Embed Size (px)
Citation preview

1 Copyright © 2011 Siemens AG - All rights reserved
Proceedings of ASME Turbo Expo 2012 GT2012
June 11-15, 2012, Copenhagen, Denmark
GT2012-69621
SGT5-8000H EXPERIMENTAL TEST RESULTS AND VALIDATION OF HIGH FIDELITY 3D CFD
Joachim Bigalk Siemens AG
Mülheim / Ruhr, Germany
Thomas Biesinger Siemens AG
Mülheim / Ruhr, Germany
Marc Broeker Siemens AG
Mülheim / Ruhr, Germany
Tobias Buchal Siemens AG
Mülheim / Ruhr, Germany
Dirk Nürnberger Siemens AG
Mülheim / Ruhr, Germany
Markus Schmidt Siemens AG
Mülheim / Ruhr, Germany
ABSTRACT The first Siemens SGT5-8000H had extensively been tested
in Simple Cycle in Irsching during 2008 and 2009. About 3000 sensors had been installed for monitoring of the engine operation, the results demonstrated that all performance targets have been exceeded.
Detailed measurements of pressure, temperature and flow were performed in the turbine flow path at various locations in circumferential and radial direction. The experimental test results in the turbine flow path have been used for additional detailed analysis of the fluid dynamics operation by a High Fidelity 3D CFD whole turbine model. This standardized whole turbine CFD process forms an important element in the Siemens design chain. The model was set up with all geometrical details to resolve all relevant flow features such as shrouds, cavities, coating, fillets etc.
This paper summarizes and compares the experimental test results with predicted CFD design values for overall thermody-namic operation and aerodynamics data at turbine outlet.
Besides the results from the Simple Cycle prototype test phase, performance test results are presented from recent measurements during customer acceptance testing in Combined Cycle in 2011. These results show a confirmation of the previously measured overall performance values after complete rebuild and re commissioning of the engine for combined cycle operation.
NOMENCLATURE BTF Berlin Test Facility CFD Computational Fluid Dynamics ITC Irsching Test Center PDS Product design specification
SAS Secondary air system h Enthalpy
m Mass flow p Pressure
s Entropy
T Temperature y+ Dimensionless wall distance
T Turbine isentropic efficiency
Subscripts t Total state quantity T Turbine in Inlet is Isentropic out Outlet ISO ISO reference condition INTRODUCTION The development of the SGT5-8000H Siemens gas turbine is based on the proven technology of the Siemens gas turbine fleet. Before the final engine test at the Irsching test center, various individual component tests had been additionally performed on component test rigs during the design phase of the SGT5-8000H.
These successful tests were conducted at various test locations for example ENEL (Italy) and DLR (Germany) for high pressure combustion; SPGI STC (Pittsburgh) for catalytic combustion, University of Central Florida, Florida Turbine Technologies, Muelheim Factory Labs for aerodynamics and

2 Copyright © 2011 Siemens AG - All rights reserved
heat transfer; SPGI Casselberry Lab (Orlando) for atmospheric combustion ignition and the Berlin Test Facility for compressor and combustion subsystem testing. The final test at Irsching has demonstrated that the expectation for the overall performance provided by each individual verified component resulted in an overall engine performance that has met all performance forecasts.
Figure 1. IRSCHING TEST CENTER
Prototype whole engine tests for the Siemens gas turbine
fleet are in general performed at the Siemens Berlin Test Facility (BTF) which offers all opportunities required for transient and steady state data collection at varying engine operation conditions. For the SGT5-8000H a test under real operation conditions including the option for extended endurance testing under real industrial plant operation was
chosen. For this reason the highly advanced measurement acquisition systems of BTF were installed in the temporary Irsching site Test Center (ITC, Fig.1) for monitoring and analysis of transient and steady operating conditions of compressor, turbine, combustor, secondary air system, rotor and casing.
TEST INSTRUMENTATION Various components could be tested in advance of the
whole engine test on individual test rigs. Selected extracts from these previous individual test results on compressor, combustor and SAS are already presented in [1-3]. During the Irsching test campaign, the previous test results could be verified in the whole turbine by means of specific test instrumentation for each individual gas turbine component as illustrated in Fig. 2.
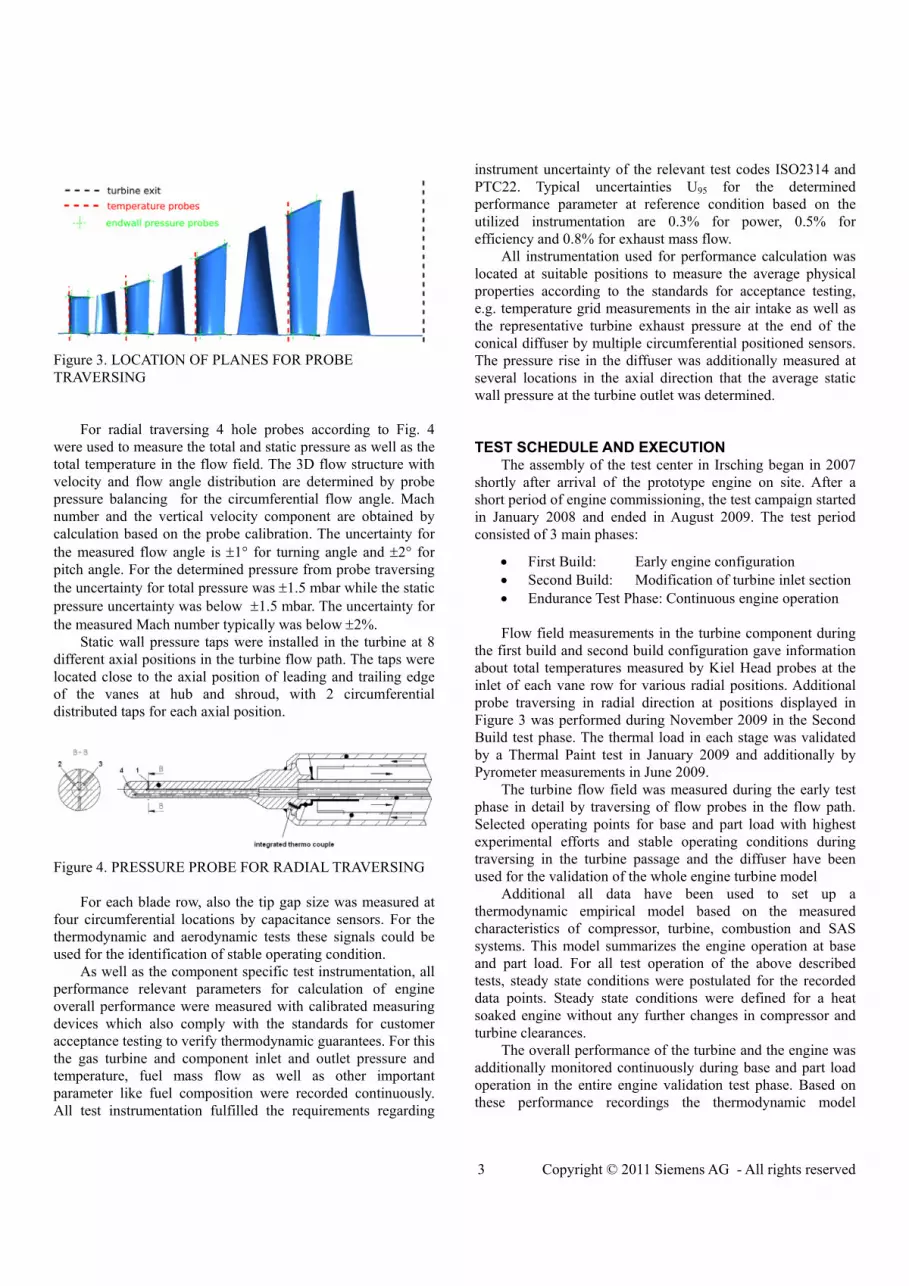
The following presentation will focus on the gas turbine operational data that could not be experimentally analyzed in advance as turbine component operation and engine overall performance. The instrumentation for the turbine consisted of pressure probes, total temperature and pyrometer measurements in the main flow and end wall region as well as in the exhaust diffuser. In the flow passages of stage 2, 3 and 4 (Fig. 3) the radial distribution of the flow field in main flow area and in the end wall region was measured for verification of the turbine clearance flow.
Figure 2. TEST INSTRUMENTATION OF SGT5-8000H AT IRSCHING TEST CENTER
2838 Sensors 1688 Temperatures 616 Pressures 357 Strain Gages 59 Accelerometer 48 Clearances 56 Blade Vibration 14 Flows & Forces 597 rotating 2241 stationary 458 dynamic 2380 quasi-static
3 Copyright © 2011 Siemens AG - All rights reserved
Figure 3. LOCATION OF PLANES FOR PROBE TRAVERSING
For radial traversing 4 hole probes according to Fig. 4
were used to measure the total and static pressure as well as the total temperature in the flow field. The 3D flow structure with velocity and flow angle distribution are determined by probe pressure balancing for the circumferential flow angle. Mach number and the vertical velocity component are obtained by calculation based on the probe calibration. The uncertainty for the measured flow angle is 1° for turning angle and 2° for pitch angle. For the determined pressure from probe traversing the uncertainty for total pressure was 1.5 mbar while the static pressure uncertainty was below 1.5 mbar. The uncertainty for the measured Mach number typically was below 2%.
Static wall pressure taps were installed in the turbine at 8 different axial positions in the turbine flow path. The taps were located close to the axial position of leading and trailing edge of the vanes at hub and shroud, with 2 circumferential distributed taps for each axial position.
Figure 4. PRESSURE PROBE FOR RADIAL TRAVERSING
For each blade row, also the tip gap size was measured at
four circumferential locations by capacitance sensors. For the thermodynamic and aerodynamic tests these signals could be used for the identification of stable operating condition.
As well as the component specific test instrumentation, all performance relevant parameters for calculation of engine overall performance were measured with calibrated measuring devices which also comply with the standards for customer acceptance testing to verify thermodynamic guarantees. For this the gas turbine and component inlet and outlet pressure and temperature, fuel mass flow as well as other important parameter like fuel composition were recorded continuously. All test instrumentation fulfilled the requirements regarding
instrument uncertainty of the relevant test codes ISO2314 and PTC22. Typical uncertainties U95 for the determined performance parameter at reference condition based on the utilized instrumentation are 0.3% for power, 0.5% for efficiency and 0.8% for exhaust mass flow.
All instrumentation used for performance calculation was located at suitable positions to measure the average physical properties according to the standards for acceptance testing, e.g. temperature grid measurements in the air intake as well as the representative turbine exhaust pressure at the end of the conical diffuser by multiple circumferential positioned sensors. The pressure rise in the diffuser was additionally measured at several locations in the axial direction that the average static wall pressure at the turbine outlet was determined.
TEST SCHEDULE AND EXECUTION
The assembly of the test center in Irsching began in 2007 shortly after arrival of the prototype engine on site. After a short period of engine commissioning, the test campaign started in January 2008 and ended in August 2009. The test period consisted of 3 main phases:
First Build: Early engine configuration Second Build: Modification of turbine inlet section Endurance Test Phase: Continuous engine operation
Flow field measurements in the turbine component during
the first build and second build configuration gave information about total temperatures measured by Kiel Head probes at the inlet of each vane row for various radial positions. Additional probe traversing in radial direction at positions displayed in Figure 3 was performed during November 2009 in the Second Build test phase. The thermal load in each stage was validated by a Thermal Paint test in January 2009 and additionally by Pyrometer measurements in June 2009.
The turbine flow field was measured during the early test phase in detail by traversing of flow probes in the flow path. Selected operating points for base and part load with highest experimental efforts and stable operating conditions during traversing in the turbine passage and the diffuser have been used for the validation of the whole engine turbine model
Additional all data have been used to set up a thermodynamic empirical model based on the measured characteristics of compressor, turbine, combustion and SAS systems. This model summarizes the engine operation at base and part load. For all test operation of the above described tests, steady state conditions were postulated for the recorded data points. Steady state conditions were defined for a heat soaked engine without any further changes in compressor and turbine clearances.
The overall performance of the turbine and the engine was additionally monitored continuously during base and part load operation in the entire engine validation test phase. Based on these performance recordings the thermodynamic model

4 Copyright © 2011 Siemens AG - All rights reserved
including compressor and turbine characteristics could be developed from the test data. The resulting thermodynamic model was generated from app. 700 stable operating points at varying ambient and load conditions. For 340 data points at base load the standard deviation for differences between model and test data, including all random operational and measuring effects was calculated to 0.103% for power and 0.063% for efficiency.
The results of the engine performance monitoring and thermodynamic performance tests showed that the design parameter of the engine product specification could be verified, even considering the range of uncertainty as stated above. All data in Tab. 1 are compared to the reference performance data without application of test uncertainties or other test tolerances.
Table 1. SGT5-8000H IRSCHING TEST PERFORMANCE DATA VS. PDS
Benefit GT Power + 3.1 % GT Efficiency + 0.3 % Mass Flow + 1.6 % Exhaust Temperature + 0.8 %
The second build test phase was completed by a first
customer acceptance test end of June 2009 with the engine operating in Simple Cycle mode.
After verification of all performance criteria and successful completion of the endurance test phase end of August 2009, the engine was dismantled and components inspected in the Berlin factory. The hot commissioning after reassembly of the engine in combined cycle started in November 2010.
WHOLE ENGINE TURBINE CFD CALCULATION
Available computational resources increase continuously due to enhancements in the information technology. Therefore, computational fluid dynamics (CFD) has become more and more practical for turbine aerodynamics design processes over the past years. Highly advanced design methods were essential to achieve the 60% efficiency barrier breaking performance of the SGT5-8000H, with a combined cycle net efficiency of >60% in combined cycle operation. The aerodynamic details of the highly complex 3-dimensional turbine flow, modulated by secondary and leakage flows, tip shrouds, wakes and the transition between rotating and stationary reference systems can only be resolved in detail by CFD methods which are able to consider the influence of cooling air injection as well as all relevant leakage flows and geometric features.
The turbine CFD simulation presented in this report is based on a standardized CFD process for generating the computational grid, setting up all boundary conditions and post-processing the results. The process is fully automated and independent from the individual user generating the results. It is based on a design system that encompasses all relevant data as output from other design tools.
A parametric sensitivity study on different modeling approaches for film cooling, cavities, tip shrouds and boundary
conditions was performed and the results were used to optimize and calibrate the CFD setup.
The verification of the theoretical CFD model was achieved by comparing different operating points (base load on hot and cold days and part load at 50% GT power) of the experimental data from probe traversing within the turbine flow path and the turbine diffuser. As will be outlined in detail in the following sections, mass flow and pressure ratio show a very close agreement with measured values. Radial profiles at the turbine exit are of very similar shape compared to the measured data and the stage matching is quite good with only small deviations. The computed efficiencies, however, are offering slight deviations which are caused by typical deficiencies with turbulence models and gas composition [4]. Comparison of the calculated radial distribution for various flow quantities with the results of empirical based quasi-3D solvers give further confidence in the very complex CFD model due to the realistic reproduction of the physical effects in the flow field. Additional checks including comparisons of CFD results with empirically calibrated gas turbine cycle calculations also show a very good agreement in terms of mass flow and pressure ratio.
Since the detailed flow measurements were able to validate the CFD model, further prediction of off design points as well as future turbine flow calculations after design modifications are thought to be possible with high confidence.
Turbine CFD Mesh
The computational grid for the SGT5-8000H gas turbine is based on a standardized flow path mesh template that is applied to all Siemens gas turbine engines with individual modifications for each engine. All turbine vanes and blades are meshed with a unified topology. Therefore, comparisons of turbines passage flows for different frames are possible without induced numerical errors caused by the underlying grid. Based on parametric studies for grid sizing finally a mesh with a medium resolution was chosen, resulting in a total number of 3 million cells per turbine stage including cavities. Each blade row passage is modeled with circumferential periodic boundary conditions to avoid meshing of the whole annulus. Thus, only one passage per blade row is meshed. The boundary layer is resolved down to an average y+ 1.5 at all solid walls.
Figure 5. CFD MODEL WITH CAVITIES

5 Copyright © 2011 Siemens AG - All rights reserved
Fillets are modeled as accurate as possible to represent their true shape. They are adjusted such that the blockage area of the modeled blade passage including blade coating layers is consistent with for example the measured throat and are therefore termed "design equivalent fillets".
As opposed to the cavities and fillets with fixed geometries at each operating point, tip gap sizes vary and had to be adjusted based on data from a whole engine structural model.
As well as the mesh templates for blade and vane rows, mesh templates for cavities and tip shrouds are standardized and available from the design system.
Finally, patches representing gaps and mate faces have to be defined in the computational mesh at the end walls. A cross section of the standard turbine computational domain is shown in Fig. 5.
Turbine CFD Setup A steady state simulation with mixing planes is set-up for
the whole turbine. Total values for pressure and temperature are applied at the inlet as well as an inflow direction. The outlet boundary condition uses a radial static pressure profile.
Cavities are attached to the main flow channel by a general grid interface (GGI). All leakage flows, which are not modeled as their own geometry, are applied as inlet boundary conditions to the previously defined grid patches for gaps and mate faces.
Film-cooling holes are implemented using a source term approach. Setting up the film-cooling is one of the key features of the automated CFD process chain. Each hole is represented by at least one source term, with individually boundary condition values for mass flow, total temperature, flow direction and turbulence. Because the procedure focuses on aerodynamic analyses, heat transfer calculations are processed within external tools reflecting all heat flows between turbine and SAS system. The heat transfer within the CFD model finally is realized by fluid mixing considering consistent heat flow with external calculations.
The CFD simulations are performed with the unstructured multi grid solver CFX-Solve (Version 13). The SST turbulence model, which is the industrial standard turbulence model, is used without any modifications (e.g. re-attachment modifi-cation).
A suitable computing time scale is specified to ensure a good convergence. Additionally a 2D initial solution for the flow path is applied, to speed up the simulation and increase the robustness further on. Different length scales and inherent unsteady flow features of the cavities cause periodic fluctuations. Thus, convergence of efficiency needs to be monitored and confined to less than 0.01% by refinements of cavity models.
A standardized post-processing cycle is performed for each simulation after a converged state is reached. Radial profiles at different positions for each blade row and general performance parameters are obtained by this, for use in further design tasks or also iterative procedures
Boundary condition for test comparison Generally the definition of efficiency in cooled gas
turbines is difficult because of the mixture of the cooling and leakage flows at different locations in the turbine. However, for the definition of the efficiency the general basic formulation is used which requires a consideration of cooling and leakage flows in the turbine inlet enthalpy:
isoutTinT
outTinTT hh
hh
,,,
,,
For this presentation the enthalpy at turbine inlet is
calculated based on the definitions of ISO-2314 for calculation of the ISO turbine inlet temperature. All cooling and leakage air is mixed with the turbine inlet flow to calculate an average turbine inlet enthalpy hT,ISO as result of the solution of the energy balance over the overall turbine boundary and the balance around the combustion chamber.
For known turbine mass flow, the calculation of hT,ISO can also be performed by mixing the cooling and leakage flow with the turbine inlet flow or by solving the energy balance across the turbine:
LeakageCoolinginT
TurbineoutTISOTinT mmm
Phhh
,,,,
The isentropic enthalpy at turbine outlet is defined by temperature and pressure and calculated for isentropic expansion :
),(),( ,,,,, intintinouttinisoutt pTfswithpsfT
Since many parameters of the CFD setup influence the
results, preliminary studies are executed to allow an optimization of the CFD setup. The features which are investigated and their effects on the result are listed below (Tab.2). This paper includes the improvements in the studies for the geometrical features (fillets, coating) as well as the cavity inflow swirl and film-cooling temperatures.
Table 2. INFLUENCES ON CFD SETUP
Feature Influence on
fillet radius mass flow, pressure ratio
coating mass flow, pressure ratio
trailing edge cooling design mass flow, pressure ratio
fluid definitions efficiency
cavity inflow swirl efficiency
film-cooling temperatures efficiency
gas table resolution efficiency

6 Copyright © 2011 Siemens AG - All rights reserved
Figure 6. INFLUENCE OF GEOMETRIC DETAILS ON MASS FLOW AND PRESSURE RATIO
The correct modeling of the throat area of a choked blade
row passage is one of the major prerequisites to reach a certain mass flow target. If the flow in a blade passage is choked, the mass flow, which is proportional to the axial velocity, cannot be increased anymore. This state is therefore independent of the static pressure downstream of the throat.
Figure 6 indicates the effects of several geometric details on turbine capacity. While an increase in fillet size from a generic one to the previously mentioned equalized fillet reduces the mass flow by about 0.8% (square and triangle symbols), coatings have a significantly higher influence (circle symbol). Between the variant of no coating and with coating, a delta in mass flow of about 2 % exists. Finally Fig. 6 shows in addition the adjustment of the model exhaust pressure boundary condition. The measured pressures by traversing after the last turbine blade do not represent the circumferential averaged data. Since the measured thermodynamic performance data represent the average values, the turbine exhaust pressure has been shifted that the exhaust parameter from traversing match these data (diamond symbol).
Hub cavities can have a significant impact on the overall performance [5]. An important modeling parameter is the amount of swirl specified at the cavity inlet [6]. An average “cavity swirl ratio” was set to an engine realistic value. This is the most realistic assumption and denoted by “low swirl” A dedicated sensitivity study assuming Couette flow where appropriate was conducted with an unrealistic “high swirl” i.e. full rotor speed to understand the influence of swirl. Streamlines exiting from a cavity and the flow field temperature behind a blade row for both amounts of swirl are indicated in Fig. 7. The cavity swirl has a noticeable effect on the temperature distribution in addition to secondary flows and further flow structures in a blade passage.
Figure 7. INFLUENCE OF CAVITY SWIRL ON FLOW FIELD TEMPERATURE; LEFT: HIGH SWIRL, RIGHT: LOW SWIRL.
If ejection temperatures for film-cooling holes are used, an
error would occur if the film-cooled walls are simulated as adiabatic. It is assumed that the cooling air is heated up by the heat flux into the blade. Therefore, a common approach to scale cooling temperatures to the compressor bleed temperatures is used.
Film Cooling Model
An accurate representation of the film cooling model in this section is an indication of the high level of detail of the CFD setup. A total number of approximately 2500 source terms is applied on the first five blade rows. The film cooling model aerodynamic flow predictions of the first two turbine stages is shown in Fig. 8.
The injection of cooling air at the precise geometric locations and the approximate momentum depending on the size of the underlying mesh cell results in very good prediction of the flow aerodynamics and to some limited extent of cooling effects. A sophisticated mapping algorithm using weights to fit the cooling hole diameter to the computational mesh is used. It turned out that the mesh size used had little effect on the result as opposed to expectations.

7 Copyright © 2011 Siemens AG - All rights reserved
Figure 8. FILM COOLING MODEL PREDICTION OF FIRST TWO TURBINE STAGES (HEAVILY DISTORTED VIEW)
CFD RESULTS COMPARED TO EXPERIMENTAL DATA
From the Irsching test phase, the experimental data are available for the SGT5-8000H for various operating conditions. For this paper, the analysis is focused on three operating points:
Base load at cold ambient conditions Base load at warm ambient conditions Part load (50 % GT power) at normal ambient
conditions
For each operating point detailed data are available such as:
Radial profiles at turbine exit (base load and part load) Temperature measured by probes in the leading edge
of each stator blade (base load only) Pressure taps in the inner and outer end wall close to
the leading and trailing edges of each stator (base load only)
Based on these test data the CFD setup is validated for the
above operating points as shown exemplary in the following section for the pressure close to the vanes leading and trailing edges and the flow field at the turbine exit.
A first comparison of the global performance parameters predicted by CFD to the test reference values is accomplished with the turbine characteristic (Fig. 9, 10). The pressure ratio for all three operating points and the mass flow show an excellent agreement to the reference values, with deviations less than 0.1 %.
ISO efficiencies are predicted with a correct trend showing a decreasing value for the off-design operating points. The average difference between test data and CFD is about 0.4 percentage points in all three cases, with lower values for the CFD. Systematic deviations may be explained by limitations in the CFD model such as fluid models used in this work, i.e. gas properties are dependant only on temperature (ideal gas).
Figure 9. PRESSURE RATIO SGT5-8000H
Figure 10. TURBINE EFFICIENCY SGT5-8000H
Radial Profiles at Turbine Exit
The temperature, pressure and flow distribution at turbine outlet shows good agreement with the shape of the measured profiles. The following presentation of CFD results will focus on base load operating conditions.
Table [3] shows the deviations of the mass flow averaged radial distributions from CFD in comparison to the test data for the different flow quantities.
Table 3. AVERAGED DEVIATIONS AT TURBINE OUTLET
Quantity Deviation [%]
Total pressure -0.97
Total temperature -0.27
Mach number -1.22
Flow angle -1.89

8 Copyright © 2011 Siemens AG - All rights reserved
Figure 11. DEVIATIONS FOR RADIAL DISTRIBUTIONS AT TURBINE EXIT
Overall, the shape of the circumferential averaged profiles at the turbine exit from the numerical simulations is in a very good agreement to the measured ones as shown in Fig. 11. Because of the strong gradients of the profiles at the end walls, high deviations only exist because the well matching profiles of measured and calculated data have small offsets in the radial directions. Positioning tolerances during traversing also have to
be considered (not shown here). The total pressure predicted by CFD exhibits only small
deviations of less than 1% difference. The curvature near the end wall due to losses is captured in a good way as well as the tip jet at about 90% span.
The total temperature distribution generally agrees very well with the experimental results. In the upper half of the profile between 50 % and 70 % span and near the hub below 20% an excellent agreement is visible. The lower parts are highly affected by the cavity flow and the chosen inflow directions.
A consistent post processing including gas properties is used for the plot of the Mach number deviations between measurement and CFD. The data matches quite well and thus provides confidence in the blade design.
The radial slope of the swirl angle shows an identical shape compared to the test data when shifted slightly. Increased flow angles due to a decreasing axial velocity in the near end wall regions are also captured with good quality. Larger deviations in the hub region are caused by the to high predicted leakage flows of the cavities in the last blade row.
Pressure Distributions on Stator End walls
Figure 12 shows the wall pressure distribution for hub and shroud in circumferential direction including the data from the static wall pressure measurement. While the agreement for the positions close to the leading edge of vane one is satisfactory with only small differences, some deviations for the data near the trailing edge are visible. Due to geometrical approximations (e.g. design equivalent fillets), the blade shape is to a certain extent different in the end wall region compared to the real geometry. The thickness of the airfoil results in a pressure field variation which is one explanation for the deviations of about 5%. The experimental results are furthermore influenced by the non-uniform inlet distribution caused by the transition duct assembly.
Regarding the pressure distribution for vane two, a good agreement is noticeable for the probes located close to the leading edge. The distributions for vane three show an excellent agreement. Except for the data at the inner end wall close to the trailing edge, the agreement between CFD and test data is without any deviations. Nevertheless, the differences in the deviating value are also small i.e. 0.5 % only. The agreement of the simulation and the experiment in vane four is good. Only small deviations in static pressure exist at the leading edge. The overall accuracy of the CFD simulations in comparison to the Irsching test data is of a high quality which surpasses the expectations at the beginning of the work.

9 Copyright © 2011 Siemens AG - All rights reserved
Figure 12. STATIC WALL PRESSURE DISTRIBUTION
FINAL IRSCHING ENGINE TEST IN COMBINED CYCLE
With the re-commissioning of the SGT5-8000H in Irsching, in 2010 for combined cycle operation, all component performance parameters have been monitored and analyzed during the commissioning phase by site instrumentation. The overall engine performance and the component operation could finally be measured by high precision performance test instrumentation which confirmed the measurements at ITC during the prototype test phase.
The customer acceptance test was performed under the supervision of TUEV SUED and the power plant was operated at various conditions during the test phase. With operation at design turbine inlet temperature, the combined cycle achieved the performance target with more than 60% net combined cycle efficiency.
The official results determined by TUEV SUED demonstrated that on May 11, 2011, Irsching power plant achieved a new benchmark for power output and breaking the

10 Copyright © 2011 Siemens AG - All rights reserved
60% barrier for efficiency in combined cycle at gas turbine design condition:
Net Power Output: 578 MW Net Efficiency 60.75 %
The gas turbine parameter like mass flow, power output,
efficiency and exhaust temperature were in good agreement to the thermodynamic performance model developed from the Irsching prototype test phase.
Deviations to the test results during the Irsching Prototype Test Phase are given in Tab. 4. All results are compared to the reference performance data without application of the previously stated test uncertainties or other test tolerances.
Table 4. SGT5-8000H IRSCHING FINAL TEST PERFORMANCE DATA
Benefit GT Power + 0.2 % GT Efficiency 0.0 % Mass Flow + 0.4 % Exhaust Temperature - 0. 1 %
The official performance data for Siemens SGT5-8000H
validated during the Irsching prototype test phase are: GT-Power 375 MW GT Efficiency 40 %
CONCLUSIONS During the Irsching prototype test phase all components of
the SGT5-8000H had been validated. As far as possible, components had been tested in advance on individual test rigs. The turbine and the overall thermodynamic performance could be validated first with the whole engine test at ITC. For the engine performance it was found that all design targets could be verified and various expectations could even be exceeded. The performance of previously tested components on test rigs could additionally be validated. In regards of the turbine CFD model, basic model validations could be achieved that set the foundation for future turbine component performance upgrades.
Summarizing the CFD results, a satisfactory prediction quality of turbine flow with 3D CFD methods was achieved. A reference turbine characteristic could be generated with CFD in good agreement with the measurements.
The general shape of the radial distributions at the turbine exit is in excellent agreement to the experimental measurements. Deviations in the level of the profiles are small and within the range of measurement uncertainties.
Further refinements to the simulation setup such as more detailed inlet boundary conditions and a consideration of the thermal state of the gas turbine casing can help to further improve the computational results. A corresponding enhanced CFD model is available but not the subject of this work.
ACKNOWLEDGMENTS The support of Siemens AG is gratefully acknowledged.
The help of Dr. L. Helmers with the cycle data and his many useful comments are gratefully acknowledged. The contribution of M. Downing and B. Barabas is appreciated. The authors also wish to acknowledge the extraordinary support for IT by J. Rössler and data acquisition at ITC by Susanna Ott, Alexander Berz and Andreas Tutschke.
PERMISSION FOR USE The content of this paper is copyrighted by Siemens AG
Energy Sector and is licensed to ASME for publication and distribution only. Any inquiries regarding permission to use the content of this paper, in whole or in part, for any purpose must be addressed to Siemens AG Energy Sector directly.
REFERENCES [1] R. Rudolph, R. Sunshine, M. Woodhall, M. Haendler
“Innovative Design Features of the SGT5-8000H Turbine and Secondary Air System”, GT2009-60137, Proceedings of ASME Turbo Expo 2009, Orlando, Florida, USA
[2] F.Eulitz, B.Kuesters, F.Mildner, M.Mittelbach, A.Peters, B.v.d.Toorn, U.Waltke, P.Rimmington, D.Wasdell “Design and Validation of a Compressor for a new Generation of Heavy-Duty Gas Turbines”, Power2007-22100, Proceedings of Power 2007, San Antonio, Texas
[3] U.Gruschka, B.Janus, J.Meisl, M.Huth, S.Wasif “ULN System for the new SGT5-8000H Gas Turbine: Design and High Pressure Rig Test Results”, GT2008-51208, Proceedings of ASME Turbo Expo 2008, Berlin, Germany
[4] J. D. Northall, The Influence of Variable Gas Properties on Turbomachinery Computational Fluid Dynamics, Transactions of the ASME, 128, 2006
[5] I. Mahle, Improving the Interactions between Leakage Flows and Main Flow in a Low Pressure Turbine, GT2010-22448, Proceedings of ASME Turbo Expo 2010, Glasgow, Scotland
[6] M. Rabs, F.-K. Benra, O. Schneider, Emergence of Kelvin-Helmholtz instabilities in gas turbine rim cavities-a parameter study, ASME Turbo Expo 2012, paper No. GT2012-68834


