Embed Size (px)
Citation preview

CHAPTER 6
Site Investigation, Drilling, and Sampling
6.1 GENERAL
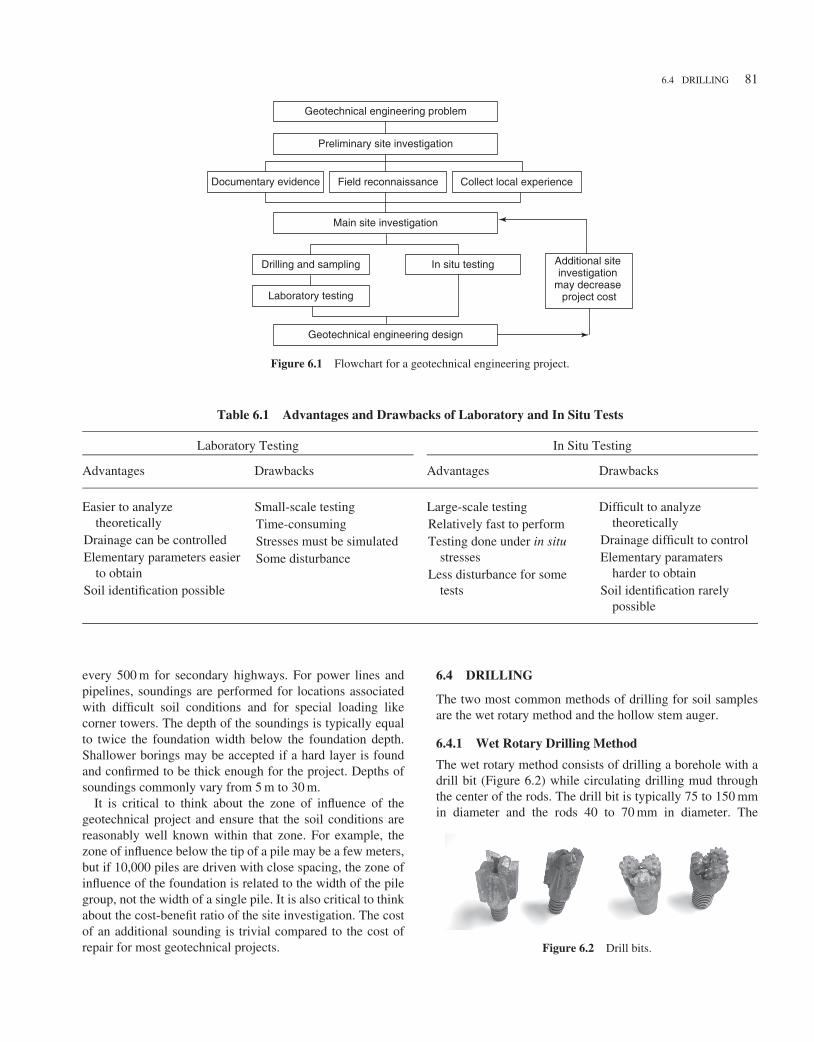
Site investigation is the first step in solving most geotechnicalengineering problems (Figure 6.1). Indeed, when a geotech-nical engineer is asked to solve a problem at a site, thefirst reflex is to go to the site, drill borings, take samples,and/or run in situ tests. Back in the laboratory, additionalsoil properties are determined and the problem is studied onthe basis of the site-specific information already obtained.Note that laboratory tests and in situ tests are not mutuallyexclusive. The best site investigation features a combinationof in situ tests and laboratory tests. Indeed, the advantages oflaboratory tests and the advantages of in situ tests comple-ment each other, as shown in Table 6.1. Boring logs add avery important component to the site investigation. The firstpart of this chapter deals with onshore site investigations, thesecond part with offshore site investigations.
A site investigation takes place in two steps: the prelimi-nary investigation and the main investigation. Once the siteinvestigation is completed, the geotechnical engineer makesappropriate calculations and recommendations to the projectowner or representative. Sometimes additional site investiga-tion allows the geotechnical engineer to optimize the designand propose less expensive options. For most projects, thecost of the soil investigation is a very small fraction of thecost of the project; it can be 0.1% for buildings up to 3% fordams. Yet it is extremely important that it be well carried out,as a poor site investigation can have disastrous consequences,generate great expenses, delay the project, and lead to lit-igation. For geotechnically complicated projects, it is verydesirable for the geotechnical engineer to act as inspector ofthe work being done at the site.
Note that under current practice, only an extremely smallportion of the soil involved in the project is tested. In a typicalsoil investigation, 0.001% of the soil involved in providingthe foundation support for the structure might be tested. Theproportion of soil tested is much smaller than the amount oftesting done for the structure itself (concrete cylinder testing,for example).
6.2 PRELIMINARY SITE INVESTIGATION
The preliminary site investigation takes place in two steps:a paper study and a site visit. The paper study consists ofobtaining documents related to the site information andhistory. In addition to maps, previous records of site usesare very helpful. Maps include geologic maps (e.g., http://ngmdb.usgs.gov/), aerial photographs (www.terraserver.com/,http://maps.google.com/), flood maps (www.fema.gov/hazard/map/flood.shtm), and seismicity maps (http://earthquake.usgs.gov/earthquakes/world/seismicity/). The site visitconsists of going to the site, taking notes and photos of thesite conditions, including the behavior of other projects inthe vicinity. The site conditions include general topography,rig access, geologic features, stream banks exposing thestratigraphy, land use, water-flow conditions, and possibilityof flood. A good site visit requires a keen eye and keepinga detailed record of what is found and observed at thesite. In the case of environmentally related problems,special guidelines exist for what is called environmental siteassessments (ESAs). The rest of this chapter describes themain site investigation.
6.3 NUMBER AND DEPTH OF BORINGSAND IN SITU TESTS
The word sounding is used in this section to refer to bothborings and in situ tests. The number, location, and depth ofsoundings on the one hand and the type of samples and insitu tests on the other depend on several factors, including thetype of geotechnical project, the stratigraphy of the site, thesoil type, and the water table conditions.
About 2 to 6 soundings are performed for average sizebuildings and bridges. A common rule for a building is toperform 1 sounding per 250 m2 of foundation surface area.For major bridges, a sounding is performed at each pier. Forextended projects such as runways and highways, soundingsare located anywhere from every 50 m for major runways to
80
Geotechnical Engineering: Unsaturated and Saturated Soils Jean-Louis Briaud© 2013 John Wiley & Sons, Inc. Published 2014 by John Wiley & Sons, Inc.
6.4 DRILLING 81
Geotechnical engineering problem
Documentary evidence Field reconnaissance Collect local experience
Geotechnical engineering design
Additional site investigation
may decrease project cost
Preliminary site investigation
Main site investigation
Drilling and sampling In situ testing
Laboratory testing
Figure 6.1 Flowchart for a geotechnical engineering project.
Table 6.1 Advantages and Drawbacks of Laboratory and In Situ Tests
Laboratory Testing In Situ Testing
Advantages Drawbacks Advantages Drawbacks
Easier to analyzetheoretically
Drainage can be controlledElementary parameters easier
to obtainSoil identification possible
Small-scale testingTime-consumingStresses must be simulatedSome disturbance
Large-scale testingRelatively fast to performTesting done under in situ
stressesLess disturbance for some
tests
Difficult to analyzetheoretically
Drainage difficult to controlElementary paramaters
harder to obtainSoil identification rarely
possible
every 500 m for secondary highways. For power lines andpipelines, soundings are performed for locations associatedwith difficult soil conditions and for special loading likecorner towers. The depth of the soundings is typically equalto twice the foundation width below the foundation depth.Shallower borings may be accepted if a hard layer is foundand confirmed to be thick enough for the project. Depths ofsoundings commonly vary from 5 m to 30 m.
It is critical to think about the zone of influence of thegeotechnical project and ensure that the soil conditions arereasonably well known within that zone. For example, thezone of influence below the tip of a pile may be a few meters,but if 10,000 piles are driven with close spacing, the zone ofinfluence of the foundation is related to the width of the pilegroup, not the width of a single pile. It is also critical to thinkabout the cost-benefit ratio of the site investigation. The costof an additional sounding is trivial compared to the cost ofrepair for most geotechnical projects.
6.4 DRILLING
The two most common methods of drilling for soil samplesare the wet rotary method and the hollow stem auger.
6.4.1 Wet Rotary Drilling Method
The wet rotary method consists of drilling a borehole with adrill bit (Figure 6.2) while circulating drilling mud throughthe center of the rods. The drill bit is typically 75 to 150 mmin diameter and the rods 40 to 70 mm in diameter. The
Figure 6.2 Drill bits.

82 6 SITE INVESTIGATION, DRILLING, AND SAMPLING
Figure 6.3 Wet rotary drilling method including mud pit. (Right: Courtesy of Wikimedia. Seealso this video: http://cee.engr.ucdavis.edu/faculty/boulanger/video.html)
drilling mud flows down the center of the rods while theyrotate and back to the surface on the outside of the rodsbetween the wall of the borehole and the exterior wall of therods. This return flow carries the soil cuttings back to thesurface by entrainment. The drilling mud arrives in the mudpit (Figure 6.3), where it is sucked back up to the top of thedrilling rods by a pump. The connection between the hosecarrying the drilling mud back to the top of the rods and therods themselves is called the water swivel; this connectionallows the hose to remain stationary while the rods keeprotating. The drill bit at the bottom end of the drill rods istypically either a drag bit or a roller bit (Figure 6.2). Drag bitstend to carve the soil with finger-like protrusions and are usedfor fine-grained soils. Roller bits are made of three rollersthat roll against the soil and erode it or push it aside; they areused for drilling in gravel because the larger particles couldget stuck between the fingers of a drag bit, damage it, andcreate excessive disturbance. In sand, either bit can be used;the bit itself is not that critical because the drilling proceedsby washing or eroding the sand with the mud flow in front ofthe bit. When the rods progress smoothly downward, the soilis likely a fine-grained soil; when the rods go down in a morejerky fashion, the soil is likely a coarse-grained soil. Thegrinding sound associated with drilling in gravel, cobbles, orrock can be easily identified. Once the borehole is advanced
to the required depth, the rods and bit are withdrawn, the bitis uncoupled, and a sampling tube or an in situ test device isconnected at the bottom of the rods.
6.4.2 Hollow Stem Auger Drilling Method
The hollow stem auger method (Figure 6.4 and 6.5) sometimesalso called the continuous flight auger method consists of
Figure 6.4 Hollow stem augers. (Courtesy of C. Jeffries, Environ-mental Sampling Ltd.)

6.5 SAMPLING 83
Figure 6.5 Hollow stem auger drilling method. (Courtesy ofGeovil Ltd)
rotating hollow stem augers into the soil; these augers are150 to 300 mm in diameter. The hollow center part of theaugers gives access for sampling or any other testing devicethat can be lowered to the bottom of the hole. The hollowstem auger has the advantage of providing a casing againstcollapse of the side walls of the borehole, but is limited inpenetration depth because it requires significant torque toadvance the augers. The wet rotary method is much lesslimited by depth, but sometimes faces problems of boreholeinstability.
6.5 SAMPLING
6.5.1 Sample Disturbance
The objective in sampling a soil or rock deposit is to obtainsamples that have the least amount of disturbance. Thisdisturbance can come from:
1. Change in stress condition2. Mechanical disturbance of the soil structure
3. Changes in water content and porosity4. Chemical changes5. Mixing and segregation of soil constituents
The goal is to minimize factors 1, 2, and 3, and to eliminatefactors 4 and 5. Factor 1 recognizes that the sample follows acertain sequence of stress states as it goes from the intact fieldsituation to testing in the laboratory. In the field, the sampleexists under an at-rest effective vertical stress σ ′
ov and anat-rest effective horizontal stress σ ′
oh. During sampling, bothstresses are likely to increase; σ ′
ov because the friction betweenthe sample wall and the inside of the sampler compresses thesample and σ ′
oh because the thickness of the sampler createshorizontal displacement and associated compression. Uponextrusion of the sample from the sampling tube, both totalstresses are decreased, but the effective stresses may ormay not decrease as much as the total stresses. Indeed, asthe sample tries to expand upon extrusion, the expansionmay be limited by the inability of the air to get into thepores if the soil has a high degree of saturation and a lowhydraulic conductivity. During transport, vibrations are likelyand can affect the internal stress state. Figure 6.6 shows apossible scenario before and after testing the sample in thelaboratory. It is important to remember this sequence to betterunderstand sample behavior in the laboratory, especially atsmaller strains. For one, it is clear that the sample does notstart at a state of stress equal to the one it was at in the field. Itis desirable to try to recreate this initial state of stress beforestarting the laboratory test. Similar observations can be madefor in situ testing.
Factors 1 and 2 can be minimized by using samplers witha low area ratio. The area ratio, AR, is the ratio of the cross-sectional area of the tube wall over the cross-sectional areaof the sample:
AR = π(D02 − Di
2)/4
πDi2/4
= D02
Di2
− 1 (6.1)
where Do and Di are the outside and inside diameter of thesampling tube, respectively.
Ratios less than 10% are desirable. Factor 3 in the precedinglist can be minimized by sealing the samples as soon as they
«
Sampling
Sample extrusion
Initial state
0
s9
(s90h, s90v)
Figure 6.6 Sequence of stress strain behavior during sampling.

84 6 SITE INVESTIGATION, DRILLING, AND SAMPLING
are extruded from the sampler. This can be done by pouringhot wax at each end or sealing them with a thin plastic filmor foil wrap. Also, it is necessary to keep the vibrationsduring transport to a minimum, and store the samples in ahumidity room as soon as possible. Note that humidity roomsare actually drying rooms, as the humidity level very rarelyreaches 100%. Indeed, even at 95% humidity, significantsuction exists that can draw water out of the soil into the air.Efforts should be made to seal the sample as well as possiblefor storage. Despite these best efforts, samples that have beenin a humidity room for more than one month are likely tohave been affected by drying.
The least disturbed samples of mineral soils are obtainedwhen the sampler is pushed into the soil in one continuousmotion. Driving creates much more disturbance. Repeatedpushes are not acceptable either, as they create a series ofcompressions and extensions in the sample and disturbs it(Figure 6.7). There is one exception to this, for organicfibrous soils such as peats. In this case it is best to drivethe sampler, because the driving action has a better chanceof cutting the fibers rather than pushing them and simplycompressing and disturbing the peat excessively. Furtherinformation on sample disturbance can be found in Hvorslev(1949).
6.5.2 Common Sampling Methods
The two most common samplers are the Shelby tube samplerfor clays and silts, also called thin-wall steel tube, and the
Figure 6.7 X-ray photographs of a driven sample (left) and pushedsample (right). (Courtesy of FUGRO Inc.)
Figure 6.8 Shelby tube sampling. (Courtesy of Leslie Kanat, 2010,http://kanat.jsc.vsc.edu/drh/.)
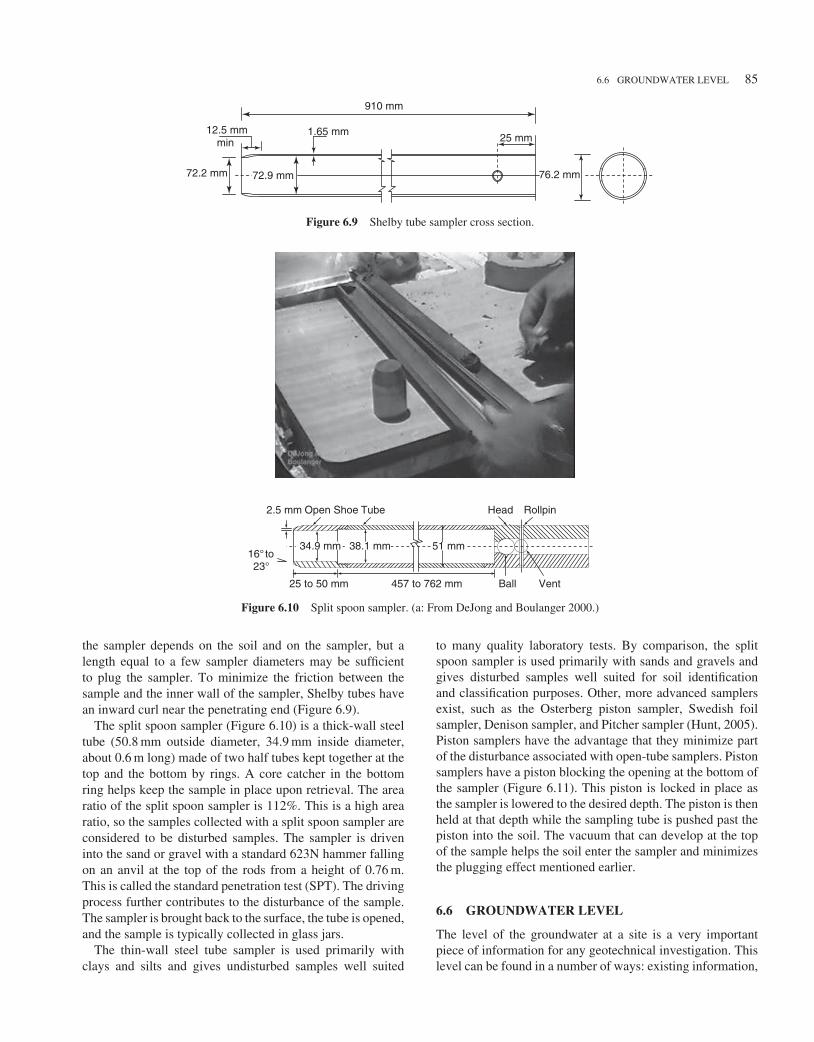
split spoon sampler for sands and gravels.1 The Shelby tube(Figure 6.8) is a seamless, thin-wall steel tube (e.g., 76.2 mmoutside diameter, 73 mm inside diameter, 0.9 m long). Thearea ratio for the Shelby tube is 9%. This is a very low arearatio, so samples taken with the Shelby tube are consideredundisturbed. The tube is pushed into the silt or clay at a steadypace under one continuous push. The tube is then pulled outof the soil and the sample stays in the tube by friction. Atthe surface, the sample is extruded, wrapped and sealed toprevent moisture loss, and then shipped to the laboratory fortesting.
Note that the length of the sample recovered is rarelyequal to the length pushed. One reason is that the frictionthat develops between the sample and the inner wall ofthe sampler increases as the sample enters the sampler. Ifthe friction on the sample becomes larger than the ultimatebearing capacity of the silt or clay below the lower end of thesampler, the sampler becomes plugged and the soil ahead ofthe sampler experiences bearing-capacity failure, so no moresoil enters the sampler. The length of sample required to plug
1The name “Shelby” comes from the Shelby seamless steel tube companyestablished in the late 1800s in Shelby, Ohio. The city of Shelby was namedafter General Isaac Shelby, a hero of the Revolutionary War and War of1812 and first governor of Kentucky.
6.6 GROUNDWATER LEVEL 85
72.2 mm 76.2 mm72.9 mm
1.65 mm
910 mm
12.5 mm min 25 mm
Figure 6.9 Shelby tube sampler cross section.
34.9 mm 38.1 mm 51 mm
2.5 mm Open Shoe Tube Head Rollpin
VentBall457 to 762 mm25 to 50 mm
16° to 23°
Figure 6.10 Split spoon sampler. (a: From DeJong and Boulanger 2000.)
the sampler depends on the soil and on the sampler, but alength equal to a few sampler diameters may be sufficientto plug the sampler. To minimize the friction between thesample and the inner wall of the sampler, Shelby tubes havean inward curl near the penetrating end (Figure 6.9).
The split spoon sampler (Figure 6.10) is a thick-wall steeltube (50.8 mm outside diameter, 34.9 mm inside diameter,about 0.6 m long) made of two half tubes kept together at thetop and the bottom by rings. A core catcher in the bottomring helps keep the sample in place upon retrieval. The arearatio of the split spoon sampler is 112%. This is a high arearatio, so the samples collected with a split spoon sampler areconsidered to be disturbed samples. The sampler is driveninto the sand or gravel with a standard 623N hammer fallingon an anvil at the top of the rods from a height of 0.76 m.This is called the standard penetration test (SPT). The drivingprocess further contributes to the disturbance of the sample.The sampler is brought back to the surface, the tube is opened,and the sample is typically collected in glass jars.
The thin-wall steel tube sampler is used primarily withclays and silts and gives undisturbed samples well suited
to many quality laboratory tests. By comparison, the splitspoon sampler is used primarily with sands and gravels andgives disturbed samples well suited for soil identificationand classification purposes. Other, more advanced samplersexist, such as the Osterberg piston sampler, Swedish foilsampler, Denison sampler, and Pitcher sampler (Hunt, 2005).Piston samplers have the advantage that they minimize partof the disturbance associated with open-tube samplers. Pistonsamplers have a piston blocking the opening at the bottom ofthe sampler (Figure 6.11). This piston is locked in place asthe sampler is lowered to the desired depth. The piston is thenheld at that depth while the sampling tube is pushed past thepiston into the soil. The vacuum that can develop at the topof the sample helps the soil enter the sampler and minimizesthe plugging effect mentioned earlier.
6.6 GROUNDWATER LEVEL
The level of the groundwater at a site is a very importantpiece of information for any geotechnical investigation. Thislevel can be found in a number of ways: existing information,

86 6 SITE INVESTIGATION, DRILLING, AND SAMPLING
Drill rod
Vent (air)
Sampling tube
Hole in piston rod
Hollow piston rod
Pressure cylinder
Piston
Figure 6.11 Piston sampler diagram.
Cap with vent hole
Surface seal
Clean and washed coarsesand or fine gravel
Standpipe
Special sealing grout
Granular bentonite
Filter
Sand
Ground water level
Riser pipe, typically32 mm diameter
Borehole, diameter typically largerthan O.D of couplings on riser pipe
Slotted plastic or steel pipe, orwellpoint, typically 600mm long.
Ground water level measurementObservation well
Phreatic surface measurementStandpipe piezometer
Figure 6.12 Measurement of groundwater level and phreatic surface: (a) groundwater levelmeasurement; (b) phreatic surface measurement observation well. (Courtesy of FHWA.)
water level in open borings, standpipe piezometer, and drivenpiezometers. Existing information can be found in records ofwater wells drilled in the area (Figure 6.12). These recordsare often kept by government agencies, such as those dealingwith water resources, hydrology, natural resources, geology,and transportation. The well owners may have some veryuseful information on the seasonal fluctuation of the waterlevel in the well.
Reading the water level in an open borehole is often done aspart of a site investigation. At the end of the drilling process,the water or drilling mud is bailed out of the borehole andthe water fills the borehole back up to the groundwater level.Water level readings are typically taken 24 hours after theboring is completed and recorded as such in the boringlog. Note that 24 hours may not be long enough for thewater level to come to equilibrium with the surroundinggroundwater. Standpipe piezometers are made by preparing aspecial borehole (Figure 6.12). After the borehole is drilled, aplastic casing, slotted with holes at its bottom part and smallerin diameter than the borehole, is lowered to the bottom ofthe borehole. The annulus between the slotted casing and theborehole is filled with sand over the portion where the waterpressure measurement is intended. The annulus above thesand-filled portion is filled with bentonite pellets to form an

6.7 FIELD IDENTIFICATION AND BORING LOGS 87
impervious plug and isolate the zone to be studied. Water isallowed to rise in the standpipe and the water level is measuredwhen equilibrium is reached. This gives the pressure head atthe depth of the slotted casing. Driven piezometers are pushedinto the ground like a cone penetrometer and water-pressuremeasurements are made through pore-pressure transducerslocated at the bottom of the piezometer. After equilibrium isreached, the pressure measured is equal to the unit weight ofwater times the height to where the water level would rise inthe pipe.
A distinction has to be made between the groundwater leveland the phreatic surface. The groundwater level is the levelto which the water rises in an open borehole. The phreaticsurface is the line where the water would rise in a pipe(not an open borehole) connected to a point in the ground.These two definitions amount to the same thing unless thereis a water pressure in the ground different from hydrostatic.This is the case with an artesian pressure, where the phreaticsurface is higher than the groundwater level (Figure 2.14).Standpipe piezometers measure the phreatic surface, whereasopen boreholes measure the groundwater level (Figure 6.12).
6.7 FIELD IDENTIFICATION AND BORING LOGS
The best way to identify the soil type is to classify the soilthrough proper laboratory tests, as described in Chapter 4 onsoil classification. In the field, it is also possible to classifythe soil through a series of simple tests (ASTM D2488).
Sands and gravels are easily identified, as the particle sizeis large enough to be seen with the naked eye. Sands will feelgritty when rubbed between your fingers. Dirty sands suchas SM and SC tend to leave stains on your hands when wet,whereas SW and SP will have much less tendency to do so. Ifthe sand is dry, taking a handful of sand and dropping it froma height of about 0.3 m will generate a cloud of fine particlesfor an SC or SM; very little dust will be observed for an SPor SW. Observations about obvious gradation gaps can helpin deciding whether the sand is SP or SW.
The type of silt or clay is more difficult to identify. First,wet silts and clays will feel smooth when rubbed betweenyour fingers. The tests described in this section help youdecide whether the soil is an ML, MH, CL, or CH; this isthe typical order from one extreme to another because in thissequence the soil particles become smaller and smaller andinduce a progression in certain properties. The wash handstest simply refers to the fact that high-plasticity clays are verydifficult to wash off your hands compared to low-plasticityclays and silts. High-plasticity clays tend to feel greasy andit requires quite a bit of rubbing to remove the soil fromyour skin. Also, when you wash your hands after handlinga high-plasticity clay, the pores of your hands will tend tocontract and your skin will feel tight after your hands dry. Thedry strength test also helps you distinguish between high- andlow-plasticity materials. Take a piece of soil and let it dryunder the sun or in a field office. In a few hours, most soils
will be dry enough that the dry strength test can be performed.High-plasticity clays will exhibit high dry strength: difficultto crush between your fingers, difficult to break a smallpiece by bending. Low-plasticity soils will crush easily orbreak easily by bending. Silts exhibit little cohesion. Thethread rolling test, also called the toughness test, consists oftaking the piece of soil used in the hand shaking test andtrying to roll it into a thread as thin as 3 mm in diameter.If it is nearly impossible without the thread cracking, thesoil is low plasticity; if it is possible, the soil is likely highplasticity.
The hand shaking test, also called the dilatancy test, canhelp in evaluating the hydraulic conductivity of a soil. Siltshave a much higher hydraulic conductivity than clays becauseof the larger particles. The hand shaking test consists of takinga small piece of very wet soil, placing it in the bottom of yourcupped hand such that it forms a mushroom-sized patty, andtapping your hand against your other hand to impart horizontalshaking blows to the soil. If the surface of the soil becomesglossy after a few blows, it means that water is coming to thesurface and the soil has relatively high hydraulic conductivity(silt). If the soil surface stays matte after 10 blows, the soilhas much lower hydraulic conductivity (clay). Organic soilshave a distinct foul smell and dark color. Peat is fibrous whenyoung and dark and smooth when decomposed.
Some simple tests can also be used to gauge the strengthof the soil encountered. In clays and silts, the tests consist oftaking a sample in your hand and trying to deform the samplewith your thumb or fingernail. In sands and gravels, the testsconsist of trying to push or drive a steel bar into the soilfrom the surface, as well as checking for footprints behindyou. These tests and corresponding categories of strengths arepresented in Table 6.2. Note that the tests for silts and clayscan be performed on samples retrieved at depth, while thetests for sands and gravels are limited to the ground surface.The SPT blow count is used for evaluating the strengthproperties of sand and gravel at depth.
During drilling, the driller usually has a good idea whatsoil is being drilled through: the driller can hear the noisemade by the drilling bit, the driller can observe the downwardprogress of the rods, and the driller can catch the cuttingscoming back to the surface (in the mud pit, for example).Clays are carved by a drill bit without much noise and withsmooth continuous penetration. Sands are washed by the mudflow and the downward movement of the rods is more erratic.Gravels make a grinding noise during drilling. The drillerwrites down the soil type that is encountered as the boreholeadvances; this is the field borehole log. (An example of afield log is shown in Figure 6.13.) While in the field thegeotechnical engineer will take notes, collect samples, andperform simple tests. Back in the office, she or he will ask thelab technician to run classification tests and other engineeringproperty tests best suited for the project. On the basis of thedata collected, the engineer will prepare the final boring logcorresponding to each borehole. Examples of boring logs are

88 6 SITE INVESTIGATION, DRILLING, AND SAMPLING
Table 6.2 Simple Field Evaluation of Strength
Silts and Clays Strength
Description Su (kPa) N (bpf) Simple field test1
Very soft <12 <2 Squeezes between your fingers.Soft 12–25 2–4 Easily penetrated by light thumb pressure.Medium or firm 25–50 4–8 Penetrated by strong thumb pressure.Stiff 50–100 8–15 Indented by strong thumb pressure.Very stiff 100–200 15–30 Slightly indented by strong thumb pressure.Hard 200–400 30–50 Slightly indented by thumbnail.Very hard >400 >50 Not indented by thumbnail.
Gravels and Sands Strength
Description �◦ N (bpf) Simple field test2
Very loose <28◦<4 12 mm diameter rebar pushed in 0.3 m by hand
Shows definite marks of footsteps; hard to walk onLoose 28◦–30◦ 4–10 12 mm diameter rebar pushed in 0.1 m by hand
Shows footstepsMedium or compact 30◦–36◦ 10–30 12 mm diameter rebar driven 0.3 m with carpenter hammer
Footsteps barely noticeableDense 36◦–41◦ 30–50 12 mm diameter rebar driven 0.1 m with carpenter hammer
No marks or footstepsVery dense >41◦
>50 12 mm diameter rebar driven 0.03 m with carpenter hammerNo marks of footsteps
1Note that these tests are performed on a sample of the soil.2Note that these tests are performed at the ground surface of the gravel or sand deposit, not on a sample.
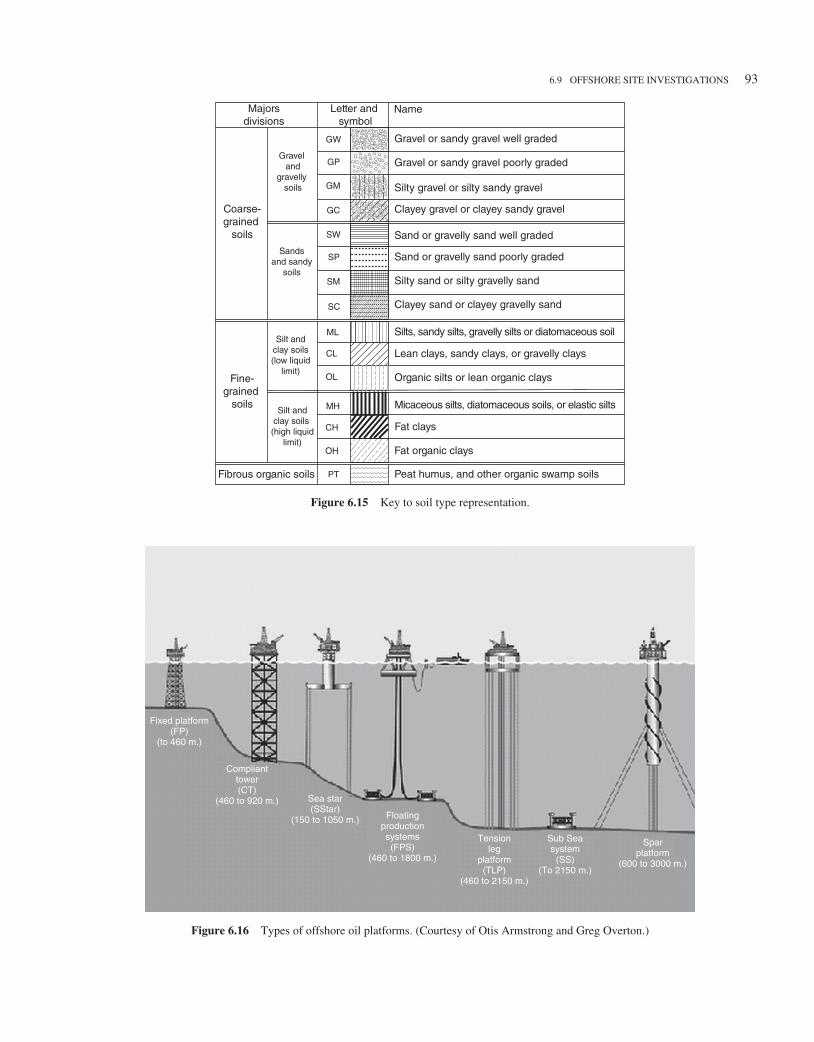
shown in Figure 6.14 and the key to soil type representationon boring logs is shown in Figure 6.15.
6.8 SOIL NAMES
In a natural soil, the four groups of particle sizes may existside by side. A gravel will be a soil that has most of itsparticles in the gravel size range. A sand will be a soil thathas most of its particles in the sand size range. Silts and claysare recognized according to their plasticity; that is, the abilityof the soil to deform without breaking. Silts exhibit moderateplasticity, whereas clays can exhibit very high plasticity.Soils are classified as gravel, sand, silt, or clay according toa rigorous classification system described in Chapter 4.
Soils may also be given other names, such as those in thefollowing list:
• Adobe: a local term describing silts and clays in semiaridregions
• Aeolian soil: soil deposited by wind such as loess
• Alluvium: soil carried by moving water and depositedwhen the water slows down
• Bentonite: a very fine clay with extreme swelling andshrinking properties; used with water as drilling mud
• Calcareous sands: sands formed by the shells of marinemollusks
• Caliche: soil cemented by calcium carbonate• Collapsible soils: soils that exhibit sudden settlement
(collapse of the structure) when placed under load andunder water
• Colluvium: soil deposited by gravity at the bottom of aslope
• Dispersive clays: clays in which the particles separatefrom each other when exposed to water even when thewater does not flow and the soil is not loaded
• Expansive soils: see shrink-swell soils• Lacustrine deposits: soil deposited by settling in water
under a low-energy environment such as a lake• Laterite: soil rich in iron (red color) and found in hot and
humid climates (tropics)

6.9 OFFSHORE SITE INVESTIGATIONS 89
0 to 3 Auger
BookProject name:
Project location
Depth(m)
Drillingmethod
TubeDia.
(mm)
SPTdepth(m)
Texas A&M
Blow countShelbytube
depth (m)N1 N2 N3 N
Pocketpenetrometervalue (kPa)
Waterobservation
Borehole ID:
Date:
Borehole I
Borehole length:
Description and notes
15 mm
6 Feb. 2011
35 1 2
4
4
6
6
7 13
10
5 6 11
3
35
7 9 12 17 29
8 70
120
No Brown silty sand
Brown silty sand
Brown silty sand
Brown silty sand
Brown silty sand
Brown silty sand
Brown silty sand
Gray Plastic clay
Gray Plastic clay
Gray Plastic clay
Gray Plastic clay
Gray Plastic clay
Gray Plastic clay
Gray Plastic clay
Water found @ 3.4 m.After 24 hours still @ 3.4 m.
No
No
Yes
Yes
Yes
Yes
Yes
Yes
Yes
Yes
Yes
Yes
Yes
130
135
10
12
14
35
35
35
35
35
35
35
76
76
76
76
76
76
Generak notes:
Auger
Auger
Auger
Auger
Auger
Auger
Auger
Auger
Auger
Auger
Auger
Auger
Auger
1 to 2
2 to 3
3 to 4
4 to 5
5 to 6
6 to 7
7 to 8
8 to 9
9 to 10
10 to 11
11 to 12
12 to 13
13 to 14
Figure 6.13 Example of a driller’s field log.
• Loam: a mixture of sand, clay, and decaying organicmaterials
• Loess: lightly cemented soil made mostly of silt, anddeposited by wind
• Marl: very stiff clay of marine origin and with calcareouscontent
• Montmorillonite: a very fine clay with extreme swellingand shrinking properties
• Organic clay or silt: a clay or a silt with a significantamount of organic constituents
• Peat: organic soil made of live or decayed plant fragments• Quick clay: clay that can liquefy when sheared exces-
sively• Quick sand: sand that turns into a liquid when subjected
to a sufficiently strong upward flow of water• Residual soils: soils created by intense weathering of
crystalline rock (tropical regions)• Shale: a very hard soil or soft rock made of silt and clay
particles; can slake when subjected to wet-dry cycles• Shrink-swell soils: soils above the groundwater level that
shrink and swell when exposed to the seasonal cycles;also but less appropriately called expansive soils
• Slickensided clay: clay with fissures, the surfaces ofwhich have been smoothened by repeated movement
• Till: soil created by glaciers and containing many particlesizes well distributed across the range from very small tovery large; typically very strong
• Tuff: soil deposited by a volcanic explosion, usually siltsize
• Varved clay: a clay made of thin alternating layers of siltand clay.
6.9 OFFSHORE SITE INVESTIGATIONS
Offshore structures (Figure 6.16) are built primarily to drillfor oil, to collect any oil found, and to send it to shorethrough pipelines. The depth of offshore platforms can reachseveral thousand meters of water depth, and the foundation ofthese enormous structures requires proper site investigations.Other types of offshore structures requiring site investigationinclude windmills, pipelines, and bridges.
The site investigation is performed from boats, ships, orsometimes jack-up rigs. The size of the ship used dependson the water depth. Figure 6.17 shows some of the ves-sels available for various water depths. In shallow waters,ships are simply anchored. In deep waters, the most sophisti-cated ships have dynamic global positioning systems (GPSs)where motors on the hull of the ship are able to maintain

90 6 SITE INVESTIGATION, DRILLING, AND SAMPLING
Asphalt with gravel base
CLAY (CH) firm, dark gray and brownishyellow
-gray 0.12-0.18m
-very stiff 0.18-0.24m-w/calcareous nodules 0.18-0.3m-slickensided 0.24-0.3m
SILTY CLAY(CL) very stiff, reddish brownand light gray, w/slickensides and sandseams
CLAY (CH) very stiff, reddish brown,slickensided,w/calcareous nodules
SILTY CLAY (CL) very stiff, light gray andbrownish yellow, w/calcareous andferrous nodules
-w/silt and sand seams 0.73-0.79m
-w/clay seams 0.88-0.94m
-slickensided and w/calcareous nodules1.13-1.4m-reddish brown 1.19-1.65m
-damaged sampler 1.46m
117
104
101
29
19
32
17
26
19
24
67
40
71
35
35
34
44
48
21
18
25
15
18
16
22
18
46
22
46
20
17
18
22
30
79
25
50102mm
37.5
36.2
35.8
35.2
PROJECT: gINT Example
LOCATION: Somewhere, USA
PROJECT NO.: 987654321
DATE: 4-7-10 COMPLETION DEPTH : 7.0 m
UNDRAINED SHEAR STRENGTH,kPa
WATER OBSERVATIONS:
SURFACE ELEVATION: 37.60m
SY
MB
OL
DESCRIPTION
DR
Y U
NIT
WE
IGH
T,
kN
/m3
NAT
UR
AL
MO
IST
UR
E
CO
NT
EN
T, %
LIQ
UID
LIM
IT, %
PLA
ST
IC L
IMIT
, %
PLA
ST
ICIT
Y IN
DE
X, %
PE
RC
EN
T P
AS
SIN
GN
O. 200 S
IEV
E
50 100 150 200 250
: FREE WATER ENCOUNTERED AT 0.6 m DURING DRILLING.
: WATER DEPTH AT 0.5 m, HOLE OPENED TO 0.6 m ON 4-9-10
9.9
SP
T N
-VA
LU
Eblo
ws p
er
0.3
mete
rs
37.6
Continued Next Page
DE
PT
H, m
0.0
0.5
1.0
1.5
2.0
2.5
3.0
3.5
4.0
4.5
5.0
LOG OF BORING NO. B-1 Sheet 1 of 2
ELE
VAT
ION
, m
UNCONFINED COMPRESSION
TORVANE
HAND PENETROMETER
ACME Consulting
1234 Main Street
Somewhere, USA 00000
Telephone: (000)555-1234
SA
MP
LE
S
UNCONSOLIDATED-UNDRAINEDTRIAXIAL
Logo
Figure 6.14 Examples of final borehole logs. (Copyright 2011 Bentley Systems, Incorporated.All Rights Reserved.)

6.9 OFFSHORE SITE INVESTIGATIONS 91
SANDY SILT (ML) very stiff, reddish
brown
-hard 1.77-1.98m
CLAY (CH) very stiff, reddish brown and
light gray, slickensided,w/ferrous stains,silt and sand seams
19
26
NP
NP
71
NP
NP
27
NP
NP
44
85
93
92
50102mm
84203mm
32.3
31.1
30.6
PROJECT: gINT Example
LOCATION: Somewhere, USA
PROJECT NO.: 987654321
DATE: 4-7-10 COMPLETION DEPTH : 7.0 m
UNDRAINED SHEAR STRENGTH,kPa
WATER OBSERVATIONS:
SY
MB
OL
DESCRIPTION
DR
Y U
NIT
WE
IGH
T,
kN
/m3
NAT
UR
AL M
OIS
TU
RE
CO
NT
EN
T, %
LIQ
UID
LIM
IT, %
PLA
ST
IC L
IMIT
, %
PLA
ST
ICIT
Y IN
DE
X, %
PE
RC
EN
T P
AS
SIN
GN
O. 200 S
IEV
E
50 100 150 200 250
: FREE WATER ENCOUNTERED AT 0.6 m DURING DRILLING.
: WATER DEPTH AT 0.5 m, HOLE OPENED TO 0.6m ON 4-9-10
SP
T N
-VA
LU
Eblo
ws p
er
0.3
mete
rs
32.6
DE
PT
H, m
5.0
5.5
6.0
6.5
7.0
7.5
8.0
8.5
9.0
9.5
10.0
LOG OF BORING NO. B-1 Cont’d Sheet 2 of 2
ELE
VAT
ION
, m
UNCONFINED COMPRESSION
TORVANE
HAND PENETROMETER
ACME Consulting
1234 Main Street
Somewhere, USA 00000
Telephone: (000) 555-1234
SA
MP
LE
S
UNCONSOLIDATED-UNDRAINEDTRIAXIAL
Logo
Figure 6.14 (Continued)

92 6 SITE INVESTIGATION, DRILLING, AND SAMPLING
32
38
68
73
38
45
62
92
95
Brown Clayey Sand (SC),very dense,dry to moist,with small roots nearsurface
moist to wet
saturated
Gray-Brown Sandy Clay (CL), verystiff, saturated
Bottom of Boring
TYPE: LOCATION:
20
75 mm Thin Wall Tube & 50 mm Split Spoon
0
LOG OF BORING NO. B-1gINT Example
Somewhere, USA
DRILL METHOD:
ACME Consulting
failure strain (%)PP (pocket penetrometer)
DATE: June 9, 2010 DATE: June 10, 2010
WATER DEPTH: 5.3 m CAVED AT: 10.9 m
-#2
00
,%
PLATE 2
BLO
WS
PE
R 0
.3 M
25 mm Hollow Stem Auger
SA
MP
LE
S
10 m northwest of northwest building corner and16.5 m east of creek. See Plate1.
COMPLETION DEPTH: 16 m
confining press (kN/m2)
DE
PT
H,
UN
IT D
RY
WT
kN
/m3
SY
MB
OL
DESCRIPTION OF MATERIAL
10 20 30 40 50 60 700 80
Plastic Limit Liquid LimitMoisture Content
UNDRAINED SHEAR STRENGTH, kPa
0.2 0.4 0.6 0.8 1.0 1.2 1.4
SURFACE ELEV.: 4.2 m
PP
PP
6.9%5.1
5.2%6.3
1
2
3
4
5
6
7
8
9
10
11
12
13
14
15
16
17
18
19
Figure 6.14 (Continued)
6.9 OFFSHORE SITE INVESTIGATIONS 93
Majorsdivisions
Fine-grained
soils
Gravel and
gravelly soils
GW
GP
GM
SW
SP
SC
SM
Sandsand sandy
soils
Letter and symbol
Name
GC
Gravel or sandy gravel well graded
Gravel or sandy gravel poorly graded
Silty gravel or silty sandy gravel
Clayey gravel or clayey sandy gravel
Sand or gravelly sand well graded
Sand or gravelly sand poorly graded
Silty sand or silty gravelly sand
Clayey sand or clayey gravelly sand
Silt andclay soils(low liquid
limit)
Silt andclay soils (high liquid
limit)
ML
CL
OL
MH
CH
OH
Coarse-grained
soils
Silts, sandy silts, gravelly silts or diatomaceous soil
Lean clays, sandy clays, or gravelly clays
Organic silts or lean organic clays
Micaceous silts, diatomaceous soils, or elastic silts
Fat clays
Fat organic clays
PTFibrous organic soils Peat humus, and other organic swamp soils
Figure 6.15 Key to soil type representation.
Fixed platform(FP)
(to 460 m.)
Complianttower(CT)
(460 to 920 m.) Sea star(SStar)
(150 to 1050 m.) Floatingproductionsystems(FPS)
(460 to 1800 m.)
Tensionleg
platform(TLP)
(460 to 2150 m.)
Sparplatform
(600 to 3000 m.)
Sub Seasystem
(SS)(To 2150 m.)
Figure 6.16 Types of offshore oil platforms. (Courtesy of Otis Armstrong and Greg Overton.)
94 6 SITE INVESTIGATION, DRILLING, AND SAMPLING
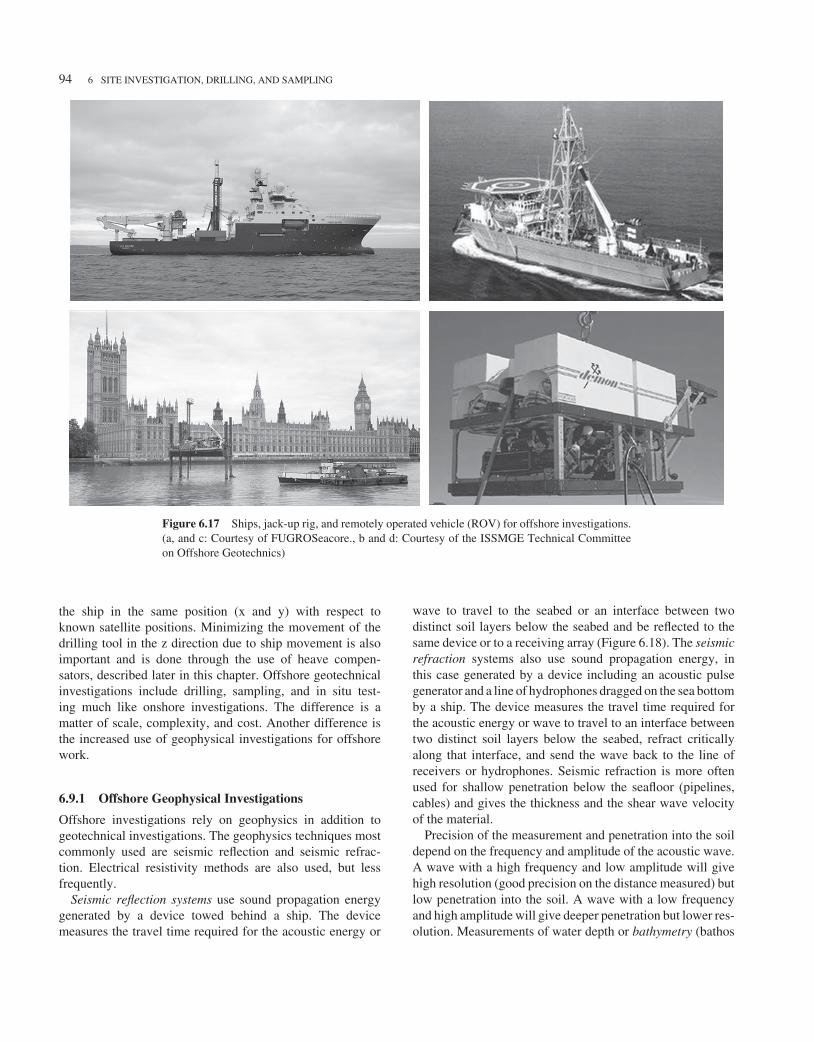
Figure 6.17 Ships, jack-up rig, and remotely operated vehicle (ROV) for offshore investigations.(a, and c: Courtesy of FUGROSeacore., b and d: Courtesy of the ISSMGE Technical Committeeon Offshore Geotechnics)
the ship in the same position (x and y) with respect toknown satellite positions. Minimizing the movement of thedrilling tool in the z direction due to ship movement is alsoimportant and is done through the use of heave compen-sators, described later in this chapter. Offshore geotechnicalinvestigations include drilling, sampling, and in situ test-ing much like onshore investigations. The difference is amatter of scale, complexity, and cost. Another difference isthe increased use of geophysical investigations for offshorework.
6.9.1 Offshore Geophysical Investigations
Offshore investigations rely on geophysics in addition togeotechnical investigations. The geophysics techniques mostcommonly used are seismic reflection and seismic refrac-tion. Electrical resistivity methods are also used, but lessfrequently.
Seismic reflection systems use sound propagation energygenerated by a device towed behind a ship. The devicemeasures the travel time required for the acoustic energy or
wave to travel to the seabed or an interface between twodistinct soil layers below the seabed and be reflected to thesame device or to a receiving array (Figure 6.18). The seismicrefraction systems also use sound propagation energy, inthis case generated by a device including an acoustic pulsegenerator and a line of hydrophones dragged on the sea bottomby a ship. The device measures the travel time required forthe acoustic energy or wave to travel to an interface betweentwo distinct soil layers below the seabed, refract criticallyalong that interface, and send the wave back to the line ofreceivers or hydrophones. Seismic refraction is more oftenused for shallow penetration below the seafloor (pipelines,cables) and gives the thickness and the shear wave velocityof the material.
Precision of the measurement and penetration into the soildepend on the frequency and amplitude of the acoustic wave.A wave with a high frequency and low amplitude will givehigh resolution (good precision on the distance measured) butlow penetration into the soil. A wave with a low frequencyand high amplitude will give deeper penetration but lower res-olution. Measurements of water depth or bathymetry (bathos

6.9 OFFSHORE SITE INVESTIGATIONS 95
GPS navigation
Chirper
Pinger
Sea floor
Sparker/
boomer
Receive array
Geological strata
Figure 6.18 Offshore geophysics investigations: seismic reflection. (Courtesy of Ozcoast.)
Figure 6.19 Sidescan sonar and sea-bottom image generated therefrom. (Courtesy of the ISSMGETechnical Committee on Offshore Geotechnics.)
means “depth” in Greek) are made using echosounders towedin the water column behind a boat. Pictures of the sea floorare obtained with sidescan sonars (Figure 6.19). These sonarsaim sideways to capture a wide image of the sea floor. Imagesof the soil layers below the sea bottom are generated by usingsub-bottom profilers such as pingers, chirpers, boomers, andsparkers (Figure 6.18). The frequencies generated by thesedevices vary from 0.5 kHz to 40 kHz and give penetration of
the soil from 1 to 100 m with about a 1 to 10% resolution.Examples of the results obtained through geophysics tests areshown in Figure 6.20.
6.9.2 Offshore Geotechnical Drilling
Compared to onshore drilling, offshore drilling adds at leasttwo complexities: larger depths, which can reach thousandsof meters of combined water depth and penetration depth;

96 6 SITE INVESTIGATION, DRILLING, AND SAMPLING
0500
30—
40—
50—
60—
70—
80—
30—
40—
50—
60—
70—
80—
30—
40—
50—
60—
70—
80—
30—
40—
50—
60—
70—
80—
30—
40—
50—
60—
70—
80—
30—
40—
50—
60—
70—
80—
30—
40—
50—
60—
70—
80—
30—
40—
50—
60—
70—
80—
30—
40—
50—
60—
70—
80—
30—
40—
50—
60—
70—
80—
30—
40—
50—
60—
70—
80—
30—
40—
50—
60—
70—
80—
30—
40—
50—
60—
70—
80—
30—
40—
50—
60—
70—
80—
30—
40—
50—
60—
70—
80—
30—
40—
50—
60—
70—
80—
30—
40—
50—
60—
70—
80—
30—
40—
50—
60—
70—
80—
30—
40—
50—
60—
70—
80—
30—
40—
50—
60—
70—
80—
30—
40—
50—
60—
70—
80—
30—
40—
50—
60—
70—
80—
30—
40—
50—
60—
70—
80—
1000 1500 2000FFID
2500 3000 3500
0.1
TW
T (
s)
Z3-07-SC age = 20 Chirp line MCC-22
Figure 6.20 Examples of sub-bottom profiler results. (a: Courtesy of EdgeTech; image capturedby EdgeTech 3100 Portable sub-bottom profiling system, b: Courtesy of United States GeologicalSurvey, USA)
and vertical motion of the drill rig due to waves. The wetrotary drilling method is always used for offshore work, butit is very difficult to recirculate the drilling mud; this wouldrequire injecting the drilling mud from the ship down thedrill pipes, and bringing it back to the ship. It would benecessary to have a double set of concentric drill pipes andwould complicate the process dramatically while increasingthe weight significantly. Instead, a single string of drill pipesis used and the biodegradable drilling mud is expended aswaste on the sea floor. Many offshore sediments are verysoft near the sea floor, so a casing is necessary to preventcollapse of the borehole. Furthermore, access to the boreholeafter drilling is necessary to take a sample or run an in situtest. For these reasons offshore drilling is done by rotatingcasing-size drill pipes, typically 127 mm outside diameter and
102 mm inside diameter. The drill bit at the end of the pipesis about 220 mm in outside diameter (Figure 6.21) and allowsfree access to the soil for various tools through the center ofthe pipes and the bit. Often the drill pipes will go through asupport bottom platform (Figure 6.22) to guide the pipes andprovide bottom support.
The ship movement must not be transmitted to the drillpipes or the drill bit would go up and down with the ship.This would lead to very poor borehole quality and couldplug the bit. Heave compensators or motion compensatorsare instruments that minimize this problem (Figure 6.23).They can be passive (spring-and-dashpot system from whichthe top of the rods is hanging) or active (computer-controlledhydraulic jacks acting on the rods to compensate for measuredmotion).

6.9 OFFSHORE SITE INVESTIGATIONS 97
Drill-stringor Drillpipe
Drillingfluid
(mud)
Drill bit210-230mmf
BoreholeWall
Seafloor
Figure 6.21 Bottom of drill pipes with drill bit. (Left: Courtesy of Rok Max Drilling Tools, Ltd.;Right: After Richards and Zuidberg 1985.)
Top drive
power swivel
Motion compensation
system
Line tensioner
5” Drillstring
Re-entry
funnel
Seabed reaction
and re-entry
Frame: seaclam
Hydraulic
pipe clam
CPT
Downhole
hydraulic push
sampler: wip
sampler
1Drill
3
Drill
4Clamp
andpreform
2
Clamp
and
sample
Open dragbit
DownholeCPT system:
wison
Figure 6.22 Drilling, sampling, and in situ testing through the drill string. (Courtesy of theISSMGE Technical Committee on Offshore Geotechnics.)

98 6 SITE INVESTIGATION, DRILLING, AND SAMPLING
0.75 M
2.9 M
0.1To
2.7 M
Local/remotewave motionindicator anddriver pump
Tooljoint
0.33 Mv
Heavecompensator
Figure 6.23 Drill derrick with heave compensator. (a: Courtesy of Pulse Guard; b: Courtesy ofIntegrated Ocean Drilling Program.)
Lifting point
Fins
Weight
Barrel
Liner
Core catcher
Cutting shoe
Figure 6.24 Drop core samplers. (a: After ISSMGE Technical Committee on Offshore Geotech-nics, b: Courtesy of Offshore Magazine//PennWell Corp.)
6.9 OFFSHORE SITE INVESTIGATIONS 99
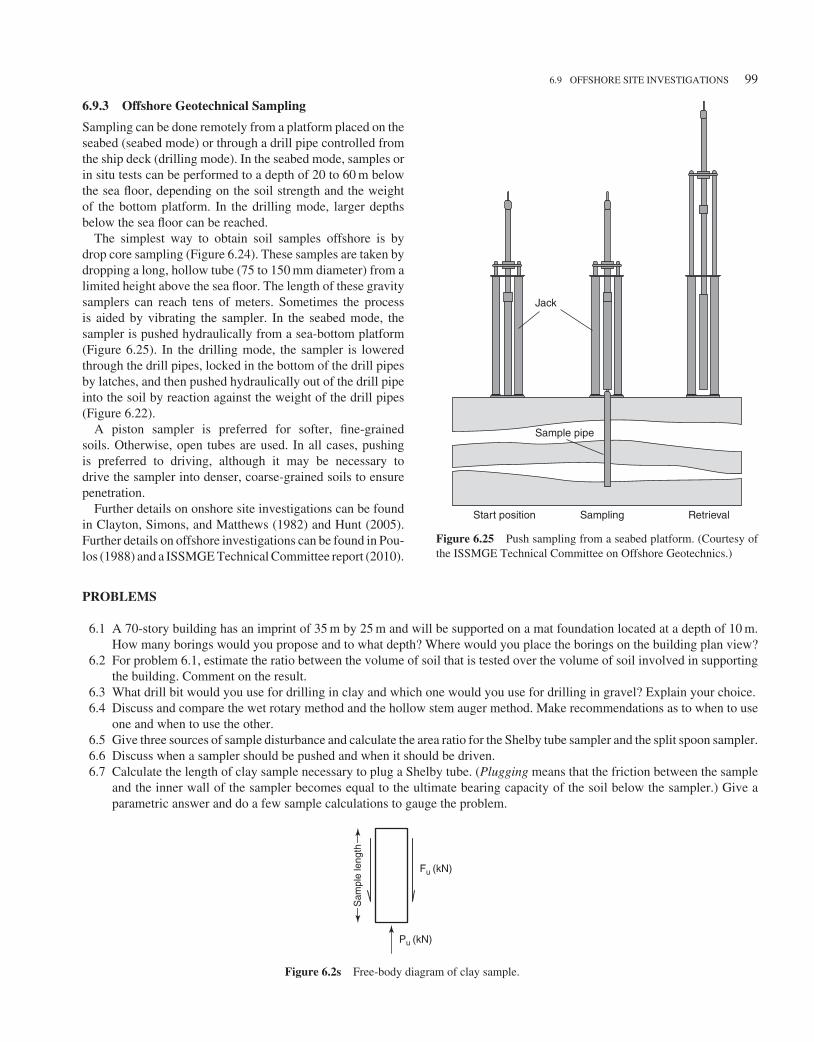
6.9.3 Offshore Geotechnical Sampling
Sampling can be done remotely from a platform placed on theseabed (seabed mode) or through a drill pipe controlled fromthe ship deck (drilling mode). In the seabed mode, samples orin situ tests can be performed to a depth of 20 to 60 m belowthe sea floor, depending on the soil strength and the weightof the bottom platform. In the drilling mode, larger depthsbelow the sea floor can be reached.
The simplest way to obtain soil samples offshore is bydrop core sampling (Figure 6.24). These samples are taken bydropping a long, hollow tube (75 to 150 mm diameter) from alimited height above the sea floor. The length of these gravitysamplers can reach tens of meters. Sometimes the processis aided by vibrating the sampler. In the seabed mode, thesampler is pushed hydraulically from a sea-bottom platform(Figure 6.25). In the drilling mode, the sampler is loweredthrough the drill pipes, locked in the bottom of the drill pipesby latches, and then pushed hydraulically out of the drill pipeinto the soil by reaction against the weight of the drill pipes(Figure 6.22).
A piston sampler is preferred for softer, fine-grainedsoils. Otherwise, open tubes are used. In all cases, pushingis preferred to driving, although it may be necessary todrive the sampler into denser, coarse-grained soils to ensurepenetration.
Further details on onshore site investigations can be foundin Clayton, Simons, and Matthews (1982) and Hunt (2005).Further details on offshore investigations can be found in Pou-los (1988) and a ISSMGE Technical Committee report (2010).
Start position
Sample pipe
Jack
Sampling Retrieval
Figure 6.25 Push sampling from a seabed platform. (Courtesy ofthe ISSMGE Technical Committee on Offshore Geotechnics.)
PROBLEMS
6.1 A 70-story building has an imprint of 35 m by 25 m and will be supported on a mat foundation located at a depth of 10 m.How many borings would you propose and to what depth? Where would you place the borings on the building plan view?
6.2 For problem 6.1, estimate the ratio between the volume of soil that is tested over the volume of soil involved in supportingthe building. Comment on the result.
6.3 What drill bit would you use for drilling in clay and which one would you use for drilling in gravel? Explain your choice.6.4 Discuss and compare the wet rotary method and the hollow stem auger method. Make recommendations as to when to use
one and when to use the other.6.5 Give three sources of sample disturbance and calculate the area ratio for the Shelby tube sampler and the split spoon sampler.6.6 Discuss when a sampler should be pushed and when it should be driven.6.7 Calculate the length of clay sample necessary to plug a Shelby tube. (Plugging means that the friction between the sample
and the inner wall of the sampler becomes equal to the ultimate bearing capacity of the soil below the sampler.) Give aparametric answer and do a few sample calculations to gauge the problem.
Fu (kN)
Pu (kN)
Sam
ple
length
Figure 6.2s Free-body diagram of clay sample.

100 6 SITE INVESTIGATION, DRILLING, AND SAMPLING
6.8 Describe the simple tests that would allow you to identify a soil in the field.6.9 Explain the differences between drilling onshore and drilling offshore.
6.10 Explain the difference between the seismic reflection and the seismic refraction methods used for offshore investigations.6.11 What is a piston sampler?
Problems and Solutions
Problem 6.1
A 70-story building has an imprint of 35 m by 25 m and will be supported on a mat foundation located at a depth of 10 m.How many borings would you propose and to what depth? Where would you place the borings on the building plan view?
Solution 6.1
A boring is required roughly every 250 m2, so the minimum number of boreholes is
35 × 25
250= 3.5
So, 4 or 5 borings are reasonable. The depth of the borings is usually one to two times the width of the foundation, with atleast one boring extending to two times the width of the foundation below the foundation level. The depth of borings shouldbe: 2B = 2 × 25 = 50 m.
For a rectangular mat, it is desirable to have a boring near each corner of the mat and one in the center. Therefore, apossible layout of the boring plan is shown in Figure 6.1s. Particular site specific soil conditions may affect this solution.
Figure 6.1s Borehole locations.
Problem 6.2
For problem 6.1, estimate the ratio between the volume of soil that is tested over the volume of soil involved in supportingthe building. Comment on the result.
Solution 6.2
The depth of influence for the mat foundation can be considered to be 2B = 2 × 25 = 50 m. The volume of soil affected bythe mat foundation of the building can be estimated as:
VSoil = 35 × 25 × 50 = 43,750 m3
The volume of soil drilled (given a boring diameter of 100 mm) is:
Vboreholes = 5 × π × 0.12
4× 50 = 1.96 m3
If it is assumed that the volume of soil tested is one-third of the volume of soil drilled, then:
Vtested = 0.33 × 1.96 = 0.65 m3
The ratio of the volume of soil that is tested over the volume of soil involved in supporting the building is:
Vtested
Vsoil= 1.48 × 10−5 = 0.00148 %
This shows that the volume of soil tested in a typical soil investigation is extremely small. Add to this the fact that soils areknown to be heterogeneous, and it is obvious that one must accept a significant degree of imprecision in geotechnical prediction.

6.9 OFFSHORE SITE INVESTIGATIONS 101
Problem 6.3
What drill bit would you use for drilling in clay and which one would you use for drilling in gravel? Explain your choice.
Solution 6.3
A drag bit or finger bit is recommended for drilling in clay because it carves the soil with finger-like protrusions. This reducesthe disturbance of the clay. Roller bits are used for drilling in gravel because it is made of three rollers that roll against thesoil and erode it or push it aside. Finger bits are not used for drilling in gravel because the larger particles could get stuckbetween the fingers of the drag bit, damage it, and create excessive disturbance.
Problem 6.4
Discuss and compare the wet rotary method and the hollow stem auger method. Make recommendations as to when to useone and when to use the other.
Solution 6.4
The wet rotary method consists of drilling a borehole with a drill bit while circulating drilling mud through the center of therods. The drill bit is typically 75 to 150 mm in diameter and the rods 40 to 70 mm in diameter. The drilling mud flows downthe center of the rods while they rotate and back to the surface on the outside of the rods between the wall of the borehole andthe exterior wall of the rods. This return flow carries the soil cuttings back to the surface by entrainment. The drilling mudarrives in the mud pit where it is sucked back up to the top of the drilling rods by a pump. The water swivel, which connectsthe hose carrying the drilling mud back to the top of the rods and the rods themselves, allows the hose to remain stationarywhile the rods keep rotating. The drill bit at the bottom end of the drill rods is typically either a drag bit or a roller bit.
The hollow stem auger method consists of rotating hollow stem augers into the soil; these augers are 150 to 300 mm indiameter. The hollow center part of the augers gives access for sampling or any other testing device that is to be lowered tothe bottom of the hole. The hollow stem auger has the advantage of providing a casing against collapse of the side walls ofthe borehole, but is limited in penetration depth because it requires a significant torque to advance the augers. The wet rotarymethod has the advantage of being much less limited by depth, but sometimes faces problems of borehole instability.
Problem 6.5
(a) Give three sources of sample disturbance and (b) calculate the area ratio for the Shelby tube sampler and the split spoonsampler.
Solution 6.5
a. Three sources of sample disturbance:• Change in stress condition• Mechanical disturbance of the soil structure• Changes in water content and porosity
b. The equation to calculate the area ratio is:
AR = (π(D2o − D2
i )/4)/(πD2i /4)
where Do is the outside diameter of the sampling tube, and Di is the inside diameter of the sampling tube.• For the Shelby tube sampler, Do = 76.2 mm and Di = 72.9 mm; therefore:
AR = (π(D2o − D2
i )/4)/(πD2i /4) = (Do/Di)
2 − 1 = (76.2/72.9)2 − 1 = 0.092
The area ratio for the Shelby tube sampler is 9.2%.• For the split spoon sampler, Do = 50.8 mm and Di = 34.9 mm; therefore:
AR = (π(D2o − D2
i )/4)/(πD2i /4) = (Do/Di)
2 − 1 = (50.8/34.9)2 − 1 = 1.13
The area ratio for the split spoon sampler is 113%.
Problem 6.6
Discuss when a sampler should be pushed and when it should be driven.

102 6 SITE INVESTIGATION, DRILLING, AND SAMPLING
Solution 6.6
Samplers should usually be pushed in clays or silts to minimize soil disturbance and yield samples well suited for qualitylaboratory tests. Samplers are usually driven in sands or gravels because it is very difficult to push them into these soilswithout damaging the tube and therefore the sample. Driven samples are disturbed and only well suited for soil identificationand classification purposes. For organic fibrous soils such as peats, it is best to drive the sampler, because the drivingaction has a better chance to cut the fibers rather than pushing them and simply compressing and disturbing the peatexcessively.
Problem 6.7
Calculate the length of clay sample necessary to plug a Shelby tube. (Plugging means that the friction between the sampleand the inner wall of the sampler becomes equal to the ultimate bearing capacity of the soil below the sampler.) Give aparametric answer and do a few sample calculations to gauge the problem.
Solution 6.7
The free-body diagram of the clay sample is shown in Figure 6.2s.
Fu (kN)
Pu (kN)
Sam
ple
length
Figure 6.2s Free-body diagram of clay sample.
fu: Unit side friction between Shelby tube and the soilD: Diameter of the sampleL: Length of clay sampleSu: Undrained shear strengthα: Friction coefficientγ : Unit weight of the soilZ: Depth of clay sampleNc: Bearing capacity factor
Fu = fuπDL = αSuπDL
Pu = (NcSu + γ z)πD2
4
Plugging occurs when:Pu
Fu
< 1 → (NcSu + γ z)π D2
4
αSuπDL< 1
→ (NcSu + γ z)D
4αSuL< 1
Sample calculations:
if z = 0, α= 1, Nc = 9
9SuD
4SuL< 1 → 9D
4L< 1
L > 2.25D
if z = 0, α = 0.5, Nc = 9
9SuD
4 × 0.5SuL< 1
L > 4.5D
if γ z = NcSu, α = 0.5, Nc = 9
2 × 9SuD
4 × 0.5SuL< 1
L > 9D

6.9 OFFSHORE SITE INVESTIGATIONS 103
Problem 6.8
Describe the simple tests that would allow you to identify a soil in the field.
Solution 6.8
On cuttings:
1. Visual inspection2. Feel the graininess or smoothness of the soil3. Wash hands test4. Dilatancy test (hand shaking test)5. Dry strength test6. Thread rolling test (toughness test)
On samples:
1. On clays and silts, the thumb or nail test for undrained shear strength2. On the ground surface of a sand or gravel deposit, the 12 mm diameter steel bar test for strength
ASTM D2488, “Standard Practice for Description and Identification of Soils (Visual-Manual Procedure),” describes someof these tests.
Problem 6.9
Explain the differences between drilling onshore and drilling offshore.
Solution 6.9
Offshore geotechnical investigations include drilling, sampling, and in situ testing, much like onshore investigations. Thedifference is a matter of scale, complexity, and cost. Compared to onshore drilling, offshore drilling has at least twocomplexities: larger depths, which can reach thousands of meters of combined water depth and penetration depth; and verticalmotion of the drill rig due to waves. Another difference is the increased use of geophysical investigations for offshore work.
Problem 6.10
Explain the difference between the seismic reflection and the seismic refraction methods used for offshore investigations.
Solution 6.10
Seismic reflection systems use sound propagation energy generated by a device towed behind a ship. The device measuresthe travel time required for the acoustic energy or wave to travel to the seabed or an interface between two distinct soillayers below the sea bed and be reflected to the same device or to a receiving array. Seismic refraction systems use soundpropagation energy generated by a device including an acoustic pulse generator and a line of hydrophones dragged on thesea bottom by a ship. The device measures the travel time required for the acoustic energy or wave to travel to an interfacebetween two distinct soil layers below the seabed, refract critically along that interface, and send the wave back to the line ofreceivers or hydrophones. Seismic refraction is more often used for shallow penetration below the seafloor (pipelines, cables)and gives the thickness and the shear wave velocity of the material.
Precision of the measurement and penetration into the soil depend on the frequency and amplitude of the acoustic wave.A wave with a high frequency and low amplitude will give high resolution (good precision on the distance measured) butlow penetration into the soil while a wave with a low frequency and high amplitude will give deeper penetration but lowerresolution.
Problem 6.11
What is a piston sampler?
Solution 6.11
A piston sampler has a piston blocking the opening at the bottom of the sampler (see Figure 6.10). This piston is locked inplace as the sampler is lowered to the desired depth. The piston is then held at that depth while the sampling tube is pushedpast the piston into the soil. The vacuum that can develop at the top of the sample helps the soil enter the sampler andminimizes the plugging effect.