Embed Size (px)
Citation preview

Somatosensory Projections to Cochlear Nucleus are Up-regulated after Unilateral Deafness
Chunhua Zeng1, Ziheng Yang1, Lauren Shreve1, Sanford Bledsoe1, and Susan Shore1,2
1Kresge Hearing Research Institute, Department of Otolaryngology, University of Michigan, 1301East Ann Street, Ann Arbor, MI 48109-05062Department of Molecular and Integrative Physiology, University of Michigan
AbstractThe cochlear nucleus (CN) receives innervation from auditory and somatosensory structures,which can be identified using vesicular glutamate transporters, VGLUT1 and VGLUT2. VGLUT1is highly expressed in the magnocellular ventral CN (VCN), which receives auditory nerve inputs.VGLUT2 is predominantly expressed in the granule cell domain (GCD), which receives non-auditory inputs from somatosensory nuclei, including spinal trigeminal nucleus (Sp5) and cuneatenucleus (Cu). Two weeks after unilateral deafening VGLUT1 is significantly decreased inipsilateral VCN while VGLUT2 is significantly increased in the ipsilateral GCD (Zeng et al.,2009), putatively reflecting decreased inputs from auditory nerve and increased inputs from non-auditory structures in guinea pigs. Here we wished to determine whether the upregulation ofVGLUT2 represents increases in the number of somatosensory projections to the CN that aremaintained for longer periods of time. Thus we examined concurrent changes in VGLUT levelsand somatosensory projections in the CN using immunohistochemistry combined with anterogradetract tracing three and six weeks following unilateral deafening. The data reveal that unilateraldeafness leads to increased numbers of VGLUT2-colabeled Sp5 and Cu projections to the ventraland dorsal CN. These findings suggest that Sp5 and Cu play significant and unique roles in cross-modal compensation and that, unlike after shorter term deafness, neurons in the magnocelluarregions also participate in the compensation. The enhanced glutamatergic somatosensoryprojections to the CN may play a role in neural spontaneous hyperactivity associated with tinnitus.
Keywordsvesicular glutamate transporters; glutamatergic; plasticity; cochlear nucleus; cuneate nucleus;spinal trigeminal nucleus; unilateral deafness; somatosensory
IntroductionThe cochlear nucleus (CN) receives auditory inputs from type I auditory nerve fibers(ANFs) and non-auditory inputs from several somatosensory nuclei, including the spinaltrigeminal nucleus (Sp5), trigeminal ganglion, cuneate nucleus (Cu), vestibular nuclei andcontralateral CN (Barker et al., 2012; Bukowska, 2002; Burian and Gstoettner, 1988; Doucetet al., 2009; Haenggeli et al., 2005; Zeng et al., 2011; Zhou and Shore, 2004; Zhou et al.,2010). The non-auditory projections terminate predominantly in the CN granule cell domain(GCD) (Zeng et al., 2011; Zhan and Ryugo, 2007; Zhou et al., 2007), which includes thesuperficial shell region of ventral CN (VCN) and the fusiform cell layer of dorsal cochlear
Correspondence to: Susan Shore Tel: 734-647-2116; Fax: 734-764-0014; [email protected].
NIH Public AccessAuthor ManuscriptJ Neurosci. Author manuscript; available in PMC 2013 May 07.
Published in final edited form as:J Neurosci. 2012 November 7; 32(45): 15791–15801. doi:10.1523/JNEUROSCI.2598-12.2012.
$waterm
ark-text$w
atermark-text
$waterm
ark-text

nucleus (DCN) (Hackney et al., 1990; Mugnaini et al., 1980; Weedman et al., 1996; Zhouand Shore, 2004). These projections give CN the unique ability to integrate informationfrom the auditory nerve and somatosensory system (Shore, 2005) and compensate tocochlear damage (Barker et al., 2012; Dehmel et al., 2012; Kaltenbach, 2007; Shore et al.,2008; Zeng et al., 2009) .
The vesicular glutamate transporter subtypes have different distributions in the brain.VGLUT2 is strongly expressed by neurons in auditory subcortical nuclei, whereas VGLUT1is dominant in the auditory cortex and at variable levels among auditory subcortical nuclei(Hackett and de la Mothe, 2009; Hackett et al., 2011). In the CN VGLUT1 and VGLUT2have distinct distributions associated with projections from auditory and somatosensoryinputs, respectively (Zhou et al., 2007). VGLUT1 is highly expressed in the magnocellulararea of VCN and deep layer of the dorsal cochlear nucleus (DCN3), where ANFs terminateon principal neurons. In contrast, VGLUT2 is expressed mostly in the GCD of the CN,which receives primarily non-auditory inputs from somatosensory nuclei (Zhou et al., 2007).Somatosensory terminals from Sp5, Cu and vestibular nuclei as well as terminals from thecontralateral CN colabel with VGLUT2 but rarely VGLUT1, whereas type I ANF terminalsexclusively colabel with VGLUT1 (Barker et al., 2012; Zeng et al., 2011; Zhou et al., 2007;Zhou et al., 2010). This pathway-specific feature can be used to quantify changes in auditoryand somatosensory inputs after unilateral deafening.
Previously, we demonstrated changes in the relative distributions of VGLUT1 and VGLUT2in the guinea pig CN after unilateral deafening (Zeng et al., 2009): While VGLUT1decreased in the ipsilateral VCN two weeks post-deafening, VGLUT2 increased in the GCDthat receives non-auditory inputs (Zeng et al., 2009). These changes suggested anenhancement in non-auditory glutamatergic inputs. However, the sources of these increasedVGLUT2 levels have not been elucidated. Here, we combined VGLUTimmunohistochemistry with anterograde tract tracing to determine whether post-deafeningincreases in VGLUT2 represented increases in the number of projections from thesomatosensory pathways to the CN. The results indicate that following unilateral deafening,an increased number of projections from both Sp5 and Cu provide the basis for the increasedVGLUT2 distributions. Furthermore, these increased projections occurred not only in theGCD, but also in magnocellular regions, suggesting a differential redistribution ofsomatosensory inputs to the CN.
Materials and MethodsEighteen female pigmented guinea pigs (250–350 g, Elm Hill Breeding Labs, Chelmsford,MA, USA) with normal Preyer’s reflexes were used in this study. Ten were unilaterallydeafened and eight were used as controls. In order to quantify changes in VGLUT isoformlevels, three unilaterally deafened animals were allowed to survive for three weeks (3wdeafened), and three were allowed to survive for six weeks following the deafening (6wdeafened). Two age-matched normal animals were used as control for each group (3wdeafened and 6w deafened). An additional eight animals were used to identify the locationsof VGLUT- co-labeled terminals following tracer injections in Sp5 or Cu. Of these eightanimals, four were unilaterally deafened and four were controls. Two deafened animalsreceived tracer injections in Sp5 and two received injections in Cu two weeks followingdeafening. These animals were sacrificed after another week to allow for anterogradetracing. Four age-matched control animals received tracer injections in Sp5 (N=2) and Cu(N=2) in the same timeframe as the deafened animals. All animals with tracer injectionswere allowed to survive for one week before being sacrificed. All procedures wereperformed in accordance with the NIH guidelines for the use and care of laboratory animals
Zeng et al. Page 2
J Neurosci. Author manuscript; available in PMC 2013 May 07.
$waterm
ark-text$w
atermark-text
$waterm
ark-text

(NIH publication No. 80-23), and guidelines provided by the University Committee on Useand Care of Animals (UCUCA) of the University of Michigan (UCUCA protocol # 08539).
Auditory brainstem response (ABR) measurementsABRs were measured for all animals before and at the end of the experiment prior toeuthanization. ABRs were recorded in an electrically and acoustically shielded chamber(Acoustic Systems, Austin, TX USA). Animals were anesthetized with ketamine (40 mg/kg)and xylazine (10 mg/kg) and body temperature was maintained with a thermostaticallycontrolled heating pad. Sub-dermal recording electrodes were placed at vertex (one cmposterior to bregma), reference (ventral to the pinna on the tested ear) and ground (ventral tothe pinna on the contralateral ear) sites.
Digital signals were generated and delivered by Tucker Davis Technologies (TDT, Alachua,FL USA) hardware controlled by a Pentium PC, using the TDT software package SigPlay32.Stimuli were generated using a sample rate of 100 kHz at 16-bit resolution. Equalization tocorrect for the system response was performed on the digital waveforms in the frequencydomain. Acoustic stimuli (15 ms tone bursts, with 1.5 ms rise/fall times) were presented at10 per second. TDT System II hardware and SigGen/Biosig software (TDT) were used topresent the stimulus and record responses. Tones (4, 8, 12 and 16 kHz) were deliveredthrough a Beyer driver (Beyer Dynamic Inc., Farmingdale, NY; aluminum-shieldedenclosure made in house), using a speculum placed just inside the tragus. Up to 1024responses were averaged for each stimulus level. Responses were collected for stimuluslevels in 10 dB steps at higher stimulus levels, with additional 5 dB steps near threshold.Thresholds were interpolated between the lowest stimulus level where a response wasobserved, and 5 dB lower, where no response was observed.
Deafening and tracer injectionsTen animals were anesthetized with intramuscular injections of ketamine hydrochloride(Ketaset; 40 mg/kg) and xylazine (Rompun; 10 mg/kg) and placed in a stereotaxic frame(David Kopf, Tujunga, CA). Rectal temperature was maintained at 38° + 0.5°C with athermostatically controlled heating pad. Using a post-auricular approach, a small incisionwas made behind the left ear and the skin retracted to expose the bulla. A small hole in thebulla was made and kanamycin (20 μl, 30% in normal saline) was injected into the cochleausing a Hamilton syringe, through the round window. After the injection, the skin overlyingthe bulla was sutured and the animal was allowed to recover.
Two weeks following deafening, two animals received anterograde tracers [10%biotinylated dextran-amine (BDA), MW 10,000, Molecular Probes] in Sp5 and two animalsreceived injections in Cu, while four control animals likewise received identical tracerinjections in Sp5 or Cu. The surgical procedure has been described previously (Zeng et al.,2011; Zhou and Shore, 2004). Briefly, an opening just lateral-caudal to lambda was drilledin the occipital bone. A Hamilton microsyringe equipped with a glass micropipette (20-30μm tip) was positioned into the left Sp5 (3mm lateral to the midline, 2mm caudal to theposterior edge of the transverse sinus, and 10.4mm ventral to the surface of the dura) or theleft Cu (1.8 mm lateral to the midline, 3 mm caudal to the posterior edge of the transversesinus, and 8.8 mm ventral to the surface of the dura). A total volume of 0.1 μl anterogradetracer (BDA) was injected into the Sp5 or Cu. After removing the pipette, the animals weresutured and allowed one week to recover.
Three weeks following deafening, final ABR measurements were performed in all deafenedand control animals with tracer injection before being euthanized with FatalPlus (VortechPharmaceuticals, Dearborn, MI; 5mg/kg, intraperitoneally). Three deafened and two control
Zeng et al. Page 3
J Neurosci. Author manuscript; available in PMC 2013 May 07.
$waterm
ark-text$w
atermark-text
$waterm
ark-text

animals without tracer injections also received ABRs and were euthanized. The animalswere then perfused transcardially with 100 ml of 0.1 M phosphate-buffered saline (PBS; pH7.4), followed by 400 ml of 4% paraformaldehyde in the same buffer. The brains wereisolated and postfixed for 2 hours at 4°C, then transferred into 20% sucrose in 0.1 Mphosphate buffer overnight at 4°C. The brainstems were sectioned on a freezing microtomeat a thickness of 40 μm; the cochleae were processed for spiral ganglion counts (see below).
Three deafened animals and two control animals survived for six weeks after deafening.Following final ABR measurements, the animals were euthanized and the brainstem and thecochleae processed as above.
Spiral ganglion assessmentsAll deafened and control animals were processed for spiral ganglion counts. The density ofspiral ganglion cells (SGC) in the left (deafened) cochlea was compared with the right sideand the control animals.
Differences in the number of spiral ganglion neurons (SGN) were assessed as describedpreviously (Glueckert et al., 2008; Miller et al., 1997; Zappia and Altschuler, 1989). Briefly,cochleae were rapidly removed following vascular fixation. Cochleae were then decalcifiedin 5% EDTA and processed for embedding into JB-4 Plus, a glycol methacrylate plastic.Sections were cut at 5 μm in a paramodiolar plane such that mid-modiolar sections had sixcross-sectional profiles of Rosenthal’s canal. Plastic sections were mounted on slides,stained with Paragon and coverslipped. The twelve most mid-modiolar sections wereselected and every third section was used for quantitative assessment to reduce the chance ofcounting a cell twice. Digital images of the entire most basal cross sectional profile throughRosethals canal were acquired under bright field optics and exported to a Metamorph ImageAnalysis workstation. An image of the profile through Rosenthal canal was also acquired ata lower magnification and the outline circled to give an area using that could be used togenerate a measure for SGN density within that profile. The area of Rosenthal’s canal onevery third section was measured and the number of spiral ganglion neuron profiles counted.The criteria for inclusion as a spiral ganglion neuron included having a round cell body(aspect ratio of length to width 3:1) diameter between 14–20 μm, the presence of a nucleuswith a diameter between 7–10 μm, and a homogenous cytoplasm. The use of these criteriaminimized the potential for over- or underestimating the number of spiral ganglion cells thatcan occur when counting cell profiles due to, for example, surviving neurons changing theirsize significantly.
Brain tissue and immunocytochemistry processingForty μm transverse sections of the brainstem were cut and mounted in four series on cleanglass slides and air-dried. Two serial sections without tracer injections were used to labelVGLUT1 or VGLUT2 only, the two other series were saved as back-up. For the sectionswith tracer injections, one series was used to label BDA and VGLUT1, one was used tolabel BDA and VGLUT2, the third series was labeled with only BDA for injection locationdefinition and projection puncta counting. The final series was saved for back-up. To definethe injection size and location, all sections in the third series containing the injected tracerwere photographed using a fluorescent microscope equipped with a digital camera (Leica,DM). The images were imported to Photoshop and the borders of the injection site weretraced and cropped. The cropped images were exported to Metamorph for measuring theareas. The volume of each injection site was calculated by summing the injection areas andmultiplying by 120 μm, the separation between two contiguous sections (Moore andKowalchuk, 1988). This analysis yielded two pairs of size and location-matched Sp5
Zeng et al. Page 4
J Neurosci. Author manuscript; available in PMC 2013 May 07.
$waterm
ark-text$w
atermark-text
$waterm
ark-text
injections (two controls, two three-week deafened) and two pairs of Cu injections (twocontrols, two three-week deafened).
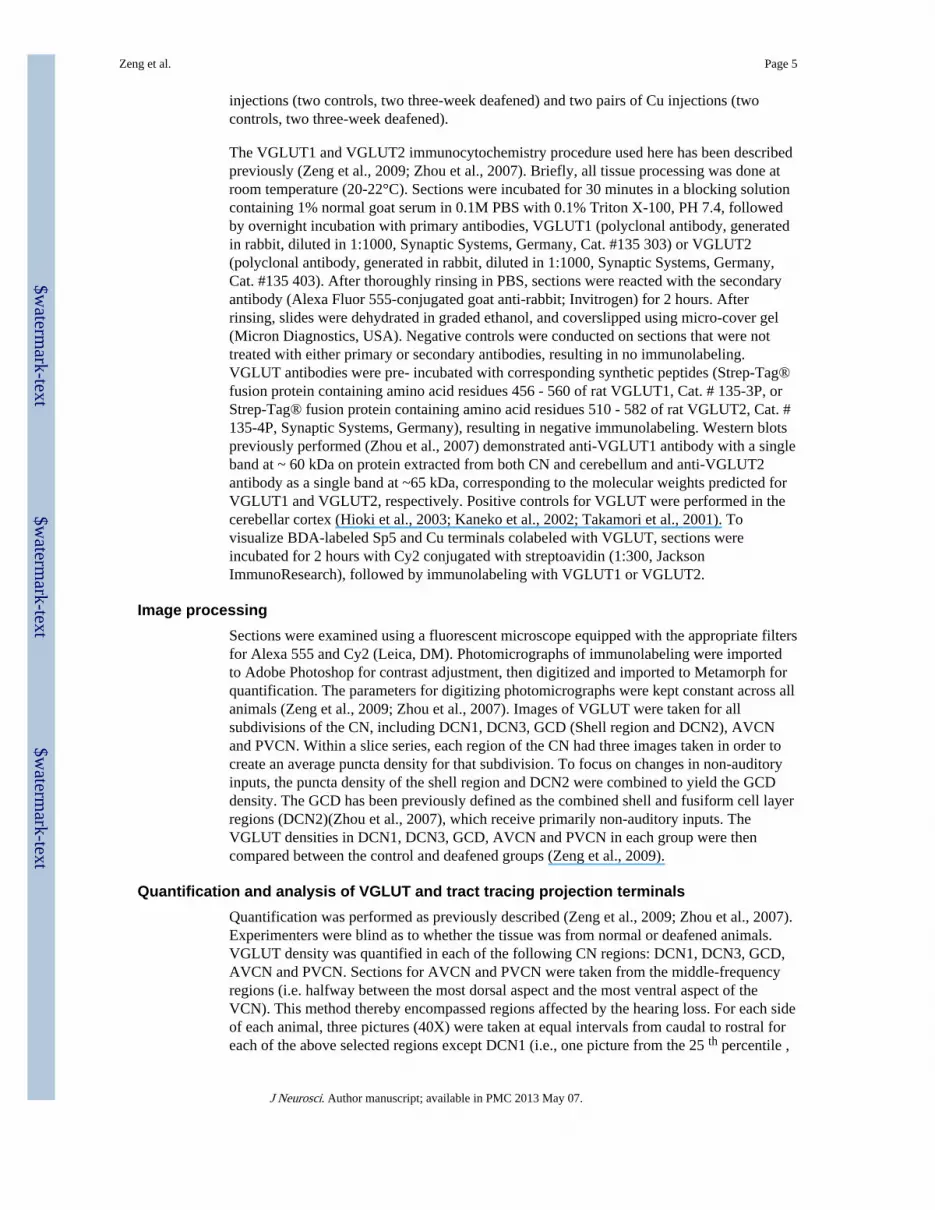
The VGLUT1 and VGLUT2 immunocytochemistry procedure used here has been describedpreviously (Zeng et al., 2009; Zhou et al., 2007). Briefly, all tissue processing was done atroom temperature (20-22°C). Sections were incubated for 30 minutes in a blocking solutioncontaining 1% normal goat serum in 0.1M PBS with 0.1% Triton X-100, PH 7.4, followedby overnight incubation with primary antibodies, VGLUT1 (polyclonal antibody, generatedin rabbit, diluted in 1:1000, Synaptic Systems, Germany, Cat. #135 303) or VGLUT2(polyclonal antibody, generated in rabbit, diluted in 1:1000, Synaptic Systems, Germany,Cat. #135 403). After thoroughly rinsing in PBS, sections were reacted with the secondaryantibody (Alexa Fluor 555-conjugated goat anti-rabbit; Invitrogen) for 2 hours. Afterrinsing, slides were dehydrated in graded ethanol, and coverslipped using micro-cover gel(Micron Diagnostics, USA). Negative controls were conducted on sections that were nottreated with either primary or secondary antibodies, resulting in no immunolabeling.VGLUT antibodies were pre- incubated with corresponding synthetic peptides (Strep-Tag®fusion protein containing amino acid residues 456 - 560 of rat VGLUT1, Cat. # 135-3P, orStrep-Tag® fusion protein containing amino acid residues 510 - 582 of rat VGLUT2, Cat. #135-4P, Synaptic Systems, Germany), resulting in negative immunolabeling. Western blotspreviously performed (Zhou et al., 2007) demonstrated anti-VGLUT1 antibody with a singleband at ~ 60 kDa on protein extracted from both CN and cerebellum and anti-VGLUT2antibody as a single band at ~65 kDa, corresponding to the molecular weights predicted forVGLUT1 and VGLUT2, respectively. Positive controls for VGLUT were performed in thecerebellar cortex (Hioki et al., 2003; Kaneko et al., 2002; Takamori et al., 2001). Tovisualize BDA-labeled Sp5 and Cu terminals colabeled with VGLUT, sections wereincubated for 2 hours with Cy2 conjugated with streptoavidin (1:300, JacksonImmunoResearch), followed by immunolabeling with VGLUT1 or VGLUT2.
Image processingSections were examined using a fluorescent microscope equipped with the appropriate filtersfor Alexa 555 and Cy2 (Leica, DM). Photomicrographs of immunolabeling were importedto Adobe Photoshop for contrast adjustment, then digitized and imported to Metamorph forquantification. The parameters for digitizing photomicrographs were kept constant across allanimals (Zeng et al., 2009; Zhou et al., 2007). Images of VGLUT were taken for allsubdivisions of the CN, including DCN1, DCN3, GCD (Shell region and DCN2), AVCNand PVCN. Within a slice series, each region of the CN had three images taken in order tocreate an average puncta density for that subdivision. To focus on changes in non-auditoryinputs, the puncta density of the shell region and DCN2 were combined to yield the GCDdensity. The GCD has been previously defined as the combined shell and fusiform cell layerregions (DCN2)(Zhou et al., 2007), which receive primarily non-auditory inputs. TheVGLUT densities in DCN1, DCN3, GCD, AVCN and PVCN in each group were thencompared between the control and deafened groups (Zeng et al., 2009).
Quantification and analysis of VGLUT and tract tracing projection terminalsQuantification was performed as previously described (Zeng et al., 2009; Zhou et al., 2007).Experimenters were blind as to whether the tissue was from normal or deafened animals.VGLUT density was quantified in each of the following CN regions: DCN1, DCN3, GCD,AVCN and PVCN. Sections for AVCN and PVCN were taken from the middle-frequencyregions (i.e. halfway between the most dorsal aspect and the most ventral aspect of theVCN). This method thereby encompassed regions affected by the hearing loss. For each sideof each animal, three pictures (40X) were taken at equal intervals from caudal to rostral foreach of the above selected regions except DCN1 (i.e., one picture from the 25 th percentile ,
Zeng et al. Page 5
J Neurosci. Author manuscript; available in PMC 2013 May 07.
$waterm
ark-text$w
atermark-text
$waterm
ark-text

one from the 50th percentile, and one from the 75th percentile, etc). For DCN1, a highermagnification (63X) was used. The photomicrographs were then transferred to Metamorphfor automatic quantification. The total number of VGLUT labeled puncta was divided by thechosen area in each photomicrograph to yield the puncta density. No distinction was madebetween puncta on cell bodies and puncta on dendrites or in the neuropil. Means andstandard errors were calculated for the puncta density of VGLUT1 and VGLUT2. Thedeafened side was compared with the contralateral side and age-matched normal controls.
Under epifluorescence, the labeled Cu and Sp5 terminals in both CN were manually countedon every section of one series in each group. The quantification was based on terminals inboth CNs unless otherwise stated. Cu and Sp5 terminal endings were further classified as: 1)mossy fiber-like terminal endings (MF): large irregular swellings (≥2.5 μm), which usuallygive rise to collaterals; or 2) small boutons (SB): small and round or oval (<2.5 μm),including en passant and terminal boutons (Zeng et al., 2011; Zhou and Shore, 2004). Eachending was defined by size, location in the CN and double labeling with VGLUT1/VGLUT2. Double labeling of Cu and Sp5 terminals with VGLUTs were determined byfrequently switching the filters and adjusting the focus of the objective lens. Colocalizationwas established when the two different labels (red and green) exactly marked the sameprofile at the same focusing level. In many cases, double-labeled immunofluorescentterminals were also identified by confocal laser microscopy (Olympus 500). The method ofidentifying double-labeled Cu/Sp5– VGLUT1/VGLUT2 terminals in the CN correspondedwell with the confocal findings. For both Cu and Sp5 terminals, there were 4 categories: 1)SB-non-colabeled with VGLUT1/VGLUT2; 2) SB-colabeled with VGLUT1/VGLUT2; 3)MF-non-colabeled with VGLUT1/VGLUT2; 4) MF-colabeled with VGLUT1/VGLUT2.The terminal counts were obtained from the first series of sections and the number ofterminal counts was multiplied by 4 to achieve the total terminal counts. Finally,Abecrombie’s correction was used to adjust possible double counting errors : correctednumber = count × [section thickness/ (section thickness + terminal size)] (Abercrombie,1946). For the unilaterally deafened animals, the contralateral and the ipsilateral CNs werecompared to each other and to the normal controls. Statistical analyses were performedusing one-way ANOVA, t-test or Chi-square, as appropriate. Significance was determined atp< 0.05.
ResultsUnilateral injections of kanamycin resulted in profound, unilateral hearing loss after threeand six weeks following deafening
All ten animals with unilateral intra-cochlear injections of kanamycin had profound,unilateral hearing losses as demonstrated with ABR measurements (Figure 1A). No ABRresponses were measurable at 90 dB SPL (the limits of our sound system) in the deafenedears. Figure 1A shows the mean ABR thresholds for the deafened animals at four testfrequencies (4, 8, 12 and 16 kHz) for the left (ipsilateral, deafened) ears before and afterdeafening, as well as sixteen normal control ears in the eight normal hearing animals.
Spiral ganglion density is significantly reduced three and six weeks following deafeningFigure 1B shows the mean spiral ganglion densities for the whole cochlea as well as thebasal turn at three and six weeks following deafness. The left side (ipsilateral to deafening)for the whole cochlea (F=219.74; df=2, 15; p<0.001) and the basal turn (F=107.89; df=2, 15;p<0.001) shows significantly decreased spiral ganglion density when compared to thecontrol animals and the right ears at both three and six weeks. Figure 1C shows the normalappearance of spiral ganglion cells in one control animal, and Figure 1D shows thesignificant loss of spiral ganglion cells in one animal after three weeks deafness. Thus, after
Zeng et al. Page 6
J Neurosci. Author manuscript; available in PMC 2013 May 07.
$waterm
ark-text$w
atermark-text
$waterm
ark-text

unilateral deafness (3 and 6 weeks), spiral ganglion densities are reduced significantlycompared with the contralateral (right) side and the control groups. Spiral ganglion densitiesof the contralateral ear were not significantly different between the three and six weekgroups and the control animals, similar to those previously reported (Miller et al., 2007;Zeng et al., 2009).
VGLUT expression is significantly altered in the cochlear nuclei three and six weeks afterunilateral deafening
1) Along with decreased SG density, VGLUT1 density was significantly decreased in theVCN ipsilateral to the cochlear injections three and six weeks after unilateral deafness.
Compared to both the control and contralateral data, significant decreases in VGLUT1labeling were seen in the AVCN and PVCN. Figure 2 shows photomicrographs of decreasedVGLUT1 density in the ipsilateral AVCN and PVCN in one animal (three weeks afterdeafening) in comparison with the contralateral side. The photomicrographs in Figure 2Aand 2B show strong VGLUT1 labeling in the contralateral AVCN and PVCN, whereassparse VGLUT1 labeling was observed on the side ipsilateral to the deafening (Figs. 2C and2D). Compared to both the contralateral CN and normal controls, quantification reveals thatipsilateral VGLUT1 densities were significantly decreased in ipsilateral VCN (AVCN andPVCN) after three (Fig. 3, F=29.51; df=2, 24; p<0.001 for AVCN, F=87.87; df=2, 24;p<0.001 for PVCN) and six weeks of deafness (Fig. 3, F=34.46; df=2, 24; p<0.001 forAVCN, F=53.78; df=2, 24; p<0.001 for PVCN), . No significant change in VGLUT1 wasfound in other regions of CN, including DCN1 (not shown in the figure).
2) VGLUT2 density was increased in the ipsilateral GCD, which is the primary recipient ofnon-auditory inputs. In addition, VGLUT2 is also increased in the ipsilateral magnocellularregions of VCN that predominantly receive auditory inputs at both three and six weeks afterunilateral deafness.
Although VGLUT2 is intensely expressed in the GCDs of both normal controls anddeafened guinea pigs (Zeng et al., 2009; Zhou et al., 2007), it is significantly increased in theipsilateral GCD of unilaterally-deafened animals starting at two weeks following deafening(Zeng et al., 2009), and shown here also at three and six weeks following unilateraldeafening. Figure 4 shows photomicrographs of increased VGLUT2 density in the ipsilateralGCD (Fig. 4A) of one animal (three weeks after deafening) compared with the contralateralside (Fig. 4D). There is sparse VGLUT2 labeling in the contralateral AVCN and PVCN(Figs. 4E and 4F), but stronger VGLUT2 expression in the ipsilateral AVCN and PVCN(Figs. 4B and 4C). Compared with control animals, there is an up regulation of VGLUT2 inthe ipsilateral GCD three (F=4.19; df=2, 24; p<0.05) and six weeks (F=4.00; df=2, 24;p<0.05) following deafening. VGLUT2 densities in ipsilateral AVCN and PVCN aresignificantly increased at three weeks following deafening (Fig. 5; (F=10.32; df=2, 24;p<0.001 for AVCN, F=8.04; df=2, 24; p<0.05 for PVCN). VGLUT2 increases were alsoseen in the ipsilateral PVCN at six weeks after deafness when compared with controlanimals (F=4.18; df=2, 24; p<0.05).
Thus, following unilateral deafening, VGLUT2 was significantly increased in regions of theGCD that receive somatosensory inputs and was also increased in the ipsilateralmagnocellular region of CN. No significant changes were seen in DCN1 and DCN3.
Somatosensory inputs are upregulated and redistributed three weeks following deafeningFour guinea pigs (two controls, two three-week deafened) received BDA injectionsrestricted to Sp5, and four guinea pigs (two controls, two three-week deafened) receivedBDA injections restricted to Cu. The locations of all eight injection sites are summarized in
Zeng et al. Page 7
J Neurosci. Author manuscript; available in PMC 2013 May 07.
$waterm
ark-text$w
atermark-text
$waterm
ark-text

serial brainstem templates in Figure 6. The injection sites and volumes were well-matched inthe deafened and control animals. The first pair of matched Sp5 injections (A, top row)shows a slightly larger injection site in the control animal (volume = 3.56mm3) than thedeafened animal (2.81 mm3). The second pair of matched Sp5 injections (B, second row)has a smaller injection size than the first pair, but also shows a slightly larger injection in thecontrol animal (volume = 2.19mm3) than the deafened animal (volume = 1.26mm3). All 4Sp5 injections are restricted to the Sp5. The two pairs of Cu injections (lower rows, C andD) have very similar injection volumes, with one control animal (C, solid, volume =0.49mm3) paired with one deafened animal (C, hatched, volume = 0.44mm3), and a secondcontrol animal (D, solid, volume = 0.67mm3) paired with another deafened animal (D,hatched, volume = 0.68mm3).
Even though the injection sites and volumes were well-matched in the deafened and controlanimals, to help further interpret the changes in Sp5 and Cu projections to the CN withhearing loss, the means and standard errors of the means were computed for the number ofprojection terminals in both deafened and control animals. The results depicted in Figure 7show little variation in the amount of CN labeling between control and deafened animals.The projection counts are further divided into those colocalized with VGLUT2 and those notcolocalized in Figure 8. The results in Figures 7 and 8 reveal that three weeks followingunilateral deafening, there was a significant increase in the numbers of both Sp5 and Cuprojection terminals in almost every region in the CN compared with control animals. Theterminal distributions of Sp5 and Cu projections in control and deafened guinea pigs wereall bilateral with ipsilateral dominance, with most of these terminals located predominantlyin the GCD, which receives somatosensory inputs. However, the distribution patterns weredifferentially altered depending on the projection source. In control animals, the totalnumber of Cu projection terminals was considerably less than the number of Sp5 projections(p<0.05, two-tailed t-test). Cu projections were located primarily in the GCD with a minorpresence in DCN3 while Sp5 projections were located primarily in the GCD with a broaderdistribution in DCN3, AVCN and PVCN. In deafened animals, the total numbers of both Cuand Sp5 projections increased, but the total number of Cu projections remained lower thanSp5 projections (p<0.05, two-tailed t-test). Furthermore, the distributions of projectionterminals from Cu and Sp5 were changed differently after three weeks unilateral deafness.In spite of a predominant distribution in the GCD, Cu projections were increased in DCN3and VCN while Sp5 projections were increased in VCN. These data indicate that threeweeks following deafening, the CN received increased numbers of projections from both Cuand Sp5. Furthermore, these increases were observed not only in the GCD, which receivessomatosensory inputs, but also in the non-GCD regions, DCN3 and VCN (Fig. 7A, B; Fig.8A, B).
Additionally, the morphological patterns of projection terminals were altered differentiallydepending on the source (Fig. 8C-F). As shown previously (Zeng et al., 2011), Cu and Sp5terminal endings are either MFs or SBs. In control animals, the MF-to-SB ratio for Cuterminals was 1:2.3, while the MF-to-SB ratio for Sp5 terminals was 1:9 (Chi square,p<0.001). In deafened guinea pigs, the MF-to-SB ratio of Cu terminals decreased to 1:4compared with control animals (Chi square, p<0.01), while the ratio for Sp5 terminalsincreased to 1:5 compared with control animals (Chi square, p<0.001). Thus, there was agreater increase in Cu SBs but a greater increase in Sp5 MFs compared with control animals(Fig 8 C-F).
The colocalization of Sp5 and Cu projections with VGLUT2 changes three weeks followingdeafening
Sp5 and Cu terminal endings in CN colabel with VGLUT2 but rarely with VGLUT1 (Zenget al., 2011; Zhou et al., 2007). In the present study, we examined the association of Sp5 and
Zeng et al. Page 8
J Neurosci. Author manuscript; available in PMC 2013 May 07.
$waterm
ark-text$w
atermark-text
$waterm
ark-text

Cu projection terminals with VGLUT2 in deafened guinea pigs compared with controlanimals (Fig. 8). Three weeks following deafening VGLUT2-colabeled Cu and Sp5terminals were significantly increased in the CN compared with control animals (p<0.01,two-tailed t-test for Cu; p<0.001, two-tailed t-test for Sp5; Fig 8 A, B). In control animals,most of the VGLUT2-labeled Cu and Sp5 terminals were located in the GCD. In thedeafened animals, whileVGLUT2-labeled Cu and Sp5 terminal numbers still predominatedand increased in the GCD, they also increased in DCN3 and VCN. Indeed, there weregreater increases in VGLUT2-labeled Cu terminals in DCN3 (Chi square, p<0.001) andincreased numbers of VGLUT2-labeled Sp5 terminals in VCN (Chi square, p<0.001), thanin GCD alone. These changes are consistent with recently reported increased VGLUT2-mediated vestibular inputs to the DCN (Barker et al., 2012) after acoustic overexposure.
The distribution patterns of VGLUT2-labeled of MFs and SBs from Cu and Sp5 were alsochanged following three weeks deafening. Most MFs colabeled with VGLUT2, and werelocated predominantly in the GCD in both control and deafened guinea pigs for both Cu andSp5 terminals (Figs. 8C-F, 9 and 10). While Cu and Sp5 SBs were also GCD dominant,fewer SBs colabeled with VGLUT2 than MFs. In the deafened animals, VGLUT2-labeledCu and Sp5 MFs retained GCD predominance. VGLUT2-labeled Cu SBs increased inDCN3 (Chi square, p<0.001) (Figs. 8, 9), and VGLUT2-labeled Sp5 SBs increased in theVCN (Chi square, p<0.001) (Figs. 8, 10). VGLUT2-labeled SBs from Sp5 were the maincontributors to the increase in VGLUT2 in the ipsilateral VCN following deafness. Inaddition to an increased number of VGLUT2-labeled SBs, deafened animals exhibited moreVGLUT2-labeled MFs than control animals (p<0.001; Figs. 8, 10). While there were fewerSp5-labeled MFs in the VCN than in the GCD, their appearance in the VCN suggest that adifferent form of neural processing may occur three weeks after unilateral deafness.
The colocalization of Sp5 and Cu projections with VGLUT1 is altered three weeks followingdeafening
Compared with VGLUT2, there were considerably fewer Cu and Sp5 terminals colabeledwith VGLUT1 in both control and deafened guinea pigs (Fig. 11). VGLUT1-labeled Cu andSp5 endings were GCD predominant in both control and deafened animals. AlthoughVGLUT1-labeled Cu and Sp5 terminals constitute a minor subset of the somatosensoryinputs to the CN, VGLUT1-labeled MFs from both Cu and Sp5 were increased in the GCDafter deafness, indicating that somatosensory compensation three weeks after unilateraldeafness not only involves VGLUT2, but also VGLUT1.
DiscussionVGLUT1 decreases likely reflect ANF degeneration in the CN after unilateral deafness
Since type I ANF terminals in the CN exclusively colabel with VGLUT1 (Zhou et al.,2007), the decrease in VGLUT1, together with decreases in spiral ganglion counts, likelyindicate decreased ANFs inputs to CN neurons after unilateral deafening. Decreases in thesynaptic vesicle marker, SV2 (D’Sa et al., 2007) and synaptophysin, also indicative ofsynaptic degeneration of ANFs in the CN following cochlear damage (D’Sa et al., 2007; Duet al., 2012; Muly et al., 2002), support this contention. The early decrease in VGLUT1 inthe DCN1 post deafening (Zeng et al., 2009) is not maintained three and six weeks postdeafening, suggesting a temporary shift of parallel fiber intrinsic connections (Zhou et al.,2007). The lack of change in VGLUT1 in the GCD and DCN3 for up to six weeks afterdeafening is consistent with previous studies (Benson et al., 1997), although down-regulatedsynaptophysin was shown in a limited region of the DCN (Du et al., 2012). This may reflectinput from a smaller number of ANF synaptic endings in the DCN (Cohen et al., 1972),which receives inputs from multiple sources, including descending, intrinsic, somatosensory
Zeng et al. Page 9
J Neurosci. Author manuscript; available in PMC 2013 May 07.
$waterm
ark-text$w
atermark-text
$waterm
ark-text

pathways, as well as VCN T-stellate cells (Barker et al., 2012; Benson et al., 1997;Haenggeli et al., 2005; Ito et al., 2011; Kane and Conlee, 1979; Ryugo et al., 2003;Weinberg and Rustioni, 1987; Zeng et al., 2011; Zhou et al., 2010). Thus, cochlear damagecan lead to synaptic plasticity in the DCN (Du et al., 2012; Hildebrandt et al., 2011; Illing etal., 2005; Kraus et al., 2011; McBain, 2008; Zeng et al., 2009), but may not result insignificant down-regulation of VGLUT1 in the DCN.
Somatosensory nuclei are sources of the increased VGLUT2 in the CN after unilateraldeafness
The major objective of this study was to determine the source/s of the increased VGLUT2 inthe CN following unilateral deafness. Several possibilities exist, including intrinsicpathways or synaptogenesis, or extrinsic inputs. Here, we focused on the two major sourcesof the VGLUT2-mediated inputs to the CN, the somatosensory brainstem nuclei, Sp5 andCu (Zeng et al., 2011; Zhou et al., 2007). After volume and location-matched tracerinjections in Cu or Sp5 in three week-deafened animals, there were significantly moreterminal endings in the deafened animals. This increase occurred in spite of slightly largerinjections in the normal animals. There was also little variation in the amount of CN labelingbetween control and deafened animals. The increased VGLUT2 levels, along with increasednumbers of VGLUT2-labeled Sp5 and Cu terminals, likely indicate an increase in thenumber of axonal inputs from these somatosensory nuclei in response to auditorydeafferentation. This VGLUT2-mediated compensation begins at two weeks (Zeng et al.,2009) and is maintained up to six weeks (the longest time tested) following unilateraldeafness. Other sources such as the vestibular (Barker et al., 2012), lateral reticular (Cui andShore, 2008; Zhan and Ryugo, 2007) and contralateral cochlear nuclei (Doucet et al., 2009;Zhou et al., 2010) constitute other sources that may contribute to the increase of VGLUT2.
In addition to their upregulation in the GCD, more terminal endings from Sp5 and Cu werefound in the ipsilateral magnocellular VCN three and six weeks after unilateral deafness.This redistribution of VGLUT2-labeled non-auditory inputs to regions previously dominatedby VGLUT1-labeled ANF inputs has significant implications for signal-processing in theCNs of deafened animals. While physiological studies have suggested that increases inglutamatergic inputs to the DCN may explain deafness-induced hyperactivity and tinnitus(Dehmel et al., 2012), redistribution of these glutamatergic inputs to the VCN opens the wayfor contributions of the VCN to hyperactivity and tinnitus (Vogler et al., 2011).
Sp5 and Cu MFs play an important role in the compensation of somatosensory input afterhearing loss
The granule cell-rich GCD is the main destination of somatosensory terminal endings(Weedman et al., 1996; Zeng et al., 2011; Zhou and Shore, 2004). MFs, which containnumerous round synaptic vesicles (Mugnaini et al., 1980), play an important role inactivating DCN cells via granule cell axons (Ryugo et al., 2003; Weedman et al., 1996;Wright and Ryugo, 1996; Zeng et al., 2009; Zeng et al., 2011). In normal hearing animals,MF terminals from Sp5 and Cu predominantly colabel with VGLUT2 (Zeng et al., 2011).Here, VGLUT2- labeled Sp5 and Cu MFs in the GCD were significantly increased,indicating that VGLUT2- MF-mediated somatosensory input is amplified following threeweek unilateral deafness. The high density of Na+-channels and fast-gated presynaptic Ca+
channels in MFs can produce a large but brief presynaptic Ca+ influx, triggering transmitterrelease with high temporal precision (McBain, 2008). Thus, somatosensory MFs mayprovide a faster-acting pathway after hearing damage. This would be especially evident inthe Sp5 to CN pathway since MFs from Sp5 showed a greater increase in the GCDcompared with MFs from Cu. These findings provide an anatomical basis for the decreasedlatencies of Sp5 activation of DCN principal cells after deafness (Shore et al., 2008). One
Zeng et al. Page 10
J Neurosci. Author manuscript; available in PMC 2013 May 07.
$waterm
ark-text$w
atermark-text
$waterm
ark-text

undesirable consequence of the post-trauma neuroplasticity could be increased spontaneousrates in the CN neurons that have been observed after hearing loss (Brozoski et al., 2002;Dehmel et al., 2012; Shore et al., 2008; Sumner et al., 2005). This elevated neural activity inthe DCN has been proposed as a physiological correlate of tinnitus (Bauer et al., 2007;Brozoski and Bauer, 2005; Kaltenbach, 2007; Kaltenbach, 2011). Tinnitus indeed, mayreflect a predominant increase in somatosensory synaptic strength to the CN (Dehmel et al.,2012). The present data provides a rationale for tinnitus treatment involving blocking theVGLUT2-mediated somatosensory input.
Sp5 and Cu SBs are differentially increased across topographic maps of the CN after threeweek unilateral deafness
Somatosensory SBs, located in DCN and the VCN shell region (Zeng et al., 2011; Zhou andShore, 2004), likely mediate slow-acting pathways. Here, auditory deafferentation resultedin more SB terminals from both SP5 and Cu to the CN, but with a different distribution.Like MFs, most SBs from Sp5 and Cu were located in the GCD in normal animals. But afterthree weeks of unilateral deafness there were more VGLUT2-labeled Sp5 SBs in the VCNand more VGLUT2-labeled Cu SBs in DCN3. This was not seen one and two weeks afterdeafening (Zeng et al., 2009), suggesting that SBs and MFs are involved longer term effects,but terminate in different regions of the CN. The increased somatosensory SBs in VCNlikely activate the principal neurons in the VCN, increasing their role in auditory-somatosensory integration after deafness. The existence of a bushy-cell network in the VCN,for example, may facilitate these interactions since the dendritic inputs on bushy cells are ofcochlear as well as non-cochlear origin (Gomez-Nieto and Rubio, 2009).
Synaptic plasticity after cochlear damage is reflected in increased growth associated protein43 (GAP43) in ipsilateral VCN. Deafness-induced GAP-43-mediated synaptic plasticity inthe VCN is predominantly based on cholinergic afferents (Meidinger et al., 2006), and hasbeen proposed to possibly reduce central hyperactivity and tinnitus (Kraus et al., 2011). Theincreased VGLUT2-labeled Sp5 terminals in the VCN shown in this study indicate thatsynaptic plasticity in the VCN is also mediated by glutamatergic inputs, which may increasethe excitatory drive to the CN and produce tinnitus. It is possible that the cholinergic andglutamatergic amplifications after deafness counteract each other or work synergistically,concepts that require further investigation.
AcknowledgmentsWe thank Cameron Rule for his critical reading and editing of this manuscript, and Dr. Richard Altschuler and hislab for the assessment of spiral ganglion neurons. This work was supported by grant R01 DC DC004825 and a corecenter grant P30 DC-05188 from the National Institute on Deafness and Other Communication Disorders, NationalInstitutes of Health.
ReferenceAbercrombie M. Estimation of Nuclear Population from Microtome Sections. Anatomical Record.
1946; 94:239–247. [PubMed: 21015608]
Barker M, Solinski HJ, Hashimoto H, Tagoe T, Pilati N, Hamann M. Acoustic Overexposure Increasesthe Expression of VGLUT-2 Mediated Projections from the Lateral Vestibular Nucleus to theDorsal Cochlear Nucleus. PLoS One. 2012; 7:e35955. [PubMed: 22570693]
Bauer CA, Brozoski TJ, Myers K. Primary afferent dendrite degeneration as a cause of tinnitus. JNeurosci Res. 2007; 85:1489–98. [PubMed: 17393482]
Benson CG, Gross JS, Suneja SK, Potashner SJ. Synaptophysin immunoreactivity in the cochlearnucleus after unilateral cochlear or ossicular removal. Synapse. 1997; 25:243–57. [PubMed:9068122]
Zeng et al. Page 11
J Neurosci. Author manuscript; available in PMC 2013 May 07.
$waterm
ark-text$w
atermark-text
$waterm
ark-text

Brozoski TJ, Bauer CA, Caspary DM. Elevated fusiform cell activity in the dorsal cochlear nucleus ofchinchillas with psychophysical evidence of tinnitus. J Neurosci. 2002; 22:2383–90. [PubMed:11896177]
Brozoski TJ, Bauer CA. The effect of dorsal cochlear nucleus ablation on tinnitus in rats. Hear Res.2005; 206:227–36. [PubMed: 16081010]
Bukowska D. Morphological evidence for secondary vestibular afferent connections to the dorsalcochlear nucleus in the rabbit. Cells Tissues Organs. 2002; 170:61–8. [PubMed: 11602803]
Burian M, Gstoettner W. Projection of primary vestibular afferent fibres to the cochlear nucleus in theguinea pig. Neurosci Lett. 1988; 84:13–7. [PubMed: 2831482]
Cohen ES, Brawer JR, Morest DK. Projections of the cochlea to the dorsal cochlear nucleus in the cat.Exp Neurol. 1972; 35:470–9. [PubMed: 4338427]
Cui YL, Shore S. Topography of Projections from the Lateral Reticular Formation and the SpinalTrigeminal Nucleus in the Guinea Pig Cochlear Nucleus. Assoc Res Otolaryngol Abstr. 2008;31:105–106.
D’Sa C, Gross J, Francone VP, Morest DK. Plasticity of synaptic endings in the cochlear nucleusfollowing noise-induced hearing loss is facilitated in the adult FGF2 overexpressor mouse. Eur JNeurosci. 2007; 26:666–680. [PubMed: 17651425]
Dehmel S, Pradhan S, Koehler S, Bledsoe S, Shore S. Noise overexposure alters long-termsomatosensory-auditory processing in the dorsal cochlear nucleus--possible basis for tinnitus-related hyperactivity? J Neurosci. 2012; 32:1660–71. [PubMed: 22302808]
Doucet JR, Lenihan NM, May BJ. Commissural neurons in the rat ventral cochlear nucleus. J AssocRes Otolaryngol. 2009; 10:269–80. [PubMed: 19172356]
Du X, Chen K, Choi CH, Li W, Cheng W, Stewart C, Hu N, Floyd RA, Kopke RD. Selectivedegeneration of synapses in the dorsal cochlear nucleus of chinchilla following acoustic traumaand effects of antioxidant treatment. Hear Res. 2012; 283:1–13. [PubMed: 22178982]
Glueckert R, Bitsche M, Miller JM, Zhu Y, Prieskorn DM, Altschuler RA, Schrott-Fischer A.Deafferentation-associated changes in afferent and efferent processes in the guinea pig cochlea andafferent regeneration with chronic intrascalar brain-derived neurotrophic factor and acidicfibroblast growth factor. J Comp Neurol. 2008; 507:1602–21. [PubMed: 18220258]
Gomez-Nieto R, Rubio ME. A bushy cell network in the rat ventral cochlear nucleus. J Comp Neurol.2009; 516:241–63. [PubMed: 19634178]
Hackett TA, de la Mothe LA. Regional and laminar distribution of the vesicular glutamate transporter,VGluT2, in the macaque monkey auditory cortex. J Chem Neuroanat. 2009; 38:106–16. [PubMed:19446630]
Hackett TA, Takahata T, Balaram P. VGLUT1 and VGLUT2 mRNA expression in the primateauditory pathway. Hearing Research. 2011; 274:129–141. [PubMed: 21111036]
Hackney CM, Osen KK, Kolston J. Anatomy of the cochlear nuclear complex of guinea pig. AnatEmbryol (Berl). 1990; 182:123–49. [PubMed: 2244686]
Haenggeli CA, Pongstaporn T, Doucet JR, Ryugo DK. Projections from the spinal trigeminal nucleusto the cochlear nucleus in the rat. J Comp Neurol. 2005; 484:191–205. [PubMed: 15736230]
Hildebrandt H, Hoffmann NA, Illing RB. Synaptic reorganization in the adult rat’s ventral cochlearnucleus following its total sensory deafferentation. PLoS One. 2011; 6:e23686. [PubMed:21887295]
Hioki H, Fujiyama F, Taki K, Tomioka R, Furuta T, Tamamaki N, Kaneko T. Differential distributionof vesicular glutamate transporters in the rat cerebellar cortex. Neuroscience. 2003; 117:1–6.[PubMed: 12605886]
Illing RB, Kraus KS, Meidinger MA. Reconnecting neuronal networks in the auditory brainstemfollowing unilateral deafening. Hear Res. 2005; 206:185–99. [PubMed: 16081008]
Ito T, Bishop DC, Oliver DL. Expression of glutamate and inhibitory amino acid vesicular transportersin the rodent auditory brainstem. J Comp Neurol. 2011; 519:316–40. [PubMed: 21165977]
Kaltenbach JA. The dorsal cochlear nucleus as a contributor to tinnitus: mechanisms underlying theinduction of hyperactivity. Prog Brain Res. 2007; 166:89–106. [PubMed: 17956775]
Kaltenbach JA. Tinnitus: Models and mechanisms. Hearing Research. 2011; 276:52–60. [PubMed:21146597]
Zeng et al. Page 12
J Neurosci. Author manuscript; available in PMC 2013 May 07.
$waterm
ark-text$w
atermark-text
$waterm
ark-text

Kane ES, Conlee JW. Descending inputs to the caudal cochlear nucleus of the cat: degeneration andautoradiographic studies. J Comp Neurol. 1979; 187:759–83. [PubMed: 489799]
Kaneko T, Fujiyama F, Hioki H. Immunohistochemical localization of candidates for vesicularglutamate transporters in the rat brain. J Comp Neurol. 2002; 444:39–62. [PubMed: 11835181]
Kraus KS, Ding D, Jiang H, Lobarinas E, Sun W, Salvi RJ. Relationship between noise-inducedhearing-loss, persistent tinnitus and growth-associated protein-43 expression in the rat cochlearnucleus: does synaptic plasticity in ventral cochlear nucleus suppress tinnitus? Neuroscience.2011; 194:309–25. [PubMed: 21821100]
McBain CJ. Differential mechanisms of transmission and plasticity at mossy fiber synapses. ProgBrain Res. 2008; 169:225–40. [PubMed: 18394477]
Meidinger MA, Hildebrandt-Schoenfeld H, Illing RB. Cochlear damage induces GAP-43 expression incholinergic synapses of the cochlear nucleus in the adult rat: a light and electron microscopicstudy. Eur J Neurosci. 2006; 23:3187–99. [PubMed: 16820009]
Miller JM, Chi DH, O’Keeffe LJ, Kruszka P, Raphael Y, Altschuler RA. Neurotrophins can enhancespiral ganglion cell survival after inner hair cell loss. Int J Dev Neurosci. 1997; 15:631–43.[PubMed: 9263039]
Miller JM, Le Prell CG, Prieskorn DM, Wys NL, Altschuler RA. Delayed neurotrophin treatmentfollowing deafness rescues spiral ganglion cells from death and promotes regrowth of auditorynerve peripheral processes: effects of brain-derived neurotrophic factor and fibroblast growthfactor. J Neurosci Res. 2007; 85:1959–69. [PubMed: 17492794]
Moore DR, Kowalchuk NE. Auditory brainstem of the ferret: effects of unilateral cochlear lesions oncochlear nucleus volume and projections to the inferior colliculus. J Comp Neurol. 1988; 272:503–15. [PubMed: 2843582]
Mugnaini E, Osen KK, Dahl AL, Friedrich VL Jr. Korte G. Fine structure of granule cells and relatedinterneurons (termed Golgi cells) in the cochlear nuclear complex of cat, rat and mouse. JNeurocytol. 1980; 9:537–70. [PubMed: 7441303]
Muly SM, Gross JS, Morest DK, Potashner SJ. Synaptophysin in the cochlear nucleus followingacoustic trauma. Exp Neurol. 2002; 177:202–21. [PubMed: 12429223]
Ryugo DK, Haenggeli CA, Doucet JR. Multimodal inputs to the granule cell domain of the cochlearnucleus. Exp Brain Res. 2003; 153:477–85. [PubMed: 13680048]
Shore SE. Multisensory integration in the dorsal cochlear nucleus: unit responses to acoustic andtrigeminal ganglion stimulation. Eur J Neurosci. 2005; 21:3334–3348. [PubMed: 16026471]
Shore SE, Koehler S, Oldakowski M, Hughes LF, Syed S. Dorsal cochlear nucleus responses tosomatosensory stimulation are enhanced after noise-induced hearing loss. Eur J Neurosci. 2008;27:155–68. [PubMed: 18184319]
Sumner CJ, Tucci DL, Shore SE. Responses of ventral cochlear nucleus neurons to contralateral soundafter conductive hearing loss. J Neurophysiol. 2005; 94:4234–43. [PubMed: 16093339]
Takamori S, Rhee JS, Rosenmund C, Jahn R. Identification of differentiation-associated brain-specificphosphate transporter as a second vesicular glutamate transporter (VGLUT2). J Neurosci. 2001;21:RC182. [PubMed: 11698620]
Vogler DP, Robertson D, Mulders WH. Hyperactivity in the ventral cochlear nucleus after cochleartrauma. J Neurosci. 2011; 31:6639–45. [PubMed: 21543592]
Weedman DL, Pongstaporn T, Ryugo DK. Ultrastructural study of the granule cell domain of thecochlear nucleus in rats: mossy fiber endings and their targets. J Comp Neurol. 1996; 369:345–60.[PubMed: 8743417]
Weinberg RJ, Rustioni A. A cuneocochlear pathway in the rat. Neuroscience. 1987; 20:209–19.[PubMed: 3561761]
Wright DD, Ryugo DK. Mossy fiber projections from the cuneate nucleus to the cochlear nucleus inthe rat. J Comp Neurol. 1996; 365:159–72. [PubMed: 8821448]
Zappia JJ, Altschuler RA. Evaluation of the effect of ototopical neomycin on spiral ganglion celldensity in the guinea pig. Hear Res. 1989; 40:29–37. [PubMed: 2768082]
Zeng C, Nannapaneni N, Zhou J, Hughes LF, Shore S. Cochlear damage changes the distribution ofvesicular glutamate transporters associated with auditory and nonauditory inputs to the cochlearnucleus. J Neurosci. 2009; 29:4210–7. [PubMed: 19339615]
Zeng et al. Page 13
J Neurosci. Author manuscript; available in PMC 2013 May 07.
$waterm
ark-text$w
atermark-text
$waterm
ark-text

Zeng C, Shroff H, Shore SE. Cuneate and spinal trigeminal nucleus projections to the cochlear nucleusare differentially associated with vesicular glutamate transporter-2. Neuroscience. 2011; 176:142–51. [PubMed: 21167260]
Zhan X, Ryugo DK. Projections of the lateral reticular nucleus to the cochlear nucleus in rats. J CompNeurol. 2007; 504:583–98. [PubMed: 17701985]
Zhou J, Shore S. Projections from the trigeminal nuclear complex to the cochlear nuclei: a retrogradeand anterograde tracing study in the guinea pig. J Neurosci Res. 2004; 78:901–7. [PubMed:15495211]
Zhou J, Nannapaneni N, Shore S. Vessicular glutamate transporters 1 and 2 are differentiallyassociated with auditory nerve and spinal trigeminal inputs to the cochlear nucleus. J CompNeurol. 2007; 500:777–87. [PubMed: 17154258]
Zhou J, Zeng C, Cui Y, Shore S. Vesicular glutamate transporter 2 is associated with the cochlearnucleus commissural pathway. J Assoc Res Otolaryngol. 2010; 11:675–87. [PubMed: 20574763]
Zeng et al. Page 14
J Neurosci. Author manuscript; available in PMC 2013 May 07.
$waterm
ark-text$w
atermark-text
$waterm
ark-text
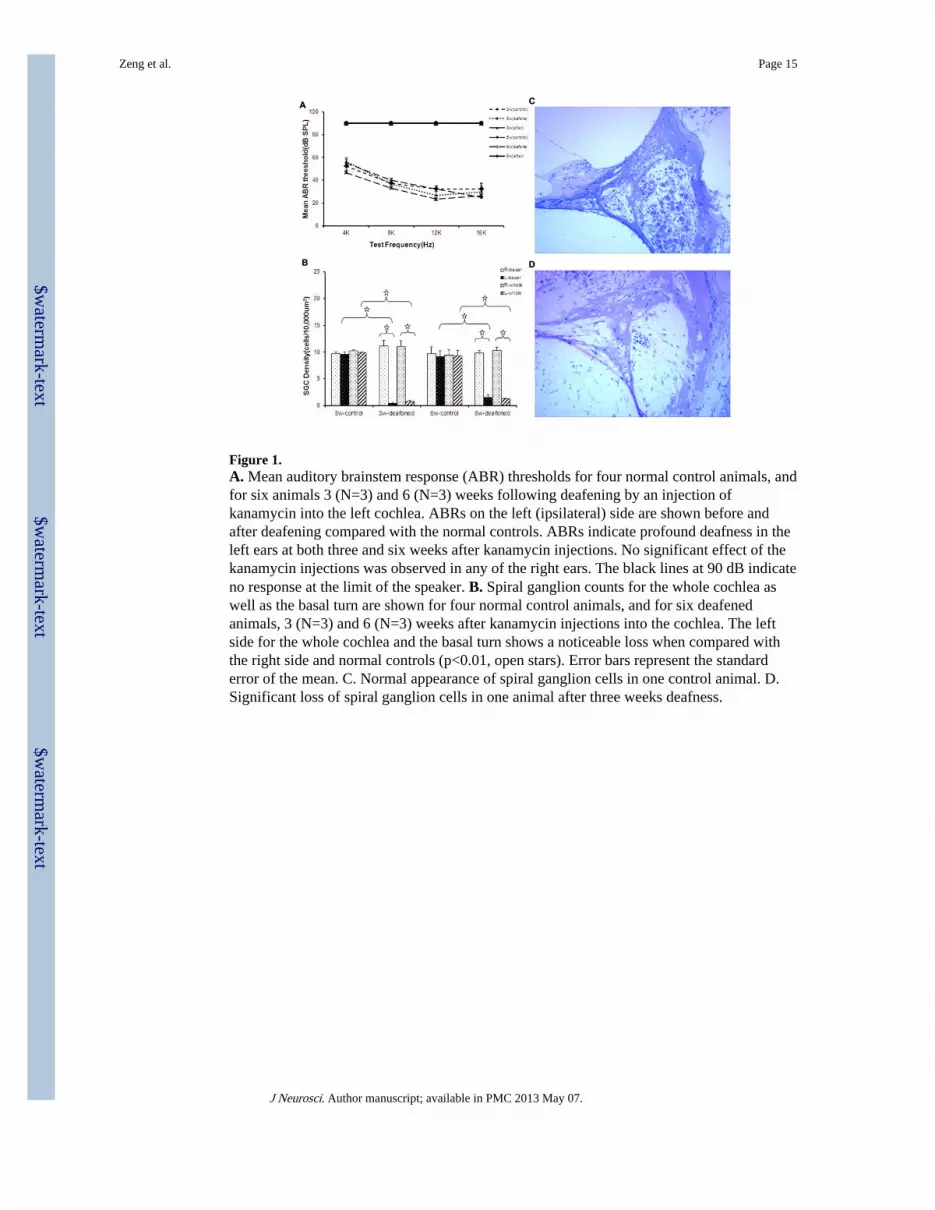
Figure 1.A. Mean auditory brainstem response (ABR) thresholds for four normal control animals, andfor six animals 3 (N=3) and 6 (N=3) weeks following deafening by an injection ofkanamycin into the left cochlea. ABRs on the left (ipsilateral) side are shown before andafter deafening compared with the normal controls. ABRs indicate profound deafness in theleft ears at both three and six weeks after kanamycin injections. No significant effect of thekanamycin injections was observed in any of the right ears. The black lines at 90 dB indicateno response at the limit of the speaker. B. Spiral ganglion counts for the whole cochlea aswell as the basal turn are shown for four normal control animals, and for six deafenedanimals, 3 (N=3) and 6 (N=3) weeks after kanamycin injections into the cochlea. The leftside for the whole cochlea and the basal turn shows a noticeable loss when compared withthe right side and normal controls (p<0.01, open stars). Error bars represent the standarderror of the mean. C. Normal appearance of spiral ganglion cells in one control animal. D.Significant loss of spiral ganglion cells in one animal after three weeks deafness.
Zeng et al. Page 15
J Neurosci. Author manuscript; available in PMC 2013 May 07.
$waterm
ark-text$w
atermark-text
$waterm
ark-text

Figure 2.VGLUT1 immunostaining is decreased in the magnocellular regions of AVCN and PVCNafter deafness. Photomicrographs of VGLUT1 are taken from the AVCN and PVCN of oneanimal (three weeks post deafening). VGLUT1 is intensely expressed in AVCN (A) andPVCN (B) in the contralateral side as shown previously (Zeng et al., 2009; Zhou et al.,2007), but weakly expressed following deafening (C and D).
Zeng et al. Page 16
J Neurosci. Author manuscript; available in PMC 2013 May 07.
$waterm
ark-text$w
atermark-text
$waterm
ark-text

Figure 3.Mean VGLUT1 puncta densities in each CN subdivision in the ipsilateral side andcontralateral side (N=3 for each deafened animal group), as well as normal control CNs(N=4 for each control group). VGLUT1 puncta densities (expressed as thousands/squaremm) are significantly decreased in the ipsilateral AVCN and PVCN, compared to both thecontralateral and normal control CNs (p<0.0001, filled stars). Error bars represent standarderror of the mean.
Zeng et al. Page 17
J Neurosci. Author manuscript; available in PMC 2013 May 07.
$waterm
ark-text$w
atermark-text
$waterm
ark-text

Figure 4.VGLUT2 immunostaining is increased in ipsilateral granular cell domain (GCD) andmagnocellular regions (AVCN and PVCN) after unilateral deafness. (A, D)Photomicrographs of VGLUT2 from the GCD of one animal three weeks post deafening.VGLUT2 is increased in the ipsilateral GCD (A) compared with the contralateral side (D).(B-C, E-F) Photomicrographs of VGLUT2 from the AVCN and PVCN of one animal threeweeks post deafening. VGLUT2 is increased in the ipsilateral AVCN (B) and PVCN (C)compared with the contralateral AVCN (E) and PVCN (F).
Zeng et al. Page 18
J Neurosci. Author manuscript; available in PMC 2013 May 07.
$waterm
ark-text$w
atermark-text
$waterm
ark-text

Figure 5.Mean VGLUT2 puncta densities in each CN subdivision in the ipsilateral side andcontralateral side (N=3 for each deafened animal group), as well as normal control CNs(N=4 for each control group). VGLUT2 puncta densities (expressed as thousands/squaremm) are significantly increased in the ipsilateral granular cell domain (GCD) that receivesnon-auditory synaptic terminals (Zhou et al., 2007). VGLUT2 puncta densities are alsosignificantly increased in ipsilateral magnocellular regions (AVCN and PVCN), which alsoreceive some non-auditory inputs from Sp5 and cuneate nucleus (Zeng et al., 2011),compared to both the contralateral and normal control CNs (p<0.05, filled stars). Error barsrepresent standard error of the mean.
Zeng et al. Page 19
J Neurosci. Author manuscript; available in PMC 2013 May 07.
$waterm
ark-text$w
atermark-text
$waterm
ark-text

Figure 6.Locations of the injection sites in matched control and deafened animals are shown ondrawings of caudal to rostral transverse brain stem sections. The cross-hatched areasrepresent the injection sites in control guinea pigs, the solid shaded areas represent theinjection sites in deafened guinea pigs. (A) Three serial sections of matched pairs of Sp5injections in one control animal (solid; volume =3.56mm3) and one deafened animal(hatched, volume = 2.81 mm3). (B) A second pair of matched Sp5 injections in one controlanimal (solid; volume = 2.19mm3) and one deafened animal (hatched; volume = 1.26 mm3).(C) Matched Cu injections in one control animal (solid; volume = 0.49mm3) and onedeafened animal (hatched; volume = 0.44 mm3). (D) A second matched pair of Cu injectionsin one control animal (solid; volume = 0.67 mm3) and one deafened animal (hatched;volume = 0.68 mm3). The injection sizes in two control animals with Sp5 injections areslightly larger than the matched deafened counterparts, while two pairs with Cu injectionshave very similar injection sizes. All injections occurred on the left side of the brain but areshown here for convenience of separation on both sides. Sp5, spinal trigeminal nucleus; sp5,spinal trigeminal tract; Sp5I, pars interpolaris of Sp5; Sp5C, pars caudalis of Sp5; icp,inferior cerebellar peduncle; Cu, cuneate nucleus; Gr, gracile nucleus; PVCN, posteroventralcochlear nucleus.
Zeng et al. Page 20
J Neurosci. Author manuscript; available in PMC 2013 May 07.
$waterm
ark-text$w
atermark-text
$waterm
ark-text

Figure 7.Means and standard errors of the means for Cu and Sp5 terminal endings in differentsubdivisions of the CN in control (Cu, N=2; Sp5, N=2) and deafened (Cu, N=2; Sp5, N=2)guinea pigs. There was little variation in the amount of CN labeling between control anddeafened animals. (A) Sp5 terminals were mostly located in the GCD, with increases seen inthe GCD and VCN in the deafened animals. (B) Cu terminal endings were mostly located inthe GCD, with increases seen in the GCD and DCN3 in deafened animals.
Zeng et al. Page 21
J Neurosci. Author manuscript; available in PMC 2013 May 07.
$waterm
ark-text$w
atermark-text
$waterm
ark-text

Figure 8.Counts of labeled Cu and Sp5 terminal endings colocalized and not colocalized withVGLUT2 in different subdivisions of the CN in control (Cu, N=2; Sp5, N=2) and deafened(Cu, N=2; Sp5, N=2) guinea pigs. (A) VGLUT2-labeled Sp5 terminals were mostly locatedin the GCD, with increases seen in the GCD and VCN in the deafened animals. (B)VGLUT2-labeled Cu terminal endings were mostly located in the GCD, with increases seenin the GCD and DCN3 in deafened animals. (C, E) VGLUT2-labeled Sp5 MFs and SBssignificantly increased in the GCD and VCN in the deafened animals. (D, F) Numbers ofVGLUT2-labeled Cu MFs and SBs significantly increased in the GCD and DCN3 indeafened guinea pigs, some VGLUT2-labeled MFs were seen in the VCN.
Zeng et al. Page 22
J Neurosci. Author manuscript; available in PMC 2013 May 07.
$waterm
ark-text$w
atermark-text
$waterm
ark-text

Figure 9.High magnification confocal images (x100) showing colocalization of anterogradely-labeledCu terminal endings with VGLUT2 in DCN3 (A, B, C) and GCD (D,E,F) in a three weeksdeafened guinea pig, the terminal locations are designated by the asterisks in the insets. (A)and (D) show BDA-labeled Cu terminals (green), (B) and (E) show VGLUT2 labeling (red).Colocalization of VGLUT2 with Cu SBs in DCN3 is shown by arrows in (C), andcolocalization of VGLUT2 with Cu MFs in GCD is shown by arrow in (F). The 5 μm scalebar applies to (A, B, C), the 20 μm scale bar applies to (D, E, F).
Zeng et al. Page 23
J Neurosci. Author manuscript; available in PMC 2013 May 07.
$waterm
ark-text$w
atermark-text
$waterm
ark-text
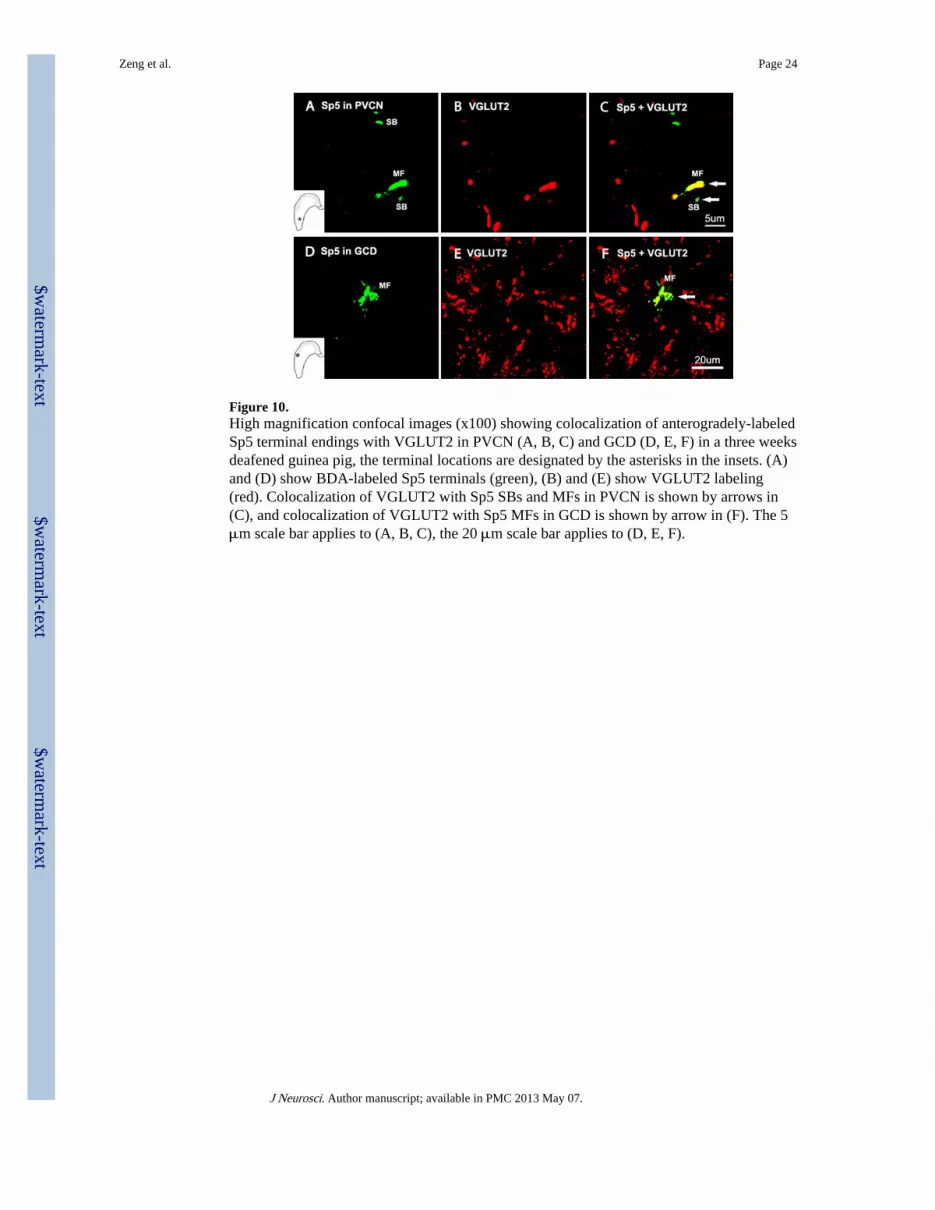
Figure 10.High magnification confocal images (x100) showing colocalization of anterogradely-labeledSp5 terminal endings with VGLUT2 in PVCN (A, B, C) and GCD (D, E, F) in a three weeksdeafened guinea pig, the terminal locations are designated by the asterisks in the insets. (A)and (D) show BDA-labeled Sp5 terminals (green), (B) and (E) show VGLUT2 labeling(red). Colocalization of VGLUT2 with Sp5 SBs and MFs in PVCN is shown by arrows in(C), and colocalization of VGLUT2 with Sp5 MFs in GCD is shown by arrow in (F). The 5μm scale bar applies to (A, B, C), the 20 μm scale bar applies to (D, E, F).
Zeng et al. Page 24
J Neurosci. Author manuscript; available in PMC 2013 May 07.
$waterm
ark-text$w
atermark-text
$waterm
ark-text

Figure 11.Counts of labeled Cu and Sp5 terminal endings colocalized with VGLUT1 in differentsubdivisions of the CN in control (Cu, N=2; Sp5, N=2) and deafened (Cu, N=2; Sp5, N=2)guinea pigs. (A, B) Only a few Cu and Sp5 terminals colabeled with VGLUT1. Theseterminals were mostly located in the GCD in both control and deafened guinea pigs. (C, E)Numbers of VGLUT1-labeled Sp5 MFs significantly increased in the GCD following threeweek unilateral deafening. (D, F) Numbers of VGLUT1-labeled Cu MFs significantlyincreased in the GCD following three week unilateral deafening.
Zeng et al. Page 25
J Neurosci. Author manuscript; available in PMC 2013 May 07.
$waterm
ark-text$w
atermark-text
$waterm
ark-text


