Embed Size (px)
Citation preview
Strain distribution and fabric development modeled
in active and ancient transpressive zones
Karel Schulmann,1 Alan Bruce Thompson,2 Ondrej Lexa,1 and Josef Jezek3
Received 23 May 2001; revised 26 April 2002; accepted 20 May 2002; published 16 January 2003.
[1] A model based on kinematics of transpression allows the measurable internalparameters (simultaneous strain, fabric, and vertical elevation) to be simulated in relationto the macroscopically determined external parameters of transpressive zones (i.e., zonewidth, velocity, angle of convergence, and zone depth). We present a diagram ofconvergence angle against time for homogeneous transpression, where isolines of strainintensity D, strain symmetry K, and vertical elevation of rock samples are superposed.However, the distribution of internal strain parameters is sensitive to three types of strainpartitioning: (1) Discrete partitioning results in general decrease of finite strainaccumulations and in increase of pure shear component, (2) ductile partitioning splits thetranspressional domain into a pure shear zone where strain accumulations decreases and ina wrench-dominated zone where strain accumulations increases, and (3) viscositypartitioning is marked by different strain rates in zones of different viscosity and therefore bydifferent strain parameters. INDEX TERMS: 8025 Structural Geology: Mesoscopic fabrics; 8110
Tectonophysics: Continental tectonics—general (0905); 0905 Exploration Geophysics: Continental structures
(8109, 8110); KEYWORDS: transpression, strain partitioning, exhumation, oblique convergence
Citation: Schulmann, K., A. B. Thompson, O. Lexa, and J. Jezek, Strain distribution and fabric development modeled in active and
ancient transpressive zones, J. Geophys. Res., 108(B1), 2023, doi:10.1029/2001JB000632, 2003.
1. Introduction
[2] Modern tectonic studies face the problem of under-standing the relationships between small-scale structuresand large-scale geometry in orogenic zones. The linksbetween the external and internal parameters governingthe problem are particularly important. These factors maybe viewed as far-field causes related to local effects. Weexamine here these relationships in ancient and activetranspressive zones. External structural parameters are rep-resented by the geometry of orogenic zones (i.e., zone width(distance between colliding plates), obliquity (angle ofconvergence) and depth of the transpressive zone. Irregu-larities of plate boundaries (shape of indenting block), andthe velocity and duration of plate convergence) may alsoplay an important role. Internal (local) structural parametersthat can be examined are fabric and strain intensity, sym-metry of fabrics, orientations of strain axes, pressure (depth)memory, and metamorphic facies of the rocks. Theseinternal structural parameters are determined by the inter-actions of the external forces with local lithological hetero-geneities and rheologies in the transpressive zone.[3] Relative motion of lithospheric plates on a spherical
surface is such that the plate convergence vectors are often
not orthogonal to plate boundaries [McKenzie and Parker,1967; Dewey, 1975]. These plate boundaries experiencecombined transcurrent and convergent displacements asso-ciated with development of deformation zones of differentsize. Within continental blocks, the deformation is not onlyrestricted to active plate boundaries but occurs within zonesof weakness inside rigid continental domains [e.g., Tommasiand Vauchez, 1997] and can be approximately described asa deformation of a weak zone bounded by rigid blocks withsteep parallel walls. All the mentioned types of deformationzones can be more or less described by a model called‘‘transpression,’’ introduced first by Harland [1971], devel-oped by Sanderson and Marchini [1984], and elaborated bymany others. Despite its simplicity, it seems that the modelstill has much to contribute toward our understanding of thenature of convergent orogeny. In this work we develop themodel to quantify the effects of external (macroscopic)parameters on temporal development of internal strainparameters in transpressive (obliquely convergent) weakzones of finite width.
2. Structural Definition of Transpression andProblems to Be Solved
[4] The classical zone of transpressive deformation is atabular weak region subjected between its steep walls to asimultaneous pure shear and simple shear. In the model ofSanderson and Marchini [1984] the material is able to slipfreely upward (vertically extruded) along the walls of thetranspression zone. The transpressive deformation zonedefined by Sanderson and Marchini [1984] was also limiteddownward by a rigid horizontal plate (like a rigid floor),
JOURNAL OF GEOPHYSICAL RESEARCH, VOL. 108, NO. B1, 2023, doi:10.1029/2001JB000632, 2003
1Institute of Petrology and Structural Geology, Faculty of Science,Charles University, Prague, Czech Republic.
2Department Erdwissenschaften, ETH Zurich, Switzerland.3Institute of Applied Mathematics and Computer Science, Faculty of
Science, Charles University, Prague, Czech Republic.
Copyright 2003 by the American Geophysical Union.0148-0227/03/2001JB000632$09.00
ETG 6 - 1
thus allowing extrusion only in the vertical direction.Fossen and Tikoff [1998] suggested boundary conditionswhere zones of transpressive deformation are able to growthor shrink vertically as well as horizontally along strike.[5] Fossen and Tikoff [1993] defined two types of trans-
pression on the basis of the orientation of the instantaneousstretching axes: (1) pure-shear-dominated transpression inwhich v1 and v3 (eigenvectors of instantaneous straincorresponding to maximum and minimum elongation)define a vertical plane and the v1 (lineation) is vertical,and (2) wrench-dominated transpression in which v1 and v3are horizontal, while the v2 (intermediate eigenvector) isvertical. Pure-shear-dominated transpression operates whenthe angle between relative plate convergence direction andplate boundary is greater than 20� [Pinet and Cobbold,1992], and the main axis of finite strain is always vertical. Inwrench-dominated transpression acting at an angle of con-vergence (a) of <20�, this axis switches from the horizontalto the vertical direction during progressive deformation.[6] Several authors considered the effects of discrete
displacement partitioning in transpressive zones, where partor all of the lateral displacements is accommodated bydiscrete zone-boundary-parallel faults [Tikoff and Teyssier,1994; Jones and Tanner, 1995; Teyssier et al., 1995]. Jezeket al. [1998] proposed that lateral displacement might bealso accommodated in large-scale ductile shear zones ofdominant simple shear deformation. This type of deforma-tion was called ‘‘ductile partitioning’’ and in nature isrepresented by large-scale shear zones affecting domainsof uniform lithology and viscosity [Martelat et al., 2000].The deformation in transpressive zones may be also bepartitioned due to lateral variations of viscosity leading tolateral variations in strain rate, which is called ‘‘viscositypartitioning’’ by Jezek et al. [1998]. This situation maydevelop in nature by isoclinal vertical folding of originallyflat stratification, leading to horizontal alternation of zonesof different lithology in transpressional zones. In addition,intrusion of syntectonic granites in transpressional zonesmay represent such vertical zones of anomalous weakness[Brown and Solar, 1998].[7] Several numerical models, varying in their ‘‘obliq-
uity’’ and consequently pure shear and simple shear com-ponents, predict the distribution of strain symmetry in termsof K values (a deformational aspect ratio), strain rateintensity, orientations of lineation and foliation and/orvorticity (expressed by the Wk number [Sanderson andMarchini, 1984; Robin and Cruden, 1994; Dutton, 1997;Jones et al., 1997]). Moreover, changes of coaxial compo-nents in the directions X and Z allowed Fossen and Tikoff[1998] to define five types of transpressive systems, leadingto distinct complex strain symmetries and finite strain axesgeometries. It is their B type of transpression that corre-sponds to a classical Sanderson and Marchini [1984] trans-pressional scheme.[8] The aim of this contribution is to study how the basic
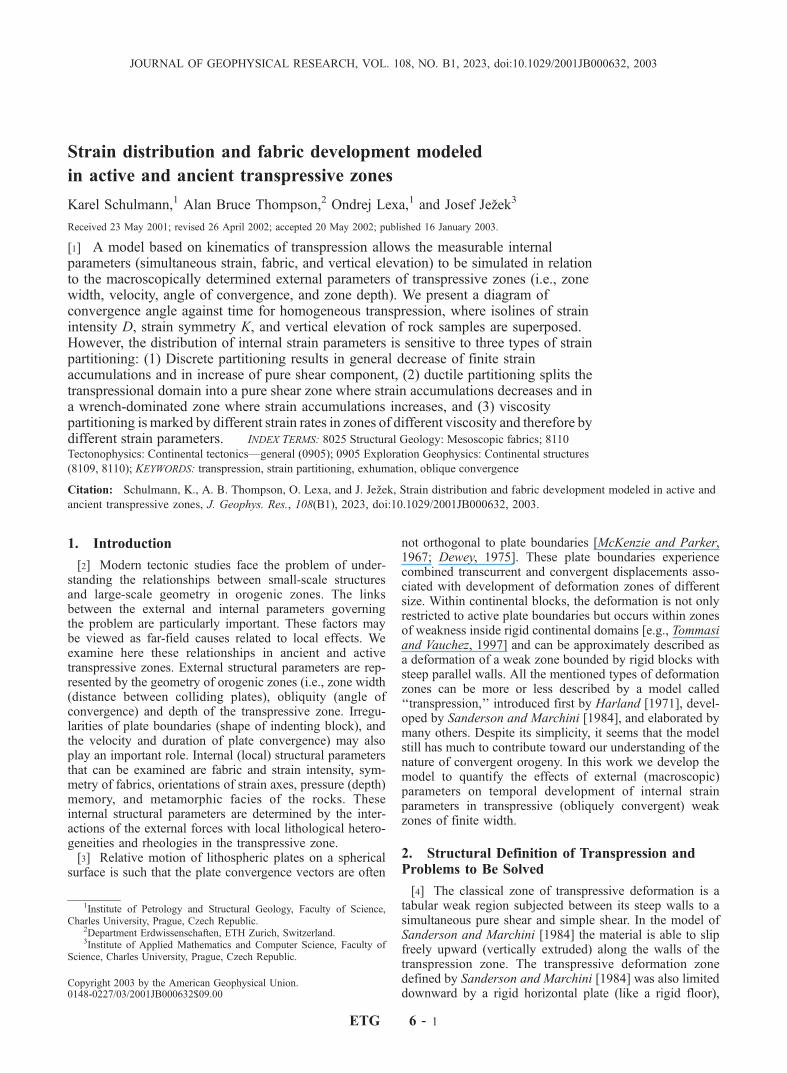
external parameters of convergence may control the possi-ble internal structural patterns in weak tabular transpressionzones. An attempt is made to show possible relationshipsbetween orientations of strain axes, finite strain parameterslike strain symmetry, strain intensity and rate of rockexhumation with respect to belt width (d ), angle of con-vergence (a), velocity (v), duration of plate movements, and
depth of the transpressional system (Figure 1). There areonly a few models which examine relationships betweensome external macroscopic parameters and internal struc-tures [e.g., Tikoff and Teyssier, 1994; Dutton, 1997]; theseusually consider relations between obliquity of convergenceand strain. The main problems addressed in this paper arethe following:How the width of the deformed zone, velocity of move-
ment of the bounding rigid blocks, and the angle ofconvergence influence the development of internal struc-tures with time?What is the influence of various types of strain partition-
ing on the development of the above mentioned structures?What is the time necessary for development of most of
the observed fabrics in transpressive zones?Is the switch from horizontal to vertical lineation in
oblique transpressive zones significant in terms of geo-logically relevant timescales?What is the influence of the depth of the transpressional
system upon the relationship between rock sample elevationand its internal strain?We are interested in what new information can be
obtained if we simplify reality to classical transpression,relate the external and internal parameters and use all theirknown values.
3. External Macroscopic Parameters ofTranspressive Zones
[9] External parameters, which will be used for thepurposes of this study, are widths of existing intracontinen-tal transpressive zones, angles of convergence, and typicalplate velocities and depth of the transpressional systems.
3.1. Width of the Transpressional Systems andVelocities of Convergence
[10] Transpressive systems from Archean and Proterozoiccrust represented by domains of high ductile shear sur-rounded by rigid cratonic blocks reach widths of severalhundred kilometers [Tommasi and Vauchez, 1997; Vauchezet al., 1998]. Similar values are quoted from active litho-spheric transpressional shear zones located at plate bounda-ries, like the Sumatra zone and the San Andreas fault systemwhich reach widths of 300 and 200 km, respectively [Tikoffand Teyssier, 1994].[11] Plate velocities are known from intensive geodetic
and GPS measurements made during the last decade [e.g.,DeMets et al., 1990]. We are mainly interested in platevelocities in collisional systems, which are slower thanthose of active subduction and are only rarely higher thanseveral tens of millimeters per year. For instance, quotedconvergence velocities range from 30 to 70 mm yr�1 for theIndia-Asia collision, 10 to 20 mm yr�1 for Eurasia-Arabia,50 to 90 mm yr�1 for the Europe-Africa collision, �70 mmyr�1 for Australia-Indonesia, and �50 mm yr�1 for the SanAndreas domain [DeMets et al., 1990]. Thus the conver-gence velocities for major collisional boundaries varybetween 10 and 90 mm yr�1, with an average around 50mm yr�1. Most important for our study are areas of activetranspressive deformation where plate velocities (v), con-vergence angles (a) and zone width (d ), are known, like theSan Andreas lithospheric transpressional system [Teyssier
ETG 6 - 2 SCHULMANN ET AL.: STRAIN DISTRIBUTION
and Tikoff, 1997], the Sumatra system [Tikoff and Teyssier,1994], or the Alpine fault system, South Island, NewZealand [Teyssier et al., 1995].[12] Using the above listed macroscopic parameters, we
can assume that the width of transpressive systems varies in arange of several hundred kilometers, with plate velocitiesranging between 10 and 90mm yr�1.We can therefore definea ratio of convergence velocity to width of the deformedzone, Rvd, which determines the strain rate, and find it torange from 2 Myr�1 (6.34 � 10�14 s�1) for narrow zoneswith high convergence velocity, to 0.03Myr�1 (9.51� 10�16
s�1) for exceptionally wide zones with slow convergence.
3.2. Rigid Floor Depth of Transpressional System(RFD)
[13] Most transpressive models assume that the horizontalshortening of the zone is compensated by vertical extrusionabove a level of decoupling [Royden, 1996]. This premiseimplies that there must be somewhere in the lithosphere an‘‘exhumation compensation level’’ from which the rocks areextruded upward and in some circumstances perhaps alsodepressed downward. This is a similar concept to the depthof ‘‘no elevation’’ in intracontinental rift zones introducedas a ‘‘necking depth’’ [e.g., Cloetingh et al., 1995], which iscritically dependent on the thermal and rheological state ofthinned lithosphere.
[14] Thompson et al. [2001] applied a rheological model-ing of the mechanical evolution of the stratified lithosphereusing yield strength envelopes of Ranalli and Murphy[1987] and integrated strength values according to England[1986] of lithospheric columns inside and outside thecontracted zone. Their modeling showed that homogeneousshortening and thickening of a weak zone is possible forsome suitable combinations of temperature and rheologyappropriate to averaged crustal composition. This is possi-ble if the rocks in the internal zone are weaker at any depthof the column than adjacent rigid lithosphere [Thompson etal., 2001]. Thompson et al. also showed that the continuousthickening of weak zone led inevitably to a situation wherethe thickened zone becomes floored by a mantle layerstronger than the adjacent walls. This configuration led tocontinuous horizontal shortening of the lower crustal zoneabove the strong mantle layer which itself laterally wedgesinto the adjacent continental lithosphere.[15] Another possibility is that the ‘‘exhumation compen-
sation level’’ is produced by a balance of forces acting in thevertical direction [Stuwe and Barr, 1998] assuming cou-pling of deformation between mantle and crust. Homoge-nous deformation in lithospheric scale shear zones has beenassumed for several transpressive zones that are hundreds ofkilometers wide [Vauchez and Nicolas, 1991; Pili et al.,1997; Teyssier and Tikoff, 1997; Vauchez et al., 1998]. This
Figure 1. Block diagrams and principal strain axes orientations for transpressive systems with externalparameters: (a) plate velocity (v = 1 to 10 cm yr�1) and initial width (d = 50 to 300 km), which give theratio Rvd from 2 to 0.03, respectively, and rigid floor depth (RFD = 70, 40 km). As internal parameters,the instantaneous orientation of foliation plane (XY ) and lineation (X ) are related to angle of convergence(a) of (c) a = 60� and (d) a < 20�. (b) Particle paths of two samples shown for a given RFD and initialstarting depths (z1(t0), z2(t0)). The final positions of particles are shown for time t1 (z1(t1), z2(t1)). Verticalelevation of both particles is expressed by e1(dt) and e2(dt).
SCHULMANN ET AL.: STRAIN DISTRIBUTION ETG 6 - 3
suggests that the base of lithospheric transpressional zonesis not always present as a rigid floor. In such a case, verticalmovements within the system are controlled by isostaticalresponse and can thus lead also to downward motion ofmaterial early in the shortening history.
4. Modeling of Internal Parameters ofTranspressional Systems
[16] We calculate the internal strain parameters of trans-pressional systems (strain rate, finite strain intensity, andsymmetry and orientation of finite strain axes) in terms ofexternal parameters defined above. The description ofmethod of calculations and derivation of equations are givenin Appendices A–D.
4.1. Strain Rates and Finite Strain Intensities
[17] The first result of our model is that in the range ofassumed Rvd, a strain rate interval from 10�14 s�1 to 10�16
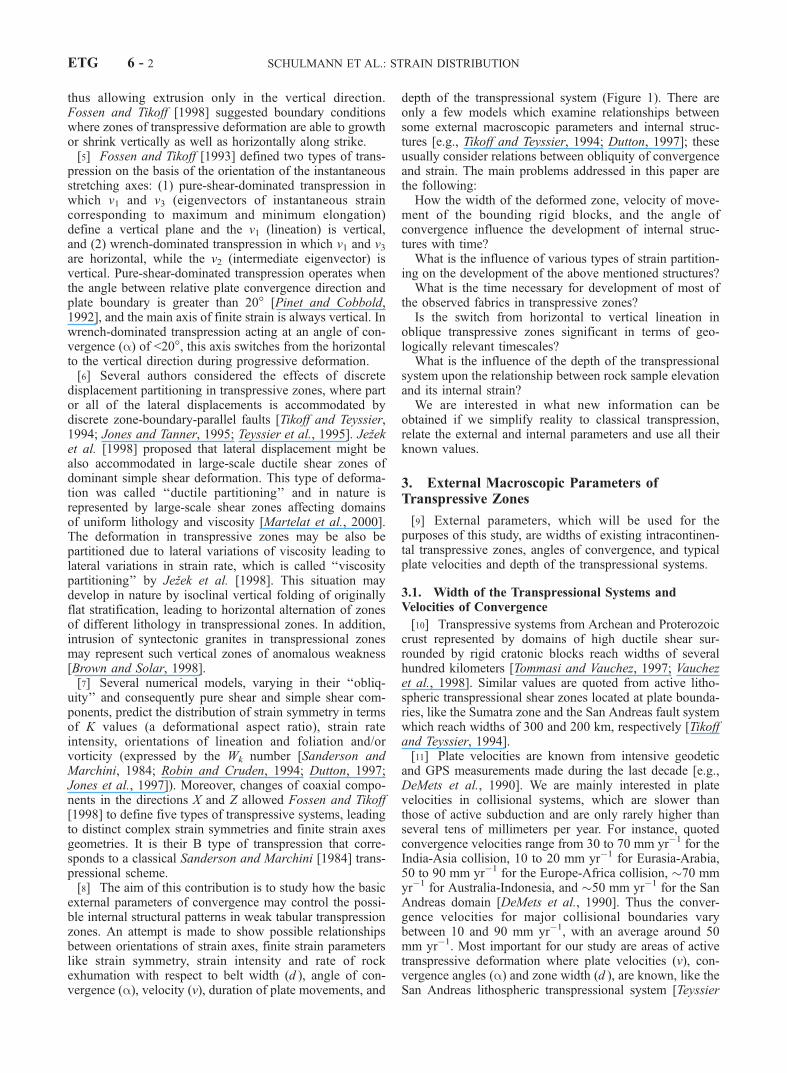
s�1 is obtained. This is within the range of generallyassumed strain rates extrapolated from experimental labo-ratory data [Carter and Tsenn, 1987] and corresponds wellto that deduced for natural orogens by Pfiffner and Ramsay[1982]. Theoretical curves of finite strain accumulation for
different obliquities are presented in Figure 2b. In Figure 2bthe strain intensity parameter D (see Appendix A) is plottedon the vertical axis against the time parameter, kt, whichrelates the time of deformation with Rvd, the ratio ofconvergence velocity and initial zone width
kt ¼ tRvd: ð1Þ
The introduction of such a time parameter follows from thedefinition of the transpression model and allows us to graphthe temporal developments corresponding to zones ofdifferent width and convergence velocities (Figure 2a). Ifthe ratio Rvd = 1, the scale of the kt axis represents timedirectly in million years. For other Rvd values we obtain thecorresponding time from equation (1).[18] In order to compare Figure 2a with those on Figure 7
of Pfiffner and Ramsay [1982] each of the curves calculatedfor convergence angles varying from a = 0� to 90� is labeledwith its strain rate value. Because of the triaxial character ofthe deformation in transpressive zones we use a strain ratecalculated as rate of change of the square root of theminimum eigenvalue corresponding to short axis of instan-taneous strain tensor, and instead of R = X/Z, which is a goodcharacteristic for plane strain we use the D parameter.
Figure 2. (a) Diagram showing relation between strain intensity (D) and time (expressed by timeparameter, kt, where t = kt/Rvd). The dot-dashed curves show time evolution of D for different angle ofconvergence (a). The distribution curve at the left shows the envelope of natural strains summarized byPfiffner and Ramsay [1982], Hrouda [1993], and others. The horizontal line through the maximum (at D =1.2) shows the strain observable by field measurements. (b) The relationship between strain intensity (D)and angle of convergence (a) through three time sections (5, 10, and 15Myr). The contours show variationsof Rvd values, which distinguish narrow and fast converging transpressive orogens (Rvd > 0.5) from wideand slowly converging ones (Rvd < 0.5). Vertical lines at convergence angles 30� and 50� show strainaccumulations for Rvd values of active transpressive zones in New Zealand and Sumatra, respectively.
ETG 6 - 4 SCHULMANN ET AL.: STRAIN DISTRIBUTION
[19] The strain rates are expressed in terms of Rvd. Thefinite strain development is more rapid for pure frontalconvergence than for a transpressional zone of any obliq-uity. The convergence with a = 90� and a = 0� end-membercurves represent pure shear and simple shear strain ratepaths in Figure 7 of Pfiffner and Ramsay [1982]. Thedensity distribution curve on the left side of Figure 2aindicates the distribution of finite strains plotted fromPfiffner and Ramsay [1982] and Hrouda [1993] and com-pleted with finite strain data of Rajlich et al. [1988],Schultz-Ela and Hudleston [1991], Schulmann et al.[1994], and Kirkwood [1995].[20] The strain intensity D is strongly dependent on both
the angle of convergence a, and on the ratio Rvd. It istherefore highest for frontal collision at high Rvd. Withdecreasing Rvd and decreasing convergence angle, the strainintensity decreases rapidly (Figure 2b). Starting from zonesmarked by the value Rvd = 0.1 the variations in strainintensity are negligible with time. However, zones withRvd values higher than 0.2 show rapid increase of strainintensity after only a short duration of convergence. Thehighest gradient of strain intensity increase occurs for lowconvergence angles (wrench-dominated transpression). Forhigher convergence angles, the strain intensity increasessmoothly with increasing convergence angle. The strainintensity value also increases steadily with time, which isconsistent with progressive accumulation of finite strainduring shortening of a collisional belt.
4.2. Temporal Evolution of Foliation and Lineation
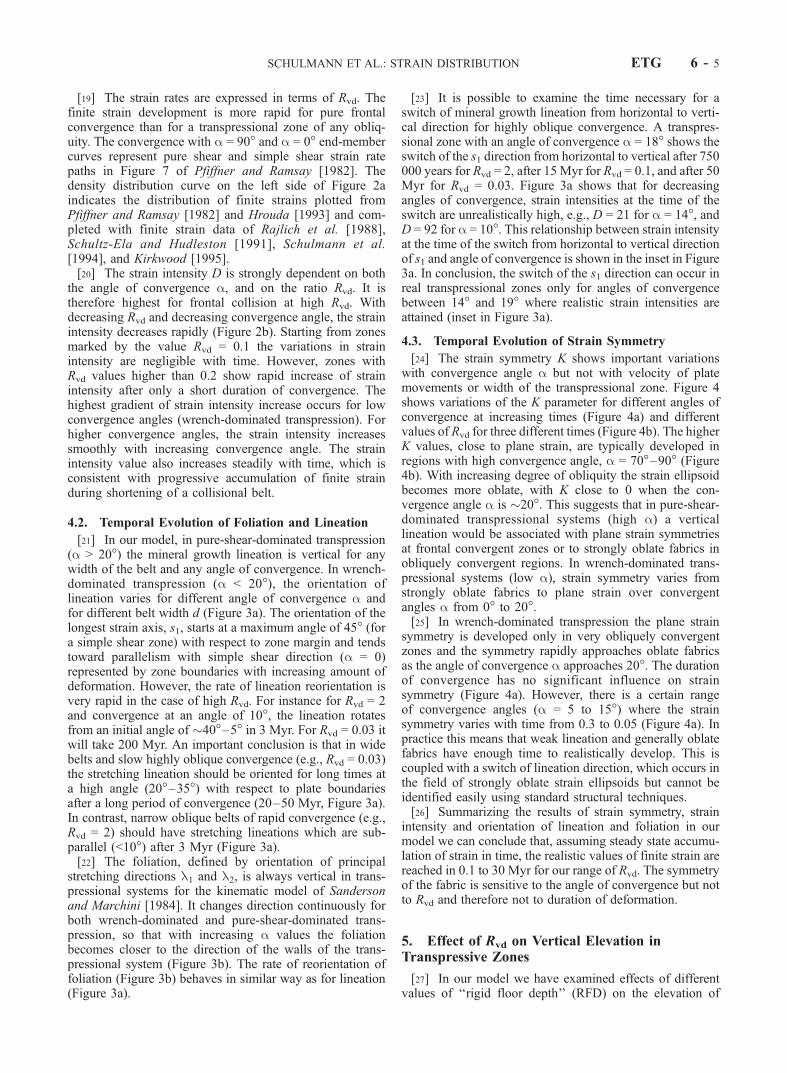
[21] In our model, in pure-shear-dominated transpression(a > 20�) the mineral growth lineation is vertical for anywidth of the belt and any angle of convergence. In wrench-dominated transpression (a < 20�), the orientation oflineation varies for different angle of convergence a andfor different belt width d (Figure 3a). The orientation of thelongest strain axis, s1, starts at a maximum angle of 45� (fora simple shear zone) with respect to zone margin and tendstoward parallelism with simple shear direction (a = 0)represented by zone boundaries with increasing amount ofdeformation. However, the rate of lineation reorientation isvery rapid in the case of high Rvd. For instance for Rvd = 2and convergence at an angle of 10�, the lineation rotatesfrom an initial angle of �40�–5� in 3 Myr. For Rvd = 0.03 itwill take 200 Myr. An important conclusion is that in widebelts and slow highly oblique convergence (e.g., Rvd = 0.03)the stretching lineation should be oriented for long times ata high angle (20�–35�) with respect to plate boundariesafter a long period of convergence (20–50 Myr, Figure 3a).In contrast, narrow oblique belts of rapid convergence (e.g.,Rvd = 2) should have stretching lineations which are sub-parallel (<10�) after 3 Myr (Figure 3a).[22] The foliation, defined by orientation of principal
stretching directions l1 and l2, is always vertical in trans-pressional systems for the kinematic model of Sandersonand Marchini [1984]. It changes direction continuously forboth wrench-dominated and pure-shear-dominated trans-pression, so that with increasing a values the foliationbecomes closer to the direction of the walls of the trans-pressional system (Figure 3b). The rate of reorientation offoliation (Figure 3b) behaves in similar way as for lineation(Figure 3a).
[23] It is possible to examine the time necessary for aswitch of mineral growth lineation from horizontal to verti-cal direction for highly oblique convergence. A transpres-sional zone with an angle of convergence a = 18� shows theswitch of the s1 direction from horizontal to vertical after 750000 years for Rvd = 2, after 15 Myr for Rvd = 0.1, and after 50Myr for Rvd = 0.03. Figure 3a shows that for decreasingangles of convergence, strain intensities at the time of theswitch are unrealistically high, e.g., D = 21 for a = 14�, andD = 92 for a = 10�. This relationship between strain intensityat the time of the switch from horizontal to vertical directionof s1 and angle of convergence is shown in the inset in Figure3a. In conclusion, the switch of the s1 direction can occur inreal transpressional zones only for angles of convergencebetween 14� and 19� where realistic strain intensities areattained (inset in Figure 3a).
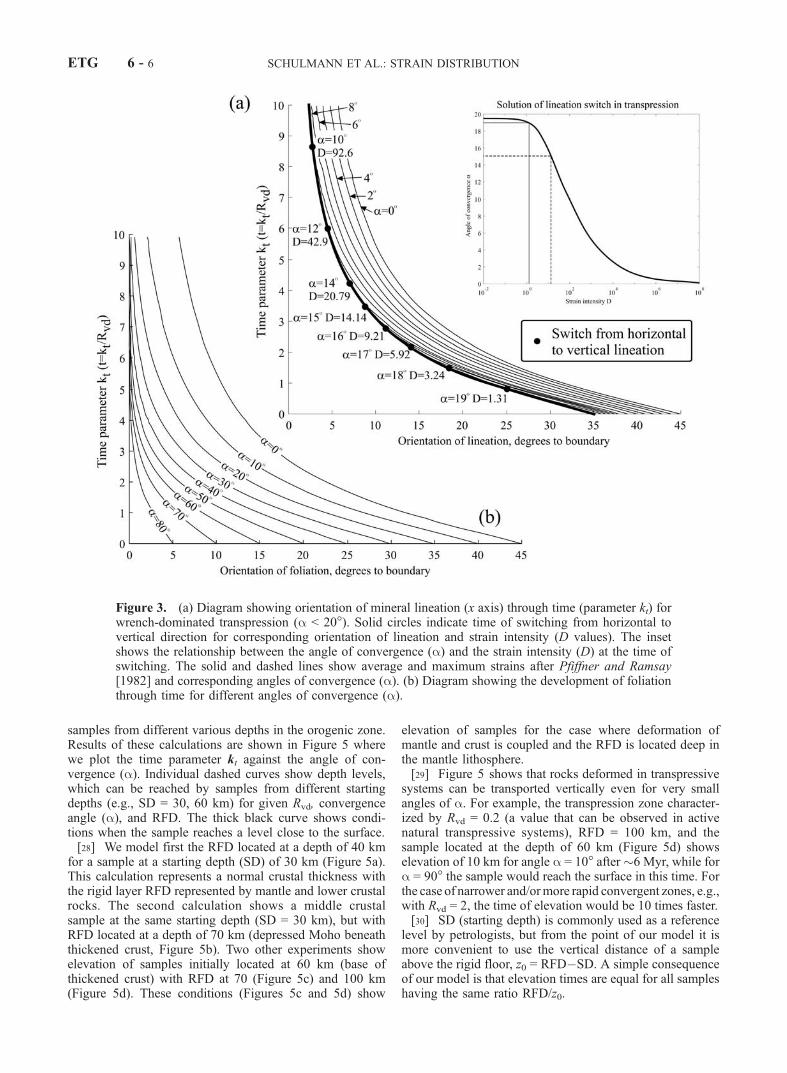
4.3. Temporal Evolution of Strain Symmetry
[24] The strain symmetry K shows important variationswith convergence angle a but not with velocity of platemovements or width of the transpressional zone. Figure 4shows variations of the K parameter for different angles ofconvergence at increasing times (Figure 4a) and differentvalues of Rvd for three different times (Figure 4b). The higherK values, close to plane strain, are typically developed inregions with high convergence angle, a = 70�–90� (Figure4b). With increasing degree of obliquity the strain ellipsoidbecomes more oblate, with K close to 0 when the con-vergence angle a is �20�. This suggests that in pure-shear-dominated transpressional systems (high a) a verticallineation would be associated with plane strain symmetriesat frontal convergent zones or to strongly oblate fabrics inobliquely convergent regions. In wrench-dominated trans-pressional systems (low a), strain symmetry varies fromstrongly oblate fabrics to plane strain over convergentangles a from 0� to 20�.[25] In wrench-dominated transpression the plane strain
symmetry is developed only in very obliquely convergentzones and the symmetry rapidly approaches oblate fabricsas the angle of convergence a approaches 20�. The durationof convergence has no significant influence on strainsymmetry (Figure 4a). However, there is a certain rangeof convergence angles (a = 5 to 15�) where the strainsymmetry varies with time from 0.3 to 0.05 (Figure 4a). Inpractice this means that weak lineation and generally oblatefabrics have enough time to realistically develop. This iscoupled with a switch of lineation direction, which occurs inthe field of strongly oblate strain ellipsoids but cannot beidentified easily using standard structural techniques.[26] Summarizing the results of strain symmetry, strain
intensity and orientation of lineation and foliation in ourmodel we can conclude that, assuming steady state accumu-lation of strain in time, the realistic values of finite strain arereached in 0.1 to 30 Myr for our range of Rvd. The symmetryof the fabric is sensitive to the angle of convergence but notto Rvd and therefore not to duration of deformation.
5. Effect of Rvd on Vertical Elevation inTranspressive Zones
[27] In our model we have examined effects of differentvalues of ‘‘rigid floor depth’’ (RFD) on the elevation of
SCHULMANN ET AL.: STRAIN DISTRIBUTION ETG 6 - 5
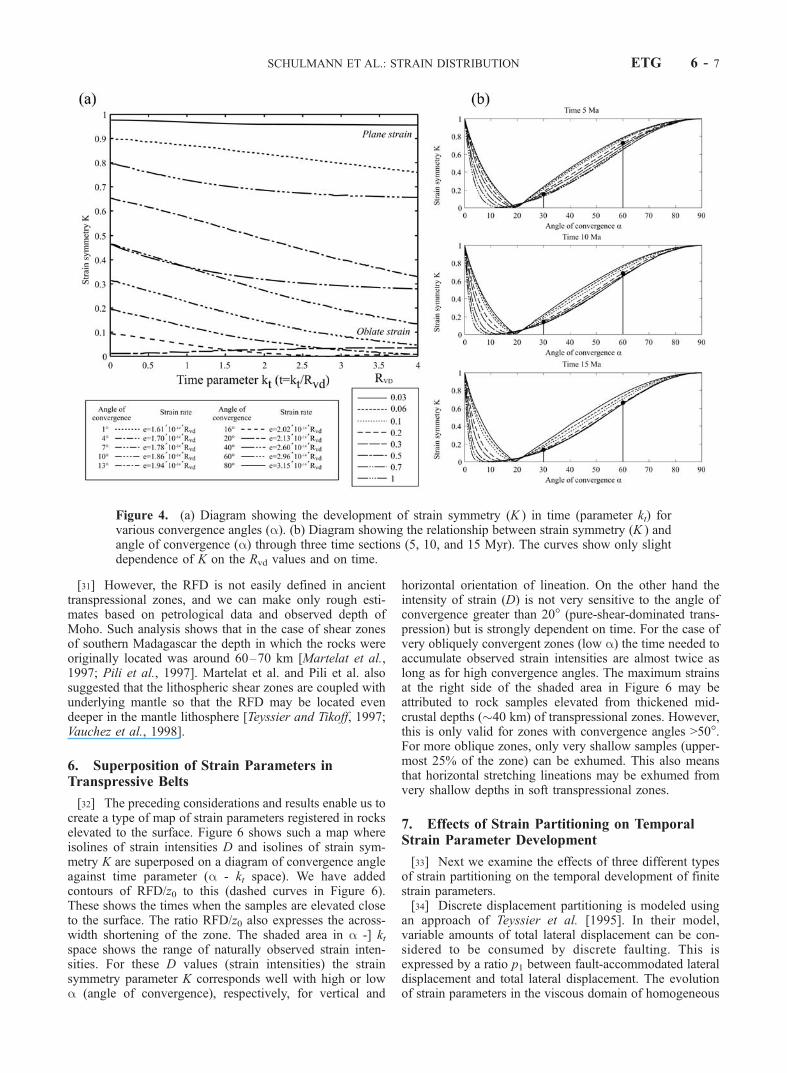
samples from different various depths in the orogenic zone.Results of these calculations are shown in Figure 5 wherewe plot the time parameter kt against the angle of con-vergence (a). Individual dashed curves show depth levels,which can be reached by samples from different startingdepths (e.g., SD = 30, 60 km) for given Rvd, convergenceangle (a), and RFD. The thick black curve shows condi-tions when the sample reaches a level close to the surface.[28] We model first the RFD located at a depth of 40 km
for a sample at a starting depth (SD) of 30 km (Figure 5a).This calculation represents a normal crustal thickness withthe rigid layer RFD represented by mantle and lower crustalrocks. The second calculation shows a middle crustalsample at the same starting depth (SD = 30 km), but withRFD located at a depth of 70 km (depressed Moho beneaththickened crust, Figure 5b). Two other experiments showelevation of samples initially located at 60 km (base ofthickened crust) with RFD at 70 (Figure 5c) and 100 km(Figure 5d). These conditions (Figures 5c and 5d) show
elevation of samples for the case where deformation ofmantle and crust is coupled and the RFD is located deep inthe mantle lithosphere.[29] Figure 5 shows that rocks deformed in transpressive
systems can be transported vertically even for very smallangles of a. For example, the transpression zone character-ized by Rvd = 0.2 (a value that can be observed in activenatural transpressive systems), RFD = 100 km, and thesample located at the depth of 60 km (Figure 5d) showselevation of 10 km for angle a = 10� after�6 Myr, while fora = 90� the sample would reach the surface in this time. Forthe case of narrower and/ormore rapid convergent zones, e.g.,with Rvd = 2, the time of elevation would be 10 times faster.[30] SD (starting depth) is commonly used as a reference
level by petrologists, but from the point of our model it ismore convenient to use the vertical distance of a sampleabove the rigid floor, z0 = RFD�SD. A simple consequenceof our model is that elevation times are equal for all sampleshaving the same ratio RFD/z0.
Figure 3. (a) Diagram showing orientation of mineral lineation (x axis) through time (parameter kt) forwrench-dominated transpression (a < 20�). Solid circles indicate time of switching from horizontal tovertical direction for corresponding orientation of lineation and strain intensity (D values). The insetshows the relationship between the angle of convergence (a) and the strain intensity (D) at the time ofswitching. The solid and dashed lines show average and maximum strains after Pfiffner and Ramsay[1982] and corresponding angles of convergence (a). (b) Diagram showing the development of foliationthrough time for different angles of convergence (a).
ETG 6 - 6 SCHULMANN ET AL.: STRAIN DISTRIBUTION
[31] However, the RFD is not easily defined in ancienttranspressional zones, and we can make only rough esti-mates based on petrological data and observed depth ofMoho. Such analysis shows that in the case of shear zonesof southern Madagascar the depth in which the rocks wereoriginally located was around 60–70 km [Martelat et al.,1997; Pili et al., 1997]. Martelat et al. and Pili et al. alsosuggested that the lithospheric shear zones are coupled withunderlying mantle so that the RFD may be located evendeeper in the mantle lithosphere [Teyssier and Tikoff, 1997;Vauchez et al., 1998].
6. Superposition of Strain Parameters inTranspressive Belts
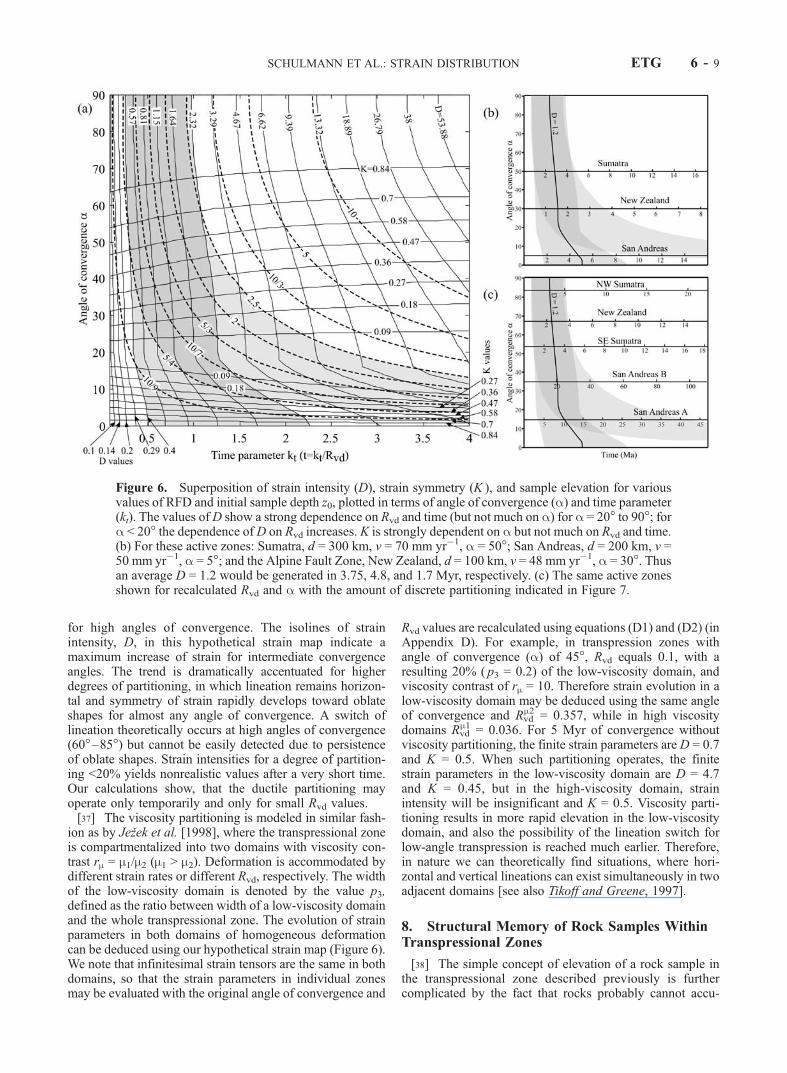
[32] The preceding considerations and results enable us tocreate a type of map of strain parameters registered in rockselevated to the surface. Figure 6 shows such a map whereisolines of strain intensities D and isolines of strain sym-metry K are superposed on a diagram of convergence angleagainst time parameter (a - kt space). We have addedcontours of RFD/z0 to this (dashed curves in Figure 6).These shows the times when the samples are elevated closeto the surface. The ratio RFD/z0 also expresses the across-width shortening of the zone. The shaded area in a -] ktspace shows the range of naturally observed strain inten-sities. For these D values (strain intensities) the strainsymmetry parameter K corresponds well with high or lowa (angle of convergence), respectively, for vertical and
horizontal orientation of lineation. On the other hand theintensity of strain (D) is not very sensitive to the angle ofconvergence greater than 20� (pure-shear-dominated trans-pression) but is strongly dependent on time. For the case ofvery obliquely convergent zones (low a) the time needed toaccumulate observed strain intensities are almost twice aslong as for high convergence angles. The maximum strainsat the right side of the shaded area in Figure 6 may beattributed to rock samples elevated from thickened mid-crustal depths (�40 km) of transpressional zones. However,this is only valid for zones with convergence angles >50�.For more oblique zones, only very shallow samples (upper-most 25% of the zone) can be exhumed. This also meansthat horizontal stretching lineations may be exhumed fromvery shallow depths in soft transpressional zones.
7. Effects of Strain Partitioning on TemporalStrain Parameter Development
[33] Next we examine the effects of three different typesof strain partitioning on the temporal development of finitestrain parameters.[34] Discrete displacement partitioning is modeled using
an approach of Teyssier et al. [1995]. In their model,variable amounts of total lateral displacement can be con-sidered to be consumed by discrete faulting. This isexpressed by a ratio p1 between fault-accommodated lateraldisplacement and total lateral displacement. The evolutionof strain parameters in the viscous domain of homogeneous
Figure 4. (a) Diagram showing the development of strain symmetry (K ) in time (parameter kt) forvarious convergence angles (a). (b) Diagram showing the relationship between strain symmetry (K ) andangle of convergence (a) through three time sections (5, 10, and 15 Myr). The curves show only slightdependence of K on the Rvd values and on time.
SCHULMANN ET AL.: STRAIN DISTRIBUTION ETG 6 - 7
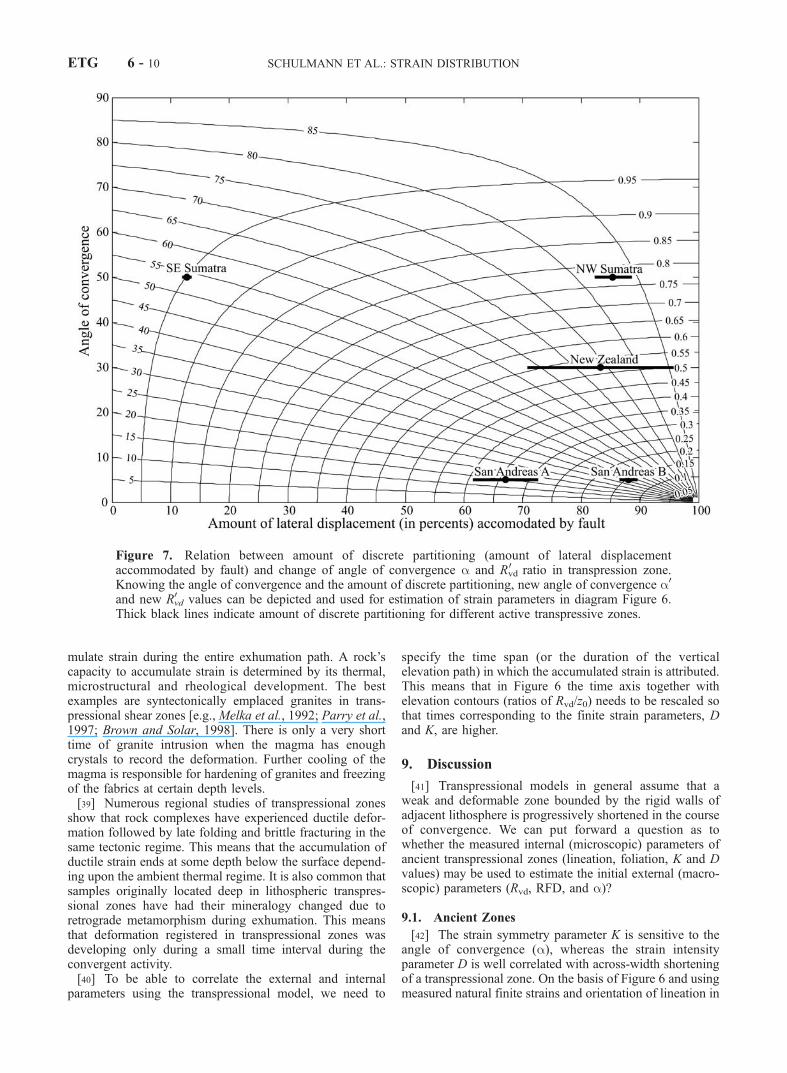
deformation, where the rest of lateral displacement and thewhole across strike shortening are accommodated, can bededuced using our hypothetical strain map (Figure 6). Toevaluate the influence of partitioning on strain parameters,recalculation of values Rvd and a are made using theequations (B1) and (B2) (in Appendix B) or they can betaken from Figure 7. The effect of discrete partitioning onfinite strain parameters is expressed by a virtual increase ofconvergence angle and decrease of Rvd (decrease of plateconvergence velocity or increase of weak zone width). Thusfor a transpression zone with an angle of convergence of45�, Rvd equal 0.1, and with 50% of lateral displacementconsumed by discrete faults, we use values of a0 = 63.43�and Rvd
0 = 0.079 (Figure 7). For 10 Myr of convergencewithout discrete partitioning, finite strain parameters are D =1.64 and K = 0.58. When discrete partitioning accommo-dates 50% of the lateral displacement, the finite strainparameters are D = 0.9 and K = 0.8.[35] Ductile partitioning splits the deformed domain into
a pure shear zone (PSZ) and a wrench-dominated zone
(WDZ). We assume that the pure shear-across-strike short-ening and elevation are homogeneously distributed acrossthe whole system, while simple shear-lateral displacement isaccommodated only in the WDZ. We examine developmentof strain parameters for different widths of the WDZ,expressed as ratio p2 of the width of WDZ and the widthof the whole transpressional zone. Such a partitioning ofpure shear and simple shear within transpressional zones isresponsible for decomposition of the velocity gradienttensor into two separate tensors according to equations(C1) and (C2) (in Appendix C).[36] While the evolution of strain parameters in the PSZ
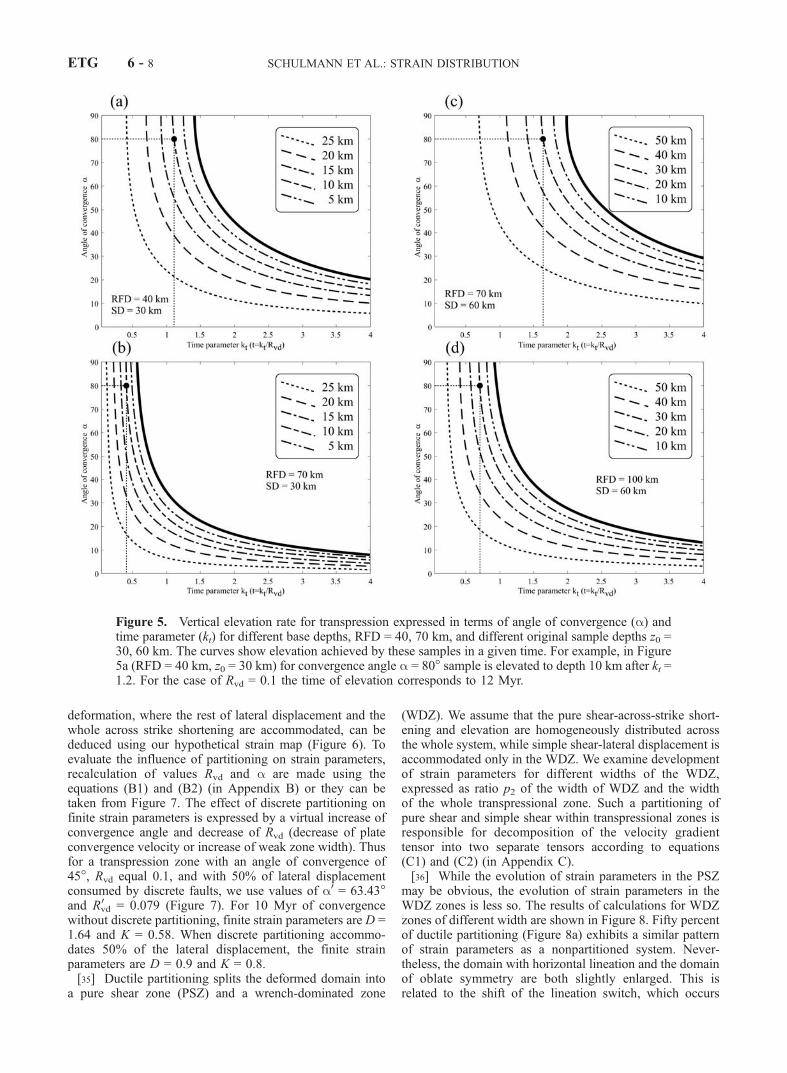
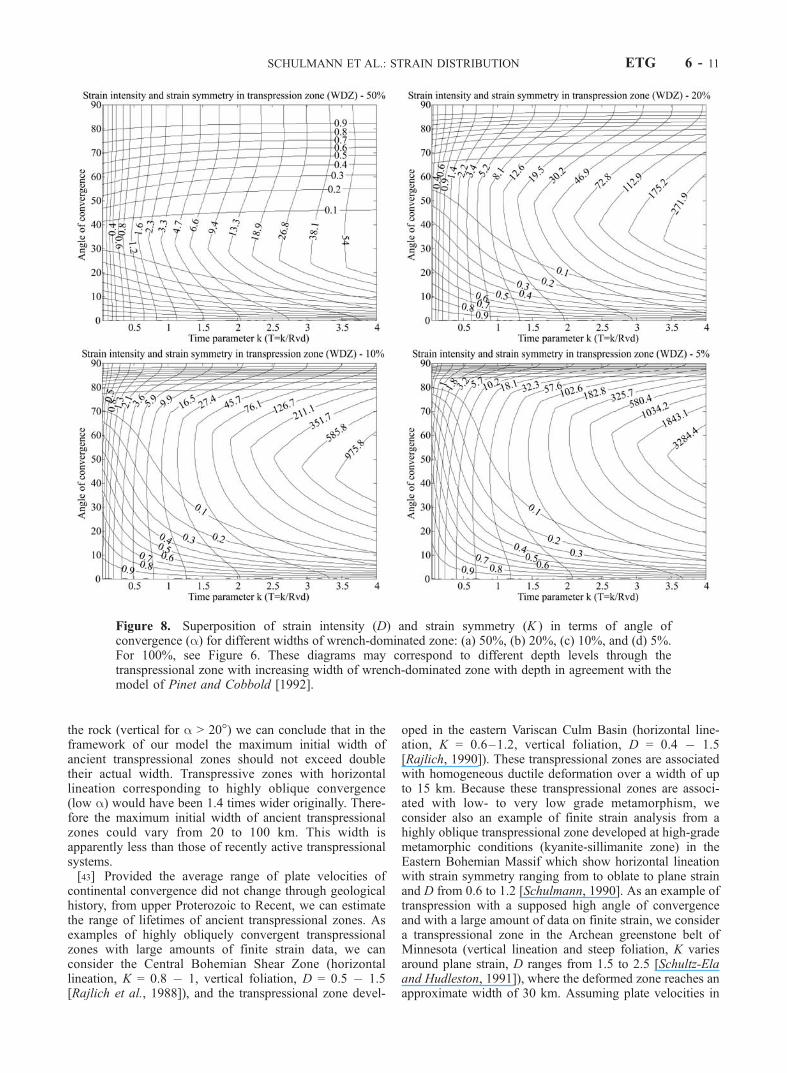
may be obvious, the evolution of strain parameters in theWDZ zones is less so. The results of calculations for WDZzones of different width are shown in Figure 8. Fifty percentof ductile partitioning (Figure 8a) exhibits a similar patternof strain parameters as a nonpartitioned system. Never-theless, the domain with horizontal lineation and the domainof oblate symmetry are both slightly enlarged. This isrelated to the shift of the lineation switch, which occurs
Figure 5. Vertical elevation rate for transpression expressed in terms of angle of convergence (a) andtime parameter (kt) for different base depths, RFD = 40, 70 km, and different original sample depths z0 =30, 60 km. The curves show elevation achieved by these samples in a given time. For example, in Figure5a (RFD = 40 km, z0 = 30 km) for convergence angle a = 80� sample is elevated to depth 10 km after kt =1.2. For the case of Rvd = 0.1 the time of elevation corresponds to 12 Myr.
ETG 6 - 8 SCHULMANN ET AL.: STRAIN DISTRIBUTION
for high angles of convergence. The isolines of strainintensity, D, in this hypothetical strain map indicate amaximum increase of strain for intermediate convergenceangles. The trend is dramatically accentuated for higherdegrees of partitioning, in which lineation remains horizon-tal and symmetry of strain rapidly develops toward oblateshapes for almost any angle of convergence. A switch oflineation theoretically occurs at high angles of convergence(60�–85�) but cannot be easily detected due to persistenceof oblate shapes. Strain intensities for a degree of partition-ing <20% yields nonrealistic values after a very short time.Our calculations show, that the ductile partitioning mayoperate only temporarily and only for small Rvd values.[37] The viscosity partitioning is modeled in similar fash-
ion as by Jezek et al. [1998], where the transpressional zoneis compartmentalized into two domains with viscosity con-trast rm = m1/m2 (m1 > m2). Deformation is accommodated bydifferent strain rates or different Rvd, respectively. The widthof the low-viscosity domain is denoted by the value p3,defined as the ratio between width of a low-viscosity domainand the whole transpressional zone. The evolution of strainparameters in both domains of homogeneous deformationcan be deduced using our hypothetical strain map (Figure 6).We note that infinitesimal strain tensors are the same in bothdomains, so that the strain parameters in individual zonesmay be evaluated with the original angle of convergence and
Rvd values are recalculated using equations (D1) and (D2) (inAppendix D). For example, in transpression zones withangle of convergence (a) of 45�, Rvd equals 0.1, with aresulting 20% ( p3 = 0.2) of the low-viscosity domain, andviscosity contrast of rm = 10. Therefore strain evolution in alow-viscosity domain may be deduced using the same angleof convergence and Rvd
m2 = 0.357, while in high viscositydomains Rvd
m1 = 0.036. For 5 Myr of convergence withoutviscosity partitioning, the finite strain parameters are D = 0.7and K = 0.5. When such partitioning operates, the finitestrain parameters in the low-viscosity domain are D = 4.7and K = 0.45, but in the high-viscosity domain, strainintensity will be insignificant and K = 0.5. Viscosity parti-tioning results in more rapid elevation in the low-viscositydomain, and also the possibility of the lineation switch forlow-angle transpression is reached much earlier. Therefore,in nature we can theoretically find situations, where hori-zontal and vertical lineations can exist simultaneously in twoadjacent domains [see also Tikoff and Greene, 1997].
8. Structural Memory of Rock Samples WithinTranspressional Zones
[38] The simple concept of elevation of a rock sample inthe transpressional zone described previously is furthercomplicated by the fact that rocks probably cannot accu-
Figure 6. Superposition of strain intensity (D), strain symmetry (K ), and sample elevation for variousvalues of RFD and initial sample depth z0, plotted in terms of angle of convergence (a) and time parameter(kt). The values ofD show a strong dependence on Rvd and time (but not much on a) for a = 20� to 90�; fora < 20� the dependence of D on Rvd increases. K is strongly dependent on a but not much on Rvd and time.(b) For these active zones: Sumatra, d = 300 km, v = 70 mm yr�1, a = 50�; San Andreas, d = 200 km, v =50 mm yr�1, a = 5�; and the Alpine Fault Zone, New Zealand, d = 100 km, v = 48 mm yr�1, a = 30�. Thusan average D = 1.2 would be generated in 3.75, 4.8, and 1.7 Myr, respectively. (c) The same active zonesshown for recalculated Rvd and a with the amount of discrete partitioning indicated in Figure 7.
SCHULMANN ET AL.: STRAIN DISTRIBUTION ETG 6 - 9
mulate strain during the entire exhumation path. A rock’scapacity to accumulate strain is determined by its thermal,microstructural and rheological development. The bestexamples are syntectonically emplaced granites in trans-pressional shear zones [e.g., Melka et al., 1992; Parry et al.,1997; Brown and Solar, 1998]. There is only a very shorttime of granite intrusion when the magma has enoughcrystals to record the deformation. Further cooling of themagma is responsible for hardening of granites and freezingof the fabrics at certain depth levels.[39] Numerous regional studies of transpressional zones
show that rock complexes have experienced ductile defor-mation followed by late folding and brittle fracturing in thesame tectonic regime. This means that the accumulation ofductile strain ends at some depth below the surface depend-ing upon the ambient thermal regime. It is also common thatsamples originally located deep in lithospheric transpres-sional zones have had their mineralogy changed due toretrograde metamorphism during exhumation. This meansthat deformation registered in transpressional zones wasdeveloping only during a small time interval during theconvergent activity.[40] To be able to correlate the external and internal
parameters using the transpressional model, we need to
specify the time span (or the duration of the verticalelevation path) in which the accumulated strain is attributed.This means that in Figure 6 the time axis together withelevation contours (ratios of Rvd/z0) needs to be rescaled sothat times corresponding to the finite strain parameters, Dand K, are higher.
9. Discussion
[41] Transpressional models in general assume that aweak and deformable zone bounded by the rigid walls ofadjacent lithosphere is progressively shortened in the courseof convergence. We can put forward a question as towhether the measured internal (microscopic) parameters ofancient transpressional zones (lineation, foliation, K and Dvalues) may be used to estimate the initial external (macro-scopic) parameters (Rvd, RFD, and a)?
9.1. Ancient Zones
[42] The strain symmetry parameter K is sensitive to theangle of convergence (a), whereas the strain intensityparameter D is well correlated with across-width shorteningof a transpressional zone. On the basis of Figure 6 and usingmeasured natural finite strains and orientation of lineation in
Figure 7. Relation between amount of discrete partitioning (amount of lateral displacementaccommodated by fault) and change of angle of convergence a and Rvd
0 ratio in transpression zone.Knowing the angle of convergence and the amount of discrete partitioning, new angle of convergence a0
and new Rvd0 values can be depicted and used for estimation of strain parameters in diagram Figure 6.
Thick black lines indicate amount of discrete partitioning for different active transpressive zones.
ETG 6 - 10 SCHULMANN ET AL.: STRAIN DISTRIBUTION
the rock (vertical for a > 20�) we can conclude that in theframework of our model the maximum initial width ofancient transpressional zones should not exceed doubletheir actual width. Transpressive zones with horizontallineation corresponding to highly oblique convergence(low a) would have been 1.4 times wider originally. There-fore the maximum initial width of ancient transpressionalzones could vary from 20 to 100 km. This width isapparently less than those of recently active transpressionalsystems.[43] Provided the average range of plate velocities of
continental convergence did not change through geologicalhistory, from upper Proterozoic to Recent, we can estimatethe range of lifetimes of ancient transpressional zones. Asexamples of highly obliquely convergent transpressionalzones with large amounts of finite strain data, we canconsider the Central Bohemian Shear Zone (horizontallineation, K = 0.8 � 1, vertical foliation, D = 0.5 � 1.5[Rajlich et al., 1988]), and the transpressional zone devel-
oped in the eastern Variscan Culm Basin (horizontal line-ation, K = 0.6–1.2, vertical foliation, D = 0.4 � 1.5[Rajlich, 1990]). These transpressional zones are associatedwith homogeneous ductile deformation over a width of upto 15 km. Because these transpressional zones are associ-ated with low- to very low grade metamorphism, weconsider also an example of finite strain analysis from ahighly oblique transpressional zone developed at high-grademetamorphic conditions (kyanite-sillimanite zone) in theEastern Bohemian Massif which show horizontal lineationwith strain symmetry ranging from to oblate to plane strainand D from 0.6 to 1.2 [Schulmann, 1990]. As an example oftranspression with a supposed high angle of convergenceand with a large amount of data on finite strain, we considera transpressional zone in the Archean greenstone belt ofMinnesota (vertical lineation and steep foliation, K variesaround plane strain, D ranges from 1.5 to 2.5 [Schultz-Elaand Hudleston, 1991]), where the deformed zone reaches anapproximate width of 30 km. Assuming plate velocities in
Figure 8. Superposition of strain intensity (D) and strain symmetry (K ) in terms of angle ofconvergence (a) for different widths of wrench-dominated zone: (a) 50%, (b) 20%, (c) 10%, and (d) 5%.For 100%, see Figure 6. These diagrams may correspond to different depth levels through thetranspressional zone with increasing width of wrench-dominated zone with depth in agreement with themodel of Pinet and Cobbold [1992].
SCHULMANN ET AL.: STRAIN DISTRIBUTION ETG 6 - 11
the range 1–5 cm yr�1, the lifetimes of these shear zonesmight be in the range 0.5–4 Myr. These times are too shortfor an assumed duration of orogenic events. If we considerthat the duration of orogenic events is long (over an intervalof several tens of million years), then the computed strainintensities for such given external parameters are unrealisti-cally high (up to D = 100).
9.2. Active Zones
[44] Our calculations show that for a transpressional zonewith Rvd < 0.2, the strain rate does not exceed a value of 6 �10�15 s�1 for any angle of convergence (a). This Rvd valuecorresponds to the active zones of Sumatra (d = 300 km, v =70 mm yr�1, Rvd = 0.23) and San Andreas (d = 200 km, v =50 mm yr�1, Rvd = 0.25). For a zone with value Rvd = 0.48,corresponding to the Alpine Fault zone in New Zealand,there will be maximum strain rate of 1.58 � 10�14 s�1
distributed over a width of 100 km for a plate velocity of 48mm yr�1. Zones with Rvd >2 (small d, large v) show highstrain rate values of 3.2 � 10�14 s�1 and will apply fornarrow continental zones (10–20 km) with a mean platevelocity of 5 km yr�1. Note that all of these values areconsistent with the strain rate estimates suggested by Carterand Tsenn [1987].[45] Assuming that the above mentioned strain values
develop in large zones of homogeneous deformation, inFigure 6b we have plotted recent macroscopic convergenceparameters of well-known active transpressive zones. Wecan take the above listed macroscopic parameters of thesetranspressive zones and ask at what time are the averagestrain intensities developed? Figure 6b shows that theaverage strain of D = 1.2 would be produced in the Sumatrazone after 3.75 Myr, in San Andreas after 4.8 Myr, and inAlpine Fault Zone, New Zealand, after �1.7 Myr.[46] The average strains, characteristic for most of the
zones with dispersed deformation are achieved in 5 Myr forzones with Rvd = 0.2 and after 10 Myr for zones with Rvd =0.1. We note that the New Zealand zone of distributedfaulting would have a strain intensity corresponding to D =13 after 5 Myr, while the San Andreas and Sumatra zoneswould remain within a realistic range of strain intensities (Dof x to y). We note that for the entire lifetime of the SanAndreas system (20 Myr) only the last 5 Myr are attributedto dextral transpression [Walcott, 1993] which is caused byPacific plate rotation [Luyendyk et al., 1985]. Similarfeatures are reported from paleomagnetic investigations ofthe New Zealand system [Walcott, 1987], and therefore anydirect application of the transpressional model to strainaccumulations in time is problematic.
9.3. What Effects Could Explain These Discrepancies?
[47] We are unable to correlate succinctly the external andinternal parameters of homogeneous transpression. Thisinconsistency, apart from plate rotation, is well explainedby the three concepts of strain partitioning discussed above.Discrete partitioning results in general decrease of finitestrain accumulations and in increase of pure shear compo-nent in deformed zone. The effects of ductile partitioningbecomes important for narrow wrench-dominated zone (lessthan 30% of the width of the whole transpressional zone)and is responsible for decrease of strain accumulation in thepure-shear-dominated zone and increase in the wrench-
dominated zone. We note that the pure-shear-dominatedzone exhibits all structural characteristics of frontal short-ening. Viscosity partitioning is marked by different strainrates in domains of different viscosity leading to differentstrain accumulations. In strongly oblique zones (a < 20�)the lineation switch may be achieved in zone of lowviscosity, while in high-viscosity domain the lineationremains horizontal.[48] Therefore strain partitioning of any type may explain
why generally small finite strains are measured in natureand why many orogenic belts are considered to be the resultof frontal convergence. In ancient orogenic zones we do nothave an adequate tool enabling estimation of amounts ofstrain partitioning.[49] In addition, techniques of strain measurement in
deformed rocks face serious problems with the reliabilityof strain markers. This occurs because of requirements ofstrain homogeneity and the need for a similar viscositycontrast of measured particles with respect to the surround-ing matrix (see discussion by Lisle and Savage [1982]).Most strain intensity measurements come from deformationof pebbles measured in low-grade rocks [e.g., Wood, 1974]and from deformed quartzo-feldspathic rocks in high-graderegions [e.g., Schulmann, 1990; Schulmann et al., 1994].These give similar values of finite strain with a range of Dfrom 0 to 20 [Pfiffner and Ramsay, 1982]. Only rarely havestrains been measured in high-grade metamorphic rocks,such as eclogites or orthogneisses, which exhibit penetrativedeformation over several cubic kilometers of volume (asshown by the example of deformed orthogneiss [Schulmannet al., 1994]). In these rocks the measured strain is in therange of D from 2 to 3. There is no significant difference instrain intensity measurements from transpressive and othertypes of orogens [e.g., Kirkwood, 1995; Schulmann et al.,1994; Schultz-Ela and Hudleston, 1991].[50] We suggest that the high strain rates of 10�12 s�1
determined in shear zones [White and Mawer, 1992; Nymanet al., 1995; Newman et al., 1999] results from extremelocalization of deformation (partitioning) and which canonly operate for short periods of time. Thus these measure-ments cannot be extrapolated over large scales and used innumerical models of transpressional systems.[51] The model predictions for finite strain are too high in
zones of high convergence angle when compared to thosemeasured in ancient transpression zones. Another way ofimproving the model would be to incorporate in the modelthe finite strain memory of rocks, as discussed above.Unfortunately, this leads to a devaluation of the possibilityof the transpressional model to relate in a simple way themacroparameters and microparameters of transpressionalzones. The finite strain accumulation is then closely depend-ent on the amount of elevation of a rock sample and theelevation path is also significantly influenced by the verticalgeometry of the zone, i.e., especially the depth of the zone,which is not as easy to determine/define as horizontalparameters (width, velocity, angle of convergence). We donot consider that such a conclusion diminishes the simpleuse of our transpressional model to characterize zones ofoblique convergence, but its application should be donecarefully and needs to involve assumptions about possibleaccumulation of finite strain in specific rocks. Rare studiesputting together detailed finite strain estimates and petro-
ETG 6 - 12 SCHULMANN ET AL.: STRAIN DISTRIBUTION
logical data allowing estimate of depth changes throughtime exist but so far are related to intrusions of magmas intranspressional regimes [e.g., Melka et al., 1992; Parry etal., 1997]. Future work should certainly concentrate onacquisition of fabric data together with detailed petrologicalinvestigations, to delimit the depth-temperature regime, andwith geochronological investigations, to understand theduration of transpressional orogeny.
9.4. Importance of the Switch of Lineation
[52] As an additional result of our modeling, we haveobtained information about the switch of lineation thatdeserves to be mentioned in conclusion. Analysis of thelineation produced by the classical transpression modelshows that the switch of lineation during progressive short-ening of the zone is theoretically possible. However, thecorresponding strain intensities are very high and the degreeof oblateness does not permit meaningful measurement of thechange in the linear fabric. An interesting observation is thatoblate fabrics are measured only exceptionally, more oftenwe have to deal with lineation (vertical or horizontal andclose to plain strain symmetries). In contrast to the model, innature horizontal and vertical lineations are often observedsimultaneously in transpressional zones [Hudleston et al.,1988; Schultz-Ela and Hudleston, 1991; Melka et al., 1992;Tikoff and Greene, 1997]. This fact underlines the ideas ofpartitioning of the strain in transpressional zones [Tikoff andGreene, 1997] or perhaps to later superposition of simpleshear zones on already existing fabrics [Jones and Tanner,1995].
Appendix A: Strain Parameters
[53] In the transpressional model, computation of thethree-dimensional motion path of rock samples and strainparameters in the transpressive belt are based on thevelocity gradient tensor:
L ¼0 _g 0
0 �_e 0
0 0 _e
0@
1A: ðA1Þ
The pure shear strain rate component _e (corresponding tovertical extrusion and horizontal shortening) and simpleshear rate component _g (corresponding to lateral horizontaldisplacement) are calculated using the respective equations:
_e ¼ ndsina ðA2Þ
_g ¼ ndcosa; ðA3Þ
where v is the relative plate velocity, d is zone width, and ais the angle of convergence (Figure 1). In our model we willconsider an example of constant strain rate during temporaldevelopment of a transpressional zone, so for given periodfinite strain parameters can be obtained from followingfinite strain tensor:
F ¼1 _g
_e cosa 1� exp �_etð Þ½ 0
0 exp �_etð Þ 0
0 0 exp _etð Þ
0@
1A: ðA4Þ
During deformation we trace rock samples moving in thetranspressive zone (Figure 1b). At each position of a rocksample we calculate finite strain geometry, i.e., the principaldirections and the principal stretches by taking theeigenvectors and square roots of eigenvalues, respectively,of ‘‘Cauchy-Green tensor’’ FFT [Truesdell and Toupin,1960], which are further used to calculate the parameters Kand D [Ramsay and Huber, 1983, pp. 201–202].[54] Strain intensity is expressed by the D value:
D ¼ffiffiffiffiffiffiffiffiffiffiffiffiffiffiffiffiffiffiffiffiffiffiffiffiffiffiffiffiffiffiffiffiffiffiffiffiffiffiffiffiffiffiffiffiffiRxy � 1� �2þ Ryz � 1
� �2q: ðA5Þ
The strain symmetry K value is calculated as
K ¼ Rxy � 1
Ryz � 1; ðA6Þ
where Rxy = S1/S2 and Ryz = S2/S3 represent elongationaspect ratios measured on orthogonal axes. Furthermore,when K = 0 a (S) planar fabric is indicated, and for K = 1(LS) a plane strain fabric in which foliation is equally strongas lineation, and K = 1 for a linear fabric without foliation.[55] Vertical displacement produced by the pure shear
component can be expressed by a value
z tð Þ ¼ z0 exp _etð Þ; ðA7Þ
where z0 = z(t0) is the initial vertical distance of a rocksample above a reference level (rigid floor depth) of zeroelevation.
Appendix B: Discrete Partitioning
[56] To evaluate strain parameters in a domain wherediscrete partitioning operate, we can use above definedapproach using following recalculated values of angle ofconvergence a and Rvd
tana0 ¼ tana1� p1ð Þ ðB1Þ
R0vd ¼ Rvd
ffiffiffiffiffiffiffiffiffiffiffiffiffiffiffiffiffiffiffiffiffiffiffiffiffiffiffiffiffiffiffiffiffiffiffiffiffiffiffiffiffiffiffiffiffiffiffiffiffi1� p1ð Þ2 cos2 aþ sin2 a
q; ðB2Þ
where p1 is ratio between fault-accommodated lateraldisplacement and total lateral displacement.
Appendix C: Ductile Partitioning
[57] Ductile partitioning in transpression zone results indecomposition of velocity gradient tensor into two compo-nents for pure shear zone (LPSD) and wrench-dominatedzone (LWDZ) as follows:
LPSD ¼0 0 0
0 �_e 1� p2ð Þ 0
0 0 _e 1� p2ð Þ
0@
1A ðC1Þ
LWDZ ¼0 _g 0
0 �_ep2 0
0 0 _ep2
0@
1A; ðC2Þ
SCHULMANN ET AL.: STRAIN DISTRIBUTION ETG 6 - 13
where p2 is ratio of the width of WDZ and the width of thewhole transpressional zone.
Appendix D: Viscosity Partitioning
[58] Viscosity partitioning assumes different strain ratesor different Rvd, respectively, in two adjacent domains whilethe angle of convergence remains constant. The values ofRvd are
Rm2vd ¼ Rvd
rm
1þ p3 rm � 1� � ðD1Þ
for low-viscosity domain and
Rm1vd ¼ Rvd
1
1þ p3 rm � 1� � ðD2Þ
for high-viscosity domain, where
rm ¼m1m2
; m1 > m2ð Þ
is viscosity contrast.
[59] Acknowledgments. The Czech National Foundation grant 205/98/K004, the Grant Agency of Charles University grant 296/1997/B GEO,the Schweizerische National Fonds and ETH Research credits are gratefullyacknowledged for financial support. We thank Basil Tikoff and an anon-ymous reviewer for very helpful reviews.
ReferencesBrown, M., and G. S. Solar, Shear-zone systems and melts: Feedbackrelations and self- organization in orogenic belts, J. Struct. Geol., 20,211–227, 1998.
Carter, N. L., and M. C. Tsenn, Flow properties of continental lithosphere,Tectonophysics, 136, 27–63, 1987.
Cloetingh, S., J. D. Vanwees, P. A. Vanderbeek, and G. Spadini, Role ofpre-rift Rheology in kinematics of extensional basin formation—Con-straints from thermomechanical models of Mediterranean and intracra-tonic basins, Mar. Pet. Geol., 12, 793–807, 1995.
DeMets, C., R. G. Gordon, D. F. Argus, and S. Stein, Current plate motions,Geophys. J. Int., 101, 425–478, 1990.
Dewey, J. F., Finite plate evolution: Some implications for the evolution ofrock masses at plate margins, Am. J. Sci., 275-A, 260–284, 1975.
Dutton, B. J., Finite strains in transpression zones with no boundary slip,J. Struct. Geol., 19, 1189–1200, 1997.
England, P., Comment on ‘‘Brittle failure in the upper mantle during ex-tension of continental lithosphere’’ by Dale S. Sawyer, J. Geophys. Res.,91, 10,487–10,490, 1986.
Fossen, H., and B. Tikoff, The deformation matrix for simultaneous simpleshearing, pure shearing and volume change, and its application to trans-pression-transtension tectonics, J. Struct. Geol., 15, 413–422, 1993.
Fossen, H., and B. Tikoff, Extended models of transpression and transten-sion, and application to tectonic setting, in Continental Transpressionaland Transtensional Tectonics, edited by R. E. Holdsworth, R. A. Stra-chan, and J. F. Dewey, Geol. Soc. Spec. Publ., 135, 15–33, 1998.
Harland, W., Tectonic transpression in Caledonian Spitzbergen, Geol. Mag.,108, 27–42, 1971.
Hrouda, F., Theoretical-models of magnetic-anisotropy to strain relation-ship revisited, Phys. Earth Planet. Inter., 77, 237–249, 1993.
Hudleston, P. J., D. D. Schultz-Ela, and D. L. Southwick, Transpression inan Archean Greenstone-Belt, northern Minnesota, Can. J. Earth Sci., 25,1060–1068, 1988.
Jezek, J., K. Schulmann, and A. B. Thompson, Modelling of strain parti-tioning in transpression zones, in Proceedings of the fourth annual con-ference of the International Association for Mathematical Geology, editedby A. Buccianti, G. Nardi, and R. Potenza, pp. 827–832, De Frede,Naples, Italy, 1998.
Jones, R. R., and P. W. G. Tanner, Strain partitioning in transpression zones,J. Struct. Geol., 17, 793–802, 1995.
Jones, R. R., R. E. Holdsworth, and W. Bailey, Lateral extrusion in trans-pression zones: The importance of boundary conditions, J. Struct. Geol.,19, 1201–1217, 1997.
Kirkwood, D., Strain partitioning and progressive deformation history in atranspressive belt, northern Appalachians, Tectonophysics, 241, 15–34,1995.
Lisle, R., and J. Savage, Factors influencing Rock Competence - Data Froma Swedish Deformed Conglomerate, Geol. Foren. Stockholm Forh., 104,219–224, 1982.
Luyendyk, B. P., M. J. Kamerling, R. R. Terres, and J. S. Hornafius, Simpleshear of southern California during Neogene time suggested by paleo-magnetic declinations, J. Geophys. Res., 90, 2454–2466, 1985.
Martelat, J. E., C. Nicollet, J. M. Lardeaux, G. Vidal, and R. Rakotondrazafy,Lithospheric tectonic structures developed under high-grade metamorph-ism in the southern part of Madagascar, Geodin. Acta, 10, 94–114, 1997.
Martelat, J. E., J. M. Lardeaux, C. Nicollet, and R. Rakotondrazafy, Strainpattern and late Precambrian deformation history in southern Madagas-car, Precambrian Res., 102, 1–20, 2000.
McKenzie, D., and R. L. Parker, The North Pacific: An example of tec-tonics on a sphere, Nature, 216, 1276–1280, 1967.
Melka, R., K. Schulmann, B. Schulmannova, F. Hrouda, and M. Lobko-wicz, The evolution of perpendicular linear fabrics in synkinematicallyemplaced tourmaline granite (central Moravia-Bohemian Massif ),J. Struct. Geol., 14, 605–620, 1992.
Newman, J., W. M. Lamb, M. R. Drury, and R. L. M. Vissers, Deformationprocesses in a peridotite shear zone: Reaction-softening by an H2O-defi-cient, continuous net transfer reaction, Tectonophysics, 303, 193–222,1999.
Nyman, M. W., R. D. Law, and S. S. Morgan, Conditions of contact-metamorphism, Papoose Flat Pluton, eastern California, USA-Implica-tions for cooling and strain histories, J. Metamorph. Geol., 13, 627–643, 1995.
Parry, M., P. Stipska, K. Schulmann, F. Hrouda, J. Jezek, and A. Kroener,Tonalite sill emplacement at an oblique plate boundary; northeasternmargin of the Bohemian Massif, Tectonophysics, 280, 61–81, 1997.
Pfiffner, O. A., and J. G. Ramsay, Constraints on geological strain rates:Arguments from finite strain states of naturally deformed rocks, J. Geo-phys. Res., 87, 311–321, 1982.
Pili, E., Y. Ricard, J. M. Lardeaux, and S. M. F. Sheppard, Lithospheric shearzones and mantle-crust connections, Tectonophysics, 280, 15–29, 1997.
Pinet, N., and P. R. Cobbold, Experimental insights into the partitioning ofmotion within zones of oblique subduction, Tectonophysics, 206, 371–388, 1992.
Rajlich, P., Strain and tectonic styles related to Variscan transpression andtranstension in the Moravo-Silesian Culmian basin Bohemian Massif,Czechoslovakia, Tectonophysics, 174, 351–367, 1990.
Rajlich, P., K. Schulmann, and J. Synek, Strain analysis on conglomeratesfrom the central Bohemian shear zone, Krystalinikum, 19, 119–134,1988.
Ramsay, J. G., and M. I. Huber, The Techniques of Modern StructuralGeology, vol. 1, Strain Analysis, Academic, San Diego, Calif., 1983.
Ranalli, G., and D. C. Murphy, Rheological stratification of the lithosphere,Tectonophysics, 132, 281–295, 1987.
Robin, P. Y., and A. R. Cruden, Strain and vorticity patterns in ideallyductile transpression zones, J. Struct. Geol., 16, 447–466, 1994.
Royden, L., Coupling and decoupling of crust and mantle in convergentorogens: Implications for strain partitioning in the crust, J. Geophys. Res.,101, 17,679–17,705, 1996.
Sanderson, D. J., and W. R. D. Marchini, Transpression, J. Struct. Geol, 6,449–458, 1984.
Schulmann, K., Fabric and kinematic study of the bites orthogneiss (south-western Moravia)—Result of large-scale northeastward shearing parallelto the Moldanubian Moravian boundary, Tectonophysics, 177, 229–244,1990.
Schulmann, K., R. Melka, M. Lobkowicz, P. Ledru, J. M. Lardeaux, andA. Autran, Contrasting styles of deformation during progressive nappestacking at the southeastern margin of the Bohemian Massif (ThayaDome), J. Struct. Geol., 16, 355–370, 1994.
Schultz-Ela, D. D., and P. J. Hudleston, Strain in an Archean greenstone-belt of Minnesota, Tectonophysics, 190, 233–268, 1991.
Stuwe, K., and T. D. Barr, On uplift and exhumation during convergence,Tectonics, 17, 80–88, 1998.
Teyssier, C., and B. Tikoff, Study of strike-slip partitioning in Californiaresolves San Andreas discrepancy and constrains lithospheric structure,Geol. Soc. Am. Abstr. Programs, 29, 347, 1997.
Teyssier, C., B. Tikoff, and M. Markley, Oblique plate motion and con-tinental tectonics, Geology, 23, 447–450, 1995.
Thompson, A. B., K. Schulmann, J. Jezek, and V. Tolar, Thermally softenedcontinental extensional zones: Arcs and rifts as precursors to thickenedorogenic zones, Tectonophysics, 332, 115–141, 2001.
ETG 6 - 14 SCHULMANN ET AL.: STRAIN DISTRIBUTION
Tikoff, B., and D. Greene, Stretching lineations in transpressional shearzones: An example from the Sierra Nevada Batholith California, J. Struct.Geol., 19, 29–39, 1997.
Tikoff, B., and C. Teyssier, Strain modeling of displacement-field partition-ing in transpression orogens, J. Struct. Geol., 16, 1575–1588, 1994.
Tommasi, A., and A. Vauchez, Continental-scale rheological heterogene-ities and complex intraplate tectono-metamorphic patterns: Insights froma case study and numerical models, Tectonophysics, 279, 327–350,1997.
Truesdell, C. A., and R. A. Toupin, The classic field theory, in Encyclope-dia of Physics, vol. III, Principles of Classical Mechanics and FieldTheory, edited by S. Flugge, pp. 226–793, Springer-Verlag, New York,1960.
Vauchez, A., and A. Nicolas, Mountain building-Strike-parallel motion andmantle anisotropy, Tectonophysics, 185, 183–201, 1991.
Vauchez, A., A. Tommasi, and G. Barruol, Rheological heterogeneity, me-chanical anisotropy and deformation of the continental lithosphere, Tec-tonophysics, 296, 61–86, 1998.
Walcott, D., Neogene tectonics and kinematics of western North America,Tectonics, 12, 326–333, 1993.
Walcott, R. I., Geodetic strain and the deformational history of the NorthIsland of New Zealand during the Late Cainozoic, Philos. Trans. R. Soc.London, Ser. A, 321, 163–181, 1987.
White, J. C., and C. K. Mawer, Deep-crustal deformation textures alongmegathrusts from Newfoundland and Ontario—Implications for micro-structural preservation, strain rates, and strength of the lithosphere, Can.J. Earth Sci., 29, 328–337, 1992.
Wood, D. S., Current views of the development of slaty cleavage, Annu.Rev. Earth Planet. Sci., 2, 369–401, 1974.
�����������������������J. Jezek, Institute of Applied Mathematics and Computer Science,
Faculty of Science, Charles University, Albertov 6, 128 43 Prague, CzechRepublic. ( [email protected])O. Lexa and K. Schulmann, Institute of Petrology and Structural Geology,
Faculty of Science, Charles University, Albertov 6, 128 43 Prague, CzechRepublic. ([email protected]; [email protected])A. B. Thompson, Institut fur Mineralogie und Petrographie, ETH
Zentrum, NO E 64, CH-8092 Zurich, Switzerland. ([email protected])
SCHULMANN ET AL.: STRAIN DISTRIBUTION ETG 6 - 15


