Embed Size (px)
Citation preview
Survival of Host-Associated Bacteroidales Cells and Their Relationshipwith Enterococcus spp., Campylobacter jejuni, Salmonella entericaSerovar Typhimurium, and Adenovirus in Freshwater Microcosms asMeasured by Propidium Monoazide-Quantitative PCR
Sungwoo Baea* and Stefan Wuertza,b
Department of Civil and Environmental Engineering, University of California, Davis, Davis, California, USA,a and Singapore Centre on Environmental Life SciencesEngineering (SCELSE), School of Biological Sciences, and School of Civil and Environmental Engineering, Nanyang Technological University, Singaporeb
The ideal host-associated genetic fecal marker would be capable of predicting the presence of specific pathogens of concern.Flowthrough freshwater microcosms containing mixed feces and inocula of the pathogens Campylobacter jejuni, Salmonellaenterica serovar Typhimurium, and adenovirus were placed at ambient temperature in the presence and absence of diurnal sun-light. The total Enterococcus DNA increased during the early periods (23 h) under sunlight exposure, even though cultivable En-terococcus and DNA in intact cells, as measured by propidium monoazide (PMA), decreased with first-order kinetics during theentire period. We found a significant difference in the decay of host-associated Bacteroidales cells between sunlight exposure anddark conditions (P value < 0.05), whereas the persistence of host-associated Bacteroidales DNA was comparable. The 2-log re-duction times of adenovirus were 72 h for sunlight exposure and 99 h for dark conditions with similar decay rate constants (Pvalue � 0.13). The persistences of fecal Bacteroidales cells and Campylobacter cells exposed to sunlight were similar, and host-associated Bacteroidales DNA and waterborne pathogen DNA were degraded at comparable rates (P values > 0.05). Overall, theratio of quantitative PCR (qPCR) cycle threshold (CT) values with and without PMA treatment was indicative of the time elapsedsince inoculation of the microcosm with (i) fecal material from different animal sources based on host-associated Bacteroidalesand (ii) pure cultures of bacterial pathogens. The use of both PMA-qPCR and qPCR may yield more realistic information aboutrecent sources of fecal contamination and result in improved prediction of waterborne pathogens and assessment of health risk.
The threat to human health posed by fecal contamination ofsurface waters is usually estimated by measuring fecal indica-
tor bacteria (FIB) such as total and fecal coliforms, Escherichia coli,and Enterococcus. However, traditional fecal indicators to monitorrecreational water quality are often not associated with healthrisks in ambient water where nonpoint sources are dominant fecalcontributors, and these results suggest a need for alternative indi-cators of water quality (47). Furthermore, FIB are inadequate toidentify the source of fecal pollution because they are observed inboth warm- and cold-blooded animal feces (30, 35). Microbialsource tracking (MST) can discriminate between human and non-human fecal contamination such as cow, dog, and pig in waterusing microbiological or chemical traits of source identifiers (19,22). Bacteroidales have been proposed as an alternative fecal indi-cator as well as source identifier because they are abundant in thegastrointestinal tract and genetic markers based on 16S rRNAhave host-associated distributions (7, 13, 14, 17, 18, 25, 30, 32).The persistence of Bacteroidales was investigated by controllingvariables such as the presence or absence of sunlight, temperature,and the use of filtered versus unfiltered water (3, 30, 36, 48, 50).According to these previous studies, the DNA of fecal Bacteroi-dales was detected by quantitative PCR (qPCR) for days or evenweeks and the persistence of Bacteroidales genetic markers wasinfluenced by incubation temperature, the effect of artificial sun-light, and the presence of indigenous microorganisms (2, 8, 26).However, little is known regarding the persistence of host-associated Bacteroidales cells and their genetic markers in freshwa-ter. In two studies, Bacteroidales RNA was measured as an equiv-alent of whole cells using fluorescent in situ hybridization (FISH)
(29, 42), but it is difficult to compare FISH results with qPCRresults because the number of rRNA gene operons in fecal Bacte-roidales is unknown. Furthermore, the relationship of Bacteroi-dales with FIB or waterborne pathogens needs to be established.
Previous studies have suggested PCR with propidium mono-azide (PCR-PMA) to discriminate intact from dead cells as ameans of reducing the PCR signal from DNA originating fromdead bacterial cells (25). PMA in combination with PCR or qPCRhas been successfully applied to identify intact pathogens in a sim-ple matrix (21, 23) and in environmental samples (2, 5, 38, 42).Basically, PMA is a DNA-intercalating dye with an azide groupand will penetrate only the membrane of dead cells with compro-mised cell walls/membrane and then bind their DNA or attach tofree DNA. Upon exposure to bright visible light, the photoactiveazide group on the dye is converted to a nitrene radical, which isreadily attached to a carbon atom of the DNA through a C-Hinsertion reaction, resulting in an inhibition of amplification ofDNA from dead cells or free DNA. Residual unbounded PMA is
Received 16 April 2011 Accepted 9 November 2011
Published ahead of print 2 December 2011
Address correspondence to Stefan Wuertz, [email protected].
* Present address: The University of Texas, Austin, Department of Civil,Architectural, and Environmental Engineering, Austin, Texas, USA.
Supplemental material for this article may be found at http://aem.asm.org/.
Copyright © 2012, American Society for Microbiology. All Rights Reserved.
doi:10.1128/AEM.05157-11
922 aem.asm.org 0099-2240/12/$12.00 Applied and Environmental Microbiology p. 922–932
simultaneously transformed as hydroxylamine, which is no longercapable of covalently binding to DNA. Recently, an optimizedPMA-qPCR method successfully discriminated between intactand dead fecally derived Bacteroidales cells (2).
Cultivation-dependent methods to measure FIB require 18- to96-h incubation periods, during which human exposure to fecalpathogens can occur. A rapid method such as qPCR could im-prove the protection of public health by reducing the time be-tween exposure measurement and management decisions, poten-tially providing same-day results (24). In addition, recentepidemiological studies suggested that rapid qPCR methods canpredict swimming-associated gastrointestinal illness at freshwaterbeaches impacted by publicly owned treatment works (POTWs)(44, 45). On the other hand, there is currently no knowledge aboutthe relationship between the DNA of fecal genetic markers andhealth risks at freshwater beaches that receive non-point sourcepollutants.
The objectives of this study were, therefore, (i) to evaluate thepersistence of FIB measured by both cultivation and molecularmethods; (ii) to determine the decay functions of host-associatedBacteroidales cells and their DNA as well as those of the water-borne pathogens Campylobacter jejuni, Salmonella, and adenovi-rus in freshwater using PMA-qPCR and qPCR; and (iii) to com-pare the decay profiles and slopes and determine the predictiverelationship between the ratio of cycle threshold (CT) values forboth qPCR methods and the time elapsed since fecal contamina-tion occurred.
MATERIALS AND METHODSFecal sample collection. Individual fecal samples were collected with asterile utensil placed in a sterile 50-ml tube and kept on ice until used asinoculum. Fresh human feces was collected within 24 h from six healthyadults, and animal fecal samples were obtained on the day of inoculationfrom a cattle farm (8 samples; Winters, CA) and a dog park (12 samples;Davis, CA). Each fecal sample was immediately transported on ice to thelaboratory. Before mixing fecal samples, each fecal sample was seriallydiluted and then analyzed by qPCR without DNA extraction (13) to con-firm the specificity of each host-associated Bacteroidales assay for the cor-responding host fecal samples.
Preparation of inocula. Salmonella enterica serovar Typhimurium(ATCC 13311) and Campylobacter jejuni (ATCC 43431) were purchasedfrom the American Type Culture Collection (ATCC) and used as spikes inthe microcosm study and to generate plasmid quantification standardsand optimize qPCR performance. Also, Enterococcus faecalis (ATCC
29212) was purchased from ATCC and grown in brain heart infusionbroth for 24 h at 37°C for the preparation of plasmid standards and opti-mization of qPCR. Adenovirus (VR-680) from ATCC was used as inocu-lum without further propagation. Salmonella Typhimurium (ATCC13311) was incubated overnight in LB broth at 37°C, and Campylobacterjejuni (ATCC 43431) was incubated in Trypticase soy broth for 36 h at37°C under microaerophilic conditions in GasPak anaerobic jars (BectonDickinson Microbiology Systems, Cockeysville, MD) using CampyPackhydrogen plus CO2 (BD, Franklin Lakes, NJ).
Cell densities of Salmonella Typhimurium and Campylobacter jejuniwere measured with the Live/Dead BacLight bacterial viability kit (Molec-ular Probes Inc., Eugene, OR). The cells were stained by adding 1.5 �l eachof the provided fluorescent stains SYTO 9 and propidium iodide. SYTO 9stains all bacterial cells and fluoresces green, whereas propidium iodidepenetrates only bacterial cells with compromised membranes and fluo-resces red. Upon mixing and a 10-min incubation in the dark, a 10-�lsample was enumerated three times with a hemacytometer using anAxioskop2 Plus epifluorescence microscope (Zeiss, Thornwood, NY)equipped with two filter sets (fluorescein isothiocyante [FITC] and TexasRed).
Establishment of microcosms. A ready-to-use Spectra/Por 7 mem-brane dialysis tubing (molecular weight cutoff [MWCO], 50,000; 34-mmflat width; Spectrum Laboratories, Inc., Rancho Dominguez, CA) was cutinto segments of 12 cm in length. Four grams of each fresh feces was mixedwith 2.5 liters groundwater obtained from the Aqua Toxicology Labora-tory, UC Davis. In addition, 2 ml each of approximately 107 cells of Sal-monella Typhimurium and Campylobacter jejuni cell suspensions and 1ml of adenovirus were inoculated. Half of the dialysis tubes were placedinside a 6.4-cm-long polyvinyl chloride (PVC) pipe protected from sun-light. The remainder of the dialysis tubes were exposed to sunlight andimmersed by attaching them to a glass ball without the PVC pipe to coun-teract the buoyancy. Triplicates of the dialysis tubes for both exposure andnonexposure conditions were randomly sampled every day for 3 days andevery other day for 6 days.
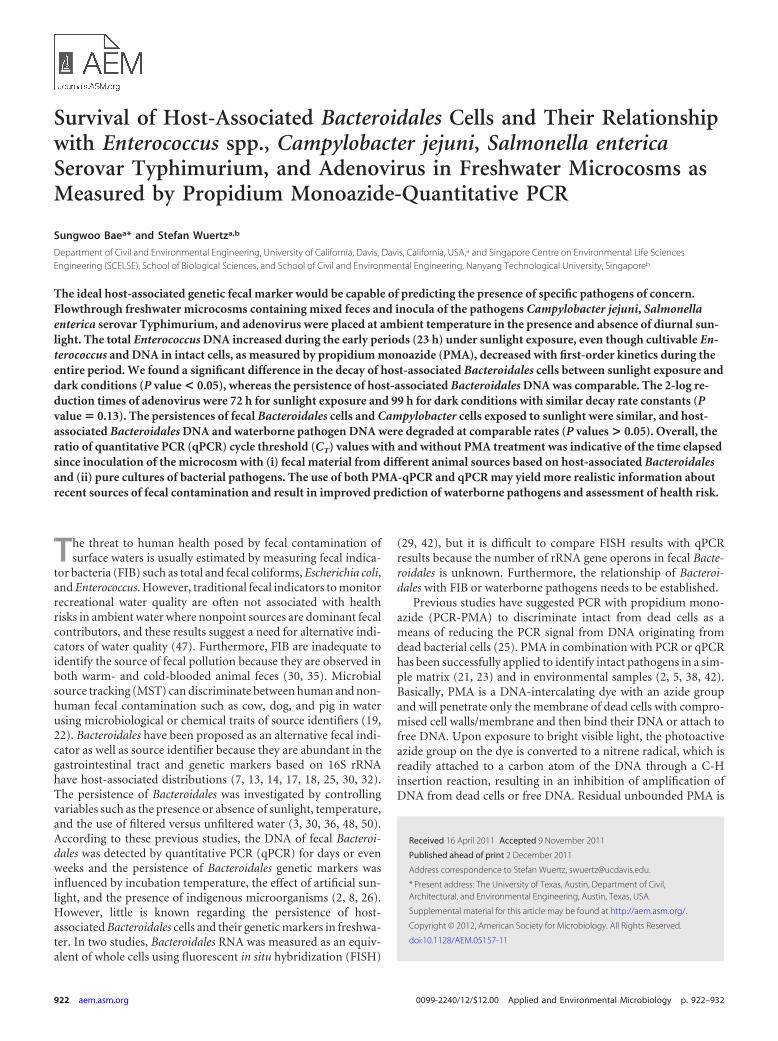
The microcosm experiments were conducted outdoors in the AquaToxicology Laboratory at UC Davis. All microcosms were placed in arectangular tank with dimensions (length, width, and depth) of 80 cm by45 cm by 30 cm, providing ambient conditions such as diurnal cycle,temperature fluctuation, the presence of predators, and so forth (Fig. 1).Fresh groundwater was continuously pumped into the tank at a flow rateof 1 gallon per min (5.45 m3 day�1). Temperature, salinity, conductivity,pH, and dissolved oxygen concentration were measured using the probesYSI 63 and YSI 550A (YSI, Yellow Springs, OH), respectively. To confirmthe presence or absence of any host-associated Bacteroidales prior to add-ing feces to the microcosm experiments, DNA was extracted from a
FIG 1 Schematic diagram of the experimental setup for microcosm studies. Permeable dialysis tubes were either placed inside PVC pipe for protection fromsunlight or exposed to sunlight. Triplicate dialysis tubes from sunlight exposure and nonexposure conditions were randomly sampled for further analysis.
Survival of Host-Associated Bacteroidales Cells
February 2012 Volume 78 Number 4 aem.asm.org 923
100-ml freshwater sample using the Ultraclean Water DNA isolation kit(Mo Bio Laboratories Inc., Carlsbad, CA).
Enumeration of cultivable fecal indicators. The cultivable fecal indi-cators E. coli and Enterococcus (cENT) were enumerated using membranefilter techniques (40, 41). Preliminary experiments were conducted todetermine the background concentrations of E. coli and Enterococcus in a100-ml freshwater sample in the Aqua Toxicology Laboratory. For themicrocosm study, 10 ml of feces samples from dialysis tubes was dilutedwith a sterile buffer solution and filtered through a 47-mm-diameter ster-ile grid-marked membrane with an 0.45-�m pore size (Millipore Corp.,Bedford, MA). The filters were subsequently placed on mEI agar and MIagar plates. Triplicate plates from three dialysis tubes were then incubatedat 35°C for 24 h and at 41°C for 24 h for E. coli and Enterococcus, respec-tively.
PMA treatment and DNA extraction. PMA (Biotium Inc., Hayward,CA) was dissolved in 20% dimethyl sulfoxide (DMSO) to create a stockconcentration (1 mg ml�1) and stored at �20°C in the dark. Exposuretime and PMA concentration were in accordance with previous optimi-zation experiments for Bacteroidales spp. (2). PMA was added to samplesat a final concentration of 100 �M. Following a 5-min incubation in thedark, samples were exposed to light for 10 min with a 600-W halogen lightsource at a distance of 20 cm from the light source. Microcentrifuge tubeswere placed on ice prior to light exposure to avoid excessive heating.
A 400-�l sample was extracted using the FastDNA spin kit for soil(Biomedicals, Solon, OH). Cell lysis was achieved by bead beating using abead mill Minibead beater (Biospec Products Inc., Bartlesville, OK) at2,400 rpm for 20 s. Cell debris was removed by centrifugation for 5 min at14,000 � g before adding 250 �l of PPS solution (provided with the kit).DNA was eluted twice with 80 �l DES buffer (provided in the kit). Oth-erwise, DNA extraction was performed according to the manufacturer’sinstructions. Also, viral DNA was extracted from dialysis tubes using aQIAamp MinElute Virus Spin kit (Qiagen, Valencia CA) as specified bythe manufacturer.
Quantification standards for real-time PCR. To create Campylobac-ter, Salmonella, and Enterococcus qPCR standards, genomic DNA was ex-tracted from a pure culture using a DNeasy Blood & Tissue kit (Qiagen,Valencia CA) and quantified by a NanoDrop ND-1000 (NanoDrop Tech-nologies, Wilmington, DE). Target sequences were amplified by PCR foreach organism (see Table S1 in the supplemental material). The size ofresultant amplicons was confirmed by gel electrophoresis prior to cloningwith TOPO TA cloning vector (Invitrogen, Carlsbad, CA). Plasmids wereextracted with a QIAprep Spin MiniPrep kit (Qiagen, Valencia, CA), andthe concentration of each plasmid was measured by a NanoDrop ND-1000 (NanoDrop Technologies, Wilmington, DE). Optimal performanceof qPCR was achieved by selecting the primer and probe concentrationswith the lowest CT and highest �Rn for a fixed amount of target templates.Assay limits of detection (ALOD) were determined as described previously(13, 27, 31) according to U.S. EPA recommendations for determiningmethod detection limits (40 CFR 136, appendix B). The limit of detection(LOD) was calculated with the following equation:
LOD � �ALOD
VT� �Vel
Vex�
Here, V (ml) represents the volumes of sample that was extracted (Vex), ofelute from nucleic acid extraction (Vel), and of nucleic acid templateadded to the PCR (VT). ALOD indicates assay limit of detection of eachtarget DNA on the assumption of 100% extraction efficiency.
Real-time PCR amplification of Bacteroidales, Salmonella, Campy-lobacter, and adenovirus. Amplification and detection were carried outin 96-well plates in an ABI Prism 7700 Sequence Detection system (Ap-plied Biosystems, Foster City, CA). Each 25-�l PCR mixture contained12.5 �l of qPCR MasterMix Plus (Eurogentec, San Diego, CA), 10 �l ofDNA template, and optimal primer-probe concentrations (Table 1). For anegative control, DNA-free water was used instead of templates. The ther-mal protocol for host-associated Bacteroidales, Enterococcus, and water-
borne pathogens consisted of 2 min at 50°C, followed by 10 min at 95°Cand 40 cycles of 15 s at 95°C and 60 s at 60°C. Each qPCR experiment wasconducted in duplicate on DNA template from three dialysis tubes. Aserial dilution approach was employed for each duplicate, and then the CT
values were plotted against log of the dilution to estimate the effects ofpotentially present PCR inhibitors.
Decay rate calculations and statistical analysis. We employed twodifferent exponential decay models proposed by previous studies to cal-culate decay rates as well as T99 (time for 2-log reduction) (3). First, thedecay rates were calculated by a simple first-order decay model �N �N0 � e�k1t�, where N is the number of gene copies or number of bacteriaml�1 at time t, N0 is the initial concentration, and k1 is the decay rateconstant. A modification of this model has a lag period before the begin-ning of logarithmic decay where the population increases or persists tosome extent. The logarithmic decay in this situation can be modeled byN � N0 � e�k1�t �t1�, where t1 is time at end of lag period, t is time at anypoint after lag period t1, and the other terms are as previously noted. Also,a biphasic model was used to fit the experimental data of host-associatedBacteroidales cells to characterize two subpopulations with different decayrates: N � N0 � e�k1t � N1 � e�k2t, where k1 and k2 are the exponentialdecay rate for N0 and N1, respectively.
Nonlinear regression analysis and fitting of persistence data were per-formed using Origin Pro 8. A P value was determined by computing theF-test provided in Origin Pro 8 to statistically analyze whether two decaymodels were significantly different from each other. Furthermore, wecompared the slopes (decay rates) by testing the null hypothesis that theslopes were all identical using GraphPad Prism version 5.
Calculation of the ratio of CT values with and without PMA. Theratio was calculated as described by Bae and Wuertz (2) based on theequation
Ratio �CT(PMA)
CT(cycle) � CT(without PMA)
where CT(PMA) � CT number in PMA treatment, CT(cycle) � total numberof cycles of PCR amplification (e.g., 40 cycles), and CT(without PMA) � CT
number without PMA treatment. The ratio indicates the age of fecal con-tamination by measurement of threshold values obtained from qPCRruns.
RESULTS
A microcosm study was conducted in the outdoor Aqua Toxicol-ogy Laboratory at UC Davis. The average pH, temperature, anddissolved oxygen values throughout the study were 7.3 mg liter�1,22.4°C, and 8.7 mg liter�1, respectively. Background concentra-tions of cultivable E. coli and Enterococcus (cENT) were not de-tected. In contrast, the universal fecal Bacteroidales gene marker(BacUni-UCD) was detected at concentrations of 3.4 � 102 genecopies (gc)/ml in freshwater prior to inoculation, whereashuman-, cow-, and dog-associated Bacteroidales were not found.
Survival of fecal indicator bacteria in freshwater. Fecal indi-cator bacteria such as E. coli and Enterococcus were enumerated bycultivation methods and, for Enterococcus alone, using quantita-tive PCR methods to determine the persistence of both cells andDNA in freshwater. Regrowth of cultivable E. coli was observedunder both sunlight exposure and dark conditions, and all num-bers declined after 45 h for diurnal sunlight exposure and after 70h for dark conditions, respectively (Fig. 2A and B). CultivableEnterococcus (cENT) experienced a lag period (23 h) and subse-quently followed a log-linear inactivation phase under dark con-ditions (Fig. 2B). Interestingly, the number of Enterococcus 23SrRNA gene copies from total Enterococcus DNA (tENT) exposedto sunlight increased initially even though Enterococcus genesfrom intact cells (vENT) followed first-order decay as measured
Bae and Wuertz
924 aem.asm.org Applied and Environmental Microbiology
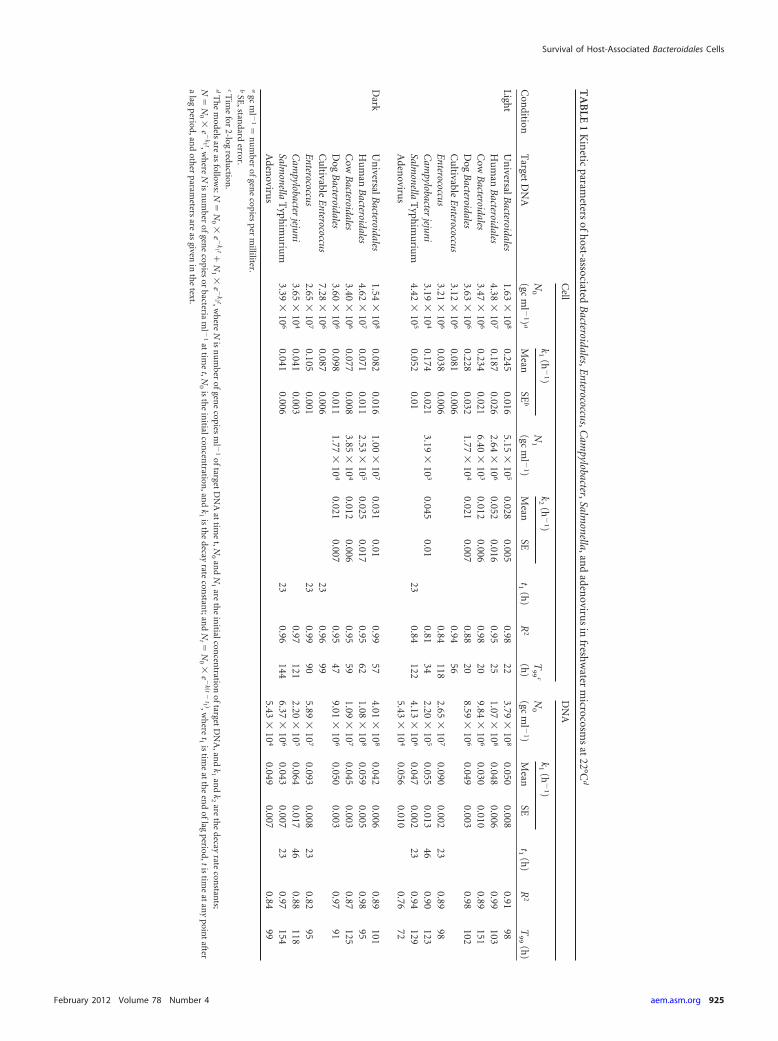
TA
BLE
1K
inetic
parameters
ofh
ost-associatedB
acteroidales,Enterococcus,C
ampylobacter,Salm
onella,and
adenoviru
sin
freshw
aterm
icrocosms
at22°C
d
Con
ditionT
argetD
NA
Cell
DN
A
N0
(gcm
l �1)
a
k1
(h�
1)N
1
(gcm
l �1)
k2
(h�
1)
t1(h
)R
2
T9
9c
(h)
N0
(gcm
l �1)
k1
(h�
1)
t1(h
)R
2T
99
(h)
Mean
SEb
Mean
SEM
eanSE
Light
Un
iversalBacteroidales
1.63�
108
0.2450.016
5.15�
105
0.0280.005
0.9822
3.79�
108
0.0500.008
0.9198
Hu
man
Bacteroidales
4.38�
107
0.1870.026
2.64�
106
0.0520.016
0.9525
1.07�
108
0.0480.006
0.99103
Cow
Bacteroidales
3.47�
106
0.2340.021
6.40�
103
0.0120.006
0.9820
9.84�
106
0.0300.010
0.89151
Dog
Bacteroidales
3.63�
106
0.2280.032
1.77�
104
0.0210.007
0.8820
8.59�
106
0.0490.003
0.98102
Cu
ltivableE
nterococcus3.12
�10
60.081
0.0060.94
56E
nterococcus3.21
�10
60.038
0.0060.84
1182.65
�10
70.090
0.00223
0.8998
Cam
pylobacterjejuni
3.19�
104
0.1740.021
3.19�
103
0.0450.01
0.8134
2.20�
105
0.0550.013
460.90
123Salm
onellaT
yphim
uriu
m4.42
�10
50.052
0.0123
0.84122
4.13�
106
0.0470.002
230.94
129A
denoviru
s5.43
�10
40.056
0.0100.76
72
Dark
Un
iversalBacteroidales
1.54�
108
0.0820.016
1.00�
107
0.0310.01
0.9957
4.01�
108
0.0420.006
0.89101
Hu
man
Bacteroidales
4.62�
107
0.0710.011
2.53�
105
0.0250.017
0.9562
1.08�
108
0.0590.005
0.9895
Cow
Bacteroidales
3.40�
106
0.0770.008
3.85�
104
0.0120.006
0.9559
1.09�
107
0.0450.003
0.87125
Dog
Bacteroidales
3.60�
106
0.0980.011
1.77�
104
0.0210.007
0.9547
9.01�
106
0.0500.003
0.9791
Cu
ltivableE
nterococcus7.28
�10
60.087
0.00623
0.9699
Enterococcus
2.65�
107
0.1050.001
230.99
905.89
�10
70.093
0.00823
0.8295
Cam
pylobacterjejuni
3.65�
104
0.0410.003
0.97121
2.20�
105
0.0640.017
460.88
118Salm
onellaT
yphim
uriu
m3.39
�10
60.041
0.00623
0.96144
6.37�
106
0.0430.007
230.97
154A
denoviru
s5.43
�10
40.049
0.0070.84
99a
gcm
l �1
�n
um
berofgen
ecopies
perm
illiliter.b
SE,stan
darderror.
cTim
efor
2-logredu
ction.
dT
he
models
areas
follows:N
�N
0�
e�
k1 t�N
1�
e�
k2 t,wh
ereN
isn
um
berofgen
ecopies
ml �
1oftarget
DN
Aat
time
t,N0
and
N1
areth
ein
itialconcen
trationoftarget
DN
A,an
dk
1an
dk
2are
the
decayrate
constan
ts;N
�N
0�
e�
k1 t,wh
ereN
isn
um
berofgen
ecopies
orbacteria
ml �
1at
time
t,N0
isth
ein
itialconcen
tration,an
dk
1is
the
decayrate
constan
t;and
Nt �
N0
�e
�k�t
�t1 �,w
here
t1is
time
atth
een
doflag
period,tistim
eat
any
point
aftera
lagperiod,an
doth
erparam
etersare
asgiven
inth
etext.
Survival of Host-Associated Bacteroidales Cells
February 2012 Volume 78 Number 4 aem.asm.org 925
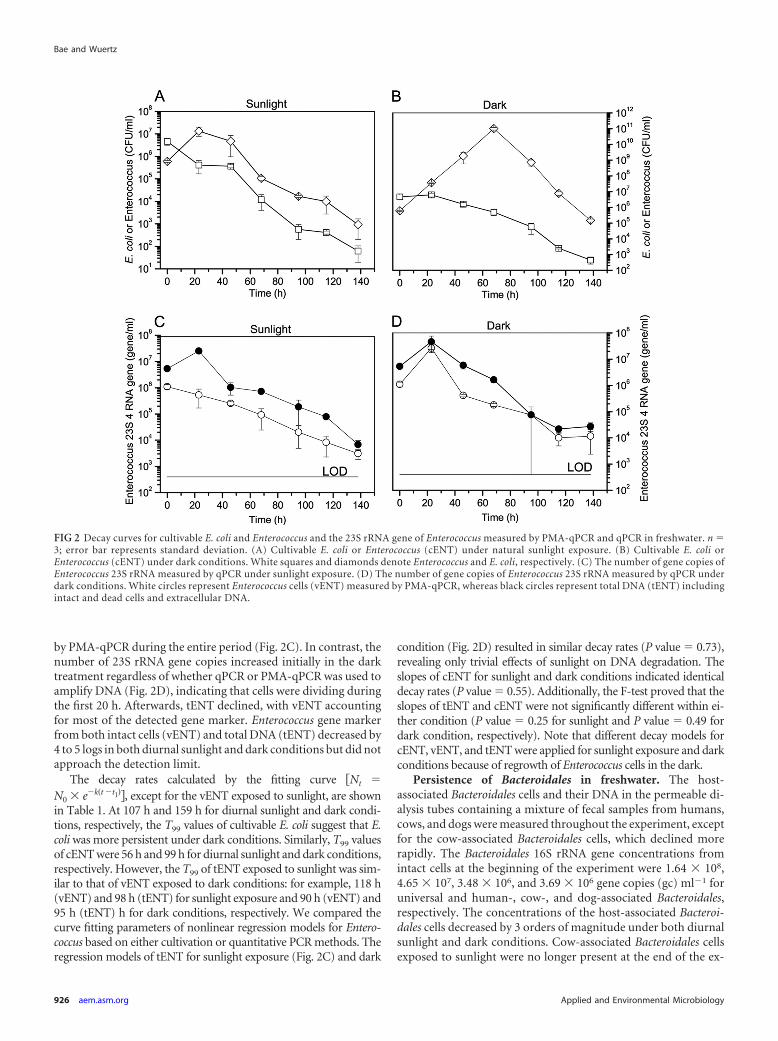
by PMA-qPCR during the entire period (Fig. 2C). In contrast, thenumber of 23S rRNA gene copies increased initially in the darktreatment regardless of whether qPCR or PMA-qPCR was used toamplify DNA (Fig. 2D), indicating that cells were dividing duringthe first 20 h. Afterwards, tENT declined, with vENT accountingfor most of the detected gene marker. Enterococcus gene markerfrom both intact cells (vENT) and total DNA (tENT) decreased by4 to 5 logs in both diurnal sunlight and dark conditions but did notapproach the detection limit.
The decay rates calculated by the fitting curve �Nt �
N0 � e�k�t �t1��, except for the vENT exposed to sunlight, are shownin Table 1. At 107 h and 159 h for diurnal sunlight and dark condi-tions, respectively, the T99 values of cultivable E. coli suggest that E.coli was more persistent under dark conditions. Similarly, T99 valuesof cENT were 56 h and 99 h for diurnal sunlight and dark conditions,respectively. However, the T99 of tENT exposed to sunlight was sim-ilar to that of vENT exposed to dark conditions: for example, 118 h(vENT) and 98 h (tENT) for sunlight exposure and 90 h (vENT) and95 h (tENT) h for dark conditions, respectively. We compared thecurve fitting parameters of nonlinear regression models for Entero-coccus based on either cultivation or quantitative PCR methods. Theregression models of tENT for sunlight exposure (Fig. 2C) and dark
condition (Fig. 2D) resulted in similar decay rates (P value � 0.73),revealing only trivial effects of sunlight on DNA degradation. Theslopes of cENT for sunlight and dark conditions indicated identicaldecay rates (P value � 0.55). Additionally, the F-test proved that theslopes of tENT and cENT were not significantly different within ei-ther condition (P value � 0.25 for sunlight and P value � 0.49 fordark condition, respectively). Note that different decay models forcENT, vENT, and tENT were applied for sunlight exposure and darkconditions because of regrowth of Enterococcus cells in the dark.
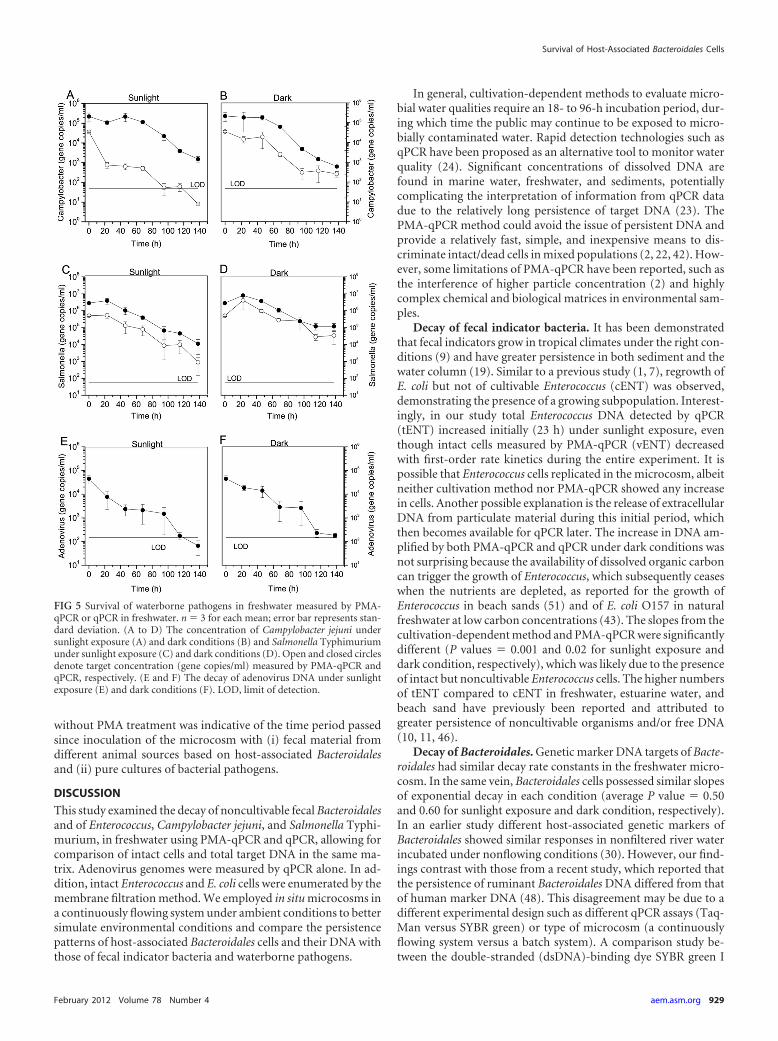
Persistence of Bacteroidales in freshwater. The host-associated Bacteroidales cells and their DNA in the permeable di-alysis tubes containing a mixture of fecal samples from humans,cows, and dogs were measured throughout the experiment, exceptfor the cow-associated Bacteroidales cells, which declined morerapidly. The Bacteroidales 16S rRNA gene concentrations fromintact cells at the beginning of the experiment were 1.64 � 108,4.65 � 107, 3.48 � 106, and 3.69 � 106 gene copies (gc) ml�1 foruniversal and human-, cow-, and dog-associated Bacteroidales,respectively. The concentrations of the host-associated Bacteroi-dales cells decreased by 3 orders of magnitude under both diurnalsunlight and dark conditions. Cow-associated Bacteroidales cellsexposed to sunlight were no longer present at the end of the ex-
FIG 2 Decay curves for cultivable E. coli and Enterococcus and the 23S rRNA gene of Enterococcus measured by PMA-qPCR and qPCR in freshwater. n �3; error bar represents standard deviation. (A) Cultivable E. coli or Enterococcus (cENT) under natural sunlight exposure. (B) Cultivable E. coli orEnterococcus (cENT) under dark conditions. White squares and diamonds denote Enterococcus and E. coli, respectively. (C) The number of gene copies ofEnterococcus 23S rRNA measured by qPCR under sunlight exposure. (D) The number of gene copies of Enterococcus 23S rRNA measured by qPCR underdark conditions. White circles represent Enterococcus cells (vENT) measured by PMA-qPCR, whereas black circles represent total DNA (tENT) includingintact and dead cells and extracellular DNA.
Bae and Wuertz
926 aem.asm.org Applied and Environmental Microbiology
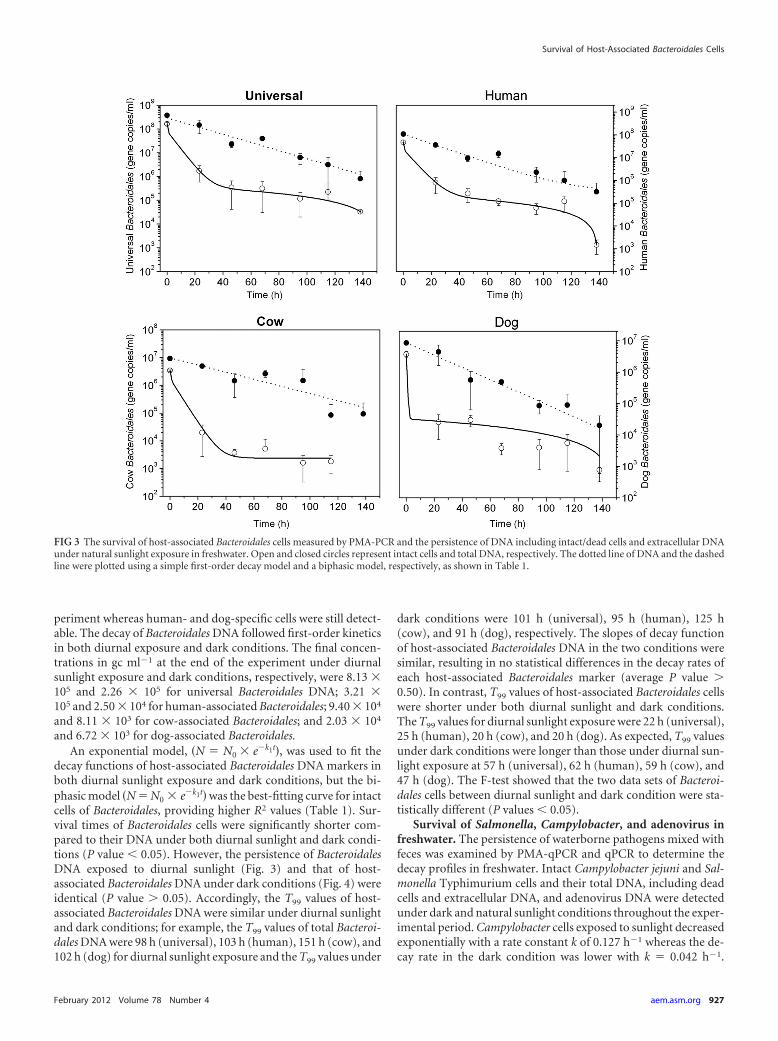
periment whereas human- and dog-specific cells were still detect-able. The decay of Bacteroidales DNA followed first-order kineticsin both diurnal exposure and dark conditions. The final concen-trations in gc ml�1 at the end of the experiment under diurnalsunlight exposure and dark conditions, respectively, were 8.13 �105 and 2.26 � 105 for universal Bacteroidales DNA; 3.21 �105 and 2.50 � 104 for human-associated Bacteroidales; 9.40 � 104
and 8.11 � 103 for cow-associated Bacteroidales; and 2.03 � 104
and 6.72 � 103 for dog-associated Bacteroidales.An exponential model, �N � N0 � e�k1t�, was used to fit the
decay functions of host-associated Bacteroidales DNA markers inboth diurnal sunlight exposure and dark conditions, but the bi-phasic model �N � N0 � e�k1t� was the best-fitting curve for intactcells of Bacteroidales, providing higher R2 values (Table 1). Sur-vival times of Bacteroidales cells were significantly shorter com-pared to their DNA under both diurnal sunlight and dark condi-tions (P value � 0.05). However, the persistence of BacteroidalesDNA exposed to diurnal sunlight (Fig. 3) and that of host-associated Bacteroidales DNA under dark conditions (Fig. 4) wereidentical (P value � 0.05). Accordingly, the T99 values of host-associated Bacteroidales DNA were similar under diurnal sunlightand dark conditions; for example, the T99 values of total Bacteroi-dales DNA were 98 h (universal), 103 h (human), 151 h (cow), and102 h (dog) for diurnal sunlight exposure and the T99 values under
dark conditions were 101 h (universal), 95 h (human), 125 h(cow), and 91 h (dog), respectively. The slopes of decay functionof host-associated Bacteroidales DNA in the two conditions weresimilar, resulting in no statistical differences in the decay rates ofeach host-associated Bacteroidales marker (average P value �0.50). In contrast, T99 values of host-associated Bacteroidales cellswere shorter under both diurnal sunlight and dark conditions.The T99 values for diurnal sunlight exposure were 22 h (universal),25 h (human), 20 h (cow), and 20 h (dog). As expected, T99 valuesunder dark conditions were longer than those under diurnal sun-light exposure at 57 h (universal), 62 h (human), 59 h (cow), and47 h (dog). The F-test showed that the two data sets of Bacteroi-dales cells between diurnal sunlight and dark condition were sta-tistically different (P values � 0.05).
Survival of Salmonella, Campylobacter, and adenovirus infreshwater. The persistence of waterborne pathogens mixed withfeces was examined by PMA-qPCR and qPCR to determine thedecay profiles in freshwater. Intact Campylobacter jejuni and Sal-monella Typhimurium cells and their total DNA, including deadcells and extracellular DNA, and adenovirus DNA were detectedunder dark and natural sunlight conditions throughout the exper-imental period. Campylobacter cells exposed to sunlight decreasedexponentially with a rate constant k of 0.127 h�1 whereas the de-cay rate in the dark condition was lower with k � 0.042 h�1.
FIG 3 The survival of host-associated Bacteroidales cells measured by PMA-PCR and the persistence of DNA including intact/dead cells and extracellular DNAunder natural sunlight exposure in freshwater. Open and closed circles represent intact cells and total DNA, respectively. The dotted line of DNA and the dashedline were plotted using a simple first-order decay model and a biphasic model, respectively, as shown in Table 1.
Survival of Host-Associated Bacteroidales Cells
February 2012 Volume 78 Number 4 aem.asm.org 927
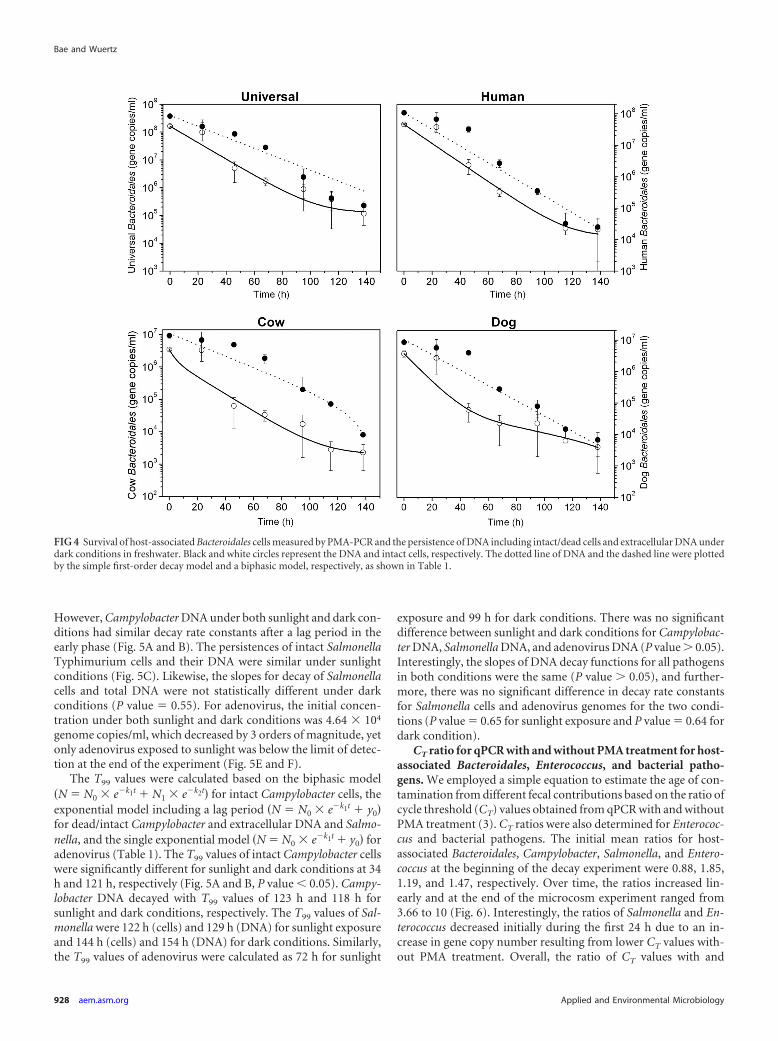
However, Campylobacter DNA under both sunlight and dark con-ditions had similar decay rate constants after a lag period in theearly phase (Fig. 5A and B). The persistences of intact SalmonellaTyphimurium cells and their DNA were similar under sunlightconditions (Fig. 5C). Likewise, the slopes for decay of Salmonellacells and total DNA were not statistically different under darkconditions (P value � 0.55). For adenovirus, the initial concen-tration under both sunlight and dark conditions was 4.64 � 104
genome copies/ml, which decreased by 3 orders of magnitude, yetonly adenovirus exposed to sunlight was below the limit of detec-tion at the end of the experiment (Fig. 5E and F).
The T99 values were calculated based on the biphasic model�N � N0 � e�k1t � N1 � e�k2t� for intact Campylobacter cells, theexponential model including a lag period �N � N0 � e�k1t � y0�for dead/intact Campylobacter and extracellular DNA and Salmo-nella, and the single exponential model �N � N0 � e�k1t � y0� foradenovirus (Table 1). The T99 values of intact Campylobacter cellswere significantly different for sunlight and dark conditions at 34h and 121 h, respectively (Fig. 5A and B, P value � 0.05). Campy-lobacter DNA decayed with T99 values of 123 h and 118 h forsunlight and dark conditions, respectively. The T99 values of Sal-monella were 122 h (cells) and 129 h (DNA) for sunlight exposureand 144 h (cells) and 154 h (DNA) for dark conditions. Similarly,the T99 values of adenovirus were calculated as 72 h for sunlight
exposure and 99 h for dark conditions. There was no significantdifference between sunlight and dark conditions for Campylobac-ter DNA, Salmonella DNA, and adenovirus DNA (P value � 0.05).Interestingly, the slopes of DNA decay functions for all pathogensin both conditions were the same (P value � 0.05), and further-more, there was no significant difference in decay rate constantsfor Salmonella cells and adenovirus genomes for the two condi-tions (P value � 0.65 for sunlight exposure and P value � 0.64 fordark condition).
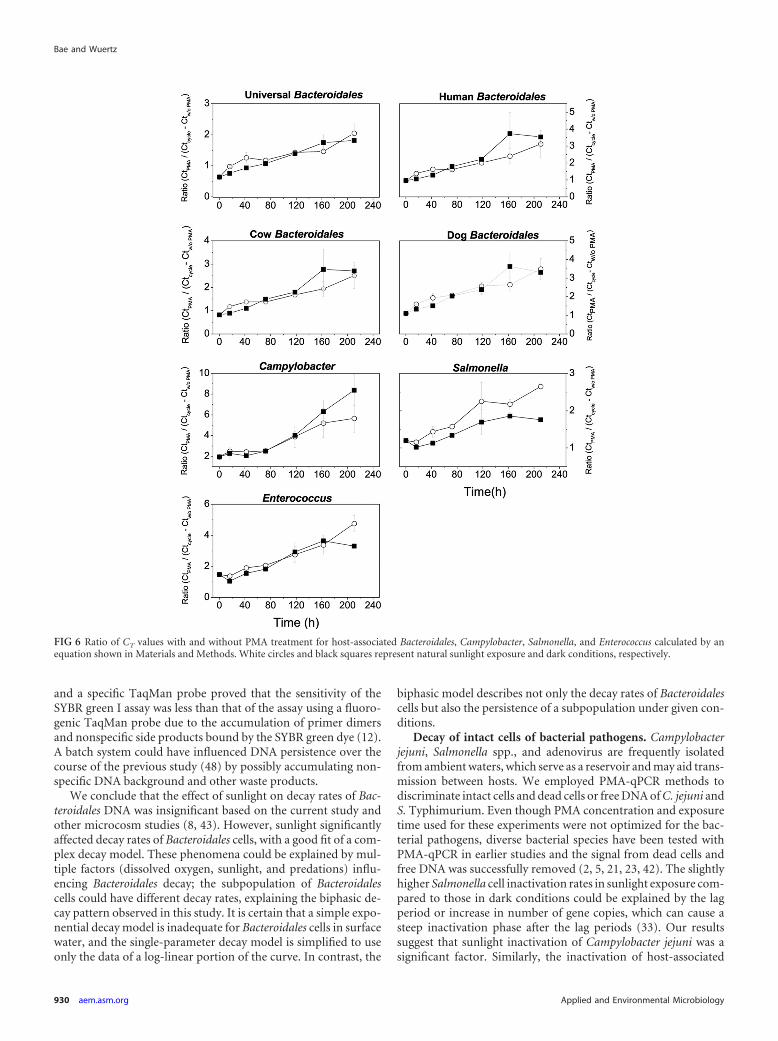
CT ratio for qPCR with and without PMA treatment for host-associated Bacteroidales, Enterococcus, and bacterial patho-gens. We employed a simple equation to estimate the age of con-tamination from different fecal contributions based on the ratio ofcycle threshold (CT) values obtained from qPCR with and withoutPMA treatment (3). CT ratios were also determined for Enterococ-cus and bacterial pathogens. The initial mean ratios for host-associated Bacteroidales, Campylobacter, Salmonella, and Entero-coccus at the beginning of the decay experiment were 0.88, 1.85,1.19, and 1.47, respectively. Over time, the ratios increased lin-early and at the end of the microcosm experiment ranged from3.66 to 10 (Fig. 6). Interestingly, the ratios of Salmonella and En-terococcus decreased initially during the first 24 h due to an in-crease in gene copy number resulting from lower CT values with-out PMA treatment. Overall, the ratio of CT values with and
FIG 4 Survival of host-associated Bacteroidales cells measured by PMA-PCR and the persistence of DNA including intact/dead cells and extracellular DNA underdark conditions in freshwater. Black and white circles represent the DNA and intact cells, respectively. The dotted line of DNA and the dashed line were plottedby the simple first-order decay model and a biphasic model, respectively, as shown in Table 1.
Bae and Wuertz
928 aem.asm.org Applied and Environmental Microbiology
without PMA treatment was indicative of the time period passedsince inoculation of the microcosm with (i) fecal material fromdifferent animal sources based on host-associated Bacteroidalesand (ii) pure cultures of bacterial pathogens.
DISCUSSION
This study examined the decay of noncultivable fecal Bacteroidalesand of Enterococcus, Campylobacter jejuni, and Salmonella Typhi-murium, in freshwater using PMA-qPCR and qPCR, allowing forcomparison of intact cells and total target DNA in the same ma-trix. Adenovirus genomes were measured by qPCR alone. In ad-dition, intact Enterococcus and E. coli cells were enumerated by themembrane filtration method. We employed in situ microcosms ina continuously flowing system under ambient conditions to bettersimulate environmental conditions and compare the persistencepatterns of host-associated Bacteroidales cells and their DNA withthose of fecal indicator bacteria and waterborne pathogens.
In general, cultivation-dependent methods to evaluate micro-bial water qualities require an 18- to 96-h incubation period, dur-ing which time the public may continue to be exposed to micro-bially contaminated water. Rapid detection technologies such asqPCR have been proposed as an alternative tool to monitor waterquality (24). Significant concentrations of dissolved DNA arefound in marine water, freshwater, and sediments, potentiallycomplicating the interpretation of information from qPCR datadue to the relatively long persistence of target DNA (23). ThePMA-qPCR method could avoid the issue of persistent DNA andprovide a relatively fast, simple, and inexpensive means to dis-criminate intact/dead cells in mixed populations (2, 22, 42). How-ever, some limitations of PMA-qPCR have been reported, such asthe interference of higher particle concentration (2) and highlycomplex chemical and biological matrices in environmental sam-ples.
Decay of fecal indicator bacteria. It has been demonstratedthat fecal indicators grow in tropical climates under the right con-ditions (9) and have greater persistence in both sediment and thewater column (19). Similar to a previous study (1, 7), regrowth ofE. coli but not of cultivable Enterococcus (cENT) was observed,demonstrating the presence of a growing subpopulation. Interest-ingly, in our study total Enterococcus DNA detected by qPCR(tENT) increased initially (23 h) under sunlight exposure, eventhough intact cells measured by PMA-qPCR (vENT) decreasedwith first-order rate kinetics during the entire experiment. It ispossible that Enterococcus cells replicated in the microcosm, albeitneither cultivation method nor PMA-qPCR showed any increasein cells. Another possible explanation is the release of extracellularDNA from particulate material during this initial period, whichthen becomes available for qPCR later. The increase in DNA am-plified by both PMA-qPCR and qPCR under dark conditions wasnot surprising because the availability of dissolved organic carboncan trigger the growth of Enterococcus, which subsequently ceaseswhen the nutrients are depleted, as reported for the growth ofEnterococcus in beach sands (51) and of E. coli O157 in naturalfreshwater at low carbon concentrations (43). The slopes from thecultivation-dependent method and PMA-qPCR were significantlydifferent (P values � 0.001 and 0.02 for sunlight exposure anddark condition, respectively), which was likely due to the presenceof intact but noncultivable Enterococcus cells. The higher numbersof tENT compared to cENT in freshwater, estuarine water, andbeach sand have previously been reported and attributed togreater persistence of noncultivable organisms and/or free DNA(10, 11, 46).
Decay of Bacteroidales. Genetic marker DNA targets of Bacte-roidales had similar decay rate constants in the freshwater micro-cosm. In the same vein, Bacteroidales cells possessed similar slopesof exponential decay in each condition (average P value � 0.50and 0.60 for sunlight exposure and dark condition, respectively).In an earlier study different host-associated genetic markers ofBacteroidales showed similar responses in nonfiltered river waterincubated under nonflowing conditions (30). However, our find-ings contrast with those from a recent study, which reported thatthe persistence of ruminant Bacteroidales DNA differed from thatof human marker DNA (48). This disagreement may be due to adifferent experimental design such as different qPCR assays (Taq-Man versus SYBR green) or type of microcosm (a continuouslyflowing system versus a batch system). A comparison study be-tween the double-stranded (dsDNA)-binding dye SYBR green I
FIG 5 Survival of waterborne pathogens in freshwater measured by PMA-qPCR or qPCR in freshwater. n � 3 for each mean; error bar represents stan-dard deviation. (A to D) The concentration of Campylobacter jejuni undersunlight exposure (A) and dark conditions (B) and Salmonella Typhimuriumunder sunlight exposure (C) and dark conditions (D). Open and closed circlesdenote target concentration (gene copies/ml) measured by PMA-qPCR andqPCR, respectively. (E and F) The decay of adenovirus DNA under sunlightexposure (E) and dark conditions (F). LOD, limit of detection.
Survival of Host-Associated Bacteroidales Cells
February 2012 Volume 78 Number 4 aem.asm.org 929
and a specific TaqMan probe proved that the sensitivity of theSYBR green I assay was less than that of the assay using a fluoro-genic TaqMan probe due to the accumulation of primer dimersand nonspecific side products bound by the SYBR green dye (12).A batch system could have influenced DNA persistence over thecourse of the previous study (48) by possibly accumulating non-specific DNA background and other waste products.
We conclude that the effect of sunlight on decay rates of Bac-teroidales DNA was insignificant based on the current study andother microcosm studies (8, 43). However, sunlight significantlyaffected decay rates of Bacteroidales cells, with a good fit of a com-plex decay model. These phenomena could be explained by mul-tiple factors (dissolved oxygen, sunlight, and predations) influ-encing Bacteroidales decay; the subpopulation of Bacteroidalescells could have different decay rates, explaining the biphasic de-cay pattern observed in this study. It is certain that a simple expo-nential decay model is inadequate for Bacteroidales cells in surfacewater, and the single-parameter decay model is simplified to useonly the data of a log-linear portion of the curve. In contrast, the
biphasic model describes not only the decay rates of Bacteroidalescells but also the persistence of a subpopulation under given con-ditions.
Decay of intact cells of bacterial pathogens. Campylobacterjejuni, Salmonella spp., and adenovirus are frequently isolatedfrom ambient waters, which serve as a reservoir and may aid trans-mission between hosts. We employed PMA-qPCR methods todiscriminate intact cells and dead cells or free DNA of C. jejuni andS. Typhimurium. Even though PMA concentration and exposuretime used for these experiments were not optimized for the bac-terial pathogens, diverse bacterial species have been tested withPMA-qPCR in earlier studies and the signal from dead cells andfree DNA was successfully removed (2, 5, 21, 23, 42). The slightlyhigher Salmonella cell inactivation rates in sunlight exposure com-pared to those in dark conditions could be explained by the lagperiod or increase in number of gene copies, which can cause asteep inactivation phase after the lag periods (33). Our resultssuggest that sunlight inactivation of Campylobacter jejuni was asignificant factor. Similarly, the inactivation of host-associated
FIG 6 Ratio of CT values with and without PMA treatment for host-associated Bacteroidales, Campylobacter, Salmonella, and Enterococcus calculated by anequation shown in Materials and Methods. White circles and black squares represent natural sunlight exposure and dark conditions, respectively.
Bae and Wuertz
930 aem.asm.org Applied and Environmental Microbiology
Bacteroidales cells was consistently faster under sunlight exposurethan under dark conditions. In agreement with a previous study,the marked difference in inactivation rates between sunlight ex-posure and dark conditions suggested that rapid inactivation innatural water is due to high susceptibility of Campylobacter tophoto-oxidative damage (38). Its sensitivity to short solar radia-tion (UV-B and UV-C) is likely to be associated with direct DNA(photobiological) damage. However, UV-C wavelengths are re-moved by the atmosphere and UV-B comprises only a small pro-portion of solar energy at the earth’s surface. UV-B wavelengthsare also more rapidly attenuated in natural water than longer andvisible wavelengths with the result that photo-oxidative damagebecomes more important as a bacterial inactivation mechanism tolead to breakdown of membrane integrity (33, 34) and subse-quently allows for the discrimination of intact cells by PMA-qPCR.
Our findings lead to the question as to whether Enterococcus orhost-associated Bacteroidales measured by either PMA-qPCR orqPCR displayed a similar persistence to pathogenic bacteria or ad-enovirus in water. The decay rates of Enterococcus and Salmonellacells during sunlight exposure were similar (P value � 0.307), butEnterococcus cells were more persistent than those of Campylobac-ter jejuni, indicating that the physiological condition of Campylo-bacter jejuni at different dissolved oxygen concentrations needs tobe considered to understand environmental decay in water. Thepersistences of fecal Bacteroidales cells (universal Bacteroidalesmarker, BacUni-UCD) and Campylobacter cells in sunlight expo-sure were similar as shown by the F-test. Host-associated Bacte-roidales DNA and waterborne pathogen DNA were degraded atsimilar rates from 0.03 to 0.064 h�1 under both dark and sunlightconditions, but decay rates of Enterococcus DNA were significantlydifferent from those of DNA from other pathogens due to re-growth of cells.
Walters and Field further reported that ruminant-associatedBacteroidales cells survived longer than human-associated cellsbased on rRNA detection used to assess viability of persistent Bac-teroidales cells in freshwater microcosms (48). In contrast,ruminant-associated Bacteroidales cells in our study decayed fasterthan or at a similar rate to human-associated Bacteroidales cells inthe presence of sunlight as monitored by PMA-qPCR (Fig. 3). Thereason for observed differences in the two studies may be attrib-uted to the stability of rRNA in bacteria after cell death and inter-ference of RNA extraction in cow feces (5). Another recent micro-cosm study reported higher T99 values of the human-associatedDNA marker BacHum (measured as total DNA without PMA)compared to cultivable E. coli (11), whereas BacHum DNA in thepresent study was more persistent than were cultivable Enterococ-cus or E. coli cells. Therefore, the question beckons how to inter-pret and compare data from these different experimental setups tounderstand decay rates of fecal pollution indicators and sourceidentifiers in impaired water. As Schulz and Childers proposed, arepository database of raw survival and persistence data is neededfor a statistical comparison of decay rates from different studies(35). Additionally, comparable kinetic studies are necessary con-sidering inoculum effect, temperature, salinity, quantificationmethods, and viability of target organism.
The application of qPCR assays with PMA treatment in thesame matrix holds promise as an effective tool for identifyingsources of fecal pollution and quantifying waterborne pathogenswith assessment of health risk. qPCR with PMA should provide
greater confidence in fecal pollution assessment and may informremediation decisions in water. Furthermore, the ratios of CT val-ues in samples with and without PMA treatment are a promisingmethod to estimate recent fecal contamination because ratios ofintact cells by PMA-qPCR over dead cells by qPCR reflect differentdecay rates. For example, a ratio close to unity indicates that fecalcontamination occurred recently based on the reasonable as-sumption that bacterial DNA is more persistent compared withthe relatively faster decay of cells in the natural environment. Inaddition, inhibition of PMA activity after concentration of bio-mass by filtration and concurrent higher levels of total suspendedsolids should be considered in field monitoring (42). Even thoughvery little co-occurrence of fecal Bacteroidales detection was ob-served for E. coli O157, Salmonella, and Campylobacter amongsamples in a previous study using only (q)PCR (49), PMA-qPCRanalysis for both Bacteroidales and waterborne pathogens could beinformative to identify the sources of waterborne pathogens dueto similar decay rates in the environment.
Several remaining questions have to be investigated. The po-tential contribution of sediments as secondary habitats of Bacte-roidales or waterborne pathogens needs to be established consid-ering that other enteric bacteria and waterborne pathogens canpersist by colonizing surfaces and forming biofilms (6, 9, 46). Thedecay rates should be integrated into models of the fate of entericbacteria in water to implement a remediation strategy, and long-term and large-scale field studies need to be conducted with thedecay model to validate the potential of microbial source tracking.Finally, epidemiological studies are required to determine the cor-relation between source identifiers, the presence of fecal patho-gens, and the occurrence of illness associated with a particularwater use (32).
ACKNOWLEDGMENTS
This research was supported by the Environmental Division of the Cali-fornia Department of Transportation, contract no. 43A0168, TO 23.
We thank Paul Lutes at the Center for Aquatic Biology and Aquacul-ture, UC Davis, for providing space and assisting in microcosm studies.
REFERENCES1. Alm EW, Burke J, Hagan E. 2006. Persistence and potential growth of the
fecal indicator bacteria, Escherichia coli, in shoreline sand at Lake Huron.J. Great Lakes Res. 32:401– 405.
2. Bae S, Wuertz S. 2009. Discrimination of viable and dead fecal Bacteroi-dales bacteria by quantitative PCR with propidium monoazide. Appl. En-viron. Microbiol. 75:2940 –2944.
3. Bae S, Wuertz S. 2009. Rapid decay of host-specific fecal Bacteroidalescells in seawater as measured by quantitative PCR with propidiummonoazide. Water Res. 43:4850 – 4859.
4. Bell A, et al. 2009. Factors influencing the persistence of fecal Bacteroidesin stream water. J. Environ. Qual. 38:1224 –1232.
5. Birch L, Dawson CE, Cornett JH, Keer JT. 2001. A comparison of nucleicacid amplification techniques for the assessment of bacterial viability. Lett.Appl. Microbiol. 33:296 –301.
6. Brescia CC, et al. 2009. Cryptosporidium propidium monoazide-PCR, amolecular biology-based technique for genotyping of viable Cryptospo-ridium oocysts. Appl. Environ. Microbiol. 75:6856 – 6863.
7. Bucci V, Vulic M, Ruan XD, Hellweger FL. 2011. Population dynamics ofEscherichia coli in surface water. J. Am. Water Resour. Assoc. 47:611–619.
8. Buswell CM, et al. 1998. Extended survival and persistence of Campylo-bacter spp. in water and aquatic biofilms and their detection byimmunofluorescent-antibody and -rRNA staining. Appl. Environ. Micro-biol. 64:733–741.
9. Desmarais TR, Solo-Gabriele HM, Palmer CJ. 2002. Influence of soil onfecal indicator organisms in a tidally influenced subtropical environment.Appl. Environ. Microbiol. 68:1165–1172.
Survival of Host-Associated Bacteroidales Cells
February 2012 Volume 78 Number 4 aem.asm.org 931
10. Dick LK, et al. 2005. Host distributions of uncultivated fecal Bacteroidalesbacteria reveal genetic markers for fecal source identification. Appl. Envi-ron. Microbiol. 71:3184 –3191.
11. Dick LK, Stelzer EA, Bertke EE, Fong DL, Stoeckel DM. 2010. Relativedecay of Bacteroidales microbial source tracking markers and cultivatedEscherichia coli in freshwater microcosms. Appl. Environ. Microbiol. 76:3255–3262.
12. Field KG, Samadpour M. 2007. Fecal source tracking, the indicator par-adigm, and managing water quality. Water Res. 41:3517–3538.
13. Fries JS, Characklis GW, Noble RT. 2008. Sediment-water exchange ofVibrio sp. and fecal indicator bacteria: implications for persistence andtransport in the Neuse River Estuary, North Carolina, U.S.A. Water Res.42:941–950.
14. Haugland RA, Siefring SC, Wymer LJ, Brenner KP, Dufour AP. 2005.Comparison of Enterococcus measurements in freshwater at two recre-ational beaches by quantitative polymerase chain reaction and membranefilter culture analysis. Water Res. 39:559 –568.
15. He JW, Jiang S. 2005. Quantification of enterococci and human adeno-viruses in environmental samples by real-time PCR. Appl. Environ. Mi-crobiol. 71:2250 –2255.
16. Hein I, et al. 2001. Comparison of different approaches to quantifyStaphylococcus aureus cells by real-time quantitative PCR and applicationof this technique for examination of cheese. Appl. Environ. Microbiol.67:3122–3126.
17. Kildare BJ, et al. 2007. 16S rRNA-based assays for quantitative detectionof universal, human-, cow-, and dog-specific fecal Bacteroidales: a Bayes-ian approach. Water Res. 41:3701–3715.
18. Layton A, et al. 2006. Development of Bacteroides 16S rRNA geneTaqMan-based real-time PCR assays for estimation of total, human, andbovine fecal pollution in water. Appl. Environ. Microbiol. 72:4214 – 4224.
19. Lee CM, et al. 2006. Persistence of fecal indicator bacteria in Santa Mon-ica Bay beach sediments. Water Res. 40:2593–2602.
20. Lee YJ, et al. 2008. Temporal assessment of the impact of exposure to cowfeces in two watersheds by multiple host-specific PCR assays. Appl. Envi-ron. Microbiol. 74:6839 – 6847.
21. Malorny B, et al. 2004. Diagnostic real-time PCR for detection of Salmo-nella in food. Appl. Environ. Microbiol. 70:7046 –7052.
22. Mieszkin S, Furet JP, Corthier G, Gourmelon M. 2009. Estimation of pigfecal contamination in a river catchment by real-time PCR using twopig-specific Bacteroidales 16S rRNA genetic markers. Appl. Environ. Mi-crobiol. 75:3045–3054.
23. Nielsen KM, Johnsen PJ, Bensasson D, Daffonchio D. 2007. Release andpersistence of extracellular DNA in the environment. Environ. BiosafetyRes. 6:37–53.
24. Noble RT, Weisberg SB. 2005. A review of technologies for rapid detec-tion of bacteria in recreational waters. J. Water Health 3:381–392.
25. Nocker A, Cheung CY, Camper AK. 2006. Comparison of propidiummonoazide with ethidium monoazide for differentiation of live vs. deadbacteria by selective removal of DNA from dead cells. J. Microbiol. Meth-ods 67:310 –320.
26. Nocker A, Sossa-Fernandez P, Burr MD, Camper AK. 2007. Use ofpropidium monoazide for live/dead distinction in microbial ecology.Appl. Environ. Microbiol. 73:5111–5117.
27. Nocker A, Sossa KE, Camper AK. 2007. Molecular monitoring of disin-fection efficacy using propidium monoazide in combination with quanti-tative PCR. J. Microbiol. Methods 70:252–260.
28. Nogva HK, Bergh A, Holck A, Rudi K. 2000. Application of the 5=-nuclease PCR assay in evaluation and development of methods for quan-titative detection of Campylobacter jejuni. Appl. Environ. Microbiol. 66:4029 – 4036.
29. Okabe S, Okayama N, Savichtcheva O, Ito T. 2007. Quantification ofhost-specific Bacteroides-Prevotella 16S rRNA genetic markers for assess-ment of fecal pollution in freshwater. Appl. Microbiol. Biotechnol. 74:890 –901.
30. Okabe S, Shimazu Y. 2007. Persistence of host-specific Bacteroides-Prevotella 16S rRNA genetic markers in environmental waters: effects oftemperature and salinity. Appl. Microbiol. Biotechnol. 76:935–944.
31. Rajal VB, McSwain BS, Thompson DE, Leutenegger CM, Wuertz S.
2007. Molecular quantitative analysis of human viruses in Californiastormwater. Water Res. 41:4287– 4298.
32. Santo Domingo JW, Bambic DG, Edge TA, Wuertz S. 2007. Quo vadissource tracking? Towards a strategic framework for environmental mon-itoring of fecal pollution. Water Res. 41:3539 –3552.
33. Saunders AM, Kristiansen A, Lund MB, Revsbech NP, Schramm A. 2009.Detection and persistence of fecal Bacteroidales as water quality indicators inunchlorinated drinking water. Syst. Appl. Microbiol. 32:362–370.
34. Savichtcheva O, Okabe S. 2006. Alternative indicators of fecal pollution:relations with pathogens and conventional indicators, current methodol-ogies for direct pathogen monitoring and future application perspectives.Water Res. 40:2463–2476.
35. Schulz CJ, Childers GW. 2011. Fecal Bacteroidales diversity and decay inresponse to variations in temperature and salinity. Appl. Environ. Micro-biol. 77:2563–2572.
36. Seurinck S, Defoirdt T, Verstraete W, Siciliano SD. 2005. Detection andquantification of the human-specific HF183 Bacteroides 16S rRNA geneticmarker with real-time PCR for assessment of human faecal pollution infreshwater. Environ. Microbiol. 7:249 –259.
37. Shanks OC, et al. 2006. Basin-wide analysis of the dynamics of fecalcontamination and fecal source identification in Tillamook Bay, Oregon.Appl. Environ. Microbiol. 72:5537–5546.
38. Sinton L, Hall C, Braithwaite R. 2007. Sunlight inactivation of Campy-lobacter jejuni and Salmonella enterica, compared with Escherichia coli, inseawater and river water. J. Water Health 5:357–365.
39. Sinton LW. 2006. Biotic and abiotic effects, p 464. In Belkin S, Colwell RR(ed), Oceans and health: pathogen in the marine environment. SpringerScience, New York, NY.
40. US Environmental Protection Agency. 2002. Method 1600: enterococciin water by membrane filtration using membrane-Enterococcus indoxyl-�-D-glucoside agar (mEI). US Environmental Protection Agency, Wash-ington, DC.
41. US Environmental Protection Agency. 2002. Method 1604: total coli-forms and Escherichia coli in water by membrane filtration using simulta-neous detection technique (MI medium). US Environmental ProtectionAgency, Washington, DC.
42. Varma M, et al. 2009. Quantitative real-time PCR analysis of total andpropidium monoazide-resistant fecal indicator bacteria in wastewater.Water Res. 43:4790 – 4801.
43. Vital M, Hammes F, Egli T. 2008. Escherichia coli O157 can grow innatural freshwater at low carbon concentrations. Environ. Microbiol. 10:2387–2396.
44. Wade TJ, et al. 2008. High sensitivity of children to swimming-associatedgastrointestinal illness: results using a rapid assay of recreational waterquality. Epidemiology 19:375–383.
45. Wade TJ, et al. 2006. Rapidly measured indicators of recreational waterquality are predictive of swimming-associated gastrointestinal illness. En-viron. Health Perspect. 114:24 –28.
46. Wagner AO, Malin C, Knapp BA, Illmer P. 2008. Removal of freeextracellular DNA from environmental samples by ethidium monoazideand propidium monoazide. Appl. Environ. Microbiol. 74:2537–2539.
47. Wahman DG, Wulfeck-Kleier KA, Pressman JG. 2009. Monochlora-mine disinfection kinetics of Nitrosomonas europaea by propidiummonoazide quantitative PCR and live/dead BacLight methods. Appl. En-viron. Microbiol. 75:5555–5562.
48. Walters SP, Field KG. 2009. Survival and persistence of human andruminant-specific faecal Bacteroidales in freshwater microcosms. Environ.Microbiol. 11:1410 –1421.
49. Walters SP, Gannon VPJ, Field KG. 2007. Detection of Bacteroidales fecalindicators and the zoonotic pathogens E. coli O157:H7, Salmonella, andCampylobacter in river water. Environ. Sci. Technol. 41:1856 –1862.
50. Walters SP, Yamahara KM, Boehm AB. 2009. Persistence of nucleic acidmarkers of health-relevant organisms in seawater microcosms: implica-tions for their use in assessing risk in recreational waters. Water Res. 43:4929 – 4939.
51. Yamahara KM, Walters SP, Boehm AB. 2009. Growth of enterococci inunaltered, unseeded beach sands subjected to tidal wetting. Appl. Environ.Microbiol. 75:1517–1524.
Bae and Wuertz
932 aem.asm.org Applied and Environmental Microbiology


