Embed Size (px)
Citation preview

Tax Decoder
exemption
write off
deduction
give-away loophole
exclusion
carve out
haven preference
credit
itemize
extenders
special interests


i
Introduction
The U.S. tax code is so complicated most Americans pay someone else to complete their tax forms.1 Even the members of Congress who are in charge of writing tax law admit they too cannot do their own taxes.2
In fact, it is unlikely there is a single taxpayer, politician, lawyer, or economist who has read or completely understands the entire Internal Revenue Code, which is now more than four million words in length, filling 9,000 pages.3 By contrast, the federal income tax law in 1913 was just 27 pages long and could be read cover to cover by nearly every American.4
The tax code is not just complicated, it is unfair. More than $1.7 trillion in federal income this year was collected from taxpayers,5 but this financial burden is not shared equally by all. Due to the code’s complexity, your taxes are not a simple calculation of earnings and obligations. Instead, taxes are determined by how well you can take advantage of the hundreds of tax credits, deductions, exclusions, and carve-outs tucked into the code. As a result of all of these loopholes and giveaways, nearly half of American households pay no federal individual income tax,6 including over a thousand with an adjusted gross income of $1 million.7
Median family income was $51,000 in 2012.8 That same year, taxpayers had an average personal tax bill of $12,759.9 Yet, some individuals and corporations paid almost nothing in taxes, while a few even received payments from the government.
Because many of those who pay no income taxes are at both ends of the economic ladder, those in the middle are squeezed the hardest. While it is fair to expect those who have more to pay more and for those who have less to pay less, every citizen should contribute in some manner.
Taxes should not be determined by who has access to the craftiest accountants, lobbyists and politicians. The tax code should be simple enough that everyone—including members of Congress—is capable of filling out their own tax return.
This report, Tax Decoder, is intended to decode the tax code for every taxpayer. It reveals more than 165 tax expenditures costing over $900 billion this year and more than $5 trillion over the next five years.
It is nearly impossible to know who is benefiting from the tax code because it lacks any real transparency or accountability. This is not unintentional. The Senate Finance Committee recently rejected an amendment that would have required the recipients of some tax credits to be publicly listed in the USAspending.gov website.10 The recipients of these tax breaks know who they are, so it seems reasonable for those who are paying the taxes to provide the benefits should know as well.
Tax Decoder attempts to provide a detailed and comprehensive overview of the code for all taxpayers. It in-cludes the background, cost, and primary beneficiaries of each provision along with specific examples of some of the recipients of certain tax breaks. It covers well known tax provisions as well as others that are more obscure.
For example, the owners of lucrative professional sports franchises can write-off some of the costs of purchas-ing a team, while some multibillion dollar sports leagues pay very little in taxes. Hollywood movie makers aren’t just collecting at the box office, they are also downloading tax subsidies from the IRS. Gamblers who lose at the casino or horse track can still win on their tax return by writing off gambling losses. There is no shortage of tax subsidies for the rich and famous, such as credits to renovate vacation homes and purchase luxury cars and deductions for yachts. McDonald’s even received tax breaks to sell Chicken McNuggets overseas.11
While many of these were created with the best of intentions, big spenders in Washington have often attempted to con fiscal conservative policymakers into believing that spending through the tax code is actually
BECAUSE MANY OF THOSE WHO PAY NO INCOME TAXES ARE AT BOTH ENDS OF THE ECONOMIC LADDER, THOSE IN THE MIDDLE ARE SQUEEZED THE HARDEST. WHILE IT IS FAIR TO EXPECT THOSE WHO HAVE MORE TO PAY MORE AND FOR THOSE WHO HAVE LESS TO PAY LESS, EVERY CITIZEN SHOULD CONTRIBUTE IN SOME MANNER.

ii
cutting taxes. In fact, many tax provisions duplicate spending programs, providing financial assistance to the very same recipients for nearly identical purposes. For example, home ownership is supported within the tax code with the mortgage interest deduction, capital gains exclusion of profits from home sales, and deduction for property taxes, while dozens of federal spending programs at multiple departments also provide aid for homeownership.
And the real beneficiaries of many tax giveaways end up being not the intended recipients who need relief, but those who are already well-off. The New Markets Tax Credit was created to create jobs in low-income areas, but instead resulted in nearly $1 billion being steered to wealthy investors and Wall Street banks. Likewise, the Research and Development Tax Credit was designed to encourage mid-sized companies to increase investments in research and development, but over 80 percent of the credit went to companies with $250 million or more in annual sales in 2010.12 Google, Intel, Boeing and Apple were the top recipients in 2011.13
“Even though lowering rates and getting rid of loopholes would raise incomes, reduce inequality, and bring down the deficit, too many Democrats and Republicans in Washington are addicted to loopholes to conceal spending in the tax code,” noted a former Democratic presidential economic adviser who pointed out how both parties have used tax preferences to increase spending over the past three decades.
All of these tax giveaways add up to nearly $1 trillion in lost revenue every year.14 For each of these that benefit only one company or industry, other businesses must bear a disproportionately higher effective rate. Instead of artificially lowering the rates for select industries, companies or individuals, Congress should lower rates for all taxpayers in a fair and equitable manner.
The federal tax code is a necessary evil that should be used only to collect revenue to pay for legitimate, essential federal expenditures, such as our national defense. But Washington politicians have manipulated it for their own purposes, whether to support special interests or to encourage certain behaviors or discourage others.
As such, the tax code has become a powerful and elaborate system of rewards and punishments used to coerce Americans and manipulate the economy. A prime example is the tax penalty utilized to enforce the individual mandate requiring Americans to purchase health insurance contained within Obamacare. After all, what better enforcer is there then the most feared agency in the federal bureaucracy? Sixty percent of Americans fear an audit by the IRS according to the tax agency’s own polling and this percentage has steadily risen over the past five years.15 This is no surprise since in recent years some at the IRS have abused the agency’s powers to harass and intimidate perceived political opponents.
But the IRS is not the only entity to abuse the tax code, which provides a legal way for the crafty to shield earnings and expenses from taxation. While many of the nearly 1.6 million nonprofit organizations in the country serve as indispensable nongovernmental mechanisms for strengthening society, some are multi-million dollar operations that are akin to for-profit businesses, but pay virtually no federal taxes. These are nearly indistinguishable from taxpaying businesses, such as credit unions, social clubs, huge hospital chains, lobbying groups, and sports leagues. Several tax-free celebrity charities ultimately gave little or nothing to charitable causes. Lady Gaga’s Born This Way Foundation, raised $2.6 million in 2012, but only gave away $5,000 for “grants to organizations or individuals.”16 Similarly, the Kanye West Foundation spent a total of $553,826 in 2009—but only $583 went to charity. The rest was eaten up by expenses such as salaries, travel, overhead, and “professional fees.” In 2010, the foundation did even worse, spending $572,383 without a single penny going charity.17
Meanwhile, the U.S. corporate tax rate is one of the highest in the developed world, making it far more difficult for American companies to compete in the global marketplace. As a result, companies continue to
THIS REPORT PROVIDES A LIST OF OPTIONS FOR CONGRESS TO STREAMLINE AND SIMPLIFY THE TAX CODE TO ACHIEVE THAT GOAL. WHILE MANY OF THE TAX BREAKS IDENTIFIED THROUGHOUT THIS REPORT SHOULD BE PHASED OUT OR ELIMINATED, OTHERS COULD ALSO BE REFORMED TO BETTER ACHIEVE THEIR INTENDED PURPOSE.

ii iii
relocate overseas, taking jobs—and the tax revenues they generate—with them. Each of the special tax breaks within the code is an admission by Congress that the current tax rates are too high for American businesses, yet they are only selectively provided for favored industries.
The complicated mess is not just unfair, it is a burden on working families and businesses. The tax preparation and accounting services industries take in a combined $100 billion annually, a cost that is paid by families and companies18, 19 Instead of using capital for investments to grow the U.S. economy through the creation of new jobs, American businesses are spending millions of dollars to comply with IRS paperwork requirements. Similarly, families are paying tax preparers money which could be better spent purchasing goods, paying for their children’s college education, and starting businesses of their own.
Further, because the tax code is so complicated, the IRS will be unable to even collect nearly $500 billion in taxes owed in 2014, more than enough to balance the federal budget this year. This is despite the IRS employing over 40,000 staff members and spending over $10 billion to enforce tax compliance. A simpler tax code could significantly reduce this cost to all sectors and make the job of filing and collecting taxes easier for all.
Congress should not attempt to manipulate or distort investment decisions through the code, but should create the most economically neutral tax system possible. This will allow the free market to determine the most efficient allocation of capital, and is the optimal tax policy to maximize wealth creation.
The companies that benefit from the tax breaks listed in Tax Decoder will assuredly defend their provisions as vital policies whose absence would inflict undue harm on the economy. Savings and investment in the American economy should be predicated on risk and return – not lobbyists and politicians. The acute impacts that striking a special interest carve out will have on a specific business should not be prioritized over the massive benefits that fixing our broken tax system will have on the American people.
Nearly every politician on both sides of the aisle claims to want to make the tax code simpler and fairer but each time Congress takes up so-called tax reform, the result is the exact opposite. There were over 4,600 changes to the tax code made between 2001 and 2012.20 These changes have only made the tax code more complicated and less fair.
This month Congress will likely approve a “tax extenders” bill, reauthorizing dozens of expired tax perks for select companies and industries. The legislation will cost more than $40 billion and will include many tax breaks discussed in the report, including the wind production tax credit, the New Markets Tax Credit, and tax breaks for NASCAR, Hollywood, and tuna manufacturers.
This has become an annual ritual for Congress to rubber stamp the continuation of expiring tax earmarks and loopholes with little debate or discussion. Most members of Congress refuse to name even one specific tax break they would support eliminating. My office approached more than a dozen other Senate offices about sponsoring a bill to eliminate the tax free status for professional sports leagues and associations with annual gross receipts in excess of $10 million. To date, only one other senator, Independent Angus King of Maine, has agreed to co-sponsor. When the office of a Democrat senator was asked to choose a tax credit we could target together, the senator’s staffer likened killing tax giveaways to “clubbing baby seals.”
Despite assertions from some on the Right that eliminating tax earmarks violates campaign pledges to not raise taxes, ending many of these preferences would not negatively impact most taxpayers, if rates were simultaneously lowered. Many are not even tax cuts, but rather tax spending giveaways. Doing away with many of these would provide the means to reduce taxes on everyone who does not benefit from these tax code carve outs. After all, true tax cuts leave money entirely in the hands of those who earned it to begin with and allow them to spend or save it as they wish. Tax preferences, by contrast, might leave some money in the hands of the taxpayer, but only if the individual behaves as the government dictates. This is just another form of nanny state overreach that limits freedom by attempting to control markets and individuals.
WHILE WEEDING OUT THE TAX CODE MAY CAUSE SOME SHORT TERM UNCERTAINTY FOR THOSE WHO HAVE BECOME RELIANT ON TAX HANDOUTS, THE U.S. ECONOMY AND INDIVIDUAL TAXPAYERS WOULD GREATLY BENEFIT FROM A SIMPLER, FAIRER CODE AND LOWER TAX RATES.
1 “2012 Annual Report to Congress, Volume One,” p. 5-6, Taxpayer Advocate Service, December 31, 2012, http://goo.gl/b35KN9 2 Emily Goodin, “Do my own taxes? I would not dare!,” The Hill, April 15, 2013; http://thehill.com/capital-living/cover-stories/294011-do-my-own-taxes-i-would-not-
dare- . 3 “2012 Annual Report to Congress, Volume One,” IRS Taxpayer Advocate Service, December 31, 2012, page 6; http://goo.gl/b35KN9 . 4 “Income Tax: Law, Regulations, Amendments, Rulings, Decisions, Opinions, from the Records of the Corporation Trust Company,” CCH Incorporated, October 2003. 5 “Monthly Budget Review for September 2014,” Congressional Budget Office, p. 2, http://goo.gl/fT2XtN. 6 Rachel Johnson, James Nunns, Jeffrey Rohaly, Eric Toder, and Roberton Williams, “Why Some Tax Units Pay No Income Tax,” Urban Institute-Brookings Institution Tax
Policy Center, July 2011; http://www.taxpolicycenter.org/UploadedPDF/1001547-Why-No-Income-Tax.pdf . 7 Calculations based on Table 1.2. “Individual Income Tax Returns 2011,” Publication 1304, revised Aug. 2013, IRS, p. 36-41; http://goo.gl/HvzFFX. 8 Table H-8. Median Household Income by State: 1984 to 2013,” US Census Bureau, https://www.census.gov/hhes/www/income/data/historical/household/2013/h08.xls 9 Table 1.1 All Returns: Selected Income and Tax Items, by Size and Accumulated Size of Adjusted Gross Income, Tax Year 2012,” Internal Revenue Service, http://www.
irs.gov/file_source/pub/irs-soi/12in11si.xls10 “Senate panel defeats measure to make tax credits public,” Washington Examiner, August 2, 2012; http://www.washingtonexaminer.com/senate-panel-defeats-
measure-to-make-tax-credits-public/article/2503836 . 11 Aaron Zitner, “Tax code gives companies a lift,” The Boston Globe, July 9, 1996. 12 “Figure C. Corporations Claiming a Credit for Increasing Research Activities [1] Claimed Credit Amounts by Size of Business Receipts [2] Tax Years 1990-2010,” IRS,
August 12, 2013; http://goo.gl/b4YcWP . accessed January 16, 2014. 13 “Reform the Research Tax Credit – or Let It Die,” Citizens for Tax Justice, December 4, 2013, http://goo.gl/CQbTRT . accessed January 17, 2014. 14 National Commission on Fiscal Responsibility and Reform, “Moment of Truth, Report of the National Commission on Fiscal Responsibility and Reform,” December
1, 2010, p25. 15 “IRS Oversight Board 2013 Taxpayer Attitude Survey,” IRS Oversight Board, February 2014, page 7; http://www.treasury.gov/IRSOB/reports/Documents/IRSOB_
TAS%202013.pdf . 16 “Lady Gaga’s Charity Raises $2 million, Only Spends $5,000,” Mashable.com, March 14, 2014, http://goo.gl/YYdjsi 17 “Kanye West’s Charity Spends More than $500G Annually, donates $0, Report Says,” FOX 411, February 21, 2012, http://goo.gl/3HX9tj. 18 “Tax Preparation Services in the US: Market Research Report,” IBISWorld, March 2014, http://bit.ly/1uS48RK, archived webpage snapshot from September 19, 2014. 19 “Accounting Services in the US: Market Research Report,” IBISWorld, June 2014, http://bit.ly/1p9F4q5, archived webpage snapshot from September 19, 2014. 20 Commerce Clearing House (CCH) data provided to Taxpayer Advocate Service on Dec. 12, 2012. “2012 Annual Report to Congress, Volume One,” Taxpayer Advocate
Service, December 31, 2012 http://goo.gl/b35KN9, p. 6
Tax Decoder is not a comprehensive tax reform plan. It is an educational reference guide designed to equip taxpayers and lawmakers with the details needed to thoughtfully reconsider many aspects of the existing tax code. Ideally Congress would throw out the entire tax code and start over. But at the very least, Congress should make the code simpler, fairer and flatter. This report provides a list of options for Congress to streamline and simplify the tax code to achieve that goal. While many of the tax breaks identified throughout this report should be phased out or eliminated, others could also be reformed to better achieve their intended purpose.
Simplification and fairness are two of the primary considerations throughout this report. For every tax benefit, several questions should be asked: Does this give an unfair advantage to a select group at the expense of the many? Does this make the U.S. more competitive or does it help just one industry? Is this outdated? Does it duplicate another form of federal aid or assistance? Is there measurable data that provides evidence it is achieving the intended goals? Is the cost worth the outcome, including higher taxes levied elsewhere to pay for its costs? Is it highly susceptible to waste, fraud and abuse? Are the true beneficiaries the intended recipients? Should it be simplified, phased out or eliminated? Is it even necessary? Is this tax provision Washington’s way of telling you what to do by coercing the behavior of American citizens or businesses?
These questions should not only be asked of provisions currently in the tax code but also of those proposed in the future.
While weeding out the tax code may cause some short term uncertainty for those who have become reliant on tax handouts, the U.S. economy and individual taxpayers would greatly benefit from a simpler, fairer code and lower tax rates.

v
Note to the Reader
Tax Decoder is designed to provide the building blocks of comprehensive tax reform for lawmakers wishing to enact a meaningful overhaul of the tax code in the coming years.
This report is meant to help decode the tax code for the public and policymakers alike, exposing special giveaways and surprising tax preferences unknown to many Americans who cannot afford tax lawyers or accountants.
Without addressing each special preference, or rethinking some of the code’s most distortionary provisions, Congress will be unable to generate the revenue needed to lower rates, simplify, improve, and clean up the tax code.
Definitions
Many of the words and terms used throughout this report have specialized tax-related meanings, while others have more commonly-accepted meanings. Some of these, such as “tax expenditure,” can have a political slant. This section clarifies the meaning intended behind several terms used frequently throughout the report. Notes on sources and cost estimates are also provided.
Tax preferences and expenditures: In general, “tax preferences” or “tax expenditures” are provisions of tax law that reduce the tax owed by a tax filer. Certain basic provisions, such as the tax brackets, the standard deduction, and the personal exemptions, are not considered preferences, but rather part of the “normal structure” of the tax code.1 This report, however, may treat such provisions as tax preferences in special cases (e.g., when adult students are claimed as dependents).
Spending through the tax code: Throughout this report, tax provisions that reduce federal revenue are frequently described in language similar to the terminology used for government spending. Such terms include tax expenditures, subsidies, handouts, carve-outs, or giveaways.
Tax preferences create similar economic distortions as those caused by spending subsidies. The loss of revenues may prompt policymakers to raise general tax rates, creating a higher burden on everybody. Just like spending subsidies, therefore, tax preferences may decrease the wealth of the general public in order to increase the wealth of certain selected groups. Also, as discussed at the beginning of this report, from an economic and philosophical perspective, tax preferences are much more akin to special-interest spending than true tax reductions.
Tax loophole: This term is often used informally to describe tax preferences, including ones that were deliberately written into the tax code by Congress. It is also used to mean a misuse of the tax code for purposes that were not intended by lawmakers.
Credits, deductions, exclusions, and exemptions: Tax credits reduce taxes owed by a specified dollar amount. Tax deductions, exclusions, and exemptions, by contrast, shield certain portions of income from taxation, so the ultimate tax reduction from these provisions depends on the taxpayer’s bracket and other factors. Some may draw a distinction between these two types of preferences—for example, by arguing that credits are more like subsidies than the others. Ultimately, however, both types result in lower tax liabilities and decreased revenue, so they are not treated differently in this report.
Deferrals and depreciation changes: Numerous tax provisions do not actually change the dollar amount of taxes owed—they simply change the timing of tax payments or tax deductions. Some provisions allow taxes to be deferred to a later date. Various other sections of the code involve exceptions to the ordinary depreciation schedules, allowing taxpayers to claim deductions faster than normal.
Even though the dollar amount of taxes owed is ultimately the same, tax policymakers consider these provisions to be tax expenditures due to the time value of money—the principle that a dollar today is worth more than a dollar tomorrow. A taxpayer who can claim a tax deduction now rather than later, or pay a tax bill later rather than now, can invest more money earlier, allowing it to earn a net return.

DRAFTRefundable credits: Refundable tax credits are credits that may decrease the filer’s tax liability below zero,
resulting in the Treasury making a direct payment to the tax filer. To the extent that tax credits are refundable, they are equivalent to spending programs. A nonrefundable tax credit, by contrast, may reduce a filer’s liability to zero (but not below) and therefore will not trigger a payment from the Treasury.
Sources Consulted
The office of Senator Coburn relied heavily on existing tax literature in writing this report. Documents produced by experts at the Congressional Research Service, the Joint Committee on Taxation, the Treasury Department, the Congressional Budget Office, and others, are referenced throughout this report. Many individuals at these and outside organizations also generously gave of their time and expertise, serving as invaluable resources during the two-year process of writing Tax Decoder.
Revenue Estimates
This report primarily relies on the Joint Committee on Taxation’s “Estimates of Federal Tax Expenditures for Fiscal Years 2014-2018” for revenue estimates of nearly all provisions. Where JCT estimates were unavailable, such as in the case of many of the temporary tax extenders, estimates may have been taken from the following sources:
• “Individual Income Tax Receipts and the Individual Tax Base - February 2014 Baseline,” Tab 7: Effects of Extending Tax Provisions Scheduled to Expire Before 2024, Congressional Budget Office, February 4, 2014.
• “Analytical Perspectives, Budget of the United States Government, Fiscal Year 2015,” Office of Management and Budget.
• “Tax Expenditures: Compendium of Background Material on Individual Provisions,” Congressional Research Service, December 2012.
Several estimates were also taken from the Government Accountability Office and other sources, which are referenced throughout the report.
1 “Estimates of Federal Tax Expenditures for Fiscal Years 2014-2018,” Joint Committee on Taxation, August 5, 2014, p. 3, https://www.jct.gov/publications.html?func=startdown&id=4663.

Introduction
Note to the Reader
Complexity of the Tax Code
Who Pays Taxes & Who Does Not
Agriculture
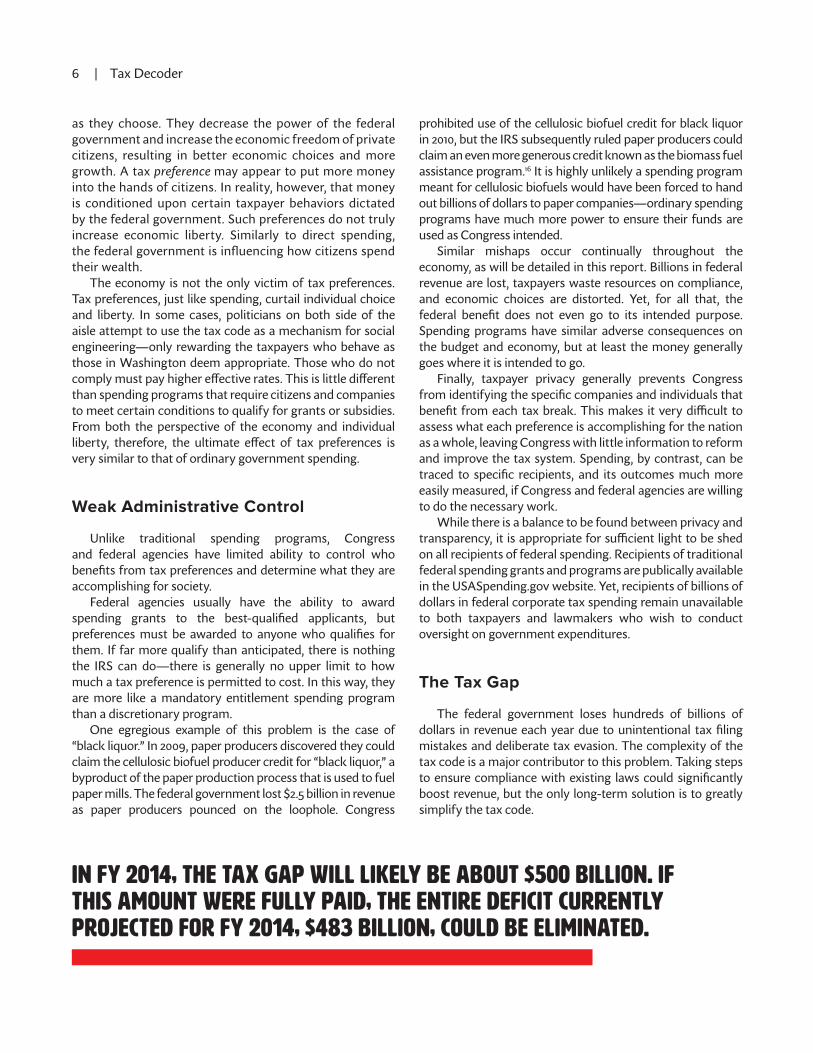
Economic & Community Development
Education
Business
Financial Services
Energy
International Taxation
Family & Child
Health Care
Housing
Indian Tribes
Military
Sports Tax Breaks
Tax-Exempt Interest
Tax-Exempt Organizations
Transportation
Other Tax Provisions
Appendix
i
v
3
13
18
27
58
74
106
123
143
152
165
183
207
217
227
239
255
297
302
306
CONTENTS

DRAFT

COMPLEXITYOF THE TAX CODE

DRAFT
4 | Tax Decoder
The Tax Code is Too Complex. Why Does That Matter?
Despite the many divisions in Washington today, virtually all policymakers on both sides of the aisle agree the federal tax code is far too complicated. The complexity of the tax code is more than just an annoyance. It is a stifling force hindering the economic growth and productivity of the United States.
The hundreds of credits, deductions, exemptions, deferrals, and other preferences in the code have major consequences for our nation’s economic productivity and fiscal condition. There are five basic reasons for this, outlined below.
questions must be asked—is this provision overly burdensome or complex? Can it be simplified or eliminated?
The Tax Reform Act of 1986 succeeded in simplifying many aspects of the tax code. Since then, however, Congress has allowed tax code complexity to once again explode.1 Between 2001 and 2012, there were over 4,600 changes to the tax code—an average of more than one a day.2
In 2012, the Internal Revenue Code contained over 4 million words, enough to fill 9,000 pages.3 By way of comparison, a pamphlet with the original 1913 income tax required only 27 pages for the full text of the statute.4 The length of the code itself only begins to convey the tax system’s complexity—it does not include the far larger corpus of regulations and rulings that make up binding U.S. tax law.
Congress needs to once again aggressively cut back on tax code complexity in order to remove impediments to our economic recovery. At a time of stagnant economic growth and dwindling common ground in the political realm, now is the time to tackle this task and provide a lean, streamlined tax code that will allow our economy to thrive in the coming decades.
Compliance Costs
Individuals, businesses, and tax professionals spent a combined 6.1 billion hours a year complying with the filing requirements of the Internal Revenue Code—the equivalent of a year’s work for 3 million full-time workers.5
Most taxpayers today are unwilling to tackle the task of tax compliance on their own. Fifty-nine percent of individual
Back to the 80s: Despite the dramatic simplification achieved by the landmark 1986 tax reform, Congress has once again allowed the tax code to grow into an enormously complex labyrinth, daunting even to the most determined entrepreneurs.
1. Compliance costs: Complying with the tax code costs households and businesses immensely in both time and money.
2. Economic distortions: The incentives in the tax code lure taxpayers to use their money in ways that minimize their tax liability, rather than directing resources to the most economically productive uses.
3. Weak administrative control: The IRS often has little knowledge of, or control over, how tax expenditures are ultimately used, and there is little transparency of tax spending recipients. This results in costly losses of revenue with little demonstrable benefit and virtually no way for Congress to measure results or conduct oversight of tax spending.
4. The tax gap: The complexity of the tax code contributes both to deliberate tax evasion and accidental mistakes. This widens the gap between what the federal government is legally owed and what it actually collects, increasing the federal deficit and adding to interest costs.
5. High standard tax rates: The numerous costly preferences in the tax code force Congress to keep the standard tax rates high, disadvantaging new industries and discouraging growth.
Simplification of the tax code would remove these burdens and unleash our nation’s true economic potential. As such, simplification is one of the primary considerations throughout this report. For every tax expenditure two

4 | Tax Decoder Complexity of the Tax Code | 5
taxpayers hired preparers to complete their tax forms for tax year 2010, and an additional 30 percent used tax software.6
The cost of this outside assistance is a significant financial burden on individuals and businesses. The tax preparation services industry takes in about $10 billion in revenue annually, according to a leading industry research firm.7
Meanwhile, the accounting services industry, which spends much of its time assisting with tax compliance, brings in $94 billion a year.8
These costs particularly burden small businesses, which are essential to job creation. According to the National Federation for Independent Businesses (NFIB), 89 percent of small business owners rely on outside tax preparers,
since they generally do not employ their own accounting specialists. The NFIB writes that the cost of complying with the tax code is 67 percent higher for small businesses than large ones, and total tax compliance costs in the small business sector are $18-19 billion a year.9 This is money that could be used to hire new employees, invest in research and development, or market products. Instead, it is being used to meet IRS paperwork requirements. This burden on small business has major implications for the overall economy.
Economic Distortions
The tax code often induces taxpayers to make decisions for tax reasons rather than economic reasons. For example, the tax system may induce a business to direct its money toward a less profitable investment over a more profitable one, because the less profitable one earns the business a tax break. The overall economy is weakened by such decisions because capital is funneled to investments that produce less wealth.
Although individual businesses may come out ahead due to a tax break, the break comes at the expense of keeping taxes higher for other taxpayers. From an economy-wide perspective, these higher taxes on others cancel out the tax benefit to individual businesses.10 For the
overall economy, the net effect of the tax break is that a less profitable investment is selected over a more profitable one—decreasing economic growth.
The Business Roundtable acknowledges these distor-tions, and describes how they play out in day-to-day invest-ment decisions.
Businesses undertake a wide range of capital investments in their productive activities, including investments in plant and equipment, office buildings, inventories, and land….[T]he allocation of capital among competing investments is likely to be influenced by the different cost recovery rules for each type of investment. Assets that are recovered more slowly for tax purposes than their true decline in value are disfavored relative to assets that are recovered more rapidly. As a result, in practice, taxes cause businesses to allocate their capital among diverse assets in a different and less efficient manner than they would in the absence of these tax distortions.11
Due to the different depreciation schedules for various different types of property, the effective tax rates on income produced by different properties can range from seven to 40 percent.12 These dramatic differences in tax burden have a significant impact on how companies choose to invest and purchase property.
Another notable distortion is the tax code’s favorable treatment of debt verses equity. It is more advantageous from a tax perspective to raise money through borrowing than the sale of stock. One tax reform panel estimated the effective tax rate on equity-financed investment is 38 percent. The tax rate of debt-financed investment is negative 15 percent due to deductions for interest and other provisions. This means the tax code actually subsidizes debt more than if there were no taxes at all. This distortion encourages companies to rely more on debt, potentially increasing the risk of bankruptcy and financial problems.13
The total economic cost of the distortions in the tax code is difficult to quantify. In 2005, however, the Government Accountability Office (GAO) surveyed the academic literature on this question. GAO reported that although none of the studies attempted to calculate the total efficiency costs of the tax system, “they do indicate that those total costs are likely to be large. The two most comprehensive studies we found show costs on the order of magnitude of 2 to 5 percent of GDP each year (as of the mid-1990s).”14 At the two percent figure, economic distortions would have cost our economy a staggering $336 billion in 2013, while at five percent, these costs could be as high as $840 billion.15
These distortions highlight an important fact about tax expenditures. From an economic perspective, they are generally much more like spending than a tax cut. True tax cuts put more money into the hands of citizens, to be used
AT TWO PERCENT, ECONOMIC DISTORTIONS WOULD HAVE COST OUR ECONOMY A STAGGERING $336 BILLION IN 2013. AT FIVE PERCENT, THESE COSTS COULD BE AS HIGH AS $840 BILLION.
DRAFT
6 | Tax Decoder
as they choose. They decrease the power of the federal government and increase the economic freedom of private citizens, resulting in better economic choices and more growth. A tax preference may appear to put more money into the hands of citizens. In reality, however, that money is conditioned upon certain taxpayer behaviors dictated by the federal government. Such preferences do not truly increase economic liberty. Similarly to direct spending, the federal government is influencing how citizens spend their wealth.
The economy is not the only victim of tax preferences. Tax preferences, just like spending, curtail individual choice and liberty. In some cases, politicians on both side of the aisle attempt to use the tax code as a mechanism for social engineering—only rewarding the taxpayers who behave as those in Washington deem appropriate. Those who do not comply must pay higher effective rates. This is little different than spending programs that require citizens and companies to meet certain conditions to qualify for grants or subsidies. From both the perspective of the economy and individual liberty, therefore, the ultimate effect of tax preferences is very similar to that of ordinary government spending.
Weak Administrative Control
Unlike traditional spending programs, Congress and federal agencies have limited ability to control who benefits from tax preferences and determine what they are accomplishing for society.
Federal agencies usually have the ability to award spending grants to the best-qualified applicants, but preferences must be awarded to anyone who qualifies for them. If far more qualify than anticipated, there is nothing the IRS can do—there is generally no upper limit to how much a tax preference is permitted to cost. In this way, they are more like a mandatory entitlement spending program than a discretionary program.
One egregious example of this problem is the case of “black liquor.” In 2009, paper producers discovered they could claim the cellulosic biofuel producer credit for “black liquor,” a byproduct of the paper production process that is used to fuel paper mills. The federal government lost $2.5 billion in revenue as paper producers pounced on the loophole. Congress
prohibited use of the cellulosic biofuel credit for black liquor in 2010, but the IRS subsequently ruled paper producers could claim an even more generous credit known as the biomass fuel assistance program.16 It is highly unlikely a spending program meant for cellulosic biofuels would have been forced to hand out billions of dollars to paper companies—ordinary spending programs have much more power to ensure their funds are used as Congress intended.
Similar mishaps occur continually throughout the economy, as will be detailed in this report. Billions in federal revenue are lost, taxpayers waste resources on compliance, and economic choices are distorted. Yet, for all that, the federal benefit does not even go to its intended purpose. Spending programs have similar adverse consequences on the budget and economy, but at least the money generally goes where it is intended to go.
Finally, taxpayer privacy generally prevents Congress from identifying the specific companies and individuals that benefit from each tax break. This makes it very difficult to assess what each preference is accomplishing for the nation as a whole, leaving Congress with little information to reform and improve the tax system. Spending, by contrast, can be traced to specific recipients, and its outcomes much more easily measured, if Congress and federal agencies are willing to do the necessary work.
While there is a balance to be found between privacy and transparency, it is appropriate for sufficient light to be shed on all recipients of federal spending. Recipients of traditional federal spending grants and programs are publically available in the USASpending.gov website. Yet, recipients of billions of dollars in federal corporate tax spending remain unavailable to both taxpayers and lawmakers who wish to conduct oversight on government expenditures.
The Tax Gap
The federal government loses hundreds of billions of dollars in revenue each year due to unintentional tax filing mistakes and deliberate tax evasion. The complexity of the tax code is a major contributor to this problem. Taking steps to ensure compliance with existing laws could significantly boost revenue, but the only long-term solution is to greatly simplify the tax code.
IN FY 2014, THE TAX GAP WILL LIKELY BE ABOUT $500 BILLION. IF THIS AMOUNT WERE FULLY PAID, THE ENTIRE DEFICIT CURRENTLY PROJECTED FOR FY 2014, $483 BILLION, COULD BE ELIMINATED.

6 | Tax Decoder Complexity of the Tax Code | 7
The “tax gap” is the amount owed by all taxpayers that is not paid on time. The most recent estimates available, for tax year 2006, put the size of the tax gap at $450 billion. Late payments and enforcement action resulted in an extra $65 billion in revenue, decreasing the net tax gap for the year to $385 billion. In total, $2.66 trillion in taxes was owed that year, but the federal government ultimately collected only $2.28 trillion, for a collection rate of about 86 percent. This rate was essentially unchanged from the previous year the IRS examined, tax year 2001.17
This means for FY 2014, the tax gap will likely be about $500 billion. If this amount were fully paid, the en-tire deficit currently projected for FY 2014, $483 billion, could be eliminated.18
The tax gap cannot be fully closed, as it would be impractical for the IRS to pursue all noncompliance cases. However, there are a number of measures that could be taken to substantially decrease the tax gap, resulting in increased revenue simply through better compliance with existing laws.
It is important to recognize that stepping up enforcement will have limited effectiveness. As the figures above indicate, the IRS’ current enforcement efforts close only about 15 percent of the tax gap.
There are some options to improve enforcement efforts. For example, a GAO report found the IRS could get more bang for the buck from its enforcement budget by conducting more audits through correspondence with taxpayers rather than expensive field examinations.19 Another GAO study suggested enhancing information reporting by third parties, similar to the wage and salary information provided by employers through Form W-2. The report also recommends matching information returns to tax returns during, rather than after, tax filing season.20
In some cases, the IRS simply needs to do a better job of following its own policies. The IRS Inspector General found, in FY 2012, IRS employees closed as uncollectible over 480,000 cases involving $6.7 billion in taxes due, stating they were unable to contact or locate the delinquent taxpayer—but in more than half of the cases, the employees had not completed all required research steps before closure.21 Such shortcuts may be costing the federal government significant revenues. Improved management of IRS personnel is clearly needed to correct these failures.
Another simple step would be to prohibit the federal government from employing those with seriously delinquent tax debt, making exceptions for those who are in the process of settling their debt with the IRS. More than 318,000 federal workers owed over $3.3 billion in federal taxes, according to a September 30, 2013 report issued by the IRS.22 This includes 714 employees of the House and Senate who owe $8.6 million in taxes, and 36 members of the Executive Office of The President who owe $213,000. These figures do not
include taxpayers currently paying their tax debt under an installment agreement.23
Those whose salaries are paid by the taxpayers have a clear obligation to pay taxes themselves. Individuals who have serious tax debt and who are not working to resolve it should be ineligible to continue living at the expense of those who do pay their taxes.
The most practical way to cut the tax gap significantly is to help facilitate compliance. The GAO has suggested improving services to taxpayers who want to comply but do not understand their tax obligations, such as better telephone, correspondence, and online services.24
The best way by far to improve compliance would be to simplify the tax code. Nina Olsen, head of the Taxpayer Advocate Service, has testified multiple times before Congress that the complexity of the tax code is likely a significant reason for taxpayer noncompliance.25, 26
For example, complexity may lead to inadvertent errors on the part of taxpayers. The IRS’ National Research Program, which examined returns filed in 2002,27 asked auditors to identify reasons for noncompliance in 46,000 audits. Olsen stated, “Among issues that IRS auditors examined that resulted in a change in tax liability, the auditors listed 67 percent as inadvertent mistakes, 27 percent as computational errors or errors that flowed automatically, and only 3 percent of errors as intentional.”28 The IRS has some concerns with the accuracy of the data,29 but even if it is only generally accurate, it clearly indicates that the vast majority of noncompliance is the result of unintentional error.
The tremendous complexity of the tax code can only increase the number of errors. For example, one area of exceedingly complex tax law is the calculation of capital gains taxes for securities transactions. In 2001, 38 percent of taxpayers with securities transactions misreported their gain or loss. However, a third of these errors actually resulted in the taxpayer paying more than was owed—a clear indication these mistakes were unintentional.30 It is likely a similar number of the taxpayers who paid too little on these transactions were also unintentional. Simplification would reduce the frequency of unintentional errors like these, improving compliance and reducing the tax gap.
The tax code’s complexity not only causes confusion on the part of taxpayers, it overburdens the IRS’ ability to assist taxpayers and clear up the confusion. “From FY 2004 to FY 2012, the number of calls the IRS received from taxpayers on its Accounts Management phone lines increased from 71 million to 108 million, yet the number of calls answered by telephone assistors declined from 36 million to 31 million,” according the Taxpayer Advocate Service. This represents a drop in calls answered from 87 to 68 percent. Over the same time period, the backlog of unanswered written correspondence nearly tripled from 357,151 to 1,028,539 cases.31 When taxpayers

DRAFT
8 | Tax Decoder
simply cannot get authoritative answers to their tax question, mistakes are bound to multiply, increasing the tax gap.
Olsen also points out that complexity can create opportunities for creative tax avoidance schemes.
Many law firms, accounting firms, and investment banking firms have made tens of millions of dollars by scouring the tax code for ambiguities and then advising taxpayers to enter into transactions, with differing levels of business purpose or economic substance, to take advantage of those ambiguities.32
The tax code’s complexity creates innumerable such ambigu-ities, costing the federal government in both revenue and legal expenses when the IRS challenges these creative schemes.
Numerous Preferences Result in High Standard Rates
The numerous preferences in the personal and corporate tax code come at a price. In order to collect adequate revenue while providing hundreds of different tax breaks, Congress must keep the standard tax rates artificially high.
Tax analysts often emphasize the effective tax rates paid by citizens, rather than standard rates, as the best measure of our nation’s tax burden. Effective rates measure the actual percentage of income paid in taxes after deductions, credits, exemptions, and other preferences, and are certainly important. Average effective rates for the country are not the only metrics that matter, however. The standard rates also have a significant impact on critical components of the economy.
The standard rates may not concern those lucky enough to qualify for multiple generous tax breaks. The rest of the taxpaying public, however, must bear the brunt of these high rates in order to make such tax breaks possible. This includes the innovators and entrepreneurs who have not yet secured a place in the Washington favor factory. High standard rates, therefore, are a built-in deterrent to the emergence of new industries in our economy.
For example, a plethora of tax advantages are available for alternative energy fuels and technologies—but only for the ones that have caught the attention of Washington politicians. New innovations in alternative energy may have to await the blessing of the D.C. political machine before they can obtain similar preferential tax treatment.
D.C. politicians are not noted for their technological
sophistication, nor their acumen in selecting investments. The generous tax advantages for Washington’s favored technologies come at the expense of higher rates on everyone else—including the innovators who may hold the key to America’s energy future. This unequal tax treatment may be enough to kill the very technologies that could solve our nation’s energy problems.
Expensive electric cars receive generous federal tax credits that primarily benefit upper-income taxpayers—in 2012, 70 percent of the credits went to taxpayers with $100,000 or more in income.33 Meanwhile, an emerging transportation technology, lightweight ultra-high mileage vehicles, are designed to retail for nearly half the price of traditional cars and get more than twice the fuel efficiency using only conventional gasoline.34 Such vehicles could bring the lowest-income Americans into the energy revolution. Unfortunately, these vehicles have not yet caught the fancy of Washington elites, so the vehicles’ sellers and buyers must continue to shoulder high effective tax rates. This additional tax burden could be the difference between success and failure for this and other promising technologies.
Lavishing tax advantages on Washington’s favorite technologies, while stifling new innovations with high standard rates, will slow down the nation’s progress in achieving long-term energy sustainability. Energy is just one area where Washington’s clumsy attempts at picking winners and losers are holding our nation back. Low, flat tax rates across the board will ensure all new technologies have the best possible shot at success, whether or not the cumbersome Washington political apparatus recognizes their value.
Even for relatively well-established industries, high standard rates may be an impediment to growth. A large, tax-savvy corporation might enjoy an effective tax rate of 12 percent, for example—but the same tax preferences it used to obtain that rate will not necessarily apply to new growth and profits in the company. Those new revenues will likely be subject to an effective rate closer to the high standard rate.
It is also important to note the impact of high personal tax rates on businesses. According to the National Federation of Independent Businesses, 75 percent of small businesses are pass-through entities that operate under the personal tax code. As much as a quarter of the private-sector workforce, meanwhile, is employed by a pass-through with more than $250,000 in earnings. High personal rates, even if applied only to “wealthy” taxpayers, can have a significant negative impact on small businesses throughout the country.35

8 | Tax Decoder Complexity of the Tax Code | 9
THE IRS HAS NO ESTIMATE OF HOW MUCH OF THE TAX GAP IS THE RESULT OF FRAUD.
Conclusion
The complexity of the tax code is extremely costly to individual taxpayers, our overall economy, and federal revenues. Billions are lost simply complying with the code, and economic distortions may be suppressing economic growth by entire percentage points every year. High rates discourage new industries and hinder growth. Meanwhile, complexity contributes to a tax gap nearly the size of the entire federal deficit, adding to our unsustainable debt and further undermining economic growth.
For all that, the IRS often is unable to ensure the preferences are accomplishing their intended purposes. Taken together, the costs of complexity are enormous.
The good news is this means simplifying the tax code can yield big payoffs for both taxpayers and the nation’s economy. At a time of sharp disagreement over how to stimulate economic growth and lower the deficit, tax reform and simplification may be the single most viable option to achieve these goals and strengthen the country’s economic future.
Tax Fraud The delta between the amount of federal taxes owed to the government and the amount of taxes actually collected in a
given year is known as the “tax gap.” As previously noted, the tax gap in FY 2014 will likely be an estimated $483 billion. The tax gap exists for a number reasons, such as complexity of the code, willful negligence, and unintentional errors.
Some of the tax gap, however, is due to deliberate, criminal fraud. The IRS defines tax fraud as “intentional wrongdoing on the part of a taxpayer, with the specific purpose of evading a tax known or believed to be owing.”36 The agency, however, has no estimate of how much of the tax gap is the result of fraud. Although the IRS has a specific unit dedicated to criminal investigations, it does not specifically compile the sums suspected or proven to be owed in criminal cases into a total annual figure. While the IRS keeps records of the individual cases it refers for criminal investigation, it does not track the outcome of these cases, and therefore does not know how many of those cases are proven to be cases of fraud, and how many turn out to be cases of inadvertent mistakes.37
According to CRS, at least three specific tax credits and two deductions have been identified as potential significant sources of fraud. These include the Earned Income Tax Credit, the American Opportunity Tax Credit, the Fuel Tax Credit, as well as the deduction for self-employment retirement plans and the deduction for alimony payments.38
CRS cautions the percentage of these claims that could be considered fraudulent is unclear. These five tax expenditures,
however, are not unusually complicated or difficult to comply with. Deliberate fraud may be the most logical explanation for the unusually high rate of improper payments in these tax programs. CRS also details three criminal schemes used to steal tax refunds.
Earned Income Tax Credit
The Earned Income Tax Credit (EITC) is the largest federal anti-poverty cash program in the country. The credit is provided to lower-wage working individuals, both with and without children. It is intended to encourage continued employment and help workers transition from lower-paying jobs into the middle class. It is one of a few major tax credits that are refundable, meaning it can supply cash payments from the Treasury even to those with no tax liability. The Joint Committee on Taxation estimates the credit will cost $69.2 billion in 2014, $60.6 billion of which will be direct spending from refundable credits.39
A 2014 audit by the Treasury Inspector General for

DRAFT
10 | Tax Decoder
Tax Administration (TIGTA), the inspector general for the IRS, found that between $124.1 billion and $148.2 billion in improper payments for the EITC were made between FY 2003 and FY 2013, with $13.3 to $15.6 billion in FY 2013 alone.40
American Opportunity Tax Credit
The American Opportunity Tax Credit (AOTC) provides a partially refundable tax credit of up to $2,000 for students enrolled in higher education programs. The credit was first made available in tax year 2009, and has been extended through 2017.
The program, unfortunately, is at high risk for fraud. At least 1.7 million taxpayers who claimed the AOTC had provided no supporting documentation that a student had attended an educational institution, according to Treasury Inspector General report. Another 371,000 claims involved students who were not eligibly enrolled, and 64,000 improperly received credits for students that had been claimed on other taxpayers’ returns. Even 250 prisoners improperly received the AOTC.
All told, TIGTA found “$3.2 billion in education credits ($1.6 billion in refundable credits and $1.6 billion in nonrefundable credits) that appear to be erroneous.” The report also notes that from tax years 2009 to 2012, “erroneous education credits could potentially reach $12.8 billion.”41
Fuel Tax Credit
The federal government levies excise taxes on a range of fuels to finance the Highway Trust Fund. The excise taxes are between 18.3 cents and 24.3 cents per gallon, depending on the type of fuel. Credits to offset the excise taxes are available for taxpayers that use the fuel for off-road purposes and several other uses. Eligible purposes include farming, off-highway businesses, commercial fishing, the busing of students, and the operations of nonprofit educational institutions.
According to TIGTA, about $176 million in fuel credits were claimed in 2011, but “over 20 percent of tax returns claiming a Fuel Tax Credit of $100 or more had questionable characteristics, such as little or no reported income from self-employment or farming.”42 TIGTA plans to follow up on these concerns with a more detailed audit.
Deduction for Self-Employment Retirement Plans
Self-employed individuals may claim deductions for con-tributions to three qualifying retirement plans, including a Simplified Employee Pension (SEP), a Savings Incentive Match
Plan for Employees (SIMPLE), or an individual 401(k) retire-ment plan. Deductions may be as large as $52,000 for the SEP; $12,000 plus three percent of compensation for the SIMPLE; or $17,500 plus 20 percent of net earnings for the 401(k).
A 2014 TIGTA audit found over 207,000 individuals who made $1.7 billion in SEP contributions in 2011. Some of these taxpayers, however, reported no self-employment income. TIGTA believes the IRS could recover $14 million by investigating similar claims, and could prevent $71 million in improper claims over five years by improving its controls.43
Deduction for Alimony Payments
Taxpayers making alimony payments under a divorce or separation agreement may deduct these payments from their taxable income, and taxpayers who receive alimony must report it in their taxable income.
In an audit of tax year 2010, TIGTA found 568,000 tax returns with more than $10 billion in deductions for alimony payments, but nearly half (47 percent) of the deduction amounts did not match the amount reported by the recipient. Either the payer of the alimony deducted more than they actually paid or the recipient reported less than they actually received. Either way, about $2.3 billion in income that should have been taxable to either the payer or the recipient was never taxed.44
Tax Refund Theft
The IRS provides billions of dollars in tax refunds every filing season. In recent years, criminals have become increasingly resourceful at claiming unauthorized cash refunds from the IRS through identity theft, prisoner fraud, and theft of employer identification numbers (EINs).
Identify Theft
Identify theft tops the list of the IRS’s “dirty dozen” tax scams for tax year 2014.45 This type of fraud has increased substantially in recent years. Criminals use the personal identifying information of other individuals, typically Social Security numbers, to claim unauthorized refunds. Often, criminals will select an individual not required to file a return, such as a child, deceased person, or individual with negligible income, and file a return in their name with fabricated earnings and withholdings designed to result in a refund. The targets are often unaware their identities had been stolen.
The IRS has numerous automatic filters and other procedures in place for detecting identity theft. In 2011, over a million returns were confirmed to be cases of identity theft,

10 | Tax Decoder Complexity of the Tax Code | 11
and nearly $8 billion in refunds were cancelled as a result. A 2013 TIGTA report, however, found 1.2 million individual tax returns for tax year 2011 that had many characteristics of fraudulent returns, but were not caught by the filters. Most of these returns used Social Security numbers; 141,000 of them used Individual Taxpayer Identification Numbers (ITINs).
The returns were associated with a total of $4 billion in refunds in tax year 2011 that may have been fraudulent. This staggering sum is actually less than the estimate for the previous year, when 1.5 million potentially fraudulent returns used social security numbers to obtain refunds worth $5.2 billion.46
Prisoner Fraud
Another tax fraud scheme uses the social security numbers of incarcerated individuals to obtain tax refunds. Fraudulent tax returns that used a prisoner’s social security number increased from more than 18,000 tax returns in 2004 to more than 186,000 tax returns in calendar year 2011. The returns are sometimes filed by the prisoners themselves and sometimes by others. The fraudulent filer generally inflates the income and withholding of the prisoner to
obtain refunds. The cost of the refunds associated with these returns increased from $68 million to $3.7 billion over the period studied.
Although two different federal laws have provided the IRS authority to share information with the Federal Bureau of Prisons and help prevent this fraud, as of January 2014 no agreement between the agencies was yet in place.47
Stolen Employer Identification Numbers
Taxpayers must provide a valid Employer Identification Number (EIN) with their tax return in support of the income and withholding information they report.
TIGTA, however, identified over 767,000 individual tax returns in tax year 2011 that used a stolen or falsely obtained EIN, generally to report false income and inflate fraudulent tax refunds. The returns used nearly 286,000 different EINs, most of which were stolen from an existing employer. About 8,000 were falsely obtained from the IRS by criminals purporting to represent employers. TIGTA estimated the IRS may be issuing nearly $2.3 billion a year in refunds for returns that are using EINs fraudulently.48
1 “Working Paper: When are tax expenditures really spending? A Look at Tax Expenditures and Lessons from the Tax Reform Act of 1986,” Mercatus Center, George Mason University, November 2011, http://goo.gl/8HHx9A
2 Commerce Clearing House (CCH) data provided to Taxpayer Advocate Service on Dec. 12, 2012. “2012 Annual Report to Congress, Volume One,” Taxpayer Advocate Service, December 31, 2012 http://goo.gl/b35KN9, p. 6.
3 “2012 Annual Report to Congress, Volume One,” Taxpayer Advocate Service, December 31, 2012 http://goo.gl/b35KN9, p. 6. 4 “Income Tax: Law, Regulations, Amendments, Rulings, Decisions, Opinions, from the Records of the Corporation Trust Company,” CCH Incorporated, October 2003.5 TAS bases these figures on the time the IRS estimates is required to fill out tax forms. They do not include the time required to complete other tax-related tasks. “2012
Annual Report to Congress, Volume One,” p. 5, Taxpayer Advocate Service, December 31, 2012, http://goo.gl/b35KN9 6 “2012 Annual Report to Congress, Volume One,” p. 5-6, Taxpayer Advocate Service, December 31, 2012, http://goo.gl/b35KN9 7 “Tax Preparation Services in the US: Market Research Report,” IBISWorld, March 2014, http://bit.ly/1uS48RK, archived webpage snapshot from September 19, 2014. 8 “Accounting Services in the US: Market Research Report,” IBISWorld, June 2014, http://bit.ly/1p9F4q5, archived webpage snapshot from September 19, 2014. 9 “Small Business Tax Rates and Tax Complexity,” National Federal for Independent Businesses Research Foundation, January 31, 2013, http://goo.gl/5gRl43 10 In practice, when Congress creates a tax break, it usually does not raise taxes on others—it simply allows the deficit and debt to increase. The negative effects of the
increased debt load on all U.S. citizens, however, similarly offsets the value of the tax break for the individual taxpayer. 11 “Corporate Tax Reform – The Time is Now,” Business Roundtable, April 15, 2013, p24, http://goo.gl/6KL7a3 12 Jane Gravelle, “Reducing Depreciation Allowances to Finance a Lower Corporate Tax Rate,” National Tax Journal, December 2011, http://goo.gl/gZSIwV , p. 1041. 13 “Simple, Fair, and Pro-Growth: Proposals to Fix America’s Tax System,” The President’s Advisory Panel on Federal Tax Reform, November 2005, http://goo.gl/4ZXR30
, Chapter 5, p. 100. 14 “Tax Policy. Summary of Estimates of the Costs of the Federal Tax System,” August 2005, http://goo.gl/mcy9Oo p. 4. 15 “Gross domestic product 2013,” GDP Ranking, The World Bank, http://databank.worldbank.org/data/download/GDP.pdf

DRAFT
12 | Tax Decoder
16 “Tax Expenditures: Compendium of Background Material on Individual Provisions,” Congressional Research Service, December 2012, http://1.usa.gov/17wTyob, p. 181-182.
17 “IRS Releases New Tax Gap Estimates; Compliance Rates Remain Statistically Unchanged From Previous Study,” IRS, January 6, 2012 http://goo.gl/sI6au8. 18 It is assumed that the tax gap over the course of a fiscal year is comparable to the tax gap over the course of a tax year. Revenue for FY 2014 was $3.021 trillion. $3.021
trillion is 86 percent of $3.513 trillion, so the federal government would legally have been owed about $3.5 trillion in FY 2014, if past trends held true. $492 billion is the difference between actual revenue and the theoretical amount owed for FY 2014. This figure is rounded up for an estimated tax gap in FY 2014 of $500 billion. The deficit for FY 2014 was $483 billion. Joint Statement of Treasury Secretary Jacob J. Lew and Office of Management and Budget Director Shaun Donovan on Budget Results for Fiscal Year 2014, Department of the Treasury, October 15, 2014, http://goo.gl/Rk5QRC
19 “Tax Gap: IRS Could Significantly Increase Revenues by Better Targeting Enforcement Resources,” GAO, December 2012, p6, http://goo.gl/IYzbxO 20 James R. White, Director, Strategic Issues, “Tax Gap: Sources of Noncompliance and Strategies to Reduce It,” GAO, April 19, 2012, p11, http://goo.gl/F8YByh 21 “Delinquent Taxes May Not Be Collected Because Required Research Was Not Always Completed Prior To Closing Some Cases As Currently Not Collectible,” Treasury
Inspector General For Tax Administration, August 25, 2014, http://goo.gl/FfXV73 22 Federal Employee/Retiree Delinquency Initiative (FERDI) report, Provided by the Internal Revenue Service to the Office of Senator Tom Coburn, September 30, 2013. 23 Spreadsheet from FERDI report, September 30, 2013. 24 James R. White, Director, Strategic Issues, “Tax Gap: Sources of Noncompliance and Strategies to Reduce It,” GAO, April 19, 2012; http://goo.gl/6PNCRs p3. 25 “Written Statement of Nina E. Olson, National Taxpayer Advocate, before the US Senate Subcommittee on Taxation and IRS Oversight, Hearing on the Tax Gap,” July
26, 2006, http://goo.gl/n6bBMm 26 “Written Statement of Nina E. Olson, National Taxpayer Advocate, Hearing on Complexity and The Tax Gap: Making Tax Compliance Easier and Collecting What’s
Due, Before The Committee On Finance, United States Senate,” June 28, 2011, http://goo.gl/4yZg4Z 27 “Privacy Impact Assessment - National Research Program,” IRS, http://goo.gl/LxswQd 28 “Written Statement of Nina E. Olson, National Taxpayer Advocate, before the US Senate Subcommittee on Taxation and IRS Oversight, Hearing on the Tax Gap,” July
26, 2006, http://goo.gl/khjBlF p4. 29 “Tax Gap: Multiple Strategies, Better Compliance Data, and Long-Term Goals are Needed to Improve Tax Payer Compliance,” GAO, October 26, 2005, http://goo.gl/
xOhwOJ , p. 12. 30 “Capital Gains Tax Gap: Requiring Brokers to Report Securities Cost Basis Would Improve Compliance if Related Challenges Are Addressed,” GAO, June 2006, http://
goo.gl/SqKZmJ 31 “2012 Annual Report to Congress, Volume One,” Taxpayer Advocate Service, December 31, 2012, http://goo.gl/b35KN9 p. 9. 32 “Written Statement of Nina E. Olson, National Taxpayer Advocate, Hearing on Complexity and The Tax Gap: Making Tax Compliance Easier and Collecting What’s
Due, Before The Committee On Finance, United States Senate,” June 28, 2011, http://goo.gl/4yZg4Z, p. 7. 33 “Table 2. All Returns: Tax Liability, Tax Credits, and Tax Payments, by Size of Adjusted Gross Income, Tax Year 2011,” Internal Revenue Service http://goo.gl/CbOCwo 34 Elio Motors, http://www.eliomotors.com/ 35 “Small Business Tax Rates and Tax Complexity,” National Federal for Independent Businesses Research Foundation, January 31, 2013, http://goo.gl/reeSHb 36 “Definition of Fraud,” 25.1.1.2 (01-23-2014), Internal Revenue Manual, IRS, http://goo.gl/0PXBJT 37 Memorandum provided by Gary Guenther, Analyst in Public Finance, CRS to the Office of Senator Tom Coburn, May 27, 2014. 38 Memorandum provided by Gary Guenther, Analyst in Public Finance, CRS to the Office of Senator Tom Coburn, May 27, 2014. 39 “Estimates of Federal Tax Expenditures for Fiscal Years 2014-2018,” Joint Committee on Taxation, August 5, 2014, p. 32, “Earned income credit,” http://goo.gl/3DIxfj 40 Memorandum provided by Gary Guenther, Analyst in Public Finance, CRS to the Office of Senator Tom Coburn, May 27, 2014. 41 “Billions of Dollars in Education Credits Appear to Be Erroneous,” Treasury Inspector General for Tax Administration, September 16, 2011, http://goo.gl/hmH2NS 42 Testimony of the Honorable J. Russell George, Treasury Inspector General for Tax Administration, “Oversight Hearing – Internal Revenue Service,” Hearing before
the Committee on Appropriations Subcommittee on Financial Services and General Government U.S. House Of Representatives, February 26, 2014, http://goo.gl/hfEIdZ
43 “Millions of Dollars in Potentially Improper Self-Employed Retirement Plan Deductions Are Allowed,” Treasury Inspector General for Tax Administration, March 20, 2014, http://goo.gl/ZTdTLg
44 “Significant Discrepancies Exist Between Alimony Deductions Claimed by Payers and Income Reported by Recipients,” Treasury Inspector General for Tax Administration, March 31, 2014, http://goo.gl/EKzudg
45 “IRS Releases the ‘Dirty Dozen’ Tax Scams for 2014; Identity Theft, Phone Scams Lead List,” IRS, February 19, 2014, http://goo.gl/M7FMR0 46 “Detection Has Improved; However, Identity Theft Continues to Result in Billions of Dollars in Potentially Fraudulent Tax Refunds,” Treasury Inspector General for
Tax Administration, September 20, 2013, http://goo.gl/0D6hTC 47 Testimony of the Honorable J. Russell George, Treasury Inspector General for Tax Administration, “Oversight Hearing – Internal Revenue Service,” Hearing before
the Committee on Appropriations Subcommittee on Financial Services and General Government U.S. House Of Representatives, February 26, 2014, http://goo.gl/YO6Pje , p. 24.
48 “Stolen and Falsely Obtained Employer Identification Numbers Are Used to Report False Income and Withholding,” Treasury Inspector General for Tax Administration, September 23, 2013, http://goo.gl/FTywhA

12 | Tax Decoder Who Pays Taxes and Who Does Not | 13
WHO PAYS TAXESAND WHO DOES NOT

DRAFT
14 | Tax Decoder
Federal Income Tax: Who Pays and Who Does Not
Americans paid over $1.7 trillion in individual and corporate income taxes to the federal government this year.1 This financial burden, however, is not shared by all citizens. Some corporations and individuals contribute little or nothing in federal income taxes.
The United States has a top federal corporate tax rate of 35 percent, and a combined federal and state top corporate tax rate of 39.1 percent—the highest in the industrialized world.2 It is certainly in the best interest of our nation’s economy to decrease this burden as much as possible. Congress should work strenuously to decrease penalties on innovation and job creation. This process, however, should be carried out in a fair and evenhanded manner. Rather than allowing the biggest tax breaks to go to those with the best lobbyists, lawyers, and accountants, Congress should work to decrease the tax bur-den consistently throughout the economy.
Many nonprofits have little to no net income, and therefore might not owe much in taxes even if they became legally taxable corporations.
This is not always true, however. For example, according to 2012 data, about 3,900 large 501(c)(3) public charities had a combined net income of more than $67 billion, an average of more than $17 million per organization that could be sub-ject to tax were it not for their tax-exempt status.9 For these organizations, tax exemption is quite lucrative.
On both ends of the economic spectrum there are nu-merous individual citizens who pay nothing in income taxes. Out of 145 million tax returns in 2011, 54 million (more than a third) had zero tax liability or were owed money back from the government. Most nonpaying filers are from the low-er-income tax brackets. Seventy percent of nontaxable re-turns had an AGI less than $20,000, according to IRS data,10 while 97 percent had an AGI below $50,000, which was roughly the U.S. median income in 2011.11
Overall, the bottom half of tax filers paid 2.9 percent of all federal income taxes in 2011, while the top 10 percent of in-come earners paid over 68 percent of the income tax burden.12
While it is fair to expect those who have more to pay more and for those who have less to pay less, every citizen should contribute in some manner.
Many of those who are not contributing, however, are among the highest earners who use creative accounting to leverage tax breaks and avoid paying taxes. While most high-income earners bear a significant tax burden, a small subgroup pays nothing in federal income taxes. In 2011, nearly 4.8 million tax filers earned $200,000 or more. Of these, 15,000 filers paid no taxes to any national govern-ment, despite reporting $5.7 billion in income.13It is import-
As it stands, the tax code is littered with provisions that allow businesses to chop away significantly at the 35 per-cent rate. Studies differ on the effective rates paid by U.S. corporations, but many of the most recent studies put the rate in the mid-to-high twenties, according to a Tax Foun-dation survey.3
This effective tax burden is likely higher than the inter-national average—but it is not shared among all compa-nies. Some companies even received a refund back from the government. Facebook, Inc., for example, brought in over $1 billion in U.S. pretax profits in 2012, yet received a combined $429 million refund from federal and state filings. The refund was largely due to the employee stock option deductions the company has claimed over the years.4
A recent study found that 111 of 288 Fortune 500 com-panies surveyed either paid zero taxes or received a refund in at least one year from 2008 to 2012. Notably, the tax ben-efits were concentrated in a small group. Together, the 288 companies in the Fortune 500 claimed about $364 billion worth of tax breaks from 2008 to 2012—yet just 25 of the companies claimed nearly half of this amount.5
For every tax break claimed by one company or indus-try, other businesses across the country must pay more. They pick up the financial slack created by the favored busi-nesses, and bear a disproportionately high effective rate, because Washington politicians have handed out targeted tax breaks to the well-connected.
There are also nearly 1.6 million tax-exempt entities in the country, including universities, hospitals, labor unions, and religious groups.6 While tax-exempt organizations must collect and match payroll taxes for their employees,7
they pay income taxes only in special circumstances.8
WHILE IT IS FAIR TO EXPECT THOSE WHO HAVE MORE TO PAY MORE AND FOR THOSE WHO HAVE LESS TO PAY LESS, EVERY CITIZEN SHOULD CONTRIBUTE IN SOME MANNER.

14 | Tax Decoder Who Pays Taxes and Who Does Not | 15
Millionaires and the Tax Code
Tax filers with $1 million or more in adjusted gross income (AGI) earned about 11 percent of all income, but paid 21 percent of all federal income taxes, according to IRS data from 2011.16 Yet over 1,600 who filed tax returns with an AGI of $1 million paid no income taxes at all!17
The reason is simple—Congress has littered the tax code with loopholes and giveaways intended to benefit selected special interests or activities. Wealthier Americans with more resources are better positioned financially to take advantages of these to lower and, in some cases, even eliminate their tax liability. But every tax benefit must be paid for or offset somewhere else through higher taxes on someone or something else, so in effect these tax code provisions are Robin Hood in reverse, taking from those who have less to give to those with more.
Most tax breaks work by allowing the taxpayer to set aside a certain amount of their income, protecting it from taxation. Because the top earners are subject to higher tax rates, these tax breaks are naturally more valuable for them. Most of these provisions are known as deductions.18
Many deductions and similar provisions are directed at mid-dle-class Americans, but are quite often leveraged by the wealthy.
Millionaires deducted $5.1 billion from their taxable income using the mortgage interest deduction in 2011. They protected another $7.3 billion from taxation with the investment interest expense deduction. This provision allows the taxpayer to deduct the interest paid on loans that are used to purchase taxable in-vestments, such as stocks.19 The benefits of this provision are particularly weighted toward wealthy taxpayers who get the ma-jority of their income from investments; over 58 percent worth of the deductions under this provision were claimed by millionaires.
Certain tax code giveaways largely benefit big businesses providing a product and service and the well-off who can afford to purchase it, at the expense of smalls businesses and middle class taxpayers who must foot the bill. A family, for example, that relies on public transportation to get to and from work is unlikely to qualify for the credit for buying an upscale electric vehicle they cannot afford. After all, you have to earn enough to purchase a premium car before you can qualify for the payout from the tax code for owning one. This is essentially an upside-down luxury tax that charges the working class for some of the niceties and extravagances enjoyed by the more affluent.
From deductions for yachts and second homes to tax credits for purchasing luxury cars, and write-offs for gambling losses, the tax code is spending billions of dollars subsidizing the upscale lifestyles of the well-off.
MORE THAN 15,000 MILLIONAIRES CLAIMED OVER $10 MILLION WORTH OF CHILD CARE CREDITS AND 1,300 MILLIONAIRES CLAIMED $9 MILLION WORTH OF QUALIFIED PLUG-IN ELECTRIC VEHICLE CREDITS IN 2012.
ant to note this report focuses on income taxes rather than payroll taxes. Many individuals, corporations, and nonprof-its who pay no income taxes do contribute to the payroll taxes that fund Social Security, Medicare, and unemploy-ment insurance; the federal government collected $948 billion in payroll taxes in FY 2014.14 Payroll taxes, however, fund insurance programs that directly benefit the workers who pay into them.15 They do not contribute to the shared common goods that must be provided by the federal gov-ernment, such as defense, the justice system, and other ser-vices provided through discretionary programs. The costs for these shared federal services should be shared, to some extent, by all taxpayers.
There may be valid legal reasons for some of the entities and individuals discussed above to have no income tax lia-bility. Yet, for every corporation, individual, or nonprofit entity that contributes nothing to funding the federal government, other taxpayers must pay more.
To avoid creating unfair burdens on the taxpaying public, Congress should ensure there is a legitimate reason these entities are not contributing to the federal income tax base—and where there is no adequate reason, Congress must ensure these entities pay a fair and reasonable amount in federal income taxes.

DRAFT
16 | Tax Decoder
Millionaires claimed another $4.8 billion worth of deduc-tions for gambling losses, deducted $67 billion for taxes paid to state and local governments, and deducted another $37 billion for charitable contributions.20 Millionaires also earned a total of $17.8 billion in tax-exempt interest income from municipal bonds, over 24 percent of such income earned by all tax filers.21
Some of these deductions are justifiable and some may not be—but it is important to remember that, dollar-for-dollar, all of them are worth significantly more to the wealthy than other taxpayers. A $1,000 deduction for a millionaire could reduce his final tax bill by as much as $396, depending on the individual tax return, while the same $1,000 deduction for a median-income taxpayer may reduce his final liability by only $250.22
Millionaires also obtained significant benefits from tax credits. Credits are generally worth the same to all taxpayers, regardless of income. Because they directly reduce tax liabilities, they are also generally worth more than deductions for all taxpayers.
More than 15,000 millionaires claimed over $10 million worth of child care credits and 1,300 millionaires claimed $9 million worth of qualified plug-in electric vehicle credits in 2012. They also claimed $329 million of the “prior-year minimum tax credit,” an obscure provision primarily used by options traders.23 Taxpayers usually use the provision to cancel out an alternative minimum tax caused by exercising an in-the-money stock option.24
The $143 million worth of tax subsidies for electric cars25
has been derided as “limousine liberalism” and “snobby and foolish.” One columnist questions “where does the federal government get off spending the average person’s tax dollars to help better-off-than-average Americans buy expensive new cars?”26
Nearly 9,000 millionaires claimed a total of $67.7 million in residential energy credits in 2012.27 The federal government offers a credit for energy-efficient home improvements that “covers expensive and somewhat exotic equipment and has no dollar limit,” according to MarketWatch, noting “unlike many tax breaks, there are no income limits on this one, so even billionaires are eligible.” The credit equals 30 percent of the cost of solar water-heating equipment, solar, wind, or fuel cell power equipment, or geothermal heat pump equipment—no matter how much these improvements cost. The tax credits can even be used to upgrade vacation homes. A smaller credit, limited to no more than $500, is also available for expenses such as insulation, storm doors, and high-efficiency air conditioning units.28
The wealthy are also more likely than other taxpayers to live and earn income overseas. Accordingly, millionaires claimed $8.9 billion worth of foreign tax credits in 2011—more than half the value of all foreign tax credits claimed that year.29, 30 The credit offsets taxes paid to foreign governments. Millionaires also wrote off $28.6 million using the foreign housing deduction, which allows U.S. citizens to deduct a portion of the costs of living overseas.31, 32
High-income taxpayers can combine these tax breaks to dramatically lower their tax liability. As discussed in other chapters, for example, some wealthy taxpayers rely on tax-exempt interest and other deductions to cut their tax bill to zero.
It is unfair to take more from those who have less to give more to those who already have more. Whenever Congress creates a deduction, credit, loophole or other distortion, this is exactly what happens. This is the unintended consequence of distorting the tax code to provide preference and favor to certain products, companies and individuals rather than simply being fair to everyone.

16 | Tax Decoder Who Pays Taxes and Who Does Not | 17
1 “Monthly Budget Review for September 2014,” Congressional Budget Office, p. 2, http://goo.gl/fT2XtN. 2 “The U.S. Has the Highest Corporate Income Tax Rate in the OECD,” The Tax Foundation, January 27, 2014, http://goo.gl/4NYVlw. 3 Phillip Dittmer, “U.S. Corporations Suffer High Effective Tax Rates by International Standards,” The Tax Foundation, September 2011, p. 7, http://goo.gl/R7KyRf. 4 “Facebook’s Multi-Billion Dollar Tax Break: Executive-Pay Tax Break Slashes Income Taxes on Facebook— and Other Fortune 500 Companies,” Citizens for Tax Justice,
February 14, 2013, p. 2, http://goo.gl/lxFXOZ. See also Senator Coburn’s “Wastebook 2013,” December 2013, p. 26, http://goo.gl/pF0zaB. 5 “The Sorry State of Corporate Taxes,” Citizens for Tax Justice, February 2014, p. 6; http://goo.gl/yA29WN. 6 “Data Book,” IRS, October 1, 2012, Table 25, p. 56; http://goo.gl/U8fwiB. 7 “Exempt Organizations: What Are Employment Taxes?” IRS, July 15, 2014; http://goo.gl/f9Bcsh. 8 Tax-exempt organizations often must pay the Unrelated Business Income Tax (UBIT) on income that is not substantially related to their exempt purpose. “Unrelated
Business Income Defined,” IRS, Oct. 16, 2014; http://goo.gl/wqsY6A. 9 Includes organizations with more than $100 million in total assets. Table generated from the website of the National Center for Charitable Statistics (NCCS). “NCCS
Public Charities Table Wizard,” http://goo.gl/jYecX9. 10 Calculations based on Table 1.2. “Individual Income Tax Returns 2011,” Publication 1304, revised Aug. 2013, IRS, p. 36-41, http://goo.gl/LT99B8. 11 Noss, Amanda, “Household Income for States: 2010 and 2011,” U.S. Census Bureau, September 2012, p. 5; http://goo.gl/Y7c9L0. 12 “Table 5. All Individual Returns Excluding Dependents: Number of Returns, Shares of Adjusted Gross Income (AGI) and Total Income Tax, AGI Floor on Percentiles
in Current and Constant Dollars, and Average Tax Rates, by Selected Expanded Descending Cumulative Percentiles of Returns Based on Income Size Using the Definition of AGI for Each Year, Tax Years 2001-2011,” Individual Income Tax Rates and Tax Shares, SOI Tax Stats, IRS, http://goo.gl/pAam6a.
13 The IRS concept of “expanded income” is used in this statement instead of AGI because AGI does not include tax-exempt interest and other significant tax preferences on nontaxable returns. Bryan, Justin, “High-Income Tax Returns for 2011,” Statistics of Income Bulletin, IRS, Table 6, p. 80, http://goo.gl/eB6gCR.
14 “Monthly Budget Review for September 2014,” Congressional Budget Office, p. 2; http://goo.gl/ukR0rS. 15 Corporations also pay payroll taxes on behalf of their employees. It may be argued, however, that these taxes are actually borne by employees, since they are part of
the corporation’s total cost of hiring an employee, and are therefore passed on to the employee through lower wages. 16 For purposes of this section, “millionaires” refers to tax filers with $1 million or more of AGI, unless otherwise noted. “Individual Income Tax Returns 2011,” Publication
1304, revised Aug. 2013, IRS, Table 1.2, p. 36-41; http://goo.gl/HvzFFX. 17 Calculations based on Table 1.2. “Individual Income Tax Returns 2011,” Publication 1304, revised Aug. 2013, IRS, p. 36-41; http://goo.gl/HvzFFX. 18 Such provisions may also be called exemptions or exclusions. A tax credit, by contrast, reduces the taxpayer’s final tax bill by the same dollar amount regardless of the
tax rate they face. Only a minority of tax breaks are credits, however. Most tax breaks, therefore, are inherently more advantageous to high-income taxpayers that pay high rates.
19 Rande Spiegelman, “Investment Expenses: What’s Tax Deductible?” Charles Schwab, March 6, 2014, http://goo.gl/PRbSeD. 20 “Table 3. Returns with Itemized Deductions: Itemized Deductions by Type and by Size of Adjusted Gross Income, Tax Year 2011,” SOI Tax Stats, Internal Revenue
Service, http://goo.gl/BtIxwL. 21 Tax-exempt bond income is even more valuable to millionaires than the tax deductions discussed above, since it does not trigger Alternative Minimum Tax adjustments.
Bryan, Justin, “High-Income Tax Returns for 2009,” Statistics of Income Bulletin, 2012, p. 15; http://goo.gl/O8UNc7. 22 Assumes an above-the-line deduction not subject to the Pease limitation. The millionaire is assumed to be in the 39.6 percent bracket and median-income taxpayer
in the 25 percent bracket. 23 “Table 3.3 All Returns: Tax Liability, Tax Credits, and Tax Payments, by Size of Adjusted Gross Income, Tax Year 2012,” available from “SOI Tax Stats - Individual
Statistical Tables by Size of Adjusted Gross Income,” IRS, Aug. 22, 2014, http://goo.gl/ZVCo4Q 24 Bill Bischoff, “An upside to the alternative minimum tax,” MarketWatch, April 2, 2014, http://goo.gl/y18EBg. 25 Includes qualified electric vehicle credit and qualified plug-in electric vehicle credit. “Table 3.3 All Returns: Tax Liability, Tax Credits, and Tax Payments, by Size of
Adjusted Gross Income, Tax Year 2012,” available from “SOI Tax Stats - Individual Statistical Tables by Size of Adjusted Gross Income,” IRS, Aug. 22, 2014, http://goo.gl/ZVCo4Q
26 Charles Lane, “Unaffordable at Any Speed,” Slate, July 30, 2012, http://goo.gl/YU18Se. 27 “Table 3.3 All Returns: Tax Liability, Tax Credits, and Tax Payments, by Size of Adjusted Gross Income, Tax Year 2012,” available from “SOI Tax Stats - Individual
Statistical Tables by Size of Adjusted Gross Income,” IRS, Aug. 22, 2014, http://goo.gl/ZVCo4Q 28 Bill Bischoff, “Even billionaires would qualify for these energy-saving tax credits,” MarketWatch, Nov. 4, 2014, http://goo.gl/TpypiJ. 29 “Table 2. All Returns: Tax Liability, Tax Credits, and Tax Payments, by Size of Adjusted Gross Income, Tax Year 2011,” SOI Tax Stats, Internal Revenue Service, http://
goo.gl/iZUZxy. 30 “Foreign Tax Credit - How to Figure the Credit,” Internal Revenue Service, http://goo.gl/yy1jeb. 31 “Foreign Housing Exclusion or Deduction,” Internal Revenue Service, http://goo.gl/bccVF6. 32 “Table 1. All Returns: Sources of Income, Adjustments, Deductions and Exemptions, by Size of Adjus

DRAFT
18 | Tax Decoder
AGRICULTURE

18 | Tax Decoder Agriculture | 19
Agriculture
American farmers are the most efficient and innovative agricultural producers in the world. They provide a safe, abundant source of food for all Americans and are leaders in food exports to every corner of the globe. With over $350 billion in annual sales1 and 750,000 individuals directly employed,2 the American farming sector is a vital compo-
nent of the American economy and is essential to our well-being as a nation.
advantages afforded to farmers in the tax code and examine how other taxpayers fare in comparison.
Federal agricultural tax policy, born out of the Great Depres-sion and incrementally amended since, is a composite of the many highs and lows experienced by farmers and ranchers over the past century. While the farmer has adapted to constantly changing times and shaken off outdated practices of the past, Congress has failed to do the same. The tax code is replete with policies and incentives aimed squarely at yesterday’s challenges, largely ignoring the realities of today’s farming industry. While each provision has developed firm constituencies and advocates, far too many have outlived their usefulness. And all too often, these tax preferences and procedures are no longer in the interest of the nation as a whole, or the farm economy specifically.
Meanwhile, agricultural policy beyond the tax code is also in need of an overhaul; for example, according to the Government Accountability Office (GAO), the U.S. Department of Agriculture ran 60 programs to provide financial assistance to farmers, costing at least $114 billion from 2008 to 2012.4 These programs, such as crop insurance and commodity subsidies, cost billions of dollars every year and are also designed to accommodate the volatile nature of the farming profession. Yet, the tax code provisions are intended to do the same. Congress should routinely evaluate both and determine the most effective and equitable approach to federal farming assistance.
It is apparent politicians in Washington are far less adapt-able to changing times than the farmers and ranchers they represent. This section reviews major federal tax provisions aimed at improving the American farm economy or accom-modating the unique challenges faced on the farm.
Agriculture (in millions) FY 2014 FY 2014 - FY 2018Expensing of Certain Capital Outlays $400 $1,700
Exclusion of Cost-Sharing Payments $50 $100
Exclusion of Farm Debt Cancellation from income $100 $400
Income Averaging for Farmers $50 $200
Five-Year Carry-Back Period for Net Operating Losses Attributable to Farming
$100 $400
Amortization and Expensing of Reforestation Expenditures
$200 $1,200
Expensing of Multiperiod Timber Growing Costs $200 $1,500
Capital Gains Treatment of Timber Income $500 $2,600
Total $1,600 $8,100
This remarkable productivity is not achieved easily. Farming is subject to extreme volatility driven by unpredict-able weather and roller coaster-like price fluctuations for in-puts such as feed, fertilizer, and shifting trade policies. For example, damaging droughts can be replaced by devastating floodwaters, causing supply shortages. Meanwhile, times of abundant exports can be reversed with sudden changes in international trade policies or politics. The successful pro-ducer often times is equal parts farmer, businessman, and risk manager.
These volatile conditions can produce equally erratic swings in income, resulting in spikes in tax liabilities when in-comes are high. Various tax accommodations have been en-acted for farmers to smooth out these potentially detrimental tax effects. This special treatment understandably raises ques-tions. Although the income of farmers may be unpredictable, there is no shortage of professions outside of the agricultural sector that experience dramatic variations in income.
A few agricultural tax breaks are based on a spurious, outdated assumption that farmers lack the sophistication and resources of other taxpayers and therefore require pa-ternalistic treatment in the tax code. Yet, in 2010, average farm household income was 25 percent higher than that of the average U.S. household.3 Additionally, even though many different sectors of the economy may experience drastic swings in income year-to-year, farmers benefit from feder-ally subsidized programs, such as crop insurance subsidies, designed to smooth out these fluctuations.
By no means is any of this to suggest that farmers do not “pay their fair share” of the tax burden; far from it. Rather, the main objective of this chapter is to explore the unique

DRAFT
20 | Tax Decoder
Expensing of Certain Capital Expenditures
Most taxpayers may not expense costs associated with long-term improvements to their property. That is, they may not immediately deduct the costs in the year they were in-curred. IRS Code Section 263, and other related regulations, disallow expensing for capital expenditures made to increase the value of any property whose useful life exceeds one year.
These expenditures must instead be capitalized, which means they may need to be deducted over more than one year. Day-to-day short-term business expenses, on the other hand, may be expensed. Although farmers are generally not allowed to deduct capital expenditures to improve their property, the tax code allows them to deduct certain costs that at first glance appear to be capital expenditures.
For example, farmers may elect to deduct expenditures such as feed and fertilizer that increase the long-term value of their property. Farmers planting orchards, building farm facilities for their own use, or producing goods for sale with longer production periods also may elect to deduct these costs. Additional costs that otherwise would be considered capital expenditures, but that may be deducted immediately by farmers, include certain soil and water conservation expenses.5
The 2008 Farm Bill included costs associated with site and habitat improvements that will benefit endangered species on farm land to the list of deductible expenditures for farmers.6 Farmers may choose to expense these costs even if they are for investments intended to be harvested beyond the end of the year.
The tax code provides the agriculture industry with expensing for the following:
• soil and water conservation expenditures; • site or habitat improvements that benefit the recovery
of a federally endangered or threatened species; • costs of raising dairy and breeding cattle; and • fertilizer and soil conditioner costs.
Not including the habitat improvement expense, these provisions will cost $400 million in FY 2014 and $1.7 billion from FY 2014 through FY 2018.7
With their ability to take deductions on farming operation improvements in the year they are incurred, farmers are shielded from inflation. Due to the time value of
money, a dollar today is worth more than a dollar a year from now. Virtually all taxpayers would benefit from receiving immediate deductions on improvements to their businesses as opposed to capitalizing and depreciating property over its useful life.
This principle may manifest itself in a number of different forms. For most taxpayers, if improvements have a useful life of over a year and raise the value of the property, the additions are not expensed but instead must be capitalized and depreciated. Farmers thus receive an advantage in the start-up and expansion phases of their businesses, as they are among the few entities that can defray substantial upfront costs through immediate deductions.
For example, if a farmer wishes to expand operations to start selling apples, several tax options arise. On top of the temporary maintenance and fertilizer costs, the farmer could immediately deduct, or “expense,” all the costs for the new fields, orchards, and storage facilities. These investments will bear fruit years down the road.
Questions often arise as to whether a farmer’s expenditures simultaneously qualify for the advantage of immediate deductions as well as capital expensing. This uncertainty exists because many of the costs of running a farm are identical to the costs of creating a farm. For example, a farmer feeds his mature cows to obtain continued milk
production, but on the other hand he also gives the same feed to his calves to bring them to maturity.8
As a result, it can be quite difficult in some circumstances to determine whether a particular cost may be expensed. Disputed cases between taxpayers and the IRS over expensing require courts to conduct an extensive analysis into “the precise path the taxpayer-farmer [sic] actually took” in incurring the cost and whether it was “purely capital in nature.”9
Exclusion of Cost-Sharing Payments
The federal government has a number of programs that reimburse taxpayers for costs associated with certain land improvements. These programs generally relate to improvements that further conserve and protect the environment, improve forests, or provide habitats for wildlife. Grants received under these programs are excluded from the recipient’s gross income.
VIRTUALLY ALL TAXPAYERS WOULD BENEFIT FROM RECEIVING IMMEDIATE DEDUCTIONS ON IMPROVEMENTS TO THEIR BUSINESSES AS OPPOSED TO CAPITALIZING AND DEPRECIATING PROPERTY OVER ITS USEFUL LIFE.

20 | Tax Decoder Agriculture | 21
The exclusion of these grants, and subsequent reduction in taxes paid, provides a general incentive for various conservation and land improvement projects that may not have otherwise been undertaken. “To qualify for the exclusion, the payment must be made primarily for the purpose of conserving soil and water resources or protecting the environment, and the payment must not produce a substantial increase in the annual income from the property in question.”10
Programs qualifying for this exclusion have included the federal rural clean water program, the rural abandoned mine program, the water bank program, the emergency conservation measures program, the agricultural conservation program, the Great Plains conservation program, the resource conservation and development program, and the forestry incentives program.11
This exclusion costs less than $50 million each year, and will result in lost revenue of $100 million from FY 2014 to FY 2018.12
“The partial exclusion of certain cost-sharing payments is based on the premise that the improvements financed by these grants benefit both the general public and the individual landowner,” according to the Congressional Research Service (CRS).13 This tax code provision seeks to exclude the approximate portion of the conservation project serving a public benefit, while taxing the portion primarily benefitting the landowner.
“The income tax exclusion for certain cost-sharing payments was one of the tax changes made under the Revenue Act of 1978. The rationale for this change was that in the absence of a tax break many of these conservation projects would not be undertaken. In addition, since the grants are spent on conservation projects exclusively, the taxpayer would not necessarily have the additional funds needed to pay the tax on the grants if they were not excluded from taxable income.”14
With this tax treatment it is not possible to identify the true value of the public benefit produced by the conservation or environmental improvement to a taxpayer’s land, according to a 2012 CRS report. Accordingly, “the exclusion of the cost-sharing payment probably exceeds the value of the public benefit and hence, the excess provides a subsidy primarily benefitting the landowner.”15
Exclusion of Farm Debt Cancellation from Income
When a lender cancels or forgives an individual’s debt, the IRS considers the cancelled debt to be taxable income unless it meets certain requirements.16 Although taxpayers normally must pay income tax on cancelled debts, farmers are not immediately required to pay this tax if they fulfill certain criteria. Instead, a farmer may reduce his basis in
any property for which a debt was forgiven, allowing him to defer paying tax on the forgiven debt until the property is sold. The reduced basis will result in a larger tax bill upon the eventual sale of the property, but this is more advantageous than paying the tax when the loan is forgiven.
This carve-out was enacted as part of the Tax Reform Act of 1986. At the time, the intended purpose of the provision was to avoid tax problems that might arise from other legislative initiatives designed to alleviate a credit crisis in the agricultural sector. As explained in the CRS’ Compendium of Background Material on Individual Provisions, “Congress was concerned that pending legislation providing federal guarantees for lenders…would cause some farmers to recognize large amounts of income when their loans were canceled. …These farmers might be forced to sell their farmland to pay the taxes on the canceled debt.”17
In FY 2014, this provision cost an estimated $100 million, and will cost at least $400 million from FY 2014 through FY 2018.18
Even though this exclusion does not fully exempt a farmer from paying for the cancellation of his debts by virtue of his property’s decreased basis, it is a tax expenditure because it allows the farmer to defer his tax bill until the property to which the debt was attached is sold. Allowing farmers to wait to pay these taxes provides farmers a financial benefit courtesy of the time value of money principle.
To qualify for this exclusion, the farm debt in question must meet two tests, it:
must be incurred directly from the operation of a farming business, and at least 50 percent of the taxpayer’s previous three years of gross receipts must come from farming.” Additionally, “those canceling the qualified farm debt must participate regularly in the business of lending money, cannot be related to the taxpayer who is excluding the debt, cannot be a person from whom the taxpayer acquired property securing the debt, or cannot be a person who received any fees or commissions associated with acquiring the property securing the debt.19
Income Averaging for Farmers
With passage of the Taxpayer Relief Act of 1997, Congress recognized that income from farming could fluctuate dramatically from year to year, independent of actions taken by taxpayers. To compensate for these variances, Congress created the income averaging system, allowing farmers to calculate their current year income tax by averaging over a three-year period all or a portion of their income from farming. Seven years later, Congress extended this benefit to commercial fishermen.20
Income tax for a farmer making this election is calculated

DRAFT
22 | Tax Decoder
by taking the sum of:1. the taxpayer’s current year tax, calculated without
including “elected farm income,” and2. the extra tax in each of the three previous years
that results from including 1/3 of the current year’s “elected farm income.”
The tax burden computed using income averaging does not apply for purposes of the alternative minimum tax (AMT).21 The Office of Management and Budget assumes this provision will cost an estimated $130 million in 2015.22
However, because of differing assumptions, the Joint Committee on Taxation estimates the provision costs less than $50 million annually and cost $200 million from FY 2014 through FY 2018.23
Income averaging was enacted to remedy the unintended consequences of the progressive tax code. Given that the agricultural sector often witnesses drastic fluctuations in its profit margins from year to year as a result of factors such as weather, it was argued that tax burdens for those engaged in farming could sway as wildly as their crops caught up in a violent storm. Supporters of this tax expenditure argue that income averaging, while not providing insurance against these storms, at the very minimum provides a mechanism to establish stability for the farmer with respect to his tax returns.
While farmers undoubtedly experience fluctuations in their incomes year to year due to factors out of their control, many other fields experience similar changes, but do not receive the assurance of a more stabilized tax burden across time. It is unclear why Congress chooses to extend to farmers and fisherman this guarantee while other industries subject to similar profit swings do not receive this benefit.
Additionally, the tax code does not allow for upward income averaging. Upward income averaging would mean that taxpayers who experienced major reductions in their annual incomes would also qualify for income averaging. This would allow them to mitigate sharp reductions in their current year incomes by reducing their current year taxes to reflect taxes that had already been prepaid in previous years when their incomes were higher.
Five-Year Carry-Back Period For Net Operating Losses Attributable to Farming
A net operating loss, which is the amount by which business and certain other expenses exceed income for the year, may be carried forward and deducted from other income for twenty years following the year in which the loss occurred. However, it may, at the taxpayer’s election, be carried back to earlier years in which there was positive income. This is a standard tax practice employed by most businesses.
However, as part of the effort to smooth over large swings in profits and losses, Congress has granted farmers extreme flexibility regarding how far back they may carry back their losses. Although farmers may carry back their losses five years, for most taxpayers the carryback period is limited to the previous two years. Exceptions have been made for small businesses in federally declared disaster areas, which may carry losses back three years.
Additionally, the American Recovery and Reinvestment Act of 2009 and other measures have temporarily provided certain businesses with five year carry-back.24 Farmers, however, remain the only industry with a permanent five year carry-back allowance. While the special five-year carryback applies only to losses incurred in a farming business, the losses may be used to offset taxes paid on any type of income earned by the farmer.25
This provision will cost an estimated $100 million in FY 2014, and $400 million from FY 2014 through FY 2018, according to the Joint Committee on Taxation.26
The five-year carryback for farm losses was intended to compensate for the excessive income fluctuations to which farmers were purportedly subject. This justification is a common theme for many of the tax benefits farmers are granted, but there is little evidence to suggest that farms experience income fluctuations any greater than other small businesses. “Farm losses may offset taxes on non-farm income, so some of the benefit will accrue to persons whose income is not primarily from farming.”27
The potential abuse of this provision through the ability to offset taxes on non-farm income represents an acute unfairness when comparing farmers with all other taxpayers. This inequality is in addition to the generous assistance farmers receive from the federal government with respect to crop insurance.
Absent concrete findings that farmers do indeed experience fluctuations in their incomes greater than those of other taxpayers, the five-year loss carry-back period should be changed to two years, consistent with the rest of the tax code.
Farmer vs. Small Business Owner: A Case Study in Income Averaging & Carry-Back Losses
Through a combination of income averaging and five-year carry-back losses, farmers are given a huge strategic advantage over all other taxpayers in their ability to optimally time when their income is taxed. In a progressive tax structure in which the first dollar of all taxpayers’ incomes is taxed at the same rate, with the rate of taxation gradually increasing in brackets as incomes rise, the ability to time when income gets taxed is a crucial tool in minimizing one’s tax bill.

22 | Tax Decoder Agriculture | 23
Year of Crop Crop Yield
Year 1 Bumper
Year 2 Drought
Year 3 Drought
Year 4 Drought
Year 5 Bumper
Year 6 Drought
Only farmers are given the option to time their profits through income averaging. This treatment gives farmers the option to shift profits from a particularly lucrative year onto their tax liability for the previous three years in which they reported less income. By doing so, the farmer is better able to avoid higher income tax brackets in the particular year he reaps a bumper crop by spreading his income across years in which he experienced lower profits (or even losses).
Similarly, farmers may take losses and distribute them retroactively over a longer time span than granted to ordinary taxpayers. Although all taxpayers have some flexibility to carry back losses, most only have the option to do so for up to two years. Farmers are given over double the flexibility due to their ability to carry back losses up to five years.
This decisive advantage may be better understood in a hypothetical case study. Consider a scenario during a volatile six-year span in which a farming community witnesses an excellent crop yield (known as a “bumper” crop) in some years, while in other years experiences record droughts, resulting in a low crop harvest. Although farmers and their crop yields would be most directly affected by these weather patterns, business owners located in communities with local economies highly reliant on agriculture would find their revenues rising and falling with the economic fortunes of their farmer neighbors. For example, if a poor crop yield left farmers in a town with relatively little pocket change to spend in their communities, it stands to reason that local merchants would likely suffer to some degree as well.
Assume all other years, previous and subsequent to this period, represent normal crop yields with little variation:
A look at the tax filing options available to both a farmer and a different small businessperson in two of these years,
five and six, reveals the sizable preferences given to the farmer over all other taxpayers.
Year Five
The discrepancy between how the tax code treats the
farmer and all other taxpayers could not be clearer than in this example. With income averaging available to the farmer, he can take the excess profits from this season and spread them across years two through four, where he would have experienced little if any profit from growing crops in drought conditions. In fact, if he experienced negative incomes during any of those three previous years, profits from year five could be distributed to that particular drought year with no tax liability whatsoever as long as the drought year’s income was still under $0. Even if the farmer had averaged his income over the previous years to reflect a profit in the drought years, this move would almost certainly have put him in a lower tax bracket.
The small business owner, even though he most likely ex-perienced increased sales volume in year five due to all the farmers in his community spending their excess cash, would have no similar recourse. Even though he may have experi-enced drought-induced financial difficulty during the previ-ous three years, income averaging applies only to farmers.
Year Six
This situation illustrates the extra flexibility farmers are given with respect to carry-back losses. Suppose a farmer reports a net operating loss in year six, with so few sales that he goes in the red for the year. Although this scenario is obviously not a situation he wants to be in, the farmer can find some relief in the tax code. By being able to carry back his losses from year six’s drought five years, the farmer can readjust his tax returns for both years one and five.
A small business owner experiencing similar yearly patterns in his income would be able to carry back his losses as well, but he would have fewer options. As a non-farmer, the tax code would only allow the carry-back loss to adjust his year 5 tax return downward due to the year 6 loss.
This limits the small business owner in his tax planning options. As seen in the chart, he is precluded from carrying back his losses to year one, a year in which he experienced net positive income. When compared with the farmer in this scenario, the small business owner is left with half as many carry-back options.
There are a few ramifications that flow from this case study. First, imagine if the small business owner’s losses in year six exceeded his gain in year five. This means he would not be able to carry back all his losses from year six to year five, which means some of that year’s losses may go to waste in that they might not be able to offset positive net income.28
Second, consider a scenario in which both the farmer and businessperson experienced huge gains in year one that put them in the 33 percent tax bracket, but only modest gains in year five that ended up only putting their top dollar in the 25 percent bracket. By giving the farmer the ability to carry his losses up to five years into the past,

DRAFT
24 | Tax Decoder
the farmer can first target with his carry-back allowance the income from year one that would have been in the 33 percent tax bracket. By giving the farmer a longer span of time from which to choose loss distribution, the tax code not only potentially increases the amount of income the farmer can offset but also possibly gives the farmer more options to lower his effective tax rate.
Not all cases will conform to the hypothetical crop yields, tax brackets, and other parameters set forth above. Some cases may favor the farmer more than in this example, while others may present a situation in which both the farmer and the small businessperson can both carry back their losses in similar ways. Regardless, it is important to understand the tax code provides farmers with exclusive options to strategically time their tax payments, options which are not available in other sectors of the economy. Doing so allows them to maximize their use of tax advantages to reduce their own tax liability.
Tax Benefits for Timber Production
Timber growers have access to favorable tax treatment at several stages in the timber production process. In most industries, when a company incurs costs to produce prop-erty, such as labor, material, or equipment expenses, it must capitalize these expenses, claiming tax deductions for them when the property is sold.29 Timber operators, however, have the ability to expense these costs in the year they are incurred, or over significantly shorter periods than would be required under the normal tax rules.
Amortization and Expensing of Reforestation Expenses
Timber growers may claim favorable deductions when they plant a new stand of timber30 or replant a property where prior growth has been harvested.31 Expenses eligible for the tax break include costs connected to reforestation such as seeds
or seedlings, site preparation, labor, and tools, including equip-ment such as tractors, trucks, and tree planters. The operator may immediately expense the first $10,000 of these costs for each property that will contain trees in significant commercial quantities.32 If there are multiple co-owners of the same prop-erty, each one may claim the full $10,000 worth of expensing for the same property.33 The $10,000 threshold was set in 1980 and has not been adjusted for inflation since then, making the value of the expensing “comparatively inconsequential,” ac-cording to CRS.34
Any planting expenses above the $10,000 threshold may be amortized over a period of seven years. This is more fa-vorable treatment than the normal capitalization rules. Since timber stands typically grow over a period of up to 50 years,35
the normal capitalization rules would typically require the amortization of the initial planting expenses over a period of five decades.36 Only timber to be used in the commercial production of timber products is eligible for the expensing and seven-year amortization, so ornamental and Christmas trees are not eligible.37, 38
This provision is estimated to cost $200 million in FY 2014 and $1.2 billion from FY 2014 through FY 2018.39
Expensing of Multiperiod Timber-Growing Costs
Any costs associated with maintaining the timber stand after planting are eligible for immediate expensing, including disease and pest control, brush control, and fertilization.40 In-direct costs associated with maintenance are also eligible for expensing, along with deductions for interest costs and prop-erty taxes that are available to other industries.41 Trees grown for fruit, nuts, or other crops are not eligible for this tax ben-efit. Ornamental evergreen trees (read: Christmas trees) are only eligible if they are at least six years old when cut.42
This provision is estimated to cost at least $200 million in FY 2014 and $1.5 billion from FY 2014 through FY 2018.43
Timber operators receive preferential
tax treatment when planting, growing, and
selling trees for lumber.

24 | Tax Decoder Agriculture | 25
Capital gains treatment of timber income
When the timber is cut, eligible operators may treat the income from the timber as a capital gain rather than ordinary income. The rules surrounding whether timber sales may be classified as capital gains can be difficult to navigate. If timber is held as “investment property,” its sale may qualify as capital gains, but if the timber is held “primarily for sale to custom-ers,” its sale constitutes ordinary income. However, even these rules are not iron-clad. The sale of Christmas trees, as long as they are more than six years old when cut, qualify as capital gains as long as they are being sold to customers for “orna-mental purposes.”44
Ordinary C corporations are not eligible for the low 15 per-cent capital gains tax rate, so this benefit is not available to the large publically traded timber companies.45 The taxpay-er must also have owned the rights to the trees for at least a year.46 Some tax scholars also consider timber growers to have a tax advantage because they do not pay any tax until their timber is cut or sold, allowing them to effectively defer taxa-tion of their timber assets for decades.47
This provision, which includes a special tax rate for coal and iron ore gains as well, is estimated to cost at least $500 million in FY 2014 and $2.6 billion from FY 2014 through FY 2018.48
Analysis
The original rationales for the special tax treatment of timber are unclear, but the two main reasons appear to be the ecological benefits of growing forests, and tax accounting reasons.
According to law professor John Bogdanski, the tax benefits for timber “recognize and promote the beneficial ecological effects of growing forests.”49 CRS also notes, “Supporters of the tax subsidy argue that timber-growing provides benefits to society in general, such as an improved environment, recreational opportunities, and natural vistas.”50
There are some concerns with this approach. Timber operators plant forests to cut and sell the wood, not to improve the environment or provide recreation. Any incidental environmental benefits from timber forests will
last only until they are harvested. Many forests intended for timber also lack the biodiversity of natural forests, making them less beneficial to the ecosystem and not ideal for recreation and scenery.51
The tax benefits specifically related to expensing may be explained by a technical tax accounting rationale. In general, costs related to producing goods must be capitalized and amortized, with the deduction taken over a period of years, while other “ordinary and necessary” business costs may be expensed in the year paid or incurred.52 According to CRS, “Permitting the costs of timber-growing to be expensed was apparently part of a general perception that these were maintenance costs, and thus deductible as ordinary costs of a trade or business.”
Recommendations
As with other areas of the code, Congress should not pass out special tax breaks to well-connected industries. It is the role of the market, not the government, to choose winners and losers in the private business sector, including that in the timber industry. Congress should completely overhaul all depreciation tax provisions, devising a simplified and fair approach for the accounting of assets and investments.
As noted in the business section of this report, the ideal scenario is full and immediate expensing. Absent a complete overhaul of the corporate income tax, however, it is inappropriate for Congress to continue to treat varying types of assets and industries differently with regard to depreciation. Doing so results in tens of billions of dollars in revenue losses each year, without the increased efficiency from a flattened code that a complete overhaul would bring.
The capital gains treatment of timber should be eliminated. Timber is not property like a building or a financial stock; it is a product. The income from its sale should therefore be taxed as ordinary income. The current capital gains treatment of timber income is a subsidy for the timber industry which cannot be justified from an accounting or ecological perspective.

DRAFT
26 | Tax Decoder
1 Randy Schnepf, “U.S. Farm Income,” Congressional Research Service, February 28, 2014, http://goo.gl/4tD4dP, p. 27, “Cash Receipts.” 2 “Agricultural Workers,” Bureau of Labor Statistics, http://goo.gl/OMoFVq. 3 “Farm Programs: Direct Payments Should Be Reconsidered,” Government Accountability Office, July 2012, http://goo.gl/AnzMby. p. 16. 4 “Farmers Have Been Eligible for Multiple Programs and Further Efforts Could Help Prevent Duplicative Payments,” Government Accountability Office, July 8, 2014,
http://goo.gl/BkXuvH. 5 Robert McIntyre, “The Hidden Entitlements,” Citizens for Tax Justice, May 1996, http://goo.gl/i190da. 6 Expenditures must be related to the protection of endangered species located in the same county as the farmland and the species have a recovery plan. “Farm Bill:
Endangered Species Tax Deduction,” U.S. Fish and Wildlife Service, March 2010, http://goo.gl/BTQ36Q. 7 “Estimates of Federal Tax Expenditures for Fiscal Years 2014-2018,” Joint Committee on Taxation, August 5, 2014, http://goo.gl/TTCByF. 8 Maple v. Comm’r, 440 F.2d 1055, 1056-1057 (9th Cir. 1971) http://goo.gl/wi7P7z. 9 Maple v. Comm’r, 440 F.2d 1055, 1056 (9th Cir. 1971) http://goo.gl/wi7P7z. 10 “Tax Expenditures: Compendium of Background Material on Individual Provisions,” Congressional Research Service, December 2012, http://goo.gl/oOOCZh, p. 297-
298. 11 “Income Taxation of Farmers and Ranchers,” Federal Income, Gift and Estate Taxation, § 13.03, 2013. http://goo.gl/zwvP6b. 12 “Estimates of Federal Tax Expenditures for Fiscal Years 2014-2018,” Joint Committee on Taxation, August 5, 2014, http://goo.gl/LbVCai p. 25. 13 “Tax Expenditures: Compendium of Background Material on Individual Provisions,” Congressional Research Service, December 2012, http://goo.gl/JbaJBX, p. 298. 14 “Tax Expenditures: Compendium of Background Material on Individual Provisions,” Congressional Research Service, December 2012, http://goo.gl/JbaJBX, p. 298. 15 “Tax Expenditures: Compendium of Background Material on Individual Provisions,” Congressional Research Service, December 2012, http://goo.gl/Fepi43, p. 298. 16 “Topic 431 - Canceled Debt – Is It Taxable or Not?” Internal Revenue Service, http://goo.gl/ue40Y7 17 “Tax Expenditures: Compendium of Background Material on Individual Provisions,” Congressional Research Service, December 2012, http://goo.gl/EYbguX , p. 302. 18 “Estimates of Federal Tax Expenditures for Fiscal Years 2014-2018,” Joint Committee on Taxation, August 5, 2014, http://goo.gl/eyxZIi. p. 25 19 “Tax Expenditures: Compendium of Background Material on Individual Provisions,” Congressional Research Service, December 2012, http://goo.gl/QpoivI, p. 301-302. 20 “Tax Expenditures: Compendium of Background Material on Individual Provisions,” Congressional Research Service, December 2012, http://goo.gl/1BqOf6. p. 309. 21 “Tax Expenditures: Compendium of Background Material on Individual Provisions,” Congressional Research Service, December 2012, http://goo.gl/2w4Uld. p. 309. 22 “Analytical Perspectives, Budget of the United States Government, Fiscal Year 2015,” Office of Management and Budget, http://goo.gl/nCJgwN, p. 206. 23 “Estimates of Federal Tax Expenditures for Fiscal Years 2014-2018,” Joint Committee on Taxation, August 5, 2014, http://goo.gl/1xaNLS. p. 25. 24 Mark Keightley, “Tax Treatment of Net Operating Losses,” Congress Research Service, September 8, 2010, http://goo.gl/WqLQn6. 25 “Tax Expenditures: Compendium of Background Material on Individual Provisions,” Congressional Research Service, December 2012, http://goo.gl/ew8RI2 , p. 313-315. 26 “Estimates of Federal Tax Expenditures for Fiscal Years 2014-2018,” Joint Committee on Taxation, August 5, 2014, http://goo.gl/KrYsyE. 27 “Tax Expenditures: Compendium of Background Material on Individual Provisions,” Congressional Research Service, December 2012, http://goo.gl/7bGzvn , p. 315. 28 N.B. The tax code does allow all taxpayers to carry forward losses 20 years. Nevertheless, the small business owner is still in a position with fewer options than the
farmer at this point. 29 This tax preference is described by the CRS as “Amortization and Expensing Of Reforestation Expenses.” Senate Committee on the Budget, “Tax Expenditures:
Compendium of Background Material on Individual Provisions,” Congressional Research Service, December 2012; http://1.usa.gov/17wTyob, p. 269. 30 A stand of timber is a “group of forest trees growing on forest land.” Northeastern Forest Inventory & Analysis, U.S. Forest Service website, accessed November 7,
2014; http://goo.gl/UUeM0C 31 “Tax Expenditures: Compendium of Background Material on Individual Provisions,” Congressional Research Service, December 2012, p. 269; http://1.usa.gov/17wTyob 32 I.R.C. § 194, “26 U.S. Code § 194 - Treatment of reforestation expenditures,” Cornell University Law School, http://bit.ly/1wrlwkl 33 John A. Bogdanskip, “Reflections on the Environmental Impacts of Federal Tax Subsidies for Oil, Gas, and Timber Production,” Lewis & Clark Law Review Vol. 15:2,
April 15, 2011, p. 329, http://bit.ly/1vFDDRt.34 “Tax Expenditures: Compendium of Background Material on Individual Provisions,” Congressional Research Service, December 2012, p. 271; http://1.usa.gov/17wTyob 35 Johnson, Calvin H., “Timber!” Tax Notes, November 16, 2009, p. 1, http://goo.gl/Rwu9FR 36 John A. Bogdanskip, “Reflections on the Environmental Impacts of Federal Tax Subsidies for Oil, Gas, and Timber Production,” Lewis & Clark Law Review Vol. 15:2,
April 15, 2011, p. 329 (footnote 61), p. 330, http://bit.ly/1vFDDRt.37 John A. Bogdanskip, “Reflections on the Environmental Impacts of Federal Tax Subsidies for Oil, Gas, and Timber Production,” Lewis & Clark Law Review Vol. 15:2,
April 15, 2011, p. 329, http://bit.ly/1vFDDRt.38 I.R.C. § 194(c)(1), “26 U.S. Code § 194 - Treatment of reforestation expenditures,” Cornell University Law School, http://bit.ly/1ywGwRK 39 “Estimates of Federal Tax Expenditures for Fiscal Years 2014-2018,” Joint Committee on Taxation, August 5, 2014, http://goo.gl/TTCByF 40 Senate Committee on the Budget, “Tax Expenditures: Compendium of Background Material on Individual Provisions,” Congressional Research Service, December
2012, p. 269; http://1.usa.gov/17wTyob41 John A. Bogdanskip, “Reflections on the Environmental Impacts of Federal Tax Subsidies for Oil, Gas, and Timber Production,” Lewis & Clark Law Review Vol. 15:2,
April 15, 2011, p. 330, http://bit.ly/1vFDDRt.42 I.R.C. § 263A(c)(5) and I.R.C. § 263A(e)(4)(B)(ii), Cornell University Law School, http://bit.ly/1w80aVH43 “Estimates of Federal Tax Expenditures for Fiscal Years 2014-2018,” Joint Committee on Taxation, August 5, 2014, http://goo.gl/TTCByF 44 “Farmer’s Tax Guide,” Publication 225, for use in preparing 2014 returns, p. 54, http://1.usa.gov/1ajrovN45 John A. Bogdanskip, “Reflections on the Environmental Impacts of Federal Tax Subsidies for Oil, Gas, and Timber Production,” Lewis & Clark Law Review Vol. 15:2,
April 15, 2011, p. 335, http://bit.ly/1vFDDRt.
46 “Tax Expenditures: Compendium of Background Material on Individual Provisions,” Congressional Research Service, December 2012, p. 277; http://1.usa.gov/17wTyob 47 John A. Bogdanskip, “Reflections on the Environmental Impacts of Federal Tax Subsidies for Oil, Gas, and Timber Production,” Lewis & Clark Law Review Vol. 15:2,
April 15, 2011, p. 330, http://bit.ly/1vFDDRt.48 “Estimates of Federal Tax Expenditures for Fiscal Years 2014-2018,” Joint Committee on Taxation, August 5, 2014, http://goo.gl/TTCByF 49 John A. Bogdanskip, “Reflections on the Environmental Impacts of Federal Tax Subsidies for Oil, Gas, and Timber Production,” Lewis & Clark Law Review Vol. 15:2,
April 15, 2011, p. 334, http://bit.ly/1vFDDRt.50 “Tax Expenditures: Compendium of Background Material on Individual Provisions,” Congressional Research Service, December 2012, p. 271; http://1.usa.gov/17wTyob 51 Neil Carman et al., “Ecological and Social Impacts of Fast Growing Timber Plantations and Genetically Engineered Trees,” http://bit.ly/1Bu0uTb 52 “Deducting Business Expenses,” IRS, December 8, 2014, http://1.usa.gov/1hPwpDH

26 | Tax Decoder Economic and Community Development | 27
ECONOMIC ANDCOMMUNITY DEVELOPMENT
DRAFT
28 | Tax Decoder
Economic and Community Development
Several tax breaks are intended to promote economic and community development, but they often function largely as entitlement welfare programs for profitable corporations. Tax breaks are available to encourage film and magazine production in the United States, encourage the renovation of historic structures, and promote development in
low-income areas. Corporations, however, often claim these tax breaks for activities they had planned to do anyway. In other words, if the
tax breaks were not available, the businesses would have made the same choices. In such cases, these preferences amount to a giveaway to the corporation, adding to the deficit and enriching the company without making any difference for the nation or community.
In other cases, such as the New Markets Tax Credit, large financial investors, such as banks, are profiting from the tax credit perhaps even more than the low-income communities intended to benefit from taxpayers’ generosity.
It is also often unclear why Congress chooses to single out a particular industry for special treatment. Instead of passing out special breaks for the most well-connected or powerful industries and companies, Congress should eliminate all tax earmarks and lower the overall corporate income rate on all companies. This approach would not only create a more level playing field, but encourage true economic growth in the private sector, creating jobs in all communities across the country.
Like much of the tax code, the credits and deductions outlined in this section were created on the assumption that Congress is capable of effectively managing and directing the American economy through tax policy. A better approach would be to minimize tax-related distortions to the economy and allow the free market to guide the decisions of businesses.
Empowerment Zone and Enterprise Community Tax Incentives
The Empowerment Zone (EZ) Program is among the most complex, inefficient, ineffective, and downright incomprehensible set of tax incentives in the federal tax code. The program is a poster child for the failure of Congress’ absurdly over-complicated micro-management of the economy through the tax system. Thankfully, these tax incentives expired on December 31, 2013 after being extended multiple times.1 They may be retroactively extended again, however, as they were included in the Tax Extenders Act of 2013 (S. 1859, 113th Congress).2
Empowerment Zones and Enterprise Communities (EC) are “federally designated geographic areas characterized by high levels of poverty and economic distress, where businesses and local governments may be eligible to receive federal grants and tax incentives.”3
Congress has designated three rounds of EZs (1993, 1997, 1999) and two rounds of ECs (1993, 1997). In total, Congress has authorized 40 EZs and 95 ECs.4 Not only are there differences between EZs and ECs, there are differences between each round of EZs and ECs. To top it off, there are additional variations for certain individual zones, including Washington, D.C., and Oakland, California.5 Several zones have expired. The HUD website currently lists 30 active zones.6
A multitude of different tax incentives are available in the different rounds of zones. For example, there are several different types of tax credits available for businesses that hire workers who live and primarily work inside a zone. Businesses in some zones may also immediately expense slightly more of their assets under Section 179. More favorable deductions for commercial
Economic and Community Development (in millions) FY 2014 FY 2014 - FY 2018Empowerment Zone & Enterprise Community Tax Incentives $300 $1,200
American Samoa Economic Development Credit $10 $82
Historic and Non Historic Tax Credits $1,000 $5,400
Hollywood Tax Break $126 $838
Magazines Tax Break $100 $300
New Markets Tax Credit $1,000 $5,500
Total $2,536 $13,320

28 | Tax Decoder Economic and Community Development | 29
construction expenses are also available. Businesses may even use tax-exempt bonds, considered “exempt facility bond[s]”7 to finance construction of commercial buildings within a zone. Investors who realize a gain on the sale an EZ asset, such as stock in an EZ business, can defer tax recognition of the gain by replacing the sold asset with another EZ asset from the same zone. Between 50 and 75 percent of the gain from certain stocks in zone businesses is tax-exempt.8
As if this list was not complicated enough in itself, remember that the mix of available tax incentives differs from zone to zone. Also, the above does not even include the numerous grants that were available in the zones before they were expended.9
Businesses interested in using the zone incentives must also ensure they operate within highly specific geographic areas that do not necessarily correspond to existing local boundaries. As shown by the figure from the HUD website, the zones often take irregular shapes, recalling gerrymandered voting districts.10
For some of the tax incentives, it is not enough for business to be merely located within these oddly-shaped zones—the requirements are far more excruciating than that. For example, to qualify for the tax-exempt bonds, businesses must meet the following requirements:
• 85 percent of the use of the bond-financed facility must be the active conduct of a qualified business within the zone.
• At least 50 percent of the business’ gross income must be derived from business activity within the zone.
• At least 35 percent of the business’ employees must be residents of the zone.
• A substantial portion of the work done by the employees must be performed in the zone.11
Businesses must stay in compliance with these requirements throughout the term of the bond issue. It is easy to imagine a business struggling to stay afloat in an impoverished area while constantly tracking all these variables over the course of two or three decades. The business would need to constantly tie itself in knots to maintain the appropriate ratios of business activity, gross income, and employee residences within the erratic boundaries of the zone. These are only the requirements for the tax-exempt bonds—additional requirements apply for each of the other tax programs.
Much time and money would be wasted by these businesses ensuring compliance with these rules, only taking away from their productivity and contribution to the economy. Perhaps more importantly, many good business opportunities would likely be sacrificed by these businesses in order to stay within the program requirements. These two factors—compliance burdens and economic distortions—are the primary reasons our tax code imposes such a drag on economic growth today. There are few better illustrations of these pathologies than the Empowerment Zone program.
Cost
In FY 2014, empowerment zone tax incentives are expected to cost $100 million, renewal community incentives will cost about $40 million, and District of Columbia tax incentives will cost $100 million. Empowerment zone tax incentives include both empowerment zones and enterprise communities. Renewal communities and the District of Columbia zone are not discussed in this chapter since they have expired; however, the tax-exempt bonds and other incentives under the programs still have an effect on federal revenues, so their cost is included.
This map, from the Congressional Research Service, illustrates the locations of the larger EZs and ECs scattered throughout the country. Also included in the map are Renewal Communities (RCs). The tax benefits for RCs expired in 2009.
The Knoxville, Tennessee Empowerment Zone

DRAFT
30 | Tax Decoder
Together, all three will cost at least $300 million in FY 2014 and about $1.2 billion from FY 2014 to 2018.12
Data on the use of these tax incentives is poor. The Government Accountability Office (GAO) stated in a one-page report in 2006 that “detailed Internal Revenue Service (IRS) data on the use of EZ/EC program tax benefits were not available,”13 and has not updated its assessment of the program since then.
The only detailed examination of these tax incentives is from a 2004 GAO report that examined a 1995-2001 study period. During this period, businesses and individuals claimed a total of $251 million in EZ Employment Credits. During the same period, state and local governments issued a total of $315 million in tax-exempt bonds (the federal revenue cost would be a small percentage of this amount).
No data at all was available for five other tax expenditures, according to the GAO:
“IRS cannot report on the extent to which businesses operating in an EZ or RC are claiming the increased expensing deduction, the Commercial Revitalization Deduction, or the Nonrecognition of Gain on the Sale of EZ Assets, because taxpayers do not report these benefits as separate items on their returns. In addition, two benefits, the Zero Percent Capital Gains Rate for RC Assets and the Partial Exclusion of Gain on the Sale of EZ Stock cannot be claimed until 2007 and 2005, respectively.”14
Analysis
CRS observes that while the EZ, EC, and RC programs have benefited the businesses and investors who participate in the programs, their effect on the surrounding impoverished community is uncertain. Three federal studies have been conducted on the zones, including one by the Department of Housing and Urban Development (HUD) in 2001 and two by the GAO in 2004 and 2006. Several studies have also been published in academic journals.15
Of these studies, only the HUD study yielded evidence that the zones may have had a positive effect, and even this evidence has been called into question. The study examined six EZs for the period 1995-2000, identifying a comparison area with similar demographic characteristics and economic condition for each EZ in the same city. Four out of the six EZs experienced greater employment growth than their comparison areas. However, the HUD report notes that in
only three of the six EZs were increases in employment correlated with specific EZ programmatic activities. Moreover, in some of the EZs, such as Atlanta, employment increases may have been attributable to non-EZ activities.16
In addition, one of the academic studies similarly employed comparison areas, and found no difference in the economic
benefits between the EZ areas and the comparison areas.17
Neither of the two GAO studies found a causal link between the zone designations and economic improvements in the zones. This was largely due to the unavailability of data. The grants for the zones were handled by three different federal agencies (HHS, HUD, and USDA), none of which appropriately collected data on the amount of funds spent on the program. The IRS, meanwhile, was unable to provide data on the use of tax benefits. The 2004 GAO study urged the agencies to work together to improve data collection, but they had not done so as of the 2006 study.18 Like the government studies, the academic studies had difficulty identifying a causal link between the zones and economic conditions.19
It is also important to note that the tax incentives for these zones, including the tax-exempt bonds, played a relatively small role in the program. Most businesses who participated used grant money, not the tax incentives. The HUD study notes:
Only a small proportion of the businesses that were aware of the incentives took advantage of them, sometimes because of assumed or actual ineligibility to use them. Eleven percent of businesses in 2000 reported using the EZ employment tax credit, four percent reported using the Section 179 expensing provisions, and three percent used WOTC. Larger businesses were far more likely to take advantage of these Federal tax incentives than their smaller counterparts.20
Today, the grant money has largely been expended, leav-ing only the tax incentives in place.21 In summary then, the Empowerment Zone Program had doubtful economic bene-fit even when considering both tax incentives and grants. To-day, it mostly includes only the tax incentives—which have mostly only been used by big businesses. It is highly unlikely that a program that was unable to demonstrate any broad benefit to impoverished communities in the past will be able to do so now that the only widely-used components, the grants, have largely expired. All that remains now is a series of tax entitlement programs mainly used by big business. These tax benefits are unlikely to provide any demonstrable benefit to impoverished communities.
It is no surprise primarily large companies use these tax provisions—the qualifying criteria are highly complex and place exasperating restrictions on how businesses may sell, hire, and make money. An entrepreneur fighting to establish his small business in an economically challenged area does not have time to contend with these convoluted rules. A reformed tax code would do far more to benefit the economies of these struggling communities and the businesses within them.
Recommendation
Congress should not renew the Empowerment Zone Program tax incentives that expired at the end of 2013.

30 | Tax Decoder Economic and Community Development | 31
American Samoa Economic Development Credit: Tax Breaks for Tuna
Routinely included in Congress’ “tax extenders” legislation is a multi-million dollar tax break for certain domestic corporations operating in American Samoa, a territory of the United States located in the Pacific Ocean, south of Hawaii. The tax credit was created with the purpose of offsetting the U.S. tax liability of these companies on income earned from active business operations.22
The StarKist tuna company has
been the primary recipient of a $10
million annual tax break directed
to businesses in American Samoa
Tax Incentives for Preservation of Historic Structures
The Grand Canyon. Yellowstone. The Statue of Liberty. Boston’s Fenway Park? Miami’s Fontainebleau Resort on Millionaire’s Row? While most Americans recognize the National Park Service (NPS) is responsible for caring for our National Parks, many
will be surprised to find the Park Service has also been tapped to oversee construction projects at sites ranging from beach front resorts to Major League Baseball stadiums. The National Park Service assists the Internal Revenue Service (IRS) with administering the federal historic preservation tax incentives program that subsidizes the rehabilitation of historic buildings, and in many cases, not-so-historic buildings.
Outside of tourism and government employment, the primary economic activity on the island is canning tuna, as the territory is home to Chicken of the Sea23 and StarKist.24
More recently, Bumble Bee Foods has indicated it plans to establish a base in American Samoa as well. The tax break, however, was narrowly written as to only be available to certain companies that before January 1, 2006, and in respect to American Samoa, claimed the possession tax credit (which existed before this economic development credit and has since expired). It is assumed Starkist has been the primary recipient of the credit.25, 26
Given these changes in the territory’s tuna companies, the American Samoa governor recently asked Congress to change the requirements for recipients of the credit, which would likely allow other companies, such as Bumble Bee, to claim the credit.27 The existing credit has been extended by Congress twice and a third extension is included in the Senate’s 2014 extenders legislation, the EXPIRE Act of 2014. This bill also includes an expansion, to open up the credit to other companies, as requested by the American Samoa government.
This tax break is estimated to cost $10 million in FY 2014 and $82 million from FY 2014 through FY 2018.28
The tuna tax break is an example of congressional meddling in the private sector, directing federal resources to specific industries, instead of allowing the market to appropriately allocate capital and commerce. Taxpayers
should not be asked to subsidize particular businesses in states or territories in the name of “economic development,” which is not the role of Washington or the federal government. Congress should eliminate this special tax credit for the tuna industry.

DRAFT
32 | Tax Decoder
The National Register of Historic Places now consists of over 80,000 listings and 1.5 million buildings.29 This list continues to grow by more than one thousand structures every year and includes properties such as putt-putt golf courses, bowling alleys and liquor stores.
Even more, the credit, which costs the U.S. Treasury more than $600 million in lost revenue every single year, has been used by the wealthy to lower their tax liability and reduce their personal investment expenses by millions of dollars. The credit is claimed on both corporate and individual returns. The historic tax credit program provided $40 million for a Fenway Park renovation, handed $10 million over to the Las Vegas Mob Museum, provided $5 million for a site that hosted a Hollywood gala in Beverly Hills, and gave $60 million for a renovation of Miami’s Fontainebleau Resort – which celebrated the affair in style with a Victoria’s Secret Fashion Show and performances from Usher and Mariah Carey.
Even Washington politicians and socialites benefit from the historic tax credit’s generous subsidies for luxury hotel renovations. Since 2000, at least $22.5 million in tax credits have paid for refurbishing four of the capital’s finest hotels, including the Hay Adams, Courtyard Marriot, Hotel Monaco, and the St. Regis.
The tax code provides two different methods to obtain tax credits to pay for such luxury hotels and mansion makeovers. A tax credit worth 20 percent of the rehabilitation costs is available for improvements to a “certified structure,” which means the building is listed in the National Register of Historic Places or is located in a historic district and certified by the Secretary of the Interior as being of historic significance to the historic district. Projects must meet the following criteria to be eligible for the 20 percent tax credit:
• The building must be used in a trade or business or held for the production of income (the building may not serve as the owner’s private residence).
• Qualifying rehabilitation costs cannot include acquisition of the structure or the leasehold interest.
• Leases can only utilize the tax credit if the remaining lease is longer than 27.5 years for residential property and 39 years for nonresidential property.
• The rehabilitation costs incurred must exceed the greater of $5,000 or the adjusted basis of the building and its structural components during a 24-month period.
• A period of 60 months is allowed for phased rehabilitations that are completed in two or more distinct stages.
• The owner must hold the structure for five full years following completion of the rehabilitation or pay back the credit on a pro-rata basis (full recoupment if disposed within the first year, 80 percent after one year, 60 percent after two years, etc.)
• The National Park Service or a State Historic Preservation Office may inspect a rehabilitated property for its historical integrity during the initial five-year period and revoke the credit if it does conform with the plans in the application.
The tax code also provides a tax credit worth 10 percent of rehabilitation costs for older non-certified buildings. In order for expenditures on a non-certified historic building to be eligible for a 10 percent tax credit, the project must satisfy the following criteria:
• The building must have been placed in service prior to 1936 and be in a trade or business or held for the production of income;
• The expenditures must exceed $5,000 or the adjusted basis of the building within a 24-month period;
• At least 50 percent of the external walls must be retained as external walls;
• At least 75 percent of the exterior walls must be retained as internal or external walls;
• 75 percent of the internal structural framework of the building must be retained; and
• Unlike the 20 percent certified historic tax credit, the non-certified building cannot be used for residential buildings, but can be used for hotels.
History
Congress included a provision to subsidize the rehabilitation of historic buildings in the Tax Reform Act of 1976, at the behest of Senator Glen Beall (R-MD). The tax credit was intended to subsidize the preservation of historical structures and neighborhoods, which was deemed by Congress as a national goal.
The Tax Reform Act provided for a rapid five-year depreciation schedule for capital expenditures on certified historic structures. In order to discourage demolition of historic buildings, the provision charged the capital account for demolition of any certified structure and the destruction costs could not be included in the depreciable basis for the replacement structure. Nor could the replacement structure at the demolition site be eligible for accelerated depreciation.
Congress created an investment tax credit for rehabilitation expenditures on buildings in use for at least 20 years in the Revenue Act of 1978. The provision was intended to address the concern of decline in older neighborhoods and cities and to “promote stability in and restore economic vitality to deteriorating areas.”30
As part of the Economic Recovery Tax Act of 1981, Congress created a 3-tier structure to encourage the rehabilitation of older and historic structures. The Economic

32 | Tax Decoder Economic and Community Development | 33
Recovery Tax Act provided a 25 percent tax credit for certified historic structures, a 15 percent tax credit for non-certified structures that were at least 30 years old, and a 20 percent tax credit for commercial properties that were at least 40 years old.31
Following the 1981 provision, historic preservation projects become popular among investors because they could be manipulated for usage as tax shelters.32 In order to reduce their taxable income from their trade or other investments, wealthy taxpayers would purposely invest in real estate businesses that lost money so they could deduct all those losses incurred from their other income activities. The tax benefits in these tax shelters would often far exceed the money invested in the tax shelter.
Congress changed the structure to two tiers and reduced the tax credit values in the Tax Reform Act of 1986.33 The 1986 provision is the same as the current structure, 20 percent for certified historic structures or structures in historic districts and 10 percent for rehabilitation costs of buildings first placed into service prior to 1936. To combat the use of real estate investment for tax manipulation, Congress also included a provision that limited the ability for investors to deduct losses from businesses that they do not materially participate in or rental properties except for on other passive income (regularly earned income that requires little traditional work, such as an investment).
After these rules were implemented in 1986, there was a “steep decline in rehabilitation projects sponsored by limited partnerships and other syndication structures that linked individual investors to developers.”34 However, by the mid-to-late nineties, historic tax credit popularity were on the rise again due to the ability for corporate investors to combine the tax credit with the low income housing tax credit and the new markets tax credit. The practice of “twinning” continues to this day and the usage of the historic tax credit has reached record highs as recently as 2008 and 2009.
Cost
The credit for rehabilitation of historic structures will cost an estimated $900 million in lost revenue in FY 2014 and $4.9 billion from FY 2014 through FY 2018. The credit for non-historic structures will cost at least $100 million in FY 2014 and $500 million from FY 2014 through FY 2018.35
Analysis
Evaluating Tax Incentives for Preservation of Historic Structures
Proponents of the historic tax credits believe preserving old and historic structures is a national priority that can only be met by incentivizing private investment in rehabilitation projects over new construction. They claim that without the historic preservation tax credits, people are encouraged to demolish and replace old buildings rather than rehabilitate them.
Supporters also claim the tax credit has a 5-to-1 return on investment and has created $69 billion in investment since its establishment in 1976.36 However, a 5-to-1 return on investment would be expected for a 20 percent tax credit when the investment and jobs data are based on a scenario where businesses would not invest in a rehabilitation project or any alternative projects in the absence of the tax credit, a dubious assumption at best.
Efficiency
A 20 percent or 10 percent tax credit for rehabilitation costs artificially reduces the costs to maintain an older building while simultaneously propping up its property value. The policy impact of the tax credit inefficiently shifts capital investment towards projects that may not otherwise be
Historic tax credits. (“Four downtown projects receive tax abatement deal” Tulsa World, http://goo.gl/jkpbvY)

DRAFT
34 | Tax Decoder
profitable. This encourages more costly ways for companies to obtain additional housing or commercial space. These inefficiencies are justified by proponents that believe that it is adjusting for an externality that accounts for the benefits of societal and aesthetic value of older structures. However, this would assume that all new construction projects are based on the most efficient cost-benefits analysis regardless of aesthetic values. Business and individuals cannot internalize the values by paying a premium to rent or buy space in a historically noteworthy or aesthetically pleasing building.37
The National Register consists of over 80,000 listings cover-ing nearly 1.5 million buildings.38 This list continues to grow by more than 1,000 structures every year and includes properties such as a putt putt golf courses, bowling alleys and liquor stores.
The tax credit also operates under the general assumption that older buildings have more aesthetic and societal qualities than new buildings. This may be a compelling case if the tax credit was applied to a narrowly defined group of historically significant buildings (whose value businesses can already account for regardless of tax incentives). Yet with nearly two million buildings on the list, this is not the case.
When describing the selection process, a National Register historian stated “we rarely overturn anything supported locally.”39 Given this threshold, a listing on the Historic Register that provides eligibility for the 20 percent tax credit is not necessarily commensurate with an irreplaceable nationally
historically significant structure. For example, the Milliken Building in Bowling Green, Ohio,
which is occupied by a law firm, was included on the list in 2012 just in time to take advantage of the tax credit on $250,000 in building repairs. The building’s owner said “the building was placed on the list because it is considered exceptionally significant as a piece of modern office building design in the context of Bowling Green” while admitting “on the national scale, it probably is not that significant.”40
Moreover, the non-certified historic structures that qualify for a 10 percent credit merely have to have been built prior to 1936. Applying the same justification for the non-certified credit in a prospective manner, federal policy assumes that every building constructed in 2014 will provide more societal benefits and have better aesthetic qualities than a building constructed in 2092.
Administrative costs
In addition costing more than $500 million annually, these tax credits require a significant amount of federal funding to administer. With two federal agencies overseeing the provision, the historic tax credit “receives more administrative oversight than most other tax provisions.”41 The National Park Service partners with the IRS to administer the tax credits. NPS certifies the rehabilitation expenditures at the point of proposal and after the project is completed.
BUREAUCRATIC OVERHEAD CREATES $600 MILLION IN COSTS JUST TO ADMINISTER THE HISTORIC TAX CREDIT.
Bureaucratic overhead creates $600 million in costs just to administer the historic tax credit

34 | Tax Decoder Economic and Community Development | 35
Furthermore, the recapture element of the tax credit requires continuing oversight of the project for five years following the rehabilitation’s completion. The NPS budget allocates $367,000 per year for the Technical Preservation Services (TPS) program and $46.9 million for grants to State Historic Preservation Offices who both coordinate with the IRS in administering the tax credits. Moreover, taxpayers spend $9.59 million on NPS staff to evaluate and make historic register designations and another $6.5 million on an independent federal agency, the Advisory Council on Historic Preservation (ACHP) to ensure that projects comply with federal historic preservation regulations. In total, taxpayers spend more than $63 million annually in administrative costs to dole out the $600 million in historic tax credits.42
One example of the ongoing administrative cost burdens of the historic tax credit occurred at an Ohio casino. When a National Basketball Association (NBA) owner tried to utilize the Historic Preservation Tax Credit to develop a casino in downtown Cleveland, Ohio, the National Park Service had to intervene in plans by the Horseshoe Casino within the historic Higbee Building to build a skywalk connecting the casino to a parking garage. The National Park Service ruled that the skywalk would detract from “the overall historic character of the property,” rendering the casino ineligible for the federal tax credit.
Double dipping
As noted previously, corporations often pair the historic tax credit with one or more other federal and state tax credits for rehabilitation projects. Beginning in the mid-90’s,
corporations began combining the historic tax credit with the low income housing tax credit by “rehabilitating historic properties for affordable housing, sometimes also including retail or office space in the building.”
Twinning has become so prevalent that in 2009, 91 percent of projects that qualified for a historic tax credit “also took advantage of at least one additional incentive or form of publicly supported financing.”43
These include the brownfields environmental tax credit, the New Markets Tax Credit, the low income housing tax credit, industrial development bonds, Small Business Administration programs, Community Development Block Grants, and the Department of Agriculture’s rural development programs. Additionally, more than 40 percent of the projects certified as completed by NPS also benefit from one of the approximately 40 states that have historic preservation tax credits.44, 45
Ani DiFranco, a Grammy award winning artist, utilized multiple federal tax breaks to build her record label, Righteous Babe, a new headquarters in an 1876 Gothic Revival church.46 The project took advantage of $1.5 million in historic preservation tax credits, along with $3.7 million in New Market Tax Credits.47 The project manager admitted that the project would not add any permanent jobs and divulged that “It’s kind of cruel….We’ve been able to use these tax loopholes created by big government.”48
Affordable Housing
Proponents of the tax credit also boast the provision helps to supply affordable housing units in the United States. In FY 2013, 46 percent of the projects that utilized the historic tax credit were for housing. Of these projects, about one third were for affordable housing units.49 Since the creation of the tax credit program, NPS has approved a reported 131,438 low
Ani DiFranco, a Grammy award winning artist, utilized multiple federal tax breaks to build her record label, Righteous Babe, a new headquarters in an 1876 Gothic Revival church

DRAFT
36 | Tax Decoder
and moderate income housing units.50
Yet other federal policies already provide a tremendous amount of support targeted at affordable housing. Federal housing initiatives are fragmented across 160 programs and activities administered through 20 different federal entities. Some of these housing assistance programs include tax expenditures administered by Treasury and the Internal Revenue Service (IRS).
As GAO points out, “some tax expenditures can contribute to mission fragmentation and program overlap that, in turn, can create service gaps, additional costs, and the potential for duplication.” Identifying the historic tax credit specifically, GAO raised the efficiency concern that
to qualify for a historic preservation tax credit, rehabilitation must preserve historic character, which
may conflict with states’ efforts to produce energy-efficient, low-income properties with tax credits, and could increase project costs.52
The following examples are just a few recent uses of the historic preservation tax credit, which is utilized for affordable housing at times, but is also claimed to support luxury desti-nations that are unaffordable for the average American family.
Boston Red Sox Owner Hits Homerun off the American People
In commemoration of Fenway Park’s inclusion in the National Register of Historic Places, NPS Director John Jarvis had the honor of throwing out the first pitch for a Boston Red Sox home game. During the ceremony, Jarvis stated
Fenway is a treasured American icon for baseball fans across the country. It, along with the Boston area’s 11 national parks, helps attract visitors from around the world to one of our nation’s most vibrant cities, expanding opportunities for business and tourism that generate economic returns for Boston and the nearby communities.53
The Red Sox organization was elated that “Fenway Park will be counted among America’s most treasured historical places, ensuring that it is protected and enjoyed by future generations.” However, the Boston Red Sox had more to be happy about then a commemorative ceremony – they were also the beneficiaries of what equates to a $40 million check from the American taxpayers.
The honorary first pitch by the NPS Director and the distinction of a National Register were not merely symbolic gestures for an iconic baseball stadium. These events capped off a $285 million decade-long renovation project at Fenway Park and meant that the federal taxpayers would be repaying
Boston’s iconic Fenway Park received $40 million
in federal tax subsidies for a renovation. The Red Sox
spokeswoman explained the credit from taxpayers as “basically reimbursing us for
some of the money we’ve spent.”
Other Incentives Used in Completed Projects in Addition to Historic Preservation Tax Credits in FY 2013.51

36 | Tax Decoder Economic and Community Development | 37
the owners roughly $40 million of these expenses through a historic preservation tax credit. The Boston Red Sox initial-ly applied to obtain a National Register listing historic sta-tus amidst the renovation process for the specific purpose of receiving the generous federal tax benefit.54 The Red Sox spokeswoman summarized the $40 million tax credit as “ba-sically reimbursing us for some of the money we’ve spent.”55
At a total worth of $1.31 billion, the Boston Red Sox is the 11th most valuable sports franchise in the world.56 The owner of the Red Sox is personally worth $1.4 billion.57 While Red Sox fans may be delighted that the American people are finan-cially supporting their franchise, it’s likely that Yankees fans and the rest of the American taxpayers will take exception to this expenditure.
Chicago Cubs Seeks Federal Tax Breaks for Potential Stadium Renovation
The owners of the Chicago Cubs are planning to take on “an ambitious construction project that will include renovations to the interior, exterior, baseball facilities and infrastructure” at Wrigley Field.58 A club spokesman confirmed that the Cubs will pursue federal historic tax credits to offset some of the estimated $300 million renovation cost. The owner told the fan base regarding a dispute over usage restrictions on Wrigley Field in exchange for local financial support that “We’re not a museum. We’re a business.”59
While groundbreaking on the project has been delayed due to legal wrangling between the owners, Chicago city government and local business owners, the project delay did not prevent Cubs owner’s from submitting their initial application for National Register status to NPS. The initial historic status was approved on March 29, 2013, and the owners submitted rehabilitation plans for National Park Service approval on September 11, 2013.
As of April 2014, the renovation plans were still pending approval with NPS.60 It’s unclear how much of the renovation costs would qualify for the federal historic tax credit if approved, but there could be up to $60 million federal subsidy for the Chicago Cubs. In 2009, the owners of the Cubs were worth roughly $1 billion.
Las Vegas Mob Museum Shakes Down the American Taxpayers
When then Las Vegas Mayor and current Mob Museum Board Director Oscar Goodman proposed the Mob Museum should benefit from the $800 billion American Rehabilitation and Recovery Act, commonly referred to as the “stimulus package,” a public uproar occurred and the Senate voted by a 73-24 vote to prohibit federal stimulus funds from being directed towards the museum dedicated to honoring organized crime.61
While the project may have been left out of the
stimulus funding bonanza, this did not prevent the Mob Museum from applying for and obtaining a plethora of other federal funds. The museum has received
more than $8.3 million in grants, including nearly $1.9 million in economic development initiative grants from the U.S. Department of Housing and Urban Development, more than $500,000 from Save America’s Treasures from the National Trust for Historic Preservation, more than $5.6 million in Centennial Committee Awards…more than $87,000 from the State Historic Preservation Office, [and] a $250,000 grant from the Institute of Museum and Library Services.62
But American taxpayer assistance did not stop with the grant funds, as the Board still had the ability to tap into the tax benefits of its location. The Mob Museum is located in a Las Vegas Post Office, which is listed on the National Register of Historic Places. The fact that the construction would involve the renovation of a certified historic building made the project costs eligible for the lucrative 20 percent historic preservation tax credit. The problem was the organization leading the project was the 300 Stewart Avenue Corporation, a nonprofit organization. As a nonprofit entity, the 300 Stewart Avenue Corporation did not have a tax bill to offset with the tax credits.
The opportunity to obtain millions of dollars’ worth of historic preservation tax credits was an offer the founders of the Las Vegas Mob Museum could not refuse. In an ode to its founding mission, the Mob Museum wielded the United States Tax Code as its weapon of choice, concocting a “complex but also very artful method”63 to gain $10 million in tax benefits from the American taxpayers. Mobsters robbed banks because that is where the money was. The Mob Museum robbed the IRS because that’s where the real money is, and it’s legally available for the taking.
While the nonprofit organization was unable to obtain the tax credits, they formed three separate taxable entities, 300 Stewart Avenue Lessee, 300 Stewart Avenue Taxable and 300 Stewart Avenue Qalicb.64 These were set up for the purposes of syndicating the historic preservation tax credits to obtain the cash value of them from third-party investors, in this case PNC Bank.65 The 300 Steward Avenue Taxable is a limited liability corporation (LLC) who became and must remain one of the building’s owners for 5 years after the rehabilitation’s completion. As the building’s owner, tax credits are sold to investors for typically $.95 to .99 cents on the dollar, providing the project funding and giving the investor a tax credit to reduce their corporate tax liability.66
After the Mob Museum opened for business in 2012, the Museum applied for a property tax exemption from the city of Las Vegas.67 A member of the museum’s Board of Director’s argued to the county tax board that “the reality

DRAFT
38 | Tax Decoder
is this is a nonprofit….It’s a museum. It’s for educational purposes.” The executive board director of the Mob Museum admitted that “technically, there’s affiliated for-profit entities associated with the property,” but they were only pass-through entities created so that the “nonprofit could make use of a federal incentive.”68
Private Country Club May “Return to Grandeur”
New owners of the Doral Golf Resort & Spa are completely transforming it into the Trump National Doral Miami resort.69 This exclusive members-only private resort may not let you in, but you could be investing $50 million to offset some of the $250 million rehabilitation project costs through historic tax breaks.70 NPS received the first application that justifies the Trump Na-tional Doral Miami resort as a historically significant site on April 15, 2013, and quickly approved it less than three weeks lat-er.71 Trump National Doral Miami submitted their rehabilitation project plans to the Park Service and the request is still pending as of March 2014, as NPS has requested more information.72
Timing of Historic Register Listing for Slew of Illinois Buildings Too Good to be True
In 2013, 23 buildings and 11 historic districts were added to the National Register of Historic Places at the recommendation of the Illinois Historic Preservation Agency.73 These sites that are now included on the nation’s “official list of the Nation’s historic places worthy of preservation.” However, the suspicious timing of the listing and application for tax credits raises the question of whether these sites were added because of the property’s “historical, architectural, or archaeological significance” or because the owners were preparing to renovate and wanted to cut a fifth of the project costs compliments of the American taxpayers.
Of the 14 Cook County projects that were newly listed in 2013, more than half were in the application process with the National Park Service for a national historic tax credit.74 While there is a chance this is simply an odd coincidence, the correlation suggests that the most significant feature of the newly listed buildings was their pending renovation plans.
Name of Cook County Property Newly Listed in 2013
Application for Historic Tax Credit?
Date of Initial Application
Apartment Building320 West Oakdale Avenue, Chicago
NO
42nd Precinct Police Station YES 10/09/12
Bush Temple of Music YES 8/09/13
Curtiss-Wright Aeronautical University Building YES 3/01/12
Drucker House NO
Kosciuszko Park Field House NO
The Neuville Apartments NO
Passionist Fathers Monastery YES 4/13/12
Polish Roman Catholic Union of America Building NO
Stony Island Trust & Savings Bank Building YES 6/13/13
Storkline Furniture corp YES 6/01/10
Strand Hotel YES 12/14/12
Vesta Accumulator Company Building YES 3/02/12
Walser House NO $2,800
Suspicious Timing: More than Half of the New Cook County Historic Register Designations in 2013 Simultaneously Applied for Historic Tax Credit

38 | Tax Decoder Economic and Community Development | 39
Taxpayers Subsidize Hollywood Celebrity Gala in Beverly Hills
Opening night at the Wallis Center was a site to behold. The events included a fashion show, cocktails in the sculpture garden, tap-dancing performers backed by a live orchestra, a performance by members of the Paris Opera Ballet and live readings by Kevin Spacey and Diane Lane. There were “Pali designed high-end, Swiss cement panels -- tinted to look like copper and which match the terra cotta of the older building -- that cover the exterior of the new building.”75 The dinner was catered by Wolfgang Puck.
The evening’s guests included Demi Moore, Charlize Theron, Nicole Richie, Courtney Cox, Jodie Foster, Gwen Stefani and accompanying paparazzi. This hive of celebrity activity and cultural decadence was in honor of the grand opening of the newly renovated $70 million Wallis Annenberg Center for the Performing Arts in Beverly Hills, California. The American taxpayers chipped in roughly $5 million to help this star-studded and high-class affair take place.
The performing arts center was able to tap into the federal coffers because a portion of the newly renovated Wallis Center is located in the Beverly Hills Post Office, a National Register listed site. The Wallis Center wanted to garner the tax advantages of rehabilitating a National Register site, but due to its nonprofit
status, the Wallis Center had to set up an elaborate structure of pass-through entities and lease agreements in order to access the $5 million in tax benefits from the federal government. The process for this complicated tax scheme is described below.76
1. The Wallis Center’s nonprofit organization, WACPA, is leasing the Beverley Hills Postal Office Space, a National Register Building for 55 years;
2. The WACPA assigned that lease to a new entity, the Master Landlord, which will be majority-owned and managed by LL Manager, which is wholly owned by WACPA – the Master Landlord will be the official tenant;
3. As the new tenant, the Master Landlord will then create two 19.5 year sub master leases (one for the Post Office and one for the non-historic theatre portion) with a new entity, the Master Tenant, which will be managed by an entity that is wholly owned by WACPA, the MT Manager, and will be majority owned by Bank of America (the Equity Investor);
4. The new Master Tenant will then further sublease the property subject to the sub master leases back to the WACPA;
5. Following the five-year period when Bank of America can utilize all of the tax credits, the Wallis Center will restructure and eliminate all of the new pass-through for-profit entities.
The owners of the Watergate Hotel, Euro Capital, are
reported to have an $100 million renovation project for
the now shuttered portion of the complex, and could
receive up to $20 million in taxpayer funded subsidies. This screen shots are from
their promotional trailer advertising the new luxury
hotel.

DRAFT
40 | Tax Decoder
Complex tax arrangements all culminated into a $5 million tax credit and a star-studded opening night. “As guests waited for their cars outside at the valet, dancers draped in billowy, white cloth swayed in the air on towering springs. A fitting end to an evening shot through with drama and culture.”77
The Watergate Breaks into Taxpayer Coffers to Grab Tax Breaks
Within the infamous Watergate Complex is the Watergate Hotel, which is planning a massive renovation in 2014. The owners of the Watergate Hotel, Euro Capital, are reported to have a $100 million renovation project for the now shuttered portion of the complex.78
The exterior of the building will likely remain unchanged in order to retain the historical integrity of the complex. However, the interior plans are grandiose, including a “renovated lobby with a bar and lounge, a specialty restaurant with some outdoor terrace seating and a rooftop bar with a small reflecting pool.”79
The renovation will also add new spa and fitness areas. In addition, the designs call for more than 100 additional luxury hotel rooms including the installation of “high-end, imported finishes.”
Fortunately for the developers, they will not have to commit any crimes to obtain up to $20 million in benefits from the taxpayers.
Resort in the Heart of Millionaire’s Row Reaps Hundreds of Millions from Taxpayers
Located in the “heart of Millionaire’s Row,” the Fontainebleau Resort in Miami Beach, Florida, completed a $1 billion renovation that yielded “a spectacular blend of Miami’s glamorous golden era and stylish modern luxury.”80
The Fontainebleau Resort now features “1,504 rooms and suites, more than 20 oceanfront acres, 12 restaurants and night-clubs including three signature restaurants, a 40,000 square foot spa, and a sophisticated poolscape with private cabanas.”81
While most taxpayers likely have not paid the minimum $219+82 per night rate to stay at the luxury resort or had
Fontainebleau Resort was listed on the National Register of Historic Places in December 2008.1 Within a year, it was celebrating the grand opening of the billion dollar renovated resort with a Victoria’s Secret Fashion Show, and performances by Usher, Mariah Carey, and Robin Thicke.
Inside “the capital’s most luxurious hotel,” the St. Regis, which received at least $ 11.2 million in federal historic tax credit subsidies.
Tourists visiting the nation’s capital can go visit Madame Tussauds, the famous wax museum
filled with replica wax figures of famous celebrities. Madame Tussauds took over the
former location of a DC shoe store using $520,000 worth of federal historic tax credits.

40 | Tax Decoder Economic and Community Development | 41
a $6583 dry-aged steak at one of the resort’s signature restaurants, you have already partially paid for it through a $317 million renovation project partly paid for through the historic preservation tax credit.84
Fontainebleau Resort was listed on the National Register of Historic Places in December 2008.85 Within a year, it was celebrating the grand opening of the post billion dollar renovated resort with a Victoria’s Secret Fashion Show, and performances by Usher, Mariah Carey, and Robin Thicke.86 Commenting on the taxpayer supported renovated Fontainebleau, Martha Stewart stated, “I think it’s great….They’re trying so hard to make everyone comfortable.”87 In this case, “they” are the American taxpayers and “everyone” are those fortunate enough to vacation on Millionaire’s Row.
The architect of the original Fontainebleau Resort hotel felt “that if you create a stage and it is grand, everyone who enters will play their part.”88 Indeed, with a $60 million tax credit, the American people played their part in a large way.
Taxpayers Support Unaffordable Housing in Aspen
Pegged by Frommer’s as “one of the best places to stay in Aspen – for those who can afford it,” Hotel Jerome is a luxurious hotel located in the quintessential getaway ski resort town of Aspen, Colorado.89 Hotel Jerome recently completed a multi-million dollar renovation in 2013 that entailed 94 rooms being “refurbished with new carpet, wallpaper and amenities” in addition to “overhauls of the lobby, dining room and ballroom.”90
The property owner’s also received a historic preservation tax credit, helping to enhance “the grandeur of the hotel’s already spacious guest rooms.”91 As described by Hotel Jerome’s owners, the rooms now have “a soulful, Western authenticity with the bonus of indulgent luxuries that are de rigueur Auberge: plush bathrobes, custom-blended bath products, and gourmet snacks.” The hotel features “key decorative elements- cashmere curtains, burnished-leather bed frames, and cubist carpet design.”92
This is not the first time the owners of Hotel Jerome have utilized tax tricks to reap benefits from the public. The city of Aspen had previously accused the owners of using a
“fraudulent conveyance of the property as part of a broader scheme to avoid paying a hefty real estate transfer tax bill,” according to an Aspen Times article.93 The Hotel Owners foreclosed against its own wholly-owned subsidiary in order to avoid a $405,000 Real Estate Transfer Tax.94
Hotel Jerome is undoubtedly a fantastic destination for “those who can afford it,” but it raises the broader question as to whether the American people can afford subsidizing such luxurious vacation designations.
DC Wax Museum built with help of Historic Tax Credits
Tourists visiting the nation’s capital can go visit Madame Tussauds, the famous wax museum filled with replica wax figures of famous celebrities. Madame Tussauds took over the former location of a DC shoe store using $520,000 worth of federal historic tax credits.
Washington DC Luxury Hotels
Tourists and special interest groups alike travel from all around the world to visit our nation’s capital. While visiting Washington DC, they can choose to stay in one of the District’s luxury hotels whose construction and/or renovation has been subsidized by the American taxpayers. Since 2000, $111.5 million in renovation work at four of Washington DC’s finest hotels have qualified for the historic preservation tax credit.
St. Regis Washington DC, self-described as “the hotel of choice for royalty, presidents, and prime ministers in the nation’s capital, completed a $56.2 million renovation of the old Carlton hotel that reinstated it as “the capitol’s most luxurious
Washington D.C.’s Hotel Monaco received a $4.6 million tax credit in order to transform the government owned General
Post Office building into a boutique hotel.
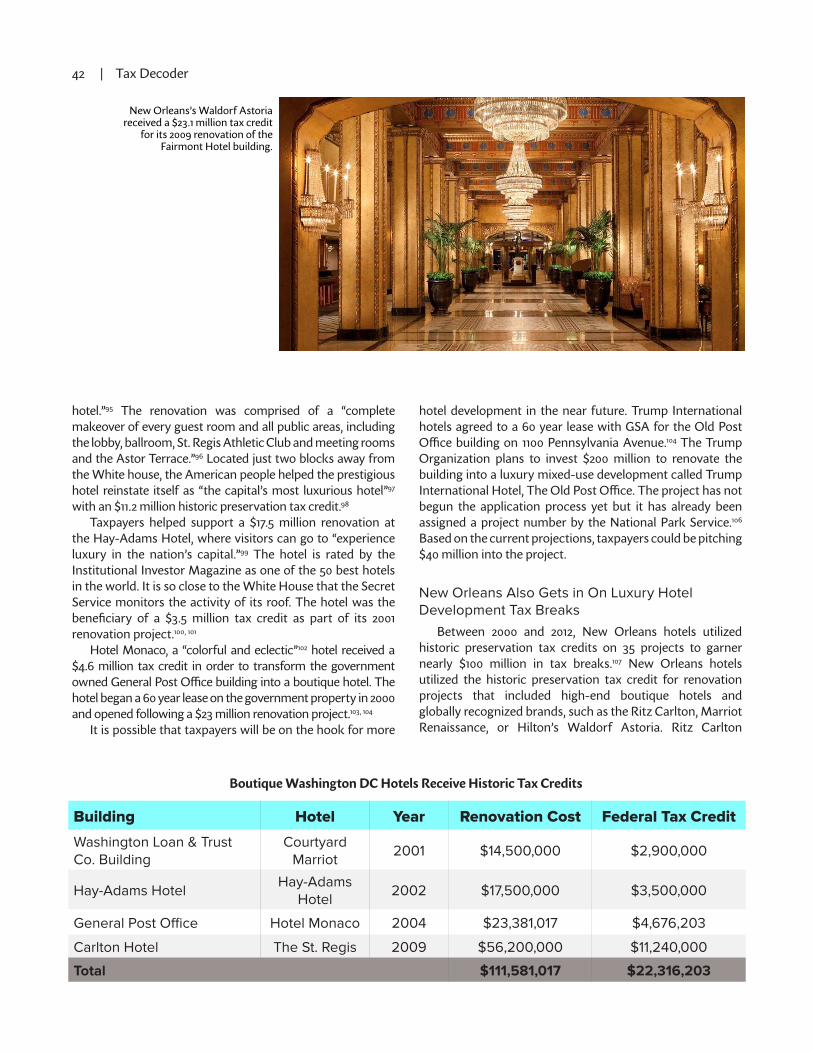
DRAFT
42 | Tax Decoder
New Orleans’s Waldorf Astoria received a $23.1 million tax credit
for its 2009 renovation of the Fairmont Hotel building.
hotel.”95 The renovation was comprised of a “complete makeover of every guest room and all public areas, including the lobby, ballroom, St. Regis Athletic Club and meeting rooms and the Astor Terrace.”96 Located just two blocks away from the White house, the American people helped the prestigious hotel reinstate itself as “the capital’s most luxurious hotel”97
with an $11.2 million historic preservation tax credit.98
Taxpayers helped support a $17.5 million renovation at the Hay-Adams Hotel, where visitors can go to “experience luxury in the nation’s capital.”99 The hotel is rated by the Institutional Investor Magazine as one of the 50 best hotels in the world. It is so close to the White House that the Secret Service monitors the activity of its roof. The hotel was the beneficiary of a $3.5 million tax credit as part of its 2001 renovation project.100, 101
Hotel Monaco, a “colorful and eclectic”102 hotel received a $4.6 million tax credit in order to transform the government owned General Post Office building into a boutique hotel. The hotel began a 60 year lease on the government property in 2000 and opened following a $23 million renovation project.103, 104
It is possible that taxpayers will be on the hook for more
hotel development in the near future. Trump International hotels agreed to a 60 year lease with GSA for the Old Post Office building on 1100 Pennsylvania Avenue.104 The Trump Organization plans to invest $200 million to renovate the building into a luxury mixed-use development called Trump International Hotel, The Old Post Office. The project has not begun the application process yet but it has already been assigned a project number by the National Park Service.106
Based on the current projections, taxpayers could be pitching $40 million into the project.
New Orleans Also Gets in On Luxury Hotel Development Tax Breaks
Between 2000 and 2012, New Orleans hotels utilized historic preservation tax credits on 35 projects to garner nearly $100 million in tax breaks.107 New Orleans hotels utilized the historic preservation tax credit for renovation projects that included high-end boutique hotels and globally recognized brands, such as the Ritz Carlton, Marriot Renaissance, or Hilton’s Waldorf Astoria. Ritz Carlton
Building Hotel Year Renovation Cost Federal Tax Credit
Washington Loan & Trust Co. Building
Courtyard Marriot
2001 $14,500,000 $2,900,000
Hay-Adams HotelHay-Adams
Hotel2002 $17,500,000 $3,500,000
General Post Office Hotel Monaco 2004 $23,381,017 $4,676,203
Carlton Hotel The St. Regis 2009 $56,200,000 $11,240,000
Total $111,581,017 $22,316,203
Boutique Washington DC Hotels Receive Historic Tax Credits

42 | Tax Decoder Economic and Community Development | 43
Hollywood Boulevard Some Hollywood executives must have taken a lesson from Mr. Smith Goes to Washington, the American classic depicting a
young man winning over many in Washington. With one tax carve-out, the rich and famous have hit a billion-dollar bonanza. “You’ve heard of Farm Subsidies. Well, Congress in essence created subsidies for the film industry through Section 181,”
wrote one industry insider of the Hollywood tax break.110 Under the special tax rules, film and TV producers can deduct 100 percent of their costs, up to $15 million, regardless of
their overall budget and expected revenue, if at least 75 percent of a project’s compensation takes place in the United States. If a project is produced in a low-income area, the tax benefit rises to $20 million. Furthermore, each of the first 44 episodes in a television series is treated as an independent production, and qualifies for the full amount of the deduction.
The only excluded types of film or TV are productions with any sexually explicit material. There is no limit to the benefits or frequency with which a producer uses the special tax break. An unlimited number of
projects can use the break, since the rules apply uniquely to each project.
received a $33.9 million tax credit for its work at the Maison Blanche building, while the Waldorf Astoria reaped a $23.1 million tax credit for its 2009 renovation of the Fairmont Hotel building.
New Orleans’s Waldorf Astoria received a $23.1 million tax credit for its 2009 renovation of the Fairmont Hotel building.
Deck Stacked Against American Tax Payers
When voters of Ohio approved the building of the first casino in the state, did they know they would ultimately be the ones paying for the construction? The Horseshoe Casino in Cleveland opened on May 14, 2012 and is the first casino in Ohio’s history. Caesars Entertainment and Dan Gilbert’s Rock Gaming companies decided to build their casino in the former Higbee Building at Tower City Center in downtown Cleveland. The renovation cost the companies $44,829,620 which in turn received an $8,965,924 Historic Tax Credit. The casino features more than 1,600 slot machines, 200 video poker machines, 89 table games,108 and raked in $242,646,044 in revenues FY 2013.109 Most taxpayers would agree that Horseshoe Cleveland did not need an $8 million tax break.
Controversy struck during the renovation of the Higbee building. Dan Gilbert, the owner of the casino, wanted to build a skywalk from his casino’s parking garage to the Higbee
building. According to the National Park Service (NPS), in order for a building to qualify for the Historic Tax Break, the renovation has to be relevant to the building’s original structure. The plan for the skywalk was denied by the NPS, appealed and ultimately the ruling held up. Dan Gilbert built the skywalk anyway and forwent the Historic Tax Break. The National Park Service’s decision brought light to the Historic Tax Break issue; you may build casinos but no skywalks.
Recommendation
The National Historic Tax Credit is duplicative, costly, and unnecessary. Eliminating this tax break would not preclude states and local communities from implementing, maintaining, or expanding historic preservation programs on their own. Nor would eliminating this tax credit lead to the collapse of iconic historic structures that have long been protected and preserved by the federal government. Instead, this will prevent the federal government from doling out hundreds of millions of dollars to luxury vacation destinations, major league baseball teams, and practically any other renovation project in the one million plus buildings eligible for a tax credit under the program.
THE NATIONAL HISTORIC TAX CREDIT IS DUPLICATIVE, COSTLY, AND UNNECESSARY.

DRAFT
44 | Tax Decoder
History
Congress first passed the Hollywood tax break in 2004, with the intention of preventing “runaway production” – the so-called phenomenon of film production going abroad.111 Other foreign countries began luring moviemakers with subsidies, with one report stating billions were leaving the U.S. economy.112 The initial version of the benefit was set to be a temporary handout, and only applied to smaller productions with a total budget of $15 million (or $20 million if produced in a low-income area). It was also set to be a temporary benefit to the industry.
Inevitably, the subsidy was later expanded in 2008 by eliminating the budget requirement, so that any film or T.V. production could take advantage of the tax break. Set to expire once again in 2012, Congress extended the tax break through December 31, 2013. Productions commencing before that date will still be able to utilize the provision in future years. Looking forward, Congress is likely to extend the provision again.
Cost and Usage
Extension of the provision was included in the Senate’s 2014 extenders legislation, the EXPIRE Act of 2014. Assuming continued extension, the provision is estimated to cost $126 million in 2014 and $838 million over five years.113 Since its inception in 2004, the special deduction may have cost taxpayers over $1.3 billion.114, 115 No data exists on the geographic or income distribution of the deduction’s recipients.
Analysis
While the intent of the tax program was to save jobs, no evidence exists to show it has actually saved any but it certainly has given an added boost to an industry that fared very well even during the recent economic downturn. Since 2004, ticket sales have increased from $9.11 billion to an estimated $10.9 billion for 2013.116 Last year, The Avengers smashed box office records on its way to becoming the third-highest grossing move of all time at just over $623 million.117
One 2013 industry analysis states, “Film and other entertainment sectors are constantly outperforming and seem to be more resistant to untimely global events and adverse economic conditions.”118
A variety of other television programming is eligible for the tax break. No list of recipients has been published, but
[r]eality shows like American Idol, So You Think You Can Dance, etc., qualify, as do quiz or game shows like Deal Or No Deal or Smarter Than A Fifth Grader. Similarly, the regulations make eligible
documentaries, religious or spiritual shows, sports programs, interview and talk shows, movies of the week, as well as news programs,
according to one analysis of the tax code.119 Commercials and YouTube video production may even qualify for the tax break.120, 121
Congress did not foresee so many productions potentially raiding the Treasury. When creating regulations to implement the new law in 2004, the IRS noted Congress’ intention “arguably would exclude productions that do not fall within these delineated categories.”122
One peculiarity may benefit TV shows even more than film producers. Since every episode of a series qualifies for the full deduction up to 44 episodes, TV producers may receive up to a $660 million deduction for a single show. For shows produced in low-income areas, the maximum deduction is $880 million per show.
That amount is more than enough to cover production of many of the most expensive shows. Game of Thrones – the HBO drama based on a popular book series – reportedly costs $6 million per episode.123 X Factor has a per-season budget of $100 million.124
Major league sports games even qualify for the deduction (though it is unclear if major networks are utilizing the tax loophole). “[I]t would apply to the entire cost of producing ‘Monday Night Football,’ including the cost of acquiring the underlying rights,” wrote one entertainment tax expert.125 Many sports stadiums are located in low-income areas, as designated by the Census Bureau, so television programs produced there qualify for a larger deduction. Stadiums such as Sports Authority Field at Mile High (home of the Denver Broncos), Fedex Field (home of the Washington Redskins), or Nationals Field (home of the Washington Nationals), are all in qualifying areas.126
Each National Football League game alone can cost the major networks millions of dollars just for the purchase of rights to broadcast.127 The NFL itself has a network – the NFL Network – that televises Thursday night games. This multi-bil-lion dollar enterprise may also be able to claim the tax break for each of its productions.
The benefits to Hollywood extend beyond a write-off. “[T]he section 181 deduction can create a net operating loss (NOL) which can be carried back (two years), up to five years for certain taxpayers, and forward (20 years)….This seems to be a potential tax shelter,” concluded one study of the provision.128 A profitable company could purchase a film or TV company just to get an offset for future income tax liability.129
Most states have also created a number of special incentives for the film industry. North Carolina, for example, gives film producers a 25 percent cash tax rebate.130
No clear evidence exists to demonstrate whether the federal

44 | Tax Decoder Economic and Community Development | 45
Tax Provisions for Magazines
Expensing of Magazine Circulation Expenditures
Magazine publishers retain a special exemption to business depreciation rules, a benefit worth roughly $50 million per year and at least $100 million from FY 2014 through FY 2018.135
Under normal tax rules, businesses are required to depreciate their capitalized investments over a set number of years (which is determined by the IRS). Magazine companies are allowed to fully deduct any “expenditures to maintain, establish, or increase circulation in the year when they are made.”136 For other businesses, such activities would be considered investments that need to be depreciated over a number of years. Living the “LIFE,” magazine companies get the extra benefit of accounting for the expense immediately. Getting their tax benefit early significantly decreases a publisher’s cost of doing business. In general, other businesses are not given such preferential treatment.
Though this provision largely benefits a few publishers, it may simplify tax compliance for businesses and administration for the IRS. However, it is more appropriate to eliminate this special carve-out as part of tax reform and instead lower overall corporate income tax rates.
Special Rules for Calculations on Returns
Magazine and book publishers have their own special page in the tax code for returned items. The overall benefit for these special provisions is less than $50 million annually,
but at least $200 million from FY 2014 through FY 2018.137
Under special rules passed in 1978, if these companies receive returns – such as books – from vendors within a certain timeframe after a tax year ends, they can still exclude that income from last year’s tax returns. Normally, a company would have to wait until the following year to exclude the income from taxes. Magazines must be returned within 75 days after the tax year, and paperback books and musical albums within 95 days. Hardback books, however, are not allowed.
The apparent reasoning for the rule is the unique nature of the industry.
A common practice in the publishing industry is to ship substantially more magazines than are expected to be sold to enable the retailers to keep their shelves stocked. Keeping the retailers’ shelves stocked promotes visibility of the magazines and insures [sic] that there will be an adequate stock of undamaged magazines on hand,
notes one description of the loophole.138 At the same time, many other retail industries have returns, and do not have or need special tax breaks. They set aside cash in reserve accounts to offset the expected cost of product returns.
Recommendation
Eliminating these premiums would bring overall simplifi-cation to the tax code, as noted previously by the Reagan Ad-ministration.139 IRS administration would also be easier, since the agency would not have to verify whether income was adjusted properly.140 Businesses of different sectors would be placed on a more equitable competitive footing.
or state incentives are actually achieving their goals of preventing “runaway production.” There is also no data to suggest the cost to taxpayers is worth subsidizing a multibillion industry.
Hollywood is also able to take advantage of several other tax loopholes. The first is through Section 199, which allows for a deduction of costs related to domestic production activities. The film industry received a special carve-out to utilize this section in 2007, several years after the provision was first created.131 Motion picture and sound recording companies received $744 million in domestic production tax benefits in 2010.132 Other tax sheltering schemes advocated by an industry tax expert include use of a Domestic International Sales Corporation and offshore tax structures.133
Recommendation
Congress should eliminate this special depreciation schedule. This provision was started as temporary assistance to an industry allegedly being lured away by foreign countries. During the 2009 consideration of the stimulus legislation, the Senate voted 52-45 to strip the bill of an accelerated depreciation preference for Hollywood, worth $246 billion over 11 years.134
As middle-class families struggle to make ends meet, Hollywood bigwigs should not be receiving special assistance from Uncle Sam, especially since the industry is more stable even in tough economic times.

DRAFT
46 | Tax Decoder
New Markets Tax Credit After a decade of economic growth and expansion, President Clinton and a Republican Congress purposed to spread
the wealth to areas lagging behind the rest of the country. Their efforts culminated in December 2000, with passage of the Community Renewal Tax Relief Act, a bipartisan spending bill intended to jump-start economic activity in poor communities.
The legislation enacted nearly $26 billion in tax expenditures,141 including the New Markets Tax Credit (NMTC), a tax incentive designed to “spur new or increased investments into operating businesses and real estate projects located in low-income communities.”142
Most of the country, however, is considered a low-income community for purposes of the program. “As a result of the definition of qualified low-income communities, virtually all of the country’s census tracts are potentially eligible for the NMTC,” according to the nonpartisan Congressional Research Service.143
Administered by the Department of Treasury’s Community Development Financial Institutions Fund (CDFI Fund), the New Markets Tax Credit provides federal tax credits to financing entities, such as banks, for investing in businesses located in qualified low-income areas. These credits are distributed through a complicated mechanism involving several different entities and numerous tax lawyers.
First, Congress authorizes the total amount of tax credit allocations that may be awarded each year. Next, the Treasury’s CDFI Fund doles out the allocation authority to Community Development Entities (CDEs). A CDE is an entity that acts as the middleman between the investors (often a bank or hedge-fund) and a low-income project that will receive a loan from the lending entity.
Once a CDE has been allocated the tax credits to distribute, it seeks out investors to purchase those tax credits to help finance various local projects. The private investor, nearly 40 percent of which are banks or other regulated institutions, then claims a tax credit equal to 39 percent of their investment over seven years. In exchange for the tax
credit, the investor makes investments in the CDE, and the CDE then uses these funds to make direct investments in, or offer below-market or more flexible loans to, low-income community businesses or projects.144 According to the GAO, in recent years private investors have claimed more than $1 billion in New Markets Tax Credits annually.145
Because of the complex structure of the tax credit and investments, as well as taxpayer privacy protections, there is very little transparency on the amount of tax credits individual investors are claiming at the project level. While Washington politicians claim the program’s goal is to put more money into the hands of businesses in struggling communities, the real beneficiaries are Wall Street banks and other large investment enterprises. Additionally, in many cases, investors that claim the credits are providing special loans to questionable and wasteful projects with virtually no accountability to taxpayers.
It is important to distinguish between the various recipients of government assistance through the NMTC. The direct government subsidy (the tax credit) is given to the private investors and financing conglomerations, based on their investments.146 Businesses and other projects, such as hotels, recreational centers, health spas, movie theaters, and fast food chains, receive low-interest loans from the lending entities claiming the NMTC.147 While these local projects do not receive a financial subsidy directly from taxpayers, the qualifying projects and businesses benefitting from the New Markets program receive millions of dollars in private loans and equity investments from the banks that provide investment in order to claim the federal tax credit. According to the CDFI Fund’s online database, nearly 4,000 projects received loans or equity investments from entities claiming the NMTC.148
New Markets, Same Old Waste
While Wall Street banks and other financial corporations cut their tax bills by millions of dollars every year through the New Markets Tax Credit, many of the projects in which they invest may fall short of the program’s goal – to bring economic opportunity to struggling communities.
From fast food joints to parking garages and luxury hotels, the government subsidizes banks for investing in nationwide
Starbucks and IHOP have been recipients of
financing through the New Markets Tax Credits

46 | Tax Decoder Economic and Community Development | 47
chains or corporations with proven business models without the need of this government handout. In other cases recipients are larger commercial real estate developments and other private entities in little need of taxpayer help.
The New Markets program prohibits the credit from being used for “the operation of any private or commercial golf course, country club, massage parlor, hot tub facility, suntan facility, race track, or other facility used for gambling, or any store the principal business of which is the sale of alcoholic beverages for consumption off the premises.”149
Despite these restrictions, many questionable projects are still funded by NMTC.
The NMTC helped finance a Starbucks in Indianapolis, a bakery in New Bedford, Massachusetts, a baseball stadium in Kentucky, four bowling alleys, six car washes, four coffee shops, a day spa in Alaska, an IHOP in Milwaukee, four law firms, and at least two Mexican restaurants in Colorado and Wisconsin.150
Another $17 million NMTC allocation paved the way for the residents of Pittsburgh to get a new Target store,151 and a specialty tea shop in Columbus, Ohio received two NMTC allocations.152
NMTC projects also include:153
Tax Credits for the Poor Wash Up on the Shore of a Billionaire’s Fantasy Island
The beautiful Hawaiian island of Lanai, regarded as “a playground for the moneyed,”154 was hit especially hard by the recent economic downturn. Just four years ago, “all major new construction” had “stopped and the island’s
• Dog day care, and a dog rehabilitation, grooming, and wellness facility
• Gas stations and convenience stores
• Dance studio• Recording studios• Shopping centers• Fitness center• Funeral homes• Subway• YMCA gym• Flea Market• Garbage collection
and landfills• Parking lots• CPA firms• Laundromats• Auto repair shops• Starbucks
• Florist• Sporting goods
stores• Charter schools• Ice cream company• eBay consignment
selling services• Custom yacht
dealer• Limousine service• Churches• Fast food
restaurants• Car and motorcycle
dealerships• RV park• Dry cleaners• Brewery• Frozen custard
shop
largest employer” had “laid off or furloughed 20 percent of its work force and cut hours” for the remaining employees. Families on the island were “pushed to the edge.”155
Today, Lanai “is booming.”156
More people are coming to the island for work opportunities and fewer are leaving. Infrastructure is being upgraded with roads being paved, airport runways being lengthened, and new airlines being added “to improve access” to the island.157
There are plans to build an “ultraluxury hotel,” return commercial agriculture, and establish a
sustainability laboratory that will help make the island ‘the first economically viable 100%-green community,’ as well as to improve educational opportunities for children, ensure quality health care and lower living costs.158
The community pool has been renovated and re-opened. The park has a new swing set and basketball and volleyball courts.
“People are going back to work and people seem to have a lot less stress in their lives,” said Diane Preza, a Lanai public school teacher, noting “It just seems the community has come alive. And people feel like there’s hope.”159
All the results of New Markets Tax Credits? Nope. All of these improvements and investments are being
privately funded by billionaire Larry Ellison, the third-richest man in America,160 who bought nearly the entire island for $300 million in 2012. Ellison’s net worth is $49.4 billion.161
He owns “nearly everything on the island,” reports The Wall Street Journal referring to Lanai as “Larry Ellison’s Fantasy Island.”163 In July 2014, Ellison “purchased the historic Hotel Lanai for an undisclosed price” and became “the owner of every hotel room on the island.”163 One of the two grocery stores, the community center and pool, the water company, the movie theater, and half of the roads belong to him.164 He also “owns the gas station, the car rental agency and the supermarket.” He owns the Lanai City Grille as well as
two championship golf courses, about 500 cottages and luxury homes, a solar farm, and nearly every single one of the small shops and cafes that line Lanai City. He owns 88,000 acres of overgrown pineapple fields and arid, boulder-strewn hills, thick with red dust, as well as 50 miles of beaches.165
The remaining two percent of the 141-square mile island “is owned by the government or by longtime Lanai families.”166
“It’s easy to understand the improvement of the economy on Lanai when you watch the arrival at Manele Small Boat Harbor of one of five daily ferry round trips from Maui,” reports Hawaii News Now. “The boat is packed with more than 100 people, including tourists bringing their golf clubs on day trips and lots of construction workers and other trades people. Electrician Kevin McNamara said business

DRAFT
48 | Tax Decoder
at Sturdevant electrical contractor on Lanai has increased 300-percent since Ellison” bought the island. “The amazing thing is we have to send the workers home every night because there’s no longer housing. When he first bought the island, they would spend the night, spend the week,” said McNamara. A new restaurant has opened, “hiring a staff of more than 30” people and “Smaller mom-and-pop operations” are benefitting from “a 20-percent increase in business” and are “hiring for more than 100 new jobs.”
Ellison himself is doing what the NMTC program was intended to do—creating economic opportunities. But instead of tapping government incentives and taxpayer funds, Ellison is investing his own personal wealth and relying on market forces to succeed.
“It’s surreal to think that I own this beautiful island,” reflected Ellison.167 “It doesn’t feel like anyone can own Lanai. What it feels like to me is this really cool 21st-century engineering project, where I get to work with the people of Lanai to create a prosperous and sustainable Eden in the Pacific.”
As the island’s economy blossoms with new projects and businesses resulting from the investments made by its billionaire owner, suddenly the New Markets Tax Credit washes up to do essentially what is already being done.
NMTC “was established by Congress in 2000 to spur new or increased investments into operating businesses and real estate projects located in low-income communities,” according to the federal agency that administers the program.168
So it may be surprising that millions of dollars in NMTC financing could be coming to an island where such investments are already being made and new markets are already in the works.
But the Lanai Community Health Center is hoping to take ad-
vantage of NMTC financing to help build a new $8 million facility.169
There already is a health center on the island, but “the new health center is expected to be five times larger than the current facility.”170 The new center, which will be 6,800 square feet and include medical examination rooms as well as a “multipurpose room to hold joint programs with the art center,” will be “far bigger” than the center’s existing 1,000-square-foot building.171
The center has received millions of dollars in public funding from other state and federal government programs as well as $125,000 “from local businesses and the community.”172 In July, the Hawaii state government provided $500,000 for construction and the state legislature approved an additional $1.75 million.173
“Part of the project is also being funded with investors attracted by” the New Market Tax Credit.174 While the amount of NMTC assistance for this program is not publicly available, the center anticipated receiving $3 million in financing through the program.175
Although details remain elusive, Novogradac & Company, a Certified Public Accounting firm that specializes in constructing elaborate New Markets Tax Credits financing deals, may be involved in structuring the financial arrangement.176 Michael Novogradac, a managing partner at firm and board member of the New Markets Tax Credit Coalition, tweeted the announcement of the new center, “Health facility planned for the heart of Lanai -http://Mauinews.com http://shar.es/Z4pAU #NMTC.”177
The current center employs 15 full-time workers and six to eight part-time workers, but Executive Director Diana Shaw expects this number to increase. “Of course we have
Billionaire Larry Ellison purchased the beautiful Hawaiian island of Lanai, regarded as “a playground for the moneyed,” and is investing his resources to revitalize the tropical paradise.

48 | Tax Decoder Economic and Community Development | 49
to find people, but that’s a whole other project,” she said.178
Shaw notes “the project is helped by brisk construction elsewhere on the island” for Ellison’s projects since “some contractors the health center is working with are already on the small, remote island.”179
While a new health center would most likely benefit the island’s 3,135 residents, this does not seem to be the right time or place to direct federal economic development assistance. Given that it is touted as a tropical and economic paradise, it is bewildering why the flourishing island would need the federal NMTC to access financing opportunities.
With the island’s economy now booming, the New Markets Tax Credit program is unnecessarily sinking millions of dollars in federally subsidized financing into the billionaire’s island.
The Flipper Tax Credit: Dolphins Dive for Tax Dollars
Dolphins and Hollywood producers are among the unlikely beneficiaries of tens of millions of dollars in NMTC investments intended to benefit struggling neighborhoods in Atlanta, Georgia.
Financing through two NMTC allocations totaling $40 million were sunk into the world’s largest aquarium -- the Atlanta Aquarium -- to expand the AT&T Dolphin Tales exhibit.180 A Community Development Entity owned by the city of Atlanta, Georgia, received the tax credit allocation, which was then sold to Wells Fargo and SunTrust banks for funding to complete the $120 million project.181
The AT&T Dolphin Tales exhibit “includes a soaring, naturally-lit entrance lobby featuring an expansive underwater dolphin viewing window”182 leading into
the theater, which is a “state-of-the-art enclosed facility designed as the perfect backdrop for a spectacular musical theatrical performance highlighting the strong emotional bond between dolphins and human.”
NMTC supporters claim this project “added” hundreds of jobs.183 Some of the jobs created were not in hard hit Atlanta neighborhoods, but Hollywood. “An original score was recorded by a 61-piece orchestra at Sony Studios in Hollywood” and “Emmy-winning producers and directors, along with a team of talented individuals from TV, film and Broadway, developed the show.”184 And caring for animals --especially dolphins -- is a highly skilled profession requiring years of education in marine mammal veterinary medicine. The aquarium’s head veterinarian received compensation totaling $363,035 in 2010.185
“There’s more impact here than just jobs,” Tyrone Rachal, the president of Imagine Downtown Inc, argues. “This is an educational opportunity for families and children in a landlocked city who otherwise might not have the opportunity to learn about marine mammals.”186
Yet, taxpayers who helped finance the exhibit still must pay a cover charge to see the exhibit. The cost per visitor, regardless of age, is $64.95.187 This price may be an especially high financial barrier for lower-income families— the intended beneficiaries of this project and the NMTC program.
“This fast-paced program lasts 15 minutes and includes approximately 8 to 10 minutes of hands-on interaction with a dolphin.”188
The questionable use of NMTC funding an exhibit at an aquarium has been derided as a “classic bait and switch” operation that “conned” taxpayers. While the location of the project allowed it to technically qualify as a low-income area, nearby condominiums “are selling for as much as 2 million dollars…hardly what the government had in mind when they set the standard of 26% below poverty in order to qualify for the NMTC Program.”189
The proponents of the project openly admit the tax assistance was not even needed but its availability allowed the popular aquarium to spend money on other projects. “The NMTCs used to support the dolphin exhibit” are “freeing up funds for further aquarium enhancements,” notes Tyrone Rachal.190
“It’s the gift that keeps on giving” Rachal said, admitting the aquarium “could have used conventional financing to develop the dolphin gallery” or relied “on revenue from tickets sales and parking to fund new attractions.”191
The aquarium, which has attracted the interest of private investors, “would not disclose the monetary value of AT&T’s sponsorship.” It did disclose “several sponsors were under consideration for the naming rights of the exhibit.”192 Clearly, this project did not need federal financial assistance and is unlikely to have any noticeable benefit for lower income Americans, who likely cannot even afford to take in the dolphin encounter.
Lower income families—the intended beneficiaries of New Market Tax Credit—may be deterred from the Atlanta aquariums dolphin encounter by the high admission price of $64.95.

DRAFT
50 | Tax Decoder
Capital Peak Partners (CPP) helped negotiate the NMTC financing for the project. CPP is a firm that consults other organizations on NMTCs and has “structured and closed over $2 billion of NMTC loans.”193 CPP’s new markets experience includes “renewable energy projects, community facilities, mixed use properties, for-sale housing, hotels, retail” and others.194 The Reznick group, a top twenty accounting firm, also helped structure this NMTC deal.195
Monument to Waste Constructed with Tax Credits for a Wellness Center Whose Financial Health is in Critical Condition
A wellness center intended to provide health care to underserved populations is threatening to bankrupt the city of Desert Hot Springs, California. The center may even increase fees or cut services to stay afloat while spending tax assistance on gratuitous sculptures in the desert.
A sculpture in the desert was “paid for with leftover center funds from the U.S. Treasury’s New Markets Tax Credit Program” by the Desert Hot Springs Health & Wellness Center, located just north of Palm Springs, California.196
The sculpture, “Dancing on the Wind,” is “made from
industrial materials to withstand strong wind conditions in the city while aging gracefully.” On the top, “two figures stand on twin peaks — San Jacinto and San Gorgonio — reaching toward the heavens.”197
“Air moves the piece, while gravity puts it back into place.” 198
The artist “prefers to leave his sculptures open to interpretation.”199
“I’ll leave you to tell me what it means,” he said.200
Some taxpayers, while appreciating its artistic merits, may still interpret it as a symbol of government waste. The sculpture cost $65,000, according to a local report.201 While this amount may be a fraction of the overall NMTC, it is enough to pay the salary of a registered nurse for an entire year to care for patients at the Center.202
The NMTC was intended to support the Desert Hot Springs Health & Wellness Center “preventive and dental healthcare opportunities to a medically underserved population.”203
While creating jobs and expanding health care access is a noble goal, spending tax dollars for sculptures at a Wellness Center is not likely to do much to achieve either goal.
“This major art piece that we have here signifies where we want to go,” Mayor Adam Sanchez stated regarding the sculpture. “It’s all about health and wellness.”
His statement about the taxpayer financed sculpture blowing in the wind may be more accurate than he realized, but for the wrong reasons. The health and wellness of both the city and the center are in critical condition.
Desert Hot Springs is nearing bankruptcy and the Wellness Center is running a deficit. The city cannot sustain the center, according to a financial analysis released in July 2014 by “a state-appointed employment arbitration panel.”204
As a result, the city may be forced to increase user fees or reduce services at the Wellness Center.205
“Closure of the” Health & Wellness Center (H&W Center) is “a cost saving option which has been advocated,” according to the panel’s report. “The City must seriously consider increasing the service fee for its use” and “alternatively, there is the option of some decrease in the amount of services provided,” the panel’s report noted.206
However well intentioned the creation of that facility was, and it is without a doubt beneficial to the community, the record makes clear that operation of the H&W Center’s current panoply of services at the modest user fees charged is unsustainable,
U.S. BANK HAS INVESTED MORE THAN $4.1 BILLION IN NMTC PROJECTS AND EMPLOYS AT LEAST 24 INDIVIDUALS TO WORK
ON THE BANK’S NMTC INVESTMENTS.
A New Market Tax Credit financed the sculpture Dancing in the Wind, a reminder of tax dollars blowing in the wind that might have been better spent by a wellness center for the underserved that may have to increase fees, reduce services, or even close its doors due to budget shortfalls.

50 | Tax Decoder Economic and Community Development | 51
the panel concluded. The annual operation cost of the center in the 2012-2013 fiscal year “was about $991,000,” according to the city, while “revenues to fund it totaled only $811,000.” Of this amount, “$700,000 came from the federal government.”207 Additionally, the city previously received a congressional earmark “in excess of $3 million” intended for the facility.208
“The longer the H&W Center remains a financial drain on the City’s general fund, the greater the deficit will become and the prospect of municipal bankruptcy should not be taken lightly,” the panel warned.209
Meanwhile the budget shortfall “prompted Desert Hot Springs leaders to launch across-the-board salary cuts” and “discussed whether it was financially prudent to eliminate the police department.”210
New Market Tax Credits are intended to create economic opportunities in communities. In this case, poor management of the assistance has had the reverse effect. The project it financed is bankrupting the city, cutting salaries, and possibly eliminating jobs and increasing local taxes. But the sculpture paid for with the tax assistance remains dancing in the wind, a reminder of tax dollars blowing in the wind that might have been better spent.
Corporate Welfare: Banking on the Poor
The NMTC program allows banks and other financial entities to claim a tax credit for investing in businesses in low-income areas. Over the last decade, a niche group of investors, such as banks and hedge funds, have worked with Community Development Entities and projects to maximize their return while maximizing the cost to taxpayers as well. As of 2007, nearly 40 percent of all NMTC claimants were banks or other regulated financial institutions.211
Many banks have set up their own CDEs in order to receive tax credit allocations from the Treasury, making them both the recipient of the tax credits and the lender. Many of the top CDEs receiving tax credit allocations are subsidiaries of major banks including Bank of America, JP Morgan Chase, Wells Fargo, and SunTrust banks. Along with setting up their own CDE’s, banks invest in other CDEs which provide them with tax credits in return for an investment.
U.S. Bancorp Community Development Corporation,
part of U.S. Bank, claims to be the “most active New Markets Tax Credit (NMTC) investor in the country.”212 U.S. Bank has invested more than $4.1 billion in NMTC projects213 and employs at least 24 individuals to work on the bank’s NMTC investments.214 The 24 jobs at U.S. Bank exceed the number of permanent jobs created in low-income areas by some of the NMTC projects profiled in this report, one of which created only 33 temporary jobs. It appears the NMTC may have been more effective in creating jobs for Wall Street bankers and tax lawyers than for those looking for work on Main Street.
Although U.S. Bank claims to be the largest investor in NMTCs, other big banks are taking advantage of the program as well. JP Morgan Chase has received at least $480 million in NMTC allocations and has invested in “nearly $3.7 billion of NMTC authority allocated” to other CDEs.215
Despite the purpose of the tax credit being to leverage private investment, a new report by the GAO found a majority of NMTC projects utilize more than one source of public funding.216 Further, GAO found that through a process of “twinning,” investors are able to claim the New Markets Tax Credit on the equity raised through other federal funding sources—such as historic tax credits, Recovery Zone bonds and qualified school construction bonds. In these cases, corporations and investors are claiming federal New Markets Tax Credits based on a value much higher than the amount of their own money invested in a project.217
GAO’s latest report shows just one example of how a bank can structure a NMTC investment to claim $1.2 million in NMTC, even after investing less than half the amount:
Some evidence suggests that some investors may receive returns that are above-market returns and therefore more than the necessary subsidy required to attract the funds. In a case study reported by the Urban Institute, an investor appeared to put in about $500,000 of NMTC equity to claim $1.2 million of NMTCs representing a return of about 26 percent compounded annually. The NMTC was leveraged entirely with $2.5 million of federal and state [Historic Tax Credits] HTCs without use of a conventional leveraged loan in the NMTC structure. As a result, 83% of the qualified equity investment on which investors are claiming NMTCs is provided by other federal and state tax credit programs.218
THE NMTC MAY HAVE BEEN MORE EFFECTIVE IN CREATING JOBS FOR WALL STREET BANKERS AND TAX LAWYERS THAN FOR THOSE LOOKING FOR WORK ON MAIN STREET.
IN SOME CASES, CORPORATIONS AND INVESTORS ARE CLAIMING FEDERAL NEW
MARKETS TAX CREDITS BASED ON A VALUE MUCH HIGHER THAN THE AMOUNT OF THEIR
OWN MONEY INVESTED IN A PROJECT.

DRAFT
52 | Tax Decoder
The “twinning” structure that allows banks to get an abnormally high rate of return was discussed at a 2007 conference on federal Historic Tax Credits,219 and has since been used by several CDEs and banks.
New Markets are not only a great deal for big banks and hedge funds, but the increasing complexity of NMTC investments has benefited lawyers and accountants involved in the transactions. From 2011 to 2012, fees charged by New Markets middlemen siphoned at least $619 million away from the investment intended for low-income businesses.220 GAO also pointed to evidence that in transactions with relatively low fees, the low fees may be offset by higher interest rates.221 However, “a lack of transparency makes it hard to readily determine how much of the NMTC investment is being reduced and by what means.”222
US Banks on New Markets Tax Credits
U.S. Bank and developer McCormack Baron Salazar (MBS) joined together to install solar panels on low-income housing communities throughout California, using the New Markets Tax Credits program to finance them.
With a combination of federal and state funding, the project created 33 temporary jobs223 for individuals who had graduated from a federally funded workforce training program.224 The real beneficiaries of this project were the lawyers who designed the project’s convoluted financing structure and U.S. Bank, which claimed New Markets Tax Credits for more than their actual private investment.
U.S. Bank, one of the nation’s largest commercial banks and the largest NMTC investor, used a “twinned” tax credit financing structure, which allowed the financial giant to claim both the New Markets Tax Credits and the Section 1603 investment tax credits.225 The bank contributed funding that equaled the amount of solar rebates the project was set to receive through California’s Solar Initiative’s Multi-family Affordable Solar Housing program, which allowed U.S. Bank to claim a tax credit on money that was ultimately provided by the state program – not their own private investment.
This “twinned” structure, which has increased in popularity in recent years and is highlighted in GAO’s latest report,226 allows investors such as U.S. Bank to claim a federal tax credit on equity provided by other federal or state grants and tax credits, and evade rules intended to ensure the use of NMTC only for qualified low-income businesses. This runs contrary to the purpose of the New Markets Tax Credit, which is designed to incent private sector investment.
In addition to NMTC, the investment deal included the use of other federal tax credits and California’s Multifamily Affordable Solar Housing (MASH) program incentives.227
Although NMTC and Low Income Housing Tax Credits (LIHTC) cannot be combined, the developer (MBS) was able
to use federal LIHTC and federal HOPE VI grants to develop the affordable-housing communities that received the solar panels in 2010.228
US Banks on New Markets Tax Credits, Again
Using a creative web of financial transactions, the Crown Square mixed-use development in St. Louis was built using New Markets Tax Credits as well as other government subsidies, including federal and state historic tax credits, federal Community Development Block Grant funding, and a federal transportation grant.229 Despite millions of dollars in government help, the area remains nearly empty.
The NMTC allocations were provided by Enterprise Community Investment and McCormack Baron Salazar, and the tax credits were claimed by U.S. Bank CDC.230
The Crown Square development is one portion of a larger redevelopment plan for the 14th Street Pedestrian Mall. Another component of the redevelopment “consists of 42 units of affordable housing financed through tax-exempt bonds (and related four percent Low Income Housing Tax Credit), historic tax credits and other subsidies.”231 Despite the $35 million that went into redeveloping the area, “many buildings in Crown Square remain ghostly vacant.”232
In 2012, two years after the project was completed, 60 percent of the commercial property was still unused.233 The developers expected Crown Candy Kitchen to attract visitors to the area, but getting people to stay for longer than a lunch break has been difficult.234
While residents of St. Louis may not have benefited from redeveloping an area that remains largely empty, U.S. Bank was able to rake in the tax credits.
Duplication and Double Dipping
In a February 2012 report, the GAO “identified 23 community development tax expenditures available in fiscal year 2010…five ($1.5 billion) targeted economically distressed areas, and nine ($8.7 billion) supported specific activities such as rehabilitating structures for business use.”235 Each of the tax expenditures overlaps at least one other tax expenditure.236
In addition, more than 80 similar programs funded through the Departments of Commerce, Housing and Urban Development, and Agriculture as well as Small Business Administration target “economic development,” according to a March 2011 report.237 These 80 programs, of which 28 are specifically designed to spur growth in new markets, received a combined $6.5 billion in federal funding in 2010.238
The Office of Management and Budget also admitted the goal of the NMTC overlaps several other tax credits and numerous programs administered by the Departments of Housing and Urban Development and Commerce.”239
Along with the duplication of government programs and

52 | Tax Decoder Economic and Community Development | 53
tax expenditures, businesses have combined the NMTC with other sources of federal funding for specific projects, such as the historic preservation tax credit, renewable energy tax incentives, Brownfield Economic Development Grants, Department of Transportation funding, stimulus funding, earmarks, and HUD funding. Several states also offer their own NMTC programs that can be combined with federal new markets tax credits and other sources of federal and state funding.
GAO’s latest report on the NMTC program revealed: • 62 percent of NMTC projects received other public
funding in 2010-2012 (funds from federal, state or local public sources);
• 33 percent of NMTC projects received other federal funding; and
• 21 percent of NMTC projects received funding from multiple other government programs.240
Cost & Recommendations
The program results in hundreds of millions of dollars in lost revenue to the federal treasury each year, as GAO’s 2014 report found private investors are claiming more than $1 billion a year in NMTC.241
The NMTC program is expected to cost more than $1 billion in FY 2014, and $5.2 billion from FY 2014 through FY 2018.242
The EXPIRE Act of 2014, passed by the Senate Finance
Committee earlier this year would extend the NMTC for two additional years, and allow another $3.5 billion in tax credit authority each year, which will cost an additional $325 million from FY 2014 through FY 2018.243
The New Markets Tax Credit is poorly designed, duplicative of dozens of federal programs and tax credits, and has become a goodie bag for big banks and corporate America at the expense of the taxpayers. There is little evidence it has succeeded in its intended purpose of creating new markets in distressed areas to foster economic opportunities.
Congress should let the New Markets Tax Credit expire and focus its efforts on creating a fair and equitable tax code that will generate economic growth and opportunity for every American, not just the well connected. Will McBride, chief economist at The Tax Foundation “listed the New Markets Tax Credit as among the tax extenders that should be allowed to expire, describing it and many of the green energy tax items as programs used primarily by special interests.”244

DRAFT
54 | Tax Decoder
1 “Welcome to the Community Renewal Initiative,” U.S. Department of Housing and Urban Development, http://goo.gl/O0zRey, accessed September 16, 2014. 2 Tax Extenders Act of 2013 (S. 1859, 113th Congress), THOMAS, The Library of Congress, http://goo.gl/LrDv1v &, accessed September 16, 2014. 3 Donald J. Marples, “Empowerment Zones, Enterprise Communities, and Renewal Communities: Comparative Overview and Analysis,” Congressional Research
Service, February 14, 2011 (R41639). 4 Donald J. Marples, “Empowerment Zones, Enterprise Communities, and Renewal Communities: Comparative Overview and Analysis,” Congressional Research
Service, February 14, 2011 (R41639). 5 “Empowerment Zone and Enterprise Community Tax Incentives: A Guide for Businesses,” U.S. Department of Housing and Urban Development, http://goo.gl/iKExHR 6Although described as a “list of current empowerment zones,” the list appears to also include enterprise communities. “List of Current Empowerment Zones and
Updated Contact Information,” U.S. Department of Housing and Urban Development, http://goo.gl/RUk1bb, accessed September 16, 2014. 7 “26 U.S. Code § 1394 - Tax-exempt enterprise zone facility bonds,” Legal Information Institute, http://goo.gl/CJxRlz 8 Donald J. Marples, “Empowerment Zones, Enterprise Communities, and Renewal Communities: Comparative Overview and Analysis,” Congressional Research
Service, February 14, 2011 (R41639). 9 “Empowerment Zone and Enterprise Community Tax Incentives: A Guide for Businesses,” U.S. Department of Housing and Urban Development, http://goo.gl/iKExHR
, (p. 11-13) 10 “EZ/RC Locator,” Screenshot of the Knoxville, TN Empowerment Zone, http://goo.gl/YgTFqU, accessed September 16, 2014. 11 “26 U.S. Code § 1397C - Enterprise zone business defined,” http://goo.gl/xyyihp, “26 U.S. Code § 1397D - Qualified zone property defined,” http://goo.gl/VleLBZ, Legal
Information Institute. [1] JCT’s five-year estimate for renewal community incentives is $200 million. The $40 million figure is $200 million divided by 5. 12 “Estimates of Federal Tax Expenditures for Fiscal Years 2014-2018,” Joint Committee on Taxation, August 5, 2014, http://goo.gl/8ZcXYq, (p. 28-29). 13 “Empowerment Zone and Enterprise Community Program,” Government Accountability Office, September 2006, http://goo.gl/lkwQNU 14 “Federal Revitalization Programs Are Being Implemented, but Data on the Use of Tax Benefits Are Limited,” Government Accountability Office, March 2004, http://
goo.gl/DMtUh8, (p. 34). 15 Donald J. Marples, “Empowerment Zones, Enterprise Communities, and Renewal Communities: Comparative Overview and Analysis,” Congressional Research
Service, February 14, 2011 (R41639). 16 “Interim Assessment of the Empowerment Zones and Enterprise Communities (EZ/EC) Program: A Progress Report,” U.S. Department of Housing and Urban
Development, November 2001, http://goo.gl/Vh0t7y, (p. 3) 17 Donald J. Marples, “Empowerment Zones, Enterprise Communities, and Renewal Communities: Comparative Overview and Analysis,” Congressional Research
Service, February 14, 2011 (R41639), p. 18. 18 “Empowerment Zone and Enterprise Community Program,” Government Accountability Office, September 2006, http://goo.gl/6VnNBQ 19 Donald J. Marples, “Empowerment Zones, Enterprise Communities, and Renewal Communities: Comparative Overview and Analysis,” Congressional Research
Service, February 14, 2011 (R41639), p. 18. 20 “Interim Assessment of the Empowerment Zones and Enterprise Communities (EZ/EC) Program: A Progress Report,” U.S. Department of Housing and Urban
Development, November 2001, http://goo.gl/hcRcvo, (p. 6) 21 Donald J. Marples, “Empowerment Zones, Enterprise Communities, and Renewal Communities: Comparative Overview and Analysis,” Congressional Research
Service, February 14, 2011 (R41639). 22 22 Lowry, Sean, “Recently Expired Community Assistance Related Tax Provisions (‘Tax Extenders”): In Brief,” Congressional Research Service, R43541, May 22, 2014. 23 Lowry, Sean, “Recently Expired Community Assistance Related Tax Provisions (‘Tax Extenders”): In Brief,” Congressional Research Service, R43541, May 22, 2014. 24 Sagapolutele, Fili, “StarKist, Eni meet to discuss economic incentives for canneries,” Samoa News, September 15, 2014, http://goo.gl/TMHbWw 25 Lowry, Sean, “Recently Expired Community Assistance Related Tax Provisions (‘Tax Extenders”): In Brief,” Congressional Research Service, R43541, May 22, 2014. 26 Montgomery, Lori, “Special interests win in Senate panel’s attempt at tax reform,” Washington Post, August 2, 2012, http://goo.gl/afyaXM 27 Congressman Eni F.H. Faleomavaega (AS), “Senate Finance Committee Passes Two-Year Extension of American Samoa Economic Development Credit,” press release,
April 3, 2014, at http://goo.gl/ty3Rdm 28 “Tab 7: Effects of Extending Tax Provisions Scheduled to Expire Before 2024,” Individual Income Tax Receipts and the Individual Tax Base - February 2014 Baseline,
Congressional Budget Office, February 4 2014, http://goo.gl/qAk09p 29 “Federal Tax Incentives for Rehabilitating Historic Buildings” National Park Service, Mar 2014, http://goo.gl/GlER2z 30 “Tax Expenditures Compendium of Background Material on Individual Provisions,” Committee on the Budget United States Senate, prepared by the Congressional
Research Service, December 2012 31 Conrad, Kent. “Letter of Transmittal” U.S. Senate Committee on the Budget, Dec 28 2014, http://goo.gl/MEjVD7 32 Conrad, Kent. “Letter of Transmittal” U.S. Senate Committee on the Budget, Dec 28 2014, http://goo.gl/MEjVD7 33 Conrad, Kent. “Letter of Transmittal” U.S. Senate Committee on the Budget, Dec 28 2014, http://goo.gl/MEjVD7 34 Conrad, Kent. “Letter of Transmittal” U.S. Senate Committee on the Budget, Dec 28 2014, http://goo.gl/MEjVD7 35 “Estimate of Federal Tax Expenditures for Fiscal Years 2014-2018” JCX-97-14, Joint Committee on Taxation, Aug 5 2014, http://goo.gl/VtJofd 36 “Federal Tax Incentives for Rehabilitating Historic Buildings” National Park Service, Mar 2014, http://goo.gl/GlER2z 37 “The old Bill White Chevrolet facility in downtown Tulsa” KRMG, http://goo.gl/Tbbzyu 38 “Federal Tax Incentives for Rehabilitating Historic Buildings” National Park Service, Mar 2014 http://goo.gl/GlER2z 39 Strauss, Ben. “Status of Landmarks” The New York Times, Dec 16 2011, http://goo.gl/oTxCK1 40 Minor, Robyn. “Milliken Building named to national historic register” Park City Daily News, Feb 10 2010, http://goo.gl/BWX7nk 41 “Tax Expenditures Compendium of Background Material on Individual Provisions,” Committee on the Budget United States Senate, prepared by the Congressional
Research Service, December 2012. 42 “Other Independent Agencies,” White House FY2014 budget;43 “A Guide to Federal Tax Incentives for Brownfields Redevelopment” Environmental Protection Agency, 2011, http://goo.gl/S1pSnY 44 “Federal Tax Incentives for Rehabilitating Historic Buildings” National Park Service, Mar 2014, http://goo.gl/GlER2z 45 “Historic Tax Credits: State Programs” Novogradac Historic Tax Resource Center, http://goo.gl/Vsw74n 46 Swibel, Matthew. “Righteous Tax Credit” Forbes, Nov 29 2004, http://goo.gl/KPDzBG 47 New Markets Tax Credits are discussed in detail at the end of this section. These credits are distributed to the investors in certain economic development projects. 48 Swibel, Matthew. “Righteous Tax Credit” Forbes, Nov 29 2004, http://goo.gl/KPDzBG 49 “Federal Tax Incentives for Rehabilitating Historic Buildings” National Park Service, Mar 2014, http://goo.gl/GlER2z 50 “Federal Tax Incentives for Rehabilitating Historic Buildings” National Park Service, FY 2013, http://goo.gl/2WXdjr 51 “Federal Tax Incentives for Rehabilitating Historic Buildings” National Park Service, Mar 2014, http://goo.gl/GlER2z 52 “28. Housing Assistance” GAO, 2012 Annual Report, Feb 2012, http://goo.gl/R2Bfl2 53 “Historic Fenway Park Receives National Recognition as Part of 100th Anniversary Celebration” NPR, National Park Press Release, Jul 7 2012, http://goo.gl/kRmd6X 54 Reidy, Chris. “Red Sox seek landmark status for Fenway Park” Knight Ridder Tribune Business News, Aug 24 2005, http://goo.gl/JeUvgz 55 Turner, Greg. “Fenway swings $40M with historic designation” McClatchy – Tribune Business News, Mar 8 2012, http://goo.gl/um4Cpb 56 Badenhausen, Kurt. “The World’s 50 Most Valuable Sports Teams 2013” Forbes, Jul 15 2013, http://goo.gl/XUgEZ2 57 Forbes, http://www.forbes.com/profile/john-henry/ 58 Strauss, Ben. “Cubs Hint at Paying for Renovations” The New York Times, Jan 30 2013, http://goo.gl/7ZIBRy 59 Strauss, Ben. “Cubs Hint at Paying for Renovations” The New York Times, Jan 30 2013, http://goo.gl/7ZIBRy 60 “Project Number 28,546” National Park Service, Technical Preservation Services, http://goo.gl/3dtdeH 61 “Senate Passes ‘Mob Museum’ Prohibition In Stimulus” The Wall Street Journal, Feb 6 2009, http://goo.gl/3BmuWo 62 Toplikar, Dave. “City approves $7.1 million for mob museum exhibits” Las Vegas Sun, Jul 7 2010, http://goo.gl/aPv05J 63 Botkin, Ben. “Mob Museum to appeal tax decision” Las Vegas Review-Journal, Mar 7 2013, http://goo.gl/spbiez 64 “Return of Organization Exempt From Income Tax” GuideStar, http://goo.gl/6AfphE

54 | Tax Decoder Economic and Community Development | 55
65 Botkin, Ben. “Mob Museum to appeal tax decision” Las Vegas Review-Journal, Mar 7 2013, http://goo.gl/spbiez 66 “Federal Historic Tax Credit Basics” National Trust Community Investment Corporation, http://goo.gl/OwCS2j 67 Botkin, Ben. “Mob Museum to appeal tax decision” Las Vegas Review-Journal, Mar 7 2013, http://goo.gl/spbiez 68 Botkin, Ben. “Mob Museum to appeal tax decision” Las Vegas Review-Journal, Mar 7 2013, http://goo.gl/spbiez 69 “Resort Overview” Trump National Doral, http://goo.gl/xVqBR8 70 Sampson, Hannah. “Massive renovations progressing at Trump’s Doral resort” http://goo.gl/IsswAO 71 “Project Number 28,683” National Park Service, Technical Preservation Services, http://goo.gl/3dtdeH 72 “Project Number 28,683” National Park Service, Technical Preservation Services, http://goo.gl/3dtdeH 73 “Check out Chicago-are sites named to National Register of Historic Places” Crain’s Chicago Business, Feb 14 2014, http://goo.gl/1cNB6i 74 “Check out Chicago-are sites named to National Register of Historic Places” Crain’s Chicago Business, Feb 14 2014, http://goo.gl/1cNB6i 75 Vankin, Deborah. “Wallis Annenberg Center for the Performing Arts set for grand opening,” Variety, October 17 2013, http://goo.gl/pzMNo6 76 Lightner, David. “Agenda Report” City of Beverly Hills, Mar 12 2013, http://goo.gl/78jGnK 77 Vankin, Deborah. “Starry gala opens Wallis Annenberg Center for the Performing Arts” LA Times, Oct 18 2013, http://goo.gl/zZTYj2 78 Cooper, Rebecca, “Grunley tapped for $100 M Watergate Hotel renovation,” Washington Business Journal, October 3, 2014, http://goo.gl/MDfMgm 79 Cooper, Rebecca. “Watergate Hotel renovation could begin in March” Washington Business Journal, Jan 14 2014, http://goo.gl/1OiB1o 80 “About Fontainebleau” Fontainebleau Resort, http://goo.gl/9q4p5b 81 “About Fontainebleau” Fontainebleau Resort, http://goo.gl/9q4p5b 82 “What is the average price of a room at Fontainebleau Miami Beach?,” Forbes travel Guide, http://goo.gl/cmpTLO. 83 “Dinner Menu,” Michael Mina 74, http://goo.gl/AU7iIi. 84 “Fontainebleau Resort Hotel,” National Park Service, http://goo.gl/XATnCG. 85 “Weekly List of Actions Taken on Properties” National Park Service, Jan 2 2009, http://goo.gl/ZX3Ys1 86 Roberts, Rob. “Victoria’s Secret brings sexy back to Fountainebleau” USA Today, Nov 16 2008, http://goo.gl/idkir8 87 Roberts, Rob. “Victoria’s Secret brings sexy back to Fountainebleau” USA Today, Nov 16 2008, http://goo.gl/idkir8 88 Luscombe, Richard. “Hotel to the stars gets billion-dollar makeover” The Guardian, Nov 21 2008, http://goo.gl/4FKMdD 89 Peterson, Eric. “Frommer’s Colorado” Wiley Publishing, 2011, http://goo.gl/Bb5u22 90 Travers, Andrew. “Hotel Jerome plans closure and remodel” Aspen Daily News, Apr 20 2012, http://goo.gl/PV1tis 91 “At-A-Glance Fact Sheet” Hotel Jerome, http://goo.gl/d5COC4 92 “At-A-Glance Fact Sheet” Hotel Jerome, http://goo.gl/d5COC4 93 Condon, Scott. “Aspen cries foul against Hotel Jerome in tax fight” The Aspen Times, Apr 13 2011, http://goo.gl/uz0cIO 94 Condon, Scott. “Aspen cries foul against Hotel Jerome in tax fight” The Aspen Times, Apr 13 2011, http://goo.gl/uz0cIO 95 “District of Columbia Historic Tax Credit Projects 2001-2013” National Trust for Historic Preservation, p. 2, http://goo.gl/O1u6Yd. 96 St. Regis, “Hotel Heritage” http://goo.gl/BkYHQa 97 St. Regis, “Hotel Heritage” http://goo.gl/BkYHQa 98 “District of Columbia Historic Tax Credit Projects 2001-2013” National Trust for Historic Preservation, p. 2, http://goo.gl/O1u6Yd. 99 “History” The Hay-Adams, http://goo.gl/rzUlKd 100 Di Meglio, Francesca. “The World’s Best Hotels: Making Luxury the Standard” Institutional Investor, Feb 2013, http://goo.gl/Ub0w7j 101 Loos, Ted. “Pheasant Season” Traditional Home, Sep 2012, http://goo.gl/w75eji 102 “Hotel Monaco DC: Celebrated in Downtown Washington, D.C.” Hotel Monaco, http://goo.gl/EKYAR3 103 “Pebblebrook buys Monaco Washington DC” Hotel News Now, Sep 10 2010, http://goo.gl/QI32gZ 104 “District of Columbia Historic Tax Credit Projects 2001-2013” National Trust for Historic Preservation, p. 2, http://goo.gl/O1u6Yd 105 “GSA and Trump Organization Reach Deal on Old Post Office Lease” GSA, Jun 5 2013, http://goo.gl/gvgpg7 106 “Project Number 29,214” National Park Service, Technical Preservation Services, http://goo.gl/xR6WNE 107 “Louisiana Historic Tax Credit Projects, 2001-2003”, National Trust for Historic Preservation, http://goo.gl/0sj0q6. 108 “Casino” Horseshoe Cleveland, http://goo.gl/pK6oK1 109 Schwartz, David. “Ohio Casinos: Monthly Revenues” UNLV Center for Gaming Research, Sep 2014, http://goo.gl/sq1J4c 110 “Why Invest In Film?” Elevating Entertainment Motion Pictures, June 26, 2013, http://goo.gl/CPr3ES. August 27, 2013. 111 Wright, Kathleen, Stewart Karlinsky, and Kim Tarantino. (2009) “Lord of the Rings Impact on Federal and State Film Industry Tax Incentives and Their Tax Treatment,”
Journal of Legal Tax Research, 7(1): 57-75. 112 Wright, Kathleen, Stewart Karlinsky, and Kim Tarantino. (2009) “Lord of the Rings Impact on Federal and State Film Industry Tax Incentives and Their Tax Treatment,”
Journal of Legal Tax Research, 7(1): 57-75. 113 “Individual Income Tax Receipts and the Individual Tax Base—February 2014 Baseline,” Tab 7: Effects of Extending Tax Provisions Scheduled to Expire Before 2024,
Congressional Budget Office, February 4, 2014, http://www.cbo.gov/publication/45065. 114 The Joint Committee on Taxation estimated the cost of the provision from 2011-2020 to be $1.3 billion. 115 The Treasury Department report on tax expenditures has an estimated cost for 2011-2017. 116 “Domestic Movie Theatrical Market Summary 1995 to 2013,” The-Numbers, 2014; http://goo.gl/JM7XxF. August 23, 2013. 117 “Domestic Movie Theatrical Market Summary 1995 to 2013,” The-Numbers, 2014; http://goo.gl/JM7XxF. August 23, 2013. 118 “Why Invest In Film?,” Elevating Entertainment Motion Pictures, June 26, 2013, http://goo.gl/CPr3ES. August 27, 2013. 119 Wright, Kathleen, Stewart Karlinsky, and Kim Tarantino. (2009) “Lord of the Rings Impact on Federal and State Film Industry Tax Incentives and Their Tax Treatment,”
Journal of Legal Tax Research, 7(1): 57-75. 120 Moore, Schuyler, “Section 181 Lives!,” The Hollywood Reporter Esq., April 10-16, 2007; http://goo.gl/KQfz3E. 121 IRS regulations state “digital video” production qualifies for the tax break, provided that production costs are subject to capitalization requirements. See “Section
181 – Deduction for Qualified Film and Television Production Costs,” Internal Revenue Bulletin, March 19, 2007; http://goo.gl/oq7MFj. 122 “Section 181 – Deduction for Qualified Film and Television Production Costs,” Internal Revenue Bulletin, March 19, 2007; http://goo.gl/ak7xoC. 123 Mujica, Alex. “TV shows reap rating benefits with bigger budgets,” Washington Square News, April 24, 2013; http://goo.gl/rkFkTE. August 27, 2013. 124 Bukszpan, Daniel. “Costly Productions: Not Just for Movies Anymore,” CNBC.com, January 15, 2013; http://goo.gl/9MNsDT. August 27, 2013. 125 Moore, Schuyler, “Section 181 Lives!,” The Hollywood Reporter Esq., April 10-16, 2007; http://goo.gl/bVh2WK. 126 Locations and eligibility determined with the Novogradac & Company LLP New Markets Tax Credit Mapping Tool, “NTC Mapping Tool -2006-2010 ACS Data,”
Novogradac & Company, 2010; http://goo.gl/5KCbvu. 127 Futterman, Matthew, Sam Schechner, and Suzanne Vranica, “NFL: The League That Runs TV,” Wall Street Journal, December 15, 2011; http://goo.gl/DIsIs0. August
23, 2013. 128 Wright, Kathleen, Stewart Karlinsky, and Kim Tarantino. (2009) “Lord of the Rings Impact on Federal and State Film Industry Tax Incentives and Their Tax Treatment,”
Journal of Legal Tax Research, 7(1): 57-75. 129 Wright, Kathleen, Stewart Karlinsky, and Kim Tarantino. (2009) “Lord of the Rings Impact on Federal and State Film Industry Tax Incentives and Their Tax Treatment,”
Journal of Legal Tax Research, 7(1): 57-75. 130 “Why Invest In Film?,” Elevating Entertainment Motion Pictures, June 26, 2013, http://goo.gl/BDtgy6. August 27, 2013. 131 Sherlock, Molly. “The Section 199 Production Activities Deduction: Background and Analysis,” Congressional Research Service, February 27, 2012; http://goo.gl/
MbfNzY 132 “SOI Tax Stats -0 133 Moore, Schuyler. “5 Ways Hollywood Can Cut Its Taxes (Guest Column),” The Hollywood Reporter, May 10, 2013; http://goo.gl/pd5UqP 134 U.S. Senate Roll Call Votes 111th Congress - 1st Session, Vote on S.Amdt. 109 to S.Amdt. 98 to H.R. 1 (American Recovery and Reinvestment Act of 2009), February 3,
2009, http://goo.gl/fdOdHB

DRAFT
56 | Tax Decoder
135 “Estimates of Federal Tax Expenditures for Fiscal Years 2014-2018,” Joint Committee on Taxation, August 5, 2014, http://goo.gl/LZqKhp, (p. 28-29) 136 “Tax Expenditures Compendium of Background Material on Individual Provisions,” Committee on the Budget United States Senate, prepared by the Congressional
Research Service, December 2012 137 “Estimates of Federal Tax Expenditures for Fiscal Years 2014-2018,” Joint Committee on Taxation, August 5, 2014, http://goo.gl/LZqKhp, (p. 28-29) 138 Handy, Nelson James. “The All Events Test Proves Taxing to Magazine Publishers,” 9 Loy. L.A. Ent. L. Rev. 173 (1989). Available at http://digitalcommons.lmu.edu/elr/
vol9/iss1/10. 139 “The President’s Tax Proposals to the Congress for Fairness, Growth, and Simplicity,” May 1985, p. 318-319. Available at http://goo.gl/KGdkVZ, accessed January 17,
2014. 140 “The President’s Tax Proposals to the Congress for Fairness, Growth, and Simplicity,” May 1985, p. 318-319. Available at http://goo.gl/KGdkVZ, accessed January 17,
2014. 141 Williams, Stockton, “The New Markets Tax Credit: A Promising New Tool for Community Revitalization,” Federal Reserve Bank of San Francisco, April 2001, http://
goo.gl/dRehbN. 142 US Department of Treasury, CDFI Fund, New Markets Tax Credit Program, accessed August 6, 2014, http://goo.gl/td81Eh. 143 Donald J. Marples and Sean Lowry, New Markets Tax Credit: An Introduction, CRS Report RL34402 (Washington, DC: Library of Congress, Congressional Research
Service, January, 10, 2013). 144 Donald J. Marples and Sean Lowry, New Markets Tax Credit: An Introduction, CRS Report RL34402 (Washington, DC: Library of Congress, Congressional Research
Service, January, 10, 2013). 145 (GAO-14-500), New Markets Tax Credit: Better Controls and Data Are Needed to Ensure Effectiveness,” Government Accountability Office, August 2014, http://goo.
gl/B7o76p. 146 The US Treasury Department releases the names of NMTC CDEs, as well as the projects that receive leveraged funds. However, the Department does not provide
the names of the private companies or individuals who receive the tax credits from the federal government and then provide the low-interest financing. However, many of these companies publically release data about their involvement in the program and many create separate legal entities that can be CDEs. In those cases, the banks are then the NMTC allocator, tax credit recipient, and the lender. For Goldman Sachs examples, see: http://goo.gl/MExSZ6, for Citibank, see: http://goo.gl/RwA2dQ.
147 US Department of Treasury, CDFI Fund, Spreadsheet of NMTC Awards through 2009, http://goo.gl/RxdHBE, accessed December 8, 2013. 148 NMTC Public Release: FY2003-FY2012, Public Data File, http://goo.gl/xtVs6J. 149 LMSB-04-0510-016, New Markets Tax Credit, Internal Revenue Service, May 2010, http://goo.gl/A972jY. 150 FY 2009 NMTC Data, CDFI Fund. http://goo.gl/9K8kpy. 151 “Eastside V-Target East Liberty,” LISC New Markets, http://goo.gl/Suqrai. 152 Zen Cha Tea Salon, Finance Fund, http://goo.gl/znYnbv. 153 FY 2009 NMTC Data, CDFI Fund. http://goo.gl/J8fzuM. 154 John Flinn, “DESTINATION HAWAII; Lanai for the rest of us; The affordable side of Hawaii’s most exclusive island,” The San Francisco Chronicle, page T1, August
26, 2001. 155 Ilima Loomis, “Lanai hit hard by economic downturn,” Maui News, February 1, 2010; http://goo.gl/XBf6bo. 156 Keoki Kerr, “Lanai is booming under Ellison; may double in population,” Hawaii News Now, February 11, 2014; http://goo.gl/P1c2tD. 157 Julian Guthrie, “Larry Ellison’s Fantasy Island,” Wall Street Journal, June 13, 2013; http://goo.gl/3cBC4Z. 158 Julian Guthrie, “Larry Ellison’s Fantasy Island,” Wall Street Journal, June 13, 2013; http://goo.gl/3cBC4Z. 159 Keoki Kerr, “Lanai is booming under Ellison; may double in population,” Hawaii News Now, February 11, 2014; http://goo.gl/7qRDgo. 160 “Business briefs,” Honolulu Star-Advertiser, July 17, 2012. 161 “The World’s Billionaires,” Forbes, updated August 6, 2014; http://goo.gl/IGvVYD. 162 Julian Guthrie, “Larry Ellison’s Fantasy Island,” Wall Street Journal, June 13, 2013; http://goo.gl/3cBC4Z530. 163 “Oracle CEO Larry Ellison now owns every hotel room on Lanai,” Associated Press, August 2, 2014; http://goo.gl/rfCIHt. 164 Julian Guthrie, “Larry Ellison’s Fantasy Island,” Wall Street Journal, June 13, 2013; http://goo.gl/3cBC4Z. 165 Adam Nagourney, “Tiny Hawaiian Island Will See if New Owner Tilts at Windmills,” New York Times, August 22, 2012; http://goo.gl/vt6Dv0. 166 Julian Guthrie, “Larry Ellison’s Fantasy Island,” Wall Street Journal, June 13, 2013; http://goo.gl/3cBC4Z. 167 Julian Guthrie, “Larry Ellison’s Fantasy Island,” Wall Street Journal, June 13, 2013; http://goo.gl/3cBC4Z. 168 “New Markets Tax Credit Program,” U.S. Department of Treasury Community Development Financial Institutions Fund website, accessed August 6, 2014; http://
goo.gl/IKRNOH. 169 “Director: $8 million Lanai health center could open in 2016,” Associated Press, July 24, 2014; http://goo.gl/cRuDdz. 170 “Director: $8 million Lanai health center could open in 2016,” Associated Press, July 24, 2014; http://goo.gl/cRuDdz. 171 Chris Sugidono, “Health facility planned for the heart of Lanai,” The Maui News, May 19, 2013; http://goo.gl/oVFWVM. 172 Chris Sugidono, “Health facility planned for the heart of Lanai,” The Maui News, May 19, 2013; http://goo.gl/oVFWVM. 173 “Director: $8 million Lanai health center could open in 2016,” Associated Press, July 24, 2014; http://goo.gl/cRuDdz. 174 “Director: $8 million Lanai health center could open in 2016,” Associated Press, July 24, 2014; http://goo.gl/cRuDdz. 175 Jenna Blakely, “Lanai Community Health Center seeks to raise $2M from community for new facility,” Pacific Business News, May 8, 2013; http://goo.gl/EgKfwX. 176 Novogradac & Company, About the Firm, Accessed August 6, 2014, http://goo.gl/HM7gxu. 177 Tweet, May 19, 2013, http://goo.gl/OsTcGX. 178 Chris Sugidono, “Health facility planned for the heart of Lanai,” The Maui News, May 19, 2013; http://goo.gl/oVFWVM. 179 “Director: $8 million Lanai health center could open in 2016,” Associated Press, July 24, 2014; http://goo.gl/cRuDdz. 180 Hill, Jennifer, “Waves of NMTC Funding Shore up Aquarium,” Novogradac Journal of Tax Credits, June 2011, Volume II, Issue VI, http://goo.gl/7BLU0t. 181 “Georgia Aquarium Receives $40M in New Markets Tax Credit Funding,” CityBizList, January 30, 2011, http://goo.gl/BlSIag. 182 AT&T Dolphin Tales, Georgia Aquarium, http://goo.gl/6VeFg9. 183 Hill, Jennifer, “Waves of NMTC Funding Shore up Aquarium,” Novogradac Journal of Tax Credits, June 2011, Volume II, Issue VI, http://goo.gl/7BLU0t. 184 AT&T Dolphin Tales, Georgia Aquarium, http://goo.gl/6VeFg9. 185 Whiting, Candace Calloway, “The Georgia Aquarium Bilked Taxpayers into Financing a Dolphin Exhibit by Using a Program Designed to Help Struggling Families,”
Seattle PI, October 17, 2012, http://goo.gl/hzDaIF. 186 Hill, Jennifer, “Waves of NMTC Funding Shore up Aquarium,” Novogradac Journal of Tax Credits, June 2011, Volume II, Issue VI, http://goo.gl/7BLU0t. 187 “Total Ticket,” Georgia Aquarium website accessed August 4, 2014; http://goo.gl/smC3u4. 188 “NEW Dolphin Encounter and Experience Program,” Georgia Aquarium website, accessed August 5, 2014; http://goo.gl/2rqLKE. 189 Whiting, Candace Calloway, “The Georgia Aquarium Bilked Taxpayers into Financing a Dolphin Exhibit by Using a Program Designed to Help Struggling Families,”
Seattle PI, October 17, 2012, http://goo.gl/hzDaIF. 190 Hill, Jennifer, “Waves of NMTC Funding Shore up Aquarium,” Novogradac Journal of Tax Credits, June 2011, Volume II, Issue VI, http://goo.gl/7BLU0t. 191 Hill, Jennifer, “Waves of NMTC Funding Shore up Aquarium,” Novogradac Journal of Tax Credits, June 2011, Volume II, Issue VI, http://goo.gl/7BLU0t 192 Lisa R. Schoolcraft, “AT&T to sponsor Aquarium’s dolphin exhibit,” Atlanta Business Chronicle, January 14, 2011; http://goo.gl/hdVpau. 193 Georgia Aquarium—Atlanta, Georgia,” Capital Peak Partners, LLC, http://goo.gl/r7cLpG. 194 Georgia Aquarium—Atlanta, Georgia,” Capital Peak Partners, LLC, http://goo.gl/r7cLpG. 195 “Reznick Group helps expand Georgia Aquarium through tax credit expertise,” Central Atlanta Progress April 14, 2011, http://goo.gl/Dl4WJ3. 196 Nyczepir, Dave, “Desert Hot Springs artist’s sculptures reflect aspirations,” The Desert Sun, July 24, 2014, http://goo.gl/g4MpjC. 197 Nyczepir, Dave, “Desert Hot Springs artist’s sculptures reflect aspirations,” The Desert Sun, July 24, 2014, http://goo.gl/g4MpjC. 198 Nyczepir, Dave, “Desert Hot Springs artist’s sculptures reflect aspirations,” The Desert Sun, July 24, 2014, http://goo.gl/g4MpjC. 199 Nyczepir, Dave, “Desert Hot Springs artist’s sculptures reflect aspirations,” The Desert Sun, July 24, 2014, http://goo.gl/g4MpjC.

56 | Tax Decoder Economic and Community Development | 57
200 Nyczepir, Dave, “Desert Hot Springs artist’s sculptures reflect aspirations,” The Desert Sun, July 24, 2014, http://goo.gl/g4MpjC. 201 “Desert Hot Springs Art Dedication Ceremony, July 17,” Ron’s Log, July 10, 2014; http://goo.gl/av7tmW. 202 “Registered Nurse: Salary,” U.S. News & World Report website, accessed August 5, 2014; http://goo.gl/XF38kA. 203 “The NMTC Blender – Utilizing the New Market Tax Credit Program to Fund Infrastructure Projects,” Growth and Infrastructure Consortium, October 3, 2013; http://
goo.gl/gbJ55q. 204 Felci, Erica, “State panel offers Desert Hot Springs police solutions,” The Desert Sun, July 29, 2014, http://goo.gl/Olvnxi. 205 Felci, Erica, “State panel offers Desert Hot Springs police solutions,” The Desert Sun, July 29, 2014, http://goo.gl/Olvnxi. 206 “Factfinding Panel’s Findings, Conclusion, and Recommendations in the Matter of the Impasse Between City of Desert Hot Springs and Desert Hot Springs Police
Officers Association,” PERB Case No. LA-IM-153-M, July 2014; http://goo.gl/Iocwd2. 207 “Factfinding Panel’s Findings, Conclusion, and Recommendations in the Matter of the Impasse Between City of Desert Hot Springs and Desert Hot Springs Police
Officers Association,” PERB Case No. LA-IM-153-M, July 2014; http://goo.gl/Iocwd2. 208 “A tour of the almost finished ‘DHS Health & Wellness Center’ Desert Local News, http://goo.gl/0NXPNS. 209 “Factfinding Panel’s Findings, Conclusion, and Recommendations in the Matter of the Impasse Between City of Desert Hot Springs and Desert Hot Springs Police
Officers Association,” PERB Case No. LA-IM-153-M, July 2014; http://goo.gl/Iocwd2. 210 Felci, Erica, “State panel offers Desert Hot Springs police solutions,” The Desert Sun, July 29, 2014, http://goo.gl/Olvnxi. 211 GAO Report: GAO-07-296, “New Markets Tax Credit Appears to Increase Investment by Investors in Low-Income Communities, but Opportunities Exist to Better
Monitor Compliance,” Government Accountability Office, January 2007, http://goo.gl/QHEDzl. 212 Portfolio Highlights: New Markets Tax Credit, U.S. Bank, http://goo.gl/5FlL2l. 213 Portfolio Highlights: New Markets Tax Credit, U.S. Bank, http://goo.gl/5FlL2l. 214 “Our Team: New Markets Tax Credits,” US Bank, http://goo.gl/XiVnAS. 215 “New Markets Tax Credit (NMTC) Investments,” Chase, http://goo.gl/nX50mY. 216 (GAO-14-500), New Markets Tax Credit: Better Controls and Data Are Needed to Ensure Effectiveness,” Government Accountability Office, August 2014, http://goo.
gl/d6UVfF. 217 (GAO-14-500), New Markets Tax Credit: Better Controls and Data Are Needed to Ensure Effectiveness,” Government Accountability Office, August 2014, http://goo.
gl/d6UVfF. 218 (GAO-14-500), New Markets Tax Credit: Better Controls and Data Are Needed to Ensure Effectiveness,” Government Accountability Office, August 2014, http://goo.
gl/d6UVfF. 219 “Charlie Werhane: Twinning Historic Tax Credits and New Markets Tax Credits,” National Historic Tax Credit Conference 2007, http://goo.gl/Nzc92b. 220 (GAO-14-500), New Markets Tax Credit: Better Controls and Data Are Needed to Ensure Effectiveness,” Government Accountability Office, August 2014, http://goo.
gl/d6UVfF. 221 (GAO-14-500), New Markets Tax Credit: Better Controls and Data Are Needed to Ensure Effectiveness,” Government Accountability Office, August 2014, http://goo.
gl/d6UVfF. 222 (GAO-14-500), New Markets Tax Credit: Better Controls and Data Are Needed to Ensure Effectiveness,” Government Accountability Office, August 2014, http://goo.
gl/d6UVfF. 223 Dockery, Jennifer, “Solar Installation Provides Free Power to Tenants,” Novogradac Journal of Tax Credits, March 2010, http://goo.gl/X2ZZdQ. 224 “Investing in Solar Energy Using the Public Welfare Investment Authority,” US Department of the Treasury, Comproller of the Currency Administrator of National
Banks, July 2011, http://goo.gl/VbKEQw. 225 “Investing in Solar Energy Using the Public Welfare Investment Authority,” US Department of the Treasury, Comproller of the Currency Administrator of National
Banks, July 2011, http://goo.gl/VbKEQw. 226 (GAO-14-500), New Markets Tax Credit: Better Controls and Data Are Needed to Ensure Effectiveness,” Government Accountability Office, August 2014, http://goo.
gl/d6UVfF. 227 “Investing in Solar Energy Using the Public Welfare Investment Authority,” US Department of the Treasury, Comproller of the Currency Administrator of National
Banks, July 2011, http://goo.gl/VbKEQw. 228 “Investing in Solar Energy Using the Public Welfare Investment Authority,” US Department of the Treasury, Comproller of the Currency Administrator of National
Banks, July 2011, http://goo.gl/VbKEQw. 229 Townsend, Anne, “NMTCs, HTCs Work to Resurrect North St. Louis Neighborhood,” Novogradac New Markets Tax Credit Report, April 2008, Volume VII, Issue IV,
http://goo.gl/29GF4E. 230 Townsend, Anne, “NMTCs, HTCs Work to Resurrect North St. Louis Neighborhood,” Novogradac New Markets Tax Credit Report, April 2008, Volume VII, Issue IV,
http://goo.gl/29GF4E. 231 “Crown Square,” Enterprise Community Partners, http://goo.gl/92IiWL. 232 O’Leary, Madeline, “Old North pushing for vitality in Crown Square,” St. Louis Post-Dispatch, June 8, 2012, http://goo.gl/pQH22k. 233 O’Leary, Madeline, “Old North pushing for vitality in Crown Square,” St. Louis Post-Dispatch, June 8, 2012, http://goo.gl/pQH22k 234 O’Leary, Madeline, “Old North pushing for vitality in Crown Square,” St. Louis Post-Dispatch, June 8, 2012, http://goo.gl/pQH22k 235 GAO Report: GAO-12-262, “Community Development: Limited Information on the Use and Effectiveness of Tax Expenditures Could Be Mitigated through
Congressional Attention,” Government Accountability Office, February 2012, http://goo.gl/Sv0wCb. 236 GAO Report: GAO-12-262, “Community Development: Limited Information on the Use and Effectiveness of Tax Expenditures Could Be Mitigated through
Congressional Attention,” Government Accountability Office, February 2012, http://goo.gl/Sv0wCb. 237 GAO Report: GAO-11-318SP, “Opportunities to Reduce Potential Duplication in Government Programs, Save Tax Dollars, and Enhance Revenue,” Government
Accountability Office, March 2011, http://goo.gl/Rss0ZF 238 GAO Report: GAO-11-318SP, “Opportunities to Reduce Potential Duplication in Government Programs, Save Tax Dollars, and Enhance Revenue,” Government
Accountability Office, March 2011, http://goo.gl/Rss0ZF 239 Marples, Donald, “New Markets Tax Credit: An Introduction,” Congressional Research Service, January 10, 2013, http://goo.gl/N2obk2 240 (GAO-14-500), New Markets Tax Credit: Better Controls and Data Are Needed to Ensure Effectiveness,” Government Accountability Office, August 2014, http://goo.
gl/5iHdo6 241 (GAO-14-500), New Markets Tax Credit: Better Controls and Data Are Needed to Ensure Effectiveness,” Government Accountability Office, August 2014, http://goo.
gl/5iHdo6 242 Joint Committee on Taxation, “Estimates of Federal Tax Expenditures for Fiscal Years 2014-2018,” August 5, 2014, JCX-97-14, page 28; http://goo.gl/Au28Z6 243 “Tab 7: Effects of Extending Tax Provisions Scheduled to Expire Before 2024,” Individual Income Tax Receipts and the Individual Tax Base - February 2014 Baseline,
Congressional Budget Office, February 4 2014, http://goo.gl/qAk09p. 244 Miller, Kevin, “Wind power, low-income development programs face ax,” Portland Press Herald, November 25, 2012, http://goo.gl/cRvwJ7.

DRAFT
58 | Tax Decoder
EDUCATION

58 | Tax Decoder Education | 59
Education
High-quality education is important for both individual success in the job market and the nation’s competitiveness in the global economy. Per-pupil education spending in the United States is higher than in any other developed nation.1 However, U.S. educational outcomes remain lackluster and have seen little improvement over the decades despite
increased spending. The United States ranked 11th on its combined reading, math, and science test scores, and 20th in literacy and graduation rate in the 2014 Pearson report on educational outcomes in 40 nations.2
the spending programs, they come at significant expense to federal taxpayers, but their benefits are uncertain. The education tax expenditures described in this section cost more than $29 billion a year, but there is little to no evidence they have any significant effect on educational outcomes. Moreover, the most expensive education tax break, the American Opportunity Tax Credit, is losing billions every year to fraudulent and erroneous claims.
Like many other provisions in the code, tax benefits for higher education disproportionally benefit higher-income households that have a greater tax liability, and they are only available many months after the education expense has been incurred.
Further, many students fail to claim education benefits that could benefit them. In 2009, 14 percent (1.5 million) of “eligible students failed to take a credit or deduction that would have provided them with a $466 benefit on average.” Additionally, due to the complexity and overlap of education tax benefits,
about 237,000 eligible students failed to utilize the specific education benefit that would have been the most beneficial for his or her circumstances. The optimal benefit would have provided each student with
Although higher spending per student has not resulted in higher educational outcomes, all too often policymakers still talk first about dollars and cents when it comes to education. At the federal level, education spending has risen steeply in recent decades. The Department of Education’s discretionary budget has skyrocketed, from $11.7 billion in 19803 to over $67 billion in 2014,4 a nearly two-fold increase in inflation-adjusted dollars.5 The agency spent roughly $23 billion on Pell grants,6 and administered numerous student loan assistance programs.7
Dozens of education-related federal programs have taken root throughout the federal bureaucracy, many of which are duplicative and overlapping. The Government Accountability Office (GAO) identified 21 different programs in four different federal agencies that assist with paying for higher education.8 Meanwhile, 82 federal programs across 10 agencies are focused on improving teacher quality,9 15 programs at 13 federal agencies are focused on improving financial literacy,10 45 programs assist with early learning and child care,11 and an astonishing 209 programs at 13 federal agencies are focused on Science, Technology, Engineering, and Mathematics (STEM) education.12
On top of these spending programs, the IRS administers several tax programs aimed at supporting education. Like
Education (in millions) FY 2014 FY 2014 - FY 2018American Opportunity Tax Credit
$23,000 $110,000HOPE Tax Credit
Lifetime Learning Credit
Deduction for Higher Education Expenses $71 $1,300
Student Loan Interest Deduction $1,700 $9,400
Section 529 Qualified Tuition Plans $700 $5,900
Coverdell Educational Savings Accounts $100 $600
Exclusion of Interest of Education Savings Bonds $50 $300
Exclusion of Scholarship and Fellowship Income $2,600 $14,400
Exclusion of Employer-Provided Tuition Reduction $300 $1,500
Exclusion of Employer-Provided Education Assistance $1,200 $6,000
Occupation Related Loan Forgiveness $200 $1,000
Deduction for Classroom Expenses $40 $883
Tax Credits for Holders of Qualified Zone Academy Bonds $300 $1,300
Total $29,961 $151,283

DRAFT
60 | Tax Decoder
Indeed, a 1965 article in the New York Times summarized the views of then-Treasury Secretary Stanley Surrey as follows:
[A] tax credit for higher education ‘would not result in even a single additional student going to college.’ The $1 billion or so that the Treasury would lose in revenue by providing a credit of several hundred dollars annually to the parents of college students can be put to better use in the form of direct financial assistance to young people who would not otherwise get to college at all.15
Although considered at various times over the next few decades, tuition credits were not actually implemented until the late 1990s. In 1996, President Clinton made the creation of an education tax credit, dubbed the “America’s Hope Scholarship,” a component of his reelection campaign.16 In a
commencement address at Princeton University, President Clinton argued that such a credit would “complete our college strategy, and make two years of college as universal as four years of high school.”17 In his proposal, the credit, which was to require students to maintain a “B” average in high school to qualify, would “pay the cost of two years of tuition at the average community college.”18
Ultimately, the Hope Scholarship Credit and Lifetime Learning Credit were enacted as part of the Taxpayer Relief Act of 1997.19 Originally, the Hope credit was available for the first two years of college, was capped at $1,500 per student per year (adjusted for inflation), and was not refundable (meaning an individual could not receive more from the credit than he owed in taxes).
The Hope tax credit remained until 2009 when President
Source: Congressional Research Service24
The American Opportunity Tax Credit/Hope Scholarship Credit and the Lifetime Learning Credit
The concept of postsecondary tuition tax credits originated in the 1960s when Congress considered ways to provide federal financial support for higher education.14 At the time, however, President Johnson’s Administration opposed tuition tax credits, believing they would prove ineffective at increasing college attendance while at the same time reducing revenues for financial aid programs.
Overview of Education Tax Benefits, 2014
a $284 additional benefit on average.13
Congress should unwind federal intervention in the education system currently being conducted through the tax code, allowing other entities better qualified to serve students
to focus on furthering education. Instead of attempting to steer educational decisions through tax preferences, the best thing Congress can do to serve the next generation is to create a fairer, flatter tax system for all Americans.

60 | Tax Decoder Education | 61
Obama signed into law the American Recovery and Reinvestment Act (ARRA), which included a provision that replaced the Hope Credit with an expanded and increased tuition credit called the American Opportunity Tax Credit (AOTC).20 The AOTC equals 100 percent of the first $2,000 in eligible postsecondary expenses and 25 percent of the next $2,000, up to a maximum of $2,500 per student.
In addition, the AOTC has higher income limits than the Hope Credit, allowing more students access to the financial aid, and can be redeemed for four years instead of two.21 Furthermore, the credit is partially refundable, which allows individuals with zero tax liability to receive up to $1,000 per student.
Under ARRA, the AOTC applied only to tax years 2009 and 2010. However, the credit was extended for two years by the Tax Relief and Job Creation Act of 2010, and an additional five years (through December 2017) by the American Taxpayer Relief Act of 2012.22
The Lifetime Learning Credit, created in 1997, with the Hope Scholarship Credit, is a $2,000 nonrefundable credit that can be claimed for undergraduate and graduate courses, as well as non-degree “courses to acquire or improve job skills.” Students need not be enrolled at least half-time in a degree program. Unlike the AOTC, which can be claimed for the same student for no more than four tax years, there is no limit on the number of times the Lifetime Learning Credit can be claimed.23
The chart on page 60 outlines the provisions of each of the higher education tax credits.
Cost & Current Status
“The enactment of the AOTC has resulted in a substantial increase in the amount of education credits claimed by taxpayers,” according to the Congressional Research Service.25
In 2005, the Hope Credit reduced tax revenue by $3.5 billion.26
In 2011, the expanded AOTC reduced tax revenue by $15.8 billion.27 However, because the AOTC is partially refundable, unlike the Hope Credit, it paid out an additional $6.6 billion to Americans with little or no tax liability.28 In total, the AOTC cost $22.4 billion in 2011.29
Two changes have most contributed to the increased cost of the AOTC relative to the Hope Credit. First, the AOTC’s partial refundability allows individuals with little to no tax liability to qualify for a refund. As a result, the cost of the credit was increased by 42 percent in 2012 (compared to a non-refundable AOTC).
Second, the AOTC’s higher income limits have resulted in a significant portion of the credit’s total value going to upper-income individuals. For instance, while less than 5 percent of 2008 Hope Credits went to individuals with incomes above $100,000, roughly 20 percent of AOTC refunds in 2009 went to such high-income individuals.30
The cost of the Lifetime Learning Credit has also risen in recent years. According to the Congressional Research Service, the cost of the Lifetime Learning Credit grew from $1.9 billion in 2011 to $2.8 billion in 2013, a 47 percent increase.31 The Office of Management and Budget estimates the Lifetime Learning Credit will cost $1.68 billion in FY 2014
Source: Congressional Research Service
Share of the AOTC (2009) and Hope Credit (2008), by Income
DRAFT
62 | Tax Decoder
and $8.76 billion from FY 2014 through FY 2018.32 Together, these higher education tax credits cost
taxpayers $23 billion in FY2014, and will cost $110 billion from FY 2014 through 2018.33
Evaluating Higher Education Tax Credits
The primary purpose of both the Hope Scholarship Credit and the AOTC is to boost college attendance by partially offsetting the cost of postsecondary degrees. However, studies on whether these incentives have increased attendance are mixed.34 An analysis by the nonpartisan Congressional Budget Office (CBO) found “tax credits are unlikely to cause substantial increases in college enrollment.”35 The CBO analysis also questioned the findings of two studies that predicted up to a 4 percent increase in enrollment after enactment of the Hope Credit, noting that those projections were based on how current students react to price increases, not how nonstudents react to price reductions.36
A later study conducted by the National Bureau of Economic Research (NBER) and highlighted by CRS found “the Hope and Lifetime Learning Credits had no impact on college enrollment, although there were possible limitations with the analysis.”37 Specifically, the NBER study found,
No evidence that the [Hope Tax Credit (HTC) and Lifetime Learning Tax Credit (LLTC)] affected attendance behavior. Using a large sample of individuals from 1990 to 2000, the analysis did not find increased postsecondary enrollment among credit-
eligible students after the introduction of the HTC and LLTC. Additionally, the models tested whether college students increased their investments in higher education by being more likely to choose a four-year rather than a two-year institution or attend full-time rather than part-time. Again, there was no discernible effect on the behavior of students affected by the tax credits. Therefore, although the stated goal of the tax credits was to increase access to higher education, they do not appear to have encouraged additional postsecondary enrollment.38
According to a report by the Congressional Research Service on the AOTC/Hope Credit and the Lifetime Learning Credit,
Although [students’ educational] investment decision is unaffected by the credits, these students can claim them (i.e., reap a “windfall gain”) but federal taxpayers get no offsetting social benefits in the form of an increased quantity of investment.39
In other words, the credits do not affect potential students’ decisions regarding whether or not to invest in education. Thus, taxpayers bear the cost of these credits but do not gain the intended benefit (increased enrollment).
Further, a 2011 report by the Treasury Inspector General for Tax Administration (TIGTA) found “the IRS does not have effective processes to identify taxpayers who claim erroneous education credits.” Specifically, the report found that the IRS did not properly corroborate AOTC claims with 1098-T forms (tuition statements) submitted to the IRS by universities.
As a result, the audit found 2.1 million individuals received a total of $3.2 billion in education credits that appeared to be erroneous. That is, of the $16.3 billion in AOTC claims paid in 2009, nearly a fifth of this amount went to individuals whose incomes could not be verified. According to the report, “Over 4 years, erroneous education credits could potentially reach $12.8 billion.”40
With regard to the scale of potentially erroneous payments, the report stated,
Not only is the loss of revenue due to erroneous education credits higher because of the increase in the amount of the credit, but also many of these claims result in additional costs to the Government now that up to $1,000 of the credit is refundable.41
IN 2011, THE EXPANDED AOTC REDUCED TAX REVENUE BY $15.8 BILLION. HOWEVER, BECAUSE THE AOTC IS PARTIALLY REFUNDABLE, UNLIKE THE HOPE CREDIT, IT PAID OUT AN ADDITIONAL $6.6 BILLION TO AMERICANS WITH LITTLE OR NO TAX LIABILITY. IN TOTAL, THE AOTC COST $22.4 BILLION IN 2011.
WHILE LESS THAN 5 PERCENT OF 2008 HOPE CREDITS WENT TO INDIVIDUALS WITH INCOMES ABOVE $100,000,
ROUGHLY 20 PERCENT OF AOTC REFUNDS IN 2009 WENT TO THESE HIGH-INCOME INDIVIDUALS.

62 | Tax Decoder Education | 63
Student Loan Interest Deduction loan interest deduction through 2012.48 P.L. 112-240, the “fiscal cliff” bill, made these provisions permanent.
The interest deduction is expected to cost $1.7 billion in FY 2014 and $9.4 billion from FY 2014 through FY 2018.49
Evaluating the Student Loan Interest Deduction
The deduction for student loan interest was intended to boost college enrollment by making higher education more affordable. Yet, according to CRS, “[w]hether the deduction will affect enrollment decisions is unknown; it might only change the way families finance college costs.” Further, “[i]t is unlikely to reduce loan defaults, which generally are related to low income and unemployment.”50
History and General Background
A special deduction for student loan interest, allowing indi-viduals to deduct from their taxable income the amount spent on student loan interest payments, was first added to the tax code in 1954, but was repealed by the Tax Reform Act of 1986.45
For the following decade, no deduction for student loan inter-est existed. However, the Taxpayer Relief Act of 1997, which also created the Hope Scholarship Credit and the Lifetime Learning Credit (discussed above), created a new deduction for student loan interest. According to the Congressional Re-search Service (CRS), these measures were designed to “make postsecondary education more affordable for middle-income families who are unlikely to qualify for much need-based fed-eral student aid.”46 Specifically, the deduction for student loan interest was intended to help taxpayers repay student loans.
The deduction applies only to interest paid on “qualified education loans,” or loans which were used solely to pay for qualified educational expenses of the taxpayer, spouse, or dependent, at a qualified institution of higher education.47 The deduction is limited to $2,500 annually and is an ‘above-the-line deduction,’ meaning it is not restricted to taxpayers who itemize.
Since 1997, the deduction has been expanded to cover more student loans and higher-income taxpayers. Originally, the deduction applied only to interest payments made during the first five years in which interest payments were required. This was temporarily repealed by the Economic Growth and Tax Relief Reconciliation Act of 2001 (EGTRRA) and later extended.
EGTRRA also raised the income phase-out range, allowing taxpayers with higher incomes to take advantage of the deduction. For 2014, the phase-out range for joint filers is between $130,000 and $160,000 and between $65,000 and $80,000 for individual filers.
Although these provisions were set to expire in 2010, the Tax Relief, Unemployment Insurance Reauthorization, and Job Creation Act of 2010 extended modifications to the student
Student Loan Interest Deduction Distribution by Income
Source: Congressional Research Service
In fact, despite only 31 percent of AOTC payments in 2009 being in the form of refundable credits, TIGTA found half ($1.6 billion) of the $3.2 billion in erroneous claims were via refundable credits.
Deduction for Higher Education Expenses
Taxpayers who do not qualify for the AOTC or Lifetime Learning Credits may still be able to claim up to a $4,000 tax deduction for higher education expenses.42
Individuals with an adjusted gross income up to $65,000 ($130,000 for joint filers) can claim the maximum deduction of $4,000 and individuals with an adjusted gross income of
$80,000 or less ($160,000 for joint filers) can claim up to a $2,000 deduction.43
The deduction expired in 2013, but is included in the EXPIRE Act, which would extend several temporary provisions of the tax code. The EXPIRE Act would extend the deduction for higher education expenses through the end of 2015. Assuming continued extension of this provision, the cost is estimated to be $71 million in FY 2014 and $1.3 billion from FY 2014 through FY 2018.44
Congress should unwind the tuition tax credits and deductions including AOTC, Lifetime Learning Credit, Hope Scholarship, and the deduction for higher education expenses. Instead, Congress should allow students and families to keep more of their own money to pay for higher education by lowering overall tax rates.

DRAFT
64 | Tax Decoder
College Savings Plans and Education Savings Bonds The tax code also includes several provisions to help families save for higher education. These tax provisions include
Qualified Tuition Programs, often called 529 plans, Coverdell Educational Savings Accounts (previously called education IRAs), and Education Savings Bonds.
Coverdell and 529 savings plans are both tax-advantaged investment accounts that can be used to pay for qualified education expenses. As long as the money from the account is used to pay for qualified education expenses, distributions (withdrawals) from the account are tax-free. Similarly, for education savings bonds, the interest income is not taxed.
In addition, it is not clear that the student loan interest deduction is particularly well targeted. Half of all households in the United States earned below $51,017 in 2012. Yet, only 20.8 percent of tax filers who claimed the student loan interest deduction had incomes below $50,000. This means nearly 3 of every 5 deductions went to people who earned above the median household income. In fact, according to CRS, “More than three-fourths of the tax reduction [by dollar amount] that results from this deduction benefits tax filing units with adjusted gross incomes between $50,000 and $200,000.”51 In a hearing held by the Senate Committee on Finance, Scott Hodge, President of the Tax Foundation stated, “While the interest deduction for student loans may give them some relief, the benefits of that deduction accrue largely to upper-middle class households.”52
Furthermore, higher education tax credits, including the student loan interest deduction, may actually be fueling the explosion in student loan debt. In a report released three years after the reinstatement of the student loan interest deduction, the Congressional Budget Office stated,
The deductibility of interest paid on student loans lowers the cost of borrowing to pay for college and should thus lead students to rely on loans even more than they do already. To the extent that students choose to substitute college loans for savings in financing their education, the deductibility of interest will reduce saving.53
This increased reliance on debt, in and of itself, would not have posed such a massive problem had tuition rates stayed the same. Yet, the subsidization of higher education has caused colleges and universities to do what any subsidized industry does: raise prices to capture more of the subsidy. Indeed, Scott Hodge of the Tax Foundation noted in his testimony before the Senate Finance Committee that
[s]ubsidized student loans and education credits are similarly fueling higher college costs by disconnecting student-consumers from the true cost of higher education. In turn, the benefits of these programs get capitalized into tuition costs because universities can boost tuitions without suffering the normal market backlash.54
Congress should eliminate the misguided tax deduction for student loan interest payments.
Generally, a parent contributes to the account on behalf of a beneficiary, such as a child. Differing restrictions may apply to each type of account, but they receive many of the same tax advantages. Individuals and families can benefit from more than one type of education savings account at a time. Contributions are made to the account with after-tax dollars, but the interest grows tax-free.
The chart on page 65 details the similarities and differences between 529 plans, Coverdell accounts, and Education savings bonds.
Section 529 Qualified Tuition Programs
There are two types of 529s—prepaid tuition programs and savings account programs. The prepaid tuition programs allow a contributor to make
lump-sum or periodic payments that entitle the beneficiary to a specified number of academic periods, course units, or a percentage of tuition costs at current
prices. Essentially, the contributor is paying for and purchasing a given amount of education today which will be used by the student in the future.55
Another type of Section 529 qualified tuition program is the 529 savings plan, which allows contributors to invest in an account. The interest earned on the account is not taxable if spent on qualified education expenses. Money contributed to a 529 savings account is invested in a mutual fund or other investment tool offered by the state. 529 savings plans are generally more popular than prepaid 529 plans.
In 2011, $164.9 billion was held in 529 plans, 87.9 percent ($144.9 billion) of which was held in savings plans, while 12.1 percent ($20.0 billion) was held in prepaid plans.56 In 2013,
the amount invested in 529 plans reached a new record of $227.1 billion in 2013. With half a million accounts opened in 2013 alone, the number of 529 plan accounts outstanding hit 11.6 million, meaning that the average 529 balance rose to a record $19,584.57
Section 529 plans are popular because they allow families

64 | Tax Decoder Education | 65
529 Plans Coverdell Education Savings Bond
Tax Treatment
Disbursements for qualified education expenses are tax-
free, and interest income is also tax-free
Disbursements for qualified education expenses are tax-free, and
interest income is also tax-freeInterest is not taxed
Limits on Contributions
Overall lifetime limit ranging from $250,000 to nearly $400,000 per beneficiary
$2,000 per year per beneficiary$10,000 face value per
series per Social Security Number per year
Limits on Contributions Base on Income
No limits
Maximum amount the contributor can donate is reduced if the contributor’s income exceeds $95,000 ($190,000
for married joint filers) and is fully phased out at $110,000 ($220,000
for married joint filers)
Benefits phased out for individual earning $76,000-$91,000 and couples filing
jointly earning between $113,950 to $143,950
Investments of the Account
Limited investment options, generally including mutual funds and certificates of
deposits. Investment options can only be changed once per
calendar year
Greater investment options than 529 plans, including mutual funds, certificates of deposit, exchange-
traded funds, and individual stocks and bonds.
U.S. Treasury bond series EE issued after 1989 or a series
I bond
Qualified Education Expenses
Higher education expenses (undergraduate and graduate)
Higher education expenses (undergraduate and graduate), and elementary and secondary school
expenses
Higher education expenses (undergraduate and
graduate), payments to Coverdell ESAs or payments to qualified tuition programs
Federal Age Restrictions
None, but may be established at the state level
Cannot contribute to a Coverdell ESA once the beneficiary reaches age
18, and all funds must be distributed when the beneficiary reaches age
30, unless the beneficiary has special needs
The taxpayer must be at least 24 years old before the
bond’s issue date
Impact of Federal Financial Aid
Counted as an asset of the parent/contributor, distributions
from 529 are not counted as income for the student
Counted as an asset of the parent/contributor, distribution from Cover-dell plan are not counted as income
for the student
Counted as an asset of the bond owner
to save and invest their own money to pay for a family member’s college expenses.
Section 529 plans generally require a modest minimum contribution to open an account, making them available to moderate-income families, but they can also be used by wealthy families to
stash away tens of thousands of dollars. Grandparents who are forced to take required distributions from retirement accounts but don’t need the money to live on move the money from one tax-deferred account to another by setting up plans for their grandkids,58
according to one manager of 529 plans. In addition to the tax benefits of 529 plans, these
accounts are treated more favorably than other types of
college savings or investments when determining eligibility for federal student aid. Generally, a 529 is considered an asset of the parent on the Free Application for Federal Student Aid (FAFSA), which has a smaller impact on the assessment of eligibility for need-based federal financial assistance.59
Families contributing to a 529 account may also benefit from state income tax benefits, such as a deduction for contributions, in states with an income tax. Thirty-three states and the District of Columbia offer a deduction for contributions to a 529,60 ranging from $250 (Maine) to the full amount of the contribution (New Mexico).61
As college costs continue to rise, Congress should encourage individuals to save rather than take out student loans to cover college expenses. However, this is most efficiently accomplished by eliminating special preferences
Similarities and Differences Between 529 Plans, Coverdell Accounts, and Education Savings Bonds.

DRAFT
66 | Tax Decoder
and lowering income tax rates, allowing taxpayers to keep their earnings in the first place.
The Joint Committee On Taxation estimates the exclusion of tax on earnings of qualified tuition programs reduced tax revenue by $700 million in FY 2014 and $5.9 billion from FY 2014 through 2018.62
Coverdell Education Savings Accounts
Coverdell Education Savings Accounts (ESAs), first called education IRAs, were created in 1998, but had stricter limitations than current Coverdell ESAs. EGTRRA renamed education IRAs Coverdell Education Savings Accounts after the late Senator Paul Coverdell, permitted withdrawals for K-12 expenses, and raised the contribution limit from $500 to $2,000.63 These changes “made the accounts popular among the private school set as well as public school families with sights on college.”64 Coverdell ESAs also appeal to investors who may prefer investment options not offered by 529 plans.65 These provisions were made permanent by the American Taxpayer Relief Act of 2012.
Although Coverdell accounts include limits on the income of contributors to the accounts, it is possible for a parent with income exceeding the limits to gift money to a grandparent or other individual who is below the income threshold, with the understanding the money will be put into the Coverdell account.
Like 529s, Coverdell funds must be used to pay for qualified education expenses. However, unlike 529s, qualified education expenses for a Coverdell account include elementary and secondary education expenses, in addition to higher education expenses.66
Qualified education expenses a Coverdell can be used for include
tuition, fees, books, supplies, equipment, academic tutoring, the purchase of computer technology or equipment (even internet access), room and board, uniforms, transportation and supplementary items such as extended day programs as required or provided by the school.67
Allowing individuals to withdraw funds tax-free from a Cov-erdell account for elementary and secondary expenses may undermine the incentive to save for future education expenses.
Like 529s, Coverdell accounts are treated more favorably than other types of college savings or investments when determining eligibility for federal student aid. Generally, Coverdell accounts are treated as an asset of the parent.68
While Coverdell ESAs and 529 plans are very similar, individuals can contribute to both a 529 account and a Coverdell ESA for the same beneficiary without any penalty. Contributing to both accounts allows families to maximize the flexibility of income limitations and qualified expenses,
while retaining the tax benefits. For example, Forbes offers the following advice: “For many families the best way to maximize tax savings is to contribute to both a Coverdell and a 529 plan… if you need a computer, you can tap your Coverdell if someone in your family is a K-12 student.”69 In addition,
if your state offers a state income tax deduction or credit for contributions to its 529 plans (34 states and Washington, D.C. do), you should probably contribute enough to grab the deduction before turning to a Coverdell for college expenses.70
The Joint Committee on Taxation estimates the exclusion of earnings of Coverdell education savings accounts will decrease revenue by $100 million in FY 2014 and $600 million from FY 2014 through FY 2018.71
The tax reform proposal from House Ways and Means Chairman Camp would disallow new contributions to a Coverdell ESA after December 31, 2014.72
Congress should eliminate the tax preference for Coverdell accounts.
Exclusion of Interest on Education Savings Bonds
The tax code also provides a third tax-preferred option for education savings. Generally, interest on federal bonds is subject to taxation; however, interest accrued on an education bond (series EE issued after 1989 or a series I bond) may be excluded from taxable income in order to pay education expenses.73
As with Coverdell ESAs and 529s, there are several restrictions on contributions and qualified education expenses the tax-free money can be used to purchase. The purchaser of the bond must be at least 24 years of age at the time of bond issuance74 and the money from the bond must be used to pay for education expenses for the owner of the bond, the owner’s spouse, or a dependent.75
Qualified education expenses include tuition and fees to enroll in or attend an educational institution, but do not include room and board.76 The tax benefit is phased out for married couples filing a joint return.77 Educational Savings Bonds “are subject to the limit of $10,000 face value (equal to the purchase price) per series per Social Security Number per year, just like any other purchase,” but “there is no limit on the amount of bonds that you can accumulate over a lifetime.”78
Educational savings bonds can be rolled over into 529s and Coverdell accounts.79 Revenue lost due to the exclusion of interest on education savings bonds is less than $50 million a year.80
There is some overlap between these three college savings incentives, which Congress should address in the context of comprehensive tax reform. One option is to eliminate the federal tax preference for each of these programs, while allowing states to continue managing 529 qualified tuition programs with state tax incentives.

66 | Tax Decoder Education | 67
Tax Exclusions for Education Assistance
Exclusion of Employer-Provided Education Assistance
The exclusion for employer-provided education assis-tance allows an employee to receive tax-free educational assistance from their employer up to $5,250 per year. The education assistance does not have to be job related.88 Em-ployer-provided education assistance above $5,250 a year must be included on the employee’s taxable income, un-less the benefit meets the requirements of another fringe benefit.89
The exclusion was first included in the Revenue Act of 1978 and was a five-year provision. The Coalition to Preserve Employer Provided Education Assistance points out the exclusions was “established as a five-year provision to give officials time to study it.”90
Although there is very little research on the exclusion, it has been reauthorized ten times, sometimes retroactively, and the American Taxpayer Relief Act of 2012 (P.L. 112-240) permanently extended the exclusion.91
This provision will reduce revenue by $1.2 billion in FY 2014 and $6 billion from FY 2014 through FY 2018.92 Employer provided education assistance is an employment benefit that should be counted as taxable income.
Exclusion of Scholarship and Fellowship Income
A scholarship or fellowship is tax-free if the recipient uses the money to pay for undergraduate or graduate qualified education expenses, including tuition, textbooks, and fees.81
Common tax-free scholarships and grants include Pell grants, academic scholarships, and athletic scholarships.82
However, a scholarship or fellowship used for payment for teaching or research must be included as taxable income.83
This exclusion of scholarship and fellowship funds will reduce tax revenue by $2.6 billion in FY 2014 and $14.4 billion from FY 2014-2018.84
Exclusion of Employer-Provided Tuition Reductions
The exclusion for employer-provided tuition reductions allows for educational institutions to provide reduced or free tuition for employees, as well as their spouses and dependents, without considering the amount of the reduction taxable income. The exclusion for employer-provided tuition reductions was added in 1984 as part of legislation “establishing boundaries for tax-free fringe benefits.”85 However, federal regulations have included similar provisions since 1956.86
This exclusion costs the federal government about $300 million per year and will cost $1.5 billion from FY 2014 through FY 2018.87
Occupation-Related Loan Forgiveness The federal government offers several programs through which borrowers can have a portion of their student loans
forgiven as an incentive to enter a certain occupation. For example, teachers completing five consecutive schools years in low-income schools may qualify for loan forgiveness.93 In addition, special education teachers, full-time math or science teachers in a secondary school, social workers, civil assistance attorneys, and public service employees can qualify for loan forgiveness under the Public Service Loan Forgiveness Program created in 2007.94
The Public Service Loan Forgiveness Program “is intended to encourage individuals to enter and continue to work full-time in public service jobs.”95 In order for public service employees to qualify for loan forgiveness, the individual must be employed full-time in a public service job for 10 years during the repayment of their loans.96
A public service job is defined as a job in emergency management, government, military service, public safety, law enforcement, public health, public education, social work in a public child or family service agency, public interest law services, early childhood education, public service for individuals with disabilities, public service for the elderly,

DRAFT
68 | Tax Decoder
Deduction for Classroom Expenses of Elementary and Secondary School Educators
A study by the National School Supply and Equipment Association found, “99.5 percent of all public school teachers spent some amount of money out of pocket” on classroom supplies.107 On average, teachers spent $485 on out of pocket classroom expenses ($149 on school supplies, $198 for instructional materials, and $138 on “other classroom supplies”) for the 2012-2013 school year.108
A temporary provision of the tax code allows teachers to deduct up to $250 for expenses they incur purchasing classroom supplies.109 In addition to teachers, this deduction is available to K-12th grade instructors, counselors, principals, and aides who worked at least 900 hours during the school year.110
The deduction is an “above-the-line” deduction, meaning taxpayers do not have to itemize their deductions in order to take advantage of this tax break.111 Although the deduction is available to non-itemizers, nearly 50 percent of the deduc-tions are taken by educators or families making between $75,000 and $200,000 yearly. The Congressional Research Service (CRS) provides the breakdown found on page 69.112
Due to the nature of tax deductions, high-income earners benefit more from a deduction than low-income earners. Therefore, high-income earners are more likely to claim
the deduction, skewing their share of the benefit from the deduction upward. According to CRS:
If the purpose of the deduction is to reimburse some portion of classroom spending, a deduction is not a particularly fair way to provide this type of refund. Deductions are worth more to taxpayers in higher tax brackets. A teacher in a higher tax bracket (perhaps due to their spouse’s income), spending $100 on supplies, might see a reduction in tax liability of $35. A teacher in a lower tax bracket, also spending $100 on supplies, might realize tax savings of $15. Thus, while each teacher spends the same amount on classroom supplies, in the preceding example, one teacher’s tax savings is more than twice that of the other.113
public library sciences, school-based library sciences and other school-based services, or a full-time faculty member at a Tribal College or University.97 Individuals serving in the AmeriCorps or Peace Corps also qualify for the public service loan forgiveness program.98
The borrower must also make 120 monthly payments on a qualifying student loan after October 1, 2007. Since the individual must be employed for 10 years, borrowers can become eligible for loan forgiveness beginning in October 2017.99
The National Health Service Corps (NHSC) also offers physicians and other health care professionals loan repayment assistance in return for a two-year commitment to work in an area designated as a Health Professional Shortage Area (HPSA).100 States may also operate loan repayment programs with federally funded grant money to repay student loans for primary care providers operating in HPSAs within their state.
Members of the NHSC or individuals qualifying for the discharge of student loan debt are allowed to exempt the amount of the cancelled or forgiven loan from their taxable income.
This tax exemption costs the federal government $200 million in FY 2014 and $1 billion from FY 2014-2018.101
As with other tax deductions and exclusions, “the benefit provided to any individual taxpayer and the corresponding loss of revenue to the federal government depends on the taxpayer’s marginal tax rate.”102 Higher income individuals will benefit the most from this exclusion because they are subject to a higher marginal tax rate.
The Consumer Financial Protection Bureau (CFPB) estimates more than 33 million workers, or “roughly a quarter of the U.S. workforce could take advantage of federal rules that give favorable loan repayment options to those in public service fields.”103 However, a large portion of eligible individuals fail to take advantage of the benefits because “the programs are overly complicated and often confusing.”104 In addition, many individuals may not be aware of the loan forgiveness programs. The lack of participation in loan forgiveness programs demonstrates they are ineffective and unnecessary.
The exclusion of income attributable to student loan forgiveness should be eliminated.105 Chairman Camp’s tax reform plan would also repeal this provision and increase revenues by $1.1 billion over 2014-2023.106

68 | Tax Decoder Education | 69
Distribution By Income Class of Classroom Expense Deduction at
2009 Income Levels
Income Class(in thousands of $)
Percentage Distribution
Below $10 1.3
$10-20 3.1
$20-$30 4.0
$30-$40 7.6
$40-$50 9.0
$50-$75 22.0
$75-100 19.6
$100-$200 30.2
$200 and over 3.1
Tax Credits for Holders of Qualified Zone Academy Bonds (QZABs)
Qualified Zone Academy Bonds (QZABs) are debt instruments issued by state and local governments to raise funds for school renovations, equipment, teacher training, and development of course materials at “qualified zone academies.”116 Federal tax credits are provided to those who purchase qualified zone academy bonds.
A qualified zone academy is a public school, or program within a school, that is below college level and located in an empowerment zone or enterprise community. An academy can also qualify if it is reasonably expected that at least 35 percent of students will qualify for the free or reduced price school lunch program. The academy should be designed in cooperation with businesses to enhance the academic curriculum and increase graduation and employment rates.
QZABs can eliminate state and local costs entirely and often allow those governments to borrow money at no cost.117
Although paid for by federal taxpayers, individual states are responsible for approving specific applications for QZABs. The IRS simply allocates authority to issue the bonds among the states based on the size of their population beneath the poverty line.118
The Joint Committee on Taxation estimates the credit costs taxpayers $300 million in FY 2014 and will cost $1.3 billion from FY 2014 through 2018.119 This estimate includes $100 million in FY 2014 and $300 million from FY 2014 through 2018120 in direct payments to bond buyers, in lieu of the tax credit, to cover interest costs.121
A Powerful Subsidy for State and Local Borrowing
QZABs were first introduced in 1997. QZABs were available through 2013, and would need to be extended in order for them to continue after 2013. The EXPIRE Act, approved by the Senate Finance Committee, extends the authorization through 2015 and provides $400 million in bond volume authority.122 According to the committee report, this extension will cost $284 million over 10 years.123
QZABs are designed to allow state and local governments to borrow money at zero or nominal interest rates. Bondholders receive all or nearly all of their compensation in the form of annual tax credits from the federal government rather than interest payments from the issuing state or local government. The bonds therefore cost state and local governments little or nothing to issue.124
Unlike tax-exempt bonds, which allow investors to deduct interest payments from their taxable income, QZABs provide investors with annual tax credits that reduce their tax liabilities
This deduction was enacted in 2002 and has been reauthorized several times in the past 12 years. The Expiring Provisions Improvement Reform and Efficiency (EXPIRE) Act, approved by the Senate Finance Committee, would extend this deduction through December 31, 2015.114 Extending this deduction would cost $40 million in FY 2014 and $883 million from FY 2014 through FY 2018.115
Although the dedication and commitment of teachers to provide their students with a quality education is worthy of immense respect, this deduction should be allowed to expire.

DRAFT
70 | Tax Decoder
dollar for dollar. The amount of the tax credit is based on a percentage of the bond’s face value. This percentage is determined on a daily basis by the U.S. Treasury. On January 2, 2014, for example, the rate was 5.22 percent.125 A $100,000 qualified zone academy bond (QZAB) sold on this day would allow the bondholder to claim a $5,220 federal tax credit every year for the life of the bond. The Treasury also sets the maximum term of the bond. On January 2, 2014 the maximum term was 19 years.
One of the most novel features of tax credit bonds is that the credits are “strippable,” meaning the credits may be separated from the underlying bond. For example, a bond trader could buy a $100,000 QZAB, sell the bond itself to a pension fund for $90,000, but sell the tax credits to another investor who can use them to reduce his tax liability. This feature allows investors to purchase tax credit bonds even if they may not owe sufficient taxes to get the full value of the credits, since the credits may simply be sold to another party.126
Subsidizing power plants with school bonds? Oh, well, YOLO!
Yolo County, California, may have found one of the most creative uses of these lucrative bonds. Although
QZABs are intended to be used to refurbish schools, the county secured $23 million of the bonds to build “5.8 megawatts of ground-mounted, high-efficiency SunPower solar power systems” at two sites in 2013.127 The first site produces 0.8 MW for three county government buildings, and the second produces 5 MW and sells it to the local utility, giving the county an income stream expected to be at least $60 million over the next 35 years.128
A Yolo County official told reporters “as part of our partnership with SunPower, we have established an energy academy for K-12 students that provides our young people with educational opportunities in environmental science, renewable energy technology and energy auditing.”129 The county will build a total of seven of these “solar academies.”130
The county appears to be treating the entire $23 million solar project as “equipment” for these “solar academies.” It is unclear exactly what type of education will be provided at these “solar academies.”
Federally-Subsidized iPads
The Merrillville Community School Corporation used QZABs to help provide iPads for 1,000 fifth and sixth graders,
Solar power plant in Yolo County, California, funded with bonds intended for schools in economically-
challenged communities.
iPads in the classroom: QZABS will help pay for the expensive devices in some districts, but the federal government has no power to intervene if initiatives
prove to be a poor investment.
QZABs are intended to support programs that enhance academics, but a school district in New Hampshire was able to use them to renovate a football field.

70 | Tax Decoder Education | 71
as well as an iPad for every staff member and Apple TVs in classrooms.131 Meanwhile, a high school in Connersville, Indiana, will be spending about $600,000 in QZAB-raised funding to help purchase approximately 1,100 iPads.132
It is possible these iPads will help increase the effectiveness of education at these schools. The federal government, however, has little ability to ensure this will in fact occur. The iPads qualify as “equipment,” and as long as states can claim they enhance schools’ academic curriculum in some way, the federal government has little ability to ask how they are used. Although technology in the classroom has many promising applications, there are also many ways it can go wrong. For example, as the Washington Post writes, the networks must have “enough network control to prevent the devices from becoming easy tools for the distractions of online shopping or instant messaging that could easily lure students away from their math classes.” Jaim Foster of the Arlington Education Association also expresses concerns about a loss of person-to-person communication with teachers and other students.133 Finally, they are simply expensive, raising questions about whether they are the best use of scarce federal taxpayer dollars.134
The “Academic” Football Field
The tax code requires QZABs be used for schools and programs that are “designed in cooperation with business to enhance the academic curriculum, increase graduation and employment rates, and better prepare students for the rigors of college and the increasingly complex workforce.”135 This language indicates Congress intended stronger academics to be a central purpose of the bonds.136
Some who use the bonds, however, may view academics as a mere incidental requirement. Laconia School District, for example, used QZABs to reconstruct a football field.137
To qualify for the QZABs, the district decided to launch a “Health and Wellness Academy” in conjunction with the field. “The field will be the centerpiece and visual draw of the Academy,” the Academy’s website explains. In addition to athletic and fitness activities, the academy will provide education related to nutrition, substance abuse, injury prevention, personal health, and emergency preparedness. Explaining the meaning of “QZAB,” the website states, “A [in QZAB] stands for Academy and there are many ways to satisfy this requirement. Creating the Health & Wellness Academy is our recommendation to the School Board.”138
Congress should not extend the QZAB tax provision that expired at the end of 2013.
1 “Education at a Glance 2013: OECD Indicators,” Organization for Economic Co-operation and Development, http://goo.gl/e2aey3 , p. 162. 2 “Index of cognitive skills and educational attainment,” Pearson, 2014, http://goo.gl/fElRG8 3 Office of Management and Budget, Historical Tables, Table 5.4, ―Discretionary Budget Authority by Agency: 1976-2019, http://goo.gl/cs8xMX 4 “Department of Education, Summary of Discretionary Funds, FY 2009 - FY 2015 President’s Budget,” U.S. Department of Education, http://goo.gl/S9kosQ 5 “CPI Inflation Calculator,” Bureau of Labor Statistics, http://goo.gl/opvEHm 6 Includes both discretionary and mandatory Pell grants. “Department of Education, Summary of Discretionary Funds, FY 2009 - FY 2015 President’s Budget,” http://goo.
gl/aXsEdw . “Department of Education Mandatory Funds Summary Table FY 2013-2015 President’s Budget,” http://goo.gl/pCPTc6 . 7 “The Budget for Fiscal Year 2015,” “Department of Education,” Office of Management and Budget, http://goo.gl/SWe2N8 8 “2013 Annual Report: Actions Needed to Reduce Fragmentation, Overlap, and Duplication and Achieve Other Financial Benefits,” GAO, April 2013, http://goo.gl/rrlxut
, page 139. 9 “Opportunities to Reduce Potential Duplication in Government Programs, Save Tax Dollars, and Enhance Revenue,” GAO, March 2011, http://goo.gl/YMUzo3 , page
144. 10 “2012 Annual Report: Opportunities to Reduce Duplication, Overlap and Fragmentation, Achieve Savings, and Enhance Revenue,” GAO, February 2012, http://goo.gl/
hDRrjn , page 221. 11 “2012 Annual Report: Opportunities to Reduce Duplication, Overlap and Fragmentation, Achieve Savings, and Enhance Revenue,” GAO, February 2012, http://goo.gl/
VUN4XL , page 193. 12 “2012 Annual Report: Opportunities to Reduce Duplication, Overlap and Fragmentation, Achieve Savings, and Enhance Revenue,” GAO, February 2012, http://goo.gl/
HtRMje , page 214. 13 Internal memo distributed by Senate Finance Tax Team, Majority Staff, July 23, 2012. 14 Margot Crandall-Hollick, “The American Opportunity Tax Credit: Overview, Analysis, and Policy Options,” Congressional Research Service, January 16, 2013; http://
goo.gl/NuUgAZ . 15 Eileen Shanahan, “Tax Withholding May Be Revised: Administration Studies Plan to Reduce Underpayments—Aid Unlikely This Year,” The New York Times, March 8,
1965. P 1. 16 Wolf Blitzer, “Clinton Supports An Education Tax Credit,” CNN, June 4, 1996; http://goo.gl/sjUKQd . 17 William J. Clinton, Remarks at the Princeton University Commencement Ceremony in Princeton, New Jersey on June 4, 1996, The American Presidency Project, http://
goo.gl/pxnHyu . 18 Margot Crandall-Hollick, “The American Opportunity Tax Credit: Overview, Analysis, and Policy Options,” Congressional Research Service, January 16, 2013; http://
goo.gl/3wZcfK . 19 Margot Crandall-Hollick, “The American Opportunity Tax Credit: Overview, Analysis, and Policy Options,” Congressional Research Service, January 16, 2013; http://
goo.gl/3wZcfK . 20 Internal Revenue Service, “American Opportunity Tax Credit.” http://goo.gl/Ynv32W 21 Whereas the Hope Credit was fully phased out for individuals and joint filers with modified adjusted gross incomes (MAGIs) above $60,000 and $120,000, respectively,
the American Opportunity Tax Credit is phased out at $80,000 for individuals and $160,000 for joint filers. 22 Internal Revenue Service, “American Opportunity Tax Credit.” http://goo.gl/3G69sZ

DRAFT
72 | Tax Decoder
23 Internal Revenue Service, “Lifetime Learning Credit,” Publication 970 (2013), Tax Benefits for Education, Accessed January 22, 2014; http://goo.gl/M3LUHD . 24 Margot Crandall-Hollick, “Higher Education Tax Benefits: Brief Overview and Budgetary Effects,” Congressional Research Service, March 18, 2013; http://goo.gl/ttejdI 25 Crandall-Hollick, Margot, “The American Opportunity Tax Credit: Overview, Analysis, and Policy Options” Congressional Research Service, January 16, 2013; http://
goo.gl/rggnwm 26 Elaine Maag, David Mundel, Lois Rice, and Kim Rueben, “Subsidizing Higher Education through Tax and Spending Programs,” Tax Policy Issues and Options, Tax
Policy Center, May 2007; http://goo.gl/sbJJX4 27 Crandall-Hollick, Margot, “The American Opportunity Tax Credit: Overview, Analysis, and Policy Options” Congressional Research Service, January 16, 2013; http://
goo.gl/eZUEZt . 28 Crandall-Hollick, Margot, “The American Opportunity Tax Credit: Overview, Analysis, and Policy Options” Congressional Research Service, January 16, 2013; http://
goo.gl/J65pWj . 29 Crandall-Hollick, Margot, “The American Opportunity Tax Credit: Overview, Analysis, and Policy Options” Congressional Research Service, January 16, 2013; http://
goo.gl/aIAjnc . 30 Crandall-Hollick, Margot, “The American Opportunity Tax Credit: Overview, Analysis, and Policy Options” Congressional Research Service, January 16, 2013; http://
goo.gl/aIAjnc . 31 Congressional Research Service for the United States Senate Committee on the Budget, “Tax Expenditures: Compendium of Background Material on Individual
Provisions,” December 2012: http://goo.gl/SLrruA 32 Office of Management and Budget, FY 2015 Budget, Analytical Perspectives, Section 14: Tax Expenditures, http://goo.gl/e3ri0j 33 (JCX-97-14) “Estimates of Federal Tax Expenditures for Fiscal Years 2014-2018,” Joint Committee on Taxation, August 5, 2014, http://goo.gl/q8Kuuq 34 Crandall-Hollick, Margot, “The American Opportunity Tax Credit: Overview, Analysis, and Policy Options” Congressional Research Service, January 16 2013, http://
goo.gl/q8Kuuq 35 Congressional Budget Office, “An Economic Analysis of the Taxpayer Relief Act of 1997,” April 2000; http://goo.gl/1a5Q7T 36 Congressional Budget Office, “An Economic Analysis of the Taxpayer Relief Act of 1997,” April 2000; http://goo.gl/1a5Q7T 37 Crandall-Hollick, Margot, “The American Opportunity Tax Credit: Overview, Analysis, and Policy Options” Congressional Research Service, January 16, 2013; http://
goo.gl/QSRjRa 38 Bridget T. Long, “The Impact of Federal Tax Credits for Higher Education Expenses,” National Bureau of Economic Research, September 2004; http://goo.gl/PQcVIR 39 Congressional Research Service for the United States Senate Committee on the Budget, “Tax Expenditures: Compendium of Background Material on Individual
Provisions,” December 2012: http://goo.gl/kQkRDf 40 Treasury Inspector General for Tax Administration, “Billions of Dollars in Education Credits Appear to Be Erroneous,” September 16, 2011; http://goo.gl/DGspGJ 41 Treasury Inspector General for Tax Administration, “Billions of Dollars in Education Credits Appear to Be Erroneous,” September 16, 2011; http://goo.gl/xgUXSm 42 “Tuition and Fees Deduction,” IRS, http://goo.gl/YCJ2KF 43 “Final Summary of EXPIRE ACT as reported,” S. 2260: Expiring Provisions Improvement Reform and Efficiency (EXPIRE) Act, Senate Finance Committee, May 21, 2014,
http://goo.gl/EQeWOl 44 “Individual Income Tax Receipts and the Individual Tax Base—February 2014 Baseline,” Tab 7: Effects of Extending Tax Provisions Scheduled to Expire Before 2024,
Congressional Budget Office, February 4, 2014, http://goo.gl/UCAgfs 45 Margot Crandall-Hollick, “Higher Education Tax Benefits: Brief Overview and Budgetary Effects,” Congressional Research Service, March 18, 2013; http://goo.
gl/2p6SWV 46 Congressional Research Service for the United States Senate Committee on the Budget, “Tax Expenditures: Compendium of Background Material on Individual
Provisions,” December 2012: http://goo.gl/8DyiLx 47 Congressional Research Service for the United States Senate Committee on the Budget, “Tax Expenditures: Compendium of Background Material on Individual
Provisions,” December 2012: http://goo.gl/8DyiLx 48 S.Prt.112-45, “Tax Expenditures: Compendium of Background Material on Individual Provisions,” Senate Committee on the Budget, December 2012, http://goo.gl/
EEzET6 49 “Estimates of Federal Tax Expenditures for Fiscal Years 2014-2018,” Joint Committee on Taxation, August 5, 2014, http://goo.gl/JqYn2W 50 Congressional Research Service for the United States Senate Committee on the Budget, “Tax Expenditures: Compendium of Background Material on Individual
Provisions,” December 2012: http://goo.gl/Xc5uMC 51 Congressional Research Service for the United States Senate Committee on the Budget, “Tax Expenditures: Compendium of Background Material on Individual
Provisions,” December 2012: http://goo.gl/Xc5uMC 52 Hodge, Scott A., “Are Tax Credit the Proper Tool for Making Higher Education More Affordable?” Tax Foundation, July 25, 2012, http://goo.gl/cVCP2r 53 Congressional Budget Office, “An Economic Analysis of the Taxpayer Relief Act of 1997,” April 2000; http://goo.gl/EO9xys 54 Hodge, Scott A., “Are Tax Credit the Proper Tool for Making Higher Education More Affordable?” Tax Foundation, July 25, 2012, http://goo.gl/jwvvhX 55 (R42807), Crandall-Hollick, Margot, “Tax-Preferred College Savings Plans: An Introduction to 529 Plans,” Congressional Research Service, November 2, 2012, http://
goo.gl/SFn4qM 56 (R42807), Crandall-Hollick, Margot, “Tax-Preferred College Savings Plans: An Introduction to 529 Plans,” Congressional Research Service, November 2, 2012, http://
goo.gl/Cr8vJv 57 Caplinger, Dan, “529 Plans: As a way to save for college, they’re consistently head of the class,” Daily Finance, March 18, 2014, http://goo.gl/fhzPTp 58 Ebeling, Ashlea, “Maximizing 529 College Savings Plan Tax Breaks,” Forbes, January 16, 2014, http://goo.gl/tW9z2O 59 (R42807), Crandall-Hollick, Margot, “Tax-Preferred College Savings Plans: An Introduction to 529 Plans,” Congressional Research Service, November 2, 2012, http://
goo.gl/PjZ4oh 60 Ebeling, Ashlea, “Maximizing 529 College Savings Plan Tax Breaks,” Forbes, January 16, 2014, http://goo.gl/iQ3FtH 61 “State Tax Deductions for 529 Contributions,” FinAid, http://goo.gl/bJN7bX 62 “Estimates of Federal Tax Expenditures for Fiscal Years 2014-2018,” Joint Committee on Taxation, August 5, 2014, http://goo.gl/FKWc9S 63 Ebeling, Ashlea, “New Tax Law Resurrects Competitor to 529 College Savings Plans,” January 14, 2013, http://goo.gl/4unxTt 64 Ebeling, Ashlea, “New Tax Law Resurrects Competitor to 529 College Savings Plans,” January 14, 2013, http://goo.gl/4unxTt 65 Ebeling, Ashlea, “New Tax Law Resurrects Competitor to 529 College Savings Plans,” January 14, 2013, http://goo.gl/4unxTt 66 Nicholson, Holly, “Families considering an education savings account have several options,” NewsObserver, April 13, 2013, http://goo.gl/DhNW1l 67 Nicholson, Holly, “Families considering an education savings account have several options,” NewsObserver, April 13, 2013, http://goo.gl/XMHj1R 68 (R42809) Crandall-Hollick, Margot, “Tax-Preferred College Savings Plans: An Introduction to Coverdells,” Congressional Research Service, March 11, 2014, http://goo.
gl/79eZae 69 Ebeling, Ashlea, “New Tax Law Resurrects Competitor to 529 College Savings Plans,” Forbes, January 14, 2013, http://goo.gl/QFD1sY 70 Ebeling, Ashlea, “New Tax Law Resurrects Competitor to 529 College Savings Plans,” Forbes, January 14, 2013, http://goo.gl/hiZ6Za 71 “Estimates of Federal Tax Expenditures for Fiscal Years 2014-2018,” Joint Committee on Taxation, August 5, 2014, http://goo.gl/Q5OWkE 72 (R41967), Crandall-Hollick, Margot L., “Higher Education Tax Benefits: Brief Overview and Budgetary Effects,” Congressional Research Service, March 12, 2014, http://
goo.gl/ySYgJ7 73 Erb, Kelly Phillips, “Back to School: Education Savings Bonds,” Forbes, September 25, 2011, http://goo.gl/33fGSV 74 “Compare Savings Options,” Savingforcollege.com, http://goo.gl/q99q58 75 “Education Savings Bond Program,” IRS, http://goo.gl/Knmr7j 76 “Education Savings Bond Program,” IRS, http://goo.gl/Knmr7j 77 (R41967), Crandall-Hollick, Margot L., “Higher Education Tax Benefits: Brief Overview and Budgetary Effects,” Congressional Research Service, March 12, 2014, http://
goo.gl/0r73FN 78 “Using Savings Bonds for Education,” Treasury Direct, http://goo.gl/djGgY6 79 “How Do I Roll Over US Savings Bonds into a 529 College Savings Plan?” FastWeb, February 13, 2012, http://goo.gl/1myT8n 80 (R41967), Crandall-Hollick, Margot L., “Higher Education Tax Benefits: Brief Overview and Budgetary Effects,” Congressional Research Service, March 12, 2014, http://

72 | Tax Decoder Education | 73
goo.gl/jH5Mdv 81 Scholarships, Fellowships, Grants, and Tuition Reductions, Internal Revenue Service, http://goo.gl/O9Ec2U . 82 (RL32554) Keightley, Mark P., “An Overview of Tax Benefits for Higher Education Expenses,” Congressional Research Service, February 11, 2011, http://goo.gl/yLj2JP . 83 (RL32554) Keightley, Mark P., “An Overview of Tax Benefits for Higher Education Expenses,” Congressional Research Service, February 11, 2011, http://goo.gl/xoePXl . 84 (JCX-97-14) “Estimates of Federal Tax Expenditures for Fiscal Years 2014-2018,” Joint Committee on Taxation, August 5, 2014, http://goo.gl/QJ2vCh . 85 Senate Committee on the Budget, “Tax Expenditures: Compendium of Background Material on Individual Provisions,” Congressional Research Service, December
2012; http://goo.gl/9mxRQy . 86 Senate Committee on the Budget, “Tax Expenditures: Compendium of Background Material on Individual Provisions,” Congressional Research Service, December
2012; http://goo.gl/9mxRQy . 87Estimates of Federal Tax Expenditures for Fiscal Years 2014-2018,” Joint Committee on Taxation, August 5, 2014, http://goo.gl/dnqIbu 88 In Congress, The Coalition to Preserve Employer Provided Education Assistance, http://goo.gl/aGIZnI . 89 Senate Committee on the Budget, “Tax Expenditures: Compendium of Background Material on Individual Provisions,” Congressional Research Service, December
2012; http://goo.gl/IPRCcJ . 90 In Congress, The Coalition to Preserve Employer Provided Education Assistance, http://goo.gl/oRFNoM . 91 Kantrowitz, Mark, “Employer Tuition Assistance,” Edvisors, February 3, 2014, http://goo.gl/f1NQCx . 92Estimates of Federal Tax Expenditures for Fiscal Years 2014-2018,” Joint Committee on Taxation, August 5, 2014, http://goo.gl/hqPvua . 93 Smole, David P., “Federal Student Loans Made Under the Federal Family Education Loan Program and the William D. Ford Federal Direct Loan Program: Terms and
Conditions for Borrowers,” Congressional Research Service, January 16, 2014, http://goo.gl/mi6aFd . 94 Smole, David P., “Federal Student Loans Made Under the Federal Family Education Loan Program and the William D. Ford Federal Direct Loan Program: Terms and
Conditions for Borrowers,” Congressional Research Service, January 16, 2014, http://goo.gl/mi6aFd . 95 Public Service Loan Forgiveness Program, Federal Student Aid, https://studentaid.ed.gov/sites/default/files/public-service-loan-forgiveness.pdf 96 Smole, David P., “Federal Student Loans Made Under the Federal Family Education Loan Program and the William D. Ford Federal Direct Loan Program: Terms and
Conditions for Borrowers,” Congressional Research Service, January 16, 2014, http://goo.gl/mi6aFd . 97 Smole, David P., “Federal Student Loans Made Under the Federal Family Education Loan Program and the William D. Ford Federal Direct Loan Program: Terms and
Conditions for Borrowers,” Congressional Research Service, January 16, 2014, http://goo.gl/mi6aFd . 98 Public Service Loan Forgiveness Program, Federal Student Aid, http://goo.gl/UT23sD . 99 Public Service Loan Forgiveness Program, Federal Student Aid, http://goo.gl/UT23sD 100 “State Loan Repayment Program (SLRP), Bureau of Clinician Recruitment and Service, May 2012, http://goo.gl/U2ffI8 101 (JCX-97-14) “Estimates of Federal Tax Expenditures for Fiscal Years 2014-2018,” Joint Committee on Taxation, August 5, 2014, http://goo.gl/NbD5p8 . 102 S.Prt.112-45, “Tax Expenditures: Compendium of Background Material on Individual Provisions,” Senate Committee on the Budget, December 2012, http://goo.gl/
rmsoFR . 103 Elliott, Philip, “Consumer bureau: Too few use loan forgiveness,” Associated Press, August 28, 2013, http://goo.gl/cBwWRP . 104 Elliott, Philip, “Consumer bureau: Too few use loan forgiveness,” Associated Press, August 28, 2013, http://goo.gl/cBwWRP . 105 In addition, Congress should review student loan forgiveness programs that put taxpayers on the hook for student loans. Congress should also consolidate
overlapping and duplicative medical workforce training programs, including the National Health Service Corps (NHSC). 106 Section-by-Section Summary, Tax Reform Act of 2014: Discussion Draft, Committee on Ways and Means, http://goo.gl/du3zBy . 107 Nagel, David, “K-12 Teachers out of Pocket $1.6 Billion on Classroom Tools,” The Journal, July 1, 2013, http://goo.gl/4ZYF7c . 108 Nagel, David, “K-12 Teachers out of Pocket $1.6 Billion on Classroom Tools,” The Journal, July 1, 2013, http://goo.gl/4ZYF7c 109 Bell, Kay, “A Tax-Deduction Apple for Teachers,” Fox Business, March 24, 2014, http://goo.gl/zVQ8xp 110 Bell, Kay, “A Tax-Deduction Apple for Teachers,” Fox Business, March 24, 2014, http://goo.gl/zVQ8xp 111 Bell, Kay, “A Tax-Deduction Apple for Teachers,” Fox Business, March 24, 2014, http://goo.gl/zVQ8xp 112 S.Prt.112-45, “Tax Expenditures: Compendium of Background Material on Individual Provisions,” Senate Committee on the Budget, December 2012, http://goo.
gl/9iBLcS 113 Sherlock, Molly, “Expired Tax Provisions: The Deduction for Out-of-Pocket Teacher Expenses,” Congressional Research Service, April 17, 2014, http://goo.gl/2Gbnvj 114 JCX-26-14, “Description of the Chairman’s Mark of the ‘Expiring Provisions Improvement Reform and Efficiency (EXPIRE) Act’” April 1, 2014, http://goo.gl/l87RLr 115 “Individual Income Tax Receipts and the Individual Tax Base—February 2014 Baseline,” Tab 7: Effects of Extending Tax Provisions Scheduled to Expire Before 2024,
Congressional Budget Office, February 4, 2014, http://goo.gl/Jclh9L 116 Steven Maguire, “Tax Credit Bonds: Overview and Analysis,” Congressional Research Service, September 20, 2012, http://goo.gl/9Y48V4 117 Steven Maguire, “Tax Credit Bonds: Overview and Analysis,” Congressional Research Service, September 20, 2012, http://goo.gl/0TvoYo 118 IRC § 54E(c)(2), Legal Information Institute, http://goo.gl/XKFOpe 119 “Estimates of Federal Tax Expenditures for Fiscal Years 2014-2018,” Joint Committee on Taxation, August 5, 2014, http://goo.gl/liI96i 120 “Estimates of Federal Tax Expenditures for Fiscal Years 2014-2018,” Joint Committee on Taxation, August 5, 2014, http://goo.gl/tIUJ5E 121 “Direct Payment Subsidy Option for Certain Qualified Tax Credit Bonds and Build America Bonds,” Internal Revenue Service, http://goo.gl/lbKuQg , “QZAB,” Utah
State Office of Education, http://goo.gl/gcJ0JG 122 Final Summary of EXPIRE Act as reported, Senate Finance Committee, May 21, 2014, http://goo.gl/nhz0nS 123 Estimated Budget Effects of an Amendment in the Nature of a Substitute to H.R. 3474, the “Expiring Provisions Improvement, Reform, and Efficiency (‘EXPIRE’) Act
of 2014,” Joint Committee on Taxation, May 15, 2014, http://goo.gl/zMWlAV . 124 Steven Maguire, “Tax Credit Bonds: Overview and Analysis,” Congressional Research Service, September 20, 2012, http://goo.gl/tKNRkS 125 Input January 2, 2014 into search box. “Qualified Tax Credit Bond Rates,” TreasuryDirect, http://goo.gl/HlME9d 126 Steven Maguire, “Tax Credit Bonds: Overview and Analysis,” Congressional Research Service, September 20, 2012, http://goo.gl/YJUXtW 127 “Yolo County Receives Recognitions for Use of Green Power,” Yolo County, April 4, 2014, http://goo.gl/d1iKU9 128 “How a California county produces more power than it uses,” The Christian Science Monitor, April 17, 2014, http://goo.gl/5cNuoV 129 “Yolo County Receives Recognitions for Use of Green Power,” Yolo County, April 4, 2014, http://goo.gl/d3ekCm 130 “How a California county produces more power than it uses,” The Christian Science Monitor, April 17, 2014, http://goo.gl/RxXtXl 131 “Equipping all students with computing device,” Chicago Sun-Times, http://goo.gl/v6pXW6 132 Seth Winstead, “Technology gets personal: School plans to adopt One-to-One Initiative with iPads,” The Clarion, Connersville High School, April 24, 2014, http://goo.
gl/8kB3O1 133 “Tablets proliferate in nation’s classrooms, taking a swipe at the status quo,” Washington Post, May 17, 2014, http://goo.gl/aG1YIX 134 Los Angeles spent $770 per device to equip its students with iPads, at a cost of more than $1 billion. “School iPads to cost nearly $100 more each, revised budget
shows,” LA Times, October 22, 2013, http://goo.gl/15UtFp 135 IRC § 54E(d), Legal Information Institute, http://goo.gl/JTqlM7 136 There is some ambiguity in the language of the statute. IRC 54E(d)(1) requires the school or program that is a benefitting from the bond to have an academic purpose.
The statute is unclear whether the requirements that apply to the schools and programs also apply to the specific bond-financed projects carried out by those schools. QZAB recipients such as Laconia School District, however, appear to be acting on the understanding that the academic component is required for the projects themselves.
137 Adam Drapcho, “Laconia Schools to Establish ‘Health & Wellness Academy’ As Condition of Special Fed Funding,” The Laconia Daily Sun, http://goo.gl/MEXeIU 138 “About the Wellness Academy,” Laconia Health &Wellness Academy, http://goo.gl/k44ois

DRAFT
74 | Tax Decoder
BUSINESS

74 | Tax Decoder Business | 75
Business
Of all aspects of the federal tax system, the U.S. corporate tax code is among the areas most urgently in need of a complete overhaul. In recent years, proposals to rewrite the corporate tax code by eliminating special preferences and low-ering the corporate rate have been introduced by legislators from both political parties, President Obama, and numerous tax
and deficit reduction think-tanks. There is little disagreement in Washington that we need an affordable tax rate in order to retain United States’ competitiveness in an increasingly globalized market.
The combined federal and average state corporate tax rate is the highest in the OECD countries at 39.1 percent.1 The top federal corporate rate, at 35 percent, is the primary reason for this unfortunate distinction. This high rate of taxation has real consequences for U.S. competitiveness. The accounting firm Ernst & Young estimated that over the past 25 years, as oth-er nations have dropped their corporate rates, our static high rate has reduced U.S. GDP by an estimated 1.2 to 2.0 percent.2
To compensate for this high tax burden, Congress has approved dozens of deductions, exclusions, and other special tax breaks to drastically reduce the taxes paid by many companies. Yet, this inefficient and unfair system has resulted in tax breaks for companies with the best accountants or high-powered lobbyists.
These costly credits, deductions, and other preferenc-es built into the tax code are some of the chief obstacles to bringing federal corporate tax rates down and enacting com-prehensive reform. Of the approximately $1 trillion in tax ex-penditures in the code, an estimated $148 billion will be di-rected toward corporations in FY 2014.3 These corporate tax expenditures include provisions such as the deduction for U.S. production activities, the deferral of income from controlled foreign corporations, and others, many of which are outlined in this report.
The federal government simply cannot afford to reduce corporate rates to a competitive level while these preferences remain in place. Further, armies of special interests protest and lobby Congress when their favorite tax break is threatened.
The taxes paid by corporations account for only $321 billion, slightly more than 17 percent, of the total revenues collected by the federal government in FY 2014.4 In some cases, corporate tax expenditures result in multi-billion-dollar companies paying nearly no income tax at all or even receiving a refund from the government.
Despite bringing in more than $1 billion5 in U.S. pretax profits in 2012,6 the social media giant Facebook reported a combined $429 million refund from their federal and state tax filings.7 The government cut a check to Facebook for roughly $295 million in 20128 after the company used stock option tax deductions and carry-forward provisions of the tax code to make their tax bill virtually disappear.
In recent years, a string of domestic companies have used
the process of inversion mergers to avoid billions of dollars in U.S. taxes, raising alarms in Washington. By inverting, a do-mestic business can acquire an overseas entity and move—or domicile—in the lower-tax country where the newly acquired entity is located. Instead of offering short-term patches to try to lock companies into the United States’ tax jurisdiction against their will, Congress should move quickly to start the process of reforming the corporate tax code and lowering rates across the board, making the United States a place where businesses want to stay.
Many of the corporate tax expenditures detailed in this report provide a federal benefit to specific types of compa-nies or particular industries. This chapter, however, focuses on several more widely-used provisions, available to most businesses. These tax policies, such as depreciation and busi-ness expense deductions, are generally designed to ensure American companies are taxed only on net profits and re-main competitive with overseas companies.
While well-intentioned, many of these widely-used tax provisions are inherently vague, requiring extensive interpre-tation by the IRS and permitting broad taxpayer discretion, which often leads to manipulation and irresponsible behav-ior. For example, some have proposed schemes to use the business expense deduction to write off live-in girlfriends and even weddings.
Many of these provisions inadvertently favor particular industries. This leads to an unfair tax code, distortion of the market, and placing government, rather than consumers, in a position to determine winners and losers in the private sec-tor. According to a 2011 report of the president’s jobs council, “Because of its complexity and its incentives for tax avoid-ance, the U.S. corporate tax system results in high adminis-trative and compliance costs by firms—costs estimated to exceed $40 billion per year (or more than 12 percent of the revenues collected).”9
Many corporate tax expenditures also induce companies to spend significant financial resources on tax compliance, detracting from more economically productive uses. In gen-eral, these broadly-used provisions should not be eliminated, but they should be reformed and scrutinized to prevent un-justified revenue losses. Every dollar in revenue lost to friv-olous write-offs and other claims is a dollar that cannot be
DESPITE BRINGING IN MORE THAN $1 BILLION IN U.S. PRETAX PROFITS IN 2012, THE SOCIAL MEDIA GIANT FACEBOOK REPORTED A COMBINED $429 MILLION REFUND FROM THEIR FEDERAL AND STATE TAX FILINGS.

DRAFT
76 | Tax Decoder
Business Expense Deduction: Section 162One of the most widely used business tax provisions is the business expense deduction, codified in Title 26 U.S. Code
Section 162.10 The section allows “ordinary and necessary” business expenses to be deducted from a business’ taxable income.11 For instance, taxpayers may deduct expenses such as cost of goods sold, office supplies and other expenses ordinarily incurred in the course of business.
used to reduce the corporate tax burden—an indispensable step to making our businesses competitive.
Many of the corporate provisions detailed in other parts of this report should be eliminated—in conjunction with an overhaul of the corporate tax code that significantly lowers and flattens the corporate tax rate.
In order to reduce rates, eliminate market distortions and in-
equities, and reduce unproductive compliance costs, Congress must aggressively cut back on the number and complexity of tax expenditures in the corporate tax code. Without this reform, large companies that possess the capabilities to move offshore will continue to do so, and the companies that stay will continue to lose ground to foreign competitors as they struggle to grow under an inefficient and burdensome corporate tax system.
Business Tax Provisions (in millions) FY 2014 FY 2014 - FY 2018Business Expense Deduction (Section 162) * *
Interest Expense Deduction (Section 163) * *
Domestic Production Activities (Section 199) $16,800 $89,900
Domestic Production Activities in Puerto Rico (Section 199) $57 $830
Last In First Out $1,800 $9,200
Employee Stock Ownership Plan $900 $4,600
Depreciation
Accelerated Depreciation $9,820 $164,750
Corporate Jets $394 $1,970
Race Horses as Three Year Property $23 $342
15 Year Recovery for Qualified Leasehold Improvements $62 $2,795
50% Bonus Depreciation $33,535 $197,111
Option to Accelerate Use of AMT Credits $89 $480
Expensing of Research and Experimental Expenses $4,700 $28,900
Permanent Levels of Section 179 Expensing $7,000 $17,600
Extenders Section 179 Expansion $7,208 $46,384
Special Expensing for Mine Safety Equipment $12 $56
Total $82,400 $564,918
It is certainly appropriate to deduct “ordinary and necessary” business expenses, particularly the cost of goods sold and other large, vital expenses. The business expense tax deduction is not considered a tax expenditure, and is not considered by the Joint Committee on Taxation to result in an annual revenue loss. The business expense deduction is necessary to ensure businesses are taxed on their bottom-line and not their top-line revenue.
Like other sections of the code, such as the Earned Income Tax Credit, Section 162 is vulnerable to waste and
fraud. Ambiguous words like “ordinary” and “necessary” leave the business expense deduction extremely vulnerable for misinterpretation and abuse. The Government Accountability Office (GAO) found that in both fiscal year 1993 and 1994, the Office of Appeals, which oversees disputes over business expense deductions, received over 65,000 cases for settlement with over 90 percent settling without litigation.12 This is likely a conservative figure for the total number of questionable uses of the business expense deduction because it only represents tax forms the IRS
* The revenue loss associated with these provisions is either unknown or not included in order to avoid double counting

76 | Tax Decoder Business | 77
that way. Have people pay to attend as they would a charity event, with all the profits going to the designated charity.” 15
Examples such as these serve to demonstrate the flexi-bility available under the current structure of the business expense deduction.
Girlfriend for Hire
One individual who owned several rental properties was able to deduct his live-in girlfriend who managed the properties. A Tax Court ruled that this truly less-than-arms-length transaction allowed a business expense deduction of $2,500 for the $9,000 paid in compensation, although it disallowed the cost of her housekeeping chores.16
Fictitious Companies
There are other, less legal ways to create deductible busi-ness expenses. In Maryland, a man named Athanasios Reglas built a successful bridge painting company by contracting with the State of Maryland on highway projects. Unbeknownst to the IRS, Mr. Reglas created two fictitious companies in 1999 and used them as sub-contractors, taking large business ex-pense deductions and essentially allowing windfall profits for his enterprise. The funds were then laundered from the shell companies back into Mr. Reglas’s personal bank account and spent on items such as a lavish vacation home in Ocean City, MD. All told, several hundred thousand dollars were hidden from the IRS until law enforcement discovered the scheme in 2007.17 While the IRS eventually caught on to this instance of abuse, it is impossible to know how many more fictitious busi-ness expense deductions are claimed in this manner.
Leaving on a Jet Plane
Believe it or not, one couple attempted to write off costs associated with the use of a private plane used to travel to and monitor their rental condo. Because only a portion of the trip was actually used to check on the real estate property, the Tax Court clarified that the taxpayers could only deduct costs, on a prorated basis, associated with the amount of time spent on business-related matters.18
Luxury in the Sky
In many cases luxury boxes at entertainment and sporting events can be deducted, however, some limitations apply. For example, only the face value of tickets may be deducted. Any amounts in excess of the face value paid to agents or scalpers are not deductible. If you rent a skybox or other private luxury box for more than one event at the same sports arena in the same year, your deduction is limited to the price of a regular
The lengths to which some will go to save taxes on a wedding are enough to make anyone a Bridezilla.
audited and found questionable. Two major problems have resulted from the ambiguous
language of Section 162. First, individual taxpayers can mask hobby and personal expenses as business expenses. Second, businesses can mask compensation and perks as business expenditures. Both provide a tax-free advantage.
Individual Taxpayers Mask Hobby and Personal Expenses as Business Expenses
Rampant abuse of the business expense deduction is largely due to the subjectivity involved in discerning taxpayer intent. According to IRS guidance, “An ordinary expense is one that is common and accepted in your industry. A necessary expense is one that is helpful and appropriate for your trade or business.”13 In theory, the deductibility of an expense may be determined simply by asking: Does the expense help the taxpayer conduct his business, and is the expense ordinary given the type of business? The difficulty comes when taxpayers fabricate businesses solely to reduce their tax bill.
This report provides just a few examples of the questionable, if not completely inappropriate items that have been claimed as business expenses. Congress should consider significantly curtailing the business expense deduction, but in a simplified manner, in order to prevent these types of clear abuses.
Going to the Chapel
With the average wedding costing just over $28,400 in 2012, it is easy to understand why newlyweds would be ea-ger to write off these expenses.14 The ambiguity of the tax code makes this possible for some couples about to walk down the aisle. As a result, some taxpayers have dreamt up creative ways to turn their weddings into business events.
An article published by Equifax encourages couples to combine their weddings with corporate events by making the main dinner of a business meeting also serve as a wed-ding reception. Another suggestion is to “turn the whole wedding into a charity or fundraising event, and market it

DRAFT
78 | Tax Decoder
non-luxury box ticket for each seat. When expenses for food and beverage are separately stated, you may deduct those expenses in addition to the amounts allowable for the skybox. Both expenses are subject to the 50 percent limitation.
As demonstrated by the IRS’s website for illustrative purposes: “You pay $3,000 to rent a 10-seat skybox at Team Stadium for three baseball games. The cost of regular nonluxury box seats at each event is $30 a seat. You can deduct (subject to the 50% limit) $900 [(10 seats × $30 each) × 3 events].”19
Business Can Mask Compensation, Perks and Legal Damages as Business Expenditures
Another challenge with the ambiguity of the business expense deduction is that businesses can write off “perks” to owners without reporting the benefits on the individual’s W-2. In doing so, neither the company nor the owner or employee is required to pay taxes on the expensed amount. Under current law, businesses are only able to deduct “reasonable” compensation expense to the owners and employees. This law exists to prevent businesses from shifting expenses from the business to the owners when it may provide a tax advantage to do so.
In a study, the GAO reviewed a random sample of 185 sole proprietors, small and medium-sized corporations, and individuals claiming employee business expenses who were in disputes in tax court. While the study report was issued nearly twenty years ago, very little has changed since then in the way business expense deductions are claimed. Unreasonable compensation occurred in 15 percent of the 185 disputed cases but accounted for 50 percent of the value of the tax adjustments proposed by the IRS, worth a total of $24.5 million. In 117 large corporation cases examined by the GAO, unreasonable compensation occurred in three percent of cases, but accounted for one percent of proposed tax adjustments, for a total of $15 million.20
Child Labor
Some business owners have gone so far as to employ their children for doing office work.
“Upstanding Schedule C filers have options, too. They can legally write off payment for office work done by family members, even if they’re in middle school. ‘I’ve seen people with infant children claiming that their kids are doing work,’ says Howard Rosen, a St. Louis-based CPA. ‘I’m talking about a 3-year-old doing filing,’ Rosen says. ‘He didn’t even know the alphabet’.”21 Because the personal exemption amount is relatively high, most children do not have to file taxes for the earned income.
Legal Damages
Many corporations commonly deduct legal damages under Section 162. While Section 162(f) disallows deductions for “fines and penalties,” the deductions are allowed for other forms of legal remedies paid. For instance, in November 2014, JPMorgan was forced to pay a $13 billion settlement, of which is composed a $2 billion nondeductible civil penalty, a deductible $4 billion consumer relief payment and a $7 billion portion that is partially deductible.22 Legal payments deemed as compensation are considered deductible according to the IRS and/or tax courts.
Firms like JPMorgan are not alone. Exxon Mobile’s $1.1 billion Alaska oil spill settlement actually cost the company $524 million after taxes.23 In fact, a 2005 GAO report supports that such treatment is prevalent for businesses. In examining more than $1 billion in settlements paid by 34 companies, the report listed twenty companies that had claimed deductions for at least part of their payouts.24 The Department of Justice does have the ability to render the damages nondeductible, but a more systematic solution should be in place to determine deductibility.
Pimping the Business Deduction
Through the business expense deduction, Uncle Sam is assisting the operation of the legal brothels in Nevada. These businesses are antiquated practices from the days of the state’s silver boom starting in the 1850s, yet they still manage to get special treatment in the tax code through exemptions designed for businesses.
Though prostitution is illegal almost everywhere in the nation, the federal tax code still allows brothels to qualify for standard business deductions and expenses.25 These deductions significantly reduce a brothel’s overall federal income tax liability, even though annual revenues for the industry have been approximately $50 million.26
Brothels can take deductions for groceries, “salaries and
Some small business owners have tried to illegally claim their non-working young children as employees in order to expense their “wages.”

78 | Tax Decoder Business | 79
wages of prostitutes, rent, utilities and taxes and licenses.”27, 28 The Mustang Ranch brothel, which was Nevada’s oldest, reduced its income tax liability by also deducting costs of “promotion,” which included “free passes.” Workers are also allowed business deductions. “[B]reast implants and…costumes” have also been ruled allowable deductions by the Internal Revenue Service (IRS).29 Workers can also deduct the cost of “equipment for that specialized stuff,” noted one tax expert.30
About 19 legal brothels currently exist in Nevada.31 Only 10 counties out of 3,007 in the United States allow prostitution, and all are in Nevada.32 The counties alone have just 300,000 people. Brothels are hardly economic drivers for communities since most “are in rural areas with few people.”33
Even though prostitution is deemed illegal under nearly every law in the nation, Congress must explicitly disallow businesses – legal or illegal – from making such deductions from their tax liability. The IRS argued before the Supreme Court that illegal activities should qualify for normal deductions, but the Court placed the buck on Congress to make that point explicit, which it has failed to do. A number of federal laws already limit the scope of what businesses are allowed to deduct, but brothels are not mentioned.
At least one prominent Nevada lawmaker has noted that allowing the practice gives the Silver state a bad name: “Nevada needs to be known as the first place for innovation and investment – not as the last place where prostitution is still legal.”34
Why Is the Business Expense Deduction So Easily Manipulated?
Under Section 162, taxpayers may deduct certain expenditures as business expenses. Business taxpayers are required under IRS regulations to maintain books and records to substantiate their income and deductions, including any deduction under Section 162.35 The IRS uses authority granted in Section 7602(a) to enforce this rule by examining a business taxpayer’s books and records to ascertain whether they support the information reported in the taxpayer’s return.
However, the likelihood of the IRS discovering fraudulently deducted expenses claimed by a small business owner is slim. From FY 2004 to FY 2013, the examination rate for business returns ranged from a low of 0.36 percent in FY 2004 to a high of 0.71 percent in FY 2012.36 Therefore, if someone was creative to the point of committing fraud in FY 2012, there was only a 0.71 percent probability the IRS would have audited that particular tax return.
Due to a lack of widespread monitoring, it is impossible to accurately assess the full extent of abuse occurring through this government tax expenditure. The business expense deduction is often abused because the taxpayer’s intent largely determines whether an expense is personal or business in nature.
A landmark U.S. Supreme Court case United States v. Gilmore best conveyed this paradigm, stating, “one is [as] a seeker after profit who can deduct the expenses incurred in that search; the other is [as] a creature satisfying his needs as a human and those of his family but who cannot deduct such consumption and related expenditures.”37 The taxpayer’s intent is critical for determining whether the business expense deduction applies and this subjectivity curtails the IRS’s efforts to curb abuse of the deduction.
Recommendations
The ambiguity of Section 162 and lack of proper IRS guidance have created a business environment in which broad discretion is granted to taxpayers, allowing some to go too far. Congress should consider changes to Section 162 to mitigate the magnitude and likelihood of abuses. While numerous options for improvements to help prevent abuse exist, the following are just three suggestions.
1. Allow only businesses that have registered with the IRS and obtained a tax ID number to claim business expense deductions. Under this policy, individuals will have to commit to creating businesses in advance of tax time rather than establishing enterprises retro-spectively during tax filing season for tax avoidance purposes. This change will reduce flagrant misuse of the deduction by those who only think to create a “business” when tax bills come due.
2. Cap the deductibility of business-related “perks” at a specified level and adjust annually for inflation.
3. Disallow the deductibility of compensatory legal damages.
In his draft corporate tax reform proposal, House Ways and Means Chairman Dave Camp proposed eliminating entertainment related business expense deductions, which have been used to write off the costs of lavish food and entertainment expenditures such as golf outings and others. As with other business expense deductions it is difficult to determine excessive and fraudulent expenditures from more appropriate business expenses. The Joint Committee on Taxation estimated Chairman Camp’s proposal would save $15 billion over ten years.38

DRAFT
80 | Tax Decoder
Interest Expense Deduction: Section 163 The fundamental purpose of the tax code is to collect enough money to fund necessary government operations. As shown
throughout this report, policy makers have added a secondary purpose of changing market behavior through various tax credits, deductions, exemptions and other preferences. One such market altering provision embedded in our code is the deductibility of interest payments on debt. Since dividend payments on equity do not receive similar treatment, there is an explicit tax preference for corporations to finance with debt over equity.
Financing Additional $100M Investment: Debt vs. Preferred Stock with Third Party Investor
This “debt bias” has several consequences, including distorting the costs associated with debt in capital planning, unproductive investments in complex tax planning activities, and greater amounts of leverage than would otherwise exist in the US economy. Americans only need to look back at the excessive levels of debt leading up to 2008 to remember the consequences associated with an over-leveraged economy. Perplexingly, all of these risks accrue with little legal or economic justifications for the disparity of tax treatment between debt and equity financing.
Corporations finance their operations through either debt in the form of bonds, equity in the form of stock, or a hybrid instrument combining qualities of both. Investors in traditional bonds make a lump sum payment in return for fixed periodic interest payments and the return of their investment at the maturity date of the bond. The issuance of equity is a sale of ownership stake and investors receive, but are not necessarily entitled to, dividend payments.
There are several key differences between debt and equity instruments. Debt holders have a legal right to the fixed return
whereas equity holders receive a non-guaranteed return based on the performance of the company. In the event of bankruptcy, equity holders are subordinate to debt holders in the claims process. Finally, equity holders have controlling rights in the firm whereas debt holders have no control over the firm.
While there are many important legal and economic distinctions between equity and debt, fundamentally they are financial instruments that provide a return on capital to a company’s investors. Yet, whether the returns flow through dividends or interest payments makes a substantial difference in the tax costs to the company. Section 163 of the tax code allows for firms to deduct the interest payments paid on debt. Dividends paid to equity holders on the other hand are not deductible. Due to this discrepancy in tax treatment of financing through debt versus equity, there is a structural bias in the tax code for firms to use debt financing over equity financing. The Joint Committee on Taxation (JCT) illustrates the implications of the disparate tax treatment through the following scenario:
80 | Tax Decoder Business | 81
Corporation X is in the 35 percent tax bracket and wants to raise $100 million of additional capital. X can issue either debt with a 5 percent interest rate, or preferred stock with a 5 percent dividend. Assume that after raising the capital, Corporation X earns $10 million and pays $5 million to the new investors. If the $100 million raised is in the form of debt, corporation X can deduct the $5 million paid to the investors, leaving cash after tax of $3.25 million. If the $100 million is in the form of preferred stock, cash available to Corporation X after tax is only $1.50 million.39
The justification for the deductibility of interest payments on debt is that it is a cost of doing business and should not be includ-ed in taxable income. However, an International Monetary Fund (IMF) report points out this rationale “makes no sense economi-cally… [as] both payments represent a return to capital and there is no a priori reason to tax one differently from the other.”40
While the disparate tax treatment may not make economic sense in theory, it makes a world of difference to financing costs in reality. A 2005 Congressional Budget Office (CBO) report found that the “rate on equity-finance corporate capital income is 36.1 percent and that on debt-financed corporate capital income is -6.4 percent, a difference of 42.5 percentage points.”41
There is a vast amount of academic literature on corporate finance and how firms reach their optimal target capital structure. Theories and practice on all the tradeoffs that go into capital structure decisions is beyond the scope of this report. With that said, it is true that tax treatment is not the sole determination in corporate financing and there are factors that deter corporations from issuing excessive amounts of debt.
Prime among these are the financial instability costs as-sociated with the ability for debt holders to force a firm into bankruptcy in the case of a missed interest payment. Corpo-rations facing financial stress “may be denied sufficient access to credit, suffer key personnel losses, and endure a diversion of management time and energy away from productive activity” along with the administrative and legal expenses of bankrupt-cy.42 These mitigating factors of financial instability associated with debt financing would still exist in a world where there was tax parity between debt and equity financing. Therefore, the case can be made that the deductibility of interest payments is a public policy to offset the financial instability costs of debt.
If anything, the costs associated with financial distress due to debt buildup should be highlighted – rather than masked – by public policy makers. This is especially true given that “over-borrowing increases the probability of a financial crisis considerably, while it magnifies the depth of the crisis.”43
We learned this lesson all too well in 2008, when some of the largest financial institutions, including Lehman Brothers, Bear Stearns and AIG, held exorbitant amounts of debt that could not be handled during the stressed environment.44 In this case, the cratering of the economy had massive social costs that went far beyond the impact of any specific firm, and the after effects of this debt buildup still exist to this day.
While the 2008 financial crisis cannot be directly attributed to the deductibility of interest payments, the debt was nonetheless encouraged over equity due to the explicit tax advantage. Moving forward, it confounds common sense that we would wish to maintain a public policy that incentivizes debt over equity.
One particular industry that gains a large tax advantage through the deductibility of interest payments on debt are pri-vate equity firms that use a strategy called a “leverage buy-out”. In a leveraged buyout, a private equity firm will raise funds from investors to take over a company, or a division of a company, from the existing shareholders. The price of the takeover is pre-dominately funded through debt financing, whose interest pay-ments are deductible under the tax code. Due to the emphasis of debt financing utilized by private equity firms to enhance their return on investments, these leveraged buyouts gain a sig-nificant tax advantage through interest rate deductions.
Another implication of the disparate tax treatment between debt and equity is the unproductive costs of financial engineering by corporate managers. Victor Fleicher, associate professor at the University of Colorado Law School, testified before the Finance Committee in 2011 that “corporate managers are willing to add complexity to their capital structure, distort corporate governance, and even change investment policy and other critical business decisions as long as the tax savings are worth it.”45 As part of this tax planning process,
tens of millions of dollars a year in billable hours and investment banking fees are devoted to analyzing whether particular financial products will or should be treated as debt or equity for tax purposes.46
These financial engineering costs are spent for the sake of lowering tax bills rather than capital investments. Victor Fleicher points out,
in a world without a tax distortion, corporations would make financing decisions based on the firm’s investment policy and the cost of capital dictated by market conditions, not a tax calculation.47
In addition to encouraging a risky and more costly business environment, the section 163 deduction of interest expense creates an opportunity for corporations to perform “earnings stripping”, which entails reducing revenue in one country and shifting it to a country with a more favorable tax rate. This practice typically occurs when a foreign parent company issues a loan with an exorbitantly high interest rate to a domestic subsidiary, allowing the subsidiary to deduct the interest expenses and reduce its tax bill.
IRS code section 163(j), which was adopted by the Revenue Reconciliation Act of 1989, sought to disallow earnings strip-ping. However, in practice, the complexity of calculating key components renders enforcement capabilities murky at best. This section defines disqualified interest expense based on the

DRAFT
82 | Tax Decoder
Domestic Activities Production Deduction: Section 199
The Domestic Activities Production Deduction (DAPD), often referred to as Section 199 for its location in the tax code, is a deduction provided to companies with income from certain “qualified production activities,” such as manufacturing, construction, and movie making, among others.51 Like many other business tax provisions, the deduction is well meant in its objective. It is primarily intended to keep U.S. manufacturing companies operating domestically from moving to countries with lower tax burdens. Its effectiveness and ability to do so, however, are questionable, as many companies continue to relocate their operations overseas and the deduction simply lowers the effective tax rate for certain companies.
Adopted by Congress’s American Jobs Creation Act of 2004, the DAPD originally offered a special three percent deduction for qualified production activity income. Since that time, the deduction amount has increased to nine percent. In the highest tax bracket, the DAPD of nine percent for qualified production expenses reduces the tax rate by 3.15 percentage points, from 35 percent to 31.85 percent.52
The deduction heavily favors large corporations. In 2009, 93 percent of the DAPD was claimed by the top 0.5 percent of firms with over $100 million in assets.53 Further, the provision, while more widely available than some, remains a targeted tax break for certain industries. According to the Congressional Research Service:
In 2008, 66% of corporate claims of the Section 199 deduction were attributable to the manufacturing sector. Another 12% of the value of corporate claims came from the information sector, while 7% were attributable to the mining sector.54
Although not originally allowed by the DAPD, a subsequent
congressional extension was broadly interpreted to allow film producers to claim the deduction for “the production of any qualified film, provided at least 50% of the total compensation associated with the production is for services performed in the United States by actors, production personnel, directors, and producers.”55 Such use of the deduction has sparked controversy united over whether film production would have taken place in the States, regardless of Section 199.
The lower effective tax rate enjoyed by these companies puts non-qualifying businesses at a competitive disadvan-tage. The government is once again picking winners and losers in the market place and using tax subsidies to allocate capital instead of creating a neutral tax code that encourages growth for all private sector businesses.
From 2005 to 2014, the DAPD was estimated to cost about $76.5 billion in revenue as originally enacted.56 The provision cost $16.8 billion in FY 2014 and is expected to result in $89.9 billion from FY 2014 through FY 2018.57
Two years after enactment of Section 199, Congress amend-ed the law to allow business operations located in Puerto Rico
company’s debt-to-equity ratio, whether a related-party loan exists, and whether the company has “excess interest expense.”
Excess interest expense is defined as net interest expense, or interest revenue minus interest expense, in excess of 50 percent of adjusted taxable income.48 The difficulty of calculating disqualified interest lies in classifying securities as either debt or equity to determine the debt-to-equity ratio that must meet certain legal standards. Securities that contain both features of debt and equity cause ambiguity in the ratio calculation, and as a result, the enforceability of limited interest expense is highly suspect. This ill-defined area allowed Tyco International, which is headquartered in Switzerland, to file a lawsuit in federal tax court in August 2013, by asserting its interest expense was due to an intercompany loan.49
Recommendation
The potential tax savings a company can derive from the deductibility of interest payments is directly associated with the corporate tax rate. Therefore, any tax reform that lowers the base rates will simultaneously lessen the tax favorability
of debt financing. However, there is significant danger if Congress goes without addressing the tax code’s debt bias when taking on comprehensive tax reform.
If an abundance of tax breaks and loopholes that firms traditionally utilize in their corporate strategies are eliminated, the relative value of any remaining tax preferences will be heightened. A consequence of tax reform could be to enhance the role debt financing plays in tax planning strategies. Victor Fleicher warned about this potential in his 2011 Finance Committee testimony, stating
as we continue to close corporate tax loopholes, we can expect renewed fervor for increasing leverage as a method of managing effective tax rates.50
Therefore, it is paramount that Congress closely scrutinize interest rate deductibility and close the gap in tax treatment between debt and equity financing. Without careful consideration of the tax code’s debt bias, Congress could inadvertently make incentivizing unsustainable leverage the legacy of comprehensive tax reform.

82 | Tax Decoder Business | 83
to also qualify for this benefit. The tax break, however, has not been provided to other U.S. possessions, creating yet another level of complexity and unfairness with this deduction.58
This addition is included in the frequent “extenders” tax packages passed by Congress, and is extended once again in the Senate’s 2014 extenders legislation, the EXPIRE Act of 2014. The Puerto Rico based 199 tax break will cost American taxpayers an estimated $57 million in FY 2014 and $830 million from FY 2014 through FY 2018.59
The suspect economic effects of the DAPD are explained by a Congressional Research Services report:
From an economic perspective, providing a deduction for selected domestic manufacturing activities is less efficient than an across-the-board cut in tax rates. By allowing only certain sectors to qualify for this deduction, the tax code creates an added incentive for capital investment in activities that would have produced lower pre-tax rates of return. This incentive distorts the allocation of capital. Targeted tax incentives may be inefficient as they can drive capital away from its most productive use, reducing overall economic output. … Economic efficiency could be enhanced by repealing the Section 199 deduction and using the additional revenues to offset the cost of reducing corporate tax rates.60
In addition to the DAPD’s distortive economic impact, the deduction also presents an administrative hurdle for taxpayers and the government alike. This results from the complexity of the deduction, as explained by CRS.
The Section 199 deduction and the associated regulations have increased complexity in the tax code. Both taxpayers and the government face an added administrative burden.61
CRS explains that the burden of determining qualifying expenses leads to extensive record keeping and accounting by private firms, while enforcement of the provision only adds to IRS’ personnel work.
A number of tax proposals have included eliminating Section 199, including the President’s National Commission on Fiscal Responsibility and Reform and the Debt Reduction Task Force.62 According to CRS estimates, a revenue-neutral approach in eliminating the deduction would reduce rates by an estimated 1.2 percentage points.63
Section 199 effectively acts as a redistribution of wealth mechanism to give the largest qualifying companies preferential tax treatment, adds another layer of complexity and burden on those claiming it, and further distorts the market. As with numerous other provisions highlighted throughout this report, Section 199 should be eliminated, in conjunction with lowering and flattening the overall corporate tax rate.
Last-In First-Out (LIFO) Inventory Deduction In order to compute a business’ annual taxable income, the cost to produce or purchase the goods sold must be deducted
from the business’ revenues. All things being equal, the higher the costs are to purchase or produce a good, the smaller a company’s income, and thus taxes, will be. Due to the impracticality for companies with a large inventory to match the specific cost and sales price on each individual item sold, U.S. tax law allows for companies to make general accounting assumptions on their inventory costs. How a company determines the cost of its inventory has a significant impact on the amount of taxes paid by large corporations – including one accounting methodology that gives “a permanent tax deferral — a tax holiday — for a select class of taxpayers.”64
Initially, only first-in first-out (FIFO) and average cost methods were allowed for inventory accounting. In 1939, amidst the flagging economy following the Great Depression, Congress permitted the use of last-in first-out (LIFO) for inventory accounting with the Revenue Act of 1939. Following the rejection by the Treasury department and the Supreme Court of a similar “base-stock” accounting method, the “adoption of the LIFO method was initiated by big business’ interests, impacted by the economic realities of the Depression and New Deal tax policy, and mediated through the professional aspirations of accountants and policy experts within Congress and the Treasury Department.”65 What was initially an industry attempt to counteract the deleterious economic impact of a new undistributed profits tax proposal from President Roosevelt, turned into a tax break for particular
industries that are suited to take advantage of the tax savings. The difference between LIFO and other types of inventory
assumptions can substantially change the value of inventory and ultimately income reported for purposes of paying taxes. Under FIFO, the cost of the good sold is treated the same as the first item in the inventory. Under LIFO, the cost of the good sold is assumed to be the same as the last inventory item purchased.66 Therefore, LIFO allows companies to expense the most recently purchased, expensive inventory, maximizing charges against revenue which reduces net income and taxes paid. Assuming that inflation continues to occur as it has since the 1970s and businesses buy more inventory than they sell, LIFO will reap large tax savings for some corporations.
The tax savings attributed to LIFO are calculated by a com-pany’s LIFO reserves, which is the difference between the val-

DRAFT
84 | Tax Decoder
ue of inventory under FIFO cost assumptions and LIFO cost assumptions. For instance, Exxon Mobil maintained a LIFO reserve of $25.4 billion in 2007, representing the largest bene-ficiary of the LIFO tax break.67 All told, this LIFO reserve rep-resents $8.89 billion in deferred taxes, an additional amount the government will have to borrow in order to keep the lights on.68
Technically, the ability to utilize LIFO inventory accounting is available to all companies. However, the benefits of LIFO are concentrated in a select few industries with long-term, homo-geneous inventories, including “oil and gas producers, com-modities firms, such as steel and chemical companies, plastic and specialty retailers such as fabric related and drug stores.”69 Alternatively, “industries possessing inventories which are ob-solete in nature and/or sold quickly (high turnover) and/or per-ishable, cannot benefit from LIFO adoption.”70
Thus, the LIFO method “fails another fundamental princi-ple of a well-designed income tax in that it is not available to all taxpayers in all industries, but rather only to those that main-tain physical inventories and are not required to use another accounting method for those inventories.”71
A study conducted in 2007 analyzed the Securities and Ex-change Commission (SEC) annual filings for all Fortune 500 companies.72 Inventory cost methods were categorized, and the inventory and LIFO reserve balances were recorded, both in aggregate and for each entity. Of all Fortune 500 companies, only 359 maintained inventory balances. Further, 38 percent of Fortune 500 companies, or 135 of the 359 entities that reported inventory, used LIFO accounting to reduce their tax bill on a regu-lar basis, as long as inventory purchases exceed inventory sales.73
The study found that the largest LIFO reserves were recorded by the petroleum refining, industrial/farming equipment, and metals industries with $56.267, $4.693, and $3.716 billion in reserves respectively.74 As individual corporations, Exxon Mobil, Chevron, and ConocoPhillips maintained LIFO reserves of $25.4, $6.96, and $6.67 billion respectively.75 Assuming a 35 percent tax rate, these three companies have deferred a whopping $13.66 billion in taxes. This amount is directly added to the national debt since it’s money not received by the IRS until an undetermined future period, or potentially never.
While supporters of LIFO accounting defend the methodology as protecting inflation-generated gains on inventory from taxation, the fact that LIFO accounting can only be utilized by a subset of American businesses creates another distortion within the tax code. Congress should consider the impact of inflation-generated gains in a holistic manner, rather than shielding only companies that hold inventories that are compatible with LIFO.
Another consequential byproduct of LIFO is that it allows corporations to manage their earnings. The American Institute of CPAs, the largest member association representing CPAs, explained that LIFO grants corporate executives the opportunity to manipulate earnings and taxes by managing whether to sell off old inventory or over-purchase new inventory with inflated prices.76 A wider cost difference between old and new inventory
provides more opportunity for earnings and tax management. In fact, tax management incentivizes corporate executives to participate in earnings management.
Empirical studies have found corporate executives manage inventory levels directly to avoid paying taxes. Some of these studies (Biddle77; Davis, Kahn and Rozen78; Tse79) found that LIFO firms liquidate inventories less frequently and in smaller magnitudes than do FIFO firms, suggesting the tax implications of LIFO inventory reductions induce managers to avoid liquidation to preserve the lower valuations of older inventory items. Further, Frankel and Trezvant80 determined that high tax rate LIFO firms are more likely to purchase excessive inventory at year-end compared to their low tax rate LIFO or FIFO firms. All told, the studies suggest that high tax rate LIFO firms incur operational inefficiencies to gain income tax reductions, meaning the use of LIFO encourages executive management to base inventory levels on their targeted tax goals.
The Obama administration has advocated the elimination of the use of LIFO for tax purposes, arguing that it does not reflect the economic reality of business operations. According to the Congressional Budget Office (CBO), most companies prefer to sell their oldest inventory first, to reduce the risk that a product will become obsolete. A change to allow only FIFO or weighted-average costing would better reflect “business practice and economic reality.”81
This stance invoked dozens of business lobbyists and the LIFO Coalition to redouble their efforts to maintain the acceptance of LIFO. Even so, LIFO faces large headwinds as U.S. regulators have sought to converge U.S. and international accounting standards, in doing so, eliminating LIFO. In fact, the SEC released material in November 2008 predicting that LIFO would be disallowed starting in 2014.82
Last In First Out is estimated to cost $1.8 billion in FY 2014 and $9.2 billion from FY 2014 through FY 2018.83
Recommendation
Like many provisions in the tax code, inventory accounting is intended to capture a company’s profits, rather than revenues, for taxation. Congress can move to an immediate expensing of capital investments and eliminate the issue of accounting methodologies altogether. In the absence of such an approach, transitioning to average-cost and FIFO inventory accounting will create a more accurate representation of the costs of goods sold, eliminating a permanent tax holiday that is only available for certain industries.
If LIFO is eliminated for tax purposes, LIFO reserve should be recognized as income equally over a ten year period. A ten year timeline is recommended because a one-time annual adjustment could cause negative economic harm by requiring a large accounting modification too quickly. Of course, this course of action is only preferable if the SEC or the U.S. Financial Accounting Standards Board have not acted.

84 | Tax Decoder Business | 85
Employee Stock Ownership Program (ESOP) An Employee Stock Ownership Plan (ESOP) is a defined-contribution plan which invests primarily in the stock of the employer.
Employers contribute cash or stock to an ESOP and an ESOP may also borrow money to purchase additional stock. In addition to being a retirement plan for employees, ESOPs are often used as an exit strategy for owners of small companies, by allowing employee shareholders to gradually buyout the existing owners of the company. However, the provision results in more than $1 billion in revenue loss each year and is sometimes manipulated by large companies – the most infamous example of which is the Enron case.
The first ESOP was created in 1956 by a San Francisco attorney and investment banker for a local newspaper. However, it was not until the 1974 Employee Retirement Income Security Act (ERISA) that Congress began regulating ESOPs, and shortly after, tax incentives were created to encourage the use of ESOPs. ESOPs have continued to grow in popularity, and in 2006 the net value of ESOPs exceeded $600 billion.84
ESOPs were given preferential tax treatment by the 1975 Tax Reduction Act, and several tax reform bills during the 1970s and 1980s modified the tax preferences given to ESOPs. In addition, the Small Business Job Protection Act of 1996 allowed S corporation shareholders to participate in ESOPs, expanding the availability and popularity of ESOPs.85 Today, ESOPs are regulated by the Department of Labor’s (DOL) Employee Benefits Security Administration (EBSA) and maintain several tax advantages.
Employer stock or cash contributions to an ESOP may be deducted as a business expense. Employers may also “deduct dividends paid on stock held by an ESOP if the dividends are paid to plan participants, if the dividends are used to repay a loan that was used to buy the stock, or for dividends paid on stock in a retirement plan.”86 Further, employees are not taxed on employer contributions to an ESOP or the earnings on ESOP funds until they are distributed. The tax treatment of ESOPs provides businesses a “tax-favored method of financing”87 and increases the business’ cash flow.
In closely held S corporations, if the company is at least 30 percent owned by an ESOP, the company in effect does not have to pay taxes on 30 percent of its income provided the income is not paid out to the owners. If an S corporation is 100 percent owned by an ESOP, the company does not have to pay any income taxes, provided the income from the ESOP is not distributed to the owners.
The tax treatment of ESOPs resulted in lost revenue totaling $900 million in FY 2014 and is expected to cost $4.6 billion from FY 2014 through FY 2018.88
Analysis
The Department of Labor has recently taken notice of abuses within ESOPs including “overvalued stock, ill-timed stock purchases, conflicts of interest and outright plan mismanagement.” Over the last year, EBSA and the DOL’s Office of the Solicitor brought “lawsuits seeking nearly
$100 million in repayments to ESOP plans for questionable transactions.”89 According an investment advisor website:
ESOP stock purchases are typically used to free up operating cash, avoid capital gains or to cash out de-parting executives, who would otherwise have big tax bills. That makes it tempting, say officials, for company executives to hire an appraiser who will give firms the price they want for the stock, and supposedly indepen-dent fiduciaries who will green-light the transactions.90
The most notorious example of the abuse and failure of an ESOP was in the case of Enron’s bankruptcy, which resulted in the loss of employees’ pensions held in an ESOP. Many employees were heavily invested in Enron stock through the ESOP and other retirement plans, such as a 401(k), because the company’s stock was doing so well. However, when the company failed, the employees lost not only their job, but their retirement savings as well. CRS warns that “while the Enron case was probably the most publicized instance of employee loss of retirement assets due to holdings of company stock, it is not an isolated case.”91
The tax treatment of ESOPs can create perverse incentives for businesses to create ESOPs. One study,
found that ESOPs adopted prior to the availability of the tax benefits provided by the Tax Reform Act of 1986 experienced improved financial performance on six financial ratios, while the performance of ESOP firms adopted after the passage of the Act declined on each ratio observed.92
The study revealed that firms who adopted an ESOP prior to the availability of tax incentives successfully improved company performance through the alignment of the employee’s financial interest and the company’s financial interest. However, companies that created an ESOP after the availability of the tax benefits “may have likely done so for reasons other than incentive alignment”93 and therefore, did not experience the same financial growth.
ESOPs were created to align employer and employee incentives and to establish retirement savings for employees that may be beneficial for both the employer and employee, but ESOPs created to utilize tax preferences can harm both as well.
The tax treatment of ESOPs may also distort economic activ-ity, work against shareholder interest, and economic efficiency. According to CRS:

DRAFT
86 | Tax Decoder
Firms where employees hold a large fraction of stock are more impervious to hostile takeovers, as employees and managers may otherwise fear loss of pay and jobs in such a circumstance. However, threats of takeovers are also a market mechanism that may keep the principal-agent problem under control and both takeover threats and actual takeovers may lead to a more efficient company. Reducing takeovers may be advantageous for managers and workers but may not be desirable socially.94
ESOPs have also long been considered a method for increasing employee ownership and facilitating greater equality income. However, it has been found that those at the higher end of the pay scale generally benefited more from ESOPs than low-level workers, calling into question the assumption that ESOPs facilitate greater equality of income distribution.
The lack of diversification of ESOP funds also come with significant risks for the employees, whose retirement savings are largely invested in their employer’s stock. “The cost of such a lack of diversification was demonstrated with the failure of Enron and other firms whose employees’ retirement plans were heavily invested in company stock.”95
When companies with ESOPs fail, not only do employees lose their jobs, they often lose their retirement savings.
Options for Reform
President Obama’s FY 2015 budget proposal eliminates the ESOP Dividend Deduction for Large C Corporations.96
The tax reform proposal introduced by House Ways and Means Chairman Camp also closed this loophole.97
Depreciation in the Tax Code98 Sections 167 and 168 of the tax code detail how businesses can deduct the cost of acquiring an asset that loses value over
time. This deduction allows a company to deduct from its taxable income a certain amount of money each year based on the value of that asset and the depreciation rules specified in the tax code. This is part of ensuring companies are not taxed on their expenses, but only on true profits.
Generally, the cost of these capital assets99 is deducted over the course of the useful life of that asset (as determined by the depreciation rules in Sections 167 and 168). This reduces the taxes owed each year by a portion of the amount of the cost of purchasing the asset. Given the unique nature of various assets, ranging from equipment and buildings and planes to intangible assets like copyrights and contracts, Congress has created differing “depreciation schedules” for these classes of assets. These schedules allow different assets to be depreciated over differing lengths of time, some faster than others.
Similar to the business expense deduction, depreciation that more or less reflects the real rate of decline in the economic value of an asset is not considered a tax expenditure. Therefore, it is not considered by the Joint Committee on Taxation to result in an annual revenue loss. It is important that business is taxed only on real profits
and not appropriate business costs. However, depreciation allowances that exceed rates of economic depreciation are considered tax expenditures, as they represent a subsidy for investment in the affected assets, and are often directed to particular industries.
As with other areas of the code, Congress should not pass out special tax breaks to well-connected industries with highly paid lobbyists. It is the role of the market, not the government, to choose winners and losers in the private business sector.
Significant exceptions and preferential treatment exist throughout the code. Congress has enacted a number of special iterations of depreciation which cost hundreds of billions of dollars in lost revenue each year. Some of these provide overly generous tax subsidies by accelerating the depreciation for many as a form of stimulus spending.

86 | Tax Decoder Business | 87
Others have been directed toward a select few industries with effective government relations operations.
The optimal solution to eliminating the distorting effect that the tax code has on capital investment through the deployment of varying depreciation schedules is to move towards immediate expensing. With such a cost recovery policy in place, businesses would be able to write-off the full cost of capital investments against their revenue at the time of investment, thus spurring capital investment, cash flow, productivity and economic growth. Moreover, immediate expensing ameliorates the impact that inflation has on the taxation of long-term capital investments. While this policy does reduce government revenues in the short-run, in the aggregate the same amount of taxes will ultimately be paid. In a static scoring model, this policy will score as a revenue loss due to the time value of money. However, Congress should realistically assess the impact that immediate expensing would have on economic growth when evaluating the merits of cost recovery policy during tax reform.
While moving towards an immediate expensing of capital investments is preferable, in the absence of such a policy Congress should avoid extending or adopting modifications to depreciation schedules that are not widely applicable to all businesses and asset classes. Tinkering with depreciation schedules on an item by item or industry by industry basis allows Uncle Sam to put a thumb on the scale, placing politicians instead of markets at the center of capital allocation.
Accelerated Depreciation
“Accelerated depreciation” allows businesses to depreciate the cost of certain assets faster than the regular depreciation schedules in Sections 167 and 168.
Provisions such as the expensing allowance in Section 179 and the bonus depreciation allowance in Section 168(k) means that returns on investments in different business assets are not taxed at the same effective rate. As a result, some investments receive more favorable tax treatment than others, and the government is effectively choosing winners and losers in the private sector through this tax preference.
Some of these preferential depreciation schedules, such as accelerated depreciation for motor sports race car tracks, are highlighted in various chapters of this report. In his FY 2015 budget proposal, President Obama called for the elimination of a well-known example of this tax break – accelerated depreciation for corporate jets. The code allows these types of planes to be depreciated over five years instead of the standard seven years for commercial planes. Eliminating just this one tax break for owners of corporate jets would increase revenue by an estimated $1.97 billion over five years and $3.8 billion over ten years.100
There is some evidence that the widely used modified
accelerated cost recovery system (MACRS) accelerates the tax depreciation of many types of assets, including computers, agricultural and mining equipment, offshore drilling costs, and theme parks, among others.101 Enacted by Congress in the Tax Reform Act of 1986, MACRS is the system through which tax depreciation is applied to various asset classes, as detailed by IRS guidance.102
Accelerated depreciation is estimated to result in revenue losses of $9.8 billion in FY 2014 and $164.7 billion from FY 2014 through FY 2018. The Joint Committee on Taxation estimated completely repealing accelerated deprecation through MACRS could save $724 billion from 2012 to 2021.103
The Committee for a Responsible Federal Budget estimates “if the deduction were repealed, the revenue from C-corporations could finance a corporate rate cut of 4.3 percentage points over ten years.”104
The Senate’s 2014 extenders legislation, the EXPIRE Act of 2014, provides a number of accelerated depreciation provisions, some of which are highlighted throughout this report, such as special treatment for motorsport speedway tracks and accelerated depreciation for business property on an Indian reservation.
The EXPIRE Act also includes a provision classifying certain race horses as three-year property, instead of the seven years normally applied to young horses, which will cost $23 million in FY 2014 and $342 million from FY 2014 through FY 2018.105
Another EXPIRE Act depreciation provision would allow for 15-year straight line cost recovery for qualified leasehold improvements, qualified restaurant buildings and improvements, and qualified retail improvements, instead of the standard 39 years for buildings, which will cost $62 million in FY 2014 and $2.79 billion from FY 2014 through FY 2018.106 These two provisions are routinely extended by Congress, providing a tax break to particular industries.
The oil and gas industry is often highlighted in discussion of accelerated depreciation. Oil and gas producers have several options to depreciate the costs of constructing and improving wells.107 The cost of these provisions is significant, and is included in the estimates for revenue losses associated with special depreciation preferences. The energy chapter of this report includes an extensive discussion of energy and oil and gas related preferences in the tax code, including depreciation.
Bonus Depreciation
In 2002, Congress created another generous form of accelerated depreciation, known as “bonus depreciation.”
The provision allowed for 30 percent of the acquisition cost of eligible property to be deducted in the first year, and the remaining cost or basis to be written off over the relevant period of time. In 2003, the bonus depreciation allowance was increased to 50 percent of the acquisition cost and

DRAFT
88 | Tax Decoder
extended through the end of 2005. Congress reinstated the 50 percent allowance in 2008, raised it to 100 percent in 2010, and lowered it to 50 percent for qualified assets bought and placed in service in 2013. It expired at the end of that year.
An extension of the 50 percent bonus depreciation was included in the Senate’s 2014 extenders legislation, the EXPIRE Act of 2014. Assuming ongoing extension, the provision is estimated to cost $33.5 billion in FY 2014 and $197 billion from FY 2014 through FY 2018.108
Further, the EXPIRE Act allows companies the option of accelerating their use of any alternative minimum tax credits they have in lieu of claiming bonus depreciation. This would cost an estimated $89 million in FY 2014 and $480 million from FY 2014 through FY 2018.109
Another bonus depreciation provision in tax law, the expensing of research and experimental expenses, allows companies to immediately deduct as a current expense certain research costs for qualified projects. According to the Congressional Research Service:
What makes this treatment both unusual and beneficial to the taxpayer is that such expenditures generally contribute to the development of tangible and intangible assets with useful lives that extend beyond a year.110
This provision will cost $4.7 billion in FY 2014 and $28.9 billion from FY 2014 through FY 2018.111
A number of other immediate expending provisions are provided in law, including those listed below. Several of these provisions are discussed in other chapters throughout this report.
• Expensing of timber-growing costs • Amortization and expensing of reforestation
expenditures • Expensing of soil and water conservation
expenditures • Expensing of the costs of raising dairy and breeding
cattle • Expensing by farmers for fertilizer and soil
conditioner costs • Expensing of magazine circulation expenditures • Expensing of costs to remove architectural and
transportation barriers to the handicapped and elderly
• Amortization of air pollution control facilities • Amortization of business startup costs
Section 179 Expensing
Section 179 expensing is another form of accelerated depreciation. First enacted by Congress in 1958, it allows “expensing” of up to $25,000 of the cost of certain assets, which under normal circumstances would be depreciated over the life of the asset. Expensing refers to the practice of deducting an expense as a current year purchase, as if it were a normal business expense in Section 162.
The amount that a small business can expense has changed over time. In 2008 and 2009, a business could expense up to $250,000. For 2010 through 2013, the limit was increased to $500,000. The increased limits expired at the end of 2013, and the limit was reduced to $25,000.
This provision was estimated to cost $5.7 billion in FY 2011.112 However, the use of the provision was largely superseded by the availability of 100 percent bonus depreciation from late 2010 through 2012. Section 179 expensing in current law is estimated to cost $7 billion in FY 2014 and $17.6 billion from FY 2014 through FY 2018.113
The EXPIRE Act increases Section 179 limits back to 2013 levels, with some additional modifications for certain types of property, which will cost an additional $7.2 billion in FY 2014 and $46.3 billion from FY 2014 through FY 2018.114
The legislation also includes special expensing for mine safety equipment, which will cost $12 million in FY 2014 and $56 million from FY 2014 through FY 2018.115
The EXPIRE Act would also extend special expensing rules for film and television productions and make live theatrical productions newly eligible, costing $126 million in FY 2014 and $838 million from FY 2014 through FY 2018.116
This provision is discussed in more detail in the Economic and Community Development chapter of this report.
However, when bonus depreciation is available, a company can use both expensing allowances for the same sets of property or equipment. As such, in 2013, a company could first take the 179 expensing allowance, and if the company had a remaining basis in the asset, it could then claim a 50 percent bonus depreciation allowance against that amount.
Options for Reform
Ideally, Congress would completely eliminate the corporate income tax and begin again. In such a scenario, Congress could allow for the full and immediate expensing
IDEALLY, CONGRESS WOULD COMPLETELY ELIMINATE THE CORPORATE INCOME TAX AND BEGIN AGAIN. IN SUCH A SCENARIO, CONGRESS COULD ALLOW FOR THE FULL AND IMMEDIATE EXPENSING OF ALL CAPITAL ASSETS AND MOVE THE TAXATION SYSTEM AWAY FROM AN INCOME TAX AND TOWARD A CONSUMPTION-BASED TAX.

88 | Tax Decoder Business | 89
Employment Tax Credits and Exclusions
Some credits and exclusions offered for employment related activities are also claimed by many businesses. Similar to many discretionary programs, the tax code provides tax credits to businesses to hire and retain certain workers or for providing various compensation and employee benefits. Some of these tax preferences may distort how employees are compensated, while others are directed to multi-million dollar corporations based on hiring practices. Yet, studies suggest these incentives have done little to increase employment among the disadvantaged.
In some cases these tax breaks are claimed by wealthy individuals who put millions of dollars into tax-deductible accounts to pay for luxuries such as planes, boats and condominiums, while other employees pay no taxes on lavish perks. There is bipartisan support for eliminating some of these special credits and exclusions, many of which are outlined in this report.
The Work Opportunity Tax Credit (WOTC) and the credit for retaining newly hired workers, for example, were intended to incentivize businesses to hire workers who met certain criteria, or to hire and retain workers during the economic recession. Yet, GAO revealed most of the credits were directed to large companies earning over $1 billion annually.118 Another study concluded these credits provide “no meaningful increase in employment of the disadvantaged” to large companies.119
Numerous similar and overlapping federal programs exist to encourage and increase employment for certain populations. In addition to these credits, the federal government runs 47 job training and employment programs
within nine agencies, often targeted to specific groups of underprivileged individuals—such as disabled individuals, Native Americans, veterans, and ex-offenders. These programs cost taxpayers $18 billion in FY 2009.120
Tax exclusions allow employees to exclude from their taxable income reported to the IRS certain benefits they receive from their employer. While some of these exclusions were enacted because it is difficult to calculate the value of the benefit, others may allow large compensatory benefits to be excluded from taxable income, resulting in significant revenue loss. These create distortions in employee compensation and lead to abuses. For example, the tax code allows retail store employees to exclude the benefits they receive from store discounts from their taxable income.
An appropriate balance must be found between ensuring simplicity in reporting taxable income, and preventing the tax code from favoring certain forms of compensation. Compensation and benefits should be determined by employee demand, rather than tax preference.
of all capital assets and move the taxation system away from an income tax and toward a consumption-based tax. This would treat producers equitably and create the most conducive environment for a free and productive market.
Absent a complete overhaul of the corporate income tax, however, it is inappropriate for Congress to continue to treat varying types of assets and industries differently with regard to depreciation. Doing so would result in tens of billions of dollars in revenue losses each year, without the increased efficiency from a flattened code that a complete overhaul would bring.
Additionally, when undertaking comprehensive tax re-form, lawmakers must avoid playing games with deprecia-tion schedules for the sole purpose of achieving budget neu-
trality in a 10 year window. Congress must be ever mindful of the impact that tax reform will have on the national debt via its impact on tax revenues. But a sustainable tax code with the aims of robust economic growth must be made with long-term vision that does not involve squeezing the private sector in the 9th and 10th years of a budget window so that politicians can tout budget neutrality.
Several recent corporate tax reform proposals, including those released by House Ways and Means Chairman Dave Camp, Senators Ron Wyden and Dan Coats, and former Senate Finance Chairman Max Baucus included significant changes scaling back, and in some cases eliminating, accelerated depreciation and other select depreciation preferences.117

DRAFT
90 | Tax Decoder
Work Opportunity Tax Credit The Work Opportunity Tax Credit (WOTC) is a non-refundable tax credit that subsidizes businesses to hire individuals
from targeted populations. These generally include families receiving benefits through the Temporary Assistance for Needy Families (TANF) program, members of families receiving food stamps, ex-felons, Supplemental Security Income (SSI) recipients, veterans, summer youth, and individuals located in an empowerment zone or similar communities.
The credit is intended to help provide jobs for these populations, but its effectiveness has long been in question. Further, the direct financial subsidy results in tax credits for major corporations.
The Targeted Jobs Tax Credit (TJTC) was the federal tax credit predecessor to the WOTC and was available from 1978 to 1994. It was largely considered a failed policy because of the poor ad-ministration of the credit, and a belief that “employers who used it would have hired the same people even without the tax cred-it.”121 Nevertheless, only two years after the TJTC credit expired, Congress instituted the slightly modified Work Opportunity Tax Credit. Created in 1996, the credit was authorized for only one year, but has been renewed and expanded several times.
Congress hoped making minor adjustments and changing the name of the credit would increase its effectiveness. However, the issues with WOTC largely resemble the issues plaguing the TJTC, in part because the changes that have been made to WOTC relaxed its rules, expanded the program ,and made it more closely resemble its failed predecessor.
The Congressional Research Service explains the credit it not necessarily designed to create new jobs, but instead to redistribute the existing pool of employment opportunities.
Basically, the WOTC is a hiring subsidy designed to encourage employers to hire more disadvantaged individuals than they otherwise would, perhaps because of the cost of training them and their relatively low productivity. The credit is not intended to create new jobs or promote recovery in labor markets weakened by an economic downturn.122
CRS also questions the program’s effectiveness stating,
Still, it is unclear how effective the credit has been overall. Nor is it clear if the credit is more cost-effective than other policy options, such as federal subsidies to job training and disadvantaged persons.123
Numerous studies, including a report by the Government
Accountability Office (GAO), have highlighted problems with this credit, going so far as to suggest it not effective at incentiv-izing the hiring of individuals within targeted groups. Neverthe-less, Congress continually extends the credit and has expanded the program to include certain individuals as a part of emergency disaster responses. For example, following the Hurricane Katrina disasters, workers in the core disaster area were added to the tar-geted individuals covered by WOTC. Congress also added “New York Liberty Zone business employees” to the eligible individu-als for 2002 and 2003. Businesses with 200 or fewer employees, “located in the vicinity of the World Trade Center” or businesses that moved due to September 11, 2001, to another area of New York City were eligible to claim the credit. The provision allowed eligible companies to claim the credit for both existing and newly hired employees, while WOTC is only allowed to be claimed for newly hired workers within other targeted groups.124
Congress most recently allowed the authorization for WOTC to expire for all targeted groups, except veterans, at the end of 2011. However, Congress later retroactively authorized the targeted groups that had been allowed to expire.125 According to the Department of the Treasury’s explanation of President Obama’s Fiscal Year 2014 Revenue Proposals, extension of the credit
has often been retroactive or near the expiration date. This pattern leads to uncertainty for employers regarding the availability of the credit and may limit the incentive the credits provide for employers to employ individuals from the targeted groups.126
Specifically, one of the longest gaps in authorization was a 10-month lapse during the 108th Congress.127
The credit will result in $900 million in lost revenue in FY 2014 and will cost at least $3 billion from FY 2014 through FY 2018.128 However, this assumes the credit will not be reauthorized, which is highly unlikely, given previous extensions. Assuming it is not allowed to expire, the credit will likely cost closer to $4 billion over the next five years.
Employment Tax Credits & Exclusions (in millions) FY 2014 FY 2014 - FY 2018Work Opportunity Tax Credit $900 $3,000
Exclusion of Employee Awards $300 $1,600
Exclusion of Employee Meals and Lodging $2,000 $10,700
Exclusion of Miscellaneous Fringe Benefits $7,300 $38,300
Total $10,500 $53,600

90 | Tax Decoder Business | 91
Breakdown of Eligibility
Currently, the credits are claimed by for-profit businesses that hire individuals meeting the following criteria:
A veteran who is: • A member of a family that received SNAP benefits
(food stamps) for at least a 3-month period during the 15-month period ending on the hiring date.
• Entitled to compensation for a service-connected disability:
- Hired within 1 year of discharge or release from active duty
- Unemployed at least 6 months in the year ending on the hiring date
• Unemployed: - At least 4 weeks in the year ending on the hiring
date - At least 6 months in the year ending on the hiring
date
In order to be considered a veteran for WOTC purposes, the individual must meet the following criteria:
• Have served on active duty (not including training) in the U.S. Armed Forces for more than 180 days or have been discharged or released from active duty for a service-connected disability
• Not have a period of active duty (not including training) of more than 90 days that ended during the 60-day period ending on the hiring date
Long-term Temporary Assistance for Needy Families (TANF) Recipient
A member of a family that meets one of the following circumstances:
• Received TANF benefits for at least 18 consecutive months ending on the hiring date.
• Received TANF benefits for at least 18 consecutive or non-consecutive months after August 5, 1997, and has a hiring date that is not more than 2 years after the end of the earliest 18-month period after August 5, 1997.
• Stopped being eligible for TANF payments during the past 2 years because a Federal or state law limited the maximum time those payments could be made.
Short-term TANF Recipient: A member of a family that received TANF benefits for any 9-month period during the 18-month period ending on the hiring date.
SNAP (food stamp) Recipient: An 18-39 year old member of a family that received Supplemental Nutrition Assistance Program (SNAP) benefits for the 6 months ending on the hiring date or received SNAP benefits for at least 3 of the 5 months ending on the hiring date.
Designated Community Resident: An 18-39 year old who lives within one of the federally designated Rural Renewal Counties or Empowerment Zones.
Vocational Rehabilitation Referral: An individual with a disability who completed or is completing rehabilitative services from a state-certified agency, an Employment Network under the Ticket to Work program, or the U.S. Department of Veteran Affairs.
Ex-felon: An individual who has been convicted of a felony and has a hiring date that is not more than 1 year after the conviction or release from prison.
Supplemental Security Income (SSI) recipient: A recipient of SSI benefits for any month ending during the past 60-day period ending on the hire date.
Summer Youth Employee: A 16 or 17 year-old youth who works for the employer between May 1 and September 15 of any given year and lives in an Empowerment Zone.
The following table shows the percentage of credits claimed for each group in FY 2008:129
Additional rules regarding the size of the credit depend on the targeted group the hired individual is a part of, as well as how many hours the employee worked. In addition, the amount an employer can claim “is capped at 90 percent of its regular income tax or alternative minimum tax liability; any unused credit can be carried back one year or forward up to 20 years.”130
How the Credit is Administered
The tax credit is administered by the IRS, but the Department of Labor and state agencies also play a vital role in certifying which companies are eligible to claim the credit.
Credits Claimed for Each Targeted Group
18-24 year olds in Families receiving SNAP assistance
61%
TANF Receiving 14%
Designated Community Residents 11%
Ex-felons 7%
SSI Recipients 4%
Vocational Rehabilitation Referrals 3%
Veterans 2%

DRAFT
92 | Tax Decoder
The IRS processes and verifies claims for WOTC, while the U.S. Department of Labor’s manages the certification process. The Department of Labor also “awards grants to states for administering the eligibility determination and certification provisions of the program. State agencies verify and report to the DOL on state certification activities.”131
Participating agencies (e.g. job corps centers, local welfare agencies, food stamp program agencies, and VA offices) also assist state workforce agencies in certifying that newly hired workers in their states qualify for the credit.132
ETA is responsible for providing oversight of the WOTC program. The IRS is also responsible for ensuring the tax credit claimed matches the amount of hours the employee worked, but the Urban-Brookings Tax Policy Institute noted that “firms are not required to submit documentation with the tax form” regarding the hours the employee worked.133
According to a 2005 Urban-Brookings report on WOTC and the Welfare to Work credit (which was rolled into WOTC in 2007 because the programs were so similar), “about $20 million is spent on administration of the programs each year.”134 Eliminating this credit, and eliminating the requirement for these participating agencies to certify qualified workers, would save this funding from the discretionary budget, as well as the foregone tax revenue.
Failed Policy
WOTC is simply a rehash of the failed Targeted Jobs Tax Credit (TJTC), which existed from 1978 through 1994.135
The TJTC failed in part because “it subsidized the hiring of targeted individuals who would have been hired in any event,”136 and this argument has also been made of WOTC. In addition, the administration of TJTC was overly burdensome, dis-incentivizing participation in the program. When Congress created WOTC, it originally enacted several provisions attempting to address the issues found within TJTC. However, changes to the program since its creation have made it “more closely resemble the TJTC (e.g., the retention period was reduced from 400 hours or 180 days to 120 hours).”137
Given the complexity of the program’s administration and the specificity of targeted individuals, it is not surprising the Urban-Brookings Tax Policy center says, “The evidence suggests that the programs are vastly underutilized and have not had a meaningful effect on employment rates among the
disadvantaged.”138 In fact, studies have indicated the credit was only claimed for one in five new hires in the food stamp youth group, and one-third of new hires in the TANF group.139
In addition, relatively few companies claim a majority of the credits. GAO’s 2001 study of business participants in the states of California and Texas revealed only “3 percent of participating employers accounted for about 83 percent of all hires of WOTC-certified employees.”140 WOTC credits are mostly claimed by businesses in relatively few industries. According to GAO, 81 percent of the businesses claiming the credit were “hotel[s], motel[s], or other personal service businesses,” as well as retail trade businesses.141
GAO’s work also found “most” companies claiming the credit had gross annual revenue of more than $1 billion.142
Large employers earned most of the credits and hired most of the employees under the Work Opportunity Tax Credit program. In 1997, 4,465 corporations earned a total of $135 million in tax credits.143
Meanwhile, most of these were “large companies” with over $1 billion in revenue.144 These large firms benefit from the assistance of “employer representatives” who “help firms screen job applicants for credit eligibility and complete required paperwork”145 in order to help the firm secure WOTC certifications as well as lobby for the extension of the credit. Meanwhile, small businesses are left to navigate the complexity of the program alone, and often choose not to participate. According to CRS, state WOTC coordinators have recommended reducing and simplifying the paperwork for employers so that more small businesses would be inclined to participate.146
Despite the long history of the Work Opportunity Tax Credit, as well as similar wage subsidies, WOTC has had little impact on whether or not employers hire individuals within targeted populations. Responses to a GAO study “found that less than 10 percent of firms reported any change or modification in their hiring standards” due to the availability of the credit, and a Department of Labor study revealed “little to no evidence of firms allowing subsidy eligibility to influence their hiring decisions,” leading an Urban-Brookings study to conclude “no meaningful increase in employment of the disadvantaged can be attributed to the programs.”147
These results are a clear indication that the credits have not incentivized a meaningful increase in hiring among targeted groups, and that the credit is simply a bonus for employers who would have hired the individual anyway.
Recommendation
The credit for all targeted groups should remain expired, and Congress should not extend or retroactively extend the credit for any targeted groups beyond the end of 2013.
GAO’S WORK ALSO FOUND MOST COMPANIES CLAIMING THE CREDIT HAD GROSS ANNUAL REVENUE OF MORE THAN $1 BILLION.

92 | Tax Decoder Business | 93
Exclusion of Employee Awards Most employee fringe benefits such as gift cards, cash, or
cash equivalent are included in taxable income when given to an employee. However, some employee awards, such as a gold watch or golf clubs that do not exceed $1,600 may be excluded from taxable income.
This exclusion applies to tangible property awards given to an employee for qualified length of service or safety achievements. An employee may exclude up to $1,600 per year in awards.
Qualified employee achievement plans cannot discriminate in favor of highly paid individuals and the “average cost per recipient of all awards granted under all established plans for an employer cannot exceed $400.”148
Qualified length of service awards cannot be given until an employee has been employed by the company for at least five years, and the employee cannot be awarded more than once every five years.
In order for safety achievement awards to qualify for the exclusion, the award cannot have been awarded to more than ten percent in that year, and the awards “cannot be awarded to a manager, administrator, clerical employee, or other professional employee.”149
This employee fringe benefit exclusion was adopted in the Tax Reform Act of 1986, prior to which most awards were taxable, with some exceptions.150
Cost and Recommendation
This exclusion accounts for $300 million in lost rev-enue for the federal govern-ment each year, and from FY 2014 to FY 2018 will cost $1.6 billion.151 The Wyden-Coats Bipartisan Tax Fairness & Simplification Act of 2011 eliminates this exclusion.152 This exclusion should be eliminated.
The exclusion for employee awards, such as the classic
gold watch, costs $1.6 billion over five years.
Exclusion of Employee Meals and LodgingThis exclusion allows employees to exclude from
their taxable income the “fair market value of meals furnished by employers if the meals are furnished on the employer’s business premises and for the convenience of the employer.”153 Likewise, lodging is excluded if provided to an employee for the convenience of the employer or as a condition of employment. These types of arrangements are common for live-in housekeepers, apartment resident managers, or nannies.
The provision is described in detail by the Joint Committee on Taxation,
The fair market value of meals provided to an employee at a subsidized eating facility operated by the employer is also excluded from income, if the facility is located on or near the employer’s business, and if
revenue from the facility equals or exceeds operating costs. In the case of highly compensated employees, certain nondiscrimination requirements are met to obtain this second exclusion.154
The record-keeping difficulties involved in identifying which employees ate what meals on particular days, as well as the values and costs for each such meal, led the Congress to conclude that an exclusion should be provided for subsidized eating facilities as defined in section 132(e)(2).155
This tax exclusion was included for administrative reasons (because of the difficulty of determining the fair market value of housing and meals) and not to subsidize or encourage certain behavior.156 Taxpayers will lose $2 billion in FY 2014 from this provisions allowing corporate America to dine for free. Over the next five years, that cost will rise to $10.7 billion.157

DRAFT
94 | Tax Decoder
Exclusion of Miscellaneous Fringe Benefits This provision of the tax code allows individuals to
exclude from their taxable income “miscellaneous fringe benefits provided by employers, including services provided at no additional cost, employee discounts, working condition fringes, [and] de minimis fringes.”158 Although miscellaneous fringe benefits are not taxable to the employee, employers can still deduct many of these fringe benefits as a business deduction.
For example, retail store employees “may receive discounts on purchases of store merchandise”159 and they do not have to pay income taxes on the amount of the discount.
De minimis fringe benefits, which are not taxable, include things such as “occasional snacks, coffee, doughnuts, holiday gifts, occasional meal money or transportation expense for working overtime, flowers, fruit, books, [and] personal use of a cell phone provided by an employer primarily for business purposes.”160 The Internal Revenue Service indicates that one standard of de minimis fringe benefits is that accounting for miscellaneous fringe benefits would be “unreasonable or impractical.”161
This specific exclusion was created in 1984, but “had been long established and generally had been treated by employers, employees, and the Internal Revenue Service as not giving rise to taxable income.”162 The Congressional Research Service states that,
in enacting these provisions, the Congress also wanted to establish limits on the use of tax-free fringe benefits.
Prior to enactment of the provisions, the Treasury Department had been under a congressionally imposed moratorium on issuance of regulations defining the treatment of these fringes. There was a concern that without clear boundaries on use of these fringe benefits, new approaches could emerge that would further erode the tax base and increase inequities among employees in different businesses and industries.163
Cost and Recommendation
Despite the assumption these freebies cost little, this provision in the tax code results in lost revenue of billions each year. Estimates suggest it will cost $7.3 billion in FY 2014 and $38.3 billion from FY 2014 through FY 2018.164
Miscellaneous fringe benefits should be limited to only be non-taxable for employees, not employees’ spouses or dependents. In addition, employers should not be able to deduct the expense. If a business can deduct the expense, then clearly the miscellaneous fringe benefit is not too small for accounting and income tax purposes. If a business deducts the expense on their taxable income, the benefit should be included in the employee’s taxable income.
DESPITE THE ASSUMPTION THESE FREEBIES COST LITTLE, THIS PROVISION IN THE TAX CODE RESULTS IN LOST REVENUE OF BILLIONS OF DOLLARS EACH YEAR.

94 | Tax Decoder Business | 95
The Research and Development Tax Credit Custom furniture makers, Barbie’s parent company Mattel, and the developers of hair salon products like mousse and
conditioner have all benefited from the federal research and development (R&D) tax credit. The tax credit for increasing research expenditures, more commonly called the R&D tax credit, was designed to encourage companies to increase their investments in research and development beyond what they would normally invest without tax incentives.165
The credit’s price tag of $6.8 billion in fiscal year 2013 made it one of the tax code’s most expensive corporate tax expenditures.166 Many of these companies are in little need of taxpayers’ generosity, yet according to the IRS, over 80 percent of
the R&D credit in 2010 went to companies with $250 million or more in annual sales.167 Meanwhile, the top R&D tax credit recipients in 2011 were Google, Intel, Boeing and Apple.168
The credit expired at the end of 2013,169 but most in Washington assume Congress will extend it again. In fact, the Treasury Department released new regulations on June 2, 2014, expanding the availability of the credit on amended returns.170
The specific activities that qualify for the credit have been hotly contested since its creation more than 25 years ago. Despite efforts by Congress and the IRS to limit the use of the credit, the credit today subsidizes numerous activities that strain the common notion of “research.” Many of these activities are nothing more than ordinary development work for new product lines, as in the case of Mattel’s products like Barbies or Hot Wheels, the animation work of film studios, or food manufacturers’ recipes and package designs. This “research” does little to meaningfully expand the industry’s knowledge base.
Studies examining the credit’s effectiveness at stimulating additional research have been largely inconclusive. Some experts, including those at GAO, contend the credit creates “windfalls” for some businesses who avoid paying millions of dollars in taxes for research they would have done anyway. Consider the top four beneficiaries from the credit in 2011: Intel, Apple, Boeing, and Google.171 Without the credit, would those companies cease to innovate? Innovation is the key to the competitive advantage of these businesses and central to their leadership within their respective industries.
Because the types of research and experimentation supported by the credit are not coordinated or reviewed, it is likely the subsidized projects often duplicate each other and other federally-funded research projects. For example, CRS noted as far back as 2001 that “caution is needed to avoid unproductive duplication” in the area of genomics research, since private industry has substantial incentive to invest in this area on its own.172 NIH continues to provide funding in this area—it spent $2.47 billion in FY 2013 on human genome research.173 This spending could duplicate or crowd out similar efforts in private industry.174
The legal expenses generated by the credit are also noteworthy. Because the credit relies on nuanced, subjective definitions, the IRS has frequently been put in the position of challenging businesses’ use of the tax credit. Those challenges often lead to litigation, generating significant costs for businesses and taxpayers alike. Fedex, Bayer AG, and Lockheed Martin have each been in litigation battles with the agency involving millions of dollars’ worth of R&D credits.
History & General Background
Congress created the tax credit in 1981 to boost innovation by U.S. businesses, which at the time were rapidly losing ground to foreign competitors. At the time, some lawmakers and experts believed American businesses did not see the value in innovation and would “underinvest” in research and technological development, unless given a generous government subsidy to do otherwise.175 Further, the credit was intended to provide assistance to startup companies and encourage research in areas that might otherwise not be explored.
The top four R&D tax credit recipients in 2011. Over 80% of the credit went to companies with $250 million or more in annual sales in 2010.
Research and Development Tax Credit (in millions) FY 2014 FY 2014 - FY 2018Total $2,052 $22,381

DRAFT
96 | Tax Decoder
The non-refundable credit is found in section 41 of the tax code and consists of four distinct components:176, 177
• an incremental regular credit; • an alternative simplified incremental credit; • a credit for contract university basic research; and • a credit for contract energy research. According to the latest tax expenditure compendium
compiled biannually by the Congressional Research Service (CRS), if a company qualifies for each of the four components, it may either claim the first or the second credit (but not both), and each of the other credits. In other words, a company can claim up to three of the four credits. Each credit is structured slightly differently and provides companies with varying federal subsidies based on a percent of their research expenditures.
The incremental regular credit is a 20 percent benefit for a company based on qualified investments made above their “base” amount. The formula used to determine the base amount for the regular credit is based on the company’s value in the early 1980s–well before many companies even existed. A different formula is used for “startup” companies that began after this period.
The outdated formula leads to major inequities between different companies. The GAO estimated in 2009 that “due to shortcomings in the computation of base spending, the research tax credit has provided some taxpayers with more than a 10 percent reduction in the cost of additional research, while providing other research-performing taxpayers with a disincentive to increase their research in the current year.”178
The alternative simplified credit, added in 2006, may be claimed in lieu of the incremental regular credit. This credit is equal to 14 percent of the amount spent on research in excess of a base amount. This base amount is equal to 50 percent of the business’ average research costs over the past three years.179
Contract university basic research, which is funded by for-profit corporations, but conducted by nonprofit groups like universities and scientific research organizations, is also equal to 20 percent of investments made above their qualified base amount. Once again, this formula is significantly out of date and is based on figures from the early 1980s.180
Finally, companies may also claim a 20 percent credit for payments made for research contracts to energy research entities. The research must be related to the company’s business endeavors; however, the claiming company does not have to prove to the IRS that the entity being paid is actually conducting qualified research.181
Businesses have been able to fully expense research costs under Section 174 since 1954. The Section 174 deduction is
generally simpler and easier to qualify for than the credit. The credit is more valuable than the deduction, however, since it allows a dollar-for-dollar reduction in tax liability. Today, businesses can claim the Section 174 deduction for certain activities that do not qualify for the credit. If a business claims the credit for research expenses, however, it may not claim the deduction for the same expenses.182
Like many provisions of the tax code, the R&D tax credit was originally temporary.183 Congress has never made the credit permanent, choosing instead to extend it 15 times, most recently by the American Taxpayer Relief Act of 2012, which extended it through 2013.184 When the tax credit periodically expires, Congress often makes the renewal retroactive when it gets around to extending the credit.185
Over the past 30 years, presidents have alternately tightened and loosened the rules around the credit. Under President Obama, the Treasury Department is broadening the rules to allow companies to claim the credit for the cost of prototypes even if they are able to sell them, a change expected to cost several hundred million dollars a year.186
Cost & Current Status
Companies claimed $104 billion in R&D tax credits from 1990 to 2010, according to the IRS.187 In FY 2013, the credit cost the government $8.43 billion.188
The cost of the credit has risen substantially since its inception. In conference reports accompanying the 1981 act, legislators estimated the cost of the credit would rise from $329 million in 1982 to $724 million in 1986.189 The cost of the expenditure has certainly not leveled off since then. In 2013 dollars, $724 million would be about $1.5 billion,190 but the actual cost of the expenditure in 2013 was $8.43 billion, more than five times that amount.191
Extension of the provision was included in the Senate’s 2014 extenders legislation, the EXPIRE Act of 2014. The cred-it is estimated to cost $2 billion in 2014 and $22.4 billion over five years.192
A Boon for Big Business
The vast majority of R&D tax credit subsidies are directed to very large corporations with revenues in the hundreds of millions of dollars. According to IRS data, over 80 percent of the R&D credit in 2010 went to companies
THE TOP FOUR R&D TAX CREDIT RECIPIENTS IN 2011 WERE INTEL, APPLE, GOOGLE, AND BOEING. OVER 80% OF THE CREDIT WENT TO COMPANIES WITH $250 MILLION OR MORE IN ANNUAL SALES IN 2010.

96 | Tax Decoder Business | 97
with $250 million or more in annual sales.193 A GAO study, meanwhile, found over half of the credit went to companies with over $1 billion in sales in 2005.194 This suggests the credit benefits companies that can already afford large R&D budgets without taxpayer assistance.
The private sector suggests an even higher percentage of the credit is directed to large corporations. “Currently big business is netting 93 percent of all R&D tax credit dollars, even though small and mid-size businesses represent 98 percent of the nation’s businesses,” writes Plante & Moran, a tax consulting firm that targets manufacturing companies, advertising its ability to help them cash in on the R&D credit for small manufacturing. The company boasts,
“We can help reduce your current year effective tax rate or uncover cash refunds from previously filed income tax returns and get the most out of your research and development activities. That means the IRS sends you back cash — often lots of it.”195
What Counts as Research & Development?
One of the greatest areas of contention surrounding the R&D tax credit is what, exactly, counts as research. Initially, most research activities that qualified for the Section 174 deduction could also qualify for the credit.196 This quickly became a problem. As Robert McIntyre of Citizens for Tax Justice wrote, “Soon, horror stories emerged about tax credits being successfully claimed for such scientific breakthroughs as McNuggets, Gillette’s Lemon-Lime shaving cream, and new fashions in clothing.”197
While it may be permissible for companies to deduct such research as business expenses, using the more lucrative credit is more problematic. The credit was intended to stimulate innovation, not ordinary product development. Congress first tackled this problem in the Tax Reform Act of 1986, which required qualifying R&D to be experimental, focused on discovering technological information, and used to improve specific business components.
The IRS took many years to issue guidance under the new statute, first offering proposed regulations in 1998. Controversy and complaints from the business community delayed the implementation of final regulations until 2003, seventeen years after passage of the statute.198
One of the main reasons for the drawn-out controversy over the credit from 1998 to 2003 was the IRS’s proposed regulation that qualifying research be intended to discover “knowledge that exceeds, expands, or refines the common knowledge of skilled professionals in the particular field of technology or science.”199 In other words, the language would have required research to be aimed at contributing something
new to the field. This regulation could have been helpful in precluding mere product development from being counted as research. For example, the garments manufacturer that claimed the credit for designing a new uniform, discussed below, may have been conducting research, but it is unlikely that it developed any new garment technologies for the uniform; more likely, it was simply experimenting with existing technologies to develop a product that met its requirements.
Although potentially helpful, the IRS proposal was criti-cized as too subjective and unworkable, and was eventually dropped in the 2003 regulations.200 This controversy illus-trates the difficulty of legislatively distinguishing product de-velopment from the type of research that truly is advancing new products .
Regulations that would give the IRS the ability to make this distinction could give the agency too much discretion, making tax compliance unpredictable. More objective regulations, on the other hand, could allow a broad range of activities to qualify that do not constitute meaningful research. The latter is the state of the R&D credit today—product development for toys, furniture, hair care products, and more is being claimed as research, at significant expense to the public.
Under the current regulations, qualifying research must be aimed at evaluating ways to improve a business compo-nent, such as a product, process, or formula. The final solution or design should be uncertain at the outset, and the compa-ny should use an experimental process to eliminate the un-certainty. The experimentation should use methods such as modeling, simulation, or systematic trial and error, and rely on principles of the physical or biological sciences, engineering, or computer science.
At least 80 percent of the research activities must be for a qualified purpose, including the development of new or improved function, performance, reliability or quality of a component. Non-qualified purposes include style, taste, cosmetic, or seasonal design factors—nevertheless, up to 20 percent of the research activities could focus on factors like these. Research will automatically qualify for the credit if the resulting information qualifies for a U.S. patent.201, 202
Several specific activities do not qualify. These include activities conducted after the business component begins commercial production; adapting an existing component to a particular customer’s needs; studying an existing component in order to mimic it; management and marketing research; routine data collection; research conducted outside of the United States; any research already receiving funding through a grant or contract from a government or
THE CREDIT BENEFITS COMPANIES THAT CAN ALREADY AFFORD LARGE R&D
BUDGETS WITHOUT TAXPAYER ASSISTANCE.

DRAFT
98 | Tax Decoder
other entity; and research in the social sciences, arts, and humanities. The statute also specifically disqualifies research on software for internal company use, but this area remains contentious, with no final regulations currently published.203 In 2009, FedEx won a legal case against the United States over $11.6 million in tax credits it had claimed for developing a software program for its own internal use.204
The IRS and the business community continue to battle over the meaning of qualifying R&D, costing both the federal government and the business substantial sums in litigation.205
A sampling of various companies that have claimed the credit makes clear it is still used for numerous purposes that do not constitute truly innovative research. “Are you surprised to hear that barbie [sic] qualifies for R&D tax Credit?” the tax firm AlliantGroup asks in advertising tax credit services.206 The group, which dubs itself the “nation’s premier provider of specialty tax services,”207 does not elaborate, but it is likely referring to a Wall Street Journal report that estimated the toy maker Mattel claimed $4 million in R&D credits after spending $195 million on research.208
While the report does not provide details on the expenses Mattel claimed, it is safe to assume the company did not spend all $195 million pushing the frontiers of science and technology. As AlliantGroup explains, “if a company has simply invested time, money, and resources toward the advancement and improvement of its products and processes, it may qualify.”209
Mattel was likely simply doing what all manufacturers do—investing time and money into the development of new products, in this case, the latest innovation in product lines like Barbie, Hot Wheels, or Masters of the Universe.210
The research would qualify as long as the final design of the toy was uncertain at the outset, and the company used an experimental process based in science or engineering to decide on the design. The research would also have to be primarily aimed at improving function, performance, or quality, rather than style or cosmetic factors.211, 212 So Mattel might be able to claim the credit for the research to engineer Batman’s “custom chopper that transforms into a massive saw weapon for cutting criminals down to size,”213 but unfortunately, the fashion design work that went into the My Fab Fashion Barbie’s “cute and casual top” and “totally fabulous dress” probably would not qualify.214
Tax firms like AlliantGroup lament that more companies like Mattel are not claiming the credit. “You do not have to be engaged in pure science or similar research to be conducting qualified activities as defined by the Internal Revenue Code,”
Mattel, Inc., maker of Barbie, is estimated to have claimed $4 million in R&D credits.
The R&D tax credit is being used by many companies for product development, such a salon hair products, and not true experimental research.

98 | Tax Decoder Business | 99
the group stresses.215
These firms seem to have been successful in recruiting a wide range of companies to claim R&D credits. Examples abound of companies that profit substantially from the credit, yet appear to be more focused on developing product lines rather than making real contributions to the fields of science and technology.
A furniture maker obtained $200,000 in credits,216
a corrugated packaging maker claimed $871,000, an “architecture, landscape planning, & interior design” company obtained $521,000, and a cabinet manufacturer claimed $257,000.217
A garment maker designed a uniform to “meet certain product characteristics such as breathability, imperviousness, chemical resistance, and other physical properties,” gaining $266,322 in credits, and a personal care products company claimed $121,359 to develop “various hair products which included permanent wave preparations, relaxers, texturizers, colorants, developers, color removers, and approximately 100 different formulations of powdered hair bleach.”218
According to the accounting firm Deloitte, numerous activities in the entertainment and media industry could be eligible for the R&D credit, including visual effects, animation, computer gaming, and web-based systems.219 Baker Tilly also lists several eligible activities for food manufacturers, including “Recipe blending and formulation;” “Formulating ingredients to achieve pre-determined sensory requirements and specifications such as: flavor, smell, texture, or nutritional requirements;” and “Package design for functional (versus artistic) purposes such as: shelf life, ergonomics, bacterial prevention, or manufacturing compatibility.”220
In some cases, these companies might be making contributions to their fields. For the most part, however, it seems they are simply developing their product lines. Although legal within the current regulatory framework, these activities do little to advance industry knowledge.
Does the R&D Credit Actually Stimulate R&D?
The federal revenue cost of the research tax credit has reached $8.43 billion.221 How much R&D has resulted from this substantial investment? In other words, how much R&D have companies performed that they would not have performed in absence of the credit?
The research varies on this question. Some studies suggest that over the long term, each dollar in tax savings results in as much as two dollars in extra research spending. Other studies, however, suggest that each dollar in tax savings triggers less than a dollar in research spending.222 This means the federal government could be losing more in tax revenue than corpo-
rations are spending in additional research. The Joint Commit-tee on Taxation wrote in 2003 that the general consensus is that the ratio is less than a dollar of research for every dollar in tax savings—and potentially less than 50 cents on the dollar.
A 2014 Congressional Research Services report works under the assumption the return is between 40 cents and 80 cents on the dollar. “The credit delivered, at most, a modest stimulus to domestic business R&D investment from 2000 to 2010,” notes CRS.223 In 2010, for example, the credit cost $8.5 billion, but may have encouraged only $3.4 to $6.8 billion in additional investment.224 If this is the case, the federal government could steer significantly more funding to R&D simply by directly spending $8.5 billion on R&D.
A 2011 GAO report estimated that only a small minority of the research subsidized through the credit was new research,
Some taxpayers earned credits on as much as 50 percent of their total research spending, even though the most favorable empirical estimates of the credit’s simulative effects suggest that less than 15 percent of that spending was actually new spending that they would not have done in the absence of the credit.225
Does the R&D Tax Credit Encourage New Research?
The R&D credit is intended to encourage businesses to increase their spending on research. In practice, however, many businesses and tax professionals businesses appear to view the credit as a reward for existing activities. Numer-ous tax firms and consultants exhort businesses to take ad-vantage of the credit, but few mention the credit is intend-ed to incentivize research increases.
More often, these firms chide businesses for failing to realize that the activities they are already doing qualify for a tax break. AlliantGroup takes pains to emphasize this point: “Oftentimes, the normal day-to-day activities which company personnel conduct may qualify for the R&D credit.”226
A consulting firm, Wipfli, similarly observes,
Normally, when companies think of research and development they are focused on the development of new, cutting-edge products or design standards for their industry. While these highly technical activities generally qualify for the research credit, many of the day-to-day activities of companies may qualify as well.227
The firm helped one manufacturer of conveyor systems identify “several day-to-day activities that the company wasn’t aware could qualify for the research credit.”228
The National Tooling and Manufacturing Association (NTMA) represents businesses that manufacture precision custom parts.229 Because these manufacturers specialize in unique, custom projects, there is likely to be a degree
DRAFT
100 | Tax Decoder
of experimentation in each project, making the tax credit particularly lucrative in this line of business. The association writes that customer manufacturers don’t realize that,
much of what takes place on a day-to-day basis in the “Job Shop/Contract Manufacturing environment” may qualify for the R&D Tax Credit, and may be causing these companies to leave substantial money on the table.
Tax Point Advisors, which dub themselves “the R&D Tax Credit Experts,” actually scolds businesses for the “misconception” that they need to increase their year-to-year research to qualify. Although true in some cases, the website misleadingly claims that “the amount of research done is not in the qualifications.”230
These firms’ language certainly does not convey that the credit is intended to motivate companies to increase their research budgets. Instead, the credit is viewed as another way to use existing activities to lower their tax bill.
An Unnecessary Incentive
In 2011, the top beneficiaries of the credit were Intel ($178 million), Apple ($167 million), Boeing ($146 million), and Google ($140 million).231 Many of these companies rely on innovation for their competitive advantage. It is difficult to imagine Apple remaining competitive if it did not continually introduce new, improved iPhones and other devices, or to see a path to profitability for Intel if it chose to make the same processors year after year. In fact, the GAO found that much of the credit corporations received was “a windfall … earned for spending they would have done anyway, instead of being used to support potentially beneficial new research.”232
The argument in favor of the R&D credit is based on the assumption that American businesses do not grasp the importance of R&D investment and therefore won’t invest adequately in R&D without a federal subsidy. Perhaps this was true when the R&D tax credit provision was created in 1980. In fact, this may still be the case with smaller, start-up companies, who are unable to invest in research to the extent of larger companies, without some support. However, the pace of technological development has made it nearly impossible for a company in most industries to survive without constant and rapid innovation. In fact, the United States’ most successful, profitable companies—like Google, Apple, and Intel—have built their corporate identities around being innovative.233
“No one with a brain makes an R&D decision based on tax credits,” said a professor of Chemistry at Purdue University in his essay Who Needs R&D Tax Credits? “We make those decisions to try for a competitive advantage.”234
May Duplicate Other Federal R&D Spending
The R&D tax credit may not be taken for work financed by a federal grant. However, there is no mechanism to ensure research for which the credit is claimed does not duplicate similar research being done by another company being paid with a federal grant. Moreover, there is no way to prevent duplication of research being performed by another company that is also claiming the credit.235 The federal government, therefore, could pay for the same research more than once.
Research subsidized through the R&D credit might also be conducted by the federal government itself. The federal government, for example, spends considerable sums on health research. According to the GAO,
The majority of federal funding for health research and related activities is spent by the National Institutes of Health (NIH), within the Department of Health and Human Services (HHS), the Department of Defense (DOD), and the Department of Veterans Affairs (VA). In fiscal year 2010, NIH, DOD, and VA obligated about $40 billion, $1.3 billion, and $563 million, respectively, for activities related to health research.236
There is nothing to prevent the R&D credit from subsidizing medical research that duplicates the efforts of these agencies.
A Source of Costly Litigation
The IRS aggressively reviews R&D credit claims, and challenges so many it has become a source of increasing contention between the agency and firms.237 Bayer AG spent years fighting the IRS’s attempt to strip it of $175 million in claimed R&D credits, and FedEx fought the IRS’s denial of $11.6 million in credits for developing new package-tracking software.238 More recently, Lockheed Martin Corp. filed suit in federal court in December 2012 challenging the IRS’s rejection of $13.6 million in credits for R&D expenditures. The costs were related to development of a space rocket launcher and a surveillance system for New York City, the company said.239
Gains for U.S. Taxpayers are Easily Lost
What meager public benefit could accrue from the program can disappear quickly. First, there is no requirement in the law that the intellectual property (IP) developed using taxpayer subsidies remains in the United States – employing American workers or generating profits in the United States. As a result, many companies move their IP offshore to tax havens, where profits generated largely from the IP avoid

100 | Tax Decoder Business | 101
1 Pomerleau, Kyle et al. “The U.S. Has the Highest Corporate Income Tax Rate in the OECD,” The Tax Foundation, January 27 2014, http://goo.gl/UWj4np. 2 “Study: Corporate Tax Rate a Drag on Economic Growth,” Reforming America’s Taxes Equitably (RATE) Coalition, March 21 2014, http://goo.gl/86prNk. 3 Cole, Alan, “Corporate vs Individual Tax Expenditures,” April 23 2014, http://goo.gl/qfrwXK. 4 “Monthly Budget Review for September 2014,” Congressional Budget Office, October 8 2014, http://goo.gl/uMyAQK, (p. 2). 5 Note: While Facebook’s U.S. pretax profit was $1.062 billion, $568 million was recognized in foreign pretax losses, as noted on their 10-K. These amounts netted to a
total of $494 million in total pretax profit. 6 “Annual report pursuant to section 13 or 15(d) of the securities exchange act of 1934 (Facebook, inc.),” United States Securities and Exchange Commission, February 2
2013, http://goo.gl/NN1L71, (p. 84). 7 “Annual report pursuant to section 13 or 15(d) of the securities exchange act of 1934 (Facebook, inc.),” United States Securities and Exchange Commission, February 2
2013, http://goo.gl/NN1L71. 8 Singer, Anne, “Facebook’s Multi-Billion Dollar Tax Break: Executive-Pay Tax Break Slashes Income Taxes on Facebook and Other Fortune 500 Companies,” Citizens for
Tax Justice, February 14 2013, http://goo.gl/BsaF0T. 9 “Road Map to Renewal,” President’s Council on Jobs and Competitiveness, 2011, http://goo.gl/JFQF1c. 10 Internal Revenue Code section 162(a). 11 “26 U.S. Code §162 – Trade or business expenses.” Legal Information Institute, http://goo.gl/wDxJa1. 12 “Tax Administration: Recurring Issues in Tax Disputes Over Business Expense Deductions,” United States General Accounting Office, September 1995, http://goo.gl/
OwH5zM, (p. 3)
taxes of any sort. Other countries – including China and Japan – require IP developed with tax subsidies to stay onshore; still other jurisdictions, such as Israel, Russia and Mexico, consider companies’ intent to keep IP onshore when awarding subsidies and tax breaks.
Apple avoided $167 million in taxes in 2011 thanks to the R&D credit. However, a 2013 congressional investigation found that Apple routinely transferred the economic rights to its IP to offshore affiliates. That move enables the company to avoid U.S. tax on profits generated by its innovations.240
Evaluating the R&D Tax Credit
Given that most American companies – indeed, most Americans – recognize the imperative to innovate or face obsolescence, the justification for such a costly tax credit to encourage innovation is not obvious. It is impossible to examine the effectiveness of the credit on a case-by-case basis; however, a macro analysis by CRS found that the credit, at best, produces a “modest stimulus.” This is unsurprising, as the credit appears to be widely viewed as simply a way to use existing activities to avoid taxes. What meager benefits it may generate fall mostly to well-established companies, and even those advantages can evaporate quickly as IP holdings, production, and the innovations slip beyond U.S. borders.
The R&D credit is widely used for activities that do not constitute meaningful research. Preventing this problem
through adjustments in the regulations is fraught with difficulties, as the line between meaningful innovation and simple product development is unclear and subjective. Attempts to limit qualifying research activities to more reasonable uses are bound to be met with new rounds of expensive litigation if passed.
Recommendations & Options for Reform
Ideally, Congress would eliminate the R&D tax credit in exchange for overall lower tax rates on all companies and business. The credit has become a paperwork-heavy exercise in tax avoidance, used mainly by the largest companies and those whose survival depends on innovation, regardless of federal tax incentives. Elimination of the credit will also remove the need for the IRS to choose between imposing regulations for qualifying research that are subjective and allow the agency excessive latitude, or allowing widespread misuse of the credit for research with little social value. Another option, however, is to significantly curtail the program, limiting beneficiaries to only smaller companies without the multi-million dollar annual revenue streams that are simply using the credit to lower their tax liability and supplant investment in product line development.

DRAFT
102 | Tax Decoder
13 “Publication 535 (2013), Business Expenses,” IRS, http://goo.gl/QHzErw. 14 Hicken, Melanie, “Average Wedding Bill in 2012: $28,400,” CNN Money, March 10 2014, http://goo.gl/Fh8A7y. 15 Rosenberg, Eva, “Tax Tips: Tax Deductions Available for Your Wedding,” Equifax, August 7 2013, http://goo.gl/Sma6YX. 16 Blank, Peter, “Extraordinary Tax Deductions,” Kiplinger, November 2012, http://goo.gl/gZeZnd. 17 May, Colin et al. “Tax Evasion and Money Laundering in Maryland,” Association of Certified Fraud Examiner, January 2010, http://goo.gl/OuYdNp. 18 Mielach, David, “10 Crazy Deductions Allowed by the DHS,” Business News Daily, April 2 2013, http://goo.gl/qUUJ4j. 19 “Publication 463 (2013), Travel, Entertainment, Gift, and Car Expenses” IRS, http://goo.gl/hh9nDU. 20 “Tax Administration: Recurring Issues in Tax Disputes Over Business Expense Deductions,” United States General Accounting Office, September 1995, http://goo.gl/
OwH5zM, (p. 2). 21 Davidson, Adam et al. “What’s the Easiest Way to Cheat on Your Taxes?” The New York Times Magazine, April 3 2012, http://goo.gl/ejGGG3. 22 Lunder, Erika K., “Deductibility of JPMorgan Settlement,” Congressional Research Services, November 21, 2013, http://goo.gl/MruRsh. 23 Wood, Robert W., “BP, Oil, and Deducting Punitive Damages,” Woodcraft: Tax Notes, Tax Analysts, August 9 2010, http://goo.gl/rJbFAa, (p. 633). 24 “Tax Administration: Systematic Information Sharing Would Help IRS Determine the Deductibility of Civil Settlement Payment,” U.S. Government Accountability
Office, September 2005, http://goo.gl/flM15f. 25 Information confirmed by the Congressional Research Service. Section 162 of the Internal Revenue Code or any other statute does not disallow deductions for
expenses related to operating a brothel. 26 Friess, Steve. “Nevada Brothels Want to Pay Tax, But State Says No,” The New York Times Company. 26 January 2009. Web. http://goo.gl/0qWiz9. 27 Information provided by the Congressional Research Service, 29 August 2013. 28 Doan, Michael. “Prostitutes Called Legitimate Expense For Nevada Brothel,” Associated Press. The Dispatch. July 27, 1978. 29 Duryee, Tricia, and Mark Rahner. “Brilliant Deductions: Some Taxpayers Try Anything Once,” The Seattle Times Company. 15 April 2002. Web. http://goo.gl/Gi5nR1. 30 Randazzo, Ryan. “Wacky Writeoffs,” Reno Gazette-Journal, April 15, 2001. 31 Vekshin, Alison. “Brothels in Nevada Suffer as Web Disrupts Oldest Trade,” Bloomberg L.P. 28 August 2013. Web. http://goo.gl/RfBBXU. 32 Vekshin, Alison. “Brothels in Nevada Suffer as Web Disrupts Oldest Trade,” Bloomberg L.P. 28 August 2013. Web. http://goo.gl/VV5gyD. 33 Vekshin, Alison. “Brothels in Nevada Suffer as Web Disrupts Oldest Trade,” Bloomberg L.P. 28 August 2013. Web. http://goo.gl/T0zMFm. 34 Whitcomb, Dan, and Ellen Wulfhorst. “Harry Reid’s Prostitution Remarks Ignite Debate in Nevada,” Huffington Post. Thomson Reuters. 6 March 2011. Web. http://
goo.gl/a5c78J. 35 “26 CFR 1.6001-1 – Records,” Legal Information Institute, http://goo.gl/oEKBRX. 36 “Internal Revenue Service Fiscal Year 2013 Enforcement and Service Results,” Internal Revenue Service, http://goo.gl/0yBHUL. 37 “United States v. Gilmore – 372 U.S. 39 (1963),” Justia US Supreme Court, February 18 1963, http://goo.gl/joc1TB. 38 Stein, Harry et al. “The Growing Consensus to Improve Our Tax Code,” Center for American Progress, September 2014, http://goo.gl/ETzOsB. 39 “Present Law and Background Relating to Tax Treatment of Business Debt,” Joint Committee on Taxation, July 11 2011, http://goo.gl/YIFIku. 40 de Mooij, Ruud A.,“Tax Biases to Debt Finance: Assessing the Problem, Finding Solutions,” International Monetary Fund, May 3 2011, http://goo.gl/GSy0xm. 41 “Taxing Capital Income: Effective Rates and Approaches to Reform,” Congressional Budget Office, October 2005, http://goo.gl/aTYEjz, (p. 8). 42 Sullivan, Martin A., “Deleveraging the Tax Code,” Tax Analysts, October 2 2008, http://goo.gl/KOOYu5. 43 de Mooij, Ruud A.,“Tax Biases to Debt Finance: Assessing the Problem, Finding Solutions,” International Monetary Fund, May 3 2011, http://goo.gl/GSy0xm. 44 Fleischer, Victor, “Tax Reform and the Tax Treatment of Debt and Equity,” Testimony before the U.S. House of Representatives Ways and Means Committee, July 13
2011, http://goo.gl/yiIJm7. 45 Fleischer, Victor, “Tax Reform and the Tax Treatment of Debt and Equity,” Testimony before the U.S. House of Representatives Ways and Means Committee, July 13
2011, http://goo.gl/yiIJm7. 46 Fleischer, Victor, “Tax Reform and the Tax Treatment of Debt and Equity,” Testimony before the U.S. House of Representatives Ways and Means Committee, July 13
2011, http://goo.gl/yiIJm7. 47 Fleischer, Victor, “Tax Reform and the Tax Treatment of Debt and Equity,” Testimony before the U.S. House of Representatives Ways and Means Committee, July 13
2011, http://goo.gl/yiIJm7. 48 “26 U.S. Code § 163 – Interest,” Legal Information Institute, http://goo.gl/7ZeO6r. 49 “IRS Continues to Target Interest Expense Deductions on Intercompany Debt,” Aronson, LLC, September 4, 2013, http://goo.gl/enhhBK 50 Fleischer, Victor, “Tax Reform and the Tax Treatment of Debt and Equity,” Testimony before the U.S. House of Representatives Ways and Means Committee, July 13
2011, http://goo.gl/yiIJm7. 51 Sherlock, Molly F., “The Section 199 Production Activities Deduction: Background and Analysis,” Congressional Research Service, February 27 2012, http://goo.gl/
Bu2Leh. 52 Gravelle, Jane G. et al. “Selected Recently Expired Business Tax Provisions (‘Tax Extenders’),” Congressional Research Service, April 30 2014, http://goo.gl/9bddPO,
(p. 22-23). 53 Mazerov, Michael, “States Can Opt Out of the Costly and Ineffective ‘Domestic Production Deduction’ Corporate Tax Break” Center on Budget and Policy and
Priorities, January 31 2013, http://goo.gl/VY067l. 54 Sherlock, Molly F., “The Section 199 Production Activities Deduction: Background and Analysis,” Congressional Research Service, February 27 2012, http://goo.gl/
Bu2Leh. 55 Homsi, Eric, “Financing Films One State at a Time: A Survey of Successful Film Incentive Programs,” Seton Hall Journal of Sports and Entertainment Law, Volume 21,
2011, http://goo.gl/EhsW1w. 56 Sherlock, Molly F., “The Section 199 Production Activities Deduction: Background and Analysis,” Congressional Research Service, February 27 2012, http://goo.gl/
Bu2Leh. 57 “Estimates of Federal Tax Expenditures for Fiscal Years 2014-2018,” Joint Committee on Taxation, August 5 2014, http://goo.gl/WUjjU2. 58 Gravelle, Jane G. et al. “Selected Recently Expired Business Tax Provisions (‘Tax Extenders’),” Congressional Research Service, April 30 2014, http://goo.gl/9bddPO. 59 “Tab 7: Effects of Extending Tax Provisions Scheduled to Expire Before 2024,” Individual Income Tax Receipts and the Individual Tax Base - February 2014 Baseline,
Congressional Budget Office, February 4 2014, http://goo.gl/qAk09p. 60 Sherlock, Molly F., “The Section 199 Production Activities Deduction: Background and Analysis,” Congressional Research Service, February 27 2012, http://goo.gl/
Bu2Leh. 61 Sherlock, Molly F., “The Section 199 Production Activities Deduction: Background and Analysis,” Congressional Research Service, February 27 2012, http://goo.gl/
Bu2Leh. 62 Sherlock, Molly F., “The Section 199 Production Activities Deduction: Background and Analysis,” Congressional Research Service, February 27 2012, http://goo.gl/
Bu2Leh. 63 Sherlock, Molly F., “The Section 199 Production Activities Deduction: Background and Analysis,” Congressional Research Service, February 27 2012, http://goo.gl/
Bu2Leh. 64 Kleinbard, Edward D. et al. “Is It Time to Liquidate LIFO?,” Tax Analysts, October 16 2006, http://goo.gl/MOy6Kb. 65 Stephen Charles Lessard, “Giving Life to LIFO: Adoption of the LIFO Method of Inventory Valuation by the Income Tax Code,” Orrick, Herrington & Sutcliffe, LLP;
New York County Lawyers’ Association (NYCLA); American Bar Association - Section of Taxation, http://papers.ssrn.com/sol3/papers.cfm?abstract_id=1048521 66 Guenther, Gary. “Small Business Tax Benefits: Current Law and Main Arguments For and Against Them (RL32254)” Congressional Research Service, April 3 2013,
http://goo.gl/joiZFZ 67 Kostolansky, John, “The Impact of LIFO In The Fortune 500 In 2007,” The Journal of Applied Business Research, Volume 5, Number 5, September/October 2009, http://
goo.gl/zbbxhS. 68 $8.89 billion was calculated under the assumption a 35 percent tax rate is used. ($25.4billion x .35 = $8.89 billion) 69 Harris, Peter, “Should Last in First Out Inventory Valuation Methods be Eliminated?,” Global Journal of Business Research, Volume 5, Number 4, http://goo.gl/6EBC4i,
(p. 55). 70 Harris, Peter, “Should Last in First Out Inventory Valuation Methods be Eliminated?,” Global Journal of Business Research, Volume 5, Number 4, http://goo.gl/6EBC4i,
(p. 55).

102 | Tax Decoder Business | 103
71 Kleinbard, Edward D. et al. “Is It Time to Liquidate LIFO?,” Tax Analysts, October 16 2006, http://goo.gl/MOy6Kb. 72 Kostolansky, John, “The Impact of LIFO In The Fortune 500 In 2007,” The Journal of Applied Business Research, Volume 5, Number 5, September/October 2009, http://
goo.gl/zbbxhS. 73 Kostolansky, John, “The Impact of LIFO In The Fortune 500 In 2007,” The Journal of Applied Business Research, Volume 5, Number 5, September/October 2009, http://
goo.gl/zbbxhS. 74 Kostolansky, John, “The Impact of LIFO In The Fortune 500 In 2007,” The Journal of Applied Business Research, Volume 5, Number 5, September/October 2009, http://
goo.gl/zbbxhS. 75 Kostolansky, John, “The Impact of LIFO In The Fortune 500 In 2007,” The Journal of Applied Business Research, Volume 5, Number 5, September/October 2009, http://
goo.gl/zbbxhS. 76 Weil, Roman L., “Quality of Earnings and Earnings Management: A Primer for Audit Committee Members,” American Institute of CPAs, February 2009, http://goo.
gl/xpyuWq. 77 Biddle, Gary C., “Accounting Methods and Management Decisions: The Case of Inventory Costing and Inventory Policy,” Journal of Accounting Research, Volume 18,
January 15 1980, http://goo.gl/0OsidF, (p. 235 - 280). 78 Davis, Harry Z. et al. “LIFO Inventory Liquidations: An Empirical Study,” Journal of Accounting Research, Volume 22, Number 2, 1984, http://goo.gl/EHUhXe, (p. 480
- 596). 79 Tse, Senyo, “LIFO Liquidations,” Journal of Accounting Research, Volume 28, Number 1, 1990, http://goo.gl/R6oXjK, (p. 229 – 238). 80 Frankel, Micah et al. “The Year-End LIFO Inventory Purchasing Decision: An Empirical Test,” The Accounting Review, Volume 69, Number 2, April 1994, http://goo.
gl/5uNdRa, (p. 382 – 398). 81 Pear, Robert, “Rush to Defend Tax Rule on Inventory and Profits,” The New York Times, July 12 2011, http://goo.gl/AjqMYH. 82 Bloom, Robert et al. “The Death of LIFO?,” Journal of Accountancy, January 2009, http://goo.gl/OdbVm6. 83 “Estimates of Federal Tax Expenditures for Fiscal Years 2014-2018,” Joint Committee on Taxation, August 5 2014, http://goo.gl/WUjjU2. 84 Freeman, Steven F., “Effects of ESOP Adoption of Employee Ownership: Thirty years of Research and Experience,” University of Pennsylvania Scholarly Commons,
January 4 2007, http://goo.gl/VgqHGX, (p. 2). 85 Snyder, Todd S., “Employee Stock Ownership Plans (ESOPs): Legislative History,” Congressional Research Service, May 20 2003, http://goo.gl/J1Wl3N. 86 “Tax Expenditures: Compendium of Background Material on Individual Provisions,” Congressional Research Service, December 2012, http://goo.gl/yj8iKp, (p. 705-
706) 87 Snyder, Todd S., “Employee Stock Ownership Plans (ESOPs): Legislative History,” Congressional Research Service, May 20 2003, http://goo.gl/J1Wl3N. 88 “Estimates of Federal Tax Expenditures for Fiscal Years 2014-2018,” Joint Committee on Taxation, August 5 2014, http://goo.gl/WUjjU2, (p. 30). 89 Bradford, Hazel, “ESOPs feel heat from campaign against abuses,” Pensions & Investments, March 4 2013, http://goo.gl/hC5uo0. 90 Bradford, Hazel, “ESOPs feel heat from campaign against abuses,” Pensions & Investments, March 4 2013, http://goo.gl/hC5uo0. 91 Gravelle, Jane G., “Employer Stock in Pension Plans: Economic and Tax Issues,” Congressional Research Service, September 4 2002, http://goo.gl/99IJ81. 92 Freeman, Steven F., “Effects of ESOP Adoption of Employee Ownership: Thirty years of Research and Experience,” University of Pennsylvania Scholarly Commons,
January 4 2007, http://goo.gl/XD6B9o. 93 Freeman, Steven F., “Effects of ESOP Adoption of Employee Ownership: Thirty years of Research and Experience,” University of Pennsylvania Scholarly Commons,
January 4 2007, http://goo.gl/XD6B9o, (p. 19) 94 Jane G. Gravelle, “Employer Stock in Pension Plans: Economic and Tax Issues,” RL31551, Congressional Research Service, September 4, 2002, http://www.crs.gov/
pdfloader/RL31551 95 “Tax Expenditures: Compendium of Background Material on Individual Provisions,” Congressional Research Service, December 2012, http://goo.gl/yj8iKp, (p. 709). 96 “General Explanations of the Administration’s Fiscal Year 2014 Revenue Proposals,” Department of the Treasury, April 2014; http://goo.gl/pfdSnq, (p. 197). 97 “Tax Reform Act of 2014: Discussion Draft” Committee on Ways and Means, http://goo.gl/TEtGiV. 98 Much of the information for this section is derived from the following CRS Report, unless otherwise noted: Guenther, Gary, “Section 179 and Bonus Depreciation
Expensing Allowances: Current Law, Legislative Proposals in the 113th Congress, and Economic Effects,” Congressional Research Service, July 15 2013, http://goo.gl/1YVneM.
99 Assets that are used over time to earn a profit 100 “Estimated Budget Effects of The Revenue Provisions Contained In The President’s Fiscal Year 2015 Budget Proposal,” Joint Committee on Taxation, April 15 2014,
http://goo.gl/43rDQW, (p. 4). 101 “The Tax Break-Down: Accelerated Depreciation,” Committee for a Responsible Federal Budget, September 20 2013, http://goo.gl/luNCn8. 102 “Publication 946: How to Depreciate Property,” IRS, http://goo.gl/8neHce. 103 Office of Management and Budget, February 2015, Table 14-1, Estimates of total Income Tax Expenditures for Fiscal Years 2013-2019104 “The Tax Break-Down:
Accelerated Depreciation,” Committee for a Responsible Federal Budget, September 20 2013, http://goo.gl/luNCn8. 105 “Tab 7: Effects of Extending Tax Provisions Scheduled to Expire Before 2024,” Individual Income Tax Receipts and the Individual Tax Base - February 2014 Baseline,
Congressional Budget Office, February 4 2014, http://goo.gl/qAk09p. 106 “Tab 7: Effects of Extending Tax Provisions Scheduled to Expire Before 2024,” Individual Income Tax Receipts and the Individual Tax Base - February 2014 Baseline,
Congressional Budget Office, February 4 2014, http://goo.gl/qAk09p. 107 “Oil and Gas Handbook,” Internal Revenue Manual, Internal Revenue Service, http://goo.gl/LkldVn. 108 “Tab 7: Effects of Extending Tax Provisions Scheduled to Expire Before 2024,” Individual Income Tax Receipts and the Individual Tax Base - February 2014 Baseline,
Congressional Budget Office, February 4 2014, http://goo.gl/qAk09p. 109 “Tab 7: Effects of Extending Tax Provisions Scheduled to Expire Before 2024,” Individual Income Tax Receipts and the Individual Tax Base - February 2014 Baseline,
Congressional Budget Office, February 4 2014, http://goo.gl/qAk09p. 110 “Tax Expenditures: Compendium of Background Material on Individual Provisions,” Congressional Research Service, December 2012, http://goo.gl/yj8iKp. 111 “Estimates of Federal Tax Expenditures for Fiscal Years 2014-2018,” Joint Committee on Taxation, August 5 2014, http://goo.gl/WUjjU2, (p. 23). 112 “Tax Expenditures: Compendium of Background Material on Individual Provisions,” Congressional Research Service, December 2012, http://goo.gl/yj8iKp. 113 “Estimates of Federal Tax Expenditures for Fiscal Years 2014-2018,” Joint Committee on Taxation, August 5 2014, http://goo.gl/WUjjU2. 114 “Tab 7: Effects of Extending Tax Provisions Scheduled to Expire Before 2024,” Individual Income Tax Receipts and the Individual Tax Base - February 2014 Baseline,
Congressional Budget Office, February 4 2014, http://goo.gl/qAk09p. 115 “Tab 7: Effects of Extending Tax Provisions Scheduled to Expire Before 2024,” Individual Income Tax Receipts and the Individual Tax Base - February 2014 Baseline,
Congressional Budget Office, February 4 2014, http://goo.gl/qAk09p. 116 “Tab 7: Effects of Extending Tax Provisions Scheduled to Expire Before 2024,” Individual Income Tax Receipts and the Individual Tax Base - February 2014 Baseline,
Congressional Budget Office, February 4 2014, http://goo.gl/qAk09p. 117 Stein, Harry et al. “The Growing Consensus to Improve Our Tax Code,” Center for American Progress, September 2014, http://goo.gl/YZCPd8. 118 “Work Opportunity Tax Credit: Employers Do Not Appear to Dismiss Employees to Increase Tax Credits,” Government Accountability Office, March 2001, http://
goo.gl/d3tshz. 119 Hamersma, Sarah, “The Work Opportunity and Welfare-to-Work Tax Credits,” Urban-Brookings Tax Policy Center, October 15 2005, http://goo.gl/gAm1Z3. 120 “Multiple Employment and Training Programs: Providing Information on Colocating Services and Consolidating Administrative Structures Could Promote
Efficiencies,” Government Accountability Office, January 2011, http://goo.gl/XSrKuv. 121 Cappelli, Peter et al. “Assessing the Effect of the Work Opportunity Tax Credit,” The Wharton School, University of Pennsylvania, http://goo.gl/KydIz2. 122 “Tax Expenditures: Compendium of Background Material on Individual Provisions,” Congressional Research Service, December 2012, http://goo.gl/yj8iKp. 123 “Tax Expenditures: Compendium of Background Material on Individual Provisions,” Congressional Research Service, December 2012, http://goo.gl/yj8iKp. 124 Scott, Christine, “The Work Opportunity Tax Credit (WOTC),” Congressional Research Service, February 4 2013, http://goo.gl/NBiugn. 125 “Work Opportunity Tax Credit,” United States Department of Labor, http://goo.gl/2Bvd6F. 126 “General Explanations of the Administration’s Fiscal Year 2014 Revenue Proposals,” Department of the Treasury, April 2013, http://goo.gl/WWxWJ8. 127 Scott, Christine, “The Work Opportunity Tax Credit (WOTC),” Congressional Research Service, February 4 2013, http://goo.gl/NBiugn 128 “Estimates of Federal Tax Expenditures for Fiscal Years 2014-2018,” Joint Committee on Taxation, August 5 2014, http://goo.gl/WUjjU2.

DRAFT
104 | Tax Decoder
129 “Tax Expenditures: Compendium of Background Material on Individual Provisions,” Congressional Research Service, December 2012, http://goo.gl/yj8iKp. 130 “Tax Expenditures: Compendium of Background Material on Individual Provisions,” Congressional Research Service, December 2012, http://goo.gl/yj8iKp. 131 “Work Opportunity Tax Credit: Employers Do Not Appear to Dismiss Employees to Increase Tax Credits,” Government Accountability Office, March 2001, http://
goo.gl/0zuvDL. 132 “Tax Expenditures: Compendium of Background Material on Individual Provisions,” Congressional Research Service, December 2012, http://goo.gl/yj8iKp. 133 Hamersma, Sarah, “The Work Opportunity and Welfare-to-Work Tax Credits,” Urban-Brookings Tax Policy Center, October 15 2005, http://goo.gl/gAm1Z3. 134 Hamersma, Sarah, “The Work Opportunity and Welfare-to-Work Tax Credits,” Urban-Brookings Tax Policy Center, October 15 2005, http://goo.gl/gAm1Z3. 135 “Tax Expenditures: Compendium of Background Material on Individual Provisions,” Congressional Research Service, December 2012, http://goo.gl/yj8iKp. 136 “Tax Expenditures: Compendium of Background Material on Individual Provisions,” Congressional Research Service, December 2012, http://goo.gl/yj8iKp. 137Scott, Christine, “The Work Opportunity Tax Credit (WOTC),” Congressional Research Service, February 4 2013, http://goo.gl/NBiugn. 138 Hamersma, Sarah, “The Work Opportunity and Welfare-to-Work Tax Credits,” Urban-Brookings Tax Policy Center, October 15 2005, http://goo.gl/gAm1Z3. 139 Scott, Christine, “The Work Opportunity Tax Credit (WOTC),” Congressional Research Service, February 4 2013, http://goo.gl/NBiugn. 140 “Work Opportunity Tax Credit: Employers Do Not Appear to Dismiss Employees to Increase Tax Credits,” Government Accountability Office, March 2001, http://
goo.gl/0zuvDL, (p. 10). 141 “Work Opportunity Tax Credit: Employers Do Not Appear to Dismiss Employees to Increase Tax Credits,” Government Accountability Office, March 2001, http://
goo.gl/0zuvDL, (p. 9). 142 “Work Opportunity Tax Credit: Employers Do Not Appear to Dismiss Employees to Increase Tax Credits,” Government Accountability Office, March 2001, http://
goo.gl/0zuvDL. 143 “Work Opportunity Tax Credit: Employers Do Not Appear to Dismiss Employees to Increase Tax Credits,” Government Accountability Office, March 2001, http://
goo.gl/0zuvDL, (p. 2). 144 “Work Opportunity Tax Credit: Employers Do Not Appear to Dismiss Employees to Increase Tax Credits,” Government Accountability Office, March 2001, http://
goo.gl/0zuvDL, (p. 2). 145 Scott, Christine, “The Work Opportunity Tax Credit (WOTC),” Congressional Research Service, February 4 2013, http://goo.gl/NBiugn, (p. 10) 146 Scott, Christine, “The Work Opportunity Tax Credit (WOTC),” Congressional Research Service, February 4 2013, http://goo.gl/NBiugn. 147 Hamersma, Sarah, “The Work Opportunity and Welfare-to-Work Tax Credits,” Urban-Brookings Tax Policy Center, October 15 2005, http://goo.gl/gAm1Z3, (p. 4). 148 “Tax Expenditures: Compendium of Background Material on Individual Provisions,” Congressional Research Service, December 2012, http://goo.gl/yj8iKp, (p. 711) 149 “Tax Expenditures: Compendium of Background Material on Individual Provisions,” Congressional Research Service, December 2012, http://goo.gl/yj8iKp, (p. 712). 150 “Tax Expenditures: Compendium of Background Material on Individual Provisions,” Congressional Research Service, December 2012, http://goo.gl/yj8iKp. 151 “Estimates of Federal Tax Expenditures for Fiscal Years 2014-2018,” Joint Committee on Taxation, August 5 2014, http://goo.gl/WUjjU2, (p. 30). 152 “The Wyden-Coats Bipartisan Tax Fairness & Simplification Act of 2011,” Ron Wyden Senator for Oregon, http://goo.gl/54kBpu. 153 “Tax Expenditures: Compendium of Background Material on Individual Provisions,” Congressional Research Service, December 2012, http://goo.gl/yj8iKp. 154 “Tax Expenditures: Compendium of Background Material on Individual Provisions,” Congressional Research Service, December 2012, http://goo.gl/yj8iKp, (p. 715). 155 “Tax Expenditures: Compendium of Background Material on Individual Provisions,” Congressional Research Service, December 2012, http://goo.gl/yj8iKp, (p. 716). 156 “Tax Expenditures: Compendium of Background Material on Individual Provisions,” Congressional Research Service, December 2012, http://goo.gl/yj8iKp. 157 “Estimates of Federal Tax Expenditures for Fiscal Years 2014-2018,” Joint Committee on Taxation, August 5 2014, http://goo.gl/WUjjU2, (p. 30). 158 “Tax Expenditures: Compendium of Background Material on Individual Provisions,” Congressional Research Service, December 2012, http://goo.gl/yj8iKp, (p. 747). 159 “Tax Expenditures: Compendium of Background Material on Individual Provisions,” Congressional Research Service, December 2012, http://goo.gl/yj8iKp, (p. 747). 160 “De Minimis Fringe Benefits,” Internal Revenue Service, http://goo.gl/3mzO51. 161 “De Minimis Fringe Benefits,” Internal Revenue Service, http://goo.gl/3mzO51. 162 “Tax Expenditures: Compendium of Background Material on Individual Provisions,” Congressional Research Service, December 2012, http://goo.gl/yj8iKp. (p. 748). 163 “Tax Expenditures: Compendium of Background Material on Individual Provisions,” Congressional Research Service, December 2012, http://goo.gl/yj8iKp, (p. 748). 164 “Estimates of Federal Tax Expenditures for Fiscal Years 2014-2018,” Joint Committee on Taxation, August 5 2014, http://goo.gl/WUjjU2, (p. 30). 165 Committee on Finance United States Senate, “Economic Recovery Tax Act of 1981,” Committee on Finance, June 1, 1981; http://goo.gl/2QgWh5 . P 76-77. 166“Estimates of Federal Tax Expenditures for Fiscal Years 2012-2017,” Joint Committee on Taxation, February 1, 2013, p. 30, “Credit for increasing research activities,”
http://goo.gl/sTStWh 167 “Figure C. Corporations Claiming a Credit for Increasing Research Activities [1] Claimed Credit Amounts by Size of Business Receipts [2] Tax Years 1990-2010,” IRS,
August 12, 2013; http://goo.gl/b4YcWP . accessed January 16, 2014. 168 “Reform the Research Tax Credit – or Let It Die,” Citizens for Tax Justice, December 4, 2013, http://goo.gl/CQbTRT . accessed January 17, 2014. 169Gary Guenther, “Research Tax Credit: Current Law and Policy Issues for the 113th Congress,” Congressional Research Service, June 13, 2014; http://www.crs.gov/
pages/Reports.aspx?PRODCODE=RL31181&Source=search#_Toc380766889. 170 Zerbe, Dean. “Surprise Change To R&D Tax Credit Rules IS Big Help For Small Business.” Forbes Magazine. 2014. http://goo.gl/k2xNAi 171 “Reform the Research Tax Credit – or Let It Die,” Citizens for Tax Justice, December 4, 2013, http://ctj.org/ctjreports/2013/12/reform_the_research_tax_credit_--_or_
let_it_die.php. accessed January 17, 2014. 172 “Pharmaceutical Research and Development: A Description and Analysis of the Process,” CRS, April 2, 2001, p. 23, http://www.law.umaryland.edu/marshall/
crsreports/crsdocuments/RL30913.pdf 173 “Estimates of Funding for Various Research, Condition, and Disease Categories (RCDC),” NIH, March 7, 2014, https://web.archive.org/web/20141111112825/http://
report.nih.gov/categorical_spending.aspx, archived website snapshot from November 11, 2014. 174 “Research and Development in the Pharmaceutical Industry,” CBO, October 2006, p. 31, https://cbo.gov/sites/default/files/10-02-drugr-d.pdf 175 Guenther, Gary, “Research Tax Credit: Current Law, Legislation in the 112th Congress, and Policy Issues,” Congressional Research Service, August 14, 2012; http://goo.
gl/p6lriN . p. 8. 176 Committee on the Budget Unites States Senate, “TAX EXPENDITURES Compendium of Background Material on Individual Provisions” Congressional Research
Service, December 2012; http://goo.gl/SyUyxr 177 Guenther, Gary, “Research Tax Credit: Current Law, Legislation in the 112th Congress, and Policy Issues,” Congressional Research Service, February 13, 2014; http://
goo.gl/MM8GLk 178 Government Accountability Office, “Opportunities to Reduce Potential Duplication in Government Programs, Save Tax Dollars, and Enhance Revenue,” March 2011,
http://goo.gl/Pgiz9V , P. 274 179Gary Guenther, “Research Tax Credit: Current Law and Policy Issues for the 113th Congress,” Congressional Research Service, June 13, 2014; http://goo.gl/aKgvQY . 180 Gary Guenther, “Research Tax Credit: Current Law and Policy Issues for the 113th Congress,” Congressional Research Service, June 13, 2014; http://goo.gl/QujZvG . 181 Gary Guenther, “Research Tax Credit: Current Law and Policy Issues for the 113th Congress,” Congressional Research Service, June 13, 2014; http://goo.gl/CzXTss . 182 Gary Guenther, “Research Tax Credit: Current Law and Policy Issues for the 113th Congress,” Congressional Research Service, June 13, 2014; http://goo.gl/T1X7b5 . 183 Guenther, Gary, “Research Tax Credit: Current Law, Legislation in the 112th Congress, and Policy Issues,” Congressional Research Service, August 14, 2012; http://goo.
gl/fvK15I . 184 Sherlock, Molly F., “Tax Provisions Expiring in 2013 (‘Tax Extenders’),” Congressional Research Service, June 27, 2013; http://goo.gl/gyrE4O . P 4. 185 GAO, “TAX POLICY: The Research Tax Credit’s Design and Administration Can Be Improved,” GAO-10-136, November 2009, http://goo.gl/wzBXp6 . P 3, accessed
September 6, 2013. 186 Yang, Jia Lynn, “There’s A War over R&D Tax Credits. And Companies Keep Winning,” Washingtonpost, January 24, 2014; http://goo.gl/SMpPgc , accessed January
27, 2014. 187 “Figure C. Corporations Claiming a Credit for Increasing Research Activities [1] Claimed Credit Amounts by Size of Business Receipts [2] Tax Years 1990-2010,” IRS,
August 12, 2013; http://goo.gl/C1me1g , accessed January 16, 2014. 188 Office of Management and Budget, “Federal Receipts, Analytical Perspectives, Budget of the United States Government, Fiscal Year 2015,” http://goo.gl/ebtRa9 . P
205. 189 Committee on Finance United States Senate, “Economic Recovery Tax Act of 1981,” Committee on Finance, June 1, 1981; http://goo.gl/pmLVce . P 86 190 CPI inflator, http://goo.gl/r8vzti

104 | Tax Decoder Business | 105
191 Office of Management and Budget, “Federal Receipts, Analytical Perspectives, Budget of the United States Government, Fiscal Year 2015,”http://goo.gl/m5qRt2 . P 205.
192 “Individual Income Tax Receipts and the Individual Tax Base—February 2014 Baseline,” Tab 7: Effects of Extending Tax Provisions Scheduled to Expire Before 2024, Congressional Budget Office, February 4, 2014, http://www.cbo.gov/publication/45065
193 “Figure C. Corporations Claiming a Credit for Increasing Research Activities [1] Claimed Credit Amounts by Size of Business Receipts [2] Tax Years 1990-2010,” IRS, August 12, 2013; http://goo.gl/um1BYS . accessed January 16, 2014.
194 GAO, “TAX POLICY: The Research Tax Credit’s Design and Administration Can Be Improved,” GAO-10-136, November 2009; http://goo.gl/frSRJ2 . P I, accessed September 6, 2013.
195 Plante & Moran, “R&D Tax Credits,” 2014; http://goo.gl/cWF3jU 196Gary Guenther, “Research Tax Credit: Current Law and Policy Issues for the 113th Congress,” Congressional Research Service, June 13, 2014; http://goo.gl/ITmJV4 197 Robert McIntyre, “The Taxonomist,” The American Prospect, January 3, 2002; http://goo.gl/ZuNlpD 198 Gary Guenther, “Research Tax Credit: Current Law and Policy Issues for the 113th Congress,” Congressional Research Service, June 13, 2014; http://goo.gl/LLyjaE 199 Gary Guenther, “Research Tax Credit: Current Law and Policy Issues for the 113th Congress,” Congressional Research Service, June 13, 2014; http://goo.gl/LLyjaE 200 Gary Guenther, “Research Tax Credit: Current Law and Policy Issues for the 113th Congress,” Congressional Research Service, June 13, 2014; http://goo.gl/GgMe7y 201 “26 CFR 1.41-4-Qualified Research for Expenditures Paid or Incurred in Taxable Years Ending on or after December 31, 2003,” Cornell Law School, http://goo.gl/
Dvc1YE 202 “26 U.S. Code § 41 - Credit for increasing research activities,” Cornell Law School, http://goo.gl/ufkH7S 203 “26 CFR 1.41-4-Qualified Research for Expenditures Paid or Incurred in Taxable Years Ending on or after December 31, 2003,” Cornell Law School, http://goo.gl/
bCqkVh 204 “Reform the Research Tax Credit- Or Let it Die,” December 14, 2013; http://goo.gl/BxP9GP 205 Gary Guenther, “Research Tax Credit: Current Law and Policy Issues for the 113th Congress,” Congressional Research Service, June 13, 2014; http://goo.gl/UFYLvW 206 The Aliant Group, “Research and Development Tax Credit,” http://goo.gl/UJ53RT 207 AlliantGroup, http://goo.gl/uvMWxu 208 Scott Thrum, “Taking Credit,” Wall Street Journal, June 14, 2013; http://goo.gl/Bp0wGQ 209 AlliantGroup, http://goo.gl/2jr4TP 210 “Mattel Toys” http://goo.gl/Qi1HeX 211 “26 CFR 1.41-4-Qualified Research for Expenditures Paid or Incurred in Taxable Years Ending on or after December 31, 2003,” Cornell Law School, http://goo.gl/
chJ8Tm 212 “26 U.S. Code § 41 - Credit for increasing research activities,” Cornell Law School, http://www.law.cornell.edu/uscode/text/26/41. 213 Mattel, 2014; http://goo.gl/qhwgir 214 Mattel, 2014; http://goo.gl/VovUDf . Accessed May 2, 2014. 215 AlliantGroup, April,2009; http://goo.gl/hrgsAH 216 Plante & Moran, 2014; http://goo.gl/kz38w5 217 AlliantGroup, April,2009; http://goo.gl/2j0Nkj 218 Intrepid Advisors, 2012; http://goo.gl/p4l69V 219 Deloitte Tax, 2010; http://goo.gl/0yQiAI 220 Baker Tilly, November 11, 2011; http://goo.gl/CW2M2I 221 Office of Management and Budget, “Federal Receipts, Analytical Perspectives, Budget of the United States Government, Fiscal Year 2015,” http://goo.gl/HFuoIa . P
205. 222 Government Accountability office, “Review of Studies of the effectiveness of the Research Tax Credit, May 1996, http://goo.gl/x3aZqp . See also, Bronwhn Hall and
John Van Reenen, “How effective are fiscal incentives for R&D? A review of the evidence,” Research Policy 29 2000 449–46 223 Gary Guenther, “Research Tax Credit: Current Law and Policy Issues for the 113th Congress,” Congressional Research Service, June 13, 2014; http://goo.gl/ysakxO 224 $3.4 billion is 40 percent of $8.5 billion; $6.8 billion is 80 percent of $8.5 billion. 225 Government Accountability Office, “Opportunities to Reduce Potential Duplication in Government Programs, Save Tax Dollars, and Enhance Revenue,” March 2011,
http://goo.gl/4mEmWt P. 274 226 Justin Goodson and Steffanie Gunn, “The R&D Tax Credit – It’s Not Just for High-Tech Companies!” AlliantGroup, “http://goo.gl/g5g577 227 “Research and Development (R&D) Tax CreditsHelping businesses identify, qualify for, and obtain their fair share of allowable credits.” WIPFLI, 2014; http://goo.gl/
qgYBy8 228 “Mallard Manufacturing Corp. Identifying additional tax credits results in substantial savings.” WIPFLI, 2014; http://www.wipfli.com/SuccessStory_MaD_
MallardManufacturing.aspx. 229 NTMA, 2014; http://goo.gl/LQWG13 230 “Misconception: Only Companies that Increase Research from Year-to-Year Can Qualify,” Tax Point Advisors, 2014; http://goo.gl/BfMjEs 231 “Reform the Research Tax Credit – or Let It Die,” Citizens for Tax Justice, December 4, 2013; http://goo.gl/1Lkr9p . accessed January 17, 2014. 232 GAO, “TAX POLICY: The Research Tax Credit’s Design and Administration Can Be Improved,” GAO-10-136, November 2009; http://goo.gl/hf2UX0 P I, accessed
September 6, 2013. 233 Apple’s slogan for years was “Think Different”; Google has tried to build a corporate practice around innovation, for example its much-touted “innovation time off”
program, which encourages Google engineers to spend a day a week on projects of interest. Intel claims it is “Leading in an innovation economy.” Intel, http://goo.gl/892NCR . accessed January 17, 2014.
234Pete Kissinger, Who Needs R&D Tax Credits,” Grow Indioanna Media Ventures, 2014; http://goo.gl/yuAV8X 235 Memorandum from Gary Guenther, Congressional Research Service, to Sen. Tom Coburn, “Subj: State Research Tax Credits: Design, Revenue Cost, and Selected
Other Issues,” April 30, 2013, p. 21. 236 Government Accountability Office, “2012 Annual Report: Opportunities to Reduce Duplication, Overlap and Fragmentation, Achieve Savings, and Enhance
Revenue,” February 2012, http://goo.gl/JbtY7U , Page 96. 237 McKinnon, John D., “Firms Pass Up Tax Breaks, Citing Hassles, Complexity,” Wall Street Journal, July 23, 2012; http://goo.gl/Y8n5ys 238 Byrnes, Nanette, “An R&D Credit Not Earning Its Keep,” BusinessWeek, October 15, 2009; http://goo.gl/Y9aX0d . accessed Sept. 6, 2013. 239 Temple-West, Patrick, “IRS, Lockheed fight over R&D ‘rocket science’ tax break,” Reuters, January 25, 2013; http://goo.gl/FvVUcM . accessed September 6, 2013. 240 “Memorandum: Offshore Profit Shifting and the U.S. Tax Code – Part 2 (Apple Inc.),” Permanent Subcommittee on Investigations, Homeland Security and
Governmental Affairs Committee, May 21, 2013; http://goo.gl/J8ANFf . P 2, accessed January 17, 2014.

DRAFT
106 | Tax Decoder
FINANCIALSERVICES

106 | Tax Decoder Financial Services | 107
Financial Services Tax Provisions
Individuals, families, and businesses of all sizes rely on the critical functions that financial services companies provide in the global economy. Banks, credit unions, insurance companies, and investment funds are just a few of the businesses that provide essential services such as lending, payment processing, retirement planning, and risk mitigation.
Given the unique proximity financial service companies have to money, markets, and the flow of capital, perhaps there is no other industry that is more responsive to changing incentive structures in the marketplace. Credit, interest rate, counterparty, market, volatility, and liquidity are all forms of risks that impact investment decisions and the costs of financial products offered to the American people. Yet, Congress has managed to add another non-market based dynamic to the flow and price of capital through the creation and perpetuation of various carve outs for specific members of the financial services sector.
From sweetheart deals for small life insurance companies to the unexplainable tax-exempt status of credit unions, the unjustifiable tax treatment of investment fund manager earn-ings to the tax shelters for the rich disguised as life insurance policies, the provisions outlined in this chapter represent a variety of tax preferences that have different applications and recipients. But they all end in the same result – a skewed policy that benefits a select few at the expense of the many.
The companies that benefit from the tax breaks listed in this section will assuredly defend their provisions as vital policies whose absence would inflict undue harm on the economy. When considering comprehensive tax reform, it is important to remember that the impact of eliminating a single provision does not happen in a vacuum. Nor does the status quo created by a Congressional carve out legislated decades ago constitute a baseline to judge the efficacy of a tax code for the 21st century.
Savings and investment in the American economy should be predicated on risk and return – not lobbyists and lawmakers. The acute impacts that striking a special interest carve out will have on a specific business should not be prioritized over the massive benefits that fixing our broken tax system will have on the American people. It is long past due that we plow the tax code’s giveaways and level the competitive playing field through meaningful comprehensive tax reform.
Carried Interest Tax Treatment “I think if you make an investment with cash and you get a return, that should be capital gains. If you’re a hedge fund and
a private equity fund and you get your carried interest taxed at capital gains, I can’t justify that, because it’s a payment for services, and it ought to be taxed as income tax.”1
- Peter G. Peterson, co-founder of Blackstone Group, the largest private equity firm in the world
Financial Services (in millions) FY 2014 FY 2014 - FY 2018Carried Interest $1,200 $11,900
Exclusion of Interest on Life Insurance Savings (Inside Buildup)
$30,100 $158,100
Qualified Small Business Stock Gain Exclusion: Sec-tion 1202
$802 $4,900
100% Qualified Small Business Stock Gain Exclusion $2 $34
Small Life Insurance Company Deduction $50 $200
Nonprofit Status of Credit Unions $2,100 $11,900
Total $33,054 $175,134

DRAFT
108 | Tax Decoder
The federal tax code treats income from long-term capital gains, profit made from the difference between the purchase and sale of an asset that is held for at least one year, at a separate rate from ordinary income. The favorable tax treatment of capital gains is a critical component to incentivizing investment in our economy.
The distinction between what constitutes a capital gain versus ordinary income is not always clear, and nothing rep-resents the potential ambiguities better than the long-stand-ing policy dispute about how to categorize a portion of earn-ings made by managers of investment funds, such as hedge funds and private equity firms, known as “carried interest.”
Due to the relative wealth levels of those involved in this debate, much of the argument surrounding carried interest taxation has been couched in terms of class warfare. However, the tax treatment of carried interest is not a question of one versus the 99 percent. It is simply a question of common sense.
The pretense that carried interest represents an apprecia-tion of the illusory assets of risk and hard work – intangibles that are arguably essential to every American job – would en-title everybody’s wages to capital gain rates. In reality, carried interest is simply a fee for labor-based management services that should be taxed as ordinary income.
Carried Interest Background
Hedge fund and private equity firms are investment pools that are run by managers on behalf of outside investors. The fund employees that manage the funds are general partners while the outside investors who supply the capital but have no say in managerial decisions are limited partners.
These firms are almost always structured as partnerships or limited liability companies. These entities are not taxed at the corporate level but instead pass through their profits and losses to the partners to be taxed at the individual level.2
Fund managers are typically compensated in two ways: 1. a management fee that is based on the total assets
the firm manages2. a performance based fee that provides managers a
share of the returns made by the fund.3 The performance based fee is referred to as “carried interest.” The most typical fee structure utilized by private equity
and hedge funds are “2 and 20,” meaning the fund managers charge investors a two percent fee on total assets under management and receive 20 percent of the annual returns made by the fund above a specified threshold.
For example, if a fund manages $1 billion in assets and makes a 10 percent return on the year, the fund managers will be compensated $20 million for the management fee (two percent of $1 billion in assets managed) and $20 million in carried interest (20 percent of $100 million return).
The management fees are taxed as ordinary income, but
the performance based “carried interest” compensation is taxed under the more favorable capital gains rate. Under current law, treating compensation as capital gains instead of ordinary income can cut the tax rate on that portion of a manager’s income by nearly half.4
This structure provides a significant tax benefit to this industry. The president’s FY 2014 budget proposed taxing carried interest as ordinary income and applied capital gains taxes to enterprise value compensation.5 Taxing carried interest as ordinary income was also included in the Congressional Budget Office’s Options for Reducing the Deficit.6 This was estimated to raise $1.2 billion in FY 2014 and $11.9 billion from FY 2014 through FY 2018.
Key Policy Concerns
Investment funds such as private equity firms and some hedge funds make their earnings through long-term investments. Partnership tax law typically treats funds that are passed through to the partners the same as how they are generated. In this case, since the carried interest is derived from a capital gain, the fund managers treat the performance fee as a capital gain as well.7
But many economists question the fairness of allowing compensation for performance based labor to avoid ordinary income tax rates because it violates the principle of horizontal equity.8 The labor the fund managers provide is no different than that of other employees who provide similar services. As a federal tax court ruling argued, “like stockbrokers, financial planners, investment bankers, business promoters and dealers,” firm managers make money from other peoples’ investments.9 Yet, investment fund managers who similarly derive earnings from other people’s money are taxed at nearly half the rate under the guise of “carried interest.”
Defenders of the carried interest tax break also argue that the compensation represents the fund managers’ “intellectual” and “sweat equity” contributions to the business enterprise.10 Since the returns on the outside investors’ capital are due to the fund managers’ work and risk, proponents of the current policy believe their contributions are interchangeable with the outside investors’ capital and should receive equivalent treatment.
This justification for favorable treatment of carried interest is predicated on the notion that fund managers should enjoy the increased valuation of an asset to which they have no claim. Providing a service that results in the appreciation in asset value does not automatically mean the compensation for that service should be treated as a capital gain. Contractors that renovate homes cannot treat their compensation as capital gains because they helped the home appreciate in value. Researchers working for a firm that discover a breakthrough technology do not have

108 | Tax Decoder Financial Services | 109
their salary treated as capital gains because the contribution raises the valuation of a business. In reality, hedge fund and private equity managers charge their investor a fee for their services of managing invested capital.
The purpose of favorable tax treatment on capital gains is to incentivize people to place their financial assets at risk, thus generating more capital investment that is the cornerstone of economic growth. But this incentive is not applicable to carried interest. Carried interest is not attributable to a fund manager’s own financial assets at risk, but rather providing time and effort to manage others’ capital investment. If time, effort, and risk are capital investments, then all income should be taxed as capital gains.
Moreover, it is fundamentally skewed for fund managers to reap the benefits of favorable capital gains rates on the upside without having direct exposure to the risk of capital losses on the downside. Undoubtedly, fund managers that place their own capital at risk in the firm’s fund should receive capital gains treatment. However, the performance based fees for labor should be taxed according to the ordinary income schedule.
Another justification of the special tax treatment on car-ried interest is that it aligns the interest of the fund managers with the outside partners so that “partners in a partnership are treated similarly regardless of the form of their invest-ment.”11 Car salesmen do not get favorable tax treatment because their commission-based compensation aligns their interests with the company. Nor do CEOs get taxed at the same rate as their employees in order to ensure that every-body in a corporation is on the same page. The alignment of fund managers and outside investors’ incentives is already accomplished through the performance based compensa-tion arrangement. The need for similar tax treatment is sim-ply a convenient defense of a lucrative tax break.
A final argument often used to defend the carried interest
tax break is that the Internal Revenue Code has permitted it for over fifty years.12 But “it’s always been this way” is an empty excuse that should have no persuasive sway over any public policy debate. No serious analysis should confuse longstanding precedent as an equivalent to good policy. For instance, the top corporate tax rate having been 35 percent or higher since 1942 is hardly a compelling defense of the status quo.13
Conclusion
Members of the industries that enjoy carried interest treatment claim that taxing carried interest at ordinary rates will discourage investment and hurt the economy. There is no disputing that capital investment is vital to economic growth and that tax increases remove potential private capital investment. However, this argument is a distraction from the policy issue at hand. If carried to the extreme, proponents of this defense might suggest a regressive marginal tax structure because people with larger incomes are more likely to invest. This is obviously unrealistic.
The real key to unlocking capital investment and economic growth is not to protect unjustifiable tax breaks for a small segment of the economy. Real growth is predicated upon Congress implementing clear and sensible policies that instill confidence and clarity for businesses and families to invest in the future.
Perhaps more than any other issue, the cluttered and unnavigable tax code serves as an inhibitor to capital formation and economic growth. Clearing out loopholes and special interest giveaways, including the carried interest tax break that will cost $17 billion over the next decade, while reducing rates across the board is the crux to unleashing America’s boundless economic potential.
EXCLUSION OF INTEREST ON LIFE INSURANCE SAVINGS (INSIDE BUILDUP)
Permanent life insurance has “become a tax shelter for the rich….If the industry no longer has a significant presence on Main Street, it loses its political clout in Congress and can’t defend the tax benefits.”14
- Charlie Smith, ChFC, CLU, AEP, former president and CEO of GAMA International
The fundamental purpose of life insurance is to protect the policyholder’s listed beneficiaries from the financial risk that the loss of income or services the death of the policy-holder would pose on a family or business. Life insurance products that help survivors handle the financial burden cre-ated by the loss of life are beneficial to society. In fact, life in-
surance has garnered special tax treatment since the income tax code was created in 1913 because the product has been viewed by Congress as a safety net for widows and orphans. However, the current use of life insurance products and the tax treatment of savings associated with policies no longer fit the primary purpose that justified the special tax treatment.

DRAFT
110 | Tax Decoder
Due to the favorable tax treatment of the savings component of cash value life insurance, these products are instead used by the wealthy to shelter savings from taxes – a fact acknowledged by high ranking officials in the industry. In fact, more than more than half of all of the monetary benefits of this tax expenditure go to the top ten percent, while half of America only receives five percent.15
Life Insurance Background
There are two primary types of life insurance coverage – term life insurance and cash value life insurance.16 In a term life insurance contract, the insured agrees to pay a premium for life insurance coverage for a defined period which will pay-out a specific death benefit to the listed beneficiaries if the insured passes away during the period of the contract. Once the term of the insurance contract expires, neither party has a continuing financial obligation to the other.17
The other type of life insurance is a cash value life insurance policy, also known as permanent life insurance, which includes whole life, variable life, and universal life coverage.18 A cash value life insurance policy is a hybrid product that combines a death benefit provided under the term insurance product with a cash savings element.
When an individual pays a life insurance company a premium for cash value life insurance coverage, the premium is directed towards two primary purposes:
1. the cost of the life insurance coverage associated with the death benefit based on the policy holder’s actuarial rating; and
2. an investment account that can either earn a fixed rate of return or be invested in stock or bonds which earn a variable rate of return.19
The rate charged to cover the life insurance coverage is de-rived from the insured’s risk of death based on the age and health of the policyholder and the amount of the death benefit in the policy. Any additional premium that is paid above the costs to cover the annual death benefit is credited to the policy holder’s cash value account. The insurance company invests these excess funds on behalf of the policyholder and the earn-ings accrue within the insured’s cash value account. The in-vestment earnings made on the cash value account funds are known as “inside buildup.” The cash value can be used for sev-eral purposes, including covering the death benefit coverage portion of the premium in future years, collateral for a loan, retirement income, and to be passed on to the beneficiaries.20
Exclusion of Taxation on Inside Buildup
The investment income derived from the cash value in the account, referred to as inside buildup, is exempt from taxes until it is withdrawn.
There are no limitations on the total size of the invest-ment made through a cash value life insurance policy such as those that apply to other retirement savings vehicles, as long as the life insurance policy passes the tests put in place in 1984 and 1988 that prevent policies from become too heavily weighted towards investment as compared to the value of the death benefit.
The exclusion of investment income on life insurance and annuity contracts cost the taxpayers $30.1 billion in 2014 and will cost a total of $158.1 billion from FY 2014 through FY 2018.21
Evaluation of Preferential Tax Treatment for Cash Value Life Insurance Policies
Despite the prominence of the word “insurance” in cash value life insurance products, in reality the “life insurance policy is merely a savings account or a mutual fund that generates an annual rate of return, with the attachment of an annual bet on the insured’s death.”22
The tax free accrual of earnings on the cash value portion of the policy provides cash value life insurance a market dis-torting advantage over similar savings vehicles. The “exemp-tion of inside build-up distorts investors’ decisions by encour-aging them to choose life insurance over competing savings vehicles such as bank accounts, mutual funds, or bonds,” notes the nonpartisan Congressional Research Service.23
Even when a policyholder withdraws cash from the life insurance contract, the tax code allows for the withdrawals to count against the policyholder’s own capital (the amount contributed via premiums), rather than the investment income portion, until the aggregate amount of withdrawals exceeds the capital levels.24 In other words, if a policyholder withdraws funds from the cash value in the life insurance policy, a taxable event is not triggered until the policyholder’s
DUE TO THE FAVORABLE TAX TREATMENT OF THE SAVINGS COMPONENT OF CASH VALUE LIFE INSURANCE, THESE PRODUCTS ARE INSTEAD USED BY THE WEALTHY TO SHELTER SAVINGS FROM TAXES.

110 | Tax Decoder Financial Services | 111
premium contribution is exhausted. This stacking feature further enhances the benefit of the deferred taxation of inside buildup in the account.
Moreover, the policy treatment of life insurance allows a policyholder to avoid a taxable event when accessing the inside buildup by allowing the policyholder to borrow against the value of the cash value in the policy.25 Therefore, instead of withdrawing the cash value of the investment income and triggering a taxable event, the policyholder can use it as collateral and continue to defer taxation on the accrual of investment returns in the account.
While the policyholder will still pay interest on the loan taken out using the cash value as collateral, this is still advantageous for two reasons. The cost of the loan is the marginal difference between the interest rates paid on the loan and the amount of return made on the cash value, a typically small difference. Additionally, the interest payments on the loan are usually tax deductible, further reducing or reversing any remaining difference.26
If the loan is not paid back at the time of the insured’s death, the death benefit can be used to cover the debt. Rather than incurring a taxable event by accessing the savings accrued through the inside buildup, the policyholder can instead access the entirety with minimal, if any, tax consequences. This is different from loans taken out of qualified retirement accounts, whose proceeds are considered a distribution to be included in the holders’ taxable gross income.
While there are deferred taxation characteristics in retirement savings vehicles such as 401(k)s, pensions, and savings bonds, the key difference is that these are specifically designed for retirement savings and have contribution limitations tailored for that purpose.27
On the other hand, life insurance policies are intended to offset the financial burden an insured’s death would have on his/her survivors. If life insurance is more valuable than similar financial savings products, it will maintain a viable market without the tax subsidies.
The Inside Buildup Tax Preference Subsidizes Retirement Planning for the Wealthy
The ability to accrue tax-free investment income through the policy without contribution limitations is a lucrative function of the cash value life insurance policy. As such, cash value life insurance has predominately turned into retirement savings and estate planning vehicles for the affluent who hit the contribution limits for traditional retirement savings vehicles, rather than a risk-mitigating product for the broader public.
According to a 2010 Federal Reserve report on consumer finance, the wealthiest one percent of American families held 22 percent of the assets in the cash value portion of life
insurance policies, the top ten percent of families by income owned 54 percent of the cash value in life insurance policies, while the bottom 50 percent of American families owned only five percent.28
While higher levels of cash-value are naturally proportional to the larger associated policy benefits, and not necessarily coverage rates, the tax benefits are directly correlated to the total assets attributed to inside buildup in the cash value. Therefore, more than half of all of the monetary benefits of this tax expenditure go to the top ten percent, while half of America receives only five percent.
An article in Life Health Pro, a life insurance industry publication, is fearful that this fact will cause industry to fall out of favor of Congress, reasoning that:
The dominant independent life insurance distribution channel is disproportionately focused on the affluent market while largely ignoring the middle-income market. The low-income market is completely ignored, doomed to rely on public assistance in the event a family’s breadwinner dies prematurely. Congress perceives the life insurance industry as catering only to the affluent, making the industry’s products vulnerable to the loss of their long tax-advantaged status at the hands of a revenue-starved federal government.29
A former president and CEO of a life insurance company went even further, warning,

DRAFT
112 | Tax Decoder
if the middle market is not being adequately served — and we know from study after study that the Average Joe is rarely contacted by a producer about life insurance — then you risk losing that ‘protecting widows and orphans’ street cred.30
Another life insurance CEO acknowledges that the lack of coverage outside the upper income spectrum issue is systemic, affirming that “career shops have an interest in training young agents, but they’re training them to be working in the affluent market. The training is there, but it’s not to reach the masses.”31
While targeting a high-wealth clientele base is lucrative for life insurance companies, the industry also realizes this places them in a difficult position. Another Life Health Pro article points out the inherent problem when reality no longer matches the industry’s main justification to preserve the tax break, stating
the perception of life insurance as protection for wid-ows and orphans is gradually changing, in the minds of some, to a perception that life insurance has become a tax shelter for the rich. Why is this perception out there? Perhaps because most producers in the independent life insurance distribution channel naturally tend to migrate toward the affluent market as they grow their practice and become more experienced.32
Market data on life insurance consumers proves that the shift in perception that industry fears is supported by reality. One 2007 analysis showed that “high-end policies for $2 million and up, which can carry annual premiums of $20,000 or more, made up nearly 40% of the face value of new whole-life and universal-life policies sold.”33
The admission by the former head of an international association of insurance managers that cash value life insurance has “become a tax shelter for the rich” highlights the fact that the industry is far removed from the original purpose of the exemption’s inclusion when life insurance was seen as a safety net.34 Despite the reality of the benefits of the tax exemption predominately flowing to the top, there will remain an entrenched interest to vigorously defend the special tax status of inside buildup.35
Insurance Industry Lobbying
The solution to protecting the tax break proffered by industry leaders is to make sure they still have Congress’ ear.
LIFE Foundation President and CEO Marvin Feldman laid out the strategy to defend the tax exemption from the notion that life insurance does not serve the middle class saying,
It’s giving Congress ammunition in its battle with our industry over proposed taxes and regulation, including taxing the inside buildup of cash value policies….We need
to support [the National Association of Insurance and Financial Advisors (NAIFA)] and [the Association for Advanced Life Underwriting (AALU)] in these battles, or our industry as we know it will become quite different.36
While a substantiated policy defense on the merits of the tax exemption as a safety net is withering, the industry is none-theless prepared to defend the tax break using the same tagline.
An industry publication notes that every time the exemption of inside buildup comes before Congress “after hearing the ‘we protect widows and orphans’ mantra from the life insurance industry — [Congress] has chosen to preserve the current tax treatment.”37 Industry hopes that once gain Congress will continue to fall for the perception pitched by industry talking points, rather than the reality of who the tax exemption truly benefits.
Recommendation
The death benefits provided by life insurance should, and will, continue to serve as a valuable resource to those facing the financial disruption caused by the loss of a loved one.
This important benefit, however, is not contingent upon retaining the tax-exempt status of the inside buildup in cash value accounts used in many cases to subsidize retirement planning for the wealthy.
President Reagan proposed a reform that would impose current taxation on all inside build-up in life insurance policies as part of the Tax Reform Act of 1986, but Congress rejected it. Later, President Bush’s Advisory Panel on Federal Tax Reform issued a report in November 2005 that recommended the elimination of the exemption of life insurance investment earnings, favoring investment incentives that would treat various investment vehicles in a more neutral manner.
The Congressional Budget Office also included invest-ment income from life insurance and annuities in taxable in-come in their report of options to reduce the deficit. In their assessment, CBO estimated the provision would raise $210 billion over the next 10 years.38
In conjunction with a comprehensive tax reform plan that lowers rates across the board, Congress should tax the inside buildup comprising the annual increase in the cash value portion of life insurance effective on life insurance first issued after the reform.
Policies that offer fixed rates of return on investment should be taxed under ordinary income rules, while policies that offer variable rates of return based on a basket of stocks or bonds would be taxed under the same rules as mutual funds.
To ease the administrative burden of the taxation on inside buildup, the life insurance companies can withhold the tax on the annual earnings from the returns in the policy. Given the premiums are taxed as they accrue over the policy’s lifetime, there would be no tax event if the policyholder withdraws the cash value from the account for retirement savings purposes.

112 | Tax Decoder Financial Services | 113
Qualified Small Business Stock Gain Exclusion: Section 1202
Providing two out of every three new jobs and employing half of the nation’s workforce, small businesses are at the heart of a prosperous American economy.39 With this outsized role in job creation and economic growth, Congress has taken upon itself to create numerous programs to support American small businesses, including an entire agency dedicated to assisting them.
The Small Business Administration (SBA) had a nearly $1 billion budget in FY 2014, which offered programs that include “loan guaranty and venture capital programs to enhance small business access to capital; contracting programs to increase small business opportunities in federal contracting; direct loan programs for businesses, homeowners, and renters to assist their recovery from natural disasters; and small business management and technical assistance training programs to assist business formation and expansion.”40 The SBA has more than $100 billion in loans outstanding and even has a program that specifically focuses on providing equity investments in small businesses.41
Despite the plethora of federal programs and magnitude of funding that benefit small businesses, Congress added Section 1202 to the Internal Revenue Code. Section 1202 allows investors in qualified small business stocks (QSBS) to exclude at least half and at times up to 100 percent of the capital gains made from the investments. The exclusion may be claimed by non-corporate investors on stock issued by corporations in businesses with $50 million or less in gross assets when the stock is issued.42
While well-intentioned, the provision distorts capital investments, provides benefits that are limited to a few companies, arbitrarily limits corporations that have issued qualifying stock, and is duplicative of the massive financial support already provided by the SBA.
Background of Section 1202: The QSBS Gain Exclusion
The Section 1202 qualified small business stock (QSBS) exclusion was enacted in 1993, when the highest capital gains tax rates were 39.6 percent for short-term gains and
28 percent for long-term gains. To be eligible for the Section 1202 exemption, investors must be non-corporate taxpayers, such as individuals and pass through entities, and they must hold the QSBS for at least five years and one day. Further, the company issuing the stock must have gross assets of less than $50 million. The total amount of exempted capital gains under Section 1202 is limited to the greater of $10 million or 10 times the return on the original investment.
Initially, investors could exclude 50 percent of their capital gains earnings from qualified small business stocks. Congress increased the exclusion level to 75 percent in 2009, and then to 100 percent in 2010.43 Most recently, the 100 percent exclusion rate was extended by the American Taxpayer Relief Act of 2012 to apply to QSBS purchased before 2014.44
Extension of the 100 percent exclusion rate was included in the Senate’s 2014 extenders legislation, the EXPIRE Act of 2014, and is estimated to cost an additional $2 million in FY 2014 and $34 million from FY 2014 through FY 2018.45 This cost, however, is only for the 100 percent exclusion. The underlying 50 percent exclusion will cost $800 million in FY 2014 and total $4.9 billion from FY 2014 through FY 2018.46
In sum, the QSBS exclusion will result in $802 million in FY 2014 and at least $5 billion from FY 2014 through FY 2018 in losses of revenue to Treasury.
Considerations
The justification for the provision’s creation was to encourage equity investments into small businesses that predominately receive financing through debt, due in part to the tax code’s favorable treatment of debt over equity. The Section 1202 exclusion distorts market prices and disrupts
As post-tax premiums have already paid for the benefits, and the gains and losses in actuarial value of the life insurance coverage average out amongst all policyholders, Congress should maintain the tax-exempt status of the death benefits for the beneficiaries.
Instead of pretending that the investment accounts attached to the cash value life insurance policies serve as a safety net for the masses that necessitate special
tax treatment, Congress should instead eliminate this regressive loophole in conjunction with lowering rates for every American. This would provide more post-tax income available for savings for everyone and allow people to choose which savings vehicles are preferable based on the characteristics of the investment product rather than the tax treatment in the federal tax code.

DRAFT
114 | Tax Decoder
economic growth rather than promoting it. For this reason, the South Texas Law Review states, “Most economists … would argue that providing small business, or any special interest group for that matter, with artificially created tax incentives makes no sense with respect to efficient market theory.”47
In practice, QSBS attracts relatively more investment than what is economically justified due to favorable tax treatment. As a result, investment capital may be lacking in other forms of investments that would otherwise receive funds. While the provision is certainly well intentioned, the efficacy of distorting capital investments via this tax provision is questionable, and likely causes negative effects on economic growth in the aggregate.
The distorting impact of Section 1202 is especially mag-nified due to the narrow scope of corporations that qualify for QSBS exclusion. In addition to having to be structured as a C-Corp and the $50 million gross asset size limitation, there are also restrictions placed on certain industries and business structures. Specifically, corporations cannot qual-ify if their commercial activities include “health care, law, engineering, architecture, hospitality, farming, insurance, finance, and mineral extraction.”48 Additionally, corporations cannot qualify if they are
current or former domestic international sales corporations (DISCs), regulated investment companies (RICs), real estate investment trusts (REITs), real estate mortgage investment conduits (REMICs), financial asset securitization investment trusts (FASITs), cooperatives, or C corporations that have claimed the possessions tax credit under IRC Section 936.49
Through the size and activity limitations, Congress is tilting the allocation of capital investments towards some busi-nesses over others.
Another deleterious impact of the size restrictions is that it arbitrarily limits growth opportunities for small businesses. In order for businesses to maintain eligibility for the QSBS exclusion, they cannot exceed the $50 million gross asset limitation. This unnecessarily discourages corporations “from acquiring assets that will take it above the $50 million threshold, because any stock subsequently issued by the company will not qualify for the exclusion.”50
Not only does it unnecessarily cap businesses at an ar-bitrary size threshold, the QSBS provision likely encourages businesses to manipulate financial reporting and organiza-tional structure to get around the size caps. This potential unintended consequence is described in an excerpt from an
assessment of small business tax incentives:
When a tax incentive is determined by the size of a business, owners will be enticed to artificially manipu-late the size of their business (e.g., slow natural growth or split into separate entities), to take advantage of the incentive. This creates administrative headaches for the Internal Revenue Service to discover such tax shelter-ing behavior and may artificially suppress the natural growth and productivity of some small businesses.51
Finally, the QSBS exemption duplicates other federal initiatives and expenditures made through the SBA. The SBA extends a host of small business loans, including the 7(a) Loan Guaranty Program, the Section 504 Loan Program, and the Microloan Program.
The partial exclusion for gains on the sale or exchange of QSBS seems intended to increase the flow of equity capital to new ventures, small firms, and SSBICs that are having difficulty raising capital from traditional sources such as banks, angel investors, family members, or venture capital firms. It does this by boosting the potential after-tax rate of return a qualified investor could earn by buying and selling QSBS, relative to other investments.52
Moreover, the SBIC Program most directly duplicates the intent of the Section 2012 provision to encourage equity investments in small businesses that are trying to overcome the debt bias in the tax code. The SBIC program is intended to provide access to venture capital for small businesses, in order to fill a purported unmet demand for equity financing rather than the typical credit based support from SBA loan guarantee programs. Through the program, the SBA licenses privately managed and controlled SBICs (there are currently 301 licensed SBICs) that combine privately raised capital with funds borrowed at favorable rates due to a SBA guarantee on their credit. These combined funds are then invested in small businesses as equity, convertible debt, loans or guarantees of obligation to creditors. In 2012, SBA guaranteed $1.9 billion in leverage and the SBICs raised $1.4 billion in private capital to provide $3.3 billion in investments into 1,094 small businesses.
The SBIC is an on-budget program that provides guarantees and incentivizes equity investments in small businesses, the exact same purpose of the Section 1202 exclusion. Moreover, multiple other federal government programs exist to promote access to affordable financing for small businesses. The Section 1202 provision unnecessarily complicates the federal government’s sprawling programs which distort market signals and simply duplicate the efforts of the SBA.
THE SECTION 1202 EXCLUSION DISTORTS MARKET PRICES AND DISRUPTS ECONOMIC GROWTH RATHER THAN PROMOTING IT.

114 | Tax Decoder Financial Services | 115
SMALL LIFE INSURANCE COMPANY DEDUCTION: SECTION 806
The Small Life Insurance Company Deduction (SLICD) is one of the many special tax carve-outs that distorts market signaling and subsidizes a particular industry— in this case, certain life insurance companies.
The Small Life Insurance Company Deduction allows certain sized insurance companies to deduct approximately 60 percent of their taxable income. The deduction is reduced by 15 percent of the amount of taxable income that exceeds $3 million, fully eliminating the deduction with taxable income of $15 million or more.53 All told, the maximum deduction could total $1.8 million per company, reducing the effective tax rate from 35 percent to 14 percent.54
The deduction was created during consideration of the Tax Reform Act of 1984, as a way to lower the total revenue generated from taxing the insurance industry. Congress aimed to generate a predetermined level of tax revenue from the life insurance industry, but when the proposed rates exceeded these targets, the deduction was created to reduce federal revenues.55
This type of tax preference, based on certain income and asset requirements, changes the behavior of private companies that can manipulate their business structure to ensure they are receiving the benefit. In some cases, participants may even enter the market in order to receive the deduction and avoid paying taxes. This appears to be occurring with certain trial lawyers, utilizing small insurance companies to reduce their own tax liabilities.
Since many trial lawyers are paid on a contingency fee basis, they face large tax bills periodically which can put them in a higher tax bracket when paid. Seeing an opportunity in SLICD, some have even proposed forming life insurance companies for the very purpose of taking advantage of the generous tax breaks.
The Law Office of Gerald R. Nowotny publicized his tax strategy by advising lawyers to a set of insurance companies which keep 51 percent of the companies’ reserves in life insurance.56 Using this strategy, these companies can claim the SLICD, in addition to other tax breaks for insurance companies, to receive favorable tax treatment on life events.
For instance, the proposed tax strategy requires the insurance company to include in its underwritten policy payments starting the year the beneficiary’s child starts college and the four years thereafter, ultimately paying a lump-sum payment upon the beneficiary’s death. Since life insurance proceeds are generally received tax-free, this scheme is a way
to avoid taxes, both on the life insurance proceeds and the income generated by the insurance company.
Because the lawyer assigns to the life insurance company rights to collect contingency fee awards, the lawyer’s income receives special tax treatment which would have otherwise been paid and taxed directly to the lawyer as ordinary income.
This creative tax planning demonstrates the ability of taxpayers to manipulate tax advantages when opportunities are made available. However, even though such complex tax strategies may be legal, most hardworking Americans simply do not have the means to utilize these sorts of aggressive plans, ultimately allowing the richest in society to pay lower effective tax rates.
Rather than assist small companies in an industry predom-inately controlled by larger firms, this manipulation of SLICD means taxpayers are helping those who need it the least.
The deduction results in less than $50 million in tax revenue lost each year and $200 million from FY 2014 through FY 2018.57
One of the fundamental problems with SLICD is that its special treatment of small life insurance companies gives these market participants a distinct advantage over other businesses, both inside and outside of the industry. As investors search the market for the most optimal investment opportunities, the 60 percent of taxable income deduction offered by SLICD provides a comparatively higher return since small life insurance companies can expect a higher net profit margin. Such advantages place Congress in an unfair position to select winners and losers in the private sector at the expense of taxpayers.
SLICD provides preferential treatment to small life insurance companies, and Congress should consider eliminating the deduction.
Recommendations
Given the questionable necessity and benefits of the QSBS carve out, Congress should eliminate Section 1202 in conjunction with comprehensive tax reform. Importantly, small businesses that do not have the capacity to hire armies of accountants to navigate the overly complex code will reap tremendous benefits from tax simplification.

DRAFT
116 | Tax Decoder
FEDERAL TAX EXEMPTION OF CREDIT UNION INCOME With millions of Americans conducting their regular banking activities at a credit union, these institutions operate largely in
competition with traditional banks. Credit unions, however, benefit from one of the most substantive tax advantages provided to a single industry in the tax code — they are considered nonprofit organizations and exempt from federal income taxes.
More than 100 million people across the country bank at a credit union.58 Credit union membership at the nearly 7,000 credit unions jumped by more than 2.85 million participants in just the last year.59
With extensive growth in membership, revenue and assets, the nature of credit union banking has changed significantly over the last 40 years. Yet, their tax-exempt status has not changed to reflect this revolution in the industry. In fact, credit unions are “the only depository institutions exempt from federal income taxes,” notes the Congressional Research Service.60
This exemption will cost taxpayers $2.1 billion in FY 2014 and $11.9 billion from FY 2014 through FY 2018.61
Background
Credit unions were created to serve as “cooperative organizations” for the financial benefit of their members, providing access to credit and other financial services.62
The first credit union in the United States, La Caisse Pop-ulaire, Ste-Marie of Manchester, New Hampshire, was estab-lished in 1908 to help a group of local French-Canadian immi-grant mill workers to save and borrow money. Founded by the pastor of the local parish, the first credit union was run out of the home of its first president and they used a metal box pur-chased from the local daily newspaper as the safe.63
Congress explicitly exempted credit unions from federal income taxes in 1937, based on the assumption that “credit unions are mutual or cooperative organizations operated entirely by and for their members.”64 Mutual banks and savings and loans institutions also enjoyed tax-exempt status from the same provision in the tax code.
All of these institutions retained this status until the Revenue Act of 1951 repealed the tax exemption for these institutions due to the resemblance of competition with for-profit financial institutions.65 The exemption for credit unions, however, remained in the tax code, and 60 years later they continue to receive a different tax treatment from that of other mutual banks and savings and loans institutions.66
The Tax Code Distorts Competition between Similar Business
Credit unions are the only depositary institutions exempt from federal income taxes, yet they compete directly with
AS THE CREDIT UNION INDUSTRY HAS EVOLVED, THE HISTORICAL DISTINCTION BETWEEN CREDIT UNIONS AND OTHER DEPOSITORY INSTITUTIONS HAS CONTINUED TO BLUR.
FROM 2003 TO 2012, THE ASSET SIZE OF THE CREDIT UNION
INDUSTRY NEARLY DOUBLED, FROM $610.1 BILLION TO $1.02 BILLION.
financial institutions that do not enjoy the same tax status, such as traditional banks.
Supporters of the tax exemption claim that despite deregulation, credit unions are still unique depository institutions. However, the Government Accountability Office (GAO) notes that “as the credit union industry has evolved, the historical distinction between credit unions and other depository institutions has continued to blur.”67
“The credit union industry has evolved with marketplace changes so that many of the financial services that credit unions provide are similar to those offered by banks and savings associations,” acknowledged the Congressional Research Service.
Similar to their taxed depositary institution counterparts, credit unions “serve the general public and provide many of the services offered by savings and loans and mutual savings banks—including mortgages and car loans, access to automatic tellers, credit cards, individual retirement accounts, and discount brokerage services.”68
The special tax status allows credit unions to pay members higher dividends and charge members lower interest rates on loans, giving them a leg up against their competition that is not sheltered from the federal tax code. One study found that credit unions gain a 50 basis point advantage over their financial services competitors due to the special tax treatment.69
According to the CRS, the tax exemption “may have contributed to the more rapid growth of credit unions compared to other depositary institutions.”70 From 2003 to 2012, the asset size of the credit union industry nearly doubled from $610.1 billion to $1.02 trillion.71

116 | Tax Decoder Financial Services | 117

DRAFT
118 | Tax Decoder
Moreover, consolidation in the industry has resulted in the more than 100-fold increase of credit unions with more than $1 billion in assets over the last 20 years. As of 2012, more than half of the total assets held by the industry are controlled by fewer than 200 credit unions (or two percent of all credit unions).
These large credit unions can use their tax-exempt status for their “retained earnings to expand and thus displace the services of other thrift institutions, even though the latter may provide those services more efficiently.”72 The regulatory cost advantages that favor credit unions increase with their size and the larger credit unions “tend to hold more mortgage and real estate loans, resembling those of similarly sized banks.”73
Credit unions move beyond small member based financial services
Advocates of the credit union tax exemption also justify the status because it allows them to offer “unique services, such as small loans, financial counseling, and low-cost checking accounts.”74 But credit unions have found a way to expand from the traditional financial products and residential and consumer lending activities. The Spokane Teachers Credit Union, for instance, helped finance a boutique hotel in Spokane with a $2.9 million commercial loan.75
“Credit unions have fewer powers available to them than do banks and thrifts…. but, through [credit union service organizations], credit unions may provide their members with a panoply of sophisticated financial services and products that rivals the offerings of banks and thrifts,”76
according to a 2001 Treasury Department report. Credit Union Service Organizations (CUSO) are corporate
structures, typically limited liabilities companies that allow several credit unions to operate as a collective. In 2005, the Texans Commercial Capital, LLC, disproved “the naysayers who’ve raised concerns on whether credit unions have the seasonality to pull off large business lending transactions.”77
Within its first year of business, the Texas based CUSO had “amassed more than 200 loans with $214 million in outstanding loan balances,” including the financing of Prism Hotel’s acquisition and renovation of the 280-room Radison Memphis Hotel in Tennessee.78 Investments by credit unions in CUSOs have increased since the 2008 financial crisis. As of 2012, there were roughly 760 CUSOs that held more than $2 billion in funding from credit unions.79
The Credit Union Membership Access Act placed a cap on credit union member business lending (MBL) activities. Credit unions are statutorily unable to hold more than 12.5 percent of their assets as MBL loans. In order to get around this limit, some credit unions are forming participation agreements to sell portions of their MBL loans to larger credit unions that have more room to hold the loans without
hitting their 12.5 percent MBL limit. Between 2007 and 2012, the amount of credit unions utilizing these arrangements increased by 15 percent, and the value of the loans shared through the participation agreements grew by more than 40 percent.80 During this same period, charge-offs on the participation loans increased by more than 160 percent.
The Navy Federal Credit Union, the largest credit union in the world, launched a commercial participation loan program that allows other credit unions to originate commercial loans. Navy Federal Credit Union will subsequently purchase between 40-60 percent of the commercial loan amount. Navy Federal Credit Union has 30 business development offices in its major markets to try to sell these partnership deals to chambers of commerce, banks, and other credit unions. According to the Washington Business Journal, “most of the loans so far have been for commercial real estate projects, with Navy Federal’s portion of the deal coming in at $1 million or more.”81
The median size for the large credit union MBL loans was $303,958 in 2012.82 In comparison, the “average commercial and industrial loan size for all domestic commercial banks (excluding U.S. branches and agencies of foreign banks) by the end of 2012 was approximately $374,000.”83 The average loan size for small domestic banks, community banks that have to compete directly with large credit unions, was approximately $119,000.84
The non-partisan Tax Foundation found that
credit unions continue to grow faster than banks, have little practical limitations on membership, and make business loans that increasingly have no limits on who can borrow, how much or for what purpose.85
The Common Bond Eviscerated by Congress
The Federal Credit Union Act of 1934 restricted membership to “groups having a common bond of occupation or association, or to groups within a well-defined neighborhood, community or rural district.” This original common bond requirement promoted safety and soundness of the financial institution by creating a close relationship among its members. The common bond requirement meant that “Congress effectively tapped the members of the credit union to monitor each other.”86
The unifying characteristic of a “common bond” is why credit unions herald themselves unique establishments justifying an equally unique tax status. Credit unions only accept deposits of members and make loans to those members or other credit unions and credit union organizations. However, these credit unions are not niche establishments created to serve narrowly defined groups.
The original “common bond” requirement was broken

118 | Tax Decoder Financial Services | 119
after the financial turmoil of the late 1970s and early 1980s threatened the stability of federal credit unions. Following these disruptions, the National Credit Union Administra-tion (NCUA) “made a series of administrative rulings that allowed multiple-group federal credit unions; that is, com-binations of existing federal credit unions that do not share a common bond.”87
The American Bankers Association (ABA) and several small North Carolina banks challenged the new multi-group field of membership expansions with a lawsuit. In 1998, the Supreme Court heard the challenge and ruled that credit union membership should be limited “to individuals within a single company, community or occupation” per the original statute established by the Federal Credit Union Act (FCUA) of 1934.88
This decision would not stand for long. Congress immediately reacted to the Supreme Court’s ruling and passed the Credit Union Membership Access Act, sponsored by then-Speaker Newt Gingrich. The Act grandfathered in all of the pre-court ruling federal credit unions and provided for “future multiple-group formations subject to limitations that the NCUA must consider when authorizing charters.”89
Today, a distinctly unique “common bond” justifying special tax treatment for credit unions has been eviscerated. While the Federal Credit Union Act of 1934 included in its definition of common bond a “well-defined neighborhood, community or rural district,” today some credit unions cover expansive or heavily populated territory. The Wescom Credit Union eligibility extends to “the 16 million people living in Los Angeles, Ventura, Orange, Riverside, and San Bernardino Counties.”90
In 2002, the Boeing Employees’ Credit Union (BECU) expanded its member eligibility to include everybody that lives in the state of Washington. With more than 825,000 members and $11.4 billion in assets, BECU is now the fourth
largest credit union in the United States.91
Credit union membership is no longer bound by occupational or associational constraints either. The Consumer Cooperative Credit Union (CCU) boasts that “CCU Membership is unique….Regardless of where you live or work, you are eligible to join.”92
Some credit unions allow anybody to buy their way into membership for as little as five dollars. Eligibility for membership at Alliant Credit Union is automatically extended to anybody living and working in the Chicago area. For those that do not live in the Chicago area, it only takes a $10 donation to Foster Care to Success to join the 234,003 member institution with $5.9 billion in assets.93
To open an account with Connexus Credit Union, one only needs to make a $5 donation to a charitable organization.94
Meanwhile, becoming an eligible member of the Pentagon Federal Credit union, the 3rd largest credit union in the United States, only requires a one-time donation of $20 to the National Military Family Association or a one-time $15 donation to Voices for America’s Troops.95
Simply joining the American Consumer Council (a nonprofit consumer education, advocacy and financial literacy organization) for a $5 fee allows a person to become a member in their choice of 50 different credit unions, including the State Department Credit Union, the US Postal Service Credit Union, Indiana State University Credit Union, University of Kentucky Credit Union, Marine Savings Credit Union, Police and Fire Credit Union, and NASA Credit Union.96
It is doubtful the authors of the original Federal Credit Union Act (FCUA) of 1934, would consider the state of Washington as a well-defined neighbor or the act of giving $5 dollars to a charity as a “common bond” for members to join around and obtain special tax treatment.
Even so, these now-amorphously defined institutions get to reap the same tax benefits that were intended for
Simply signing up for the American Consumer Council for $5 opens up eligibility to any of 50 different credit unions, such as Fort Knox Federal Credit Union

DRAFT
120 | Tax Decoder
institutions that serve low-income individuals with little access to financial services such as a group of immigrant mill workers in Manchester, New Hampshire.
Who Benefits?
Advocates of protecting the tax-exempt status for credit unions contend it allows the entities to provide services targeted at low-income members at reduced or free prices. Even Congress suggested this notion during the passage of the Credit Union Membership Access Act in 1998, which found “credit unions, unlike many other participants in the financial services market, are exempt from Federal and most State taxes because they are member-owned, democratically operated, not-for-profit organizations generally managed by volunteer boards of directors and because they have the specified mission of meeting the credit and savings needs of consumers, especially persons of modest means.”
The data, however, appears to dispute the anecdotal notion that credit unions primarily assist those of modest means. A GAO analysis of available data provided “some indication that, compared with banks, credit unions served a slightly lower proportion of households with low and moderate incomes.”97 GAO found that “31 percent of households that only and primarily used credit unions were of modest means versus 41 percent for households that only and primarily used banks.”98
Is there an economic rationale for the tax-exempt status?
The current model of many credit unions no longer comport with the original justification of the special tax treatment for credit unions. Instead, “the principal justification for the tax exemption would seem to be that it already exists and, therefore, removing it could adversely impact thousands of institutions and their customers,” as noted by the Tax Foundation.99 The tax-exempt status of credit unions, like many of the hundreds of other carve outs in the tax code, has survived based on the power of political constituency and the momentum of the status quo.
Recommendation: The Credit Union Tax Exemption Should be Eliminated
Removing the tax-exempt status of credit unions has been proposed several times by administrations from both parties, including the following.100
• President Jimmy Carter proposed a five year phase out of the tax exemption in 1978.
• The Department of Treasury under President Ronald Reagan’s administration issued a report in 1984 to eliminate the tax exemption, followed by the Reagan administration proposing the repeal of tax-exempt status for credit unions with more than $5 million in gross assets the following year.
• President George H.W. Bush proposed the elimination of the tax exemption for credit unions with assets in excess of $50 million in the 1993 Fiscal Year budget.
• The chairman of the Federal Depositary Insurance Commission (FDIC) under President George W. Bush said that “credit unions ought to pay taxes” in 2004.
• President Barack Obama administration’s President’s Economic Recovery Advisory Board (PERAB) issued a report with options for corporate tax reform, which included reducing or eliminating the credit union tax exemption.
Congress has diluted the original statuary intent and it is clear credit unions no longer have to subscribe to a common bond, no long longer have the unique purpose of serving the needs of those with modest income, distorts competition within similar institutions and has no economic justification to exist.
Congress should eliminate the tax-exempt status of credit unions as part of comprehensive tax reform, a process by which members of credit unions and non-members alike will undoubtedly benefit from the bounty of enhanced economic growth.

120 | Tax Decoder Financial Services | 121
1 Lattman, Peter, “Peterson’s Public Break From Private Equity’s Line on Taxes,” New York Times, November 29 2010, http://goo.gl/U8izWm. 2 Marples, Donald J., “Taxation of Hedge Fund and Private Equity Managers,” Congressional Research Service, March 7 2014, http://goo.gl/6lYR3s. 3 Fund managers also receive returns on any equity they personally invest in the fund 4 The difference between ordinary income rates and capital gains is 39.6% compared to 20% for the highest income bracket 5 Marples, Donald J., “Taxation of Hedge Fund and Private Equity Managers,” Congressional Research Service, March 7 2014, http://goo.gl/6lYR3s. 6 “Options for Reducing the Deficit: 2014 to 2023,” Congressional Budget Office, November 2013, http://goo.gl/a636VW 7 Marples, Donald J., “Taxation of Hedge Fund and Private Equity Managers,” Congressional Research Service, March 7 2014, http://goo.gl/6lYR3s. 8 Marples, Donald J., “Taxation of Hedge Fund and Private Equity Managers,” Congressional Research Service, March 7 2014, http://goo.gl/6lYR3s. 9 “Todd A. and Carolyn D. Dagres, Petitioners v. Commissioner of Internal Revenue, Respondent,” United states Tax Court, http://goo.gl/ddTqNl. 10 “Carried Interest,” Managed Funds Association, http://goo.gl/dGGPVB. 11 “Carried Interest,” Managed Funds Association, http://goo.gl/dGGPVB. 12 “Carried Interest,” Private Equity Growth Capital Council, http://goo.gl/vKFV4w. and “Carried Interest,” Managed Funds Association, http://goo.gl/dGGPVB. 13 “Corporation Income Tax Brackets and Rates, 1909-2002,” IRS, http://goo.gl/F46eIB. 14 Maremont, Mark et al. “Shift to Wealthier Clientele Puts Life Insurers in a Bind,” Wall Street Journal,October 3 2010, http://goo.gl/5CMyg7. 15 Marr, Chuck et al. “Tax Expenditure Reform: An Essential Ingredient of Needed Deficit Reduction,” Center on Budget and Policy Priorities, February 27 2013, http://
goo.gl/nbG8jz. 16 Pike, Andrew, “Taxation of Life Insurance Products: Background and Issues,” Congressional Research Service, July 18 2003, http://goo.gl/wtJN60. 17 Pike, Andrew, “Taxation of Life Insurance Products: Background and Issues,” Congressional Research Service, July 18 2003, http://goo.gl/wtJN60. 18 Pike, Andrew, “Taxation of Life Insurance Products: Background and Issues,” Congressional Research Service, July 18 2003, http://goo.gl/wtJN60. 19 Expenses to administer the life insurance policy are also incorporated into the premium rates 20 “Living with Cash-Value Life Insurance,” Annuity Advantage, http://goo.gl/tZJsgd. 21 “Estimates of Federal Tax Expenditures for Fiscal Years 2014-2018,” Joint Committee on Taxation, August 5 2014, http://goo.gl/QSAz1O. 22 Johnson, Calvin H., “Tax on Insurance Buildup,” University of Texas, February 2 2009, http://goo.gl/kQlnug. 23 “Tax Expenditures: Compendium of Background Material on Individual Provisions,” Congressional Research Service, December 2012, http://goo.gl/oOOCZh 24 Pike, Andrew, “Taxation of Life Insurance Products: Background and Issues,” Congressional Research Service, July 18 2003, http://goo.gl/wtJN60. 25 Pike, Andrew, “Taxation of Life Insurance Products: Background and Issues,” Congressional Research Service, July 18 2003, http://goo.gl/wtJN60. 26 Pike, Andrew, “Taxation of Life Insurance Products: Background and Issues,” Congressional Research Service, July 18 2003, http://goo.gl/wtJN60. 27 Pike, Andrew, “Taxation of Life Insurance Products: Background and Issues,” Congressional Research Service, July 18 2003, http://goo.gl/wtJN60. 28 Marr, Chuck et al. “Tax Expenditure Reform: An Essential Ingredient of Needed Deficit Reduction,” Center on Budget and Policy Priorities, February 27 2013, http://
goo.gl/nbG8jz. 29 Anderson, Brian, “The dangers of ignoring the middle market,” LifeHealthPro, http://goo.gl/ekgzgM. 30 Anderson, Brian, “Tax advantages of life insurance at risk again in 2013?” LifeHealthPro, http://goo.gl/cfqQdy. 31 Anderson, Brian, “The dangers of ignoring the middle market,” LifeHealthPro, http://goo.gl/ekgzgM. 32 Anderson, Brian, “Tax advantages of life insurance at risk again in 2013?” LifeHealthPro, http://goo.gl/cfqQdy. 33 Maremont, Mark et al. “Shift to Wealthier Clientele Puts Life Insurers in a Bind,” Wall Street Journal, October 3 2010, http://goo.gl/ZeLZWs. 34 Maremont, Mark et al. “Shift to Wealthier Clientele Puts Life Insurers in a Bind,” Wall Street Journal, October 3 2010, http://goo.gl/ZeLZWs. 35 Maremont, Mark et al. “Shift to Wealthier Clientele Puts Life Insurers in a Bind,” Wall Street Journal, October 3 2010, http://goo.gl/ZeLZWs. 36 Anderson, Brian, “The dangers of ignoring the middle market,” LifeHealthPro, http://goo.gl/ekgzgM. 37 Anderson, Brian, “The dangers of ignoring the middle market,” LifeHealthPro, http://goo.gl/ekgzgM. 38 “Options for Reducing the Deficit: 2014 to 2023,” Congressional Budget Office, November 2013, http://goo.gl/KpbSpN. 39 “FY 2015 Congressional Budget Justification: Budget Request in Brief,” U.S. Small Business Administration, http://goo.gl/WbHys6. 40 Dilger, Robert Jay et al. “Small Busines Adminsitration: A Primer on Programs and Funding,” Congressional Research Service, October 9 2014, http://goo.gl/zv3K7u. 41 Dilger, Robert Jay, “Small Business: Access to Capitol and Job Creation,” Congressional Research Service, August 6 2014, http://goo.gl/hehssJ. 42 Guenther, Gary, “Small Business Tax Benefits: Current Law and Main Arguments For and Against Them,” Congressional Research Service, April 3 2013, http://goo.
gl/qniDLS. 43 “Gambling with New Corporations: 100% Gain Exclusion on the Sale of Qualified Business Stock,” Sussman Shank LLP Attorneys, August 2011, http://goo.gl/XEZGlj. 44 McGuire, Brad et al. “Qualified Small Business Stock: An Opportunity for Tech Startups,” American Institute of CPAs, October 1 2013, http://goo.gl/aRn1KC. 45 “Individual Income Tax Receipts and the Individual Tax Base - February 2014 Baseline,” Tab 7: Effects of Extending Tax Provisions Scheduled to Expire Before 2024,
Congressional Budget Office, February 4 2014, http://goo.gl/yh7bxH. 46 “Estimates of Federal Tax Expenditures for Fiscal Years 2014-2018,” Joint Committee on Taxation, August 5 2014, http://goo.gl/QSAz1O. 47 Wilson, Ronald F., “Federal Tax Policy: The Political Influence of American Small Business,” South Texas Law Review, Volume 37, 1996, http://goo.gl/QMtaFf. 48 Guenther, Gary, “Small Business Tax Benefits: Current Law and Main Arguments For and Against Them,” Congressional Research Service, April 3 2013, http://goo.
gl/qniDLS. 49 Guenther, Gary, “Small Business Tax Benefits: Current Law and Main Arguments For and Against Them,” Congressional Research Service, April 3 2013, http://goo.
gl/qniDLS. 50 Viard, Alan D., “The Misdirected Debate and the Small Business Stock Exclusion,” Tax Notes, 2012, http://goo.gl/ZDEeJM. 51 Wilson, Ronald F., “Federal Tax Policy: The Political Influence of American Small Business,” South Texas Law Review, Volume 37, 1996, http://goo.gl/QMtaFf. 52 “2012 Tax Expenditures Compendium,” Congressional Research Service, December 21 2012. 53 “26 U.S. Code § 806 - Small life insurance company deduction,” Legal Information Institute, http://goo.gl/Gr61be. 54 Pike, Andrew D., “Taxation of Life Insurance Companies,” Congressional Research Service, December 24 2003, http://goo.gl/OK9i9Z. 55 Pike, Andrew D., “Taxation of Life Insurance Companies,” Congressional Research Service, December 24 2003, http://goo.gl/OK9i9Z. 56 Nowotny, Gerald, “Tax Reduction and Deferral Strategies for Trial Attorneys - Part 2,” JDSupra Business Advisor, September 19 2012, http://goo.gl/234j8h. 57 “Estimates of Federal Tax Expenditures for Fiscal Years 2014-2018,” Joint Committee on Taxation, August 5 2014, http://goo.gl/QSAz1O. 58 Cole, Marine, “Why 100 million people bank at credit unions,” The Fiscal Times, August 22 2014, http://goo.gl/iSve1B. 59 Cole, Marine, “Why 100 million people bank at credit unions,” The Fiscal Times, August 22 2014, http://goo.gl/iSve1B. 60 “Tax Expenditures: Compendium of Background Material on Individual Provisions,” Congressional Research Service, December 2012, http://goo.gl/oOOCZh 61 “Estimates of Federal Tax Expenditures for Fiscal Years 2014-2018,” Joint Committee on Taxation, August 5 2014, http://goo.gl/QSAz1O. 62 Getter, Darryl E., “Policy Issues Related to Credit Union Lending” Congressional Research Service, July 8 2014., http://goo.gl/0l9BPp. 63 “Our History,” St. Mary’s Bank, 2007, http://goo.gl/p3TlR5. 64 “Credit Union Federal Tax Exemption Study,” NAFCU, 2014, http://goo.gl/Ia1P46. 65 Bickley, James M., “Should Credit Unions be Taxed?,” Congressional Research Service, September 8 2010, http://goo.gl/jc3dIX. 66 “Tax Expenditures: Compendium of Background Material on Individual Provisions,” Congressional Research Service, December 2012, http://goo.gl/oOOCZh 67 “Financial Institutions Issues Regarding the Tax Exempt Status of Credit Unions,” GAO, November 3 2005, http://goo.gl/lYP985. 68 “Budget Options Volume 2,” CBO, August 2009, http://goo.gl/JTYhWI. 69 Tatom, John A., “Competitive Advantage: A Study of the Federal Tax Exemption for Credit Unions,” Tax Foundation, February 28 2005, http://goo.gl/uCJIf0. 70 70 “Tax Expenditures: Compendium of Background Material on Individual Provisions,” Congressional Research Service, December 2012, http://goo.gl/oOOCZh 71 Getter, Darryl E., “Policy Issues Related to Credit Union Lending,” Congressional Research Service, July 8 2014, http://goo.gl/0l9BPp. 72 “Budget Options Volume 2,” CBO, August 2009, http://goo.gl/JTYhWI. 73 “Financial Institutions Issues Regarding the Tax Exempt Status of Credit Unions,” GAO, November 3 2005, http://goo.gl/KvbwWO. 74 “Tax Expenditures: Compendium of Background Material on Individual Provisions,” Congressional Research Service, December 2012, http://goo.gl/oOOCZh 75 “Spokane Teacher CU’s Commercial Loan Helps Renaissance in Spokane,” Credit Union Times, April 21 2004, http://goo.gl/xoGvdH. 76 “Comparing Credit Unions with Other Depositary Institutions,” United States Department of the Treasury, January 2001, http://goo.gl/tReAKu. 77 “Texans CU’s Business CUSO Taking Off; Loans Range from Multi-Million to Just Thousands,” Credit Union Times, February 2 2005, http://goo.gl/brjzg0.

DRAFT
122 | Tax Decoder
78 “Texans CU’s Business CUSO Taking Off; Loans Range from Multi-Million to Just Thousands,” Credit Union Times, February 2 2005, http://goo.gl/brjzg0. 79 Douglas, Danielle, “Credit Unions Worry about New Regulation,” Washington Post, March 4 2012, http://goo.gl/w8r6XM. 80 Getter, Darryl E., “Policy Issues Related to Credit Union Lending,” Congressional Research Service, July 8 2014, http://goo.gl/0l9BPp. 81 Switzky, Bryant R., “Navy Federal to the Rescue: Inside the Credit Union’s Initiative to Boost Business Lending,” BIZ Beat, Jul 17 2013, http://goo.gl/nNaoWh. 82 Getter, Darryl E., “Policy Issues Related to Credit Union Lending,” Congressional Research Service, July 8 2014, http://goo.gl/0l9BPp. 83 Getter, Darryl E., “Policy Issues Related to Credit Union Lending,” Congressional Research Service, July 8 2014, http://goo.gl/0l9BPp. 84 Getter, Darryl E., “Policy Issues Related to Credit Union Lending,” Congressional Research Service, July 8 2014, http://goo.gl/0l9BPp. 85 Hodge, Scott A., “Credit Unions Say ‘Don’t Tax Me, Tax the Banks Behind the Tree,’” December 7 2012, http://goo.gl/ncjVml. 86 Brannon, Ike, “An Analysis of the Impact of Expanding the Ability of Credit Unions to Increase Commercial Loans,” Capital Policy Analytics Group, November 2012,
http://goo.gl/Bu5XYk. 87 Bickley, James M., “Should Credit Unions be Taxed?,” Congressional Research Service, September 8 2010, http://goo.gl/jc3dIX. 88 Savage, David G., “High Court Restricts Credit Union Membership,” Los Angeles Times, February 26 1998, http://goo.gl/8bBtHa. 89 Bickley, James M., “Should Credit Unions be Taxed?,” Congressional Research Service, September 8 2010, http://goo.gl/jc3dIX. 90 Plagge, Jeff, “Testimony,” U.S. House of Representatives Committee on Ways and Means, November 3 2005, http://goo.gl/FY7Rrg. 91 “BECU is your Community Credit,” BECU, 2014, http://goo.gl/HozRcV. 92 “Who We Are,” Consumers Credit Union, 2014, http://goo.gl/Mia5J4. 93 Goldwasser, Joan, “7 Great Credit Unions Anyone Can Join,” Kiplinger, April 2014, http://goo.gl/FTB17C. 94 Goldwasser, Joan, “7 Great Credit Unions Anyone Can Join,” Kiplinger, April 2014, http://goo.gl/FTB17C. 95 “How are you Eligible For PenFed Membership?,” PenFed, 2014, http://blog.penfed.org/ways-to-become-a-member/ 96 “How to become a Member,” American Consumer Council, http://goo.gl/wfreaa. 97 “Financial Institutions Issues Regarding the Tax Exempt Status of Credit Unions,” GAO, November 3 2005, http://goo.gl/lYP985. 98 “Credit Unions Greater Transparency Needed on Who Credit Unions Serve and on Senior Executive Compensation Arrangements,” GAO, November 2006, http://
goo.gl/qOLWAE. 99 Hodge, Scott A., “Credit Unions Say ‘Don’t Tax Me, Tax the Banks Behind the Tree,’” December 7 2012, http://goo.gl/ncjVml 100 “Tax Expenditures: Compendium of Background Material on Individual Provisions,” Congressional Research Service, December 2012, http://goo.gl/oOOCZh

122 | Tax Decoder Energy | 123
ENERGY

DRAFT
124 | Tax Decoder
Energy
The United States has been at the forefront of production and innovation in the energy industry since the discovery of oil in Titusville, Pennsylvania, in the 1850s. Advances in the industry have come through tremendous investment and achievement by some of the world’s greatest companies and individuals – sometimes with the aid of
the federal government, and oftentimes in spite of it.
As the third largest industry in America,1 the energy sector is vitally important to our national economy. From microwaving a cheeseburger to propelling a satellite into space, energy is at the center of practically every activity that takes place in modern society. In fact, one report found that without the economic contribution of the energy industry, predominately through the recent American oil and gas boom, our nation would continue to be in a recession.2
Because our economic vitality depends on a reliable supply of energy, Congress has unsurprisingly taken an acute interest in our nation’s energy policy. Unfortunately, this interest has increasingly resulted in attempts to shape our energy portfolio through a variety of regulations, grant programs, loan guarantees, and tax preferences. From 1999 to 2010, Congress increased energy related tax expenditures by at least 500 percent, using the tax code to influence domestic energy production and usage.3
This has resulted in a code rife with targeted provisions for various sectors of the energy industry, thus distorting investments in energy technology and development and undermining an efficient market-based energy sector. As the former chairman of the Senate Finance Committee pointed out, “our existing energy incentives provide different levels of subsidies for different technologies, picking winners and losers with no discernible policy rationale.”4
This lack of cohesion in energy tax policy should not be surprising, given that pressures from special interest groups, home-state businesses, and voter constituencies are all incorporated into the political decisions that create these energy policies. The economics of supply and demand are eschewed in a Congress primarily concerned with the optics of electability.
Some will argue that congressional intervention is needed to subsidize “clean” or carbon-emissions-free energy sources in order to correct market externalities that contribute to
climate change. While there is still much debate to be had on the impact of human-generated carbon emissions on the climate, the solution is the same regardless of the veracity of the gloom and doom climate change predictions. Whether or not policymakers conclude that cuts in carbon emissions are necessary, our country will be much better equipped to take the next step in our energy future with a strong, resilient economy. Maintaining a vibrant energy sector will always be a far superior option to suffocating prosperous energy resources which will cost jobs and economic growth.
The recent American energy boom, sparked by innovative technologies that allow the development of previously uneconomical oil and gas, has laid to rest the concerns of the last decade that America had reached the peak of its oil production. While fossil fuels will continue to be the dominant resource utilized in the global economy for decades to come, there will inevitably come a day that non-fossil energy sources will take over.
Even so, the federal government should not interfere with this process or attempt to artificially spur our economy in the direction of one technology at the expense of others. The failure of Congress’ artificial support for ethanol is a prime example of why our energy economy—and emerging energy technologies in particular—must be shaped by the free market rather than the agendas of politicians. As such, many energy tax provisions should simply be eliminated, thus allowing the disparate energy sources to compete against each other in the free market—which time and time again has proven to be remarkably effective at advancing the energy industry on its own.
The tax provisions related to energy generally fall into one of three areas: traditional fossil fuels, renewable and alternative energy sources, and energy efficiency activities. This section examines each of these three areas, as well as several other miscellaneous provisions.

124 | Tax Decoder Energy | 125
Energy (in millions) FY 2014 FY 2014 - FY 2018
Traditional Fossil Fuel Provisions
Amortization of All Geological & Geophysical Expenditures Over 2 Years
$100 $700
Election to Expense IDCs $1,100 $6,500
Excess of Percentage Over Cost Depletion $1,200 $8,700
Capital Gains Treatment of Coal Royalties $80 $520
Advanced Coal Project and Gasification Credit $200 $390
Indian Coal Credit $22 $192
Enhanced Oil Recovery Deduction for Tertiary Injectants * *
Marginal Wells * *
Renewable and Alternative Fuel Source Provisions
Credit for Electricity Produced from Certain Renewable Resources
$1,692 $20,655
Advanced Energy Project Investment Credit $300 $1,300
Biodiesel, Renewable Diesel, and Second Generation Biofuel $1,054 $7,351
Alternative and Alcohol Fuel Credit $300 $2,071
Fuel Cell Vehicles $50 $100
Plug-In Electric-Drive Motor & Electric-Drive Low-Speed, Motorcycle & Three-Wheeled Vehicles
$202 $1,112
Alternative Fuel Refueling Properties $21 $177
Energy Efficiency Provisions
Energy Efficient Commercial Buildings Deduction $95 $845
Manufacturer Credit for Energy Efficient Appliances $66 $691
Manufacturer Credit for New Energy Efficient Home $48 $600
Residential Energy Efficient Property Credits $1,100 $4,300
Energy Production Properties Credit for Businesses $500 $2,900
Nonbusiness Energy Property Credits $401 $7,099
Exclusion of Utility Conservation Subsidies $50 $100
Miscellaneous Properties
Industrial CO2 Capture and Sequestration Tax Credit $80 $660
Advanced Nuclear Power Production Credit $0 $680
Deferral of Gains from the Sale of Electric Transmission Property
$232 $1,081
Amortization of Pollution Control Facilities $400 $1,800
Depreciation Recovery Periods for Energy-Specific Items * *
Total $9,293 $70,524
* The revenue loss associated with these provisions is either unknown or not included in order to avoid double counting

DRAFT
126 | Tax Decoder
Traditional Fossil Fuel Provisions One of the most commonly cited bogeymen in politics is the government’s treatment of oil and gas companies. Generally,
this bogeyman goes by the moniker of “subsidies for oil companies,” an exceedingly misleading phrase which misrepresents the treatment of companies that explore for, produce, and refine the traditional fossil fuels—petroleum, natural gas, and coal.
When politicians or activists refer to subsidies for energy companies, they are usually referring to the tax treatment of these companies; traditional fossil fuel companies do not receive any direct spending subsidies from the federal government. Furthermore, while a number of tax provisions are targeted to these companies, several of these are not actually useful in the current economic environment, and several more are general tax provisions that are comparable to the tax treatment of many other industries.
A fair tax code would not provide targeted tax breaks to the different fuel sources, and as such, as part of overall reform of the tax code, many of the fossil fuel tax provisions should be eliminated. For those provisions that apply across all industries—generally, variations on deduction and amortization of costs—the treatment of oil, gas, and coal companies should be normalized and equal to companies in other industries.
There are at least eight fossil fuel provisions in the code, which will cost a total of $2.7 billion in FY 2014, and more than $17 billion from FY 2014 through FY 2018.6
Amortization of All Geological and Geophysical Expenditures Over Two Years (Sec. 167(h))
The costs associated with the normal process of constructing an oil and gas well generally break down into two components: the geological and geophysical costs associated with the well, and “intangible” drilling costs. The
tax treatment of these costs is defined by two different tax provisions—geological and geophysical cost amortization, covered in this section, and intangible drilling cost (IDC) expensing, covered in the next section.
Geological and geophysical costs (G&G) relate to the exploration for oil and gas reserves in the ground. Specifically, they are associated with the study and analysis of surface and subsurface rock formations, preliminary (exploratory) drilling, and measurement of subsurface structures, all in an attempt to discover recoverable oil and gas reserves.7
In an attempt to simplify the tax treatment of these costs, the Energy Policy Act of 2005 provided for the amortization of these costs over a defined period—two years for most energy companies, and seven years for the “major integrated” (i.e., largest) companies.8 Section 167(h) thereby accelerated the timetable on which these costs could be recovered through tax deductions, with the explicit goal of “substantial simplification for taxpayers, significant gains in taxpayer compliance, and reductions in administrative cost.”9 Other proponents see capital preservation for additional drilling as a goal of this provision.
A ConocoPhillips refinery in Wilmington, California5 A mobile drill rig being used for exploratory oil drilling

126 | Tax Decoder Energy | 127
Unfortunately, Section 167(h) has failed in at least one of these four admirable goals—simplification. Under Section 167(h), geological and geophysical costs are defined as those expenses associated with the exploration and development of oil and gas. These criteria have led to ambiguity in the application of the statute. According to KPMG, a leading tax services firm, this “has potentially blurred the line between G&G expenditures and IDC…The term ‘exploration’ has often been associated with G&G expenses, but the term ‘development’ has had limited association with G&G…This raises the question whether section 167(h) was intended to cover any ‘development’ activities historically viewed as being IDC.”10
Furthermore, this section raises the question of whether the G&G costs are to be treated as real property, given their new schedule as an amortizable product. If so, the costs should likely be factored into the calculation of other tax deductions. As KPMG puts it, however, “If the goal of simplified tax accounting for G&G expenses is the proper guide here, then probably not.”11
Ultimately, as discussed in this report’s section on depreciation, a clean tax code rewrite could allow for the full and immediate expensing of assets, and this would include the costs associated with geological and geophysical activities. In the absence of that change, Congress should avoid creating different asset schedules for different industries, and therefore the treatment of G&G costs should mirror all other industries’ assets.
This provision will cost nearly $100 million in FY 2014, and would cost nearly $700 million over the FY 2014-FY 2018 time period.12
Election to Expense Intangible Drilling Costs (Sec. 263(c) and 291)
Intangible drilling costs (IDCs) are costs necessary for drilling wells and preparing them to produce oil and gas.13
IDCs include all costs associated with the well that have no salvageable value—for example, the costs of clearing an area in preparation for drilling, fuel expenses, and wages associated with the drilling.14 Other expenses considered IDCs include grading and digging, the cost of roads to the drill site, crop damage payments to landowners, the costs of transporting the oil rig, the cost of water, mud, and other fluids used in drilling, and the cost of plugging the well if turns out to be nonproductive.15
IDC expensing has been in existence since the imposition of the income tax under the Revenue Act of 1913, and allows for the immediate deduction of “intangible” costs associated with drilling an oil and gas well.16 On a much smaller scale, cost-wise, wells containing other, miscellaneous fuels also qualify for the election.
Rather than deducting these expenses over the lifespan of the well’s production, most energy companies can deduct 100 percent of these costs in the year in which they are incurred. For the major, integrated companies, 70 percent of these costs can be deducted the first year, with the remainder deducted in the next five years.17
This accelerated schedule encourages drilling—especially by smaller, independent producers—as the upfront expenses and uncertainty associated with any one well could otherwise be prohibitive. According to Chesapeake Energy, approximately 70-80 percent of the cost of a shale gas well comes from IDCs; as such, the tax treatment of these costs
A drilling rig being used to drill an oil well.
An oil well drill bit.

DRAFT
128 | Tax Decoder
An oil and natural gas reserve in North Dakota Black Thunder Coal Mine near Wright, Wyoming
plays a critical role in determining whether or not to go forward with a specific project.18 Furthermore, accelerating the depreciation schedule for IDCs immediately frees up more capital for the driller, which can in turn be invested in new projects elsewhere in the company.
As with the amortization of G&G costs, a clean tax code rewrite could allow for the full and immediate expensing of investments in assets, and this would include intangible drilling costs. Therefore, current law accords with the ideal treatment of IDCs. However, this treatment is currently a provision specific to the oil and gas industry, and is not equal across all industries. This provision should be inspected in view of a comprehensive approach to the tax code. A level playing field for all companies would include normalized tax treatment for the costs of developing a specific product.
The revenue loss from expensing of intangible drilling costs is $1.1 billion for FY 2014 and $6 billion from FY 2014 through FY 2018 for oil and gas. For all other fuels, the cost over the five-year period is approximately $500 million.19
Excess of Percentage over Cost Depletion (Sec. 611-613A and 291)
Companies that extract minerals from the earth are allowed to deduct the costs associated with the capital investments in the mine. The amount of the deduction is determined based on the type of mineral and the intended use of the mineral—specifically, whether it is to be used as a fuel source or not. The amount of the deduction changes over time, and is determined based on the depletion of the reserve (the amount of the mineral taken out in a given year). The purpose of this calculation is to set mineral reserves on equal footing with traditional manufacturing equipment, which also depreciates in value over time. The majority
of the cost associated with this provision is due to claims associated with oil and gas reserves, although other fuels do qualify for the provision.
The deduction associated with depletion of a mineral reserve operates similarly to depreciation. The recovery of costs decreases over time, based on either the amount of the original cost of the investment in the reserve (cost depletion) or the amount of gross income generated from the reserve (percentage depletion). Under Section 613 of the current code, the mineral producers take the more advantageous of the two calculations, which invariably is the percentage depletion deduction.20
Percentage depletion was first introduced in the tax code in 1926 to encourage development of oil and natural gas reserves.21 It was soon expanded to coal reserves, and later to other fuel and non-fuel minerals. Originally the percentage depletion rate was set at 27.5 percent and was limited to 50 percent of the net income from the reserve; the rate was reduced to 22 percent in 1969, and then to 15 percent in 1975. At the time of the last reduction, the depletion was limited to the first 1000 barrels per day and capped at 65 percent of net income provided by each well, and the “major” oil companies were prohibited from receiving the deduction. This left only the smaller, “independent” companies as recipients of the deduction. Finally, in 1990 the income limitation was increased to 100 percent for each reserve.
Under current law, then, any firm that is not a “major” oil and gas company may use the percentage depletion rate of 15 percent on the first 1000 barrels per day, up to 100 percent of the net income of the reserve.22 The rate for other types of minerals varies from 5 percent to 22 percent, with a net income limitation of 50 percent.
The cost of this provision is $1 billion in FY 2014, and $7.4 billion over the period from FY 2014-FY 2018. For all other fuels, the cost is $200 million in FY 2014, and $1.3 billion over the five-year period.23 These figures are the difference

128 | Tax Decoder Energy | 129
between the cost of the deductions that would be allowed under cost depletion and the cost of the deductions that are allowed under percentage depletion.
Capital Gains Treatment of Coal Royalties (Sec. 631(c))
Certain sales of coal under royalty contracts qualify for taxation under the lower capital gains rate, rather than the ordinary income rate. Specifically, taxpayers who lease mining rights for coal or lignite may treat the royalties from the mining operation as a capital gain.24 The taxable amount of the income is the price for which the coal was sold, minus the cost of the original property and any improvements. A few other adjustments may also go into the calculation. The taxpayer must hold the property for at least a year to qualify for the capital gains treatment.25
If a taxpayer elects this treatment, he must forfeit another benefit commonly available to small coal producers, percent-age depletion. Under current capital gains rates, however, the taxpayer will generally end up paying less in tax even with the loss of percentage depletion. According to CRS:
“Capital gains treatment for coal royalties was added in 1951 to equalize the treatment of coal lessors, to provide benefits to long-term lessors with low royalties who were unlikely to benefit from percentage depletion, and to encourage coal production.”
CRS notes the provision is sometimes defended “on the basis of risk and protection of domestic industry.”
The economic justification for the capital gains tax treatment of coal is unclear. The capital gains rate was created to tax the appreciation of assets like stocks or investment properties. There is no clear reason to apply this special tax treatment to coal sales.
Essentially the same capital gains treatment is available for iron ore mining. Yet, it is not available for other materials commonly mined in the U.S., such as gold, copper, nickel, and zinc.26 The capital gains treatment for two specific mining industries appears to be largely arbitrary. This special treatment should be eliminated.
The “capital gains treatment of royalties on coal” will cost $80 million in FY 2014 and $520 million from FY 2014 through FY 2018.27
Advanced Coal Project and Gasification Credit (Sec. 48A and 48B)
Two tax credits were created by the Energy Policy Act of 2005 for certain advanced clean coal and gasification technologies. Qualifying investments that were approved by the Secretary of the Treasury, together with officials at the Department of Energy, were eligible for up to a 30 percent tax credit. These tax breaks were only available for specific, approved projects and were distributed similarly to direct grants more typically found in discretionary spending programs.28 The authority to use these credits has been fully allocated.
In 2010, a $417 million clean coal investment tax credit was awarded to a 602-megawatt facility in Taylorville, Illinois. The company that received the award believed the credit “to be the largest ever granted to a single project.” The same facility had already received a $2.579 billion loan guarantee, which brought the federal support for this one facility to $3 billion out of its $3.6 billion total cost.29 Despite the significant federal investment, the project was eventually shelved by the developer for cost and regulatory reasons.30
Much of the U.S. electric market is coal-based, and supporting the industry should remain an important priority. However, there is still “uncertainty surrounding
Black Thunder Coal Mine near Wright, Wyoming. Westmoreland Coal mine on Crow tribal land

DRAFT
130 | Tax Decoder
the economic feasibility and commercial viability” of clean coal and gasification facilities, according to the Congressional Research Service. Congress should stop supporting an industry that relies upon what CRS describes as “economically unproven technologies in the sense that none may have become commercial without significant subsidies.”31
Since the tax credits for these two provisions have been fully allocated, Congress should repeal the authorizing statute and end any future attempt to subsidize these technologies.
The recipients of the credits have not yet used all of the credits allocated to them, so they continue to cost federal revenue. The “credit for investment in clean coal facilities” will cost $200 million in FY 2014 and $390 million from FY 2014-FY 2018, according to the Office of Management and Budget.32
Indian Coal Credit (Sec. 45)
Companies that produced coal from reserves owned by an Indian tribe could claim a tax credit of $2.308 per ton of coal produced and sold in a calendar year. The credit amount is adjusted each year. The credit is part of the general business credit, so unused credits may be carried back one year and forward up to 20 years.33
Only three tribes benefit from the tax credit: the Crow, the Hopi, and the Navajo, according to a USA Today report.34
These tribes do not directly mine for the coal, but without the tax credit it is unlikely companies would find the coal on tribal land to be economically recoverable. As the USA Today report notes, before the establishment of the credit under the Energy Policy Act of 2005, “Crow coal—which has relatively high sulfur content—was suffering under sulfur emissions standards in the Clean Air Act and needed an incentive to compete…The tax credit has helped the mine stay open and find new customers.”35
If Congress believes these three tribes deserve a targeted benefit for the production of coal on their land, then it should vote on a direct subsidy for the coal production through the appropriations process. As noted in the USA Today article, this would require Congress to directly approve this targeted benefit for the three tribes each year, rather than using an obscure tax credit to shroud the benefit to the tribes.
The credit was available only for coal produced and sold through 2013, but a two-year extension is included in the EXPIRE Act.36 Continued extensions of the credit would cost $22 million in FY 2014 and $192 million from FY 2014 to FY 2018.37 As with other credits specifically marked for one fuel source, this credit should not be extended.
Enhanced Oil Recovery and Deduction for Tertiary Injectants (Sec. 43 and 193)
Traditional methods for recovering oil from a reserve only capture between 30 percent and 50 percent of the available supply, leaving a significant portion behind.39 This is a result of the extensive costs associated with the processes that are used to recover the harder-to-reach supply; generally, it may not be profitable to use the “unconventional” methods that are required to recover the remaining reserves. This provision, then, seeks to lower the costs of the unconventional methods by giving a credit for enhanced recovery costs associated with these methods.
The Enhanced Oil Recovery (EOR) Credit provides a 15 percent credit for the costs of oil recovery technologies. Enhanced Oil Recovery costs include those paid for depreciable tangible property, intangible drilling and development expenses, tertiary injectant expenses (such as CO2, nitrogen, or steam to supplement natural well pressure leveraged to extract oil from underground), and construction costs for certain natural gas facilities in Alaska.40
The full credit is available when crude prices are below a reference price (adjusted for inflation; $42.57 per barrel in 2010).41 When prices rise above this threshold, the credit is reduced over a $6 phase-out range. The crude price used in the calculation is the annual average price of domestic crude oil from the previous calendar year. This credit is currently inactive but has cost $2.4 billion since its inception in 1990.42
Eliminating this credit would not have a significant impact on production, as prices will probably remain well above the trigger for the credit; in November 2014, they were over $70 per barrel.43 Although the potential savings are unclear, repealing the tax credit would prevent future revenue losses associated with covering the costs of enhanced oil recovery methods.
Oil Recovery Methods38

130 | Tax Decoder Energy | 131
Marginal Wells (Sec. 45I)
Marginal wells average no more than 15 barrels per day and produce heavy oil. To qualify as a marginal well, at least 95 percent of the well output must be water, and the well must produce no more than 25 barrels per day of oil. Marginal gas wells also cannot produce more than 90 metric cubic feet (Mcf) of natural gas per day.44
This credit was created in 1994 to keep these low-production marginal wells in operation during periods of low pricing and on-hand surpluses. The credit provides $3 per barrel on the first three barrels of daily production and
a $0.50 per Mcf tax credit for the first 18 Mcf of daily natural gas production.
Though currently inactive, under current law, a $3 per barrel tax credit is available for the first 3 barrels of daily production from an existing marginal oil well, plus a $0.50 per Mcf tax credit for the first 18 Mcf of daily natural gas production from a marginal well. The credit is available only if prices in the previous year were below designated averages—$18/barrel in the case of oil and $2/Mcf in the case of gas. This credit is currently phased out and should be ended permanently.
Renewable and Alternative Fuel Source Provisions Resources that fall under the general heading of “renewable” or “alternative” energy sources have been promoted for
decades as the future of the energy industry. They are often lauded as being cleaner than traditional fossil fuel sources, and the threat of depletion that exists for fossil fuels theoretically does not apply to these resources.
Because of these characteristics, the federal government has been active in attempting to encourage the use of these fuel sources, through mandates, subsidies, and targeted provisions in the tax code. These measures have supplanted market forces in an attempt to force environmental responsibility upon private citizens.
Despite substantial support for these resources throughout the years, however, they have yet to supplant traditional fossil fuels. The most prominent sources—led by hydropower, wood biomass, and wind—accounted for approximately 12.7 percent of all electricity generation in the United States in 2013; this figure was less than nuclear power, and substantially below natural gas and coal.45
Alternative energy technologies may become economically viable on a large scale in the future, but subsidizing an industry already primed with private investment represents a dangerous misallocation of capital that can serve as a drag on innovation. American companies are being proactive on many fronts to develop new, more efficient ways to utilize alternative energy technology and, if these companies find the technology viable, it will surely succeed in the marketplace.
The federal government has also attempted to encourage the demand for alternative fuel sources, often through motor vehicles. It has supported the purchase and use of vehicles powered by alternative fuels, although with little success to show for its efforts. Whether or not vehicles that run on non-fossil fuels can gain enough traction in the market to become competitive, once again remains to be seen.
Seven provisions of the tax code fall under the general header of “renewable and alternative fuel source provisions.” The provisions cost a total of $3.6 billion in FY 2014, and will total $32.8 billion over the five-year period from FY 2014 through FY 2018.47
Credit for Electricity Produced from Certain Renewable Resources (Sec. 45)
The production tax credit (PTC) applies to the generation of electricity from energy resources such as wind, solar, hydropower, and biomass, among others. Electricity from these renewable resources is eligible for a credit for each kilowatt-hour (kWh) produced. The credit for wind, biomass, and geothermal resources is 2.3¢ per kWh, and for all other eligible sources it is 1.1¢ per kWh. Facilities are eligible to receive this credit for ten years after they are placed in service.
The PTC was first added to the tax code in 1992 under the Energy Policy Act of 1992, and was originally intended to assist in the development of electricity generated from wind and biomass.48 Since its enactment, the credit has been extended on a number of occasions, and has been expanded to incorporate other renewable resources. Currently, the credit is available for wind, closed- and open-loop biomass, geothermal power, small irrigation power, power generated from municipal solid waste, qualified hydropower, and marine and hydrokinetic power.49
The rationale behind the production tax credit is clear: providing federal support for certain types of renewable energy sources allows them to gain an advantage in the marketplace over those traditional sources which do not benefit from the federal support. The goal, ultimately, is for these renewable resources to replace traditional fossil fuels as the primary electricity generation source.

DRAFT
132 | Tax Decoder
Congress should not be in the business of picking winners and losers. The American economy is unique because citizens, not the government or opticians, determine how the country’s economy progresses by their ability to purchase goods and services. The enterprises that respond to the needs and desires of consumers are rewarded, while those companies that do not fail. Private investment is always available for these alternative energy sources, and if the market determines there is a demand for these products that can be met at a profitable price, then the technologies will become economically viable on a larger scale.
The wind PTC receives the lion’s share of the credits available under Sec. 45. An examination of the credit’s effect on the wind industry serves as an illustration of the effect of the overall credit.
The chart on the next page shows the amount of new wind energy capacity installed in the United States on an annual basis. Because the PTC is not a permanent credit, it must be reauthorized on an annual or multi-year basis. Unsurprisingly, the correlation between having the PTC in place ahead of time for a given year and amount of capacity installed in that year is incredibly robust. When federal support for the energy source is secure, the industry responds with strong investment; when
there is uncertainty regarding the long-term existence of the credit, investment drops precipitously.
This chart is a clear indicator of a reality in the wind energy industry: without secure federal support for the industry, it is unlikely to expand on a large scale. That does not mean wind investment would disappear entirely without the credit; smaller investments would still exist, and as the technology becomes more advanced, it may displace traditional fuel sources as a cheaper or more reliable option. However, after more than two decades of support for the industry, it has not proven to be an energy source that can be a reliable supplier of electricity generation without the assistance of the federal government—and wind has been the most successful of the renewable sources included in Section 45. Furthermore, even where wind turbines have been placed in service, the amount of power that can be derived from an individual turbine remains too small to make technology viable on a larger scale.
Congress should discontinue the practice of choosing preferred electricity sources through the PTC. With the corresponding reforms recommended elsewhere in this section, Congress could level the playing field and allow each fuel source to compete on its own, thus allowing the most dynamic and competitive sources to succeed.
Prominent Renewable Fuel Sources46

132 | Tax Decoder Energy | 133
While the credit has not technically expired, January 1, 2014, was the latest date that renewable power facilities could begin construction and still be eligible for the credit.51 Plants built before this date continue to use the credit, at a cost of about $1.6 billion in FY 2014 and $16.4 billion from FY 2014 through FY 2018.52 Continued extensions of this date would cost an additional $92 million in FY 2014 and $4.255 billion from FY 2014 through FY 2018.53 The EXPIRE Act would extend the latest construction date by two years.54
Advanced Energy Project Investment Credit (Sec. 48)
Since passage of the Energy Tax Act of 1978, taxpayers have been eligible for an investment tax credit (ITC).55 This credit was significantly expanded under the American Recovery and Reinvestment Act of 2009, which provided the opportunity to claim a 30 percent credit (or, in limited cases, 10 percent) for property that would have otherwise qualified for the production tax credit discussed above.56
After 2016, the credit for solar and fuel cell properties will drop to 10 percent, and this drop is already having a direct effect on the solar industry, allowing the largest companies to control more of the market. A recent Bloomberg news
report declared, “acquisitions in the solar industry will take off as manufacturers and developers prepare for the expiration of [the ITC]…Some consolidation has already begun. NRG Energy Inc., the largest independent U.S. power producer, purchased three solar companies this year…”57
As companies in the solar industry prepare for the drop in the credit, many smaller-scale companies are realizing they will not be able to survive, and are being forced to merge with or sell their properties to the largest companies in the industry. This illustrates that a number of smaller companies are only in existence because of the credit.
This advanced energy credit is available for the same facilities as the production tax credit. Properties that use wind, biomass, municipal solid waste, landfill-to-gas, hydropower, and geothermal energy, and that began construction before December 31, 2013, are eligible for a 30 percent credit. For solar and fuel cell properties that are placed in service before the end of 2016, the credit is also 30 percent, while three energy sources are eligible for a 10 percent credit if placed in service before the end of 2016—microturbines, combined heat and power, and geothermal heat pumps.58
Although it operates differently from the PTC, the goal of the ITC is the same: to encourage production of electricity from alternative and renewable fuel sources. As discussed in the section on the PTC, efforts to encourage the production
Wind Production Tax Credit and Industry Investment50

DRAFT
134 | Tax Decoder
of electricity from alternative and renewable fuel sources has not been shown to be competitive without significant federal support, and this support should be eliminated.
This provision will cost $300 million in FY 2014, and $1.3 billion from FY 2014-FY 2018.59 This assumes the credit for solar projects is allowed to decrease in 2017. Extending the full credit would cost an additional $84 million from FY 2017-FY 2018.60
Biodiesel, Renewable Diesel, and Second Generation Biofuel (Sec. 40A, 6426, and 6427)
Biofuels such as ethanol and biodiesel are renewable fuels made from organic sources such as crops wastes and animal fat. The biodiesel tax credit provides $1 per gallon, available in an unlimited amount to all qualifying biodiesel producers, plus an extra 10¢ per gallon credit for small producers. The credit was created in 2004 and has been extended three times since.
U.S. biodiesel production has shown strong growth, rising from nine million gallons in 2001 to an estimated 1,339 million gallons in 2013.61 However, much of this growth is the result of the federal Renewable Fuel Standard, which requires the blending of certain amounts of biofuels into the total fuel supply (the required amounts increase on a yearly basis until 2023). The projected required volume for 2014, as established by the Environmental Protection Agency in November 2013, was 1,280 million gallons, although this number is subject to change before the end of the year.62
Without the tax credit, biodiesel is more expensive than gasoline, demonstrating the fuel is not economical to produce without federal assistance. According to the Congressional Research Service, “demand for biofuels [both ethanol and biodiesel] to fulfill a mandate is not based on price, but rather on government fiat. As long as the consumption of biofuels is less than the mandated volume, its use is obligatory.”63
This statement also applies to renewable diesel and second generation biofuels, which are also supported through the tax code. Renewable diesel is incentivized at $1.00/gallon, while second generation biofuels receive $1.01. These provisions expired at the end of 2013, but are likely to be included in any package of tax extenders.
Congress should end these targeted tax credits to certain fuel sources, as well as the federal mandate for the blending of biodiesel, which creates an artificial demand for the products. The credits are currently expired, but have been included in the EXPIRE Act.64 Continuing extensions of the credit would cost $1.054 billion in FY 2014 and $7.351 billion from FY 2014-2018.65
Alternative and Alcohol Fuel Credit (Sec. 6426, 6427, and 4041(m))
The alternative and alcohol fuel credits expired at the end of 2013, but have been included in the EXPIRE Act.66 Eligible alternative fuels include propane, blends of ethanol and natural gas liquids known as P Series fuels, compressed or liquefied natural gas, liquefied fuel derived from coal or peat through the Fischer-Tropsch process, liquefied hydrocarbons derived from biomass, and liquefied hydrogen. Ineligible fuels include ethanol, methanol, biodiesel, and any fuel derived from the production of paper or pulp.
As with biodiesel, there are technically two credits: the “alternative fuel credit” and “alternative fuel mixture credit.”
The alternative fuel credit reduces excise taxes by 50 cents per gallon of pure alternative fuel. If the credit is worth more than the excise taxes due, the remaining value of the credit can often be used to offset income tax liability, and direct payments from the government are also possible.
Meanwhile, the alternative fuel mixture credit reduces excise taxes for blends of conventional fuels and alternative fuels. It provides 50 cents per gallon of the alternative fuel used in the blend. A gallon of a blend with 20 percent alternative fuel and 80 percent gasoline, for example, would be eligible for a 10-cent tax credit.
This credit may only be used to reduce excise tax liability—it may not be used to offset income taxes or be claimed as a payment. These benefits were allowed to expire at the end of 2011. According to an article published by the American Institute of CPAs, “This step was taken after the Senate Finance Committee received notice from the IRS that several taxpayers were making large and questionable claims for payment.”67
Three different credits for alcohol fuels, which include methanol and ethanol, and other sources excluded from the Alternative Fuel Credit, expired at the end of 2011: the alcohol mixtures credit, the pure alcohol fuel credit, and the small ethanol producer credit. These provisions have not been included in the EXPIRE Act, and should not be reinstated.
Continuing to extend the alternative fuel credit and alternative fuel mixture credit would cost $300 million in FY 2014 and $2.071 billion from FY 2014 through FY 2018.68
Credit for Fuel Cell Vehicles (Sec. 30B)
The Alternative Fuel Motor Vehicle Credit was created under the Energy Policy Act of 2005, and originally provided tax credits to four vehicle categories.69 Since its enactment, three of these categories have expired, leaving only the credit for qualified fuel cell vehicles – defined by the IRS as “a vehicle that is propelled by power derived from one or more cells which convert chemical energy directly into electricity.”70 This credit will no longer be available for property purchased after 2014.71

134 | Tax Decoder Energy | 135
Fuel cell vehicles receive a base credit of $4,000 for vehicles under 8,500 pounds, with the amount of the base credit increasing to up to $40,000 based on weight. Further credits are allowed based on the amount by which the vehicle’s fuel economy exceeds 2002 base levels.72
The Alternative Motor Vehicle Credit experienced significant structural problems from the start. Approximately $33 million in tax credits claimed by 12,920 individuals were paid erroneously through this tax credit, out of $163.9 million in credits reviewed, according to the U.S. Treasury Inspector General for Tax Administration (TIGTA). Among the false claims were 29 prisoners who claimed the credit while incarcerated. Additionally, the report found IRS was not able to monitor credits that were claimed on paper-file tax returns.73
At this time, only six vehicles qualify for the credit, and five of these are different years of the same model.74 The provision is projected to cost $100 million from FY 2014 through FY 2018.75
Plug-In Electric-Drive Motor Vehicles and Electric-Drive Low-Speed, Motorcycle, and Three-Wheeled Vehicles (Sec. 30D)
The remaining categories of vehicles originally included in the Alternative Fuel Motor Vehicle Credit were Plug-In Electric-Drive Motor Vehicles (generally known as hybrid vehicles) and Electric-Drive Low-Speed, Motorcycle, and Three-Wheeled Vehicles.
A study published in the Journal of Environmental Economics and Management found that only a small percentage of motorists attribute their purchase of hybrid vehicles to tax incentives; instead, most purchase them due to personal preferences or high fuel costs.76
The credit is primarily used for 4-wheel electric vehicles such as the Nissan Leaf, the Tesla Model S, the Chrysler Fiat 500e, the Chevrolet Volt, the Ford Fusion Energi, and
various electric vans and trucks.77 It begins to phase out in the second quarter after the total number of qualifying sales made after 2009 reach 200,000.78 There are currently no tax credits available for vehicles that do not qualify under this provision or Section 30B (above); this distorts the market in favor of vehicles that are politically preferred by the federal government. This provision will cost $200 million in FY 2014, and $1.1 billion from FY 2014 through FY 2018.79
A credit is also allowed for qualified 2- or 3-wheeled electric plug-in vehicles. This credit was allowed to expire at the end of 2013, but has been included in the EXPIRE Act.80 Congress should not extend it in any tax extender package. Continuing to extend this provision will cost an additional $2 million in FY 2014, and $12 million from FY 2014 through FY 2018.81
Alternative Fuel Refueling Properties (Sec. 30C)
Section 30C provides a tax credit for the installation of an alternative fuel vehicle refueling property at a business or a taxpayer’s residence. The credit is equal to 30 percent of the cost of the property, up to $30,000 for each location of a business and up to $1000 for a residence.82
Qualifying properties include fuel storage, pumps, and recharging equipment for fuel sources such as natural gas, hydrogen, biodiesel, and ethanol (E85). Given the limited number of alternative fuel vehicles in the market today, this infrastructure is not necessary on a large scale, and as mentioned in the section on alternative fuel vehicle credits, those who purchase the vehicles are often able and willing to purchase them without federal support. This would similarly apply to the demand for refueling properties. This provision should be eliminated.
The provision expired at the end of 2013 for most fuel types, but has been included in the EXPIRE Act.83 Continuing to extend these provisions would cost $21 million in FY 2014 and $177 million from FY 2014 through FY 2018.84

DRAFT
136 | Tax Decoder
Energy Efficiency Provisions The tax code provides a number of advantages to building properties, including both commercial buildings and residences
that are deemed to be “energy efficient.” These tax advantages are intended to encourage the construction of new buildings that will meet measurable standards of efficiency, thereby reducing energy costs.
Energy efficiency is a laudable goal, and oftentimes a property owner will decide it is in his or her best interest to invest in equipment or technologies that achieve this goal. Because the potential savings associated with energy efficiency accumulate over time, the property owner must evaluate future savings against current expenses in determining whether energy efficient materials are worthwhile.
Because energy efficiency investments are ultimately beneficial to taxpayers who choose to finance them on their own, each federal tax provision supporting this goal must be closely scrutinized.
Seven provisions of the tax code fall under the general header of “energy efficiency provisions.” The provisions cost a total of $2.2 billion in FY 2014, and will total $18.3 billion over the five-year period from FY 2014 through FY 2018.85
Deduction of Expenditures on Certain Energy Efficient Commercial Building Property (Sec. 179D)
This deduction was introduced in the Energy Policy Act of 2005 in an attempt to encourage the use of energy-saving equipment in commercial buildings both new and old.86 In order to qualify for the deduction, a qualified professional must certify that the energy and power costs of the building will be reduced by 50 percent or more compared to a minimum-standard reference building.87
Commercial energy properties that qualify for this deduction are generally depreciable over a 39-year period using the straight-line method. However, the Section 179D deduction allows for the expensing of such property at the time of construction or retrofit, thus greatly increasing the value of the deduction.
In general, energy efficient buildings provide a clear benefit in the long term by reducing the costs associated with heating, cooling, and power for the building. Therefore, when evaluating the costs associated with constructing or retrofitting a building, a property owner will usually take into consideration future sav-ings over the life of that building when deciding which materials to use. The market should determine how much appetite there is for energy efficient equipment of this kind in commercial prop-erties. Instead, this deduction attempts to increase the market for energy efficient materials by decreasing the present value cost of the new or retrofitted buildings, compared to other alternatives.
Because the demand for energy efficient buildings is determined by evaluating the long-term savings associated with the upgrades, it is unclear what effect this deduction has on the market. Many property owners may elect to retrofit or construct energy efficient buildings without
taking into account this deduction, because the economics otherwise support that decision. In that case, the deduction has no effect other than to reduce receipts to the Treasury and reward a taxpayer for making a rational decision.
If, on the other hand, the property owner determines that the costs associated with an energy efficient building are not justified absent the deduction, then the market has spoken. By allowing special tax benefits for certain investment decisions, the federal government is picking one type of investment over others, which inevitably results in market distortions based on politicians’ preferences.
By allowing for immediate expensing of the costs associated with constructing or retrofitting an energy efficient building, the government provides either a market-distorting incentive or a payment for decisions that would have been made irrespective of the incentive. Congress should allow the market for energy efficient commercial buildings to operate without distortion and allow property owners to make decisions based on the cost analysis of the life of a property.
Congress should eliminate the preferential tax treatment of energy efficient commercial building properties. The provision expired at the end of 2013, but has been included in the EXPIRE Act.88 Continuing to extend the provision would cost $95 million in FY 2014 and $845 million from FY 2014 through FY 2018.89
Credit for Manufacture of Energy Efficient Appliances (Sec. 45M)
Section 45M provides a tax credit to industrial companies or appliance manufacturers for the production of new clothes washers, dishwashers, or refrigerators that meet Energy Star 2007 requirements. The law caps the credits any company may receive at $25 million for most appliances, although clothes washers and refrigerators that meet the highest efficiency standards are eligible for uncapped credits of $225 and $200 per appliance, respectively.
Manufacturers such as Whirlpool benefit greatly from this tax credit; in fact, in previous years the credit “generate[d] about one-third of Whirlpool’s earnings [in a given] year.”90
In the first quarter of 2011, Whirlpool reported net income of $169 million, which was “helped by between $300 million

136 | Tax Decoder Energy | 137
and $350 million in energy tax credits [that year]. The company said in February it expected to receive $300 million in energy tax credits [that year].”91 Thanks to this tax credit, Whirlpool “had negative effective income tax rates in 2010, 2009, and 2008. Last year, the company reported an income tax benefit of $64 million and an effective tax rate of negative 10.9 percent, according to company filings.”92
Since passage of the National Energy Policy Conservation Act of 1978, both Congress and the Department of Energy have set, and frequently revised, minimum energy efficiency standards for household appliances, including refrigerators, dishwashers, and clothes washers. Currently, Congress mandates energy efficiency standards for major appliances through:
• Part B of Title III of the Energy Policy and Conservation Act
• Public Law 94-163, as amended by the National Energy Conservation Policy Act
• Public Law 95-619, by the National Appliance Energy Conservation Act
• Public Law 100-12, by the National Appliance Energy Conservation Amendments of 1988
• Public Law 100-357 • The Energy Policy Act of 1992; and • Public Law 102-486
In effect, the Department of Energy subsidized manufacturers to comply with federally-imposed energy efficiency mandates. This provision expired at the end of 2013, and was not included in the EXPIRE Act. It should not be extended. Were it be extended, it would cost $66 million in FY 2014 and $691 million from FY 2014 to FY 2018.93
Manufacturer Credit for New Energy Efficient Home (Sec. 45L)
A manufacturer or contractor building a new home is eligible for a tax credit if the home meets certain energy efficiency standards. In general, these homes will have heating and cooling energy consumption at least 50 percent below similar homes in any given year, with at least 10 percent of the savings coming from the “envelope” of the building—windows, doors, and roofing.94
The credit for construction of qualifying homes is up to $2,000 for contractors, and up to $1,000 for manufacturers who build manufactured homes. The credit was created in the Energy Policy Act of 2005, and has since been extended on multiple occasions.
Energy efficient homes will provide their homeowners with significant savings over the life of the property; therefore, homeowners are likely to pay more for these properties. If the market demand for energy efficient homes is sufficient to encourage their construction, this tax credit is
unnecessary and provides a windfall for the builder. The credit expired at the end of 2013, but has been
included in the EXPIRE Act.95 If it continues to be extended, the provision will cost $48 million in FY 2014, and $600 million from FY 2014-FY 2018.96
Residential Energy Efficient Property Credits (Sec. 25D)
The residential energy efficiency property tax credit was first enacted under the Energy Policy Act of 2005, expired in 2007, and was then reinstated in 2009 by the Emergency Economic Stabilization Act of 2008. This credit applies to the homeowners of residences that purchase and install solar electric and water heating properties, geothermal heat pumps, small wind energy properties, and fuel cell power plants.97
For all properties except fuel cells, there is a 30 percent tax credit for the purchase price plus installation costs associated with the property, with no maximum credit amount. For fuel cells, there is a maximum amount that can be credited equal to $500 per half kilowatt of capacity.98
This tax credit is “disproportionately claimed by higher-income households,” according to the Congressional Research Service. Given that these higher-income households are more likely to be able to afford the properties without the credit, and given the reduction in energy bills that results from the installation, it is highly likely that this credit “would be a windfall benefit to the taxpayer, and not result in additional energy efficiency.”99 As such, the credit should be repealed.
The credit will cost $1.1 billion in FY 2014, and $4.3 billion from FY 2014-FY 2018.100 It is scheduled to expire at the end of 2016; if it continues to be extended after that point, it will cost an additional $1.727 billion from FY 2014 through 2018.101
Energy Production Properties Credit for Businesses (Sec. 48)
Similarly to residences, businesses that invest in equipment using alternative fuel sources are provided a tax credit under Section 48. Specifically, the credit applies to the same equipment as the residential credit—solar, geothermal, wind, and fuel cell properties—plus microturbines and combined heat and power systems.102
For solar, fuel cell, and small wind turbines, the credit is 30 percent of the costs associated with purchase and installation, while the credit for geothermal, microturbines, and combined heat and power is 10 percent.103
This provision will cost approximately $500 million in FY 2014, and $2.9 billion from FY 2014 through FY 2018.104
Similar to the residential properties credit above, this provision should be eliminated.

DRAFT
138 | Tax Decoder
Nonbusiness Energy Property Credits (Sec. 25C)
In tandem with Section 25D, Section 25C attempts to incentivize energy efficiency improvements to residential homes. This credit focuses on the structure of the residence, as well as the heating, cooling, and water-heating equipment that is powered by traditional fuels not covered by 25D.105
Improvements to the structure of the residence generally include insulation, windows, doors, and roofing. These improvements receive a 10 percent credit, up to $500, provided only for the purchase of the improvement; unlike Section 25D, labor costs are not eligible for the credit.
For water heaters, furnaces, air conditioners, fans, and heat pumps to qualify for the credit, they must meet certain energy efficiency standards and must be installed in the taxpayer’s primary residence. The tax credit available for each of these properties varies, from $50 for air circulating fans to $200 for window installations.106
According to the Congressional Research Service, “the amount of the investment resulting from these credits is unclear. Purchasers investing in energy-efficient property for other reasons—for example, concern about the environment—would have invested in such property absent tax incentives, and hence stand to receive a windfall gain from the tax benefit.”107
This provision has expired, but is included in the EXPIRE Act.108 Similarly to Section 25C, this provision should be repealed by Congress. If it continues to be extended, it will cost $401 million in FY 2014 and $7.1 billion from FY 2014 through FY 2018.109
Exclusion of utility conservation subsidies (Sec. 136)
The exclusion of subsidies for public utilities was enacted in the National Energy Conservation Policy Act of 1978. The exclusion removes rate subsidies from the gross income of a taxpayer. From the perspective of the IRS, these subsidies are similar to direct payments. By reducing the cost of consumers’ electricity or natural gas bills, the subsidies increase their wealth. The IRS would normally consider these subsidies taxable income, but this provision allows consumers to exclude the subsidies from their taxable income.
Energy conservation measures that qualify for the excluded subsidies include “installations or modifications primarily designed to reduce consumption of electricity or natural gas, or to improve the management of energy demand.”110 As with the other provisions in this section, if consumers wish to lower their electricity or gas bill by improving conservation in their residence, they will weigh projected savings with the cost of the installation—including the subsidy provided by the public utility. Consumers should not need a third form of savings in order to incentivize this behavior.
Although it was allowed to expire in 1989, this provision was reinstated by the Energy Policy Act of 1992 and has remained in effect ever since. This provision will cost $100 million from FY 2014 through FY 2018.111 Congress should eliminate this incentive.
Miscellaneous Provisions
Industrial CO2 Capture and Sequestration Tax Credit (Sec. 45Q)
The credit for carbon dioxide sequestration was meant to reduce carbon emissions and ultimately global warming. The credit originally offered taxpayers $20 per metric ton of CO2 captured and disposed of, and $10 per metric ton of CO2 captured and used.112 The actual inflation-adjusted amounts are $21.51 and $10.75 for 2014.113
“To qualify for the tax credit, the facility must capture at least 500,000 metric tons of CO2 per year. If CO2 is used for enhanced oil or gas recovery, a tax credit would be available only for an initial injection; CO2 subsequently recaptured, recycled, and re-injected would not be eligible for a tax credit,” according to the Congressional Research Service.114
Like many tax preferences, the industrial CO2 capture and sequestration tax credit effectively picks winners and losers in the marketplace. In addition, the industrial CO2 capture and sequestration tax credit also incentivizes the capture of CO2 rather than other, perhaps more beneficial, methods of reducing emissions. If superior technology emerged in the future, this tax provision would not necessarily change, but might instead be lost in the reams of IRS codification, adding to the mish-mash of dysfunctional tax rules.
One study indicates storage costs for CO2 would actually increase the cost of electricity by as much as 17 percent. A University of Utah report published in 2007 “found the cost of carbon capture to be about forty dollars per ton and underground storage costs ten dollars per ton, which would add 7.5 cents to the cost of a kilowatt-hour or a seventeen

138 | Tax Decoder Energy | 139
percent incremental increase in the cost of generating electricity,” according to an article in the Boston College Environmental Affairs Law Review.115 So rather than pay a $100 electric bill, you could end up paying $117 if all companies uniformly adopted CO2 capture programs. Congress should consider not only expenses to the federal Treasury, but also the significant expenses to consumers when assessing whether to maintain this tax expenditure.
The industrial CO2 credit will cost $80 million in FY 2014 and $660 million from FY 2014 through FY 2018.116 Another estimate, calculated in 2012 by the Taxpayers for Common Sense, projected that cutting the CO2 tax credit would eliminate $1 billion in government spending over a ten-year period.117
Advanced Nuclear Power Production Credit (Sec. 45J)
The Advanced Nuclear Power Credit provides 1.8 cents per kilowatt hour (kWh) for nuclear power from new facilities for the first eight years of their operation. The credit may be awarded for no more than 6,000 megawatts of nuclear power nationwide, which is enough for approximately four to five reactors. However, applicants had filed applications for more than five times that amount of nuclear energy generation capacity by the end of 2008.118
According to the Congressional Research Service, “License applications for as many as 31 new reactors have been announced, and NRC issued licenses for four reactors at two plant sites in early 2012. However, falling natural gas prices, safety concerns raised by the Fukushima accident, and other changing circumstances have made it unlikely that many more of the proposed nuclear projects will move toward construction in the near term.”
The credit will result in zero lost revenue from FY 2014 through FY 2016, but it will cost $210 million in FY 2017, $470 million in FY 2018, and $590 million in FY 2019.119
Although this provision’s current costs appear to be negligible, as new nuclear power comes online, the costs could become substantial. In the meantime, if nuclear power is capable of competing with natural gas and other fuel sources, it should be able to stand on its own. In order to prevent significant future revenue losses, therefore, the Advanced Nuclear Power Credit should be repealed.
Deferral of Gains from the Sale of Electric Transmission Property (Sec. 451(i))
Since the 1970s, state and federal governments have pursued a variety of strategies to break up “vertically integrated” utilities that control both the generation and distribution of electrical power. Many policymakers believe large vertically
integrated utilities are uncompetitive and increase prices for consumers.121 These utilities may be forced to sell off their transmission components by the Federal Energy Regulatory Commission (FERC) or other authorities.122
In 2004, Congress created a special tax provision to alleviate the tax consequences of these sales. Integrated companies that sell off transmission property would ordinarily be liable for a tax on the capital gain of their property in the year it was sold. Under Section 451(i) of the tax code, however, these companies may pay the tax on their gain over eight years, rather than paying it all at once. The eight-year period provides the integrated utilities with significant tax relief, due to the time value of money.
Without the provision, the capital gain would be recognized in the year of the sale, and some sales could be partially taxed under the ordinary income rates rather than the lower capital gains rates. To qualify for the special tax treatment, the proceeds from the sale must be reinvested in other electric or natural gas infrastructure—any proceeds not invested in property of this kind are taxed as normal.123
The provision has expired and been renewed multiple times since enactment. Most recently, it expired at the end of 2013, but has been included in the EXPIRE Act.124 Continuing to extend this provision would cost $232 million in FY 2014 and $1.081 billion from FY 2014 through FY 2018.125
As long as Congress continues to compel utilities to sell off equipment, this tax relief is appropriate.
Amortization of Certified Pollution Control Facilities (Sec. 169)
All pollution control equipment that has been placed in service after April 2005 is eligible for a seven-year amortiza-tion schedule, significantly shorter than the life of the asset. This schedule applies to any equipment that is added to an existing power plant and reduces air emissions of pollutants as defined by the Clean Air Act. Shortening the amortization period brings greater present value to the owners of such fa-cilities by reducing their tax burden.
The Energy Policy Act of 2005 applied an accelerated amortization schedule to pollution control improvements at newer (post-1976) coal-fired power plants; prior to the act, only improvements to older (pre-1976) power plants were eli-gible for accelerated amortization. For older plants, the amor-tization period is five years. The original accelerated depreci-ation schedule was implemented in 1969 as a replacement for the investment tax credit, which had been eliminated.126
The seven-year amortization schedule applies to any pollution control equipment placed in service after 2005, and this schedule will continue to benefit owners of coal-fired plants in the future.
The typical cost recovery period for equipment relating to electricity generation greatly exceeds the five- and
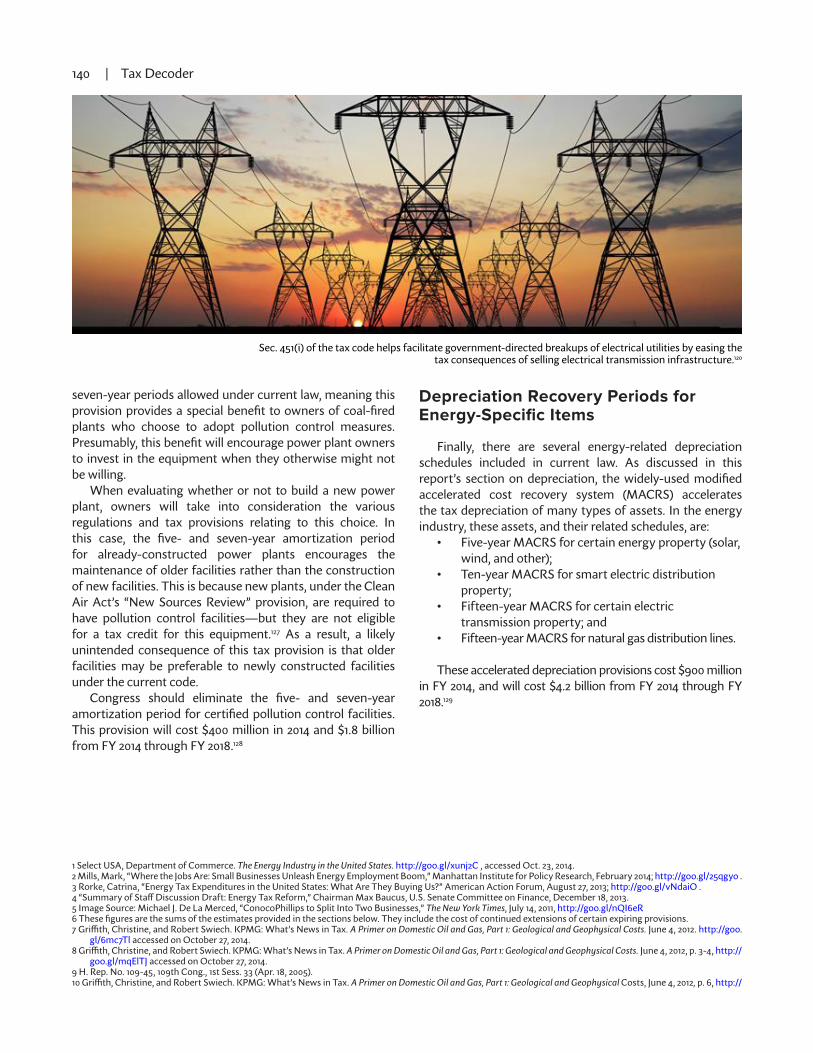
DRAFT
140 | Tax Decoder
seven-year periods allowed under current law, meaning this provision provides a special benefit to owners of coal-fired plants who choose to adopt pollution control measures. Presumably, this benefit will encourage power plant owners to invest in the equipment when they otherwise might not be willing.
When evaluating whether or not to build a new power plant, owners will take into consideration the various regulations and tax provisions relating to this choice. In this case, the five- and seven-year amortization period for already-constructed power plants encourages the maintenance of older facilities rather than the construction of new facilities. This is because new plants, under the Clean Air Act’s “New Sources Review” provision, are required to have pollution control facilities—but they are not eligible for a tax credit for this equipment.127 As a result, a likely unintended consequence of this tax provision is that older facilities may be preferable to newly constructed facilities under the current code.
Congress should eliminate the five- and seven-year amortization period for certified pollution control facilities. This provision will cost $400 million in 2014 and $1.8 billion from FY 2014 through FY 2018.128
Depreciation Recovery Periods for Energy-Specific Items
Finally, there are several energy-related depreciation schedules included in current law. As discussed in this report’s section on depreciation, the widely-used modified accelerated cost recovery system (MACRS) accelerates the tax depreciation of many types of assets. In the energy industry, these assets, and their related schedules, are:
• Five-year MACRS for certain energy property (solar, wind, and other);
• Ten-year MACRS for smart electric distribution property;
• Fifteen-year MACRS for certain electric transmission property; and
• Fifteen-year MACRS for natural gas distribution lines.
These accelerated depreciation provisions cost $900 million in FY 2014, and will cost $4.2 billion from FY 2014 through FY 2018.129
Sec. 451(i) of the tax code helps facilitate government-directed breakups of electrical utilities by easing the tax consequences of selling electrical transmission infrastructure.120
1 Select USA, Department of Commerce. The Energy Industry in the United States. http://goo.gl/xunj2C , accessed Oct. 23, 2014. 2 Mills, Mark, “Where the Jobs Are: Small Businesses Unleash Energy Employment Boom,” Manhattan Institute for Policy Research, February 2014; http://goo.gl/25qgyo . 3 Rorke, Catrina, “Energy Tax Expenditures in the United States: What Are They Buying Us?” American Action Forum, August 27, 2013; http://goo.gl/vNdaiO . 4 “Summary of Staff Discussion Draft: Energy Tax Reform,” Chairman Max Baucus, U.S. Senate Committee on Finance, December 18, 2013. 5 Image Source: Michael J. De La Merced, “ConocoPhillips to Split Into Two Businesses,” The New York Times, July 14, 2011, http://goo.gl/nQI6eR 6 These figures are the sums of the estimates provided in the sections below. They include the cost of continued extensions of certain expiring provisions. 7 Griffith, Christine, and Robert Swiech. KPMG: What’s News in Tax. A Primer on Domestic Oil and Gas, Part 1: Geological and Geophysical Costs. June 4, 2012. http://goo.
gl/6mc7Tl accessed on October 27, 2014. 8 Griffith, Christine, and Robert Swiech. KPMG: What’s News in Tax. A Primer on Domestic Oil and Gas, Part 1: Geological and Geophysical Costs. June 4, 2012, p. 3-4, http://
goo.gl/mqElTJ accessed on October 27, 2014. 9 H. Rep. No. 109-45, 109th Cong., 1st Sess. 33 (Apr. 18, 2005). 10 Griffith, Christine, and Robert Swiech. KPMG: What’s News in Tax. A Primer on Domestic Oil and Gas, Part 1: Geological and Geophysical Costs, June 4, 2012, p. 6, http://

140 | Tax Decoder Energy | 141
goo.gl/6A73jo accessed on October 27, 2014. 11 Griffith, Christine, and Robert Swiech. KPMG: What’s News in Tax. A Primer on Domestic Oil and Gas, Part 1: Geological and Geophysical Costs at 6. June 4, 2012, p. 8,
http://goo.gl/2BjC7w accessed on October 27, 2014. 12 “Estimates of Federal Tax Expenditures for Fiscal Years 2014-2018,” Joint Committee on Taxation, August 5, 2014. http://goo.gl/YvWuo5 13 “A Primer on Domestic Oil and Gas, Part II: Intangible Drilling and Development Costs,” KPMG, 2012, http://goo.gl/lfCIi7 14 “Intangible Drilling Costs: Crucial Underpinning of Affordable US Energy Supply,” American Exploration and Production Council, September 2012, http://goo.gl/
Xz4jSB accessed on October 27, 2014. 15 “A Primer on Domestic Oil and Gas, Part II: Intangible Drilling and Development Costs,” KPMG, 2012, http://goo.gl/anWwu7 16 Independent Petroleum Association of America. Drilling and Development Costs, December 2011. http://goo.gl/kkEtO6 accessed on October 27, 2014. 17 American Petroleum Institute, Why Oil & Gas Tax Treatments Are Not Unique or “Subsidies”. February 2012. http://goo.gl/wS3Q1F accessed on October 27, 2014. 18 Chesapeake Energy, Intangible Drilling Costs: The Impact of A Change in Oil-and-Gas Tax Policy. December, 2012. 19 “Estimates of Federal Tax Expenditures for Fiscal Years 2014-2018,” Joint Committee on Taxation, August 5, 2014. http://goo.gl/K2Ps90 , accessed on October 27, 2014. 20 26 U.S.C. §613 21 Energy Tax Facts, “Percentage Depletion.” http://goo.gl/gHI4BZ , accessed on October 28, 2014. 22 Timeline History of Natural Gas and Oil Tax Provisions, http://goo.gl/ZfyhdZ 23 “Estimates of Federal Tax Expenditures for Fiscal Years 2014-2018,” Joint Committee on Taxation, August 5, 2014. http://goo.gl/gYBHJ9 , accessed on October 27, 2014. 24 “Tax Expenditures: Compendium of Background Material on Individual Provisions,” Congressional Research Service, December 2012, http://goo.gl/dJYGdD , p. 277. 25 “26 U.S. Code § 631 - Gain or loss in the case of timber, coal, or domestic iron ore,” Legal Information Institute, 26 U.S.C. 631(c), http://goo.gl/tJmCev “Mines and
Geothermal Deposits,” Chapter 9, Depletion, Publication 535 (2013), Internal Revenue Service, http://goo.gl/sjddzC 26 “Mineral Commodity Summaries 2014,” U.S. Department of the Interior, U.S. Geological Survey, http://goo.gl/FeK0uK 27 “Analytical Perspectives, Budget of the United States Government, Fiscal Year 2015,” Office of Management and Budget, http://goo.gl/BQpcFL 28 Congressional Budget Office,” CBO Budget Options, Vol 2,” August, 2009, https://www.cbo.gov/sites/default/files/08-06-budgetoptions.pdf, accessed on November
3, 2014, 223. 29 Scott, DiSavino, ”US gives tax credit to Illinois clean coal project,― Reuters, July 28, 2010,” http://www.reuters.com/article/2010/07/28/utilities-tenaska-taylorville-
idUSN2821308620100728, accessed October 31, 2014. 30 Tim Landis, “Developer pulls plug on Taylorville Energy Center,” The State-Journal Register, June 21, 2013, http://goo.gl/xxaw1I 31 “Tax Expenditures: Compendium of Background Material on Individual Provisions,” Congressional Research Service, December 2012, http://goo.gl/il9Ia5 , at 206, 208. 32 “Analytical Perspectives, Budget of the United States Government, Fiscal Year 2015,” Office of Management and Budget, http://goo.gl/Eo9HE9 . A separate estimate
for the cost of the gasification project credit is not available; however, it is likely small. In 2012, CRS estimated the combined cost of both credits would be about $200 million in FY 2014, the same figure OMB provided for the advanced coal project credit alone. “Tax Expenditures: Compendium of Background Material on Individual Provisions,” Congressional Research Service, December 2012, http://goo.gl/sIQ5V3 , at 217.
33 “Tax Expenditures: Compendium of Background Material on Individual Provisions,” Congressional Research Service, December 2012, http://goo.gl/3jafkz , at 157. 34 Korte, Gregory, “In Montana, Crow Tribe sees perils to ‘fiscal cliff,’” USA Today, November 19, 2012, http://goo.gl/tVAhRL , accessed on Nov. 12, 2014. 35 Korte, Gregory, “In Montana, Crow Tribe sees perils to ‘fiscal cliff,’” USA Today, November 19, 2012, http://goo.gl/dxLr4L , accessed on Nov. 12, 2014. 36 “Estimated Budget Effects of an Amendment in the Nature of a Substitute to H.R. 3474, the “Expiring Provisions Improvement, Reform, and Efficiency (‘EXPIRE’) Act
of 2014,” Joint Committee on Taxation, May 15, 2014, http://goo.gl/CMnoea 37 “Individual Income Tax Receipts and the Individual Tax Base—February 2014 Baseline,” Tab 7: Effects of Extending Tax Provisions Scheduled to Expire Before 2024,
Congressional Budget Office, February 4, 2014, http://goo.gl/kA5SJy 38 Image Source: “What is EOR?” Pump Solutions Group, http://goo.gl/rpSJi9 39 Office of Fossil Energy, Department of Energy. Enhanced Oil Recovery. http://goo.gl/Xdj0OR , accessed October 23, 2014. 40 Website of the Joint Committee on Taxation, “Description Of Revenue Provisions Contained In The President‘s Fiscal Year 2012 Budget Proposal,”JCS-3-11, June 14, 2011,
p. 336-337, http://goo.gl/cLF5Yk , accessed Nov. 4, 2011. 41 Website of the Joint Committee on Taxation, “Description Of Revenue Provisions Contained In The President‘s Fiscal Year 2012 Budget Proposal,”JCS-3-11, June 14, 2011,
p. 336-337, http://goo.gl/cLF5Yk , accessed Nov. 4, 2011. 42 Molly F. Sherlock, “Energy Tax Policy: Historical Perspectives on and Current Status of Energy Tax Expenditures,” R41227, Congressional Research Service, May 2, 2011,
p. 33, http://goo.gl/VxyMEq 43 “Energy & Oil Prices,” Bloomberg, http://goo.gl/fuqNvv , accessed November 13, 2014. 44 Independent Petroleum Association of America, “Marginal Well Tax Credit,” April 2009, http://www.ipaa.org/wp-content/uploads/downloads/2012/01/2009-04-
MarginalWellTaxCreditFactSheet.pdf, accessed July 5, 2011. 45 Calculation from the U.S. Energy Information Administration’s “Electric Power Monthly: October 2014.” http://goo.gl/a9RhhO , accessed on October 28, 2014. 46 Image Source: U.S. Energy Information Administration, “Short-Term Energy Outlook October 2014,” http://goo.gl/Ntqeo0 , accessed on October 28, 2014. 47 These figures are the sums of the estimates provided in the sections below. They include the cost of continued extensions of certain expiring provisions. 48 “Tax Expenditures: Compendium of Background Material on Individual Provisions,” Congressional Research Service, December 2012, http://goo.gl/3aLhqe , at 199. 49 “Present Law and Analysis of Energy-Related Tax Expenditures,” Joint Committee on Taxation, at 2. September 16, 2014. 50 Image Source: Union of Concerned Scientists, “Production Tax Credit for Renewable Energy.” http://goo.gl/KcJgTj accessed on October 28, 2014. 51 “Estimated Budget Effects of an Amendment in the Nature of a Substitute to H.R. 3474, the ‘Expiring Provisions Improvement, Reform, and Efficiency (‘EXPIRE’) Act
of 2014,’ Scheduled for Consideration by the Senate, ” Joint Committee on Taxation, May 15, 2014, http://goo.gl/3zjKXX 52 “Estimates of Federal Tax Expenditures for Fiscal Years 2014-2018,” Joint Committee on Taxation, August 5, 2014, http://goo.gl/GliUuM 53 “Individual Income Tax Receipts and the Individual Tax Base—February 2014 Baseline,” Tab 7: Effects of Extending Tax Provisions Scheduled to Expire Before 2024,
Congressional Budget Office, February 4, 2014, http://goo.gl/oHScSi 54 “Estimated Budget Effects of an Amendment in the Nature of a Substitute to H.R. 3474, the ‘Expiring Provisions Improvement, Reform, and Efficiency (‘EXPIRE’) Act
of 2014,’ Scheduled for Consideration by the Senate, ” Joint Committee on Taxation, May 15, 2014, http://goo.gl/Soz1SU 55 “Tax Expenditures: Compendium of Background Material on Individual Provisions,” Congressional Research Service, December 2012, p. 199, http://goo.gl/3ftqNn 56 Hunton and Williams, “IRS Issues Guidance for the ITC in Lieu of PTC Election,” June 2009. http://goo.gl/BUqpFq accessed on October 28, 2014 57 Martin, Christopher, “Solar Consolidation Expected as Tax Credit Drives Deals,” Bloomberg News, Oct. 21, 2014, http://goo.gl/JAnrvo accessed on Nov. 12, 2014. 58 Baker Tilly, “Investment Tax Credit – Section 48.” http://goo.gl/Aniibz , accessed on October 28, 2014. 59 Estimates of Federal Tax Expenditures for Fiscal Years 2014-2018,” Joint Committee on Taxation, August 5, 2014. http://goo.gl/d3jUCp , accessed on October 28, 2014. 60 This amount is not included in the total cost for this provision at the beginning of the chapter. “Individual Income Tax Receipts and the Individual Tax Base—February
2014 Baseline,” Tab 7: Effects of Extending Tax Provisions Scheduled to Expire Before 2024, Congressional Budget Office, February 4, 2014, http://goo.gl/EzkG5Y 61 “Frequently Asked Questions,” U.S. Energy Information Administration, April 29 2014, http://goo.gl/DxZEJZ. 62 “EPA Proposes 2014 Renewable Fuel Standards, 2015 Biomass-Based Diesel Volume,” Environmental Protection Agency, November 2013, p.3, http://goo.gl/h13jL0. 63 Schnepf, Randy, Agriculture-Based Biofuels: Overview and Emerging Issues,― Report: RN1282, Congressional Research Service, June 11, 2010, p. 4, http://goo.gl/hfq2in. 64 “Estimated Budget Effects of an Amendment in the Nature of a Substitute to H.R. 3474, the “Expiring Provisions Improvement, Reform, and Efficiency (‘EXPIRE’) Act
of 2014,” Joint Committee on Taxation, May 15, 2014, p. 3, http://goo.gl/y9onAr. 65 “Individual Income Tax Receipts and the Individual Tax Base—February 2014 Baseline,” Tab 7: Effects of Extending Tax Provisions Scheduled to Expire Before 2024,
Congressional Budget Office, February 4, 2014, http://goo.gl/wERtdk. 66 “Estimated Budget Effects of an Amendment in the Nature of a Substitute to H.R. 3474, the “Expiring Provisions Improvement, Reform, and Efficiency (‘EXPIRE’) Act
of 2014,” Joint Committee on Taxation, May 15, 2014, p. 4, http://goo.gl/y9onAr. 67Pashley, Steve, et. al. “Bringing Clarity to Fuel Excise Taxes and Credits,” American Institute of CPAs, April 1, 2014, http://goo.gl/914Iom. 68 The credit for liquefied hydrogen expired separately at the end of FY 2014; continuing to extend it will cost an additional $10 million from FY 2014-FY 2018. The credit
for all the other fuels, if extended, would cost $300 million in FY 2014 and $2.061 billion from FY 2014-FY 2018. “Individual Income Tax Receipts and the Individual Tax Base—February 2014 Baseline,” Tab 7: Effects of Extending Tax Provisions Scheduled to Expire Before 2024, Congressional Budget Office, February 4, 2014, http://goo.gl/EmV8vj.

DRAFT
142 | Tax Decoder
69 “Alternative Motor Vehicle Credit,” Internal Revenue Service, http://goo.gl/5YQ6jU. 70 “Alternative Motor Vehicle Credit,” Internal Revenue Service, http://goo.gl/5YQ6jU. 71 “Estimates of Federal Tax Expenditures for Fiscal Years 2014-2018,” Joint Committee on Taxation, August 5, 2014, p. 12, http://goo.gl/MF8Da5. 72 “Present Law and Analysis of Energy-Related Tax Expenditures,” Joint Committee on Taxation, September 16, 2014, p. 6. http://goo.gl/G5qNSr. 73 “Individuals Received Millions of Dollars in Erroneous Plug-in Electric and Alternative Motor Vehicle Credits,” U.S. Treasury Inspector General for Tax Administration,
January 21, 2011. http://goo.gl/s4upGs. 74 Internal Revenue Service, “Qualified Fuel Cell Vehicles.” http://goo.gl/cYp0hp. 75 No estimate is available for FY 2014 alone. “Estimates of Federal Tax Expenditures for Fiscal Years 2014-2018,” Joint Committee on Taxation, August 5, 2014, p. 24, http://
goo.gl/312meG. 76 Gallagher, Kelly Sims, and Muehlegger, Erich J, “Giving Green to Get Green: Incentives and Consumer Adoption of Hybrid Vehicle Technology.” Harvard Kennedy
School Faculty Research Working Paper Series RWP08-009, February 2008, p. 30 http://goo.gl/pnR9yA. 77 “Qualified Vehicles Acquired after 12-31-2009,” IRS, June 23, 2014, http://goo.gl/bvaPUq. 78 26 U.S. Code § 30D(e)(2), Legal Information Institute, http://goo.gl/sY52wb. 79 “Estimates of Federal Tax Expenditures for Fiscal Years 2014-2018,” Joint Committee on Taxation, August 5, 2014, p. 24 http://goo.gl/DKSI0r. . 80 “Estimated Budget Effects of an Amendment in the Nature of a Substitute to H.R. 3474, the ‘Expiring Provisions Improvement, Reform, and Efficiency (‘EXPIRE’) Act
of 2014,’ Scheduled for Consideration by the Senate, ” Joint Committee on Taxation, May 15, 2014, p. 3, http://goo.gl/qxOwGJ. 81 “Individual Income Tax Receipts and the Individual Tax Base—February 2014 Baseline,” Tab 7: Effects of Extending Tax Provisions Scheduled to Expire Before 2024,
Congressional Budget Office, February 4, 2014, http://goo.gl/Mynvqm. 82 Tax Expenditures: Compendium of Background Material on Individual Provisions,” Congressional Research Service, December 2012, p. 203, http://goo.gl/ke8e7L. 83 “Estimated Budget Effects of an Amendment in the Nature of a Substitute to H.R. 3474, the “Expiring Provisions Improvement, Reform, and Efficiency (‘EXPIRE’) Act
of 2014,” Joint Committee on Taxation, May 15, 2014, p. 4 http://goo.gl/DS8OBe. 84 The credit for hydrogen refueling property will expire at the end of 2014. Extending this provision past this point would cost $13 million from FY 2014 to FY 2018. The
credit for the other types of refueling property expired at the end of 2013. Continuing to extend these provisions would cost $21 million in FY 2014 and $177 million from FY 2014-FY 2018, according to the CBO. “Individual Income Tax Receipts and the Individual Tax Base—February 2014 Baseline,” Tab 7: Effects of Extending Tax Provisions Scheduled to Expire Before 2024, Congressional Budget Office, February 4, 2014, http://goo.gl/66iqRF.
85 These figures are the sums of the estimates provided in the sections below. They include the cost of continued extensions of certain expiring provisions. 86 Tax Expenditures: Compendium of Background Material on Individual Provisions,” Congressional Research Service, December 2012, p. 113, http://goo.gl/udnj25. 87 Tax Expenditures: Compendium of Background Material on Individual Provisions,” Congressional Research Service, December 2012, p.114, http://goo.gl/udnj25. 88 “Estimated Budget Effects of an Amendment in the Nature of a Substitute to H.R. 3474, the “Expiring Provisions Improvement, Reform, and Efficiency (‘EXPIRE’) Act
of 2014,” Joint Committee on Taxation, May 15, 2014, p. 3, http://goo.gl/jubPzh. 89 “Individual Income Tax Receipts and the Individual Tax Base—February 2014 Baseline,” Tab 7: Effects of Extending Tax Provisions Scheduled to Expire Before 2024,
Congressional Budget Office, February 4, 2014, http://goo.gl/GKa38F. 90 Rubin, Richard, “Appliance Tax Credit for Whirlpool, GE Gets Higher Price Tag,” March 18, 2011, http://goo.gl/Aq5iUG. 91 Coleman-Lochner, Lauren and Richard Rubin, “Whirlpool’s First Quarter Profit Rises, Helped by U.S. Energy Tax Credits,” April 27, 2011, http://goo.gl/Pg9mu1. 92 Coleman-Lochner, Lauren and Richard Rubin, “Whirlpool’s First Quarter Profit Rises, Helped by U.S. Energy Tax Credits,” April 27, 2011, http://goo.gl/Pg9mu1. 93 “Individual Income Tax Receipts and the Individual Tax Base—February 2014 Baseline,” Tab 7: Effects of Extending Tax Provisions Scheduled to Expire Before 2024,
Congressional Budget Office, February 4, 2014, http://goo.gl/1EoC4P. 94 Tax Expenditures: Compendium of Background Material on Individual Provisions,” Congressional Research Service, December 2012, p. 243, http://goo.gl/Fjvnh5. 95 “Estimated Budget Effects of an Amendment in the Nature of a Substitute to H.R. 3474, the ‘Expiring Provisions Improvement, Reform, and Efficiency (‘EXPIRE’) Act
of 2014,’ Scheduled for Consideration by the Senate, ” Joint Committee on Taxation, May 15, 2014, p 3, http://goo.gl/adHPPx. 96 “Individual Income Tax Receipts and the Individual Tax Base—February 2014 Baseline,” Tab 7: Effects of Extending Tax Provisions Scheduled to Expire Before 2024,
Congressional Budget Office, February 4, 2014, http://goo.gl/nrrMb4. 97 “Tax Expenditures: Compendium of Background Material on Individual Provisions,” Congressional Research Service, December 2012, p. 167, http://goo.gl/L3jBt3. 98 “Tax Expenditures: Compendium of Background Material on Individual Provisions,” Congressional Research Service, December 2012, p. 167, http://goo.gl/L3jBt3. 99 “Tax Expenditures: Compendium of Background Material on Individual Provisions,” Congressional Research Service, December 2012, p. 170, http://goo.gl/L3jBt3. 100 “Estimates of Federal Tax Expenditures for Fiscal Years 2014-2018,” Joint Committee on Taxation, August 5, 2014, p. 24, http://goo.gl/qqp0GA. 101 “Individual Income Tax Receipts and the Individual Tax Base—February 2014 Baseline,” Tab 7: Effects of Extending Tax Provisions Scheduled to Expire Before 2024,
Congressional Budget Office, February 4, 2014, http://goo.gl/1EoC4P. 102 “Tax Expenditures: Compendium of Background Material on Individual Provisions,” Congressional Research Service, December 2012, p. 197, http://goo.gl/L3jBt3.. 103 “Tax Expenditures: Compendium of Background Material on Individual Provisions,” Congressional Research Service, December 2012, p. 197, http://goo.gl/L3jBt3. . 104 Estimates of Federal Tax Expenditures for Fiscal Years 2014-2018,” Joint Committee on Taxation, August 5, 2014, p.23,http://goo.gl/qqp0GA. 105 “Tax Expenditures: Compendium of Background Material on Individual Provisions,” Congressional Research Service, December 2012, p. 173, http://goo.gl/L3jBt3. 106 Tax Expenditures: Compendium of Background Material on Individual Provisions,” Congressional Research Service, December 2012, p. 174, http://goo.gl/L3jBt3. 107 Crandall-Hollick, Margot, and Molly Sherlock. Residential Energy Tax Credits: Overview and Analysis. March 18, 2014. http://goo.gl/gpeHv9. 108 “Estimated Budget Effects of an Amendment in the Nature of a Substitute to H.R. 3474, the ‘Expiring Provisions Improvement, Reform, and Efficiency (‘EXPIRE’) Act
of 2014,’ Scheduled for Consideration by the Senate, ” Joint Committee on Taxation, May 15, 2014, http://goo.gl/yW1VaH. 109 “Individual Income Tax Receipts and the Individual Tax Base—February 2014 Baseline,” Tab 7: Effects of Extending Tax Provisions Scheduled to Expire Before 2024,
Congressional Budget Office, February 4, 2014, http://goo.gl/Z4xHfQ. 110 “Residential Energy Conservation Subsidy Exclusion (Personal),” U.S. Department of Energy, http://goo.gl/YwyY9F. 111 No figure is available for FY 2014 alone. Estimates of Federal Tax Expenditures for Fiscal Years 2014-2018,” Joint Committee on Taxation, August 5, 2014, p. 23, http://
goo.gl/5NncYN. 112 26 U.S. Code § 45Q, Legal Information Institute, http://goo.gl/kqTKNs. 113 “Carbon Dioxide Sequestration Credit,” Form 8933, 2014, IRS, http://goo.gl/VxB8dm. 114 Larry Park and Peter Folger, “Capturing CO2 from Coal-Fired Power Plants: Challenges for a Comprehensive Strategy,” CRS, April 15, 2010, p. 22, http://goo.gl/yXgry7. 115 Arnold W. Reitze, Jr., “Federal Controls of Carbon Dioxide Emissions: What are the Options?” Boston College Environmental Affairs Law Review, Volume 36, Number
1 (2009), p. 44, http://goo.gl/qxBkap. 116 “Analytical Perspectives, Budget of the United States Government, Fiscal Year 2015,” Office of Management and Budget, p. 205, http://goo.gl/8VqulG. 117 “Sliding Past Sequestration: Two trillion in common sense cuts to avoid the fiscal cliff,” Taxpayers for Common Sense, October 2012, p. 6, http://goo.gl/cw8Zq9. 118 Website of the Congressional Research Service, ―Nuclear Energy Policy,― RL33558, May 10, 2011, p. 22, http://goo.gl/6MPh4K. 119 “Analytical Perspectives, Budget of the United States Government, Fiscal Year 2015,” Office of Management and Budget, p. 205, http://goo.gl/5ebexy. 120 Image source: http://goo.gl/knad4q. 121 “Report to congress on competition in wholesale and retail markets for electric energy,” The Electric Energy Market Competition Task Force, p. 24, http://goo.
gl/6wy7iU. 122 “Tax Expenditures: Compendium of Background Material on Individual Provisions,” Congressional Research Service, December 2012, p. 255, http://goo.gl/L3jBt3. 123 “Tax Expenditures: Compendium of Background Material on Individual Provisions,” Congressional Research Service, December 2012, p. 255, http://goo.gl/L3jBt3. 124 “Estimates of Federal Tax Expenditures for Fiscal Years 2014-2018,” Joint Committee on Taxation, August 5, 2014, p. 23, “Special rule to implement electric transmission
restructuring,” http://goo.gl/kQbTs0. 125 “Individual Income Tax Receipts and the Individual Tax Base—February 2014 Baseline,” Tab 7: Effects of Extending Tax Provisions Scheduled to Expire Before 2024,
Congressional Budget Office, February 4, 2014, http://goo.gl/yv6E7u. 126 “Tax Expenditures: Compendium of Background Material on Individual Provisions,” Congressional Research Service, December 2012, p. 235, http://goo.gl/J6MQm2. 127 “Tax Expenditures: Compendium of Background Material on Individual Provisions,” Congressional Research Service, December 2012, p. 236, http://goo.gl/J6MQm2. 128 Estimates of Federal Tax Expenditures for Fiscal Years 2014-2018,” Joint Committee on Taxation, August 5, 2014, p. 24, http://goo.gl/ppzVCh. 129 Estimates of Federal Tax Expenditures for Fiscal Years 2014-2018,” Joint Committee on Taxation, August 5, 2014, p. 24, http://goo.gl/ppzVCh.

142 | Tax Decoder International Taxation | 143
INTERNATIONALTAXATION

DRAFT
144 | Tax Decoder
International Taxation
The United States’ taxation of the international income of U.S. corporations and individuals is determined by a tax system that is extremely complex. Our nation’s international tax system includes numerous deferrals, deductions, and credits that distort behavior and lead to inefficiencies in our economy. At the same time, the U.S. corporate tax rate, which
is the highest in the developed world, not only places U.S. companies at a competitive disadvantage to their foreign competitors; it creates incentives for corporations and individuals to keep their income abroad rather than invest it here at home.
reported foreign-earned income had no U.S. tax liability for 2006, after claiming the foreign-earned income exclusion and the foreign tax credit,” according to the Congressional Research Service.2
Although this section discusses several proposals, it is not meant to advocate a specific comprehensive reform plan for the U.S. international tax system. Rather, it is intended to highlight for taxpayers, and policymakers alike, the complexity of the current system and the reasons why it is failing.
U.S. Taxation of International Income
History & General Background
Most countries generally utilize one of two types of approaches to how they tax income earned abroad: a territorial approach or a worldwide approach. Under a territorial tax system, only income earned within the home country is taxed. Income earned by domestic companies’ operations abroad (known as “foreign subsidiaries”) is largely exempted from domestic taxes. Under a worldwide tax system, all income is subject to domestic taxes regardless of where it is earned. For example, a U.S. multinational corporation (a U.S. corporation with overseas operations) with a subsidiary in Japan would pay the higher U.S. tax rate even on income earned in Japan (often with a foreign tax credit issued to offset taxes paid to Japan.)
Most developed countries follow a territorial approach.
Of the 34 members of the OECD (a group of developed countries), 26 countries – including the United Kingdom, Canada, France, and Germany – use a territorial tax system.3 In these countries, most foreign-earned income is exempted from domestic taxes and can thus be “repatriated” (brought home) with little or no tax liability.
Consider this example, provided by the Business Roundtable, a trade group that advocates the adoption of a territorial tax system by the United States:
A 100 percent exemption applies in 18 of the OECD territorial countries, with the other territorial countries applying exemption rates between 95 and 97 percent. The 95 percent exemption typically results in a tax rate of 1 to 2 percent on the foreign dividend in these countries (e.g., in Germany, 5 percent of the dividend is
International Taxation (in millions) FY 2014 FY 2014 - FY 2018Deferral of Active Income of Controlled Foreign Corporations $83,400 $418,000
Tonnage Tax Alternative $100 $500
Research and Development Expenses $200 $1,100
Inventory Property Sales $3,000 $15,300
Availability of Foreign Tax Deduction Instead of Credit $200 $1,200
Personal Salary and Housing Exclusions $8,500 $47,600
Exclusion of Certain Allowances $2,000 $10,700
Total $97,400 $494,400
For example, a study by a private research firm found that U.S. multinational corporations kept $2.1 trillion abroad in 2013. Among these companies were General Electric, which stashed $110 billion overseas; Microsoft, with $76 billion; and Pfizer, with $69 billion.1 These large sums of cash kept overseas are the unintended consequences of a tax system that is overly complex and full of misaligned incentives.
Many individuals also benefit from generous tax treatment of overseas income. “Roughly 57 percent of taxpayers who

144 | Tax Decoder International Taxation | 145
subject to a 30 percent tax rate, resulting in a tax equal to 1.5 percent of the remitted income).
As an example of the operation of a territorial system, a U.K. multinational corporation operating through a foreign subsidiary in China generally pays the same total rate of tax on its earnings in China as do the Chinese subsidiaries of other multinational corporations that are headquartered in other territorial countries.
As a result, under territorial tax systems, all foreign operations located in a given country generally compete on a level playing field with each other, as well as with locally headquartered companies.4
The United States and seven other OECD nations – including Ireland, Greece, South Korea, and Mexico – employ a mostly worldwide approach. In these countries, very little foreign-earned income is exempted from domestic taxes. As a result, multinational corporations pay the domestic rate on all income, regardless of whether it is earned at home or abroad. Among these nations, foreign income is subject to domestic tax rates ranging from 12.5 percent in Ireland to 35 percent in the United States.
“No major country has adopted either approach entirely,” according to the Congressional Budget Office. That is, even in nations with a territorial tax system, a small amount of foreign-earned income is subject to domestic taxes in that country. Likewise, countries utilizing a worldwide system may also have various deductions or deferrals that reduce or delay taxation of foreign-earned income. For instance, although the U.S. uses a mostly worldwide system, it has numerous deductions and deferrals. As a result, in reality, very little foreign-earned income is taxed by the U.S. government.
The U.S. Tax System is the Worst of Both Worlds
Under a purely worldwide tax system, the United States would tax all income at the same rate, regardless of where it was earned. An American multinational corporation with operations in Ireland (which has a 12.5 percent corporate tax rate) would pay the U.S. rate (nominally 35 percent) even on income earned in Ireland. On the other hand, under a purely territorial system, that same firm’s Ireland-based operations would only be subject to the 12.5 percent Irish rate and the company would be able to repatriate all its Irish income without any additional tax liability.
However, while the U.S. tax system leans toward the worldwide approach, meaning U.S. taxes apply to foreign-earned income, it retains some elements of a territorial system. Specifically, the U.S. tax system offers several exclusions and deferrals that significantly reduce or delay the tax liability of U.S. multinationals’ foreign-earned income. These exclusions and deferrals are described below.5
Deferral of active income of controlled foreign corporations.
Although the United States taxes the foreign-earned income of U.S. multinational corporations, these taxes are generally deferred until the foreign-earned income is repatriated to the United States, such as in the form of dividends from the foreign subsidiary to the U.S. parent. In other words, until the foreign-earned income is transferred to the U.S. parent company, no U.S. taxes are owed on that income.
“Deferral has been part of the U.S. tax system since the origin of the corporate income tax in 1909,” according to CRS. Yet, because deferral allows U.S. multinationals to delay or avoid taxes on foreign-earned income, it creates an incentive for companies to locate operations in foreign countries with lower tax rates.
This provision is estimated to cost $83.4 billion in FY 2014 and $418 billion from FY 2014 through FY 2018.6
Opponents of deferral argue it distorts investment decisions by encouraging U.S. multinationals to locate operations in low-tax foreign nations. According to CRS,
Economic theory suggests that a tax incentive such as deferral does not promote the efficient allocation of investment. Rather, capital is allocated most efficiently—and world economic welfare is maximized—when taxes are neutral and do not distort the distribution of investment between the United States and abroad.7
In other words, opponents of deferral believe it reduces efficiency by creating artificial tax incentives that make foreign investments more appealing than they otherwise would be.
Even after eliminating deferral, some incentives to relocate operations abroad remain.8 In order to prevent double taxation of foreign-earned income, the United States provides tax credits to offset taxes paid to foreign governments. However, these foreign tax credits cannot exceed the amount of U.S. taxes owed on foreign-earned income. Thus, a business which paid higher foreign taxes than the U.S. tax liability on that same income would have excess credits.
Taxation of Foreign Income of U.S. Multinational Firms: An Example

DRAFT
146 | Tax Decoder
Assuming no changes were made to how credits can be used, “firms with excess foreign tax credits would still find it advantageous to shift investments or reported income from high-tax to low-tax countries” because they could shift their excess credits to the second country along with the shifted income.9 However, if this “cross-crediting” were eliminated, it would further reduce such incentives.
Another concern noted by CBO is that elimination of de-ferral could encourage some firms, particularly new firms, to incorporate abroad as a means of avoiding U.S. taxes entirely. The process of reincorporating abroad, known as “inversion,” involves relocating the headquarters of a U.S. company to a foreign country. It is discussed in greater detail below.
Supporters of maintaining deferral argue it is necessary to allow U.S. multinationals to compete abroad. If it were eliminated, they argue, foreign subsidiaries of U.S. firms would be at a distinct competitive disadvantage versus foreign firms, given that U.S. subsidiaries would face higher tax rates than those of their competitors.
Tonnage tax alternative
The tonnage tax is an alternative to the normal corporate tax that allows corporations involved in shipping to pay a tax calculated from a ship’s tonnage rather than regular corporate income tax.
The special tax rate for the shipping industry was created by Congress in 2004, as a means of lowering the higher taxes U.S.-flagged shipping vessels paid compared to their foreign com-petitors. Supporters of the legislation contend the tax break keeps the country “internationally competitive and secure,” and argued that these tax imbalances were to blame for the declining numbers of U.S.-flagged vessels participating in in-ternational trade. In addition, a robust commercial fleet crewed by merchant mariners was viewed as vital to national security.10 According to CRS:
Corporations involved in shipping trade and business operations may, as an alternative to the conventional corporate income tax, elect to pay the ‘tonnage tax’...
For corporations electing to pay the tonnage tax, the expected tax burden is smaller than under the conventional corporate income tax. The expected tax burden is reduced because taxes are no longer directly tied to profitability, but rather to a ship’s fixed tonnage. Thus, as profitability increases taxes remain constant.11
This provision is estimated to cost $100 million in FY 2014 and $500 million from FY 2014 through FY 2018.12
Research and development expenses
Federal tax law requires “U.S.-based multinational corporations to attribute part of their research expenses to foreign-earned income, even if their R&D was performed
entirely in the United States.”13 The rationale behind this requirement is that since goods and services sold in foreign markets often benefit from the same R&D as domestic goods and services, at least part of those R&D costs should be deducted from foreign-earned income. Thus, the requirement lowers the R&D-related expenses which can be deducted from taxes owed on domestic income, raising a company’s domestic tax liability.
On a purely proportional basis, a company that earns 80 percent of revenue abroad would attribute 80 percent of related R&D expenses to that foreign-earned income. Thus, even if all R&D operations were U.S.-based, only 20 percent of R&D expenses would be attributed to U.S.-income. However, rules issued by the IRS also allow that when 50 percent or more of R&D expenses are incurred in the United States, up to 50 percent of those expenses may be automatically attributed to U.S.-income, with only the remaining expenses attributed proportionally.
When a company repatriates foreign-earned income to the United States, it can claim credits for taxes paid on that income to a foreign country. (This ensures foreign-earned income is subject to the same overall tax liability as domestic income.) By allowing a greater share of R&D expenses to be attributed to U.S. income than would be allowable on a proportional basis, the rules increase a company’s foreign-earned income and thus allow larger foreign tax credits.
While Congress and the IRS have, over the years, increased the maximum amount of expenses that can be attributed to U.S.-income under the above 50 percent rule, some argue that the entirety of expenses should be attributed based on where they are incurred. Because foreign governments do not typically provide foreign subsidiaries of U.S. companies with tax credits for R&D expenses incurred in the United States, critics argue the allocation rules create incentives for companies to transfer some R&D operations to foreign countries, where they would be eligible for such tax breaks.
This provision is estimated to cost $200 million in FY 2014 and $1.1 billion from FY 2014 through FY 2018.14
Inventory property sale
As mentioned previously, when repatriating foreign-earned income, companies can claim credits for taxes paid on that income to a foreign country. However, these credits cannot exceed the amount of U.S. taxes owed on that foreign-earned income. Thus, if a company paid more in foreign taxes than it owes in U.S. taxes on the same foreign-earned income, it will have “excess credits” that cannot be used to further reduce its U.S. tax liability.
Rules related to the manufacture and sale of certain inventory property allow some or all of the income to be classified as foreign-earned income. Under the Tax Reform Act of 1986, the source of income from the sale of personal property is determined by the residence of the seller. Thus, “sales of property by U.S. persons or firms were to have a U.S. source.”15

146 | Tax Decoder International Taxation | 147
Not wanting to inhibit international trade, however, Congress provided two exceptions to the residence rule:
1. inventory that is purchased and resold is sourced based on where the sale occurs; and
2. inventory that is manufactured and sold by the same U.S. firm is treated as having a divided (part domestic, part foreign) source.
By classifying such income as foreign-earned, a company can increase the amount of credits it can claim against taxes owed on that foreign-earned income.
This provision is estimated to cost $3 billion in FY 2014 and $15.3 billion from FY 2014 through FY 2018.16
Availability of foreign tax deduction instead of credit
In some cases, such as when a company has reached the limit on foreign tax credits it can claim, the company may choose to reduce its tax liability on foreign-earned income by deducting foreign taxes as if they were business expenses. According to CRS:
In general, the credit is more advantageous than the deduction, because a credit reduces taxes paid on a dollar-for-dollar basis, while a deduction only reduces income subject to tax. However, in cases where the taxpayer is facing the foreign tax credit limit[,] claiming the deduction will result in a lower tax liability,
This provision is estimated to cost $200 million in FY 2014 and $1.2 billion from FY 2014 through FY 2018.17
While a deduction allows companies to reduce their tax liabil-ities, deductions do not avoid double-taxation of foreign-earned income as credits do, and are thus less generous. For instance, a U.S. multinational corporation operating in a foreign country with a 20 percent corporate tax rate would pay $20 in foreign tax on $100 of income earned there. Given a U.S. corporate tax rate of 35 percent, the company’s U.S. tax liability on that same $100 of foreign-earned income would be $35. However, with a credit, the $35 U.S. tax liability would be reduced dollar-for-dollar by the $20 paid to the foreign country, leaving a $15 U.S. tax liability.
In the case of a deduction, however, the $20 paid to the foreign country would merely reduce the amount of foreign-earned income subject to U.S. taxes. As a result, the U.S. tax liability would be 35 percent of $80 ($100 minus $20 in foreign taxes paid), or $28. Thus, while the total tax liability under a credit would be $35 (or 35 percent of $100), the total tax liability under the deduction would be $48 (20 percent of $100, plus 35 percent of $80).
Due to the fact that deductions do not avoid double-taxation as credits do, deductions create a disincentive for companies to invest abroad. While this disincentive may have an immediate positive impact on national economic welfare, it creates distortions that encourage companies to base investment decisions on tax considerations rather than what investments are the most worthwhile. Thus, according to CRS, “it produces an
inefficient ‘deadweight’ reduction in world economic welfare.”18
Although the U.S. tax system leans toward a worldwide ap-proach, deferrals and exclusions such as these, which delay or reduce tax liability on foreign-earned income, make it essentially a hybrid system. According to the Congressional Budget Office:
Those features of the U.S. tax system affect U.S. multinationals’ decisions about whether and how to invest at home and abroad. The current tax system provides incentives for U.S. firms to locate their production facilities in countries with low taxes as a way to reduce their tax liability at home. Those responses to the tax system reduce economic efficiency because the firms are not allocating resources to their most productive use.
The CBO also concluded that these incentives reduce the income of shareholders, domestic employment, and federal tax revenue. Thus, over the long term, wages for U.S. workers are likely to be lower than they otherwise would be. Further:
The current system also creates incentives to shift reported income to low-tax countries without changing actual investment decisions. Such profit shifting erodes the corporate tax base and leads to wasted resources for tax planning.19
Thus, the current system not only creates incentives for companies to locate operations in low-tax countries, but it creates disincentives for repatriating foreign-earned earnings as well.
Apple, Inc.: A Case Study
Apple Inc. is a U.S. multinational corporation and maker of consumer electronics. In 2013, Apple had almost $171 billion in worldwide revenue, with a net income of just over $37 billion.20 About 60 percent of Apple’s quarterly revenue was earned through sales outside of the United States.21 To manage its overseas operations and sales, Apple established two controlled foreign corporations (CFCs) in Ireland, Apple Operations International and Apple Sales International.
Apple Inc. in the United States is responsible for coordinating U.S. sales, and Apple Sales International (ASI) is responsible for selling Apple products in Europe and Asia. Apple Operations International (AOI) is a holding company that “consolidates and manages a substantial portion of Apple’s foreign, post-tax income through intercompany dividends,” according to Apple.22 By utilizing the tax code’s “deferral of active income of controlled foreign corporations,” described in the previous section, Apple can avoid paying taxes on its overseas (non-investment) income, so long as that income remains abroad (e.g., in AOI).
Apple divides its intellectual property rights along these same lines. Although Apple conducts virtually all of its re-search and development (R&D) in the United States, it utilizes

DRAFT
148 | Tax Decoder
a cost-sharing agreement with its foreign subsidiaries to pay for the majority of its R&D expenses. Although it is not permit-ted to deduct from its U.S. tax liability the R&D costs funded by ASI, Apple is able to use its foreign revenue to pay for R&D costs without paying U.S. taxes on that foreign revenue. In ex-change for sharing these R&D costs, Apple Inc. grants its Irish subsidiaries the rights to its intellectual property and to profits resulting from the sale of Apple products.23
Currently, Apple has an estimated $54 billion in profits held overseas. Repatriating that income to the United States would require Apple to pay 35 percent, or $18.9 billion, of it in taxes. Thus, Apple simply has little incentive to bring that money home. In fact, in 2013, to finance a cash dividend to its shareholders, Apple issued $17 billion in debt rather than repa-triate the money needed to pay for the dividend. According to Apple’s CEO Tim Cook, “If Apple had used its overseas cash to fund this return of capital, the funds would have been di-minished by the very high corporate US tax rate of 35% (less applicable foreign credits). By contrast, given today’s histori-cally low interest rates, issuing debt at a cost of less than 2% is much more advantageous for the Company’s sharehold-ers.”24 In other words, the high U.S. corporate tax rate creates a strong incentive for U.S. multinational corporations to keep their foreign profits overseas.
Comparing the Worldwide and Territorial Approaches
Each approach to taxation has distinct advantages and disadvantages. Supporters of a worldwide approach argue that because a corporation’s tax liability is the same regardless of where it operates, there is less incentive to relocate operations abroad solely as a means of gaining a lower tax rate. Thus, supporters contend, a worldwide tax system encourages companies to base investment decisions on more substantive factors, improving efficiency.
However, opponents of a worldwide tax system argue it places U.S. multinationals at a competitive disadvantage with foreign competitors. They argue that a foreign subsidiary of a U.S. multinational that is subject to the 35 percent U.S. tax rate would find it more difficult to compete with foreign firms that pay a significantly lower rate.
Likewise, supporters of a territorial approach argue that it places U.S. multinational corporations on a level playing field with their foreign competitors. For example, a German subsidiary of a U.S. multinational would pay the same tax rate as German companies or subsidiaries of multinationals of other territorial tax countries.
Opponents of a territorial tax system argue that it encourages U.S. multinationals to relocate operations abroad and creates incentives for companies to shift profits abroad (i.e., make them appear to be foreign in origin) to avoid U.S. taxes.
What is true of both systems is they largely reduce the
current incentives to retain income abroad rather than repatriate it to the United States.
International Corporate Tax Policy Options
A number of policy options could move the United States to-ward either a worldwide or territorial tax system. Each of these would have significant effects on federal tax revenues. For instance, according to the Joint Committee on Taxation (JCT), requiring U.S. multinational corporations to pay taxes immediately on income they earn abroad could raise as much as $114 billion over a 10-year period.25 In addition to increased revenue, proponents of a world-wide system argue that its biggest benefit would be a reduction in the tax incentives to locate operations abroad.
The United States could also move toward a territorial approach by exempting from U.S. taxation dividends from foreign subsidiaries to U.S. parents. According to CBO, this option would “tend to increase investment in and reported income from low-tax countries.” At the same time, by limit-ing the deduction of expenses allocated to foreign operations, this option would increase a firm’s taxable worldwide income “enough to more than offset the Treasury’s loss from not tax-ing active foreign income.” According to JCT, this option could raise as much as $76 billion over a 10-year period.26 Most im-portant, a territorial system would allow U.S. multinational corporations to better compete abroad, and would eliminate disincentives to bring earnings back to the United States.
Still others have proposed alternative, hybrid systems meant to correct the drawbacks in the current hybrid U.S. system. For exam-ple, Robert Pozen, of Harvard Business School and the Brookings Institution, has proposed a non-deferrable “global competitiveness tax of roughly 17 percent on all foreign profits of U.S. corporations.” This number represents the “effective marginal rate paid, on av-erage, by corporations in advanced industrial countries.” Existing foreign tax credits would prevent double taxation.
For example, suppose Corporation X pays a 17 percent effective tax rate on its 2014 profits in the U.K. Since Corporation X is already paying 17 percent in taxes to the U.K., it would be allowed to move those profits anywhere in the world—including the U.S.—without being taxed again. Suppose Corporation Y, on the other hand, pays 12 percent on its 2014 corporate profits earned in Ireland. Then Corporation Y would promptly have to pay the difference, owing 5 percent in U.S. taxes on those Irish profits. After the company paid the tax, the foreign profits could be moved back to the U.S. without any additional corporate taxes.
According to Pozen, this approach seeks to address the biggest criticisms of both worldwide and territorial tax systems. By taxing foreign-earned income at the average industrialized-nation rate and not at the higher U.S. rate, this

148 | Tax Decoder International Taxation | 149
Taxation of Personal Income Earned Abroad In addition to a worldwide tax system for corporate income, the United States is one of only two countries (the other being
Eritrea) that taxes the worldwide income of nonresident citizens and permanent residents.28 As a result, U.S. citizens and permanent residents who live and work abroad must report their foreign income to the IRS and pay U.S. taxes on income, aside from certain exclusions (discussed below).
Since 1926, at least some income earned abroad by nonresident citizens has been exempted from U.S. taxes. According to the Congressional Research Service, “The Revenue Act of 1926 (P.L. 69-20) provided an unlimited exclusion for foreign earned income for persons residing abroad for an entire tax year.” Proponents of such an exclusion argued it was necessary to allow U.S. citizens to promote trade abroad.31
However, the Kennedy Administration would later push for limits on the foreign earned income exclusion, arguing they were necessary to “support the general principles of equity and neutrality in the taxation of U.S. citizens at home and abroad.”
Source: CNN Money42
History and Current Status
The first step toward taxation of the worldwide income of U.S. citizens came about during the Civil War, when the United States instituted a five percent tax on the U.S. income of “any citizen of the United States residing abroad.” The surcharge on nonresident citizens was designed, according to The Wall Street Journal, “to prevent wealthy people ducking their military and civic obligations by fleeing the U.S. in its time of crisis.”29 By 1864, the tax included not just U.S. income of nonresident citizens, but their foreign income as well.30
system would largely allow U.S. multinationals operating abroad to stay competitive (although U.S. companies would still be at a disadvantage to foreign competitors from territorial system countries – for instance, a German company operating in China). Yet, by maintaining U.S. taxes on foreign-earned income, Pozen argues his proposal would create a weaker incentive to locate operations abroad than a purely territorial approach.
Under Pozen’s approach, the revenues from this “global competitiveness tax,” which he estimates to be $150 billion
over 10 years, could finance a reduction in the U.S. domestic tax rate from 35 percent to 30 percent.27
As most industrialized nations have moved toward a territorial system, academic consensus has likewise settled around a territorial approach. Most believe it is the best option to encourage economic growth and investment here at home. Whatever approach policymakers ultimately adopt, it is clear that the current system of high tax rates and complexity is putting the United States at a distinct disadvantage to its competitors.

DRAFT
150 | Tax Decoder
As a result, the Revenue Act of 1962 limited the exclusion to $20,000.32 Over the subsequent decades, the foreign earned income exclusion underwent numerous changes that in some cases limited it and in other cases expanded it.
Cost and Current Status
Today, nonresident citizens can claim a flat salary exclusion of $99,200 (indexed for inflation) as well as an additional housing exclusion. Credits also offset any taxes paid to foreign governments on income above the exclusion. Any other income is taxed as if it were earned in the United States.
Additionally, some international organizations, like the United Nations (UN) and the International Monetary Fund (IMF), provide their U.S. citizen employees tax reimbursements to offset their tax payments. According to the IMF, this is done “to treat all staff equitably regardless of nationality,” as some countries do not tax income paid to citizens from an international organization.33 Under this system, U.S. citizens pay federal income taxes on their wages, then are reimbursed for those taxes. In the case of the UN, the United States pays into its Tax Equalization fund with dues.
The salary and housing exclusions together will reduce U.S. tax revenues by $8.5 billion in FY 2014, and $47.6 billion from FY 2014 through FY 2018.34
A separate section allows federal civilian employees working abroad to exclude housing and other cost-of-living allowances from their taxable income. This provision will cost $2 billion in FY 2014 and $10.7 billion from FY 2014 through FY 2018.35
Analysis & Debate
According to the Committee for a Responsible Federal Budget (CRFB),
those who benefit from the [foreign earned income exclusion] have much higher income on average than the overall population. Using IRS data, Eric Toder of the Tax Policy Center finds that in 2006, the average income for someone who used the exclusions was $170,000, compared to the overall average of $58,000.36
Likewise, with regard to the complete exclusion of cost-of-living allowances of federal workers abroad, CRS notes that the “data suggest that real incomes for federal workers abroad are generally higher than real incomes in the United States. Consequently, section 912 exclusions probably reduce the progressivity of the income tax.”37
Opponents of these exclusions argue they are essentially subsidies for higher-income Americans working abroad. As noted by CRS,
Many employers offer their overseas employees ‘tax equalization’ packages whereby the employer
guarantees that the employees will not pay more taxes working overseas than they would pay if they were working in the U.S. The [exclusion] provisions relieve the employer from having to reimburse employees for U.S. tax on the amounts that are excluded under the income and housing exclusions. In this way, [the foreign earned income exclusion] subsidizes employers sending employees overseas.38
However, proponents of maintaining the foreign earned income exclusion argue that repealing it would:
• place many Americans working abroad at an eco-nomic disadvantage versus foreign workers whose home countries do not take their worldwide income;
• make foreign-based firms less likely to hire Americans, given that any ‘tax equalization’ packages offered would become more costly;
• harm U.S. exports by creating disincentives for Americans to work abroad; and
• mean “U.S. taxes on Americans working abroad would generally be higher than taxes on domestic workers with equivalent real economic income” due to generally higher costs of living in foreign countries.39
Likewise, the federal worker cost-of-living exclusion was designed to compensate for the higher cost of living of some countries. Were there no such exclusion, federal employees’ salaries would necessarily be higher in high-cost countries to ensure the same real income (salary adjusted for cost-of-living). Yet, these higher salaries would also “place federal employees stationed abroad in a higher tax bracket,” according to CRS.40
“Roughly 57 percent of taxpayers who reported foreign-earned income had no U.S. tax liability for 2006, after claiming the foreign-earned income exclusion and the foreign tax credit,” according to CRS, Thus, for most U.S. citizens working abroad, the exclusion and tax credit mitigate many of the negative effects of worldwide taxation. Still, for others, the remaining tax liability and the resources required to comply with increasing complex regulations are such that they will go as far as renouncing their U.S. citizenship to avoid them.
Indeed, stricter enforcement, new legislation and regulations, and higher tax rates on top-earners have all contributed to a dramatic spike in the number of Americans renouncing their citizenship. In 2013, this number reached nearly 3,000 – a 221 percent increase over the 932 who renounced their citizenship in 2012, according to the International Tax Blog. The average from 1999 to 2010 was just under 504.41
In 2010, Congress passed the Foreign Accounts Tax Compliance Act (FACTA), which required foreign financial institutions to report to the IRS regarding the holdings of their American clients. According to NPR, “Foreign banks looked at the new law and decided that the regulations

150 | Tax Decoder International Taxation | 151
1 Audit Analytics, “Overseas Earnings of Russell 1000 Tops $2 Trillion in 2013,” April 1, 2014, available at http://goo.gl/L0H8uO. 2 “Tax Expenditures: Compendium of Background Material on Individual Provisions,” Congressional Research Service, December 2012, http://goo.gl/oOOCZh 3 Business Roundtable, “Taxation of American Companies in the Global Marketplace: A Primer,” April 2011; http://goo.gl/DKMWrK. 4 Business Roundtable, “Taxation of American Companies in the Global Marketplace: A Primer,” April 2011; http://goo.gl/QAG7io. 5 Congressional Research Service for the United States Senate Committee on the Budget, “Tax Expenditures: Compendium of Background Material on Individual
Provisions,” December 2012: http://goo.gl/UcJ4rL. 6 “Estimates of Federal Tax Expenditures for Fiscal Years 2014-2018,” Joint Committee on Taxation, August 5 2014, http://goo.gl/WUjjU2 7 Congressional Research Service for the United States Senate Committee on the Budget, “Tax Expenditures: Compendium of Background Material on Individual
Provisions,” December 2012: http://goo.gl/ongkoV 8 Congressional Budget Office, “Options for Taxing U.S. Multinational Corporations,” January 8, 2013; http://goo.gl/zMzvtq. 9 Congressional Budget Office, “Options for Taxing U.S. Multinational Corporations,” January 8, 2013; http://goo.gl/zMzvtq. 10 “Preserving the Tonnage Tax for the U.S.-Flag Commercial Fleet Keeps the U.S. Internationally Competitive and Secure,” House Ways and Means Committee, http://
goo.gl/mijpGS 11 Congressional Research Service for the United States Senate Committee on the Budget, “Tax Expenditures: Compendium of Background Material on Individual
Provisions,” December 2012: http://goo.gl/Xg9w91. 12 “Estimates of Federal Tax Expenditures for Fiscal Years 2014-2018,” Joint Committee on Taxation, August 5 2014, http://goo.gl/WUjjU2. 13 Congressional Research Service for the United States Senate Committee on the Budget, “Tax Expenditures: Compendium of Background Material on Individual
Provisions,” December 2012: http://goo.gl/CNqyWW. 14 “Estimates of Federal Tax Expenditures for Fiscal Years 2014-2018,” Joint Committee on Taxation, August 5 2014, http://goo.gl/WUjjU2. 15 Congressional Research Service for the United States Senate Committee on the Budget, “Tax Expenditures: Compendium of Background Material on Individual
Provisions,” December 2012: http://goo.gl/RYxWuH 16 “Estimates of Federal Tax Expenditures for Fiscal Years 2014-2018,” Joint Committee on Taxation, August 5 2014, http://goo.gl/WUjjU2. 17 “Estimates of Federal Tax Expenditures for Fiscal Years 2014-2018,” Joint Committee on Taxation, August 5 2014, http://goo.gl/WUjjU2. 18 Congressional Research Service for the United States Senate Committee on the Budget, “Tax Expenditures: Compendium of Background Material on Individual
Provisions,” December 2012: pg 70 http://goo.gl/qXmZhs. 19 Congressional Budget Office, “Options for Taxing U.S. Multinational Corporations,” January 8, 2013; http://goo.gl/aBBt9t. 20 Securities and Exchange Commission, “APPLE INC 2013 Annual Report Form (10-K)” (XBRL), October 30, 2013, available at http://goo.gl/2tyP1l. 21 Apple, Inc., “Apple Reports Fourth Quarter Results,” Apple Press Info, Accessed July 24, 2014, available at http://goo.gl/gccpaj. 22 Testimony of Apple CEO Tim Cook before the Permanent Subcommittee on Investigations (PSI) of the U.S. Senate Homeland Security and Governmental Affairs
Committee, May 21, 2013, available at http://goo.gl/ouAkUa. 23 Testimony of Apple CEO Tim Cook before the Permanent Subcommittee on Investigations (PSI) of the U.S. Senate Homeland Security and Governmental Affairs
Committee, May 21, 2013, available at http://goo.gl/d4TRSV 24 Testimony of Apple CEO Tim Cook before the Permanent Subcommittee on Investigations (PSI) of the U.S. Senate Homeland Security and Governmental Affairs
Committee, May 21, 2013, available at http://goo.gl/rpUWlG 25 Congressional Budget Office, “Options for Taxing U.S. Multinational Corporations,” January 8, 2013; http://goo.gl/BF3jpM . pg 18 26 Congressional Budget Office, “Options for Taxing U.S. Multinational Corporations,” January 8, 2013; http://goo.gl/DYUjzF. 27 Robert C. Pozen, “A Better Path to Corporate Tax Reform,” February 18, 2014; http://goo.gl/mDnxVF. 28 John D. McKinnen, “Tax History: Why U.S. Pursues Citizens Overseas,” Wall Street Journal, May 18, 2012; http://blogs.wsj.com/washwire/2012/05/18/tax-history-why-
u-s-pursues-citizens-overseas. 29 John D. McKinnen, “Tax History: Why U.S. Pursues Citizens Overseas,” Wall Street Journal, May 18, 2012; http://blogs.wsj.com/washwire/2012/05/18/tax-history-why-
u-s-pursues-citizens-overseas. 30 John D. McKinnen, “Tax History: Why U.S. Pursues Citizens Overseas,” Wall Street Journal, May 18, 2012; http://goo.gl/Ul14QY . 31 Congressional Research Service for the United States Senate Committee on the Budget, “Tax Expenditures: Compendium of Background Material on Individual
Provisions,” December 2012: http://goo.gl/lphwkD pg 34 32 Congressional Research Service for the United States Senate Committee on the Budget, “Tax Expenditures: Compendium of Background Material on Individual
Provisions,” December 2012: http://goo.gl/v8zunE 33 International Monetary Fund, Tax Equalization Adjustments, September 10, 2014; http://goo.gl/WQeqIW . 34 “Estimates of Federal Tax Expenditures for Fiscal Years 2014-2018,” Joint Committee on Taxation, August 5 2014, http://goo.gl/WUjjU2. 35 “Estimates of Federal Tax Expenditures for Fiscal Years 2014-2018,” Joint Committee on Taxation, August 5 2014, http://goo.gl/WUjjU2. 36 The Committee for a Responsible Federal Budget, “The Tax Break-Down: Foreign Earned Income Exclusion,” October 24, 2013; http://goo.gl/VbdJ9H . 37 Congressional Research Service for the United States Senate Committee on the Budget, “Tax Expenditures: Compendium of Background Material on Individual
Provisions,” December 2012: http://goo.gl/wcGhIz 38 Congressional Research Service for the United States Senate Committee on the Budget, “Tax Expenditures: Compendium of Background Material on Individual
Provisions,” December 2012: http://goo.gl/E1ebpE 39 Congressional Research Service for the United States Senate Committee on the Budget, “Tax Expenditures: Compendium of Background Material on Individual
Provisions,” December 2012: http://goo.gl/wEOSfk 40 Congressional Research Service for the United States Senate Committee on the Budget, “Tax Expenditures: Compendium of Background Material on Individual
Provisions,” December 2012: http://goo.gl/kVE6rS 41 International Tax Blog, “2013 Expatriations Increase by 221%,” February 6, 2014; http://goo.gl/KTJY7c 42 Sophia Yan, “3,000 Americans ditch their passports,” CNN Money, February 17, 2014; http://money.cnn.com/2014/02/17/pf/taxes/citizenship-taxes. 43 Ari Shapiro, “Why More Americans Are Renouncing U.S. Citizenship
would be a huge hassle. Many of them decided to wash their hands of American account-holders.”43
Some Americans abroad argue that the incentive to renounce their citizenship is less about the tax liability and more about the difficulty complying with the complex FACTA regulations. The same NPR article quoted an American businessman in Switzerland: “It’s not about a dollar value of taxes that I don’t want to pay… It’s about the headache associated with the regulations, filing in the U.S., and then having financial institutions in the rest of the world turn me away.”
The tax equalization fund payments to U.S. citizen employees of international organizations violate the principle of tax equity by taxing Americans at different rates for similar work. Diplomats and other Department of State employees who work with the United Nations in New York are required to pay their taxes without any reimbursement from the U.S. government.

DRAFT
152 | Tax Decoder
FAMILYAND CHILD

152 | Tax Decoder Family & Child | 153
Family & Child Congress has built numerous provisions into the tax code intended to support children and those that care for them. These
range from provisions used by nearly all caretakers, such as exemptions for dependents, to special refundable tax credits that provide cash payments to low-income households. These tax benefits, in general, only marginally offset the expense of raising a child.
Although they were well-intentioned, several problems have developed from these tax expenditures since their creation. Many of the expenditures are not targeted to those with the greatest financial need and some even provide significant subsidies to the very wealthiest taxpayers. Some, particularly the Earned Income Tax Credit and the Additional Child Tax Credit, are vulnerable to fraud and are costing the taxpayers billions of dollars. Further, they are misdirecting benefits meant for those with true need. Other expenditures are duplicative of spending programs in federal agencies. Finally, some provisions cost significant federal revenue, but may fall short of achieving certain social goals. There is little evidence to suggest they have a significant impact on the decisions of taxpayers, despite Washington’s best attempt at encouraging certain behaviors by offering tax incentives.
The next generation of Americans promise hope for the country’s future. Yet, this is best fostered and encouraged by those closest to each young person-their family and local communities. Congress must ensure federal efforts to support children are effective and meaningful and constitutional.
Some members on both sides of the aisle have suggested expanding several of these tax provisions. This report, however, cautions against expanding programs that are extremely vulnerable to fraud and abuse. Congress should instead work to better target such provisions at those who need federal support, implement changes to prevent fraud, and eliminate unnecessary or ineffective programs. Congress must carefully evaluate whether or not the current provisions in the tax code are truly the best way to support families at the federal level.
A superior way to support American families is to allow them to keep more of their own money. This serves them better than continuing to fund ineffective and wasteful programs that siphon money from those who need it most. Further, the risk and burden placed upon the next generation by our nation’s debt and weakened economy are of far more consequence than a handful of tax preferences that are inequitably and even fraudulently distributed. A reformed, streamlined tax code is critical to solving both our financial and economic challenges. Tax provisions related to children and families can and should be examined as part of any legislation designed to simplify and improve the tax code.
Family and Child Tax Provisions (in millions) FY 2014 FY 2014 - FY 2018Child Tax Credit $57,300 $285,800
Earned Income Tax Credit $69,200 $352,800
Child Tax Credit (Average savings from fraud prevention)** $760 $7,600
Earned Income Tax Credit (Annual fraud/waste estimate)** $13,000 $65,000
Child and Dependent Care Expenditures $4,600 $23,500
Adoption Tax Credit $400 $2,000
Exclusion of Foster Care Payments $400 $2,000
Parental Personal Exemption for Students Aged 19 to 23 $4,700 $25,200
Total $136,200 $691,300
** The revenue loss or potential savings associated with these line items is not included in the total calculations

DRAFT
154 | Tax Decoder
Child Tax CreditHistory, General Background, & Cost
Congress created the Child Tax Credit (CTC) in 1997 “to help ease the financial burden that families incur when they have children.”1 It is a partially refundable, means-tested tax credit distributed to individuals based on the number of children in their family.
At its inception, 24 million filers received the Child Tax Credit, at a cost of $15 billion. An increase in the credit per child from $500 to $1,000, along with other program expansions, caused the cost of the tax expenditure to rise dramatically.2, 3
Fifteen years after its creation, the program served an estimated 38 million families.4 The credit will cost taxpayers $57.3 billion in 2014 and $285.5 billion over the next five years, making it the sixth largest expenditure in the tax code.5
While just over half of the cost of the credit is directed to families with no tax liability,6 over 40 percent of the Child Tax Credit is utilized by those on the higher end of the income spectrum. The credit is also plagued by fraud and abuse, resulting in billions of dollars in wasted taxpayer funds every year. Congress should enact tighter eligibility restrictions and fraud prevention measures in order to better target the credit at those with true need.
Challenges with the Child Tax Credit
The Additional Child Tax Credit (ACTC) is the refundable portion of the child tax credit and is directed to individuals with very little or no other tax liabilities.7 In total, $22.7 billion in ACTC credits were distributed in 2010.8 Much like the Earned Income Tax Credit, this refundable portion results in direct government cash payments to millions of individuals with no income tax liability.
Unlike the Earned Income Tax Credit, which requires the recipient to provide a valid Social Security Number (SSN), individuals are able to obtain the Additional Child Tax Credit
with only an Individual Taxpayer Identification Number (ITIN). This identification number is available even to those that are not authorized to work in the United States.9
In 2000, there were a total of 62,000 ITIN filers claiming a total of $62 million worth of additional child tax credits. By 2010, the number grew to 2.3 million ITIN filers claiming $4.2 billion in tax credits.10 More precisely, in only one year, more than $4 billion in federal tax subsidies went to individuals not legally authorized to work in the United States as a result of this program.
The use of the ITIN numbers has long been controversial due to their susceptibility to fraud. The Treasury Inspector General (IG) provides a summary of ITIN fraud:
Billions of dollars in ACTC are being provided to ITIN filers without verification of eligibility, and IRS employees have raised concerns about the lack of an adequate process for identifying and addressing improper claims.11
Over 60,000 ITINs were used on multiple tax returns processed in 2008.12 According to the IG, 70 percent of these ITIN numbers should never have been issued and were granted to individuals living outside the United States, even though the documentation provided by the applicants was questionable.13 Just like Social Security numbers, ITIN numbers are supposed to be “specific to individuals and should be issued to and used only by that individual.”14 In other words, there is no accountability for billions in taxpayer dollars because the ACTC only requires an ITIN.
In addition to the waste from ITIN fraud, the credit is not limited to those most in need. Roughly one-fourth of the tax credit is directed to the top 40 percent of taxpayers. Although recent changes to the program have expanded it more to benefit lower-income households, a large portion of it is still directed to middle-to-upper-income taxpayers.15 The largest share of the credit, 18.5 percent, is directed to families with cash incomes ranging between $50,000 and $75,000. However, 16.1 percent of the total benefits are directed to families with income ranging from $75,000 to $100,000, while another 12.7 percent goes to families earning from $100,000 to $200,000 annually—nearly four times the national median household income.16, 17
Options for Reform
As a first step, Congress should end the ACTC for individuals without a valid Social Security Number. This generous federal subsidy should, like the Earned Income Tax Credit, be provided only to those individuals with a legal SSN. This reform would
IN ONLY ONE YEAR, MORE THAN $4 BILLION IN FEDERAL TAX SUBSIDIES WENT TO INDIVIDUALS NOT LEGALLY AUTHORIZED TO WORK IN THE UNITED STATES AS A RESULT OF THIS PROGRAM.

154 | Tax Decoder Family & Child | 155
Earned Income Tax Credit Congress created the Earned Income Tax Credit (EITC) in 1975 as a small temporary program designed to reduce the tax burden
on working, low-income families. It aimed “to encourage them to seek employment rather than welfare.”20 Congress made the program a permanent welfare program three years later. Today it is the largest federal anti-poverty cash entitlement program.
Background and Overview
The EITC is provided to lower-wage, working individuals. Further, eligibility for the EITC is not determined by whether or not an individual has children. It is intended to encourage continued employment in order to which will help workers transition into the middle class.
At its inception, 6.2 million filers received the EITC at a cost of $1.25 billion. However, changes in the 1990s caused the program’s costs to skyrocket. Today, nearly 28 million tax filers receive the credit. One study found that “between 1990 and 1996 the program more than doubled in real terms” and “much of this increase in costs is driven by the increase in the number of recipients—in 1995, 19 million filers received the EITC, 160 percent more than 10 years earlier.”21
Similarly, the average annual financial benefit has grown. It has seen an enormous increase in the decades since its inception, growing from $201 in 1975 to $2,252 in 2011—a 168 percent increase in inflation-adjusted dollars. In 2011, families with two children received on average a tax credit of $3,469, and 87.7 percent of all EITC spending was provided as a direct cash refund to recipients.22
Exponential growth in the program, combined with the automatic and opaque nature of these cash payments through the tax code, has resulted in extensive fraud and annual payments to unqualified recipients of at least $13.3 billion – 22 percent of the program’s annual cost.23 Although the program does meet a true need for many, changes are necessary. Such changes can ensure the EITC continues to
function as a transition program, not a permanent subsidy. Updating the tax credit to meet this goal should be part of any tax code overhaul undertaken by Congress in the coming years.
Cost & Current Status
The Earned Income Tax Credit has become one of the largest federal welfare programs, with 27.9 million tax filers receiving $62.9 billion in tax credits during tax year 2011.24
Now the fifth largest tax expenditure, the Joint Committee on Taxation estimates the credit will cost $69.2 billion in 2014, and will cost $352.8 billion from FY 2014 through FY 2018.25
Of the nearly $70 billion in total costs, $60.6 billion is provided to filers in the form of direct spending from refundable credits. Since the tax credit is refundable, an EITC recipient does not need to owe taxes to receive the benefits. If the amount of the credit exceeds a tax liability, the individual receives a credit in the form of a direct payment from the government. As a result of credits like EITC, “30 percent of tax-filing units received more from the federal government in tax credits than the amount of their income tax liability.”26
The result is that when an individual receives the refundable portion of the EITC, money leaves the federal Treasury in the form of a cash payment, just as with a spending program. This portion of the EITC program resulted in spending through the tax code of more than $54 billion in 2010.27
save at least an estimated $7.6 billion over ten years.18 As a further measure, Congress could consider eliminating
the refundable portion of the program, while also more aggressively means testing the benefit in order to direct it to those at or below the poverty level.
Eliminating the credit and using the revenue raised to lower all income tax rates could mean taxpayers would see a 4.8 percent decrease in their tax rate, according to one study.19 This would allow all taxpayers to keep nearly five
percent more of their own money throughout the year, rather than first paying it to the IRS and receiving it back based on personal family decisions.
In the absence of such a complete overhaul or significant curtailing of the program, Congress should enact other changes to the program that would reduce fraud, better target the credit to those with the greatest financial need, and simultaneously reduce federal spending in the tax code.

DRAFT
156 | Tax Decoder
At Least $13 Billion in Waste and Fraud Every Year
The EITC program has become permeated by waste and abuse, resulting in a significant drain on taxpayer resources. This has made it the only revenue program routinely listed on the Government Accountability Office’s (GAO) list of government programs as a “high-risk” program for extensive fraud and abuse.
Billions of dollars are wasted every year because the IRS has little ability to monitor overpayments or prevent EITC pay-ments to ineligible recipients. The Treasury Inspector General for Tax Administration (TIGTA) recently revealed that for the last three fiscal years, the IRS has failed to comply with the law that requires the agency to publish a goal annually for reduc-ing EITC fraud when its improper payment rate is 10 percent or higher.28 In addition, every year for the last ten years, EITC improper payment rates have been more than twice the 10 percent threshold.
In the last decade, 21 to 29 percent of all EITC payments were erroneously awarded each year. These payments were either directed to ineligible recipients, or they were overpayments or underpayments of eligible individuals.29 The IRS estimates from FY 2003 to 2013 between $124.1 billion and $148.2 billion was improperly awarded through the Earned Income Tax Credit.30 In FY 2013 alone, TIGTA estimated between $13.3 and $15.6 billion in improper payments were made through the program.31
A GAO audit of improper payments found much of the waste is preventable, attributing EITC’s unacceptable error rate to a number of factors including “complexity of the tax law, structure of the program, confusion among eligible claimants, high turnover of eligible claimants, and unscrupulous return preparers.”32 By pointing out several primary causes of waste in the EITC, GAO’s audit of improper payments provides several targets for reforms.
Even Center on Budget and Policy Priorities’ (CBPP) founder Robert Greenstein, a staunch proponent of the credit, acknowledges the program has “a significant error rate that needs to be reduced.” He attributes this largely to the complexity of the program’s rules. While disputing IRS’ figure of a roughly 25 percent improper payment rate, CBPP nonetheless supports congressional and presidential actions to improve the tax credit. They suggest that since complexity is the root cause of errors in EITC, the solution is simplification.33
While much of the waste comes from improper payments, millions of dollars have also been wasted because of fraud. Much of this fraud, as noted by GAO, is the result of questionable tax return preparation business operations.
There are numerous examples of fraudulent tax preparation relating to the EITC. One instance in Wisconsin involved an individual who filed multiple fraudulent tax returns and claimed earned income tax credits over many years. It is estimated he received about $3.2 million in federal EITC refunds.34
In May 2014, the owner of a tax preparation business in
Per
cent
60%
50%
40%
30%
20%
10%
0%EITC Phase-in range EITC Plateau EITC Phase-down range EITC Total
Free School Lunch
Public or Subsidized HousingCash Public AssistanceLow Income Home Energy Assistance
Source: Estimates prepared by the Congressional Research Service (CRS) based on analysis of data from the U.S. Census Bureau’s 2010 Annual Social and Economic Supplement to the Current Population Survey (CPS/ASEC)
Head of Household Tax Filers, with One or More Children, Qualifying for the EITC,by Household Receipt of Selected Need-Tested Benefits in 2009

156 | Tax Decoder Family & Child | 157
New York admitted he was guilty of lying about his clients’ income in order to claim higher amounts of the Earned Income Tax Credit. The IRS paid out more than $390,000 in tax refunds because of this fraudulent activity.35
In another May 2014 case, one man’s shoddy tax preparation operation cost the government somewhere from $400,000 to $1 million in part by falsely reporting income for purposes of claiming the EITC.36
In another recent case, a Maine man underreported his family income from 2006 to 2010 by $650,000, claiming he was eligible to receive the Earned Income Tax Credit. Yet, with an income of millions of dollars over the five-year period, he in no way qualified for a tax credit aimed at reducing poverty.37
A recent news report38 detailed several other ways the EITC program is being defrauded, including the following:
• “Some car dealerships and furniture stores offer ‘free’ tax prep services, hoping to snag the [Earned Income Tax] credit as a payment toward cars or appliances;”
• “Some services, eager to claim rights to the credit, offer to help EITC-eligible workers prepare their returns even before they get their W-2s;” and
• “The National Consumer Law Center said in a report last year that its mystery shoppers encountered preparers who intentionally omitted incomes on returns, encouraged them to lie so they could claim the EITC and other tax breaks and made data entry errors that resulted in incorrect refunds.”
These, and many other examples, highlight the prevalence of fraud in the EITC program. Such behaviors waste huge amounts of taxpayer funds. Rather than going to those who really need it, the EITC often simply subsidizes the unscrupulous.
In part, EITC was designed to help the economically disadvantaged by effectively re-paying their payroll taxes and thus providing an incentive to keep working. As the program grew, however, its nature began to shift from being an anti-poverty program to an entitlement welfare program. Studies have found the program is not completely transitional, but is being used for long-term support. Up to 20 percent of EITC claimants receive the credit for over five years.39
Duplication and Double Dipping
Individuals receiving a cash payment through the EITC often also secure other federal assistance as well. In addition to the refundable portion of the EITC, hundreds of billions of dollars in federal assistance are directed toward these same low-income individuals through programs such as Medicaid, Supplemental Nutrition Assistance Program, Supplemental Security Income, Pell Grants, Temporary Assistance for Needy Families, the additional (refundable) Child Tax Credit, and Section 8 Housing Choice Vouchers. According to the Congressional Research Service (CRS), “The federal government spent almost $708 billion in FY 2009 on programs for the low-income, and nearly $578 billion the previous year.”40 Many individuals can qualify for most or all of these programs at the same time.
The CRS chart on page 156 shows the percentage of filers eligible for EITC who also reported receiving federal assistance from other welfare programs such as SNAP and WIC benefits. It suggests that a significant proportion of EITC recipients are likely receiving other welfare benefits.41
Recommendations & Options for Reform
This report recommends phasing in a five-year maximum to the time period in which recipients may receive benefits. It further directs the IRS to continue implementing reforms proposed by the TIGTA to reduce improper payments in this program. Limiting the time an individual can claim the EITC will help ensure the program acts primarily “as a safety net for workers experiencing temporary income and employment shocks,”42 not a permanent entitlement program. Limiting this tax benefit to no more than five years may also reduce the amount of improper payments made by the government and prevent some fraud and abuse.
The IRS should also develop a mechanism to reduce the fraud perpetrated by dishonest tax preparers and others who under-report income for purposes of illegally obtaining the Earned Income Tax Credit.

DRAFT
158 | Tax Decoder
Dependent Care Tax Credit and Exclusion44
Taxpayers can receive a benefit for their childcare expenses either through a credit or income exclusion.
Under the Dependent Care Tax Credit, a taxpayer receives a credit for a portion of expenses for the care of a dependent, such as for the costs of traditional daycare. Qualified dependents include children under the age of 13 and spouses or dependents who live with the taxpayer most of the year and are incapable of caring for themselves.
The portion of the expenses that qualifies for the credit depends on the taxpayer’s income. Those with incomes of $15,000 or less receive a credit of 35 percent, up to a maximum of $3,000 for one child, or $6,000 for two or more children. The credit rate decreases by one percentage point for every $2,000 of adjusted gross income above $15,000, but it does not go below 20 percent for taxpayers with incomes over $43,000.
Yet, because the tax benefit has no income limit, even mil-
lionaires have taken advantage of it. In 2012, over 15,000 million-aires received more than $10 million in Child Care Tax Credits.45
The alternative to the credit is the Dependent Care Assis-tance Program (DCAP). Under this program, if an employer pays part of the taxpayer’s child care expenses, the taxpayer can elect to exclude a portion of their wages from income taxes, as well as from Social Security and Medicare taxes. The maximum benefit is $5,000, or if married, the amount of either spouse’s earned income. A qualifying employer must make DCAP assistance available to a broad segment of its employees. Qualified expenses include payments to relatives of the taxpayer who are not dependents and are at least 19 years of age.
For every dollar in benefits from DCAP, the amount a taxpayer can claim under the DCTC is reduced by one dollar. If a taxpayer claims the full DCAP benefit, the maximum expenses they can claim under the DCTC is $1,000.
Twenty-six states also offer a dependent care tax credit, modeled after the federal version.46
There are at least 45 programs that permit spending on child care, costing taxpayers at least $17 billion annually.
Child and Dependent Care Over the last 60 years, Congress created a number of programs and tax expenditures to fund early learning and childcare, which
together cost a combined $17.3 billion annually.43 Two tax programs are specifically targeted toward decreasing the cost of daycare for children and dependents: the employer-provided Child Care Exclusion and Credit and the Dependent Care Tax Credit (DCTC).
Local and state-based child care and pre-school programs can have a positive impact on the development of children, while daycare is also important to millions of parents who would not otherwise be able to work. Funding for these programs, however, is appropriately handled at the state, local and private levels and is not a responsibility of the federal government.

158 | Tax Decoder Family & Child | 159
History of DCTC and DCAP
Employees are allowed to deduct the cost of many busi-ness expenses that are not reimbursed by their employers. In line with this practice, Congress sought to recognize child care as an expense incurred in order to generate income.47 The special deduction was first created in 1954 with a max-imum cap of $600 per year. Even though families making over $5,100 did not qualify, single parents had no income cap and were thus always eligible for the provision.
By creating the benefit as a deduction, Congress had limited the pool of eligible taxpayers to those who itemize their deductions. Several decades later, Congress wanted to broaden the expenditure to all taxpayers, so it converted the deduction into a credit (which does not depend on whether a filer itemizes), benefitting filers with lower incomes. Between 1954 and 1981, Congress increased the size and broadened the income eligibility of the benefit several times. In 1981, Congress created the tax exclusion under DCAP (the employer program), and implemented a sliding benefit scale to better target assistance to those with low incomes.
The size of the benefit was again increased in 2001. Though initially temporary, Congress extended the tax break several times until installing the current permanent provision in the American Taxpayer Relief Act of 2012.
Cost and Usage
For FY 2014, DCTC and DCAP are estimated to result in a combined $4.6 billion in lost federal revenue.48 From FY 2014 through FY 2018, these expenditures are estimated to cost $23.5 billion.49
Usage of the DCTC is mixed. A major portion of the benefit—about 30 percent—goes to those with incomes over $100,000.50 Filers in the highest two quintiles of income (above approximately $62,000) claim almost 60 percent of the tax benefits51 while those with incomes below $50,000 claim only 34 percent of the benefits.52 The lowest-income Americans (in the bottom quintile) claim only 0.9 percent of the benefit.53
Yet, because the tax benefit has no income limit, even millionaires have taken advantage of it. In 2012, over 15,000 millionaires received more than $10 million in Child Care Tax Credits.54
Duplication
Federal support for child care is not only provided through these two tax expenditures, but can be provided through dozens of spending programs. GAO identified 45 programs that permit spending on child care. Three of these federal programs explicitly seek to provide child care services as their primary goal. All three are intended primarily for low-income households.55 Together, these three programs account for $5 billion in spending annually.56
In addition, 33 other federal programs allow for spending on child care and early learning services.57 Several block grants provide billions to states every year that may be used to provide child care services, including the Community Services Block Grant and the Temporary Assistance for Needy Families (TANF) program. States typically utilize the flexibility in the TANF grant to transfer a significant portion of the grant money to other federal child care services, a reallocation of $2.6 billion in FY 2012 on top of what the federal government had already allocated to other programs.58
Streamlining the number of programs offering child care services would enable the federal government to offer a better service while using resources more wisely.
Recommendations
Americans overwhelmingly desire to have a safety net to assist those in true need. The dependent care tax benefits should be reformed to ensure they are going to those most in need of them.
Although Congress designed DCTC to direct resources to those with lower incomes, millionaires are claiming the credit. Thus the program may not be meeting that goal. Additionally, most of the federal programs providing funding for child care do not have clear eligibility standards. Instead, resources are stretched among many who do not need government support, which steals assistance from those who do.
If retained, these programs should be subject to means testing, and Congress should completely phase out any assistance for those with incomes of more than $100,000 to better target the resources to those in need. However, in keeping with other recommendations throughout this report, the most ideal proposal would be for these benefits to be eliminated entirely and for the overall income tax rate of each individual and family to be lowered. Congress should allow these families to keep their money, instead of asking them to send it to Washington and then rerouting it back to them based on certain expenditures, such as for daycare.

DRAFT
160 | Tax Decoder
The federal government offers a special tax benefit for adoption. This is in addition to the Child Tax Credit – a $1,000 per child tax credit available to all individuals with eligible dependents. Current law provides a credit for any adoption-related expense up to $13,190 in 2014. This cap is adjusted annually for inflation. Families with incomes of $194,580 or less qualify for a dollar-for-dollar credit. This credit rate decreases for incomes between $197,880 to $234,880, after which families can no longer utilize the credit.59
Private agency, public, and international adoptions all qualify for the adoption tax credit. Those who participate in domestic adoptions are able to utilize the credit for expenses even if the adoption does not get finalized. International adoptions, however, must be completed before the taxpayer can claim the credit.
Employers can also assist with adoption expenses under a separate tax expenditure that essentially follows the same limits as the credit. Employer assistance, such as direct cash benefits or expense reimbursement, can be excluded from federal income taxes. Employment taxes (Social Security and Medicare) still apply, and expenses paid for under the exclusion cannot be utilized for the tax credit. Similarly, any expenses that are paid with federal, state, or local grants cannot be applied toward the credit or exclusion.60
Those who adopt a special needs child are able to automatically claim the full amount of the credit regardless of actual expenses incurred. Special needs children are defined as not being able to return to their birth parents and having a specific factor that may be a hindrance to adoption. Most foster children are considered special needs for the purposes of the credit.61
Currently 1.8 million children living in the United States have been adopted.62 About 38 percent of them were adopted through private agencies, 37 percent were previously in foster care, and 25 percent were from abroad.63 Of the approximately 400,000 children in foster care in 2011, about 51,000 were adopted, a figure that has essentially remained unchanged since 1999.64
History of the Adoption Tax Credit65
Congress created the first adoption tax incentive in 1981 in order to encourage people to adopt children with special needs. The provision allowed an itemized deduction for any adoption-related expenses. However, a rewrite of the tax code in 1986 eliminated this policy.
In 1996, a renewed focus on reducing the cost of
adoption led to the enactment of the tax credit and employer assistance exclusion on a temporary, five-year basis. Only a credit for the adoption of children with special needs was to remain permanently. Instead of allowing the
expenditure to expire in 2001, however, Congress renewed it for another nine years and increased the allowable expense limit and income qualification.
Facing expiration, the credit was again extended in 2010 for two years. In addition, Congress made it refundable, meaning that any amount in excess of the taxpayer’s tax liability would be provided to them as a direct cash payment. In 2012, Congress made the tax credit permanent but without refundability.
Cost and Usage
The adoption tax credit and exclusion is estimated to cost $400 million FY 2014, and $2.2 billion from FY 2014 through FY 2018.66
In FY 2009, over 80,000 returns claimed the adoption tax credit (including exclusions for employer-provided assistance).67 Because of the rules surrounding when a return can be claimed, not all returns may be associated with an adoption completed in that tax year. More than 36 percent of the total credits went to families with incomes over $100,000, with average credits of about $5,800.68 Families with incomes
Exclusion of Foster Care Payments86
Foster care providers receive a payment for their services either from a charitable placement organization or governmental agency. These payments are exempt from federal income taxes, a provision that was first instituted in 1977 through an IRS ruling. It was codified in law in 1982. The tax exclusion for such payments is capped at 10 children under the age of 19, or 5 adults 19 years of age or older. The exemption of foster care payments from federal income taxes will result in $400 million in lost federal revenue in FY 2014.87 From FY 2014 through FY 2018, this provision will result in a net revenue loss of $2 billion.88 Little data exists on if this exclusion impacts the decision-making of foster families, which offer a home to these special children out of compassion and not for a financial benefit.
Adoption Tax Credit and Exclusion Each year, adoption transforms and enriches the lives of thousands of children and the loving families they join. Americans
have long recognized this special blessing and the valuable social impact of adoption. Taking on this responsibility can be an indispensable source of stability and well-being for all involved.

160 | Tax Decoder Family & Child | 161
between $50,000 and $70,000 captured 27 percent of the credits with an average claim of $2,921, while those making less than $50,000 claimed 11 percent.69 In 2011 (the most recent data available), $610 million in the tax credits were claimed, and $201 million was paid out in the refundability portion.70
Usage of the adoption tax credit has varied over the last decade. In 2005, almost 85,000 returns claimed the credit.71
The number rose to over 93,000 in 2006, followed by over 94,000 in 2007.72 After nearly 89,000 taxpayers utilized the credit in 2008, the number dropped by about 10 percent the following year.73 In 1997, three percent of returns claimed the credit, while six percent claimed it in 2009.74
Analysis
Incentivizing adoption is a noble goal, but using the tax code to that end has not proved to be a successful means of stimulating increased adoptions. Scant data exists on whether the tax credit and exclusion positively impact the motivation of those considering adoption to follow through with the decision. Child Trends’ study points out, “interest in adoption has increased substantially due to a variety of demographic and societal changes. When there is often already an 18-month waiting list to adopt foreign-born children, it is doubtful that the adoption tax credit is promoting adoption of these children.”75 The implication of this is that individuals and families may desire to adopt regardless of the existence of a credit.
Estimates on the overall cost of raising a child also add to doubt that the tax credit actually incentivizes people to adopt. A detailed analysis of adoptions in 2004 found 71 percent of all children adopted that year were younger than five years old.76 However, the cost of raising a child from age 5 to 18 can be well over $150,000, as measured in 2004 by the U.S. Department of Agriculture.77 In light of the overall cost of raising a child it appears doubtful the average adoption tax benefit of a few thousand dollars will persuade a family to adopt.78
Unfortunately, this is contrary to the intent of Congress. Congressional records indicate Congress’ belief that “increasing the size of the adoption credit and exclusion and expanding the number of taxpayers who qualify for the tax benefits [would] encourage more adoptions and allow more families to afford adoption.”79
Additionally, Congress wanted to focus on special needs children. Accompanying the 1996 bill establishing the tax credit and exclusion, the House Report read, “the Committee wishes to encourage further the adoption of special needs children. Therefore the tax credit is allowed in addition to any grant money received for the adoption expenses associated with the adoption of special needs children.”80
Duplication
As with other tax incentives, the Adoption Tax Credit duplicates the work of many other federal programs.
The Health and Human Service’s Adoptions Incentives Program awards bonuses to states that increase their number of adoptions. Bonuses awarded for each adoption can be used for a variety of child welfare goals, but many states use the funds to help pay the costs of adoption procedures.81
The Adoption Assistance program through Title IV-E also provides about $4 billion in annual federal funding.82 States use most of the money (80 percent) to make payments to adopted parents of certain children who were previously in foster care.83 In recent years, nearly all parents (over 90 percent) have received adoption assistance for children previously in foster care.84
Other federal funding streams that can be allocated to adoption assistance include the Community Services Block Grant, Social Services Block Grant, and the Temporary Assistance for Needy Families (TANF) program, together offering over $19 billion every year that could be used in part for adoption support.85
Recommendations and Options for Reform
Some supporters of the credit have called for it to be made refundable, as it was temporarily in 2010 and 2011. While this policy could incentivize some families to adopt, this kind of assistance can already be provided through state and local programs funded by federal block grants, as discussed above.
This report, however, contends that this credit and exclusion should be eliminated, as part of comprehensive tax reform that lowers overall income tax rates on all Americans. Little evidence suggests the credit serves to motivate parents to adopt who had not already planned or desired to do so. Since a number of federal programs already exist to provide adoption assistance to families that require it, the tax credit is duplicative of other initiatives.

DRAFT
162 | Tax Decoder
Exemptions for dependents are more complicated. The most common dependents are the minor children of the taxpayer, but exemptions may also be claimed for the following individuals:
• Minor family members. A taxpayer may claim their “son, daughter, stepchild, foster child, brother, sister, half-brother, half-sister, stepbrother, stepsister, or a descendant of any of them” if the dependent is below the age of 19, lived with the taxpayer for more than half of the year, and did not provide more than half of their own support.
• Adult students. A taxpayer may claim family members over the age of 18 as dependents if they are full-time students for 5 months of the year, younger than the taxpayer, and younger than 24. The same requirements related to family relationship, residency, and support apply as above.
• Disabled adults. A taxpayer may claim family members, regardless of age, if they are permanently and totally disabled. The same requirements related to family relationship, residency, and support apply as above.
• Supported individuals. A taxpayer may claim a person as a dependent, regardless of age, if he supplies more than half of the individual’s total support for the year, the person’s gross income is less than $3,900, and the person either lives in the taxpayer’s household year-round or is a family member.
A social security number is required for all dependents, and each dependent must meet citizenship or residency requirements. A taxpayer may not claim dependents if he can be claimed as a dependent himself, and individuals who file a joint return may not be claimed as dependents.91
Cost and Usage
The Joint Committee on Taxation (JCT) does not generally consider personal exemptions to be tax expenditures. It does provide a revenue cost for one type of dependent however: students over the age of 18. JCT considers this special exception to the normal age requirement to be a tax provision to support education.
According to the Joint Committee on Taxation, this exception will cost $4.7 billion in 2014 and $25.2 billion from 2014-2018.92
Although a total revenue cost for all exemptions is not available, according to IRS data, exemptions reduced taxable income by more than $1 trillion on 145 million tax returns with more than $9.1 trillion in AGI.93
Analysis
The exemption for adult students represents a significant subsidy for education that should be considered in context with the many other tax and spending programs that support education. This exemption is different from the generic exemption for supported individuals; although the student may not provide more than half of their own support, there is no specific limit on the student’s AGI. Since the student’s college costs may be included in the calculation of support, a student with significant personal earnings could be claimed as a dependent. When examining education tax policy, Congress should not overlook the nearly $5 billion annual expenditure that occurs through exemptions for dependents.
Exemptions for Dependents Taxpayers may claim a “personal exemption” for themselves and their spouses, and additional exemptions for dependents,
provided each individual meets certain qualifications.89 For tax year 2014, each exemption reduces taxable income by $3,950.90
The rules for personal exemptions are simple to understand. Any tax filer may claim a personal exemption for themselves, as long as they cannot be claimed as a dependent by another taxpayer. A second personal exemption may be claimed for a spouse on a joint return, or on an individual return in certain cases.

162 | Tax Decoder Family & Child | 163
1 Margot L. Crandall-Hollick, “The Child Tax Credit: Current Law and Legislative History,” Congressional Research Service, March 25, 2013 (R41873); http://goo.gl/5Yz9um. (p. 1). Accessed June 17, 2014.
2 “Individual Income Tax Returns with Tax Computation: Table 3.3,” Internal Revenue Service, June 9, 2014; http://goo.gl/XONzRb. Accessed June 17, 2014. 3 Margot L. Crandall-Hollick, “The Child Tax Credit: Current Law and Legislative History,” Congressional Research Service, March 25, 2013 (R41873), http://goo.gl/
qRFY5y. Accessed June 17, 2014. 4 Adam Carasso and Elaine Maag, “Taxation and the Family: What is the child tax credit?,” Tax Policy Center, January 12, 2013; http://goo.gl/kzKqUi. Accessed June 17, 2014. 5 “Estimates of Federal Tax Expenditures for Fiscal Years 2014-2018,” Joint Committee on Taxation, August 5, 2014; http://goo.gl/4COaYo. (p. 30, 34) 6 “The Tax Break-Down: Child Tax Credit,” The Committee for a Responsible Federal Budget, August 29, 2013;. http://goo.gl/s9OsjH Accessed June 17, 2014 7 IRS Tax Tip 2011-29, “Ten Facts about the Child Tax Credit,” Internal Revenue Service, November 4, 2013; http://goo.gl/RClaUp. Accessed June 17, 2014. 8 Russell George (Treasury Inspector General for Tax Administration), “Improper Payments in the Administration of Refundable Tax Credits,” Testimony before the U.S.
House Committee on Ways and Means – Subcommittee on Oversight, May 25, 2011; http://goo.gl/mjnfgo. (p. 2). Accessed June 17, 2014. 9 Russell George (Treasury Inspector General for Tax Administration), “Improper Payments in the Administration of Refundable Tax Credits,” Testimony before the U.S.
House Committee on Ways and Means – Subcommittee on Oversight, May 25, 2011; http://goo.gl/fjeS7N. (p. 4). Accessed June 17, 2014. 10 Russell George (Treasury Inspector General for Tax Administration), “Improper Payments in the Administration of Refundable Tax Credits,” Testimony before the U.S.
House Committee on Ways and Means – Subcommittee on Oversight, May 25, 2011; http://goo.gl/fjeS7N. (p. 5). Accessed June 17, 2014. 11 Russell George (Treasury Inspector General for Tax Administration), “Improper Payments in the Administration of Refundable Tax Credits,” Testimony before the U.S.
House Committee on Ways and Means – Subcommittee on Oversight, May 25, 2011; http://goo.gl/fjeS7N. (p. 6). Accessed June 17, 2014. 12 Inspector General for Tax Administration, “Individual Taxpayer Identification Numbers Are Being Issued Without Sufficient Supporting Documentation” (Report No:
2010-40-005), U.S. Department of the Treasury, December 8, 2009; http://goo.gl/heuly8. (p. 3). Accessed June 17, 2014. 13 Inspector General for Tax Administration, “Individual Taxpayer Identification Numbers Are Being Issued Without Sufficient Supporting Documentation” (Report No:
2010-40-005), U.S. Department of the Treasury, December 8, 2009; http://goo.gl/CwK4Cs. (p. 29). Accessed June 17, 2014. 14 Inspector General for Tax Administration, “Individual Taxpayer Identification Numbers Are Being Issued Without Sufficient Supporting Documentation” (Report No:
2010-40-005), U.S. Department of the Treasury, December 8, 2009; http://goo.gl/CwK4Cs. (p. 3). Accessed June 17, 2014. 15 “The Tax Break-Down: Child Tax Credit,” The Committee for a Responsible Federal Budget, August 29, 2013; http://goo.gl/OtJcUU. Accessed June 17, 2014. 16 Carmen DeNavas-Walt, Bernadette D. Proctor and Jessica C. Smith, “Income, Poverty, and Health Insurance Coverage in the United States: 2012,” U.S. Census Bureau,
September 2013; http://goo.gl/NWTydj. Accessed June 17, 2014. 17 Margot L. Crandall-Hollick, “The Child Tax Credit: Economic Analysis and Policy Options,” Congressional Research Service, May 14, 2013; http://goo.gl/4nKAER.
Accessed June 17, 2014. 18 “The Child Tax Credit and ITIN Filers,” Congressional Research Service memorandum, June 11, 2012. 19 Stephen J. Entin and Michael Schuyler, “Case Study #9: The Child Tax Credit,” Tax Foundation, August 8, 2013; http://goo.gl/TCDzjh. Accessed June 17, 2014. 20 Honorable J. Russell George, “Improper Payments in the Administration of Refundable Tax Credits,” Committee on Ways and Means Subcommittee on Oversight U.S.
House of Representatives, May 25, 2011; http://goo.gl/uScqeZ. 21 Eissa, Nada & Hoynes, Hilary, “Redistribution and Tax Expenditures: The Earned Income Tax Credit,” National Tax Journal, June 2011. 22 Scott, Christine, “The Earned Income Tax Credit (EITC): An Overview,” Congressional Research Service, April 3, 2014; http://goo.gl/2mM8oC. 23 Treasury Inspector General “The Internal Revenue Service Fiscal Year 2013 Improper Payment Reporting Continues to Not Comply With the Improper Payments
Elimination and Recovery Act,” Dept. Treasury, March 31, 2014; http://goo.gl/64zPZ5. 24 Scott, Christine, “The Earned Income Tax Credit (EITC): An Overview,” Congressional Research Service April 3, 2014; http://goo.gl/HOqi4g. 25 “Estimates of Federal Tax Expenditures for Fiscal Years 2014-2018,” Joint Committee on Taxation, August 5, 2014, p. 32, “Earned income credit,” http://goo.gl/GXL3Q1. 26 Winfree, Paul, “Obamacare Tax Subsidies: Bigger Deficit, Few Taxpayers, Damaged Economy,” The Heritage Foundation, May 24, 2011; http://goo.gl/KxuizX. 27 Scott, Christine, “The Earned Income Tax Credit (EITC): An Overview,” Congressional Research Service April 3, 2014; http://goo.gl/zHy9Ut. 28 Treasury Inspector General “The Internal Revenue Service Fiscal Year 2013 Improper Payment Reporting Continues to Not Comply With the Improper Payments
Elimination and Recovery Act,” Dept. Treasury, March 31, 2014; http://goo.gl/G3Dhu1. 29 Treasury Inspector General “The Internal Revenue Service Fiscal Year 2013 Improper Payment Reporting Continues to Not Comply With the Improper Payments
Elimination and Recovery Act,” Dept. Treasury, March 31, 2014; http://goo.gl/G3Dhu1. 30 Treasury Inspector General “The Internal Revenue Service Fiscal Year 2013 Improper Payment Reporting Continues to Not Comply With the Improper Payments
Elimination and Recovery Act,” Dept. Treasury, March 31, 2014; http://goo.gl/G3Dhu1. 31 Treasury Inspector General “The Internal Revenue Service Fiscal Year 2013 Improper Payment Reporting Continues to Not Comply With the Improper Payments
Elimination and Recovery Act,” Dept. Treasury, March 31, 2014; http://goo.gl/G3Dhu1. 32 Statement of Beryl H. Davis, “Improper Payments: Remaining Challenges and Strategies for Governmentwide Reduction Efforts,” Government Accountability Office,
March 28, 2012; http://goo.gl/ZyrcTN. 33 Robert Greenstein and John Wancheck “Earned Income Tax Credit Overpayment and Error Issues,” Center on Budget and Policy Priorities, April 19, 2011; http://goo.
gl/AUT5FQ. 34Werner, Mary Jo, “Tax Credits often benefit wrong people,” Lacrosse Tribune, June 6, 2011; http://goo.gl/6Im28P. 35 “Rochester man pleads guilty to fraud charges,”US Dept. of Justice, May 20, 2014; http://goo.gl/czLHqn. 36 Ed Bierschenk, “Lake Station tax preparer admits fraud, identity theft,” NWI Times, May 20, 2014; http://goo.gl/bwMtwi. 37 Betty Adams, “Chelsea contractor Marshall Swan to be sentenced Monday on tax offenses,” The Morning Sentinel, June 4, 2014; http://goo.gl/7bxqLI. 38 Sheryl Harris, “It’s time for Ohio to protect citizens from tax preparer fraud: Plain Dealing,” Cleveland, May 16, 2014; http://goo.gl/3ibj6F. 39 Dowd, Tim & Horowitiz, John, “Income Mobility and the Earned Income Tax Credit: Short-term Safety Net or Long-term Income Support,” April 11, 2011; http://goo.
gl/CId9I1. (p. 2) 40 Spar, Karen, “Federal Benefits and Services for People with Low Income: Programs, Policy, and Spending, FY2008-FY2009,” Congressional Research Service, January
31, 2011; http://goo.gl/tFoTtb. 41 Reforming Tax Expenditures & Ending Special Interest Giveaways,” June 30, 2011; http://goo.gl/Pc5tHa. 42 Dowd, Timothy, “Distinguishing Between Short-Term and Long-term Recipients of the Earned Income Tax Credit,” National Tax Journal, December 2005; http://goo.
gl/9gFw20. 43 “Early Learning and Child Care Federal Funds Support Multiple Programs with Similar Goals,” GAO, February 5, 2014; http://goo.gl/XzC0OY 44 Senate Committee on the Budget, “Tax Expenditures: Compendium of Background Material on Individual Provisions,” Congressional Research Service, December
2012; http://goo.gl/onaeSc. 45 “Internal Revenue Service, All Returns: 2011: Tax Liability, Tax Credits, and Tax Payments, Table 3.3, http://goo.gl/ZVCo4Q 46 Stacey Dickert-Conlin, Katie Fitzpatrick, and Andrew Hanson. “Utilization of Income Tax Credits by Low-Income Individuals,” National Tax Journal, http://goo.gl/
o7CJyV. (p. 756) 47 Senate Committee on the Budget, “Tax Expenditures: Compendium of Background Material on Individual Provisions,” Congressional Research Service, December
2012; http://goo.gl/7U5JZH 48 Estimates of Federal Tax Expenditures for Fiscal Years 2014-2018,” Joint Committee on Taxation, August 5, 2014, http://goo.gl/mv6TSe (p. 30) 49 Estimates of Federal Tax Expenditures for Fiscal Years 2014-2018,” Joint Committee on Taxation, August 5, 2014, http://goo.gl/mv6TSe (p. 30) 50 Internal Revenue Service, Table 3.3 All Returns: Tax Liability, Tax Credits, and Tax Payments, by Size of Adjusted Gross Income, Tax Year 2010. 51 “Taxation and the Family: How does the tax system subsidize child care expenses?” Tax Policy Center, July 22, 2011; http://goo.gl/yCM2AH, August 6, 2013. 52 Noah Meyerson, “Dependent Care: Current Tax Benefits and Legislative Issues,” Congressional Research Service, RS21466, July 1, 2014. 53 “Taxation and the Family: How does the tax system subsidize child care expenses?” Tax Policy Center, July 22, 2011; http://goo.gl/qlir5d, August 6, 2013. 54 “Internal Revenue Service, All Returns: 2011: Tax Liability, Tax Credits, and Tax Payments, Table 3.3, http://goo.gl/ZVCo4Q 55 The three programs are the Child Care Access Means Parents in School, Child Care and Development Block Grant, and the Child Care Mandatory and Matching Funds
of the Child Care and Development Fund. See “Early Learning and Child Care Federal Funds Support Multiple Programs with Similar Goals,” GAO, February 5, 2014; http://goo.gl/O0NbCo

DRAFT
164 | Tax Decoder
56 “Early Learning and Child Care Federal Funds Support Multiple Programs with Similar Goals,” GAO, February 5, 2014; http://goo.gl/O0NbCo (highlights page) 57 “Early Learning and Child Care Federal Funds Support Multiple Programs with Similar Goals,” GAO, February 5, 2014; http://goo.gl/O0NbCo (highlights page) 58 “Early Learning and Child Care Federal Funds Support Multiple Programs with Similar Goals,” GAO, February 5, 2014; http://goo.gl/O0NbCo 59 Meyerson, Noah P, “Tax Benefits for Families: Adoption,” Congressional Research Service, RL33633, July 23, 2014. 60 Senate Committee on the Budget, “Tax Expenditures: Compendium of Background Material on Individual Provisions,” Congressional Research Service, December
2012; http://goo.gl/IZUqmP 61 Rob Green, “The Adoption Tax Credit: Is it an effective Approach to Promote Foster Care Adoption?” Child Trends, August 2007; http://goo.gl/nSIzi0. (p. 1) 62 “Adopted Children Indicators on Children and Youth,” Child Trends, August 2012; http://goo.gl/FqMEJs 63 “Adopted Children Indicators on Children and Youth,” Child Trends, August 2012; http://goo.gl/FqMEJs 64 “Trends in Foster Care and Adoption- FY 2002-FY 2011,” U.S. Department of Health and Human Services, August 7, 2013; http://goo.gl/Fd5rfT. 65 Senate Committee on the Budget, “Tax Expenditures: Compendium of Background Material on Individual Provisions,” Congressional Research Service, December
2012; http://goo.gl/m9rRRs 66 “Estimates of Federal Tax Expenditures for Fiscal Years 2014-2018,” Joint Committee on Taxation, August 5, 2014, http://goo.gl/YhYJTW 67 Christine Scott, “Tax Benefits for Families: Adoption,” Congressional Research Service, February 1, 2013, RL33633. 68 Christine Scott, “Tax Benefits for Families: Adoption,” Congressional Research Service, February 1, 2013, RL33633. 69 Christine Scott, “Tax Benefits for Families: Adoption,” Congressional Research Service, February 1, 2013, RL33633. 70 Meyerson, Noah P, “Tax Benefits for Families: Adoption,” Congressional Research Service, RL33633, July 23, 2014. 71 IRS, “Statistics of Income – Individual Income Tax Returns, 2005,” IRS, 72 IRS, Statistics of Income – Individual Income Tax Returns, Table 3.3 for Tax Years 2006 and 2007. 73 IRS, Statistics of Income – Individual Income Tax Returns, Table 3.3 for Tax Years 2008 and 2009. 74 IRS, Statistics of Income – Individual Income Tax Returns, Table 3.3 for Tax Years 1997 and 2009. 75 Rob Green, “The Adoption Tax Credit: Is it an effective Approach to Promote Foster Care Adoption?” Child Trends, August 2007; http://goo.gl/gK2Zv5. 76 Rob Green, “The Adoption Tax Credit: Is it an effective Approach to Promote Foster Care Adoption?” Child Trends, August 2007; http://goo.gl/lZ6HxQ. 77 “Expenditures on Children by Families, 2004,” U.S. Department of Agriculture, http://goo.gl/spPZpU. 78 Christine Scott, “Tax Benefits for Families: Adoption,” Congressional Research Service, February 1, 2013, RL33633. 79 “General Explanation of Tax Legislation in the 107th Congress,” Joint Committee on Taxation, January 24, 2003; https://www.jct.gov/publications.
html?func=startdown&id=1211 80 “Adoption Report and Stability of 1996,” Committee on Ways and Means, May 3, 1996; http://goo.gl/M76BTp 81 Emilie Stoltzfus, “Child Welfare: Structure and Funding of the Adoption Incentives Program along with Reauthorization Issues,” Congressional Research Service, April
18, 2013; http://goo.gl/kFzw5X. 82 Emilie Stoltzfus, “Child Welfare: Structure and Funding of the Adoption Incentives Program along with Reauthorization Issues,” Congressional Research Service,
April 18, 2013; http://goo.gl/kFzw5X. 83 Emilie Stoltzfus, “Child Welfare: Structure and Funding of the Adoption Incentives Program along with Reauthorization Issues,” Congressional Research Service,
April 18, 2013; http://goo.gl/kFzw5X. 84 U.S. Department of Health and Human Services, “The AFCARS Report: Preliminary FY2012 Estimates as of November 2013,” http://goo.gl/s1vjZV, page 6. 85 “Fiscal Year 2014 Budget in Brief: Strengthening Health and Opportunity for All Americans,” U.S. Department of Health and Human Services. http://goo.gl/pjctvy 86 Much of this information is derived from the following document: “Tax Expenditures Compendium of Background Material on Individual Provisions,” Committee on
the Budget United States Senate, prepared by the Congressional Research Service, December 2012. 87 “Estimates of Federal Tax Expenditures for Fiscal Years 2014-2018,” Joint Committee on Taxation, August 5, 2014, http://goo.gl/eHUpJG 88 “Estimates of Federal Tax Expenditures for Fiscal Years 2014-2018,” Joint Committee on Taxation, August 5, 2014, http://goo.gl/eHUpJG 89 “3. Personal Exemptions and Dependents,” Internal Revenue Service, http://goo.gl/jPhlf0, accessed Sept 3, 2014. 90 Kelly Phillips, “IRS Announces 2014 Tax Brackets, Standard Deduction Amounts And More,” Forbes, October 31, 2013, http://goo.gl/5piymR 91 “3. Personal Exemptions and Dependents,” Internal Revenue Service, http://goo.gl/OykAGL, accessed Sept 3, 2014. 92 “Estimates of Federal Tax Expenditures for Fiscal Years 2014-2018,” Joint Committee on Taxation, August 5, 2014, http://goo.gl/6npxcx p. 3, 29. 93 “Table 1.2 All Returns: Adjusted Gross Income, Exemptions, Deductions, and Tax Items, by Size of Adjusted Gross Income and by Marital Status, Tax Year 2012,”
Internal Revenue Service, http://goo.gl/IlvsI1

164 | Tax Decoder Health Care | 165
HEALTH CARE

DRAFT
166 | Tax Decoder
Health Care
The federal government promotes health care in numerous ways, such as by conducting medical research through the National Institutes of Health and Centers for Disease Control and Prevention, regulating pharmaceuticals through the Food and Drug Administration, supporting the health care workforce, reducing the impact of substance
abuse and mental illness, and providing health insurance and health care for numerous populations through Medicaid, Medicare, the Children’s Health Insurance Program (CHIP), the Veterans Affairs Administration, the military, the Indian Health Service, and the Affordable Care Act.
tax code. Together, health-related tax provisions will result in over $290 billion in foregone federal revenue this year.2
As health care costs continue to rise, lawmakers and economists are increasingly taking note of the subsidies within the tax code. Every American should have access to high-quality care and insurance. But as spending continues to climb, Congress must consider whether the health care tax provisions are increasing access, or just increasing costs with little net benefit for the nation.
Federal spending on these major health programs totaled about $1.2 trillion (or about 7.4 percent of GDP) in 2012, the last year for which complete data is available.1
In addition to direct spending on health care programs, the tax code includes several provisions aimed at helping Americans access affordable health care and health insurance. In fact, the subsidy for employer-sponsored health care is the single biggest subsidy in the tax code. Exchange subsidies, which came about under the Patient Protection and Affordable Care Act (ACA), are also administered through the
Reform the Tax Treatment of Employer-Provided Health Insurance3
Americans receiving health insurance from their employers benefit from preferential treatment under the tax system, compared to individuals who purchase their own insurance (or those who do not have any coverage). Currently, an employer’s contribution toward the cost of an employee’s health insurance plan is not subject to federal income or payroll taxes, and the
FEDERAL SPENDING ON THESE MAJOR HEALTH PROGRAMS TOTALED ABOUT $1.2 TRILLION, OR ABOUT 7.4 PERCENT OF GDP, IN 2012
Health (in millions) FY 2014 FY 2014 - FY 2018Tax Treatment of Employer-Provided Health Insurance $143,000 $785,100
Health Insurance Deduction for Self-Employed Taxpayers $5,400 $29,400
Exclusion for Cafeteria Plans and FSAs $34,500 $193,000
Health Savings Accounts $1,600 $11,500
Special Deduction for Blue Cross & Blue Shield Companies $400 $2,100
Deduction for Medical Expenses $9,900 $59,900
Medical Device Tax** -$3,000 -$15,000
Orphan Drug Tax Credit $700 $4,500
ACA Exchange Tax Credits $15,500 $318
Total $208,000 $1,070,818
** The revenue loss or potential savings associated with these line items is not included in the total calculations

166 | Tax Decoder Health Care | 167
employer pays no taxes on the business income used to fund the health benefit. The exclusion for employer-sponsored insurance (ESI) contributions will cost $143 billion in 2014 in lost federal income taxes4 and approximately $120 billion in foregone payroll tax revenue.5 From FY 2014 through FY 2018, the exclusion will result in $785.1 billion in lost revenue from income tax revenue.6 Altogether, including both payroll and income tax revenue, total foregone federal revenue will be about $3.4 trillion over the next ten years.7
While the employer-based tax health benefit initially helped expand the number of individuals with health coverage, economists from across the political spectrum argue the current tax treatment of health benefits is one key driver of our nation’s rising health care costs.
The ESI benefit’s existence is largely an accident of history. During World War II, the federal government implemented controls on wages, but health benefits were not subject to those controls. Employers were still able to offer generous health insurance plans to entice employees.
In 1943, the IRS ruled that employers could contribute to group health insurance plans tax-free.8 Almost a decade later, Congress also ensured the tax benefit applied to employer contributions to individual plans, after the IRS tried to rule against the exclusion.9 In 1996, employer contributions to long-term care insurance were also deemed exempt from federal income taxes.10
Employers increasingly used the insurance exclusion and became the dominant source of health insurance for most Americans before retirement,11 entrenching the existing tax policy and making any revisions to it difficult to achieve.
Current Tax Treatment Contributes to Increasing Costs
The ESI tax incentive has long been protected politically. Unfortunately, the exclusion promotes increased health costs, greater inequality across classes, and lower wages. Because the tax code subsidizes the purchase of health insurance, it is artificially inexpensive for a consumer compared to what they pay for other goods or services. Employees are less sensitive to the cost of their health insurance because, as a result of the ESI benefit, they do not bear the full burden of its cost. Put another way, “On average, $1 in added health benefits is worth only $.70 in added wages,” according to the Congressional Research Service.12 The average employer
contribution for families was $11,237, and for singles, $4,266, this year alone.13, 14 This exclusion has no limit.
Employees accept far more generous insurance than they need or want, in turn leading them to utilize more medical care than they might otherwise. Economist Roger Feldman explains,
“Excluding ESI premiums from taxable compensation causes workers to demand more insurance than they would in the absence of that exclusion…this higher level of coverage leads to inefficiently high levels of health care spending.”15
Unfortunately, the downstream impact on the entire healthcare system is tremendous. Increasing demand for medical services leads to higher prices. Lower-income households have difficulty accessing certain doctors or facili-ties as the prices go up. Government programs that subsidize or provide care have to grow their budgets to keep up. Tax-payers pay both in the lost federal revenue and increased di-rect spending. The distortion is so severe that one economist has acknowledged, “[N]o health expert today would ever set up a health system with such an enormous tax subsidy to a particular form of insurance coverage.”16
Current Tax Treatment Is Inequitable, Regressive
No lawmaker would support a federal grant program in which the funds are mostly given to those who are well-off and able to care for themselves. But about three-quarters of the insurance exclusion goes to the top half of income earners, many of whom are most able to purchase health in-surance without subsidies.17 This flawed distribution of the benefit merits its description as “upside-down.”18 It is a poor method for ensuring all Americans have adequate access to health insurance.
Wealthy individuals and families get more benefit from the deduction because they belong to a higher tax bracket—an observation true of many other tax provisions. Deductions, exemptions, and exclusions usually have a bigger impact on the tax return of wealthier taxpayers than of less wealthy ones. Upper-income families are also more likely to benefit since they are more likely to have employer-sponsored health insurance than lower-income households.19 To the degree any government assistance for health care is warranted, these high earners should be at the back of the line.
One health policy expert has suggested this inequitable dis-tribution is actually the reason it has remained in the tax code for decades. Robert Helms of the American Enterprise Institute writes, “The tax subsidy is regressive, offering more benefits to those with higher incomes…This distribution also helps to explain the political popularity of the tax exclusion. The policy gives more to those who have higher incomes and who work for firms that offer health insurance—a powerful bloc of voters.”20
ABOUT THREE-QUARTERS OF THE INSURANCE EXCLUSION GOES TO THE TOP HALF OF INCOME EARNERS, MANY OF WHOM ARE MOST ABLE TO PURCHASE HEALTH INSURANCE WITHOUT SUBSIDIES.

DRAFT
168 | Tax Decoder
ESI Benefit Depresses Wages and Mobility (Job Lock)
The current tax structure has locked in a system in which employees are less mobile and have seen their wages stagnate in recent years. Most Americans under 65 get health insurance through employers, who are in a position to dictate what plans are available to their workers, and under what terms.21 Employees have little freedom to choose a plan that better suits their needs, and when they leave the job, they cannot take the same plan with them. They would also receive less or no support through other tax subsidies if they purchased a health plan outside of what their employers offer.
This system has hurt take-home pay, especially in the last two decades. When employees’ compensation is diverted from salaries to health insurance, they have little freedom to choose differently (other than by finding a new job). The increasing costs of employer contributions have put “a disproportionate downward pressure on money wages.”22
The average annual increase in the cost for health insurance for families was 7.7 percent from 1996 to 2009.23 In contrast, average income only increased 3.5 percent annually.24
Over this period, the portion of employee compensation comprised of health benefits has increased.25
Secondly, this system prevents employees from changing jobs freely, or even creating new businesses. If they leave a job in which they receive insurance, they will likely have to switch insur-ance plans, which may entail changing doctors and learning new features (copays, cost-sharing, billing processes, allowances, etc.). One consequence of this system is older workers have a tenden-cy to delay retirement until they qualify for Medicare, delaying potential promotions for younger workers.26 The extent to which the current system creates “job lock” is debated.27 One study found the availability of insurance through a spouse’s employer can increase job turnover by 25 percent.28 In other words, being able to obtain insurance through other means increases the like-lihood that employees will transition to other jobs.
Reforms
The economic and societal deadweight of the ESI benefit is heavy. Outright elimination of the exclusion would allow tax rates to be reduced by 14.6 percent, increase GDP by $125 billion per year, increase federal revenues by $29 billion, and lead to over 800,000 new full-time jobs.29
RATHER THAN FURTHER COMPLICATING THE TAX CODE BY ADDING A NEW TAX ON TOP OF THOSE THAT
ALREADY EXIST, CONGRESS SHOULD LOOK TO REFORMS THAT LIMIT OR PHASE OUT THE EXCLUSION ITSELF.
Health Insurance Deduction for Self-Employed Taxpayers
The ESI benefit is only available to those whose employers contribute to their health insurance cover-age. However, Congress created a special, separate de-duction in 1986 for any expenses necessary to procure health and long-term care insurance for self-employed individuals and their immediate families.35 Motivating the new subsidy was a desire to extend insurance cov-erage to a population that struggled to obtain it. Con-gress was also concerned that some businesses were incorporating in order to qualify for the ESI benefit, a move policymakers saw as leading to “inefficient tax decision making.”36
The provision was at first temporary and only al-lowed 25 percent of the cost to be deducted. It was ex-tended several times and made permanent in 1996. The deduction allowance was also repeatedly raised, finally reaching 100 percent of the cost of the insurance premi-ums. The write-off cannot exceed the net income gener-ated by the person’s business.
Any expenditure counted toward this provision may not be double-counted under the medical expense de-duction. If a self-employed person is also able to receive a separate federal tax subsidy for insurance through a state or federal exchange, however, that taxpayer may also deduct the excess costs not covered by that subsidy.
Unlike amounts funneled through the ESI benefit, self-employed people do still have to pay payroll taxes on any income spent on health insurance contribu-tions.37 This revenue goes toward Social Security and Medicare trust funds.
Lost federal revenue from this tax break will to-tal $5.4 billion in 2014, and $29.4 billion over the next five years.38
Even though any taxpayer can utilize the deduction even if they do not itemize, it largely benefits high-in-come taxpayers. Those with incomes over $100,000 take over half of the benefits, with an average of $9,400 per claim in 2012.39 Taxpayers with incomes less than $100,000 have an average claim of $4,800 in 2012.40
One societal benefit of the self-employment deduc-tion is that it promotes entrepreneurship in the United States, as it enables people to obtain insurance when they start their own businesses.41 There is also evidence the tax benefit did meet its goals of expanding coverage among the self-employed and their families.42,43
A disadvantage of an unlimited deduction (i.e., there is no cap on the size of insurance that may be eligible for the provision) is consumers may still over-consume health insurance, purchasing more than they may actu-ally need. The downstream impact, as already discussed in the section on the ESI benefit, is overutilization of medical services that ultimately drives up the cost of care for everyone.
The self-employed deduction should be reformed to substantially conform to the same subsidy level as is provided through the ESI benefit. The total deduction allowed under either should be capped, and eventually phased out.

168 | Tax Decoder Health Care | 169
Cafeteria Plans and FSAs In addition to employer-sponsored health insurance, employers may choose to provide employees with auxiliary tax-
preferred benefits through cafeteria plans. Cafeteria plans offered by employers allow employees to divert pre-tax dollars for certain benefits such as “accident and health insurance, dependent care assistance, group-term life insurance, and adoption assistance.”44 The plans get their name because employees can choose between several nontaxable benefits or cash.
If an employee chooses a nontaxable benefit, the benefit is funded by a portion of the employee’s salary through a salary re-duction. Generally, since employees may choose between bene-fits or cash, both would be taxable, but this section of the tax code allows employees to choose to divert a portion of their income to fund certain benefits without paying taxes on those benefits.
The tax exclusion for benefits provided under cafeteria plans was estimated to decrease revenue by $34.5 billion in 2014 and $36.7 billion in 2015.45
Cafeteria plans are more likely to be offered to high-in-come earners and employees at large firms. Almost no low-income workers have access to cafeteria plans, whereas a majority of employees in the highest income brackets do, according to the Committee for a Responsible Federal Bud-get analysis of federal data.46 In addition, self-employed indi-viduals cannot benefit from cafeteria plans.47
Companies can choose the benefits offered through a cafe-teria plan. The most common benefit offered is “premium con-version,” which allows employees to pay their portion of the premiums for employer-sponsored health insurance with pretax dollars.48 The employer-sponsored insurance exclusion also al-lows employers to use pre-tax dollars to fund health insurance plans for employees. In 2013, roughly 80 percent of employees with employer-sponsored insurance had access to premium con-version benefits through a cafeteria plan.49
A cafeteria plan offering only premium conversion benefits is known as a premium only plan (POP). Since the employee can choose to pay insurance premiums with pre-tax dollars, the em-ployee may be incentivized to purchase a more robust insurance plan than is needed.50 In addition, paying for health care premi-ums through a salary reduction can mask the true cost of health insurance to the employee.
Flexible Spending Accounts (FSA) may also be included in cafeteria plans. Health FSAs may be used to pay for eligible med-ical expenses and dependent care FSAs may be used to pay for eligible dependent care expenses. The full amount an employ-ee chooses to put in an FSA is available at the beginning of the year, but the employee contributions are paid in equal amounts throughout the year through salary reductions. The maximum contribution to a health FSA is $2,500 per year and $5,000 for a dependent care FSA.51
Health FSAs allow employees to put pre-tax dollars into an account to spend on qualified health care costs, ranging from eyeglasses to contraceptives to allergy medicine to acupuncture. Health FSAs overlap with a more effective tool for encouraging individuals to save for unknown future health care costs— Health Savings Accounts (HSAs)—which are also tax-advantaged ac-counts.52 The Patient Protection and Affordable Care Act (ACA) prohibits using an FSA for over-the-counter medicines (except insulin) unless the patient has a prescription.53 As a result, indi-
A 40 percent excise tax on high-premium health insurance plans—one component of the Patient Protection and Affordable Care Act—was intended to curb the exclusion beginning in 2018.30 Rather than further complicating the tax code by adding a new tax on top of those that already exist, Congress should look to reforms that cap or phase out the exclusion itself.
Numerous ideas have been offered to cap or phase out the exclusion of employer contributions for health care. The President’s National Commission of Fiscal Responsibility and Reform recommended capping the exclusion at the 75th percentile of premium levels in 2014, with the cap frozen in nominal terms through 2018. The Commission’s plan would reduce the cap beginning in 2019 until the exclusion is completely phased out in 2038.31 The Commission would also reduce the excise tax on high-premium plans to 12 percent. As the Commission noted, “reducing … the exclusion for employer-provided health insurance will help decrease growth in health care spending, according to virtually all health economists.”32
The Domenici-Rivlin Debt Reduction Task Force plan
caps the amount that may be excluded beginning in 2018 and completely phases out the exclusion over ten years.33 Their proposal would replace the ACA’s “Cadillac tax” scheduled to take effect in 2018.
More recently, Senator Coburn introduced the Patient CARE Act with Senators Burr and Hatch to repeal and replace Obamacare. As part of this reform, in 2017 the exclusion for employer contributions would be capped at 65 percent of the total plan cost for high-premium plans. The cap would be indexed to grow at an annual rate of CPI +1.34
The goal should be to completely phase out the exclusion and other tax subsidies for health insurance over time, and to replace them with one tax program aligned with the actual need of taxpayers. Moving away from the current system will empower all Americans with freedom to purchase health insurance that meets their needs, without an economic incentive to purchase more than they need.

DRAFT
170 | Tax Decoder
viduals with an FSA may be incentivized to visit the doctor just to acquire a prescription for a medicine available over the counter.
Dependent care FSAs can be used for daycare expenses for children under the age of 13, or expenses for a spouse, parent, or grandparent who cannot care for themselves, as long as the de-pendent lives in the same house. Dependent care FSAs duplicate the tax benefits of the dependent care tax credit, which is allow-able for daycare expenses incurred for children or dependents whose caretaker goes to work or school.54
Incentivizing consumers to think about their use of medical services can have lasting benefits for the industry and economy. Health savings accounts (HSAs), which are distinct from FSAs, are often cited as a key component in this approach. FSAs, on the other hand, do a poor job of promoting responsible health care spending because of the “use it or lose it” rule. A maximum of $500 in an FSA may be rolled over into the following year, if an employer allows.55 In many cases, if the money in the account is not spent at the end of the year, the employee loses the money, incentivizing employees to spend the balance of the FSA as the end of the year approaches. Studies have shown that “employees typically forfeit more than $100 each year in flexible medical accounts” due to this requirement.56 Forfeited money goes back to the employer, which is often used to cover administration costs for FSAs, or may be used to balance a situation in which an employee leaves the com-pany with a negative balance in his or her medical FSA.57 A balance in an FSA account is also forfeited upon employee termination.58
Health FSAs are simply subsidizing expected health expenses for the year, but do not encourage individuals to save money for un-expected health costs they may incur.
Given this lack of incentive to save, “It is possible that FSAs encourage additional consumption of health care,” concluded the Congressional Research Service.59 One FSA user shared how he purchased Dolce & Gabbana glasses with his FSA rather than the “no-name glasses” his insurance covered.60 He encouraged others who are considering an expensive pair of glasses to check and see if their employer offers an FSA as a way “to treat yourself to something nice without feeling the pain in your wallet.”61
The incentive to overspend is partially counterbalanced by the design of cafeteria plans. Employees usually have little to no choice in deciding whether to spend part of their salary
on health insurance or other benefits, or to receive cash. With cafeteria plans, freedom is key. The trade-off between cash and benefits helps make employees more sensitive to considerations of how much health insurance they truly need. Still, any dollars allocated to health plans are essentially tax-free, so the incentive to overspend still exists.
In addition to the tax benefits for employees, employers can benefit from cafeteria plans. When an individual selects benefits from a cafeteria plan, the employer does not have to pay payroll taxes to fund Social Security and Medicare on the portion of the employee’s salary diverted to cafeteria plan benefits.62 An estimated $150 to $200 billion over ten years will be lost in payroll tax revenues as a result of cafeteria plans.63
Recommendations
Congress should phase out the tax preference for benefits available in cafeteria plans, including premium conversions and FSAs.
The Domenici-Rivlin and Wyden-Gregg tax reform plans completely eliminate the tax preference for cafeteria plans, and the Fiscal Commission eliminated the non-health benefits under cafeteria plans, and phased out the tax subsidy for health benefits provided by cafeteria plans at the same pace as the employer-provided health insurance provision.64
Reforming the tax preference for cafeteria plans would also bring in additional payroll tax revenue, helping programs such as Social Security and Medicare that are running deficits. The Committee for a Responsible Federal Budget (CRFB) estimates “repealing the exclusion entirely would allow a 4% cut in individual tax rates (citing the Joint Committee on Taxation), and close 9% of the Social Security shortfall (over 75 years).”65
The table below, from The Committee for a Responsible Federal Budget, provides estimated savings from several reforms to cafeteria plans.66
Eliminating the tax preference for cafeteria plans entirely would save over $600 billion over 10 years.67
Revenue from Reform Options on Cafeteria Plans
Policy Savings (2014-2023)
Repeal entire tax exclusions for cafeteria plans $600-$650 billion
Make cafeteria plans subject to the income tax, but still exempt from the payroll tax
$400-450 billion
Make cafeteria plans subject to the payroll tax, but still exempt from the income tax
$150-200 billion
Repeal Health FSAs only $60 billion
170 | Tax Decoder Health Care | 171
Health Savings Accounts A significant driver in the continued rise of health care costs is the disconnect between the purchaser of health care and the
payer. Traditional third-party insurance gives patients little incentive to consider the cost of their medical care. One increasingly popular tool touted as a means to reduce health spending are health savings accounts (HSAs) attached to high-
deductible health plans (HDHPs). Over 15 million people receive health coverage through an HDHP eligible for use with an HSA, and participation in these plans is increasing by about 15 percent annually.68 However, as HSAs are tax-free accounts, it is important to examine whether the federal revenue lost from these types of plans is justified by the overall advantages they provide.
How HSAs Work
HSAs are tax-free savings accounts used to pay for medical and dental expenses. Eligible expenses mostly include any that would otherwise qualify for the medical expense deduction.69 HSA dollars may not be used to pay for health insurance premiums in most circumstances,70 but may be used to pay for long-term care insurance.
Funds deposited into and withdrawn from HSAs are not subject to federal income or employment taxes, provided they are used to pay for qualified medical expenses. Any funds contributed reduce a taxpayer’s adjusted gross income. HSA owners, their employers, and others can add funds to an HSA at any point throughout a year, up to an aggregate annual limit—which for this year was $3,350 for self-only coverage and $6,650 for family coverage. However, contributions to an HSA are only allowed when the accountholder is concurrently covered by a high-deductible health plan (HDHP).
In 2011, employers contributed an average of $1,150 to their employees’ HSAs for family coverage (and $653 for employees in self-only plans).71 HSA funds can be invested, and any capital gains are also tax-free (subject to their use for eligible medical and dental expenses). Any HSA funds not used for eligible medical or dental expenses are subject to income taxes and an additional 20 percent penalty.72 An accountholder owns a health savings account, even if he or she changes insurance plans or jobs.73 When no longer covered by an HDHP, the accountholder can still invest or withdraw funds, but deposits may no longer be made.74
HSAs are not subject to a ‘use it or lose it’ policy that forces accountholders to make purchases at the end of the year or else lose the funds. Unused balances may continue to accrue without limit. In fact, over 80 percent of HSAs had a carryover balance from 2013 into 2014.75
Individual consumers can establish and fund HSAs if (and only if) they have qualifying HDHPs.76 There are also several features that must be included in a qualifying HDHP. In 2014, a HDHP needed an annual deductible of at least $1,250 for self-only coverage and $2,500 for family coverage. The minimums are updated annually to reflect changes in the cost of living. These plans also have built-in consumer protections. One is an annual maximum limit on out-of-pocket expenses, revised annually by the IRS, for any covered medical expenses.77
HDHPs also generally cover preventive services—such as annual physicals—at little or no charge.
Cost and Usage of HSAs
Because funds going into or accumulated in an HSA are not subject to any federal income or payroll taxes, the accounts result in lost federal revenue. In 2014, the net impact was $1.6 billion in foregone federal funds.78 Over the next five years, the cost will be $11.5 billion.79 At the start of 2014, HSAs held over $20 billion in assets in almost 11 million accounts.80
The average tax subsidy per account during 2014 will be approximately $149.81
Almost half of HSA owners in 2012 lived in lower-middle income neighborhoods with a median income under $50,000, and 34 percent of HSA owners lived in middle-income neighborhoods with a median income between $50,000 and $75,000.82
At the same time, accountholders with incomes over $100,000 tend to contribute more to their accounts, receiving an average deduction of about $4,000.83 Those with incomes less than $100,000 have an average deduction of $2,000.84
Effectiveness of HSAs
HSAs are designed to give consumers more choices and encourage them to be more mindful of how they manage their own health care spending.
Employers recognize these plan features as useful for giving more freedom to their employees while limiting the growth in cost of providing care.85 Next year, over 30 percent of employers are expecting to only offer high-deductible health plan options.86 Five years ago, less than 10 percent followed the practice.87 Consumers view HSA/HDHP options as giving them more control over their health care dollars.88
HSAs feature several attractive design perks: consumers always own the accounts, and funds roll over every year. Both features stand in contrast to FSAs, which have been criticized for their lack of consumer freedom and incentive to restrain unnecessary spending. Whether a consumer contributes his or her own funds, receives an employer contribution, or earns investment income within the HSA, the accumulated savings will always stay with the consumer. There is little incentive to pull funds out of the account unless a consumer feels certain medical care is truly necessary. Of the totals funds contributed to HSAs in 2013, about one quarter were retained and left unspent by the end of the year.89 At the same time, nearly all HDHPs generally cover preventive care without charging

DRAFT
172 | Tax Decoder
patients, giving patients no reason to avoid regular physicals, check-ups, and tests.90 When patients do face high health care costs, limits on out-of-pocket expenses under an HDHP also reduce overall financial exposure.
These benefits are balanced by important limits on the use of the tax subsidy. A strong financial penalty for spending HSA funds on non-medical expenses provides a necessary barrier to ensure the tax incentive is properly targeted. HSAs also have modest contribution caps that further minimize the risk of HSAs becoming tax shelters. These checks appear to prevent abuse of HSAs. Only 5 percent of HSA accountholders reached the maximum annual contribution limit of $6,450.91
Despite HSAs’ growing popularity, some policy analysts have suggested the disadvantages of the accounts may outweigh the benefits.92 For example, they say HSAs may not be appropriate for elderly consumers or individuals with chronic disease, as both of these populations generally may require more health care than others. Some worry HSAs could actually cause health insurance costs to increase, since younger, healthier consumers could, over time, switch to HSAs and leave a relatively older, sicker—and thus more costly—population to insure through more traditional insurance plans.
The extent to which these concerns actually hinder the efficacy of HSAs is questionable. For example, patients who meet the annual limit (because they are high spenders) are no worse off under an HSA/HDHP than if they were in more traditional, low-deductible plans.93 Similarly, real-life plan data shows HDHPs combined with HSAs may promote preventive care and basic screenings, typically available with no copay or coinsurance through HDHPs. One major study found these plans lower health care costs at the same time beneficiaries
use more routine, preventive care, including higher rates of screening for cervical, colorectal, and prostate cancer.94 Usage of general laboratory tests—often said to be overused in today’s medical practices95—decreased among patients who switched from an HMO96 plan to an HDHP.97
Since HSA dollars can be used for largely the same set of expenses allowable under the medical and dental expense deduction, the same questions surrounding the breadth of that deduction apply to HSAs. The medical expense deduction is explored in this report.
Conclusion
Given the current structure of the tax code and federal health care law, HSAs are an important tool to sensitize health care consumers to the costs of their choices and to incentivize them to plan to cover their expenses and meet their own needs. There is evidence these accounts are meeting their overall goal of restraining health care spending while ensuring patients still have access to affordable medical care.
While in the current environment the tax exemption for HSA should be retained. However, in the context of a complete rewrite of the tax code and significant reforms to health care subsidies Americans would face lower income tax rates and have significantly less incentive to overspend in the health care sector. In those conditions, the HSA tax exemption could be eliminated.
Nonetheless, Congress should continue to monitor the effectiveness of HSAs going forward, but there appears to be little need for reform at this time.
Special Deduction for Blue Cross and Blue Shield Companies
A single health insurance brand has a special deduction written into statute. Under current federal law, Blue Cross/Blue Shield (BCBS) is cited by name and given special status related to how its funds are treated for tax purposes.98 Other health plans that were once considered nonprofit by the IRS may be treated similarly. This advantage may give BCBS plans an unfair edge over their competitors, to the tune of $400 million each year.
History & General Background
The history of how BCBS gained this carve-out goes back several decades. Blue Cross plans, originally organized as nonprofits under the federal tax code, spread rapidly in the 1930s. By the 1950s, for-profit health insurers increasingly competed with Blue Cross’ plans and cut into their market share.99 Even at that time, BCBS plans enjoyed a “competitive advantage” over their commercial counterparts to the point that “continued exemption was inherently unfair to other nonexempt, commercial insurers,” according to one analysis.100
501(c)(3) or 501(c)(4) nonprofit status was generally not allowed for organizations that provide commercial-type insurance, yet BCBS organizations happened to receive favorable rulings from the IRS that were not allowed for others. In fact, before the BCBS plans lost their exemption, other health insurance organizations tried to qualify for nonprofit status but were denied by the Internal Revenue Service.101
The growth of the insurance market brought increasing scrutiny to the nonprofit plans’ tax advantage in the 1980s. There were “more similarities than differences” between commercial and nonprofit health insurers with regard to the “provisions of health insurance, especially to high-risk

172 | Tax Decoder Health Care | 173
individuals,” a 1986 report by the Government Accountability Office (GAO) found.102 As a result, in the Tax Reform Act of 1986, Congress prohibited all health insurers from qualifying for a federal income tax exemption because their activities are “inherently commercial in nature.”103 Congress believed “exempt charitable and social welfare organizations that engage in insurance activities are engaged in an activity whose nature and scope is inherently commercial rather than charitable.”104
Ostensibly, BCBS plans are now treated by the federal tax code similarly to all other health insurers subject to federal income tax.105 But at the same time the tax exemption was removed, Congress gave several new tax benefits to BCBS plans. Other insurers that were formerly nonprofits at the federal level may qualify, but they must meet a laundry list of additional criteria. There is no public, comprehensive list of which insurance plans actually qualify, but federal law requires plans other than those associated with BCBS to have nonprofit status at the state level.106
BCBS organizations were provided two key deductions. First, BCBS plans and other qualifying entities can fully deduct from their stated income the total amount of unpaid premiums in a given year, which reduces the amount of income subject to tax in a given year. Other insurers can now only deduct a fraction of this amount. Before 1986, any health insurer was allowed to fully deduct unpaid premiums, but that year Congress scaled back this practice by limiting the size of the deduction. BCBS plans and other qualifying entities were allowed to carry on the old practice, reducing their tax bills and increasing their advantage over other insurers. At the time, Congress justified this handout as necessary to “ease the transition from tax-exempt to taxable status.”107
The second deduction permits BCBS organizations and other eligible organizations to write off the difference between a quarter of all health-related expenses and any surplus from the previous year.108 This provision is not allowed to other insurers. The report accompanying the 1986 tax reform package explains this policy with an example:
“Assume a calendar year Blue Cross organization engaged only in health business, the State law surplus (as adjusted) of which was $100 million on January 1, 1987. In 1987, the organization has health claims and expenses incurred of $880 million and adjusted taxable income of $160 million (including net tax-exempt income of $10 million). In 1987, the organization would be entitled to a special deduction of $120 million, that is, the excess of $220 million (25 percent of the 1987 claims and expenses paid) over $100 million (the 1987 opening surplus).”109
Almost thirty years later, this handout is still favoring BCBS plans over its competitors. Together, these provisions can give BCBS and other eligible plans a major advantage since their cost of doing business will likely be less than what
others can achieve.110 The Joint Committee on Taxation estimates a $400 million
cost in foregone federal revenue in 2014.111 From 2014 through 2018, the total cost will be $2.1 billion.112
BCBS plans were automatically included in these benefits in part to aid their transition from nonprofit to taxable status (as noted above).113 Other health insurers can also make use of the special provisions, but have twice as many criteria to meet as BCBS plans.114 For example, they need to utilize community rating for at least some of their beneficiaries, allow full-year continuous open enrollment, and cover pre-existing conditions of high-risk individuals.115 The only requirement consistent for all qualifying plans (including BCBS) is the mandate to maintain a medical loss ratio of at least 85 percent.
Corporate Welfare?
One of the main reasons the Tax Reform Act of 1986 provided a special deduction for BCBS plans was to “ease the transition from tax-exempt to taxable status.”116 Thirty years is a long enough transition—these plans should now be able to operate without special tax benefits.
BCBS plans have demonstrated consistent success, and do not need a special handout from taxpayers. Blue Cross/Blue Shield companies are among the top ten largest in the health insurance business.117 In roughly half of the states, BCBS plans control more than half the health insurance market; in some states, these plans control up to three-quarters of the market.118 Today, they also have 5.3 million beneficiaries enrolled in their plans through the Federal Employees’ Health Benefits Plan (FEHBP), making it the “largest single health plan group in the world.”119, 120
In addition to these successes, BCBS companies have a range of other health insurance business lines. Today, many BCBS plans have “accumulated enough surplus to purchase unrelated businesses” while “many receive a substantial part of their income from administering Medicare or self-insurance plans of other companies.”121 Some critics have also suggested the current tax code benefits BCBS executives and their affiliated providers more than patients and communities.122
Providing the BCBS plans a special tax break may have, in the past, served the purpose of making insurance more accessible for some Americans. These handouts are no longer justified, however, since the health insurance market has greatly evolved since 1986. Today, all health plans are subject to national community rating standards, are required to provide access to beneficiaries with pre-existing conditions, and must meet a minimum medical loss ratio criterion. While there are serious concerns with the consequences of this federal regulation of the insurance market, current law does remove the policy rationale propping up the continuance of this deduction in federal law.

DRAFT
174 | Tax Decoder
Deduction for Medical Expenses Taxpayers who itemize are able to deduct their medical and dental expenses, insurance premiums, and long-term care
costs in excess of 10 percent of adjusted gross income (AGI).123 The provision is another example of a poorly targeted health care subsidy that has persisted for decades.
Background
Since 1942, individuals have been able to deduct medical expenses. Under the original law, expenses in excess of 5 percent of AGI were eligible for the deduction. There were also limits on the total amount that could be deducted. Married couples could deduct up to $2,500, while single filers could use up to $1,250. Accounting for inflation, those thresholds would be about $37,000 and $18,500 today.124 The deduction was motivated in large part by the high tax rates at the time. “This allowance is recommended in consideration of the heavy tax burden that must be borne by individuals during the existing emergency and of the desirability of maintaining the present high level of public health and morale,” read the Senate Finance Committee’s report accompanying the legislation.125
The decades following saw a number of changes to the cap and threshold, but never the outright elimination of the provision.126 In 1954, a separate 1-percent threshold was created specifically for spending on drugs and medicines. In the Tax Equity and Fiscal Responsibility Act of 1982 (known as TEFRA), the medical expense deduction was combined with another focused on health insurance premiums. The one percent threshold on drug costs was eliminated, and the overall threshold for deductibility was raised to 5 percent (from the 3 percent level set by a previous law). Additional changes were made in 1986, 1990, and 1996, ultimately raising the threshold to 7.5 percent of AGI and allowing long-term care expenses and insurance to qualify for the deduction (subject to a cap).
The Patient Protection and Affordable Care Act (ACA) generated $15 billion in revenue by raising the threshold for deductibility from 7.5 percent to 10 percent of AGI.127
Cost and Usage
The provision is expected to result in $9.9 billion in foregone federal revenue for 2014, and $11 billion in 2015.128 Over the next five years, it will cost $59.9 billion.129
Eligible expenses
Eligible medical and dental expenses are essentially any that are not reimbursed by an employer or insurance company.130 Qualifying for the deduction are “costs for the diagnosis, cure, mitigation, treatment or prevention of disease,
and costs for treatments affecting any part or function of the body.”131 Premiums for health insurance and long-term care are included, as are a number of non-medical expenses.
Special equipment or modifications to a home—such as installing new doorways or stairways—are deductible as medical expenses.
The cost of private tutoring or education for a child with a learning or other disability can also qualify, as long as a doctor recommends the services. Expenses related to care for a disabled dependent can qualify for the medical expenses deduction, just as they do for the dependent care tax credit.132 Any costs incurred for transportation and lodging (up to $50 per night per individual) while seeking medical care are eligible for the tax write-off.
The expense of using a surrogate mother to bear children is deductible. Such costs include paying the donor for her time and expense, the agency’s fees for finding the donor, and associated legal fees.133
The logic regarding which expenses are eligible is not always consistent. For example, pregnancy tests and lactation equipment are eligible for the deduction—items that do not require prescriptions. Over-the-counter supplements and nicotine patches are not eligible (though stop-smoking programs are). Seeing a Christian Science practitioner is deductible134 while having a Scientology “audit” is not.135
Analysis
This provision is well-intentioned as a financial backstop for high medical expenses, which would seem to benefit everyday Americans. In reality, the real beneficiaries of the deduction are those earning the most—the federal assistance is poorly targeted to those in the most need. Tax filers with incomes over $100,000 make up less than 15 percent of the deduction’s claimants, but they take about half of the overall benefits.136 Those with incomes below $100,000 write off $3,000 in medical expenses, per average claimant, whereas the average for claimants with incomes over $100,000 is $11,000.137 For those with incomes over $500,000, the average deduction is $66,700.138
Poor targeting is not the deduction’s only problem. It leaves the tax code open to significant interpretation, placing the taxman in the position of studying medical records and deciding what constitutes necessary care. For example, one man tried to deduct his visits to prostitutes and purchases of pornography as medical expenses related to sex therapy.139
The IRS determined the man did not receive actual medical

174 | Tax Decoder Health Care | 175
benefit from the visits and obscene material. Another tried to seek the benefit for his gym membership.140 The IRS had to study the patient’s medical records. It ruled, “There was no specific health reason why petitioner needed to participate in an exercise gym as distinguished from the general proposition that such exercise is generally good for any person.”141
Examples of what the IRS has allowed present questions as to whether the deduction has been overly broad at times. Each of the following has been ruled an allowable expense:
• The cost of attending a conference can be deducted as long as “the majority of the time spent at the conference [is] spent attending sessions on medical information.” 142
• One taxpayer was able to claim deductibility of dance lessons, because his doctor said they would “alleviate postoperative stiffness of his abdominal and leg muscles and because this suggestion was concurred in by his psychiatrist.”143
• A well-meaning father was allowed to deduct the cost of his son’s clarinet and music lessons, which were recommended by his doctor for correcting misalignment of his teeth.144
• Another taxpayer was able to deduct a portion of his expenses for a naturopathic treatment of “consultation and dietary ‘supplements.’”145
• Air conditioners are also eligible as a deduction, as long as they are alleviating an allergy or other condition.146
A third problem with the medical expense deduction is it may undermine the incentive for consumers to purchase adequate health insurance, according to some economists.
“One possibility is that individuals might reduce their coverage or forgo insurance entirely, in order that they will not sacrifice the free partial insurance offered by the tax system,” notes one analysis.147 For example, some Americans may choose to forgo planning for long-term care for their dependents or spouse, knowing they can deduct the high cost on their income taxes.
Recommendation
No American should go without vital medical care. The aim of this provision is to provide a backstop for those whose unreimbursed expenses have exceeded a significant percentage of their income. It also grew out of tax rates during World War II, which were much higher than they are today. Unfortunately, the provision generally serves those who are least in need of a helping hand. Maintaining the medical expense deduction complicates the tax code and duplicates other provisions in the code, such as health savings accounts, flexible spending accounts, and the dependent care tax credit.
Phasing out the deduction would streamline compliance, while other public policy can explore other ways to ensure no one is left without access to high quality health care. Congress now has the opportunity to unwind the special benefit and return more dollars to everyday Americans’ pocketbooks.
An alternative to a complete phase-out would be to cap eligibility for the deduction based on income.
Medical Device Tax Our nation has long been considered the world’s leader in medical device research and development. In 2008, the industry
employed 422,778 workers and shipped $135.9 billion worth of products.148 Salaries in the field are approximately 40 percent higher149 than the national average.150 Most device companies (80 percent) employ less than 50 workers.151
The Patient Protection and Affordable Care Act (ACA) began levying a tax in 2013 on medical device manufacturers that develop and import products such as pacemakers, artifi-cial joints, surgical tools, and ultrasound equipment. This 2.3 percent tax applies to revenue, not profits—so regardless of whether a company makes a profit, it must pay the federal tax each year. On average, profits compose less than 4 percent of industry-wide sales.152 The tax does not affect medical devices manufactured and sold abroad.
Much of the cost of the tax will be paid by consumers, not manufacturers. To cover the expected shortfall due to the medical device tax, companies may choose to increase the price of devices, move their operation overseas, or both. The
incentive to raise prices occurs because the excise tax impacts each company equally. CBO warned the tax “would be largely passed through to consumers in the form of higher premiums for private coverage.”153 Subsequently, the Medicare program’s Chief Actuary, Richard Foster, came to the same conclusion as he discussed the device tax and a range of other taxes imple-mented by the ACA: “We anticipate that these fees and the excise tax would generally be passed through to health con-sumers in the form of higher drug and device prices and high-er insurance premiums.”154
Companies are already moving to low-tax nations like Ire-land, Costa Rica, Mexico, and Canada to develop life-saving and life-altering medical devices, taking good-paying jobs

DRAFT
176 | Tax Decoder
Orphan Drug Tax Credit Drugs to treat rare diseases are often called “orphan drugs” because drug companies historically lacked a strong financial
case to develop them, since the patient population was too small. The National Organization for Rare Disorders estimates there are nearly 7,000 rare disorders affecting nearly 30 million Americans.162 To create incentives to develop such drugs, Congress passed the Orphan Drug Act (ODA) in 1982. The ODA specifically targeted development of drugs to treat rare diseases or conditions affecting less than 200,000 people in the United States, or drugs for which there is no reasonable expectation that the sales from the drug will recover the costs.
A tax credit for orphan drug development was a central part of the ODA’s design. The orphan drug tax credit allows a drug company to “claim a tax credit equal to half of the cost of human clinical trials for [orphan] drugs.”163 Trials are usually the costliest and most time-consuming part of the drug development process.164 Originally temporary, the credit was extended by Congress several times and was permanently extended by the Taxpayer Relief Act of 1997. The Small Business Job Protection Act of 1996 gave taxpayers with “unused [orphan drug] credits the ability to carry them back up to three years or carry them forward up to 15 tax years.”165
In 2014, the tax credit for orphan drug research resulted in $700 million in lost revenue and will cost $4.5 billion over the next five years.166
In addition to creating a tax credit for orphan drug clinical trials, the ODA gives orphan drugs a seven-year term of marketing exclusivity for the specific indication, provides for a waiver from drug application fees for orphan products, and allows for “faster review of applications for marketing approval if the products treat rare but life-threatening illnesses, such as late-stage cancers.”167 Only 10 orphan drugs were approved for rare diseases in the decade prior to the ODA becoming law; the FDA approved nearly 400 drugs in the following three decades.168 Still, just five percent of rare diseases have any drug approved for their treatment.169
A Burgeoning Industry?
Orphan drugs have proven to be a viable and lucrative source of revenue for developers. The global sales of orphan drugs reached nearly $83 billion in 2012, and the “worldwide orphan drug market is set to grow to $127 billion” by 2018.170 Orphan drugs targeting rare cancers account for over one-third of those in development, and other top areas of orphan drug research include drugs for genetic conditions, infectious diseases, and autoimmune disorders.171
Orphan drugs have actually proven to be more profitable than non-orphan drugs. They command a significant portion of revenue—22 percent—when compared to all key products within the drug industry.172 The overall size of the market for orphan drugs increased 25.8 percent every year from 2001 to 2010.173 For key non-orphan drugs, the growth was less at 20.1 percent.174 Individual orphan drugs yield the same value to a manufacturer as a non-orphan drug, a fact that “is remarkable and indicates significant revenue opportunity for orphan drugs.”175 By 2009, 18 drugs that had been approved as orphan drugs “had reached blockbuster status—that is, they had annual sales surpassing $1 billion—within their seven years of market exclusivity.”176
A driver in the development of orphan drugs has been the high pricing that manufacturers are able to command, a
with them.155 Other countries offer decreased operating costs, lower employee wage costs, and relaxed regulatory settings that create a superior environment in which device manufac-turers can economically prosper.156
Additionally, medical device companies with facilities in the U.S. will engage in “workforce trimming” in order to sus-tain profit margins.157 Bracing for the tax to hit, device compa-nies started shrinking their payrolls. Stryker Corp. laid off 1,000 workers in part to absorb the impact of the medical device ex-cise tax.158 Smith & Nephew, another major device manufac-turer, laid off 100 U.S. employees in preparation for the tax.159
Recommendation
This misguided and destructive tax should be repealed. The cost of repealing this, however, would be roughly $29 billion over ten years.160
Several members of Congress who support the ACA (the law that implemented the tax) are now supporting a repeal of the tax provision. On March 21, 2013, the Senate approved a non-binding amendment to the Senate budget resolution to repeal the 2.3 percent medical device tax. The amendment was approved by a vote of 79-20.161

176 | Tax Decoder Health Care | 177
feature that does not rely on the tax credit. Soliris is an orphan drug used to treat paroxysmal nocturnal hemoglobinuria, a rare disease of the blood. It costs over $400,000 per year.177 Naglazyme, Elaprase, and Cinryze are all orphan drugs that cost over $300,000 annually.178 One prominent orphan drug, Rituxan, was the third best-selling drug in 2013 and may bring in as much as $150 billion over its entire lifecycle.179, 180 It may be the best-selling drug by 2018.181
Tax Credit’s Impact May Be Negligible
Lawmakers should take every step to ensure no federal law or regulation is unnecessarily slowing down development of orphan drugs. But the orphan drug industry does not need a tax credit as an added incentive. The credit’s marginal value is small in comparison to the total revenue these drugs can generate. If the credit did not exist, companies would still be able to expense (take an immediate deduction for) or amortize research costs on their tax return.
The real payoff for investors is not getting the tax credit, but getting a drug approved. The major hindrance to orphan drug development is getting through the regulatory process. FDA requirements have become stricter in the last few decades. The cost burden has increased over four-fold since 1987, and the total cost to get a new product to market is over $1 billion.182 Almost all the cost of getting a new drug to market is incurred during the last phase of clinical trials, which take years and involve thousands of patients. Revenue from successful products must also cover the costs lost due to drugs that fail to cross the finish line.
The key incentives for manufacturers to develop and seek orphan drug approvals are not the credit, but the other aspects of the Orphan Drug Act, including market exclusivity and a quicker approval process. With the streamlined process under the Orphan Drug Act, drug approval requires far fewer patients and takes one year less, on average, than approvals for non-orphan drugs.183 Such drugs are more likely to be approved as well.184 The overall cost of development of orphan drugs can be as low as 29 percent of that for non-orphan products.185 The average number of patients needed for Phase 3 clinical trials is 528, a quarter of the requirement for non-orphan products.186 On top of this less burdensome pathway is the market exclusivity, granting a clear period to regain any R&D costs for seven years. “The seven-year monopoly…is considered by pharmaceutical manufacturers to be the Act’s most important incentive,” wrote several researchers just years after the Act became law.187
Patients are able to gain access to life-saving and improving products faster, while manufacturers are not subject to the enormous financial risk present in developing non-orphan drugs.
Duplication
In addition to the tax credit, the federal government operates several programs, task forces, collaborations, and other initiatives to encourage the development of orphan drugs and research treatments for rare diseases.
The Office of Orphan Products Development (OOPD) within the U.S. Food and Drug Administration (FDA) runs the Orphan Products Grants Program to fund clinical development for orphan drugs.188 The Orphan Products Grant program usually receives about $14 million in appropriations each year,189 and since 1983, OOPD has funded over 500 studies and “has been used to bring more than 45 products to marketing approval.”190 The FDA also houses the Rare Diseases Program which supports the “research, development, regulation and approval of drug and biologic products for the treatment of rare disorders.”191
The National Institutes of Health (NIH) also administers several programs to support research to find new treatments for rare diseases, including Therapeutics for Rare and Neglected Diseases, and the Office of Rare Diseases Research.192 NIH will allocate $3.6 billion to rare disease research in the coming year.193
Although the most significant investments in rare disease research and treatment is done through the FDA and NIH, the Centers for Disease Control and Prevention (CDC) and the Department of Defense (DOD) also manage programs focused on rare diseases.194
Several government studies have also been completed to further the research and development of drugs and biologics to treat rare diseases. For instance, a 2010 appropriations bill created the Rare Disease Group (RDG) to report to Congress on the “appropriate preclinical, trial design, and regulatory paradigms and optimal solutions for the prevention, diagnosis, and treatment of rare diseases.”195 In its report, the RDG notes,
“[E]fforts to develop medical products for rare diseases have increased substantially in recent years and are expected to increase, given advances in molecular biology, bioengineering, computational modeling, and targeted pharmaceutical and biotechnology product development.”
Recommendation
The tax credit for orphan drug development should be eliminated because it is not needed to incentivize orphan drug development. Any research costs would be subsidized through the research and development tax break, already available for certain types of corporations. As Congress continues to monitor the incentives provided in the Act, it may want to consider lowering the threshold for which

DRAFT
178 | Tax Decoder
Nonprofit Hospitals Another major tax provision that essentially provides billions in dollars annually for the health care sector is the availability
of 501(c)(3) tax-exempt status for nonprofit hospitals. 501(c)(3) status allows nonprofit hospitals to pay no income tax, except in special situations. The cost of this tax exemption
would be approximately $3.3 billion in FY 2014.200, 201 Taxpayers are also able to make tax-deductible charitable donations to 501(c)(3) nonprofit hospitals, which cost $4.8 billion in revenue. Finally, 501(c)(3) status allows nonprofit hospitals to take advantage of tax-exempt 501(c)(3) bonds, costing an additional $2.2 billion in revenue.202
These tax benefits are discussed in more detail in the section on 501(c)(3) tax-exempt organizations.
ACA Exchange Tax Credits Starting in 2014, millions of Americans purchasing health insurance through state and federal exchanges became eligible
for tax subsidies to offset premiums. Subsidies are available to families with incomes between 100 and 400 percent of the federal poverty level who generally have no access to health insurance through their employers or other federal programs. A family of four can earn up to $95,000 and still qualify for the tax credits.
products qualify as “orphan” drugs. Doing so would more precisely target the Act’s benefits.
To the extent that small businesses with potentially viable products need support to launch clinical trials, additional resources can and do come from the National Institutes of Health (NIH). NIH plans to spend $3.6 billion next year to research rare diseases.196 For instances in which an NIH-supported orphan drug makes blockbuster profits, certain grants could be recaptured over time – a proposal that has been explored for the current tax credit structure.197
When the Orphan Drug Act was debated in Congress, the only reason a tax credit was implemented, instead of a stronger grant program, was “not on the substantive issue of whether to provide support, but on the procedural issue of what Senate Committee had jurisdiction when federal government funds
were to be provided through a tax credit.”198 The Treasury Department opposed the creation of a new tax credit because of “concern that the Code was not the appropriate vehicle for dealing with the orphan drug problem.”199
Congress should also consolidate unnecessarily duplicative federal programs within FDA, NIH, CDC, and DOD intended to better target resources to spur the research and development of drugs to treat rare disorders.
Key motivators for drug companies are the other components of the Orphan Drug Act, including the seven-year exclusivity period (regardless of patent status) and fast-track approval process. In fact, the success of these reforms—especially the streamlined approval process—should form the basis of major FDA restructuring to modernize the agency.
Providing federal assistance to families for premium assistance was not an idea unique to the Affordable Care Act. The inequity between federal subsidies for employer-provided plans and those purchased on the individual market has long been in need of reform. Provision of tax credits to help families purchase insurance has been included in bipartisan reform proposals dating back several decades.203
Broader tax subsidies will undoubtedly be part of the solution for extending insurance access to Americans who otherwise have no outside assistance to purchase insurance. These changes should be paired with trimming back the unlimited tax subsidy for employer-sponsored insurance plans, as discussed in this report.
Still, there are serious concerns about the sustainability of the ACA tax credits on the federal budget. The national debt already stands at over $18 trillion, and the exchange
tax credits will cost well over $300 billion in the next five years.204 Scaling back income eligibility and restraining the annual growth in the subsidy (rather than allowing it to grow with premiums) would place the tax credits on a firmer foundation.
The ACA also placed significant restraints on the design of insurance plans. Consumers are faced with paying higher premiums or choosing cheaper plans that have reduced network sizes or high copays. Because the ACA exchange credits are pegged to a percentage of premiums, they necessarily increase whenever a plan’s costs increase.
Addressing these concerns–coupled with scaling back the employer-sponsored insurance exclusion–provides an avenue to ensure all Americans have adequate access to affordable health insurance without burdening the nation with additional debt.

178 | Tax Decoder Health Care | 179
1 The 2014 Long-Term Budget Outlook, Congressional Budget Office, July 2014, page 27, http://goo.gl/GJ5Nqi . This CBO report assumes GDP is about $16.05 trillion. 2 Each of the following are discussed in this report: Employer-sponsored health insurance exclusion results in $248 billion in lost federal revenue; medical expense
deduction, $9.9 billion; deduction of health insurance premiums for self-employed taxpayers, $5.4 billion; tax exemption for nonprofit hospitals, $3.3 billion; charitable donations to nonprofit hospitals, $4.8 billion; bonds for nonprofit hospitals, $2.2 billion; health savings accounts, $1.6 billion; orphan drug tax credit, $700 million; special Blue Cross/Blue Shield deduction, $400 million. Though they are largely not discussed in this report, the ACA exchange subsidies result in $16.5 billion in lost revenue, according to the Joint Committee on Taxation.
3 The ESI exclusion is also the tax policy under which health reimbursement accounts/arrangements (HRAs) are governed. These accounts are very different from FSAs and HSAs, which are each discussed in this report. HRAs were not created by any specific legislation, but rather were created by employers as an extension of the ESI exclusion. They are set up and funded by an employer for use by the employee for certain medical expenses allowed by the employer. Employees do not always get to take their HRA dollars with them when they leave their jobs. Limits on ESI exclusion should take employer HRA contributions into account.
4 Joint Committee on Taxation, “Estimates of Federal Tax Expenditures for Fiscal Years 2014-2018,” August 5, 2014, JCX-97-14, page 31; http://goo.gl/Au28Z6 5 CBO estimated the payroll tax revenue foregone on account of the ESI exclusion was about $120 billion in 2013. The 2014 Long-Term Budget Outlook, Congressional
Budget Office, July 2014, page 12; http://goo.gl/oXGf4N 6 Joint Committee on Taxation, “Estimates of Federal Tax Expenditures for Fiscal Years 2014-2018,” August 5, 2014, JCX-97-14, page 31; http://goo.gl/Au28Z6 7 This estimate is for 2014-2023 and includes lost payroll tax revenue. The 2014 Long-Term Budget Outlook, Congressional Budget Office, July 2014, page 12; http://goo.
gl/oXGf4N . 8 “Tax Expenditures: Compendium of Background Material on Individual Provisions,” Congressional Research Service, December 2012, page 872; http://goo.gl/5UQsFj 9 “Tax Expenditures: Compendium of Background Material on Individual Provisions,” Congressional Research Service, December 2012, page 872; http://goo.gl/5UQsFj 10 “Tax Expenditures: Compendium of Background Material on Individual Provisions,” Congressional Research Service, December 2012, page 872; http://goo.gl/5UQsFj 11 Blumenthal, David. “Employer-Sponsored Health Insurance in the United States–Origins and Implications,” New England Journal of Medicine, 355: 82-88. 12 “Tax Expenditures: Compendium of Background Material on Individual Provisions,” Congressional Research Service, December 2012, page 873; http://goo.gl/5UQsFj 13 Kaiser Family Foundation, “Average Family Premium per Enrolled Employee For Employer-Based Health Insurance,” http://goo.gl/vhGqfZ 14 Kaiser Family Foundation, “Average Single Premium per Enrolled Employee For Employer-Based Health Insurance,” http://goo.gl/vhGqfZ 15 Hearing before the Subcommittee on Health of the Committee on Ways and Means, September 23, 2008, http://goo.gl/Znpjqe 16 Gruber, Jonathan. (2009) “A Win-Win Approach to Financing Health Care Reform,” New England Journal of Medicine, 361(1):4-5. 17 Statement of Professor Jonathan Gruber Before the Senate Finance Committee, July 31, 2008, http://goo.gl/0Bm5Tb 18 Hearing before the Subcommittee on Health of the Committee on Ways and Means, September 23, 2008, http://goo.gl/WYzzSW 19 “Health Politics: Continuing the Employer Tax Exclusion Debate,” New America Foundation, June 2010; http://goo.gl/ivZIIh 20 “Tax Reform and Health Insurance,” American Enterprise Institute, June 2005; http://goo.gl/JZE0Dj 21 Janicki, Hubert. “Employment-Based Health Insurance: 2010,” Census Bureau, February 2013, page 1; http://goo.gl/pm40LV 22 Burtless, Gary, and Sveta Milusheva. (2013) “Research Summary: Effects of Employer-Sponsored Health Insurance Costs on Social Security Taxable Wages,” Social
Security Bulletin, 73(1); http://goo.gl/dxlp6Q 23 Burtless, Gary, and Sveta Milusheva. (2013) “Research Summary: Effects of Employer-Sponsored Health Insurance Costs on Social Security Taxable Wages,” Social
Security Bulletin, 73(1); http://goo.gl/dxlp6Q 24 Burtless, Gary, and Sveta Milusheva. (2013) “Research Summary: Effects of Employer-Sponsored Health Insurance Costs on Social Security Taxable Wages,” Social
Security Bulletin, 73(1); http://goo.gl/dxlp6Q 25 Burtless, Gary, and Sveta Milusheva. (2013) “Research Summary: Effects of Employer-Sponsored Health Insurance Costs on Social Security Taxable Wages,” Social
Security Bulletin, 73(1); http://goo.gl/dxlp6Q 26 Gruber, Jonathan and Brigitte Madrian. “Health Insurance, Labor Supply, and Job Mobility: A Critical Review of the Literature,” Prepared for the Research Agenda
Setting Conference held at the University of Michigan, July 8-10, 2001; http://goo.gl/N2uS3m , page 14. 27 Gruber, Jonathan and Brigitte Madrian. “Health Insurance, Labor Supply, and Job Mobility: A Critical Review of the Literature,” Prepared for the Research Agenda
Setting Conference held at the University of Michigan, July 8-10, 2001; http://goo.gl/5jZcVu page 35. 28 Gruber, Jonathan and Brigitte Madrian. “Health Insurance, Labor Supply, and Job Mobility: A Critical Review of the Literature,” Prepared for the Research Agenda
Setting Conference held at the University of Michigan, July 8-10, 2001; http://goo.gl/5jZcVu , page 23. 29 Schuyler, Michael, and Stephen J. Entin. “Case Study #6: The Exclusion for Employer Provided Health Insurance,” Tax Foundation, August 5, 2013; http://goo.gl/kR51GJ 30 “Restoring America’s Future,” Bipartisan Policy Center, November 2010; http://goo.gl/XoP0Q4 31 The National Commission on Fiscal Responsibility and Reform, “The Moment of Truth,” December 2010; http://goo.gl/XoP0Q4 P 31. 32 The National Commission on Fiscal Responsibility and Reform, “The Moment of Truth,” December 2010; http://goo.gl/XoP0Q4 P 36. 33 “Restoring America’s Future,” Bipartisan Policy Center, November 2010; http://goo.gl/hQOxGb 34 “The Patient Choice, Affordability, Responsibility, and Empowerment Act: A Legislative Proposal,” January 2014; http://goo.gl/8BEoIz 35 Immediate family includes the taxpayer, taxpayer’s spouse, any dependents, and any child under age 27. The deductibility of long-term care insurance premiums is
capped based on age. 36 “General Explanation of the Tax Reform Act of 1986 (H.R. 3838, 99th Congress; Public Law 99-514),” Prepared by the Staff of the Joint Committee on Taxation, May 4,
1987, JCS-10-87, pages 815-816; http://www.jct.gov/jcs-10-87.pdf. 37 “Tax Expenditures: Compendium of Background Material on Individual Provisions,” Congressional Research Service, December 2012, page 859; http://goo.gl/VOGctB 38 Joint Committee on Taxation, “Estimates of Federal Tax Expenditures for Fiscal Years 2014-2018,” August 5, 2014, JCX-97-14, page 31, http://goo.gl/Au28Z6 39 Internal Revenue Service, Statistics of Income, Table 1.4 – All Returns: Sources of Income, Adjustments, and Tax Items, Tax Year 2012. 40 Internal Revenue Service, Statistics of Income, Table 1.4 – All Returns: Sources of Income, Adjustments, and Tax Items, Tax Year 2012. 41 Heim, Bradley, and Ithai Lurie. (2010) “The effect of self-employed health insurance subsidies on self-employment,” Journal of Public Economics, 94(11-12): 995-1007. 42 Selden, Thomas. (2009) “The Impact of Increased Tax Subsidies on the Insurance Coverage of Self-Employed Families: Evidence from the 1996-2004 Medical
Expenditure Panel Survey,” The Journal of Human Resources, 44(1):115-139. 43 Gruber, Jonathan, and James Poterba. (1994) “Tax Incentives and the Decision to Purchase Health Insurance: Evidence from the Self-Employed,” The Quarterly Journal
of Economics, 109(3):701-733. 44 “Tax Expenditures: Compendium of Background Material on Individual Provisions,” Congressional Research Service, December 2012; http://goo.gl/qkulXQ . 45 Joint Committee on Taxation, “Estimates of Federal Tax Expenditures for Fiscal Years 2014-2018,” August 5, 2014, JCX-97-14, page 30; https://www.jct.gov/publications.
html?func=startdown&id=4663. 46 “The Tax Break-Down: Cafeteria Plans and Flexible Spending Accounts,” The Committee for a Responsible Federal Budget, September 12, 2013; http://goo.gl/2GxEkV 47 “Who Can Sponsor or Participate in a Cafeteria Plan?” myCafeteriaplan.com, http://goo.gl/VuI4XO 48 Burt, Bill, “Cafeteria plans provide health care savings,” Bankrate, http://goo.gl/VzoBm5 49 Gruber, Jonathan, “The tax exclusion for employer-sponsored health insurance,” National Tax Journal, June 2011, 64 (2, Part 2) 511-530, http://goo.gl/ddpr46 50 For more information on price transparency of health insurance, see section on employer sponsored health insurance. 51 Van Horn, Scott, “2014 FSA and HSA Contribution Levels,” Tango, December 9, 2013, http://goo.gl/ErSFeh 52 FSAs also overlap Health Reimbursement Accounts (HRA), and Medical Savings Accounts (MSA). 53 “Spending Account Eligible Expense Guide,” ADP, http://goo.gl/l2uH9h 54 More information on the Child and Dependent Care Tax Credit is available in the section on provisions for children and families. 55 Leftover funds may be forfeited, extended for up to 2.5 months, or rolled over into the next year up to $500. The employer decides which option is allowed. 56 Burt, Bill, “Cafeteria plans provide health care savings,” Bankrate, updated May 23, 2005; http://goo.gl/LfXRVB 57 Total Administrative Services, Inc., “Section 125 Cafeteria Plan,” http://goo.gl/5AvPxX 58 Rapaport, Carol, “Tax-Advantaged Accounts for Health Care Expenses: Side-by-Side Comparison, 2013,” Congressional Research Service, November 8, 2013, http://
goo.gl/Mc4ivw 59 “Tax Expenditures: Compendium of Background Material on Individual Provisions,” Congressional Research Service, December 2012; http://goo.gl/CAvafe

DRAFT
180 | Tax Decoder
60 Borden, Robert, “How to Use Tax-Free Money from Your FSA to Buy Designer Glasses,” Yahoo! Voices, September 18, 2008, http://goo.gl/lDaWWE 61 Borden, Robert, “How to Use Tax-Free Money from Your FSA to Buy Designer Glasses,” Yahoo! Voices, September 18, 2008, http://goo.gl/lDaWWE 62 “The Benefits of Cafeteria Plans,” Entrepreneur, September 14, 2005, http://goo.gl/eDHMP2 63 “The Tax Break-Down: Cafeteria Plans and Flexible Spending Accounts,” The Committee for a Responsible Federal Budget, September 12, 2013; http://goo.gl/H10aV9 64 “The Tax Break-Down: Cafeteria Plans and Flexible Spending Accounts,” The Committee for a Responsible Federal Budget, September 12, 2013; http://goo.gl/H10aV9 65 Conway, Mikka Gee, “Cafeteria Plan in the Crosshairs of Tax Reform?” Sutherland TaxReformLaw.com, September 19, 2013, http://goo.gl/h2P6Pr 66 “The Tax Break-Down: Cafeteria Plans and Flexible Spending Accounts,” The Committee for a Responsible Federal Budget, September 12, 2013; http://goo.gl/HaznJn 67 “The Tax Break-Down: Cafeteria Plans and Flexible Spending Accounts,” The Committee for a Responsible Federal Budget, September 12, 2013; http://goo.gl/HaznJn 68 “New Census Survey Shows Continued Growth in HSA Enrollment,” America’s Health Insurance Plans, July 9, 2014; http://goo.gl/xhsrKr . 69 “High-Deductible Health Plans and Health Savings Accounts: An Empirical Review,” Congressional Research Service, September 22, 2010. A discussion of the medical
expense deduction may be found in this report. 70 According to the IRS, HSA funds may be used for premiums for health care continuation coverage, coverage while receiving unemployment compensation, and for
Medicare and other coverage if the beneficiary is over 65. 71 “2013 Employer Health Benefits Survey,” Kaiser Family Foundation, August 20, 2013; http://goo.gl/g9RWK5 72 Funds may be withdrawn without penalty when an accountholder dies, is disabled, or reaches age 65. 73 FSAs, on the other hand, are owned by an employer, not the beneficiary. 74 Deposits could be made again if the accountholder eventually obtains another HDHP. Rapaport, Carol, “Tax-Advantaged Accounts for Health Care Expenses: Side-
by-Side Comparison, 2013,” Congressional Research Service, November 8, 2013. 75 Landen, Rachel. “Consumers using, but confused about, health savings accounts, surveys find,” Modern Healthcare, July 10, 2014, http://www.modernhealthcare.
com/article/20140710/BLOG/307109995, accessed July 18, 2014. 76 This description is a general outline and is not intended to detail exceptions and nuances that should be evaluated for persons making decisions related to their
specific coverage. 77 The annual limit on out-of-pocket spending in 2014 was $6,350 for self-only plans and $12,700 for family plans. 78 Joint Committee on Taxation, “Estimates of Federal Tax Expenditures for Fiscal Years 2014-2018,” August 5, 2014, JCX-97-14, ; http://goo.gl/Au28Z6 . 79 Joint Committee on Taxation, “Estimates of Federal Tax Expenditures for Fiscal Years 2014-2018,” August 5, 2014, JCX-97-14, http://goo.gl/Au28Z6 . 80 “Health Savings Accounts Exceed $20 Billion in January,” Devenir, February 12, 2014; http://goo.gl/WBLnOp 81 This amount comes from the cost of the tax subsidy in 2014 ($1.6 billion) divided by the approximate number of accounts in 2014 (over 10.7 million). 82 “Health Savings Accounts and Account-Based Health Plans: Research Highlights,” AHIP Center for Policy and Research, July 2012, http://goo.gl/DpIUWs 83 Internal Revenue Service, “Table 1. Individual Income Tax Returns, Tax Year 2010 Preliminary Data: Selected Income and Tax,” Statistics of Income Bulletin, Winter 2012;
page 14. Items, by Size of Adjusted Gross Income 84 Internal Revenue Service, “Table 1. Individual Income Tax Returns, Tax Year 2010 Preliminary Data: Selected Income and Tax,” Statistics of Income Bulletin, Winter 2012;
page 14. Items, by Size of Adjusted Gross Income 85 Tozzi, John. “How Health-Care Costs Gobbled Up Wages,” Bloomberg Businessweek, August 13, 2014. 86 Tozzi, John. “How Health-Care Costs Gobbled Up Wages,” Bloomberg Businessweek, August 13, 2014. 87 Tozzi, John. “How Health-Care Costs Gobbled Up Wages,” Bloomberg Businessweek, August 13, 2014. 88 Alegeus Technologies, “2014 Consumer and Employer Healthcare Benefits Survey,” http://goo.gl/Sj2fB5 89 “Health Savings Accounts Exceed $20 Billion January,” Devenir, February 12, 2014; http://goo.gl/UUEyfh 90 “Most HSA/HDHPs Cover Preventative Treatment on a First-Dollar Basis,” Managed Care, December 2007; http://www.managedcaremag.com/archives/0712/0712.
news_preventive.html. 91 “Most HSAs Receive Contributions in 2013, But Few Max Out,” Employee Benefit Research Institute, June 26, 2014; http://goo.gl/NUL7sH 92 Baicker, Katherine, William Dow, and Jonathan Wolfson. (2007) “Lowering The Barriers To Consumer-Directed Health Care: Responding To Concerns,” Health Affairs
26(5):1328-1332. 93 Baicker, Katherine, William Dow, and Jonathan Wolfson. (2007) “Lowering the Barriers To Consumer-Directed Health Care: Responding To Concerns,” Health Affairs
26(5):1328-1332. 94 “Aetna Healthfund Study Results Highlight More Than a Decade of Helping Employers Save Millions,” Aetna, February 4, 2014; http://goo.gl/iYRraF 95 For example, see Feldman, Leonard, et al. (2013) “Impact of Providing Fee Data on Laboratory Test Ordering: A Controlled Clinical Trial,” JAMA Internal Medicine, 173(10):903-908. 96 Health Maintenance Organization 97 Reddy, Sheila, et al. (2013) “Impact of a High-deductible Health Plan on Outpatient Visits and Associated Diagnostic Tests,” Medical Care, 52(1):86-92. 98 “26 U.S. Code § 833 – Treatment of Blue Cross and Blue Shield Organizations, etc.” Legal Information Institute. http://goo.gl/37JKPX 99 “The Market Structure of the Health Insurance Industry,” Congressional Research Service, December 17, 2010; http://goo.gl/EVyq7W 100 Watson, Elisabeth. “Denial of Exempt Status under Section 501(m): Paratransit Ins. Corp. v. Commissioner; Florida Hosp. Trust v. Commissioner and Nonprofits Ins.
Alliance of California v. United States,” The Tax Lawyer, Vol. 48, No. 2 (Winter 1995), pp. 585-602, American Bar Association. http://goo.gl/yqvMka 101 “General Explanation of the Tax Reform Act of 1986 (H.R. 3838, 99th Congress; Public Law 99-514),” Prepared by the Staff of the Joint Committee on Taxation, May
4, 1987, JCS-10-87; http://goo.gl/LzFbr8 102 “Health Insurance: Comparing Blue Cross and Blue Shield Plans With Commercial Insurers,” U.S. General Accounting Office, July 11, 1986 , available at http://goo.gl/
HcqO7u 103 “General Explanation of the Tax Reform Act of 1986 (H.R. 3838, 99th Congress; Public Law 99-514),” Prepared by the Staff of the Joint Committee on Taxation, May
4, 1987, JCS-10-87; http://goo.gl/q0bhe0 104 “General Explanation of the Tax Reform Act of 1986 (H.R. 3838, 99th Congress; Public Law 99-514),” Prepared by the Staff of the Joint Committee on Taxation, May
4, 1987, JCS-10-87; http://goo.gl/5LWWMV 105 All BCBS plans are subject to federal income taxation, but many plans remain registered as nonprofit under applicable state laws. 106 26 USC 833(c)(3)(v) requires that no part of a qualifying insurer’s (other than a BCBS plan) earnings “inures to the benefit of any private shareholder or individual.”
Some BCBS plans no longer qualify for these benefits because they reorganized after August 16, 1986, which was a limit set by TRA86.107 “General Explanation of the Tax Reform Act of 1986 (H.R. 3838, 99th Congress; Public Law 99-514),” Prepared by the Staff of the Joint Committee on Taxation, May
4, 1987, JCS-10-87, page 590; http://goo.gl/uUygQo 108 “Tax Expenditures Compendium of Background Material on Individual Provisions,” Congressional Research Serive, 2010; http://goo.gl/Dw7ooy 109 “General Explanation of the Tax Reform Act of 1986 (H.R. 3838, 99th Congress; Public Law 99-514),” Prepared by the Staff of the Joint Committee on Taxation, May
4, 1987, JCS-10-87, page 589-590; http://goo.gl/q2sFYz 110 This tax benefit does not allow for the special deduction under calculations for the alternative minimum tax. 111 Joint Committee on Taxation, “Estimates of Federal Tax Expenditures for Fiscal Years 2014-2018,” August 5, 2014, JCX-97-14, page 28; http://goo.gl/Au28Z6 112 Joint Committee on Taxation, “Estimates of Federal Tax Expenditures for Fiscal Years 2014-2018,” August 5, 2014, JCX-97-14, page 28; http://goo.gl/Au28Z6 113 Under the 1996 HIPAA law, this automatic benefit was also extended to health plans organized as nonprofits under state law, but that were not affiliated with Blue
Cross/Blue Shield. 114 As set forth in section 833(c): (i) substantially all the activities of such organization involve the providing of health insurance, (ii) at least 10 percent of the health
insurance provided by such organization is provided to individuals and small groups (not taking into account any Medicare supplemental coverage), (iii) such organization provides continuous full-year open enrollment (including conversions) for individuals and small groups, (iv) such organization’s policies covering individuals provide full coverage of pre-existing conditions of high-risk individuals without a price differential (with a reasonable waiting period), and coverage is provided without regard to age, income, or employment status of individuals under age 65, (v) at least 35 percent of its premiums are determined on a community rated basis, and (vi) no part of its net earnings inures to the benefit of any private shareholder or individual.
115 See 26 USC § 833 116 “General Explanation of the Tax Reform Act of 1986 (H.R. 3838, 99th Congress; Public Law 99-514),” Prepared by the Staff of the Joint Committee on Taxation, May

180 | Tax Decoder Health Care | 181
4, 1987, JCS-10-87; http://goo.gl/1UGv6S 117 “Top 10 Health Insurance Companies by Market Share,” Personal Health Insurance, 2013; http://goo.gl/0Ls24i 118 “Turning the Corner Toward 2014,” Revive Health, 2013; http://goo.gl/WsVrg3 119 “About FEP,” Blue Cross Blue Shield, 2014; http://goo.gl/xhes2P 120 “About Blue Cross Blue Shield Association,” http://goo.gl/g7xN7C 121 “Tax Expenditures: Compendium of Background Material on Individual Provisions,” Congressional Research Service, December 2012, page 339; http://goo.gl/rzZ3tr 122 Executives would benefit from higher pay, while providers would benefit from higher payment rates. “Tax Expenditures: Compendium of Background Material on
Individual Provisions,” Congressional Research Service, December 2012, page 339; http://goo.gl/FctCtx 123 For tax years 2014-2016, taxpayers over age 64 temporarily have a lower threshold. They can deduct unreimbursed medical expenses exceeding 7.5 percent of AGI. 124 Inflation calculators performed using a tool provided by the Bureau of Labor Statistics; http://goo.gl/SLtrTK 125 Senate Finance Committee Report, S. Rep. 1631, 77th Congress, 2nd Session, page 6. 126 “Tax Expenditures: Compendium of Background Material on Individual Provisions,” Congressional Research Service, December 2012; http://goo.gl/O3v34q 127 Lundeen, Andrew, “Obamacare Tax Increases Will Impact Us All,” Tax Foundation, March 5, 2013; http://goo.gl/fFWpQh , accessed February 26, 2014. 128 Joint Committee on Taxation, “Estimates of Federal Tax Expenditures for Fiscal Years 2014-2018,” August 5, 2014, JCX-97-14, page 31; http://goo.gl/AclOnv 129 Joint Committee on Taxation, “Estimates of Federal Tax Expenditures for Fiscal Years 2014-2018,” August 5, 2014, JCX-97-14, page 31; http://goo.gl/rZLAUp 130 In Publication 502, “Medical and Dental Expenses,” the IRS says medical expenses include “the costs of diagnosis, cure, mitigation, treatment, or prevention of
disease, and the costs for treatments affecting any part or function of the body.” 131 “Medical and Dental Expenses,” Publication 502 (2013), Internal revenue Service; http://goo.gl/0tzyUh . 132 Any expenses for disabled dependent care deducted as medical expenses cannot be applied to the dependent child tax credit, and vice versa. 133 Internal Revenue Service, Private Letter Ruling, Num. 200318017, May 2, 2003; http://goo.gl/3xzia7 134 See IRS Publication 502 (2013), Medical and Dental Expenses; http://goo.gl/a3uqEh . 135 “IRS Code Section 213(d) Eligible Medical Expenses,” Utah State University, http://goo.gl/IknjrX . accessed February 27, 2014. 136 “Tax Expenditures: Compendium of Background Material on Individual Provisions,” Congressional Research Service, December 2012, page 863; http://goo.gl/ExwTlF 137 Internal Revenue Service, Statistics of Income, Table 2.1 – Returns with Itemized Deductions: Sources of Income, Adjustments, Itemized Deductions by Type,
Exemptions, and Tax Items, Tax Year 2011. 138 Internal Revenue Service, Statistics of Income, Table 2.1 – Returns with Itemized Deductions: Sources of Income, Adjustments, Itemized Deductions by Type,
Exemptions, and Tax Items, Tax Year 2011. 139 WILLIAM G. HALBY, Petitioner, v. COMMISSIONER OF INTERNAL REVENUE, Respondent. T.C. Memo 2009-204. 140 Cassius L. Peacock, III v. Commissioner. 37 T.C.M. (CCH) 177 (1978) 141 Cassius L. Peacock, III v. Commissioner. 37 T.C.M. (CCH) 177 (1978) 142 IRS Publication 502 (2013), Medical and Dental Expenses; http://goo.gl/vK22QZ . 143 JOHN J. THOENE, PETITIONER, v. COMMISSIONER OF INTERNAL REVENUE, RESPONDENT. JOHN J. THOENE AND HELEN THOENE, PETITIONERS, v.
COMMISSIONER OF INTERNAL REVENUE, RESPONDENT. 33 T.C. 62 (1959). 144 Internal Revenue Service, Revenue Ruling 62-210; http://www.gpo.gov/fdsys/pkg/GOVPUB-T22-f924d71d7b6eebe22fde1d68f358d4f9/pdf/GOVPUB-T22-f924d71d7
b6eebe22fde1d68f358d4f9-2.pdf. 145 Paul F. Dickie v. Commissioner. Paul F. Dickie and Sherry L. Dickie v. Commissioner. 77 T.C.M. 1916 (1999). 146 “John RIACH and Maude M. Riach, his Wife, Appellants, v. William E. FRANK, District Director of Internal Revenue, Appellee,” United States Court of Appeals Ninth
Circuit, April 13, 1962, No. 17530; http://goo.gl/5UeQL4 147 Kaplow, Louis. 1991. “The Income Tax as Insurance: The Casual Loss and Medical Insurance Premiums,” California Law Review, 79(6):1485-1510. 148 “State Economic Impact of the Medical Technology Industry,” Lewin Group, June 7, 2010; http://goo.gl/7WNlzq 149 “State Economic Impact of the Medical Technology Industry,” Lewin Group, June 7, 2010; http://goo.gl/DsrTOr 150 “National Average Wage Index,” Social Security Administration, 2010; http://goo.gl/oe1GSv 151 “Leading Executives from Across the Country Urge Senate to Repeal the Device Tax,” Medical Device Manufacturers Association, November 14, 2012, http://goo.gl/
VBEYYP 152 Ponnuru, Ramesh, “Put Simply, the New Medical-Device Tax Will Steal Jobs,” Star Tribune, January 4, 2012; http://goo.gl/xaXtUe 153 “Selected CBO Publications Related to Health Care Legislation, 2009-2010,” Congressional Budget Office, December 2010, http://goo.gl/HQWHE2 . P 208. 154 Foster, Richard. “Estimated Financial Effects of the ‘Patient Protection and Affordable Care Act,’ As Amended,” Department of Health and Human Services, Centers
for Medicare and Medicaid Services, Office of the Actuary, April 22, 2010; http://goo.gl/c1hpdl 155 “U.S. Medical Innovation At Risk: Fewer New Companies and Therapies Receiving Funding, Says Report,” National Venture Capital Association, October 6, 2011;
http://goo.gl/dLCNZY 156 Herrick, Devon. “The Job-Killing Medical Device Tax,” National Center for Policy Analysis, February 2012; http://goo.gl/GrvX3B 157 Zhong, Han. “Weekly Checkup: Medical Device Excise Tax Claims Its First Victims”, American Action Forum, November 16, 2011. http://goo.gl/TUoIVJ 158 “Stryker Announces Actions to Drive Over $100 million In Annual Productivity Gains,” Stryker Corporation, Press Release, November 10, 2011. http://goo.gl/oq6O67 159 “Stryker Announces Actions to Drive Over $100 million In Annual Productivity Gains,” Stryker Corporation, Press Release, November 10, 2011. http://goo.gl/6ptcsm 160 Cost estimate for H.R. 436, the Protect Medical Innovation Act of 2012, Congressional Budget Office, June 4, 2012, http://www.cbo.gov/sites/default/files/hr436.pdf 161 Pavlich, Katie, “Democrat Controlled Senate Votes to Repeal ObamaCare Medical Device Tax,” Townhall, March 22, 2013; http://goo.gl/CRS9Mq 162 “About NORD,” The National Organization for Rare Disorders, http://goo.gl/CYwKft 163 Guenther, Gary, “Federal Taxation of the Drug Industry and Its Effects on New Drug Development,” Congressional Research Service, March 18, 2009, http://goo.gl/
suTWsj 164 Guenther, Gary, “Federal Taxation of the Drug Industry and Its Effects on New Drug Development,” Congressional Research Service, March 18, 2009, http://goo.gl/
fSZIq9 165 “Tax Expenditures: Compendium of Background Material on Individual Provisions,” Congressional Research Service, December 2012; http://goo.gl/YqFxij 166 Joint Committee on Taxation, “Estimates of Federal Tax Expenditures for Fiscal Years 2014-2018,” August 5, 2014, JCX-97-14, page 31; http://goo.gl/Au28Z6 . 167 Valverde, Ana M., Shelby D. Reed, and Kevin A. Schulman, “Proposed ‘Grant-And-Access’ Program With Price Caps Could Stimulate Development Of Drugs For Very
Rare Diseases,” Health Affairs, 2012; http://goo.gl/p1hY04 168 “Tax Expenditures: Compendium of Background Material on Individual Provisions,” Congressional Research Service, December 2012, page 885; http://goo.gl/9cRSPS
. The Act also created a small research grant program. 169 Marples, Donald. “The Orphan Drug Tax Credit,” Congressional Research Service, IN10086, June 16, 2014. 170 “Orphan Drug Report 2013,” EvaluatePharma, April 2013. 171 “Rare Diseases, A Report on Orphan Drugs in the Pipeline 2013 Report,” PhRMA, 2013; http://goo.gl/rVSUfE 172 Meekings, Kirna, and John Arrowsmith. (2012) “Orphan drug development: an economically viable strategy for biopharma R&D,” Drug Discovery Today, 17(13/14):
660-664 173 Meekings, Kirna, and John Arrowsmith. (2012) “Orphan drug development: an economically viable strategy for biopharma R&D,” Drug Discovery Today, 17(13/14):
660-664 174 Meekings, Kirna, and John Arrowsmith. (2012) “Orphan drug development: an economically viable strategy for biopharma R&D,” Drug Discovery Today, 17(13/14):
660-664 175 Meekings, Kirna, and John Arrowsmith. (2012) “Orphan drug development: an economically viable strategy for biopharma R&D,” Drug Discovery Today, 17(13/14):
660-664 176 Valverde, Ana M., Shelby D. Reed, and Kevin A. Schulman, “Proposed ‘Grant-And-Access’ Program With Price Caps Could Stimulate Development Of Drugs For Very
Rare Diseases,” Health Affairs, 2012; http://goo.gl/jsRscv 177 Meekings, Kirna, and John Arrowsmith. (2012) “Orphan drug development: an economically viable strategy for biopharma R&D,” Drug Discovery Today, 17(13/14):
660-664 178 Herper, Matthew. “The World’s Most Expensive Drugs,” Forbes.com, February 22, 2010; http://goo.gl/N6qbHn

DRAFT
182 | Tax Decoder
179 “Tax Expenditures: Compendium of Background Material on Individual Provisions,” Congressional Research Service, December 2012; http://goo.gl/6aVBWy 180 “The Top 25 Best-Selling Drugs of 2013,” Genetic Engineering and Biotechnology News, March 3, 2014; http://goo.gl/gnOXbC 181 Agres, Ted. “Orphans No Longer,” Drug Discovery & Development, January 9, 2014; http://goo.gl/vuw8QR 182 Roy, Avik. “Stifling New Cures: The True Cost of Lengthy Clinical Drug Trials,” Manhattan Institute for Policy Research, April 5, 2012; http://goo.gl/pFkMGt 183 Meekings, Kirna, and John Arrowsmith. (2012) “Orphan drug development: an economically viable strategy for biopharma R&D,” Drug Discovery Today, 17(13/14):
660-664 184 “The Science of Hope: the need, the challenges and three proven strategies for successful orphan drug development,” Premier Research, 2013; http://goo.gl/d0n1S1 185 Marples, Donald. “The Orphan Drug Tax Credit,” Congressional Research Service, IN10086, June 16, 2014. 186 Agres, Ted. “Orphans No Longer,” Drug Discovery & Development, January 9, 2014; http://goo.gl/3lhR8Q 187 Rin-Laures, Li-Hsien, and Diane Janofsky. (1991) “Recent Developments Concerning the Orphan Drug Act,” Harvard Journal of Law & Technology, Vol. 4 (Spring):
269-297. 188 “Information on the Orphan Products Grant Program,” U.S. Food and Drug Administration, February 7, 2014; http://goo.gl/szFbuV 189 “Information on the Orphan Products Grant Program,” U.S. Food and Drug Administration, updated February 7, 2014; http://goo.gl/3piqTO 190 “Information on the Orphan Products Grant Program,” U.S. Food and Drug Administration, updated February 7, 2014; http://goo.gl/xB3n4C 191 “FDA at Rare Disease Day/February 28, 2011,” U.S. Food and Drug Administration, http://goo.gl/NMerBD 192 “Rare Disease Research and Therapeutics,” National Institutes of Health, National Center for Advancing Translational Sciences, http://goo.gl/tSBnH2 193 National Institutes of Health, “Estimates of Funding for Various Research, Condition, and Disease Categories (RCDC),” table published March 7, 2014; http://goo.gl/
KLnhie 194 Ed. Field, Marilyn J. and Thomas F. Boat, “Rare Diseases and Orphan Products: Accelerating Research and Development,” Institute of Medicine, 2010. 195 See Section 740 of the Agriculture, Rural Development, Food and Drug Administration, and Related Agencies Appropriation Act of 2010, P.L. 111-80. 196 National Institutes of Health, “Estimates of Funding for Various Research, Condition, and Disease Categories (RCDC),” table published March 7, 2014; http://goo.gl/
KIJ71D 197 Valverde, Ana M., Shelby D. Reed, and Kevin A. Schulman, “Proposed ‘Grant-And-Access’ Program With Price Caps Could Stimulate Development Of Drugs For Very
Rare Diseases,” Health Affairs, 2012; http://goo.gl/bk9kSh 198 Richardson, David. “The Orphan Drug Tax Credit: An Inadequate Response to an Ill-Defined Problem,” The American Journal of Tax Policy, volume 6: 156. 199 Richardson, David. “The Orphan Drug Tax Credit: An Inadequate Response to an Ill-Defined Problem,” The American Journal of Tax Policy, volume 6: 162. 200 “Nonprofit Hospitals and the Provision of Community Benefits,” Congressional Budget Office, December 2006; http://goo.gl/JUIR8e 201 Bureau of Labor Statistics, CPI Inflation Calculator, http://goo.gl/jcxAOh 202 Joint Committee on Taxation, “Estimates of Federal Tax Expenditures for Fiscal Years 2014-2018,” August 5, 2014, JCX-97-14, page 31; http://goo.gl/kYI7l1

182 | Tax Decoder Housing | 183
HOUSING

DRAFT
184 | Tax Decoder
Housing
Pursuing the “American Dream” has been a favorite pastime since the term was first coined in 1931 by James Truslow Adams. Today, the federal government assists in putting nearly every American in his or her own home, costing more than $135 billion annually through the tax code. This is certainly an admirable goal, but one that is now drowning Uncle Sam in
debt, the cost of which is outweighing the benefits.
should be eliminated or otherwise scaled back, and federal direct spending programs should also be streamlined to enhance their effectiveness.
The tax code not only subsidizes homeownership, but provides numerous credits and subsidies for other housing needs, including the development of low-income property and other rental housing expenses. In some cases, like the Low-Income Housing Tax Credit, the federal subsidies are directed to wealthy investors and even multi-million dollar companies such as Google and Verizon.
Many of the nation’s tax policies have been on the books for decades, but have had limited impact on homeownership. The homeownership rate in 1965 was about 63 percent.1 Today, the rate is about 65 percent.2 Wealthy households – those who would likely purchase housing even without a tax benefit – get the biggest bang for the buck. Meanwhile, affordable housing needs have hit record levels, even when dozens of federal tax and grant initiatives have targeted the issue.3
Federal housing policy needs to be readdressed, beginning with a “start-from-scratch” approach to these housing tax incentives. Most of the expenditures examined in this section
Duplication of Housing Programs Overwhelmingly, tax programs for both single-family and rental housing have failed to prove very successful. None have
affirmatively increased homeownership or the supply of affordable rental housing, but those are not their only problems. They are contributing to a massive patchwork approach to housing that Congress has followed over the last century. Including these tax carveouts, there are now 150 federal programs providing housing assistance, and they span 13 different agencies.4 All told, these tax provisions and direct spending programs cost taxpayers approximately $170 billion every year.5 The current housing policy is wasteful. Both single-family and rental housing programs, including the tax provisions, should be streamlined and significantly pared down to achieve actual goals of helping families in need while responsibly spending taxpayer funds.
Housing (in millions) FY 2014 FY 2014 - FY 2018Exclusion of Mortgage Indebtedness Forgiveness $1,000 $5,000
Mortgage Interest Deduction $67,800 $405,200
Property Tax Deduction $31,900 $182,100
Mortgage Insurance Deduction $600 $4,490
Parsonage Housing Allowance Exclusion $700 $3,900
Capital Gains Exclusion for Owner-Occupied Housing $24,100 $149,300
Jonas Bonus-Tax Free Temporary Rental Income $10 $50
Low-Income Housing Tax Credit $7,100 $40,500
Depreciation of Rental Housing Income $4,300 $23,700
Exemption from Passive Loss Rules $9,800 $54,900
Bonds for Owner-Occupied and Rental Housing $2,200 $11,700
Total $149,510 $880,840
Rental Programs
Affordable rental housing is especially important for serving the needs of millions of families nationwide. Instead of formulating and executing rental assistance through a
handful of key programs, Congress has created 45 federal programs total of with the primary purpose of assisting rental tenants and financing multifamily development.
The primary tax expenditures – the Low Income Housing Tax Credit (LIHTC), tax-exempt rental housing bonds, and

184 | Tax Decoder Housing | 185
accelerated depreciation for rental housing—overlap one another and other federal programs. For example, LIHTC and the bonds programs are very duplicative of one another, as they contain similar goals and distribution and income restriction methods. In many cases, funding from each of these programs is used to construct apartment buildings that have only a fraction of rent-restricted units. Accelerated depreciation for rental housing – a special tax expenditure valued at $4.4 billion in 20146 – also duplicates this other special assistance Congress has allocated toward rental housing through the tax code.
Unfortunately, while each of these tax provisions has overlapping and poorly targeted goals, a number of other federal programs complicate the picture. Each rental housing program has its own allocation and oversight methods that increase the cost of administering aid to needy families.
For example, the Department of Housing and Urban Development (HUD) has the Community Development Block Grant and HOME Investment Partnerships Program, which together provide flexible streams of $4 billion that states and cities can use to meet their single-family and multifamily housing needs.7 CDBG is intended for low to moderate-income households (though the measurements of that standard are weak). HOME is an annual block grant specifically for low-income households.
HUD also operates programs with very specific subsidies to tenants. The Section 8 Housing Choice Voucher Program and Project-Based Rental Assistance programs provide about $27 billion to 2.2 million families every year.8 And, the agency continues to fund about 1.2 million public housing units at the annual cost of about $5.8 billion.9
The Department of Agriculture also has a sizable footprint in affordable rental housing. The Section 521 Rural Rental Assistance payments program, for example, essentially
duplicates HUD’s Section 8 project-based program, in which the agency pays part of a tenant’s rent. Tenants receive almost $1 billion from the Section 521 program.10 Likewise, a Rural Community Development Initiative Grant program (approximately $6.5 million) mimics the work of HUD’s CDBG program.11 USDA also provides 50-year loans at a fixed 1 percent interest rate for rural rental housing and cooperative housing.
The Federal Home Loan Bank System – a government-sponsored enterprise – also offers a special grant and loan program for multifamily housing. Program obligations for 2010 were $216 million.12
Single Family Assistance
Equally numerous are federal programs and tax expenditures with the primary goal of assisting homeowners.
A number of tax provisions for homeowners essentially duplicate one another. The mortgage interest deduction, capital gains tax exclusion, and deduction for property taxes all have the impact of decreasing the cost of homeownership. As described elsewhere in this report, these benefits inure largely to those with high incomes and do little to stimulate additional housing purchases.
Outside of the tax code, dozens of federal programs target homeownership, again mostly at HUD and USDA. The Federal Housing Administration (FHA) provides insurance for homeowners and operates a reverse mortgage program for the elderly. (In 2013, FHA received a taxpayer bailout of $1.7 billion.13) HUD also gives local governments the chance to purchase certain HUD-owned homes for $1 each to make them available for low- to moderate-income families.14 NeighborWorks America is a program that makes funds available to nonprofits for purposes of counseling
There are at least 160 federal programs and tax expenditures at 20 different federal agencies, costing taxpayers at least $170 billion in FY 2010, to provide assistance and encourage affordable housing, according to the GAO.

DRAFT
186 | Tax Decoder
Exclusion of Mortgage Indebtedness Forgiveness Like many other provisions in the code, the income exclusion of mortgage indebtedness largely benefits the well-off
with a dollar-for-dollar reduction of income subject to federal taxes. Since 2007, homeowners who have any part of their mortgage debt forgiven have been able to exclude those funds
from their income. Though the tax provision was intended to be temporary, Congress has renewed it three times and has not yet signaled an intention of eliminating the provision. The current expiration date was December 31, 2013, but the provision could be extended retroactively.18
Forgiven debt is generally considered income for the pur-poses of taxation since elimination of debt increases one’s net worth.19 Income exclusion has only been available for situations of severe distress, including bankruptcy and insolvency.
With few limitations on who qualifies for the de facto as-sistance from Uncle Sam, the income exclusion may be help-ing people who are able to cope with foreclosure. “The bene-fits…will be concentrated among middle- and higher-income taxpayers,” writes the Congressional Research Service.20
The exclusion is available for forgiven mortgage debt up to $2 million.21 Qualifying debt must have been used in the purchase, construction, or improvement of a principal resi-dence. Second liens may also qualify for the exclusion as long as funds meet the same conditions of qualifying debt. There do not appear to be any inspector general audits to determine whether forgiven debt is actually meeting these qualifications.
Consumers may have debt forgiven through refinancing, short sale, or foreclosure. Through a refinancing, sometimes a lender may agree to write off a portion of debt remaining on the previous mortgage. This forgiven debt must also be deducted from the taxpayer’s basis in the principal residence, which can have implications for the capital gains exclusion. In a short sale, the lender agrees to a sale of the house even though the fair market value of the home is lower than the mortgage debt. After the sale, a lender forgives the balance not covered by the sale. In the case of a foreclosure, the borrower’s home is turned over to the lender. Only the amount of debt beyond the fair market value of the home is potentially forgiven and excluded from income.
The exclusion is also limited based on state law regarding recourse. Eligible states are those in which mortgages are made with recourse available to the lender. Under recourse, a lender can pursue the homeowner if the mortgage defaults.
The estimated cost of the exclusion from FY 2008 to FY 2018 is $1.7 billion.22 However, this assumes the provision expires and is not extended. According to CRS, the provision results in at least $1 billion in revenue loss each year,23 and assuming extension, could reach $5 billion over five years.
No specific data is available on who claims the exclusion for cancellation of mortgage debt. However, IRS statistics show in 2011 over $7.5 billion cancelled debt was excluded.24 Of that, 36 percent went to taxpayers making more than $100,000 a year, an average exclusion of $27,000.25 About 10 percent went to 21,987 millionaires, an average exclusion of nearly $60,500 each.26 Additionally, about 30 percent of the exclusion went to those with no adjusted gross income.27
Supporters of the provision claim it helps ease the burden on homeowners who experience the turmoil of potentially losing their home. A committee report explaining the original version of the provision said, “[I]t is inappropriate to treat discharges of acquisition indebtedness as income.”28
One of the most problematic aspects of the exclusion is the potential moral hazard. Instead of working through their debt, such as an underwater mortgage, some taxpayers may be incentivized to walk away from their obligations. At the same time, allowing some homeowners to exclude their income raises an equity issue. Taxpayers who may have worked hard to save for a home and make responsible payments are now subsidizing the debt of others.
Americans are among the most generous people in the world, and in a financial crisis seek to do everything possible to alleviate the burden of other families. However, to restore responsibility and wise decision-making to the marketplace, the federal government should no longer allow forgiven mortgage debt to be excluded from income except in cases of bankruptcy and insolvency.
homeowners. One HUD program even overlaps the rural focus of USDA. The Housing Assistance Council is a loan fund intended to “improve housing conditions for low-income rural residents.”15
USDA offers a “Mutual Self-Help Housing Loan Program” to fund loans for needy households who agree to put sweat equity into the construction of homes of other area families participating in the program.16 Another USDA program provides grants to assist nonprofit organizations to carry out
self-help housing programs.17 Many programs mentioned above for rental assistance
also have (or could have) a substantial role in encouraging or assisting homeowners. For example, CDBG and HOME funds can be used for both categories.
While most of these programs or tax expenditures were started with noble intentions, they are now a mish-mash of funding streams that are poorly coordinated and targeted.
Each of the housing tax expenditures in this report has signif-icant overlap with all of these other direct spending programs.

186 | Tax Decoder Housing | 187
Mortgage Interest and Property Tax Deductions One of the most expensive and widely known tax expenditures is purported to help the everyman, but instead
overwhelmingly benefits the well-off at the expensive of every taxpayer: the mortgage interest deduction, or the MID. Homeowners have long been able to deduct the cost of mortgage interest for their primary residences. The MID also
extends beyond what most people might think of as “home.” They can also deduct interest spent on vacation residences, such a winter cabins or condos. Mortgage interest for a yacht may also qualify, if the owner spends at least two weeks on the yacht per year. The boat must also be equipped with a toilet, sleeping area (berth), and a mini-kitchen.
Qualifying mortgage indebtedness may not exceed $1 million. The IRS also gives the wealthy another subsidy by allowing interest on home-equity lines of credit (HELOC) to be deducted on debt up to $100,000. There are no limitations on what HELOC purchases are eligible. In many cases, points (often called “prepaid interest”) can also be deducted in the year they are paid.29
The deduction has faced scrutiny for decades, but has largely escaped unscathed from any substantial changes. Voices of the homebuilding industry have supported the tax expenditure as an integral part of the economy. It is a “middle-class tax provision that makes it possible for many families to achieve homeownership,” the National Association of Homebuilders has said.30 Many in the industry state eliminating or scaling back the MID could deal a blow to the economy. One homebuilder has gone so far as to say elimination could ultimately end homeownership altogether, painting a doomsday picture of the industry. “There would be no incentive to be homeowners. We would have a whole nation of renters,” said Alan Anderson, executive vice president of the Home Builders Association Manatee-Sarasota.31
Many economists and scholars disagree with how the industry has framed discussion of the MID. The tax benefit has
likely not achieved its goal of increasing the rate and affordability of homeownership. In a Zillow.com survey of economists and experts in real estate and investment, 60 percent of respondents agreed the MID should ultimately be eliminated.32
A similar but less discussed tax provision for homeowners is the deduction of state and local property taxes. Homeowners who itemize (rather than utilize their standard deduction) are able to reduce their adjusted gross income with their state and local property taxes. (Any tax levied specifically for local improvements, however, is not deductible.)
Both of these provisions fail to achieve any substantive public policy goals and should be scaled down and/or eliminated over time.
History
“I’m pretty sure nobody intended it as a subsidy for the great American dream,” said one tax expert.33 The mortgage interest deduction did not evolve directly out of Congress’ intention to incentivize homeownership. Rather, when the federal government first started collecting income taxes in 1913, a deduction for interest payments on debt was included.34
The primary holders of debt at the time were businesses and
Lavish yachts are considered second homes for purposes of the tax code and owners of these luxury liners can deduct their mortgage interest expenses.

DRAFT
188 | Tax Decoder
farmers, who had taken out loans as part of income-generating activities, whose expenses are generally deductible.35 House-holds, on the other hand, carried little interest-bearing debt.36
As the housing industry matured, deductibility of mortgage interest went unchanged for decades, over the span of 11 presidents. No limits had been placed on either the size or number of mortgages a taxpayer could deduct. The Tax Reform Act of 1986 –a major overhaul of the tax code – limited both aspects of the deduction. A year later, Congress reformed several other components of the MID, and it has largely remained unchanged since.
The property tax deduction has similar origins. Congress’ first version of the modern tax code – written in 1913 – allowed most taxes paid to be deducted, including federal and state income tax and state and local property taxes. Even excise taxes on cigarettes, gasoline, and alcohol were all deductible at one point. Though the list of taxes eligible for deduction has been trimmed back over the last 100 years, property taxes remain, without caps on income or associated home prices.
Cost and Usage
As the second largest tax expenditure, the estimated cost of the mortgage interest deduction in 2014 was $67.8 billion.37 From 2014-2018, the MID will cost taxpayers $405.2 billion.38
Spending through this provision is second only to the exclusion of employer contributions for health insurance.39
There are approximately 76 million owner-occupied homes nationwide.40 In 2012, 34.1 million homeowners filed for the mortgage interest deduction.41
Most of the benefits from MID accrue to the high-income class, those in the top 20 percent of earners.42 Filers with annual incomes over $100,000 account for 55 percent of the claims and take 77 percent of the benefits.43 The average benefit for this income class is $2,806.44 In contrast, the average benefit for a household earning less than $100,000 is $1,010.45
For those with incomes over $500,000 (about 620,000 filers) who claim the MID, the average deduction is about $24,720, reducing federal revenue by roughly $8,000-$9,000 each.46
Usage of the property tax deduction mirrors that of MID, both largely driven by home value. Total lost federal revenue is estimated to be $31 billion in FY 2014 and $182.1 billion from FY 2014 through FY 2018.47 The tax expenditure is directed mostly to people with high incomes, who face
higher marginal tax rates and are more likely to itemize. Over $18 billion in direct benefits – 75 percent of the total lost revenue – go to taxpayers with incomes over $100,000.48 An average benefit for a household making over $200,000 is $1,619, nearly eight times the benefit of a household making $30,000 (whose average benefit is about $198).49
The total combined benefit of both the MID and property tax deduction for the highest-earning taxpayers is significantly higher than the average. For taxpayers in the highest quintile of income, these special tax provisions increase their after-tax income by 1.4 percent.50 A taxpayer earning about the national median sees an after-tax increase of only 0.3 percent.51
Analysis
Since both the MID and the property tax deductions have remained in the tax code for over 100 years, one would assume data surrounding the expenditure shows it achieving its key goal of increasing home ownership. The impact of the MID has been more scrutinized than the property tax deduction, though the conclusions from one can arguably be applied to the other since they function similarly. Unfortunately, these tax breaks are doing little to promote homeownership. They are simply keeping Uncle Sam shackled to the weight of debt by unnecessarily reducing tax revenue.
A number of academic studies analyzing the MID’s benefits have concluded it has failed. “Ask any economist that does not speak for the home-building or real estate industry and he or she will tell you that the home mortgage interest deduction has little economic justification,” wrote the Tax Foundation’s Gerald Prante of the MID’s impact.52
First, as previously noted, most of the benefit of the MID goes to households making over $100,000. A CBO analysis succinctly summarized this lack of progressivity in the provision: “The largest tax expenditures [for the MID] accrue to those households with the highest incomes as they are more likely to own homes, are more likely to itemize deductions, face higher tax rates, and have larger mortgages.”53 A separate review of the MID noted, “It is un-likely that a housing subsidy program that gave far larger amounts to high income compared with low income households would be enacted if it were proposed as a direct expenditure program.”54
The mortgage interest deduction has likely not increased homeownership. Writes one tax expert, “Substantial empirical research over the last 30 years shows that the MID has ‘almost no
FILERS WITH ANNUAL INCOMES OVER $100,000 ACCOUNT FOR 55% OF THE CLAIMS AND TAKE 77% OF THE BENEFITS.

188 | Tax Decoder Housing | 189
effect on the homeownership rate.’”55 One reason for the lack of efficacy is the tax program does not address the most difficult step to owning a home: saving for a downpayment and closing costs.56 Other federal programs do benefit first-time buyers who may face this difficulty. Financial innovation, rather than the MID, was a key driver in increased homeownership over the last decade, according to some economists.57
Homebuyers likely would have continued with their purchases anyway. An Urban Institute panel of experts agreed: “MID as currently structured does not further the goal of increasing homeownership among the middle class, but instead rewards affluent households who would have bought homes anyway.”58
For low-income borrowers, the MID offers little hope or promise towards reaching the American Dream. First off, utilizing the tax provision requires filers to itemize deductions. Many lower-income filers do not itemize deductions because itemized deductions do not outweigh the benefit of the standard deduction.59 Secondly, the MID may actually work against first-time buyers. House prices may actually be several percentage points higher than they would be if MID did not exist.60 (This latter point necessitates Congress be wary of eliminating the deduction all at once because of the adverse impact doing so would have on house prices.)
The income classes that benefit most from MID – those over $50,000 annually – already have a homeownership rate of 80.5 percent, significantly higher than the national average of 66.2 percent.61 For households with incomes less than $50,000, the homeownership rate is 53.4 percent.62 This lower income group claims about 3 percent of the total benefit of MID.63
To the degree MID does lower cost of owning a home for low-income borrowers, this federal policy may actually harm them. Even if MID were changed to a credit as some have argued, “Extensive research has shown that homeownership is not the most reliable means of building wealth for low-income families, especially those with unreliable incomes and few other investments,” writes Bloomberg Businessweek.64
Many supporters of the MID have pointed to the benefits of increased homeownership as a main reason to continue the policy. For example, they say homeownership has been
correlated with positive impacts on neighborhoods, children’s educational performance, and crime levels.65 Studies have not been able to show a causal relationship, so doubt surrounds whether increasing homeownership would actually promote these changes.66 Additionally, a high rate of homeownership can come with negative consequences. “Rises in home ownership in a U.S. state are followed by substantial increases in the unemployment rate in the state, a fall in the mobility of its workers, a rise in commuting times, and a drop in the rate of new business formation,” found one vast analysis of historical data in the U.S.67 The results hold true for various periods of American economic history.
Negative consequences of the MID also reach into other sectors of the economy, potentially dragging down overall productivity. By decreasing the cost of housing versus other investments, the MID could over-incentivize people to place capital in housing over other sectors.68 One economist quipped the MID’s distortionary impact essentially tells people, “Don’t build a factory, build a mansion.”69 The Congressional Budget Office (CBO) states, “Between 1981 and 2007, about 38 percent of net private domestic investment went into owner-occupied housing.”70 If the distortion caused by the MID were removed, GDP would increase slightly in the long run, according to researchers at Rice University.71 In addition, investment in rental housing would increase, and overall asset values in nonhousing sectors would increase by 2 percent.72
Since it lowers the after-tax cost of owning a home, the property tax deduction likely has similar dubious economic effects as the MID. In addition, the provision provides a greater federal benefit to people living in states and localities with higher property taxes.73 As property taxes increase, the value of the deduction increases, and more federal revenue is lost.
Questionable Spending Through MID
The MID clearly has a limited impact on homeownership of what most people think of as houses, but the tax benefit
Mobile recreational vehicles, such as this high end model, are considered homes by the IRS and owners may
deduct their mortgage interest payments.

DRAFT
190 | Tax Decoder
can also extend to assets most would consider to be far-fetched from any notion of “homeownership”: vacation homes, yachts, and recreational vehicles (RVs), all financed by mortgages. In most of these cases, owners are not primarily living in their boat or camper. Only 100,000 people claim to live in a boat, RV, or van every year.74 Rather, the tax code is subsidizing pleasure, not homeownership. Often, the benefit is used as a tax shelter.
One man bought a 47-foot yacht, financed it with a mortgage and claimed it as a second home.75 He was able to “reduce his income by $19,200, the amount he pays in interest on the loan.”76 The yacht enables him to “lower his tax bracket from 36 percent to 32 percent, saving [him] a bundle of money.”77 The National Marine Bankers’ Association notes that not using the deduction for a boat means leaving free money on the table. “If you’re paying cash for your boat, you’re probably paying too much,” the association wrote in a brochure.78
To qualify for the deduction, a boat or RV must include a “sleeping platform, toilet and cooking facilities.”79 The owner must also stay overnight for at least 14 nights per year.
Nearly every type of RV, including “motorhomes, van campers, travel trailers, truck campers and even some folding camping trailers,” has the proper amenities.80
Not surprisingly, the ability to deduct interest payments for a second home may especially benefit one group of insiders – members of congressional tax-writing committees. In July 2013, just under half of their members had claimed second homes on their personal financial reports.81 In some circles, the MID has reportedly earned the name “The Congressmen’s rule” because some lawmakers purchase second homes in the Washington, D.C.-area.82
Census data shows most second homes appear to be not for business, but for luxury and vacation. Second homes are concen-trated in popular vacation spots such as the Rocky Mountains, the Boundary Waters-area of Minnesota, and much of Florida.83
Home equity line of credit (HELOC) borrowers also benefit
wildly from the MID. Using their home as collateral to gain a line of credit through an HELOC, borrowers can deduct the interest paid on debt of up to $100,000. Eligible expenses are not limited. Borrowers can “do whatever [they] want with a home equity loan or HELOC: finance [their] son’s education, take an extravagant trip, or buy a big screen television. Some people use it to consolidate debts that they’ve racked up on various credit cards.”84 In these cases, taxpayers are indirectly subsidizing and encouraging personal debt and potentially ir-responsible purchases.
Recommendation
The mortgage interest deduction has few clear positive impacts on the economy. While it is purported to increase homeownership, little evidence supports such a conclusion. Still, others argue it decreases the cost of owning a home.85
Yet, other economic theory suggests the MID encourages people to spend more on a home than they otherwise would.86
Overall economic growth is hindered as the government interferes with market forces to distort consumer decisions, causing an inefficient capital allocation towards the housing industry to the detriment of other sectors. Additionally, the MID largely benefits those with incomes over $100,000, who already have the ability to purchase a home.
Congress should ultimately phase out the mortgage interest deduction over a 15 year period and immediately limit the MID to principal residences up to $15,000 in interest payments. The average benefit lost per claimant with an income under $100,000 would be $1,010, while those claimants earning over $100,000, the average lost benefit would be $2,806.87
Likewise, the property tax deduction should be trimmed back in the short-term. A modest proposal is to prohibit the deduction for those with incomes over $200,000.
Mortgage Insurance Deduction In what might best be labeled as mission creep, the tax code has steadily and increasingly subsidized nearly every
aspect of homeownership. Starting in 2007, premiums paid on mortgage insurance have been deductible, similar to the tax treatment of mortgage
interest. Like many tax provisions that seemingly never die, this carveout received an extension in 2007 and 2010. Though it was expired during 2012, Congress retroactively revived it and extended it through December 31, 2013. It is expected to cost $600 million in FY 2014.88
Promoting homeownership has long been a means for lawmakers to score political points. Yet, no evidence exists to demonstrate whether this provision has increased homeownership. Some economists may suggest, “[R]esources are likely further diverted away from other uses in the economy,
such as investment in productive physical capital.”89 Under IRS rules, homeowners are eligible to deduct any
mortgage insurance premiums paid annually, without limit. Applicable insurance policies are those issued after 2007. Eligibility is phased out for those with incomes between

190 | Tax Decoder Housing | 191
Parsonage Housing Allowance Exclusion While many churches are actively living out their calling to provide aid to the poor, pastors are able to help themselves
through an archaic handout in the tax code: the parsonage housing allowance. Not only is the provision seemingly outdated, but some unscrupulous religious leaders have used it to pay for multimillion dollar homes and other expenses.
The parsonage housing allowance is one of the oldest tax breaks in the Internal Revenue Code, dating back to the Revenue Act of 1921, a bill that sought to reduce income tax rates. This original provision exempted from federal income tax any housing provided by churches in which their ministers could live. Some have argued this practice extends a longstanding tradition and societal value of not taxing religious property.91 One tax expert has speculated, “[T]he tax break is rooted in an old tax-code provision that allows any employer to provide rent-free housing to a worker on its business property if it is for the convenience of the employer.”92
Regardless of the exact intent, in 1954 Congress expanded the tax provision to include cash housing allowances given to clergy as well (in lieu of an actual parsonage). Proponents wanted to establish equity among ministers who received housing stipends and those whose housing was provided.93
Clergy of all faiths can utilize the housing allowance. The main criterion is whether the beneficiary must be “a duly ordained, commissioned, or licensed member of a church.”94 In the case of a stipend, the church or employing organization simply designates the amount of a clergyman’s income that is for housing.
Under the housing allowance exemption, a recipient is able to deduct from federal income taxes the fair market rental value of any provided housing. Alternatively, for those receiving cash allowances, that portion of their income is tax-exempt. Social security taxes are still applicable. The cash allowance may not exceed the fair market rental value of the clergyman’s home plus certain expenses.
Clergy can use the cash set-aside for a number of housing-
related expenses including rent, property taxes, mortgage payments, furniture, decorating, cable or satellite television, and homeowners’ association dues.95
The federal government will lose roughly $700 million in FY 2014 from this tax expenditure and $3.9 billion from FY 2014 through FY 2018.96 By 2019, the annual cost will be over $900 million.97
Parsonage Party Fouls
As well intentioned as the parsonage allowance is, this special provision adds complexity to the tax code and propagates inequity between taxpayers in different professions but at the same salary level. It has largely outlived its usefulness and leaves the code open to abuse.
Double-dipping
The original motivation for this tax break for clergy is undeniably noble. Spiritual development and religious freedom has long played a transformative role in Amer-ican society. The current construction of the provision, however, allows some clergy to “double dip,” or utilize the tax code twice.
A cash housing allowance may be used to pay any variety of expenses, including mortgage and property tax payments on a home. Clergy are able to pay these costs with tax-free income and receive the additional benefit of writing off the cost of mortgage interest and property taxes from federal income tax returns. Both of expenses are also deductible
$100,000 and $110,000. Qualifying mortgage insurance includes any premiums paid to the Federal Housing Administration (FHA), the Veterans Administration (VA), the Rural Housing Administration (RHA), and private insurers. Ironically, as FHA beneficiaries receive a subsidy on their mortgage insurance payments, FHA was been on the brink of a taxpayer bailout for several years, and in September 2013, did receive a $1.7 billion bailout.90
Lenders often require borrowers to obtain mortgage insurance if their down-payments are below 20 percent.
Congress’ decision to retroactively apply the tax deduction for 2012 demonstrates a lack of real strategy to increasing homeownership. In that year, any prospective
buyer would not have even considered the deduction as Congress had not extended it.
As with the mortgage interest deduction, a tax subsidy may not actually decrease the cost of homeownership, since taxpayers may use the benefit to purchase a bigger home.
Recommendation
Because the mortgage insurance deduction does not contribute to any clear public goal, particularly when adopted retrospectively, the mortgage insurance deduction should be permanently eliminated.

DRAFT
192 | Tax Decoder
from federal income taxes, reducing overall revenue for Uncle Sam.98
The IRS tried to correct this double tax benefit in 1983 through a rule that no interest or taxes may be deducted from federal returns if they were paid for with tax-exempt income under the parsonage allowance.99 Congress quickly halted implementation of the ruling.100 To this day, pastors are still able to double dip in tax code - a benefit not available to most home-owners.
Stealing the show with extravagant spending
The open-ended, uncapped nature of the parsonage housing allowance has been abused in several instances well beyond its original spirit.
Some religious organizations have been giving untaxed housing allowances to as many staff as possible. Trinity Broadcasting Network (TBN), for example, has ordained station managers and department heads to qualify part of their compensation for the tax break.101 Its employees are not like “managers at a commercial station,” a TBN representative said of the situation.102 “[They have] gone through a religious procedure before ordination.”103
Similarly, one family televangelist’s organization and church tried to qualify as many of its employees for the “Ministerial Housing Allowance” as possible. “The Church had historically applied a liberal standard in granting housing allowances for its employees,” an internal analysis found.104
After an investigation by a United States senator, the organization decided to change its process and the allowance is not “offered to far fewer employees.”105 The scheme has still not been legally closed, however, so other organizations may continue to use the same tactic without scrutiny.
Some churches have also taken extravagant liberties in paying the housing bills for their pastors.
One Christian recording artist and pastor used the parsonage allowance to pay for his $1.4 million home in a gated Florida community.106 His church paid the home’s $7,000 monthly mortgage.107 Another pastor in North Carolina reportedly lives in a $1.7 million mansion, complete with a $5,000 air-condition dog house.108 The church refused to release financial information about its housing allowance.109
The Salvation Army also owns millions of dollars’ worth of homes that it provides tax-free for employees, who are also ordained ministers.110
A televangelist, Walter Grant, received an allowance of $175,000 before going to prison for tax evasion.111 A prominent California church designated the whole salary of its senior pastor as a housing allowance, prompting an investigation
from the IRS.112 In the midst of that lawsuit, Congress limited the allowance to the fair rental value of the home plus certain expenses – the only time Congress has modified the tax break.113
Unnecessary
Religious organizations should always be able to practice their beliefs freely, but a preferential treatment for pastors’ salaries no longer meets its original purpose. If the policy was created to provide equity between the tax treatment of lodgings for some workers and that of pastors, the original intent has been lost. To this day, employees can receive tax-free lodging if the location is on the business premises, furnished for the convenience of the employer, and a condition of employment.114
The average senior pastor today is making well above the national average. The average compensation package for senior pastors is about $82,938.115 For churches with attendance of 501 to 750 people, average compensation rises to over $100,000.116
The median household income across the nation is about $51,000. While that figure does not include the full cost of benefits like retirement and health insurance, it certainly reveals the average family is likely not better off than a typical senior pastor.
While pastors may have been poorly compensated in the past, in most cases today that is no longer the case.
Recommendation
The parsonage allowance should be eliminated. Pastors, rabbis, and other clergy are vital to our nation’s social composition. Their work in ministering to the poor and downtrodden is invaluable. However, they do not deserve special treatment from the tax code that others are unable to utilize even if they are in the same income category.
Additionally, the parsonage allowance clearly has a history of abuse by pastors who do not even need help for their daily expenses.
To reduce fraud and special benefits for a small population of the country, the parsonage allowance should be eliminated, except for housing provided on church campuses (the traditional “parsonage”), as long as other employers are able to provide tax-free housing to their employees. A number of other federal tax breaks and programs are targeted for those with low-incomes, including the earned income tax break.

192 | Tax Decoder Housing | 193
Capital Gains Exclusion for Owner-Occupied Housing
Of the $170 billion in federal funds and foregone tax revenue that subsidizes the housing sector every year, a major component is the exclusion of capital gains on the sale of principal residences.117 In 2014, this tax expenditure will cost in $24.1 billion in lost revenue.118 From FY 2014 through FY 2018, taxpayers are projected to lose $149.3 billion.119
The current provision allows taxpayers to exclude from their federal income taxes up to $500,000 ($250,000 for filing single) in gain resulting from the sale of their principal residence. Not every home sale qualifies however. Taxpayers can only utilize the special benefit once every two years. Claimants must also meet use and ownership tests requiring them to have lived in and owned the house for at least two of the last five years.
Capital gain on a home is calculated by subtracting the taxpayer’s basis in the home from the sale price. Basis includes the original purchase price plus the cost of any substantive non-routine improvements made to the home.
Beyond the cap, normal capital gains tax rates apply. Allowing taxpayers to exclude some of their capital gains is good for easing what could be a significant administrative challenge. The policy needs to be scaled back to disallow tax avoidance favoring the wealthiest individuals and to promote more efficient allocation of capital across the economy.
Evolution of the Capital Gains Exclusion Applied to Housing
This special tax exclusion has existed since 1951. That year, Congress passed the Revenue Act of 1951 to raise federal funds primarily through increases of individual and corporate taxes. However, the bill included a number of provisions that in President Truman’s words “are unfortunate from the standpoint of a sound, fair tax system.”120 Support for the exclusion originally evolved from a desire to eliminate a barrier facing families who had to move for job relocation. Under the original provisions, these families are not motivated by profit, especially considering that gains often result from inflation.121
Rather, this original provision only allowed capital gains to be tax-deferred as long as the revenue from the sale was used to purchase another home of equal or greater value.
With the need to purchase another home in order to avoid taxes, some elderly faced a difficult choice when selling their homes later in life. They could either pay taxes on their gain, or continue to tie up their investments in housing. In 1964, Congress modified the exclusion to allow the elderly (age 65 or older) a one-time option to keep $20,000 in capital gains from the sale of their homes sale tax-free.122 A formula determined the tax liability on the remaining portion.
Over the following 15 years, Congress increased the cap on the exclusion for the elderly several times. Eligibility for the benefit was also lowered from age 65 to 55, and the previous benefit formula was eliminated, allowing full
exclusion up to the cap. President Bill Clinton made expansion of the capital gains
exclusion a selling point of his 1996 presidential campaign. At the Democratic National Convention in the months before his reelection, he said, “I propose a new tax cut for homeownership that says to every middle-income working family in this country, if you sell your home, you will not have to pay a capital gains tax on it ever – not ever.”123 His plan came on the heels on another capital gains proposal from Republican nominee Bob Dole.124
Due to the complications of record keeping for home improvements, Congress reengineered the capital exclusions for housing in the Taxpayer Relief Act of 1997. Under the rules, all homeowners regardless of age, could keep a portion of the capital gains from their home sale tax-free. The current exclusion cap of $500,000 for married homeowners filing jointly ($250,000 for individuals) was implemented.125
Analysis
As with any federal benefit going to millions of people and several industries, the capital gains exclusion for housing is often defended as a vital component of the tax code. While there are some benefits to the provision, they must be weighed against downsides such as the potentially inefficient use of taxpayer funds and the present open opportunity for tax avoidance.
Currently, the exclusion has benefits over previous forms that reduce potential inefficiencies. First, most homeowners do not have to maintain meticulous records about improvements made to their homes. Records are only needed if the gains exceed the exclusions cap. Second, the broad exclusion eliminates the incentive to purchase expensive housing, a process that could lead to a national overinvestment in the sector. Homeowners no longer need to roll-over their sale revenue in order to avoid taxes on gains. In some situations, renting may be a better decision for taxpayers, but under the previous rules, homeowners were incented to continue owning.
One efficiency gained from the exclusion may be its reduction of the barrier in labor mobility - one of the original

DRAFT
194 | Tax Decoder
intentions of the provision. Families are often called to relocate for employment reasons. In selling their homes, they use the revenue to purchase a home in their new location. Some areas may have higher cost of living than others. A 2,000 sq. ft. home costs more in Washington, D.C. than it will in Oklahoma City. Barriers like this disparity in cost of living can inhibit economic productivity.126 The capital gains exclusion minimizes this issue, increasing the ease with which labor can move.
Yet, the observed impact of the provision “is very small relative to the stock of all homeowners,” raising question about whether the exclusion is a cost-effective way to address the issue.127 One study examined homeowner mobility before and after the passage of the Taxpayer Relief Act in 1997, which dramatically expanded the availability of the exclusion. Mobility increased around 1-1.4 percentage points after the policy change, the study found.128
While the historic form of the gains exclusion had many distorting effects, some economists have speculated the current form has still caused overinvestment in housing. Few other sectors or investments have the advantage of being significantly tax-free. Subsequent growth in house prices was what one Nobel laureate called, “[T]he mother of all housing bubbles.”129
The lure of tax-free profits also presents the liability of tax avoidance opportunities. For example, a family could split ownership of a house among different individuals so that the capital gains inuring to each individual would not exceed the exclusion cap.130 Another tax sheltering method allows taxpayers to buy a house that comes with a large portion of land.131 In many cases, the land can then be sold separately from the home and any gain would be separate from the cap on any gains from selling the home itself.
Cost
In 2014, this tax expenditure resulted in $24.1 billion in lost revenue.132 Over the next five years, taxpayers will lose $149.3 billion. Estimating home sales at about 5 million for 2013, the average lost federal revenue per home sale is $4,680.133
Because homes of higher value will tend to have greater gains, those who own more expensive homes receive more of a benefit than those with less expensive homes.
Recommendations
The capital gains exclusion for housing should be signifi-cantly reformed. The provision’s incentive to over-invest in housing versus other sectors distorts the economy. Benefits of the tax break also inure mostly to those with more expen-sive homes, essentially a subsidy to wealthier individuals at the expense of all.
Outright elimination of the tax provision is impractical due to the compliance costs that would be placed on the backs of everyday, middle-class Americans. Calculating a taxpayer’s basis in the principal residence requires signifi-cant record-keeping for home improvements.
Several options are available to offset the provisions negative effects of the provision:
1. Implement a lifetime exclusion cap of $500,000 for single individuals/$700,000 for married couples. This provision would still reduce the burden of mobility that would otherwise exist be present if home sale capital gains were taxed. However, the lifetime cap would decrease the incentive for people to buy homes and move within a short period of time, simply to benefit from the tax-free gain.
2. Lengthen the amount of time a person must live in a residence following a sale before the exclusion can be used again to at least 3 years out of the last five years. This provision would prevent abuse of the provision simply for the sake of enjoying tax-free profits.
3. Include on joint real estate investment property and receive independent appraisals prior to sale to support the fair market value of individual assets sold. Under current rules, taxpayers essentially receive a separate cap for any gains on investment property associated with their principal residence, such as land attached to the home.134 If such land is split off and sold, its gains should apply to the any future sale from the home as well.
4. Eliminate the capital gains exclusion, and require any capital gains from housing to be taxed just as any other capital gains.

194 | Tax Decoder Housing | 195
The Jonas Bonus One provision in the tax code allows taxpayers – including the rich and famous – to rent out their property tax-free for
short periods of time. Under IRS rules, income received for short-term rentals total less than 15 days per year is tax-free. Even a second home or a vacation property can be rented out, as long as the total stay per year is less than 15 days.135 There is no limit on the total income that can be excluded, nor is there any prohibition against high earners.
Kevin Jonas rented his mansion out for $20,000 per night for 12 nights for the Super Bowl XLVII, potentially bringing in $240,000 tax-free,
adding to his estimated net worth of $18 million.
What results is a potential bonanza for rentals around major sporting events, and about $10 million in federal revenue is lost each year to the loophole.136
At Super Bowl XLVII held in Meadowlands, New Jersey, asking rates for studios, apartments, and houses frequently ran into thousands of dollars per night. “I have never rented my home, but for $20,000, I’ll take it,” noted one local.137
Another boasted, “I’m asking $2,500 a night with a minimum 5 night stay.”138
One superstar sought at an even bigger prize. Kevin Jonas rented his mansion out for $20,000 per night for 12 nights (just under the limit).139 Complete with “a walk-out basement, a billiard room, and home theater complete with stadium seating and a 3-D projector…a 6,500-bottle wine cellar and the property’s in-ground saltwater pool,” the rental scheme could have brought in $240,000 tax-free, adding to his estimated net worth of $18 million.140, 141
Kevin Jonas was not the only celebrity to benefit from the IRS’s generosity. An NFL player even put his two-bedroom apartment up for rent on Craigslist.142 He was asking $9,000 for the week to supplement his $450,000 salary.143, 144 Jonas’ home was also not the only one in the $100,000-plus club. Another home advertised for $119,500 for “Super Bowl Week Only.”145
Major events that homeowners take advantage of are not limited just to the Super Bowl. PGA Tour tournaments, the South by Southwest music festival in Austin, Texas, and NCAA college basketball games have all been magnets for these types of tax-free shenanigans.146
One popular television show even used the loophole to help participants evade income taxes on earnings. ABC’s Extreme Makeover: Home Edition – which featured a participant’s home and remodeling – would rent out the house for 10 days (just under the exclusion cap). Instead of paying cash for the rental, the TV show would “treat the provision of flat-screen TVs, appliances, etc. in the home-makeover as the rental payments.”147 This method helped participants receive the home makeovers tax-free. Otherwise, they would have paid income tax on the increase of their homes’ fair market values.148
Congress tried to close the loophole in the 1970s, but “[a] group of powerful people who had previously been able to rent their homes on a short-term basis for gobs of cash – some of whom hailed from Augusta Georgia, [sic] home to the Masters – lobbied Congress to be able to keep their tax-free windfall,” according to one account of the loophole’s history.149
Recommendation
The short-term rental income scheme should be scaled back. Any changes must be weighed against the administrative burden placed on taxpayers. Tracking rental income for up to two weeks a year would not be overly onerous. Nevertheless, closing this tax benefit entirely would necessitate allowing homeowners to access other benefits available to landlords, such depreciation and deductibility of business expenses that would add to the burden of compliance.
If not outright eliminated, the exemption could be capped at $2,800, which amounts to $200 per night over the maximum rental allowance of 14 nights. Small-time taxpayers would be spared the complexity of the code, and Congress would strengthen overall fairness and equity of this tax provision.

DRAFT
196 | Tax Decoder
Low-Income Housing Tax Credit Affordable housing has long been a goal of a majority of elected officials. Making certain that every American has a roof
over their head should compel lawmakers to ensure only the best and most efficient government initiatives are continued. One federal housing program administered through the tax code – the Low-Income Housing Tax Credit (LIHTC) – is touted as a
“win-win-win for affordable housing.”150 Yet the program benefits big banks, financial institutions, and wealthy landlords, duplicates a variety of other federal programs, increases the cost of providing affordable housing, and has had questionable impacts.
Most of the tax benefit (over 90 percent) goes to corporate investors.151 Many companies worth billions of dollars – like Google and Verizon - use the credit to lower their tax bill.152
Background and History
Under LIHTC, developers of rental units for tenants with limited incomes receive tax credits from the federal government. To raise money for their construction or rehabilitation projects, they sell the tax credits to project investors, which are often big companies looking to ease their tax burden. The credits generally are purchased anywhere from 70-97 cents on the dollar.153 Developers can also hold on to the credits for their own financial benefit.
LIHTC grew out of the 1986 tax reform debate, when Congress added the program just as it was trying to pare back other special interest benefits. The key components of the program have stayed the same since, though Congress has raised the number of credits available to states several times. Developers also face a stronger requirement on the amount of time that units must be dedicated to low-income families. The time period of 15 years was increased to 30 years in 1989.154
Although LIHTC was also created in part to replace public housing, which had been the central affordable housing solution for almost 50 years,155 it is unlikely public housing will ever wind down, leaving both federal programs in place, likely infinitely.
Developers start the process by submitting proposals to state housing finance agencies, who competitively award credits based on the merits of each submission. Every year, each state is allowed to award a total number of tax credits equal to $2.20 per person, or $2,525,000, whichever amount is larger.
For new projects, developers receive a 70 percent subsidy for the cost of construction. Rehabilitation projects qualify for a 30 percent subsidy. The tax credit is paid out over 10 years, in equal allotments determined by the market interest rate at the time the credits are finalized.156
Tax credit-financed projects must agree to rent a certain por-tion of their units to those with low-incomes. Either 40 percent of units must be rented to households making 60 percent or less of the area’s median income (AMI), or 20 percent of units to those making 50 percent or less of the AMI. Because only a fraction of an apartment complex’s units are reserved for assisting the poor, landlords are being subsidized to build market rate units as well.
Low-income units must be dedicated for 30 years to that purpose, but developers have an option to try selling the property after 15 years. If no buyer is willing to maintain the income restrictions, the provision ceases. In any case, the
IRS only seeks to recapture tax credits if a project falls out of compliance in the first 15 years.
The program is managed and overseen by the Department of Treasury, which administers the program through the IRS, in partnership with state housing finance agencies.
Cost and Analysis
In FY 2014, the cost of the program will be approximately $7.1 billion.157 From FY 2014 through FY 2018, the cost will be $40.5 billion.158 About 100,000 housing units are financed through credits every year.159
About 1.6 million units have been subsidized, making the average cost per unit nearly $57,000.160
Most of the tax benefit (over 90 percent) goes to corporate investors.161 Many companies worth billions of dollars reap a bounty from the program.162 As noted above, Google, Verizon, Liberty Mutual, and Allstate have all benefitted from the tax credits.163 Google alone had a net income of $10.8 billion in 2012, and has invested $86 million in 480 low-income units nation-wide (a per-unit investment of $179,166).164, 165 In some cases, these companies receive “double-digit yields,” as they are able to buy the credits at a steep discount from the developers.166
Similarly, a number of multi-billion dollar banks have significant involvement in the program. One company run by U.S. Bank held $4.9 billion in LIHTC as of March 2013.167 PNC Bank’s Real Estate practice specializes in arranging funds for multi-million dollar investors.168 Bank of America Merrill Lynch invested $801 million in LIHTCs.169 These three banks alone generate over $100 billion in revenue annually.170
Is LIHTC worth the cost to taxpayers?
The LIHTC program has financed development of more than a million affordable housing units over the last three decades. But a number of independent reviews of the program have raised concerns about the effectiveness of the program in stimulating construction that would not otherwise occur. The program’s cost compared to other federal housing efforts and lack of compliance with income targets are also concerning.

196 | Tax Decoder Housing | 197
Limited evidence of additional development
Supporters of LIHTC often look to the number of units ever supported by the program as a key data point to demonstrate that the program is effective. The question, however, is not how many total units have been funded by LIHTC, but rather how many units that would not otherwise have been built. Though over $90 billions of dollars spent through the LIHTC and over 1.6 million units supported, very little evidence exists to show LIHTC has actually spurred new development.171, 172 Several studies have demonstrated how funding low-income units may simply crowd out development that would otherwise occur. In effect, subsidizing a certain portion of housing set aside for those with low-incomes may have decreased overall demand for other rental units. Builders, in turn, can respond by constructing fewer units for the non-low-income population.
One larger analysis looked at the impact of LIHTC and other federal programs on the housing supply. The authors concluded, “[T]here is no evidence in this data that housing programs have a long-run effect on the stock of housing in individual states.”173
These results were corroborated by a 2010 study. Those investigators wrote,
“Our most important finding is that displacement of private rental housing construction as a result of the LIHTC program is substantial. Our most robust estimates suggest that nearly all LIHTC development is offset by crowd out resulting in a corresponding reduction in unsubsidized construction of rental housing units.”174
Both of these studies also undermine one of the key points of LIHTC advocates, who often point to the number of jobs “created” by the program as a feature of its effectiveness.175
These data show that these jobs would likely be supported by unsubsidized construction even in the absence of LIHTC.
Lack of cost-effectiveness
Another problem of LIHTC comes from the added cost of using tax credits as compared to a direct grant program. Every $1 in tax credits results in $1 of foregone federal revenue, but each $1 in tax credit does not also translate into $1 of project equity and services provided to families in need. Indeed, the true return for every dollar in LIHTCs in 2010 was about $.75, largely due to the discounted purchase price to corporate investors.176 Government Accountability Office (GAO) has also noted if other tax benefits available to investors for owning multifamily properties were included, the actual return per dollar would be even less.177
Investors rarely pay full price for a tax credit. Rather, they weigh the value of the credit over ten years, and examine the risk of the project. By putting equity into a LIHTC project, investors may also gain access to other tax benefits as well,
such as accelerated depreciation for rental housing.178
While taxpayers are losing billions that could be going to services, corporations that invest in the tax credits are able to find double-digit returns in some cases. As noted previously, most of the tax benefit (over 90 percent) goes to corporate investors seeking to offset profits.179 Large corporations and banks like Google, Verizon, and Bank of America benefit from the program.180
Overall, the LIHTC is an expensive subsidy compared to the support provided by the Section 8 voucher program, the nation’s most significant rental assistance program. Over 30 years, the LIHTC has added over 21 percent to the cost of providing an affordable housing unit as compared to the Section 8 voucher program, according to the GAO.181 In areas outside of cities, the additional cost may be at least 96 percent more than the cost of a voucher.182 In some cities, such as Atlanta, where affordable housing is already readily available the LIHTC is over twice as expensive.183 The per-unit cost of the LIHTC may even be higher than estimated considering that many units do not remain rent-restricted after 15 years or receive a new surge in public funds at that time.184
One of the reasons the LIHTC is more expensive than other policies is that it funds construction of new projects, rather than focusing on rehabilitation of existing properties. The Congressional Budget Office (CBO) raised this concern in 1992 when the program was still fairly new: “[T]he credit subsidizes newly constructed housing, which is much more expensive than existing housing.”185 Congress made no structural changes to LIHTC to address this issue.
The LIHTC program also suffers from an inequitable dis-tribution of funds, which minimizes its impact nationwide. Federal law does not take into account a state’s current or projected supply of affordable housing, but rather assumes each state has the same needs. Every state receives an allo-cation of tax credits equal to $2.20 per person, or $2,525,000, whichever amount is larger. With some states needing the LIHTC less than others, the program can hardly be said to
Plaza Point, an affordable senior citizen housing complex in California, built with both nearly $4 million in LIHTC and a $1 million USDA loan.

DRAFT
198 | Tax Decoder
be efficient when the distribution does not take into account the number of poor in each state or actual housing supply.
Shortages of affordable rental housing are certainly not the same nationwide. Some states may have more low-income housing than they need. For example, five states have more than 100 units available per 100 households earning 30 percent of an area’s median income (AMI) or lower – a category labeled “extremely low-income.”186 Nationwide, an average of 132 affordable units are available for every 100 households earning 80 percent of AMI or less.187
Income Targeting Mostly Positive, Not Always Adhered To
With millions of families barely able to afford housing, wasting one dollar through LIHTC is unacceptable. Fortunately, LIHTC appears to be helping those it was intended to target. About 93 percent of LIHTC-utilizing households have incomes at or below 60 percent of AMI.188 Over half of LIHTC tenants have incomes below 40 percent of AMI.189 In Oklahoma County, Oklahoma, for example, the AMI for 2013 was $60,031.190
Even so, the program is not without faults. Further, almost seven percent of households have incomes over the statutory guidelines.191 Most of these households appear to have experienced income increases while living in the LIHTC unit. Still, 1.2 percent of households had excessive incomes even when they moved in, raising questions about the controls surrounding the program.192
LIHTC rules require that if a tenant’s income surpasses eligibility, the project must rent the next available apartment to a low-income tenant. Tenants are not required to move at any time, regardless of income.193 These rules only apply to projects that contain both market-rate and LIHTC units. Projects that only include LIHTC housing units may be exempted from the federal recertification requirement. States sometimes implement additional recertification, however.
Duplication and Double Dipping
Federal programs providing rental or single-family assistance now number 160 and span 20 different agencies.194 LIHTC project developers not only benefit from credits through the tax code, but often receive millions of dollars through other programs designed to assist multifamily construction. While few other federal programs focus exclusively on affordable housing development, they are flexible enough that they often do, mimicking the effect of the LIHTC.
For example, the Community Development Block Grant (CDBG) provides over $3 billion annually to states and cities to meet needs primarily affected low- to moderate-income households.195 Similarly, the HOME Investment Partnership Programs is a $1 billion annual block grant for states and localities
“to produce affordable housing for low-income families.”196 Several U.S. Department of Agriculture programs also provide funding opportunities that can overlap with the LIHTC.
Unnecessary duplication and overlap of these programs wastes resources as each contains multiple oversight and administrative structures. Compliance program’s unique requirements can also constrain private and local resources that could otherwise go to direct services.
For example, the city of Arcata, California, built a senior center in 2012, which received $3.8 million through the LIHTC for the project. The project also benefited from a $1 million USDA Rural Rental Housing Direct Loan.197 Meanwhile, the elderly individuals subjected to the new center there were less than pleased with their living condition. A local paper reported, “The residents, many retired professionals, are well organized and have compiled voluminous notes and correspondence on their issues with AWI Management Company. Allegations include:
• “Toxic substances used in cleaning and repairs, which release fumes.
• “Cheap appliances, including dishwashers and garbage disposals, which are only ‘for show.’
• “Noise from neighboring apartments and floors. • “Tenants kept in fear of eviction over trivial and
nonexistent, even fabricated offenses. • “Poor communication and brusque treatment by
managers.”198
Another local report revealed the senior citizens living at Plaza Point have even complained to city officials, contend-ing the low-income housing management is harassing and threatening them.199
Similarly, a New Hampshire project received $3.7 mil-lion through the LIHTC, a $650,730 loan through HOME, a $500,000 grant through CDBG, and $1 million from USDA.200
The owner contributed only $182,088.201 Aside from federal direct grant programs, other multi-bil-
lion-dollar tax benefits are also available to LIHTC developers. Using private activity bonds, states award billions of dollars to support affordable multifamily housing projects. As discussed in this report, the interest on these bonds is exempt from fed-eral income taxes. Lost federal revenue on multifamily bonds specifically is $1.1 billion in 2014.202 Developers can receive an interest rate that is 30-35 percent lower than a typical loan.203
Of the 2.6 million rental homes financed by the LIHTC, one-third also received support from a tax-exempt bond.204
Before 2009, developments benefitting from tax-exempt bonds or any other federal grant were only allowed to receive the 30 percent subsidy through the LIHTC. Congress modified the rule in 2009 to make it easier for developers to qualify for the full LIHTC subsidy (70 percent), regardless of what other federal grants contributed to the project.
In many ways, the bond program duplicates the operation of LIHTC. States each have an annual allocation they may spend on tax-exempt private activity bonds (for a variety of services, not exclusive to multifamily housing). Any bonds awarded for

198 | Tax Decoder Housing | 199
Depreciation of Rental Housing Adds to Uncle Sam’s Credit Card
One arcane feature of the tax code gives special benefit to owners of rental housing by virtue of accelerated depreciation. Owners are allowed an accelerated depreciation schedule on their assets, which amounts to “an interest-free loan from
the federal government.”212 The tax code allows rental housing owners to deduct depreciation from their houses over time, delaying the full tax payment to later years. This delayed payment to Uncle Sam is considered a loan because of the time value of money concept that money loses value over time due to forgone opportunity costs. In practice, by rental property owners deferring payments, the government is forced to borrow more money from investors in order to meet budgeted expenditures. These investors require interest payments on their loans to the government.
multifamily housing come with income restrictions on tenants, similar to LIHTC rules. Ultimately, taxpayers are subsidizing two different programs attempting to achieve the same goal of in-creasing the supply of affordable rental housing. The result is duplicative overhead and administrative costs.
Some multifamily units are also supported by the Section 236 Rental Housing Assistance Program, which cost taxpayers $339 million in FY2013.205 Developers benefitting from the pro-gram received mortgage insurance as well as interest rates sav-ings of up to 1 percentage point. No new units are added to the program, but 11,958 rentals units were subsidized in FY2013.206
GAO has reported on the federal government’s incom-plete understanding of how overlapping programs and tax expenditures are funding multifamily housing projects.207
Without this information, officials have no way to identify how programs may be reduced or streamlined to generate more efficiency. Neither Treasury nor HUD, for example, col-lect comprehensive information about all funding sources for a specific project. Doing so would be “helpful in better under-standing how tax expenditures contribute to rental housing project outcomes and identifying areas of overlap for further consolidation,” notes GAO.208
Advocates lament the availability of affordable housing.
Even the federal government’s multi-billion investment in af-fordable housing will have limited impact if it keeps operating programs like LIHTC that have dubious results and limited cost effectiveness.
Recommendation
Eliminate the Low Income Housing Tax Credit and reform federal affordable housing initiatives.
This tax program has not produced clear results in its nearly 30 years of existence. Instead, the credit may crowd out development that would already occur.209 It is also more expensive than other federal affordable housing initiatives, such as the Section 8 Housing Choice Vouchers program.210 While the federal budget suffers from billions of dollars in foregone revenue every year, a major benefit goes to the multi-billion corporations that invest in and defend the tax credit. LIHTC pads their bottom-line with a significant premium, while developers receive less in return.
Eliminating this credit and supplementing the Section 8 voucher program would potentially enable Section 8 to support an additional 950,000 families annually.211
The IRS currently uses the modified accelerated cost recovery system (MACRS) to depreciate rental housing property. Under MACRS, rental housing can be depreciated over 27.5 years, though the useful life of the building may be much longer; however, this useful life is inconsistent with other tax provisions. For example, the low-income housing tax credit assumes a building remains viable for at least 30 years. To simplify the tax, the Congress should use a consistent treatment of tax expenditures applied to properties and the depreciable lives should reflect the economic lives of the underlying property being depreciated. Accordingly, rental property should be depreciated over a longer depreciable life.
Though the taxpayer will end up with the total sum of
depreciation regardless of the depreciable life, requiring a longer depreciable life will reduce interest-bearing loans taken by the government.
Having a depreciation timeframe relatively shorter than that of other personal property is not necessarily a problem, except residential rental housing receives an extra preference over other types of properties. For example, residential housing has a faster depreciation schedule compared to commercial real estate, which has a depreciation schedule of 39 years.213 Allowing rental housing to qualify for faster depreciation than it may otherwise merit amounts to a subsidy for the residential property segment of the housing industry.
Landlords will reap a benefit of $23.7 billion from FY 2014

DRAFT
200 | Tax Decoder
Exception from Passive Loss Rules for $25,000 of Rental Loss
Rental housing received a special carveout from a 1986 reform that scaled back the use of tax shelters to offset income taxes. Under the exception from passive loss rules, taxpayers with incomes less than $150,000 are able to reduce their income tax liability with up to $25,000 in losses from rental properties. Prior to 1986, there was no limit on use of passive losses.
The exception will cost taxpayers about $9.8 billion in FY 2014 and $54.9 billion from 2014-2018.217
Those using the exception must have a stake of at least 10 per-cent in the property and be generally involved in its management.
Congress’ concern in limiting the use of passive losses was investors purchasing stakes in companies simply for the tax benefit. In the tax world, “[p]assive income is defined to include income generated from business and trade activities in which the taxpayer does not materially participate and from rental activities such as real estate.”218 The 1986 tax reform effort scaled back use of passive losses against gains resulting from a taxpayer’s active business efforts. These losses can continue to offset gains in other passive investments and can be carried forward.
Understandably, the use of tax shelters was perceived to destroy confidence in the tax system. Their use also “eroded the tax base and placed a disproportionate tax burden on tax-payers unable to take advantage of the shelters.”219 According to the Washington Post, “Before 1986, investment in real estate was considered a ‘profit-making activity.’ An investor could buy a rental property, receive rental income and was able to deduct “paper losses” to obtain a very significant tax shelter.”220 Put an-other way, the “loss limitations [were] likely to lower significant-ly the values of loss-motivated partnership deals and of proper-ties in areas where the economics have turned sour.”221
Presumably, Congress allowed the exemption to ease the potential administrative burden of navigating arcane rules. Taxpayers with incomes less than $100,000 qualify for a full deduction, and it is phased out for incomes up to $150,000. One possible reason for the exception was that there may be some ambiguity as to whether the rental investment is truly passive or active. Another reason may be “small landlords” do not have enough other passive income to offset, a lack of diversification of resources.222
A unique exception exists to this carveout: those who are professionally involved in the real estate industry are able to utilize passive losses without limit against active income. In 1993,
Congress allowed real estate professionals to use the exception without limit. They are allowed to consider losses on rental properties as active losses, regardless of whether their main focus is on the rental properties or other business. Congress cited the incentive as a way to revive the real estate industry at the time.223 However, this special benefit was never set to expire. At the time, this change alone was estimated to result in about $2.2 billion of lost revenue over 5 years, which roughly translates to about $3.5 billion today.224
The passive loss exclusion provides additional incentive for eligible taxpayers to invest in real estate, a distortion in the economy that may prevent the most efficient allocation of capital. At the same time, as long as the exclusion exists, some investors are still able to shelter active income from Uncle Sam in ways unintended by Congress. For example, “depending on the investor’s personal use of the property, it is possible that a taxpayer could use the exception in a manner that provides a benefit for a vacation home.”225 Any rent lost during the investor’s stay could be deducted against active income.
Recommendation
Congress may want to consider phasing out the passive loss deduction for rental housing. Tax revenue generated from closing the provision could be more targeted to assisting tenants who struggle to provide for their own housing.
Considered separately, another practical reform would be to reduce the phase-out bands from $100,000 and $150,000, and indexing these amounts to inflation.
In the interim, Congress could act more immediately by limiting the passive loss exception for real estate professionals. At the time of the tax provision’s adoption, Congress intended for the benefit to help stimulate the industry, acting as a short-term goal because of the economic circumstances. However, after more than two decades, this loophole is no longer justified.
through FY 2018 as a result of the faster depreciation, which will cost $4.3 billion in FY 2014.214 This disparity between different investments causes distortions in the marketplace that may not be the most efficient for society.
Additionally, the actual rate of depreciation of residential housing is up for debate. One economic analysis, for example, suggests that a more accurate depreciable life would be 30.5
years.215 Another suggests a life of about 50 years.216
The IRS and Congress should remain vigilant in ensuring the depreciation schedule does not unfairly benefit one industry over another and the asset’s depreciable life reasonably matches the economic life. However, reforms to MACRS should

200 | Tax Decoder Housing | 201
A UNIQUE EXCEPTION EXISTS TO THIS CARVEOUT: THOSE WHO ARE PROFESSIONALLY INVOLVED IN THE REAL ESTATE INDUSTRY ARE ABLE TO UTILIZE PASSIVE LOSSES WITHOUT LIMIT AGAINST ACTIVE INCOME.
Bonds for Owner-Occupied and Rental Housing
Background
One of the most common uses for private activity bonds are mortgage revenue bonds (MRBs) for financing multifamily rental housing.
When a state or local housing finance agency issues an MRB, the proceeds are used to finance purchases of owner-occupied homes. Bonds may also finance home improvement loans up to $15,000. Some bonds are targeted specifically to veterans, but most are not. The government allocates the proceeds from the bond to lenders. Because the interest rate on the tax-exempt loan is usually lower than the rate lenders would otherwise receive, they pass on the lower rate to borrowers. There are a number of criteria that dictate eligibility for a mortgage financed by an MRB.226
States and local governments can also trade in their authority to issue an MRB for the ability to issue a mortgage credit certificate (MCC) to homebuyers. The amount of the credit is a fraction of the mortgage interest – 10-50 percent – and allows the buyer to offset federal income tax liability.227
Bond issuance for multifamily housing operates in a simi-lar manner, but developers must meet different requirements.
Subsidized projects must meet one of two set-aside targets: 20 percent of total units for residents earning 50 percent or less of the area’s median income, or 40 percent of total units for residents earning 60 percent or less of the area’s median income.228 Projects built in New York City qualify for a unique carve-out from this latter rule.229 Only 25 percent of their total units need to house residents with incomes 60 percent or less of the area median. The result is fewer units targeted for low-income households and more subsidized market rate units.
History
States and local governments first began issuing MRBs in the 1970s to “increase the incidence of homeownership.”230 At that time, no restrictions governed how the tax-free bonds could be used. In 1980, Congress then limited the number of MRBs that could be issued each year (under the overall private activity cap for each state) and placed some targets on who
the MRBs should serve. Congress made these initial provisions permanent in 1993.
The program was largely unchanged through 2008. In the midst of the financial meltdown – Congress permanently excluded MRB interest from the alternative minimum tax, which would have otherwise triggered an increased tax liability for some investors. Congress also allowed MRB proceeds to be used for refinancing subprime mortgages issued from 2002-2007, and temporarily expanded the volume cap on private activity bonds, restricting the extra volume to MRBs.231
Likewise, program rules for multifamily tax-exempt bonds have not been modified considerably since their creation. The most significant changes came in 1986, when the current income restrictions were put in place. The bonds were also subjected to the same private-activity cap governing issuance of other kinds of state and local bonds.
Cost and Current Status
In 2011, state and local governments issued about $16.5 billion in bonds that supported mortgages and financing for multifamily housing.232 There were also about $322 million in bonds for veterans’ mortgages in 2011.233
Because the federal government does not tax the interest earned for these bonds, the federal revenue lost was $1.2 billion for MRBs and $1.0 for rental housing bonds in 2014.234 From FY 2014 through FY 2018, these tax expenditures will cost $11.7 billion.235
According to the National Council of State Housing Agencies, the median income for borrowers financed by an MRB in 2011 was about $39,000, or 77 percent of the national median.236 About 55,000 houses were financed with MRBs, receiving an average tax subsidy of $20,000 per house from the bonds alone.237
About 27,200 apartments were financed in 2011 with multifamily bonds, at an estimated cost to the taxpayers of $800 million.238 In total, each apartment essentially received an average of $33,333 in federal subsidies through the bonds alone.239 The subsidy per low-income apartment may actually be significantly higher.240

DRAFT
202 | Tax Decoder
A DIRECT GRANT PROGRAM COULD PROVIDE THE SAME BENEFIT TO HOMEBUYERS AT ABOUT
ONE-FOURTH OF THE FEDERAL COST.
Analysis
While the single-family and rental housing bonds programs have the best of intentions, both have had limited economic effec-tiveness. Are MRBs actually helping people who otherwise would not be able to buy a home to do so? Similarly, are rental housing bonds increasing the number of affordable apartments for low in-come households? There appear to be more cost-effective ways to provide assistance to low-income and middle-class families. Nei-ther program appears to be meeting the goals of increasing hous-ing opportunities in an economically sustainable fashion.
Effectiveness of MRBs
The MRB program has laudable requirements that attempt to increase homeownership of certain segments of the population. The original intent of the bonds was to increase homeownership.241 As previously discussed, requirements apply to the cost of houses and income of households, both of which narrow the target population. But previous studies of MRBs have indicated the program is not doing anything to stimulate housing purchases that would not otherwise occur.
MRBs are also an expensive means of delivering housing assistance compared to other federal programs.
First, according to the Government Accountability Office (GAO), most homebuyers who are financed with MRBs would still be able to make the purchase without a federal subsidy. Studies by the GAO found the tax subsidy provided through MRBs (or MCCs) is usually unnecessary. “Comparing assisted buyers with all first-time buyers nationwide, [GAO] found that assisted buyers are likely to become home owners without bond assistance,” GAO found in a comprehensive analysis of over 177,000 loan records.242 While some people may have used the financing to purchase a more expensive home, bonds are probably not stimulating many additional home purchases, GAO observed.243
Second, the subsidy is not delivering financial benefits to homeowners cost effectively. Beneficiaries receive only a fraction of every dollar that goes to subsidize the program. “Home buyers receive only 12 cents to 45 cents in benefits for every dollar in tax revenue foregone,” GAO said.244 One analysis found that the bonds are “costly to the Federal Government when compared to the benefits provided buyers and to the costs of alternative subsidy mechanism which could be employed.”245 In other words, a direct grant program could provide the same benefit to homebuyers at about one-fourth of the federal cost.246 Many other federal programs such as the Community Development Block Grant program could be used to provide such support for homeowners.
Effectiveness of Rental Housing Bonds
There has been little oversight and analysis to demonstrate whether tax-exempt bonds for rental housing has achieved their goal of increasing the affordable multifamily housing
supply in the United States. Based on evidence from similar programs, the usefulness
of the rental housing bonds compared to other federal housing initiatives is suspect.
Most significant, very little of the revenue from rental housing bonds appears to go units earmarked for needy families. This problem also exists in the LIHTC program. Both fund construction of market-rate rental units alongside those for low-income families. In short, taxpayers are supporting as many as four market rate apartments for the construction of one restricted-rent unit. The reason is the income restriction on the bonds requires as little as 20 percent of their units to be available to lower-income families.
Additionally, administrative costs of managing a bond (such as the MRB) can have a significant impact on how much of the funds go to direct support of low-income households. Bond management requires a number of entities to be involved, each also taking a cut for overhead expenses. As noted above, one 2009 study found a tax credit program could deliver housing assistance to families for less than half the cost to taxpayers than bond programs.247
Taxpayers lose about $1.1 billion in federal revenue from the rental housing bonds program every year.248 According to the National Council of State Housing Agencies (NCSHA), about 27,000 apartments were financed in 2011 with bonds.249 That same amount of money could have paid for an additional 141,000 families to join the Section 8 Housing Choice Voucher program.250
Recommendation
Eliminate the tax exemption for new private activity bonds for single-family and multifamily housing
These bonds programs support an important goal of increas-ing affordable housing opportunities, whether in home purchase or rentals. However, strong evidence suggests not only are these programs expensive, they overlap with a number of other federal programs with the same goals. After decades of evidence, there is little evidence that mortgage revenue bonds have increased the homeownership rate, as originally intended.251
Congress should eliminate the tax exemption and consolidate the number of federal housing assistance programs. Those truly in need of assistance should not be stranded. Yet, with over $170 billion in spending and lost tax revenue on housing programs, a significant opportunity exists to streamline these programs and better serve those with low-incomes.

202 | Tax Decoder Housing | 2031 Weiss, N. Eric. “Changes to the Residential Mortgage Market: Legislation, Demographics, and Other Drivers,” Congressional Research Service, April 24, 2013, R42571. 2 “Residential Vacancies and Homeownership in the Second Quarter 2014,” U.S. Census Bureau News, July 29, 2014, http://goo.gl/OdWTPB. 3 National Low Income Housing Coalition, “HUD Reports Record-Breaking Worst Case Housing Needs,” August 23, 2013, http://goo.gl/exzjzC, accessed January 30, 2014. 4 Programs that are only involved in regulatory requirements or regulating GSEs are not included in this count total. “Housing Assistance: Opportunities Exist to Increase
Collaboration and Consider Consolidation,” Government Accountability Office, GAO- 12-554, August 16, 2012. 5 “Housing Assistance: Opportunities Exist to Increase Collaboration and Consider Consolidation,” Government Accountability Office, GAO- 12-554, August 16, 2012. 6 Senate Committee on the Budget, “Tax Expenditures: Compendium of Background Material on Individual Provisions,” Congressional Research Service, December 2012;
http://goo.gl/XLHSoT 7 “Department of Housing and Urban Development (HUD): Funding Trends Since FY2002,” Congressional Research Service, R42542, January 7, 2014. 8 McCarty, Maggie. “An Overview of the Section 8 Housing Programs: Housing Choice Vouchers and Project-Based Rental Assistance,” Congressional Research Service,
RL32284, December 27, 2013. 9 McCarty, Maggie. “Department of Housing and Urban Development (HUD): FY2013 Appropriations,” Congressional Research Service, R42517, December 13, 2013. 10 McCarty, Maggie. “An Overview of the Section 8 Housing Programs: Housing Choice Vouchers and Project-Based Rental Assistance,” Congressional Research Service,
RL32284, December 27, 2013. 11 “Housing Assistance: Opportunities Exist to Increase Collaboration and Consider Consolidation,” Government Accountability Office, GAO- 12-554, August 16, 2012. 12 “Housing Assistance: Opportunities Exist to Increase Collaboration and Consider Consolidation,” Government Accountability Office, GAO- 12-554, August 16, 2012. 13 Miga, Andrea. “FHA needs $1.7B to cover reverse mortgage losses,” USA Today, September 27, 2012, http://goo.gl/JbNfq5, accessed January 28, 2014. 14 “Housing Assistance: Opportunities Exist to Increase Collaboration and Consider Consolidation,” Government Accountability Office, GAO- 12-554, August 16, 2012. 15 “Housing Assistance: Opportunities Exist to Increase Collaboration and Consider Consolidation,” Government Accountability Office, GAO- 12-554, August 16, 2012. 16 “Housing Assistance: Opportunities Exist to Increase Collaboration and Consider Consolidation,” Government Accountability Office, GAO- 12-554, August 16, 2012. 17 “Housing Assistance: Opportunities Exist to Increase Collaboration and Consider Consolidation,” Government Accountability Office, GAO- 12-554, August 16, 2012. 18 “2014 Update on Mortgage Cancellation Tax Relief,” National Association of Realtors, January 24, 2014, http://goo.gl/fsJRRA, accessed January 29, 2014. 19 Keightley, Mark, and Erika Lunder. “Analysis of the Tax Exclusion for Canceled Mortgage Debt Income,” Congressional Research Service, RL34212, February 12, 2013. 20 Senate Committee on the Budget, “Tax Expenditures: Compendium of Background Material on Individual Provisions,” Congressional Research Service, December 2012;
http://goo.gl/gCqQCV 21 The maximum exclusion is $1 million for married couples filing separately. 22 Keightley, Mark, and Erika Lunder. “Analysis of the Tax Exclusion for Canceled Mortgage Debt Income,” Congressional Research Service, RL34212, February 12, 2013. 23 “Tax Expenditures: Compendium of Background Material on Individual Provisions,” Senate Committee on the Budget, Congressional Research Service, December 2012;
http://goo.gl/DnUGL7 24 Internal Revenue Service, Statistics of Income Division, Individual Complete Report (Publication 1304), Table 1.4, All Returns: Sources of Income, Adjustments, and Tax
Items. 25 Internal Revenue Service, Statistics of Income Division, Individual Complete Report (Publication 1304), Table 1.4, All Returns: Sources of Income, Adjustments, and Tax
Items. 26 Internal Revenue Service, Statistics of Income Division, Individual Complete Report (Publication 1304), Table 1.4, All Returns: Sources of Income, Adjustments, and Tax
Items. 27 Internal Revenue Service, Statistics of Income Division, Individual Complete Report (Publication 1304), Table 1.4, All Returns: Sources of Income, Adjustments, and Tax
Items. 28 U.S. Congress, House Committee on Ways and Means, Mortgage Forgiveness Debt Relief Act of 2007, House Report 110-356, October 1, 2007. 29 Internal Revenue Service, Topic 504 – Home Mortgage Points, April 15, 2013. Available at http://goo.gl/tTHxW5, accessed September 5, 2013. 30 “Setting the Record Straight on the Mortgage Interest Deduction,” National Association of Homebuilders, July 25, 2013. 31 Hielscher, John. “Is mortgage-interest deduction in the cross hairs?” Sarasota Herald-Tribune, August 11, 2013, http://goo.gl/0UPZZ4, accessed August 16, 2013. 32 “Housing Experts See Strong Recovery on Horizon,” Zillow.com, September 20, 2012, http://goo.gl/b1xRqM, accessed August 16, 2013. 33 Pender, Kathleen. “Mortgage interest deduction claims, facts,” San Francisco Gate, December 18, 2012. Available at http://goo.gl/itwIIx, accessed August 19, 2013. 34 Keightley, Mark. “The Mortgage Interest and Property Tax Deductions: Analysis and Options,” Congressional Research Service, January 18, 2011. 35 Keightley, Mark. “The Mortgage Interest and Property Tax Deductions: Analysis and Options,” Congressional Research Service, January 18, 2011. 36 Keightley, Mark. “The Mortgage Interest and Property Tax Deductions: Analysis and Options,” Congressional Research Service, January 18, 2011. 37 Joint Committee on Taxation, “Estimates of Federal Tax Expenditures for Fiscal Years 2014-2018, August 5, 2014, JCX-97-14 38 Joint Committee on Taxation, “Estimates of Federal Tax Expenditures for Fiscal Years 2014-2018, August 5, 2014, JCX-97-14 39 “Analytical Perspectives, Budget of the United States Government, Fiscal Year 2015,” Office of Management and Budget, http://goo.gl/ezjk33, p. 216. 40 “Present Law, Data, and Analysis Relating to Tax Incentives for Residential Real Estate,” Joint Committee on Taxation, JCX-10-13, April 22, 2013. 41 “Present Law, Data, and Analysis Relating to Tax Incentives for Residential Real Estate,” Joint Committee on Taxation, JCX-10-13, April 22, 2013. 42 Internal Revenue Service, Table 2.1: Returns with Itemized Deductions: Sources of Income, Adjustments, Itemized Deductions by Type, Exemptions, and Tax Items, by Size
of Adjusted Gross Income, Tax Year 2011. 43 “Present Law, Data, and Analysis Relating to Tax Incentives for Residential Real Estate,” Joint Committee on Taxation, JCX-10-13, April 22, 2013. 44 “Present Law, Data, and Analysis Relating to Tax Incentives for Residential Real Estate,” Joint Committee on Taxation, JCX-10-13, April 22, 2013. 45 “Present Law, Data, and Analysis Relating to Tax Incentives for Residential Real Estate,” Joint Committee on Taxation, JCX-10-13, April 22, 2013. 46 For deduction data see Internal Revenue Service, Table 2.1: Returns with Itemized Deductions: Sources of Income, Adjustments, Itemized Deductions by Type, Exemptions,
and Tax Items, by Size of Adjusted Gross Income, Tax Year 2011. Revenue impact is estimated by assuming an accumulative 35% tax rate. This tax rate was determined by calculating a weighted-average taxable income for all taxpayers with adjusted gross income in excess of $500,000. Since the weighted-average taxable income was over $1.5 million, we believe a 35% tax rate is a conservative estimate for purposes of our analysis.
47 “Estimates of Federal Tax Expenditures for Fiscal Years 2014-2018,” Joint Committee on Taxation, August 5, 2014, http://goo.gl/Uf6wWn 48 “Present Law, Data, and Analysis Relating to Tax Incentives for Residential Real Estate,” Joint Committee on Taxation, JCX-10-13, April 22, 2013. 49 “Present Law, Data, and Analysis Relating to Tax Incentives for Residential Real Estate,” Joint Committee on Taxation, JCX-10-13, April 22, 2013. 50 Harris, Benjamin and Amanda Eng. (2013) “The Benefits of Mortgage Interest And Property Tax Deductions,” Tax Notes, August 26, 2013, p. 947. 51 Harris, Benjamin and Amanda Eng. (2013) “The Benefits of Mortgage Interest And Property Tax Deductions,” Tax Notes, August 26, 2013, p. 947. 52 Prante, Gerald. “Some Facts About the Mortgage Interest Deduction,” Tax Foundation Tax Policy Blog, November 5, 2006, 53 “Present Law, Data, and Analysis Relating to Tax Incentives for Residential Real Estate,” Joint Committee on Taxation, JCX-10-13, April 22, 2013. 54 Senate Committee on the Budget, “Tax Expenditures: Compendium of Background Material on Individual Provisions,” Congressional Research Service, December 2012,
http://goo.gl/8zqaqR, page 360. 55 Ventry Jr., Dennis J. (2012) “The Fake Third Rail of Tax Reform,” University of California-Davis Legal Studies Research Paper Series, Research Paper No. 289, April 2012. 56 Keightley, Mark. “The Mortgage Interest and Property Tax Deductions: Analysis and Options,” Congressional Research Service, January 18, 2011. 57 Keightley, Mark. “The Mortgage Interest and Property Tax Deductions: Analysis and Options,” Congressional Research Service, January 18, 2011. 58 Turner, Margaret Austin, Eric Today, Rolf Pendall, and Claudia Sharygin. “How Would Reforming the Mortgage Interest Deduction Affect the Housing Market?” Urban
Institute, March 2013. Available at http://goo.gl/9kwpEl, accessed August 20, 2013. 59 “Budget Options, Volume 2,” Congressional Budget Office, August 6, 2009, page 187-188. Available at http://goo.gl/PW9p04, accessed August 19, 2013. 60 Pender, Kathleen. “Mortgage interest deduction claims, facts,” San Francisco Gate, December 18, 2012. Available at http://goo.gl/ZBNtKx, accessed August 19, 2013. 61 “Present Law, Data, and Analysis Relating to Tax Incentives for Residential Real Estate,” Joint Committee on Taxation, JCX-10-13, April 22, 2013. Data derived from Table 1. 62 “Present Law, Data, and Analysis Relating to Tax Incentives for Residential Real Estate,” Joint Committee on Taxation, JCX-10-13, April 22, 2013. Data derived from Table 1. 63 “Present Law, Data, and Analysis Relating to Tax Incentives for Residential Real Estate,” Joint Committee on Taxation, JCX-10-13, April 22, 2013. Data derived from Table 3. 64 “Commentary: When Home Buying By the Poor Backfires,” Bloomberg Businessweek, October 31, 2004. Available at http://goo.gl/GvphE6, accessed August 20,2 013. 65 Keightley, Mark. “The Mortgage Interest and Property Tax Deductions: Analysis and Options,” Congressional Research Service, January 18, 2011. 66 Keightley, Mark. “The Mortgage Interest and Property Tax Deductions: Analysis and Options,” Congressional Research Service, January 18, 2011. 67 “High Home Ownership Can Seriously Damage Labor Market, New Study Suggests,” ScienceDaily.com, May 7, 2013, http://goo.gl/H43KkT, accessed August 20, 2013.

DRAFT
204 | Tax Decoder
68 Ventry Jr., Dennis J. (2012) “The Fake Third Rail of Tax Reform,” University of California-Davis Legal Studies Research Paper Series, Research Paper No. 289, April 2012. 69 Ventry Jr., Dennis J. (2012) “The Fake Third Rail of Tax Reform,” University of California-Davis Legal Studies Research Paper Series, Research Paper No. 289, April 2012. 70 “Budget Options, Volume 2,” Congressional Budget Office, August 6, 2009, page 187-188. Available at http://goo.gl/I2W2YL, accessed August 19, 2013. 71 “Eliminating or Curtailing Mortgage Interest Deduction Would Have Modest Long-Run Effects on Economy,” ScienceDaily.com, January 16, 2013, http://goo.gl/blRctF,
access August 20, 2013. 72 “Eliminating or Curtailing Mortgage Interest Deduction Would Have Modest Long-Run Effects on Economy,” ScienceDaily.com, January 16, 2013, http://goo.gl/DSsK0k,
access August 20, 2013. 73 Keightley, Mark. “The Mortgage Interest and Property Tax Deductions: Analysis and Options,” Congressional Research Service, January 18, 2011. 74 Nalder, Eric. “Declaring your boat a second home can bring big tax relief.” Seattle Post-Intelligencer, November 10, 2004. 75 Nalder, Eric. “Declaring your boat a second home can bring big tax relief.” Seattle Post-Intelligencer, November 10, 2004. 76 Nalder, Eric. “Declaring your boat a second home can bring big tax relief.” Seattle Post-Intelligencer, November 10, 2004. 77 Nalder, Eric. “Declaring your boat a second home can bring big tax relief.” Seattle Post-Intelligencer, November 10, 2004. 78 Nalder, Eric. “Declaring your boat a second home can bring big tax relief.” Seattle Post-Intelligencer, November 10, 2004. 79 Nalder, Eric. “Declaring your boat a second home can bring big tax relief.” Seattle Post-Intelligencer, November 10, 2004. 80 Kelly, Tom. “Second-home deduction awaits recreational vehicle owners,” The Spokesman-Review, July 14, 2013. 81 Hughes, Megan, “Scrutinizing the Second-Home Tax Deduction,” Bloomberg TV, July 23, 2013. Available at http://goo.gl/fcOFcO, accessed August 22, 2013. 82 Kelly, Tom. “Second-home deduction awaits recreational vehicle owners,” The Spokesman-Review, July 14, 2013. 83 “Housing Tax Incentives Economic Data,” National Association of Home Builders. 84 Schroeder, Alayna. “Home Equity Loan and HELOC Basics,” NOLO.com, http://goo.gl/RWVfRr, accessed January 29, 2014. 85 Keightley, Mark. “The Mortgage Interest and Property Tax Deductions: Analysis and Options,” Congressional Research Service, January 18, 2011. 86 Keightley, Mark. “The Mortgage Interest and Property Tax Deductions: Analysis and Options,” Congressional Research Service, January 18, 2011. 87 “Present Law, Data, and Analysis Relating to Tax Incentives for Residential Real Estate,” Joint Committee on Taxation, JCX-10-13, April 22, 2013. 88 “Estimates of Federal Tax Expenditures for Fiscal Years 2014-2018,” Joint Committee on Taxation, August 5, 2014, http://goo.gl/hppf0S 89 Senate Committee on the Budget, “Tax Expenditures: Compendium of Background Material on Individual Provisions,” Congressional Research Service, December 2012,
http://goo.gl/UivzGX, p. 370. 90 Puzzanghera, Jim. “Federal Housing Administration needs $1.7-billion bailout,” Los Angeles Times, September 27, 2013, http://goo.gl/9rulC0, accessed January 30, 2014. 91 Butterfield, Justin, Hiram Sasser, and Reed Smith. “The Parsonage Exemption Deserves Broad Protection,” Texas Review of Law & Politics, Vol. 16 (2), 251-276. 92 Johnston, David Cay. “YOUR TAXES; From Holy Men to Houses, a World of Tax Breaks,” New York Times, March 1, 1998. 93 Butterfield, Justin, Hiram Sasser, and Reed Smith. “The Parsonage Exemption Deserves Broad Protection,” Texas Review of Law & Politics, Vol. 16 (2), 251-276. 94 CRS Report on Tax issues. 95 “Exclusion for Ministers,” Summit Accounting Group, Inc., http://goo.gl/GTVUqI, accessed June 28, 2013. 96 Estimates of Federal Tax Expenditures for Fiscal Years 2014-2018,” Joint Committee on Taxation, August 5, 2014, http://goo.gl/LJw7e5 97 “Analytical Perspectives, Budget of the United States Government, Fiscal Year 2015,” Office of Management and Budget, http://goo.gl/jPqOO6, p. 207. 98 Senate Committee on the Budget, “Tax Expenditures: Compendium of Background Material on Individual Provisions,” Congressional Research Service, December 2012;
http://goo.gl/rz2nHZ 99 Revenue Ruling 83-3, Internal Revenue Service. 100 Senate Committee on the Budget, “Tax Expenditures: Compendium of Background Material on Individual Provisions,” Congressional Research Service, December 2012;
http://goo.gl/fUh4I4 101 Johnston, David Cay. “YOUR TAXES; From Holy Men to Houses, a World of Tax Breaks,” New York Times, March 1, 1998. 102 Johnston, David Cay. “YOUR TAXES; From Holy Men to Houses, a World of Tax Breaks,” New York Times, March 1, 1998. 103 Johnston, David Cay. “YOUR TAXES; From Holy Men to Houses, a World of Tax Breaks,” New York Times, March 1, 1998. 104 Letter from Benny Hinn Ministries to The Honorable Charles Grassley, September 9, 2008. Available at http://goo.gl/oWZ30b, accessed June 28, 2013. 105 Letter from Benny Hinn Ministries to The Honorable Charles Grassley, September 9, 2008. Available at http://goo.gl/m98LYm, accessed June 28, 2013. 106 Pinksy, Mark. “Christian recording artist hit with divorce, lawsuit,” The Orlando Sentinel, January 21, 2005. 107 Pinksy, Mark. “Christian recording artist hit with divorce, lawsuit,” The Orlando Sentinel, January 21, 2005. 108 Cull, Bob. “Tax-Free Mansions for Jesus! Megachurch That Bought Pastor $1.7M Home Refuses to Release Financial Records,” Americans Against the Tea Party blog,
November 6, 2013, http://goo.gl/PaJmFI, accessed January 22, 2014. 109 Cull, Bob. “Tax-Free Mansions for Jesus! Megachurch That Bought Pastor $1.7M Home Refuses to Release Financial Records,” Americans Against the Tea Party blog,
November 6, 2013, http://goo.gl/rO1HWI, accessed January 22, 2014. 110 “Salvation Army owns millions of dollars worth of homes,” 11 Alive news, May 15, 2013, http://goo.gl/m4eL1F, accessed January 22, 2014. 111 Johnston, David Cay. “YOUR TAXES; From Holy Men to Houses, a World of Tax Breaks,” New York Times, March 1, 1998. 112 Anton, Mike. “Pastoral Tax Break Faces Legal Test,” Los Angeles Times, April 6, 2002. 113 Congressional Research Service. “Tax Expenditures: Compendium of Background Material on Individual Provisions” December 28, 2012. Available at http://goo.gl/yFr0tp 114 Internal Revenue Service, Publication 15-B, Fringe Benefit Overview. Available at http://goo.gl/J0zaYS, accessed January 22, 2014. 115 Liautaud, Marian V. “A Breakdown of Salaries and Benefits for Senior Pastors,” Managing Your Church blog, April 3, 2012, http://goo.gl/1qsZnp, accessed January 22, 2014. 116 Barrick, Audrey. “Church Pastors’ Pay Rises to More than $80,000,” Christian Post, August 19, 2008. Available at http://goo.gl/FMlhzc, accessed January 22, 2014. 117 “Housing Assistance: Opportunities Exist to Increase Collaboration and Consider Consolidation,” Government Accountability Office, GAO-12-554, August 2012, page 57. 118 Estimates of Federal Tax Expenditures for Fiscal Years 2014-2018,” Joint Committee on Taxation, August 5, 2014, http://goo.gl/E0MhHE 119 Estimates of Federal Tax Expenditures for Fiscal Years 2014-2018,” Joint Committee on Taxation, August 5, 2014, http://goo.gl/6NYgCg 120 “264 – Statement by the President Upon Signing the Revenue Act of 1951,” President Harry S. Truman, October 20, 1951 121 Gravelle, Jane. “The Exclusion of Capital Gains for Owner-Occupied Housing,” Congressional Research Service, December 26, 2007, RL32978. 122 Gravelle, Jane. “The Exclusion of Capital Gains for Owner-Occupied Housing,” Congressional Research Service, December 26, 2007, RL32978. 123 Bajaj, Vikas and David Leonhardt. “Tax Break May Have Helped Cause Housing Bubble,” New York Times, December 19, 2008. 124 Bajaj, Vikas and David Leonhardt. “Tax Break May Have Helped Cause Housing Bubble,” New York Times, December 19, 2008. 125 Homeowners whose spouses passed away are allowed a $500,000 cap if they sell the principal residence within two years of the spouse’s passing. 126 Pettus, Ashley. “Immobile Labor,” Harvard Magazine, January-February 2013, http://goo.gl/SJpBV4 127 Cunningham, Christopher R., Gary V. Englehardt. (2008) “Housing capital-gains taxation and homeowner mobility: Evidence from the Taxpayer Relief Act of 1997,” Journal
of Urban Economics, 63: 803-815. 128 Cunningham, Christopher R., Gary V. Englehardt. (2008) “Housing capital-gains taxation and homeowner mobility: Evidence from the Taxpayer Relief Act of 1997,” Journal
of Urban Economics, 63: 803-815. 129 Bajaj, Vikas and David Leonhardt. “Tax Break May Have Helped Cause Housing Bubble,” New York Times, December 19, 2008. 130 Gravelle, Jane. “The Exclusion of Capital Gains for Owner-Occupied Housing,” Congressional Research Service, December 26, 2007, RL32978. 131 Gravelle, Jane. “The Exclusion of Capital Gains for Owner-Occupied Housing,” Congressional Research Service, December 26, 2007, RL32978. 132 Estimates of Federal Tax Expenditures for Fiscal Years 2014-2018,” Joint Committee on Taxation, August 5, 2014, http://goo.gl/I71wNq 133 “May Pending Home Sales Reach HIghest Level in Over Six Years,” National Association of Realtors, June 27, 2013, http://goo.gl/8Yr5Ko, accessed July 18, 2013. 134 Gravelle, Jane. “The Exclusion of Capital Gains for Owner-Occupied Housing,” Congressional Research Service, December 26, 2007, RL32978. 135 Bell, Kay. “Pocketing tax-free rental income,” Bankrate.com, June 11, 2013, http://goo.gl/Nkap2I, accessed January 30, 2014. 136 Congressional Budget Office, “Options to Improve Tax Compliance and Reform Tax Expenditures,” January 27, 2005, JCS-02-05, http://goo.gl/mmV5sE, accessed January
31, 2014. 137 Charlesworth, Michelle. “Renting homes out in New York area for Super Bowl for big money,” WABC, January 20, 2014, http://goo.gl/VbBzCR, accessed January 30, 2014. 138 Charlesworth, Michelle. “Renting homes out in New York area for Super Bowl for big money,” WABC, January 20, 2014, http://goo.gl/bSrgQE, accessed January 30, 2014. 139 Maresca, Rachel. “Kevin Jonas, pregnant wife list New Jersey home to rent for week of Super Bowl at $20,000 a night,” New York Daily News, January 29, 2014, http://goo.
gl/h3pqAx, accessed January 30, 2014.

204 | Tax Decoder Housing | 205
140 Maresca, Rachel. “Kevin Jonas, pregnant wife list New Jersey home to rent for week of Super Bowl at $20,000 a night,” New York Daily News, January 29, 2014, http://goo.gl/LfJgCH, accessed January 30, 2014.
141 CelebrityNetWorth.com, “Kevin Jonas Net Worth,” http://goo.gl/stQUBd, accessed January 30, 2014. 142 Notte, Jason. “Super Bowl Home Rental Is a Tempting Gamble,” TheStreet.com, January 8, 2014, http://goo.gl/w8tg61, accessed January 30, 2014. 143 Notte, Jason. “Super Bowl Home Rental Is a Tempting Gamble,” TheStreet.com, January 8, 2014, http://goo.gl/Vq5gse, accessed January 30, 2014. 144 OvertheCap.com, “Cooper Taylor,” http://goo.gl/4FK7ib, accessed January 30, 2014. 145 “Super Bowl Vacation Dream Home,” HomeAway.com, http://goo.gl/WhLDk5, accessed January 30, 2014. 146 Bell, Kay. “Pocketing tax-free rental income,” Bankrate.com, June 11, 2013, http://goo.gl/LWBl7u, accessed January 30, 2014. 147 Caron, Paul. “Extreme Makeover = Extreme Taxes? Tax Consequences of Home-Makeover TV Shows,” TaxProf Blog, May 10, 2004, http://goo.gl/dFG6Bb, accessed January
31, 2014. 148 Caron, Paul. “Extreme Makeover = Extreme Taxes? Tax Consequences of Home-Makeover TV Shows,” TaxProf Blog, May 10, 2004, http://goo.gl/dFG6Bb, accessed January
31, 2014. 149 Nitti, Tony. “The Masters: A Tax Break Unlike Any Other,” Forbes.com, April 9, 2013, http://goo.gl/jnrfO4, accessed January 30, 2014. 150 Dietz, Robert. “A Win-Win-Win for Affordable Housing,” US News Economic Intelligence Blog, September 5, 2013, available at http://goo.gl/H0XotG, accessed January
22, 2014. 151 2014 JCT Report 152 Pristin, Terry. “Who Invests In Low-Income Housing? Google, for One,” New York Times, January 25, 2011. 153 Pristin, Terry. “Who Invests In Low-Income Housing? Google, for One,” New York Times, January 25, 2011. 154 Senate Committee on the Budget, “Tax Expenditures: Compendium of Background Material on Individual Provisions,” Congressional Research Service, December 2012;
http://goo.gl/wz3rWl 155 McCarthy, Maggie. “Introduction to Public Housing,” Congressional Research Service, December 27, 2012, R41654. 156 From 2008-2013, Congress temporarily increased the minimum tax credit rate investors would receive to 9% for new construction projects and 4% for renovations. Both
rates are higher than investors would otherwise receive, resulting in more lost federal revenue. Over the last decade, the credit rate for new construction floated between 8 and 9 percent, depending on current interest rates.
157 Estimates of Federal Tax Expenditures for Fiscal Years 2014-2018,” Joint Committee on Taxation, August 5, 2014, http://goo.gl/hrybHN 158 Estimates of Federal Tax Expenditures for Fiscal Years 2014-2018,” Joint Committee on Taxation, August 5, 2014, http://goo.gl/UM6LS9 159 Senate Committee on the Budget, “Tax Expenditures: Compendium of Background Material on Individual Provisions,” Congressional Research Service, December 2012;
http://goo.gl/gu7OoW 160 Eriksen, Michael and Stuart Rosenthal. (2010) “Crowd Out Effects of Place-Based Subsidized Rental Housing: New Evidence from the LIHTC Program.” Available at http://
goo.gl/k9k2MG, accessed August 12, 2013. 161 “Estimates of Federal Tax Expenditures for Fiscal Years 2014-2018,” Joint Committee on Taxation, August 5, 2014, http://goo.gl/FxV9d0. 162 Pristin, Terry. “Who Invests In Low-Income Housing? Google, for One,” New York Times, January 25, 2011. 163 Pristin, Terry. “Who Invests In Low-Income Housing? Google, for One,” New York Times, January 25, 2011. 164 “2013 Financial Tables,” Google Investor Relations, http://goo.gl/T9N4X4. 165 Pristin, Terry. “Who Invests In Low-Income Housing? Google, for One,” New York Times, January 25, 2011. 166 Pristin, Terry. “Who Invests In Low-Income Housing? Google, for One,” New York Times, January 25, 2011.. 167 U.S. Bank, “Our Portfolio of Tax Credit Investments,” http://goo.gl/TdE0zE, accessed August 13, 2013. 168 “Tax Credit Capital,” PNC Real Estate, http://goo.gl/b262G1. 169 “BofA Provides $2.6 Billion for Community Development, Apartment Finance Today, February 14, 2013. Available at http://goo.gl/TJpSSY, accessed August 15, 2013. 170 See SEC Form 10-K for each bank (US Bancorp, PNC Bank, and Bank of America). 171 For funding figure: Eriksen, Michael and Stuart Rosenthal. (2010) “Crowd Out Effects of Place-Based Subsidized Rental Housing: New Evidence from the LIHTC Program.”
Available at http://goo.gl/Z6groK, accessed August 12, 2013. 172 Senate Committee on the Budget, “Tax Expenditures: Compendium of Background Material on Individual Provisions,” Congressional Research Service, December 2012,
http://1.usa.gov/17wTyob. 173 Malpezzi, Stephen and Kerry Vandell. (2002) “Does the Low-Income Housing Tax Credit Increase the Supply of Housing?” Journal of Housing Economics, 11(4):360-380. 174 Eriksen, Michael and Stuart Rosenthal. (2010) “Crowd Out Effects of Place-Based Subsidized Rental Housing: New Evidence from the LIHTC Program.” Available at http://
goo.gl/zslgqH, accessed August 12, 2013. 175 For example, see Affordable Housing Credit Coalition’s Submission to the House Committee on Ways and Means, April 15, 2013, available at http://goo.gl/g6izZk, accessed
January 21, 2014. 176 “Community Reinvestment Act: Challenges in Quantifying Its Effect on Low-Income Housing Tax Credit Investment,” Government Accountability Office, GAO-12-869R,
August 28, 2012. 177 “Community Reinvestment Act: Challenges in Quantifying Its Effect on Low-Income Housing Tax Credit Investment,” Government Accountability Office, GAO-12-869R,
August 28, 2012. 178 “Community Reinvestment Act: Challenges in Quantifying Its Effect on Low-Income Housing Tax Credit Investment,” Government Accountability Office, GAO-12-869R,
August 28, 2012. 179 Senate Committee on the Budget, “Tax Expenditures: Compendium of Background Material on Individual Provisions,” Congressional Research Service, December 2012;
http://goo.gl/P0SLpP 180 Pristin, Terry. “Who Invests In Low-Income Housing? Google, for One,” New York Times, January 25, 2011. 181 “Federal Housing Assistance: Comparing the Characteristics and Costs of Housing Programs,” Government Accountability Office, GAO-02-76, January 2002. 182 “Federal Housing Assistance: Comparing the Characteristics and Costs of Housing Programs,” Government Accountability Office, GAO-02-76, January 2002. 183 Deng, Lan. “The Cost-Effectiveness of the Low-Income Housing Tax Credit Relative to Vouchers: Evidence from Six Metropolitan Areas,” Housing Policy Debate, 16(3/4):
469-511. 184 “What Happens to Low-Income Housing Tax Credit Properties at Year 15 and Beyond?” U.S. Department of Housing and Urban Development, Office of Policy Development
and Research, August 2012. 185 “The Cost-Effectiveness of the Low-Income Housing Tax Credit Compared with Housing Vouchers,” Congressional Budget Office, April 1992. 186 National Low Income Housing Coalition, Housing Spotlight Newsletter, Vol. 3, Issue 2, February 2013. 187 National Low Income Housing Coalition, Housing Spotlight Newsletter, Vol. 3, Issue 2, February 2013. 188 O’Regan, Katherine and Keren Horn, “What Can We Learn about the Low Income Housing Tax Credit Program by Looking at the Tenants,” Furman Center for Real Estate
and Urban Policy -- New York University, October 2012. 189 O’Regan, Katherine and Keren Horn, “What Can We Learn about the Low Income Housing Tax Credit Program by Looking at the Tenants,” Furman Center for Real Estate
and Urban Policy -- New York University, October 2012. 190 “FY 2013 Median Family Income Documentation System,” U.S. Department of Housing and Urban Development, http://goo.gl/KkypQr, accessed August 15, 2013. 191 O’Regan, Katherine and Keren Horn, “What Can We Learn about the Low Income Housing Tax Credit Program by Looking at the Tenants,” Furman Center for Real Estate
and Urban Policy -- New York University, October 2012. 192 O’Regan, Katherine and Keren Horn, “What Can We Learn about the Low Income Housing Tax Credit Program by Looking at the Tenants,” Furman Center for Real Estate
and Urban Policy -- New York University, October 2012. 193 O’Regan, Katherine and Keren Horn, “What Can We Learn about the Low Income Housing Tax Credit Program by Looking at the Tenants,” Furman Center for Real Estate
and Urban Policy -- New York University, October 2012. 194 “Housing Assistance: Opportunities Exist to Increase Collaboration and Consider Consolidation,” Government Accountability Office, GAO-12-554, August 2012. 195 U.S. Department of Housing and Urban Development, FY2014 Congressional Justification for Community Development Fund, http://goo.gl/xmzqaq. 196 U.S. Department of Housing and Urban Development, FY2014 Congressional Justification for HOME Investment Partnerships Program, http://goo.gl/f21Hxm. 197 Case Study of Arcata, California Rental Project, U.S. Department of Agriculture. Available at http://goo.gl/V4XFHk, accessed August 13, 2013. 198 Kevin Hoover, “Seniors Peeved at Plaza Point,” Mad River Union, May 14 2014, http://goo.gl/3sSHmu 199 KIEM News Channel 3,“Seniors claim harassment; Speaking out against affordable housing management,” accessed August 15, 2014, http://goo.gl/sDkQqc

DRAFT
206 | Tax Decoder
200 Glenn Coppelman, “Financing the Redevelopment Proce$$,” NJIT “Roadmap to Mill Redevelopment” Seminar, June 26, 2012. Available at http://goo.gl/LqvfuH, accessed August 13, 2013.
201 Glenn Coppelman, “Financing the Redevelopment Proce$$,” NJIT “Roadmap to Mill Redevelopment” Seminar, June 26, 2012. Available at http://goo.gl/8Kv1OP, accessed August 13, 2013.
202 “Analytical Perspectives, Budget of the United States Government, Fiscal Year 2015,” Office of Management and Budget, http://goo.gl/CcdTkS, p. 206. 203 Cooper, Justin. “Multifamily Rental Housing: Financing with Tax-Exempt Bonds, Second Edition” Orrick, Herrington & Sutcliffe LLP. Available at http://goo.gl/CX1qyz,
accessed August 13, 2013. 204 “State of the National Council of State Housing Agencies to the House Ways and Means Committee in Support of Preserving and Strengthening the Low Income Housing
Tax Credit and Tax-Exempt Housing Bond Programs,” House Ways and Means Committee, April 25, 2013. 205 HUD FY 2014 Budget Justification. Available at http://goo.gl/hVmOGC, accessed August 13, 2013. 206 HUD FY 2014 Budget Justification. Available at http://goo.gl/LKWhsa, accessed August 13, 2013. 207 “Housing Assistance: Opportunities Exist to Increase Collaboration and Consider Consolidation,” Government Accountability Office, GAO-12-554, August 2012, page 57. 208 “Housing Assistance: Opportunities Exist to Increase Collaboration and Consider Consolidation,” Government Accountability Office, GAO-12-554, August 2012, page 57. 209 Eriksen, Michael and Stuart Rosenthal. (2010) “Crowd Out Effects of Place-Based Subsidized Rental Housing: New Evidence from the LIHTC Program.” Available at http://
goo.gl/U2HO1h, accessed August 12, 2013. 210 “Federal Housing Assistance: Comparing the Characteristics and Costs of Housing Programs,” Government Accountability Office, GAO-02-76, January 2002. 211 The annual cost of LIHTC is about $7.4 billion. The average Section 8 Housing Choice Voucher program cost per beneficiary is about $7,800 annually. At that average, the
funding going to LIHTC could support 950,000 people. 212 Schwartz, Alex. Housing Policy in the United States: An Introduction, Routledge: New York, 2006. 213 Internal Revenue Service, “Figuring Depreciation Under MACRS,” http://goo.gl/oUgXBy, accessed September 6, 2013. 214 Estimates of Federal Tax Expenditures for Fiscal Years 2014-2018,” Joint Committee on Taxation, August 5, 2014, http://goo.gl/u8glYS 215 Fisher, Jeffer, Brent Smith, Jerrold Stern, and Brian Webb. (2005) “Analysis of Economic Depreciation for Multi-Family Property,” Journal of Real Estate Research, 27(4):355-
369. 216 Fisher, Jeffer, Brent Smith, Jerrold Stern, and Brian Webb. (2005) “Analysis of Economic Depreciation for Multi-Family Property,” Journal of Real Estate Research, 27(4):355-
369. 217 Office of Management and Budget, Presidents Budget 2015, Analytical Perspectives, http://goo.gl/IJir0H 218 Hendershott, Patric, James Follian, David Ling. (1986) “Real Estate and the Tax Reform Act of 1986,” NBER Working Paper Series, Working Paper No. 2098. 219 Stock, Philip. (1987) “NOTE: The Passive Loss Rule: Closing the Door to a Tax Shelter While Opening the Floodgates to Interpretation,” Rutgers Law Review, Vol. 39: 591-617. 220 Kass, Benny. “Complex Tax Rules Govern Investment Property Deductions,” Washington Post, January 31, 1998. 221 Hendershott, Patric, James Follian, David Ling. (1986) “Real Estate and the Tax Reform Act of 1986,” NBER Working Paper Series, Working Paper No. 2098. 222 Hendershott, Patric, James Follian, David Ling. (1986) “Real Estate and the Tax Reform Act of 1986,” NBER Working Paper Series, Working Paper No. 2098. 223 Congressional Record, Senate – June 17, 1993, “Agreement of the Senate Finance Committee,” p. S7425. 224 Congressional Budget Office, “An Analysis for the President’s Budgetary Proposals for Fiscal Year 1993,” March 1992, http://goo.gl/rWvYbo, accessed January 29, 2014. 225 Congressional Research Memo titled “Exception To The Passive Loss Rules For Certain Real Estate Rental Activities,” September 12, 2013, prepared for the Office of Senator
Tom Coburn. 226 A number of restrictions govern borrower, home, and geographic eligibility for financing from an MRB. Most of the revenue (95%) must be used for borrowers who have
not owned a home in the previous three years. The borrower’s household income may not be higher than 115% of the geographic area’s median income, and the residence price may not exceed 90% of the area’s average price for single-family homes. In some cases, these rules are waived or different for homes purchased in less economically vibrant areas where most families have incomes at or below 80% of the state’s median family income.
227 Any mortgage interest not offset by the credit is still eligible for the standard mortgage interest deduction available to all homeowners. 228 The income restriction only applies for 15 years. 229 See 5 USC §142(d)(6) 230 Senate Committee on the Budget, “Tax Expenditures: Compendium of Background Material on Individual Provisions,” Congressional Research Service, December 2012;
http://goo.gl/hfhosB 231 The subprime mortgage exemption and the expanded volume cap on private activity bond provisions have since expired. 232 Maguire, Steven. “Tax-Exempt Bonds: A Description of State and Local Government Debt,” Congressional Research Service, RL30638, June 19, 2012. 233 Internal Revenue Service, Statistics of Income Division, August 2013, Table 7. Long-Term Tax-Exempt Private Activity Bonds, by Bond Purpose and Type of Issue, 2011. 234 Estimates of Federal Tax Expenditures for Fiscal Years 2014-2018,” Joint Committee on Taxation, August 5, 2014, http://goo.gl/HtG51x 235 Estimates of Federal Tax Expenditures for Fiscal Years 2014-2018,” Joint Committee on Taxation, August 5, 2014, http://goo.gl/fcTUA6 236 “2013 Tax-Exempt Housing Bonds Q&A,” National Council of State Housing Agencies, available at http://goo.gl/I3qhIF, accessed July 12, 2013. 237 For MRB participation data, “2013 Tax-Exempt Housing Bonds Q&A,” National Council of State Housing Agencies, available at http://goo.gl/9BYkwW, accessed July
12, 2013. For cost data, Senate Committee on the Budget, “Tax Expenditures: Compendium of Background Material on Individual Provisions,” Congressional Research Service, December 2012; http://goo.gl/okcNVh
238 For MRB participation data, “2013 Tax-Exempt Housing Bonds Q&A,” National Council of State Housing Agencies, available at http://goo.gl/brylKY, accessed July 12, 2013. For cost data, Senate Committee on the Budget, “Tax Expenditures: Compendium of Background Material on Individual Provisions,” Congressional Research Service, December 2012; http://goo.gl/9kCQOL
239 For MRB participation data, “2013 Tax-Exempt Housing Bonds Q&A,” National Council of State Housing Agencies, available at http://goo.gl/Dhc6wV, accessed July 12, 2013. For cost data, Senate Committee on the Budget, “Tax Expenditures: Compendium of Background Material on Individual Provisions,” Congressional Research Service, December 2012; http://goo.gl/qe7a7Q
240 Data available from national associations does not differentiate between rent-restricted and non-restricted units. If it does not, then the subsidy going to build apartments for the low income may be several times higher.
241 Senate Committee on the Budget, “Tax Expenditures: Compendium of Background Material on Individual Provisions,” Congressional Research Service, December 2012; http://goo.gl/3GJ9nv
242 “Home Ownership: Mortgage Bonds Are Costly and Provide Little Assistance to Those in Need,” Government Accountability Office, March 1988, GAO/RCED-88-111. Available at http://goo.gl/k3jpGG.
243 “Home Ownership: Mortgage Bonds Are Costly and Provide Little Assistance to Those in Need,” Government Accountability Office, March 1988, GAO/RCED-88-111. Available at http://goo.gl/LuNqah.
244 “Home Ownership: Mortgage Bonds Are Costly and Provide Little Assistance to Those in Need,” Government Accountability Office, March 1988. 245 “The Costs And Benefits Of Single-Family Mortgage Revenue Bonds: Preliminary Report,” Government Accountability Office, April 18, 1983. 246 “The Costs And Benefits Of Single-Family Mortgage Revenue Bonds: Preliminary Report,” Government Accountability Office, April 18, 1983. 247 Greulich, Erica, and John Quigley. (2009) “Housing subsidies and tax expenditures: The case of mortgage credit certificates,” Regional Science and Urban Economics, 39:
647-657. 248 Senate Committee on the Budget, “Tax Expenditures: Compendium of Background Material on Individual Provisions,” Congressional Research Service, December 2012;
http://goo.gl/GMl1iK 249 For MRB participation data, “2013 Tax-Exempt Housing Bonds Q&A,” National Council of State Housing Agencies, available at http://goo.gl/OvraO7, accessed July 12, 2013.
For cost data, CRS report. Note, because the NCSHA number does not distinguish between rent-restricted and market rate apartments, the actual number of low-income families served each year may be far below 27,000.
250 The average Section 8 Housing Choice Voucher program cost per beneficiary is about $7,800 annually. At that average, the lost revenue from rental housing bonds could support 100,000 households.
251 Senate Committee on the Budget, “Tax Expenditures: Compendium of Background Material on Individual Provisions,” Congressional Research Service, December 2012; http://goo.gl/7vWxwK

206 | Tax Decoder Indian Tribes | 207
INDIAN TRIBES

DRAFT
208 | Tax Decoder
Indian Tribes
There are currently 566 federally recognized tribes within the United States.1 As a whole, Native Americans are, on average, the poorest ethnic group in the United States, with a 2012 poverty rate of more than 29 percent for single-race American Indians and Alaska Natives, nearly double the nation-wide poverty rate of 16 percent.
Over 100 federal programs, not including tax incentives, are available to assist Indians with economic development, and at least 16 of these are targeted at Indians specifically.2
Despite these programs, some of the poorest areas in the United States are still within Indian reservations. The Pine Ridge Indian Reservation in South Dakota, for example, is estimated to have a 49 percent poverty rate and 80 percent unemployment rate.3
Despite the widespread hardship among tribal members, a handful of tribes have been very successful taking advantage of the privileges extended to the tribes—most notably, the tribes’ exemptions from gambling laws. A few tribes have become spectacularly wealthy from tribe-owned casino operations. The New York Times reported in 2012 that the Shakopee Mdewakanton tribe of Minnesota, thought to be the wealthiest tribe in the nation, paid each of its 480 members about $1.08 million a year out of the profits from Mystic Lake Casino and other gaming operations.4
By contrast, the Oglala Sioux Tribe, which one estimate places at nearly 30,000 members on Pinewood Indian Reservation, would only be able to pay an estimated $0.15 a month to each member if it were to evenly distribute revenues from the tribe-owned Prairie Wind Casino.5
A number of other tribes are able to share sizable casino profits among relatively small memberships. For example, the Seminole Tribe of Florida, which has only a few thousand members, owns the Hard Rock brand and multiple Hard Rock hotels, casinos, and restaurants.6,7 The Mohegan tribe in Con-necticut, also with a few thousand members, owns one of the largest casinos in the nation, the Mohegan Sun, which grossed over $1.1 billion in revenue in FY 2013.8 The Foxwoods Resort Casino, also in Connecticut, is owned by the Mashantucket Pequot Tribal Nation, and produced $1.04 in billion in revenue in FY 2013,9 but has less than a thousand members.10
As sovereign government entities, Indian tribes are not subject to the federal corporate income tax. A corporation
A residence in the economically depressed Pine Ridge Indian Reservation in South Dakota.
The gaming floor of the lavish Mohegan Sun casino, owned by the wealthy Mohegan Tribe of Indians of Connecticut.
Indian Tribes and Federal Taxes (in millions) FY 2014 FY 2014 - FY 2018Tax Exemption for Indian Tribes * *
Tribal Economic Development Bonds $50 $250
Depreciation for Business Property in Indian Reservations $56 $786
Indian Employment Tax Credit $21 $262
Total $127 $1,298
* The revenue loss associated with these provisions is either unknown or not included in order to avoid double counting

208 | Tax Decoder Indian Tribes | 209
wholly owned by a tribe is likewise typically exempt from this tax. This means most tribe-owned casino operations do not pay the federal corporate income tax. No specific section of the tax code provides these tax exemptions; the IRS has simply assumed tribes and their subdivisions are not subject to the corporate income tax since its creation.
Individual tribal members must generally pay federal income taxes, but certain income received from the tribe and other sources is tax-exempt. Certain non-federal taxes apply to tribes differently than federal taxes do; for example, many casinos pay significant gaming taxes to state or local governments under gaming compacts negotiated with these jurisdictions. These state and local taxes, however, are beyond the scope of this report.11
Tribal Casinos and Other Corporations
Corporations wholly owned by a tribe may be tax-exempt “regardless of whether the activities that produced the income are commercial or noncommercial in nature or are conducted on or off the Indian tribe’s reservation.”12
Tribally-owned corporations are only subject to federal tax if they are incorporated under state law. If established as a component of a tribal government, or federally chartered as a tribal corporation, or incorporated under tribal law, they are currently not taxed. Also, any income received by a tribe from a limited liability company (LLC) is not subject to tax.13
The most visible tribe-owned corporations are their casinos. Indian tribes gained unique privileges related to gaming operations after the 1987 Supreme Court case California v. Cabazon Band of Mission Indians. The Supreme Court wrote that state and local governments could not enforce civil laws on Indian reservations unless specifically permitted by Congress. Under the ruling, state and local governments have no authority to regulate gambling on reservation land unless Congress grants them authority to do so.14
At the time, federal funding for Indian tribes had been cut significantly, and federal agencies were encouraging tribal bingo to allow the tribes to generate their own revenue. In response to the Cabazon Band case, Congress passed the Indian
Gaming Regulatory Act (IGRA) in 1988, which established a process allowing tribes to negotiate with states to open Las Vegas-style gaming operations.15 Under this system, tribes are often exempt from the gambling restrictions that apply to the rest of the state, making casinos a uniquely lucrative business opportunity for tribes. The tax exemption for tribe-owned corporations gives tribal casinos an even greater advantage over non-tribal gambling operations.
Nearly 240 tribes, more than half of federally-recognized Indian tribes, were operating more than 420 gaming establishments across 28 states in 2012. The industry generated a total of $27.9 billion in revenue in 2012 alone.16 The industry transferred a total of about $11 billion of this revenue to tribal governments in 2012.17
The majority of tribal casinos bring in significant revenue; in 2012, at least 280 gaming establishments earned revenue of $10 million or more.18
In 2011, the Chickasaw Nation earned over $1.27 billion19 in revenue from its 17 gaming operations, including the Riverwind Casino in Norman, Oklahoma and the sprawling WinStar World Casino on the Oklahoma-Texas border, the largest casino in Oklahoma as measured by gaming floor space. The tribe paid no federal corporate income taxes on this income.20
While the casinos and resorts are the most high-profile tribal corporations, tribes own and operate a variety of other
Mystic Lake Casino in Minnesota.
The Foxwoods Resort Casino, one of the largest casinos in the United States, is owned by the Mashantucket Pequot Tribal Nation.

DRAFT
210 | Tax Decoder
businesses. For example, according to NewsOK.com, the Chickasaw Nation “had interests in banking, health care and other professional services, led by Chickasaw Banc Holding Co., which operates Bank2 in Oklahoma City, and Chickasaw Nation Industries, which provides services for state, federal and, private clients. Chickasaw businesses also include manufacturing, tourism, and energy.”21
Casinos still provide the vast majority of the tribe’s revenue. In 2011, the Chickasaw Nation earned 91.5 percent of its $1.39 billion in revenue from its 17 casinos.22
As another example, the Omaha Tribe runs two casinos in Nebraska, but also owns a farming company, a convenience store, and a construction company.23 The Menominee Indian Tribe of Wisconsin owns and operates a lumber and forest products company,24 and the Ute Indian Tribe in Utah owns a super market, gas stations, bowling alley, feedlot, data management firm, and a water utility.25
In Oregon, the Confederated Tribes of Warm Springs own and operate the Indian Head Casino,26 but also own a vacation resort, a power and water utility company, a lumber company, and two tile manufacturers.27 Unless incorporated under state law, none of these businesses would pay the corporate income tax.
Warm Springs Composite Products, also owned by the tribes, manufactures Tectonite, a fire-resistant material used
in the construction industry. Although Tectonite competes with several comparable fire-resistant products, Warm Springs Composite Products pays no corporate income tax.28
Tribal governments
Tribal governments enjoy many of the same tax advantages as state governments. However, in some cases, tribal governments face limitations in the use of these privileges that do not apply to any other state or local government in the United States.
Like state governments, the tribes themselves are exempt from taxation. Also like state governments, the tribes may receive tax-deductible charitable contributions. State governments and other political subdivisions are exempt from a number of federal excise taxes, including a tax on special fuels, a manufacturers excise tax, a communications excise tax, and a tax on the use of certain highway vehicles. Tribal governments receive the same exemptions—but only if the transaction in question involves the exercise of an essential government function. An essential government function is considered one that is customarily performed by a state government with general taxing power.29 A truck used to support a tribe-owned casino or grocery store, therefore,
The Mohegan Sun, one the largest casinos in the world, is owned by the Mohegan Tribal Gaming Authority, an instrumentality of the Mohegan Tribe of Indians of Connecticut
In 2013, the Mohegan Sun produced $1.12 billion in net revenues, but was not subject to the federal corporate income tax.

210 | Tax Decoder Indian Tribes | 211
would not be exempt from the fuel excise tax or highway vehicle excise tax. This restriction does not apply to ordinary state and local governments.
Indian tribes and wholly-owned tribal corporations, like State or local governments, may elect to pay the six percent Federal Unemployment Tax Act (FUTA) tax only when a former employee claims unemployment benefits. The amount that would be owed under FUTA in these situations would generally be equal to the amount of unemployment benefits claimed.30
Taxes Related to Gambling
While tribes partially share most of the excise tax exemptions enjoyed by state governments, there is one important excise tax from which they have no exemption: the federal excise tax on gambling. States may operate sweepstakes, wagering pools, lotteries, and coin-operated devices such as slot machines without paying this tax, but tribes do not share this exemption.
The tax is equal to 0.25 percent of the wager, or 2 percent for wagers not authorized under the state’s law. Although tribes may be able to conduct gaming not authorized by the state, they must pay the higher two percent tax if they choose to conduct these games. Also, a $50 annual occupational tax applies to each casino worker that receives wagers, rising to $500 for gambling not authorized by the state.
In some cases, tribes may distribute the proceeds from gaming operations to their members. These distributions are subject to the federal income tax. The customers of tribal casinos, whether tribal members or not, must pay the same federal taxes on gambling winnings that apply to gaming operations run by states, such as the 25 percent withholding on certain large winnings.
Tax-exempt bonds
Like state and local governments, tribes may issue tax-exempt bonds, but in most cases, the bonds must be for an essential government function. For purposes of tax-exempt bonds, essential government functions are activities that numerous state and local governments have conducted and funded with tax-exempt bonds for many years. They also may not be commercial or industrial activities.
This means tribes may not usually issue most private-activity bonds, nor may they issue governmental bonds to support nontraditional projects such as hotels, casinos, gas stations, grocery stores or marinas.
There are two exceptions to the “essential government function” restriction, however. First, tribes may issue an unlimited amount of tax-exempt private-activity bonds for “tribal manufacturing facilities.” To qualify for these bonds, the facilities must be owned and operated by tribal governments, be located on “qualified Indian lands,” and employ tribal members.
Second, the 2009 “stimulus bill” authorized tribes to issue $2 billion of “tribal economic development bonds.” These are tax-exempt bonds that may be used to finance any project a state or local government could finance—except for gambling facilities. Portions of buildings that house class II or class III gaming are prohibited from receiving financing. Other than this, a tribal economic development bond could be used to finance any of the projects that private-activity bonds finance, such as privately-used transit facilities, utilities, home mortgages, student loan programs, and nonprofit facilities. They could also be used to finance the same nontraditional projects that state and local governments sometimes fund with governmental bonds, such as government-owned restaurants, hotels, convention centers, and stadiums. Only facilities located within an Indian reservation qualify.31
Although they may not be used for casino facilities, nothing prevents the use of Tribal Economic Development Bonds for facilities that support casinos, such as hotels and restaurants. In 2009 and 2010, the IRS allocated more than $33 million in authority to issue the bonds to the Fort Sill Apache Tribe of Oklahoma.32 The tribe issued $28.7 million of the bonds in 2011.33 In 2012, with financing from the bonds, the 132-room Apache Casino Hotel opened in Lawton, OK, complete with a spa, restaurant, bar, coffee shop, and conference space. The hotel is directly adjacent to the tribe’s casino and was projected to increase casino revenues by 20 percent.34
The IRS had allocated all $2 billion of volume cap authority for the Tribal Economic Development Bonds among the tribes by early 2010. As of March 31, 2012, however, tribes had actually issued only about 10 percent of the available amount. All unused volume cap authority was forfeited after the March 31 deadline, and was made available for reallocation on a first-come, first-served basis.35 The JCT report notes that many tribes have difficulty accessing the bond market due to “limited revenue sources and poor credit quality.”36 As
In 2011, the Chickasaw Nation earned over $1.27 billion in revenue from its 17 gaming operations, but does not pay federal corporate income taxes.

DRAFT
212 | Tax Decoder
of June 1, 2014, $1.4 billion in cap volume authority remained available.37 Each tribal government was originally limited to $30 million in volume cap authority;38 now, however, a single tribal government may issue up to 20 percent of the remaining available amount—as of June 1, 2014, therefore, a single tribe could issue up to $279 million in tribal economic development bonds.39
On the IRS allocation schedules, the Ft. Sill Apache Tribe project is listed as a “tourism facility,” a term used for 35 other projects on the two schedules.40 Although many of the tribes were ultimately unable to issue the bonds, this terminology suggests that many of the bonds that were issued may have been used to support casinos.
JCT estimates tribal economic development bonds result in less than $50 million in decreased revenue per year.41
Economic Development Incentives
Three different tax preferences meant to encourage economic development on Indian reservations expired at the end of 2013, but have been included in the EXPIRE Act.
Accelerated depreciation for business property on Indian reservations
This provision, known to the GAO as Indian reservation depreciation (IRD),42 allows businesses to depreciate nonres-idential real property more rapidly than they would be able to under ordinary tax law, allowing them to claim deductions for the property sooner. The accelerated recovery periods are generally about 60 percent of the duration of the full period.
The accelerated depreciation is available for property which is used predominantly in a trade or business within an Indian reservation. The property may not be located or regularly used outside of the reservation, unless it is a utility or transportation infrastructure designed to connect with qualified property within the reservation. The property may
not be used for gaming activities.43
Extending this provision in perpetuity is estimated to cost $56 million in FY 2014 and $786 million from FY 2014 through FY 2018.44
The Indian Employment Tax Credit
Employers may claim a credit for the first $20,000 of wages and health insurance costs paid by the employer to a qualified employee. To calculate the credit, the employer first totals all current-year wages and insurance costs below $20,000 per employee. He then compares this amount to the same costs in 1993. The credit is equal to 20 percent of the difference. The employer’s total business deductions are reduced by the amount of the credit.
Qualified employees must be members of Indian tribes or spouses of members, must generally work and live within the reservation, and may not be employed in support of gaming activities, among other requirements.45
Extending this provision in perpetuity is estimated to cost $21 million in FY 2014 and $262 million from FY 2014 through FY 2018.46
Empowerment Zones
Businesses within empowerment zones have access to a range of tax incentives. Part of Jackson County and all of Bennett and Shannon Counties in South Dakota comprised the Oglala Sioux Tribe Empowerment Zone, but this zone has been terminated.47 No tribes are included in the current list of Empowerment Zones.48 Since some of the poorest areas in the country are within Indian reservations, however, it is possible that future reauthorizations of the Empowerment Zone Program could allow the creation of new zones within these areas. President Obama has proposed Congress extend the Empowerment Zone tax incentives to the five “Promise Zones” he designated in 2014, one of which includes several southeast Oklahoma counties within the Oklahoma Tribal Statistical Area of the Choctaw Nation.49
The Apache Casino Hotel in Lawton, Oklahoma was built with over $27 million in tax-exempt Tribal Economic Development Bonds and is owned by the Ft. Sill Apache Tribe.

212 | Tax Decoder Indian Tribes | 213
Special Treatment for Oklahoma
Tribal economic development bonds, Indian Reservation Depreciation, and the Indian Employment Tax Credit are applied in a unique way in Oklahoma—all three incentives are available in “former Indian reservations.”50 The IRS writes, “Since Oklahoma has a large Indian population but does not currently have any Indian reservations, lawmakers wanted to insure those benefits would be available to those involved in business activity in Oklahoma by including in the legal definition of ‘Indian reservation’ the term ‘former Indian reservations in Oklahoma.’”51
The IRS has determined that “former Indian reservations” includes most of the geographic area of the state. Out of 77 Oklahoma counties, 53 lie fully within former reservations, including Tulsa County, the second most populous in the state, and 11 counties lie partially within them.52
Individual Tribal Members
Tribal members within the United States are U.S. citizens, and are subject to the U.S. personal income tax under the same rules as other citizens.53 Certain types of income distributed by tribal governments may be excluded from a tribal member’s gross income for tax purposes, however.54
Payments that qualify under the “general welfare doctrine,” for example, are excluded from taxation. To qualify under this doctrine, the payment must be:
1. made from a governmental fund, 2. for the promotion of general welfare, and3. not in compensation for services.
According to the JCT report, benefits that have qualified for tax exclusions in the past include disaster relief payments, adoption assistance, and housing and utility subsidies for low income individuals. Distributions made to all tribal members without regard to need would not qualify for the exclusion. The application of the need-based requirement has been uncertain in some cases.55 An IRS revenue procedure that became effective December 6, 2012 provided “safe harbors” for certain types of benefits that would be presumed to meet the general welfare doctrine, including housing, educational, elder, disabled, transportation, and emergency benefits that meet certain criteria. The benefits must be provided by a tribal government program under written guidelines, be available to any member of the tribe that qualifies under the guidelines, and not be lavish or extravagant.
There is also language in the revenue procedure dealing specifically with Indian traditional practices. Existing court decisions ensure the patient pays no taxes when an Indian tribe makes payments to an “Indian medicine man to use traditional practices for the purpose of treating a tribal member’s disease.” The revenue procedure also guarantees the nontaxability for payments for “Indian tribal medicines.”
Other benefits given safe harbor include payments for food, lodging, transportation, and participation in “pow-wows, cere-monies, and traditional dances,” as well as payments to visit cul-turally significant sites or receive instruction about a tribe’s his-tory and culture. Payments for “funeral and burial expenses and expenses of hosting or attending wakes, funerals, burials, other bereavement events, and subsequent honoring events” are also guaranteed to be non-taxable. Finally, nontaxability is assured for nominal cash honoraria and “items of cultural significance”
The Shakopee Mdewakanton tribe’s annual Wacipi, or pow-wow. Under recently-issued IRS regulations, tribal members pay no tax on benefits provided to them by their tribe to pay for food, lodging, transportation, and other expenses associated with participating in pow-wows and other cultural events.56

DRAFT
214 | Tax Decoder
awarded to “medicine men, medicine women, and shamans” to recognize their participation in these cultural events.57
Several other types of income are exempt from tax for tribal members. This includes income from the exercise of certain treaty-recognized fishing rights, certain class-action settlement payments to all members of a tribe, and per capita distributions made from certain Indian trust funds. Finally, income is tax-exempt if it is derived from logging, mining, farming, ranching, or similar activities on land held in trust by the federal government for the benefit of an Indian tribe.58
One curiously specific provision relates to native Alaskan whaling captains. A native whaling captain engaged in subsistence bowhead whale hunting pursuant to a management plan of the Alaska Eskimo Whaling Commission may claim a charitable deduction of up to $10,000 per year for expenses related to his vessels, gear, crew, and handling of the catch.59
Analysis and Recommendations
Corporate income tax
Tribal governments are unique among political entities in the United States. Although they are governmental entities, they also frequently own and operate for-profit business enterprises that compete directly with private-sector businesses. While state and local governments also sometimes engage in private-sector-style businesses, few governments are as widely involved as tribal governments in for-profit enterprises—particularly gambling operations.
Congress has recognized tribal government’s unique relationship with for-profit enterprises, and has taken steps to limit the ability of tribes to use the privileges of governmental units for business-related purposes. Thus, tribes may generally issue tax-exempt bonds and claim excise tax exemptions only for “essential government functions.” In addition, they may never use either of these privileges to support gambling operations.
The corporate income tax exemption should likewise be limited to tribal operations that serve essential government functions. Gambling operations, in particular, should explicitly be subject to the corporate income tax.
Individual Tribal Members
IRS regulations require tribes to maintain accurate books and records for all benefits provided under the general welfare exclusion.60 Congress should direct the Government Accountability Office (GAO) and IRS to examine the total value of “general welfare” benefits provided by the wealthiest tribes to their members to ensure these benefits are not “lavish or extravagant,” as required by IRS regulations. If evidence is found of widespread distribution of high-value
or lavish benefits, Congress should consider legislatively capping the total value of benefits that one taxpayer may exclude from their gross income.
Tax-exempt bonds
Indian reservations contain some of the most economically-challenged areas of the country, but they are also home to a handful of remarkably wealthy tribes. It is unlikely the Tribal Economic Development Bond program is benefiting the poorest Indian reservations. As discussed in the JCT report, the low issuance rate of the bonds is likely due to the lack of revenue sources and poor credit rating of many tribes. The bonds that have been issued have more likely benefited the minority of established, wealthy tribes that run lucrative gambling operations.
A search for bonds issued by tribes since 2009 turns up a number of tribes with large casino operations, including the Pequot, Quechan, Oneida, Seminole, and Ute tribes.61 Future bond-financed projects could, like the Apache Casino Hotel, directly support gambling enterprises. Under the current rules for the tribal bonds, a single tribe could issue $279 million worth of the bonds. Therefore, in the future, one of the wealthy tribes could use the bond program, intended to stimulate struggling reservation economies, for a lavish new hotel or similar project.
In short, the Tribal Economic Development Program is likely doing little or nothing to benefit the poorest Indian reservations like Pine Ridge. Instead, it is primarily subsidizing the business ventures of the wealthiest tribes at the expense of federal taxpayers—and in the process, potentially supporting a number of tribal casinos.
All unallocated volume cap authority to issue these bonds should be rescinded. Tribal governments will still be able to issue tax-exempt bonds for essential government functions, as always. They would no longer, however, be able to issue these bonds for non-traditional ventures such as restaurants, hotels, and convention centers. In the future, if bonds are issued to finance such projects, they would need to be issued as taxable bonds.
Indian reservation depreciation (IRD) and the Indian Employment Tax Credit
The GAO reported in 2008 that data was insufficient to evaluate the impact of Indian reservation depreciation (IRD) on the economies of tribal reservations. The agency wrote that to evaluate IRD’s economic impact, it must at a minimum know when taxpayers are claiming IRD, the amount invested in IRD properties, and the reservations on which they have placed IRD properties.62 Unfortunately, the IRS Form 4562 for depreciation does not collect this information. On the form, taxpayers can combine IRD properties with properties being depreciated through other

214 | Tax Decoder Indian Tribes | 215
methods, making it difficult to determine when IRD was used and how much was invested. The form also does not ask where depreciated properties are located.63 Without this data, it is impossible to identify correlations between IRD use and economic conditions on reservations.
IRD may also be at significant risk of tax fraud. Without location information on Form 4562, there is no way to know whether the property is actually located on an Indian reservation without a more extensive audit of the taxpayer’s books.64
Despite the complete lack of evidence that IRD is helping the economies of reservations—and the significant risk that IRD could be used fraudulently—Congress has extended the provision a total of five times,65 and is likely to do so again.
Information regarding the Indian employment credit is even more scarce. There is not even a report from the GAO or other agency explaining why there is no information, as there is for IRD. No analysis of the Indian employment credit’s impact on hiring and economic growth in reservations is available from the GAO, CRS, OMB, or JCT. The credit was originally enacted in 1993 and has been repeatedly extended numerous times with virtually no congressional scrutiny. Congress has never even bothered to update the base year used in calculation of the credit; employers still must compare current-year wage expenditures to their costs in 1993, requiring employers to maintain very old wage records.66 No agency or entity other than the IRS is involved in overseeing the credit.67 Needless to say, Congress does not know which businesses are claiming the credit, for how many employees it is claimed,
1 “Tribal Directory,” Department of Interior Indian Affairs, July 7 2014, http://goo.gl/ughrm9. 2 “Economic Development: Federal Assistance Programs for American Indians and Alaskan Natives,” GAO, December 2001; http://goo.gl/KurqLv, (p. 1) 3 “The Reservation,” The Red Cloud Indian School, http://goo.gl/dq2ui8 4 Williams, Timothy, “$1 Million Each Year for All, as Long as Tribe’s Luck Holds,” New York Times, August 9 2012, http://goo.gl/wBo6EG 5 “The Reservation,” The Red Cloud Indian School, http://goo.gl/dq2ui8 6 Kestin, Sally et al. “Seminole Tribe is Suddenly Wealthy, but Little Oversight Means Potential Abuses,” Sun Sentinel, November 25 2007, http://goo.gl/lqbZnQ 7 Garcia, Oskar, “Hard Rock Café sues Las Vegas Namesake Hotel,” NBC News, September 23 2010, http://goo.gl/uTTxKZ. Some properties, such as the Hard Rock Hotel
and Casino Las Vegas, are not owned by the tribe-owned corporation, Hard Rock International, but instead license the Hard Rock name from the company. 8 “Form 10-K,” US Security and Exchange Commission, September 30 2013, http://goo.gl/Y16HZ5, (p. 39) 9 Sturdevant, Matthew, “Foxwood Report Details Revenue Erosion, Debt Details, Risks of Increased Competition,” The Courant, January 8 2014, member 10 Melia, Michael, “Tribe $2 billion in debt after casio bonanza,” Associated Press, March 28, 2012, http://goo.gl/ybW5q3 11 “Overview of Federal Tax Provisions and Analysis of Selected Issues Relating to Native American Tribes and Their Members,” Joint Committee on Taxation, May 15
2012, http://goo.gl/hnXXyt. 12 “Overview of Federal Tax Provisions and Analysis of Selected Issues Relating to Native American Tribes and Their Members,” Joint Committee on Taxation, May 15
2012, http://goo.gl/qUmr3z, (p. 3). 13 Atkinson, Karen J. et al. “Tribal Business Structure Handbook,” Office of Indian Economic Energy and Development, 2008, http://goo.gl/CHxtze , (p. 1-6).
or for which reservations it is claimed. In short, virtually nothing is known about who is
benefiting from IRD and the Indian employment credit. Given the complexity of the two provisions, however, it is safe to say they are more often claimed by well-established, sophisticated businesses in wealthy reservations who can afford the lawyers and accountants necessary to understand them. It is difficult to envision a small business in an economically struggling area taking the time to understand provisions that Congress itself seems to scarcely be aware of.
If the federal government wishes to subsidize the economies of Indian reservations, the more logical way to do so would be through economic spending programs, where at least the exact dollar amounts of the subsidies, their intended recipients, and their ultimate use can be identified. Several such programs already exist, including the Indian Community Development Block Grant Program at the Department of Housing and Urban Development, the Indian Loans and Economic Development program at the Department of Interior, and support programs for forestry, agriculture, irrigation, and minerals and mining on Indian lands at the Department of Interior.68
There is certainly no need to allow federal tax revenue to be siphoned away to unknown beneficiaries for unknown results. Congress should allow IRD and the Indian employment credit to expire.

DRAFT
216 | Tax Decoder
14 “California v. Cabazon Band of Mission Indians,” OYEZ, November 5 2014, http://goo.gl/0xKEmW. 15 Smith, Jane M., “Indian Gaming: Legal Background and the Indian Gaming Regulatory Act (IGRA),” CRS, April 9, 2012; http://goo.gl/lp6Vu2. 16 “Indian Gaming Revenues Increase 2.7 Percent,” National Indian Gaming Commission, July 23 2013, http://goo.gl/3lSJrt. = 17 “2013 Semi Annual Report,” National Indian Gaming Association, 2013, http://goo.gl/t01tE3. 18 “Indian Gaming Revenues Increase 2.7 Percent,” National Indian Gaming Commission, July 23 2013, http://goo.gl/3lSJrt. 19 According to NewsOK.com, Chickasaw business revenue was 1.39 billion in 2011, 91.5 percent of which was from gaming. 20 Mize, Richard, “Oklahoma Gains more than Gaming from Chickasaw Nation, Study Shows,” NewsOK, July 8 2012, http://goo.gl/TAOKce. Image: “Oklahoma’s Top 10
Casinos,” 500 Nations, 2014, http://goo.gl/VN18Sn. 21 Mize, Richard, “Oklahoma Gains more than Gaming from Chickasaw Nation, Study Shows,” NewsOK, July 8 2012, http://goo.gl/TAOKce. 22 Mize, Richard, “Oklahoma Gains more than Gaming from Chickasaw Nation, Study Shows,” NewsOK, July 8 2012, http://goo.gl/TAOKce. 23 “Omaha Enterprises Path to Self- Sufficiency,” Omaha Tribe, 2013, http://goo.gl/bv1SOt. 24 “History,” MTE, http://goo.gl/LqRgIq. 25 “About the Utes,” Ute Indian Tribe, 2014, http://goo.gl/LsOGNJ. 26 “About,” Indian Head Casino, 2014, http://goo.gl/w83Ayn. 27 “Business Directory,” Confederated Tribes of Warm Springs, 2014, http://goo.gl/r2P6Oz. 28 “Tectonite,” Warm Springs Composite Products, http://goo.gl/9kAb4B. 29 “Overview of Federal Tax Provisions and Analysis of Selected Issues Relating to Native American Tribes and Their Members,” Joint Committee on Taxation, May 15
2012, http://goo.gl/8FfR8j, (p. 14 - 17). 30 “Overview of Federal Tax Provisions and Analysis of Selected Issues Relating to Native American Tribes and Their Members,” Joint Committee on Taxation, May 15
2012, http://goo.gl/8FfR8j, (p. 32 - 35). 31 “Overview of Federal Tax Provisions and Analysis of Selected Issues Relating to Native American Tribes and Their Members,” Joint Committee on Taxation, May 15
2012, http://goo.gl/8FfR8j, (p. 14 - 20, 17 - 23) 32 “IRS Announces Tribal Economic Development Bonds Allocations,” IRS, February 12 2014, http://goo.gl/FChr34. (Amounts are accessible from the links at the bottom
of the page) 33 Electronic Municipal Market Access, “FORT SILL APACHE TRIBE OKLA ECONOMIC DEV AUTH GAMING ENTERPRISE REV SER A-144A (OK)” CUSIP 348675AA7. 34 Ruckman, S.E., “Fort Sill Apache Open First Among Area Tribes,” Native American Times, 2014, http://goo.gl/XTpqgQ. 35 “Tribal Economic Development Bonds,” IRS, July 30 2012, http://goo.gl/FUccaF. 36 “Overview of Federal Tax Provisions and Analysis of Selected Issues Relating to Native American Tribes and Their Members,” Joint Committee on Taxation, May 15
2012, http://goo.gl/8FfR8j, (p. 20 - 23). 37 “Published Volume Cap Limit for Tribal Economic Development Bonds,” IRS, June 1 2014, http://goo.gl/jNaNpr. 38 “IRS announces Tribal Economic Development Bonds Allocations,” IRS, February 12 2014, http://goo.gl/X4LcSE. 39 “Published Volume Cap Limit for Tribal Economic Development Bonds,” IRS, October 3 2014, http://goo.gl/TkOWkY. 40 “Allocation Schedule of 1st Tranche of Tribal Economic Development Bonds,” IRS, http://goo.gl/VX7htH. 41 “Overview of Federal Tax Provisions and Analysis of Selected Issues Relating to Native American Tribes and Their Members,” Joint Committee on Taxation, May 15
2012, http://goo.gl/8FfR8j, (p. 25 - 28). 42 “Tax Expenditures: Available Data are Insufficient to Determine the Use and Impact of Indian Reservation Depreciation,” GAO, June 2008, http://goo.gl/QlknpV. 43 “Overview of Federal Tax Provisions and Analysis of Selected Issues Relating to Native American Tribes and Their Members,” Joint Committee on Taxation, May 15
2012, http://goo.gl/8FfR8j, (p. 26 - 27, 29 - 30). 44 “Estimates of Federal Tax Expenditures for Fiscal Years 2014-2018,” Joint Committee on Taxation, August 5 2014, http://goo.gl/WUjjU2. 45 “Overview of Federal Tax Provisions and Analysis of Selected Issues Relating to Native American Tribes and Their Members,” Joint Committee on Taxation, May 15
2012, http://goo.gl/8FfR8j, (p. 27 - 28, 30 - 31). 46 “Estimates of Federal Tax Expenditures for Fiscal Years 2014-2018,” Joint Committee on Taxation, August 5 2014, http://goo.gl/WUjjU2. 47 Abernathy, Jesse, “Native Sun News: $17M went to Empowerment Zone Program,” Indianz.com, November 30 2011, http://goo.gl/RW876O. 48 “ List of Current Empowerment Zones and Updated Contact Information,” HUD, January 2 2013, http://goo.gl/vkPki2. 49 “Fact Sheet: President Obama’s Promise Zones Initiatives,” The White House, January 8 2014, http://goo.gl/gANhej. 50 I.R.C. § 45A(c)(7), “26 U.S. Code § 45A - Indian employment credit,” Cornell University Law School, http://goo.gl/mLGJ7f. I.R.C. § 7871(f)(3)(B)(ii), “26 U.S. Code §
7871 - Indian tribal governments treated as States for certain purposes,” Cornell University Law School, http://goo.gl/BFUShr. I.R.C. § 168(j)(6), “26 U.S. Code § 168 - Accelerated cost recovery system,” Cornell University Law School, http://goo.gl/DoKclb.
51 “Geographic Boundaries Determined for Tax Incentives Associated with ‘Former Indian Reservations in Oklahoma’,” IRS, August 18 2012, http://goo.gl/3J505Y. 52 “Geographic Boundaries Determined for Tax Incentives Associated with ‘Former Indian Reservations in Oklahoma’,” IRS, August 18 2012, http://goo.gl/3J505Y. 53 “Frequently Asked Questions, ” U.S. Department of Interior Indian Affairs, http://goo.gl/BfyH9L. 54 “Overview of Federal Tax Provisions and Analysis of Selected Issues Relating to Native American Tribes and Their Members,” Joint Committee on Taxation, May 15
2012, http://goo.gl/zD7Pkc. (p. 7 - 10). 55 “Overview of Federal Tax Provisions and Analysis of Selected Issues Relating to Native American Tribes and Their Members,” Joint Committee on Taxation, May 15
2012, http://goo.gl/zD7Pkc. (p. 12 - 15). 56 Image: “History of the Shakopee Mdewakanton Dakota,” Shakopee Mdewakanton Sioux Community, 2009, http://goo.gl/FgQ5g9. 57 “Application of the General Welfare Exclusion to Indian Tribal Government Programs That Provide Benefits to Tribal Members,” IRS, http://goo.gl/erXJ71, (p. 16-20). 58 “Overview of Federal Tax Provisions and Analysis of Selected Issues Relating to Native American Tribes and Their Members,” Joint Committee on Taxation, May 15
2012, http://goo.gl/zD7Pkc. (p. 7 - 10). 59 “Overview of Federal Tax Provisions and Analysis of Selected Issues Relating to Native American Tribes and Their Members,” Joint Committee on Taxation, May 15
2012, http://goo.gl/zD7Pkc. (p. 33 - 36). 60 “Application of the General Welfare Exclusion to Indian Tribal Government Programs That Provide Benefits to Tribal Members,” IRS, http://goo.gl/erXJ71. 61 Search for “tribe” on “Quick Results, “EMMA, 2014; http://goo.gl/5GXbn2, sort by “dated date.” Not all of the bonds issued were necessarily Tribal Economic
Development Bonds. However, the records suggest that the only the wealthier tribes with established gaming operations are capable of issuing bonds of any kind. 62 “Tax Expenditures: Available Data are Insufficient to Determine the Use and Impact of Indian Reservation Depreciation,” GAO, June 2008, http://goo.gl/eiAIT3, (p.
9 – 13). 63 “Tax Expenditures: Available Data are Insufficient to Determine the Use and Impact of Indian Reservation Depreciation,” GAO, June 2008, http://goo.gl/eiAIT3, (p.
10 – 14). 64 “Tax Expenditures: Available Data are Insufficient to Determine the Use and Impact of Indian Reservation Depreciation,” GAO, June 2008, http://goo.gl/eiAIT3, (p.
14 – 18). 65 “Overview of Federal Tax Provisions and Analysis of Selected Issues Relating to Native American Tribes and Their Members,” Joint Committee on Taxation, May 15
2012, http://goo.gl/zD7Pkc. (p. 26 - 29). 66 “General Explanations of the Administration’s Fiscal Year 2015 Revenue Proposals,” Department of Treasury, March 2014, http://goo.gl/9UYRw2. 67 “Community Development: Limited Information on the Use and Effectiveness of Tax Expenditures Could Be Mitigated through Congressional Attention,” GAO,
February 2012, http://goo.gl/9GDKPA, (p. 84 - 90). 68 “Economic Development: Federal Assistance Programs for American Indians and Alaskan Natives,” GAO, December 2001, http://goo.gl/1Xk9Ob.

216 | Tax Decoder Military | 217
MILITARY

DRAFT
218 | Tax Decoder
Military
In acknowledgment of the special demands placed on our military, Congress has enacted a number of tax benefits for military service members and veterans designed to incentivize military service and make military pay more competitive. The Joint Committee on Taxation estimates special tax treatment for both active military and veterans will account for a
combined total of $15.6 billion in lost revenue in FY 2014.1
History & General Background
Historically, our military service members have been compensated in a combination of regular salary plus room and board, or rations.2 Today, service members are paid in a combination of cash, in-kind, and deferred compensation, with cash making up approximately 50 percent of a service member’s total compensation.3
Several of these exclusions, such as tax-free pay for men and women serving in a combat zone, are in need of reform to ensure the benefit is directed to those fighting overseas. Other exclusions, such as those used to cover basic living expenses, should also be examined. These tax exclusions not only create complexity in the tax code and lead service members to underestimate their total compensation, but may have unintended consequences that distort the intent of the provisions and result in an inequitable distribution of these benefits. Additionally, the pay raises of the past decade have enabled military pay to surpass that for comparably educated and skilled occupations in the private sector. It
is time for an examination of the continued need for this specific tax structure for members of the military
As it looks to comprehensive tax reform in the coming months or years, Congress should not ignore this section of the tax code, but instead look for ways to simplify the military pay structure, including benefits handed out through the tax code.
This section is not meant to be viewed as a comprehensive reform proposal for the military pay structure. Instead, it should be considered an educational tool to provide lawmakers, taxpayers, and members of the military with a clearer picture of the tax treatment of military compensation and benefits.
THIS IS NOT MEANT TO BE VIEWED AS A COMPREHENSIVE REFORM PROPOSAL FOR THE MILITARY PAY STRUCTURE. INSTEAD, IT SHOULD BE CONSIDERED AN EDUCATIONAL TOOL TO PROVIDE LAWMAKERS, TAXPAYERS, AND MEMBERS OF THE MILITARY WITH A CLEARER PICTURE OF THE TAX TREATMENT OF MILITARY COMPENSATION AND BENEFITS.
Military Tax Provisions (in millions) FY 2014 FY 2014 - FY 2018Exclusion of Certain Benefits and Allowances to Armed Forces Personnel
$5,800 $32,400
Exclusion of Combat Pay $1,300 $6,800
Miscellaneous Exclusions $8,500 $46,900
Total $15,600 $86,100
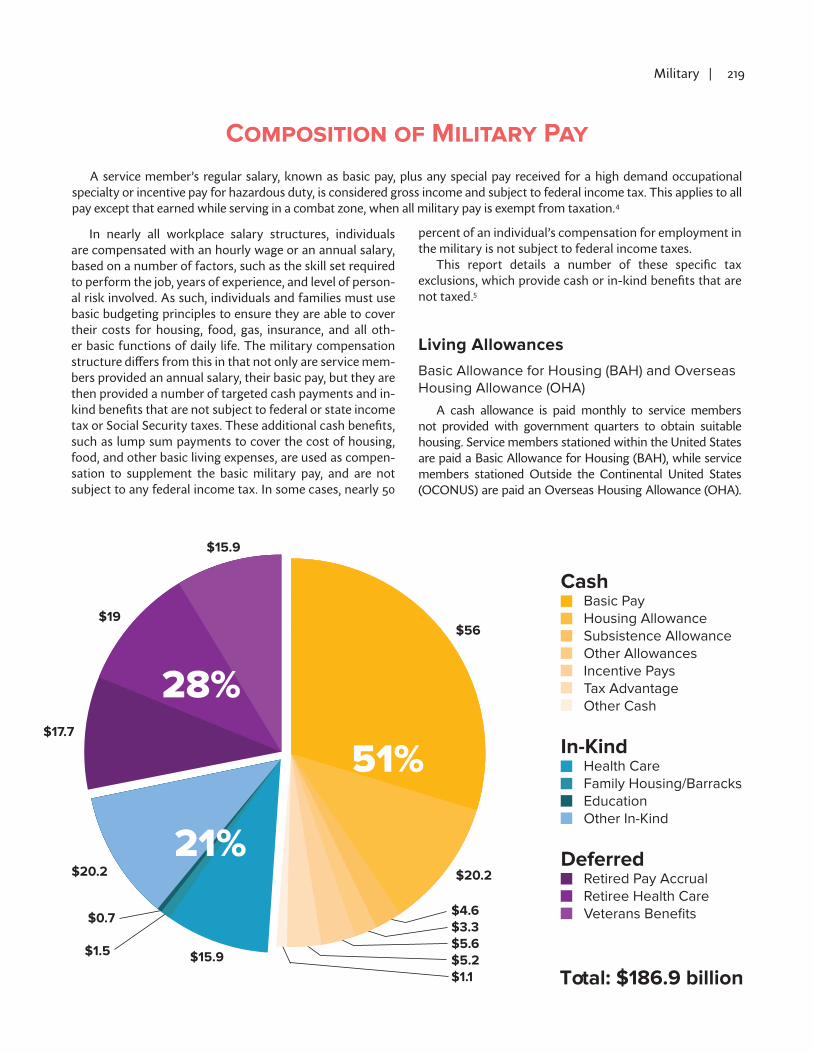
218 | Tax Decoder Military | 219
$56
$20.2
$4.6$3.3$5.6$5.2$1.1
$19
$17.7
$20.2
$0.7
$1.5 $15.9
$15.9
Total: $186.9 billion
51%
21%
28%
Composition of Military PayA service member’s regular salary, known as basic pay, plus any special pay received for a high demand occupational
specialty or incentive pay for hazardous duty, is considered gross income and subject to federal income tax. This applies to all pay except that earned while serving in a combat zone, when all military pay is exempt from taxation.4
In nearly all workplace salary structures, individuals are compensated with an hourly wage or an annual salary, based on a number of factors, such as the skill set required to perform the job, years of experience, and level of person-al risk involved. As such, individuals and families must use basic budgeting principles to ensure they are able to cover their costs for housing, food, gas, insurance, and all oth-er basic functions of daily life. The military compensation structure differs from this in that not only are service mem-bers provided an annual salary, their basic pay, but they are then provided a number of targeted cash payments and in-kind benefits that are not subject to federal or state income tax or Social Security taxes. These additional cash benefits, such as lump sum payments to cover the cost of housing, food, and other basic living expenses, are used as compen-sation to supplement the basic military pay, and are not subject to any federal income tax. In some cases, nearly 50
percent of an individual’s compensation for employment in the military is not subject to federal income taxes.
This report details a number of these specific tax exclusions, which provide cash or in-kind benefits that are not taxed.5
Living Allowances Basic Allowance for Housing (BAH) and Overseas Housing Allowance (OHA)
A cash allowance is paid monthly to service members not provided with government quarters to obtain suitable housing. Service members stationed within the United States are paid a Basic Allowance for Housing (BAH), while service members stationed Outside the Continental United States (OCONUS) are paid an Overseas Housing Allowance (OHA).

DRAFT
220 | Tax Decoder
BAH rates are determined by location, military rank, or pay grade, and dependent family members, and are based on an annual geographic survey of average rental rates.6
The table above illustrates how annual BAH rates for service members with dependents can vary from duty station to duty station, in accordance with cost of living variances for different housing markets in the U.S.7
The Overseas Housing Allowance includes monthly rental and utilities costs. Service members stationed overseas are also entitled to a lump sum Move In Housing Allowance (MIHA) to cover the average cost of making rental housing habitable, and provides reimbursement of certain rental fees or security upgrades. According to the Defense Travel Management Office, 61,000 service members receive OHA at an annual cost of $1.9 billion.8 The table above illustrates the January 2014 OHA rates for service members with dependents stationed in Wiesbaden, Germany. The OHA rate fluctuates on a monthly basis in accordance with the local currency exchange rate. These same notional service members would also receive a one-time MIHA payment of $588.65.
Basic Allowance for Subsistence (BAS)
Military employees are also provided a monthly cash payment to pay for the cost of their meals. The Basic Allowance for Subsistence is not intended to cover the cost of meals for a service member’s dependents.
BAS rates differ for officers and enlisted service members, and are adjusted annually in coordination with the United States Department of Agriculture’s (USDA) annual food cost index. The 2014 monthly BAS rate for enlisted service members is $357.55, while for officers the rate is $246.24.9 For an officer, this translates into an additional $2,954.88 a year, while an enlisted member earns $4,290.60 a year in BAS. In addition to BAS, service members usually have access to subsidized groceries through the Defense Commissary system.
Overseas Cost of Living Allowance (COLA)
This monthly cash allowance is provided to partially offset geographically-based, higher costs of food and incidental expenses, and at a cost of $2 billion a year, is provided to 250,000 service members serving in 600 locations around the world, including Alaska and Hawaii.10 The COLA allowance reflects patterns of consumption and takes into account a service member’s access to the Exchange and Commissary, where they pay prices for clothing, electronics, gas and groceries consistent with what they would pay in the U.S. Overseas COLA rates are determined by a comparison of the cost of goods and services overseas to the cost of similar goods and services in the United States, and can fluctuate from month to month. Overseas COLA rates also differ by pay grade, years in service and number of dependents. A Sergeant with six years of service in the Army, stationed in Wiesbaden, Germany, with three dependent family members, would have received approximately an additional $8,400 in 2013. Similarly, a Lieutenant Colonel with 16 years of service in the Army, stationed in Brussels, Belgium, with three dependent family members would have received more than $25,000 in tax free Overseas COLA payments in 2013.
Family Separation Allowance (FSA)
This cash allowance is provided to cover the extra expenses incurred by active duty service members who are assigned to temporary duty stations away from their dependent family members. FSA is paid monthly at a rate of $250, or prorated at a rate of $8.33 per day.11
Separation Travel and Transportation
This cash allowance is provided to service members on separation from active duty to cover costs associated with travel from their last duty station to their home of record, or the place where the service member entered active duty.
Duty Station Captain (O-3) Sergeant (E-5)
Washington, D.C. Metro Area $33.372.00 $26,100.00
Ft. Stewart, GA $19,764.00 $16,128.00
Norfolk, VA $22,716.00 $17,964.00
Camp Pendleton, CA $32,076.00 $22,896.00
Allowances Captain (O-3) Sergeant (E-5)
OHA Rental Allowance $2,839.77 $2,716.12
Utility/Recurring Maintenance Allowance $999.72 $999.72
Total Allowance $3,939.49 $3,715.84
Basic Allowance for Housing ((BAH) Rates
Overseas Housing Allowance (OHA) Rates in Wiesbaden, Germany

220 | Tax Decoder Military | 221
Clothing Allowance
There are four types of clothing allowances authorized to help service members pay for their uniforms: Initial, Replacement, Maintenance, and Extra. Both officers and enlisted service members receive an initial clothing allowance; replacement, maintenance and extra clothing allowances are provided only to enlisted service members on an annual or exception case basis.12 For enlisted service members, the standard initial clothing allowance ranges from $1,490.92 to $2,037.08, and the basic annual replacement allowance ranges between $244.80 and $637.20, depending on the branch of service and whether the service member is a male or female.13
Reserve Officers’ Training Corps (ROTC) Educational and Subsistence Allowance
ROTC scholarship cadets receive a monthly subsistence allowance ranging from $250 for freshmen to $400 for seniors.14
Training and Education Allowances Tuition Assistance
Many active duty and reserve service members are eligible to receive up to $4,500 in financial assistance annually for tuition and associated fees for both classroom-based and online college level programs.15 Each military service operates its own tuition assistance program with different eligibility requirements and service obligations. In 2013, more than 340,000 active duty and reserve service members participated in the program at a total cost of $670 million.16
Various Montgomery G.I. Bills and Post 9-11 G.I. Bill
Since 1944, various G.I. bills have been enacted to provide active duty service members and veterans, as well as their sur-vivors and dependents, with a monthly allowance to offset the costs of tuition, fees, and subsistence. Administered by the De-partment of Veterans Affairs (VA), the G.I. bill program is an en-listment incentive for both the active duty and reserve compo-nents. Depending on the type of G.I. Bill a service member has, payments generally cover school tuition, fees, and books, and may also include a monthly housing and subsistence allowance.
In 2012, approximately one million people were receiving G.I. Bill benefits at a cost of around $10 billion.17 Benefits can be used for traditional four-year degree programs as well as non-college degree programs, such as truck driving or cosmetology school.
Travel and Moving Allowances
Travel Per Diem
This cash allowance is provided to reimburse service members for lodging and meal costs incurred during official duty travel, such as for travel required to attend meetings, training, or conferences.
The per diem rate is a daily rate that includes the maximum lodging rate, which varies seasonally and geographically, based on hotel rates in the particular location, plus a meal allowance and an incidental rate for tips given to hotel employees, known collectively as M&IE. Per diem rates also vary at each location depending on the availability of government provided accommodations and meals.
The table below provides a sample of 2014 per diem rates for locations in the U.S.18 and overseas19, and assumes government provided accommodations are not available to a service member during his/her travel (if these were available, the rates would be reduced to reflect the subsidized cost of such lodging and dining options).
With the exception of the first and last day of travel, a service member is eligible for the Maximum Per Diem rate for each full day of official travel.20 Using the data from the table above, a service member traveling to Colorado Springs for a mid-week, three-day conference would be eligible for five days of per diem at a total cost of $754.50.21 Service members are reimbursed for actual lodging expenses, so in the illustration above, if the actual hotel rate was $70 per night, the reimbursement will be made at the $70 rate for lodging instead of the $87 max lodging rate. However, if the service member subsists on less than $61 a day, he/she is still entitled to receive the full daily meal rate.
Leave Between Consecutive Overseas Tours (COT)
This allowance is provided to reimburse active duty service members and their eligible dependents for authorized leave travel between consecutive overseas tours.
2014 Military Per Diem Rates
Location Max Lodging Meals & Incidental Expenses
Washington, D.C. $224 $71
Colorado Springs, CO $87 $66
Amman, Jordan $249 $141
Brussels, Belgium $210 $165

DRAFT
222 | Tax Decoder
Travel During Ship Overhaul or Deactivation
This travel allowance is provided to active duty service members or their dependents for travel during a ship overhaul or deactivation away from the service member’s home port.
Permanent Change of Station (PCS)
Active duty service members are provided this cash allowance to reimburse travel and subsistence costs incurred during permanent change of duty station moves. PCS reimbursements generally cover travel costs, including per diem for service members and each of their dependents. It also includes moving costs, such as the costs required to ship household goods and personal-owned vehicles (POVs) to the new duty station, and a Dislocation Allowance (DLA).22 DLA is another cash allowance provided to active duty service members to partially reimburse relocation expenses incurred during a permanent change of station move. The DLA rate varies based on a service member’s rank and dependency status.23 In 2013, a Sergeant with dependent family members would have received a dislocation allowance of $2,045.27, while a Captain with the same number of dependents would have received $2,359.12.24
Military Base Realignment and Closure
This allowance is provided to reimburse active duty service members for moving costs necessitated by a duty station move required by the Base Realignment and Closure (BRAC) process.
Dependent Allowances
Annual Round-Trip Allowance for Dependent Students
This transportation allowance is provided to active duty service members stationed overseas to cover the travel costs between the service member’s duty station and the United States for one annual trip for unmarried dependents under the age of 23 attending college in the States.
Departure Allowance
A departure allowance is provided to active duty service members stationed overseas to reimburse unexpected evac-uation costs incurred as a result of having to evacuate their dependents to safe haven location.
In-Kind Benefits Medical and dental benefits
Active duty and retired military personnel and their dependents, as well as survivors of deceased service members, are eligible for medical and dental benefits through the DOD’s
TRICARE program. This direct service benefit has evolved over time, from one initially intended to maintain the medical readiness of troops, in which only active duty service members were provided medical care at military medical facilities, to the TRICARE program of today, which mirrors the benefit of civilian, employer-provided health care. The average benefit in 2012 for active duty beneficiaries was $3,099 and for military retirees and their dependent family members was $4,201.25
Similarly, veterans have access to health care services through the U.S. Department of Veterans Affairs (VA). Some veterans, such as former Prisoners of War (POW) and those with service connected disabilities rated 50 percent disabled or higher, qualify for free health care based on their service connected disability, but most veterans whose income exceeds established annual thresholds are required to pay copays for VA provided healthcare. The VA estimates the average benefit in 2012 was around $9,000 per patient.26
Child care
Servicemembers receive subsidized child care through a net-work of more than 750 DOD operated child care centers. In 2013, care was provided to approximately 200,000 military children at a total cost to DOD of $750 million, with the per child cost to servicemembers ranging between $58 and $141 per week.27
Group-Term Life Insurance
Active duty service members and reservists, as well as students enrolled in the four service academies and the ROTC program, are provided low cost life insurance at a subsidized rate through the VA’s Servicemember’s Group Life Insurance (SGLI) program. The current SGLI premium is $.065 per $1,000 of insurance, regardless of the service member’s age, available in increments of $50,000 up to a maximum of $400,000.28 A service member insured for the full $400,000 SGLI amount will pay a monthly premium of $26.
Service members who have SGLI coverage are automatically covered by the Servicemembers’ Group Life Insurance Traumatic Injury Protection Program (TSGLI), which provides payment for traumatic injuries sustained on or off duty, such as the loss of sight in one or both eyes. TSGLI payments are based on the severity of the injury, ranging between $25,000 and $100,000. The TSGLI premium is $1 per month. The SGLI Disability Extension enables service members who are determined “totally disabled” at the time of discharge to retain their SGLI coverage at no cost for an additional two years.29
A separate program, the Family Servicemember’s Group Life Insurance (FSGLI) is available to the spouses and dependent children of service members insured under the SGLI program. FSGLI offers up to $100,000 of insurance coverage for a service member’s spouse, and up to $10,000 for dependent children. FSGLI coverage is offered in increments of $10,000, and rates vary by age, starting at $5.00 a month for a spouse under the age of 35.30

222 | Tax Decoder Military | 223
Upon separation from service, service members can convert their SGLI to term insurance offered under the Veteran’s Group Life Insurance (VGLI) program. VGLI is available in increments of $10,000 up to $400,000, and premium rates vary by age.
Legal Defense Counseling
Active Duty Service members, retirees, and their families are provided legal assistance for their personal civil legal af-fairs free of charge.
Space-Available Travel
Active duty service members, reservists, retirees and their dependents can travel to destinations around the world at virtually no cost on government owned and commercially contracted aircraft, with some eligibility restrictions. When mission and cargo loads allow, extra seats on planes are made available to eligible passengers following a tiered priority structure, similar to flying in a stand-by status on commercial aircraft. Sometimes these seats are available on chartered commercial aircraft, and other times they are simply benches in a military cargo plane. At a per segment cost of $3.90 per person for travel within the United States and less than $30 per person for a one way international flight, service members who have time to wait for an available flight and are willing take their chances on comfort can save significantly on their travel costs for non-reimbursable personal travel.
Combat Zone Tax Exclusion (CZTE)
Active duty service members do not pay taxes on income earned during the time in which they serve in a designated combat zone. They do not pay taxes on income earned
during a time of hospitalization due to injury or illness incurred while serving in combat.
The provision was initially established as a way to exempt those who fought in our nation’s wars from the burden of also financing the conflict. The CZTE was intended to be a temporary measure to offset higher taxes during wartime. Since 1990, however, it has been a permanent exclusion.31 For officers, the exclusion is limited to the maximum monthly enlisted pay rate.
The combat pay exclusion is in need of a review to ensure its equitable distribution.
Cost of Exclusions
All allowances and some in kind benefits, such as medical and dental care, provided to military service members and their families are excluded from federal income tax. Additionally, all veterans benefits, including direct services like health care, recurring cash payments for disability or education, cash grants for adapted housing, and payments to third parties on behalf of veterans for services like vocational training are excluded from federal income tax.
The JCT estimates these tax exclusions will result in total lost revenue to the Treasury of $15.6 billion in FY 2014. These are listed below for purposes of fully detailing existing exemptions.
Tax Deductions
National Guard and Reserve members are authorized one above-the-line deduction for un-reimbursed overnight travel, meals, and lodging expenses for official duty travel more than 100 miles away from the service member’s home of record. According to 2009 IRS data, 142,530 military tax filers claimed this deduction for a total of $558.1 million in expenses claimed.33
Exclusions From Federal Income Tax32 FY2014 Tax Expenditure Estimate, in Billions
Exclusion of Certain Benefits and Allowances to Armed Forces Personnel
$5.8
Exclusion of Combat Pay $1.3
Exclusion of Military Disability Benefits $0.2
Exclusion of Veterans Pensions $0.2
Exclusion of Veterans Disability $6.5
Exclusion of Veterans Readjustment Benefits $1.6
Total $15.6

DRAFT
224 | Tax Decoder
Evaluating Military Tax Exclusions As explained, a significant portion of a service member’s take home pay is not subject to federal income tax. The table below
shows the typical service member’s tax savings, the Federal Income Tax Advantage, at several thousand dollars annually.34
Many of the tax exclusions, particularly for living allowances, were needed to make up for the low wages of military members as compared to their civilian counterparts.
A series of pay raises have been enacted since the early 1980s, and in the late 1990s, a congressional mandate pegged annual basic pay increases to the Employment Cost Index plus ½ percent. These improvements, according to the Eleventh Quadrennial Review of Military Compensation (QRMC), when coupled with changes in Department of Defense (DOD) policy and BAH rates designed to eliminate out-of-pocket housing costs for service members, have resulted in the growth of Regular Military Compensation (RMC) that “has outpaced civilian wages and salary growth since 2002.”35
Rank Basic Pay
TotalNon-Taxable Allowances
(BAH+BAS)
TotalCash Pay
Total Federal Taxes Paid
% Cash Pay Not Taxed
Federal Income Tax Advantage
Colonel (O-6) $121,808.90 $30,115.20 $151,924.10 $24,600.44 20% $11,710.15
Captain (O-3) $63,541.31 $22,111.20 $85,652.51 $9,314.81 26% $7,387.35
Lieutenant (O-1) $35,573.77 $17,431.20 $53,004.97 $3,390.32 33% $4,385.90
Master Sergeant (E-8)
$58,788.19 $22,336.56 $81,124.75 $8,128.69 28% $7,445.52
Sergeant (E-5) $33,035.02 $18,891.24 $51,926.26 $3,009.50 36% $4,534.08
Private (E-1) $18,194.40 $16,803.24 $34,977.64 $819.44 48% $2,922.89
Growth of Military Compensation With the pay raises of the past decade, the average enlisted service member now earns approximately $21,800 more than
their civilian peers.36 Pay equity for service members was long overdue. However, the use of tax exclusions to help close the pay gap has had unintended consequences. In some cases it has produced an even more unfair compensation system.
For example, the Combat Zone Tax Exclusion is applicable for a number of countries where troops are stationed in support of operations in Afghanistan, but in which they are not engaged in combat, such as Qatar or Kuwait. The result is that a service member working in an air conditioned office executing contracts in Qatar, while still deployed to the theater of operations, though hardly in the same danger or exposed to the same hardships, is entitled to the same tax exclusion as the infantry soldier who risks his life daily trading hostile fire with enemy forces on the battlefields of Afghanistan.
Another distortion caused by the CTZE is the potential for inequitable treatment of reenlistment bonuses. These cash bonuses are designed to incentivize reenlistment of service
members with training and experience in specialties that are undermanned and can total more than $50,000 for high demand specialties. However, because service members who reenlist while on overseas deployments to combat zones don’t have to pay tax on the reenlistment bonus, and service members can’t always time their reenlistment to their deployment rotations, this results in some service members earning larger reenlistment bonuses than others with similar or greater experience, solely on the basis that the former were fortunate enough to reenlist on deployment to a combat zone.
In its review of military compensation, the Eleventh Quadrennial Review of Military Compensation raised concerns that the combat pay exclusion benefited more

224 | Tax Decoder Military | 225
senior ranking officers. Although the CZTE is limited to $7,963 per month for officers, the QRMC found that the “amount of benefit received is not correlated with exposure to combat or imminent danger” because “far more junior personnel—E-5 and below, who receive the lowest benefit from the CZTE—are deployed to combat areas with the highest casualties. In contrast, areas where casualties are the lowest have far more senior personnel deployed, who typically enjoy the greatest benefit from the CZTE.”37
In addition to the unintended consequences of inequitable distribution, the complexity created by the combat exclusion is burdensome on the individual service member and all taxpayers alike – so much so that some service members under report their income, while others over report it.
To establish eligibility for the CZTE, the IRS relies on monthly DOD reports or self-identification by the service members. However, repeated audits conducted by the Treasury Inspector General for Tax Administration (TIGTA) found the IRS’s processes for maintaining a service member’s appropriate combat zone status resulted “in taxpayers not receiving benefits to which they are entitled or continuing to receive special tax benefits to which they are no longer entitled.”38 The problem was so prevalent the IRS eventually established a Combat Zone Task Force to make changes to its procedures.
A 2009 audit found that in addition to service members, civilians serving in combat zones and spouses of service members had likely erroneously received combat zone tax benefits because the IRS procedures were not adequate to enable them to distinguish between military and civilian
taxpayers or to determine individual eligibility for married service members filing joint tax returns.
Just like other areas of tax law, military tax policy is so complex it is difficult for the IRS to accurately administer the tax benefits and for service members to benefit equally from them, and there is also a lack of transparency for taxpayers of the actual costs of this compensation. Moreover, the Center for Naval Analysis (CNA) reported that service members typically underestimate the true value of their compensation because the Regular Military Compensation (RMC) is a flawed measure. Although it captures the value of the major elements of cash compensation, it does not capture the full value of the cash, non-cash, and deferred compensation received by service members. For example, because military service members avoid out-of-pocket costs for in-kind benefits such as health care, the actual value of their health care benefit includes not just the cost of their health care benefit but also the cost avoidance.39 Government Accountability Office (GAO) corroborated this finding, noting that “valuing total military compensation from a servicemember’s perspective is challenging.”40
A recent survey by the Center for Strategic and Budgetary Analysis found that service members valued cash compensation above many in-kind benefits.41 The Congressional Research Service (CRS) found that eliminating certain tax exclusions, and simultaneously increasing military pay to compensate service members for the value, may “simplify decision-making about military pay levels and make ‘actual’ salary more apparent and satisfying to armed forces personnel.”42
Conclusion This section is not intended as an analysis of military pay rates, nor is it a comprehensive plan for military pay tax reform.
Military and veterans tax exclusions, however, should be carefully examined by Congress during comprehensive tax reform. It should be considered during any attempt to create a more cohesive and streamlined tax code that reduces the compliance burden on members of the military, ensures a equitable tax treatment for all service men and women, and is more transparent for members of the military, the general public, and congressional lawmakers.

DRAFT
226 | Tax Decoder
1 Estimates of Federal Tax Expenditures for Fiscal Years 2014-2018,” Joint Committee on Taxation, August 5, 2014, https://www.jct.gov/publications.html?func=startdown&id=4663
2 Office of the Undersecretary of Defense, Personnel & Readiness, “Basic Allowance for Subsistence (BAS),” Department of Defense http://goo.gl/i5Gb9i . June 17, 2014. 3 Office of the Secretary of Defense, “The Eleventh Quadrennial Review of Military Compensation,” June 2012; http://goo.gl/HqFT95 . Pp 17. June 17, 2014 4 “Military Pay Exclusion – Combat Zone Service.” Internal Revenue Service. April 17, 2014. http://goo.gl/9EfJ1c 5 While this report includes a number of payments in an effort to fully document most tax free payments provided to military servicemembers and veterans, their
inclusion herein is not intended as an automatic recommendation to tax these benefits. 6 Office of the Undersecretary of Defense, Personnel & Readiness, “Basic Allowance for Subsistence (BAS),” Department of Defense. http://goo.gl/4PuzFS . June 17, 2014. 7 “2014 BAH Rates – WITH DEPENDENTS.” Defense Travel Office – Department of Defense. http://goo.gl/4HqZE9 8 Office of Defense Travel Management, “Overseas Housing Allowance (OHA),” Department of Defense, http://goo.gl/xfnH8R . June 17, 2014. 9 Office of the Undersecretary of Defense, Personnel & Readiness, “Basic Allowance for Subsistence (BAS),” Department of Defense, http://goo.gl/hgECfX . June 17, 2014. 10 Office of the Undersecretary of Defense, Personnel & Readiness, “Overseas Cost of Living Allowances (COLA),” Department of Defense, http://goo.gl/DRKj41 June
17, 2014. 11 Defense Finance and Accounting Service, “Family Separation Allowance,” Department of Defense, March 31, 2011; http://goo.gl/dQrfCe . June 17, 2014. 12 Office of the Undersecretary of Defense, Personnel & Readiness, “Clothing Allowance,” Department of Defense, http://goo.gl/SrrRtf . June 17, 2014. 13 Defense Finance and Accounting Service, “Military Members,” Department of Defense, October 30, 2012; http://goo.gl/x6VBF5 . June 17, 2014. 14 Navy Recruiting Command, “NROTC,” Department of the Navy, http://goo.gl/vCfNoO June 17, 2014 . 15 Military.com, “Military Tuition Assistance,” http://goo.gl/X76w6f June 19, 2014. 16 Numbers provided by DOD. 17 Department of Veterans Affairs, Office of Budget, “Annual Budget Submission,” FY 2012 Budget Submission, http://goo.gl/k8zvce , June 19, 2014. 18 General Services Administration, Travel and Relocation Policy, “FY 2014 Per Diem Rates for,” General Services Administration, May, 21, 2014; http://goo.gl/rHRfHC .
June 17, 2014 19 Department of State, “Foreign Per Diem Rates by Location,” Department of State, http://goo.gl/quX0se . June 17, 2014. 20 General Services Administration, Travel and Relocation Policy, “Frequently Asked Questions, Per Diem,” April 18, 2014; http://goo.gl/Ll7tz0 . June 17, 2014. 21 Assumes Monday and Friday are travel days, Tuesday-Thursday are training days. M&IE is paid at 75% the first and last day of travel. 22 Office of Defense Travel and Management, “Permanent Change of Station/Relocation Frequently Asked Questions,” Department of Defense, December 24, 2013;
http://goo.gl/dJz9JT . June 17, 2014. 23 Office of Defense Travel and Management, “Permanent Change of Station/Relocation Frequently Asked Questions, “ Department of Defense, December 24, 2013;
hhttp://goo.gl/dJz9JT. June 17, 2014 24 W.B. Tirrell, Sr., “UTD for MAP 163-12(I) – DLA Rates Effective 1 January 2013,” Department of Defense, Per Diem, Travel, and Transportation Allowance Committee,
December 26, 2012; http://goo.gl/01cnpx June 17, 2014. 25 Department of Defense TRICARE Management Activity, Evaluation of the TRICARE Program: Access, Cost, and Quality; Fiscal Year 2013 Report to Congress. http://
goo.gl/lYWSAq 26 Department of Veterans Affairs, Congressional Submission, FY 2014 Volume II Medical Programs & Information Technology Programs p. 1B-2. http://goo.gl/M51eVG 27 Information provided by DOD. 28 U.S. Department of Veterans Affairs, “Servicemembers Group Life Insurance,” http://goo.gl/Y4XRrT , June 19, 2014. 29 U.S. Department of Veterans Affairs, “SGLI Disability Extension,” http://goo.gl/IVLTMx , June 19, 2014. 30 U.S. Department of Veterans Affairs, “Family Servicemembers’ Group Life Insurance,” http://goo.gl/piqNzs , June 19, 2014. 31 Gould, Brandon R. and Stanley A. Horowitz, “History of Combat Zone Tax Exclusion,” Department of Defense, June 2012; http://goo.gl/P78wlY . Pp 269. June 17, 2014. 32 Estimates do not include measures below JCT’s de minimis value of $50 million. 33 Internal Revenue Service, 2009 Estimated Data Line Counts Individual Tax Returns, 2009, at http://goo.gl/qalqRy 34 Office of the Undersecretary of Defense, Personnel & Readiness, “Selected Military Compensation Tables, Detailed RMC Tables for Single Personnel,” Department of
Defense, January 1, 2013; http://goo.gl/my4Aav . B1. June 17, 2014 35 Regular Military Compensation (RMC) is the sum of basic pay, average Basic Allowance for Housing, Basic Allowance and subsistence, and the associated federal
tax savings. 36 Office of the Secretary of Defense, “Report of the Eleventh Quadrennial Review of Military Compensation,” Department of Defense, June 2012; http://goo.gl/DOrGa8
Pp 26. June 17, 2014. 37 Office of the Secretary of Defense, “Report of the Eleventh Quadrennial Review of Military Compensation,” Department of Defense, June 2012; http://goo.gl/DOrGa8
Pp 26. June 17, 2014. 38 Office of the Treasury Inspector General, Tax Administration, “Combat Zone Indicators on Taxpayer Accounts Are Frequently Inaccurate,” Treasury Inspector
General, Tax Administration, September 23, 2009; http://goo.gl/ZubGPW . Pp, 1. June 17, 2014. 39 Grefer, James E., “Comparing Military and Civilian Compensation Packages,” The CAN Corporation, March 2008; http://goo.gl/onj8aZ . Pp, 2. June 17, 2014. 40 Farrell, Brenda S., “Testimony Before the Subcommittee on Personnel, Committee on Armed Services, U.S. Senate: Military Personnel, Comparisons between Military
and Civilian Compensation Can be Useful, but Data Limitation Prevent Exact Comparisons,” http://goo.gl/sY4dj7 . Pp, 6. June 17, 2014. 41 Todd Harrison, “Rebalancing Military Compensation: An Evidence-Based Approach.” Center for Strategic and Budgetary Assessments, 2012. http://goo.gl/t9bPdW 42 Tax Expenditures: Compendium of Background Materials on Individual Provisions, committee print, prepared by the Congressional Research Service, 11th Cong., 2nd
sess., December 2010, S Prt. 111-58 (Washington: GPO, 2010). http://goo.gl/vE0r8s

226 | Tax Decoder Sports Tax Breaks | 227
SPORTSTAX BREAKS

DRAFT
228 | Tax Decoder
Sports Subsidies
Every year, members of Congress gather at the local professional baseball stadium and play an old-fashioned game of America’s favorite pastime. The tradition was started by John Tener, a member of the House of Representatives in the early 1900s, who happened to also be a former professional baseball player.1 But Tener is not the only professional athlete to walk the halls of Congress.
At least 30 former professional athletes have made their way from the sports arena to Capitol Hill. Even those members who have not laced up a pair of cleats remain sports enthusiasts, routinely giving floor speeches praising their hometown team or local rising athletic prodigy.
Take Me Out to the Ball Park For millions of sports fans, Fall in America means watching the first weeks of football season and catching baseball playoff
games from the comfort of their couches. With tickets often costing hundreds of dollars, many people cannot afford to attend a game. Ironically, many of them are played in spectacular new stadiums paid for in part with tax-free financing.
At least 614 resolutions honoring various sporting events, teams or players, or major events were introduced in the Senate from the 93rd Congress to the 113th Congress.2
In the 113th Congress alone, there were at least ten con-gressional caucuses dedicated to the causes of athletic and sporting endeavors, including:3
• Congressional Automotive Performance and Motorsports Caucus;
• Congressional Boating Caucus; • Congressional Caucus on Youth Sports; • Congressional Caucus on Fitness; • Congressional Gaming and Entertaining Caucus; • Congressional Tennis Caucus; and the • Congressional Motorsports Caucus; Members of Congress also have the option of joining the
Congressional Olympic and Paralympic Caucus, the House
Through the use of municipal bonds, state and local governments are able to finance the building of multi-million dollar sporting arenas to support their favorite local team and wealthy franchise owners. Because the interest on these bonds is free from federal taxation, this tax break for the pros costs the federal government $146 million in lost revenue every year.6
The accumulated loss resulting from the provision is astound-
Bike Caucus, the Congressional Hockey Caucus, or the Congressional Collegiate Sports Caucus.4 Meanwhile, the Congressional Sportsmen’s Caucus boasts it is “one of the largest and most effective caucuses in the US Congress with nearly 300 members of the House and Senate representing almost all 50 states.”5
In a city dedicated to the sport of politics, Washington politicians have long used the tax code to subsidize athletics. A close look at the Internal Revenue Code reveals Congress’ love of sport costs taxpayers hundreds of millions of dollars in lost revenue. Through the tax code, the federal government provides hundreds of millions of dollars in assistance to professional sports leagues, stadiums, franchise owners, sporting goods manufacturers, and even the players themselves every single year.
ing. “Over the life of the $17 billion of exempt debt issued to build stadiums since 1986 [when Congress last enacted reforms for stadium bonds]…taxpayer subsidies to bondholders will total $4 billion,” found a Bloomberg analysis of these giveaways.7
Billion-dollar sports teams walk away with new facilities that boost their value, and local politicians get to trump their short-term win. The only loser in this game is the taxpayer.
Sports Tax Breaks (estimates in millions) FY 2014 FY 2014 - FY 2018
Take Me Out to the Ballpark * *
Highway to Tax Haven: NASCAR Tax Break $5 $162
Betting on a Tax Break $3 $14
Not So Fuzzy Foreign Golfers Exemption * *
Fishing for a Tax Break $1 $5
Tax Exemption for Pro Sports Leagues $5 $46
Roster Depreciation Allowance * *
Total $14 $227
* The revenue loss associated with these provisions is either unknown or not included in order to avoid double counting

228 | Tax Decoder Sports Tax Breaks | 229
Background
The use of governmental bonds to build stadiums for professional sports teams is one of the most remarkable examples in the tax code of a “tax loophole.” The federal tax subsidy for stadiums was not one intentionally created by Congress, which has previously attempted to prohibit tax-exempt financing of stadiums. Nevertheless, creative use of the tax code allows this subsidy to continue today – making it truly deserving of the term “loophole.”
Using public, tax-free financing for stadiums is nothing new. Before 1968, states and local governments had been increasingly using their tax-free bonds to loan money to private businesses, including professional sports facilities. That year, Congress finally attempted to curb the practice by essentially making bonds taxable if a major portion of the funds were used for a private capital facilities. However, Congress specifically exempted stadiums from these requirements. Sports facilities were deemed to be “inherently quasi-public in nature”8 and could still receive tax-free financing from state and local governments.
The stadium bonanza continued, and they were getting more and more expensive to build. Fourteen facilities opened between 1968 and 1986 with the help of as much as $181 million (2014 dollars) in federal subsidies.9 Many in Congress were alarmed the loophole was placing an increasing burden on taxpayers.10 The Tax Reform Act of 1986 prohibited “private activity” bonds from financing stadiums. Nonprofit educational institutions could continue to build stadiums, however.11 At that point, many in Congress thought they solved the problem of federal subsidies going to build stadiums. “Congress did not intend to continue the subsidy by allowing the use of tax-exempt bonds to finance the identical underlying private business use through alternative financing arrangements,” read one committee’s review of the problem.12
Shortly thereafter, local governments discovered they could still use governmental bonds to finance pro stadiums – albeit only if their taxpayers footed nearly all the cost of interest. As long as only 10 percent or less of a governmental bond was being repaid with stadium revenue, the bond could finance a stadium. The rest of the bond’s debt service (interest paid to investors) would need to come from other public sources, like sales or hotel taxes. In effect, the public had to take an even greater burden for repaying stadium debt than before 1986.
Federal officials have no veto power over these bonds, provided they meet the general rules. The use of the bonds is
not restricted to any particular geographic or socioeconomic area meeting certain requirements. The lack of restrictions has led one tax analyst to conclude, “The current bond law essentially makes stadium subsidies a federal entitlement program.”13 Any restrictions in their use would have to come from another statutory change.
Super Stadium Subsidies
Today’s professional sports leagues are raking in billions, even while some stadiums are still funded with tax-free bonds. Major League Baseball had revenues over $8 billion last year–almost three times what it made in 1995.14 The National Football League’s revenue is equally astounding, reaching an estimated $9.5 billion annually, and is shooting for $25 billion annually by 2027.15 Yet these two leagues are major beneficiaries of tax-free, reduced-rate public financing. Governmental bonds are not subject to any federal targeting, so local governments can use them in any way they see fit. As a result, mega stadiums are being funded all across the nation.
“The beauty of the tactic is that tax-exempt bonds have very little meaning to most people,” commented one expert in public sports financing. “Very few people perceive that the amount of money involved is very significant. The costs are really hidden.”16
Unfortunately, the result is billions of dollars in subsidies for the rich and famous, while taxpayers have to pick up the tab for any lost federal revenue. When asked his thoughts about public financing for Comerica Park, Detroit’s $361 million bond-subsidized stadium, one retiree commented, “I’m against any sort of property redistribution, particularly for the richest guy in town.”17
Take the astonishing stadium deal the St. Louis Rams struck in the mid-1990s. Writes Jonathon Laing,
The Rams were able to lock in an annual rent over a 30-year lease period of just $250,000, the fifth-lowest rent rate in the NFL. Yet the Rams will receive 100% of the revenues from the stadium’s 100 luxury suites and 6,250 club seats. On top of that, the team got the option to add 20 more luxury boxes and convert 4,500 more seats to club status, plus a guarantee that 85% of all suites and club seats will be sold over the next 15 years. The team also gets all concession revenues generated by the stadium, $4.5 million of the first $6 million received in stadium advertising and 90% of any ad revenues over $6 million. The Rams also get to pocket the $1.3 million a
“THE BEAUTY OF THE TACTIC IS THAT TAX-EXEMPT BONDS HAVE VERY LITTLE MEANING TO MOST PEOPLE,” COMMENTED ONE EXPERT IN PUBLIC SPORTS FINANCING. “VERY FEW PEOPLE PERCEIVE THAT THE AMOUNT OF MONEY INVOLVED IS VERY SIGNIFICANT. THE COSTS ARE REALLY HIDDEN.”

DRAFT
230 | Tax Decoder
year that Trans World Airlines is paying for the stadium naming rights. Lastly, St. Louis agreed to build a store for the Rams to sell team merchandise.18
Another team – the Baltimore Ravens – is even entitled to 50 percent of stadium revenue for non-sporting events – even though the stadium was heavily subsidized by taxpayers.19, 20
Dallas Cowboy fans may not cheer quite as loud this year considering their unrivaled $1.2 billion stadium completed in 2009 was financed by government bonds, resulting in more than $65 million in subsidies to investors over the next 29 years.21
The stadium’s accommodations are enough to make any taxpayer’s jaw drop.22 It boasts a “600-ton, four-screen video jumbotron, art galleries, and 320 suites with polished marble floors and granite counters” that can cost up to $500,000 to lease per season.23 Over 100,000 fans can fill its seats.24
Having a new stadium gave a $200 million boost to the value of the Cowboys, owned by billionaire owner Jerry Jones.25 The team is now worth an estimated $3.2 billion.26
New York
On the East Coast, New York’s beloved Yankees are hit-ting homeruns in the second most expensive baseball stadium ever built,27 in part thanks to $942 million in tax-free financing. The bonds will result in revenue losses of at least $231 million over 30 years.28
The baseball field itself is almost an afterthought. In designing the stadium, “We tried to reflect a five-star hotel and put a ball field in the middle,” noted Yankees chief operating officer.29 A team museum reflects the “historic legacy of the Yankees.”30 The Yankees are arguably more than able to finance a property themselves, being valued at $2.5 billion.31
Part of the subsidized stadium deal will not even benefit the city’s ordinary citizens but only a select group of city bureaucrats. In negotiating a sweetheart deal for a 12-seat luxury skybox, “[T]he mayor’s aides pushed for a larger suite and free food, and eventually gave the Yankees 250 additional parking spaces in exchange…The city also turned over the rights to three new billboards” and any associated revenue, wrote the New York Times.32
Atlanta
In Atlanta, taxpayers will likely be paying for part of a $1 billion, 71,000 seat football stadium.33 Tax-free bonds are expected to finance one-fifth of the cost.34 One of the stadium’s unique features is a roof “dubbed The Pantheon because of its retractable opening in the center.”35 It will include “plenty of premium seating areas and suites, including ground-level end zone suites and a club that sits behind the play benches.”36
Opponents of the bonds questioned the need to help the team’s wealthy owner. “[T]he hotel/motel tax [used to pay the city’s portion of the bond service] is being diverted to help build a stadium for a billionaire that can afford to build it himself,” noted one vocal critic.37 The Falcons are worth over $1 billion.38
Earlier this year, the city also moved forward with a plan to issue up to $397 million in bonds for a new stadium for the Atlanta Braves.39 The stadium has a total expected cost of $622 million.40
Minnesota
In Minnesota, tax-free bonds will finance almost half of a new billion-dollar stadium for the Minnesota Vikings, a team also worth over $1 billion.41
The stadium’s signature feature – a massive glass roof – has the Audubon Society worried. Because plans for the stadium did not include features to make the glass visible to birds, it may be a “death trap” for thousands of migratory birds.42
These teams are not the only ones winning big, even if they lose a game or two in their swanky stadiums. A Bloomberg investigation revealed,
There are 21 NFL owners whose teams play in stadiums built or renovated in the past quarter-century using tax-free public borrowing. Such municipal debt helped build structures used by 64 major-league teams, including baseball, hockey and basketball.43
Tax-free financing for sports stadiums like the Dallas Cowboys’ arena, leave taxpayers holding the bill, costing $146 million every year.
A BLOOMBERG INVESTIGATION REVEALED, “THERE ARE 21 NFL OWNERS WHOSE TEAMS PLAY IN STADIUMS BUILT OR RENOVATED IN THE PAST QUARTER-CENTURY USING TAX-FREE PUBLIC BORROWING. SUCH MUNICIPAL DEBT HELPED BUILD STRUCTURES USED BY 64 MAJOR-LEAGUE TEAMS, INCLUDING BASEBALL, HOCKEY AND BASKETBALL.”

230 | Tax Decoder Sports Tax Breaks | 231
Why would local governments accept this deal?
Given that using government bonds to finance stadiums means communities have to pay for nearly all the bonds’ debt service, why would any local government volunteer their own citizens’ money to pay for a for-profit sports stadium? Local politicians see using the bonds as a way to keep sports teams in town. They typically believe their communities will receive a long-term benefit even if there is a high short-term cost. There is also pressure on them as other cities use bonds to lure or keep teams.
The economic benefits of stadium subsidies are questionable. “I am not aware of a recent example of a major sports facility investment that earned anything approaching a reasonable return on capital or turned out to be self-financing in terms of tax revenues,” said a University of California-San Diego economics professor.44 A nationwide survey of economists found overwhelming support–85 percent of those surveyed – to end government subsidies of professional sports, including stadiums.45
Federal taxpayers have little reason to subsidize competition between cities. Perhaps one reason would be to financially assist particular areas of the country by steering investment and jobs to selected cities. The federal subsidy from governmental bonds, however, is not targeted to any particular area of the country; any local government can issue them. The federal government loses revenue, and there is no net advantage across all local economies.
Congress should level the playing field and protect taxpayers by closing the stadium loophole entirely. Not a single dollar from tax-exempt municipal bonds should be used for these billionaires’ bonanzas.
Recommendation Congress should prohibit use of any tax-exempt bonds
for stadiums.
State University Stadiums: Governmental Bonds
Public educational institutions, such as state universities, have access to tax-exempt financing to construct stadiums for their teams. The schools may issue governmental bonds because their teams are considered a part of a governmental entity, so their use of the stadium does not constitute private business use.
Examples of stadiums funded with tax-free bonds include:
• University of California-Berkeley, $445 million46 • University of Washington, $200 million47
• University of Minnesota, $220 million48
• University of Michigan, $148 million (to add luxury seats)49
• University of Central Florida Stadium, $19 million in bonds50
• Florida International University, $30 million51
In the mid-2000s, colleges were increasing their athletics spending three times faster than their overall spending.52
Bonds are not the only college stadium financing mechanism that results in lost federal revenue. Beneficiaries typically receive a federal income tax deduction for donations to college athletics – through which they can also gain access to special season tickets or club-level suites.53 The Texas Christian University (TCU) stadium received $15 million from six donors.54 In return, the donors received “an entire suite level [built] for them at midfield…The 6,400-square-foot lounge supporting the suites has a fireplace and a large replica of Frederic Remington’s ‘A Dash for the Timber’ behind the main bar.”55
Universities are also able to sell stadium naming rights, without having to pay tax on the income.56 The University of Washington’s Husky Stadium, for example, is partly funded with $1.25 million in revenue from selling the stadium’s naming rights.57 Ordinarily, nonprofits would pay taxes on this kind of business, income but colleges have used the scheme to enjoy tax-free revenues.
The University of Central Florida stadium and the Florida International University stadium both received tens of millions of dollars in bond financing.

DRAFT
232 | Tax Decoder
While college stadiums may not cost quite as much as those decked out for the pros, a tax handout to build them is equally egregious.
The subsidy does little for U.S. higher education overall. But current policy incentivizes colleges to spend extravagantly on stadiums. “The deal may not be good federal tax policy, but it’s the best available and most responsible deal for the university and its stakeholders,” one public finance professor said of the bonds.58 Though ironically, new stadium construction may have an adverse impact on the ability of fans to attend games. At one stadium, student tickets went from $120/season to $1,249/season.59
A successful college sports program may increase student enrollment at one college, but will decrease enrollment at oth-er colleges that students may have otherwise chosen to at-tend. A Moody’s report on college sports spending observed, “Universities pursue high-profile sports programs for the op-portunity to increase brand recognition, student demand, and donor support.”60 It may be a good policy goal to encourage American higher education, but there is little reason for the federal government to subsidize the competition between U.S. colleges—especially when it does not lead to any aca-demic or economic improvements for the nation.
Oversubsidizing college athletics may actually be posing fi-nancial harm to other aspects of the university environment.61
According to Moody’s, “[A]pproximately 90% of athletic pro-grams are not self-sustaining and require the growing subsidies, which divert funding away from other university operations.”62 While a handful of major athletic conferences bring in substantial television revenues, most athletic departments operate at a loss.63
If state governments believe athletic programs are worth the investment, they are free to spend their money in this way. The costs for these programs, however, particularly the expensive stadiums, should not be borne by federal taxpayers.
Recommendation
The prohibition against the use of governmental bonds for stadiums should include stadiums at state universities.
Private, Nonprofit Schools: Qualified 501(c)(3) Bonds
State and local governments may issue QPA bonds called “Qualified 501(c)(3) bonds” on behalf of 501(c)(3) nonprofit educational institutions, such as private universities. Sports stadiums at private, nonprofit schools are eligible for funding from these 501(c)(3) bonds. QPA bonds are significantly more restrictive than governmental bonds. Ironically, therefore, pri-vate, for-profit professional sports teams are subsidized more generously through the tax code than private nonprofit teams.
Nevertheless, private school stadiums still gain significant benefit from QPA bonds. Up to $150 million in 501(c)(3) bonds may be outstanding for one nonprofit organization at any given time. These universities may use these bonds to construct facilities “substantially related” to the organization’s performance of the purpose that is the basis for its tax-exempt status. At this time, stadiums qualify under this standard.64
Recommendation
As discussed in the chapter on tax-exempt interest, this re-port advocates elimination of 501(c)(3) bonds in general. Should 501(c)(3) bonds be preserved, however, Congress should ensure equal tax treatment of bonds for stadiums at public educational institutions and at private nonprofit educational institutions.
Highway to Tax Haven: NASCAR Tax Break
The 2004 American Jobs Creation Act was used to “clarify” congressional intent to protect a specific tax break for owners of motorsports speedway tracks.
Motorsports speedway tracks throughout the country host racing events held by professional racing entities, including the National Association for Stock Car Auto Racing (NASCAR). Like most business assets, tracks and the adjoining grand stands are depreciable assets for the owners. While standard practices allow for depreciation of assets over 15 years, the Internal Revenue Service (IRS) considers motor speedways to be similar to amusement theme parks, which enjoy accelerated seven-year depreciation.65 Speedways and surrounding facilities may therefore likewise be depreciated over seven years, giving a whole new reason for race track owners to love acceleration.66
In the early 2000s, however, the Treasury Department was mulling a shift in policy to require the speedways to be depreciated over 15 years instead of the more generous seven years. As exec-utive branch action threatened an industry in their states, certain members of Congress responded swiftly. Congress codified the practice at the time for depreciating motor speedways, guarantee-ing accelerated depreciation over seven years and barring the ad-ministration from changing the rules. The provision was estimated to cost more than $100 million over the following decade.67
Stadiums and other athletic facilities at public high schools, middle schools, and elementary schools may also be constructed with governmental bonds. These stadiums may also use a special type of QPA bond called a “qualified public educational facility” bond.
The expense of large high school stadiums may give pause. This report, however, recommends prohibiting the use of tax-exempt bonds only for university stadiums. Congress should further examine whether federal subsidies for primary and secondary education stadiums are worthwhile.

232 | Tax Decoder Sports Tax Breaks | 233
Former Pennsylvania Senator Rick Santorum introduced the initial legislation in July 2003. Dubbed the “Motorsports Facilities Fairness Act,” the bill provided explicitly that motor sports complexes were to be depreciated as a seven-year property. His proposal garnered the support of other members from racing states and was eventually included in the 2004 American Jobs Act (Public Law 108-357).
Another major proponent of the provision, former Virginia governor and senator George Allen, explained it this way: “The Motorsports Facilities Fairness Act responds to the recent decision of the IRS to question the long-standing depreciation treatment of motorsports complexes used by facility owners.”68
Virginia is home to the Richmond International Raceway, and Allen is also a known sports enthusiast and son of a former
NFL coach. Similarly, the primary bill sponsor in the House of Representatives, former Congressman JD Hayworth of Arizona, was a television sports anchor before running for Congress, and Arizona lays claim to the Phoenix International Raceway.69
Although the initial provision expired in 2007, Congress continues to extend seven-year deprecation for motor speedways, doing so most recently on January 1, 2013 (Public Law 112-240). The statutory seven-year depreciation schedule for motor speedways should be eliminated.
Extension of this provision is included in the Senate EXPIRE Act. It will result in $5 million in lost revenue in FY 2014 and $162 million from FY 2014 through FY 2018.70
Betting on a Tax Break
As part of the never-ending list of tax giveaways in the 2004 American Jobs Creation Act (Public Law 108-357), Congress also eliminated the tax for bets placed by foreign bettors on live horse or dog races in the United States through certain types of wagering pools, if the wager was initiated from outside the United States.71
The New York Times explained, “Under current law, if you win big at the horse or dog track, you get hit with a
withholding tax on your winnings. American citizens will still pay, but nonresident foreigners can gamble tax-free.”72 At the time, the Joint Tax Committee estimated the provision would result in $27 million in lost federal tax revenue over ten years.73
The provision exempts a certain type of wager called pari-mutuel betting. Rather than placing a bet against the track, pari-mutuel betting allows horse racing bettors to wager against each other. This type of betting system means the payouts could range from less than the amount wagered “to astronomical amounts.”74 A horse or dog racing track takes a minimal commission from all wagers as a handling fee.75
A local Louisiana paper contended the provision was inserted at the behest of a Louisiana congressman who chaired a House Ways and Means subcommittee at the time. Though some objected, his language made it in the final bill. “When [Jim] McCrery’s tax break for gamblers surfaced many weeks ago, it got caustic press and eventually was stripped from a then-pending House tax bill. McCrery made no apologies. The horse-racing industry is important to Louisiana, he said, and Louisiana tracks get a share of bets—bets that would increase if foreign bettors didn’t have to pay U.S. taxes on their U.S. winnings.”76
This tax break for foreign gamblers should be eliminated.
Not-So-Fuzzy Foreign Golfers Exemption
During the historic 1986 tax reform debate in Congress, former Oregon senator and chairman of the Senate Finance Committee, Bob Packwood, offered a last-minute amendment to the reform legislation on behalf of then-Senator Dan Quayle, a Republican from the state of Indiana.
The amendment provided a tax exemption for foreign athletes, no longer requiring them to count time playing in charitable events located in the States toward their permanent resident alien status.77 In practical terms, this meant qualifying professional athletes would not be required to pay taxes on their worldwide income.
During the tax reform debate, Senator Packwood made a brief statement on the Senate floor explaining the amendment:78
Mr. President, this is an amendment relating to the world professional athletes when they come to this country and play a charity sports tournament. At the moment, if you are in the United States over 180 days, you are taxed on your worldwide income. It is causing a number of athletes to be reluctant to come and play in our charity sports tournaments, where the money is raised for charity, because it counts toward the 180 days. This amendment simply says when they are playing here in a charity sports tournament, the days they are playing will not be counted toward the 180 days. They are still taxed if they make any money in the tournament, but the days that they play do not count toward the 180 days.
Motion speedway owners get a multi-million dollar tax break.

DRAFT
234 | Tax Decoder
Though the provision as described appears laudable, and perhaps not even targeted for one particular sport, Senator Packwood failed to mention what the San Diego Union-Tribune exposed: that it was a direct giveaway for the PGA Tour and its foreign golfers.
Because all 72 PGA tournaments are charity events—the tour contributed $11.3 million to charities last year and will contribute $14 million this year—none of the time foreign golfers spend playing on the tour would count toward the 183 days.79
In short, all PGA Tour golf tournaments are considered “charitable events,” and as such, foreign professional golfers could essentially live in the United States for these events and not be subject to taxes on their worldwide income.
Twenty-seven years later, the law relating to resident alien requirements still includes this PGA Tour exemption, thanks to Senator Packwood and Senator Quayle. Press reports at the time explained Quayle was an “accomplished amateur golfer”80 and had close personal connections to the PGA Tour. The Philadelphia Inquirer reported,
The PGA’s decision to seek Quayle’s help may have been influenced by the fact that one of the senator’s staff members—Greg Zoeller—is the cousin of 1984 U.S. Open champion Fuzzy Zoeller, Juday [a Quayle aide] said.81
It is unlikely today’s top foreign golfers need this exemption, or the generosity of taxpayers. The top-ranked golfer in the world,82 Northern Ireland’s Rory McIlroy, has earned more than $8 million this year83 and is estimated to be worth at least $65 million.84 Second-ranked Adam Scott of Australia85 is worth at least $40 million,86 having earned $4 million this year.87 South African-born Justin Rose, who plays for England, is ranked sixth in the world,88 and has earned more than $3.9 million this year89 and is worth north of $21 million.90 Thirteen of the world’s
top 20 golfers in 2013 were born outside the United States; combined, they earned more than $25 million last year, and were collectively worth at least $300 million.91
This exemption for superstar multi-millionaires should be eliminated.
Fishing for a Tax Break
As of 1984, manufacturers, producers and importers of fishing tackle boxes were required to pay a 10 percent excise tax on all equipment they sold. In 2004, with passage of the American Jobs Creation Act, Congress reduced the amount of the tax to only three percent.92 Yet, other sport fishing equipment remains subject to higher excise taxes, including fishing rods and poles (capped at $10), fishing reels, lures, and hooks. The revenue produced from the tackle boxes and other fishing equipment pays for federal and state sport-fishing programs.93
The fishing industry does not appear to be in dire need of taxpayer assistance, considering more than $45 billion is spent annually on fishing equipment and expenses relating to fishing, according to Congressional Sportsmen’s Foundation.94 Yet, Congress passed this carve-out for one particular line of the fishing industry. Unsurprisingly, one congressman at the time who served on the Ways and Means Committee—as well as then-Speaker of the House Dennis Hastert—represented Illinois districts home to the headquarters of a very large tackle box manufacturer.95
Sports-fishing businesses have paid federal excise taxes on their products since 1941. Initially, these revenues were deposited in the general treasury, but in 1950, sportsmen and businesses teamed up with lawmakers to redirect the revenue to the Sport-Fish Restoration Program. The idea was that investments in sport-fishing resources would result in more fishing and increased sales of fishing equipment.96
Golfing superstar Rory McIllroy from Northern Ireland is one of many foreign golfers who may
benefit from the special exception for foreign PGA Tour tournament
participants.

234 | Tax Decoder Sports Tax Breaks | 235
The 2004 provision means tackle box manufacturers generally pay a significantly smaller excise tax into the program than the rest of the fishing industry. When the legislation was passed, the provision was estimated to reduce excise tax revenue by $11 million over ten years.97
Ending this specialty tax break would once again treat tackle boxes the same as other sport fishing equipment.
Professional Sports Leagues: Tax-Exempt Nonprofits
The National Football League, the National Hockey League, and the PGA Tour classify themselves as 501(c)(6) nonprofit organizations, allowing them to exempt their earnings from federal income taxes.98 Smaller sports leagues, such as the National Lacrosse League, are also using the tax status.
In 2012, the NFL nonprofit organization alone received $325 million from its 32 member teams.99 It holds over $780 million in assets.100 Together with its subsidiaries, the NFL makes an estimated $9 billion annually.101 Each of its teams are among the top 50 most expensive sports teams in the world, ranking with the world’s most popular soccer teams. Almost half of the teams are valued at over $1 billion.102
The PGA Tour received over $1 billion, mostly through television rights, tournament earnings and sponsorships, and royalties.103 In 2012, the NHL received nearly $41 million from its member teams.104
The NFL pays Commissioner Roger Goddell more than $44 million a year. In comparison, the next highest salary of a traditional nonprofit CEO is $2.7 million.105 The league paid seven other officials a total of $39.4 million in just one year.106 Tim Finchem, commissioner of the PGA Tour, earned $5.8 million in 2012. The NHL’s commissioner, Gary Bettman, received $5 million in 2012.107
While the PGA Tour structures their tournaments as charities, the league’s charitable efforts are questionable at best. A recent ESPN investigation found 24 of the 25 PGA Tour nonprofit tournaments spend less than 50 percent on charity, and, “In one case, running a PGA tournament actu-ally caused a charity to lose money—more than $4.5 million over two years.”108
Allowing professional sports leagues to avoid paying millions of dollars in taxes while paying out million-dollar
salaries is inappropriate for a tax-exempt organization. Taxpayers should not be asked to subsidize sports organizations that are already benefiting widely from willing fans. Professional sports organizations should therefore be disqualified from claiming 501(c)(6) nonprofit status.
According to a Joint Committee on Taxation estimate in 2013, removing the tax exemption for professional sports leagues would increase revenue by $46 million over five years and $109 million over ten years.109
Roster Depreciation Allowance
Sports fans and taxpayers alike may be surprised to learn that one lucrative tax advantage results in significant tax breaks for professional sports team owners. Through a rare-ly discussed loophole, known as Roster Depreciation Allow-ance (RDA), professional sports team owners are avoiding paying millions in taxes.
Roster Depreciation Allowance allows sports-franchise owners to count the roster of players as a depreciable asset, similar to when a business purchases a piece of equipment that loses value over time.110 The RDA means team owners can claim the athletes decrease in value, resulting in a tax write-off for the team owner. “The amount of the write down is then deducted from pre-tax earnings.”111 The write down allows the owner to show a smaller profit for tax purposes, and can even result in overall losses for the team, which can be a significant tax benefit.
Bill Veeck, the infamous Chicago White Sox owner, is credited with discovering and exploiting this loophole in the tax code, which allows professional sports team owners to hit a home run on their taxes.112 According to Rodney Fort, a sports economics professor at the University of Michigan, “The RDA dates back to 1959, and was maybe Bill Veeck’s biggest hustle in a long lifetime of hustles.”113 Veeck purchased the Chicago White Sox in 1959 and also owned the Cleveland Indians and the St. Louis Browns114 and was able to convince the IRS that the team roster depreciated over time and cost the owner. As a result, team owners were able to depreciate half the cost of the purchase of the team over five years.115
Veeck’s audacious book, the Hustler’s Handbook, has this to say about the roster depreciation allowance:
LOOK, WE PLAY THE ‘STAR-SPANGLED BANNER’ BEFORE EVERY GAME. YOU WANT US TO PAY INCOME TAXES TOO?”
- BILL VEECK, FORMER CHICAGO WHITE SOX OWNER
“

DRAFT
236 | Tax Decoder
It is almost impossible not to make money on a baseball club when you are buying it new because, unless you become inordinately successful, you pay no income tax at all. It is, in fact, quite possible for a big-league club to go on forever without ever paying any income tax. Look, we play the ‘Star-Spangled Banner’ before every game. You want us to pay income taxes too?116
Beyond even the possible losses incurred by the team, “owners who’ve set themselves up as a partnership or a Subchapter S corporation can pass their ‘losses’ onto their personal income tax forms”117 in order to lower their tax liability on other business investments.118
The New York Times illustrates the benefit of the tax break with a hypothetical example. They suggest that,
if Donald Trump bought the Yankees for $1.5 billion, he could deduct about $100 million per year for 15 years on profits not only from the Yankees but from his other companies that made a profit.119
In the real world, in August former Microsoft executive Steve Ballmer purchased the Los Angeles Clippers basketball team for $2 billion — but banked a sweet tax deal in the process.
“Ballmer could seek as much as half of the purchase price of the team in tax benefits over the next 15 years, according to accountants and sports business analysts familiar with the financial aspects of team ownership,”
reports the Los Angeles Times. It is unclear how large the tax break will be for Ballmer, but “sports business analysts and accountants say owners can seek tax benefits equal to about half of the purchase price.”120 In this case, that could be close to $1 billion.
Major League Baseball commissioner Bud Selig took advantage of RDA when he purchased the team that eventually became the Milwaukee Brewers. The team cost $10.8 million, and depreciated $10.2 million for the “five–year
useful lives” of his players.121
Former Major League Baseball president, Paul Beeston, described the tax perks of being an owner this way,
Anyone who quotes profits of a baseball club is missing the point….Under generally accepted accounting principles, I can turn a $4 million profit into a $2 million loss and I could get every national accounting firm to agree with me.122
The notion that players are a depreciable asset is suspect at best, and certainly this was not the original intent of the provision. Economist Rodney Fort points out another flaw in the depreciation allowance, “while some players are fading with age, others are developing and improving.”123 In other words, a team’s roster is not necessarily depreciating at any given point, despite this treatment in tax law.
Yet, since the IRS ruled in Veeck’s favor, congressional action has only validated this use of depreciation.
In 1993, Congress set a simple 15-year rule for most businesses to write off intangible assets, but it carved out a special exclusion for sports franchises that allows them to more quickly write off player contracts.124
Until 2004, the RDA allowed owners to depreciate 50 percent of the team’s purchase price over five years.125 In 2004, Con-gress tweaked the provision to allow team owners to “write-off 100 percent of a team’s purchase price over 15 years.”126
At the time, congressional proponents argued this change would bring in more revenue and force franchise owners to pay more in taxes.127 However, industry experts believed the tax revision would lessen tax obligation of the owners, and the National Football League and Major League Baseball lobbied Congress for the revision.128 While the annual cost of this tax preference is unclear, it is clear Congress should consider the merits, or lack thereof, of providing depreciation for the purchasing of professional athletic rosters as part of purchasing a professional sports team.

236 | Tax Decoder Sports Tax Breaks | 237
1 “An Annual Outing: The Congressional Baseball Game,” U.S. House of Representatives, http://1.usa.gov/1pATNWl, accessed July 12, 2013. 2 Search conducted on July 9, 2013, in the Congressional Research Service database, for sports-related resolutions introduced in the Senate from the 93rd to 113th
Congresses. 3 “113th Congress Congressional Member Organizations,” U.S. House of Representatives, http://1.usa.gov/1xikHbi, accessed August 13, 2013. 4 “112th Congress Congressional Member Organizations,” U.S. House of Representatives, http://1.usa.gov/1zBaOI8, accessed August 13, 2013. 5 Congressional Sportsmen’s Foundation, http://bit.ly/1upOnRw, accessed August 9, 2013. 6 Aaron Kuriloff and Darrell Preston, “In Stadium Building Spree, U.S. Taxpayers Loser $4 Billion,” Bloomberg, September 5, 2012, http://bloom.bg/1wCHMW7 7 Aaron Kuriloff and Darrell Preston, “In Stadium Building Spree, U.S. Taxpayers Loser $4 Billion,” Bloomberg, September 5, 2012, http://bloom.bg/1wCHMW7 8 Williams, Jack, Jessica O’Quin, and Joshua Stein. (2012) “Public Financing of Green Cathedrals,” Albany Government Law Review, Vol. 5: 123-155; http://bit.ly/1yfkzaU,
page 131. 9 Zimmerman, Dennis. “Tax-Exempt Bonds and the Economics of Professional Sports,” Congressional Research Service, May 29, 1996; pages 8-9. Amount adjusted for
inflation from 1989 to 2014. 10 Williams, Jack, Jessica O’Quin, and Joshua Stein. (2012) “Public Financing of Green Cathedrals,” Albany Government Law Review, Vol. 5: 123-155; http://bit.ly/1yfkzaU,
page 131. 11 Senate Committee on the Budget, “Tax Expenditures: Compendium of Background Material on Individual Provisions,” Congressional Research Service, December
2010, http://1.usa.gov/10FNWrY, p. 650. 12 Congressional Record -- Senate, January 21, 1997, S504; http://1.usa.gov/1xil1H7. 13 Zimmerman, Dennis. “Tax-Exempt Bonds and the Economics of Professional Sports,” Congressional Research Service, May 29, 1996; page 12. 14 Brown, Maury. “Major League Baseball Sees Record Revenues Exceed $8 Billion For 2013,” Forbes.com, December 17, 2013; http://onforb.es/1xqDbVs. 15 Chemi, Eric. “If the NFL Were a Real Business,” Bloomberg Businessweek, September 12, 2014; http://buswk.co/1q8mI2h. 16 Whorisky, Peter. “Stadiums Are Built On Federal Tax Break,” Washington Post, July 28, 2003; http://wapo.st/1sg6HZm. 17 Aaron Kuriloff and Darrell Preston, “In Stadium Building Spree, U.S. Taxpayers Loser $4 Billion,” Bloomberg, September 5, 2012, http://bloom.bg/1wCHMW7. 18 Quoted as reprinting in the Congressional Record -- Senate, January 21, 1997, S505; http://1.usa.gov/1so0Sdp. 19 Congressional Record -- Senate, January 21, 1997, S505; http://1.usa.gov/1so0Sdp. 20 Lambert, Jack. “Baltimore’s stadiums funded from a mix of public, private sources,” Baltimore Business Journal, March 8, 2013; http://bit.ly/1zBba1v. 21 Aaron Kuriloff and Darrell Preston, “In Stadium Building Spree, U.S. Taxpayers Loser $4 Billion,” Bloomberg, September 5, 2012, http://bloom.bg/1wCHMW7. 22 Aaron Kuriloff and Darrell Preston, “In Stadium Building Spree, U.S. Taxpayers Loser $4 Billion,” Bloomberg, September 5, 2012, http://bloom.bg/1wCHMW7. 23 Aaron Kuriloff and Darrell Preston, “In Stadium Building Spree, U.S. Taxpayers Loser $4 Billion,” Bloomberg, September 5, 2012, http://bloom.bg/1wCHMW7. 24 Aaron Kuriloff and Darrell Preston, “In Stadium Building Spree, U.S. Taxpayers Loser $4 Billion,” Bloomberg, September 5, 2012, http://bloom.bg/1wCHMW7 25 Aaron Kuriloff and Darrell Preston, “In Stadium Building Spree, U.S. Taxpayers Loser $4 Billion,” Bloomberg, September 5, 2012, http://bloom.bg/1wCHMW7 26 “NFL Team Values: The Business of Football,” Forbes.com, http://www.forbes.com/nfl-valuations. 27 “11 Most Expensive Stadiums In The World,” Totalprosports.com, May 26, 2014, http://bit.ly/1yflmsy. 28 Joseph Henchman and Travis Greaves, “From the House That Ruth Building to the House the IRS Built,” The Tax Foundation, April 6, 2009, http://taxfoundation.org/
article/house-ruth-built-house-irs-built. 29 Matthews, Karen. “New Yankee Stadium to Cost $1.3 Billion,” Associated Press, February 7, 2008; http://fxn.ws/1so14cI. 30 Nelson, Craig. “Secrets of Yankee Stadium,” NewYork.com, April 3, 2014; http://bit.ly/1xilAAB. 31 “New York Yankees,” Forbes.com, http://www.forbes.com/teams/new-york-yankees/. 32 Chen, David W. “City Pressed Hard for Use of Yankee Luxury Suite,” The New York Times, November 29, 2008; http://nyti.ms/1xqDXSe. 33 Tucker, Tim. “Comparing Bravges, Falcons stadium deals,” Atlanta Journal-Constitution, November 14, 2013; http://on-ajc.com/1ABcvH6. 34 Wenk, Amy and Maria Saporta. “Invest Atlanta Oks $200M in bonds for new Falcons stadium,” Atlanta Business Chronicle, http://bit.ly/1otas2n. 35 Roberts, Stu. “New Atlanta Stadium to boast an eight-section interlocking retractable roof,” Gizmag.com, August 28, 2014; http://bit.ly/1otTyKg. 36 Choate, Dave. “New Falcons Stadium: A Glimpse at the What’s Coming in 2017,” SBNation.com, November 13, 2013; http://bit.ly/1uHQ2on. 37 Eloy, Michell. “New Coalition Of Old Faces Rallies Against Falcons Stadium Deal,” 90.1FM WABE, March 4, 2014; http://bit.ly/1qugjjL. 38“NFL Team Values: The Business of Football,” Forbes.com, http://www.forbes.com/nfl-valuations.39 “Judge approves bonds to finance new Braves stadium,” Associated Press, July 25, 2014; http://bit.ly/1so1srC. 40 “Judge approves bonds to finance new Braves stadium,” Associated Press, July 25, 2014; http://bit.ly/1so1srC. 41 “NFL Team Values: The Business of Football,” Forbes.com, http://www.forbes.com/nfl-valuations. 42 Petchesky, Barry. “Audubon Society Calls New Vikings Stadium ‘A Death Trap’ For Birds,” Deadspin.com, July 23, 2014; http://deadsp.in/1rBxEMh. 43 Aaron Kuriloff and Darrell Preston, “In Stadium Building Spree, U.S. Taxpayers Loser $4 Billion,” Bloomberg, September 5, 2012, http://bloom.bg/1wCHMW7. 44 Dillon, Liam. “Local Economists: Yes, We Should Build a Stadium. No, It Doesn’t Make Economic Sense,” Voice of San Diego, April 22, 2014; http://bit.ly/1rmFk2D. 45 Dillon, Liam. “Local Economists: Yes, We Should Build a Stadium. No, It Doesn’t Make Economic Sense,” Voice of San Diego, April 22, 2014; http://bit.ly/1rmFk2D. 46 Schwab, Frank. “Cal’s new stadium renovation leaves school with huge debt to pay off,” Yahoo! Sports, June 19, 2013; http://yhoo.it/10zKbUD. 47 Husky Stadium Financial Plan; http://bit.ly/1EpFbBn. 48 Bachman, Rachel. “Cal’s Football-Stadium Gamble,” Wall Street Journal, April 20, 2012; http://on.wsj.com/10FPjHo. 49 Bachman, Rachel. “Cal’s Football-Stadium Gamble,” Wall Street Journal, April 20, 2012; http://on.wsj.com/10FPjHo. 50 “Financings,” Dunlap and Associates, http://bit.ly/1ABfShg 51 “Financings,” Dunlap and Associates, http://bit.ly/1ABfShg 52 Golden, Daniel. “Tax Breaks for Skyboxes,” Wall Street Journal, December 27, 2006; http://on.wsj.com/10FPpP3. 53 Eichelberger, Curtis, and Charles Babcock. “Football-Ticket Tax Break Helps Colleges Get Millions,” Bloomberg, October 25, 2012; http://bloom.bg/13T3lr0. 54 “TCU: Luxury, heritage and paid in full,” Sports Business Journal, September 24, 2012; http://bit.ly/1xdL4yc. 55 “TCU: Luxury, heritage and paid in full,” Sports Business Journal, September 24, 2012; http://bit.ly/1xdL4yc. 56 Congressional Budget Office, Budget Options Volume 2, August 1, 2009: page 232; http://1.usa.gov/1z7lQSn. 57 Husky Stadium Financial Plan; http://bit.ly/1EpFbBn. 58 Eichelberger, Curtis, and Charles Babcock. “Football-Ticket Tax Break Helps Colleges Get Millions,” Bloomberg, October 25, 2012; http://bloom.bg/13T3lr0. 59 Eichelberger, Curtis, and Charles Babcock. “Football-Ticket Tax Break Helps Colleges Get Millions,” Bloomberg, October 25, 2012; http://bloom.bg/13T3lr0. 60 “Moody’s: Credit risks from big-time sports for universities are growing,” Moody’s Investor Services, October 11, 2013, http://bit.ly/1yfmPPr 61 “Moody’s: Credit risks from big-time sports for universities are growing,” Moody’s Investor Services, October 11, 2013, http://bit.ly/1yfmPPr 62 “Moody’s: Credit risks from big-time sports for universities are growing,” Moody’s Investor Services, October 11, 2013, http://bit.ly/1yfmPPr 63 “Moody’s: Credit risks from big-time sports for universities are growing,” Moody’s Investor Services, October 11, 2013, http://bit.ly/1yfmPPr 64 “501(c)(3) bonds,” Ballard Spahr LLP, http://bit.ly/1uHR7fS. 65 Patti Bond and Mike Tierney, “A new tax landscape; Major revamping of corporate code affects Georgia businesses from NASCAR to timber,” The Atlanta Journal-
Constitution, October 14, 2004. 66 Senate Committee on the Budget, “Tax Expenditures: Compendium of Background Material on Individual Provisions,” Congressional Research Service, December
2012, http://1.usa.gov/17wTyob, p. 443. 67 “Estimated Budget Effects of the Conference Agreement for H.R. 4520, the ‘American Jobs Creation Act of 2004,’” JCX-69-04, Joint Committee on Taxation, October
7, 2004, http://www.jct.gov/x-69-04.pdf 68 Congressional Record, S4425, April 27, 2004 (statement of Senator George Allen). 69 Tim Funk, “Engines roar in congress; NASCAR has powerful friends in fight over IRS depreciation rules,” The Charlotte Observer, May 6, 2004. 70 Individual Income Tax Receipts and the Individual Tax Base—February 2014 Baseline,” Tab 7: Effects of Extending Tax Provisions Scheduled to Expire Before 2024,
Congressional Budget Office, February 4, 2014, http://www.cbo.gov/publication/45065. 71 “Gambling Winnings From Dog or Horse Racing,” Internal Revenue Service, http://1.usa.gov/1vW9hpv, accessed September 16, 2014. 72 Floyd Norris, “Multinational companies get a tax break, as do foreign gamblers,” The New York Times, October 15, 2004.

DRAFT
238 | Tax Decoder
73 “Estimated Budget Effects of the Conference Agreement for H.R. 4520, the ‘American Jobs Creation Act of 2004,’” JCX-69-04, Joint Committee on Taxation, October 7, 2004, http://www.jct.gov/x-69-04.pdf
74 “Pari-Mutuel Horse Racing Betting Explained,” The Sports Geek, http://bit.ly/1EbTzv6, accessed June 20, 2011. 75 “Pari-Mutuel Horse Racing Betting Explained,” The Sports Geek, http://bit.ly/1EbTzv6, accessed June 20, 2011. 76 Joan McKinney, “Louisianans and tax cuts,” Advocate, May 25, 2003. 77 “Tax revision charitable to foreign PGA golfers,” The San Diego Union-Tribune, July 3, 1986. 78 Congressional Record, S14809, June 20, 1986 (statement by Senator Packwood). 79 “Tax revision charitable to foreign PGA golfers,” The San Diego Union-Tribune, July 3, 1986. 80 “Tax revision charitable to foreign PGA golfers,” The San Diego Union-Tribune, July 3, 1986. 81 Jeff Nesbit, “PGA tour receives hefty boost from the Senate,” The Philadelphia Inquirer, July 3, 1986. 82 “World Rankings - 2014,” ESPN Golf, http://es.pn/1wCIYsI, accessed September 16, 2014. 83 “PGA Tour Money Leaders - 2014,” http://espn.go.com/golf/moneylist, accessed September 16, 2014. 84 “Rory McIlroy Net Worth,” Celebrity NetWorth, http://bit.ly/1vW9qtlaccessed September 16, 2014. 85 “World Rankings - 2014,” ESPN Golf, http://bit.ly/1vW9qtl, accessed September 16, 2014. 86 “Adam Scott Net Worth,” Celebrity NetWorth, http://bit.ly/1uHRrve, accessed September 16, 2014. 87 “PGA Tour Money Leaders - 2014,” http://espn.go.com/golf/moneylist, accessed September 16, 2014. 88 “World Rankings - 2014,” ESPN Golf, http://espn.go.com/golf/rankings?page=worldrankings, accessed September 16, 2014. 89 “PGA Tour Money Leaders - 2014,” http://espn.go.com/golf/moneylist, accessed September 16, 2014. 90 “Justin Rose Net Worth,” Celebrity NetWorth, http://bit.ly/1tmMGkc, accessed September 16, 2014. 91 Compiled from ESPN Golf World Rankings, 2013, PGA Tour Money Leaders, 2013, and Celebrity Net Worth, accessed August 13, 2013. 92 “General Explanation of Tax Legislation Enacted in the 108th Congress,” Joint Committee on Taxation March 31, 2005, http://www.jct.gov/publications.
html?func=startdown&id=2314, accessed September 16, 2014. 93 “General Explanation of Tax Legislation Enacted in the 108th Congress,” Joint Committee on Taxation Mach 31, 2005, http://www.jct.gov/publications.
html?func=startdown&id=2314, accessed September 16, 2014. 95 Robert Trigaux, “Corporate tax cuts; making jobs?” St. Petersburg Times, October 17, 2004. 96 “Financial Returns to Businesses from the Federal Aid in Sport Fish Restoration Program,” Association of Fish and Wildlife Agencies, March 3, 2011, http://www.
fishwildlife.org/files/SportFish-Restoration-ROI-Report_2011.pdf, accessed September 16, 2014. 97 “Estimated Budget Effects of the Conference Agreement for H.R. 4520, the ‘American Jobs Creation Act of 2004,’” JCX-69-04, Joint Committee on Taxation, October
7, 2004, http://www.jct.gov/x-69-04.pdf 98 For a more lengthy discussion of 501(c)(6) organizations, please see the chapter on tax-exempt organizations. 99 2012 IRS Form 990 filed by the National Football League. 100 2012 IRS Form 990 filed by the National Football League. 101 Dan Daly, “Another Way to Look at the NFL’s $9 Billion in Revenue,” Washington Times, Daly OT Blog, February 24, 2011, http://bit.ly/1EpFITQ, accessed August 6, 2012. 102 Kurt Badenhausen, “The World’s 50 Most Valuable Sports Teams,” Forbes.com, July 16, 2012, http://onforb.es/1so2xQ4, accessed September 10, 2012. 103 2012 IRS Form 990 filed by PGA Tour, Inc. 104 2012 IRS Form 990 filed by the National Hockey League. 105 Yousuf, Hibah, “These non CEOS are getting raises,” CNNMoney.com, September 29, 2009 106 2012 IRS Form 990 filed by the National Hockey League. 107 2012 IRS Form 990 filed by the National Hockey League. 108 Lavigne, Paula. “Tax breaks power PGA Tour giving,” ESPN.com, December 15, 2013; http://espn.go.com/espn/otl/story/_/id/10089803/pga-tour-tax-breaks-help-
fuel-giving-which-falls-industry-standards.109 Joint Committee on Taxation, May 15, 2013, http://1.usa.gov/1z7mEGS. 110 Coulson, N. Edward and Rodney Fort, “Tax Revisions of 2004 and Pro Sports Team Ownership,” Contemporary Economic Policy (ISSN 1465-7287) Vol. 28, No. 4,
October 2010, http://goo.gl/s90AGx. 111 Ozanian, Mike, “New Dodgers’ Investors Will Get Big Tax Breaks,” Forbes, April 6, 2012, http://goo.gl/7h5Uaz. 112 Lamberti, Chris, “The Hustler” Bill Veeck and Roster Depreciation Allowance,” Chicago Now, June 6, 2012, http://goo.gl/KfasoA 113 “Algebra meets sports and taxes: UM sports prof Rod Fort explains how tax law allows teams to mask profits as losses,” Crain’s Detroit Business, June 30, 2011, http://
goo.gl/5DKyrt. 114 Brunner, Jim, “Tax write-off may help ease owners’ losses,” Seattle Times, April 5, 2006, http://goo.gl/C4JWO5. 115 Coulson, N. Edward and Rodney Fort, “Tax Revisions of 2004 and Pro Sports Team Ownership,” Contemporary Economic Policy (ISSN 1465-7287) Vol. 28, No. 4,
October 2010, http://goo.gl/s90AGx 116 Veeck, Bill, Veeck as in Wreck, The University of Chicago Press, 1962 117 “Algebra meets sports and taxes: UM sports prof Rod Fort explains how tax law allows teams to mask profits as losses,” Crain’s Detroit Business, June 30, 2011, http://
goo.gl/5DKyrt. 118 Brunner, Jim, “Tax write-off may help ease owners’ losses,” Seattle Times, April 5, 2006, http://goo.gl/C4JWO5. 119 Wilson, Duff, “Sports Business; Bill would raise franchise value of sports teams,” The New York Times, August 2, 2004, http://goo.gl/CUxJQ7. 120 Wharton, David, “Steve Ballmer’s Clippers purchase”; Don’t write off tax-break potential,” The Los Angeles Times, November 16, 2014, http://goo.gl/7EHhnM 121 Wharton, David, “Steve Ballmer’s Clippers purchase”; Don’t write off tax-break potential,” The Los Angeles Times, November 16, 2014, http://goo.gl/7EHhnM 122 Lamberti, Chris, “The Hustler” Bill Veeck and Roster Depreciation Allowance,” Chicago Now, June 6, 2012, http://goo.gl/KfasoA 123 “Algebra meets sports and taxes: UM sports prof Rod Fort explains how tax law allows teams to mask profits as losses,” Crain’s Detroit Business, June 30, 2011, http://
goo.gl/5DKyrt. 124 Wilson, Duff, “Sports Business; Bill would raise franchise value of sports teams,” The New York Times, August 2, 2004, http://goo.gl/CUxJQ7. 125 “Algebra meets sports and taxes: UM sports prof Rod Fort explains how tax law allows teams to mask profits as losses,” Crain’s Detroit Business, June 30, 2011, http://
goo.gl/5DKyrt. 126 Brunner, Jim, “Tax write-off may help ease owners’ losses,” Seattle Times, April 5, 2006, http://goo.gl/C4JWO5. 127 “Algebra meets sports and taxes: UM sports prof Rod Fort explains how tax law allows teams to mask profits as losses,” Crain’s Detroit Business, June 30, 2011, http://
goo.gl/5DKyrt. 128 “Algebra meets sports and taxes: UM sports prof Rod Fort explains how tax law allows teams to mask profits as losses,” Crain’s Detroit Business, June 30, 2011, http://
goo.gl/5DKyrt.

238 | Tax Decoder Tax-Exempt Interest | 239
TAX-EXEMPTINTEREST
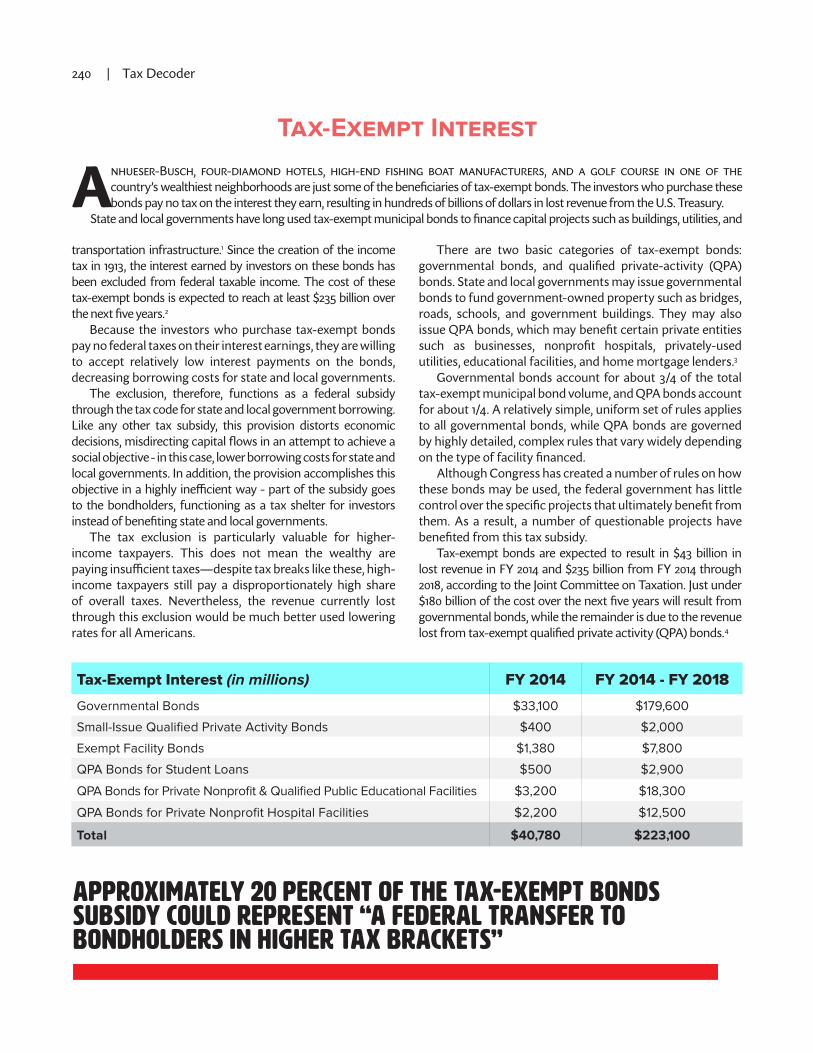
DRAFT
240 | Tax Decoder
Tax-Exempt Interest
Anhueser-Busch, four-diamond hotels, high-end fishing boat manufacturers, and a golf course in one of the country’s wealthiest neighborhoods are just some of the beneficiaries of tax-exempt bonds. The investors who purchase these bonds pay no tax on the interest they earn, resulting in hundreds of billions of dollars in lost revenue from the U.S. Treasury.
State and local governments have long used tax-exempt municipal bonds to finance capital projects such as buildings, utilities, and
transportation infrastructure.1 Since the creation of the income tax in 1913, the interest earned by investors on these bonds has been excluded from federal taxable income. The cost of these tax-exempt bonds is expected to reach at least $235 billion over the next five years.2
Because the investors who purchase tax-exempt bonds pay no federal taxes on their interest earnings, they are willing to accept relatively low interest payments on the bonds, decreasing borrowing costs for state and local governments.
The exclusion, therefore, functions as a federal subsidy through the tax code for state and local government borrowing. Like any other tax subsidy, this provision distorts economic decisions, misdirecting capital flows in an attempt to achieve a social objective - in this case, lower borrowing costs for state and local governments. In addition, the provision accomplishes this objective in a highly inefficient way - part of the subsidy goes to the bondholders, functioning as a tax shelter for investors instead of benefiting state and local governments.
The tax exclusion is particularly valuable for higher-income taxpayers. This does not mean the wealthy are paying insufficient taxes—despite tax breaks like these, high-income taxpayers still pay a disproportionately high share of overall taxes. Nevertheless, the revenue currently lost through this exclusion would be much better used lowering rates for all Americans.
There are two basic categories of tax-exempt bonds: governmental bonds, and qualified private-activity (QPA) bonds. State and local governments may issue governmental bonds to fund government-owned property such as bridges, roads, schools, and government buildings. They may also issue QPA bonds, which may benefit certain private entities such as businesses, nonprofit hospitals, privately-used utilities, educational facilities, and home mortgage lenders.3
Governmental bonds account for about 3/4 of the total tax-exempt municipal bond volume, and QPA bonds account for about 1/4. A relatively simple, uniform set of rules applies to all governmental bonds, while QPA bonds are governed by highly detailed, complex rules that vary widely depending on the type of facility financed.
Although Congress has created a number of rules on how these bonds may be used, the federal government has little control over the specific projects that ultimately benefit from them. As a result, a number of questionable projects have benefited from this tax subsidy.
Tax-exempt bonds are expected to result in $43 billion in lost revenue in FY 2014 and $235 billion from FY 2014 through 2018, according to the Joint Committee on Taxation. Just under $180 billion of the cost over the next five years will result from governmental bonds, while the remainder is due to the revenue lost from tax-exempt qualified private activity (QPA) bonds.4
APPROXIMATELY 20 PERCENT OF THE TAX-EXEMPT BONDS SUBSIDY COULD REPRESENT “A FEDERAL TRANSFER TO BONDHOLDERS IN HIGHER TAX BRACKETS”
Tax-Exempt Interest (in millions) FY 2014 FY 2014 - FY 2018
Governmental Bonds $33,100 $179,600
Small-Issue Qualified Private Activity Bonds $400 $2,000
Exempt Facility Bonds $1,380 $7,800
QPA Bonds for Student Loans $500 $2,900
QPA Bonds for Private Nonprofit & Qualified Public Educational Facilities $3,200 $18,300
QPA Bonds for Private Nonprofit Hospital Facilities $2,200 $12,500
Total $40,780 $223,100

240 | Tax Decoder Tax-Exempt Interest | 241
History & General Background
When Congress created the federal income tax in 1913, it allowed interest earned from municipal bonds to be excluded from taxable income due to the belief that the Constitution prohibited federal taxation of income from state and local debt obligations. In 1988, the Supreme Court rejected this constitutional claim in South Carolina v. Baker. Nevertheless, the exemption continues today, with supporters arguing it is important to encourage capital formation.5
Because investors pay no tax on their interest earnings, they are willing to accept a lower interest rate on the bonds, saving municipalities money. From 2007 to 2011, for example, the in-terest rates on municipal bonds ranged from 0.35 to 1.14 points lower than corporate bonds of equivalent risk.6 The investor’s de-creased interest income, however, is made up for by his tax sav-ings. In fact, the tax savings of investors are usually significantly larger than the interest savings for governments. This is why the tax subsidy is considered inefficient—part of the subsidy does not reach the intended target and is instead lost to investors.
A Tax Subsidy for the Wealthy
Approximately 20 percent of the tax-exempt bonds subsidy could represent “a federal transfer to bondholders in higher tax brackets,” according to a joint study by the Congressional Budget Office (CBO) and Joint Committee on Taxation (JCT).7
Investors in the very highest tax brackets inevitably receive a greater share of this tax subsidy than other investors due to the mechanics of selling bonds.
In order to raise the money they need, issuing municipalities must offer an interest rate high enough to attract borrowers from across the income spectrum. High-income taxpayers are in a high tax bracket, and therefore will achieve significant tax savings by buying a tax-exempt bond instead of a taxable bond. These investors would be willing to purchase a tax-exempt bond for a relatively low interest rate.
However, there may not be enough high-income investors to buy all of the bonds the municipality needs to sell. Lower-income investors in lower tax brackets achieve less tax savings when they buy tax-exempt bonds. A higher
In 2009, 19,551 tax filers earning more than $200,000 paid no federal income taxes, yet reported $4.6 billion in income from tax-exempt interest. Tax-exempt interest was the primary reason most of these filers paid no taxes.110

DRAFT
242 | Tax Decoder
interest rate would be required to attract these lower-income investors. Municipalities are not permitted to offer discriminatory rates to buyers based on their tax bracket, however—they must offer a rate high enough to attract an adequate number of both low- and high-bracket investors. This is good news for the high-bracket investors—they can now enjoy a higher interest rate than was necessary to convince them to buy the bond.8
These bond-market mechanics are the reason that roughly a fifth of the federal tax expenditure on tax-exempt bonds ultimately takes the form of a giveaway for higher-income bondholders.
Investors in the highest brackets clearly get the largest benefit from tax-exempt bonds, and therefore naturally purchase a disproportionate share of tax-exempt bonds. In 2007, for example, the top 10 percent of taxpayers received 77.4 percent of tax-exempt interest.9 The highest bracket of taxpayers in 2007, the 35 percent bracket, represents only 0.7 percent of tax returns, but collected nearly 30 percent of tax-exempt interest income, more than any other bracket.10
Wealthy Filers Who Pay Nothing in Taxes: Tax-Exempt Interest is the Chief Culprit
A small subgroup of the wealthy manages to pay no taxes at all, and tax-exempt interest is by far the most widely-used tax preference on these nontaxable returns. According to the IRS, in 2009, nearly 4 million tax filers earned $200,000 or more. Of these, 19,551 filers paid no taxes to any national government.11
These filers reported nearly $7.6 billion in income,12 and $4.6 billion of that income was from tax-exempt interest and therefore was not included in taxable income.13 Most of the filers used a combination of different provisions to achieve a tax liability of zero, but for 61 percent of the filers, tax-exempt interest was the most important provision, as illustrated by the figure from the IRS report on page 241.14
A major reason tax-exempt interest income is so important for achieving nontaxability on high-income returns is because it is one of the few preferences that does not generate Alternative Minimum Tax (AMT) adjustments or preferences.15
Costs for State and Local Governments
Overall, the tax exclusion for municipal bond interest de-creases borrowing costs for state and local governments. How-ever, the exclusion can also put upward pressure on borrowing costs. The exclusion creates an incentive for municipalities to issue more bonds. When more bonds are issued, the cost of public borrowing for all governmental units throughout the
country will increase as a function of supply and demand.16 It is unlikely these bond-market effects would erase
the savings created by the exclusion, but they do diminish them. Policies that encourage greater municipal borrowing would further increase borrowing costs, while policies that decrease municipal borrowing would lower borrowing costs.
Currently, there are few federal rules limiting the amount of governmental bonds that may be issued—municipalities may essentially issue as many as they choose. There are numerous rules, however, limiting QPA bond issuance. Adjusting these rules for a particular type of bond may either increase or decrease the volume of bonds on the market, thereby either increasing or decreasing borrowing costs for all other bonds issued by state and local governments.
Options for Reform
This report recommends Congress follow the lead of President Obama’s National Commission on Fiscal Responsibility and Reform, which in its final deficit reduction proposal recommended eliminating the exclusion entirely.17
There is little economic reason to encourage state and local government to issue debt rather than spend their money in other ways. Further, state and local governments would likely be better off in the long-term with lower, simpler tax rates on citizens and businesses than with higher rates and a federal tax subsidy for their debt.
The Joint Committee on Taxation and the Congressional Budget Office has also discussed replacing the exclusion of interest with a municipal bond tax credit.18 The credit could be designed so its revenue cost was equal to about 80 percent of the current revenue cost of tax-exempt interest.19
This change would eliminate the extra subsidy for the wealthy, and the remaining 20 percent of the subsidy could be directed to rate reduction.

242 | Tax Decoder Tax-Exempt Interest | 243
GOVERNMENTAL BONDS The majority of tax-exempt bonds are governmental bonds. While not explicitly defined in the tax code, according to GAO,
“all municipal bonds that do not meet the criteria to be classified as private activity bonds are governmental bonds.”20
The Joint Committee on Taxation estimates governmental bonds will result in $33.1 billion in lost revenue in FY 2014 and $179.7 billion from FY 2014 to FY 2018.21
Most projects funded by governmental bonds are for common public good purposes, such as schools, roads, sewer and water infrastructure, and government offices. Due to the lack of detailed rules for governmental bonds, however, a number of surprising projects have been financed by the bonds.
The Tax Reform Act of 1986 prohibited the use of tax-exempt private-activity bonds for hotels, sports stadiums, and private golf courses.22 In 2008, however, the GAO uncovered instances where all three had been funded by the less-restrictive governmental bonds.23 Although no comprehensive list of hotel and golf course projects exists, based on limited information, the GAO identified 18 hotels and six golf courses that benefited from governmental bonds.24
These luxury hotels were “three- or four-diamond hotels,” “and, in the case of four-diamond hotels, were considered upscale with extensive amenities.”25 The list included Hiltons, Marriotts, Hyatts, and even two Hard Rock Hotels.26
The six golf courses identified by GAO “were considered among the better golfing facilities in their respective regions,” including one “rated as one of the top 10 in California,” another “rated as one of the top 10 in Louisiana,” and another with green fees “between $145 and $160.”27 There is little need for taxpayer funding to bankroll these golf courses. As GAO noted, “in 2005, about 85 percent of existing golf courses had been financed privately, offering a range of fees and services often similar to those offered by publicly financed courses.”28
Developers and governments have creatively used various loopholes to fund these and other questionable projects with tax-exempt governmental bonds, in direct contravention of Congress’ intent.
The key to funding a project with governmental bonds is to avoid triggering the “private business test.” Any bond that triggers this test is a private-activity bond, and must comply with detailed, restrictive rules to remain tax-exempt. Any bond that does not trigger the test is a governmental bond, which faces virtually no restrictions—making it possible to
To qualify as a governmental bond, the bond must not trigger the “private business test”
The private business test: Both of the following conditions must be true for a
bond to trigger this test. 1. The private business use test: 10 percent or
more of the bond proceeds are used in the trade or business of a non-government entity.
2. The private security or payment test: 10 percent or more of the money to repay the bond comes, directly or indirectly, from revenue generated by privately-used property.
If a bond can avoid triggering either prong, it does not trigger the private business test, and qualifies as a governmental bond
The Hard Rock Hotel in Hollywood, Florida received $469 million in tax-exempt governmental bond financing in 2002.111

DRAFT
244 | Tax Decoder
The city-owned SilverRock Resort in La Quinta, CA, which is to include “36 holes of championship golf, a world-class practice center, retail venues, [and] luxury and boutique hotels” received $103.8 million in tax-exempt governmental bonds in 2002.112
Yankee Stadium received $942
million in tax-exempt
governmental bonds, which
will save the team between
$231 million and $471 million in
interest costs over the next 30 years,
at the expense of the federal
government.113
The 450-room Hilton hotel in Omaha, Nebraska received nearly $103 million in tax-exempt governmental bonds.114

244 | Tax Decoder Tax-Exempt Interest | 245
fund stadiums, hotels, and more with tax-exempt bonds. Some state and local governments, therefore, go to great lengths to avoid triggering the private business test. This chapter discusses three such loopholes in use today.
The “Generally Applicable Tax” Loophole
The “generally applicable tax” loophole has been used to secure tax-exempt financing for golf courses, professional sports stadiums, and more.
To use this loophole, the issuer structures the bond to avoid triggering the second prong of the private business test, the “private security or payment” test. Bonds for professional stadiums cannot avoid triggering the first prong of the test, since they will primarily be used by private sports teams. However, the bonds only need to avoid triggering one prong to avoid failing the overall test.
The strategy to avoid the second prong is simple: repay the bond with a “generally applicable tax” on the public, rather than revenue generated by the facility. The governments using this strategy may be pulling a double whammy on the taxpayer: not only does the strategy cause a loss of federal revenue, but it may also impose extra taxes on local citizens. Worse, local governments are not permitted to later extract payments from these private businesses beyond the taxes they normally pay—that would count as indirect bond repayment, triggering the second prong of the test.
Asking citizens to shoulder extra taxes to subsidize a for-profit business may be difficult politically. It is possible to use the “generally applicable tax” strategy without imposing additional taxes on citizens; however, doing so requires a degree of creativity.
For example, SilverRock Resort, which is to include “36 holes of championship golf, a world-class practice center, retail ven-ues, [and] luxury and boutique hotels,” received $103.8 million in tax-exempt governmental bonds in 2002. The fees to golf at the high-end resort, which currently includes an 18-hole Arnold Palmer Classic golf course, range from $145 to $160.29, 30
The golf resort is owned by the city of La Quinta, California, but managed by a private company, Landmark Golf Manage-ment. The private managing company may have triggered the first test, but the city devised a repayment plan to avoid trig-gering the second test. In this case, SilverRock Resort is funded through “tax increment financing.”31 The bonds will be repaid through “the incremental increase in tax revenues”32 through-out the community that results when the property is built. In other words, the resort is expected to boost the local economy, generating additional revenue through generally-applicable taxes. This additional revenue will be used to repay the bond.
The New York Yankees used a similar approach to finance their new stadium. Yankee Stadium, which opened in 2009, cost of $1.5 billion.33 In this case, the bonds are being repaid using payments from the Yankees that are theoretically
equivalent to the property taxes owed to New York City. According to the Tax Foundation, in order to make this scheme work, New York City inflated the assessed property value of Yankee Stadium to three times its actual value. The IRS subsequently issued a regulation prohibiting future stadium projects from using this particular maneuver, but other cities continue to devise creative ways to use “generally applicable taxes” to repay bonds for stadiums.34
The Congressional Research Service observes this approach could be used to finance any private business, even, for example, a privately-owned car dealership.35 For example, the GAO found that governmental bonds have been used to construct industrial parks.36
No comprehensive list exists of private businesses funded by governmental bonds and the descriptions in official bond issue disclosures are often murky. The GAO notes, “While we found that the facilities and activities financed with some bonds were apparent in many cases, they were not as obvious in some other cases, such as when ‘various government operations’ and similar descriptions were provided.”37
Considering the known uses of this loophole, however, there are likely many other startling projects throughout the country benefiting from governmental bonds.
The “Management Contract” Loophole
The 450-room Hilton hotel in Omaha, Nebraska, received nearly $103 million in tax-exempt governmental bonds.38 Unlike the projects listed above, the bonds used to finance Omaha’s Hilton Hotel are being repaid directly from revenue generated by the hotel, not general tax revenue.39 In addition, although the hotel is owned by a governmental subdivision of the city of Omaha, it is managed wholly by Hilton Hotels Corporation.40
This management arrangement would seem to be enough to constitute “private business use,” triggering the first prong of the private business test and precluding governmental bond financing. However, Department of Treasury regulations deal with management contracts in a peculiar, complex way—opening a wide loophole that allows hotels and other projects to qualify for governmental bonds. Specifically, a management contract counts as private business use only in one narrowly-defined situation: when the compensation for the management services is based on a share of the net profits generated by the property. If the managing company is instead compensated with a percentage of gross revenue, or based on the number of customers, or any other method, the management is not treated as private business use, opening the way for governmental bond financing.41
In the case of the Omaha Hilton, Hilton is paid an annual “management fee” and is also compensated through an “eligible employee bonus pool” and a variety of other fees.42 Because none of the fees are specifically based on the net

DRAFT
246 | Tax Decoder
profits generated by the hotel, Hilton’s management of the property does not constitute private business use in the eyes of the IRS.
The GAO explains how the “management contract” loophole came to be:
According to legislative history surrounding the 1986 change, Congress directed Treasury to liberalize guidelines regarding the treatment of third-party use pursuant to management agreements. The liberalization of the guidelines has permitted governmental entities to use third parties to operate facilities financed with tax-exempt governmental bonds under management agreements so that the third-party use of the bond-financed property is not treated as a private trade or business.43
These liberalized guidelines raise many concerns beyond hotels. What other bond-financed government properties are being run by private management companies? As long as they use an alternative method of compensating the management company, state and local governments could build any business facility with tax-exempt bonds and allow a private company to run it for their own profit.
If a local government wishes to build a hotel or similar facility, it is more appropriate to finance it with federally taxable bonds, instead of asking taxpayers to subsidize for-profit corporations.
Properties Owned and Operated by Governments
Several of the bond-financed hotels and golf courses identi-fied by the GAO are owned and managed wholly by a govern-ment entity, and the bonds are being repaid with revenues from the government-owned facilities. These projects trigger neither prong of the private business test.
In 2004, for example, the Seminole Tribe opened two Hard Rock Hotels in Florida with tax-exempt financing. The hotels are attached to gambling facilities that were financed through other means. Both buildings were owned and operated by the tribe under a license agreement that allowed the tribe to use the Hard Rock brand. Under the agreement, Hard Rock developed “manuals relating to the design, furnishing, décor, training of employees, services provided, and maintenance and function
operation of the Resort Facilities and Gaming Facilities.”44
Although Hard Rock provided extensive support, the management of the hotel was handled not by Hard Rock, but by an individual employed directly by the tribe.45 Since the tribe, rather than a private business, both owned and “used” the facility, the project avoided triggering the private business use test. The Seminole Tribe later acquired the Hard Rock parent company.46
The IRS ruled in 2009 that several of the bond issues associated with the Hard Rock projects did not qualify for tax-exempt interest. The agency cited special rules that re-strict tribal governments’ use of tax-exempt bonds to essen-tial government functions, among other reasons.47 The tribe subsequently issued taxable bonds to pay off the tax-exempt bonds the IRS had challenged.48 These special restrictions on tribes, however, would not prevent an ordinary state or lo-cal government from employing a similar strategy to finance hotels or resorts with tax-exempt bonds.
A number of public golf courses are likewise owned and managed wholly by governmental units. The Atchafalaya Golf Course in Patterson, Louisiana, is owned and operated by the Atchafalaya Golf Course Commission, which was created by a local government in Louisiana.49 It received $3 million in tax-exempt financing. The Laurel Hill Golf Club in Lorton, Vir-ginia, is owned and run by Fairfax County, Virginia,50 the sixth wealthiest county in the country, and received $15.53 million in tax-exempt financing.51
While Congress should not attempt to exhaustively list every type of facility that should be barred from receiving governmental bonds, at a minimum, non-essential, lucrative endeavors such as golf courses, professional athletic stadi-ums, and luxury hotels should be explicitly prohibited from receiving tax-exempt financing. Further, Congress should significantly tighten and clarify the rules governing the use of tax-exempt bonds to prevent them from being used to subsi-dize commercial-type business facilities.
The Laurel Hill Golf Club in Lorton, Virginia, is located in the country’s sixth wealthiest county and received $15.5 million in tax-exempt
financing.115

246 | Tax Decoder Tax-Exempt Interest | 247
TAX-EXEMPT INTEREST: QUALIFIED PRIVATE-ACTIVITY (QPA) BONDS
Most tax-exempt bonds are “governmental bonds,” meaning they are intended to be used for public purposes, such as schools, parks, roads, and government buildings. However, approximately one-fourth of the volume of tax-exempt bonds are “qualified private-activity” (QPA) bonds, which may substantially benefit private entities.
Because they subsidize private entities—and sometimes even for-profit corporations—QPA bonds merit special scrutiny. Recognizing the potential for misuse, Congress has repeatedly attempted to reform and update the laws governing QPA bonds. Unfortunately, this has spawned a very complex body of laws and regulations. Today, there are numerous different types of QPA bonds, each with a unique set of rules and conditions.52
According to the Joint Committee on Taxation, tax-exempt QPA bonds will decrease revenue by at least $9.9 billion in FY 2014 and $55.6 billion from FY 2014-2018.53
Governmental bonds, private-activity bonds, and QPA bonds may sometimes be used for very similar projects, but there are important differences between the three:
• interest on governmental bonds is tax-exempt; • interest on private-activity bonds generally is
taxable, because these bonds significantly benefit private entities; and
• if a private activity bond meets the criteria for one of the qualified private-activity bonds, however, the bond interest is tax-exempt, as with governmental bonds. These QPA bonds, however, are subject to a number of restrictions that do not apply to governmental bonds.
Bonds must be classified as private-activity bonds if the bond-financed project meets the “private business test,” discussed in the section on governmental bonds.54 They would also become private activity bonds if a significant amount of the bond proceeds are used to finance loans to private entities—either $5 million, or 5 percent of the issue, whichever is less.55 If a bond triggers one of these tests, the bond issuer would have to either ensure the bond meets the requirements of one of the QPA bonds, or give up the tax exclusion for the bond’s interest payments.
No portion of a QPA bond issue may be used to provide airplanes, skyboxes or other private luxury boxes, health club facilities, facilities primarily used for gambling, or liquor stores.56 While governmental bonds may be issued without limit, the different varieties of QPA bonds are subject to different “volume caps.” Some have their own individual caps, but most are subject to a single state-wide volume cap. All bonds in a state that are subject to the state-wide cap must compete with each other for bond allocations. In 2014, this cap is equal to $296.83 million or $100 per state resident, whichever is greater.57
Despite these limitations, QPA bonds have been used
to finance many private entities in little need of taxpayers’ generosity. The examples discussed in this section are all QPA bonds, meaning the interest earned by those purchasing the bonds is not taxed by the federal government.
QPA Bonds: Qualified Small Issue Bonds
Small Issue Industrial Development Bonds (IDBs) are used to make loans of $1 million or less to private businesses to construct manufacturing facilities, but have benefited companies with little need of federal support, including the maker of one-of-a-kind chandeliers in Hollywood’s W Hotel and the Hard Rock Hotel in Las Vegas and a company that builds high-performance fishing boats.
Small issue IDBs were temporary, expiring tax provisions that were continually extended until 1993, when they were made permanent. They are estimated to cost $400 million in FY 2014 and $2 billion from FY 2014 to 2018.70
Corporate welfare abounds in both the tax code and federal spending bills, but is often disguised as funding for various social needs such as historic preservation, research and development, or alternative energy advancement. Certain provisions, however, are explicitly and solely intended to assist private-sector, for-profit corporations. While intended to create jobs or spur economic growth, they are often little more than a handout to private corporations.
The exclusion of interest for small-issue IDBs is one such provision. State and local authorities may award the bonds to any manufacturing company they choose, regardless of their size, profitability, or the nature of their products. As long as a project meets the criteria for a “manufacturing facility,” the federal government has no control over the businesses that ultimately benefit from the bond.
As a result, the bonds have benefited a number of companies that might not gained federal support if Congress had been required to specifically vote for it. The typical beneficiaries of the bonds are straightforward manufacturing facilities like chemical plants, tool factories, and food processing plants.71, 72 Certain projects, however, might have raised eyebrows if they had been publicly debated in Congress.
For example, in 2008, the California Infrastructure and Economic Development Bank issued nearly $1.34 million in tax-exempt bonds to iWorks,73 a company that creates

DRAFT
248 | Tax Decoder
The company that created these custom lighting creations for the W Hotel in Hollywood and the Hard Rock Hotel in Las Vegas benefited from Small-Issue Industrial Development Bonds.116
An example of SeaVee’s 430 Series, one of the high-end boats produced by SeaVee Boats, which benefited from over $3 million in bonds issued by the Miami-Dade County Industrial Development Authority in 2004.117

248 | Tax Decoder Tax-Exempt Interest | 249
elaborate custom lighting fixtures for luxury hotels and casinos.74 The company bills itself as “the leading custom manufacturer specializing in lighting and architectural appointments; producing for high-end establishments throughout the world.”75
The company has made custom lighting creations for numerous glitzy establishments, including the W Hotel in Hollywood and the Hard Rock Hotel in Las Vegas.76
In 2004, the Miami-Dade County Industrial Development Authority issued over $3 million in bonds to benefit SeaVee Boats, a corporation that builds custom high-performance fishing and cruising boats.77 “Every SeaVee is designed from the ground up to allow for extensive customization to meet each new owners’ [sic] unique needs,” the company’s website explains.
For fishing tournament teams that demand speed and lots of cockpit space, SeaVee offers an open fishing boat configured with twin outboard engines. Sizes range from 29 to 43 feet. Options are boundless and include everything from multiple bait wells and triple outboards to a hardtop and tuna tower.78
Although these bonds cost hundreds of millions of dollars in federal revenue, the decisions on how to award these bonds are made by state and local governments, not federal officials. Lawmakers and taxpayers alike deserve the opportunity to question the true economic benefit of these bonds, which the nonpartisan Congressional Research Service suggests is suspect. CRS has observed that the bond likely does not produce any net increase in jobs for the country: “Any increase in investment, jobs, and tax base obtained by communities from their use of these bonds likely is offset by the loss of jobs and tax base elsewhere in the economy.”79
While it may be appropriate for a city or locality to offer a bond incentive such as this to generate local business growth, there is no logical reason for federal taxpayers to subsidize these endeavors. The federal government’s intervention is not even helping to shift economic activity to any particular disadvantaged area. As CRS notes, the use of the bonds “is not targeted to specific geographic areas that satisfy explicit federal criteria such as median income or unemployment; all jurisdictions are eligible to benefit from the bonds.”80
QPA Bonds: Exempt Facility Bonds
An “exempt facility bond” is a QPA bond issued to finance one of 16 different types of “exempt facilities,” including airports, utilities, transit projects, and others. Although these facilities are often owned or run by private entities, most of them must be available for general public use, meaning they may not be used for the trade or business of just a few private entities.81 Many of the projects listed here, such as highways, would ordinarily simply be funded by governmental bonds. If they are privately owned, however (or otherwise benefit private entities in a way that disqualifies them for governmental bonds), they may only be funded by a taxable bond or a QPA bond.
Individual estimates for the revenue lost on exempt facility bonds are not available for many bond types. The following information, however, is available from the JCT and GAO. No agency has provided a total revenue cost for all exempt facility bonds, but these figures suggest exempt facility bonds will cost a total of about $3 billion in FY 2014 and $16 billion from FY 2014 through FY 2018.
Bond Categories and Subsections of IRC § 142 (a) FY 2014 Cost FY 2014 - FY 2018 Cost58
Airports, docks, and mass-commuting facilities (1, 2, & 3) $800 million $4.7 billion
Waster, sewage, and hazardous waste disposal facilities (4, 5, & 10)
$400 million $2.2 billion
Energy Production Facilties59 (8) ~$40 million60 $200 million
High-speed intercity rail facilities (11) ~$20 million61 $100 million
Qualified green building and sustainable design projects (14) ~20 million62 $100 million
Qualified highway or surface freight transfer facilities (15) $100 million $500 million
Exempt facility bonds subtotal63 $1.38 billion $7.8 billion
Rental Housing (7)64 $1 billion $5.2 billion
Qualified public educational facilities (13) ~$700 million ~$2.8 billion65
Exempt facility bonds, total ~$3 billion ~$16 billion
Enterprise Zone Facilities Less than $240 million Less than $1.2 billion66

DRAFT
250 | Tax Decoder
While many of the projects financed through these bonds serve a common good, they all benefit private entities in some fashion, and this private benefit may take very questionable forms. For example, in 2008, the California Enterprise Development Authority issued $9.7 million in tax-exempt sewage facilities revenue bonds to Anhueser-Busch, producer of the popular Budweiser beer.82
The bonds allowed the company to upgrade its energy system at the Budweiser brewery in Fairfield, California. According to the Authority’s website, “The company is installing a Bio-Energy Recovery System (BERS) and a water reduction system. This renewable energy technology turns nutrients in brewing wastewater into renewable biogas.”83
Unlike most other exempt facilities, all sewage facilities are deemed to automatically meet the “public use requirement,” whether or not they are actually open to public use. Therefore, a sewage facility built solely
for the use of a private manufacturing facility is eligible for financing with tax-exempt bonds.84 Because of the exception to the public use requirement, Anhueser-Busch was able to obtain tax-exempt financing for a wastewater system used exclusively by the Fairfield brewery. Other large plants that require their own sewage system also have access to these tax-exempt bonds.
QPA Bonds: Exempt Facility Bonds - Qualified public educational facilities
Exempt facility bonds may be issued to finance public elementary or high school facilities which are owned by a private, for-profit corporation pursuant to a public-private partnership agreement with a state or local government agency. Under the public-private agreement, the
Bond Categories and Subsections of IRC § 142 (a)67 Percentage of all QPA Bond Issues in 2005 (GAO)68
Solid waste disposal facilities (6) 2.7 percent
Local district heating & cooling facilities (9) Less than 0.1 percent
Environmental enhancements of hydroelectric generating facilities (12)
Small annual volume. The GAO omitted data “to avoid disclosure of information about specific bonds.”69
In 2008, the California Enterprise Development Authority issued $9.7 million in tax-exempt sewage facilities revenue bonds to Anhueser-Busch, producer of the popular Budweiser beers. This Budweiser Brewery in Fairfield, California, was upgraded thanks to tax-exempt bonds for sewage facilities.118

250 | Tax Decoder Tax-Exempt Interest | 251
corporation agrees to “construct, rehabilitate, refurbish, or equip a school facility,” and then transfer ownership of the facility to the government agency at the end of the term of the agreement at no additional cost.85
Stadiums are specifically included in the definition of “school facilities.”86 The federal government has long provided a range of significant tax subsidies to support stadiums in both the for-profit and nonprofit sectors.
Under the original 1913 income tax, only school facilities owned by government units or nonprofit institutions could be financed with tax-exempt bonds. Under the Economic Growth and Tax Relief Reconciliation Act of 2001, however, this benefit was extended to public school facilities owned by private, for-profit corporations.
These bonds have their own annual statewide cap, equal to $10 multiplied by the state population.87 If a state does not use its full volume authority in the year, it may carry forward the unused authority, subject to certain restrictions.88
QPA Bonds: Qualified Student Loan Bonds and Qualified Scholarship Funding Bonds
QPA bonds may also be issued to assist with financing education. Qualified Student Loan Bonds are issued by state or local governments to directly or indirectly finance student loans.89 For the bond to qualify as tax-exempt, the proceeds must primarily be used for Higher Education Act loans,90 (e.g, Stafford Loans, Perkins Loans, or Direct Loans91), or a loan program approved by a state that meets certain criteria.92
Qualified Scholarship Funding Bonds are issued by nonprofit corporations established by state or local governments for the purpose of acquiring student loans.93
The corporations may not make loans directly to students, so the bonds cannot be used directly to increase lending to students. The reason governments establish these corporations is not to lend to students, but to acquire student loans from other companies and free up those companies’ lending capacity, allowing them to make more loans.94, 95
The JCT estimates the revenue cost of tax-exempt bonds for “student loans” results in $500 million in lost revenue in FY 2014, and $2.9 billion from FY 2014 to FY 2018.96 It appears the estimate includes the cost of both qualified student loan bonds and qualified scholarship funding bonds.
Although state and local governments may see the need to provide additional college financing options to students, there is no discernible reason for the federal government to subsidize these endeavors through the tax code. The federal government has limited ability to predict how many programs state and local governments may choose to create using these tax-exempt bonds, how many students will benefit and to what extent, or how the programs will be structured. The federal government therefore has little
ability to fit this tax expenditure into a coherent higher education policy.
Further, the federal government already operates numerous programs of its own to subsidize higher education, including financial aid, subsidized loans, loan guarantees, and a variety of tax deductions and credits. In total, “the federal government offers seven tax expenditures and nine spending programs…to help students and their families pay for postsecondary education.”97 The federal government should be focused on consolidating and streamlining its own higher education programs, rather than providing tax subsidies for additional programs at the state and local level, the benefits of which are difficult to predict.
QPA Bonds: Qualified 501(c)(3) bonds98
Qualified 501(c)(3) bonds are another type of QPA bond, and may be issued in two categories: hospital bonds, which fund tax-exempt hospitals, and nonhospital bonds, which include bonds for every other type of tax-exempt organization.
Hospital bonds will result in $2.2 billion in lost revenue in FY 2014 and $12.5 billion over the following five years.99 The major users of the nonhospital bonds are private educational organizations, such as universities. Bonds for educational facilities will result in lost revenue of $3.2 billion in FY 2014 and $18.3 billion over the next five years.100 Other 501(c)(3) organizations, such as museums, are also eligible to use these bonds, but no estimate is available for the amount of bonds these organizations use.
501(c)(3) bonds are issued by state or local governments, which use the proceeds to make loans that benefit 501(c)(3) tax-exempt organizations.101 The financed property must be used by a 501(c)(3) organization, and owned either by a 501(c)(3) group or a government unit.102
501(c)(3) organizations are the largest users of QPA bonds, accounting for as much as half of all QPA bonds. In 2005, hospital bonds accounted for 22.4 percent of the value of all QPA bonds, and nonhospital bonds accounted for 28.8 percent.103
One state economic development agency gives the following as examples of facilities that may be eligible for these bonds:
• Cultural facilities, including museums, libraries, aquariums, historic preservation and public broadcasting stations.
• Recreational facilities, including community centers and local sports facilities.
• Charitable facilities, including foundations.104
No more than $150 million in nonhospital bonds may be outstanding for one organization at any given time, but there is no limitation on hospital bonds. Nonprofits may use these bonds to construct facilities “substantially related” to the organization’s performance of the purpose that is the

DRAFT
252 | Tax Decoder
basis for its tax-exempt status. At this time, stadiums at universities qualify under this standard.105
The lure of tax-exempt 501(c)(3) bonds ensnares nonprofits in burdensome, inhibiting tax rules
Throughout all areas of the country, the time and money spent on tax compliance diverts resources away from other productive uses. In the case of 501(c)(3) bonds, this is particularly problematic. The time and money of nonprofits are precious and limited. These scarce funds are needed to lift up poor communities, help children, promote the arts, and provide education—not hire lawyers to puzzle over IRS regulations. The rules for 501(c)(3) bonds are complex, and Congress would do better not to lure nonprofits into spending their resources complying with them.
Using these bonds is also a double-edged sword for nonprofits. Once a nonprofit builds a facility with tax-exempt bonds, they must be careful about their interactions with businesses, or they could face consequences from the IRS. An IRS training manual gives a theoretical example of a nonprofit organization that built a clinic with 501(c)(3) bonds, realized it had too much space, and decided to lease 10 percent of its space to a flower shop. This would exceed the 5 percent allowed for private business use, so the bonds would no longer be tax-exempt.106 The organization would have to pay penalties to the IRS, or the tax-exempt status of the bonds could be revoked.107 Had they chosen not to use 501(c)(3) bonds, they could have simply paid corporate taxes on the additional income.108 Several other interactions with private businesses could likewise trigger the “private business test.” Once a nonprofit uses the 501(c)(3) bonds, avoiding these relationships will be a hindrance and distraction for decades. The federal government should not ensnare nonprofit organizations with debt instruments that will hinder their ability to partner effectively with businesses.
Nonprofit organizations would be financially better off with the tax exclusion for 501(c)(3) bonds eliminated and the tax code simplified. The resulting economic growth would enable the private businesses and individuals who support 501(c)(3) organizations to increase their charitable giving.
This is far preferable to draining nonprofit’s time and money on legal work and hobbling their ability to interact with businesses to obtain moderately lower borrowing costs.
The tax-exempt status of nonprofits is different from the tax exclusion on bond interest
There are many good reasons for the tax-exempt status of 501(c)(3) organizations, but this status is very different from the tax exclusion for interest on bonds used by 501(c)(3) organizations.
The status exempts the organization from taxation, whereas the exclusion reduces taxes for the organization’s investors. As with all tax-exempt bonds, part of the tax subsidy is pocketed by investors and never reaches the nonprofit at all. Both provisions ultimately benefit nonprofits, to be sure, but the exclusion for interest goes beyond simply exempting the nonprofit organization itself, instead helping the for-profit entities that do business with it.
It is also important to realize the exclusion is not a tax benefit enjoyed by all 501(c)(3) organizations. The tax-exempt status is available to any organization that meets the criteria, whereas tax-exempt bonds are only available to organizations that are awarded them by state and local governments. One California economic development bank notes that it “does not finance facilities that are used as places of worship or for religious instruction.”109 State and local governments are under no compulsion to award the bonds to a 501(c)(3) organization that requests it. Because of the existence of these bonds, nonprofits that have the support of state and local leaders can obtain a significant financial advantage over other nonprofits.
The $150 million limit on nonhospital bonds also demonstrates that Congress has never considered nonprofit’s right to tax-exempt bonds absolute; instead, they are limited to an arbitrary amount. Tax-exempt bonds are a special form of additional support extended by state and local governments to certain nonprofits of their choosing—paid for by the federal government.
1 State and local governments are not the only entities that may issue tax-exempt bonds. A wide variety of economic development authorities, associations, and other entities, as well as numerous nonprofit corporations, have been established by state or local governments and given authority to issue tax-exempt bonds on behalf of government units. “Tax-Exempt Status of Certain Bonds Merits, Reconsideration, and Apparent Noncompliance with Issuance Cost Limitations Should be Addressed,” GAO, February 2008, p. 8, http://goo.gl/k8wYxw , Economic Development Directory, 2014, http://goo.gl/BhGtPR
2 Combines the 14 estimates listed by JCT for exclusion of interest on state and local government bonds. “Estimates of Federal Tax Expenditures for Fiscal Years 2014-2018,” Joint Committee on Taxation, August 5, 2014, http://goo.gl/3vRGnE
3 Maguire, Steven, “Tax-Exempt Bonds: A Description of State and Local Government Debt,” Congressional Research Service, June 19, 2012, p. 9-12, http://goo.gl/5gJvGX 4 Combines the 14 estimates listed by JCT for exclusion of interest on state and local government bonds. “Estimates of Federal Tax Expenditures for Fiscal Years 2014-
2018,” Joint Committee on Taxation, August 5, 2014, http://goo.gl/jwL1JB 5 Maguire, Steven, “Tax-Exempt Bonds: A Description of State and Local Government Debt,” Congressional Research Service, June 19, 2012, p. 5; http://goo.gl/UnUGED 6 Maguire, Steven, “Tax-Exempt Bonds: A Description of State and Local Government Debt,” Congressional Research Service, June 19, 2012, p. 3; http://goo.gl/1ksyta

252 | Tax Decoder Tax-Exempt Interest | 253
7 Joint Committee on Taxation, “A Joint CBO/JCT Study: Subsidizing Infrastructure Investment with Tax-Preferred Bonds,” CBO, October 2009, p. 34; http://goo.gl/K5qR9C
8 Joint Committee on Taxation, “A Joint CBO/JCT Study: Subsidizing Infrastructure Investment with Tax-Preferred Bonds,” CBO, October 2009, p. 34; http://goo.gl/K5qR9C
9 Maguire, Steven, “The Impact of Budget Proposals on Tax-Exempt Bonds,” p. 5, CRS, March 7, 2012; http://goo.gl/18iGt1 10 Maguire, Steven, “The Impact of Budget Proposals on Tax-Exempt Bonds,” CRS, March 7, 2012, p. 9; http://goo.gl/18iGt1 11 Bryan, Justin, “High-Income Tax Returns for 2009,” Statistics of Income Bulletin, 2012, p. 9, http://goo.gl/D3m7tE 12 Bryan, Justin, “High-Income Tax Returns for 2009,” Statistics of Income Bulletin, 2012, p. 35; http://goo.gl/D3m7tE 13 Bryan, Justin, “High-Income Tax Returns for 2009,” Statistics of Income Bulletin, 2012, p. 34; http://goo.gl/D3m7tE 14 Bryan, Justin, “High-Income Tax Returns for 2009,” Statistics of Income Bulletin, 2012, p. 17; http://goo.gl/D3m7tE 15 Bryan, Justin, “High-Income Tax Returns for 2009,” Statistics of Income Bulletin, 2012, p. 15; http://goo.gl/D3m7tE 16 U.S. Senate Committee on the Budget, “Tax Expenditures: Compendium of Background Material on Individual Provisions,” Congressional Research Service, December
2010, p. 135; http://goo.gl/U3BCU4 17 National Commission on Fiscal Responsibility and Reform, “The moment of Truth,” White House, December 2010 p. 31; http://goo.gl/zOx4I8 18 U.S. Senate Committee on the Budget, “Tax Expenditures: Compendium of Background Material on Individual Provisions,” Congressional Research Service, December
2009, p. 34; http://goo.gl/RwGkFO 19 U.S. Senate Committee on the Budget, “Tax Expenditures: Compendium of Background Material on Individual Provisions,” Congressional Research Service, December
2009, p. 34; http://goo.gl/RwGkFO 20 Joint Committee on Taxation, “A Joint CBO/JCT Study: Subsidizing Infrastructure Investment with Tax-Preferred Bonds,” CBO, February 2008, p. 6, http://goo.gl/
TGT9rn 21 “Estimates of Federal Tax Expenditures for Fiscal Years 2014-2018,” Joint Committee on Taxation, August 5, 2014, http://goo.gl/7oFLJR 22 “Tax-Exempt Status of Certain Bonds Merits, Reconsideration, and Apparent Noncompliance with Issuance Cost Limitations Should be Addressed,” GAO, February
2008, footnote 21, p. 29, http://goo.gl/23a88A 23 “Tax-Exempt Status of Certain Bonds Merits, Reconsideration, and Apparent Noncompliance with Issuance Cost Limitations Should be Addressed,” GAO, February
2008, p. 29, http://goo.gl/23a88A 24 “Tax-Exempt Status of Certain Bonds Merits, Reconsideration, and Apparent Noncompliance with Issuance Cost Limitations Should be Addressed,” GAO, February
2008, p. 4, http://goo.gl/23a88A 25 “Tax-Exempt Status of Certain Bonds Merits, Reconsideration, and Apparent Noncompliance with Issuance Cost Limitations Should be Addressed,” GAO, February
2008, p. 30, http://goo.gl/23a88A 26 “Tax-Exempt Status of Certain Bonds Merits, Reconsideration, and Apparent Noncompliance with Issuance Cost Limitations Should be Addressed,” GAO, February
2008, p. 30-31, http://goo.gl/23a88A 27 “Tax-Exempt Status of Certain Bonds Merits, Reconsideration, and Apparent Noncompliance with Issuance Cost Limitations Should be Addressed,” GAO, February
2008, p. 32-33, http://goo.gl/LVxkBq 28 “Tax-Exempt Status of Certain Bonds Merits, Reconsideration, and Apparent Noncompliance with Issuance Cost Limitations Should be Addressed,” GAO, February
2008, p. 37, http://goo.gl/LVxkBq 29 “Challenge the Rock,” Silver Rock Resort, 2010; http://goo.gl/EA5LQu 30 30 “Tax-Exempt Status of Certain Bonds Merits, Reconsideration, and Apparent Noncompliance with Issuance Cost Limitations Should be Addressed,” GAO,
February 2008, p. 33, http://goo.gl/Gq39wn 31 “Tax-Exempt Status of Certain Bonds Merits, Reconsideration, and Apparent Noncompliance with Issuance Cost Limitations Should be Addressed,” GAO, February
2008, p. 33, http://goo.gl/Gq39wn 32“Tax Increment Financing,” Smith, Gambrell, and Russell, 2010; http://goo.gl/HpyIlX 33 “11 Most Expensive Stadiums In The World,” Totalprosports.com, May 26, 2014, http://goo.gl/wP2ckk 34 “From the House That Ruth Built to the House the IRS Built,” The Tax Foundation, April 6, 2009, http://goo.gl/Gc1Zu1 35 “Tax-Exempt Bonds and the Economics of Professional Sports Stadiums,” CRS, May 29, 1996, p. 20, http://goo.gl/9ijI9L 36 “Tax-Exempt Status of Certain Bonds Merits, Reconsideration, and Apparent Noncompliance with Issuance Cost Limitations Should be Addressed,” GAO, February
2008, p. 23, http://goo.gl/DhP1JL 37 “Tax-Exempt Status of Certain Bonds Merits, Reconsideration, and Apparent Noncompliance with Issuance Cost Limitations Should be Addressed,” GAO, February
2008, p. 23, http://goo.gl/BwlRgt 38 “Tax-Exempt Status of Certain Bonds Merits, Reconsideration, and Apparent Noncompliance with Issuance Cost Limitations Should be Addressed,” GAO, February
2008, p. 31, http://goo.gl/BwlRgt 39 “Series 2002 Bonds,” Piper Jaffray and Co., January 26, 2006, p. 1; http://goo.gl/EGTgzL 40 “Tax-Exempt Status of Certain Bonds Merits, Reconsideration, and Apparent Noncompliance with Issuance Cost Limitations Should be Addressed,” GAO, February
2008, p. 2 , 65-67, http://goo.gl/HqtxFw 41 “Governmental and Private Activity Bonds,” p. 10-11, http://goo.gl/yZfG1H Treas. Reg. § 1.141-3(b)(4), p. 630, http://goo.gl/toRD3s 42 “Series 2002 Bonds,” Piper Jaffray and Co., January 26, 2006, p. D-19; http://goo.gl/4vPajQ 43 “Tax-Exempt Status of Certain Bonds Merits, Reconsideration, and Apparent Noncompliance with Issuance Cost Limitations Should be Addressed,” GAO, February
2008, p. 29, http://goo.gl/sA77V0 44 Merrill Lynch & Co. May 8, 2003, p. 98 (112); http://goo.gl/C2U8fo 45 Merrill Lynch & Co. May 8, 2003, p. 83 (97); http://goo.gl/C2U8fo 46“Seminole Ownership,” 2014; http://goo.gl/51auH8 47 McConnell, Allison L., “IRS: $345M of Seminole Debt. Taxable,” The Bond Buyer, May 25, 2009; http://goo.gl/ZvYsgi . For additional background on the bonds, see the
following offering statements: “$290,000,000 Capital Trust Agency Revenue Bonds (Seminole Tribe of Florida Convention and Resort Hotel Facilities), $260,600,000 Series 2002A, $29,400,000 Series 2002C,” http://goo.gl/fc88Wm ;
“$25,000,000 Capital Trust Agency Variable Rate Revenue Bonds (Seminole Tribe of Florida Convention and Resort Hotel Facilities), Series 2002B,” http://goo.gl/MpFKhp 48 Little, Robert, “Seminole Tribe in Talks to End Cordish Contract,” The Baltimore Sun, October15, 2005; http://goo.gl/X965eX 49 Purpera, Daryl G., “Atchafalaya Golf Course Commission,” April 8, 2013; http://goo.gl/xcEEf2 50 “Laurell Hill Golf Club,” Lorton Patch, 2014; http://goo.gl/AwnhLD 51 “Tax-Exempt Status of Certain Bonds Merits, Reconsideration, and Apparent Noncompliance with Issuance Cost Limitations Should be Addressed,” GAO, February
2008, p. 33; http://goo.gl/fnOPfv 52 IRC § 141(e), http://goo.gl/Fs1O6w 53 $9.9 billion is the sum of the estimates of 13 QPA bond categories listed by JCT. These categories do not include a few minor types of QPA bonds. “Estimates of Federal
Tax Expenditures for Fiscal Years 2014-2018,” Joint Committee on Taxation, August 5, 2014, http://goo.gl/PbP1LG 54 “Subsidizing Infrastructure Investment with Tax-Preferred Bonds,” CBO/JCT, October 2009, p. 11; http://goo.gl/swtSL6 55 “Subsidizing Infrastructure Investment with Tax-Preferred Bonds,” CBO/JCT, October 2009, p. 12; http://goo.gl/swtSL6 56 IRC § 147 (e), http://goo.gl/x4qY1i 57 “State PAB Volume Caps Jump for 2014,” The Bond Buyer, Dec. 30, 2013, http://goo.gl/0qhvUq 58 “Estimates of Federal Tax Expenditures for Fiscal Years 2014-2018,” Joint Committee on Taxation, August 5, 2014, p. 26-29, https://www.jct.gov/publications.
html?func=startdown&id=4663 59 “Facilities for the local furnishing of electric energy or gas” in the tax code. 60 One-fifth of $200 million, the five-year revenue cost estimate. 61 One-fifth of $100 million, the five-year revenue cost estimate. 62 One-fifth of $100 million, the five-year revenue cost estimate.

DRAFT
254 | Tax Decoder
63 This is the total for exempt facility bonds listed at the beginning of the chapter. This figure excludes bonds for Qualified Public Educational Facilities, because these bonds are included with the estimate for bonds for private nonprofit educational facilities. It also excludes bonds for rental housing, because these bonds are accounted for in the Housing section.
64 “Qualified residential rental projects” in the tax code. 65 The JCT report estimated a $3.2 billion FY 2014 cost, and a $18.3 billion FY 2014-2018 cost, for both private nonprofit educational facility bonds and qualified public
educational facility bonds. The OMB provided estimates for private nonprofit educational facility bonds only. The OMB estimate was $2.48 billion for FY 2014, and the sum of the OMB estimates for FY 2014 through FY 2018 was $15.45 billion. The $700 million figure in the chart is approximately $3.2 billion minus $2.48 billion. The $2.8 billion figure in the chart is approximately 18.3 billion minus 15.45 billion. “Analytical Perspectives, Budget of the United States Government, Fiscal Year 2015,” Office of Management and Budget, http://www.whitehouse.gov/sites/default/files/omb/budget/fy2015/assets/receipts.pdf
66 These figures are the total cost estimates for a variety of tax incentives used in the Empowerment Zone Program. For more detail, see the chapter on the Empowerment Zone (EZ) And Enterprise Community (EC) tax incentives.
67 Because the GAO data is old, these three bond categories are not included in the total revenue cost for QPA bonds or for tax-exempt interest. 68 $55 billion in QPA Bonds were issued in 2005. Note this figure is the volume of bonds issued, not their revenue cost to the federal government. “Tax-Exempt Status of
Certain Bonds Merits Reconsideration, and Apparent Noncompliance with Issuance Cost Limitations Should Be Addressed,” GAO, February 2008, p. 27 (32), http://www.gao.gov/assets/280/272369.pdf
69 “Tax-Exempt Status of Certain Bonds Merits Reconsideration, and Apparent Noncompliance with Issuance Cost Limitations Should Be Addressed,” GAO, February 2008, p. 27 (32), http://www.gao.gov/assets/280/272369.pdf
70 “Estimates of Federal Tax Expenditures for Fiscal Years 2014-2018,” Joint Committee on Taxation, August 5, 2014, http://goo.gl/6Dxsej 71 “Manufacturing Facility Bonds,” Phoenix IDA, http://goo.gl/TMFY3W , archived webpage snapshot from Nov. 26, 2013. 72 “Success Stories,” California Enterprise Development Authority, http://goo.gl/1E3Aj4 73 Connors, Paula, Andrea Kennedy, “Bond Amendment Staff Report,” California Infrastructure and Economic Development Bank, October 27, 2009; http://goo.gl/
KxsIVX 74 Quittner, Jeremy, “For Entrepreneurs this Bond May Beat a Loan,” Bloomberg Businessweek, August 7, 2009; http://goo.gl/nNkRsk 75 iWorks, “About us,” http://goo.gl/FkZa6k 76 iWorks, “Projects,” http://goo.gl/jZJdEE 77 “Miami-Dade County Industrial Development Authority, Tax-Exempt Adjustable Mode, Industrial Development Revenue Bonds (RAM Investments of South Florida,
Inc. Project), Series 2004,” Electronic Municipal Market Access, November 5, 2004; http://goo.gl/eoK3ZH 78 SeaVee Boats; http://goo.gl/1ndJsX 79 “Tax Expenditures: Compendium of Background Material on Individual Provisions,” Congressional Research Service, December 2010 p. 481 (499); http://goo.gl/
XAjBqY 80 “Tax Expenditures: Compendium of Background Material on Individual Provisions,” Congressional Research Service, December 2010, p. 481 (499); http://goo.
gl/7Vhz5H 81 Treas. Reg.§ 1.103-8(a)(2), http://goo.gl/DpMZmD 82 “Sustainability over the Years,” Budweiser, http://goo.gl/3tZNav. “California Enterprise Development Authority, 5.30% Sewage Facilities Revenue Bonds, (Anheuser-
Busch Project), Series 2007,” Electronic Municipal Market Access, http://bit.ly/1ycBAkS. 83 “Success Stories,” California Enterprise Development Authority, http://goo.gl/aErFl9
84 Treas. Reg. § 1.103-8(a)(2), Code of Federal Regulations, p. 377, http://goo.gl/ypvLcN 85 “Module E, Exempt Facility Bonds,” Internal Revenue Service, p. 51, http://goo.gl/A7XjnW 86 IRC § 142(k)(3), Legal Information Institute, http://goo.gl/CpciKa 87 Every state may issue (i) $10 multiplied by the state population, or (ii) $5 million, whichever is greater. The least-populous state, Wyoming, has a population over
570,000, qualifying it to issue at least $5.7 million in bonds. Every state in the country, therefore, would use the population-based cap, rather than the $5 million cap. IRC § 142(k)(5)(a), Legal Information Institute, http://goo.gl/W7kbLn
88 IRC § 146(f), Legal Information Institute, http://goo.gl/72idLm 89 IRC § 144(b), Legal Information Institute, http://goo.gl/72idLm 90 IRC § 144(b)(1)(A), Legal Information Institute, http://goo.gl/zt9fXu 91 Alexandra Hegji, “The Higher Education Act (HEA): A Primer,” Congressional Research Service, January 2, 2014, http://goo.gl/AR2bhF 92 IRC § 144(b)(1)(B), Legal Information Institute, http://goo.gl/7EZFK9 93 IRC § 150(d), Legal Information Institute, http://goo.gl/OKZTyl 94 “Implementing a Student Loan Program Using Qualified Scholarship Funding Bonds Feasibility Study,” Maryland Higher Education Commission Office of Student
Financial Assistance, 2008 Session, p. 3, http://goo.gl/wZkVNB 95 “Secondary Markets,” FinAid, http://goo.gl/yRlLCO 96 “Estimates of Federal Tax Expenditures for Fiscal Years 2014-2018,” Joint Committee on Taxation, August 5, 2014, p. 29, http://goo.gl/wC4Jf0 97 “Opportunities to Reduce Potential Duplication in Government Programs, Save Tax Dollars, and Enhance Revenue,” GAO, March 2011, p. 75, http://goo.gl/bN8g2L 98 Some of these bonds, including hospital bonds, mortgage bonds, residential rental bonds, and bonds for Enterprise Zone facilities, are discussed in more detail in
other sections of the report. 99 “Estimates of Federal Tax Expenditures for Fiscal Years 2014-2018,” Joint Committee on Taxation, August 5, 2014, p. 31, http://goo.gl/8PsbdI 100 This estimate includes QPA bonds for both private nonprofit educational facilities and QPA bonds for qualified public educational facilities. The second type is an
exempt facility bond. “Estimates of Federal Tax Expenditures for Fiscal Years 2014-2018,” Joint Committee on Taxation, August 5, 2014, http://goo.gl/DyX9Ph 101 “Module I, IRC § 145 - Qualified 501(c) (3) Bonds,” Internal Revenue Service, p. 3, http://goo.gl/Vj8r0i 102 IRC § 145(a)(1), Legal Information Institute, http://goo.gl/nktsmY , “Module I, IRC § 145 - Qualified 501(c) (3) Bonds,” Internal Revenue Service, , p. 2, 7, http://goo.gl/
FZDflK 103 “Tax-Exempt Status of Certain Bonds Merits Reconsideration, and Apparent Noncompliance with Issuance Cost Limitations Should Be Addressed,” GAO, February
2008, p. 27 (32), http://goo.gl/hQMU2V 104 “501(c)(3) Conduit Revenue Bond Financing Program,” California Infrastructure & Economic Development Bank, p. 2, http://goo.gl/DLH9FO 105 “501(c)(3) Bonds,” Ballard Spahr, LLP, http://goo.gl/Tq4NRe 106 “Module I, IRC § 145 - Qualified 501(c) (3) Bonds,” Internal Revenue Service, p. 10, http://goo.gl/1kjkHp 107 Information provided by CRS analyst, September 4, 2013. 108 IRC § 511, Legal Information Institute, http://goo.gl/N9iTPP 109 “501(c)(3) Conduit Revenue Bond Financing Program,” California Infrastructure & Economic Development Bank, p. 2, http://goo.gl/RhZxkw 110 Bryan, Justin, “High-Income Tax Returns for 2009,” Statistics of Income Bulletin, 2012, p. 17, http://goo.gl/D3m7tE 111 “Tax-Exempt Status of Certain Bonds Merits Reconsideration, and Apparent Noncompliance with Issuance Cost Limitations Should be Addressed,” GAO, February
2008, p. 31, http://goo.gl/DhP1JL. Image source: http://bit.ly/1B9Q6jo 112 “Tax-Exempt Status of Certain Bonds Merits Reconsideration, and Apparent Noncompliance with Issuance Cost Limitations Should be Addressed,” GAO, February
2008, p. 33, http://goo.gl/DhP1JL, SilverRock Resort, http://www.silverrock.org. Image source: http://bit.ly/1wkAcRC.113 “From the House That Ruth Built to the House the IRS Built,” Tax Foundation, April 6, 2009, http://bit.ly/15NOqiO. Image source: http://bit.ly/15NQlUk. 114 “Tax-Exempt Status of Certain Bonds Merits Reconsideration, and Apparent Noncompliance with Issuance Cost Limitations Should be Addressed,” GAO, February
2008, p. 31, http://goo.gl/DhP1JL. Image Source: “Hilton Omaha,” “Exterior,” Hilton Hotels & Resorts, http://bit.ly/1vLO3xy 115 “Tax-Exempt Status of Certain Bonds Merits Reconsideration, and Apparent Noncompliance with Issuance Cost Limitations Should be Addressed,” GAO, February
2008, p. 33, Image source: http://bit.ly/1FK0o7R 116 “Projects,” iWorks, http://bit.ly/1yDPBe1 117 “Miami-Dade County Industrial Development Authority, Tax-Exempt Adjustable Mode, Industrial Development Revenue Bonds (RAM Investments of South Florida,
Inc. Project), Series 2004,” Electronic Municipal Market Access, November 5, 2004; http://goo.gl/eoK3ZH. “430 Gallery,” SeaVee Boats, http://bit.ly/12njcO5 118 “California Enterprise Development Authority, 5.30% Sewage Facilities Revenue Bonds, (Anheuser-Busch Project), Series 2007,” Electronic Municipal Market Access,
http://bit.ly/1ycBAkS. “Fairfield Budweiser Brewery Tour & Gift Shop,” Hotfrog, http://bit.ly/1ycsGZG

254 | Tax Decoder Tax-Exempt Organizations | 255
TAX-EXEMPTORGANIZATIONS

DRAFT
256 | Tax Decoder
Tax-exempt Organizations
Nearly 1.6 million tax-exempt nonprofit organizations are recognized by the IRS.1 These organizations represent a significant portion of the nation’s economy, and serve as indispensable nongovernmental mechanisms for strengthening society. It is under this rationale that many nonprofits are granted tax-exempt status under the tax
code. However, when such organizations begin to serve only the most limited interests, or when they mirror the behavior of the private sector, this status becomes questionable.
Many tax-exempt organizations are dedicated to providing social goods, such as eradicating social injustices and educating the public. Some tax-exempt entities in America today, however, bear little resemblance to more familiar nonprofits, such as soup kitchens, the Red Cross, or the Salvation Army.
There are 36 types of tax-exempt organizations specified under the tax code, most of which are under Section 501. Section 501 organization types range from the largest, Section 501(c)(3), with over a million registered organizations, to obscure sections like 501(c)(18), with only five registered organizations.2
These tax-exempt nonprofit organizations include groups ranging from professional sports leagues to labor unions to world-renowned hospitals. Some are multi-million dollar operations that are akin to for-profit businesses, but pay virtually nothing in federal taxes. Many, such as prestigious academic universities and credit unions, stockpile billions of dollars in assets, and generate revenues equal to those of large corporations. For example, approximately 62,000 education-related 501(c)(3) entities have Forms 990 filed with the IRS. These organizations reported $277 billion in revenue and $916 billion in assets, according to 2013 data.3 Similarly, from 2003 to 2012, the assets of the credit union industry nearly doubled,
jumping from $610 billion to more than $1 trillion.4
The tax-exempt status of these organizations protects significant amounts of income from taxation. More importantly, this status may lead to an uneven playing field in the private sector, as nontaxed entities compete with traditional businesses for market share.
Given the opaque nature of tax data, information is limited regarding the financial operations of the nonprofit sector. Out of about 1.6 million tax-exempt organizations, only 591,000 filed full Forms 990 with the IRS, according to 2013 data. These organizations reported a combined $2.1 trillion in revenue and $4.8 trillion in assets.5 Even for the organizations that disclose their finances, scant details on how these funds are used are available to taxpayers or lawmakers. However, these figures show the potential for extensive commerce to be sheltered from taxation by nonprofit entities.
Many nonprofit organizations do truly serve their com-munities and the country at large. Other nonprofits, howev-er, operate under the pretext of philanthropy, but serve as tax shelters for the wealthy or less scrupulous nonprofit directors instead of serving those in need. Such organizations under-mine the original purposes of these tax provisions, exploiting
Tax-Exempt Organizations (in millions) FY 2014 FY 2014 - FY 2018501(c)(3) Charitable Organizations * *
501(c)(4) Social Welfare Organizations * *
501(c)(5) Labor Organizations * *
501(c)(5) Agricultural and Horticultural Organizations * *
501(c)(6) Trade Associations * *
501(c)(7) Social and Recreational Clubs * *
501(c)(8) Fraternal Beneficiary Societies * *
501(c)(9) Voluntary Employee Benefit Associations * *
501(c)(10) Domestic Fraternal Societies * *
501(c)(12) Utility Associations * *
501(c)(13) Cemetery Companies * *
Veteran’s Organizations in 501(c)(19) and Other Sections * *
Support Organizations of Nonprofit Organizations * *
Business Expense Deduction for Nonprofit Contributions * *
Nonprofit Political Activity: Section 527 Organizations * *
Charitable Tax Deduction $46,900 $251,800
Total $46,900 $251,800
* The revenue loss associated with these provisions is either unknown or not included in order to avoid double counting

256 | Tax Decoder Tax-Exempt Organizations | 257
Subsection and Description Registered Entities
Section 501(c) Organizations
(1) Federal credit unions and other corporations organized under an act of Congress 615
(2) Title-holding corporations 4,730
(3) Religious, charitable, and similar organizations 1,052,495
(4) Social welfare organizations 91,056
(5) Labor and agriculture organizations 48,545
(6) Business leagues 66,985
(7) Social and recreation clubs 54,962
(8) Fraternal beneficiary societies 48,578
(9) Voluntary employees’ beneficiary associations 6,884
(10) Domestic fraternal beneficiary societies 16,049
(11) Teachers’ retirement funds 15
(12) Benevolent life insurance associations and utilities 5,486
(13) Cemetery companies 9,482
(14) State-chartered credit unions 2,711
(15) Mutual insurance companies 905
(16) Corporations to finance crop operations 19
(17) Supplemental unemployment compensation trusts 112
(18) Employee-funded pension trusts 5
(19) Veterans’ organizations 31,674
(20) Legal services organizations (revoked) 0
(21) Black lung trusts 28
(22) Multiemployer pension plans 0
(23) Veterans’ associations founded prior to 1880 5
(24) Trusts described in section 4049 of the Employee Retirement Income Security Act of 1974 (ERISA) 1
(25) Holding Companies for pensions and other entities 813
(26) State-sponsored high-risk health insurance organizations 12
(27) State-sponsored workers’ compensation reinsurance organizations 9
(28) The National Railroad Retirement Investment Trust 1
(29) Qualified health insurance issuers 16
Other Entities
501(d) Religious and apostolic associations 222
501(e) Cooperative Hospital Service Organizations 9
501(f) Cooperative Service Organizations of Operating Educational Organizations (Commonfund) 1
501(n) Charitable Risk Pools to pool certain insurance risks of sec. 501(c)(3) organizations (National Alliance of Nonprofits for Insurance, Inc.)
1
521(a) Farmers’ Cooperative Associations 1
527 Political organizations 28,553
4947(a)(1) Nonexempt charitable trusts and 4947(a)(2) split-interest trusts 128,041
Tax-exempt organizations and 4947 trusts, total 1,599,021
Tax-Exempt Organizations and Trusts, FY 20136

DRAFT
258 | Tax Decoder
501(C)(3) Charitable Organizations Every year, millions of Americans go to work strengthening their communities through 501(c)(3) charitable organizations.
Through groups like the Salvation Army and Habitat for Humanity, many selflessly give their time and money to bring dignity to the destitute–offering food, shelter, clothing, and hope.
WHEN 501(C)(3) ORGANIZATIONS ARE USED AS TAX SHELTERS, MIDDLE-CLASS AMERICANS WILL EVENTUALLY HAVE TO PAY HIGHER TAXES TO MAKE UP FOR THE LOST REVENUE.
the protections of the tax-exempt sector to generate wealth. Created piecemeal by Congress over the course of many
years, the sprawling Section 501 of the tax code has become an unmanageable mess. The number of organizations that are tax-exempt under this section is enormous, spanning beauty pageants, rodeos, political action committees, and even casinos. The excessive complexity of this section contributes to the difficulty of conducting oversight of these groups, and this uneven oversight provides avenues for abuse.
With billions of dollars in private donations and public assistance at stake, Congress and the IRS must work to ensure the integrity of the nonprofit sector. When any individual or organization donates to a charity or other nonprofit, they should be secure in the knowledge that they have bettered society. Every dollar unwittingly donated to a fraudulent or dysfunctional charity is a dollar potentially siphoned from legitimate organizations. Congress should thoughtfully address this portion of the tax code when it considers tax reform.
Esteemed institutions like Harvard University and John Hopkins University lead the world in academia. Churches and other religious organizations dot the country, ranging from mega-churches like Saddleback Church to small basement congregations. Numerous other organizations work in the areas of health care, scientific research, the arts and humanities, athletics, disaster relief, community improvement, youth development, and more.7 Each of these is included in the subgroup of nonprofit organizations known as charities.
While the vast majority of nonprofit organizations make valuable contributions to society, questionable organiza-tions, as well as clearly fraudulent ones, exist within the sys-tem. These groups and individuals tarnish the reputation of the sector, and may make it more difficult for legitimate orga-nizations to thrive. Recent investigations by the Tampa Bay Times,9 ESPN,10 and other news organizations have revealed taxpayers who appear to be using tax-exempt organizations to get rich or hide their wealth, using the tax advantages of 501(c)(3) organizations for their own gain.
Other organizations use 501(c)(3)s simply to conduct tax-free activities that serve little or no real charitable purpose. As over a million charitable groups compete for private funding, every dollar donated to these questionable charities is potentially a dollar lost by legitimate organizations that are truly altruistic.
Section 501(c)(3) is by far the largest category of tax-ex-empt organizations—over 1 million of the 1.6 million tax-ex-empt entities are registered under this section.12 This number continues to grow, with the IRS approving nearly 38,000 ap-plications for 501(c)(3) status in FY 2013 alone.13 In total, about 14 million Americans, over 10 percent of the U.S. workforce,
are employed with a nonprofit organization.14 In addition, around 26 percent of the working-age population, nearly 63 million people, volunteer every year.15
Americans choose to give roughly $300 billion annually to nonprofits.16 Taxpayers also support charities through the federal tax-exempt status for nonprofits, the charitable tax deduction, and direct government grants. With billions of federal dollars and private donations at stake every year, Congress should consider ways to prevent abuses in the charitable sector as part of comprehensive tax reform.
The most significant distinction in the tax treatment of the various types of nonprofits is whether or not they may receive tax-deductible donations. Nearly all 501(c)(3) organizations may receive deductible donations, while most other types of nonprofits may not. As such, 501(c)(3) is generally the most ad-vantageous designation for tax purposes. The deductibility of contributions to 501(c)(3)s also has a large impact on federal revenue. Charitable contributions will decrease federal reve-nue by about $46.9 billion in 2014 and $251.8 billion from FY 2014 through FY 2018.17 These figures do not include the poten-tial revenue loss from the tax exemption itself.
When 501(c)(3) organizations are used as tax shelters, middle-class Americans will eventually have to pay higher taxes to make up for the lost revenue. Not only that, donors may grow hesitant to open their wallets for charitable organizations. As a result, many of those who rely on these groups for education, health care, spiritual community, and relief of poverty could suffer. It is therefore important that Congress work with the nonprofit sector to prevent abuses and ensure the integrity of this vital component of our society.

258 | Tax Decoder Tax-Exempt Organizations | 259
There are more than 1 million Section 501(c)(3) charitable organizations.8
Types of Charitable Organizations
501(c)(3) entities are divided into two primary catego-ries—public charities and private foundations. Public char-ities, perhaps the most familiar, generally provide direct services. Public charities are groups such as the Red Cross, Goodwill, and Make-a-Wish Foundation, as well as colleges and universities, museums and other artistic groups, non-profit hospitals, and religious organizations.
Over 90 percent of registered 501(c)(3) organizations are public charities. According to 2013 IRS data, 949,000 of the 1,045,000 organizations under 501(c)(3) were public charities.18
The number of public charities grew by 42 percent from 2000 to 2010.19 The majority of these organizations do not disclose a full report of their finances to the IRS. However, 358,000 501(c)(3) public charities filed the full Forms 990 with the IRS, on which they reported $1.6 trillion in revenue and $2.9 trillion in assets.20
The second category, private foundations, includes groups like the Bill & Melinda Gates Foundation and the W.K. Kellogg Foundation. Private foundations typically have fewer, but larger, contributions. Instead of providing direct charitable services, they generally make grants to other nonprofits offering charitable services.21 According to the December 2013 data, of the 97,000 registered private foundations, 91,000 filed Forms 990, on which they reported $66 billion in revenue and $629 billion in assets.22
Both 501(c)(3) public charities and private foundations must serve specific charitable purposes. Section 501(c)(3) itself spec-ifies eight qualifying purposes: “religious, charitable, scientific, testing for public safety, literary, or educational purposes, or to foster national or international amateur sports competition…or for the prevention of cruelty to children or animals….”23
Numerous qualifying purposes fall under the second term in the list—“charitable.” Charitable organizations could potentially be devoted to poverty relief, disaster relief, and provision of housing for low-income residents, to name only a few of an expansive list.24
Lady Gaga’s 501(c)(3) Born This Way Foundation is advertised as an organization that connects youth with anti-bullying, mental health, and other community resources, but its main activity appears to be throwing free pre-concert tailgate parties for fans.11

DRAFT
260 | Tax Decoder
Federal Subsidies for Charitable Organizations
The federal government provides significant support to the charitable sector through both the tax code and direct spending. The charitable deduction results in billions of dollars of decreased revenue, and receiving 501(c)(3) tax-exempt status from the IRS also qualifies these groups to receive federal support through grants, subsidized loans, and other monetary benefits.
Grants from federal, state, and local governments represented about $126 billion of public charities’ revenue in 2010, and fees for services and goods from government sources represented another $357 billion.25 At the federal level, over 1,400 federal programs provide grants to nonprofit organizations. In 2008, eight percent ($38 billion) of all federal grant spending was directed to nonprofits.26
Federal tax privileges and subsidies provided to 501(c)(3) organizations include the following:27
• Exemption from the federal corporate income tax. • The charitable tax deduction for donors who
itemize on their tax returns. • Exemption from tax on the interest accumulated
by charity-owned assets. Organizations are generally only required to spend 5 percent of their assets on charitable activities, allowing most of the organizations’ investments to accumulate tax-free.
• Eligibility to benefit from tax-exempt bonds. • Eligibility for federal grants. • Eligibility for government-backed loans.
The charitable tax deduction will decrease federal revenue by about $46.9 billion in 2014 and $251.8 billion from FY 2014 through FY 2018.28
The GAO estimates that in 2006, four key federal credit pro-grams had about $120 billion in outstanding loans or guarantees
involving nonprofit organizations. GAO estimated the federal government’s expenses resulting from uncollected loans under these programs amounted to about $15 billion for the year. 29
In light of the considerable taxpayer support for 501(c)(3) organizations, and the hundreds of billions of dollars donated to charities every year, it is important the IRS ensures appropriate enforcement of the requirements for 501(c)(3) tax-exempt status.
Abuses within the Nonprofit Sector: 501(c)(3) Status Makes Greedy Charity Directors Rich
In 2013, a breakthrough investigative project exposed the 50 worst charities in America.30 These entities distort the nonprofit tax system in a reverse Robin Hood scheme—stealing from the poor to pad the pockets of the wealthy. The investigation raised serious concerns with the activities and financial structures of dozens of charitable 501(c)(3) organizations. Many of these entities diverted most of their charitable donations to private fundraising companies instead of the charitable activities advertised.
With names like “Find the Children,” “The Veterans Fund,” and “Cancer Fund of America,” it is easy to see how the 50 worst charities in America raised $1.3 billion31 in donations over the last ten years.32 Yet, almost none of this money benefited missing children, wounded veterans, cancer patients, or any other charitable cause.
Instead, these charities duped donors and stole millions of dollars from the sick and needy. The money spent by all 50 charities on hired telemarketers “would have been enough to build 20,000 Habitat for Humanity homes, buy 7 million wheelchairs or pay for mammograms for nearly 10 million uninsured women,”33 according to the Tampa Bay Times.
While there is not a legal standard or requirement for how much a charity should be allowed to spend on the cost of
Many well-meaning celebrities and politicians, including President Obama, President Bush, and singer Chris Brown, have donated their time to grant the wishes of KWN kids.

260 | Tax Decoder Tax-Exempt Organizations | 261
fundraising, or a requirement on how much should be spent on direct cash aid, the Times writes that watchdog groups say no more than 35 percent of an organizations’ spending should go to fundraising activities. The 50 charities identified in the investigation, however, paid a stunning 69 percent of their budgets to professional solicitors.34
The Worst Charity in America
The Kids Wish Network (KWN), a Florida organization, earned the title of America’s worst charity. This Make-A-Wish knock-off claims to grant the wishes of terminally ill children. Yet, KWN gave its corporate fundraisers $110 million of the $128 million it raised in the last decade.35 Many well-meaning celebrities and politicians, including President Obama, President Bush, and singer Chris Brown, have donated time to grant the wishes of KWN kids.36
Unlike Make-a-Wish, which only spends about one percent of donations on fundraising, the KWN spends less than three cents per dollar of annual contributions to grant wishes for sick children. In 2012, KWN raised $18.6 million and spent only $240,000 granting wishes. According to the Tampa Bay Times, “No charity in the nation has siphoned more money away from the needy over a longer period of time.” In the last 10 years, the group has funneled $4.8 million to its founder, Mark Breiner, or to one of his for-profit consulting firms.37
The KWN is currently being investigated by the Florida Attorney General and the Florida Department of Agriculture, which has received 146 complaints against it since 2003. Yet, it continues to maintain its 501(c)(3) status, with all the federal tax advantages that follow.38
A “Wretched Charity Empire”: the Reynolds Network’s Cancer Charities
The second worst charity, Cancer Fund of America (CFOA), spent less than one percent of donations on charitable activities. Over 10 years, the organization paid $5 million to its founder’s family members and spent $80 million on hired fundraisers, but gave only $890,000 to cancer patients.
Cancer Fund of America was founded in 1987 by James T. Reynolds in the state of Delaware, and claims to be the oldest na-tional cancer organization whose mission is to provide products to cancer victims and their families, with no emphasis on research.39
The group mails an assortment of necessities to cancer patients, hospices and agencies, such as shampoo, paper plates, coloring books, and board games. But recipients often consider the contents unhelpful, and they often just throw them away. Meanwhile, numerous recipient hospices and agencies listed in the organization’s IRS tax filings have no record of receiving any goods from the charity and have never even heard of CFOA.40
These goods are donated from businesses and repackaged at the warehouse where they are mailed free of charge to individuals and other nonprofits in the U.S. CFOA only has to pay the shipping costs, which amount to around $600,000 a year. Yet, the organization has paid over $80 million to for-profit fundraising corporations in the last decade.
In 2011, CFOA employees’ salaries were over $8 million, 13 times more than patients received in assistance. Almost $1 million went to Reynolds family members. Records show that less than two cents of every dollar in charitable contributions to the CFOA has gone to direct cash aid for patients or families.
Reynolds has built an empire scamming people through
A Tampa Bay Times chart details the network of five fake cancer charities that enrich James T. Reynolds, Sr. and his family members.42

DRAFT
262 | Tax Decoder
nonprofits. He even assisted his family in the creation of four more charities, all with similar missions. Each of these nonprofits has family members on the payroll as an employee, board member, or fundraiser. In 2007, CFOA paid Reynolds’ son, stepson, sister-in-law, and son-in-law over $75,000 each.
In 1989, CFOA was one of several charities who were sued for scamming sweepstakes winners and collectively paid a fine of $2.1 million. Between 1992 and 2007, five different states accused Reynolds of misleading donors, and forced the organization to pay fines. Georgia sued CFOA for misrepresenting a service they said they provided. The organizations agreed to a settlement and donated $50,000 to a charity chosen by the state of Georgia. This was the largest donation CFOA has ever made to charity.
Despite what Nonprofit Quarterly calls the Reynolds family’s “Wretched Charity Empire,” CFOA and four other fraudulent cancer charities still maintain their federal charitable status courtesy of Uncle Sam.41
Celebrities Siphoning Cash from Hollywood Fundraisers
The nonprofits that come to Hollywood often spend big on large-scale benefit events. “Almost any night of the week around Los Angeles, one charity or another holds a glitzy fundraising benefit, backed by a Hollywood star,” the LA Times wrote in 2003, “but many celebrities appear at these events not solely out of the goodness of their hearts. They come to line their pockets.”44
Like the nonprofits discussed above, large chunks of these organizations’ budgets may go to fundraising. There is an additional twist at these events, however. The celebrities headlining the galas are sometimes paid by the charities to appear. Donated funds that could have gone to worthy charitable causes are instead used to pay hefty appearance fees to big-name Hollywood stars.
Some event organizers refuse to use charity money to pay celebrities to appear—many, however, believe it is only logical. “Reeling in a major celebrity is a must for most fundraisers because it triggers a chain reaction of donations,”45 the LA
Times explained. “Honoring a star means every studio that wants him or her in a movie will be purchasing a table as well as an ad in the program booklet lauding the star. Honoring a studio chief brings in money from those who do business with the company and fills chairs with stars who appear in its movies and TV shows.”46
Singer Wyclef Jean took this practice a step further. His charitable foundation, the Wyclef Jean Foundation, paid the singer $100,000 in 2006 to perform at his own benefit concert. According to the charity’s tax return, “The Foundation reimburses the reasonable expenses of its officers and directors in the performance of their duties.”47 The return asserts the fee paid to Jean was “substantially below market value.”48
These glitzy events, and the celebrities who appear at them, are often paid for with money from charitable contributions—contributions for which donors were able to claim tax deductions. The charitable deduction was intended to encourage generosity for causes like education and medical research. The theory is that the federal government accepts a revenue loss and donors save on taxes, encouraging them to increase their support of worthy causes. In these situations, the charitable deduction is instead subsidizing donations that support the lavish lifestyles of Hollywood elites—at the expense of U.S. taxpayers.
Poorly Run Charities Founded by Athletes and Celebrities
Celebrities often create their own nonprofit charities. Many of these organizations may be born of good intentions. Yet, too often these are mismanaged, due to their founder’s lack of experience in the nonprofit sector. Others may have been created for self-serving purposes.
Several celebrity charities ultimately gave little or nothing to charitable causes. In 2009, the Kanye West Foundation spent a total of $553,826—but only $583 went to charity. The rest was eaten up by expenses such as salaries, travel, overhead, and “professional fees.” In 2010, the foundation did even worse, spending $572,383 on expenses, and not a single penny on charity. The foundation was shuttered shortly thereafter.49 Actor Jack Scalia raised more than $100,000 for
Charity money is often used to pay the expenses of charity galas—including fees to induce big-name celebrities to attend.43

262 | Tax Decoder Tax-Exempt Organizations | 263
military veterans and 9/11 victims, but the IRS stripped his groups of tax-exempt status when he failed to file tax returns for more than a decade and claimed he did not know what happened to the donated money.50
Other organizations made some contributions to charity, but far too much of their budget was eaten up by overhead, fundraising, and events. An ESPN investigation found nearly 75 percent of 115 charities founded by high-profile athletes failed to meet nonprofit operating standards for efficient, effective use of money. “Many athlete charities fail the effectiveness test for a variety of reasons, ranging from the deceptive and unethical—if not illegal—to the simply neglectful and ignorant,” ESPN explains. “Some athletes set up foundations as tax-planning vehicles. Others dispute the nonprofit standards overall, saying as long as they spend at least some money on actual charity they should not be criticized.”52
Mark Pollick, president of The Giving Back Fund, says the attitude among some athletes is “You should have a foundation because it’s good for your brand.” Some of these self-interested charities spend their resources hosting expensive fundraisers, leaving little for actual charity.
They have a lot of fun at these events. They have a wonderful golf tour. At the end of the day, they sometimes spend months putting these things together to raise $10,000. That’s insane. Just write a check for $10,000 and take the next six months off.53
Examples abound of poorly run athlete charities. In 2006 and 2007, NBA star Baron Davis formed a company to manage a fund-raising event involving a “weekend of celebrity basketball games, poker tournaments and entertainment.” The event was intended to raise money for his charity, the Team Play Foundation, and oth-er basketball players’ charities. Ultimately, however, the company formed to run the event actually took $632,000 from Team Play, and there is no evidence the events raised any money for Team Play in return. Although Team Play had been founded to raise money for other charities, only 8 percent of Team Play’s $1.3 million in expenditures ultimately went to this purpose.54
As another example, the IRS eventually revoked the tax-exempt status of famous Yankees player Alex Rodriguez’s
two charities, which had failed to file tax returns since 2006, leaving $300,000 from a fundraiser unaccounted for.55 Meanwhile, former Chicago Bears player Chris Zorich was ordered to pay the state of Illinois almost $350,000 in unspent charity funds he could not account for.56
Other organizations do at least spend their money on others, but the services they provide strain the definition of charity. The stated mission of Lady Gaga’s 501(c)(3) Born This Way Foundation is “connecting youth in safe ways and empowering them with skills and opportunities that will inspire them to create a kinder and braver world.”57
The foundation raised $2.6 million in 2012, but only gave away $5,000 for “grants to organizations or individuals.”58
Donations instead paid for publicity experts, lawyers, stage productions, web consulting, social media, and event coordination.59 These expenses were likely connected primarily to the bus tour. While the event may have some positive impacts, it appears the main work of the foundation was simply to promote and host pre-concert parties for Gaga fans. Meanwhile, roughly $1.5 million was spent on “legal fees, publicity, and a website,” for the Born This Way organization, which lists Lady Gaga’s mother as the president.60
There may be a reason the organization’s purpose is so ambiguous. The main activity highlighted on the organization’s website is the “Born Brave Bus Tour,” which followed Lady Gaga’s concert tour, offering fans a free pre-concert 3-hour tailgate-style event with a DJ, games, free food, a photobooth, and a lounge aboard the bus with “funky decor.”62
While charities like these may have been founded with good intentions, in practice they may function mainly as vehicles to host tax-free parties and golf tournaments and build a celebrity’s brand. Money that could have gone to education, medical research, or impoverished communities is instead lost to overhead, salaries, and expensive fundraising dinners and sporting events. Or worse, the funds simply disappear due to inept bookkeeping or dishonesty. Many celebrities and athletes would do better to donate or fundraise on behalf of experienced, credible charities that know how to balance overheard with actual charitable work.
The Kanye West Foundation spent more than $1 million from 2009-2010, but gave virtually nothing to charity.51
A tailgate-style pre-concert party hosted by Lady Gaga’s Born This Way Foundation.61

DRAFT
264 | Tax Decoder
Institutions of Higher Education
The definition of “educational institution” for purposes of the tax code encompasses a wide range of entities, ranging from professional associations, zoos, and libraries to parent-teacher groups, college athletic associations, and major universities. Not only is any donation to these groups tax deductible for the individual donating, but these groups do not pay any federal income taxes—including on the interest earned from their investment assets. Following the federal lead, states also typically provide tax-exempt status to these organizations.
According to 2013 data, educational institutions comprise 15 percent of 501(c)(3) organizations. Of about 150,500 registered education-related 501(c)(3) organizations, 142,000 are public charities and 8,500 are private foundations. About 62,000 educa-tion-related 501(c)(3) public charities filed Forms 990, on which they reported $277 billion in revenue and $916 billion in assets.63
Some of the very largest 501(c)(3) organizations are educational organizations, including the President and Fellows of Harvard College, the Stanford University Board of Trustees, Yale University, the Trustees of Princeton University, and the Massachusetts Institute of Technology.64 These organizations hold billions of dollars in assets, including investments which may accumulate tax-free. Harvard University boasts the largest endowment, which topped more than $32 billion in 2013. Yale, Princeton, Stanford, and the University of Texas system each hold endowments of $18-$20 billion.65
For these multi-billion-dollar endowments, the exemption from investment taxation is highly valuable. Economist Richard Vedder explains:
Big endowments such as Harvard’s probably often reap at least $1 billion annually from capital gains. They pay no income taxes on those gains; individuals pay 23.8 percent. They also pay no income taxes on dividend and interest income. The donations that form the endowments are deductible against donor income taxes, giving rich people the incentive to give to their already rich colleges, which in turn give preferences to alumni children.66
Vedder compares the private Princeton University and a nearby public college, making the case that the federal tax exemption provided to Princeton’s endowment is actually far more valuable on a per-student basis than the direct public subsidies provided to the public college.67
“Nonprofit” Hospitals
Thousands of hospitals nationwide are registered as 501(c)(3) charitable organizations. Just like donations to the American Red Cross or Goodwill Industries, contributions to hospitals are tax-deductible. Any net income generated by the hospitals is not subject to federal income taxes, and is also generally exempt from state and local taxes. Given the high value of these preferences, whether this tax treatment is justified has been debated extensively over the years.68 While Congress and the IRS have made some headway into increasing transparency for the nearly 2,900 hospitals claiming the status, more reform is necessary to ensure taxpayers are actually getting real benefits in return for these tax advantages.69 Exemption from tax is not a right, but rather a privilege that comes with responsibility.
General History and Background
Hospitals have been able to claim a tax exemption under section 501(c)(3) of the tax code since the 1950s, when the IRS first issued rules on what hospitals must do to claim the status. At that time, the agency implemented the “financial ability standard,” which required hospitals using the status to provide as much charity care as they were able.70 That decision lasted only two decades. In 1969, the IRS changed its position and established the “community benefit standard.”71
Essentially as vague as it sounds, this policy lays out several factors that are considered in IRS’ decision to grant or deny a hospital the tax exemption:72
1. Whether a hospital maintains a public emergency room that will treat any emergency condition;
2. Whether the board of trustees is made up of members from the community;
3. Whether net profits are reinvested in facilities, debt management, patient care, or medical education;
4. Whether a hospital provides inpatient treatment for anyone who is able to pay, including Medicaid and Medicare beneficiaries (in other words, not exclusive to a certain group); and,
5. Whether all local, qualifying physicians are eligible for privileges at the hospital if they meet its guidelines.
These criteria are not mandatory, and none requires the provision of “charity care” in any way. Hospitals may qualify for the special tax status through other means, “based on all the facts and circumstances,”73 according to the GAO.
The standard has hardly changed since 1969, and only once has Congress modified the law to address concerns about whether some hospitals are abusing the exemption. In 2010, the Patient Protection and Affordable Care Act (ACA) added additional requirements for tax-exempt status. The
NONPROFIT HOSPITALS ARE GENERALLY NOT SERVING WORSE-OFF POPULATIONS. IN FACT, CBO’S STUDY FOUND FOR-PROFIT HOSPITALS (IN THE FIVE STATES ANALYZED) HAD A HIGHER SHARE OF MEDICAID PATIENTS, AND GENERALLY OPERATED IN AREAS WITH SLIGHTLY LOWER AVERAGE INCOME AND UNINSURED RATES.

264 | Tax Decoder Tax-Exempt Organizations | 265
ONE ANALYSIS OF HEART ATTACK PATIENTS FOUND NO “EVIDENCE THAT FOR-PROFIT HOSPITALS SELECTIVELY TREAT LESS SICK PATIENTS, PROVIDE LESS EVIDENCE-BASED CARE, LIMIT IN-HOSPITAL STAYS, OR HAVE PATIENTS
WITH WORSE ACUTE OUTCOMES THAN NONPROFIT CENTERS.
first is a biannual assessment of community health needs. The second requires hospitals to have a clear financial assistance and emergency medical care policy.74 Third, hospitals are not allowed to charge patients qualifying for financial assistance more than the lowest amount charged to someone with private insurance. Fourth, hospitals must examine a patient’s eligibility for financial assistance before going through the debt collection process.
Cost and Usage
There are about 2,900 nongovernmental, nonprofit hos-pitals nationwide, together generating around $800 billion in revenue.75, 76 Few estimates exist of the overall revenue impact of the hospital tax exemption under Section 501(c)(3). The Joint Committee on Taxation estimated in 2002 that the exemption it-self resulted in $2.5 billion in lost federal revenue.77 Adjusting this figure for inflation, it would be worth over $3.3 billion in 2014.78
The charitable tax status also means individuals are able to receive tax deductions for most cash or in-kind donations made to nonprofit hospitals. Charitable deductions for donations to health care organizations resulted in $4.8 billion in lost federal revenue in FY 2014. Additionally, nonprofit hospitals have access to tax-exempt bond financing for construction, which resulted in another $2.2 billion in lost revenue in FY 2014.79
Adding together all three major tax benefits, nonprofit hospitals cost approximately $10.3 billion per year in lost federal revenue. With nearly 2,900 nonprofit hospitals in the country,80 the average federal subsidy per nonprofit hospital is about $3.6 million in 2014 through the tax code alone. This sum does not even include the array of subsidies from other federal programs, as well as state and local governments.81
Caring for Community?
In general, nonprofit hospitals are not much different than their for-profit counterparts when it comes to the kinds of patients they treat and the assistance they provide. For example, they give only slightly more charity care than hospitals subject to federal income tax. A five-state analysis by CBO found, “[N]onprofit hospitals were estimated to have an average uncompensated-care share that was 0.6 percentage points higher than that for otherwise similar for-profit hospitals”82 in those five states. Uncompensated care also continues in nonprofit hospitals that are acquired by for-profit entities, according to a separate analysis.83
Nonprofit hospitals are generally not serving worse-off populations. In fact, CBO’s study found for-profit hospitals (in the five states analyzed) had a higher share of Medicaid
patients, and generally operated in areas with slightly lower average income and uninsured rates.84
Nonprofit status also has no impact on the overall quality of care provided by a hospital. One analysis of heart attack patients found no “evidence that for-profit hospitals selectively treat less sick patients, provide less evidence-based care, limit in-hospital stays, or have patients with worse acute outcomes than nonprofit centers.”85 A broader look at Medicare data also supported a similar view (although it found there is an added cost to being treated in a for-profit institution).86 To their credit, nonprofit hospitals were more likely than for-profit counterparts to have specialized services in burn treatment, emergency room care, high-level trauma, and labor and delivery.87
More broadly, in the nearly six decades hospitals have claimed the special nonprofit status, neither the IRS nor Congress has established a clear standard for how much charitable care they need to provide. The IRS’ loose standard has allowed nonprofit hospitals “broad latitude to determine the services and activities that constitute community benefit,” said GAO.88 Tax-exempt hospitals reported spending, on average, about 7.5 percent of their operating expenses on “community benefits” in 2009.89
Almost half of the “benefit” was the cost of serving Medicaid patients, on whom hospitals (for-profit and nonprofit) are said to generally lose revenue.90 Only 1.9 percent of nonprofit hospitals’ operating expenses went toward charity care.91 “Two out of three hospitals spent less than 2 [percent]”92 on charity care, according to a separate analysis by Modern Healthcare. Median profit margin was about three percent at the time of the study.93
When hospitals do claim to have provided uncompensated care, the data used to support their claims can be questionable. Hospitals are supposed to report the value of their charity care based upon the actual cost of providing it. Some hospitals have instead appealed to their “chargemaster” prices, the hospital’s internal list of prices for every procedure.94 These prices are often far removed from the actual costs of products or services. At Stamford Hospital, one uninsured woman was billed $199.50 each for three troponin tests after a car accident.95 Medicare and private insurance would have reimbursed the hospital far less for each test.96 In the view of some hospitals, “charitable care” is often the difference between what the hospital’s chargemaster says and what the hospital actually receives (whether from an uninsured patient or through Medicare and Medicaid).97, 98 What results is an overstated figure of how much it actually costs a hospital to care for someone who could not pay their bills.
Nonprofit hospitals essentially get a free pass regardless of how they use their resources, even when their business activities and strategies appear similar to those of for-profit entities. One industry expert noted, “The major non-profit systems around

DRAFT
266 | Tax Decoder
the country are talking strategically. They want to get bigger.” 99
For example, nonprofit hospitals sometimes even partner with businesses to expand their reach. One of the largest nonprofit hospital chains—Ascension Health—partnered with a private equity firm in a joint venture to acquire “mission-driven smaller facilities and systems.”100 Other nonprofits have simply made direct acquisitions of hospitals.101 While these activities are legal for a nonprofit entity, their similarity to the operations and missions of for-profit entities certainly raises question about what purpose the tax exemption serves.
Considering the ambiguity in the meaning of “community benefit,” it is no wonder the IRS, after investigations, has only revoked tax exemptions for two hospitals in the last 10 years.102
Unhealthy Salaries?
The compensation of nonprofit hospital CEOs nationwide has raised eyebrows. Any organization should be able to pay its employees to attract the best talent possible. To the extent that a tax exemption enables a hospital to pay its executives more than it otherwise would, however, the necessity of the exemption should be questioned—especially when there is little clear evidence the tax exemption is resulting in additional benefit to the community.
Average compensation for the top executives of the largest nonprofit hospitals was $2.1 million in recent years.103 In Texas, the CEO of MD Anderson makes close to $2 million every year, more than three times the compensation of the president of the University of Texas system, of which it is officially a part.104 Another hospital—the Bronx’s Montefiore Medical Center—is so large that it is six times the size of the New York Yankees
stadium and had annual revenue of about $2.6 billion in 2010.105 The CEO made $4.1 million; the CFO, $3.2 million; the execu-tive vice president, $2.2 million; and the dental department head, $1.8 million.106 Over 99 percent of the hospital’s revenue came from patient bills in 2010.107
Duplication of Existing Federal Programs
Providing health care for low-income populations and others who are unable to obtain insurance is a noble goal. It is important to note, however, that a number of federal programs outside the tax code exist to ensure availability of care. For example:
• The federal health center program provided over $3.5 billion in grants in FY 2014 for community health centers, health centers for the homeless, public housing-focused health centers, and migrant-focused facilities.110
• There are also 91 medical workforce programs that provided over $14 billion in support in FY 2012.111 Many of these programs are targeted to low-income and rural areas that would presumably need greater access to charitable care.
• The Ryan White HIV/AIDS Program provided over $2 billion in funding for low-income patients with HIV in FY 2014.112
• Medicaid and the State Children’s Health Insurance Program (SCHIP) together spend over $300 billion in federal funds in FY 2014 to provide care for low-income children and adults.113
• Medicare operates the disproportionate share hospital (DSH) program, in which hospitals that treat an extraordinary number of low-income patients receive extra payments from federal and state governments. The federal government spent $11.7 billion on DSH payments in FY 2014.114
• Medicare operates a bad debt reimbursement program in which providers can seek recompense for unpaid copays and deductibles.115
• Title X funds administered by HHS provide over $286 million for family planning programs every year, including those targeting teenage pregnancy, breast and cervical cancer screen, and family planning services.116
Other federal assistance programs exist for mental health, cancer screening, family planning, and rural health.117 Several block grants—such as the Community Development Block Grant—also have funding available for hospitals.118 Allowing certain hospitals to retain nonprofit status essentially duplicates the aim of these federal programs—to increase access to healthcare services for targeted populations.
Recommendation
The intent of the tax exemption for hospitals is noble, but the policy is in serious need of reform. If Congress is to achieve the goals of streamlining the tax code and reducing incentives for overspending in health care, it cannot maintain the status quo.
Rather than subsidizing standalone entities, a better
ULTIMATELY, CONGRESS SHOULD STRONGLY CONSIDER PHASING OUT THE EXEMPTION FOR HOSPITALS AND ADDRESSING HEALTH POLICY GOALS USING DIRECT SPENDING PROGRAMS, MANY OF WHICH ARE ALREADY IN PLACE.
Average CEO compensation across all nonprofit hospitals is over $595,000.108 Unfortunately, CEO compensation is a poor predictor of the hospital’s value to the community. “Compensation was associated with technology and patient satisfaction but not with processes of care, patient outcomes, or community benefit”109 at nonprofit hospitals, according to a recent study published in JAMA Internal Medicine.

266 | Tax Decoder Tax-Exempt Organizations | 267
approach to expanding access to health care would be to ensure all families are adequately covered through insurance that allows them to visit a facility of their choice. Expanding insurance coverage is a goal of lawmakers of all stripes. As this goal is achieved, the need for “charity care” and nonprofit tax designations will diminish.
Ultimately, Congress should strongly consider phasing out the exemption for hospitals and addressing health policy goals using direct spending programs, many of which are already in place. In the interim period in which the exemption still exists, Congress should:
1. Require a GAO study of how the policy goals of nonprofit hospital status overlap with other federal programs. The study should examine the optimal location for hospitals, the need for specialty units within hospitals, and the provision of medical care to patients unable to pay for medical bills.
2. Establish and continually reevaluate a level of required charitable care, separate from the more nebulous “community benefit standard.” Calculations should be based on actual costs, not hypothetical prices like those in the chargemasters, and should be audited more frequently by the IRS.
3. Require nonprofit hospitals to publish information on average charges collected from uninsured patients and those in private insurance, Medicare, and Medicaid.
Tax-Exempt Interest for Bonds Issued by Private, Nonprofit Hospitals
Qualifying for 501(c)(3) status gives nonprofit hospitals more than just a pass from the IRS. These nonprofit hospitals also get special access to capital for construction and acquisition projects. Bonds have also been used to finance mergers between nonprofit health systems.119
Background
In 1968, Congress prohibited most private entities from benefiting from tax-exempt bonds, but private 501(c)(3) hospitals were included in a limited list of entities which were permitted continued access to these financing instruments. Originally, for-profit hospitals were eligible for assistance from tax-free bonds, but Congress decided not to extend their access to the benefit after 1986.
These bonds receive the same tax treatment as governmental bonds. That is, the interest earned on them is exempt from federal income tax. Most 501(c)(3) organizations may have no more than $150 million worth of tax-exempt bonds outstanding at any given time, but 501(c)(3) hospitals are not subject to this limit. States generally have public agencies that monitor and issue bonds on behalf of hospitals and other nonprofit organizations.
Cost and Usage
The cost to taxpayers in 2014 for the current exclusion of in-terest on bonds for private nonprofit hospital facilities will be $2.2 billion. Over the next five years, the cost will be $12.5 billion.120
Analysis
As discussed previously, there are already major questions as to whether nonprofit hospitals are providing a benefit to the com-munity in excess of their cost to taxpayers. Allowing nonprofit hos-pitals access to tax-exempt bond financing furthers their financial edge over for-profit institutions, and increases costs to taxpayers. These effects make the question of retaining or eliminating non-profit hospitals’ tax-exempt status all the more significant.
Allowing tax-exempt bonds for these hospitals is simply an inefficient way to subsidize health care. First, providing assistance to hospitals through bonds is an expensive way to help finance their projects. CBO has concluded the “amount of tax benefits received by lenders exceeds the interest savings to the hospitals by about 33 percent.”121 Second, because there are no limits on the amount of tax-free hospital bonds any state can issue, bonds may be facilitating overinvestment in some areas that are not as in-need as other areas.122
In fact, hospital capacity nationwide may be excessive. Hospital occupancy (the percent of inpatient rooms being used) declined from 64 percent in 2006 to 61 percent in 2012.123
This trend is even more dramatic in rural areas, a category often viewed as high-need. Occupancy rates in these areas in 2006 were 48 percent, and dropped to 43 percent in 2012.124 To the extent that any area—rural or urban—is in need of better access to hospitals, any public assistance would be better targeted by taking these factors into account.
The adverse effects of tax-free bonds extend beyond the healthcare industry. Such financing for hospitals can put upward pressure on the costs of public infrastructure projects.125 An increased supply of bonds in the marketplace means debtors need to offer more attractive interest rates, increasing their borrowing expenses. The bonds may also hinder the national economy by leading nonprofit hospitals to invest in activities that do not generate as high a return as they would otherwise. With a lower borrowing cost, nonprofit hospitals are able to pursue opportunities that have a lower return on investment, which may be worse for the nation at large. “If nonprofit hospitals invest in lower-value activities because of that lower pretax return, those investments contribute less to national
ALLOWING TAX-EXEMPT BONDS FOR THESE HOSPITALS IS SIMPLY AN INEFFICIENT WAY TO SUBSIDIZE HEALTH CARE.

DRAFT
268 | Tax Decoder
Charitable Remainder Trusts and Other Split-Interest Trusts
History and General Background
Charitable remainder trusts (CRTs) are complex financial planning arrangements that are generally used for the dual purposes of providing retirement income and making contributions to charity. Although these trusts may facilitate generosity toward charitable causes, they are also used by some simply for the tax advantages. Asset protection lawyer Robert Mintz writes, “The intent of the law is to encourage charitable giving but the law is drawn broadly so that even if your charitable wishes are only a minimal part of your overall goals, the CRT can produce highly favored tax treatment in a variety of situations.”130
The complexity of CRTs makes them accessible only to those who can afford specialized financial planners. “There are many rules, traps and explanations which apply to any CRT,” Mintz cautions, explaining that depending on how they are set up, a CRT can easily move into a “grey area” that the IRS may challenge. In other words, they are not recommended for ordinary citizens to attempt on their own. CRTs are a prime example of the complex, opaque tax provisions that make the U.S. tax code among the most complicated in the world. Such provisions widen the gap between those who have the resources to take advantage of the tax code and those who do not.
The CRT itself is a tax-exempt entity, and pays no taxes on any income it earns. The taxpayer may contribute assets to the CRT, such as stocks, bonds, or real estate. The CRT may earn income from the assets without paying taxes on it, or sell them without paying the capital gains tax. The CRT then distributes specified amounts back to the taxpayer over a pre-determined timeframe, often ending with the taxpayer’s death. The taxpayer pays tax on these distributions as he receives them.131
Whatever is left in the CRT at the end of the timeframe—the “remainder interest”—is donated to a designated charity. The remainder interest is required to have a certain minimum value. When the CRT is created, the taxpayer claims a charitable deduction for the future gift to the charity—even though it may be decades before the charity receives it. The value of the deduction is determined based on the present value of
the remainder interest at the time the CRT is created. Many factors impact the value of the deduction. According to one gift planning service, “the longer the charity must wait and the greater the income payments to the income beneficiaries, the lower the amount of the charitable deduction.”132
Congress created CRTs in 1969 in reaction to perceived abuses of the charitable deduction. The 1969 law established a formal process to carry out this already-existing tax strategy with restrictions to prevent abuses.133 Nevertheless, CRTs remained a vehicle for crafty tax avoidance schemes. A 1996 IRS document describes a scheme, now prohibited by the agency, to create CRTs that existed for only two years to dodge capital gains taxes.134 Due to the high complexity of the CRTs and the considerable “grey areas” in the rules surrounding them, CRTs remain vulnerable to exploitation by creative tax lawyers, exposing the federal government to costly investigation and litigation expenses.
The IRS lists two primary types of CRTs: Charitable Remainder Annuity Trusts (CRATs), which provide fixed-value payments, and Charitable Remainder Unitrusts (CRUTs), which provide variable payments depending on the performance of the assets in the trust.135 CRUTs are the most common,136
and can be set up in a variety of ways. Financial professionals have developed their own names for these variations, such as NICRUT, NIMCRUT, and FLIP CRUT.137
CRATs and CRUTs are both types of “split-interest trusts,” arrangements that are used to pay both charitable and non-charitable beneficiaries. The IRS recognizes two other types of split-interest trusts: the Pooled Income Fund and the Charitable Lead Trust.138 The Pooled Income Fund operates essentially the same as CRATs and CRUTs; income is first paid out to non-charitable beneficiaries, then the remainder interest is donated to charity, with the same tax treatment. The difference is Pooled Income Funds are established and maintained by a public charity.139 The Charitable Lead Trust is also structured similarly to CRATs and CRUTs, except the order of beneficiaries is reversed: first, the charities receive the stream of income payments, then the non-charitable beneficiary receives the remainder interest.
income…than unsubsidized investments,” writes CBO.126
The American Hospital Association (AHA) argues tax-exempt financing is crucial to keeping nonprofit hospitals in existence.127
But there is evidence that nonprofit hospitals may still be able to afford debt financing if they lose this specific subsidy. Over half of nonprofit hospitals studied by Moody’s Investment Service have net operating margins over 2.2 percent.128 Of the top 25 hospitals with the highest net operating margin in 2010, 10 are nonprofits with margins ranging from 24 percent to 37 percent.129
Recommendation
Congress should adopt the proposal from Alan Simpson and Erskine Bowles, the co-chairs of the President’s bipartisan National Commission on Fiscal Responsibility and Reform. They proposed eliminating tax-exempt bonds altogether, including those for nonprofit hospitals. Adequate access to hospital facilities can be better promoted by state and federal governments through existing direct spending programs.

268 | Tax Decoder Tax-Exempt Organizations | 269
501(C)(4) Social Welfare Organizations Lobbying groups. The International Olympic Committee. Multi-billion dollar health care networks. Super PAC affiliates.
Beauty pageants. Shooting clubs. Even a $2 billion a year casino and racetrack in Iowa. What do these seemingly unrelated organizations have in common? They all are tax-exempt under Section 501(c)(4) of the tax code.
501(c)(4) tax-exempt organizations are ambiguously defined, which has resulted in a range of questionable groups claiming the status. According to an IRS training manual, this section of tax law is: “in some degree a catch-all for presumptively beneficial nonprofit organizations that resist classification under the other exempting provisions of the Code. Unfortunately, this condition exists because ‘social welfare’ is inherently an abstruse concept that continues to defy precise definition”144
Miss America Organization180
Americans for Tax Reform181
The tax treatment of a Charitable Lead Trust is also significantly different—the trust itself is not tax-exempt, but the contributions to charity may generate charitable tax deductions.140
For filing year 2012, the IRS reported 113,688 split-interest trusts holding $117 billion in assets. Over 91,000 of these trusts were CRUTs, which held $85 billion in assets, paid out $5.2 billion in distributions, and generated $1.6 billion in charitable deductions.141
Analysis and Recommendations
Although split-interest trusts may benefit some truly
benevolent causes, there is a reason for their name: they are used both for personal and charitable purposes. The extreme complexity of the arrangements makes them accessible only to the wealthiest, most sophisticated taxpayers, and vulnerable to elaborate tax avoidance schemes. Congress should work to eliminate provisions that widen the gap between those who can afford to take advantage of these complex provisions, and those who cannot. Split-interest trusts under Section 4947(a)(2) of the tax code should therefore be eliminated.142 Taxpayers interested in dedicating money to charity will still be able to use ordinary charitable trusts under Section 4947(a)(1).143

DRAFT
270 | Tax Decoder
History and General Background
As of FY 2013, over 91,000 organizations were registered under 501(c)(4), making it the second-largest category of registered nonprofits, after 501(c)(3)s.145 IRS provides a list of (c)(4) examples, including local community associations that sponsor community sports leagues, organize holiday programs, or promote community causes like industrial development and unemployment relief.146 According to a database of nonprofits that have filed 990 forms, 501(c)(4) organizations do include many community-oriented organizations, including several thousand chapters of service clubs such as Rotary, Lions, and Kiwanis,147 at least two thousand firefighting organizations,148 and hundreds of veterans’ organizations.149 However, 501(c)(4)s encompass much more than local community groups.
The following are a few examples of “presumptively beneficial” 501(c)(4) social welfare organizations:
• Lobbying and grassroots advocacy organizations, including the Human Rights Campaign, America Votes, the National Organization for Marriage, the Center for American Progress Action Fund, Third Way, the Eagle Forum, the Campaign for Liberty,150 chapter organizations of the ACLU,151 Americans for Tax Reform,152 and Organizing for Action;153
• The advocacy components of large national interest groups, including the AARP,154 NRA,155 and the Humane Society;156
• Organizations active during elections,157 including Crossroads GPS,158 American Future Fund,159 the Planned Parenthood Action Fund,160 and Priorities USA.161 Many of these are associated with Super PACs;
• Health care associations, which are generally the largest 501(c)(4)s. Examples include the $4.8 billion a year Blue Care Network of Michigan, the $4.8 billion Health Insurance Plan of Greater New York, and the $2 billion Selecthealth, Inc;162
• Non-U.S. organizations including FIFA,163 the International Olympic Committee,164 and the Shell Foundation;165
• Hobby and recreational clubs, including Porsche clubs,166 shooting clubs,167 kennel clubs,168 sports organi-zations,169 ski clubs,170 motorcycle clubs,171 golf cours-es,172 and the Alabama Deep Sea Fishing Rodeo;173
• Prairie Meadows Race Track and Casino in Altoona, IA, one of the largest of all 501(c)(4)s with over $2 billion in revenue, and174, 175
• Beauty pageants,176 including the $8 million Miss America Organization,177 the over $4 million Miss Alabama Pageant,178 and the over $100,000 Miss Rodeo Texas Association.179
Requirements
Section 501(c)(4) of the tax code defines social welfare organizations as “Civic leagues or organizations not organized for profit but operated exclusively for the promotion of social welfare.”184 These groups must be operated for the primary purpose of improving the community or providing some form of social good.185 Organizations that only provide narrow benefits, to either individuals or small groups, do not qualify for tax-exempt status as a (c)(4).186, 187
The term “primarily” is a key test for determining nonprofit status. While a 501(c)(4) organization may not exist solely for the benefit of its members, “some amount of private benefit may be permissible so long as the organization’s activities remain ‘primarily’ social welfare.”188
Business activities
An organization will be disqualified for tax-exempt status if its primary activity is “carrying on a business with the general public in a manner similar to organizations operated for profit.”189 It may be permissible for such activities to be the organization’s primary source of income, but they cannot be the organization’s primary activities overall.190
The conservative 501(c)(4) Crossroads GPS182 and liberal 501(c)(4) Priorities USA Action.183

270 | Tax Decoder Tax-Exempt Organizations | 271
Lobbying
Lobbying for legislation “germane to the organization’s programs” is considered a permissible social welfare pur-pose. An organization that lost its 501(c)(3) status due to impermissible lobbying may not qualify as a 501(c)(4) orga-nization, however.191 In addition, if a corporation makes con-tributions to a 501(c)(4) organization, and the organization uses the money for lobbying, the corporation may not de-duct the contribution as a business expense.192
Protections against using tax-exempt organizations for private benefit
As is the case with many tax-exempt organizations, the net earnings of a 501(c)(4) entity may not inure to the benefit of any private shareholder or individual.193 If a 501(c)(4) organization engages in an “excess benefit transaction” with any “disqualified person,” that person will face tax penalties.194 A disqualified person is any person in a position to exercise substantial influence over the organization, including voting members of leadership, financial managers, substantial contributors, and many others.195
An excess benefit transaction occurs when the total value of all consideration and benefits an organization provides to a disqualified person exceeds the total value of all consideration and benefits the individual provides to the organization. The excess benefit amount is the value of what the organization provides minus the value of what it receives.196 The disqualified person must pay a 25 percent excise tax on this amount.197
In addition, the disqualified person must undo the excess benefit as much as possible by making payments to the
organization equal to the excess benefit plus interest.198 If the person fails to make these payments within a specified timeframe, they will be subject to a 200 percent tax on the excess benefit. Any other managers in the organization who willfully and knowingly participate in an excess benefit transaction must pay a tax equal to 10 percent of the excess benefit.199
Deductibility of Contributions
Contributions to most 501(c)(4) organizations are generally not deductible as charitable contributions.200 There are, how-ever, some exceptions to this rule. Donations to volunteer fire companies and war veteran organizations that are classified as 501(c)(4) may be deductible as charitable contributions, as long as they are not used for lobbying or political activity.201
Fire companies may wish to be classified as 501(c)(4) if they engage in activities that do not serve a qualifying 501(c)(3) pur-pose, such as providing recreational facilities for members.202
Contributions may also be deducted as trade or business expenses, “if ordinary and necessary in the conduct of the taxpayer’s business.”203 Any contributions used for political or lobbying purposes are not deductible.204
Analysis
The “catch-all” nature of Section 501(c)(4) has allowed it to be used by a very broad range of organizations. The hobby clubs and other organizations oriented toward enjoyment and entertainment would clearly be more appropriately categorized as Section 501(c)(7) social and recreational clubs, discussed sub-
Prairie Meadows Race Track and Casino210

DRAFT
272 | Tax Decoder
The International Brotherhood of Teamsters headquarters in Washington, DC.211 The Red Lodge Rodeo Association in Montana is a 501(c)(5) agricultural organization.227
501(C)(5) Labor Organizations
History and General Background
Labor organizations are considered tax-exempt entities. This exemption was first created by the Payne–Aldrich Tariff Act of 1909, the bill that instituted the first lasting corporate income tax.212 A labor organization is “an association of work-ers who have combined to protect or promote their interests by bargaining collectively with their employers to secure bet-
ter working conditions, wages, and similar benefits,” including “strike, lockout, death, sickness, accident, and other benefits.”213
About 49,000 organizations were registered under 501(c)(5) at the end of FY 2013.214 Some of the largest organizations under 501(c)(5) include AFL-CIO,215 the National Association of Letter Carriers, United Steelworkers, Teamsters, American Federation of Teachers, the Civil Service Employees Association, and the National Football League Players Association.216
sequently. Section 501(c)(7) clubs have a number of restrictions not faced by section 501(c)(4) groups. It is understandable that most organizations would prefer section 501(c)(4). However, this section is intended for organizations that promote the welfare of their communities,205 not for entertainment and hobby clubs.
A look at the Forms 990 of 501(c)(4)s shows the extent to which some groups strain credulity to meet this standard. One Porsche club claims its mission is to “promote high standards of road safety.”206 A shooting club tersely states that its purpose is to “promote social welfare and public safety with firearms.”207
The Alabama Deep Sea Fishing Rodeo is less inventive: the or-ganization claims it “promotes the sport of fishing.”208 Any tax-paying business involved in automotive recreation, shooting sports, or fishing could claim the same purposes, of course.
These hobby clubs are generally small, and most have little, if any, net income, so it is unsurprising that the IRS has not scrutinized them extensively. Not all are small, however. The Prairie Meadows Race Track & Casino is a $2 billion a year operation that describes its social welfare purpose as “provid-ing a source of recreation for the community, and providing a generally positive economic impact on central Iowa.”209 This is certainly, however, a claim that would also be made by most for-profit casinos. While Prairie Meadows is an outlier at this
time, it illustrates the potential for 501(c)(4) to become a hav-en for major entertainment and recreation organizations that wish to avoid taxation under ordinary corporate status.
Recommendations
The Section 501(c)(4) statute and regulations should be revised to limit these groups to those working to achieve specific social improvements or reforms, such as relief of poverty or educational improvements. Current regulations already exclude organizations focused on entertainment or recreation for members.
The updated policy should exclude all organizations fo-cused on entertainment and recreation activities, regardless of the participants. Such activities could be permissible when they help contribute to a specific social outcome, such as pro-moting physical fitness or providing a safe environment for youth. Organizations that exist primarily to provide these ac-tivities for their own sake, however, should be excluded. The organization should be able to clearly articulate the social ob-jectives it is seeking to achieve, and most of the organization’s activities should contribute to that objective.

272 | Tax Decoder Tax-Exempt Organizations | 273
Requirements
Labor organizations must “have as their objects the betterment of the conditions” of workers, “the improvement of the grade of their products, and the development of a higher degree of efficiency in their respective occupations.”217
This definition comes from regulation, not statute. The text of Section 501(c)(5) provides virtually no specific guidance for labor groups. The section consists only of the following: “(5) Labor, agricultural, or horticultural organizations.”218
According to IRS guidance, “labor organizations” include more than labor unions. The term “embraces labor unions, councils, and committees.”219
The membership of the organization should be mostly employees, but can also include some independent contrac-tors. An organization composed mostly of entrepreneurs or independent workers would not qualify, however.220 Al-though labor organizations may provide many benefits to members, the net earnings of the organization may not in-ure to the benefit of any member.221 However, the leaders of 501(c)(5)s are not subject to the same taxes on transactions involving “excess benefits” that apply to the leadership of 501(c)(3)s and 501(c)(4)s.222
Much of the detailed guidance regarding the types of organizations that qualify as labor groups comes from rulings on specific cases by the IRS and courts. In general, the entities that were permitted to keep their 501(c)(5) status were approved because they served purposes consistent with the purposes of a labor organization. They bettered the conditions of members, improved the industry’s products, improved occupational efficiency, or helped other organizations do the same.
Organizations approved by the IRS and courts include a labor newspaper owned by several unions, a “union temple” that provides space for meetings and recreation for members of several unions, an association that provides lobbying, litigation, and public relations for several unions, organizations that provide seminars, conventions, courses, and training programs, and an organization to financially support workers during strikes and lockouts.223
501(c)(5) Agricultural and Horticultural Organizations
A minority of 501(c)(5) groups are agricultural and horticultural organizations.224 These organizations “are connected with raising livestock, forestry, cultivating land, raising and harvesting crops or aquatic resources, cultivating useful or ornamental plants, and similar
pursuits.” To qualify for tax-exempt status, the primary purpose of these organizations must be “to better the conditions of those engaged in agriculture or horticulture, develop more efficiency in agriculture or horticulture, or improve the products.”225, 226
The IRS lists several specific functions as qualifying activities of these organizations. These include exhibiting livestock and farm products, testing soil on a cost basis and providing the results to community members, guarding the breed purity of livestock, improving the productivity of fish farms, negotiating with food processors, and promoting agricultural and civic activities among rural residents.228
Courts have ruled that a rodeo show qualifies as an agricultural organization—but not a horse racing event.229 Only a few rodeo organizations have filed under 501(c)(5);230
most have opted to file under sections 501(c)(3), 501(c)(4), and 501(c)(7).231
501(c)(5) Political & Lobbying Activity
501(c)(5) organizations may legally engage in limited campaign activity,232 and may engage in unlimited lobbying so long as it is related to their exempt purpose.233
Deductibility of Contributions
According to the IRS:
Contributions to labor, agricultural, and horticultural organizations are not deductible as charitable contributions on the donor’s federal income tax return. However, such payments may be deductible as business expenses if they are ordinary and necessary in the conduct of the taxpayer’s trade or business.234
If a corporation makes contributions to a 501(c)(5) organization, and the organization uses the money for lobbying or political activity, the corporation may not deduct the contribution as a business expense.235

DRAFT
274 | Tax Decoder
501(C)(6) Trade Associations
History and General Background
About 67,000 organizations were registered under 501(c)(6) as of FY 2013.236 These organizations are associations whose members have a common business interest, such as the improvement of trade practices in a particular industry, industry-wide marketing, industry-specific lobbying, or the collection of data used by the industry.
Among the largest are risk-pooling associations for insurance companies, regulatory organizations for the financial industry, the PGA Tour and the NFL, the American Medical Association, associations for investment and accounting professionals, the National Association of Realtors, and the U.S. Chamber of Commerce.237
The tax exemption for trade associations was created by the Tariff Act of 1913, and amended in 1928 to allow real estate boards to qualify. Professional football leagues were added by a 1966 law that also protected football leagues from an anti-trust challenge.238, 239
Requirements
Section 501(c)(6) lists a number of organizations eligible for tax-exempt status, including business leagues, chambers of commerce, real-estate boards, boards of trade, or professional football leagues,240 not organized for profit and no part of the net earnings of which inures to the benefit of any private shareholder or individual.241
IRS regulations require a 501(c)(6) organization to “promote such common interest and not to engage in a regular business of a kind ordinarily carried on for profit.”242
The organization “must be primarily engaged in activities or functions that are the basis for its exemption.”243
The IRS lists the following as examples of common business interests:
• higher business standards, better business methods, uniformity;
• education of the public on the use of credit; • compilation of statistics; • operation of a trade publication; • industry-wide marketing;244
• seeking to influence legislation relevant to members’ common business interest; and
• encouraging conventions in the members’ city.245
Ordinary Business Activity Prohibited
Several restrictions prevent ordinary businesses from registering under 501(c)(6). In general, the activities of a 501(c)(6) “should be directed to the improvement of business conditions of one or more lines of business as distinguished from the
performance of particular services for individual persons.”246 The members of a 501(c)(6) organizations must have a com-
mon business interest.247 An association of hobby clubs would not qualify,248 nor would a group of businessmen who meet for lunch or cocktails without any specific plans to discuss improv-ing their industry.249 However, an association of students study-ing for a degree in a particular profession would qualify.250
The organization should be primarily supported by two sources of funding — membership dues and “income from ac-tivities substantially related to its exempt purpose.”251 Dues do not need to be the primary source of income, but “membership support, both in the form of dues and involvement in the orga-nization’s activities, must be at a meaningful level.”252 An exam-ple of a “substantially related” income source would be a sports league’s sale of broadcasting rights for its sporting events.253, 254
There are some specific requirements for two of the organi-zation types mentioned in the statute: boards of trade and real estate boards. Boards of trade under 501(c)(6) should be “formed to regulate the sale of a specified agricultural commodity to as-sure equal treatment of producers, warehouse workers, and buy-ers.” A real estate board should consist of “members interested in improving the business conditions in the real estate field.”255
Some of the impermissible activities discussed above, such as performing services for particular companies or people, may be acceptable as minor activities of the organization, as long as the promotion of a common business interest remains the organization’s primary activity.256 However, any trade or business not substantially related to the organization’s exempt purpose is subject to the unrelated business income tax (UBIT).257
Lobbying & Political Activity
As with 501(c)(4) and 501(c)(5) organizations, there are no lobbying limits for trade organizations.258 Specifically, they may “work for the enactment of laws to advance common business interests.” However, donors cannot deduct the part of dues used for influencing legislation, elections, or certain executive branch officials. If total annual lobbying expenditures are $2,000 or less, however, the deduction will not be denied. It will also not be denied for expenditures related to communicating with a local government, or to sharing news on proposed legislation with membership that may affect members’ line of business.259 Trade associations may also legally engage in limited campaign activity.260
Deductibility of Contributions
Contributions to 501(c)(6) organizations are not deductible as a charitable expense, however they may, in some cases, be deductible as trade or business expenses.261

274 | Tax Decoder Tax-Exempt Organizations | 275
501(C)(7) Social and Recreational Clubs
History and General Background
The precursor of Section 501(c)(7) was added to the tax code by the Revenue Act of 1916, one of the earliest laws dealing with the federal income tax.263 The central purpose of such clubs may be to provide members with benefits such as access to “club houses, golf courses, and swimming pools.”264 The IRS gives the following examples of typical 501(c)(7) organizations:
• College alumni associations that are independent of the college;
• Fraternities or sororities;• Country clubs, hunting, or sports clubs; and• Dinner clubs, hobby clubs, garden clubs, or variety
clubs.265
About 55,000 organizations were registered under 501(c)(7) in FY 2013.266 Of the 15,000 501(c)(7) organizations with Forms 990 available online, 1,900 reported revenues of $1 million or more.267
Section 501(c)(7) clubs must be used solely for “pleasure, recreation, and other nonprofitable purposes,” and may only be supported only by membership fees and dues.268 One such organization is the Olympic Club in San Francisco, California which earned $41 million in revenue in 2011 as a tax-exempt 501(c)(7) organization.269 Another is the National Republican Club of Capitol Hill, which brought in about $7 million in revenue in 2012 as a tax-exempt 501(c)(7).270
Business activities and non-member income
Social clubs may not substantially engage in a business activity, such as “making its social and recreational facilities
available to the general public”271 or selling products that do not further its exempt purpose. A social club may, however, derive a minimal amount of income from commercial activities with its members and with the general public (less than $2,500 or less than 5 percent of gross receipts) without losing its tax exemption.272
The five percent limit applies only to services that are unrelated to the social club’s recreational purpose. A social club may derive up to 15 percent of its income from the public if this income comes from the “social and recreational activities upon which the club’s exemption is based.”273 A 501(c)(7) dance hall, for example, could derive up to 5 percent of its income from renting the hall to the members and the public for business conventions, or up to 15 percent of its income by selling dance tickets to the public.274
Finally, the club may derive no more than 35 percent of its overall income from non-member sources of any kind, such as investment income.275 One example of income that could count toward the higher 35 percent limit would be the sale of timber on a hunting club’s land. While timber sales would normally be deemed a business activity subject to the 5 percent limit, if forest clearing was necessary to preserve the health of the forest’s wildlife, and therefore promoted the club’s recreational purpose of hunting, it would not be considered a business activity, but would still be deemed a non-member source of income subject to the 35 percent limit.276
A final exception applies. If the club gains “unusual amounts of income, such as from the sale of its clubhouse or similar facility,”277 that income does not count toward any of the percentage limits. Although the club will not lose its exemption if it stays within these rules, it must pay a tax on all of this income.278
Harvard Club of New York City, with $28 million in revenue in 2011, is tax-exempt under Section 501(c)(7).291
The 501(c)(7) University Club in New York City reported $29 million in revenue in 2011.292

DRAFT
276 | Tax Decoder
Desert Mountain Club in Scottsdale, AZ was the largest reporting 501(c)(7) club in 2011 with over $54 million in revenue. 262
Yale Club of New York City, with
about $31 million in revenue in 2011,
was among the highest-earning
tax-exempt 501(c)(7) organizations
in 2011. 290
The famed Jonathan Club in San Francisco, California is a 501(c)(7) tax-exempt organization with over $30 million in revenue in 2011. 279, 280
The 501(c)(7) Olympic Club in San Francisco, California
Taxation of 501(c)(7) Clubs
Congress intended for Section 501(c)(7) to have no net impact on taxes collected. Congress assumed if club members had paid for the recreational activities themselves, they would have paid no additional taxes, so they should be able to join together and mutually pay for recreational activities without additional taxes. “When such benefits are funded by members, exemption has been justified by Congress on the theory that the members will be in the same position as if they had paid for the benefits directly.”281
This theory, however, only holds true if the club derives its income solely from membership dues. For several decades,
clubs could also derive income from investments and other sources outside their membership. In 1969, Congress decided to extend the unrelated business income tax (UBIT) to any income from outside of the club’s membership. The only exception is for certain sales of club property. 501(c)(7) clubs became virtually the only tax-exempt organizations that were taxed on income from sources such as investments, rent, and interest.282
The member-derived income that is exempt from the UBIT includes income such as fees and dues. There are also some deductions for expenses directly connected to the production of the income.283 A special exception from the UBIT exists for the sale of club property and other assets.284
276 | Tax Decoder Tax-Exempt Organizations | 277
Analysis
Many large 501(c)(7)s operate essentially as businesses, with professional, full-time staff, commercial-grade facilities and equipment, and menus of products and services that are presented to members just as a business would present its offerings to ordinary customers. This raises questions regarding why these organizations are exempt from tax, while ordinary businesses are not. Numerous taxpaying businesses have limited memberships, ranging from Costco to Netflix.
Consider the following description of amenities from the website of the largest 501(c)(7) club in the country, the Desert Mountain Club in Scottsdale, Arizona:
Amenities in The Desert Mountain Club include six Championship Jack Nicklaus “Signature” Golf Courses that rank among the best in the world, and six distinctive, award-winning Clubhouses offer acclaimed golf shops and a variety of dining experiences. We have an extensive, Sonoran Fitness Center and Spa facility that rivals those of the finest resorts and health clubs with a full array of exercise and training options, and spa treatments. The Southwest’s finest tennis facilities, considered the “Wimbledon of the West,” feature three playing surfaces: grass, hard composition and clay courts.
Adding to the richness of the community, Desert Mountain has created a series of exclusive member events, ranging from special nights of food and wine to music and art. To assist members with everything
Scottsdale, Phoenix, and the Southwest Desert have to offer, our Member Services department is modeled after the finest concierge services found in five-star hotels throughout the world. Incredible natural beauty, culture, excitement, the best in shopping, nightlife, major league sports, concerts and plays—it’s all here.285
Despite the IRS’s warning against being “strenuously engaged in expanding club membership,”286 the club employs a Director of Membership Sales to help sell memberships, which cost between $420 and $1,260 a month as of the beginning of 2014.287 It is unsurprising the IRS has not taken action on this issue yet—it is unclear how the agency would determine whether the membership director is “strenuously” engaged in her job.
Desert Mountain is clearly more than a group of social ac-quaintances pooling their resources for recreational enjoyment. The club operates with the same level of professionalism and quality as the most luxurious resorts, even boasting that its golf courses and amenities rivals the best in the industry.
The only significant difference between Desert Mountain and taxpaying businesses is that the club is not organized for profit. “Nonprofit” organizations are not necessarily profit-free, however. The profits simply cannot be provided to a private individual or shareholder.288 These profits (sometimes called “net income” to avoid confusion) tend to be small relative to ordinary businesses because the organization is not structured to maximize profit. The net income of many nonprofits, however, is substantial. Desert Mountain’s gross revenue in 2011 was $54 million, and its net income was $1.7 million.289 If the organization became a taxable corporation, the resulting revenue would be significant.
Tax-Exempt Benefit Organizations Numerous different types of nonprofit organizations are permitted to provide their members with health insurance, life
insurance, disability insurance, unemployment benefits, annuities, and broad variety of other financial products commonly available from for-profit companies.
For some of these organizations, providing benefits is their primary purpose. These include 501(c)(8) fraternal beneficiary societies, 501(c)(9) employee beneficiary associations, 501(c)(12) benevolent life insurance associations, 501(c)(15) mutual insurance companies, and a number of obscure categories with very small numbers of registered organizations.
For several other organization types, providing benefits may be one of several activities they engage in. These include 501(c)(5) labor organizations and 501(c)(19) veterans’ organizations, which are discussed in other sections.
501(c)(8) Fraternal Beneficiary Societies
501(c)(8) organizations are societies such as the Moose Lodge, Knights of Columbus, and Masons that provide benefits to their members, such as life, health, or accident insurance. Fraternal societies are organized in a “lodge system,” with a parent organization and local chapters, and have a representative form of government.293 Over 48,000 organizations were registered under Section 501(c)(8) in FY 2013.294
Members of a 501(c)(8) must have a common fraternal purpose, or “common tie.” This means the members “have adopted the same, or a very similar calling, avocation, or profession,” or are “working in union to accomplish some worthy object.” This worthy object could be “promoting the social, moral, and intellectual welfare” of members and their families. A common tie goes beyond mere membership, or statements of a common tie in the organizations charter. Members must in fact engage substantially in specific fraternal

DRAFT
278 | Tax Decoder
activities,295 such as social activities, meetings and rituals, or civic, benevolent, and charitable functions. An organization does not qualify if its “fraternal features are so insubstantial as to make it indistinguishable from an ordinary insurance company.”296 By the same token, social activities alone without a fraternal “common tie” are not sufficient. Both a fraternal purpose and fraternal activities must exist.297
Most of the members of the organization must be eligible for benefits, and the benefits must be funded by contributions or dues paid by the members. The benefits must be limited to members and their dependents.298
What counts as a “Common Tie”? The case of Thrivent Financial for Lutherans
The concept of a “common tie” can be expanded to very large groups. The largest 501(c)(8) organization by far is Thrivent Financial for Lutherans, which includes 1,309 chapters and nearly 2.4 million members. The organization has even made it to the Fortune 500 list—it ranked 335 in 2014.299
Thrivent offers a broad range of insurance and financial products and services, including life insurance, long-term care insurance, disability insurance, and Medicare supplement insurance, as well as annuities, mutual funds and investments, individual retirement accounts, trust accounts, church construction financing, employer-sponsored retirement plans, business insurance, and personal financial representatives.300 In 2011, the organization collected over $8 billion in revenue, held $62 billion in assets, and had 13 executives with salaries over $1 million. The organization’s net income after expenses was over $424 million.301
Starting in 2013, members of Thrivent no longer necessarily needed to be Lutheran.302 According to
Thrivent’s website, “The common bond of Thrivent Financial for Lutherans is Christianity.”303 Individuals eligible for membership include Christians seeking to live out their faith, spouses of Christians seeking to live out their faith, youth being raised in the Christian faith, or anyone who is a supporter of the “Thrivent Way.”304
In its explanation of the “Thrivent Way,” the website states, “Our purpose is to serve our members and society by guiding both to be wise with money and live generously.”305 As discussed above, the members of 501(c)(8)s must participate in specific fraternal activities for the organization to qualify. It appears Thrivent relies significantly on the community service activities of its members to fulfill this requirement. Thrivent’s website notes that it tracks volunteer hours in order to demonstrate its community involvement to federal regulators, among other groups.306
Community service is not an absolute requirement for 501(c)(8) status—other activities can serve to substantiate the “common tie,” such as meetings and ceremonies. It is, however, how Thrivent appears to substantiate their status. The Thrivent website reports that in 2012, Thrivent and its members raised or donated $165 million and provided 8.7 million hours of volunteer service.307 This is equivalent to about 2 percent of the organization’s revenue and an average of about 3.5 volunteer hours per member for the year.
While these contributions are certainly nothing to be dismissed, for comparison, the 33,000 associates308 of the for-profit, taxpaying car insurance company Nationwide contributed about 115,000 volunteer hours in 2012, about the same average of 3.5 hours per employee for the year.309 Further,
Thrivent Financial members are actively engaged in community service—however, in terms of average service hours per year, they are comparable to employees at some for-profit, taxpaying companies.314

278 | Tax Decoder Tax-Exempt Organizations | 279
in FY 2013, the for-profit, taxpaying firm Deloitte, LLC, which employed 61,000 staff,310 contributed around 800,000 volunteer hours,311 or about 13 hours per employee for the year.
If a benefit organization’s fraternal features “are so insubstantial as to make it indistinguishable from an ordinary life insurance company,” it does not qualify for 501(c)(8) status, according to IRS regulations.312 One court dismissed a rail employees benefit association’s appeal for 501(c)(8) status, stating, “There is no fraternal object which moves them to seek membership in the Association, but rather the motive is mercenary.”313
Strictly in terms of average service hours, Thrivent Financial is comparable to companies like Nationwide and lags behind firms like Deloitte. Does the typical Thrivent member join for purely financial reasons? If many of its members have little or no involvement in the service activities of the organization, and participate in no other fraternal activities, this could call into question the fraternal nature of the organization.
For further comparison, the 1.8 million members of Knights of Columbus, the second-largest 501(c)(8), contributed $167 million and 70 million volunteer hours in 2012, or an average of 39 hours per member for the year.315
According to the organization’s 2011 Form 990, the primary Knights of Columbus organization employed only one executive earning more than $1 million.316 The organization offers members a more limited number of benefits, including annuities, life insurance, long term care insurance, and disability insurance. The website notes, “Since our founding in 1882, the primary mission of the Knights of Columbus has been to protect families from the financial ruin caused by the death of the breadwinner.”317 Thrivent’s average of 3.5 service hours a year per member is significantly below the Knights of Columbus average of 39 hours.
The reason for this scrutiny of Thrivent, of course, does not solely concern Thrivent. There are over 48,000 organizations under 501(c)(8). Thrivent is simply the largest among them. How many more of these organizations raise questions similar to those raised by Thrivent?
Some other large beneficiary societies include the Modern Woodmen of America, Gleaner Life Insurance Society, Catholic Financial Life, and GBU Financial Life.318 These organizations offer products and benefits such as life insurances, annuities, retirement savings, support for orphans, investments, college savings, college scholarships, financial assistance for the illness or death of an infant, disaster aid, and groups discount programs such as national parks memberships. The “common ties” cited by these organizations generally include community service and mutual financial security. But whether or not these common ties can truly distinguish them from for-profit organization is important for determining how many of the 48,000 organizations under 501(c)(8) are truly eligible for the status.
Similar Organizations: 501(c)(10) Domestic Fraternal Societies
501(c)(10) domestic fraternal societies have a similar structure to 501(c)(8) groups, but a different purpose. Most of the largest 501(c)(10) organizations are branches of the Masons, including organizations of the Free and Accepted Masons, Knights Templar, and Shriners.319 Also included under this subsection are organizations such as the Fraternal Order of Eagles, the Knights of Pythias, the Order of Ahepa, and Greek fraternities320 such as Phi Beta Sigma.321 About 16,000 organizations were registered under Section 501(c)(10) in FY 2013.322
The new category was created in 1969 to ensure fraternal societies qualified for tax-exempt status even if they paid no benefits to their members.323 Like 501(c)(8)s, they must be a fraternal organization that operates under the lodge system. Domestic fraternal societies do not provide benefits like 501(c)(8)s. They may, however, arrange with insurance companies to provide optional insurance to their members. They must be organized in the United States, and all of their earnings must be devoted to either fraternal purposes or to the same social welfare purposes as 501(c)(3)s.324
501(c)(10) organizations may engage in recreational and social activities similar to 501(c)(7) organizations. However, the 501(c)(10) designation is more advantageous because it has no limitations on the amounts of income that may be derived from non-member sources, and does not face the tighter rules on unrelated business taxable income.325
Deductibility of Contributions
Donations by an individual to either a 501(c)(8) or 501(c)(10) are deductible as charitable contributions only if used for the same purposes as 501(c)(3) organizations.326 Contributions for fraternal or social purposes or to pay for benefits would not be deductible.327
501(c)(9) Voluntary Employees’ Beneficiary Associations
501(c)(9) Voluntary Employees’ Beneficiary Associations (VEBAs) are associations of employees, generally in the same company or union, that pay life, health, and other benefits to members. The associations fund fringe benefits such as life insurance, medical, disability, accident, or other benefits for employees, retirees, and their dependents or beneficiaries. In addition to these more traditional benefits, other permissible benefits include “paying vacation benefits, providing vacation facilities, reimbursing vacation expenses, and subsidizing recreational activities such as athletic leagues.”328
As of FY 2013, about 6,900 organizations are exempt under Section 501(c)(9).329 Among the largest, with over $1 billion in revenue, are associations of employees of large corporations or

DRAFT
280 | Tax Decoder
industries, including AT&T, Wal-Mart, Bank of America, Wells Fargo, J.P. Morgan Chase, Boeing, General Electric, Northrop Grumman, and Kroger. Also among the largest are associations for employees of the automobile industry and rail industry, Teamsters members, public school employees, and federal employees.330
VEBAs are most commonly formed as a trust, and because of their tax-exempt status, “contributions to and disbursements from a VEBA account are made on a tax-free basis.”331 This allows income earned by the VEBA (interest) to be exempt from federal income taxes, and employer contributions to a VEBA are also tax deductible within specific limits.332 Most VEBA benefits are also excluded from taxable income when distributed to the employees, retirees, or other beneficiaries.333
For example, a corporation will set up a VEBA with the approval of their union workers. A board of trustees is elected, half from the corporation and half from the union. The corporation will collectively bargain with the trustees on how much money the corporation will put in the VEBA and for how long. Once decided, the corporation can then contribute monies to the VEBA tax-free and also collect a tax deduction for those contributions. From there, the trustees can invest the money in the VEBA into stocks, bonds, and mutual funds. The interest earned from these gains is tax-free.334
Since the VEBA can invest in the stock market, the money is not guaranteed for the employees. The money can dry up, be lost in the stock market, or can be abolished by the trustees and set up with a new plan in its place. There are no stock input rules for employers, making beneficiaries further susceptible to an Enron-like loss of funds if the employer stock were to go under. This also allows employers to contribute stock to its VEBA and
inflate their stock price, tricking taxpayers and beneficiaries. While VEBAs can ensure at least some retirement benefits
for employees of companies that go bankrupt, VEBA funding can come “in part from company stock, rather than just cash payments, making them vulnerable to the market’s volatility.”335 Therefore, retirement benefits held by VEBAs may not be more secure than defined benefit plans promised by employers. Further, “VEBAs are usually underfunded,”336 and cannot pay out the promised fringe benefits.
VEBAs must meet several organizational requirements and must have their tax-exempt status approved by the IRS. Members must have an employment-related common bond, and, like other benefit plans, VEBAs are prohibited from providing benefits that discriminate in favor of highly-paid employees. However, collectively bargained agreements were given an exception from the nondiscrimination requirements.337
VEBAs are required to follow a law Congress enacted called the 419 Cap A Rule. Under the rule, every year the VEBA must determine how much money its beneficiaries need in the upcoming year and then supply the VEBA with that estimated amount. However, unions have a special exemption from this rule if the VEBA is collectively bargained. The union’s employer has no limit on how much they can dump into the VEBA, making the VEBA a tax shelter for employers with unions. For example, if a corporation with a collectively bargained VEBA wanted to contribute any amount to its VEBA at any time, it could and would not have to pay taxes on that money contributed.
Union-run VEBAs have gained popularity since 1992, when the Financial Accounting Standards Board required companies to list the cost of future retiree health benefits as an expense on their business income statement. VEBAs
One company exploited a VEBA to finance the purchase of a chalet-style condominium for skiers in Vermont.347

280 | Tax Decoder Tax-Exempt Organizations | 281
allow companies to discard these unfunded liabilities from their balance sheets and shift the burden to the VEBA. In addition, the company can “shed any future legal liability for paying promised benefits to retirees.”338
In 2007, automakers Ford, General Motors, and Chrysler committed to pay $54 billion to the United Auto Worker’s VEBA, the UAW Retiree Medical Benefits Trust,339 in exchange for ending their obligation to fund health care benefits for union retirees. This tax-free entity has become one of the nation’s largest private healthcare providers.340
In addition to providing unique benefits for unions, VEBAs can be very beneficial to for-profit organizations that want to reduce tax liabilities341 as well as “provide millions of dollars in estate tax savings because the survivor benefits can be income-and-estate-tax-free, with no gift taxes.”342 Attorney John Koresko recalled a case in which a physician “contributed over $1.1 million to his VEBA to fund over $4.5 million in life insurance, disability insurance, and a tax- deductible education fund for his three teenage children.”343
VEBAs have also been used to fund “planes, boats, condos, and other unusual items” while yielding tax deductions for contributions.344 In the mid-1980s, the abuse of VEBAs by the wealthy came to a halt. With IRS encouragement, in 1984, Congress amended the VEBA deduction to prohibit the use of VEBAs as a tax shelter for these items.345
The entities remain vulnerable to misuse, however. Within the past decade, Benefit Concepts, Inc. of New York, a $2 million-a-year business consulting firm, decided to buy a vacation home. The company purchased a $30,000 condominium in the Green Mountains of Vermont using VEBA funds.346
Cost
Forgone revenue due to VEBAs was $3.3 billion in 2012 and is expected to increase to $4.3 billion in 2015.348 The Wyden-Coats Bipartisan Tax Fairness & Simplification Act of 2011 called for repealing the exclusion of income earned by VEBAs.349
Recommendation The exclusion for interest earned from VEBAs, as well
as the deduction for contributions to VEBAs, are used by large enterprises as a tax shelter. These tax provisions should be eliminated.
501(c)(15) Mutual Insurance Companies
This subsection exempts small insurance companies from taxation.350 Typically, these companies provide members with property damage coverage.351 Life insurance companies, as defined in the tax code, may not claim this status. About
900 organizations were registered under Section 501(c)(15) in FY 2013.352 They include names such as Knox County Farmers Mutual Insurance Company, PCM Reinsurance, Ltd., and German Mutual Insurance Association.353
The organizations are much smaller than typical insurance companies due to the size limitations specified in Section 501(c)(15).354 The annual gross receipts of the organization may not exceed $600,000, and more than half of the receipts must come from premiums. If the organization is a mutual insurance company, receipts may not exceed $150,000, and more than 35 percent of the receipts must come from premiums.355
According to an examination document regarding Mutual Fire Insurance Company of French Township, a mid-sized 501(c)(15), in 2008 the company had 672 members in 18 counties throughout Indiana, and an approximately $1 million bank account. The company was first organized in 1882 and consists of members who “promise to assist one another in losses resulting from fire, lightning, or multiple perils and to furnish such insurance to members at cost according to specified conditions.”356
Very Small Categories of Tax-Exempt Benefit Organizations
Several sections of the tax code cover only a handful of registered organizations. Very few groups retain tax-free status under these specialized sections of the code. The numbers below were provided by the IRS.357 Most of these organizations provide benefits to their members, such as health insurance or retirement benefits. These include:
• 501(c)(11) Teachers’ associations for payment of retirement benefits358 – 15 groups
• 501(c)(16) Corporations Organizations to Finance Crop Operations359 – 19 groups
• 501(c)(18) Employee Funded Pension Trust360 – 5 groups
• 501(c)(21) Black Lung Benefit Trusts361 – 28 groups • 501(c)(24) Multiemployer Pension Plan Trusts362 – 1
group (Spring Prairie Hutterian Brethren Inc.)363
• 501(c)(26) State-Sponsored Organization Providing Health Coverage for High-Risk Individuals364 – 12 groups
• 501(c)(27) State-Sponsored Workers’ Compensation Reinsurance Organization365 – 9 groups
• 501(c)(28) The National Railroad Retirement Investment Trust366 – 1 group
• 501(c)(29) Qualified health insurance issuers (Consumer Operated and Oriented Plans under the Affordable Care Act)367 - 16 groups
• 521(a) Farmers’ Cooperative Associations368 – 1 group

DRAFT
282 | Tax Decoder
501(C)(12) Local Benevolent Life Insurance Associations, Mutual Ditch or Irrigation Companies,
Telephone Companies, and Like Organizations
History and General Background
Most section 501(c)(12) organizations are nonprofit utility companies. The tax exemption for these organizations was added by the Revenue Act of 1916.372 Over 5,400 organizations were registered under 501(c)(12) in FY 2013.373 Federal statute specifies three types of organization under this section. These include benevolent life insurance associations, mutual ditch or irrigation companies and like organizations, and mutual cooperative telephone or electric companies and like organizations.
A very small minority of 501(c)(12)s fall under the first category, including burial associations and life insurance companies.374 The vast majority of 501(c)(12)s, however, are utility companies. The most common utilities are water and irrigation cooperatives under the second category, like the Del-Co Water Company in Delaware, OH and the North Alamo Water Supply Corporation in Edinburg, TX.375 The largest utilities are electric cooperatives under the third category, like the North Carolina Electric Membership Corporation in Raleigh, NC and the Central Electric Power Cooperative in Columbia, SC, both of which had more than $1 billion in revenue in 2011.376 Also under the third category are a relatively small number of telephone, wireless, television, and internet companies.377
In all three organization types, 85 percent of income must come from members, and the income must be used solely to cover losses and expenses. Several types of income may be excluded from the amounts counted toward the 85 percent, however. Any excess income must be returned to members or kept to cover future losses and expenses.378
Analysis and Recommendations
Very few organizations use the 501(c)(12) status to provide life insurance. However, these organizations, like 501(c)(8) fraternal beneficiary societies, are providing a commercial product and compete with for-profit companies. The tax exemption should be eliminated for these companies along with 501(c)(8) companies. Further discussion of organizations that provide products and services similar to those of taxpaying businesses is discussed in the recommendations at the end of this chapter.
The remaining two parts of the statute should be re-written to specifically list the qualifying organizations, rather than relying on the ambiguous “like organizations” term. The list should include only traditional utilities such as electricity, water, sewer, natural gas, irrigation, telephone, and cellular companies.
Satellite, cable TV, and internet services should not be included. These companies were not considered by Congress when the statute was first enacted. Fortunately, very few of these companies currently use 501(c)(12) status.379 They should be precluded from using the status before the statute becomes widely used for this unintended purpose.
A specific list should be provided rather than relying on the term “like organizations.” Limiting the statute would help prevent misuses of the section in the future, and would prevent future technologies not anticipated by Congress from taking advantage of the statute.
401(a) Retirement and Pension Plans
Under Section 501(a), trusts described in Section 401(a) are exempt from taxation. These trusts are created by an employer as part of a retirement plan exclusively for employees. The plan must be a “stock bonus, pension, or profit-sharing plan.”369
Tax-Exempt Benefit Organizations: Analysis and Recommendation
Nonprofit organizations that provide commercial-type insurance have frequently been cited as questionable uses of tax-exempt status. A 1993 Treasury report noted that these organizations are often indistinguishable from tax-paying corporations,370 and a 2005 JCT tax reform option called for eliminating the tax exemption for organizations that provide commercial-type insurance.371 This report agrees with this recommendation.

282 | Tax Decoder Tax-Exempt Organizations | 283
501(C)(13) Cemetery Companies
History and General Background
At least half of burials in the US take place at tax-exempt nonprofit cemeteries.381 A 2000 AARP survey found that 54 percent of burial purchasers reported they had bought from nonprofit cemeteries, while about a third reported buying from for-profit cemeteries.382
A 501(c)(13) cemetery company must be “chartered solely for the purpose of the disposal of human bodies by burial or cremation.”383 These organizations have been eligible for tax-exempt status since 1913,384 and about 9,500 such companies were registered with the IRS in FY 2013.385 Among the largest are the $293 million a year Cedar Grove Cemetery Association in New York, the $139 million Mount Elliott Cemetery in Minnesota, and the $130 million Ferncliff Cemetery Association in New York.386
Nonprofit cemeteries are often closely tied to for-profit companies. Since the exemption was first created in 1913, many American cemeteries have transitioned from noncommercial organizations run by religious or municipal entities to commercial business.387 A 2000 report on the “deathcare” business stated that, “The industry is consolidating. Large
chains are buying and managing locally owned funeral homes and cemeteries. Many nonprofit cemeteries are now owned by, managed by, or otherwise affiliated with for-profit chains.”388 The study further notes that certain chains have created nonprofit corporations to serve as the “titular owners” of cemeteries. In the state of Oklahoma, for example, all cemeteries are required to be nonprofit,389 but according to comments submitted by a funeral association to the Federal Trade Commission in 1999, at least 25 nonprofit cemeteries in Oklahoma were owned by a for-profit chain.390
Nonprofit Cemeteries Controlled by For-profit Companies
Section 501(c)(13) explicitly prohibits any part of the net earnings of a nonprofit cemetery company from inuring to a private individual.391 IRS regulations, however, permit “reasonable fees for the services of a manager.”392 For example, a not-for-profit cemetery in New Jersey, Beth Israel Memorial Park, paid $8.5 million over six years in management fees to the large for-profit “deathcare”
The Cedar Grove Cemetery Association in Flushing, New York is the highest-revenue 501(c)(13) cemetery company with $293 million in income in 2011.380

DRAFT
284 | Tax Decoder
company StoneMor393 Partners L.P.394 Beth Israel Memorial Park’s board is directly under the control of StoneMor as the board members are salaried employees of the company.395
At least one state, New York, does not permit for-profit companies to control nonprofit cemeteries, but there is nothing in New Jersey law or regulation prohibiting it. According to the news report, “The cemetery executive who first set up the arrangement at Beth Israel is a former chair of the state board that regulates cemeteries.”
StoneMor’s SEC filing explains that of the 21 nonprofit cemeteries, 16 decided independently to contract with Stonemor. The remaining five, however, all of which are in New Jersey, are under the control of Stonemor due to the company’s ownership of their debt: “We have voting rights, along with member owners of burial spaces, in the five New Jersey nonprofit cemeteries as a result of owning all of their outstanding certificates of indebtedness or interest.”396
Some of StoneMor’s practices may be illegal under IRS rules:
The Beth Israel board’s practice of paying fees that resemble profits to a company that in turn pays salaries to members of its board could conflict with tax rules barring not-for-profit insiders from unreasonably profiting from their position, according to William Josephson, who ran the charities bureau in the office of the New York State Attorney General from 1999 to 2004.397
Although the management fees could potentially breach IRS inurement rules, the IRS does not appear to have directly addressed this issue.
Requirements
A 501(c)(13) cemetery company “must be owned and operated exclusively for the benefit of its lot owners who hold lots for bona fide burial purposes and not for purposes of resale.” However, a company may also conduct charitable activities such as burial of paupers. Companies are permitted to limit their membership to a particular class of individuals, such as members of a family.
The companies may not charter to engage in any business not necessarily incident to the purpose of burial or cremation. Operation of a mortuary is specifically prohibited. Selling markers, flowers, and similar goods for use within the cemetery is permitted if the earnings for these sales are used to care for the cemetery.
Income can be used for only the following three purposes: 1. To pay operation, maintenance, and improvement
expenses for the cemetery. 2. To buy cemetery property. 3. To create a fund that will provide a source of income
for the perpetual care of the cemetery. Reasonable fees may be paid to a manager. No part of
the net earnings may inure to a private individual, however. A cemetery company may not issue a bond or other financial instrument that pays interest based on the cemetery’s net earnings. Since 1978, cemetery companies may not issue stock, unless the stock pays no dividends.
In order to receive funds for the perpetual care of an individual lot, the cemetery must create a trust that is subject to federal income tax. Any funds received to care for the individual lot are taxable.398
An organization that manages and invests funds on behalf of a cemetery may also qualify as a 501(c)(13) organization, if its income is used solely to care for the cemetery.399
Deductibility of Contributions
Donations to exempt 501(c)(13) cemetery companies, as well as associated perpetual care funds, are deductible as charitable contributions on the donor’s federal income tax return. Contributions for the care of a particular lot or crypt, however, are not deductible. Likewise, any payments made as part of the purchase price of a lot or crypt are not deductible.400 Although this policy appears to prevent charitable deductions for self-interested donations, it is important to note that 501(c)(13) status is permitted for cemeteries that serve very narrow groups, such as individual families.
In 1976, Congress created a special rule for perpetual care funds set up by for-profit cemetery corporations.401
Such funds are barred from tax-exempt status because they support for-profit cemeteries rather than nonprofit ones. However, Congress permitted these taxable perpetual care funds to claim a deduction for the expense of maintaining gravesites at for-profit cemeteries.402 This provision essentially treats expenditures to benefit for-profit corporations as if they were charitable contributions.
Recommendations
• Congress should direct the IRS to adopt regulations similar to those in effect in the state of New York to prevent for-profit companies from controlling nonprofit cemeteries.
• The 1976 deduction for trust contributions should be repealed. This deduction creates a special advantage for for-profit cemetery companies that is not enjoyed by other for-profit companies.
• The charitable deduction should not be permitted for contributions to very small cemeteries, such as cemeteries with less than 20 sites. This would prevent deductions for contributions that are essentially intended to benefit oneself, one’s close associates, or one’s immediate family members.

284 | Tax Decoder Tax-Exempt Organizations | 285
Veterans’ Organizations Under 501(C)(19) and Other Sections
Background and General History
Veteran’s organizations are usually organized under Section 501(c)(19) of the tax code.403 Nearly 32,000 organizations were registered under 501(c)(19) in FY 2013.404
Some of the top 501(c)(19)s include the Military Officers Association of America, the Veterans of Foreign Wars of the United States, the Ladies Auxiliary to the Veterans of Foreign Wars, American Legion, and the Armed Services Mutual Benefit Association.405
Today’s 501(c)(19) veterans’ organizations would have previously been organized under Sections 501(c)(4) and 501(c)(7) of the tax code. After the Tax Reform Act of 1969, however, 501(c)(4)s and 501(c)(7)s were required to pay the unrelated business income tax (UBIT) on activities such as insurance. Because veterans’ organizations frequently provide insurance benefits to their members, a separate section was created for them to ensure the UBIT would not apply to these activities.406
Requirements
A 501(c)(19) organization is a “post or organization of past or present members of the Armed Forces.”407 Most 501(c)(19) organizations are part of a “group exemption.” They are usually “posts” of a larger central organization that adopt the central organization’s rules and therefore may inherit its 501(c)(19) status.408
All 501(c)(19) organizations must be organized in the United States, and at least 75 percent of the members must be past or present members of the U.S. Armed Forces. Family members and cadets are also permitted to join; at least 97.5 percent of all members of the organization must be past or present members of the U.S. Armed Forces, cadets, or certain family members.409
The IRS states the organization must be organized for one or more of the following purposes:
1. “Promote in some way the common good and general welfare of the people of the community.” This could include sponsoring youth organizations or donating to charities.410
2. “To assist disabled and needy war veterans and members of the U.S. Armed Forces and their dependents and the widows and orphans of deceased veterans.
3. “To provide entertainment, care, and assistance to hospitalized veterans or members of the U.S.
Armed Forces. 4. “To carry on programs to perpetuate the memory
of deceased veterans and members of the Armed Forces and to comfort their survivors.
5. “To conduct programs for religious, charitable, scientific, literary, or educational purposes.
6. “To sponsor or participate in activities of a patriotic nature.
7. “To provide insurance benefits for its members or dependents of its members or both.
8. To provide social and recreational activities for its members.”411 This could include operating a bar, restaurant, dance, or gambling activity for members (but not the general public).412
501(c)(19) organizations may not have purposes of a substantial nature that are not included in this list.413 The IRS notes that the following activities are consistent with these purposes: reviewing proposed legislation that may affect veterans; testifying before a government body regarding such legislation; and informing members about the legislation.414
Auxiliary units
Posts that have a social facility will usually have a separately organized auxiliary.415 An auxiliary unit of a veterans’ organization may also qualify under 501(c)(19) if it is affiliated with a parent veterans’ organization and it meets certain membership criteria.
Trusts and foundations
501(c)(19) organizations may directly provide life, accident, health, and benefits to members, but today, they generally contract this function out to existing public insurance companies. Trusts and foundations are often created to administer these programs. A trust or foundation should use its income to fund 501(c)(19) organizations, or for charitable purposes similar to those of 501(c)(3) organizations.416
Deductibility of Contributions
Donations to 501(c)(19) organizations are only deductible if at least 90 percent of the organization’s membership consists of war veterans.

DRAFT
286 | Tax Decoder
SUPPORT ORGANIZATIONS FOR NONPROFIT ORGANIZATIONS
Several parts of Section 501 provide tax exemption for organizations that exist solely to support nonprofit organizations. These include organizations to hold title to property on behalf of nonprofits and various organizations to provide financial and administrative services to nonprofits.
501(c)(2) and 501(c)(25) Title Holding Corporations
History and General Background
Certain nonprofit organizations choose to create separate organizations to hold title to buildings and other property on their behalf. The purpose of these organizations is to allow the tax-exempt organization to “segregate its investments and property in separate corporations.” The purpose of this arrangement is to limit legal liability for the parent nonprofit. One law firm observes, “By forming the title-holding company and transferring the real property to it, as is commonly done by private entities, the tax-exempt organization can separate any potential liability related to the ownership of the real property from the assets and operation of the tax-exempt parent organization.”419 There are two types of title-holding corporations: corporations under the control of a single parent nonprofit, which are organized under 501(c)(2), and organizations under the control of multiple nonprofits, which are organized under 501(c)(25).420
The IRS lists several advantages to these organizations, including:
…limitation of liability from potential damage suits; enhancement of ability to borrow; limitations imposed in gifts and bequests to exempt organizations that effectively require such gifts to be kept in separate entities; clarity of title; accounting simplification; and limitations imposed by various state laws on organizations that would be recognized as exempt under the federal revenue laws.421
Title-holding organizations for nonprofits were first ex-empted from tax by the Revenue Act of 1916. It appears one reason Congress created the exemption was because it con-cluded the Treasury collected little or no revenue from these or-
ganizations.422 In 1977, the IRS ruled that 501(c)(2)s could only be controlled by a single parent. This prompted Congress to create 501(c)(25), which allows up to 35 nonprofit shareholders to pool resources and invest in real estate. The 35-shareholder limit was intended to ensure the group of owners was small enough that the organization was controlled by the owners, rather than an investment advisor.423 In FY 2013, about 4,700 single-parent 501(c)(2)s and 800 501(c)(25)s were registered with the IRS.424
Among the largest 501(c)(2) organizations425 are Beta Equities, Inc. in Connecticut, which collected $95 million in revenue in 2012 for the General Electric Pension Trust,426 and Sanctuary Park Realty Holding Company in New York City, which collected $36 million in income from real property,427
including the Sanctuary Park office complex in Alpharetta, Georgia.428 Sanctuary Park collects income on behalf of a tax-exempt pension plan.429 AT Industrial Owner Acquisition, LLC in New York City, with $64 million in 2012 income, is the largest 501(c)(25) organization and likewise collects income from real property. Although permitted as a 501(c)(25) to have more than one parent organization, it currently has only one.430
Requirements
A title-holding corporation must be organized exclusively for the purpose of holding title to property, collecting income from it, and turning over all income, less expenses, to a Section 501 tax-exempt organization.431 The corporation may not actively conduct any business other than the rental of real estate.432 If it receives any income from such a business, the income will be subject to the Unrelated Business Income Tax (UBIT), and if the income exceeds 10 percent of the organization’s gross receipts, the title-holding corporation will lose its tax exemption.433 Passively collecting income from instruments such as stocks and bonds is permissible, but not the active business of securities trading.434 The parent organization should have control or ownership over
Section 501(c)(23): Grandfathered Veterans’ Organizations
Only three organizations are known to qualify under Section 501(c)(23)—the Navy Mutual Aid Association, the Army & Air Force Mutual Aid Association, and the American Legion
Memorial Club. The organization must have been formed before 1880, more than 75 of the members must be present or past members of the Armed Forces, and the primary purpose must be to provide insurance and other benefits to veterans and their dependents.417 Although few in number, these three organizations have over $3 billion in assets.418

286 | Tax Decoder Tax-Exempt Organizations | 287
the title-holding corporation.435 While 501(c)(2)s may have only one parent organization, a 501(c)(25) may have up to 35 shareholders or beneficiaries.436
Other Charity Support Organizations Exempt Under Section 501
501(e) Cooperative Hospital Service Organizations
A 501(e) is a support organization for nonprofit hospitals. Only 9 are publicly registered as of FY 2013.437 They must perform at least one of the following functions in support of nonprofit purposes in at least two tax-exempt hospitals: data processing, purchasing, warehousing, billing and collection, food, clinical, industrial engineering, laboratory, printing, communications, record center, and personnel services.438, 439
501(f) Cooperative Service Organization of Operating Educational Organizations
This section was created in 1974 for Commonfund, which today is an investment firm for nonprofits and pensions. The IRS considered revoking Commonfund’s
tax-exempt status because it relied on payments from its member institutions. In response, Congress created Section 501(f) to clarify that cooperative investment firms qualify as charitable entities.440 Commonfund today manages over $25 billion for nearly 1,300 institutions.441
501(n) Charitable Risk Pools to pool certain insurance risks of sec. 501(c)(3) organizations
Only a single organization442 is exempt under this subsection at this time: the National Alliance of Nonprofits for Insurance, Inc. (ANI), which provides insurance to over 5,000 nonprofit 501(c)(3) organizations.443 The organization may provide insurance for any insurable risk other than medical malpractice risks.
Recommendations
These organizations exist to directly support 501(c)(3) organizations. Their nonprofit status should be changed only if the nonprofit status of the 501(c)(3)s they support is changed.
The Business Expense Deduction for Contributions TO Nonprofit Organizations
According to IRS guidance, “Dues or contributions to IRC 501(c)(4), (c)(5), and (c)(6) organizations may be deductible as business expenses under IRC 162.”444
Like all deductible business expenses, these dues must be “ordinary and necessary expenses” paid “in carrying on a trade or business.”445 According to IRS guidance, “An ordinary expense is one that is common and accepted in your industry. A necessary expense is one that is helpful and appropriate for your trade or business. An expense does not have to be indispensable to be considered necessary.”446
Any contributions used for the following purposes, however, are not deductible:
• Political campaign activity • Direct legislative lobbying at the federal
and state level. • Grass roots lobbying • Contact with federal officials
Contributions for lobbying at the local level are deduct-ible, however.447
If a “substantial part” of the organization’s activities are political campaign activities or lobbying, the taxpayer can only deduct the portion of the dues he can clearly establish
were not used for campaign or lobbying activities.448 Any 501(c)(4), 501(c)(5), or 501(c)(6) that files tax returns
must include on their returns the total amounts of the dues they received that were allocated to lobbying or political activities.449 501(c)(3)s are excepted because they are generally not permitted to spend on these activities. When collecting dues from businesses, the 501 organization must provide the business a reasonable estimate of the portion of their dues that will go to campaigning or lobbying.450 The business may not deduct this portion.451 If an organization can establish that substantially all of the contributions it receives will not be deducted as business expenses by the donors, it does not need to provide these estimates to its

DRAFT
288 | Tax Decoder
Specialized Tax-Exempt Organizations: Recommendations
Nonprofit Organizations Involved in Commercial Activities
In general, when tax-exempt organizations earn income by selling products and services that are commonly sold by for-profit businesses, they should pay a tax on that income. Under current law, this is already the case to a limited extent. The tax code imposes the “unrelated business income tax” (UBIT), equivalent to the corporate income tax, on a nonprofit’s income-earning activity when it meets the following criteria:454
1. It is a trade or business; that is, any activity carried on to earn income by selling goods or performing services.455
2. It is regularly carried on in a manner similar to comparable commercial activities of businesses.456
3. It is not substantially related to furthering the exempt purpose of the organization.457
If only the first two criteria existed, most of the business-style activity among nonprofits, such as the provision of insurance benefits, restaurants, and entertainment services, would be subject to the UBIT. However, most of this activity escapes the UBIT because of the third criteria—that is, the organizations’ business-like activity is related to the exempt purpose of their organization. Many different types of nonprofit organizations458 are permitted by statute or regulation to provide their members a variety of products and services tax-free, even though they are similar to the goods available from for-profit businesses. This is permitted because these services are considered central to the organization’s “exempt purpose.”
One class of tax-exempt organizations that does not enjoy this ability are 501(c)(6) business leagues. The regulations for 501(c)(6) business leagues provide that organizations whose purpose is to “engage in a regular business of a kind ordinarily carried on for profit” is not tax-exempt. Tax exemption is denied even if “the business is conducted on a cooperative basis or produces only sufficient income to be self-sustaining.”459A similar standard should apply throughout the nonprofit sector.
Recommendation
For purposes of the UBIT, the provision of insurance benefits, restaurants, entertainment, cemetery plots and burial services, and any other products or services commonly available from for-profit businesses should not count as part of the “exempt purpose” of a tax-exempt organization. When a tax-exempt organization provides commercial products and services in essentially the same manner as taxpaying businesses—and even directly competes with those taxpaying businesses—the income from this activity should likewise be taxed.
This proposal would effectively eliminate the tax exemption for some section 501 organizations, such as some organized under sections 501(c)(7) or 501(c)(8) that essentially operate as businesses. These organizations may decide it is simpler to file as a business under this reform.
However, the sections associated with these organization types should not be removed from the tax code. Many of these organizations serve important purposes beyond providing services to their members, and they should be allowed to continue collecting income for these purposes tax-free. They should also be allowed to continue offering the same member benefits as they did in the past, but the income used to provide these benefits should be subject to the UBIT.
Since the UBIT is calculated under the same rules as the corporate income tax, if the organization pays out nearly all of its income in benefits, it will be able to write off those benefits as business expenses, and its net taxable income will be little or nothing. Any remaining taxable income, however, should be subject to the UBIT.
Complexity and Inequity
Like most of the tax system, the section of the tax code governing tax-exempt organizations is exceedingly complex. There are 36 different types of tax-exempt organizations,460 and most of them are a mystery to the average American.
Not only do these multiple subsections cause confu-sion, they can cause unfairness. Differing bodies of law
donors. A few types of organizations automatically receive this exception, including organizations funded mostly by small annual contributions.452
In lieu of providing this notification, the 501(c) organization may pay a proxy tax at the top corporate rate of 35 percent. The 35 percent tax is paid on the amount of lobbying or
campaign expenditures that was not properly reported to the organization’s donors. If the 501(c) organization elects to pay this tax on the unreported expenditures, any corporate contributions that went to the unreported expenditures, and that otherwise qualify as deductible business expenses, may still be deducted by the donor corporation.453

288 | Tax Decoder Tax-Exempt Organizations | 289
Nonprofit Political Activity: Section 527 Organizations and 501(C) Organizations
Several different nonprofit organizations may legally participate in political activity. Organizations created primarily for political campaigning generally file under Section 527. A 527 political organization is a “party, committee, association, fund, or other organization” used to accept contributions and spend money for political purposes.463 Many 527 organizations must register as political committees with the Federal Elections Commission (FEC), disclose donors, and comply with limits on the size of donations and expenditures, among other requirements.464
Political activity can also occur through Section 501 nonprofits. Section 501(c)(3) charities are prohibited from engaging in any partisan political activity, but 501(c)(4) social welfare organizations, 501(c)(5) labor organizations, 501(c)(6) business leagues, and others may all have limited involvement in elections.465 They can also create subordinate “separate segregated funds,” (SSFs) which can be more extensively involved in elections.466
Any income of a 527 organizations that is collected through donations, membership dues, or fundraising events is explicitly tax-free as long as it is segregated for political use.467 Income from investments, however, would be subject to tax. Other nonprofits that participate in political activity and have investment income are also required to pay a tax.468 A 501(c) organization’s political activity may also impact the tax deductions of the businesses that contribute to it, as discussed elsewhere in this chapter.469
and regulation have developed around each subsection, creating inequities in the requirements faced by each or-ganization type.
Despite the multiplicity of organization types, there are only three major ways nonprofits are treated for tax purposes:
• The organization itself is tax-exempt, and donations to it are tax-deductible. (e.g., 501(c)(3) charitable organizations.)
• The organization is tax-exempt, but donations to it are not tax-deductible. (e.g, 501(c)(4) social welfare groups, 501(c)(5) labor groups, 501(c)(6) trade associations, and most other categories of nonprofits).
• Donations to the organizations are not tax-deductible, and the organization’s income is tax-exempt only when it comes from contributions made by individuals to support the organization’s exempt purpose. The investment income of these organizations, for example, is taxable. (e.g., 501(c)(7) social clubs, 501(c)(9) employee’s associations,461 527 political organizations.462).
Under current law, the different categories of tax-exempt organizations must meet significantly differing requirements, which continues to promote unfairness and confusion. For example, the leaders of 501(c)(4) social welfare organizations who engage in “excess benefit transactions” with the group are subject to stiff tax penalties, but the leaders of labor groups, trade associations, and other organizations with similar tax privileges do not face this requirement. The IRS recently sparked controversy when it proposed restrictions
on the campaign activity of 501(c)(4) groups—but did not propose applying those standards to labor unions and trade associations, which are both known to be politically active.
Recommendation
Congress should examine ways to consolidate the categories of tax-exempt organizations in order to ensure groups with the same tax benefits are subject to the same requirements and have the same opportunities. While a number of methods exist for accomplishing this, consolidation could provide tax-exempt organizations with much greater flexibility. For example, if sections 501(c)(4), 501(c)(5), and 501(c)(6) were merged into one section, an organization filing under the new section could use its resources to help promote a community’s economic development (currently a 501(c)(4) purpose), work to improve worker’s conditions (a 501(c)(5) purpose), and work to improve business conditions for an industry (a 501(c)(6) purpose).
The “exempt purposes” under the new section would be a combined list of all of the exempt purposes from the previous sections. Each of these organization types are treated essentially the same for tax purposes. Organizations as disparate as hospitals, universities, and churches currently coexist under section 501(c)(3). Not only will this help make nonprofit law more flexible for organizations and simpler for the public, it will require Congress to resolve the inequities between organization types. Future IRS regulations and court rulings would have to be applied uniformly to the entire merged section, rather than discriminating against certain types of organizations.

DRAFT
290 | Tax Decoder
1 “2013 Data Book,” IRS, September 30, 2013, Table 25, (p. 56), http://goo.gl/ZE04IY. 2 See chart following the introduction. 3 A total of more than 142,000 education-related 501(c)(3) organizations are registered with the IRS, but not all filed full Forms 990. Internal Revenue Service, Exempt
Organizations Business Master File, The Urban Institute, National Center on Charitable Statistics, December 2013 data, http://goo.gl/8Eoqxo. 4 Getter, Darryl E., “Policy Issues Related to Credit Union Lending,” CRS, July 8 2014, http://goo.gl/DVW0FD. 5 Internal Revenue Service, Exempt Organizations Business Master File, The Urban Institute, National Center on Charitable Statistics, December 2013, http://goo.
gl/8Eoqxo. 6 “2013 Data Book,” IRS, September 30, 2013, Table 25, (p. 56), http://goo.gl/ZE04IY. Supplied by IRS, September 19, 2014. Table created from the National Center for
Charitable Statistics database: http://nccsweb.urban.org/tablewiz/tw.php (login required). 7 “National Taxonomy of Exempt Entities,” NCCS, http://goo.gl/LNlgCU. 8 Some of the logos pictured are not those of U.S. 501(c)(3) organizations. Dan Math, “70 Charities, One Big Logo Rainbow,” Nonprofity; http://nonprofity.com/2010/70-
charities-one-big-logo-rainbow/ 9 Hundley, Kris et al. “America’s 50 Worst Charities rake in nearly $1 billion for Corporate Fundraisers,” Tampa Bay Times, June 6, 2013, http://goo.gl/Vc6W6R. 10 Lavigne, Paula, “Athlete Charities Often Lack Standards,” ESPN, March 31, 2013, http://goo.gl/dxApCe. 11 Amy Sciarretto, “Lady Gaga to Launch Born to Brave Bus on Tour to Raise Mental Health Awareness,” Pop Crush, December 21, 2012; http://bit.ly/11ijLaA 12 “2013 Data Book,” IRS, September 30, 2013, Table 25, (p. 56), http://goo.gl/ZE04IY. These numbers includes only organizations that are registered with the IRS. Organizations not required to register include organizations with less than $5,000 in annual
revenue, religious groups, and groups that are part of a tax-exempt parent organization. An unofficial estimate puts the number of congregations in the U.S. in 2009 at about 386,000, about half of which were not registered with the IRS. According to December 2013 data from the NCCS, about 254,000 religious organizations are registered with the IRS.
13 “2013 Data Book,” IRS, September 30, 2013, Table 24, (p. 55), http://goo.gl/ZE04IY. 14 2010 statistics. Includes all nonprofit organizations, not only 501(c)(3)s. Roeger, Katie et al. “The Nonprofit Almanac 2012,” Urban Institute (p. 22 – 23). 15 Roeger, Katie et al. “The Nonprofit Almanac 2012,” Urban Institute (p. 120). 16 2005-2010 statistics. Includes giving to all nonprofits, not only 501(c)(3) organizations. Roeger, Katie et al. “The Nonprofit Almanac 2012,” Urban Institute. 17 JCT lists three separate estimates: the deduction for contributions for health organizations, for educational institutions, and other than for education and health.
“Estimates of Federal Tax Expenditures for Fiscal Years 2014-2018,” Joint Committee on Taxation, August 5, 2014, http://1.usa.gov/1xN1A8O . 18 Internal Revenue Service, Exempt Organizations Business Master File, The Urban Institute, National Center on Charitable Statistics, December 2013, http://goo.
gl/8Eoqxo. 19 Roeger Katie, et al. “The Nonprofit Sector in Brief: Public Charities, Giving, and Volunteering,” Urban Institute, 2012, http://goo.gl/iN7TaQ. 20 Internal Revenue Service, Exempt Organizations Business Master File, The Urban Institute, National Center on Charitable Statistics, December 2013, http://goo.
gl/8Eoqxo. 21 Sherlock, Molly F. et al. “An Overview of the Nonprofit and Charitable Sector,” CRS, November 17 2009, (p. 2), http://goo.gl/7FODvj. 22 Internal Revenue Service, Exempt Organizations Business Master File, The Urban Institute, National Center on Charitable Statistics, December 2013, http://goo.
gl/8Eoqxo. 23 IRC § 501(c)(3), “26 U.S. Code § 501 - Exemption from tax on corporations, certain trusts, etc.,” Cornell University Law School, http://goo.gl/Yb27sX. 24 Hopkins, Bruce R., “The Law of Tax-Exempt Organizations,” 10th Edition, May 2011, (p. x – xi). 25 Total revenue was $1.514 trillion. Roeger, Katie et al. “The Nonprofit Almanac 2012,” Urban Institute (p. 158). 26 Based on an analysis of usaspending.gov data. This grant spending may include other nonprofits beyond 501(c)(3) organizations. “Nonprofits,” Subsidyscope - Pew
Charitable Trusts, http://goo.gl/j1pUzA, archived webpage snapshot, accessed June 3, 2013. 27 Sherlock, Molly F., “An Overview of the Nonprofit and Charitable Sector,” CRS, November 17, 2009, http://goo.gl/fb9wem. 28 JCT lists three separate estimates: the deduction for contributions for health organizations, for educational institutions, and other than for education and health.
“Estimates of Federal Tax Expenditures for Fiscal Years 2014-2018,” Joint Committee on Taxation, August 5, 2014, http://1.usa.gov/1xN1A8O . 29This estimate includes loans to students at nonprofit universities. “Nonprofit Sector Significant Federal Funds Reach the Sector Through Various Mechanisms, but
More Complete and Reliable Funding Data are Needed,” GAO, February 2009, (p. 23 – 32), http://goo.gl/X8Gh3C. 30 Hundley, Kris et al. “America’s 50 Worst Charities rake in nearly $1 billion for Corporate Fundraisers,” Tampa Bay Times, June 6, 2013, http://goo.gl/Vc6W6R. 31 Hundley, Kris et al. “America’s 50 Worst Charities rake in nearly $1 billion for Corporate Fundraisers,” Tampa Bay Times, June 6 2013, http://goo.gl/Vc6W6R. 32 “The 50 Worst, Ranked by Money Blown on Soliciting Costs,” Tampa Bay Times, November 15 2013, http://goo.gl/bTzsgS. 33 Hundley, Kris et al. “America’s 50 Worst Charities rake in nearly $1 billion for Corporate Fundraisers,” Tampa Bay Times, June 6 2013, http://goo.gl/Vc6W6R. 34 “The 50 Worst, Ranked by Money Blown on Soliciting Costs,” Tampa Bay Times, November 15, 2013, http://goo.gl/bTzsgS. 35 Hundley, Kris et al. “Part 1: Dirty secrets of the worst charities,” The Center for Investigative Reporting, June 6 2013, http://goo.gl/rDXFiE. “America’s Worst Charities,
Our Rankings Based on Cash Paid to Solicitors in the Past Decade,” Tampa Bay Times, http://goo.gl/LUO83. 36 “President Obama Meets Delaware Child with Brain Tumor,” Kids Wish Network, http://goo.gl/7ssrf9, “A ‘Red White, and Blue’ Wish Come True for Christina,” Kids
Wish Network, http://goo.gl/37C2QQ, “Chris Brown Grants Mo’s Wish,” Kids Wish Network, http://goo.gl/52GdUS. 37 Hundley, Kris et al. “Part 1: Dirty secrets of the worst charities,” The Center for Investigative Reporting, June 6 2013, http://goo.gl/rDXFiE. 38 Elias, Dave, “NBC2 Exclusive: Kids Wish Network being investigated,” NBC-2, July 3, 2013, http://goo.gl/ZcinmH. 39 Cancer Fund of America,” Cancer Fund of America; http://www.cfoa.org/blog/ 40 Kris Hundley and Kendall Taggart, “Intricate Family Connections Bind several of America’s Worst Charities,” Tampa Bay Times, June 13, 2013; http://goo.gl/iI608 41 Rick Cohen, “The Reynolds Family’s Wretched Charity Empire,” Nonprofit Quarterly. June 14, 2013; http://goo.gl/a8nlxs. 42 Kris Hundley and Thomas Bassinger, “All in the Family,” Tampa Bay Times, http://www.tampabay.com/americas-worst-charities/reynolds_network.pdf 43 This image is not intended to imply the individuals pictured have been paid by charities to appear at events. “The Montblanc Signature for Good Charity Gala In
Hollywood,” Zimbio, February 20 2009, http://goo.gl/3hkGj6. 44 Cieply, Michael et al. “It Pays to be a Star on Charity Circuit,” LA Times, December 8 2003, (p. 1), http://goo.gl/89MEMz.
Recommendations
Numerous contentious issues surround the political activity of nonprofit organizations, from “Super PACs” to spending limits to donor disclosure. Since the focus of this report is tax reform, it does not make extensive recommendations on campaign finance reform. It does recommend, however, that the IRS should be removed from the arena of campaign regulation as much as possible. Rules specific to political activity should be removed from the tax code and the IRS’ jurisdiction, and shifted to the control of the Federal Elections Commission, which is the appropriate federal authority for campaign regulation.

290 | Tax Decoder Tax-Exempt Organizations | 291
45 Cieply, Michael et al. “It Pays to be a Star on Charity Circuit,” LA Times, December 8 2003, (p. 2), http://goo.gl/89MEMz. 46 Cieply, Michael et al. “It Pays to be a Star on Charity Circuit,” LA Times, December 8 2003, (p. 2), http://goo.gl/89MEMz. 47 “Wyclef Jean’s Funny Money,” The Smoking Gun, January 14 2010, http://goo.gl/C7eUW2. 48 “Wyclef Jean’s Funny Money,” The Smoking Gun, January 14 2010, http://goo.gl/IRlVHw. 49 “Kanye West’s Charity Spends More than $500G Annually, donates $0, Report Says,” FOX 411, February 21, 2012, http://goo.gl/3HX9tj. 50 Isabel Vincent, “‘All My Children’ actor doesn’t know what happened to money raised for 9/11 victims,” New York Post, July 3, 2011; http://goo.gl/JTwG09 51 Image source: T. Marie, “Kanye West Live From Chicago Theatre,” The Buzz In the City, July 27, 2009; http://thebuzzinthecity.com/kanye-west-live-from-chicago-
theater/ 52 Lavigne, Paula, “Athlete Charities Often Lack Standards,” ESPN, March 31, 2013, http://goo.gl/dxApCe. 53 Lavigne, Paula, “Athlete Charities Often Lack Standards,” ESPN, March 31, 2013, http://goo.gl/dxApCe. 54 Lavigne, Paula, “Athlete Charities Often Lack Standards,” ESPN, March 31, 2013, http://goo.gl/dxApCe. 55 Lavigne, Paula, “Athlete Charities Often Lack Standards,” ESPN, March 31 2013, http://goo.gl/dxApCe. 56 Lavigne, Paula, “Athlete Charities Often Lack Standards,” ESPN, March 31 2013, http://goo.gl/dxApCe. 57 “Form 990” Year 2011 and Year 2012, Born This Way Foundation, NCCS, http://goo.gl/cZB5OL. 58 “Lady Gaga’s Charity Raises $2 million, Only Spends $5,000,” Mashable.com, March 14, 2014, http://goo.gl/YYdjsi 59 Freidman, Roger, “Lady Gaga Foundation spends more on Lawyers, Publicity and on Consultants than on Charity,” Showbiz 411, March 11 2014 http://goo.gl/iLMSyt. 60 Freidman, Roger, “Lady Gaga Foundation spends more on Lawyers, Publicity and on Consultants than on Charity,” Showbiz 411, March 11 2014 http://goo.gl/iLMSyt. 61 “Lady Gaga ‘Born Brave Bus’ Behind the Scenes Tour,” Clevver Music, Jan 23, 2013; https://www.youtube.com/watch?v=9O13pPy2kcA 62 “Lady Gaga ‘Born Brave Bus’ Behind the Scenes Tour,” Clevver Music, Jan 23 2013, http://goo.gl/ytmZGQ. 63 Internal Revenue Service, Exempt Organizations Business Master File, The Urban Institute, National Center on Charitable Statistics, December 2013, http://goo.
gl/8Eoqxo. 64 “Public Charities,” NCCS, http://goo.gl/u8uwa3. 65 “U.S. and Canadian Institutions Listed by Fiscal Year 2013 Endowment Market Value and Change* in Endowment Market Value from FY 2012 to FY 2013,” National
Association of College and University Business Officers and Commonfund Institute, February 2014, http://goo.gl/K8KEu6. 66 Vedder, Richard K., “Cutoff Harvard to Save America,” Bloomberg View, February 20 2014, http://goo.gl/obnO3j. 67 Vedder, Richard K., “Princeton Reaps Tax Breaks as State Colleges Beg,” Bloomberg View, March 18 2012, http://goo.gl/c3Yfyu. 68 “Nonprofit Hospitals: Variation in Standards and Guidance Limits Comparison of How Hospitals Meet Community Benefit Requirements,” Government Accountability
Office, September 2008, http://goo.gl/hnnR34. 69 “Fast Facts on US Hospitals,” American Hospital Association, http://goo.gl/MMa7BP. 70 “Nonprofit Hospitals: Variation in Standards and Guidance Limits Comparison of How Hospitals Meet Community Benefit Requirements,” Government Accountability
Office, September 2008, (p. 11), http://goo.gl/hnnR34. 71 “Nonprofit Hospitals: Variation in Standards and Guidance Limits Comparison of How Hospitals Meet Community Benefit Requirements,” Government Accountability
Office, September 2008, (p. 11), http://goo.gl/hnnR34. 72 “Nonprofit Hospitals: Variation in Standards and Guidance Limits Comparison of How Hospitals Meet Community Benefit Requirements,” Government Accountability
Office, September 2008, http://goo.gl/hnnR34. 73 “Nonprofit Hospitals: Variation in Standards and Guidance Limits Comparison of How Hospitals Meet Community Benefit Requirements,” Government Accountability
Office, September 2008, (p. 42), http://goo.gl/hnnR34. 74 There are no specific standards these policies must meet. Lunder, Erika K. et al. “501(c)(3) Hospitals and the Community Benefit Standard,” CRS, November 10 2009,
http://goo.gl/vJL7HB. 75 “Fast Facts on US Hospitals,” American Hospital Association, http://goo.gl/825Gjz. 76 Pettijohn, Sarah L., “The Nonprofit Sector in Brief: Public Charities, Giving, and Volunteering, 2013,” Urban Institute, (p. 4), http://goo.gl/3mvgEA. 77 “Nonprofit Hospitals and the Provision of Community Benefits,” Congressional Budget Office, December 2006, (p. 5), http://goo.gl/TTC57H. 78 Bureau of Labor Statistics, CPI Inflation Calculator, http://goo.gl/3sEJxo. 79 “Estimates of Federal Tax Expenditures for Fiscal Years 2014-2018,” Joint Committee on Taxation, August 5 2014, (p. 31), http://goo.gl/d0TCXy. 80 “Fast Facts on US Hospitals,” American Hospital Association, http://goo.gl/Wzg6mf. 81 For example, nonprofit hospitals are generally exempt from state and local property and sales taxes. 82 “Nonprofit Hospitals and the Provision of Community Benefits,” Congressional Budget Office, December 2006, (p. 2), http://goo.gl/Qg1l3j, 83 Young, GJ et al. “Does the sale of nonprofit hospitals threaten health care for the poor?” Health Affairs, (p. 137 – 141), http://goo.gl/UcUncT. 84 “Nonprofit Hospitals and the Provision of Community Benefits,” Congressional Budget Office, December 2006, http://goo.gl/TvgypJ. 85 Shah. Bimal et al. “The Impact of For-Profit Hospital Status on the Care and Outcomes of Patients With Non–ST-Segment Elevation Myocardial Infarction: Results
From the CRUSADE Initiative,” Journal of the American College of Cardiology,” Journal of the American College of Cardiology, 2007, (p. 1462 – 1468), http://goo.gl/uv70Pw.
86 Sloan, Frank, et al. “Hospital ownership and cost and quality of care: is there a dime’s worth of difference?” Journal of Health Economics, 2001, (p. 1-21). 87 “Nonprofit Hospitals and the Provision of Community Benefits,” Congressional Budget Office, December 2006, http://goo.gl/fMd6lR. 88 “Nonprofit Hospitals: Variation in Standards and Guidance Limits Comparison of How Hospitals Meet Community Benefit Requirements,” Government Accountability
Office, September 2008, http://goo.gl/tgM2PF. 89 Young, Gary et al. “Provision of Community Benefits by Tax-Exempt U.S. Hospitals,” New England Journal of Medicine, 2013, (p. 1519), http://goo.gl/H4d3oG. 90 Young, Gary et al. “Provision of Community Benefits by Tax-Exempt U.S. Hospitals,” New England Journal of Medicine, 2013, (p. 1522), http://goo.gl/H4d3oG. 91 Young, Gary et al. “Provision of Community Benefits by Tax-Exempt U.S. Hospitals,” New England Journal of Medicine, 2013, (p. 1522), http://goo.gl/H4d3oG. 92 Melanie Evans and Joe Carlson, “Not-for-profit hospitals’ charity spending revealed, but finding a standard measure may not be so simple,” Modern Healthcare,
December 19, 2011, http://bit.ly/1HgQy0F. 93 Melanie Evans and Joe Carlson, “Not-for-profit hospitals’ charity spending revealed, but finding a standard measure may not be so simple,” Modern Healthcare,
December 19, 2011, http://bit.ly/1HgQy0F. 94 Example of Mercy Health. Brill, Steven, “How outrageous pricing and egregious profits are destroying our health care,” TIME Magazine, March 4 2013; http://goo.gl/
AmtBtc. 95 Brill, Steven, “How outrageous pricing and egregious profits are destroying our health care,” TIME Magazine, March 4 2013; http://goo.gl/AmtBtc. 96 Brill, Steven, “How outrageous pricing and egregious profits are destroying our health care,” TIME Magazine, March 4 2013; http://goo.gl/AmtBtc. 97 Example of Mercy Health. Brill, Steven, “How outrageous pricing and egregious profits are destroying our health care,” TIME Magazine, March 4 2013; http://goo.gl/
AmtBtc. 98 The American Hospital Association also recommends a formula for calculating charity care, the basis of which is “charity care charges.” See “American Hospital
Association: Uncompensated Hospital Care Cost Fact Sheet,” American Hospital Association, January 2013, http://goo.gl/Kyysye. 99 McLaughlin, Jim, “Private Equity and Nonprofit Hospitals: Strange Bedfellows or Saving Grace?” Becker’s Hospital Review, March 26 2013, http://goo.gl/M52V88. 100 McLaughlin, Jim, “Private Equity and Nonprofit Hospitals: Strange Bedfellows or Saving Grace?” Becker’s Hospital Review, March 26 2013, http://goo.gl/M52V88. 101 For example, see Christina Sampson, “Banner announces it will acquire Casa Grande hospital,” Florence Reminder and Blade-Tribune, January 2 2014, http://goo.
gl/9rv1Zr. 102 Data provided by the Internal Revenue Service to the Congressional Research Service, April 7, 2014. Twenty-four other hospitals have lost their tax exemption as a
result of not filing a Form 990 for three consecutive years. 103 Bob Herman, “CEO Compensation of the 25 Top-Grossing Nonprofit Hospitals,” Becker’s Hospital Review, March 11, 2014; http://goo.gl/AmtBtc 104 Steven Brill, “How outrageous pricing and egregious profits are destroying our health care,” TIME Magazine, March 4, 2013; http://goo.gl/AmtBtc 105 Steven Brill, “How outrageous pricing and egregious profits are destroying our health care,” TIME Magazine, March 4, 2013; http://goo.gl/AmtBtc 106 Steven Brill, “How outrageous pricing and egregious profits are destroying our health care,” TIME Magazine, March 4, 2013; http://goo.gl/AmtBtc 107 Steven Brill, “How outrageous pricing and egregious profits are destroying our health care,” TIME Magazine, March 4, 2013; http://goo.gl/AmtBtc 108 Joynt, Karen E. “Compensation of Chief Executive Officers at Nonprofit US Hospitals,” JAMA Internal Medicine, January 2014, http://goo.gl/71Xun1. 109 Joynt, Karen E. “Compensation of Chief Executive Officers at Nonprofit US Hospitals,” JAMA Internal Medicine, January 2014, http://goo.gl/71Xun1. 110 Heisler, Elayne J., “Federal Health Centers,” CRS, April 1, 2014, http://bit.ly/1EX7OEq 111 “Health Care Workforce: Federally Funded Training Programs in Fiscal Year 2012,” Government Accountability Office, August 15 2013, http://goo.gl/pfRZXO. 112 “Justification of Estimates for Appropriations Committees,” Department of Health and Human Services, Health Resources and Services Administration, FY 2015,
http://1.usa.gov/1xAKgWX

DRAFT
292 | Tax Decoder
113 “Monthly Budget Review: Summary for Fiscal Year 2014,” Congressional Budget Office, November 10, 2014, http://cbo.gov/publication/49759 114 Mitchell, Alison, “Medicaid Disproportionate Share Hospital Payments,” CRS, May 6, 2014. 115 Mitchell, Alison, “Medicaid Disproportionate Share Hospital Payments,” CRS, May 6, 2014. 116 Funds for FY2014. Napili, Angela. “Title X (Public Health Service Act) Family Planning Program,” CRS, September 3, 2014. 117 For example, see Corby-Edwards, Amalia et al. “Public Health Service Agencies: Overview and Funding,” CRS, November 12, 2013, http://goo.gl/yCbMIT. 118 “Categories of Eligible Activities,” Community Development Block Grant Program, U.S. Department of Housing and Urban Development, (p. 2 – 11), http://goo.gl/
Qopqfs. 119 “IRS Scrutinizes Hospitals Mergers; Threat to Tax Exempt Bond Financings,” McDermott Will & Emery, June 14 2000, http://goo.gl/qRPxna. 120 “Estimates of Federal Tax Expenditures for Fiscal Years 2014-2018,” Joint Committee on Taxation, August 5 2014, (p. 31), http://goo.gl/NUkLNf. 121 Potetz, Lisa, “Health plannings, Issues for Reauthorization,” Congressional Budget Office, March 1982, (p. 49), http://goo.gl/IJ3NwN. 122 “Health Care Trends and the Tax Treatment of Health Care Institutions,” Congressional Budget Office, August 1994, (p. 13), http://bit.ly/1uMDGtW 123 Stensland, Jeff and Zach Gaumer, “Medicare beneficiaries’ access to hospital care and near-term changes in Medicare payment policies,” MedPAC, November 8, 2013,
(p. 5); http://goo.gl/XhVKU9 124 Stensland, Jeff and Zach Gaumer, “Medicare beneficiaries’ access to hospital care and near-term changes in Medicare payment policies,” MedPAC, November 8, 2013,
(p. 5); http://goo.gl/9Tg52B 125 “Tax Expenditures: Compendium of Background Material on Individual Provisions,” CRS, December 2012, (p. 833), http://goo.gl/1GDS7d. 126 “Nonprofit Hospitals and Tax Arbitrage,” Congressional Budget Office, December 2006, (p. 25), http://goo.gl/7XC4lJ. 127 “Tax Reform and Tax Provisions Affecting State and Local Government,” American Hospital Association, March 19 2013, http://goo.gl/1mUyn5. 128 “Moody’s: Not-for-profit hospital margins fall to 2.2%,” The Advisory Board Company, April 25 2014, http://goo.gl/k5BFTg. 129 Whelan, David, “America’s Most Profitable Hospitals,” Forbes, August 31 2010, http://goo.gl/mS87HE. 130 Mintz, Robert J., “How to Find a Tax Shelter,” Asset Protection Law Center, http://goo.gl/bLl6PD. 131 Baker, Gregory W. et al. “Charitable Remainder Trust Handbook,” Renaissance, (p. 10), http://goo.gl/yEziIz. 132 Baker, Gregory W. et al. “Charitable Remainder Trust Handbook,” Renaissance, (p. 10), http://goo.gl/yEziIz. 133 Bourland, Michael V. et al. “The Charitable Remainder Trust,” Youthbridge Community Foundation, May 18 2011, http://goo.gl/lXMkEh. 134 Michael Seto and David Jones, “G. Self Dealing and Other Tax Issues Involving Charitable Remainder Unitrusts,” IRS, 1996 Exempt Organizations Continuing
Professional Education (EO CPE) text; http://goo.gl/cwGqNl. Available from “Exempt Organizations - Continuing Professional Education Articles,” IRS, http://goo.gl/d8QeX5.
135 Bourland, Michael V., Jeffrey N. Myers, “The Charitable Remainder Trust,” Youthbridge Community Foundation, May 18, 2011; http://goo.gl/aWcC6I 136 “Split-Interest Trusts, Filling Year 2012,” IRS, http://goo.gl/nstvZL. 137 Bourland, Michael V. et al. “The Charitable Remainder Trust,” Youthbridge Community Foundation, May 18 2011, http://goo.gl/lPDU61. 138 “Split-Interest Trusts, Filling Year 2012,” IRS, http://goo.gl/nstvZL. 139 Hoffman, Marc, “Pooled income Fund,” Youthbridge Community Foundation, May 5 2003, http://goo.gl/E4UxkC. 140 Hoffman, Marc, “Pooled income Fund,” Youthbridge Community Foundation, May 5 2003, http://goo.gl/E4UxkC. 141 The total number of split-interest trusts, and total assets, are sums of figures in Tables 3, 6, 9, and 11. Assets are net assets, given in book value. Figures on CRUTs are
from Tables 6, 5, and 4. Rosenmerkel, Lisa S., “Split-Interest Trusts, Filing Year 2012,” Internal Revenue Service, http://goo.gl/odPgkt. 142 IRC § 4947, “26 U.S. Code § 4947 - Application of taxes to certain nonexempt trusts,” Cornell University Law School, http://goo.gl/uL17Gt. 143 “Charitable Trusts,” Internal Revenue Service, http://goo.gl/DYUz9H. 144 “G. Social Welfare: What Does it Mean? How Much Private Benefit is Permissible? What is a Community?” Internal Revenue Service, 1981, (p. 39), http://goo.gl/
dt1rMq. The text is from 1981 but is quoted on the IRS webpage regarding social welfare purposes: “Social Welfare Purposes,” Internal Revenue Service, March 14 2014, http://goo.gl/ZPXVYn.
145 “2013 Data Book,” IRS, September 30, 2013, Table 25, (p. 56), http://goo.gl/ZE04IY. 146 “Social Welfare Organizations - Examples,” Internal Revenue Service], March 14 2014, http://goo.gl/50lQYT. 147 The database may include more than one Form 990 for the same organization. “Nonprofit Explorer,” ProPublica, http://goo.gl/QtDdCH. 148 “Nonprofit Explorer,” ProPublica, http://goo.gl/rHYbYW. 149 “Nonprofit Explorer,” ProPublica, http://goo.gl/6x1ne6. 150 “Nonprofit Explorer,” ProPublica, http://goo.gl/g1PJLP. 151 “Nonprofit Explorer,” ProPublica, http://goo.gl/UwSkWW. 152 “About,” American for Tax Reform, 2013, http://goo.gl/t4dNw5. 153 “Statement of Purpose,” Organizing for Action, http://goo.gl/GRFGnS. 154 “Chart 1 AARP Organizational Structure,” AARP, 2010, http://goo.gl/U34sfm. 155 “NRA Member Planned Giving Guide,” NRA, 2012, (p. 3), http://goo.gl/LwTwAU. 156 “About Us,” Humane Society Legislative Fund, http://goo.gl/z94zSZ. 157 “Political Nonprofits: Top Election Spenders,” Open Secrets, http://goo.gl/PZBGTu. 158 “American Crossroads/Crossroads GPS,” Open Secrets, http://goo.gl/7vO0pD. 159 “American Future Fund,” Open Secrets, http://goo.gl/HQnxev. 160 “Planned Parenthood,” Planned Parenthood Action Fund, http://goo.gl/BJWdSX. 161 Tau, Byron, “Pro-Obama Nonprofit Priorities USA Raises $10.7 Million,” November 19 2013, http://goo.gl/W0SwLK. 162 “501(c)(4) - Civic leagues, social welfare organizations, and local associations of employees,” NCCS, http://urbn.is/1zAXXmF (login may be required). 163 “Nonprofit Explorer,” ProPublica, http://goo.gl/0EJ1PY. 164 “International Olympic Committee,” ProPublica, http://goo.gl/dx6rjj. 165 “Nonprofit Explorer,” ProPublica, http://goo.gl/2C2D7i. 166 “Nonprofit Explorer,” ProPublica, http://goo.gl/LynU96. 167 “Nonprofit Explorer,” ProPublica, http://goo.gl/44ivTG. 168 “Nonprofit Explorer,” ProPublica, http://goo.gl/ehlSox. 169 “Nonprofit Explorer,” ProPublica, http://goo.gl/ikXsnT. 170 “Nonprofit Explorer,” ProPublica, http://goo.gl/ZyrVDC. 171 “Nonprofit Explorer,” ProPublica, http://goo.gl/h8tGbT. 172 “Nonprofit Explorer,” ProPublica, http://goo.gl/uPAugd. 173 “Nonprofit Explorer,” ProPublica, http://goo.gl/fjMJvv. 174 “Nonprofit Explorer,” ProPublica, http://goo.gl/X1ODB1. 175 “501(c)(4) - Civic leagues, social welfare organizations, and local associations of employees,” NCCS, http://urbn.is/1zAXXmF (login may be required). 176 Copeland, Sadie et al. “B. Beauty Pageants: Private Benefit Worth Watching,” IRS, 2002, http://goo.gl/y1sWdV, “Nonprofit Explorer,” ProPublica, http://goo.gl/l0lsa4. 177 “Nonprofit Explorer,” ProPublica, http://goo.gl/16tXRl. 178 “Nonprofit Explorer,” ProPublica; http://goo.gl/tMx6tz. 179 “Nonprofit Explorer,” ProPublica; http://goo.gl/4OFJKX. 180 “Miss America 2014 Nina Davuluri,” Miss America, http://goo.gl/NOVmVE. 181 “Taxpayer Protection Pledge,” Americans For Tax Reform, http://goo.gl/PFhix4. 182 “Crossroads Grassroots Policy Strategies (GPS),” Crossroads GPS, 2012; http://goo.gl/hS9F0R. 183 “About Us,” Priorities USA Action, http://goo.gl/FZvEYD. 184 IRC § 501(c)(4), “26 U.S. Code § 501 - Exemption from tax on corporations, certain trusts, etc.,” Cornell University Law School, http://goo.gl/wFgn5r. 185 “Social Welfare Organizations,” Internal Revenue Service, March 6 2014, http://goo.gl/vLxJKy. 186 “Social Welfare Purposes,” Internal Revenue Service, March 14 2014, http://goo.gl/7P8Df9. 187 These types of groups, in some cases however, are considered tax-exempt nonprofits under other sections of tax law. 188 “G. Social Welfare: What Does it Mean? How Much Private Benefit is Permissible? What is a Community?” Internal Revenue Service, 1981, (p. 16), http://goo.gl/
dt1rMq. 189 “Business Activities and Social Welfare,” Internal Revenue Service, April 25 2014, http://goo.gl/3gZDBu. 190 “Business Activities and Social Welfare,” Internal Revenue Service, April 25 2014, http://goo.gl/3gZDBu. 191 “Social Welfare Organizations,” Internal Revenue Service, March 6 2014, http://goo.gl/vLxJKy.

292 | Tax Decoder Tax-Exempt Organizations | 293
192 IRC § 162(e), “26 U.S. Code § 162 Trade or Business,” Cornell University Law School, http://goo.gl/0Be6gL. 193 “Political Activity and Social Welfare,” Internal Revenue Service, March 17, 2014, http://goo.gl/1E91cZ. 194 “Intermediate Sanctions,” Internal Revenue Service, October 31 2013, http://goo.gl/SmTU1S. 195 “Intermediate Sanctions - Substantial Influence,” Internal Revenue Service, July 15 2014, http://goo.gl/35vmoj. 196 “Intermediate Sanctions - Excess Benefit Transactions,” Internal Revenue Service, October 30 2013, http://goo.gl/F0xeuL. 197 “Intermediate Sanctions - Excise Taxes,” Internal Revenue Service, September 23, 2014, http://goo.gl/Qt3xt0 198 “Intermediate Sanctions - Excess Benefit Transactions,” Internal Revenue Service, October 30 2013, http://goo.gl/F0xeuL. 199 “Intermediate Sanctions - Excise Taxes,” Internal Revenue Service, September 23, 2014, http://goo.gl/Qt3xt0 200 “Donations to Section 501(c)(4) Organizations,” Internal Revenue Service, March 6 2014, http://goo.gl/Ah4kbL. 201 “Donations to Section 501(c)(4) Organizations,” Internal Revenue Service, March 6 2014, http://goo.gl/Ah4kbL. 202 “Tax Exempt Status for your Organization,” Internal Revenue Service, October 2013, (p. 48) http://goo.gl/YMUnZF. 203 “Donations to Section 501(c)(4) Organizations,” Internal Revenue Service, March 6 2014, http://goo.gl/Ah4kbL. 204 “Nondeductible Lobbying and Political Expenditures,” Internal Revenue Service, http://goo.gl/m4Tyse. 205 “Social Welfare Purposes,” Internal Revenue Service, March 14, 2014, http://goo.gl/x8Z7hS. 206 “Form 990, 2012 - Metropolitan New York Region Porsche Club of America LTD” Foundation Center, http://goo.gl/oR34dD. 207 “Form 990, 2012 - Cody Shooting Complex,” Foundation Center, http://goo.gl/B8trLn. 208 “Form 990, 2012 - Alabama Deep Sea Fishing Rodeo,” Foundation Center, http://goo.gl/RP00rS. 209 “Form 990, 2012 - Prairie Meadows Race Track and Casino Inc.,” Foundation Center, http://goo.gl/Jv1NRX. 210 Rod Boshart, “Racing Commission Approves New Wagering Option for Prairie Meadows,” April 3, 2014; http://thegazette.com/2011/11/10/racing-commission-
approves-new-wagering-option-for-prairie-meadows/ 211 Image source: Wikimedia Commons, http://bit.ly/11GJpXu 212 Reilly, John Francis et al. “IRC 501(c)(5) Organizations,” Internal Revenue Service, 2003, (p. J - 3) http://goo.gl/PS5RDb. 213 “Labor Organizations,” Internal Revenue Service, http://goo.gl/auGO5A. 214 “2013 Data Book,” IRS, September 30, 2013, Table 25, (p. 56), http://goo.gl/ZE04IY. 215 “AFL-CIO,” Open Secrets, http://goo.gl/JrpUdR. 216 Ranked by Total Assets. “Nonprofit Explorer,” ProPublica, http://bit.ly/1ykfU7Y and http://bit.ly/1Aeoglv 217 26 CFR 1.501(c)(5)-1, “Labor, agricultural, and horticultural organizations,” Cornell University Law School, http://goo.gl/QkSmhh. 218 IRC § 501(c)(5), “26 U.S. Code § 501 Exemption from ax on Corporations, Certain Trusts, etc.,” Cornell University Law School, http://goo.gl/OzM8mp. 219 Reilly, John Francis et al. “IRC 501(c)(5) Organizations,” Internal Revenue Service, 2003, (p. J - 4) http://goo.gl/PS5RDb. 220 “Labor Organizations - Composition of Membership,” Internal Revenue Service, http://goo.gl/dFhABK. 221 “Inurement and Benefits to Members - Agricultural/ Horticultural and Labor organizations (IRC 501(c)(5))” Internal Revenue Service, April 10 2014, http://goo.gl/
SJO5RF. 222 Reilly, John Francis et al. “IRC 501(c)(5) Organizations,” Internal Revenue Service, 2003, (p. J - 42) http://goo.gl/PS5RDb. 223 Reilly, John Francis et al. “IRC 501(c)(5) Organizations,” Internal Revenue Service, 2003, (p. J - 42) http://goo.gl/PS5RDb. 224 A database of about 16,000 organizations classified under 501(c)(5) includes several hundred groups with “agricultural” or “horticultural” in their names. “Nonprofit
Explorer,” ProPublica, http://goo.gl/uQiGpo. 225 “Tax Exempt Status for your Organization,” Internal Revenue Service, October 2013, (p. 49), http://goo.gl/HMrtcL. 226 Organizations focused on the improvement of marketing or other business conditions for an agricultural or horticultural line of business should file as a 501(c)(6)
trade organization, not a 501(c)(5) organization. “Tax Exempt Status for your Organization,” Internal Revenue Service, October 2013, (p. 49), http://goo.gl/3uy6rL 227 See Form 990 tab. “Red Lodge Rodeo Assn,” NCCS, http://urbn.is/11heccy 228 “Tax Exempt Status for your Organization,” Internal Revenue Service, October 2013, (p. 49), http://goo.gl/HMrtcL. 229 Reilly, John Francis et al. “IRC 501(c)(5) Organizations,” Internal Revenue Service, 2003, (p. J - 29) http://goo.gl/PS5RDb. 230 “Nonprofit Explorer,” ProPublica; http://bit.ly/1xTENJd 231 “Nonprofit Explorer,” ProPublica; http://bit.ly/1xMV2GZ 232 Reilly, John Francis et al. “Political Campaign and Lobbying Activities of IRC 501(c)(4), (c)(5), and (c)(6) Organizations,” Internal Revenue Service, 2003, http://goo.
gl/0ygmbN. 233 Political Campaign and Lobbying Activities of IRC 501(c)(4), (c)(5), and (c)(6) Organizations,” Internal Revenue Service, 2003, (p. L – 2), http://goo.gl/0ygmbN. 234 “Tax Exempt Status for your Organization,” Internal Revenue Service, October 2013, (p. 48), http://goo.gl/3uy6rL 235 IRC § 162(e), “26 U.S. Code § 162 Trade or Business Expenses,” Cornell University Law School, http://goo.gl/vpXXm1. 236 “2013 Data Book,” IRS, September 30, 2013, Table 25, (p. 56), http://goo.gl/ZE04IY. 237 Search for each organization’s name. Ranked by Total Assets. “Nonprofit Explorer,” ProPublica, http://bit.ly/1xMWCJ4 238 Reilly, John Francis et al. “IRC 501(c)(6) Organizations,” Internal Revenue Service, 2003, (p. K – 2), http://goo.gl/xCA0JP. 239 See the chapter on tax subsidies for sports for more discussion of tax-exempt professional sports leagues 240 whether or not administering a pension fund for football players 241 IRC § 501(c)(6), “26 U.S. Code § 501 - Exemption from tax on corporations, certain trusts, etc.,” Cornell University Law School, http://goo.gl/r5npDC. 242 26 CFR 1.501(c)(6)-1, “Business Leagues, Chambers of Commerce, Real Estate Boards, and Boards of Trade,” Cornell University Law School, http://goo.gl/U8Ju0z. 243 “Tax Exempt Status for your Organization,” Internal Revenue Service, October 2013, (p. 49-50), http://goo.gl/p8SBo3. 244 “Tax Exempt Status for your Organization,” Internal Revenue Service, October 2013, (p. 49 – 50), http://goo.gl/p8SBo3. 245 Reilly, John Francis et al. “IRC 501(c)(6) Organizations,” Internal Revenue Service, 2003, (p. K – 20), http://goo.gl/xCA0JP. 246 26 CFR 1.501(c)(6)-1, “Business Leagues, Chambers of Commerce, Real Estate Boards, and Boards of Trade,” Cornell University Law School, http://goo.gl/uAUVwv. 247 Reilly, John Francis et al. “IRC 501(c)(6) Organizations,” Internal Revenue Service, 2003, (p. K – 6), http://goo.gl/xCA0JP. 248 Reilly, John Francis et al. “IRC 501(c)(6) Organizations,” Internal Revenue Service, 2003, (p. K – 9), http://goo.gl/xCA0JP. 249 Reilly, John Francis et al. “IRC 501(c)(6) Organizations,” Internal Revenue Service, 2003, (p. K – 9), http://goo.gl/xCA0JP. 250 Reilly, John Francis et al. “IRC 501(c)(6) Organizations,” Internal Revenue Service, 2003, (p. K – 9), http://goo.gl/xCA0JP. 251 “Tax Exempt Status for your Organization,” Internal Revenue Service, October 2013, (p. 49 – 50), http://goo.gl/p8SBo3. 252 Reilly, John Francis et al. “IRC 501(c)(6) Organizations,” Internal Revenue Service, 2003, (p. K – 12), http://goo.gl/xCA0JP. 253 Reilly, John Francis et al. “IRC 501(c)(6) Organizations,” Internal Revenue Service, 2003, (p. K – 12), http://goo.gl/xCA0JP. 254The sale of broadcast rights increases public awareness of the sport and is therefore substantially related to the exempt purpose of improving business conditions for
members. Reilly, John Francis et al. “IRC 501(c)(6) Organizations,” Internal Revenue Service, 2003, (p. K – 21), http://goo.gl/xCA0JP. 255 “Tax Exempt Status for your Organization,” Internal Revenue Service, October 2013, (p. 49 – 50), http://goo.gl/p8SBo3. 256 Reilly, John Francis et al. “IRC 501(c)(6) Organizations,” Internal Revenue Service, 2003, (p. K – 12), http://goo.gl/xCA0JP. 257 IRC § 513, “26 U.S. Code § 513 Unrelated Trade or Business,” Cornell University Law School, http://goo.gl/8Gd3ku. 258 Reilly, John Francis et al. “Political Campaign and Lobbying Activities of IRC 501(c)(4), (c)(5), and (c)(6) Organizations,” Internal Revenue Service, 2003, (L – 2), http://
goo.gl/0ygmbN. 259 “Tax Exempt Status for your Organization,” Internal Revenue Service, October 2013, (p. 49 – 50), http://goo.gl/p8SBo3. 260 Reilly, John Francis et al. “Political Campaign and Lobbying Activities of IRC 501(c)(4), (c)(5), and (c)(6) Organizations,” Internal Revenue Service, 2003, http://goo.
gl/0ygmbN. 261 “Tax Exempt Status for your Organization,” Internal Revenue Service, October 2013, (p. 47, 50), http://goo.gl/p8SBo3. 262 Image: http://goo.gl/R25QA8 “Nonprofit Explorer,” ProPublica; http://goo.gl/JmVlsf. 263 Langley, Jim et al. “G. Social Clubs - IRC 501(c)(7),” Internal Revenue Service, 1996, (p. 1) http://goo.gl/0KECLH. 264 Langley, Jim et al. “G. Social Clubs - IRC 501(c)(7),” Internal Revenue Service, 1996, (p. 1) http://goo.gl/0KECLH. 265 Internal Revenue Manual 7.25.7.1, “Overview,” IRS, February 23, 1999, http://1.usa.gov/1wZu0t4 266 “2013 Data Book,” IRS, September 30, 2013, Table 25, (p. 56), http://goo.gl/ZE04IY. 267 Table generated from the NCCS website, “NCCS All Registered NonProfits Table Wizard,” NCCS, http://goo.gl/Xo0EUm. 268 26 CFR 1.501(c) (7)-1, “Social Clubs,” Cornell University Law School, http://bit.ly/1xDKsVr 269 “Nonprofit Explorer,” ProPublica, http://goo.gl/eo0Lo4. 270 “National Republican Club of Capitol Club,” NCCS, http://goo.gl/lYu42O, Image source: “Presidential Dining Room,” National Republican Club of Capitol Hill, http://
goo.gl/B1IXTm. 271 26 CFR 1.501(c)(7)-1, “Social Clubs,” Cornell University Law School, http://goo.gl/sUUw4i. 272 Langley, Jim et al. “G. Social Clubs - IRC 501(c)(7),” Internal Revenue

DRAFT
294 | Tax Decoder
Service, (p. 4 – 5), http://goo.gl/MtUCSp. 273 Langley, Jim et al. “G. Social Clubs - IRC 501(c)(7),” Internal Revenue Service, (p. 7), http://goo.gl/MtUCSp. 274 Langley, Jim et al. “G. Social Clubs - IRC 501(c)(7),” Internal Revenue Service, (p. 9), http://goo.gl/MtUCSp. 275 Langley, Jim et al. “G. Social Clubs - IRC 501(c)(7),” Internal Revenue Service, (p. 9), http://goo.gl/MtUCSp. 276 Langley, Jim et al. “G. Social Clubs - IRC 501(c)(7),” Internal Revenue Service, (p. 11), http://goo.gl/MtUCSp. 277 Langley, Jim et al. “G. Social Clubs - IRC 501(c)(7),” Internal Revenue Service, (p. 11), http://goo.gl/MtUCSp. 278 Langley, Jim et al. “G. Social Clubs - IRC 501(c)(7),” Internal Revenue Service, (p. 7), http://goo.gl/MtUCSp. 279 Image source: http://goo.gl/UxKrTm. 280 “Nonprofit Explorer,” ProPublica, http://goo.gl/usNMKJ. 281 Langley, Jim et al. “G. Social Clubs - IRC 501(c)(7),” Internal Revenue Service, (p. 1), http://goo.gl/MtUCSp. 282 Langley, Jim et al. “G. Social Clubs - IRC 501(c)(7),” Internal Revenue Service, (p. 1 - 2), http://goo.gl/MtUCSp. 283 IRC § 512(a)(3)(B), “26 U.S. Code § 512 Unrelated Business Taxable Income,” Cornell University Law School, http://goo.gl/3kWM03. 284 Langley, Jim et al. “G. Social Clubs - IRC 501(c)(7),” Internal Revenue Service, (p. 12), http://goo.gl/MtUCSp. 285 “Amenities,” Desert Mountain, http://goo.gl/IpFDZv. 286 This is one of the standards the IRS uses to determine whether the organization is a business operation or a club. Internal Revenue Manual 7.25.7.3, “Club as
Subterfuge,” IRS, February 23, 1999, http://1.usa.gov/1t2vnWN 287 “Membership Info,” Desert Mountain, http://goo.gl/4Iz22j, archived webpage snapshot from Jan. 6, 2014. 288 Hopkins, Bruce R., “The Law of Tax-Exempt Organizations,” 10th Edition, May 2011, (p. 4). 289 “Form 990, 2011 - Desert Mountain Club Inc,” Foundation Center, http://goo.gl/LcNhbk. 290 “The Grill Room,” Yale Club of New York City, http://bit.ly/1tgn2Oj, “Nonprofit Explorer,” ProPublica, http://goo.gl/LTzqbW. 291 “About the Club,” Harvard Club of New York City, http://goo.gl/712ICb, “Nonprofit Explorer,” ProPublica, http://bit.ly/1qTqRsJ. 292 Image source: “Ted & Liz The university Club Wedding, New York,” Shira Weinberger Photography, September 27 2010, http://goo.gl/tcKzbQ, “NonProfit Explorer,”
ProPublica, http://goo.gl/54VNk7. 293 Barnett, Sean M. et al. “IRC 501(c)(8) Fraternal Benefits Societies, and IRC (501)(c)(10) Domestic Fraternal Societies,” Internal Revenue Service, 2004, (p. 6), http://goo.
gl/GeKXSc. 294 “2013 Data Book,” IRS, September 30, 2013, Table 25, (p. 56), http://goo.gl/ZE04IY. 295 Political activity or “union-like” activity is not considered a fraternal activity. 296 Barnett, Sean M. et al. “IRC 501(c)(8) Fraternal Benefits Societies, and IRC (501)(c)(10) Domestic Fraternal Societies,” Internal Revenue Service, 2004, (p. 8), http://
goo.gl/GeKXSc. 297 Barnett, Sean M. et al. “IRC 501(c)(8) Fraternal Benefits Societies, and IRC (501)(c)(10) Domestic Fraternal Societies,” Internal Revenue Service, 2004, (p. 3 - 5), http://
goo.gl/GeKXSc. 298 “Tax Exempt Status for your Organization,” IRS, October 2013, (p. 51), http://goo.gl/zhtRcq. 299 “Our Financials,” Thrivent Financial, http://goo.gl/NpB2ID. 300 “Financial Products & Services,” Thrivent Financial, http://goo.gl/AS77st. 301 “Form 990, 2011 - Thrivent Financial for Lutherans,” Foundation Center, http://goo.gl/Mm0LbU. 302 “New Releases,” Thrivent Financial, June 6 2013, http://goo.gl/JsC5FV. 303 “Our Organization,” Thrivent Financial, http://goo.gl/Ep6X2w. 304 “Become a Member,” Thrivent Financial, http://goo.gl/tuNvqP. 305 “Mission, Vision, Values,” Thrivent Financial, http://goo.gl/jX3DN3. 306 “Volunteer Hours,” Thrivent Financial, http://goo.gl/PMMUSz. 307 “2012 Report to Members,” Thrivent Financial, (p. 6), http://goo.gl/zB3Wlf. 308 “2012 Annual Report,” Nationwide Insurance, http://goo.gl/ehEQZl. 309 “Providing Time and Talent to Nonprofit Organizations in Our Communities,” Nationwide, http://goo.gl/4ViF34, March 13, 2014 archived webpage snapshot. 310 “Fact and Figures,” Deloitte; http://bit.ly/1zseESt 311 “Deloitte Grows for Fourth Consecutive Year, Reporting US $32.4 Billion in Revenue,” Deloitte, September 16, 2013; http://bit.ly/1vmBv2B 312 Barnett, Sean M. and Ward L. Thomas, “IRC 501(c)(8) Fraternal Benefits Societies, and IRC (501)(c)(10) Domestic Fraternal Societies,” 2004 EO CPE text, page 8; http://1.
usa.gov/1xkVk94 313 Sean M. Barnett and Ward L. Thomas, “IRC 501(c)(8) Fraternal Benefits Societies, and IRC (501)(c)(10) Domestic Fraternal Societies,” 2004 EO CPE text; http://1.usa.
gov/1xkVk94, page 8. 314 Image source: http://bit.ly/1xML8Fy 315 “Activities,” Knights of Columbus; http://bit.ly/1xkV7D2 316 Form 990, 2011, Knights of Columbus, Foundation Center; http://bit.ly/1BKkp1q 317 “Knights of Columbus Insurance,” Knights of Columbus; http://bit.ly/1uESECC 318 “501(c)(8) - Fraternal beneficiary societies and associations,” NCCS, http://urbn.is/1wUnFPH (login may be required). 319 “501(c)(10) - Domestic fraternal societies and assoc’s,” NCCS, http://urbn.is/1zB021X (login may be required). 320 College fraternities are specifically excluded by regulation, however. Barnett, Sean M. et al. “IRC 501(c)(8) Fraternal Benefits Societies, and IRC (501)(c)(10) Domestic
Fraternal Societies,” Internal Revenue Service, 2004, (p. 15), http://goo.gl/EYVtvZ. 321 “Nonprofit Explorer,” ProPublica; http://goo.gl/ok602j. 322 “2013 Data Book,” IRS, September 30, 2013, Table 25, (p. 56), http://goo.gl/ZE04IY. 323 Barnett, Sean M. et al. “IRC 501(c)(8) Fraternal Benefits Societies, and IRC 501(c)(10) Domestic Fraternal Societies,” Internal Revenue Service, 2004, (p. 13), http://goo.
gl/EYVtvZ. 324 “Tax-Exempt Status for Your Organization,” Internal Revenue Service, October 2013, (p. 51), http://goo.gl/Bbi3ve. 325 Barnett, Sean M. et al. “IRC 501(c)(8) Fraternal Benefits Societies, and IRC 501(c)(10) Domestic Fraternal Societies,” 2004, (p. 15), Internal Revenue Service, http://goo.
gl/EYVtvZ. 326 Religious, charitable, scientific, literary, and educational purposes, etc. “Tax-Exempt Status for Your Organization,” Internal Revenue Service, October 2013, (p. 51),
http://goo.gl/v7pqsK. 327 Barnett, Sean M. et al. “IRC 501(c)(8) Fraternal Benefits Societies, and IRC 501(c)(10) Domestic Fraternal Societies,” Internal Revenue Service, 2004, (p. 15), http://goo.
gl/EYVtvZ. 328 “F. Selected Problems of Voluntary Employees’ Beneficiary Associations (VEBAs),” Internal Revenue Service, 1984, http://goo.gl/VWenbh. 329 “2013 Data Book,” IRS, September 30, 2013, Table 25, (p. 56), http://goo.gl/ZE04IY. 330 “Nonprofit Explorer,” ProPublica, http://goo.gl/Fz29Br. 331 Connolly, Daniel S., “VEBA: A Tax-Exempt Alternative for the Reimbursement of Health Care Costs,” CPER Journal, February 2006, http://goo.gl/mZC7dQ. 332 “Tax Expenditures: Compendium of Background Material on Individual Provisions,” CRS, December 2012, http://goo.gl/Bk1I0C. 333 “Tax Expenditures: Compendium of Background Material on Individual Provisions,” CRS, December 2012, http://goo.gl/Bk1I0C. 334 “Tax Expenditures: Compendium of Background Material on Individual Provisions,” CRS, December 2012, http://goo.gl/Bk1I0C. 335 Terlep, Sharon et al. “Pension Trusts Strapped,” Wall Street Journal, November 7 2011, http://goo.gl/HR74Zy. 336 “Tax Expenditures: Compendium of Background Material on Individual Provisions,” CRS, December 2012, http://goo.gl/Bk1I0C. 337 In 2007, the IRS warned against the practice of creating VEBA arrangements that primarily benefited company owners or other key employees and criticized certain
plans as being tax shelters. 338 Borzi, Phyllis C., “Retiree Health VEBAs: A New Twist on an Old Paradigm Implication for Retirees, Unions and Employers,” Kaiser Family Foundation, March 2009,
http://goo.gl/GfMOCh. 339 Form 990, UAW Retiree Medical Benefits Trust, Internal Revenue Service, 2012, http://goo.gl/b3in34. 340 Terlep, Sharon et al. “Pension Trusts Strapped,” Wall Street Journal, November 7 2011, http://goo.gl/HR74Zy. 341 “An introduction to VEBAs,” Wells Fargo, 2013, http://goo.gl/jRgczF. 342 Ross, Allen F., “Are VEBAs Worth Another Look?” Journal of Accountancy, May 1999, http://goo.gl/qFb6Ti. 343 John V. Koresko, Esq., CPA, “New VEBAs Help Businesses Fight Taxes and Preserve Wealth,” PennMont, 1998; http://bit.ly/1yPV2Fu, archived webpage snapshot
from September 22, 1999. 344 John V. Koresko, Esq., CPA, “New VEBAs Help Businesses Fight Taxes and Preserve Wealth,” PennMont, 1998; http://bit.ly/1yPV2Fu , archived webpage snapshot

294 | Tax Decoder Tax-Exempt Organizations | 295
from September 22, 1999. 345 Congress did leave an exception for what are called multi-player VEBAS when 10 or more merchants join a plan. John V. Koresko, Esq., CPA, “New VEBAs Help
Businesses Fight Taxes and Preserve Wealth,” PennMont, 1998; http://bit.ly/1yPV2Fu, archived webpage snapshot from September 22, 1999. 346 Sammons, Donna, “Vacation Breaks,” Inc., February 1, 1984, http://goo.gl/ywL9tU. 347 The structure pictured is not the condominium discussed in the article. 348 “Tax Expenditures: Compendium of Background Material on Individual Provisions,” CRS, December 2012, http://goo.gl/8icQpL. 349 “The Wyden-Coats Bipartisan Tax Fairness & Simplification Act of 2011,” Senator Ron Wyden, http://goo.gl/FqoG2W. 350 IRC § 501(c)(23), “26 U.S. Code § 501 Exemption From Tax on Corporations, Certain Trusts, etc.,” Cornell University Law School, http://goo.gl/SHgowZ. 351 “L. IRC 501(c)(15) - Small Insurance Companies or Associations,” Internal Revenue Service, 1989, (p. 1), http://goo.gl/Eg5nQd. 352 “2013 Data Book,” IRS, September 30, 2013, Table 25, (p. 56), http://goo.gl/ZE04IY. 353 “Nonprofit Explorer,” ProPublica, http://goo.gl/ATJuw1. 354 As small organizations, they generally have no public websites, although state examinations by insurance regulators can be found for some. 355 “Part 4. Examining Process Chapter 76. Exempt Organizations Examination Guidelines Section 23. Small Insurance Companies or Associations IRC Section 501(c)(15),”
Internal Revenue Service, http://goo.gl/BMYcAZ. 356 “Report of Examination of Mutual Fire Insurance Company of French Township,” State of Indiana, December 31 2008, http://goo.gl/Mcyrmc. 357 Information supplied by the IRS to the office of Senator Tom Coburn, September 19, 2014. 358 IRC § 501(c)(11), “26 U.S. Code § 501 Exemption From Tax on Corporations, Certain Trusts, etc.,” Cornell University Law School, http://bit.ly/1vrcmnd 359 IRC § 501(c)(16), “26 U.S. Code § 501 - Exemption from tax on corporations, certain trusts, etc.,” http://bit.ly/1vr1gho 360 IRC § 501(c)(18), “26 U.S. Code § 501 Exemption From Tax on Corporations, Certain Trusts, etc.,” Cornell University Law School, http://bit.ly/1HnAaeQ 361 Hopkins, Bruce R., The Law of Tax-Exempt Organizations, Tenth Edition, John Wiley & Sons, Inc., 2011, (p. 488) 362 Hopkins, Bruce R., The Law of Tax-Exempt Organizations, Tenth Edition, John Wiley & Sons, Inc., 2011, (p. 450). 363 “IRS Subsection Code 501 (c)(24),” NCCS, http://urbn.is/11DZDRl 364 Hopkins, Bruce R., The Law of Tax-Exempt Organizations, Tenth Edition, John Wiley & Sons, Inc., 2011, (p. 488). 365 Hopkins, Bruce R., The Law of Tax-Exempt Organizations, Tenth Edition, John Wiley & Sons, Inc., 2011, (p. 488). 366 “National Railroad Retirement Investment Trust NRRIT Introduction,” U.S. Railroad Retirement Board, April 1, 2010; http://1.usa.gov/1uTszPS, “U.S. Railroad Board:
An Agency Overview,” U.S. Railroad Retirement Board, January 2014; http://1.usa.gov/1vr19Cv 367 IRC § 501(c)(29), “26 U.S. Code § 501 - Exemption from tax on corporations, certain trusts, etc.,” Cornell University Law School, http://bit.ly/1F5v6cY 368 Hopkins, Bruce R., The Law of Tax-Exempt Organizations, Tenth Edition, John Wiley & Sons, Inc., 2011, (p. 478). 369 IRC § 401(a), “26 U.S. Code § 401 Qualified Pension, Profit Sharing, Stock Bonus Plans,” Cornell University Law School, http://goo.gl/xUA4BO. 370 “Report to The Congress on Fraternal Benefit Societies,” Department of the Treasury, January 1993; http://goo.gl/YJGjLE. 371 “Options to Improve Tax Compliance and Reform Tax Expenditures,” Joint Committee on Taxation, January 27 2005, http://goo.gl/kxCMpo. 372 Seto, Michael et al. “E. General Survey of I.R.C. 501(c)(12) Cooperatives And Examination Of Current Issues,” Internal Revenue Service, 2002, (p. 2), http://goo.gl/Y5yEf7. 373 “2013 Data Book,” IRS, September 30, 2013, Table 25, (p. 56), http://goo.gl/ZE04IY. 374 “Nonprofit Explorer,” ProPublica, http://goo.gl/4rXtdQ. 375 “Nonprofit Explorer,” ProPublica, http://goo.gl/zCWkOf. 376 “Nonprofit Explorer,” ProPublica, http://goo.gl/aH9p2J. 377 “Nonprofit Explorer,” ProPublica, http://goo.gl/V9y6tn. 378 “Tax Exempt Status for your Organization,” Internal Revenue Service, October 2013, (p. 53 - 55) http://goo.gl/P6aTyJ. 379 “Nonprofit Explorer,” ProPublica, http://goo.gl/INdFAz. 380 “Cedar Grove Cemetery & Mount Hebron Cemetery,” New York Cemetery Project, May 2 2011, http://goo.gl/Iq8qar. 381 Some states require cemeteries to be nonprofit corporations. “New Jersey Board Cemetery Laws,” New Jersey Department of Law & Public Safety, (p. 4), http://goo.
gl/WBhDhP. 382 “Not-For- Profit and For- Profit Cemeteries survey 2000,” AARP, 2000, http://goo.gl/JukzMQ. 383 “Tax Exempt Status for your Organization,” Internal Revenue Service, (p. 55 – 56), http://goo.gl/MhhvZ0. 384 “Part 7. Rulings and Agreements, Chapter 25. Exempt Organizations Determinations Manual, Section 13. Cemetery Companies,” Internal Revenue Service, http://
goo.gl/K0zj6R. 385 “2013 Data Book,” IRS, September 30, 2013, Table 25, (p. 56), http://goo.gl/ZE04IY. 386 “501(c)(13) - Cemetery companies, providing burial and incidental activities for members,” NCCS, http://urbn.is/1zB0mxr 387 Hopkins, Bruce R., “The Law of Tax-Exempt Organizations,” 10th Edition, May 2011, (p. 471). 388 “Death Care Industry,” AARP Public Policy Institute, (p. 1), http://goo.gl/g8huWt. 389 “Oklahoma Statute §8-8,” Oklahoma State Legislature http://goo.gl/QAkuhX. 390 “Death Care Industry,” AARP Public Policy Institute, (p. 7), http://goo.gl/g8huWt. 391 IRC § 501(c)(13), “26 U.S. Code § 501 Exemption From Tax on Corporations, Certain Trusts, etc.,” Cornell University Law School, http://goo.gl/f6E8Le. 392 “Tax Exempt Status for your Organization,” Internal Revenue Services, (p. 55), http://goo.gl/b2wUsp. 393 StoneMor stated in a 2011 Securities and Exchange Commission (SEC) filing that 21 different nonprofit cemeteries “provide us with management or operating fees that
approximate what we would earn if we owned those cemeteries and held them in for-profit entities.” The company also owns 253 cemeteries outright, as well as 69 funeral homes. “Form 10-K, Stonemor Partners L.P.,” SEC, December 31 2011, http://goo.gl/YXHfVH.
394 “Who We Are,” StoneMor Partners L.P., http://goo.gl/4nWtPz. 395 Nathan-Kazis, Josh, “Plenty of Money Made at ‘Not-For-Profit’ Cemetery,” The Jewish Daily Standard, December 11 2012, http://goo.gl/l3GqN0. 396 “Form 10-K, Stonemor Partners L.P.,” SEC, December 31 2011, http://goo.gl/YXHfVH. 397 Nathan-Kazis, Josh, “Plenty of Money Made at ‘Not-For-Profit’ Cemetery,” The Jewish Daily Standard, December 11 2012, http://goo.gl/l3GqN0. 398 “Tax Exempt Status for your Organization,” Internal Revenue Service, (p. 55-56), http://goo.gl/YglzPG. 399 “Tax Exempt Status for your Organization,” Internal Revenue Service, (p. 55), http://goo.gl/YglzPG. 400 “Tax Exempt Status for your Organization,” Internal Revenue Service, (p. 56), http://goo.gl/YglzPG. 401 Hopkins, Bruce R., “The Law of Tax-Exempt Organizations,” 10th Edition, May 2011, (p. 472). 402 IRC § 642(i), “26 U.S. Code § 642 Special Rules for Credits and Deductions,” http://bit.ly/1F5xyAf 403 They may wish to organize under six other sections, depending on their activities. “Tax Guide, Veterans’ Organizations,” Internal Revenue Service, http://goo.gl/
QM4Xlz. 404 “2013 Data Book,” IRS, September 30, 2013, Table 25, (p. 56), http://goo.gl/ZE04IY. 405 “501(c)(19) - Post or organization of war veterans,” NCCS, http://urbn.is/1AechVa 406 “Tax Guide, Veterans’ Organizations,” Internal Revenue Service, http://goo.gl/52Ig4R. 407 “Tax Exempt Status for your Organization,” Internal Revenue Service, (p. 56), http://goo.gl/IwdlsO. 408 “Tax Guide, Veterans’ Organizations,” Internal Revenue Service, http://goo.gl/52Ig4R. 409 “Tax Exempt Status for your Organization,” Internal Revenue Service, (p. 56), http://goo.gl/IwdlsO. 410 “Tax Guide, Veterans’ Organizations,” Internal Revenue Service, (p. 9), http://goo.gl/52Ig4R. 411 “Tax Exempt Status for your Organization,” Internal Revenue Service, (p. 57), http://goo.gl/1hmuW5. 412 “Tax Guide, Veterans’ Organizations,” Internal Revenue Service, (p. 9), http://goo.gl/LmH4Fy. 413 “Tax Guide, Veterans’ Organizations,” Internal Revenue Service, (p. 9), http://goo.gl/LmH4Fy. 414 “Tax Guide, Veterans’ Organizations,” Internal Revenue Service, (p. 9 - 10), http://goo.gl/LmH4Fy. 415 “Tax Guide, Veterans’ Organizations,” Internal Revenue Service, http://goo.gl/LmH4Fy. 416 “Tax Exempt Status for your Organization,” Internal Revenue Service, (p. 57), http://goo.gl/1hmuW5. 417 IRC § 501(c)(23), “26 U.S. Code § 501 Exemption From Tax on Corporations, Certain Trusts, etc.,” Cornell University Law School, http://goo.gl/SHgowZ. 418 “501(c)(23) - Veterans association formed prior to 1880,” NCCS, http://urbn.is/1F0jnN5 419 Maner, Oliver, “501(c)(2) Title Holding Companies,” Oliver Maner LLP, http://goo.gl/AYQhHX. 420 “Tax Exempt Status for your Organization,” Internal Revenue Service, (p. 58), http://goo.gl/JQk2BC. 421 “C. IRC 501(c)(2) – Title Holding Corporations,” Internal Revenue Service, 1986, http://goo.gl/hfMtLd. 422 “C. IRC 501(c)(2) – Title Holding Corporations,” Internal Revenue Service, 1986, (p. 1), http://goo.gl/hfMtLd. 423 Ward, Thomas L. et al. “C. IRC 501(c)(25)(E) – Qualified Subsidiaries,” Internal Revenue Service, 1986, (p. 2), http://goo.gl/ky9nEu. 424 “2013 Data Book,” IRS, September 30, 2013, Table 25, (p. 56), http://goo.gl/ZE04IY.

DRAFT
296 | Tax Decoder
425 “Nonprofit Explorer,” ProPublica, http://bit.ly/1zAs5yv 426 Form 990, 2012, Beta Equities, Inc., Foundation Center, http://bit.ly/1Aedkof 427 Form 990, 2012, Sanctuary Park Realty Holding Company, http://bit.ly/1xTEjmy 428 “Insurance- Service Contractor,” Sanctuary Park; http://bit.ly/1HgtbVe 429 Form 990, 2012, Sanctuary Park Realty Holding Company, (p. 2), http://bit.ly/1xTEjmy 430 Form 990, 2012, AT Industrial Owner Acquisition, LLC, http://bit.ly/1xkYREk 431 “Part 7. Rulings and Agreements Chapter 25. Exempt Organizations Determinations Manual Section 2. Single Parent Title Holding Corporations,” Internal Revenue
Service, http://goo.gl/xyWr9c. 432 “C. IRC 501(c)(2) – Title Holding Corporations,” Internal Revenue Service, 1986, http://goo.gl/hfMtLd. 433 Ward, Thomas L. et al. “C. IRC 501(c)(25)(E) – Qualified Subsidiaries,” Internal Revenue Service, 1995, (p. 3), http://goo.gl/ky9nEu. 434 “Part 7. Rulings and Agreements Chapter 25. Exempt Organizations Determinations Manual Section 2. Single Parent Title Holding Corporations,” Internal Revenue
Service, http://goo.gl/xyWr9c. 435 “Part 7. Rulings and Agreements Chapter 25. Exempt Organizations Determinations Manual Section 2. Single Parent Title Holding Corporations,” Internal Revenue
Service, http://goo.gl/xyWr9c. 436 “Tax Exempt Status for your Organization,” Internal Revenue Service, (p. 58), http://goo.gl/lvf054. 437 “2013 Data Book,” IRS, September 30, 2013, Table 25, (p. 56), http://goo.gl/ZE04IY. 438 IRC § 501(e), “26 U.S. Code § 501 Exemption From Tax on Corporations, Certain Trusts, etc.,” Cornell University Law School, http://goo.gl/6XaSm5. 439 Publicly registered groups include St. Vincent’s Medical Center, Inc., New England Life Care, Inc., and Lee Memorial Hospital, Inc. “Cooperative Hospital Service
Organization - 501(e),” NCCS, http://urbn.is/1EWVZy4 (may require login to display properly). 440 Hopkins, Bruce R., “The Law of Tax-Exempt Organizations,” 10th Edition, May 2011, (p. 301). 441 “About Us,” Common Fund, http://goo.gl/fpQpN5. 442 “Charitable Risk Pool,” NCCS, http://urbn.is/1EWWF6l (may require login to display properly). 443 “About ANI,” ANI, http://goo.gl/nqtQow. 444 Reilly, John Francis et al. “Political Campaign and Lobbying Activities of IRC 501(c)(4), (c)(5), and (c)(6) Organizations,” Internal Revenue Service, 2003, (p. v), http://
goo.gl/bWvq2y. 445 IRC § 162(e)(3), “26 U.S. Code § 162 Trade or Business Expenses,” Cornell University Law School, http://goo.gl/9HhdLO. 446 “1. Deducting Business Expenses,” Internal Revenue Service, http://goo.gl/Nf69oJ. 447 Reilly, John Francis et al. “Political Campaign and Lobbying Activities of IRC 501(c)(4), (c)(5), and (c)(6) Organizations,” Internal Revenue Service, 2003, http://goo.gl/
bWvq2y. 448 Reilly, John Francis et al. “Political Campaign and Lobbying Activities of IRC 501(c)(4), (c)(5), and (c)(6) Organizations,” Internal Revenue Service, 2003, http://goo.
gl/bWvq2y. 449 Reilly, John Francis et al. “Political Campaign and Lobbying Activities of IRC 501(c)(4), (c)(5), and (c)(6) Organizations,” Internal Revenue Service, 2003, (p. L - 22),
http://goo.gl/bWvq2y. 450 IRC § 6033(e), “26 U.S. Code § 6033 Returns by Exempt Organizations,” Cornell University Law School, http://goo.gl/fWHTms. 451 IRC § 6033(e), “26 U.S. Code § 6033 Returns by Exempt Organizations,” Cornell University Law School, http://goo.gl/fWHTms. 452 Reilly, John Francis et al. “Political Campaign and Lobbying Activities of IRC 501(c)(4), (c)(5), and (c)(6) Organizations,” Internal Revenue Service, 2003, (p. L-22 – L-23),
http://goo.gl/bWvq2y. 453 Reilly, John Francis et al. “Political Campaign and Lobbying Activities of IRC 501(c)(4), (c)(5), and (c)(6) Organizations,” Internal Revenue Service, 2003, (p. L - 20),
http://goo.gl/bWvq2y. 454 IRC § 511, § 512, and § 513, “26 U.S. Code Part III - Taxation of Business Income of Certain Exempt Organizations,” Cornell University Law School, http://goo.gl/j0pBj4. 455 “Trade or Business Defined,” Internal Revenue Service, http://goo.gl/9IWzAd. 456 “Regularly Carried On,” Internal Revenue Service, http://goo.gl/XflcWu. 457 “Unrelated Business Income Defined,” Internal Revenue Service, http://goo.gl/Y1MGJ9. 458 including 501(c)(5) labor organizations, 501(c)(7) social clubs, 501(c)(8) fraternal societies, 501(c)(9) employee associations, 501(c)(13) cemetery companies, 501(c)(19)
veteran’s organizations, and a myriad of smaller organizations 459 26 CFR 1.501(c)(6)-1, “Business leagues, chambers of commerce, real estate boards, and boards of trade,” Cornell University Law School, http://goo.gl/8IRAsM. 460 See chart at the beginning of this chapter. 461 “Special UBIT Rules for Organizations Under Code Section 501(c)(7); (c)(9); (c)(17); and (c)(20),” Internal Revenue Service, http://goo.gl/zG9Gz9. 462 IRC § 527, “26 U.S. Code § 527 Political Organizations,” Cornell University Law School, http://goo.gl/eE80zr.

296 | Tax Decoder Transportation | 297
TRANSPORTATION

DRAFT
298 | Tax Decoder
Transportation
The beneficiaries of federal transportation tax breaks are a disparate group, ranging from short-line railroads to commuters to shipbuilders. As with much of the tax code, there does not appear to be any coherent national transportation policy underlying these tax expenditures. Each has developed independently to benefit a narrow set of
recipients, and some have long since become outdated. The handful of transportation projects that happen to receive these tax breaks no doubt benefit from them. However, any
number of other transportation projects could stand to benefit from lower taxes. If short-line railroads get a tax break, why not barge shipping companies? And if shipbuilders get a break, why not rail car builders? And why should only those commuters who are lucky enough to receive transportation subsidies from their employers also receive tax subsidies from the federal government?
It is difficult to justify providing special treatment to a few select industries that happened to catch the attention of Congress. A far better approach would be to eliminate all such provisions as part of the effort of lowering tax rates for all taxpayers.
Maintaining Railroad Track Tax Credit In 2004, Congress passed legislation to temporarily offer a tax credit to certain railroad companies for railroad track
maintenance expenses incurred in 2005, 2006, and 2007. The purpose of this credit was to encourage the rehabilitation, rather than the abandonment, of short-line railroads. Qualified railroad track maintenance expenditures were eligible for a 50-percent business tax credit, limited to $3,500 multiplied by the number of miles of railroad track owned by an eligible taxpayer.1
The Congressional Research Service, discussing why the supporters of this policy sought to include it in the tax code, wrote, “There is also some indication that a tax credit was thought to be more likely to be achieved than grants.”2
Cost & Current Status
Congress has extended this temporary provision on multiple occasions. While the credit expired at the end of 2011, it was retroactively extended to cover both 2012 and 2013 in January 2013.3 Extension of the provision was included in the Senate’s 2014 extenders legislation, the EXPIRE Act of 2014. Extending the credit will cost $72 million in 2014 and $900 million from FY 2014 through FY 2018.4
Evaluating the Maintaining Railroad Tracks Tax Credit
This tax credit substitutes the judgment of Congress for that of the market by favoring certain modes of transportation, such as short-line railroad, over other transportation methods. If improving a rail line will lower
operating costs for a railroad, this should provide an ample incentive for the railroad to pay for these improvements.
As the Congressional Research Service (CRS) finds, “In general, special subsidies to industries and activities tend to lead to inefficient investment allocation since in a competitive economy businesses should earn enough to maintain their capital.”5
Recommendations & Options for Reform
Any government involvement in rail transportation should come through local citizens who are concerned with the economic well-being of their community and elect to pay their state or local taxes to fund specific capital improvements. Eliminating this tax credit would enable more efficient allocation of private funds to address transportation needs and result in savings to taxpayers.
Transportation (in millions) FY 2014 FY 2014 - FY 2018Maintaining Railroad Track Tax Credit $72 $900
Exclusion of Employer-Paid and Employer-Provided Transportation Benefits
$4,900 $26,300
Deferral of Tax on Capital Construction funds of Shipping Companies
$100 $500
Total $5,072 $27,700

298 | Tax Decoder Transportation | 299
CONGRESS SHOULD PERMANENTLY EQUALIZE COMMUTER BENEFITS BY ELIMINATING THE SUBSIDIES FROM THE TAX CODE. CONGRESS
CONTINUES TO DISTORT THE ECONOMY BY DIRECTING CAPITAL BASED ON POLITICAL PREFERENCES.
Exclusion of Employer-Paid and Employer-Provided Transportation Benefits
Businesses can currently provide their employees up to a $240 per month in monthly tax-free benefits to commute to work via transit, vanpool, or to park their vehicle at work.6
According to the Congressional Research Service,
“Some transportation benefits employers provide employees are tax exempt within certain limits. Qualified transportation benefits may include transit passes, vanpool transportation, parking, and bicycle purchase and maintenance costs. The value of transit passes or parking costs provided directly by the employer can be excluded from employees’ income, subject to a monthly limit.”7
In recent years Congress has increased the subsidy for the transit portion of this tax expenditure. Under the American Recovery and Reinvestment Act of 2009, the monthly pre-tax transit reimbursement benefit cap was raised from $120 to $230, which equaled the amount available for commuter parking benefits. The transit benefits provision was extended under the Tax Relief and Job Creation Act of 2011, but expired at the end of 2011. As a result, the transit benefit cap was reduced to $125 in 2012.8
In January 2013, however, Congress retroactively increased the transit tax benefit to equal the amount available for employee parking benefits in both 2012 and 2013.9 This extension alone was estimated to cost taxpayers $220 million over ten years.10
These transit tax perks are expected to cost taxpayers $4.9 bil-lion in fiscal year 2014, and more than $26.3 billion over five years.11
Evaluating the Exclusion of Employer-paid and Employer-Provided Transportation Benefits
According to the Congressional Research Service, “The exclusion subsidizes employment in those businesses and industries located where transportation fringe benefits are feasible and commonly used. Businesses and workers located where mass transportation alternatives are lacking gain little benefit from this provision.”12
While employers and employees alike enjoy having their travel subsidized by others, such programs are not national priorities.
Recommendation
Congress should permanently equalize commuter benefits by eliminating the subsidies from the tax code. Congress continues to distort the economy by directing capital based on political preferences, whether it is through government programs or deductions, exclusions, credits, and deferrals in the tax code.

DRAFT
300 | Tax Decoder
Deferral of Tax on Capital Construction Funds of Shipping Companies
Congress created this tax expenditure to support ship ownership and leasing by U.S. operators of trade vessels. Since 1936, the U.S. has offered tax subsidies of various types for shipbuilding to ensure an adequate supply of shipping in the event of war. The Merchant Marine Act of 1970 greatly expanded the subsidies, and the Tax Reform Act of 1986 incorporated the deferral provisions directly into the Internal Revenue Code.13
Under this policy, companies can establish a Capital Construction Fund (CCF), and make tax-free deposits into the account. According to the U.S. Department of Transportation Maritime Administration, the Capital Construction Fund (CCF) program was created to assist owners and operators of United States-flag vessels in accumulating the large amounts of capital necessary for the modernization and expansion of the U.S. merchant marine. The program encourages construction, reconstruction, or acquisition of vessels through the deferment of federal income taxes on certain deposits of money or other property placed into a CCF.14
As a result of this corporate tax perk, total revenue loss is expected to be $100 million in 2014 and $500 million over the next five years.15
Evaluating the Deferral of Tax on Capital Construction Funds of Shipping Companies
The Congressional Research Service (CRS) discussed how tax subsidies of this kind would normally misallocate resources into less efficient uses, but in practice, it appears this provision has little effect on U.S. commercial shipbuilding. The provision is, however, likely to benefit higher-income individuals who are the owners of the capital.16
The original justification for the provision was to ensure an adequate supply of shipping during wartime. CRS, however, notes
this justification may be in doubt today, since U.S. firms control many vessels registered under a foreign flag and many U.S. allies control a substantial shipping fleet and have substantial ship-building capability that might be available to the U.S.17
Supporters of this tax expenditure might also argue the provision is needed to offset foreign subsidies or other U.S. tax provisions. The CRS analysis, however, points out that creating one distortion in the tax code, however, is not the way to counter another distortion. Instead, Congress should eliminate the problems in the other areas of the tax code.18
Congress should eliminate this out-of-date tax subsidy.

300 | Tax Decoder Transportation | 301
1 “Tax Expenditures Compendium of Background Material on Individual Provisions,” Committee on the Budget United States Senate, prepared by the Congressional Research Service, December 2012, page: 565. 6
2 “Tax Expenditures Compendium of Background Material on Individual Provisions,” Committee on the Budget United States Senate, prepared by the Congressional Research Service, December 2012, page: 566.
3“Estimate of Federal Tax Expenditures for Fiscal Years 2012-2017,” prepared for the House Committee on Ways and Means and the Senate Committee on Finance by the staff of the Joint Committee on Taxation, February 1, 2013, page 17.
4 “Tab 7: Effects of Extending Tax Provisions Scheduled to Expire Before 2024,” Individual Income Tax Receipts and the Individual Tax Base - February 2014 Baseline, Congressional Budget Office, February 4 2014, http://goo.gl/qAk09p.
5 “Tax Expenditures Compendium of Background Material on Individual Provisions,” Committee on the Budget United States Senate, prepared by the Congressional Research Service, December 2012, page: 567.
6 Estimate of Federal Tax Expenditures for Fiscal Years 2012-2017,” prepared for the House Committee on Ways and Means and the Senate Committee on Finance by the staff of the Joint Committee on Taxation, February 1, 2013, page 18.
7 “Tax Expenditures Compendium of Background Material on Individual Provisions,” Committee on the Budget United States Senate, prepared by the Congressional Research Service, December 2012, page: 573.
8 “Tax Expenditures Compendium of Background Material on Individual Provisions,” Committee on the Budget United States Senate, prepared by the Congressional Research Service, December 2012, page: 574.
9 Estimate of Federal Tax Expenditures for Fiscal Years 2012-2017,” prepared for the House Committee on Ways and Means and the Senate Committee on Finance by the staff of the Joint Committee on Taxation, February 1, 2013, page 18.
10 The United States Senate Committee on Finance Website, Summary of American Taxpayer Relief Act as Passed, http://goo.gl/3zO2s3 11 “Estimate of Federal Tax Expenditures for Fiscal Years 2014-2018,” JCX-97-14, prepared for the House Committee on Ways and Means and the Senate Committee on
Finance by the staff of the Joint Committee on Taxation, August 5, 2014. 12 “Tax Expenditures Compendium of Background Material on Individual Provisions,” Committee on the Budget United States Senate, prepared by the Congressional
Research Service, December 2012, page: 573 13 “Tax Expenditures Compendium of Background Material on Individual Provisions,” Committee on the Budget United States Senate, prepared by the Congressional
Research Service, December 2012, pages: 569-571. 14“Capital Construction Fund,” U.S. Department of Transportation Maritime Administration, http://goo.gl/kxObjA 15 Estimate of Federal Tax Expenditures for Fiscal Years 2014-2018,” JCX-97-14, prepared for the House Committee on Ways and Means and the Senate Committee on
Finance by the staff of the Joint Committee on Taxation, August 5, 2014. 16 “Tax Expenditures Compendium of Background Material on Individual Provisions,” Committee on the Budget United States Senate, prepared by the Congressional
Research Service, December 2012, pages: 569-571. 17 “Tax Expenditures Compendium of Background Material on Individual Provisions,” Committee on the Budget United States Senate, prepared by the Congressional
Research Service, December 2012, pages: 569-571. 18 “Tax Expenditures Compendium of Background Material on Individual Provisions,” Committee on the Budget United States Senate, prepared by the Congressional
Research Service, December 2012, pages: 569-571.

DRAFT
302 | Tax Decoder
OTHER TAXPROVISIONS

302 | Tax Decoder Other Tax Provisions | 303
The Consumer Price Index
From the tax code to Social Security, the benefits provided through many federal programs are adjusted each year to account for inflation. The measure currently used to calculate these automatic increases, the Consumer Price Index (CPI), is considered by many to be outdated. Using the CPI leads to higher increases in federal spending
than are actually justified.1
This report supports the proposal of President Obama’s National Commission on Fiscal Responsibility and Reform, which recommended applying a more accurate measure of inflation, chain-weighted Consumer Price Index (Chained CPI), to all government programs currently tied to CPI.2
Applying Chained CPI to the tax code would increase revenue by $1 billion in FY 2014 and $30 billion from FY 2014 through FY 2018. This policy results in exponential savings, however, in the long-run. In just the first ten years, it is esti-mated to increase revenue by $140 billion.3
While the focus of this report is changes to the tax code, any transition to the use of chained CPI should be simulta-neously applied to all government programs and benefits currently measured by CPI.
Chained CPI & the Tax Code
From the size of the standard deduction to thresholds for income bracket to most income exemption levels, many provisions throughout the tax code are automatically adjusted for inflation each year using the consumer price index.4
For more than 15 years, budget experts have agreed the current CPI mechanism outpaces actual inflationary growth. This causes the cost of government programs to rise more rapidly than appropriate, unnecessarily adding to the deficit.5 According to CBO Director Doug Elmendorf:
…the CPI overstates increases in the cost of living because it does not fully account for the fact that consumers generally adjust their spending patterns as some prices change relative to other prices6
The Bureau of Labor Statistics developed a more accurate measure of inflation. Known as Chained CPI, over the last ten years it has grown at a slightly slower rate—an average of 0.3 percentage points each year—than the current measure for CPI.7 As a more accurate measure of inflation, it is only appropriate that it be applied government-wide, including throughout the tax code. In its Budget Options, the Congressional Budget Office explains,
Indexing allows those tax parameters to grow over time in nominal terms but keeps them relatively stable in real (inflation-adjusted terms). …Indexing with that lower measure would increase the amount of income subject to taxation over time and thus result in higher tax revenues.8
This benefit increase is on autopilot every year, without any review or adjustment from Congress. It is essential this automatic spending increase be as accurate and conservative as possible, in order to avoid runaway costs that simply cannot be controlled.
As the Washington Post editorial board points out in their support of a government-wide transition to Chained CPI, academics and economists across the political spectrum agree this is an area of government spending and automatic growth that can and should be addressed. The Post writes,
Among the organizations that have endorsed a switch to the Chained CPI are the president’s fiscal responsibility commission (better known as Simpson-Bowles), the Bipartisan Policy Center’s Deficit Reduction Task Force, the conservative Heritage Foundation and the liberal Center for American Progress.9
Other Tax Provisions (in millions) FY 2014 FY 2014 - FY 2018Chained-CPI $1,000 $30,000
State & Local Tax Deduction $56,600 $328,200
Total $57,600 $358,200

DRAFT
304 | Tax Decoder
State and Local Tax Deduction At an annual cost of more than $56 billion in lost revenue, the state and local tax deduction is one of the most expensive
expenditures in the tax code today.10 Almost half of this lost revenue is being claimed as a tax break the top five percent wealthiest residents, largely concentrated in certain regions of the country.11 As a result, there is much debate as to the appropriateness of this tax deduction.
The state and local tax deduction has long been a provision of the Internal Revenue Code. However, Congress eliminated the sales tax deductibility portion of it in 1986, but reinstated it in 2004, as part of the annual tax extenders legislation.12
U.S. Code Title 26 § 164 allows taxpayers to deduct their state and local income, sales, and property taxes as itemized deductions. According to the law, taxpayers must elect to deduct either the state and local (S&L) income or sales taxes, but state and local property taxes may always be deducted.13
The option to deduct sales taxes expired at the end of 2013, but a two-year extension was included in the EXPIRE Act.14
As the seventh-largest tax expenditure, the S&L tax deduc-tion has a substantial effect on annual federal revenue.15 Com-bined with the extenders sales tax portion, the S&L deduction will account for a $56.6 billion reduction in revenue in FY 2014 and cost $328.2 billion from FY 2014 through FY 2018.16 Of this amount, the extension of the sales tax provision, included in the annual extenders legislation, accounts for $75 million in FY 2014 and $11.8 billion from FY 2014 through FY 2018.17
The federal government must borrow these amounts with interest, which further adds to the national debt.
The significant benefit derived from deducting state and local taxes heavily favors the wealthy. The Congressional Budget Office estimated the top twenty percent of income earners receives 80 percent of the deduction’s value.18 Similarly, the top one percent of the population reaps three-tenths of the value of the deduction.19 The top one percent experienced a 2.2 percent increase in after-tax income as a result of the deduction, whereas the average taxpayer only saw a 0.8 percent increase.20 In effect, the S&L tax deduction reduces the intended progressivity of the tax code by providing exclusive opportunities to those in the highest tax brackets.
This uneven distribution exists for multiple reasons. First, taxpayers only use itemized tax deductions if their combined itemized expenditures exceed their total standard deduction. For example, in Tax Year 2013, a couple must have claimed at least $13,400 in combined itemized expenditures, including S&L taxes, in order to qualify for itemization. As a result, only 27 percent of taxpayers claim the S&L tax deduction.21
Not only does the S&L tax deduction discriminate against those in lower tax brackets, but the provision is also biased towards assisting states with higher income tax rates. This is demonstrated by the fact that the benefit of the S&L tax deduction is positively linked to the marginal increase in the state income tax rate. For example, if a taxpayer lives in California and is subject to a state income tax rate of 9 percent, he will receive a larger benefit than another taxpayer who lives in Florida and is not subject to any state income tax.
Since the S&L tax deduction favors states with higher state income tax rates, it perversely discourages states from lowering their income tax rates. The deduction reduces the marginal benefit of lower tax rates and comparably encourages people to remain in otherwise unbearably high-tax jurisdictions. For example, Washington D.C.’s tax rate range, which consists of four rates between 4 and nearly 9 percent, is more tolerable when Washingtonians can deduct a portion of their tax bill on their federal tax return, reducing the incentive to move elsewhere.
The disproportionate benefit provided to certain states is apparent in the tax deduction’s distribution. Over sixty percent of the deducted amount and half of the beneficiaries who were individual taxpayers came from just ten states.22 The Tax Policy Center wrote,
In 2005, taxpayers in California and New York together made up 20 percent of those claiming the deduction and accounted for 30 percent of its value. Itemizers in New York, New Jersey, Connecticut, and California (listed in descending order of the average deduction) claimed on average over $12,000 per household, well above the national average deduction of $8,764 per household.23
Proponents of the provision contend certain states need federal assistance to deal with their fiscal problems. Others in favor of the deduction argue it is necessary to reduce dou-ble taxation.24 Opponents counter that direct aid to states through a federal spending program would be a more target-ed way to provide assistance, preventing high-tax jurisdic-tions and wealthier individuals from benefiting dispropor-tionately. In addition, opponents point out the difficulty of measuring the true expense of the S&L tax deduction com-pared to direct assistance.
Opponents of the S&L tax deduction, such as the Cato In-stitute, suggest an elimination of the tax expenditure would yield increased competition between states and their income tax schemes because the rate differences would become more distinct. Realizing this, President Ronald Reagan stated, “Per-haps if the high-tax states didn’t have this federal crutch to prop up their big spending, they might have to cut taxes to stay competitive.”25 Were the S&L deduction to be eliminated, taxpayers, individuals, and businesses alike would be more acutely sensitive to differing state tax rates, which could pres-

304 | Tax Decoder Other Tax Provisions | 305
1 Goldwein, Marc, Peuquet, Jason, and Rosenberg, Adam, Moment of Truth Project, “Measuring Up: The Case for Chained CPI,” March 19, 2013, p. 2, http://goo.gl/Neq2fa. 2 National Commission on Fiscal Responsibility and Reform, “Moment of Truth, Report of the National Commission on Fiscal Responsibility and Reform,” December 1,
2010, p. 51, http://goo.gl/9eeFrD. 3 “Options for Reducing the Deficit: 2014 to 2023,” Congressional Budget Office, Revenues—Option 4, November 13, 2013, http://www.cbo.gov/budget-options/2013/44797. 4 Congressional Budget Office, “Budget Options 2007,” Revenue Option 6, p. 266, http://goo.gl/ffRvTf. 5 Goldwein, Marc, Peuquet, Jason, and Rosenberg, Adam, Moment of Truth Project, “Measuring Up: The Case for Chained CPI,” March 19, 2013, p. 3, http://goo.gl/Neq2fa. 6 Congressional Budget Office, Director’s Blog, “Using a Different Measure of Inflation for Indexing Federal Programs and the Tax Code,” accessed July 5, 2011, p. 1, http://
goo.gl/Pnsllb. 7 Congressional Budget Office, Director’s Blog, “Using a Different Measure of Inflation for Indexing Federal Programs and the Tax Code,” accessed July 5, 2011, p. 1, http://
goo.gl/Pnsllb. 8 Congressional Budget Office, “Budget Options 2007,” Revenue Option 6, p. 266 http://goo.gl/ffRvTf. 9 Editorial, “The Chained CPI, an easy way to save money,” The Washington Post, May 26, 2011, http://goo.gl/g36fQ9. 10 “Estimates of Federal Tax Expenditures for Fiscal Years 2014-2018,” Joint Committee on Taxation, August 5, 2014, https://www.jct.gov/publications.
html?func=startdown&id=4663 http://crfb.org/blogs/tax-break-down-state-and-local-tax-deduction 11 Congressional Budget Office, “The Distribution of Major Tax Expenditures in the Individual Income Tax System,” May 2013, http://www.cbo.gov/sites/default/files/
cbofiles/attachments/43768_DistributionTaxExpenditures.pdf 12 Tax Policy Center. “State and Local Tax Policy: How Does the Deduction for State and Local Taxes Work.” Urban Institute and Brookings Institution. April 2, 2008,
http://www.taxpolicycenter.org/briefing-book/state-local/fiscal/deduction.cfm 13 “26 U.S. Code §164.” Legal Information Institute. http://www.law.cornell.edu/uscode/text/26/162. 14 “Estimated Budget Effects of an Amendment in the Nature of a Substitute to H.R. 3474, the ‘Expiring Provisions Improvement, Reform, and Efficiency (‘EXPIRE’) Act
of 2014,’ Scheduled for Consideration by the Senate, ” Joint Committee on Taxation, May 15, 2014, https://www.jct.gov/publications.html?func=startdown&id=4601 15 The Committee for a Responsible Federal Budget, “The Tax Break-Down: The State and Local Tax Deduction.” August 20, 2013, http://crfb.org/blogs/tax-break-down-
state-and-local-tax-deduction 16 “Estimates of Federal Tax Expenditures for Fiscal Years 2014-2018,” Joint Committee on Taxation, August 5, 2014, https://www.jct.gov/publications.
html?func=startdown&id=4663. AND “Individual Income Tax Receipts and the Individual Tax Base—February 2014 Baseline,” Tab 7: Effects of Extending Tax Provisions Scheduled to Expire Before 2024, Congressional Budget Office, February 4, 2014, http://www.cbo.gov/publication/45065
17 Individual Income Tax Receipts and the Individual Tax Base—February 2014 Baseline,” Tab 7: Effects of Extending Tax Provisions Scheduled to Expire Before 2024, Congressional Budget Office, February 4, 2014, http://www.cbo.gov/publication/45065
18 The Committee for a Responsible Federal Budget, “The Tax Break-Down: The State and Local Tax Deduction.” August 20, 2013, http://crfb.org/blogs/tax-break-down-state-and-local-tax-deduction
19 The Committee for a Responsible Federal Budget, “The Tax Break-Down: The State and Local Tax Deduction.” August 20, 2013, http://crfb.org/blogs/tax-break-down-state-and-local-tax-deduction
20 The Committee for a Responsible Federal Budget, “The Tax Break-Down: The State and Local Tax Deduction.” August 20, 2013, http://crfb.org/blogs/tax-break-down-state-and-local-tax-deduction
21 The Committee for a Responsible Federal Budget, “The Tax Break-Down: The State and Local Tax Deduction.” August 20, 2013, http://crfb.org/blogs/tax-break-down-state-and-local-tax-deduction
22 The Committee for a Responsible Federal Budget, “The Tax Break-Down: The State and Local Tax Deduction.” August 20, 2013, http://crfb.org/blogs/tax-break-down-state-and-local-tax-deduction
23 Tax Policy Center. “State and Local Tax Policy: How Does the Deduction for State and Local Taxes Work.” Urban Institute and Brookings Institution. April 2, 2008, http://www.taxpolicycenter.org/briefing-book/state-local/fiscal/deduction.cfm
24 Tax Policy Center. “State and Local Tax Policy: How Does the Deduction for State and Local Taxes Work.” Urban Institute and Brookings Institution. April 2, 2008. http://www.taxpolicycenter.org/briefing-book/state-local/fiscal/deduction.cfm
25 Edwards, Chris. “Options for Tax Reform.” Policy Analysis. No. 536. Cato Institute. February 24, 2005. http://object.cato.org/sites/cato.org/files/pubs/pdf/pa536.pdf 26 Edwards, Chris. “Options for Tax Reform.” Policy Analysis. No. 536. Cato Institute. February 24, 2005. http://object.cato.org/sites/cato.org/files/pubs/pdf/pa536.pdf 27 The Committee for a Responsible Federal Budget, “The Tax Break-Down: The State and Local Tax Deduction.” August 20, 2013.http://crfb.org/blogs/tax-break-down-
state-and-local-tax-deduction 28 The Committee for a Responsible Federal Budget, “The Tax Break-Down: The State and Local Tax Deduction.” August 20, 2013.http://crfb.org/blogs/tax-break-down-
state-and-local-tax-deduction 29 “National Commission on Fiscal Responsibility and Reform, “Moment of Truth, Report of the National Commission on Fiscal Responsibility and Reform,” December
1, 2010, http://www.fiscalcommission.gov/news/moment-truth-report-national-commission-fiscal-responsibility-and-reform
sure state governments to offer more competitive tax rates.26
Some critics recommend the elimination of the deduction altogether without replacing it with other financial assistance. However, eliminating it could also be coupled with a simultaneous reduction in income tax rates
Based on CBO’s numbers, this amount of revenue could be sufficient to reduce all individual taxes by about 5 percent (which translates into 2 points for the top rate) or reduce each rate uniformly by about 1.5 points,
according to the nonpartisan Committee on a Responsible Federal Budget.27
The President’s National Commission on Fiscal Responsibility and Reform, as well as the tax reform proposal introduced by House Ways and Means Chairman Dave Camp recommended an elimination of the S&L tax deduction.28, 29
While this report does not recommend retaining or eliminating the deduction, as one of the largest expenditures, it must be included in the discussion of comprehensive tax reform. Congress should continue to study both the expense and effects of the S&L tax deduction as it works to streamline the code and bring down rates.

DRAFT
306 | Tax Decoder
APPENDIX

306 | Tax Decoder Appendix | 307
Agriculture (in millions) FY 2014 FY 2014 - FY 2018
Expensing of Certain Capital Outlays $400 $1,700
Exclusion of Cost-Sharing Payments $50 $100
Exclusion of Farm Debt Cancellation from income $100 $400
Income Averaging for Farmers $50 $200
Five-Year Carry-Back Period for Net Operating Losses Attributable to Farming
$100 $400
Amortization and Expensing of Reforestation Expenditures $200 $1,200
Expensing of Multiperiod Timber Growing Costs $200 $1,500
Capital Gains Treatment of Timber Income $500 $2,600
Total $1,600 $8,100
Tax DecoderThe appendix is a listing of each tax provision, and the corresponding revenue loss, described in Tax Decoder. While many
of the tax breaks identified throughout this report should be eliminated, others could be reformed to be better targeted so they achieve their intended purpose without providing a windfall for taxpayers who do not need a federal tax break.
Economic and Community Development (in millions) FY 2014 FY 2014 - FY 2018Empowerment Zone & Enterprise Community Tax Incentives $300 $1,200
American Samoa Economic Development Credit $10 $82
Historic and Non Historic Tax Credits $1,000 $5,400
Hollywood Tax Break $126 $838
Magazines Tax Break $100 $300
New Markets Tax Credit $1,000 $5,500
Total $2,536 $13,320
Education (in millions) FY 2014 FY 2014 - FY 2018American Opportunity Tax Credit
$23,000 $110,000HOPE Tax Credit
Lifetime Learning Credit
Deduction for Higher Education Expense $71 $1,300
Student Loan Interest Deduction $1,700 $9,400
Section 529 Qualified Tuition Plans $700 $5,900
Coverdell Educational Savings Accounts $100 $600
Exclusion of Interest of Education Savings Bonds $50 $300
Exclusion of Scholarship and Fellowship Income $2,600 $14,400
Exclusion of Employer-Provided Tuition Reduction $300 $1,500
Exclusion of Employer-Provided Education Assistance $1,200 $6,000
Occupation Related Loan Forgiveness $200 $1,000

DRAFT
308 | Tax Decoder
Business Tax Provisions (in millions) FY 2014 FY 2014 - FY 2018Business Expense Deduction (Section 162) * *
Interest Expense Deduction (Section 163) * *
Domestic Production Activities (Section 199) $16,800 $89,900
Domestic Production Activities in Puerto Rico (Section 199) $57 $830
Last In First Out $1,800 $9,200
Employee Stock Ownership Plan $900 $4,600
Depreciation
Accelerated Depreciation $9,820 $164,750
Corporate Jets $394 $1,970
Race Horses as Three Year Property $23 $342
15 Year Recovery for Qualified Leasehold Improvements $62 $2,795
50% Bonus Depreciation $33,535 $197,111
Option to Accelerate Use of AMT Credits $89 $480
Expensing of Research and Experimental Expenses $4,700 $28,900
Permanent Levels of Section 179 Expensing $7,000 $17,600
Extenders Section 179 Expansion $7,208 $46,384
Special Expensing for Mine Safety Equipment $12 $56
Total $82,400 $564,918
Financial Services (in millions) FY 2014 FY 2014 - FY 2018Carried Interest $1,200 $11,900
Exclusion of Interest on Life Insurance Savings (Inside Buildup) $30,100 $158,100
Qualified Small Business stock Gain Exclusion: Section 1202 $802 $4,900
100% Qualified Small Business Stock Gain Exclusion $2 $34
Small Life Insurance Company Deduction $50 $200
Nonprofit Status of Credit Unions $2,100 $11,900
Total $33,054 $175,134
Education (in millions) FY 2014 FY 2014 - FY 2018Deduction for Classroom Expenses $40 $883
Tax Credits for Holders of Qualified Zone Academy Bonds $300 $1,300
Total $29,961 $151,283
Employment Tax Credits & Exclusions (in millions) FY 2014 FY 2014 - FY 2018Work Opportunity Tax Credit $900 $3,000
Exclusion of Employee Awards $300 $1,600
Exclusion of Employee Meals and Lodging $2,000 $10,700
Exclusion of Miscellaneous Fringe Benefits $7,300 $38,300
Total $10,500 $53,600
Research and Development Tax Credit (in millions) FY 2014 FY 2014 - FY 2018Total $2,052 $22,381

308 | Tax Decoder Appendix | 309
Energy (in millions) FY 2014 FY 2014 - FY 2018
Traditional Fossil Fuel Provisions
Amortization of All Geological & Geophysical Expenditures Over 2 Years $100 $700
Election to Expense IDCs $1,100 $6,500
Excess of Percentage Over Cost Depletion $1,200 $8,700
Capital Gains Treatment of Coal Royalties $80 $520
Advanced Coal Project and Gasification Credit $200 $390
Indian Coal Credit $22 $192
Enhanced Oil Recovery Deduction for Tertiary Injectants * *
Marginal Wells * *
Renewable and Alternative Fuel Source Provisions
Credit for Electricity Produced from Certain Renewable Resources $1,692 $20,655
Advanced Energy Project Investment Credit $300 $1,300
Biodiesel, Renewable Diesel, and Second Generation Biofuel $1,054 $7,351
Alternative and Alcohol Fuel Credit $300 $2,071
Fuel Cell Vehicles $50 $100
Plug-In Electric-Drive Motor & Electric-Drive Low-Speed, Motorcycle & Three-Wheeled Vehicles
$202 $1,112
Alternative Fuel Refueling Properties $21 $177
Energy Efficiency Provisions
Energy Efficient Commercial Buildings Deduction $95 $845
Manufacturer Credit for Energy Efficient Appliances $66 $691
Manufacturer Credit for New Energy Efficient Home $48 $600
Residential Energy Efficient Property Credits $1,100 $4,300
Energy Production Properties Credit for Businesses $500 $2,900
Nonbusiness Energy Property Credits $401 $7,099
Exclusion of Utility Conservation Subsidies $50 $100
Miscellaneous Properties
Industrial CO2 Capture and Sequestration Tax Credit $80 $660
Advanced Nuclear Power Production Credit $0 $680
Deferral of Gains from the Sale of Electric Transmission Property $232 $1,081
Amortization of Pollution Control Facilities $400 $1,800
Depreciation Recovery Periods for Energy-Specific Items * *
Total $9,293 $70,524
International Taxation (in millions) FY 2014 FY 2014 - FY 2018Deferral of Active Income of Controlled Foreign Corporations $83,400 $418,000
Tonnage Tax Alternative $100 $500
Research and Development Expenses $200 $1,100
Inventory Property Sales $3,000 $15,300

DRAFT
310 | Tax Decoder
Family and Child Tax Provisions (in millions) FY 2014 FY 2014 - FY 2018Child Tax Credit $57,300 $285,800
Earned Income Tax Credit $69,200 $352,800
Child Tax Credit (Average savings from fraud prevention)** $760 $7,600
Earned Income Tax Credit (Annual fraud/waste estimate)** $13,000 $65,000
Child and Dependent Care Expenditures $4,600 $23,500
Adoption Tax Credit $400 $2,000
Exclusion of Foster Care Payments $400 $2,000
Parental Personal Exemption for Students Aged 19 to 23 $4,700 $25,200
Total $136,200 $691,300
Health (in millions) FY 2014 FY 2014 - FY 2018Tax Treatment of Employer-Provided Health Insurance $143,000 $785,100
Health Insurance Deduction for Self-Employed Taxpayers $5,400 $29,400
Exclusion for Cafeteria Plans and FSAs $34,500 $193,000
Health Savings Accounts $1,600 $11,500
Special Deduction for Blue Cross & Blue Shield Companies $400 $2,100
Deduction for Medical Expenses $9,900 $59,900
Medical Device Tax** -$3,000 -$15,000
Orphan Drug Tax Credit $700 $4,500
ACA Exchange Tax Credits $15,500 $318
Total $208,000 $1,070,818
Housing (in millions) FY 2014 FY 2014 - FY 2018Exclusion of Mortgage Indebtedness Forgiveness $1,000 $5,000
Mortgage Interest Deduction $67,800 $405,200
Property Tax Deduction $31,900 $182,100
Mortgage Insurance Deduction $600 $4,490
Parsonage Housing Allowance Exclusion $700 $3,900
Capital Gains Exclusion for Owner-Occupied Housing $24,100 $149,300
Jonas Bonus-Tax Free Temporary Rental Income $10 $50
Low-Income Housing Tax Credit $7,100 $40,500
Depreciation of Rental Housing Income $4,300 $23,700
International Taxation (in millions) FY 2014 FY 2014 - FY 2018
Availability of Foreign Tax Deduction Instead of Credit $200 $1,200
Personal Salary and Housing Exclusions $8,500 $47,600
Exclusion of Certain Allowances $2,000 $10,700
Total $97,400 $494,400

310 | Tax Decoder Appendix | 311
Indian Tribes and Federal Taxes (in millions) FY 2014 FY 2014 - FY 2018Tax Exemption for Indian Tribes * *
Tribal Economic Development Bonds $50 $250
Depreciation for Business Property in Indian Reservations $56 $786
Indian Employment Tax Credit $21 $262
Total $127 $1,298
Military Tax Provisions (in millions) FY 2014 FY 2014 - FY 2018Exclusion of Certain Benefits and Allowances to Armed Forces Personnel
$5,800 $32,400
Exclusion of Combat Pay $1,300 $6,800
Miscellaneous Exclusions $8,500 $46,900
Total $15,600 $86,100
Sports Tax Breaks (estimates in millions) FY 2014 FY 2014 - FY 2018
Take Me Out to the Ballpark * *
Highway to Tax Haven: NASCAR Tax Break $5 $162
Betting on a Tax Break $3 $14
Not So Fuzzy Foreign Golfers Exemption * *
Fishing for a Tax Break $1 $5
Tax Exemption for Pro Sports Leagues $5 $46
Roster Depreciation Allowance * *
Total $14 $227
Tax-Exempt Interest (in millions) FY 2014 FY 2014 - FY 2018
Governmental Bonds $33,100 $179,600
Small-Issue Qualified Private Activity Bonds $400 $2,000
Exempt Facility Bonds $1,380 $7,800
QPA Bonds for Student Loans $500 $2,900
QPA Bonds for Private Nonprofit & Qualified Public Educational Facilities
$3,200 $18,300
QPA Bonds for Private Nonprofit Hospital Facilities $2,200 $12,500
Total $40,780 $223,100
Housing (in millions) FY 2014 FY 2014 - FY 2018Exemption from Passive Loss Rules $9,800 $54,900
Bonds for Owner-Occupied and Rental Housing $2,200 $11,700
Total $149,510 $880,840

DRAFT
312 | Tax Decoder
Transportation (in millions) FY 2014 FY 2014 - FY 2018Maintaining Railroad Track Tax Credit $72 $900
Exclusion of Employer-Paid and Employer-Provided Transportation Benefits
$4,900 $26,300
Deferral of Tax on Capital Construction Funds of Shipping Companies
$100 $500
Total $5,072 $27,700
Other Tax Provisions (in millions) FY 2014 FY 2014 - FY 2018Chained-CPI $1,000 $30,000
State & Local Tax Deduction $56,600 $328,200
Total $57,600 $358,200
* The revenue loss associated with these provisions is either unknown or not included in order to avoid double counting** The revenue loss or potential savings associated with these line items is not included in the total calculations
Total (in millions) $928,599 $5,145,043
Tax-Exempt Organizations (in millions) FY 2014 FY 2014 - FY 2018501(c)(3) Charitable Organizations * *
501(c)(4) Social Welfare Organizations * *
501(c)(5) Labor Organizations * *
501(c)(5) Agricultural and Horticultural Organizations * *
501(c)(6) Trade Associations * *
501(c)(7) Social and Recreational Clubs * *
501(c)(8) Fraternal Beneficiary Societies * *
501(c)(9) Voluntary Employee Benefit Associations * *
501(c)(10) Domestic Fraternal Societies * *
501(c)(12) Utility Associations * *
501(c)(13) Cemetery Companies * *
Veteran’s Organizations in 501(c)(19) and Other Sections * *
Support Organizations of Nonprofit Organizations * *
Business Expense Deduction for Nonprofit Contributions * *
Nonprofit Political Activity: Section 527 Organizations * *
Charitable Tax Deduction $46,900 $251,800
Total $46,900 $251,800