Embed Size (px)
Citation preview
ACTA CLIMATOLOGICA ET CHOROLOGICA Universitatis Szegediensis, Tom. 38-39, 2005, 125-133.
125
TEMPORAL CHARACTERISTICS OF AIR POLLUTANT CONCENTRATIONS IN SZEGED, HUNGARY
G. KISS1, L. MAKRA1, J. MIKA2, E. BORSOS1 and G. MOTIKA3
1Department of Climatology and Landscape Ecology, University of Szeged, P.O.Box 653, 6701 Szeged, Hungary, E-mail: [email protected]
2Hungarian Meteorological Service, P.O.Box 39, 1675 Budapest, Hungary 3Environmental and Natural Protection and Water Management Inspectorate of Lower-Tisza Region,
P.O.Box 1048, 6701 Szeged, Hungary
Összefoglalás – Városi környezetben a gazdasági tevékenység és a mindennapi élet a légszennyező anyagok ciklikus időbeli menetét eredményezheti különböző időskálákon. Jelen tanulmány ehhez a megfigyeléshez kíván hozzájárulni a nitrogén-monoxid (NO), a nitrogén-dioxid (NO2), az ózon (O3) és az összes lebegő részecske (TSP = total suspended particulate) koncentrációjának a tanulmányozásával egy közepes méretű közép-európai város, Szeged példáján. A vizsgálathoz az említett légszennyező anyagok 1997-2001 közötti ötéves óránkénti koncentráció adatai állnak rendelkezésre Szeged belvárosának egy főútvonal melletti forgalmas közlekedési csomópontjából. Ezenkívül bemutatjuk a heti ciklusoknak a koncentrációk napi menetére gyakorolt hatását, mely különösen fontos, ha e közlekedési eredetű légszennyező anyagok lehetséges szélsőértékeit keressük. Mivel a légszennyező anyagok évi ciklusa a teljes varianciának csupán egy töredékét magyarázza, továbbá a heti ciklus meglehetősen hasonlóan viselkedik a különböző évszakokban, a dolgozatban a napi percentilis értékek heti változását elemezzük az egész évre. Summary – Economic activities and everyday life may create weekly cycles in concentrations of air pollutants in an urban setting. The present study contributes to this experience on the example of a typical medium-sized town in Central Europe, Szeged, considering the following air pollutants: NO, NO2, O3, Ox and TSP. Five-year data sets of hourly observations (1997-2001) collected near a highway, in a downtown traffic junction are analysed. In addition, the modulating effect of the weekly cycle on the diurnal course of the air pollutants is also demonstrated, which is especially important when we consider the possible extremes of these traffic related air pollutants. Since the annual cycle of the pollutants explains only a minor part of the total variance and, furthermore, the weekly cycle behaves rather similarly in the different seasons, the weekly modulation of the diurnal peaks is quantified for the whole year.
Keywords: urban air pollutants; nitric oxide, nitrogen dioxide, ozone, total suspended particulate, weekly cycle, diurnal cycle
INTRODUCTION
Air pollution is one of the most important environmental problems, which is restricted mostly to the cities. Generally, human activities induce monotonous accumulation of pollutants. Population growth in cities and, in connection to this, the increase of built-up areas is considered to be some of the underlying reasons for worsening air quality. A considerable part of population growth derives from migration to the cities. The ever-increasing urban population, together with the growing industrialisation and energy consumption, and the extensive transportation, increase air pollution which becomes a more and more serious challenge for the interest of survival. The main sources of air pollution are

Gábor Kiss, László Makra, János Mika, Emőke Borsos and Gábor Motika
126
industrial activity, motor vehicle traffic (which heavily affects air quality in densely urbanised regions) and emissions from building heating systems (contribution of which is important in the winter period). Air pollution is harmful to the buildings, technical devices and may cause serious health damage, as well. The nature and importance of air quality problems depend on the size of the city, as well as various physical and chemical processes (industrial activity), meteorological processes (climate, local meteorological conditions at the moment), geographical processes (structure and quality of the surface, vegetation cover, position, relief) and social factors (existing environmental regulations, urban planning policies) (Mayer, 1999).
Air pollutants can be divided into two groups: The traditional Major Air Pollutants (MAPs), include sulphur dioxide, nitrogen dioxide, carbon monoxide, particles, lead and the secondary pollutant ozone). The Hazardous Air Pollutants (HAPs), include chemical agents [e.g. volatile organic compounds (VOC), benzene, polyaromatic hydrocarbons (PAH)], physical agents (e.g. depositing dust coming from the surface, yellow dust in China forming loess) and biological agents (e.g. pollen of plants). The HAPs are generally present in the atmosphere in much smaller concentration than the MAPs and they often appear more localised, but they are – due to their high specific activity – nevertheless toxic or hazardous. Both in scientific investigations and in abatement strategies HAPs are difficult to manage not only because of their low concentrations, but also because they are in many cases not identified (Fenger, 1999).
Research on urban air has a wide literature. Some of these are concerned with the analysis of characteristics of pollutants (e.g. Olcese and Toselli, 2002), others deal with the spatial and temporal variability of those (e.g. Hunová et al., 2004), or investigate statistical interrelationships among the variability of pollutants (e.g. Qin et al., 2004), or examine social policy on regulating emissions (e. g. Fehrenbach et al., 2001), or study the connection of meteorological parameters with major/hazardous air pollutants (e.g. Raga et al., 2001; Makra et al., 2004), or evaluate urban air quality using special models (e.g. Jorquera, 2002a, 2002b) and special air quality indicators (e.g. Mayer et al., 2004).
Motor vehicle traffic seems to be one of the most important sources of air pollution, mainly in the cities. Cities in Hungary, especially the big ones like Szeged, together with the population, and the number of motor vehicles, are continuously expanding. Consequently, a more significant role should be assigned for traffic as potential air quality influencing factor in the future (MEH, 1999).
In Hungary, motor vehicle traffic related emissions of CO, NOx and TSP (total suspended particulate) are around 70 %, 55 % and 14 %, respectively, of the total emissions of these pollutants (MEH, 1999).
The traffic system of Szeged is considered to be overcrowded. Among vehicles, taking part in the traffic, the ratio of passenger cars is the highest (84 %). During the 11-year period between 1990-2000, traffic density has not changed considerably. However, the types of vehicles have been fundamentally modified. Emission from more and more vehicle types decreases significantly, as the ratio of vehicles equipped with catalytic converter keeps increasing. Hence, in contrast to stagnant traffic density, emissions of vehicle related air pollutants have been decreasing considerably. This way, e.g. CO emissions of motor vehicles in the year 2000 were only 35-40 % of those measured in 1990 (Pitrik, 2000).
The major aim of the present study is to determine the temporal characteristics (typical diurnal, weekly and annual course), as well as statistical interrelationships of air pollutants; furthermore, to analyse their interrelation with meteorological elements.
Temporal characteristics of air pollutant concentrations in Szeged, Hungary
127
DATA AND METHODS
Location, structure and climate of the town
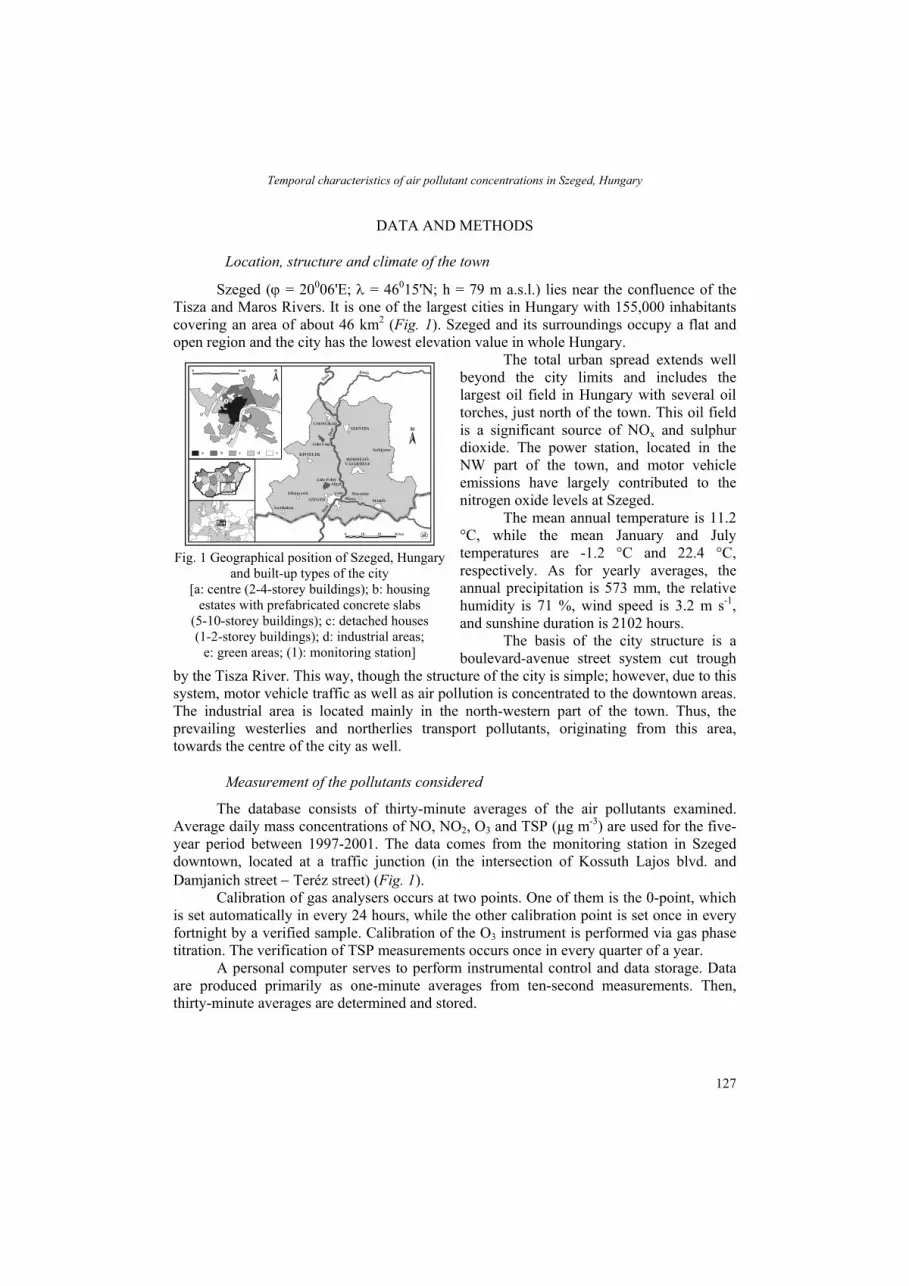
Szeged (ϕ = 20006'E; λ = 46015'N; h = 79 m a.s.l.) lies near the confluence of the Tisza and Maros Rivers. It is one of the largest cities in Hungary with 155,000 inhabitants covering an area of about 46 km2 (Fig. 1). Szeged and its surroundings occupy a flat and open region and the city has the lowest elevation value in whole Hungary.
The total urban spread extends well beyond the city limits and includes the largest oil field in Hungary with several oil torches, just north of the town. This oil field is a significant source of NOx and sulphur dioxide. The power station, located in the NW part of the town, and motor vehicle emissions have largely contributed to the nitrogen oxide levels at Szeged.
The mean annual temperature is 11.2 °C, while the mean January and July temperatures are -1.2 °C and 22.4 °C, respectively. As for yearly averages, the annual precipitation is 573 mm, the relative humidity is 71 %, wind speed is 3.2 m s-1, and sunshine duration is 2102 hours.
The basis of the city structure is a boulevard-avenue street system cut trough
by the Tisza River. This way, though the structure of the city is simple; however, due to this system, motor vehicle traffic as well as air pollution is concentrated to the downtown areas. The industrial area is located mainly in the north-western part of the town. Thus, the prevailing westerlies and northerlies transport pollutants, originating from this area, towards the centre of the city as well.
Measurement of the pollutants considered
The database consists of thirty-minute averages of the air pollutants examined. Average daily mass concentrations of NO, NO2, O3 and TSP (µg m-3) are used for the five-year period between 1997-2001. The data comes from the monitoring station in Szeged downtown, located at a traffic junction (in the intersection of Kossuth Lajos blvd. and Damjanich street − Teréz street) (Fig. 1).
Calibration of gas analysers occurs at two points. One of them is the 0-point, which is set automatically in every 24 hours, while the other calibration point is set once in every fortnight by a verified sample. Calibration of the O3 instrument is performed via gas phase titration. The verification of TSP measurements occurs once in every quarter of a year.
A personal computer serves to perform instrumental control and data storage. Data are produced primarily as one-minute averages from ten-second measurements. Then, thirty-minute averages are determined and stored.
Maros
Tisza
Tisz
a
Tisza
Körös
Lake Fehér
Lake Csaj
SZEGEDTÁPÉ
KISTELEK
CSONGRÁDSZENTES
HÓDMEZŐ-VÁSÁRHELY
MAKÓ
Ásotthalom
Zákányszék
Algyő
Maroslele
Székkutas
Tisza
1
0 5 km
0 10 20 30 km
Fig. 1 Geographical position of Szeged, Hungary
and built-up types of the city [a: centre (2-4-storey buildings); b: housing
estates with prefabricated concrete slabs (5-10-storey buildings); c: detached houses (1-2-storey buildings); d: industrial areas;
e: green areas; (1): monitoring station]

Gábor Kiss, László Makra, János Mika, Emőke Borsos and Gábor Motika
128
RESULTS
Annual cycle of the pollutant concentrations and its effect on variability
The diurnal concentrations of NO display a clear annual cycle, while those of NO2 and TSP indicate less definite ones with much higher fluctuation around this cycle. However, annual cycles for all three of them are characterised by winter maxima and summer minima. In contrast, the diurnal concentrations of O3 with a clear annual cycle have a winter minimum and a summer maximum (Fig. 2).
NO
0
20
40
60
80
100
120
140
160
180
200
0 50 100 150 200 250 300 350 400
O3
0,0
20,0
40,0
60,0
80,0
100,0
120,0
140,0
0 50 100 150 200 250 300 350 400
NO2
0
10
20
30
40
50
60
70
80
90
100
0 50 100 150 200 250 300 350 400
TSP
0
20
40
60
80
100
120
140
160
180
0 50 100 150 200 250 300 350 400 Fig. 2 Diurnal concentrations of NO, NO2, O3 and TSP (µg m-3), 1997-2001
The average weekly cycles of the air pollutants, after the annual cycle had been
removed, were also determined. For this, three seasons were defined: Winter (WI) (November-February); Summer (SU) (May-August) and a Transient Period (TR) (March-April and September-October). The average weekly cycles of NO, NO2 and TSP are very similar with weekday maxima and weekend minima. The highest concentrations are observed in the winter, while the lowest ones in summer. On the other hand, that of O3 has weekday minima and weekend maxima. On weekdays the concentration of traffic related NO is high. After reacting with O3, its concentration is decreased:
NO + O3 ⎯→ NO2 + O2 (1)
Conversely, at the weekend, the concentration of O3 is high, due to the relatively low traffic (Fig. 3).
Fig. 4a depicts the average annual cycles of NO, NO2, O3 and Ox, where Ox is a measure of the O3 concentration, contained in an air mass. It is defined as the sum of NO2 and O3 and is more suitable for the assessment of the photochemical O3 budget than O3

Temporal characteristics of air pollutant concentrations in Szeged, Hungary
129
alone, because it takes the reversible chemical processes into account as well (Mayer, 1999).
-0,7-0,6-0,5-0,4-0,3-0,2-0,1
00,10,20,3
0 1 2 3 4 5 6 7 8
NO, day
NO WI NO SU NO TR
-0,4-0,3-0,2-0,1
00,10,20,30,40,50,6
0 2 4 6 8
O3, day
O3 WI O3 SU O3 TR
-0,6-0,5-0,4-0,3-0,2-0,1
00,10,20,30,4
0 1 2 3 4 5 6 7 8
NO2, day
NO2 WI NO2 SU NO2 TR
-0,5-0,4-0,3-0,2-0,1
00,10,20,30,4
0 1 2 3 4 5 6 7 8
TSP, day
TSP WI TSP SU TSP TR
Fig. 3 Average weekly cycles of NO, NO2, O3 and TSP in the three “seasons” (µg m-3),
(1 = Monday, ... , 7 = Sunday), 1997-2001
The annual cycle of the primary air pollutant NO displays the greatest values in November, December and January, with a maximum in February (Fig. 4a). As the NO concentration depends not only on the rate of emission, but on the prevailing weather conditions as well, higher winter values refer to atmospheric stability with frequent inversions. The average annual cycle of NO has the lowest values during the summer (June and July), when air mass exchange is the most intensive. The annual cycle of NO2, a secondary substance produced mainly by chemical reactions, follows a similar course to that of NO. Tropospheric ozone is produced via the effect of short-wave radiation on substances emitted from anthropogenic sources. The role of solar radiation in the troposphere, producing photochemical O3 can be expressed by the following pair of chemical equations:
NO2 + hν ⎯→ NO + O (2) O + O2 + M ⎯→ O3 + M
(h: Planck-constant; ν: frequency of irradiance; M: usually a molecule of O2 or N2) (Sindosi et al., 2003). Consequently, the average annual cycle of O3, together with that of Ox, has the greatest values in the summer (June and July) (Makra et al., 2001). The annual cycles of these pollutants are very similar to those observed in Stuttgart, Germany (Mayer, 1999). The average annual cycle of the total suspended particles has the greatest values in November, December and January, with a maximum in January (Fig. 4b). Higher winter values might refer to atmospheric stability with frequent inversions. The lowest values

Gábor Kiss, László Makra, János Mika, Emőke Borsos and Gábor Motika
130
during the summer (June, July, August and September) can be explained by dilution caused by an intensive vertical exchange in the atmosphere.
Fig. 4a Average annual cycles of NO, NO2, O3
and Ox, monitoring station, Szeged, 1997-2001
Fig. 4b Average annual cycle of TSP, monitoring station, Szeged, 1997-2001
The weekly and diurnal cycles of the pollutant concentrations
The diurnal cycles of NO and NO2 (Fig. 5a) have the shape of a double wave, with bigger amplitudes for NO than for NO2. Due to the traffic density, the concentration of NO is relatively higher on weekdays, than on weekends. This effect can also be observed for the secondary substance NO2. The average diurnal variations on weekdays are greater for NO than for NO2, because NO2 has a longer lifespan than the more reactive NO. Generally, the NO concentrations are higher in the morning, then in the evening. This can be explained by the fact that in the morning the rush hour is shorter, and the atmosphere near the surface is more stable than in the evening. The low NO concentrations early in the afternoon result mainly from the reduction of O3 by NO. The diurnal cycles of O3 show a clear daily course with one wave. A maximum takes place in the early afternoon caused by photochemical O3 formation, while a minimum occurs after midnight. On the basis of its definition, the diurnal cycle of Ox is similar to that of O3. On weekends, the average O3 maximum values are a little higher than on weekdays, but this is not valid for Ox (Makra et al., 2001).
In comparison with the air pollutant characteristics in Stuttgart, the average weekly and diurnal cycles of the pollutants at Szeged are on the one hand less extreme with only a few large fluctuations. On the other hand, the values themselves are lower. Furthermore, slight secondary extremes in the cycles cannot be presented (Mayer, 1999). The above mentioned characteristics at Szeged may be attributed to a lower traffic density. However, the lack of secondary extremes might be caused by the short time courses of the pollutants.
The weekly and diurnal cycles of the total suspended particulate (TSP) (Fig. 5b) have the shapes of double waves. Both primary and secondary maxima can be observed during peak hours and, in the same way, primary and secondary minima occur, when traffic is the lowest (at night) or is decreasing (around midday). Also, due to the dense traffic, the concentration of TSP is relatively higher on weekdays.
Analysing NO and NO2 peak values, it becomes obvious that the highest values occur most frequently in the evening (Figs. 6a and 6b), while the diurnal cycle of mean NO concentrations has its local maximum in the morning (Fig. 6a). O3 peak values show a maximum during the weekends (Fig. 6c). Within this, in agreement with the occurrence of the average O3 maximum values mentioned above, they have a definite maximum on

Temporal characteristics of air pollutant concentrations in Szeged, Hungary
131
Sunday. If we compare the Figs. 6a-c for Stuttgart with those for Szeged, we can see that the Stuttgart curves have higher concentration values, larger fluctuations and clearer cycles of secondary extremes than those for Szeged (Makra et al., 2001; Mayer, 1999).
Fig. 5a Average weekly and diurnal cycles of
NO, NO2, O3 and Ox, monitoring station, Szeged, 1997-2001
Fig. 5b Average weekly and diurnal cycle of TSP, monitoring station, Szeged, 1997-2001
Fig. 6a Average weekly and diurnal cycle of percentile values of NO, monitoring station,
Szeged, 1997-2001
Fig. 6b Average weekly and diurnal cycle of percentile values of NO2, monitoring station,
Szeged, 1997-2001
Peak values for TSP show a double wave displaying maxima late in the evening, while secondary maxima can be observed late in the morning. The lowest TSP concentrations are measured early in the morning, while secondary minima occur in the evening (Fig. 6d). The average annual, weekly and diurnal cycles, as well as the average weekly and diurnal cycle of the percentile values of TSP are very similar to those of NO, which indicates the relation of TSP to traffic densities.
Fig. 6c Average weekly and diurnal cycle of percentile values of O3, monitoring station,
Szeged, 1997-2001
Fig. 6d Average weekly and diurnal cycle of percentile values of TSP, monitoring station,
Szeged, 1997-2001

Gábor Kiss, László Makra, János Mika, Emőke Borsos and Gábor Motika
132
CONCLUSIONS
The new findings of this work can be summed up as follows: • The air pollutants examined show typical annual weekly and diurnal cycles. • The average annual cycles of NO, NO2 and TSP (with maxima in winter)
are opposite to those of O3 and Ox (with maxima in summer). The higher winter values are caused by atmospheric stability with frequent inversions. The lowest values in summer are due to dilution caused by intensive vertical exchange in the atmosphere. The highest intensities of photochemical O3 formation are observed during the early afternoon and the summer.
• The concentrations of NO, TSP and O3 are traffic related. Concentrations of NO and TSP (O3) on weekdays are high (low), while on weekends they are low (high).
• The average weekly and diurnal cycles of NO, NO2, O3 and Ox have lower values and less extremes in a middle-sized Central-European city (Szeged), than those observed in a great one (Stuttgart) in a developed country (Germany).
Acknowledgement – The authors are indebted to L. Lukácsovics for fruitful discussions. The authors thank Z. Sümeghy for his contribution with digital mapping. This study was supported by the Hungarian National Foundation for Scientific Research (OTKA No. T 034765).
REFERENCES
Fehrenbach, U., Scherer, D. and Parlow, E., 2001: Automated classification of planning objectives for the consideration of climate and air quality in urban and regional planning for the example of the region of Basel/Switzerland. Atmos. Environ. 35, 5605-5615.
Fenger, J., 1999: Urban air quality. Atmos. Environ. 33, 4877-4900. Hunová, I., Šantroch, J. and Ostatnická, J., 2004: Ambient air quality and deposition trends at rural stations in the
Czech Republic during 1993-2001. Atmos. Environ. 38, 887-898. Jorquera, H., 2002a: Air quality at Santiago, Chile: a box modeling approach – I. Carbon monoxide, nitrogen
oxides and sulfur dioxide. Atmos. Environ. 36, 315-330. Jorquera, H., 2002b: Air quality at Santiago, Chile: a box modeling approach – II. PM2,5 coarse and PM10
particulate matter fractions. Atmos. Environ. 36, 331-344. Makra, L., Horváth, Sz., Zempléni, A., Csiszár, V., Rózsa, K. and Motika, G., 2001: Air Quality Trends in Southern
Hungary. EURASAP Newsletter 42, 2-13. Makra, L., Juhász, M., Borsos, E. and Béczi, R., 2004: Meteorological variables connected with airborne ragweed
pollen in Southern Hungary. Int. J. Biometeorol. 49, 37-47. Mayer, H., 1999: Air pollution in cities. Atmos. Environ. 33, 4029-4037. Mayer, H. and Haustein, Ch., 1994: Air pollution caused by motor-traffic in urban spaces. Meteorol. Zeitschrift
N.F. 3, 138-142. Mayer, H., Makra, L., Kalberlah, F., Ahrens, D. and Reuter, U., 2004: Air stress and air quality indices. Meteorol.
Zeitschrift 13, 395-403. MEH, 1999: Data on environment of Hungary. Budapest. Ministry for Environment, Hungary Olcese, L.E. and Toselli, B.M., 2002: Some aspects of air pollution in Cordoba, Argentina. Atmos. Environ. 36,
299-306. Pitrik, J., 2000: Change of transport-origin load of the environment in Szeged (in Hungarian). In Galbács, Z. (ed.):
Proceed. 7th Symposium on Analytical and Environmental Problems. SZAB, Szeged, 170-179.

Temporal characteristics of air pollutant concentrations in Szeged, Hungary
133
Raga, G.B., Baumgardner, D., Castro, T., Martínez-Arroyo A. and Navarro-González, R., 2001: Mexico City air quality: a qualitative review of gas and aerosol measurements (1960-2000). Atmos. Environ. 35, 4041-4058.
Sindosi, O.A., Katsoulis, B.D. and Bartzokas, A., 2003: An objective definition of air mass types affecting Athens, Greece; the corresponding atmospheric pressure patterns and air pollution levels. Environmental Technology 24, 947-962.
Qin, Y., Tonnesen and G.S., Wang, Z., 2004: Weekend/weekday differences of ozone, NOx, CO, VOCs, PM10 and the light scatter during ozone season in southern California. Atmos. Environ. 38, 3069-3087.


