Embed Size (px)
Citation preview
C. Claravall, 1-3 | 08022 Barcelona | Tel. 93 602 22 00 | Fax 93 602 22 49 | [email protected] | www.url.edu
C.I.
F. G
: 590
6974
0 U
nive
rsita
t Ram
on L
lull
Fund
ació
R
gtre
. Fun
d. G
ener
alita
t de
Cat
alun
ya n
úm. 4
72 (2
8-02
-90)
Sports Data Journalism: Data driven journalistic practices in Spanish newspapers
Zeliha Işıl Vural
http://hdl.handle.net/10803/672394
ADVERTIMENT. L'accés als continguts d'aquesta tesi doctoral i la seva utilització ha de respectar els drets de la persona autora. Pot ser utilitzada per a consulta o estudi personal, així com en activitats o materials d'investigació i docència en els termes establerts a l'art. 32 del Text Refós de la Llei de Propietat Intel·lectual (RDL 1/1996). Per altres utilitzacions es requereix l'autorització prèvia i expressa de la persona autora. En qualsevol cas, en la utilització dels seus continguts caldrà indicar de forma clara el nom i cognoms de la persona autora i el títol de la tesi doctoral. No s'autoritza la seva reproducció o altres formes d'explotació efectuades amb finalitats de lucre ni la seva comunicació pública des d'un lloc aliè al servei TDX. Tampoc s'autoritza la presentació del seu contingut en una finestra o marc aliè a TDX (framing). Aquesta reserva de drets afecta tant als continguts de la tesi com als seus resums i índexs.
ADVERTENCIA. El acceso a los contenidos de esta tesis doctoral y su utilización debe respetar los derechos de la persona autora. Puede ser utilizada para consulta o estudio personal, así como en actividades o materiales de investigación y docencia en los términos establecidos en el art. 32 del Texto Refundido de la Ley de Propiedad Intelectual (RDL 1/1996). Para otros usos se requiere la autorización previa y expresa de la persona autora. En cualquier caso, en la utilización de sus contenidos se deberá indicar de forma clara el nombre y apellidos de la persona autora y el título de la tesis doctoral. No se autoriza su reproducción u otras formas de explotación efectuadas con fines lucrativos ni su comunicación pública desde un sitio ajeno al servicio TDR. Tampoco se autoriza la presentación de su contenido en una ventana o marco ajeno a TDR (framing). Esta reserva de derechos afecta tanto al contenido de la tesis como a sus resúmenes e índices.
WARNING. The access to the contents of this doctoral thesis and its use must respect the rights of the author. It can be used for reference or private study, as well as research and learning activities or materials in the terms established by the 32nd article of the Spanish Consolidated Copyright Act (RDL 1/1996). Express and previous authorization of the author is required for any other uses. In any case, when using its content, full name of the author and title of the thesis must be clearly indicated. Reproduction or other forms of for profit use or public communication from outside TDX service is not allowed. Presentation of its content in a window or frame external to TDX (framing) is not authorized either. These rights affect both the content of the thesis and its abstracts and indexes.
C. Claravall, 1-3 | 08022 Barcelona | Tel. 93 602 22 00 | Fax 93 602 22 49 | [email protected] | www.url.edu
C.I.
F. G
: 590
6974
0 U
nive
rsita
t Ram
on L
lull
Fund
ació
R
gtre
. Fun
d. G
ener
alita
t de
Cat
alun
ya n
úm. 4
72 (2
8-02
-90)
DOCTORAL THESIS
Title
Sports Data Journalism: Data driven jounalistic practices in Spanish newspapers
Presented by
Zeliha Işıl Vural
Centre
Blanquerna School of Communication and International Relations
Department
Comunicació i Relacions Internacionals
Directed by
Pere Masip Masip
Abstract
Working with data is always an important part of journalism but its combination
with technology is an innovation for newspapers. In recent years, newspapers
have started to adapt data journalism and data journalism became a part of
newsrooms to the contrary of the traditional journalism environment in Spanish
newspapers. This thesis aims to analyse sports data journalism practices in Spain
with quantitative and qualitative approach with content analysis of 1068 data
journalism articles published by 6 newspapers (Marca, Mundo Deportivo, AS, El
Mundo, El Periódico, El Pais) between 2017-2019, and interviews with 15
participants from 6 newspapers (Marca, Mundo Deportivo, AS, El Mundo, El
Confidencial, El País). Both quantitative and qualitative analysis focus on how data
journalism is being adapted in Spain, its current situation and technical features,
opportunities and threats in its development.
Resumen
Trabajar con datos siempre es una parte importante del periodismo, pero su
combinación con la tecnología es una innovación para los periódicos. En los últimos
años, los periódicos han comenzado a adaptar el periodismo de datos y el
periodismo de datos se ha convertido en parte de las redacciones al contrario del
entorno periodístico tradicional de los periódicos españoles. Esta tesis tiene como
objetivo analizar las prácticas del periodismo de datos deportivos en España con
enfoque cuantitativo y cualitativo con análisis de contenido de 1068 artículos de
periodismo de datos publicados por 6 periódicos (Marca, Mundo Deportivo, AS, El
Mundo, El Periódico, El País) entre 2017-2019, y entrevistas a 15 participantes de
6 periódicos (Marca, Mundo Deportivo, AS, El Mundo, El Confidencial, El País).
Tanto el análisis cuantitativo como el cualitativo se centran en cómo se está
adaptando el periodismo de datos en España, su situación actual y características
técnicas, oportunidades y amenazas en su desarrollo.
Resum
Treballar amb dades sempre és una part important de l'periodisme, però la seva
combinació amb la tecnologia és una innovació per als diaris. En els últims anys,
els diaris han començat a adaptar el periodisme de dades i el periodisme de dades
s'ha convertit en part de les redaccions a contra de l'entorn periodístic tradicional
dels diaris espanyols. Aquesta tesi té com a objectiu analitzar les pràctiques de
l'periodisme de dades esportius a Espanya amb enfocament quantitatiu i qualitatiu
amb anàlisi de contingut de 1068 articles de periodisme de dades publicades per
6 diaris (Marca, Mundo Deportivo, AS, El Mundo, El Periódico, El País) entre 2017-
2019, i entrevistes a 15 participants de 6 diaris (Marca, Mundo Deportivo, AS, El
Mundo, El Confidencial, El País). Tant l'anàlisi quantitativa com el qualitatiu es
centren en com s'està adaptant el periodisme de dades a Espanya, la seva situació
actual i característiques tècniques, oportunitats i amenaces en el seu
desenvolupament.

Acknowledgements
When I started my PhD at Blanquerna School of Communications and
International Relations I didn’t know what to experience on this road. I was far
away from my home country Turkey, my family, and friends. This process
became easier than I expected thanks to my wonderful supervisor Pere Masip.
He always believed me even when I don’t believe in myself. Despite all the
challenges I've been through in 4 years, he always supported me, and he was
there when I needed to talk. He inspired me, helped me, and taught me how to
stay strong. This thesis wouldn't be possible without his support since the first
day. I’m lucky to have him by my side, and I'm sure that I'll be with him when
he needs me.
Also, I would love to thank everyone in Istanbul Bilgi University, Faculty of
Communication. I spent wonderful time in the faculty as a visiting researcher,
surrounded by amazing people and felt their support. They always made me feel
like one of them. I’ll never forget our lunches, coffee breaks, and small
conversations before classes. Although the pandemic ended this process early,
I’m happy that I spent some time with those amazing people.
Thanks to my family, my brother, and especially my dearest dad. I am very
lucky that my dad supported and believed me in this way. Thanks to my friends,
Gülşah, Emir, and Ecem, Gonca. We were far away from each other but you
were always there for me. My Barcelona family, I'm so grateful to meet with you
and share this journey with you. Damla, thanks for your endless support and our
coworking days. And also, Eren. I don't know how to thank you. I would never
have been able to go through this trip without you. They say PhD is a lonely
road, I’m lucky that I was surrounded with wonderful people.
Finally, but most importantly, thank you mom. I know that you watch me over
the clouds. I did it. I'm proud to be your daughter.
Barcelona, April 2021
Zeliha Işıl Vural
ii
Table of Contents
1. Introduction and Objectives ....................................................................................... 1 1.1. Research Objectives ...................................................................................................... 3 1.2. Research Structure ........................................................................................................ 5
SECTION I: THEORETICAL BACKGROUND AND METHOD ..................................................... 7
2. Theoretical Background ............................................................................................. 8 2.1. Digitalization in Journalism ........................................................................................... 12
2.1.1. Precision Journalism ..................................................................................................................... 12 2.1.2. Computer-Assisted Reporting ...................................................................................................... 14
2.2. Data Journalism ............................................................................................................ 16 2.2.1. Polar-Area Diagram as a Pioneer ................................................................................................. 16 2.2.2. The term: Data Journalism ........................................................................................................... 17 2.2.3. Emergence of Data Journalism .................................................................................................... 19 2.2.4. Data Journalism in the United States ........................................................................................... 20 2.2.5. Data Journalism in Europe ........................................................................................................... 23 2.2.6. Data Journalism in Rest of the World .......................................................................................... 26
2.3. Data Journalism in Spain ............................................................................................... 29 2.3.1. Emergence of Data Journalism in Spain ....................................................................................... 29 2.3.2. Access and Use of Data ................................................................................................................ 31 2.3.3. Open Data Initiatives .................................................................................................................... 32
2.4. Sports Data Journalism ................................................................................................. 34 2.4.1. Evolution of Sports Data Journalism ............................................................................................ 34 2.4.2. Sports Data Journalism in Spain ................................................................................................... 37 2.4.3. Advantages and Disadvantages of Data Journalism in Sports ...................................................... 43
2.5. Characteristics and Techniques of Data Journalism ....................................................... 45 2.5.1. Visualising Data ............................................................................................................................ 48
3. Method .................................................................................................................... 52 3.1. Quantitative Analysis .................................................................................................... 52
3.1.1. Design of the Codebook ............................................................................................................... 53 3.1.2. The Codebook .............................................................................................................................. 56
3.2. Qualitative Analysis ...................................................................................................... 57 3.2.1. Themes of Questions ................................................................................................................... 60
SECTION II: QUANTITATIVE ANALYSIS .............................................................................. 62
4. Quantitative Analysis of Marca, Mundo Deportivo, Diario AS, El Mundo, El Periodico, El Pais .............................................................................................................................. 63
4.1. Sports data journalism articles in Marca (2017-2019) ................................................... 63 4.1.1. Analysis of topics and story properties ........................................................................................ 64 4.1.2. Analysis of number of creators, data sources, accessibility of data ............................................. 70 4.1.3. Analysis of number of visualisations, visualisation types, form of interactivity and ratio of text and multimedia .......................................................................................................................................... 74
4.2. Sports data journalism in Mundo Deportivo (2017-2019) .............................................. 84 4.2.1. Analysis of topics and story properties ........................................................................................ 85 4.2.2. Analysis of number of creators, data sources, accessibility of data ............................................. 91 4.2.3. Analysis of number of visualisations, visualisation types, form of interactivity and ratio of text and multimedia .......................................................................................................................................... 94
iii
4.3. Sports data journalism in Diario AS (2017-2019) ......................................................... 105 4.3.1. Analysis of topics and story properties ...................................................................................... 106 4.3.2. Analysis of number of creators, data sources, accessibility of data ........................................... 112 4.3.3. Analysis of number of visualisations, visualisation types, form of interactivity and ratio of text and multimedia ........................................................................................................................................ 115
4.4. Sports data journalism in El Mundo (2017-2019) ......................................................... 123 4.4.1. Analysis of topics and story properties ...................................................................................... 124 4.4.2. Analysis of number of creators, data sources, accessibility of data ........................................... 129 4.4.3. Analysis of number of visualitions, visualisation types, form of interactivity and ratio of text and multimedia ............................................................................................................................................... 132
4.5. Sports data journalism in El Periodico (2017-2019) ..................................................... 138 4.5.1. Analysis of topics and story properties ...................................................................................... 138 4.5.2. Analysis of number of creators, data sources, accessibility of data ........................................... 144 4.5.3. Analysis of number of visualisations, visualisation types, form of interactivity and ratio of text and multimedia ........................................................................................................................................ 147
4.6. Sports data journalism in El Pais (2017-2019) .............................................................. 153 4.6.1. Analysis of topics and story properties ...................................................................................... 153 4.6.2. Analysis of number of creators, data sources, accessibility of data ........................................... 159 4.6.3. Analysis of number of visualisations, visualisation types, form of interactivity and ratio of text and multimedia ........................................................................................................................................ 163
4.7. Comparative Analysis ................................................................................................. 171
SECTION III: QUALITATIVE ANALYSIS .............................................................................. 178
5. Qualitative Analysis of Marca, Mundo Deportivo, Diario AS, El Mundo, El Pais, El Confidencial ................................................................................................................... 179
5.1. Production Process in Spanish Newspapers ................................................................ 180 5.1.1. Decision-making and Workflow in the Newsrooms ................................................................... 180 5.1.2. Tools and Guidelines in Sports Data Journalism ........................................................................ 188 5.1.3. Challenges in the Production of Sports Data Journalism ........................................................... 197 5.1.4. Characteristics of a Good Sports Data Article According to Journalists ..................................... 202 5.1.5. Advantages and Disadvantages of Creating Sports Data Journalism Articles ............................ 205
5.2. Access to Data in Spanish Data Journalism .................................................................. 208 5.2.1. Data Sources of Spanish Newspapers ........................................................................................ 208 5.2.2. Challenges in Working with Data in Spain ................................................................................. 210 5.2.3. Difference Between the Data Access in National and International Events .............................. 215 5.2.4. Journalists’ Opinions About the Transparency of Information in Spain ..................................... 217
5.3. Being a Data Journalist in Spain .................................................................................. 222 5.3.1. Investment in Data Journalism in Spanish Newspapers ............................................................. 222 5.3.2. Expected Skills from Data Journalists in Spanish Newspapers ................................................... 225
5.4. Current Environment in Spanish Newspapers After Integrating Data Journalism ......... 227 5.4.1. Working Conditions of Journalists in Spanish Newsrooms After Data Journalism .................... 228 5.4.2. Current Needs in Spanish Newspapers for Better Data Journalism ........................................... 230 5.4.3. Economic Motivations in Data Journalism ................................................................................. 233
5.5. Reader Engagement in Data Journalism ...................................................................... 235 5.6. Journalists' Opinions on Data Journalism and Its Future in Spain ................................ 240
SECTION IV: CONCLUSIONS AND DISCUSSION ................................................................ 245
6. Conclusions ............................................................................................................ 246 6.1. Summary of Results ................................................................................................................... 246 6.2. Discussion ................................................................................................................................... 254

iv
6.3. Suggestions ................................................................................................................................ 256 6.4. Limitations and Further Research .............................................................................................. 257
Bibliography ........................................................................................................................... 258 List of Tables ........................................................................................................................... 265 List of Figures .......................................................................................................................... 267 Annex I. Interview Questions .................................................................................................. 268 Endnotes ................................................................................................................................ 270

1
1. Introduction and Objectives
Technology that has developed with great acceleration has spread all over
the world with the effect of globalization and people's access to technology has
become easier in time. This dissemination has made it easier to analyze, process,
and transfer data. Over time, data that has been integrated into all areas of life
has also affected the journalistic practices. The transformation of journalism has
gained momentum in recent years thanks to data and has begun to leave the
traditional journalism place to digital media. Although data is used in traditional
journalism, the digital transformation of data and its transmission to the reader
has revealed data journalism. Because data alone does not make sense, thanks
to Inverted Pyramid of Bradshaw (2011), the data has begun to be passed on to
readers as a story. With the developments in digital technologies, data journalism
is becoming widespread and data journalism continues its development.
Wikileaks and The Guardian Datablog are accepted as the pioneers of data
journalism however, the term ‘data journalism’ was accepted by NICAR (National
Institute for Computer-Assisted Reporting) in 2014 and the term started to be
used in media outlets and literature. But before NICAR, data journalism started to
be taught in universities such as online data journalism training offered by
University of California at Berkeley and continued with MOOC taught by Knight
Center for Journalism at the University of Texas (Howard, 2014, p.50) and
newsrooms were in a learning process. From 2013, data journalism was started
to be adapted by some American and British newsrooms such as FiveThirtyEight,
the New York Times and the Financial Times. Data journalism practices were seen
in the rest of the world in similar times, and Spanish newsrooms started to adapt
data journalism like other countries.
Despite the fact that there were data journalism practices in Spain, the
official adaptation of data journalism in newsrooms was seen in El Confidencial in
2013. The success of El Confidencial Data Unit influenced other newsrooms and
following years witnessed data journalism projects of El Español, El Mundo, El
Periodico, and El Pais (Rojas Torrijos and Rivera, 2016, p.258). Through the
increased demand on open data, transparency law was accepted in Spain and
2
open data initiatives started to be established. In the light of these, data
journalism started to be used in not only politics, but also economics, culture, and
sport.
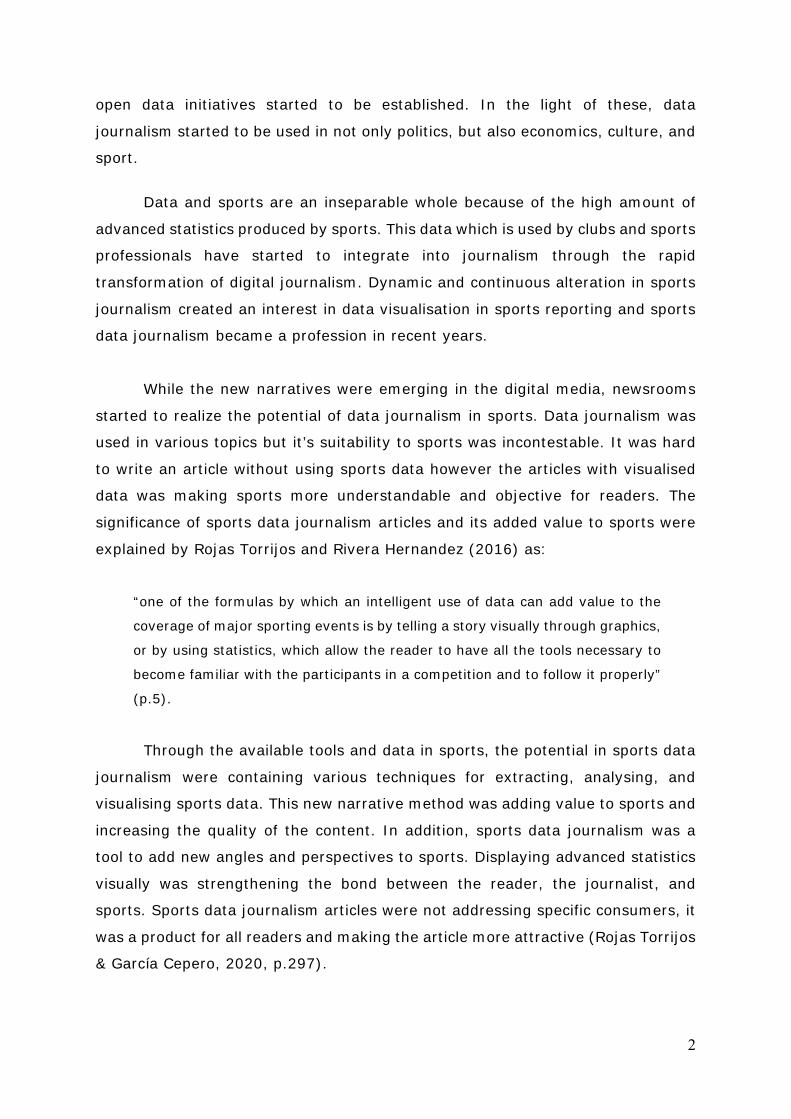
Data and sports are an inseparable whole because of the high amount of
advanced statistics produced by sports. This data which is used by clubs and sports
professionals have started to integrate into journalism through the rapid
transformation of digital journalism. Dynamic and continuous alteration in sports
journalism created an interest in data visualisation in sports reporting and sports
data journalism became a profession in recent years.
While the new narratives were emerging in the digital media, newsrooms
started to realize the potential of data journalism in sports. Data journalism was
used in various topics but it’s suitability to sports was incontestable. It was hard
to write an article without using sports data however the articles with visualised
data was making sports more understandable and objective for readers. The
significance of sports data journalism articles and its added value to sports were
explained by Rojas Torrijos and Rivera Hernandez (2016) as:
“one of the formulas by which an intelligent use of data can add value to the
coverage of major sporting events is by telling a story visually through graphics,
or by using statistics, which allow the reader to have all the tools necessary to
become familiar with the participants in a competition and to follow it properly”
(p.5).
Through the available tools and data in sports, the potential in sports data
journalism were containing various techniques for extracting, analysing, and
visualising sports data. This new narrative method was adding value to sports and
increasing the quality of the content. In addition, sports data journalism was a
tool to add new angles and perspectives to sports. Displaying advanced statistics
visually was strengthening the bond between the reader, the journalist, and
sports. Sports data journalism articles were not addressing specific consumers, it
was a product for all readers and making the article more attractive (Rojas Torrijos
& García Cepero, 2020, p.297).
3
In Spain, national newspapers adapted data journalism and currently most
of the newspapers have separate data units. However, these units were working
with all sections and they were not specialized in one topic. Under these
circumstances, the adaptation process of sports data journalism is still continuing.
Sports data journalism was started to adapt by newspapers in recent years when
most of the newspapers improve their websites and make it more data and visual
oriented. Especially the sports newspapers adapted this new narration technique
and started to publish in their websites. Marca, Diario AS, and Sport started to
publish these articles in different sections in their websites and this progress
followed by Mundo Deportivo. The potential of sports data journalism was seen by
national newspapers as well and data units of El Pais, El Mundo, El Periodico, and
Lavanguardia started to create sports data journalism articles as well.
1.1. Research Objectives
Data journalism is accepted as a profession and adapted by most of the
newsrooms in recent years. However, this adaptation process crawls in Spain and
there are not enough specialists about the topic. While alternative media works
on data journalism, mainstream media does not pay special attention to the topic
Data journalism is still a minority profession among journalists because of the lack
of interest of media outlets (Arias, Sanchez Garcia, Redondo, 2018, p.275).
Because of this lack of interest, literature does not give the relevant answers in
the current state of data journalism in Spain, deficiencies and obstacles in the
current situation, adaptation process in Spanish newspapers, advantages of
adapting data journalism, and this thesis aims to fill the gap in unanswered
questions and shed light on these topics to contribute the literature and open a
way to future research in this topic.
This thesis focuses on sports data journalism articles in the Spanish digital
media and analyzes the articles of 3 national and 3 sports newspapers in the
context of internal and external aspects of sports data journalism articles. The
thesis points to the newsroom structures, technical features of articles, internal
and external effects that shaped data journalism in Spanish newsrooms. It’s also
important to examine the journalistic environment in Spain and its connection with
4
political and economical issues in the country. To achieve this, 2 methods were
used as content analysis and interview. These 2 methods are mutually
complementary to examine the topic in the perspective of journalists as well. Both
qualitative and quantitative results aims to find answers research objectives
below:
Research Objective 1: To identify technical features of articles, and
particularly:
• To study trends, visualisation styles, type of articles, most
common topics, data sources and interactivity
• To identify the main differences in technical features of of articles
in sports and national newspapers.
Research Objective 2: To analyze changes in journalistic practice,
production process of articles, and more specifically:
• To examine newsrooms structures, departments and its effects
on production process of articles.
• To analyze working conditions of data journalists.
• To analyze daily workflow in data stories’ production processes
and changes in workflow in big events and major competitions.
• To identify decision-making process of articles and to compare
similarities and differences in decision-making processes in sports
and national newspapers.
• To identify the tools used for data journalism articles and reasons
to choose of tools.
• To analyze current needs in newspapers in order to adapt data
journalism better.
• To study the adaptation process of data journalism in sports and
national newspapers according to their daily work and working
conditions: which newspapers adapted data journalism better and
why?
Research Objective 3: To identify internal and external effects that
shaped data journalism, and particularly:
5
• To study limitations and problems regarding access to both
private and public data and its trustworthiness.
• To examine the positive and negative sides of transparency law
in Spain.
• To discuss the inequality between accessed data in certain topics
such as data linked with politics and economics.
• To understand economic motivations to adapt data journalism in
sports and national newspapers.
• To compare reader engagement between sports and other data
journalism articles and to understand the change in reader
engagement in sports and national newspapers.
While quantitative analysis answers Research Objective 1, the qualitative
approach answers other research objectives. However, quantitative analysis works
as a complementary in qualitative analysis and supports the results.
1.2. Research Structure
This thesis is consisted of four sections which are described below:
Section I starts with the literature review and identifies the basis of this
research. The section explains the transformations in journalistic practice with
starting online journalism. Then, precision journalism and computer-assisted
reporting is explained under the topics of digitalization in journalism in order to
understand the routes of data journalism. The section continues with data
journalism and presents the history of data journalism which includes
Nightingale’s Polar-Area Diagram, Philip Meyer, Wikileaks, Afgan War logs and its
emergence in different continents of the world. Later on, the section focuses on
data journalism practices in Spain and presents its development in the newsrooms
in the lights of open data, transparency law, and open data initiatives. Sports data
journalism in Spain is explained afterwards and the section focuses on the
characteristics and techniques of data journalism. In the light of the theoretical
background, Section I concludes with the method of the research and presents
the overall design structure and detailed explanations of quantitative and
6
qualitative analyzes which include designs of the content analysis, codebook, and
interviews.
Section II focuses on the results of quantitative analysis of this research and
presents the analysis of the results collected from Marca, Mundo Deportivo, Diario
AS, El Mundo, El Periodico, and El Pais through the designed codebook between
2017 and 2019 and the section ends by the comparative analysis of 6 newspapers.
Results are presented under three main topics as: • Topics and story properties. • Number of creators, data sources, accessibility of data.
• Number of visualisations, visualisation types, form of interactivity,
ratio of text and multimedia.
Section III focuses on the results of qualitative analysis of this research and
aims to explain the results from a descriptive perspective. Results of the qualitative
analysis are divided into 6 topics as: • Production process in Spanish newsrooms.
• Access to data in Spanish data journalism.
• Being a data journalist in Spain.
• Current environment in Spanish newspapers after integrating data
journalism.
• Reader engagement in data journalism.
• Journalists’ opinions on data journalism and its future in Spain.
Section IV presents the conclusion and discussion of this research. The section
starts with the summary of the results and explains the research objectives
mentioned in the introduction in the lights of results. The sections continue with
the discussion part where the personal perspective is explained and the sections
ends by suggestions and further research.
7
SECTION I: THEORETICAL BACKGROUND AND METHOD
8
2. Theoretical Background
Starting from the 1970s, technological developments had started to
influence journalism through the invention of videotext and followed by teletext
and audiotext as new content delivery channels in the 1980s. When computers
were involved in journalism, videotext has also attracted attention and seen as “a
tool and symbol of an upcoming information society” (Boczkowski, 2004, p.21) in
the context of the news that the society would reach according to their interest.
1980s was the time when Teletext had been started to be used by the newspapers
from the United States and United Kingdom (Boczkowski, 2004, p.30) to reach its
audience through “using television broadcast signal” (Domingo, 2006, p.43). With
launching of World Wide Web, the very first newspapers had started to publish on
the internet like Palo Alto Weekly (Díaz Noci, 2013, p.258) and The Telegraph’s
Electronic Telegraph (Siapera and Veglis, 2012, p.462) as the first online
newspaper of United Kingdom in 1994. The 1990s had witnessed an increasing
interest in online journalism and it changed traditional newsroom organization
within changing numbers of staff in online journalism departments. Boczkowksi
(2004) summarized this transformation from Kirsner’s study in 1997 as “by July
1997 the Chicago Tribune Interactive Edition employed 80 people, USA Today
Online employed 84, the Wall Street Journal Interactive Edition employed 90, and
the Washington Post Digital Ink employed 100” (p.52). There were an increasing
interest in online journalism in Europe too. Starting from 1994, Le Monde from
France (Siapera and Veglis, 2012, p.53), El Periódico de Catalunya, La Vanguardia,
Avui, Abc and El Mundo from Spain published their online issues (Masip, 2002,
p.2).
BBC Online was also one of the pioneers in the online journalism industry.
Less than one year BBC Online shared 140,000 pages with its readers which
61,000 of these were news. (Allan and Thorsen, 2010, p.24). Drudge Report’s big
success was also a breaking point. Starting as an email newsletter and turning
into a newsblog, the Drudge Report had published a sexual affair story about Bill
Clinton and Monica Lewinsky and mentioned by other newspapers who served the
breaking news in a short time. The big achievement of Drudge Report had also
9
influenced the online journalism industry (Díaz Noci, 2013, p.260). In 1999, the
Guardian had included into the online journalism sphere within launching the
Guardian Unlimited (is called nowadays as guardian.com) which published instant
live coverages about sports also could be accepted as a liveblogging (Mi, 2015,
p.140).
In the beginning of 1991, Pyra Labs launched Blogger which is an online
software to build a website for people without knowledge about coding. Blogger
had given journalists to reform themselves within freedom of speech (Knight,
2008, p.118), up to minute contents and critiques (Domingo and Heinonen, 2017,
p.12) and ethics (Lowrey and Burleson Mackay, 2008, p.67). Domingo and
Heinonen (2017) had divided journalistic weblogs into 4 categories as “citizen
blogs” ”audience blogs” ”journalist blogs” and ”media blogs” (p.7). While citizen
and audience blogs are written by the public, journalist and media blogs are
written by journalists. Some journalists like Kevin Sites, Matti Lintulahti, Matthew
Buckland created their personal blogs to write about the coverages which are not
under a media company (Domingo and Heinonen, 2017, p.10).
Starting from 2002, online journalism had started to rise with new
initiatives. The New York Times decided to launch a database for its digitized
archive since the beginning1. After a while, Google News was launched to combine
news from different online channels. Richard Gingras explained the aim of Google
News as:
“We built Google News’ homepage to help users discover diverse perspectives
from multiple news outlets about the news of the day, prompting them to dive
deeper into individual articles and making it easier to compare different views”
(2019).2
When Adrian Holovaty launched chicagocrime.org, actions started to take
part in journalism.3 Chicagocrime.org was a synchronic map with police statistics
which shown up to date crime information from Chicago (Cairo, 2017, p.84) and
it’s accepted as a key moment for data journalism as well (Zion and Craig, 2014,
p.214; Stavelin, 2013, p.31). In 2011, when tablets were included into people’s
daily lives, Amazon made a huge step and launched Kindle in the context of e-
10
publishing. Through the popularity of tablets and its features, newsrooms had also
met with longform journalism4 and this meeting was clearly seen with the Pulitzer
winner ‘Snowfall’ by the New York Times5. In the year of 2016, The Independent
had started to publish only online and digitalization started to be seen in
journalism clearly.6
The value of online journalism had been understood in the September 11
attacks in 2001. September 11 was also an exam for weblogs. When there is no
source of information, the world had been searching the answers on the internet
about what was happening and online news sites mostly crashed because of traffic
(Zelizer and Allan, 2004, p.120). The visiting numbers of the websites increased
from hundreds of thousands to hundreds of millions during the day of September
11 (Díaz Noci, 2013, p.262). In the study of Zelizer and Allan (2004) pointed that:
“As for the major news sites, it is worth pointing out that to date no other news
the event had affected internet performance to a greater extent than this crisis.
While events such as the 2000 US election, or before it the release of the Starr
Report in 1998, had a considerable impact, September 11 and its immediate
aftermath produced the most dramatic decline in the availability of the major
news sites yet witnessed” (p.123).
The day of 7 July 2015, London bombings, was an important day for online
journalism and citizen journalism as well. “More than 1,000 photographs, 20
videos, 4,000 texts, and 20,000 emails were sent to the BBC within six hours of
the attacks. National tv news bulletins led with grainy mobile phone video” (Zion
and Craig, 2014, p.61). Allan and Thorsen called this collaboration with society as
“accidental journalism” in their article (Meikle and Redden, 2009, p.33). Shortly
after 7 July, BBC launched “UGC Hub” (Meikle and Redden, 2009, p.30) to collect
information from the public for making news (Hammond, 2015, p.8).
The year of 2008 has shown how social media can be a tool for journalistic
approaches. Citizens started to serve information about Mumbai attacks with
#mumbai hashtag on Twitter and newsrooms had started to collect information
about the breaking news from social media (Siapera and Veglis, 2012, p.314,332)
and BBC was sharing the tweet flood about Mumbai attacks (Meikle and Redden,
11
2009, p.34). This two way communication followed by other events such as
elections in Iran (2009), Wikileaks (2010), Arab Spring (2011) and Gezi Protests
(2013). Gezi Protests started with a few people in Gezi Park Istanbul to protect
the green spaces from construction machines in the park. In a few days it turned
into a national protest against the current government all around Turkey with the
start of police attacks on the park. During the protest days the media did not serve
objective information to citizens and the main news source was Twitter with
related hashtags. Citizens from streets shared videos, photographs and even live
broadcasting to inform society about what’s actually happening.
The study of Boczkowski(2004) is still up to date in the context of
transformation from print to online. According to Boczkowski, “an entity that has
mostly been generalized, physically bound, place-bound, temporally bound
(limited duration, fixed production cycles), media bound, loci-bound and in
general, static” however, “has been extended by also being specialized, physically
unbound, place-unbound, temporally unbound (unlimited duration, variable
production cycles, media unbound (multimedia), loci-unbound (user-authoring),
and in general, dynamic” (p.65).
12
2.1. Digitalization in Journalism
Throughout history, journalism has been reshaped many times by various
influences of technology. Journalistic practices constantly interacted with new
fields such as precision journalism and computer-assisted reporting in time and
the interaction is still an ongoing process. Historical changes in digitalization in
journalism have been performed in the last half of the 20th century in the United
States by computer scientist and US Army rear admiral Grace Hopper. Hopper and
his programmer team input the data about the previous election statistics into the
ENIAC which is the first electrically operated computer with electronic data
processing capacity. With these statistics they wrote algorithms and the ENIAC
correctly predicted the results in 1952 (Howard, 2014, p.10). The progress in
digital journalism was started with Philip Meyer in the 70s and main improvements
have seen after the 80s with the development of computer-assisted reporting.
2.1.1. Precision Journalism
Philip Meyer, journalist and professor, is known as the pioneer of the use of
statistics in journalism. His finding, “Precision Journalism” has been accepted as a
theory which combines journalism and science while using statistical research
methods starting from 1973 with his book. When he was a reporter in Miami Herald
he started to be interested in investigative journalism and use of statistical
methods in journalism. During his career, as a Nieman Fellow at Harvard
University, he gained a deep knowledge about “quantitative methods in social
sciences” and became a big part of Detroit’s Riot in 1967 (Meyer, 1991). According
to his interview, getting involved in Detroit's Riot was a stroke of luck, when he
went to Detroit to collaborate with the Detroit Free Press.
“It became apparent that more was going on than could be reported by
conventional means. I proposed a survey of residents in the riot area, and the
editors found the funding and took me up on it” (Gehrke and Mielzicnuk, 2017).
13
His suggested study became so successful and Detroit Free Press won the
most prestigious award, Pulitzer Prize7. After this innovation in journalism, other
newspapers have started to use statistics in their news pieces such as the
Washington Post’s report about the Vietnam War in 1970. After Meyer’s
contribution to journalism, he published his book Precision Journalism in 1973.
The book mainly points to the use of quantitative research methods in terms of
journalistic practices. Meyer doesn’t address computers to achieve precision
journalism, he was pointing to the importance of application of social science
methods to journalism with a scientific point of view. In his words ‘precision
journalism’ is:
“A scientific journalism which means treating journalism as if it were a science,
adopting scientific method, scientific objectivity, and scientific ideals to the
entire process of mass communication” (1991, p.5).
Precision journalism contains more application methods for journalistic
practices in terms of obtaining, analyzing and matching data through computer
analysis. In his book, Meyer also describes this journalistic practice as database
journalism (1991). In the light of all of this information, Philip Meyer also
recognized as the pioneer of computer-assisted reporting (CAR). Bruce Garrison,
journalist and the author of numerous books about journalistic practices, explains
the link between two terms, precision journalism and computer-assisted reporting,
as:
“Precision journalism, the code word for a generation of computer assisted
reporting, but the two terms essentially describe the same quantitative
approaches to news reporting” (1998).
According to Meyer, a journalist should know “how to find information”,
“how to evaluate and analyze it” and “how to communicate it in a way that will
pierce the babble of information overload and reach the people who need and want
it”. Meyer also points to 2 threats against precision journalism as “journalistic
passivity” and “journalistic innocence”. Media should make observations and
present the news to the society, not create news, offers traditional journalism.
However, innocence and passivity may cause more argumentative results in the
14
context of objectivity, less criticism, manipulation and easy domination. (1991,
p.2-3).
Meyer (1991) claims that precision journalism has also a scientific approach
in the context of the used methods and shared aims. It has both a scientific part
and a market part as well.
“Journalism began moving toward a more scientific stance along two separate
paths. The increasing availability of computers made large bodies of data
available to journalists in a way that was not possible before. And in the
business office, the failure of newspaper circulation to keep up with the growth
in number of households made publishers pay more systematic attention to the
marketplace and the factors that motivated readers to spend time and money
with the publishers' products” (p.6).
The scientific approach of journalism comes from the similarities between a
journalist and a scientist. “Skepticism” is the main common characteristic between
these two. A journalist always questions the truth that the public believes
“observes” the case and “being open” about the findings to enlighten the others
(Meyer, 1991, p.12).
Meyer explains two phases of data as “the input phase” as where all data
collected and analyzed and “the output phase” as where the data is prepared for
entry into the reader’s mind. According to Meyer, under these 2 phases, six stages
should be followed for data driven journalistic practices: data collection, data
storage, data recalling, data analysis, data cleaning and data communication.
These stages also show similarity with Paul Bradshaw’s Inverted Pyramid (2011)
which will be explained in the next chapters.
2.1.2. Computer-Assisted Reporting
In the end of 80s, computer-assisted reporting (CAR) started to take a
significant role in newsrooms in terms of changes in journalistic practices with
combining computers and reporting. Hammond claims that computer-assisted
15
reporting changed how people do journalism, how we think about journalism and
“that change is not simply driven by new technologies but needs to be understood
in broader contextual terms” (2017, p.2). Similarity between CAR and precision
journalism is undeniable however the techniques which Meyer suggested are
highly quantitative and based on statistical research than computer assisted
reporting. Bruce Garrison (1998) does not only point the similarity between these
two terms but also the difference in his book Computer Assisted Reporting as:
“Precision journalism, as Meyer used the term, is a methodology for collecting
information. CAR is similar, but the term more appropriately describes a range
of computer based information gathering tools, not so much a research
philosophy, that include precision journalism approaches utilizing computers”.
In the same book, Garrison (1998) points out eight reasons for integrating
CAR into the newsrooms as: productivity, cost savings, quality, analysis of
information, competition, access to information, reliability and storage.
Journalists started to use CAR techniques in their stories from the end of
the 80s and beginning of the 90s and some of their investigative stories such as
“The Color of Money” (1989) by Bill Dedman, “The Power of Pork” (1996) by Pat
Stith awarded with Pulitzer and these stories enlighten today’s data journalists
way (Garrison, 1998). Especially Dedman’s “The Color of Money” is known as the
main example of CAR and recognition of CAR in the newsrooms. Published in
Atlanta Journal in 1988, “The Color of Money” was series of articles which reveals
the discrimination and racist policies against black people about bank loans and
mortgages in Atlanta financial institutions8.
Through the use of CAR techniques in the articles, newsrooms started to
get familiar with new technologies, data, visualisation, investigative journalism
and CAR evolved to data driven practices which will be called data journalism in
following years.
16
2.2. Data Journalism
2.2.1. Polar-Area Diagram as a Pioneer
Data visualisation is considered as the roots of data journalism. In that
point, Florence Nightingale, the lady with the lamp, is also considered as the
pioneer of data journalism with her Polar-Area Diagram. Her studies were inspired
by Quetelet who is a Belgian statistician and founder of social statistics (Cairo,
2017, p.42). She was a nurse during the Crimean War (1853-1856) and created
the Polar-Area Diagram with statistical graphics to visualise the reasons of
soldiers’ death during the war.
Great Britain, France and Turkey declared a war on Russia in 1854.
However, the conditions of the soldiers were a disaster. There was not enough
space on ships which were on their way to Black Sea from Bulgaria and medical
supplies, necessary food equipment and horses were left behind. Injured soldiers
were going to Turkey for treatment but the conditions in Turkey were even worse.
Sheds were turned into hospitals but there were not enough medical and hygienic
supplies, even doctors and nurses. As a result of these conditions outbreaks of
typhus and cholera began and the number of deaths from illnesses was increased
six times more than the number of death soldiers in battle fields. Florence
Nightingale decided to go to hospitals in Scutari with 38 voluntary nurses. She
kept a record of deaths of soldiers because of illnesses during her stay. When she
came back, she presented her polar area diagrams which are called “coxcombs”
by herself because of the vivid colors and dented appearance of the diagrams,
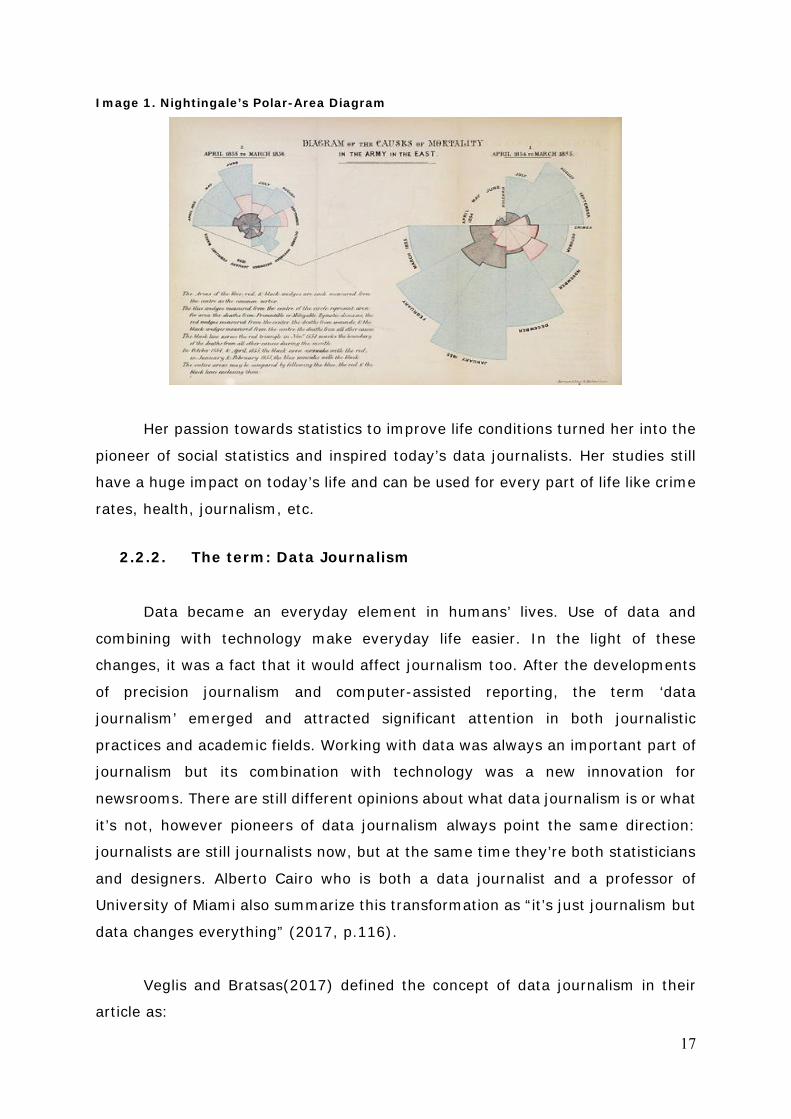
about the Crimean War to the British government in 1858 (Lewis, 2015) (Image
1).
17
Image 1. Nightingale’s Polar-Area Diagram
Her passion towards statistics to improve life conditions turned her into the
pioneer of social statistics and inspired today’s data journalists. Her studies still
have a huge impact on today’s life and can be used for every part of life like crime
rates, health, journalism, etc.
2.2.2. The term: Data Journalism
Data became an everyday element in humans’ lives. Use of data and
combining with technology make everyday life easier. In the light of these
changes, it was a fact that it would affect journalism too. After the developments
of precision journalism and computer-assisted reporting, the term ‘data
journalism’ emerged and attracted significant attention in both journalistic
practices and academic fields. Working with data was always an important part of
journalism but its combination with technology was a new innovation for
newsrooms. There are still different opinions about what data journalism is or what
it’s not, however pioneers of data journalism always point the same direction:
journalists are still journalists now, but at the same time they’re both statisticians
and designers. Alberto Cairo who is both a data journalist and a professor of
University of Miami also summarize this transformation as “it’s just journalism but
data changes everything” (2017, p.116).
Veglis and Bratsas(2017) defined the concept of data journalism in their
article as:
18
“the process of extracting useful information from data, writing articles based
on the information and embedding visualisations (interacting in some cases) in
the articles that help readers to understand the significance of the story or allow
them to pinpoint data that relate to them” (p.111).
Howard(2014) pointed to the steps of data journalism which will be
accepted later by whole data journalists as a definition. According to Howard data
journalism is “gathering, cleaning, organizing, analyzing, visualising, and
publishing data to support the creation of acts of journalism” (p.4).
One of the most important pioneers of data journalism and also the
innovator of the Guardian Data Blog, Simon Rogers, describes data journalism in
his book Facts are Sacred (2013) and his blog9 in 2014 in three parts. In his words
these 3 parts are:
“1. Data journalism is about using numbers to tell the best story possible. It is
not about maths, or drawing charts or even writing code. It is about telling
stories first and foremost – the maths and the charts and the code are all in
service to that.
2. You’re no longer thinking solely about words. Instead this is about the best
possible way to tell that story.
3. The techniques of data journalism change all the time but they are marked
out by an abundance of increasingly more accessible tools that allow
sophisticated manipulation and analysis of data.”
According to the article of Lewis and Waters(2017) ‘data journalism’ is a
polysemic term (p.3). However, the most detailed and academic description of
data journalism is explained by Coddington(2015) in his research “Clarifying
Journalism’s Quantitative Turn”. According to Coddington (2015), there are three
overlapping forms of data-driven journalism. These are CAR, Data Journalism and
Computational Journalism. CAR is more investigative reporting based while data
journalism is more based on open data and computational journalism is a
combination of programming and algorithms (p.339).
19
2.2.3. Emergence of Data Journalism
“Wikileaks didn't invent data journalism. But it did give newsrooms a reason to
adopt it.”10 Simon Rogers
When Wikileaks published Afgan War Logs in 201011It had repercussions all
around the world and later it has started to be seen as the light which leads up
the way of data driven journalism. However, Wikileaks itself should not be
considered as the very first example of data journalism in terms of the stages of
creating a data journalism piece (it only fulfills the first two stages which are data
collection and data storage according to the pioneers of data journalism), but can
be given as an example of the origins of data journalism (Baack, 2011, p.4).
A year before Wikileaks, The Guardian launched a datablog under the
leadership of Simon Rogers and published data about the expenses of UK’s
Ministers of Parliament12 and then they leaped forward with their data driven
pieces about Afgan War that they took the data from Wikileaks13.
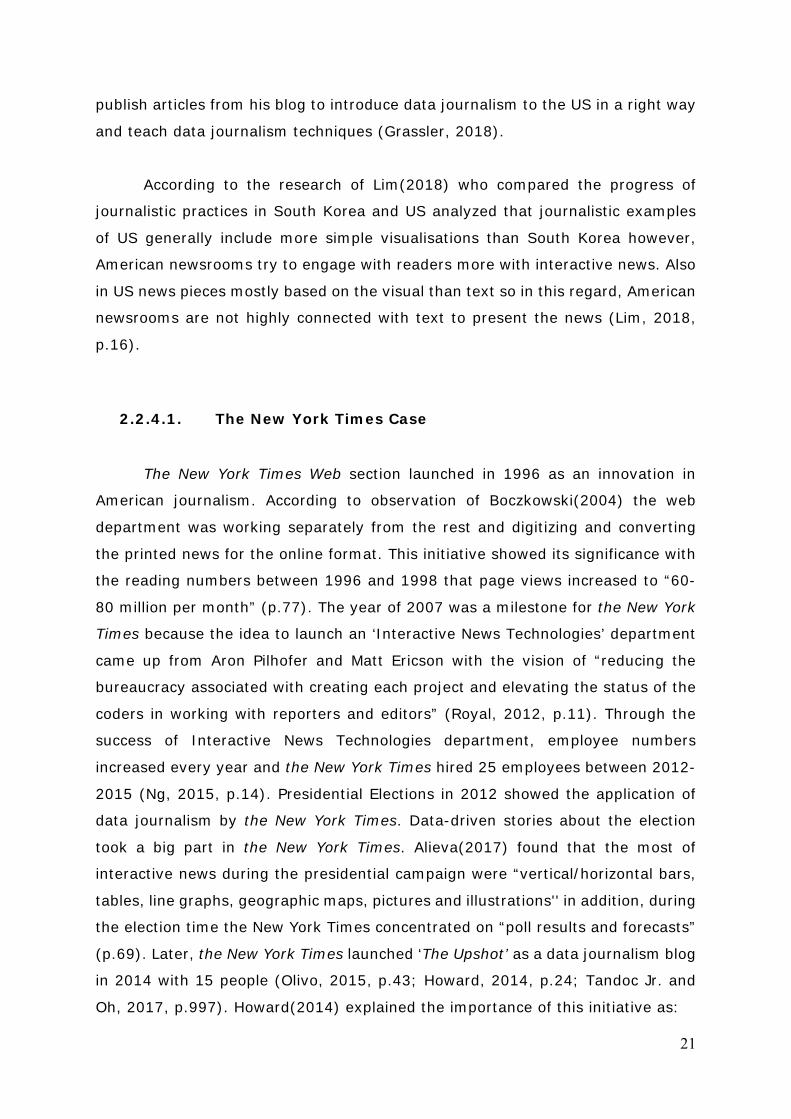
Image 2 shows the increasing interest towards data journalism between
2009 and 2019. It's clearly seen that the interest has started to increase after the
Guardian Datablog, the New York Times and Wikileaks.
Image 2. Google Trends Search about the term “data journalism” in countries between
the years of 2009 and 201914
The image proves the first claim about the increased interest after Wikileaks
and The Guardian in terms of countries’ interests towards data journalism.
According to the graphic, the United States and United Kingdom led the way to
20
other countries and spread this term to the world search and learn about data
journalism.15
Following years witnessed the improvement of data journalism and in 2014
the term “data journalism” officially accepted by the media through National
Institute for Computer-Assisted Reporting (NICAR) (Howard, 2014, p.49). The
year of 2014 and later witnessed the shine of data journalism all around the world.
2.2.4. Data Journalism in the United States
Before everything, Chicago Tribune (2002-2009) started to use
governmental data of the state of Illinois as sources to achieve computer assisted
news. However, they were not exactly data journalism, and may be considered as
roots of data journalism in the US. Data journalism reached the US after the UK
and after Wikileaks American newsrooms started to adopt data journalism with
some blogs. Vox, FiveThirtyEight, the New York Times started to visualise data
especially in politics and sports. Some authors and professors published books
about data journalism and big data to light the way of data driven journalism.
Alberto Cairo who is a professor from University of Miami pointed to the progress,
techniques and the future of data journalism in his books The Functional Art: an
Introduction to Information Graphics and Visualisation (2012), and The Truthful
Art: Data, Charts, and Maps for Communication (2016). He claims that creating
data news with just an obsession with data is irrelevant. Data journalism cannot
be achieved for cheap or fast. He drew attention to the importance of technical
skills and prior research to deal with data (Grassler, 2018).
Steve Doig and Simon Rogers played a crucial role in the development of
data journalism in the US. Steve Doig who is a professor from the University of
Arizona started to research data journalism and be interested in learning and
creating data driven pieces. During his research he found that Hurricane Andrew
in Florida damaged more new houses than the old ones. With this data he tried to
link politics and society and tried to show significance of data using in newsrooms.
Simon Rogers who is a pioneer of data journalism in the UK, left his job in the
Guardian and started to work in Google. As a data editor and writer, he started to
21
publish articles from his blog to introduce data journalism to the US in a right way
and teach data journalism techniques (Grassler, 2018).
According to the research of Lim(2018) who compared the progress of
journalistic practices in South Korea and US analyzed that journalistic examples
of US generally include more simple visualisations than South Korea however,
American newsrooms try to engage with readers more with interactive news. Also
in US news pieces mostly based on the visual than text so in this regard, American
newsrooms are not highly connected with text to present the news (Lim, 2018,
p.16).
2.2.4.1. The New York Times Case
The New York Times Web section launched in 1996 as an innovation in
American journalism. According to observation of Boczkowski(2004) the web
department was working separately from the rest and digitizing and converting
the printed news for the online format. This initiative showed its significance with
the reading numbers between 1996 and 1998 that page views increased to “60-
80 million per month” (p.77). The year of 2007 was a milestone for the New York
Times because the idea to launch an ‘Interactive News Technologies’ department
came up from Aron Pilhofer and Matt Ericson with the vision of “reducing the
bureaucracy associated with creating each project and elevating the status of the
coders in working with reporters and editors” (Royal, 2012, p.11). Through the
success of Interactive News Technologies department, employee numbers
increased every year and the New York Times hired 25 employees between 2012-
2015 (Ng, 2015, p.14). Presidential Elections in 2012 showed the application of
data journalism by the New York Times. Data-driven stories about the election
took a big part in the New York Times. Alieva(2017) found that the most of
interactive news during the presidential campaign were “vertical/horizontal bars,
tables, line graphs, geographic maps, pictures and illustrations'' in addition, during
the election time the New York Times concentrated on “poll results and forecasts”
(p.69). Later, the New York Times launched ‘The Upshot’ as a data journalism blog
in 2014 with 15 people (Olivo, 2015, p.43; Howard, 2014, p.24; Tandoc Jr. and
Oh, 2017, p.997). Howard(2014) explained the importance of this initiative as:
22
“That is precisely the model for open data journalism that embodies the best of
the craft as it is practiced in 2014, and sets a high standard right out of the
gate for future interactives at The Upshot and for other sites that might seek to
compete with its predictions” (p.36).
2.2.4.2. The Washington Post Case
Adrian Holovaty and Alyson Hurt created a database at the Washington Post
which covers “U.S. Congress Votes Database since 1991” in 2005 and this
database became one of the pioneers of computational journalism. Holovaty
explained the significance of the project as: “It was a milestone for me and for the
Post, and helped set the bar for what news organizations could do with data on
the web.” (Howard, 2014, p.30). Followed by the “Truth Teller”, in 2013, the
Washington Post made an indelible impression in the context of computational
journalism and fact-checking. The aim of “Truth Teller” was a real time fact-
checking prototype for political speeches. Cory Haik from Washington Post
mentioned that informing society in politics is crucial so newspapers should
identify the truth because “facts themselves are increasingly under attack and
falsehoods can easily and instantly find their way to a mass audience” (Uscinski
and Butler, 2013).16 Starting from 2013, the Washington Post shared outstanding
data stories with its readers such as N.S.A. surveillance scandal (2013), Police
Shooting Database (2015), President Elections (2016). The Washington Post
shared N.S.A. scandal with the Guardian synchronously and revealed that “the
N.S.A. is collecting a wide range of digital information from nine private internet
firms as part of a program known as PRISM”17 (Craig and Zion, 2014; Schulze,
2015, p.7). In 2015, the Washington Post published “Police Shooting Database in
US” which is an award winning data journalism project. The project was a finalist
in Goldstein Award, the winner in Polk Award, the winner in Sigma Delta Chi Award
and most importantly the winner in Pulitzer Prize in the category of National News
(Michalzki, 2016, p.42). Almost 5 year after the project, the Washington Post
published their results about the project on August 9, 2019. According to the
article, there are 5 findings: “Black Americans are disproportionately killed by
police. Black men are more likely to be fatally shot while unarmed. Most people
23
killed by police are young men. Since 2015, police have shot and killed an average
of 3 people per day. More than 2,500 police departments have shot and killed at
least one person since 2015” (Fox, Blanco, Jenkins, Lowery, 2019). Investigative
and data journalism continued by Presidential Elections in 2016 and the
Washington Post endeavored to perform principles of data journalism and moved
with the times.
2.2.5. Data Journalism in Europe
2.2.5.1. United Kingdom
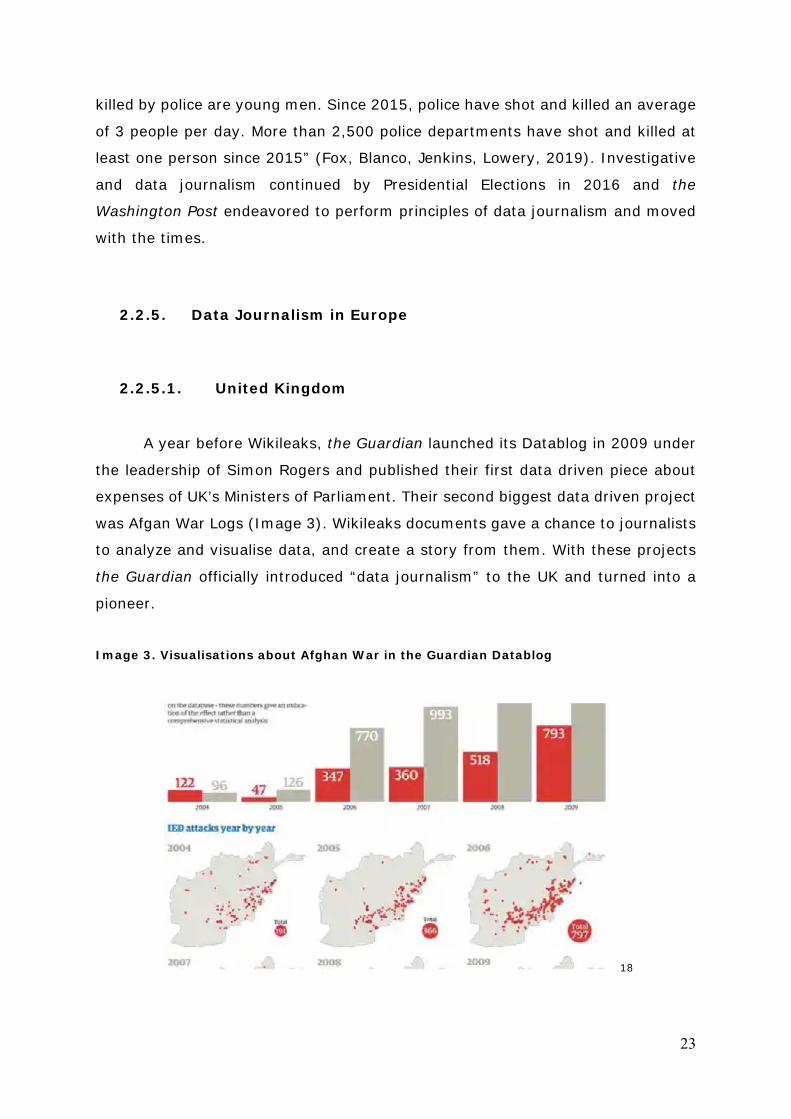
A year before Wikileaks, the Guardian launched its Datablog in 2009 under
the leadership of Simon Rogers and published their first data driven piece about
expenses of UK’s Ministers of Parliament. Their second biggest data driven project
was Afgan War Logs (Image 3). Wikileaks documents gave a chance to journalists
to analyze and visualise data, and create a story from them. With these projects
the Guardian officially introduced “data journalism” to the UK and turned into a
pioneer.
Image 3. Visualisations about Afghan War in the Guardian Datablog
18
24
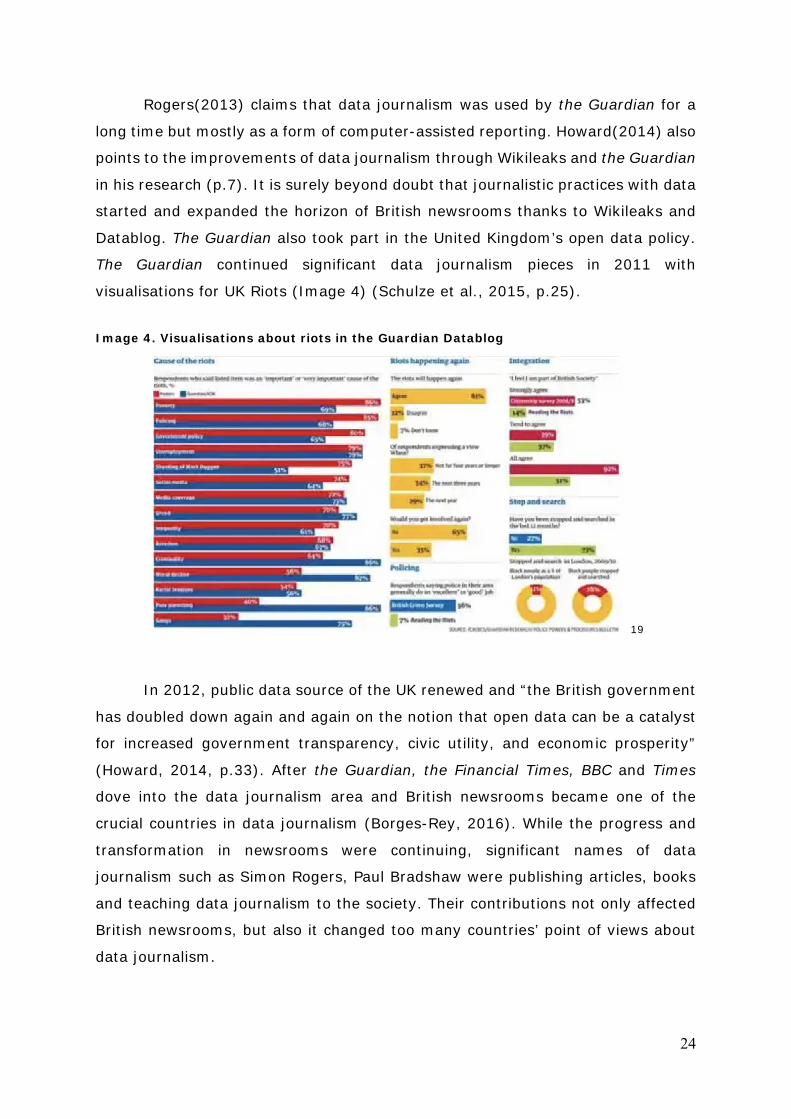
Rogers(2013) claims that data journalism was used by the Guardian for a
long time but mostly as a form of computer-assisted reporting. Howard(2014) also
points to the improvements of data journalism through Wikileaks and the Guardian
in his research (p.7). It is surely beyond doubt that journalistic practices with data
started and expanded the horizon of British newsrooms thanks to Wikileaks and
Datablog. The Guardian also took part in the United Kingdom’s open data policy.
The Guardian continued significant data journalism pieces in 2011 with
visualisations for UK Riots (Image 4) (Schulze et al., 2015, p.25).
Image 4. Visualisations about riots in the Guardian Datablog
19
In 2012, public data source of the UK renewed and “the British government
has doubled down again and again on the notion that open data can be a catalyst
for increased government transparency, civic utility, and economic prosperity”
(Howard, 2014, p.33). After the Guardian, the Financial Times, BBC and Times
dove into the data journalism area and British newsrooms became one of the
crucial countries in data journalism (Borges-Rey, 2016). While the progress and
transformation in newsrooms were continuing, significant names of data
journalism such as Simon Rogers, Paul Bradshaw were publishing articles, books
and teaching data journalism to the society. Their contributions not only affected
British newsrooms, but also it changed too many countries’ point of views about
data journalism.
25
2.2.5.2. Sweden
The main step about data journalism in Sweden was Journalism++
Stockholm20 (which belongs to the international Journalism++) established by
Swedish data journalists Jens Finnäs and Peter Grensund in 2013. They were the
first Swedish journalists who specialized in data journalism. Their projects led
other journalists’ way and with this innovative step there were a data journalism
conference in Stockholm21 which is organized by Norwegian media network
NxtMedia.
Until the research of Appelgren and Nygren(2014), data journalism was at
the beginner stage and the term “data journalism” was not a recognized area in
journalism in Sweden. Development of data driven journalistic practices was so
new for newsrooms and there were obstacles such as lack of time and lack of
technical skills to get into the data journalism area (p.395). According to the
interviewees of the research, working with data was not new and there was an
experience and interest. However, the challenging part was being familiar to the
new concepts, programs and technologies to achieve it. According to the same
research, there is a significant link between experience of journalists and their
positive attitudes towards data journalism. However, the same journalists also
claim that data journalism skills are not achievable for everyone (Appelgren and
Nygren, 2014, p.403). Sweden also has democratic and free environment to do
innovations in journalism in terms of finding data and its trustworthiness. Access
to the public data is free for everyone in Sweden for a long time with The Swedish
Freedom of the Press Act22 in 1766 (Appelgren and Salaverria, 2018, p.987). As a
result, data journalism in Sweden takes attention and rapidly growing but it still
needs time to reach key countries like the US or UK.
2.2.5.3. Belgium
In Belgium, according to the research of Grassler(2018), the roots of data
journalism has started in 2010 with an article of Association of Professional
Journalists of Belgium about a meeting about data journalism tools and achieving
this practice (p.128). Between 2010 and 2014 there were no noticeable
26
improvement about data journalism until Dataharvest23 which is a networking
event for specialized investigative and data journalists in Brussels. The biggest
threat against the improvement of data journalism in Belgium was the problem to
access public data. In the article of De Maeyer et al.(2015) points to the existence
of data journalism in Belgium but the problems against its development as access
to public data and its trustworthiness, lack of technical abilities and time
management (p.442).
2.2.5.4. Greece
When data journalism started to spread all around Europe, Greece was also
affected by this wind. Data driven journalistic practices in Greece was started with
the economic crisis in the country in terms of informing the society and attitudes
towards public institutions. It became more popular with the changes in “open
data”. After related legal procedures, Greece started to publish “open data” in
201024 and after Publicspending25 is established by National Technical University
of Athens with the aim of spreading data journalism in Greece in 2011
(Charbonneaux and Gkouskou-Giannakou, 2015, p.251).
2.2.6. Data Journalism in Rest of the World
2.2.6.1. Australia
Studies about data journalism are limited for Australia however, the term
of data journalism emerged and started to be used in Australia around 2011. Until
the years of 2014-2015 retained its originality (Wright and Doyle, 2018, p.9) and
Simon Rogers described Australian data journalism as “the new punk” in the
Guardian (2012). Data was important at Australian newsrooms but there was a
lack of basic data skills. When Fairfax which is an Australian based media group,
also runs in New Zealand created a small data team within their daily newspaper
The Age, data journalism has started to rise and followed by the main publisher
of Australia, News Corp, however they didn’t invest as much as Fairfax (Wright
27
and Doyle, 2018, p.9). Until the main years of development (2015-2017), data
driven pieces were generally interactive dashboards because of lack of data skills,
and clear information about the production process of data driven pieces. Besides
all these, Australian newsrooms were facing job cuts and cuts slowed the
development of data journalism for a while. However, more journalists with more
technical skills and higher degrees headed for this area and after this ABC started
to give training about data. In the years when data journalism shone in Australia
(2015-2017), courses in the universities have started and working with data has
spread, “the process of normalisation has been made easier because the skills
have become less technically demanding” and Wright and Doyle(2018) called this
as “data normalisation” (p.11). Still, lack of time and sources point to common
issues that Australian newsrooms face but internal and external collaborations of
newsrooms and creates “community of data journalists” (Evershed described at
Wright and Doyle, 2018, p.14).
2.2.6.2. China
Unlike many countries, there is no available environment in China to spread
data journalism due to traditional journalism loyalty, governmental problems and
problems about transparency of and obtaining data (Zhang and Feng, 2018). Even
statistics in journalism and computer-assisted reporting aren't sufficiently known
and analyzed. The very first book about precision journalism published in China in
1984. The publication didn’t affect the development of data driven practices until
Beijing Youth Daily newspaper began to collect poll results and create reports for
the public in 1996 (Zhang and Feng, 2018, p.15). ‘Sohu.com’, the very first data
journalism blog, published in 2011 and shown as the first official example of data
journalism in China. Followed by NetEase, Tencent and Sina, data journalism
started to expand its effect in China as of 2012 (Zhang and Feng, 2018, p.1).
According to the research of Zhang and Feng(2018), the most important factor
standing against development of data journalism is difficulty to reach data and
suspicion about its quality. Interviewees of the research point to the problems to
access governmental data and state that there is no “participatory openness”
(Zhang and Feng, 2018, p.13). According to the problems that pointed in the
research, creating data driven pieces is a time and energy spending process for
28
the journalists and uncertainty for the newsrooms about gaining their
investments. Besides all these, Chinese newsrooms realized that data journalism
is a good way to gain social recognition thanks to Caixin and their international
award-winning news26.
2.2.6.3. South Korea
Use of data in South Korean journalism is based on governmental sources
and the dominant of the media is traditional television networks. According to the
Philippine Information Agency “the average time daily spent reading newspapers
was 6.5 minutes, and the usage share was 7.8 percent, ranking third behind
television at 49.9 percent and the Internet at 32.6 percent”.27 Data journalism
looks more like a monopoly based on data driven pieces of TV networks. Naver is
also another point to be addressed in terms of development of data journalism.
Naver28 is a Korean search engine used generally as a news portal and the society
prefers to use Naver to access a news piece instead of visiting the actual page of
the media outlet as the Korea Herald mobile section editor Yang Sun-jin stated to
Philippine Information Agency. He also pointed that newsrooms invest and make
innovations to compete with Naver in his same speech (2018). According to the
research of Lim(2018), South Korean TV networks create “visually appealing” in
their data driven pieces however with less interactivity and it decreases user
engagement.
29
2.3. Data Journalism in Spain
2.3.1. Emergence of Data Journalism in Spain
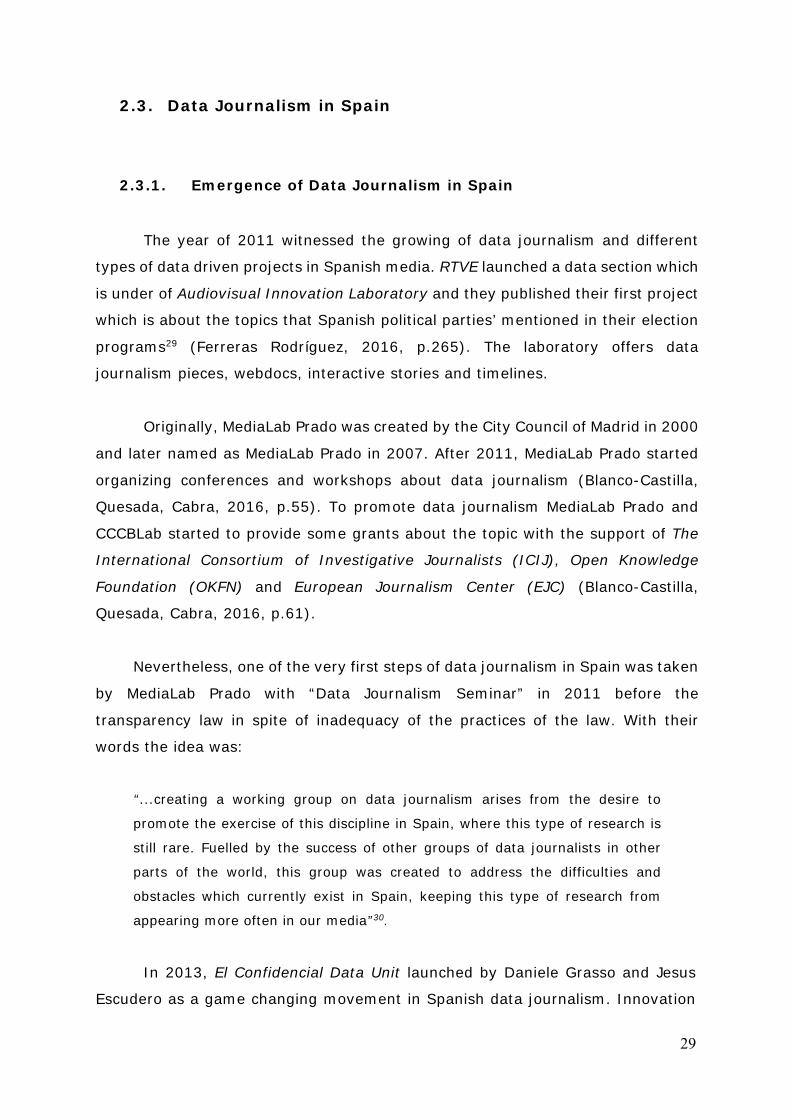
The year of 2011 witnessed the growing of data journalism and different
types of data driven projects in Spanish media. RTVE launched a data section which
is under of Audiovisual Innovation Laboratory and they published their first project
which is about the topics that Spanish political parties’ mentioned in their election
programs29 (Ferreras Rodríguez, 2016, p.265). The laboratory offers data
journalism pieces, webdocs, interactive stories and timelines.
Originally, MediaLab Prado was created by the City Council of Madrid in 2000
and later named as MediaLab Prado in 2007. After 2011, MediaLab Prado started
organizing conferences and workshops about data journalism (Blanco-Castilla,
Quesada, Cabra, 2016, p.55). To promote data journalism MediaLab Prado and
CCCBLab started to provide some grants about the topic with the support of The
International Consortium of Investigative Journalists (ICIJ), Open Knowledge
Foundation (OKFN) and European Journalism Center (EJC) (Blanco-Castilla,
Quesada, Cabra, 2016, p.61).
Nevertheless, one of the very first steps of data journalism in Spain was taken
by MediaLab Prado with “Data Journalism Seminar” in 2011 before the
transparency law in spite of inadequacy of the practices of the law. With their
words the idea was:
“...creating a working group on data journalism arises from the desire to
promote the exercise of this discipline in Spain, where this type of research is
still rare. Fuelled by the success of other groups of data journalists in other
parts of the world, this group was created to address the difficulties and
obstacles which currently exist in Spain, keeping this type of research from
appearing more often in our media”30.
In 2013, El Confidencial Data Unit launched by Daniele Grasso and Jesus
Escudero as a game changing movement in Spanish data journalism. Innovation
30
is El Confidencial Lab’s main component and with their words: “not to win the
race, but to change the rules. In El Confidencial Lab we think about how
technology is writing the future of journalism, from creativity, risk and the
possibilities that new tools offer to information and the media”. According to the
explanation of Daniele Grasso, Excel, Tableau, R, and SLQ are mostly used tools
in El Confidencial Lab (Arias, Sánchez-García, Redondo, 2018, p.288). El
Confidencial Lab put its signature under many important stories and successes
like their projects “The Migrant Files” and “Generation E.”. “The Migrant Files” won
an award from Data Journalism Awards in “Data Stories on a Single Topic” in 2014
(Ferreras Rodríguez, 2016, p.265) and this success followed by 3 nominations in
2017 and one nomination in 2019. El Confidencial is also a member of European
Data Journalism Network since 2017.31
El Español launched in 2015 by Pedro J. Ramirez and Antonio Delgado was
running a data unit (Rojas Torrijos and Rivera, 2016, p.7). El Español was mainly
into sports data journalism. Same researchers mentioned in another article which
is written in the same year that in the first 1.5 year, El Español published 19 sports
articles which were prepared with data visualisation techniques (Rojas Torrijos and
Rivera, 2016, p.7). In the same year El Mundo also launched its data unit under
Hugo Garrido. According to the conducted research of López, El Mundo generally
uses Excel, OpenRefine, Tabula, Kimono Tableau, CartoDB and D3 for data
journalism articles. El Mundo Data is an independent department however, they’re
collaborating with the editorial team when there’s an important issue to publish
(Rojas Torrijos and Rivera Hernandez, 2016b, p.20). According to the research of
Arias, Sánchez-García and Redondo(2018), there are only 3 news organizations
have an independent data journalism department which are El Confidencial, El
Diario, El Mundo while others (RTVE Lab, weblogs, Cuarto Poder) just have
participants about data journalism who’s working with the rest of the newsroom
(p.281).
Since 2015, some other media outlets started to adopt data journalism and
create data driven projects such as El Periodico and El Pais. However, not all of
them established a specific data department to achieve data journalism. El
Confidencial and El Mundo were working with data labs while others were working
with related departments and making collaborations such as the International
31
Consortium of Investigative Journalists (ICIJ) (Ferreras Rodriguez, 2016, p.270).
According to the literature about data journalism in Spain (Ferreras Rodríguez,
2016; La-Rosa and Sandoval-Martin, 2016; Appelgren and Salaverria, 2018;
Grassler, 2018; Arias et al., 2018), the main obstacle against the progress of data
journalism is economical problems, doubt about return on investment, lack of
technical and educational skills and traditional structures of Spanish newsrooms.
2.3.2. Access and Use of Data
Spain was one of the most problematic countries to establish a challenging
environment for data journalism in terms of media habits and laws in the context
of Spanish Transparency Law that was accepted in 2013 (La-Rosa and Sandoval-
Martin, 2016). Before this, the law about accessing public information was
prepared in 2012 but it was not implemented until Act 19/2013, of 9 December,
on Transparency, Access to Public Information, and Good Governance has passed
(Appelgren and Salaverria, 2018, p.988). The new law provided not only the data
of public administrations but also all data which is related to government and
public body (Article 2) with the rule of not being anonymous and request the
information with determined procedure (Article 17, Article 19)32 The main topics
of law were: “to guarantee the right to access information for all citizens”, “to
enforce transparency of all public administrations” and “to supervise the
observation of fair governance practices” (Appelgren and Salaverria, 2018,
p.988). Implementing the Transparency Law, Portal of Transparency launched in
the website ‘transparencia.gob.es’. However, Raúl Sánchez mentioned a problem
that still exists as: “there is not yet a culture of transparency among officials and
senior public sector officials” (Arias, Sánchez-García and Redondo, 2018, p.283).
According to the State of Press Freedom in Spain Report by International Press
Institute mentions the inadequacy of the transparency law in 5 points as:
“The law fails to recognise that the right of access to information is a
fundamental right. The law does not cover all public institutions. The term
“information” is inadequately defined. The law establishes a double negative
administrative silence. The Transparency Council, tasked with overseeing
compliance with the law, is not an independent body. ”(2015, p.23).
32
The transparency law was not equal to each public body. The information
that has to be transparent was only administrative and should have been just from
public institutions. In addition, requesting information was a problematic process
also. Related bodies who had to give information didn't have an obligation to
answer the request. If there is an unanswered request, it has been accepted as
denied without any explanation (2015. p.23). This deficiency was also a point to
discuss while talking about transparency.
La-Rosa and Sandoval-Martin(2016) found in their research that there is a
positive relationship between Transparency Law and development of data
journalism in Spain. However, according to the interviews in the research
transparency portal was not sufficient enough for data journalism and was taking
too much time to obtain data, so it was not officially helping. Also the same
research pointed two main obstacles against obtaining data for journalistic
practices in Spain as “the delay in answering requests of information that they
choose to respond” and “refusals to answer the many requests for public
information” (La-Rosa and Sandoval-Martin, 2016, p.1216).
2.3.3. Open Data Initiatives
Civio Foundation in their words: “is an independent, non-profit organization
based in Spain which monitors public authorities, reports to all citizens and lobbies
to achieve true and effective transparency within our institutions”.
Civio Foundation was launched in 2011 to “bring an end to opacity in public
affairs, informing citizens and using innovation to freely access the information
that matters”33. Civio Foundation is heard with their two important projects named
as “Where do my taxes go?”34 and “tuderechoasaber.es”35. “Where do my taxes
go?” is mainly fed from the general state budget data provided by the Ministry of
Finance and Public Administration. The data extracted and shared with society
through a website and included visualisations. “tuderechoasaber.es” which means
“your right to know” progressed between 2012 and 2015. The importance of the
project is that “tuderechoasaber.es” was the first website to request data from
33
public bodies even before the Portal of Transparency launched. Civio Foundation
currently has 5 active projects: “Medicamentalia” “Pardonometer” “Who's paid for
the work?” “Spain in flames” and “Who rules?”.
Maldita is also a data platform that works on fact-checking, database search,
verification techniques and content creating since 2018. In their words Maldita has
3 aims: “Monitor and control political discourse and promote transparency in public
and private institutions”, “verify and fight against misinformation” and “promote
media literacy and technological tools in order to create an aware community that
can defend itself from disinformation and lies in all areas”.36 Newtral is also
another initiative mainly based on production but also fact-checking since 2018
with the founder Ana Pastor. Newtral consists of journalists and fact-checking team
updates and verifies data every day. Data verification occurs in three different
filters and divided into 4 categories in the end which are “true”, ”truth to media”,
”deceiving” and ”false” according to the explanation on their website.37 Maldita and
Newtral shows in the past months that they started to win their battle against fake
contents by signing a collaboration agreement with Facebook to evaluate and
verify the content that is published and reduce the amount of sharing according to
the results.38
34
2.4. Sports Data Journalism
2.4.1. Evolution of Sports Data Journalism
As already mentioned, data journalism is a journalistic approach that needs
to deal with data, statistics and design to achieve its goal. In this regard, sports
and data journalism perfectly fit each other because sports offers unlimited data
in every branch to understand and analyze the game for both audience, media
and the professionals in this business. However, there is still a complex
relationship between sports and data in terms of obtaining data and gaining skills
to analyze and visualise that in a proper way. Generally national newspapers
publish a game story with basic data such as times, passes, points, goals, fouls
etc, in other words, lack of context and deeper meaning. Minto(2016) argues that
most of the sports news don’t have statistical analysis, they just have “classical
use of numbers to fill space”. Also data journalist John Burn-Murdoch from the
Financial Times explains the importance of data in sports journalism with these
words:
“The current situation of digital news distribution dictates that the media often
have to tell the story without the user even visiting their website. During an
event like the Olympics, this need becomes more acute because many people
follow them through the internet to keep track of the dozens of events held
there each day. A clear graph is a great opportunity to make the information
stand out within such a large amount of data, and it can be fully understood in
the same moment” (Rojas Torrijos and Rivera Hernandez, 2016).
In addition, Minto also examines the availability of sports data for
journalists. Mair(2017) also claims that sports data is a totally different business
than sports journalism. There are two ways to obtain data for sports which are
“associations and sports governing bodies” and “private data companies”. Most of
the associations and sports governing bodies have open data (within limits) but
on the other hand, sports data is a growing business and companies such as Opta,
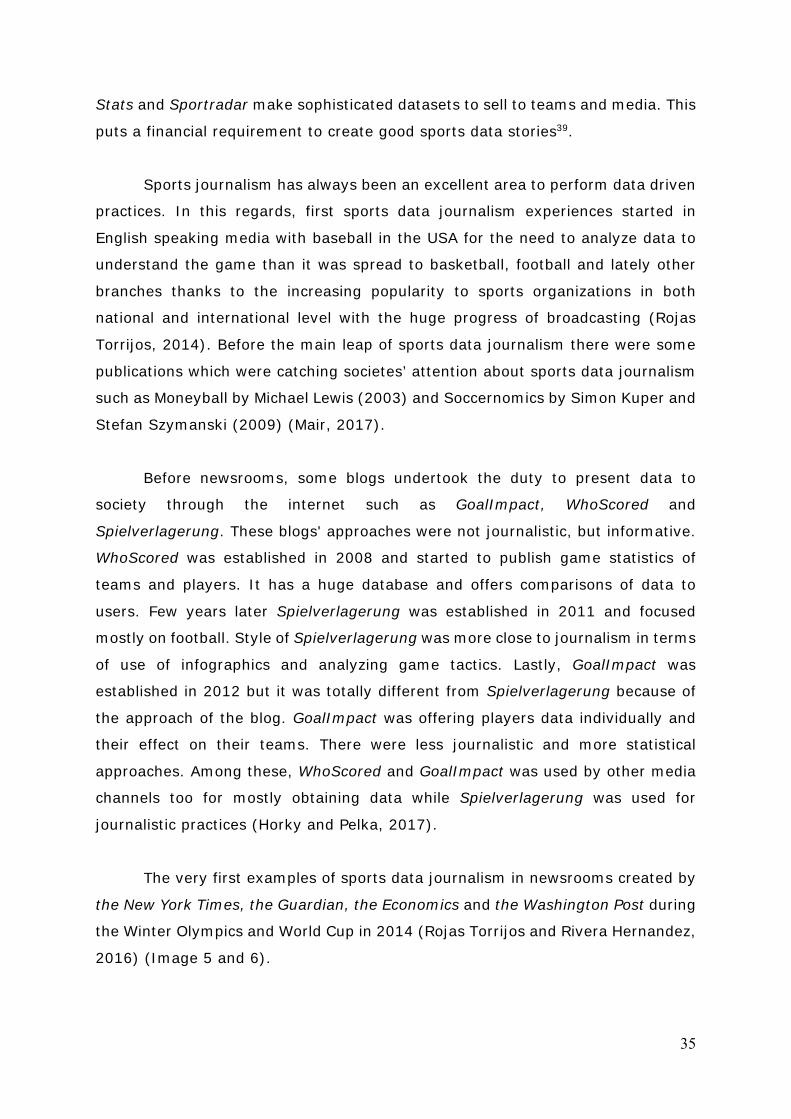
35
Stats and Sportradar make sophisticated datasets to sell to teams and media. This
puts a financial requirement to create good sports data stories39.
Sports journalism has always been an excellent area to perform data driven
practices. In this regards, first sports data journalism experiences started in
English speaking media with baseball in the USA for the need to analyze data to
understand the game than it was spread to basketball, football and lately other
branches thanks to the increasing popularity to sports organizations in both
national and international level with the huge progress of broadcasting (Rojas
Torrijos, 2014). Before the main leap of sports data journalism there were some
publications which were catching societes’ attention about sports data journalism
such as Moneyball by Michael Lewis (2003) and Soccernomics by Simon Kuper and
Stefan Szymanski (2009) (Mair, 2017).
Before newsrooms, some blogs undertook the duty to present data to
society through the internet such as GoalImpact, WhoScored and
Spielverlagerung. These blogs' approaches were not journalistic, but informative.
WhoScored was established in 2008 and started to publish game statistics of
teams and players. It has a huge database and offers comparisons of data to
users. Few years later Spielverlagerung was established in 2011 and focused
mostly on football. Style of Spielverlagerung was more close to journalism in terms
of use of infographics and analyzing game tactics. Lastly, GoalImpact was
established in 2012 but it was totally different from Spielverlagerung because of
the approach of the blog. GoalImpact was offering players data individually and
their effect on their teams. There were less journalistic and more statistical
approaches. Among these, WhoScored and GoalImpact was used by other media
channels too for mostly obtaining data while Spielverlagerung was used for
journalistic practices (Horky and Pelka, 2017).
The very first examples of sports data journalism in newsrooms created by
the New York Times, the Guardian, the Economics and the Washington Post during
the Winter Olympics and World Cup in 2014 (Rojas Torrijos and Rivera Hernandez,
2016) (Image 5 and 6).
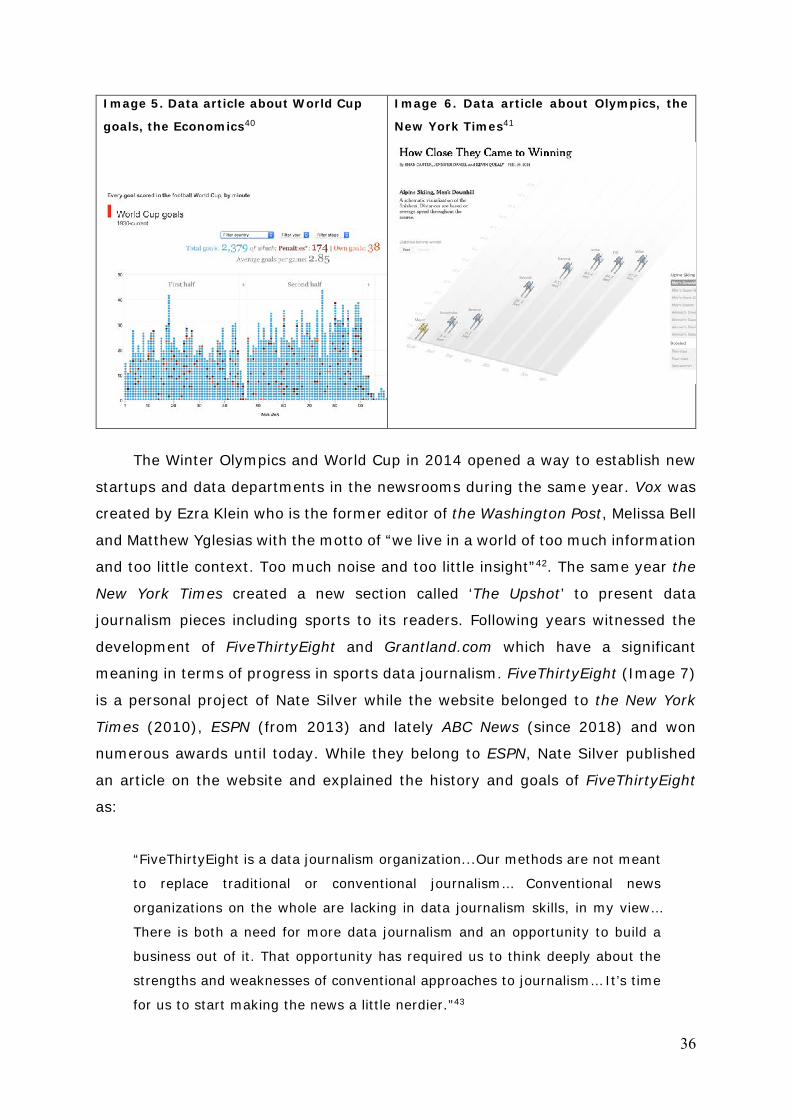
36
Image 5. Data article about World Cup
goals, the Economics40
Image 6. Data article about Olympics, the
New York Times41
The Winter Olympics and World Cup in 2014 opened a way to establish new
startups and data departments in the newsrooms during the same year. Vox was
created by Ezra Klein who is the former editor of the Washington Post, Melissa Bell
and Matthew Yglesias with the motto of “we live in a world of too much information
and too little context. Too much noise and too little insight”42. The same year the
New York Times created a new section called ‘The Upshot’ to present data
journalism pieces including sports to its readers. Following years witnessed the
development of FiveThirtyEight and Grantland.com which have a significant
meaning in terms of progress in sports data journalism. FiveThirtyEight (Image 7)
is a personal project of Nate Silver while the website belonged to the New York
Times (2010), ESPN (from 2013) and lately ABC News (since 2018) and won
numerous awards until today. While they belong to ESPN, Nate Silver published
an article on the website and explained the history and goals of FiveThirtyEight
as:
“FiveThirtyEight is a data journalism organization...Our methods are not meant
to replace traditional or conventional journalism… Conventional news
organizations on the whole are lacking in data journalism skills, in my view…
There is both a need for more data journalism and an opportunity to build a
business out of it. That opportunity has required us to think deeply about the
strengths and weaknesses of conventional approaches to journalism… It’s time
for us to start making the news a little nerdier.”43
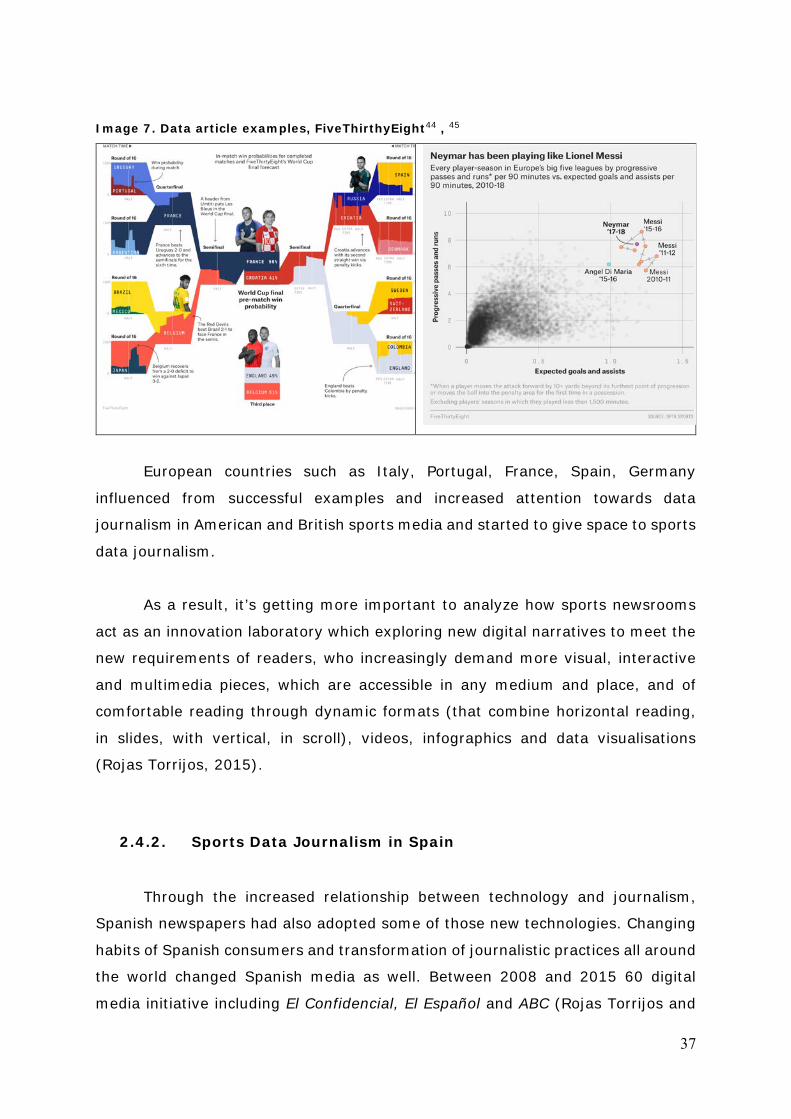
37
Image 7. Data article examples, FiveThirthyEight44 , 45
European countries such as Italy, Portugal, France, Spain, Germany
influenced from successful examples and increased attention towards data
journalism in American and British sports media and started to give space to sports
data journalism.
As a result, it’s getting more important to analyze how sports newsrooms
act as an innovation laboratory which exploring new digital narratives to meet the
new requirements of readers, who increasingly demand more visual, interactive
and multimedia pieces, which are accessible in any medium and place, and of
comfortable reading through dynamic formats (that combine horizontal reading,
in slides, with vertical, in scroll), videos, infographics and data visualisations
(Rojas Torrijos, 2015).
2.4.2. Sports Data Journalism in Spain
Through the increased relationship between technology and journalism,
Spanish newspapers had also adopted some of those new technologies. Changing
habits of Spanish consumers and transformation of journalistic practices all around
the world changed Spanish media as well. Between 2008 and 2015 60 digital
media initiative including El Confidencial, El Español and ABC (Rojas Torrijos and
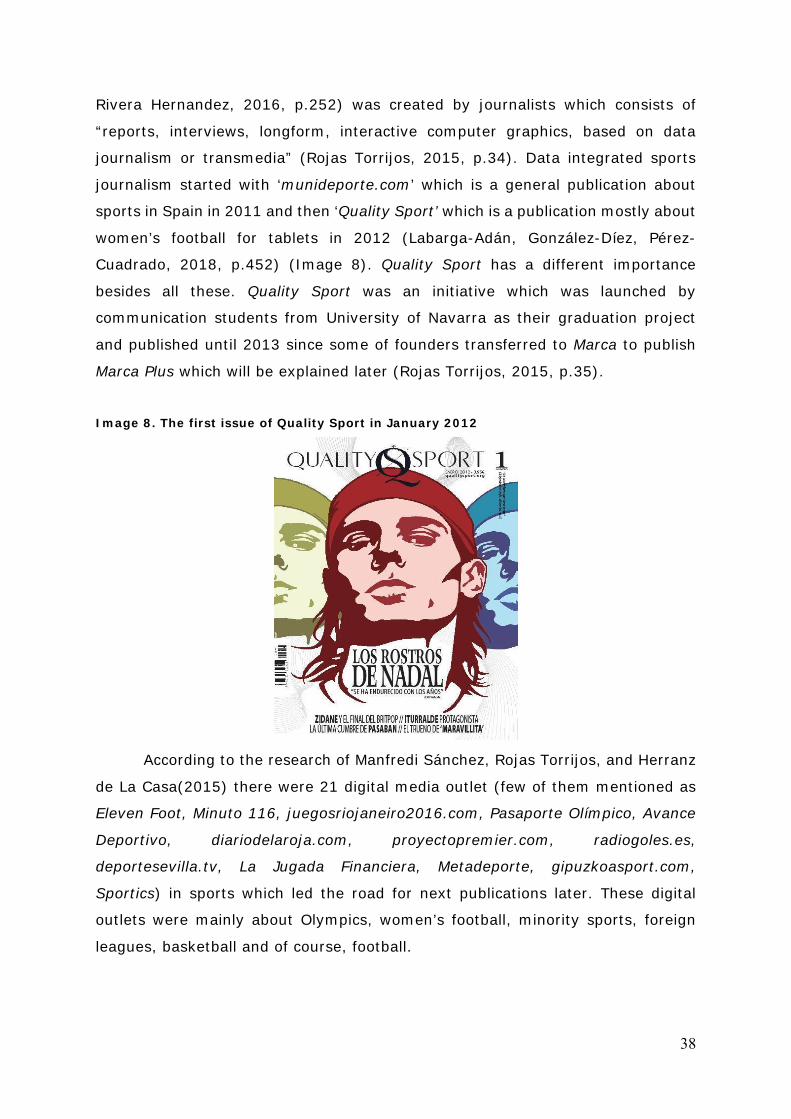
38
Rivera Hernandez, 2016, p.252) was created by journalists which consists of
“reports, interviews, longform, interactive computer graphics, based on data
journalism or transmedia” (Rojas Torrijos, 2015, p.34). Data integrated sports
journalism started with ‘munideporte.com’ which is a general publication about
sports in Spain in 2011 and then ‘Quality Sport’ which is a publication mostly about
women’s football for tablets in 2012 (Labarga-Adán, González-Díez, Pérez-
Cuadrado, 2018, p.452) (Image 8). Quality Sport has a different importance
besides all these. Quality Sport was an initiative which was launched by
communication students from University of Navarra as their graduation project
and published until 2013 since some of founders transferred to Marca to publish
Marca Plus which will be explained later (Rojas Torrijos, 2015, p.35).
Image 8. The first issue of Quality Sport in January 2012
According to the research of Manfredi Sánchez, Rojas Torrijos, and Herranz
de La Casa(2015) there were 21 digital media outlet (few of them mentioned as
Eleven Foot, Minuto 116, juegosriojaneiro2016.com, Pasaporte Olímpico, Avance
Deportivo, diariodelaroja.com, proyectopremier.com, radiogoles.es,
deportesevilla.tv, La Jugada Financiera, Metadeporte, gipuzkoasport.com,
Sportics) in sports which led the road for next publications later. These digital
outlets were mainly about Olympics, women’s football, minority sports, foreign
leagues, basketball and of course, football.
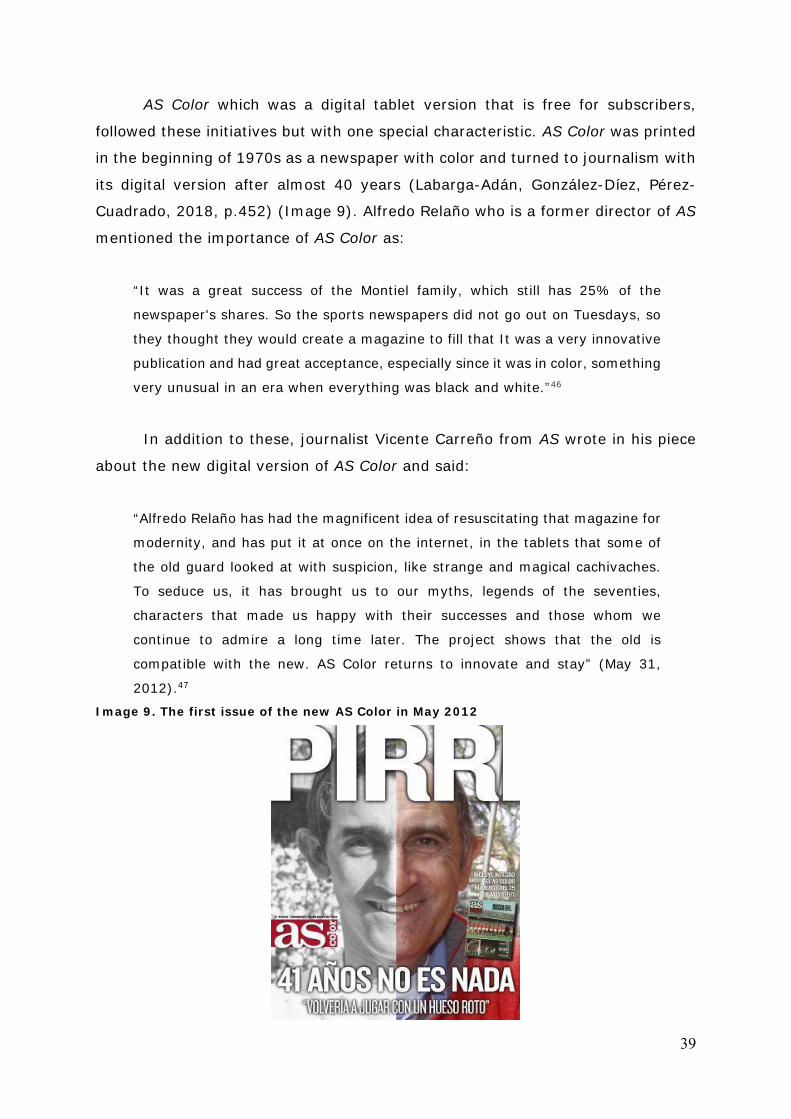
39
AS Color which was a digital tablet version that is free for subscribers,
followed these initiatives but with one special characteristic. AS Color was printed
in the beginning of 1970s as a newspaper with color and turned to journalism with
its digital version after almost 40 years (Labarga-Adán, González-Díez, Pérez-
Cuadrado, 2018, p.452) (Image 9). Alfredo Relaño who is a former director of AS
mentioned the importance of AS Color as:
“It was a great success of the Montiel family, which still has 25% of the
newspaper's shares. So the sports newspapers did not go out on Tuesdays, so
they thought they would create a magazine to fill that It was a very innovative
publication and had great acceptance, especially since it was in color, something
very unusual in an era when everything was black and white.”46
In addition to these, journalist Vicente Carreño from AS wrote in his piece
about the new digital version of AS Color and said:
“Alfredo Relaño has had the magnificent idea of resuscitating that magazine for
modernity, and has put it at once on the internet, in the tablets that some of
the old guard looked at with suspicion, like strange and magical cachivaches.
To seduce us, it has brought us to our myths, legends of the seventies,
characters that made us happy with their successes and those whom we
continue to admire a long time later. The project shows that the old is
compatible with the new. AS Color returns to innovate and stay” (May 31,
2012).47
Image 9. The first issue of the new AS Color in May 2012
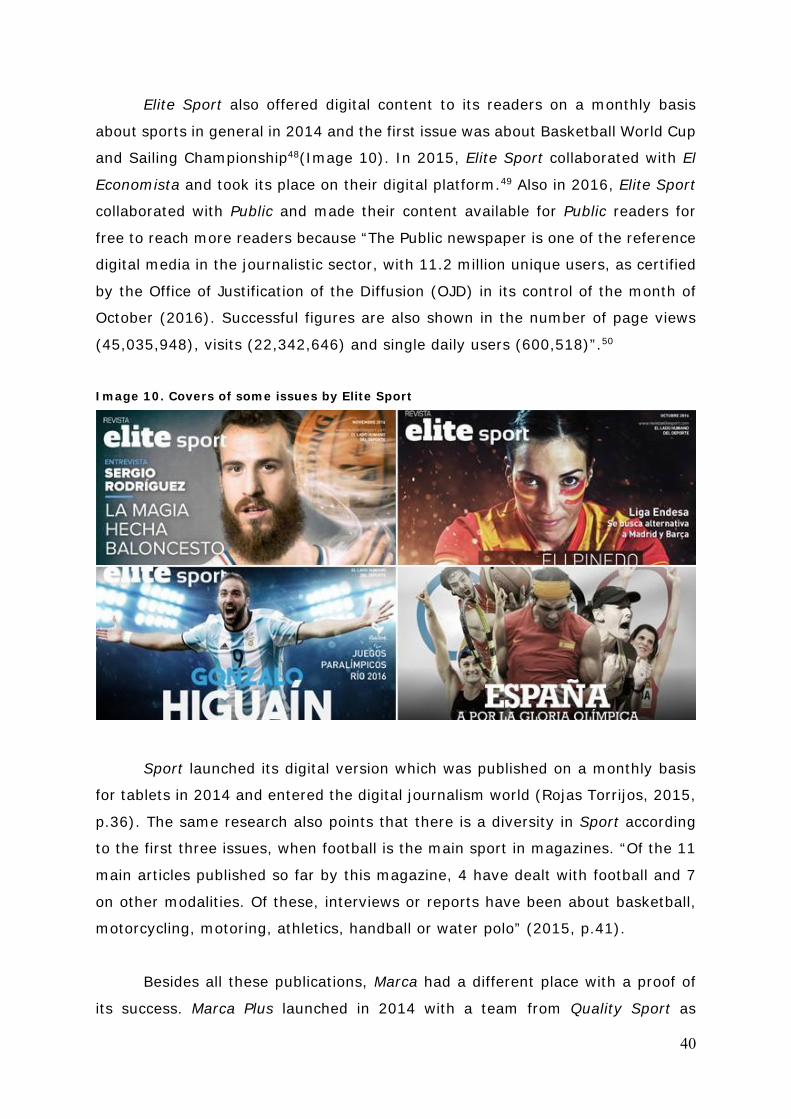
40
Elite Sport also offered digital content to its readers on a monthly basis
about sports in general in 2014 and the first issue was about Basketball World Cup
and Sailing Championship48(Image 10). In 2015, Elite Sport collaborated with El
Economista and took its place on their digital platform.49 Also in 2016, Elite Sport
collaborated with Public and made their content available for Public readers for
free to reach more readers because “The Public newspaper is one of the reference
digital media in the journalistic sector, with 11.2 million unique users, as certified
by the Office of Justification of the Diffusion (OJD) in its control of the month of
October (2016). Successful figures are also shown in the number of page views
(45,035,948), visits (22,342,646) and single daily users (600,518)”.50
Image 10. Covers of some issues by Elite Sport
Sport launched its digital version which was published on a monthly basis
for tablets in 2014 and entered the digital journalism world (Rojas Torrijos, 2015,
p.36). The same research also points that there is a diversity in Sport according
to the first three issues, when football is the main sport in magazines. “Of the 11
main articles published so far by this magazine, 4 have dealt with football and 7
on other modalities. Of these, interviews or reports have been about basketball,
motorcycling, motoring, athletics, handball or water polo” (2015, p.41).
Besides all these publications, Marca had a different place with a proof of
its success. Marca Plus launched in 2014 with a team from Quality Sport as
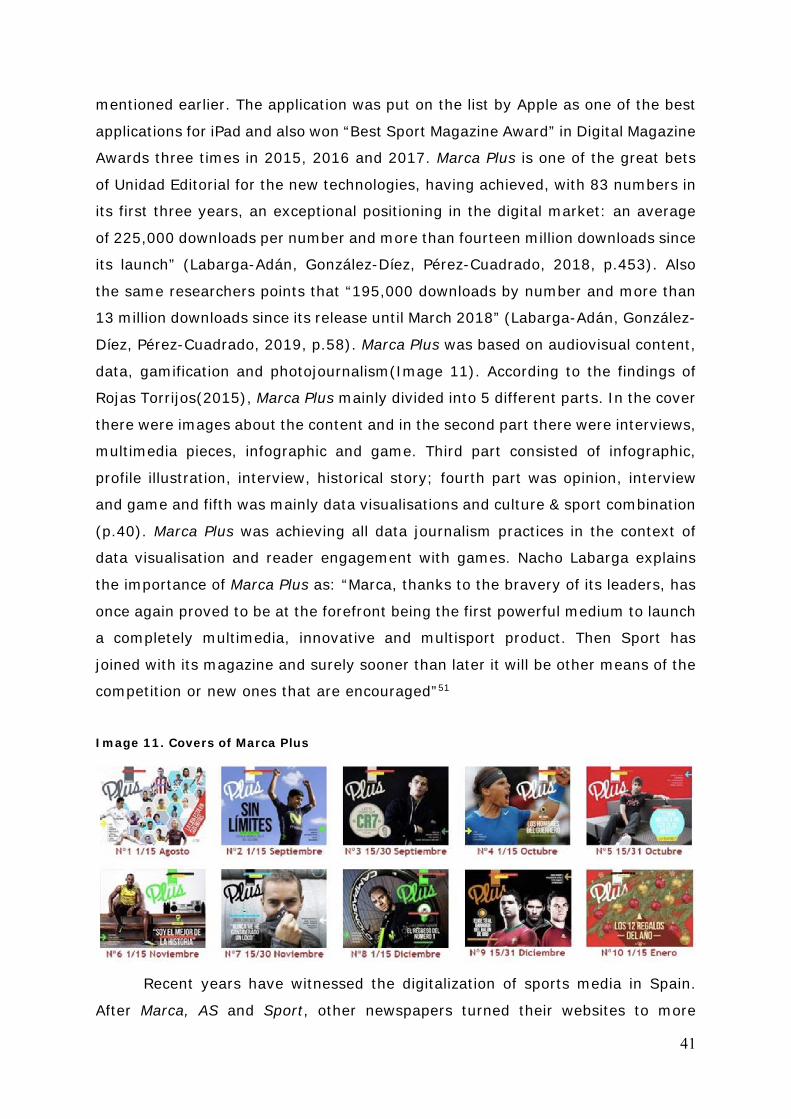
41
mentioned earlier. The application was put on the list by Apple as one of the best
applications for iPad and also won “Best Sport Magazine Award” in Digital Magazine
Awards three times in 2015, 2016 and 2017. Marca Plus is one of the great bets
of Unidad Editorial for the new technologies, having achieved, with 83 numbers in
its first three years, an exceptional positioning in the digital market: an average
of 225,000 downloads per number and more than fourteen million downloads since
its launch” (Labarga-Adán, González-Díez, Pérez-Cuadrado, 2018, p.453). Also
the same researchers points that “195,000 downloads by number and more than
13 million downloads since its release until March 2018” (Labarga-Adán, González-
Díez, Pérez-Cuadrado, 2019, p.58). Marca Plus was based on audiovisual content,
data, gamification and photojournalism(Image 11). According to the findings of
Rojas Torrijos(2015), Marca Plus mainly divided into 5 different parts. In the cover
there were images about the content and in the second part there were interviews,
multimedia pieces, infographic and game. Third part consisted of infographic,
profile illustration, interview, historical story; fourth part was opinion, interview
and game and fifth was mainly data visualisations and culture & sport combination
(p.40). Marca Plus was achieving all data journalism practices in the context of
data visualisation and reader engagement with games. Nacho Labarga explains
the importance of Marca Plus as: “Marca, thanks to the bravery of its leaders, has
once again proved to be at the forefront being the first powerful medium to launch
a completely multimedia, innovative and multisport product. Then Sport has
joined with its magazine and surely sooner than later it will be other means of the
competition or new ones that are encouraged”51
Image 11. Covers of Marca Plus
Recent years have witnessed the digitalization of sports media in Spain.
After Marca, AS and Sport, other newspapers turned their websites to more
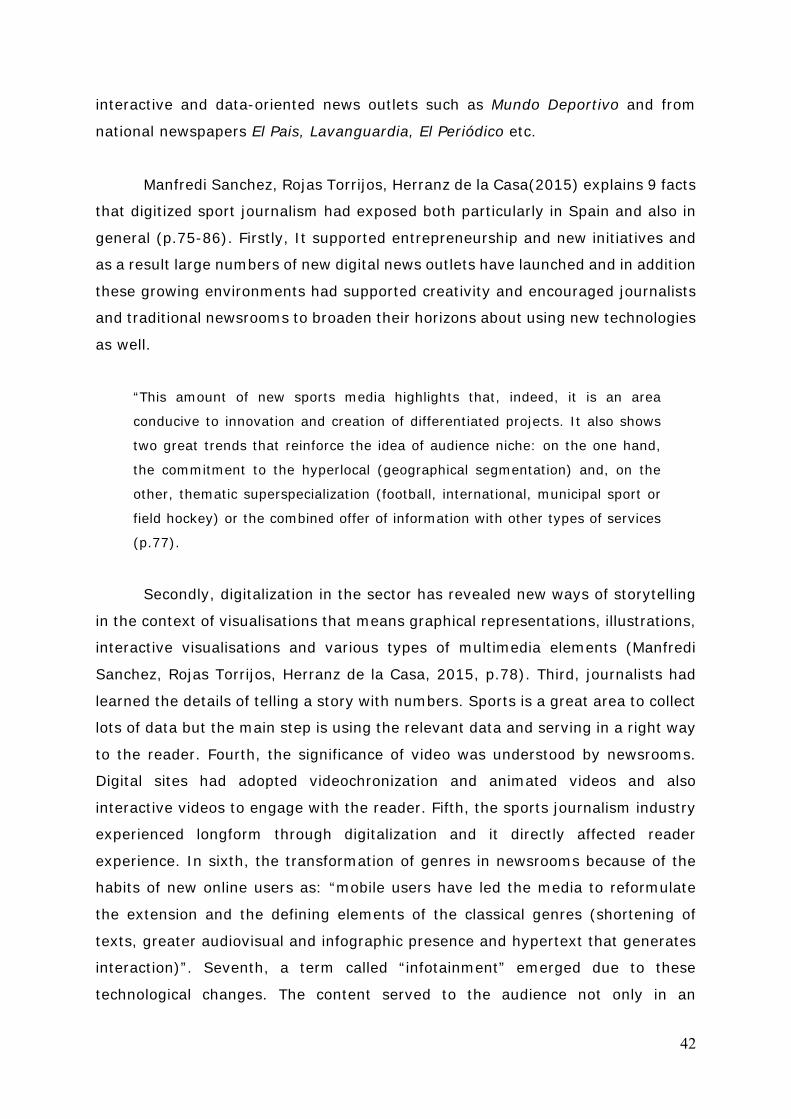
42
interactive and data-oriented news outlets such as Mundo Deportivo and from
national newspapers El Pais, Lavanguardia, El Periódico etc.
Manfredi Sanchez, Rojas Torrijos, Herranz de la Casa(2015) explains 9 facts
that digitized sport journalism had exposed both particularly in Spain and also in
general (p.75-86). Firstly, It supported entrepreneurship and new initiatives and
as a result large numbers of new digital news outlets have launched and in addition
these growing environments had supported creativity and encouraged journalists
and traditional newsrooms to broaden their horizons about using new technologies
as well.
“This amount of new sports media highlights that, indeed, it is an area
conducive to innovation and creation of differentiated projects. It also shows
two great trends that reinforce the idea of audience niche: on the one hand,
the commitment to the hyperlocal (geographical segmentation) and, on the
other, thematic superspecialization (football, international, municipal sport or
field hockey) or the combined offer of information with other types of services
(p.77).
Secondly, digitalization in the sector has revealed new ways of storytelling
in the context of visualisations that means graphical representations, illustrations,
interactive visualisations and various types of multimedia elements (Manfredi
Sanchez, Rojas Torrijos, Herranz de la Casa, 2015, p.78). Third, journalists had
learned the details of telling a story with numbers. Sports is a great area to collect
lots of data but the main step is using the relevant data and serving in a right way
to the reader. Fourth, the significance of video was understood by newsrooms.
Digital sites had adopted videochronization and animated videos and also
interactive videos to engage with the reader. Fifth, the sports journalism industry
experienced longform through digitalization and it directly affected reader
experience. In sixth, the transformation of genres in newsrooms because of the
habits of new online users as: “mobile users have led the media to reformulate
the extension and the defining elements of the classical genres (shortening of
texts, greater audiovisual and infographic presence and hypertext that generates
interaction)”. Seventh, a term called “infotainment” emerged due to these
technological changes. The content served to the audience not only in an
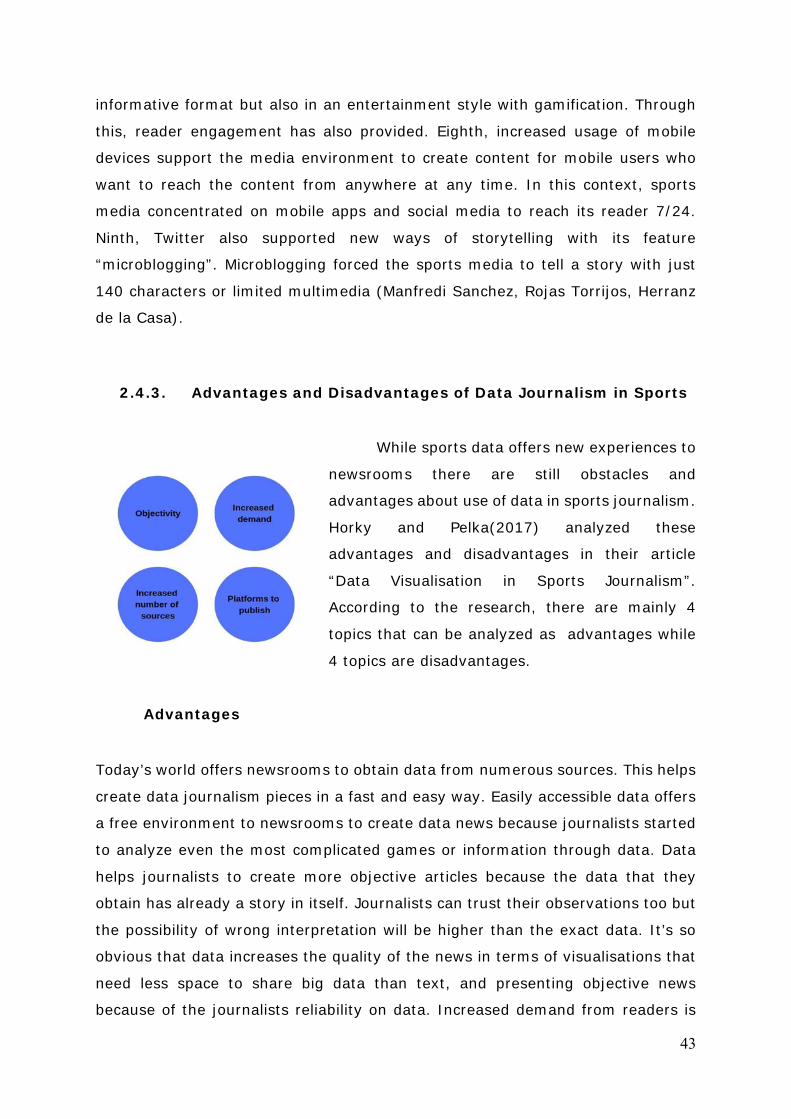
43
informative format but also in an entertainment style with gamification. Through
this, reader engagement has also provided. Eighth, increased usage of mobile
devices support the media environment to create content for mobile users who
want to reach the content from anywhere at any time. In this context, sports
media concentrated on mobile apps and social media to reach its reader 7/24.
Ninth, Twitter also supported new ways of storytelling with its feature
“microblogging”. Microblogging forced the sports media to tell a story with just
140 characters or limited multimedia (Manfredi Sanchez, Rojas Torrijos, Herranz
de la Casa).
2.4.3. Advantages and Disadvantages of Data Journalism in Sports
While sports data offers new experiences to
newsrooms there are still obstacles and
advantages about use of data in sports journalism.
Horky and Pelka(2017) analyzed these
advantages and disadvantages in their article
“Data Visualisation in Sports Journalism”.
According to the research, there are mainly 4
topics that can be analyzed as advantages while
4 topics are disadvantages.
Advantages
Today’s world offers newsrooms to obtain data from numerous sources. This helps
create data journalism pieces in a fast and easy way. Easily accessible data offers
a free environment to newsrooms to create data news because journalists started
to analyze even the most complicated games or information through data. Data
helps journalists to create more objective articles because the data that they
obtain has already a story in itself. Journalists can trust their observations too but
the possibility of wrong interpretation will be higher than the exact data. It’s so
obvious that data increases the quality of the news in terms of visualisations that
need less space to share big data than text, and presenting objective news
because of the journalists reliability on data. Increased demand from readers is
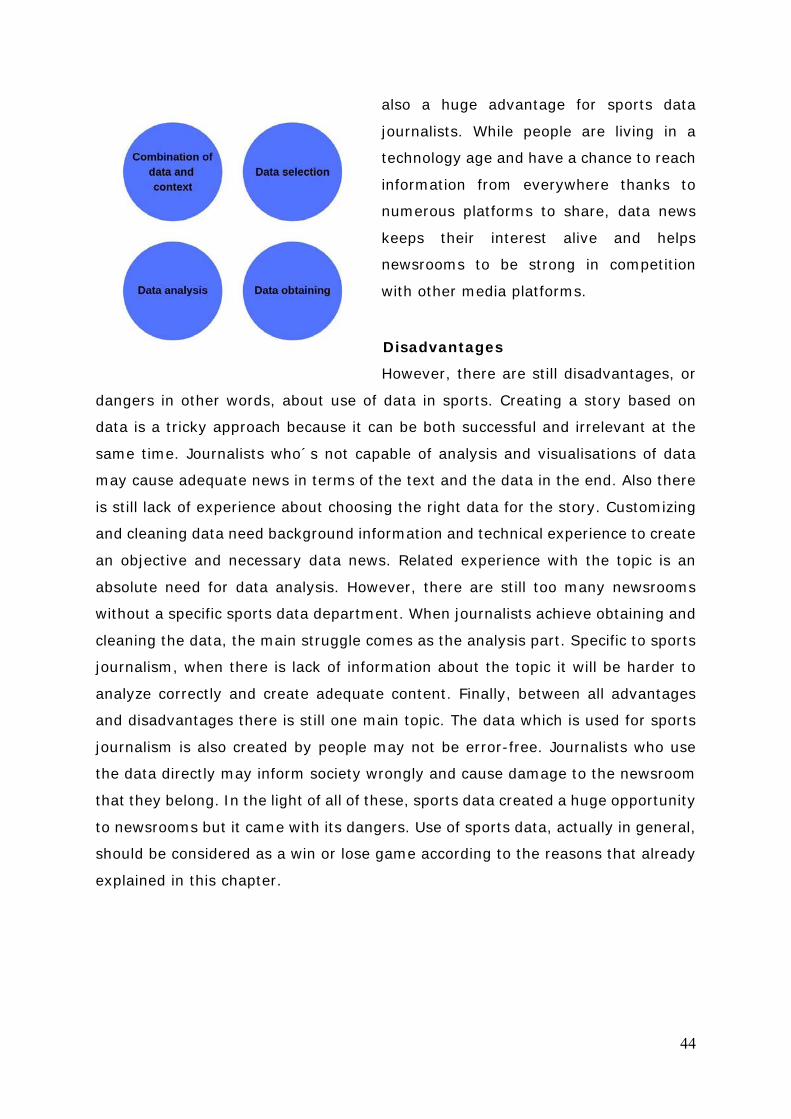
44
also a huge advantage for sports data
journalists. While people are living in a
technology age and have a chance to reach
information from everywhere thanks to
numerous platforms to share, data news
keeps their interest alive and helps
newsrooms to be strong in competition
with other media platforms.
Disadvantages
However, there are still disadvantages, or
dangers in other words, about use of data in sports. Creating a story based on
data is a tricky approach because it can be both successful and irrelevant at the
same time. Journalists who´s not capable of analysis and visualisations of data
may cause adequate news in terms of the text and the data in the end. Also there
is still lack of experience about choosing the right data for the story. Customizing
and cleaning data need background information and technical experience to create
an objective and necessary data news. Related experience with the topic is an
absolute need for data analysis. However, there are still too many newsrooms
without a specific sports data department. When journalists achieve obtaining and
cleaning the data, the main struggle comes as the analysis part. Specific to sports
journalism, when there is lack of information about the topic it will be harder to
analyze correctly and create adequate content. Finally, between all advantages
and disadvantages there is still one main topic. The data which is used for sports
journalism is also created by people may not be error-free. Journalists who use
the data directly may inform society wrongly and cause damage to the newsroom
that they belong. In the light of all of these, sports data created a huge opportunity
to newsrooms but it came with its dangers. Use of sports data, actually in general,
should be considered as a win or lose game according to the reasons that already
explained in this chapter.
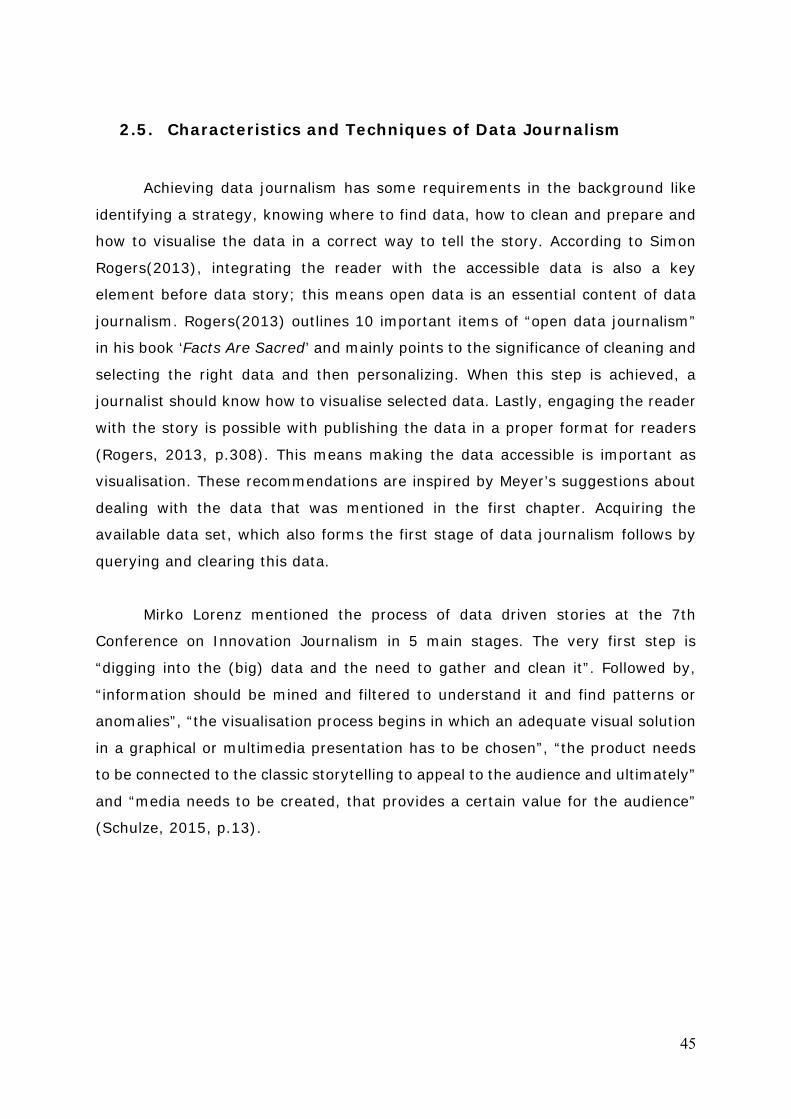
45
2.5. Characteristics and Techniques of Data Journalism
Achieving data journalism has some requirements in the background like
identifying a strategy, knowing where to find data, how to clean and prepare and
how to visualise the data in a correct way to tell the story. According to Simon
Rogers(2013), integrating the reader with the accessible data is also a key
element before data story; this means open data is an essential content of data
journalism. Rogers(2013) outlines 10 important items of “open data journalism”
in his book ‘Facts Are Sacred’ and mainly points to the significance of cleaning and
selecting the right data and then personalizing. When this step is achieved, a
journalist should know how to visualise selected data. Lastly, engaging the reader
with the story is possible with publishing the data in a proper format for readers
(Rogers, 2013, p.308). This means making the data accessible is important as
visualisation. These recommendations are inspired by Meyer’s suggestions about
dealing with the data that was mentioned in the first chapter. Acquiring the
available data set, which also forms the first stage of data journalism follows by
querying and clearing this data.
Mirko Lorenz mentioned the process of data driven stories at the 7th
Conference on Innovation Journalism in 5 main stages. The very first step is
“digging into the (big) data and the need to gather and clean it”. Followed by,
“information should be mined and filtered to understand it and find patterns or
anomalies”, “the visualisation process begins in which an adequate visual solution
in a graphical or multimedia presentation has to be chosen”, “the product needs
to be connected to the classic storytelling to appeal to the audience and ultimately”
and “media needs to be created, that provides a certain value for the audience”
(Schulze, 2015, p.13).
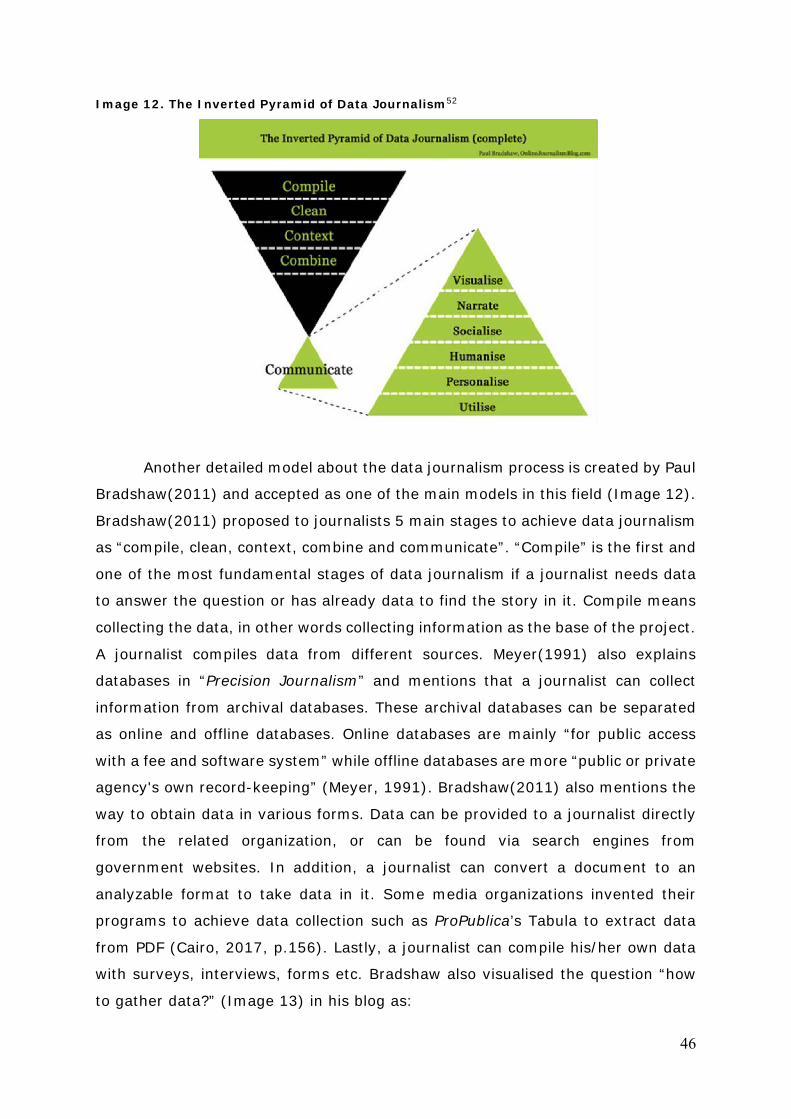
46
Image 12. The Inverted Pyramid of Data Journalism52
Another detailed model about the data journalism process is created by Paul
Bradshaw(2011) and accepted as one of the main models in this field (Image 12).
Bradshaw(2011) proposed to journalists 5 main stages to achieve data journalism
as “compile, clean, context, combine and communicate”. “Compile” is the first and
one of the most fundamental stages of data journalism if a journalist needs data
to answer the question or has already data to find the story in it. Compile means
collecting the data, in other words collecting information as the base of the project.
A journalist compiles data from different sources. Meyer(1991) also explains
databases in “Precision Journalism” and mentions that a journalist can collect
information from archival databases. These archival databases can be separated
as online and offline databases. Online databases are mainly “for public access
with a fee and software system” while offline databases are more “public or private
agency's own record-keeping” (Meyer, 1991). Bradshaw(2011) also mentions the
way to obtain data in various forms. Data can be provided to a journalist directly
from the related organization, or can be found via search engines from
government websites. In addition, a journalist can convert a document to an
analyzable format to take data in it. Some media organizations invented their
programs to achieve data collection such as ProPublica’s Tabula to extract data
from PDF (Cairo, 2017, p.156). Lastly, a journalist can compile his/her own data
with surveys, interviews, forms etc. Bradshaw also visualised the question “how
to gather data?” (Image 13) in his blog as:
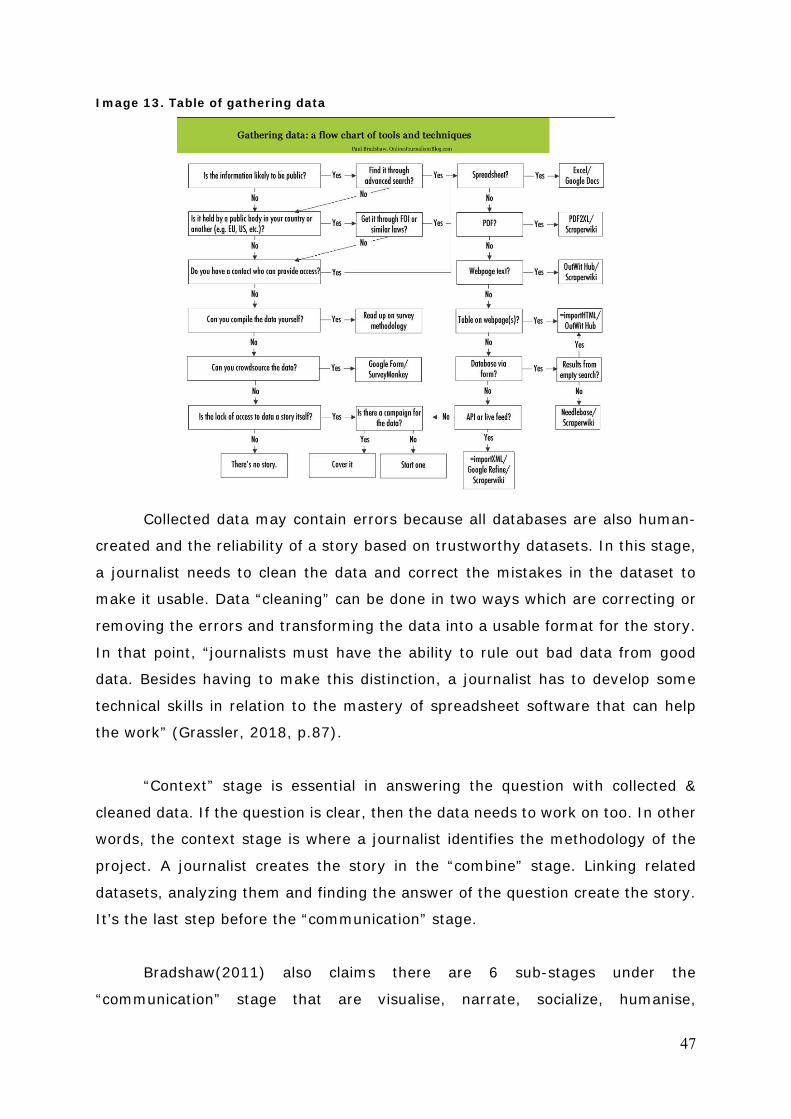
47
Image 13. Table of gathering data
Collected data may contain errors because all databases are also human-
created and the reliability of a story based on trustworthy datasets. In this stage,
a journalist needs to clean the data and correct the mistakes in the dataset to
make it usable. Data “cleaning” can be done in two ways which are correcting or
removing the errors and transforming the data into a usable format for the story.
In that point, “journalists must have the ability to rule out bad data from good
data. Besides having to make this distinction, a journalist has to develop some
technical skills in relation to the mastery of spreadsheet software that can help
the work” (Grassler, 2018, p.87).
“Context” stage is essential in answering the question with collected &
cleaned data. If the question is clear, then the data needs to work on too. In other
words, the context stage is where a journalist identifies the methodology of the
project. A journalist creates the story in the “combine” stage. Linking related
datasets, analyzing them and finding the answer of the question create the story.
It’s the last step before the “communication” stage.
Bradshaw(2011) also claims there are 6 sub-stages under the
“communication” stage that are visualise, narrate, socialize, humanise,
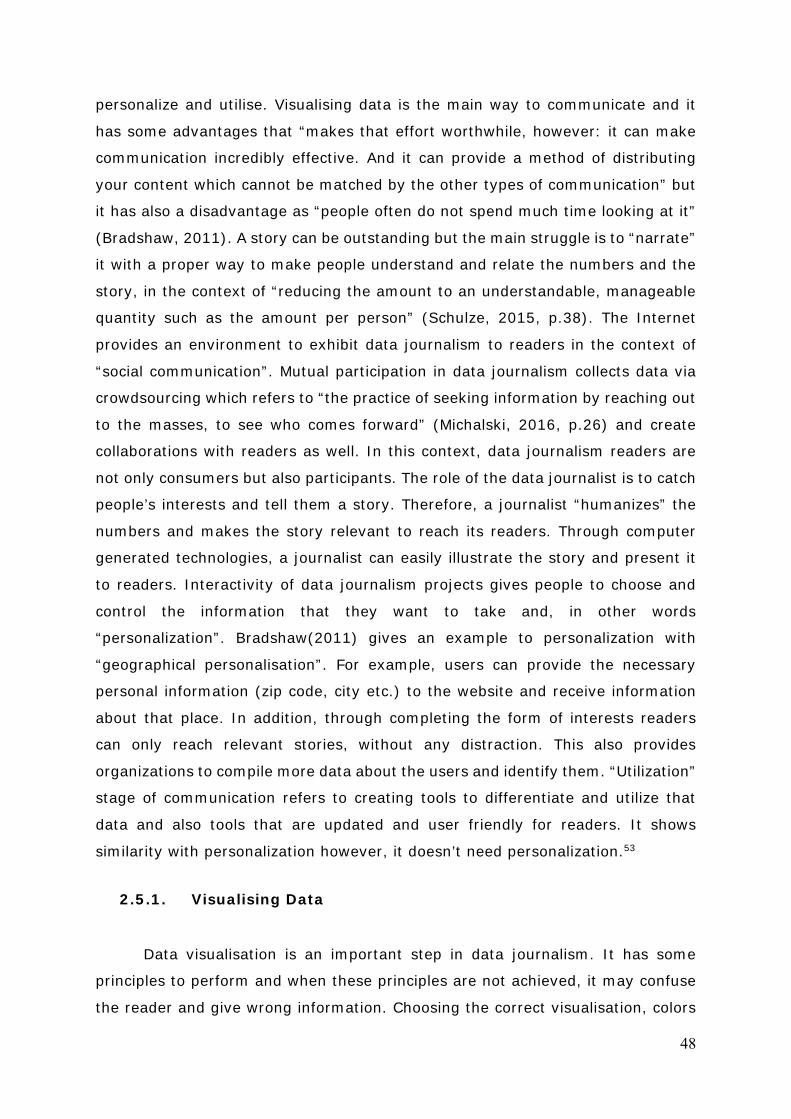
48
personalize and utilise. Visualising data is the main way to communicate and it
has some advantages that “makes that effort worthwhile, however: it can make
communication incredibly effective. And it can provide a method of distributing
your content which cannot be matched by the other types of communication” but
it has also a disadvantage as “people often do not spend much time looking at it”
(Bradshaw, 2011). A story can be outstanding but the main struggle is to “narrate”
it with a proper way to make people understand and relate the numbers and the
story, in the context of “reducing the amount to an understandable, manageable
quantity such as the amount per person” (Schulze, 2015, p.38). The Internet
provides an environment to exhibit data journalism to readers in the context of
“social communication”. Mutual participation in data journalism collects data via
crowdsourcing which refers to “the practice of seeking information by reaching out
to the masses, to see who comes forward” (Michalski, 2016, p.26) and create
collaborations with readers as well. In this context, data journalism readers are
not only consumers but also participants. The role of the data journalist is to catch
people’s interests and tell them a story. Therefore, a journalist “humanizes” the
numbers and makes the story relevant to reach its readers. Through computer
generated technologies, a journalist can easily illustrate the story and present it
to readers. Interactivity of data journalism projects gives people to choose and
control the information that they want to take and, in other words
“personalization”. Bradshaw(2011) gives an example to personalization with
“geographical personalisation”. For example, users can provide the necessary
personal information (zip code, city etc.) to the website and receive information
about that place. In addition, through completing the form of interests readers
can only reach relevant stories, without any distraction. This also provides
organizations to compile more data about the users and identify them. “Utilization”
stage of communication refers to creating tools to differentiate and utilize that
data and also tools that are updated and user friendly for readers. It shows
similarity with personalization however, it doesn’t need personalization.53
2.5.1. Visualising Data
Data visualisation is an important step in data journalism. It has some
principles to perform and when these principles are not achieved, it may confuse
the reader and give wrong information. Choosing the correct visualisation, colors
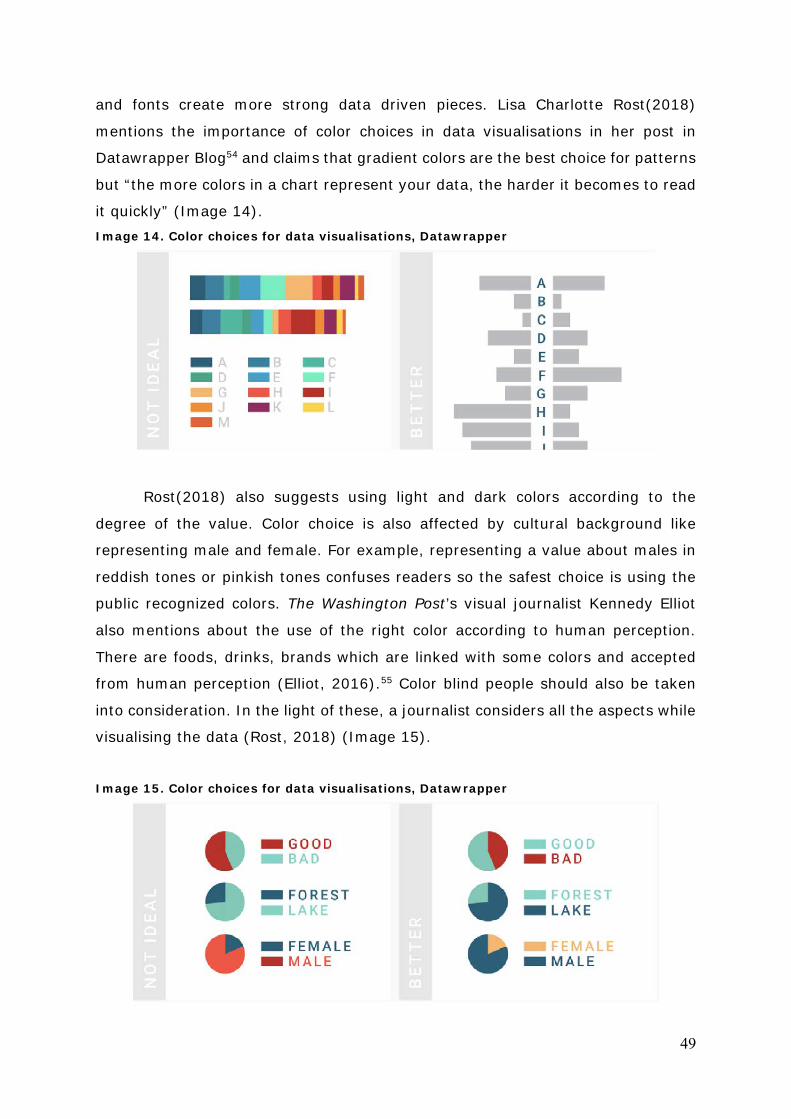
49
and fonts create more strong data driven pieces. Lisa Charlotte Rost(2018)
mentions the importance of color choices in data visualisations in her post in
Datawrapper Blog54 and claims that gradient colors are the best choice for patterns
but “the more colors in a chart represent your data, the harder it becomes to read
it quickly” (Image 14). Image 14. Color choices for data visualisations, Datawrapper
Rost(2018) also suggests using light and dark colors according to the
degree of the value. Color choice is also affected by cultural background like
representing male and female. For example, representing a value about males in
reddish tones or pinkish tones confuses readers so the safest choice is using the
public recognized colors. The Washington Post’s visual journalist Kennedy Elliot
also mentions about the use of the right color according to human perception.
There are foods, drinks, brands which are linked with some colors and accepted
from human perception (Elliot, 2016).55 Color blind people should also be taken
into consideration. In the light of these, a journalist considers all the aspects while
visualising the data (Rost, 2018) (Image 15).
Image 15. Color choices for data visualisations, Datawrapper
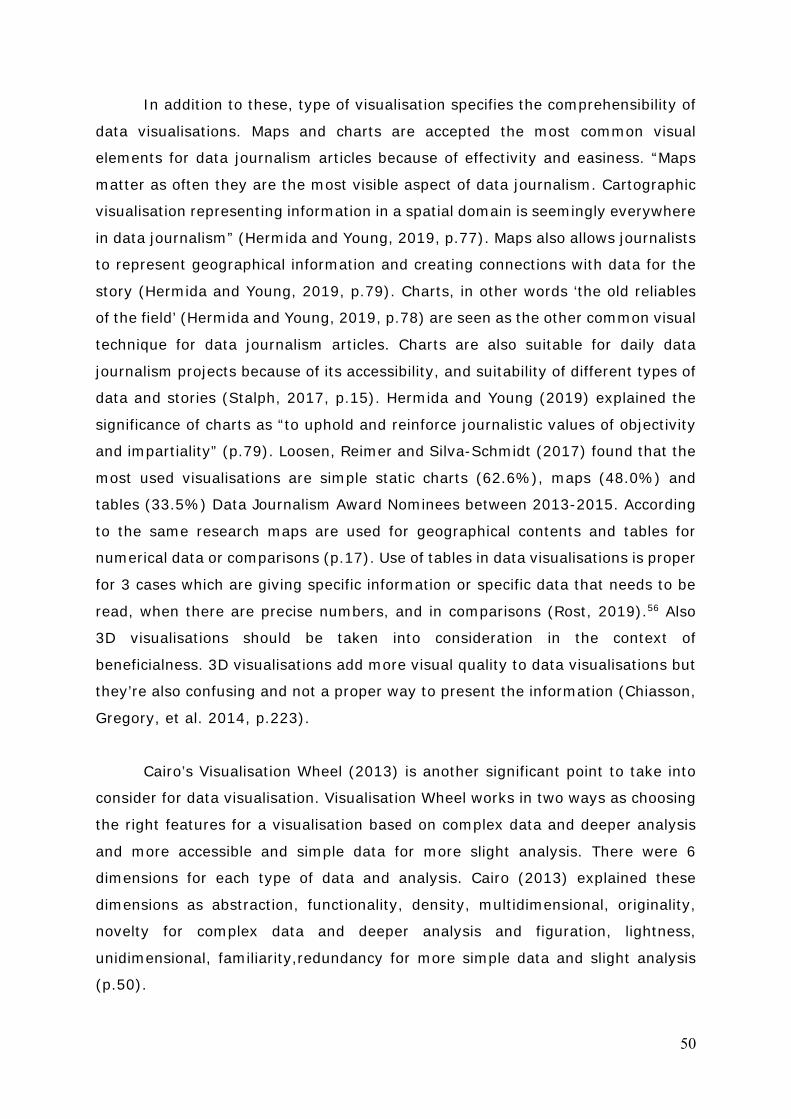
50
In addition to these, type of visualisation specifies the comprehensibility of
data visualisations. Maps and charts are accepted the most common visual
elements for data journalism articles because of effectivity and easiness. “Maps
matter as often they are the most visible aspect of data journalism. Cartographic
visualisation representing information in a spatial domain is seemingly everywhere
in data journalism” (Hermida and Young, 2019, p.77). Maps also allows journalists
to represent geographical information and creating connections with data for the
story (Hermida and Young, 2019, p.79). Charts, in other words ‘the old reliables
of the field’ (Hermida and Young, 2019, p.78) are seen as the other common visual
technique for data journalism articles. Charts are also suitable for daily data
journalism projects because of its accessibility, and suitability of different types of
data and stories (Stalph, 2017, p.15). Hermida and Young (2019) explained the
significance of charts as “to uphold and reinforce journalistic values of objectivity
and impartiality” (p.79). Loosen, Reimer and Silva-Schmidt (2017) found that the
most used visualisations are simple static charts (62.6%), maps (48.0%) and
tables (33.5%) Data Journalism Award Nominees between 2013-2015. According
to the same research maps are used for geographical contents and tables for
numerical data or comparisons (p.17). Use of tables in data visualisations is proper
for 3 cases which are giving specific information or specific data that needs to be
read, when there are precise numbers, and in comparisons (Rost, 2019).56 Also
3D visualisations should be taken into consideration in the context of
beneficialness. 3D visualisations add more visual quality to data visualisations but
they’re also confusing and not a proper way to present the information (Chiasson,
Gregory, et al. 2014, p.223).
Cairo’s Visualisation Wheel (2013) is another significant point to take into
consider for data visualisation. Visualisation Wheel works in two ways as choosing
the right features for a visualisation based on complex data and deeper analysis
and more accessible and simple data for more slight analysis. There were 6
dimensions for each type of data and analysis. Cairo (2013) explained these
dimensions as abstraction, functionality, density, multidimensional, originality,
novelty for complex data and deeper analysis and figuration, lightness,
unidimensional, familiarity,redundancy for more simple data and slight analysis
(p.50).
51
The story loses its meaning and wastes everything when there’s no
appropriate visualisation. “Good visual presentations tend to enhance the message
of the visualisation. If a figure contains jarring colors, imbalanced visual elements,
or other features that distract, then the viewer will find it harder to inspect the
figure and interpret it correctly” (Wilke, 2019). Choosing the right visual
representation, deciding how to present the data, deciding the colors combine and
create the principles of data visualisation because data journalism combines
technology, data, and aesthetics inside with harmony.
Interactivity is accepted as another key element in data visualisation
process. Especially in more advanced data articles, interactivity is a way to support
storytelling, combine narratives and engage with readers. Segel and Heer (2010)
categorized data driven stories in 2 genres as ‘author-driven’ and ‘reader-driven’.
Author-driven refers to articles with “linear ordering of scenes, heavy messaging,
no interactivity” and reader-driven refers to articles with “no prescribed ordering,
no messaging, free interactivity” (p.1146). Interactivity could cause manipulation
by reader and a possible loss of the journalists’ message. The choose of genre
should have based on the complexity of data and the story (Segel and Heer, 2010,
p.1146). In this point, similar types of interactivities were seen in the literature.
Veglis and Bratsas (2017) explained the levels of interactivity as transmissional,
consultational, and conversational. According to Veglis and Bratsas (2017) and
Loosen, Reimer and Silva-Schmidt (2017), these levels were containing playing,
pausing, zooms, buttons for transmissional interactivity, timelines, menu, index,
and filtering for consultational interactivity, and personalisation, inputs for
conversational interactivity.
52
3. Method
This research aimed to analyze sports data journalism practices in Spain
with quantitative and qualitative approaches through content analysis and
interviews. As already mentioned in the introduction, methods were designed for
3 main research objectives as:
Research Objective 1: To identify technical features of articles.
Research Objective 2: To analyze changes in journalistic practice,
production process of articles.
Research Objective 3: To identify internal and external effects that
shaped data journalism.
Quantitative analysis aimed to explain the characteristics of data journalism
articles published on the newspapers’ websites while qualitative analysis aimed to
present perspectives of the participants, and answer the questions that content
analysis could not answer. Difficulty to answer ‘why?’ through content analysis
opened a way to discuss these questions in qualitative analysis as Bryman(2012)
explained as “sometimes, users of content analysis have been able to shed some
light on ‘why?’ questions raised by their investigations by conducting additional
data-collection exercises. Such exercises might include qualitative content
analysis and/or interviews with journalists and others” (p.307). Combining two
methods presented the development of Spanish data journalism at a broader level.
3.1. Quantitative Analysis
Content analysis was used as the quantitative method of the research
because of its advantages as Bryman(2012) explained. According to
Bryman(2012), content analysis was transparent and it was possible to set out
the coding scheme and sampling protocols so that repetitive use of the method
and follow-up research were possible. This was also allowing an objective form of
analysis to be referred to as content analysis. It was a high availability process. It
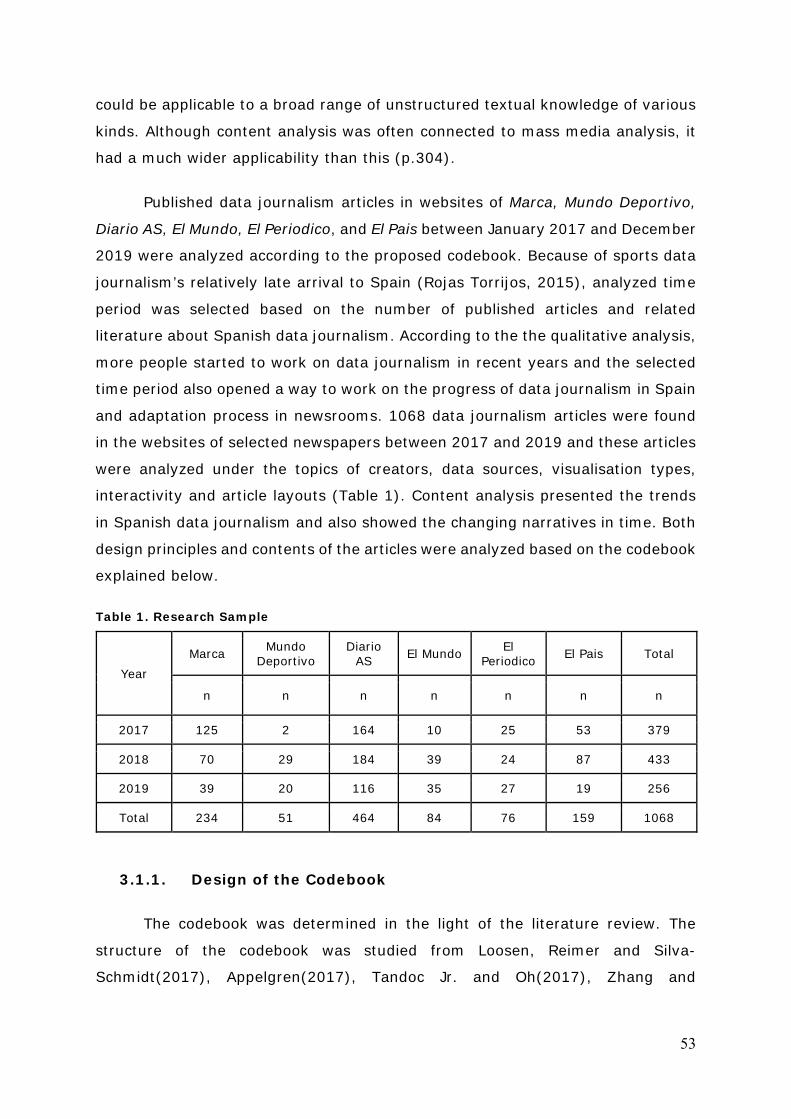
53
could be applicable to a broad range of unstructured textual knowledge of various
kinds. Although content analysis was often connected to mass media analysis, it
had a much wider applicability than this (p.304).
Published data journalism articles in websites of Marca, Mundo Deportivo,
Diario AS, El Mundo, El Periodico, and El Pais between January 2017 and December
2019 were analyzed according to the proposed codebook. Because of sports data
journalism’s relatively late arrival to Spain (Rojas Torrijos, 2015), analyzed time
period was selected based on the number of published articles and related
literature about Spanish data journalism. According to the the qualitative analysis,
more people started to work on data journalism in recent years and the selected
time period also opened a way to work on the progress of data journalism in Spain
and adaptation process in newsrooms. 1068 data journalism articles were found
in the websites of selected newspapers between 2017 and 2019 and these articles
were analyzed under the topics of creators, data sources, visualisation types,
interactivity and article layouts (Table 1). Content analysis presented the trends
in Spanish data journalism and also showed the changing narratives in time. Both
design principles and contents of the articles were analyzed based on the codebook
explained below.
Table 1. Research Sample
Year Marca Mundo
Deportivo Diario
AS El Mundo El Periodico El Pais Total
n n n n n n n
2017 125 2 164 10 25 53 379
2018 70 29 184 39 24 87 433
2019 39 20 116 35 27 19 256
Total 234 51 464 84 76 159 1068
3.1.1. Design of the Codebook
The codebook was determined in the light of the literature review. The
structure of the codebook was studied from Loosen, Reimer and Silva-
Schmidt(2017), Appelgren(2017), Tandoc Jr. and Oh(2017), Zhang and
54
Feng(2018), Stalph(2017) and Veglis and Bratsas(2017). Veglis and
Bratsas(2017) explained data journalism as:
“The process of extracting useful information from data, writing articles based
on the information and embedding visualisations (interacting in some cases) in
the articles that help readers to understand the significance of the story or allow
them to pinpoint data that relate to them” (p.111).
In addition, Rogers(2013) explained the data journalism in his book, Facts
are Sacred, and pointed that an advanced visualisation was not necessary for data
journalism:
“Data journalism is not graphics or visualisations. It’s about telling the story in
the best way possible. Sometimes that will be a visualisation or a map. But
sometimes it’s a news story. Sometimes, just publishing the number is enough”
(p.22).
As already mentioned, elements for content analysis were studied from the
related literature about data journalism and adapted to this research. Analysing
the number of people involved in articles were significant to identify the structure
of the newsrooms and collaborations between sections (Loosen, Reimer and Silva-
Schmidt, 2017; Stalph, 2017). It was also a way to study the differences in
creative process between daily articles and big projects. Analysing the data used
for the articles were seen as one of the main elements in the literature. Analysis
of data sources and accessibility of data was used to refer the transparency and
level of data use in the newsrooms (Stalph, 2017; Tandoc Jr. and Oh, 2017). Also,
Gray et al.(2012) explained the importance of mentioning data sources used in the
articles in Data Journalism Handbook and claimed that citing data sources as a
quality criteria for articles. Analysis of topics was determinant to see dominated
topics in Spanish data journalism, staying popularity of topics and/or changing
trends in time (Loosen, Reimer and Silva-Schmidt, 2017; Stalph, 2017).
Content analysis elements regarding to story property were studied from
Stalph(2017) and Zhang and Feng(2018), and adapted to the selected articles of
this research. Data journalism articles were analyzed under 6 determined topic as
55
Zhang and Feng(2018) suggested and ‘prediction’ and ‘other’ were added in the
list based on the analyzed articles. Comparison was coded for articles that present
compared values, topics, and events which aims to find differences or similarities.
Connection and flow was coded for articles that tries to find relation between
values, topics, and events. Changes over time was coded for articles that present
a change in values in time and changing trends which covers a period of time.
Statistics was coded for articles which show statistical information or raw data
without including any comparison or connection. Prediction was coded for articles
which presents probability and calculations for future based on current data. Other
as a story property was identified as photo-based explanations, listings, drawings,
animations and accepted as data journalism based on the explanations of Veglis
and Bratsas(2017) and Rogers(2013). It was also observed that these types of
articles were published in the selected newspapers’ websites under the
infographics and data section and called data journalism.
Number of visualisation and visualisation type were identified as variables in
content analysis to analyze data journalism styles of newspapers and their
methods to tell the story (Loosen, Reimer and Silva-Schmidt, 2017). These
variables were significant to understand the use of interactivity, and the level of
performing data journalism based on the visual features of articles (Appelgren,
2017). Form of interactivity were studied from Loosen, Reimer and Silva-
Schmidt(2017), Appelgren(2017), Veglis and Bratsas(2017), and Stalph(2017).
However, the variables under ‘form of interactivity’ were adapted from Veglis and
Bratsas(2017), and Stalph(2017). According to these two studies 3 variables were
determined and coded for articles which are ‘transmissional’, ‘consultational’, and
‘conversational’ as Veglis and Bratsas(2017) performed. These variables showed
similarity with the study of Stalph(2017) with ‘low’, ‘medium’, and ‘high’ level of
interactivity. Based on these studies transmissional (low) level of interactivity was
coded for articles with a low level of interaction that includes playing and pausing,
zooms, buttons, or mouseovers. Consultational (medium) level of interactivity
referred more interactive than transmissional but still not involving the reader
entirely. Consultational level of interactivity was coded for articles with timelines,
menu choices, index, filtering. Conversational (high) level of interactivity identified
as involving the reader entirely with personalization. In this level of interactivity,
readers had a chance to input some information, data, or change the visualisation
56
based on their choice or predictions. Ratio of text and multimedia was studied from
Stalph(2017) and it was significant to present the chosen features for articles by
newspapers and the way to tell stories. Articles coded based on the amount of text
and visualisation without adding cover visuals of articles.
The codebook consisted of different sections to identify the characteristics
of data journalism articles in detail. The identification was made by medium, date,
and title and followed by the number of creators which provided a solid answer to
involved newsroom departments in articles. It was important to address data
sources to support the arguments in the qualitative section. In this context, data
sources of the articles, and accessibility of the sources were analyzed. Analysis of
the topics and story properties of the research sample presented the trending
topics and techniques in Spanish data journalism in the analyzed time period. It
was also important to identify the design principles of the articles to draw a
conclusion about the current level of sports data journalism in Spanish
newsrooms. In order to achieve that, visualisation number, visualisation type,
form of interactivity and the level of ratio of text and multimedia were analyzed.
3.1.2. The Codebook
Medium, date, title: the name of the newspaper, date of the article, title of the
article.
Number of creators: 0. Not mentioned; 1. 1 creator; 2. More than 1 creator.
Data source: 0. Not mentioned; 1. Mentioned.
Name of the data source: If the article mentioned a private or public data
source, or use of transparency portal.
0. Not mentioned; 1. Mentioned.
Accessibility of data: If the article has a link to access the data
0. Not accessible; 1. Accessible.
Topic: 1. Football; 2. Basketball; 3. Tennis; 4. Motorsports; 5. Cycling; 6. Other.
57
Story property:
1. Comparison: differences or similarities between values;
2. Connection and flow: relations or correlations between data and two or more
values;
3. Changes over time: changes in a value in a period of time or displaying changing
trends in time;
4. Statistics: statistical information of a value without connections and
comparisons;
5. Prediction: predictions of a value based on current data and past changes;
6. Other: photo-based explanations, mapping, listings, drawings, animations.
Number of visualisations: 1. 1 visualisation; 2. 2 or 3 visualisations; 3. More
than 3 visualisations.
Visualisation type: 1. Static; 2. Interactive.
Form of interactivity:
0. No interactive functions;
1. Transmissional interactivity: playing / pausing, zooming, mouseovers, buttons;
2. Consultational interactivity: timeline sliders, menu items, filtering;
3. Conversational interactivity: personalization, inputs.
Ratio of text and multimedia: 1. Mostly text; 2. Mostly multimedia; 3. Balanced
use of text and multimedia; 4. Just multimedia.
3.2. Qualitative Analysis
Ritchie and Lewis(2003) explained the use of qualitative methods as:
“to address research questions that require explanation or understanding of
social phenomena and their contexts. They are particularly well suited to
exploring issues that hold some complexity and to studying processes that
occur over time” (p.5).
58
Based on the literature, interview method was seen as the primary method
to analyze the adaptation of data journalism in newsrooms, current situation and
needs of newsrooms, and also production process of articles and the method was
studied and adapted to this research in order to present the current level of
Spanish data journalism (Fink and Anderson, 2015; Wright and Doyle, 2018).
Interview method was used as the qualitative analysis of the research to answer
questions which content analysis did not correspond to. Qualitative analysis was
conducted to present a descriptive approach to understand Spanish data
journalism in detail based on the interviewees’ experiences, point of views, and
expectations as Ritchie and Lewis(2003) explained:
“They (individual interviews) provide an opportunity for detailed investigation
of people's personal perspectives, for in-depth understanding of the personal
context within which the research phenomena are located, and for very detailed
subject coverage” (p.36).
The research sample for qualitative analysis was determined as 15
participants including journalists, data journalists, and infographic artists from 3
national and 3 sports newspapers in Spain to identify the data journalism practices
in Spain in detail. The purpose of the interviews is to open a space for interviewees
to discuss their opinions about the topic and to examine themes and issues related
to the research. Interviews were conducted face-to-face in the headquarters of
Marca, Diario AS, El Mundo, El Pais, and El Confidencial in Madrid and the
headquarter of Mundo Deportivo in Barcelona in January 2020. Interviews took
approximately 45-75 minutes each and interviewees answered 37 predetermined
questions in both English and Spanish. Before the interviews, the interviewees’
permissions were asked to take audio recordings. The interviews took place for 13
hours in total and the interviews were recorded using an audio recorder. The
contents of the data obtained from the interviews were transcribed in a computer
environment, and then the contents of the interview were collected under the
interview questions that were previously created. Then, the opinions of the
participants regarding the 6 themes determined within the scope of the study were
analyzed together.
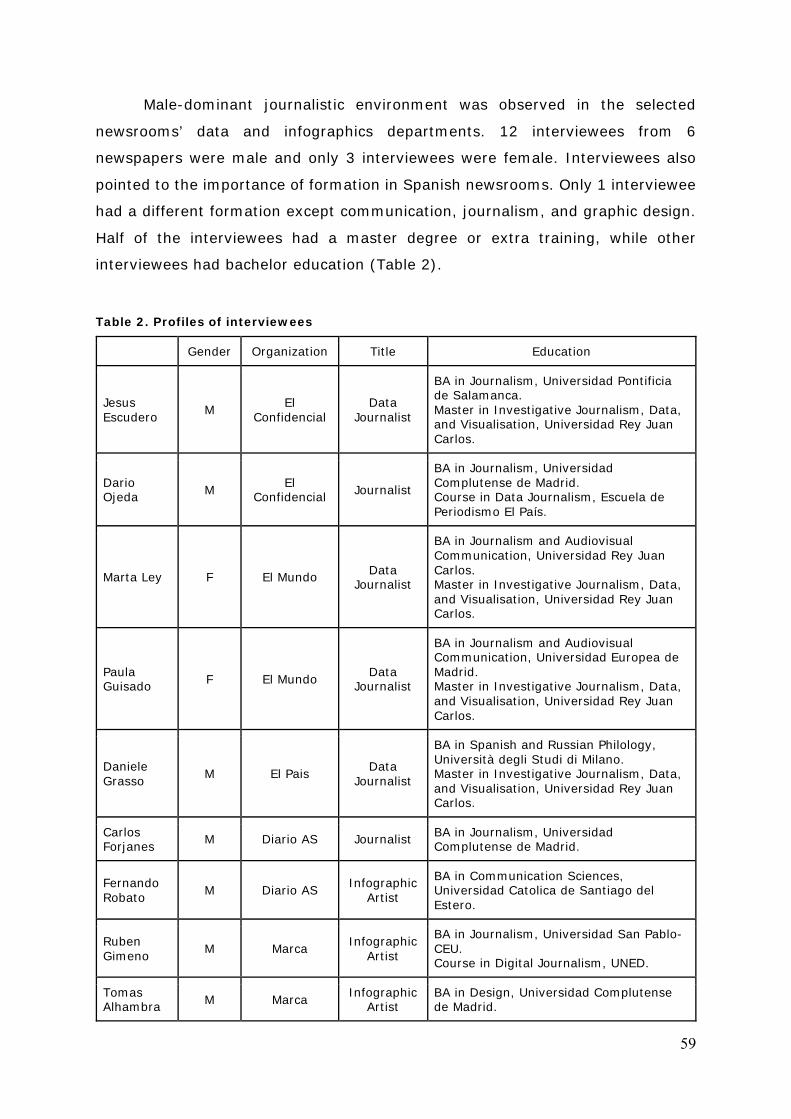
59
Male-dominant journalistic environment was observed in the selected
newsrooms’ data and infographics departments. 12 interviewees from 6
newspapers were male and only 3 interviewees were female. Interviewees also
pointed to the importance of formation in Spanish newsrooms. Only 1 interviewee
had a different formation except communication, journalism, and graphic design.
Half of the interviewees had a master degree or extra training, while other
interviewees had bachelor education (Table 2).
Table 2. Profiles of interviewees
Gender Organization Title Education
Jesus Escudero M El
Confidencial Data
Journalist
BA in Journalism, Universidad Pontificia de Salamanca. Master in Investigative Journalism, Data, and Visualisation, Universidad Rey Juan Carlos.
Dario Ojeda M El
Confidencial Journalist
BA in Journalism, Universidad Complutense de Madrid. Course in Data Journalism, Escuela de Periodismo El País.
Marta Ley F El Mundo Data Journalist
BA in Journalism and Audiovisual Communication, Universidad Rey Juan Carlos. Master in Investigative Journalism, Data, and Visualisation, Universidad Rey Juan Carlos.
Paula Guisado F El Mundo Data
Journalist
BA in Journalism and Audiovisual Communication, Universidad Europea de Madrid. Master in Investigative Journalism, Data, and Visualisation, Universidad Rey Juan Carlos.
Daniele Grasso M El Pais Data
Journalist
BA in Spanish and Russian Philology, Università degli Studi di Milano. Master in Investigative Journalism, Data, and Visualisation, Universidad Rey Juan Carlos.
Carlos Forjanes M Diario AS Journalist BA in Journalism, Universidad
Complutense de Madrid.
Fernando Robato M Diario AS Infographic
Artist
BA in Communication Sciences, Universidad Catolica de Santiago del Estero.
Ruben Gimeno M Marca Infographic
Artist
BA in Journalism, Universidad San Pablo-CEU. Course in Digital Journalism, UNED.
Tomas Alhambra M Marca Infographic
Artist BA in Design, Universidad Complutense de Madrid.

60
Miguel Angel Carbonero
M Marca Infographic Artist
BA in Audiovisual Communication, Universidad de Salamanca.
Miguel Angel Lara M Marca Journalist BA in Journalism, Universidad
Complutense de Madrid.
Lorenzo Lara M Marca Data
Journalist
BA in Journalism, Universidad San Pablo-CEU. Master in Investigative Journalism, Data, and Visualisation, Universidad Rey Juan Carlos.
Ferran Morales M Mundo
Deportivo Infographic
Artist BA in Graphic Design, Llotja Escola Superior de Disseny i Art.
Roger Guillamet M Mundo
Deportivo Infographic
Artist BA in Audiovisual Communication, Universitat Ramon Llull.
Vanesa Mauri F Mundo
Deportivo Infographic
Artist BA in Graphic Design, Escuela Superior de Imagen y Diseño (IDEP).
3.2.1. Themes of Questions
15 interviewees from selected newspapers answered 37 predetermined
questions in 6 themes as the production process in Spanish newspapers, access
to data in Spain, being a data journalist in Spain, current environment in Spanish
newspapers after integrating data journalism, reader engagement in data
journalism, and the future of data journalism in Spain. 6 themes were divided into
sub-topics to achieve a deep analysis of the interviews.
Interviewees explained the decision-making process and the workflow in
the newsrooms, tools and guidelines in sports data journalism, challenges in the
production of sports data journalism, characteristics of a good sports data article,
and advantages and disadvantages of creating sports data journalism articles in
the first part. In the second part, interviewees pointed to data access in Spain and
explained their data sources, challenges in working with data, and their opinions
about the transparency of information in Spain. In the third part, investment in
data journalism in Spanish newsrooms and expected skills from data journalists
were discussed by interviewees. In the fourth part, the current situation of
newspapers was explained and interviewees pointed to their working conditions,
current needs, and newsrooms’ economic motivations. In the fifth part, changes
in reader engagement with data journalism was explained, and lastly interviewees
discussed the future of data journalism in Spain. Results of the qualitative analysis

61
shed light on various issues in Spanish journalistic environment and opened the
issues about being a journalist in Spain up for discussion.
62
SECTION II: QUANTITATIVE ANALYSIS
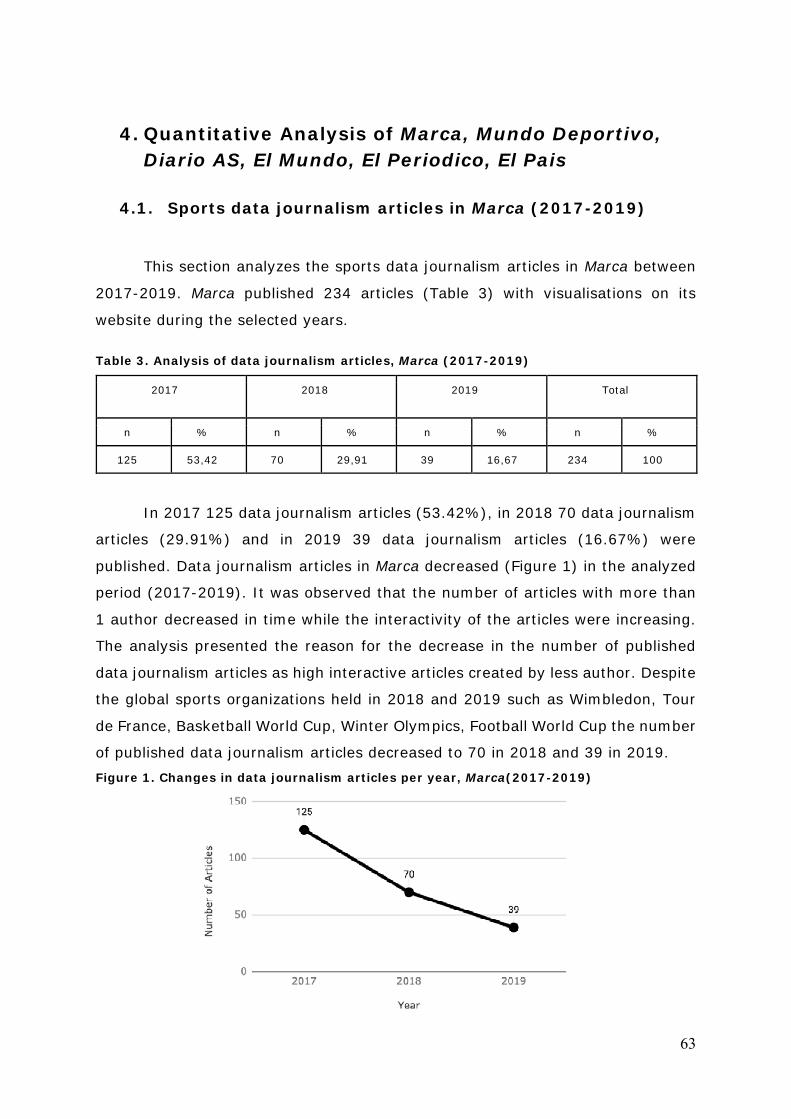
63
4. Quantitative Analysis of Marca, Mundo Deportivo, Diario AS, El Mundo, El Periodico, El Pais
4.1. Sports data journalism articles in Marca (2017-2019)
This section analyzes the sports data journalism articles in Marca between
2017-2019. Marca published 234 articles (Table 3) with visualisations on its
website during the selected years.
Table 3. Analysis of data journalism articles, Marca (2017-2019)
2017 2018 2019 Total
n % n % n % n %
125 53,42 70 29,91 39 16,67 234 100
In 2017 125 data journalism articles (53.42%), in 2018 70 data journalism
articles (29.91%) and in 2019 39 data journalism articles (16.67%) were
published. Data journalism articles in Marca decreased (Figure 1) in the analyzed
period (2017-2019). It was observed that the number of articles with more than
1 author decreased in time while the interactivity of the articles were increasing.
The analysis presented the reason for the decrease in the number of published
data journalism articles as high interactive articles created by less author. Despite
the global sports organizations held in 2018 and 2019 such as Wimbledon, Tour
de France, Basketball World Cup, Winter Olympics, Football World Cup the number
of published data journalism articles decreased to 70 in 2018 and 39 in 2019. Figure 1. Changes in data journalism articles per year, Marca(2017-2019)
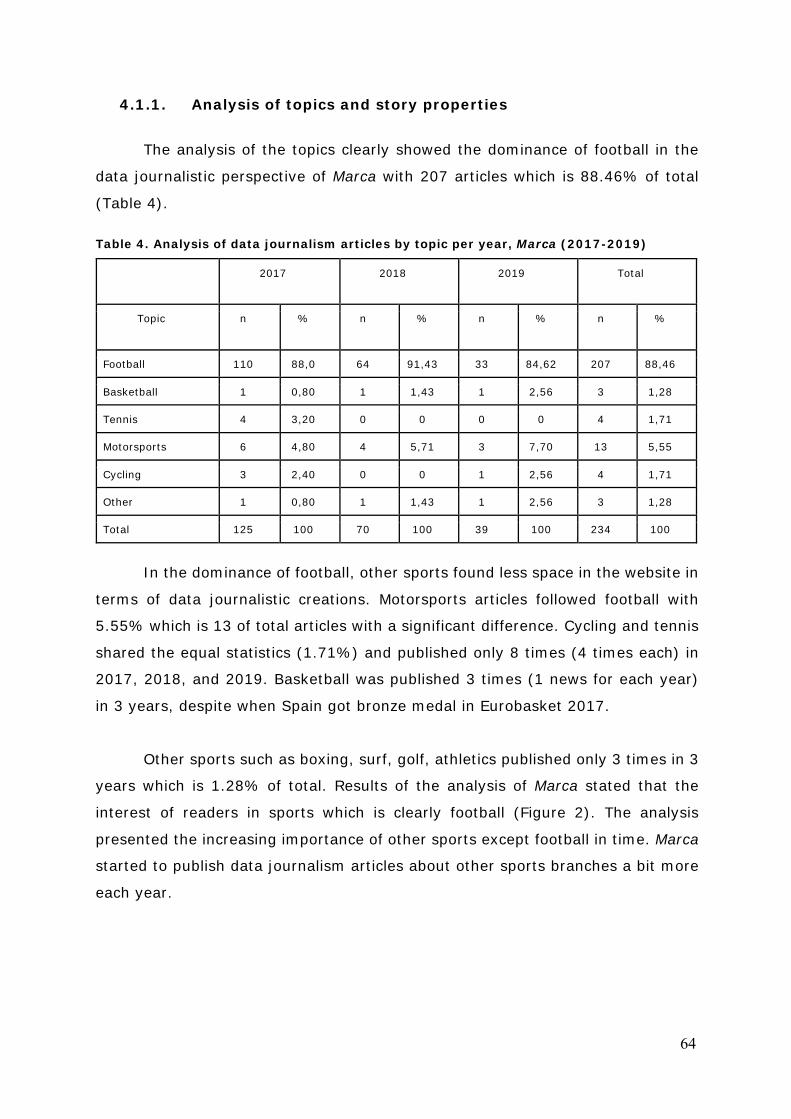
64
4.1.1. Analysis of topics and story properties
The analysis of the topics clearly showed the dominance of football in the
data journalistic perspective of Marca with 207 articles which is 88.46% of total
(Table 4).
Table 4. Analysis of data journalism articles by topic per year, Marca (2017-2019)
2017 2018 2019 Total
Topic n % n % n % n %
Football 110 88,0 64 91,43 33 84,62 207 88,46
Basketball 1 0,80 1 1,43 1 2,56 3 1,28
Tennis 4 3,20 0 0 0 0 4 1,71
Motorsports 6 4,80 4 5,71 3 7,70 13 5,55
Cycling 3 2,40 0 0 1 2,56 4 1,71
Other 1 0,80 1 1,43 1 2,56 3 1,28
Total 125 100 70 100 39 100 234 100
In the dominance of football, other sports found less space in the website in
terms of data journalistic creations. Motorsports articles followed football with
5.55% which is 13 of total articles with a significant difference. Cycling and tennis
shared the equal statistics (1.71%) and published only 8 times (4 times each) in
2017, 2018, and 2019. Basketball was published 3 times (1 news for each year)
in 3 years, despite when Spain got bronze medal in Eurobasket 2017.
Other sports such as boxing, surf, golf, athletics published only 3 times in 3
years which is 1.28% of total. Results of the analysis of Marca stated that the
interest of readers in sports which is clearly football (Figure 2). The analysis
presented the increasing importance of other sports except football in time. Marca
started to publish data journalism articles about other sports branches a bit more
each year.
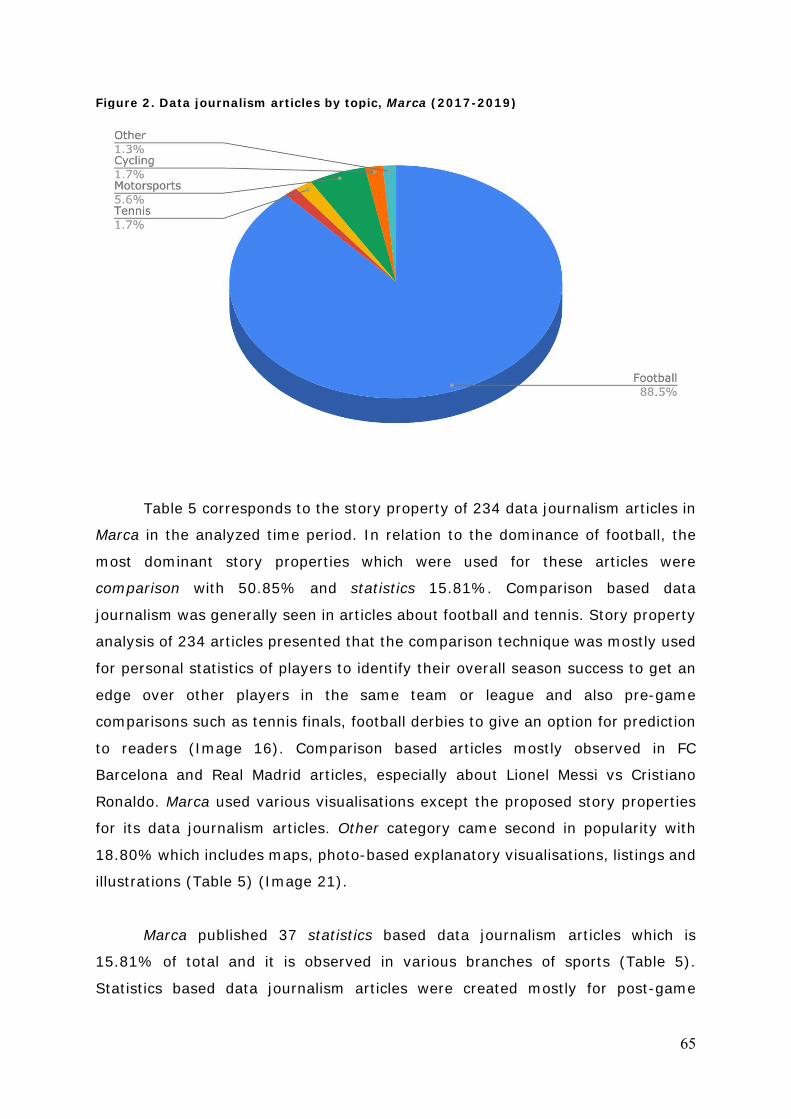
65
Figure 2. Data journalism articles by topic, Marca (2017-2019)
Table 5 corresponds to the story property of 234 data journalism articles in
Marca in the analyzed time period. In relation to the dominance of football, the
most dominant story properties which were used for these articles were
comparison with 50.85% and statistics 15.81%. Comparison based data
journalism was generally seen in articles about football and tennis. Story property
analysis of 234 articles presented that the comparison technique was mostly used
for personal statistics of players to identify their overall season success to get an
edge over other players in the same team or league and also pre-game
comparisons such as tennis finals, football derbies to give an option for prediction
to readers (Image 16). Comparison based articles mostly observed in FC
Barcelona and Real Madrid articles, especially about Lionel Messi vs Cristiano
Ronaldo. Marca used various visualisations except the proposed story properties
for its data journalism articles. Other category came second in popularity with
18.80% which includes maps, photo-based explanatory visualisations, listings and
illustrations (Table 5) (Image 21).
Marca published 37 statistics based data journalism articles which is
15.81% of total and it is observed in various branches of sports (Table 5).
Statistics based data journalism articles were created mostly for post-game
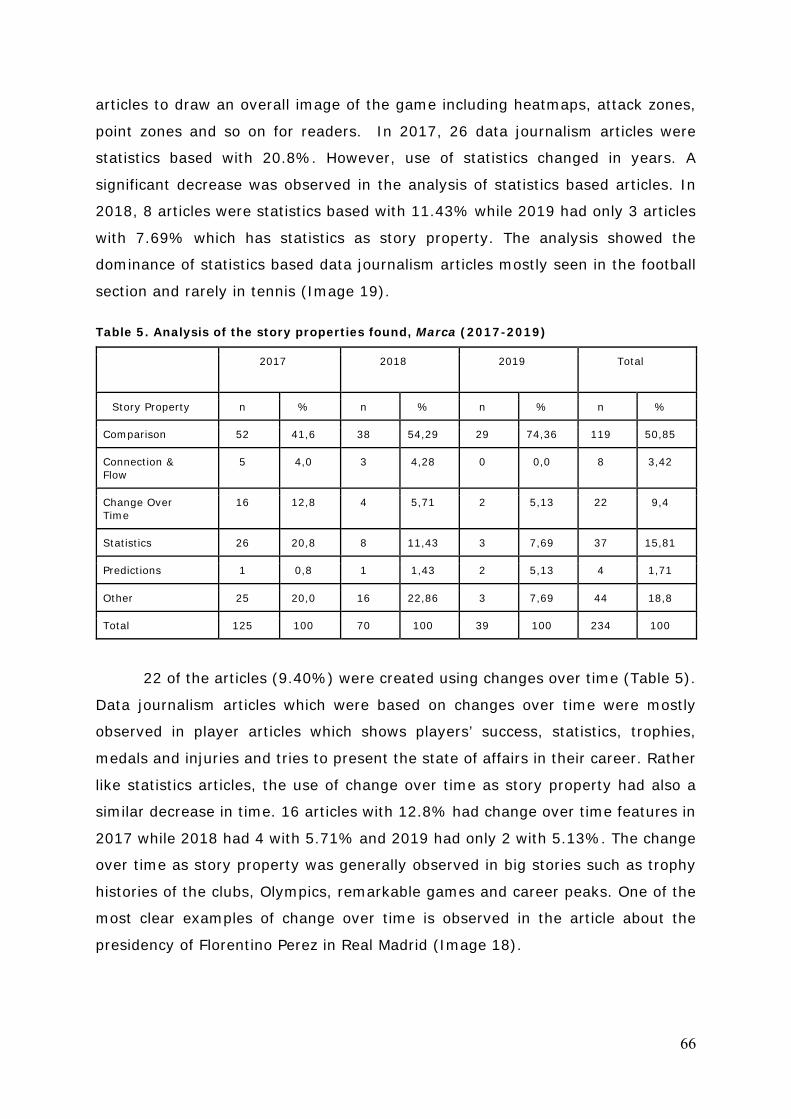
66
articles to draw an overall image of the game including heatmaps, attack zones,
point zones and so on for readers. In 2017, 26 data journalism articles were
statistics based with 20.8%. However, use of statistics changed in years. A
significant decrease was observed in the analysis of statistics based articles. In
2018, 8 articles were statistics based with 11.43% while 2019 had only 3 articles
with 7.69% which has statistics as story property. The analysis showed the
dominance of statistics based data journalism articles mostly seen in the football
section and rarely in tennis (Image 19).
Table 5. Analysis of the story properties found, Marca (2017-2019)
2017 2018 2019 Total
Story Property n % n % n % n %
Comparison 52 41,6 38 54,29 29 74,36 119 50,85
Connection & Flow
5 4,0 3 4,28 0 0,0 8 3,42
Change Over Time
16 12,8 4 5,71 2 5,13 22 9,4
Statistics 26 20,8 8 11,43 3 7,69 37 15,81
Predictions 1 0,8 1 1,43 2 5,13 4 1,71
Other 25 20,0 16 22,86 3 7,69 44 18,8
Total 125 100 70 100 39 100 234 100
22 of the articles (9.40%) were created using changes over time (Table 5).
Data journalism articles which were based on changes over time were mostly
observed in player articles which shows players’ success, statistics, trophies,
medals and injuries and tries to present the state of affairs in their career. Rather
like statistics articles, the use of change over time as story property had also a
similar decrease in time. 16 articles with 12.8% had change over time features in
2017 while 2018 had 4 with 5.71% and 2019 had only 2 with 5.13%. The change
over time as story property was generally observed in big stories such as trophy
histories of the clubs, Olympics, remarkable games and career peaks. One of the
most clear examples of change over time is observed in the article about the
presidency of Florentino Perez in Real Madrid (Image 18).
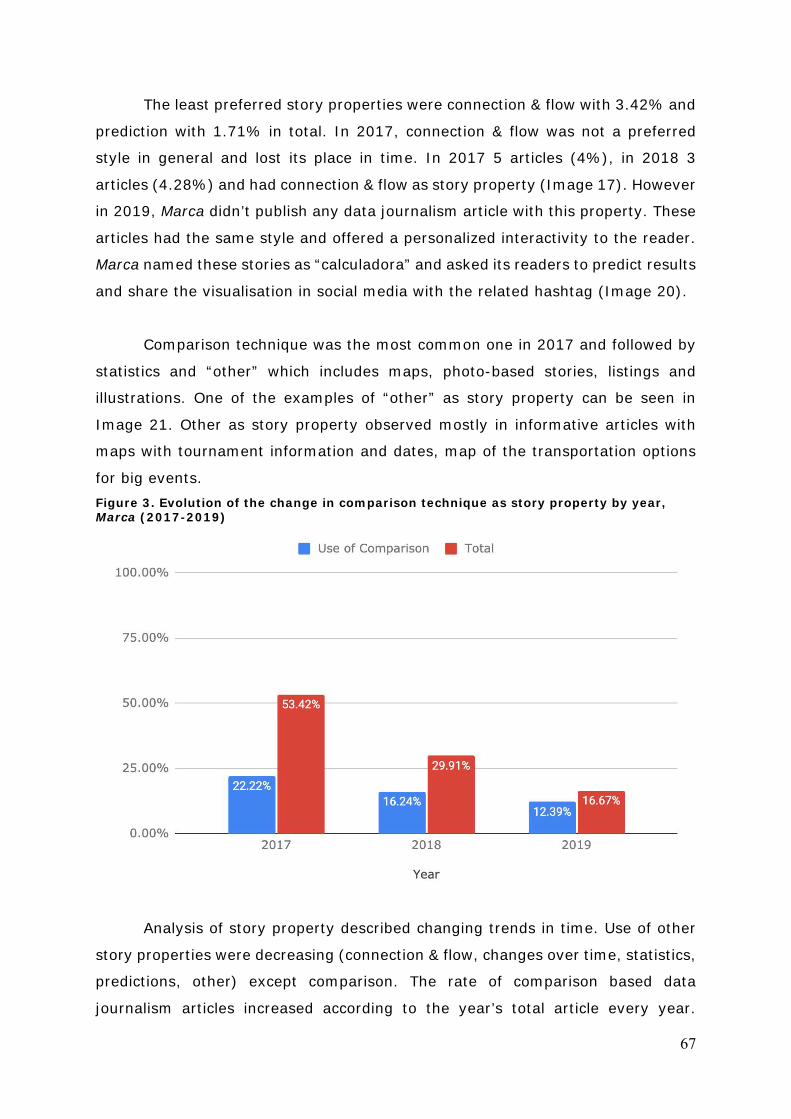
67
The least preferred story properties were connection & flow with 3.42% and
prediction with 1.71% in total. In 2017, connection & flow was not a preferred
style in general and lost its place in time. In 2017 5 articles (4%), in 2018 3
articles (4.28%) and had connection & flow as story property (Image 17). However
in 2019, Marca didn’t publish any data journalism article with this property. These
articles had the same style and offered a personalized interactivity to the reader.
Marca named these stories as “calculadora” and asked its readers to predict results
and share the visualisation in social media with the related hashtag (Image 20).
Comparison technique was the most common one in 2017 and followed by
statistics and “other” which includes maps, photo-based stories, listings and
illustrations. One of the examples of “other” as story property can be seen in
Image 21. Other as story property observed mostly in informative articles with
maps with tournament information and dates, map of the transportation options
for big events. Figure 3. Evolution of the change in comparison technique as story property by year, Marca (2017-2019)
Analysis of story property described changing trends in time. Use of other
story properties were decreasing (connection & flow, changes over time, statistics,
predictions, other) except comparison. The rate of comparison based data
journalism articles increased according to the year’s total article every year.
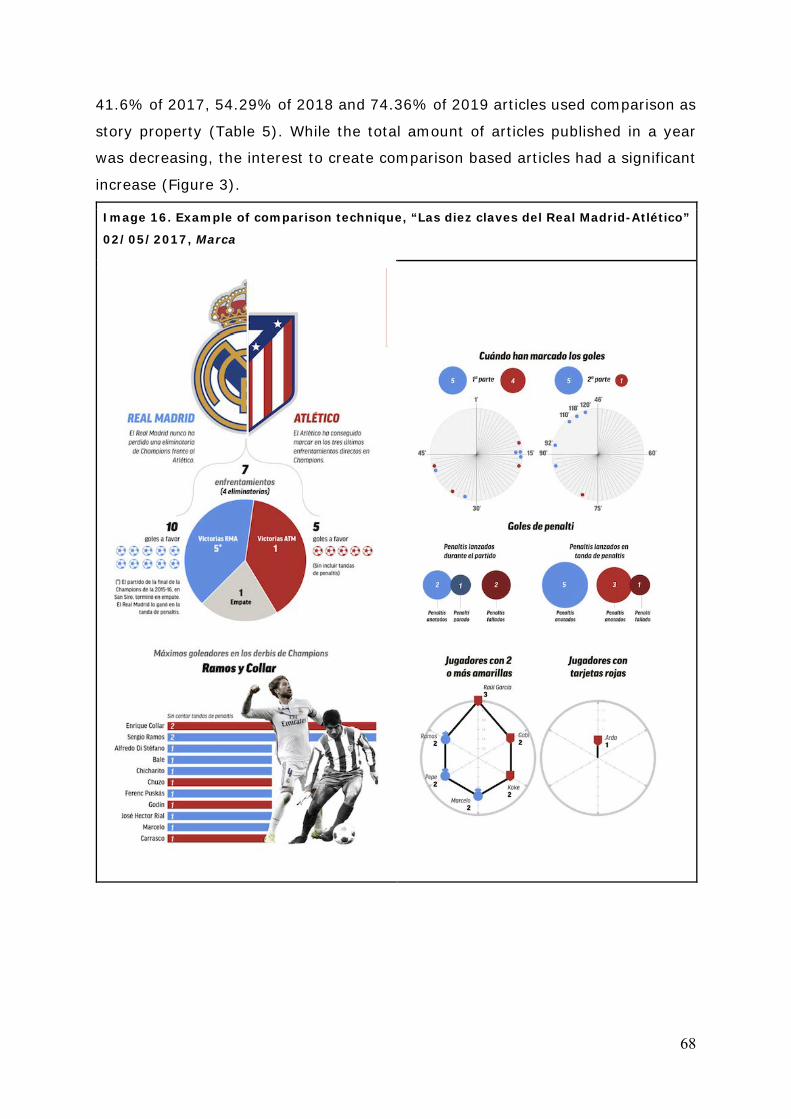
68
41.6% of 2017, 54.29% of 2018 and 74.36% of 2019 articles used comparison as
story property (Table 5). While the total amount of articles published in a year
was decreasing, the interest to create comparison based articles had a significant
increase (Figure 3).
Image 16. Example of comparison technique, “Las diez claves del Real Madrid-Atlético”
02/05/2017, Marca
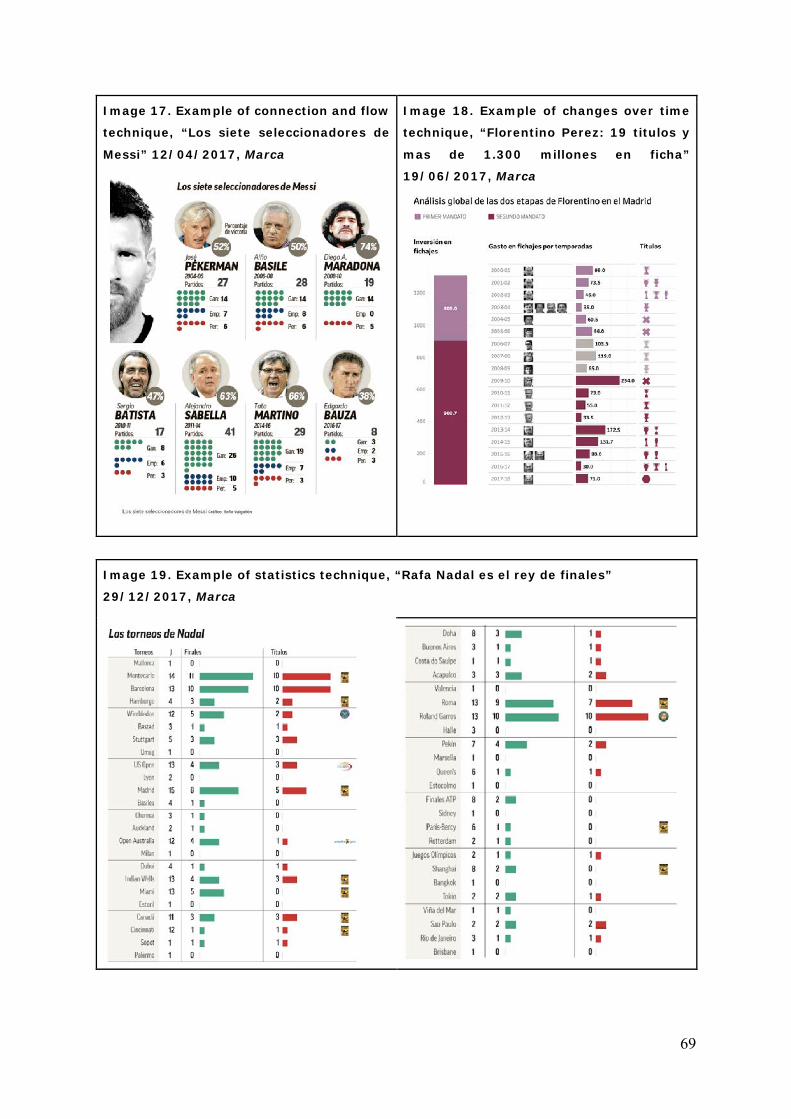
69
Image 17. Example of connection and flow
technique, “Los siete seleccionadores de
Messi” 12/04/2017, Marca
Image 18. Example of changes over time
technique, “Florentino Perez: 19 titulos y
mas de 1.300 millones en ficha”
19/06/2017, Marca
Image 19. Example of statistics technique, “Rafa Nadal es el rey de finales”
29/12/2017, Marca
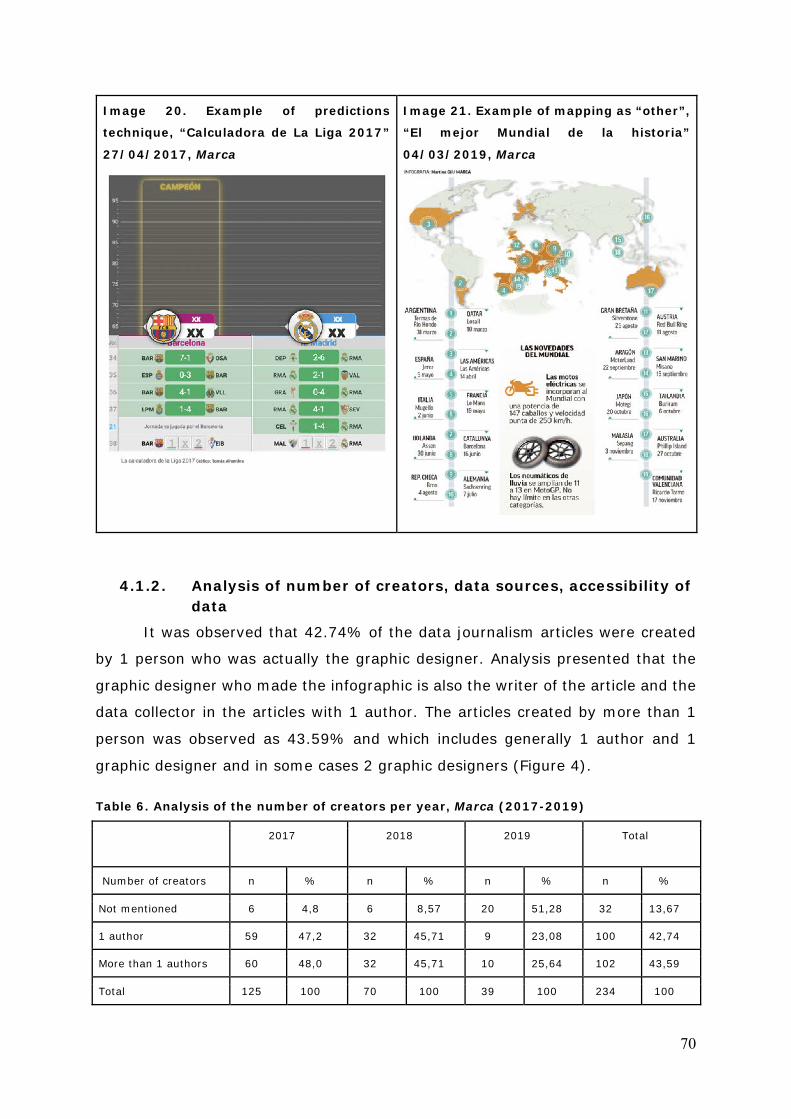
70
Image 20. Example of predictions
technique, “Calculadora de La Liga 2017”
27/04/2017, Marca
Image 21. Example of mapping as “other”,
“El mejor Mundial de la historia”
04/03/2019, Marca
4.1.2. Analysis of number of creators, data sources, accessibility of data
It was observed that 42.74% of the data journalism articles were created
by 1 person who was actually the graphic designer. Analysis presented that the
graphic designer who made the infographic is also the writer of the article and the
data collector in the articles with 1 author. The articles created by more than 1
person was observed as 43.59% and which includes generally 1 author and 1
graphic designer and in some cases 2 graphic designers (Figure 4).
Table 6. Analysis of the number of creators per year, Marca (2017-2019)
2017 2018 2019 Total
Number of creators n % n % n % n %
Not mentioned 6 4,8 6 8,57 20 51,28 32 13,67
1 author 59 47,2 32 45,71 9 23,08 100 42,74
More than 1 authors 60 48,0 32 45,71 10 25,64 102 43,59
Total 125 100 70 100 39 100 234 100
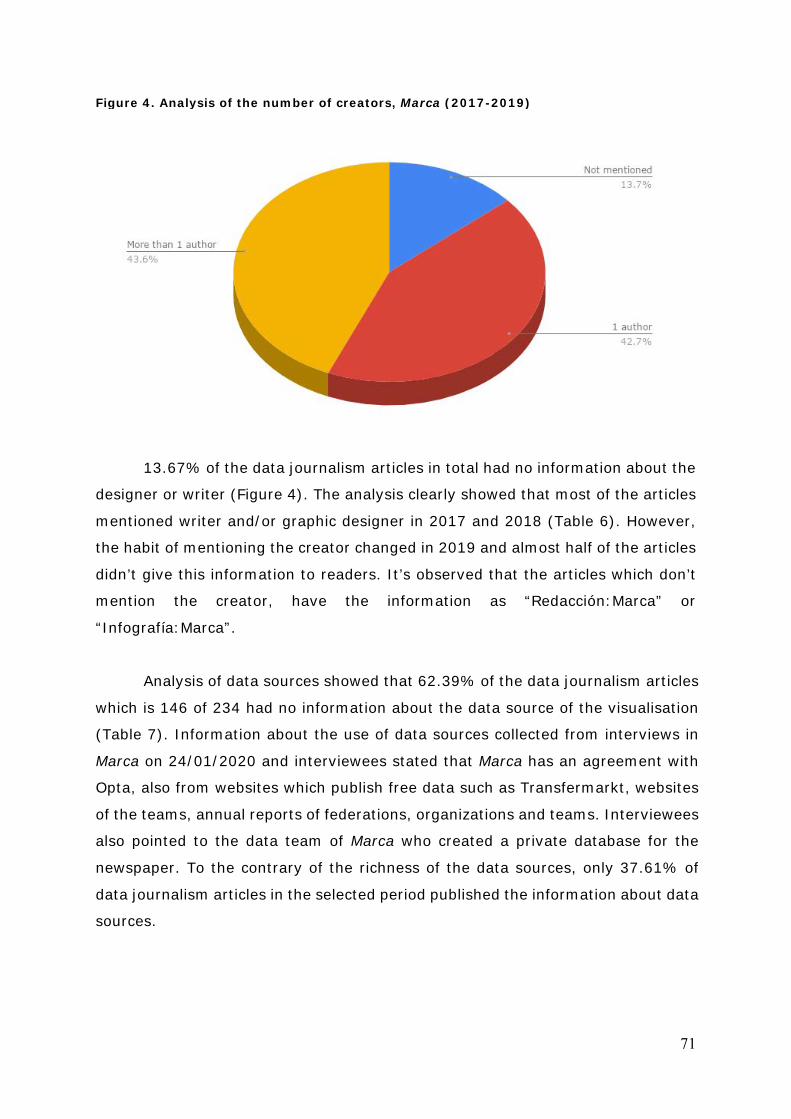
71
Figure 4. Analysis of the number of creators, Marca (2017-2019)
13.67% of the data journalism articles in total had no information about the
designer or writer (Figure 4). The analysis clearly showed that most of the articles
mentioned writer and/or graphic designer in 2017 and 2018 (Table 6). However,
the habit of mentioning the creator changed in 2019 and almost half of the articles
didn’t give this information to readers. It’s observed that the articles which don’t
mention the creator, have the information as “Redacción:Marca” or
“Infografía:Marca”.
Analysis of data sources showed that 62.39% of the data journalism articles
which is 146 of 234 had no information about the data source of the visualisation
(Table 7). Information about the use of data sources collected from interviews in
Marca on 24/01/2020 and interviewees stated that Marca has an agreement with
Opta, also from websites which publish free data such as Transfermarkt, websites
of the teams, annual reports of federations, organizations and teams. Interviewees
also pointed to the data team of Marca who created a private database for the
newspaper. To the contrary of the richness of the data sources, only 37.61% of
data journalism articles in the selected period published the information about data
sources.
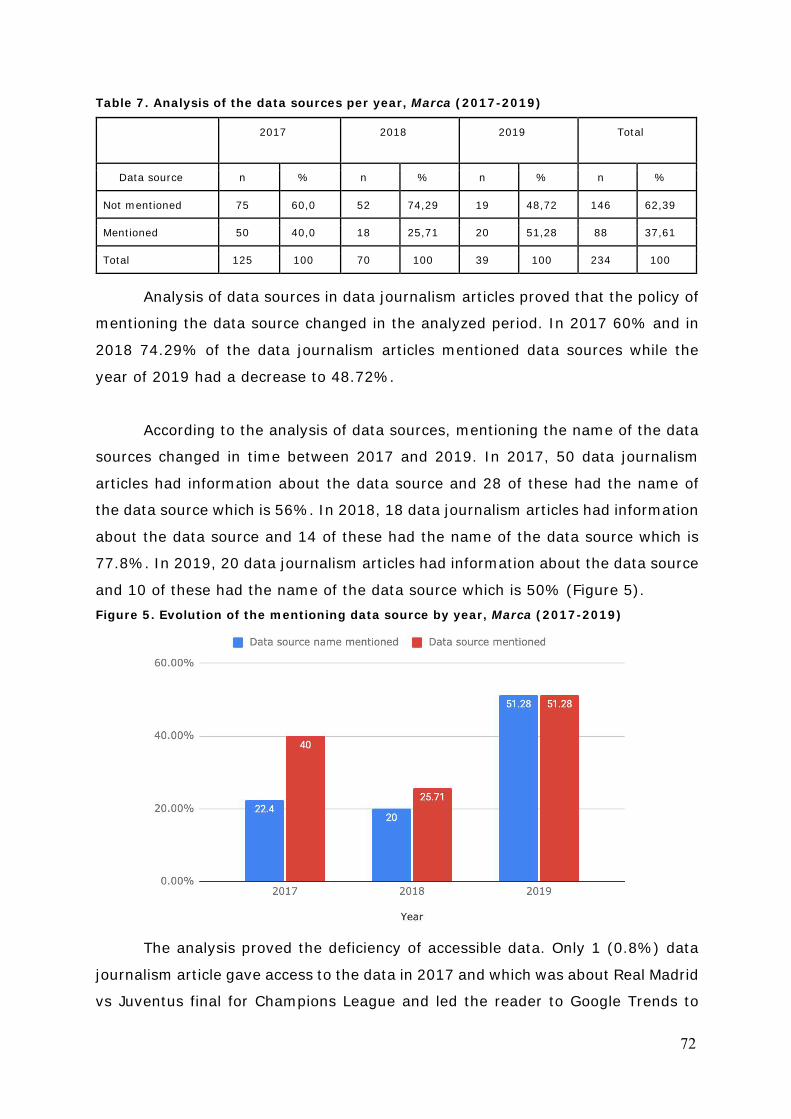
72
Table 7. Analysis of the data sources per year, Marca (2017-2019)
2017 2018 2019 Total
Data source n % n % n % n %
Not mentioned 75 60,0 52 74,29 19 48,72 146 62,39
Mentioned 50 40,0 18 25,71 20 51,28 88 37,61
Total 125 100 70 100 39 100 234 100
Analysis of data sources in data journalism articles proved that the policy of
mentioning the data source changed in the analyzed period. In 2017 60% and in
2018 74.29% of the data journalism articles mentioned data sources while the
year of 2019 had a decrease to 48.72%.
According to the analysis of data sources, mentioning the name of the data
sources changed in time between 2017 and 2019. In 2017, 50 data journalism
articles had information about the data source and 28 of these had the name of
the data source which is 56%. In 2018, 18 data journalism articles had information
about the data source and 14 of these had the name of the data source which is
77.8%. In 2019, 20 data journalism articles had information about the data source
and 10 of these had the name of the data source which is 50% (Figure 5). Figure 5. Evolution of the mentioning data source by year, Marca (2017-2019)
The analysis proved the deficiency of accessible data. Only 1 (0.8%) data
journalism article gave access to the data in 2017 and which was about Real Madrid
vs Juventus final for Champions League and led the reader to Google Trends to
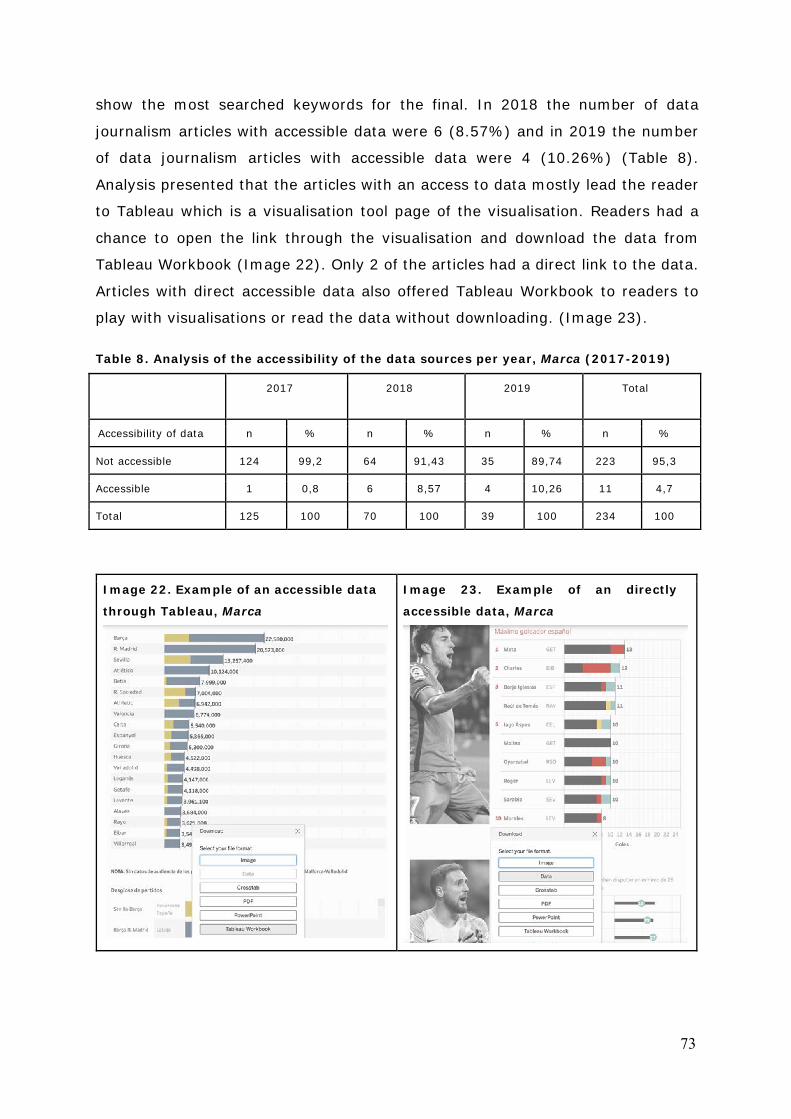
73
show the most searched keywords for the final. In 2018 the number of data
journalism articles with accessible data were 6 (8.57%) and in 2019 the number
of data journalism articles with accessible data were 4 (10.26%) (Table 8).
Analysis presented that the articles with an access to data mostly lead the reader
to Tableau which is a visualisation tool page of the visualisation. Readers had a
chance to open the link through the visualisation and download the data from
Tableau Workbook (Image 22). Only 2 of the articles had a direct link to the data.
Articles with direct accessible data also offered Tableau Workbook to readers to
play with visualisations or read the data without downloading. (Image 23).
Table 8. Analysis of the accessibility of the data sources per year, Marca (2017-2019)
2017 2018 2019 Total
Accessibility of data n % n % n % n %
Not accessible 124 99,2 64 91,43 35 89,74 223 95,3
Accessible 1 0,8 6 8,57 4 10,26 11 4,7
Total 125 100 70 100 39 100 234 100
Image 22. Example of an accessible data
through Tableau, Marca
Image 23. Example of an directly
accessible data, Marca
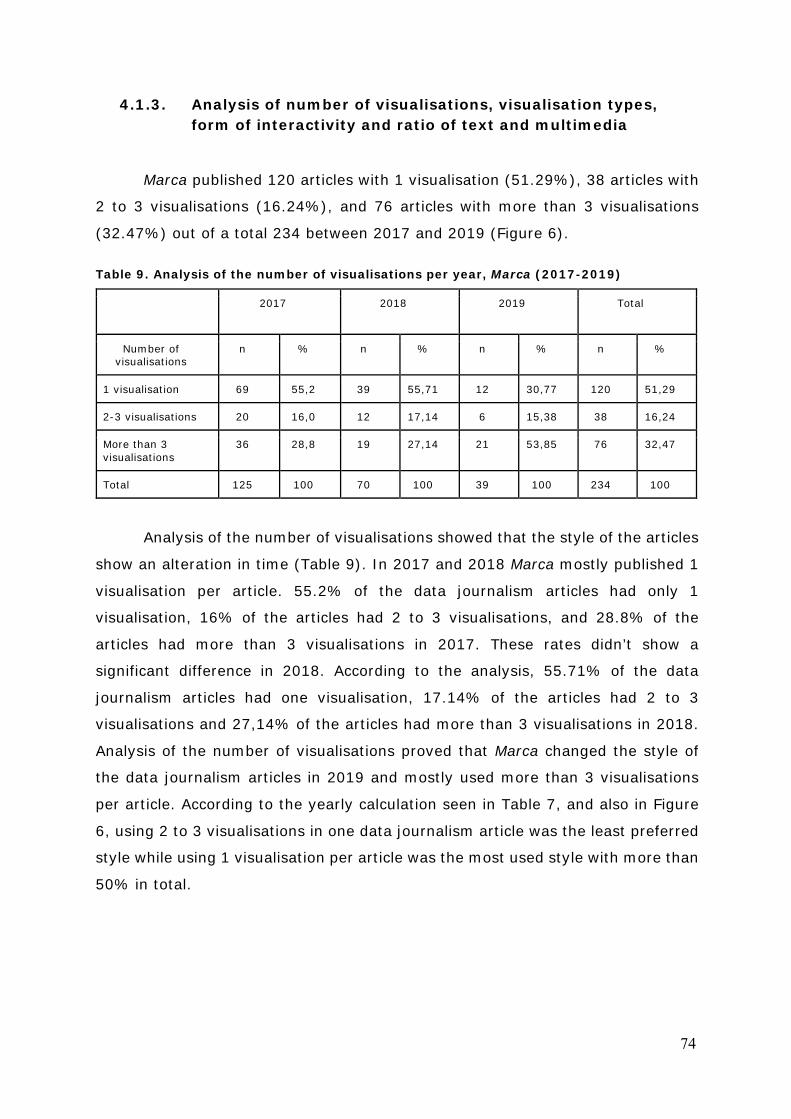
74
4.1.3. Analysis of number of visualisations, visualisation types, form of interactivity and ratio of text and multimedia
Marca published 120 articles with 1 visualisation (51.29%), 38 articles with
2 to 3 visualisations (16.24%), and 76 articles with more than 3 visualisations
(32.47%) out of a total 234 between 2017 and 2019 (Figure 6).
Table 9. Analysis of the number of visualisations per year, Marca (2017-2019)
2017 2018 2019 Total
Number of visualisations
n % n % n % n %
1 visualisation 69 55,2 39 55,71 12 30,77 120 51,29
2-3 visualisations 20 16,0 12 17,14 6 15,38 38 16,24
More than 3 visualisations
36 28,8 19 27,14 21 53,85 76 32,47
Total 125 100 70 100 39 100 234 100
Analysis of the number of visualisations showed that the style of the articles
show an alteration in time (Table 9). In 2017 and 2018 Marca mostly published 1
visualisation per article. 55.2% of the data journalism articles had only 1
visualisation, 16% of the articles had 2 to 3 visualisations, and 28.8% of the
articles had more than 3 visualisations in 2017. These rates didn’t show a
significant difference in 2018. According to the analysis, 55.71% of the data
journalism articles had one visualisation, 17.14% of the articles had 2 to 3
visualisations and 27,14% of the articles had more than 3 visualisations in 2018.
Analysis of the number of visualisations proved that Marca changed the style of
the data journalism articles in 2019 and mostly used more than 3 visualisations
per article. According to the yearly calculation seen in Table 7, and also in Figure
6, using 2 to 3 visualisations in one data journalism article was the least preferred
style while using 1 visualisation per article was the most used style with more than
50% in total.
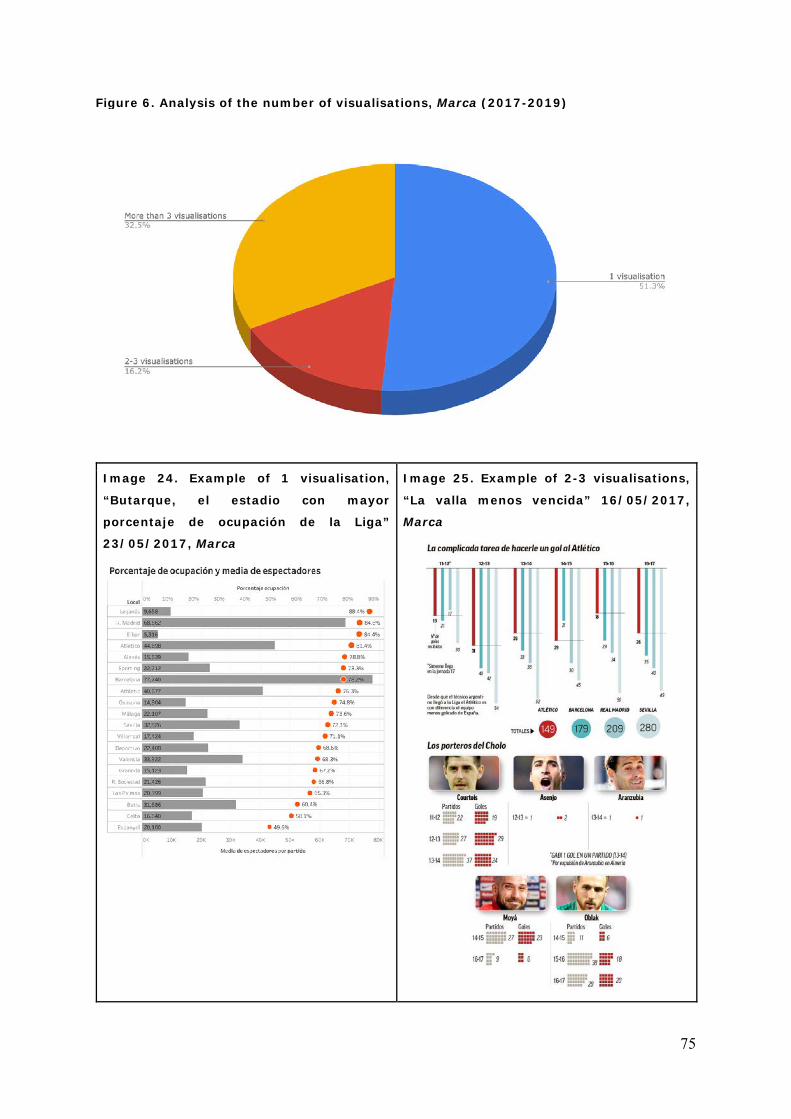
75
Figure 6. Analysis of the number of visualisations, Marca (2017-2019)
Image 24. Example of 1 visualisation,
“Butarque, el estadio con mayor
porcentaje de ocupación de la Liga”
23/05/2017, Marca
Image 25. Example of 2-3 visualisations,
“La valla menos vencida” 16/05/2017,
Marca
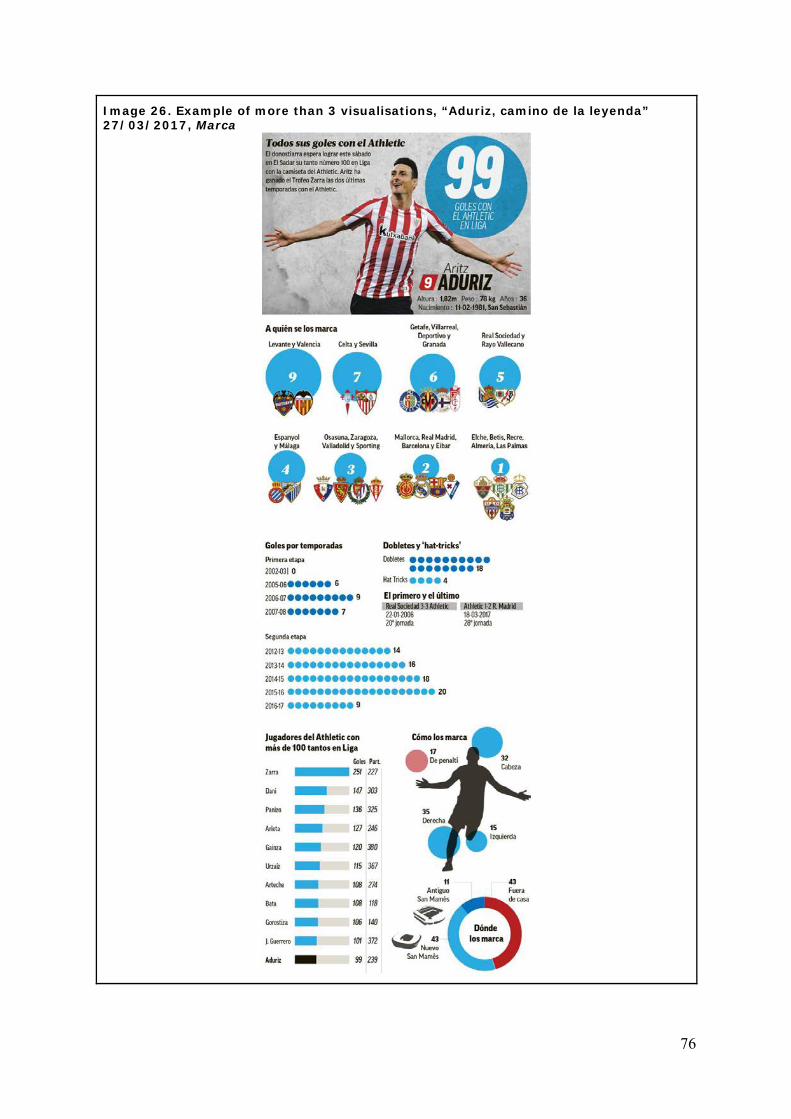
76
Image 26. Example of more than 3 visualisations, “Aduriz, camino de la leyenda” 27/03/2017, Marca
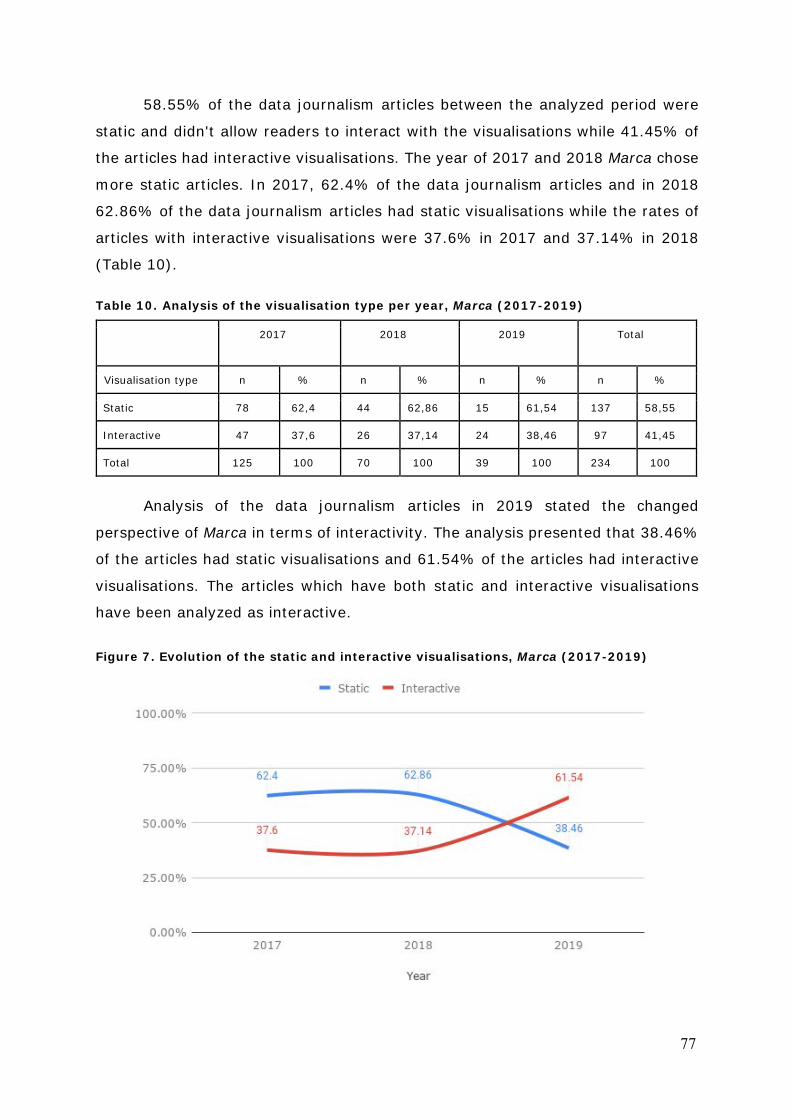
77
58.55% of the data journalism articles between the analyzed period were
static and didn't allow readers to interact with the visualisations while 41.45% of
the articles had interactive visualisations. The year of 2017 and 2018 Marca chose
more static articles. In 2017, 62.4% of the data journalism articles and in 2018
62.86% of the data journalism articles had static visualisations while the rates of
articles with interactive visualisations were 37.6% in 2017 and 37.14% in 2018
(Table 10).
Table 10. Analysis of the visualisation type per year, Marca (2017-2019)
2017 2018 2019 Total
Visualisation type n % n % n % n %
Static 78 62,4 44 62,86 15 61,54 137 58,55
Interactive 47 37,6 26 37,14 24 38,46 97 41,45
Total 125 100 70 100 39 100 234 100
Analysis of the data journalism articles in 2019 stated the changed
perspective of Marca in terms of interactivity. The analysis presented that 38.46%
of the articles had static visualisations and 61.54% of the articles had interactive
visualisations. The articles which have both static and interactive visualisations
have been analyzed as interactive.
Figure 7. Evolution of the static and interactive visualisations, Marca (2017-2019)
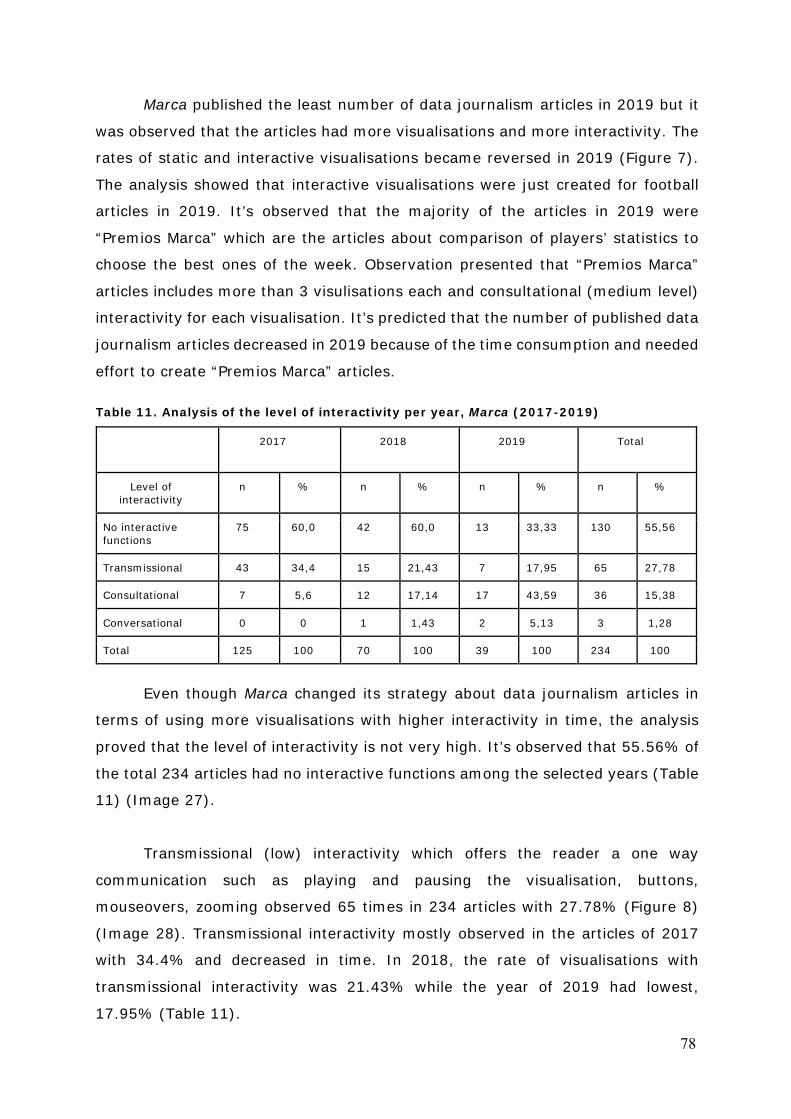
78
Marca published the least number of data journalism articles in 2019 but it
was observed that the articles had more visualisations and more interactivity. The
rates of static and interactive visualisations became reversed in 2019 (Figure 7).
The analysis showed that interactive visualisations were just created for football
articles in 2019. It’s observed that the majority of the articles in 2019 were
“Premios Marca” which are the articles about comparison of players’ statistics to
choose the best ones of the week. Observation presented that “Premios Marca”
articles includes more than 3 visulisations each and consultational (medium level)
interactivity for each visualisation. It’s predicted that the number of published data
journalism articles decreased in 2019 because of the time consumption and needed
effort to create “Premios Marca” articles.
Table 11. Analysis of the level of interactivity per year, Marca (2017-2019)
2017 2018 2019 Total
Level of interactivity
n % n % n % n %
No interactive functions
75 60,0 42 60,0 13 33,33 130 55,56
Transmissional 43 34,4 15 21,43 7 17,95 65 27,78
Consultational 7 5,6 12 17,14 17 43,59 36 15,38
Conversational 0 0 1 1,43 2 5,13 3 1,28
Total 125 100 70 100 39 100 234 100
Even though Marca changed its strategy about data journalism articles in
terms of using more visualisations with higher interactivity in time, the analysis
proved that the level of interactivity is not very high. It’s observed that 55.56% of
the total 234 articles had no interactive functions among the selected years (Table
11) (Image 27).
Transmissional (low) interactivity which offers the reader a one way
communication such as playing and pausing the visualisation, buttons,
mouseovers, zooming observed 65 times in 234 articles with 27.78% (Figure 8)
(Image 28). Transmissional interactivity mostly observed in the articles of 2017
with 34.4% and decreased in time. In 2018, the rate of visualisations with
transmissional interactivity was 21.43% while the year of 2019 had lowest,
17.95% (Table 11).
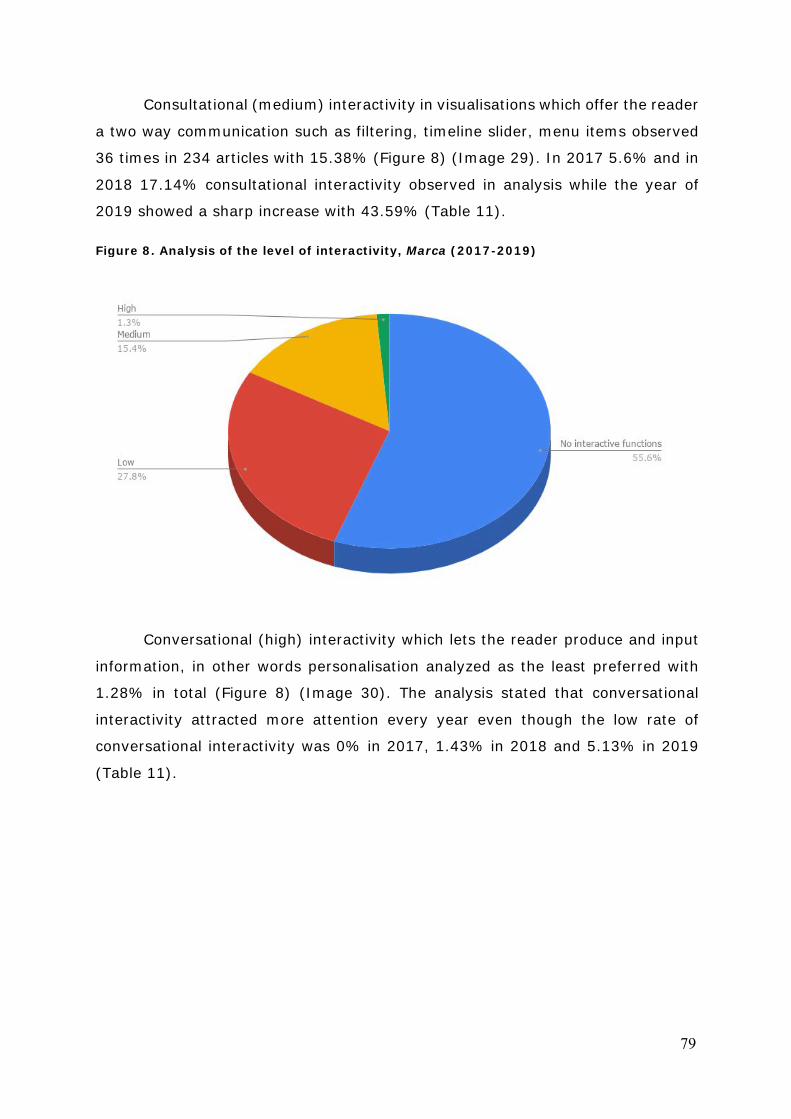
79
Consultational (medium) interactivity in visualisations which offer the reader
a two way communication such as filtering, timeline slider, menu items observed
36 times in 234 articles with 15.38% (Figure 8) (Image 29). In 2017 5.6% and in
2018 17.14% consultational interactivity observed in analysis while the year of
2019 showed a sharp increase with 43.59% (Table 11). Figure 8. Analysis of the level of interactivity, Marca (2017-2019)
Conversational (high) interactivity which lets the reader produce and input
information, in other words personalisation analyzed as the least preferred with
1.28% in total (Figure 8) (Image 30). The analysis stated that conversational
interactivity attracted more attention every year even though the low rate of
conversational interactivity was 0% in 2017, 1.43% in 2018 and 5.13% in 2019
(Table 11).
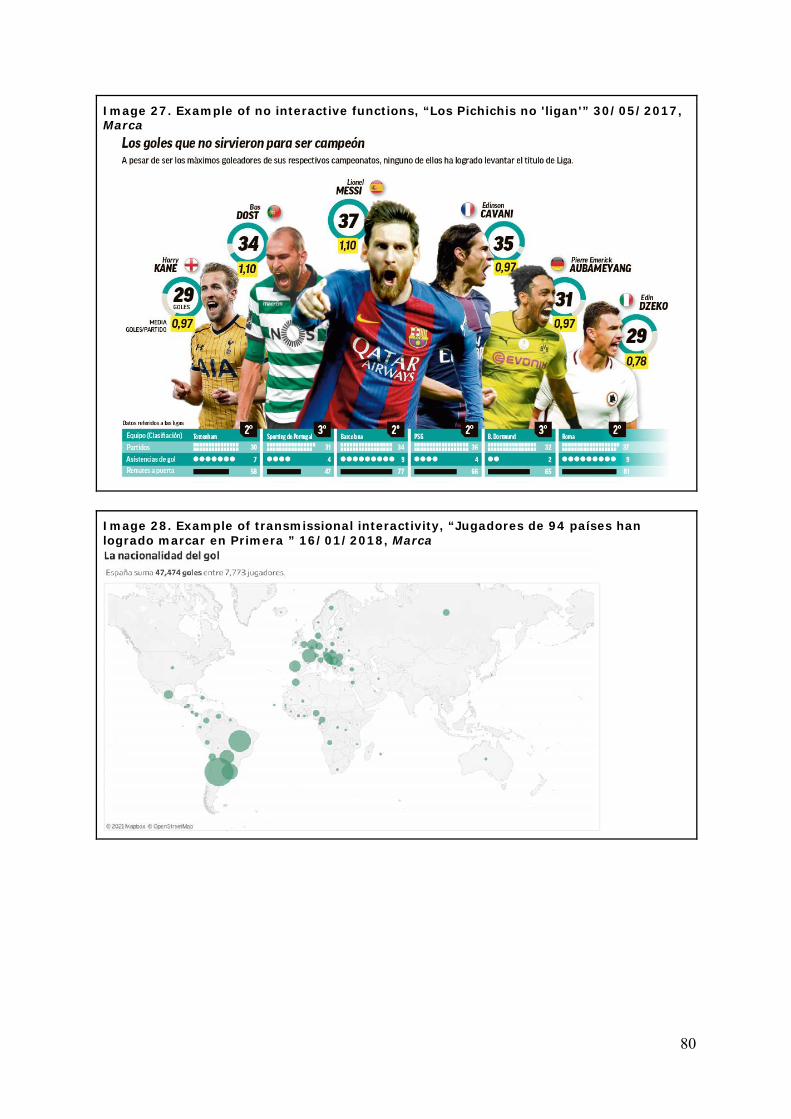
80
Image 27. Example of no interactive functions, “Los Pichichis no 'ligan'” 30/05/2017, Marca
Image 28. Example of transmissional interactivity, “Jugadores de 94 países han logrado marcar en Primera ” 16/01/2018, Marca
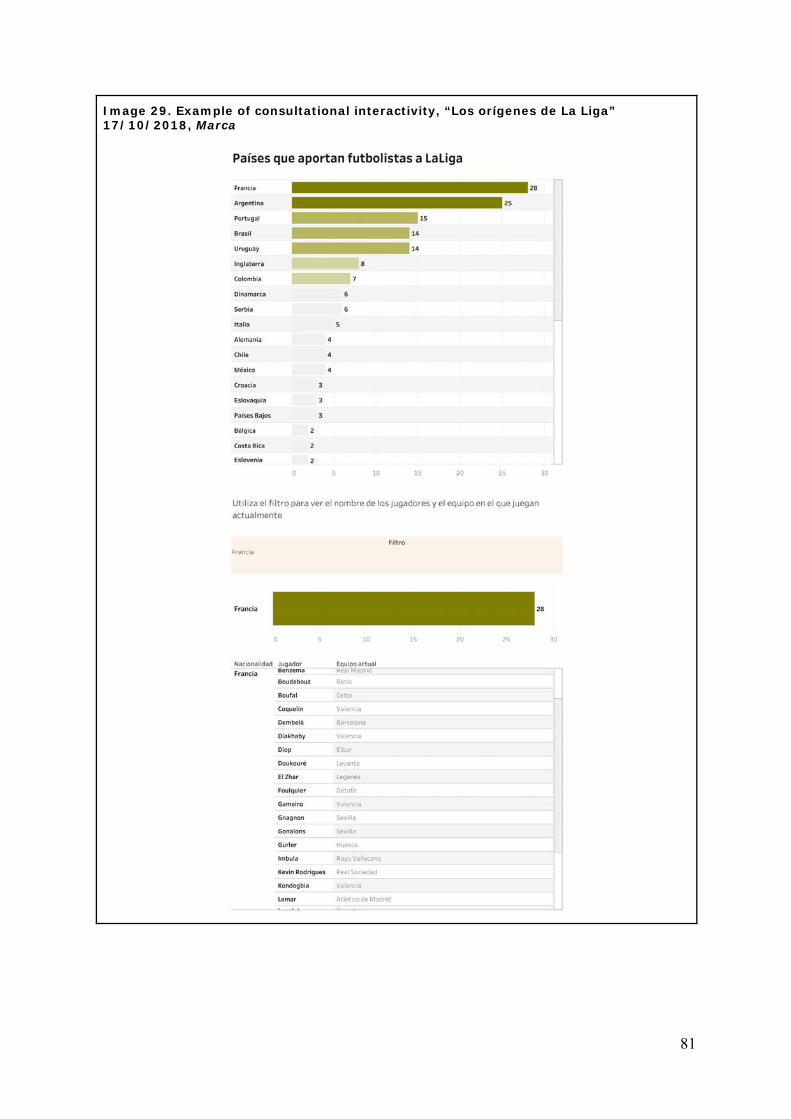
81
Image 29. Example of consultational interactivity, “Los orígenes de La Liga” 17/10/2018, Marca
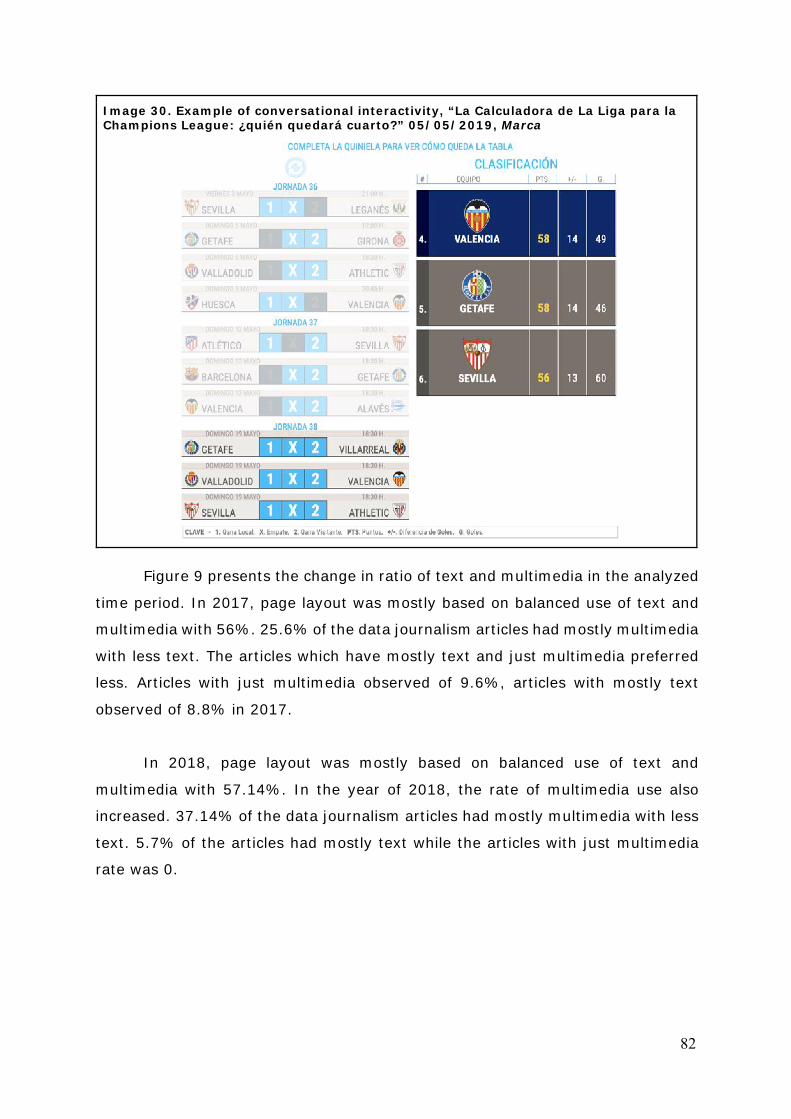
82
Image 30. Example of conversational interactivity, “La Calculadora de La Liga para la Champions League: ¿quién quedará cuarto?” 05/05/2019, Marca
Figure 9 presents the change in ratio of text and multimedia in the analyzed
time period. In 2017, page layout was mostly based on balanced use of text and
multimedia with 56%. 25.6% of the data journalism articles had mostly multimedia
with less text. The articles which have mostly text and just multimedia preferred
less. Articles with just multimedia observed of 9.6%, articles with mostly text
observed of 8.8% in 2017.
In 2018, page layout was mostly based on balanced use of text and
multimedia with 57.14%. In the year of 2018, the rate of multimedia use also
increased. 37.14% of the data journalism articles had mostly multimedia with less
text. 5.7% of the articles had mostly text while the articles with just multimedia
rate was 0.
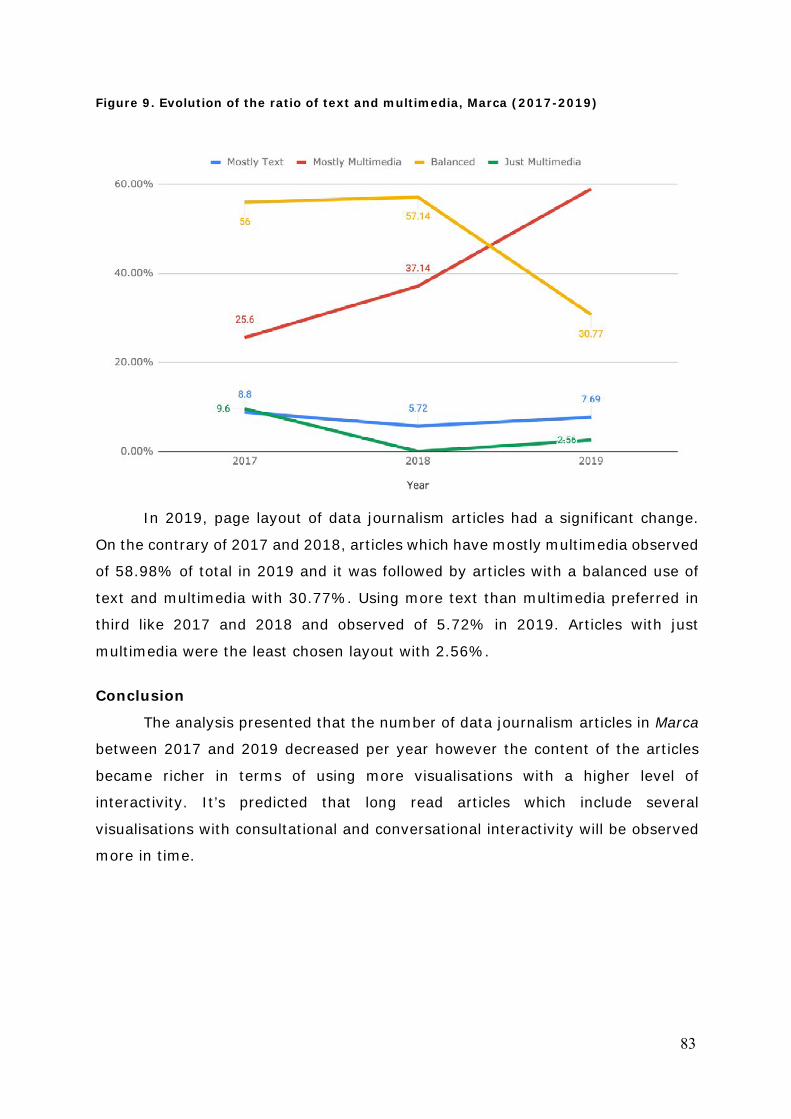
83
Figure 9. Evolution of the ratio of text and multimedia, Marca (2017-2019)
In 2019, page layout of data journalism articles had a significant change.
On the contrary of 2017 and 2018, articles which have mostly multimedia observed
of 58.98% of total in 2019 and it was followed by articles with a balanced use of
text and multimedia with 30.77%. Using more text than multimedia preferred in
third like 2017 and 2018 and observed of 5.72% in 2019. Articles with just
multimedia were the least chosen layout with 2.56%.
Conclusion
The analysis presented that the number of data journalism articles in Marca
between 2017 and 2019 decreased per year however the content of the articles
became richer in terms of using more visualisations with a higher level of
interactivity. It’s predicted that long read articles which include several
visualisations with consultational and conversational interactivity will be observed
more in time.
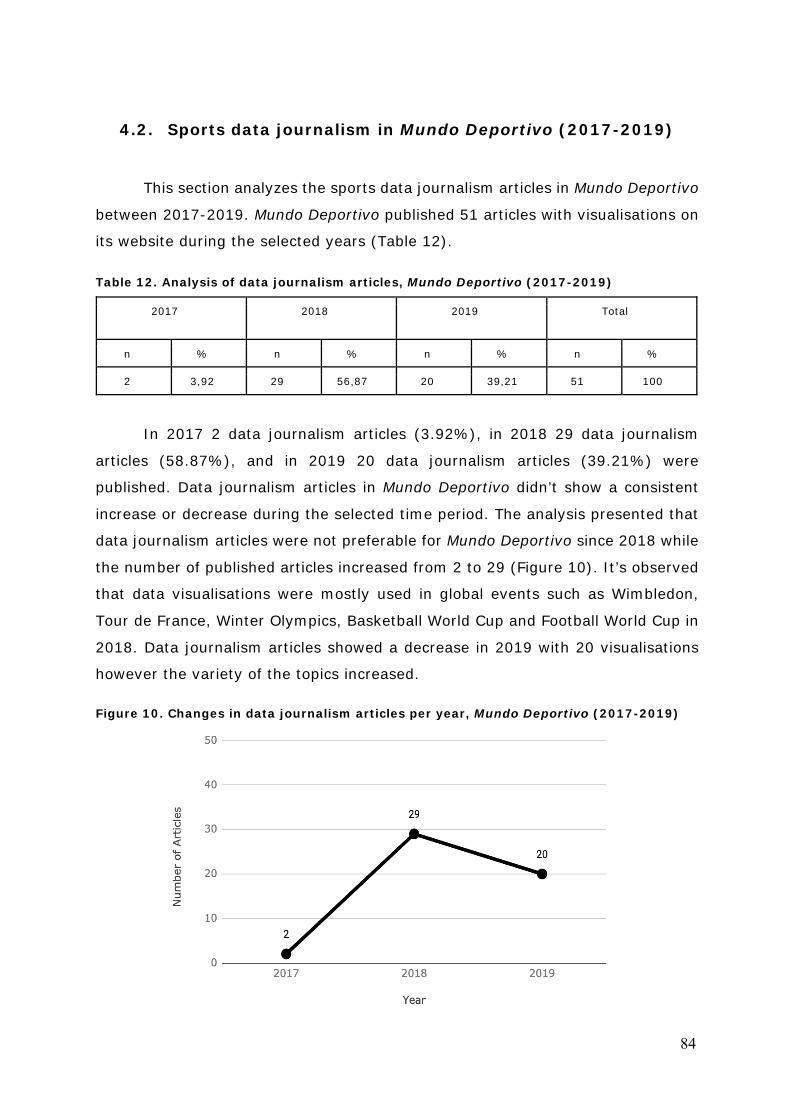
84
4.2. Sports data journalism in Mundo Deportivo (2017-2019)
This section analyzes the sports data journalism articles in Mundo Deportivo
between 2017-2019. Mundo Deportivo published 51 articles with visualisations on
its website during the selected years (Table 12).
Table 12. Analysis of data journalism articles, Mundo Deportivo (2017-2019)
2017 2018 2019 Total
n % n % n % n %
2 3,92 29 56,87 20 39,21 51 100
In 2017 2 data journalism articles (3.92%), in 2018 29 data journalism
articles (58.87%), and in 2019 20 data journalism articles (39.21%) were
published. Data journalism articles in Mundo Deportivo didn’t show a consistent
increase or decrease during the selected time period. The analysis presented that
data journalism articles were not preferable for Mundo Deportivo since 2018 while
the number of published articles increased from 2 to 29 (Figure 10). It’s observed
that data visualisations were mostly used in global events such as Wimbledon,
Tour de France, Winter Olympics, Basketball World Cup and Football World Cup in
2018. Data journalism articles showed a decrease in 2019 with 20 visualisations
however the variety of the topics increased. Figure 10. Changes in data journalism articles per year, Mundo Deportivo (2017-2019)
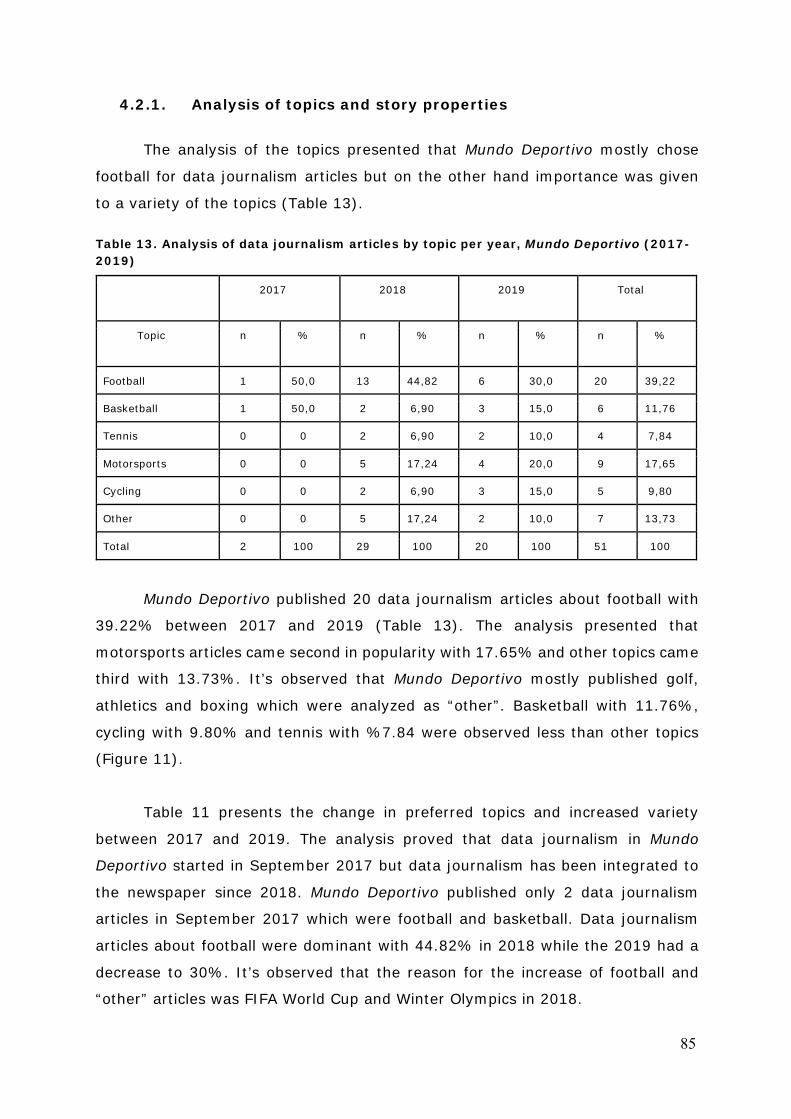
85
4.2.1. Analysis of topics and story properties
The analysis of the topics presented that Mundo Deportivo mostly chose
football for data journalism articles but on the other hand importance was given
to a variety of the topics (Table 13).
Table 13. Analysis of data journalism articles by topic per year, Mundo Deportivo (2017-2019)
2017 2018 2019 Total
Topic n % n % n % n %
Football 1 50,0 13 44,82 6 30,0 20 39,22
Basketball 1 50,0 2 6,90 3 15,0 6 11,76
Tennis 0 0 2 6,90 2 10,0 4 7,84
Motorsports 0 0 5 17,24 4 20,0 9 17,65
Cycling 0 0 2 6,90 3 15,0 5 9,80
Other 0 0 5 17,24 2 10,0 7 13,73
Total 2 100 29 100 20 100 51 100
Mundo Deportivo published 20 data journalism articles about football with
39.22% between 2017 and 2019 (Table 13). The analysis presented that
motorsports articles came second in popularity with 17.65% and other topics came
third with 13.73%. It’s observed that Mundo Deportivo mostly published golf,
athletics and boxing which were analyzed as “other”. Basketball with 11.76%,
cycling with 9.80% and tennis with %7.84 were observed less than other topics
(Figure 11).
Table 11 presents the change in preferred topics and increased variety
between 2017 and 2019. The analysis proved that data journalism in Mundo
Deportivo started in September 2017 but data journalism has been integrated to
the newspaper since 2018. Mundo Deportivo published only 2 data journalism
articles in September 2017 which were football and basketball. Data journalism
articles about football were dominant with 44.82% in 2018 while the 2019 had a
decrease to 30%. It’s observed that the reason for the increase of football and
“other” articles was FIFA World Cup and Winter Olympics in 2018.
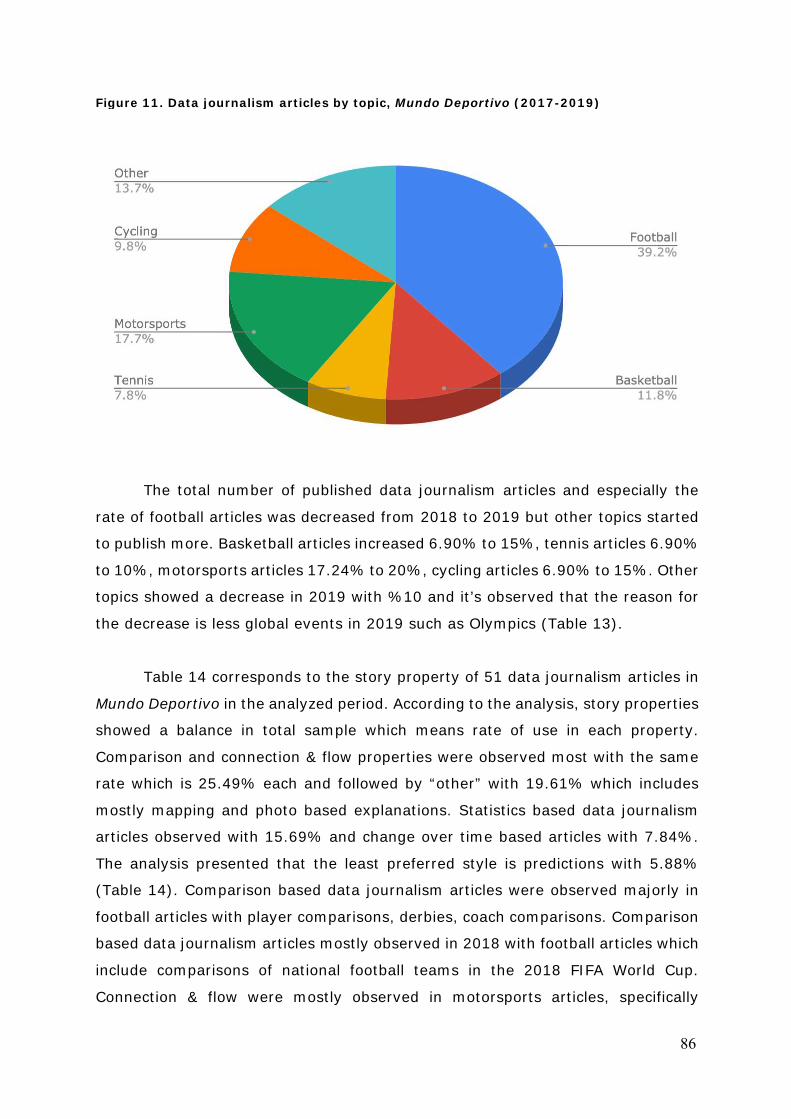
86
Figure 11. Data journalism articles by topic, Mundo Deportivo (2017-2019)
The total number of published data journalism articles and especially the
rate of football articles was decreased from 2018 to 2019 but other topics started
to publish more. Basketball articles increased 6.90% to 15%, tennis articles 6.90%
to 10%, motorsports articles 17.24% to 20%, cycling articles 6.90% to 15%. Other
topics showed a decrease in 2019 with %10 and it’s observed that the reason for
the decrease is less global events in 2019 such as Olympics (Table 13).
Table 14 corresponds to the story property of 51 data journalism articles in
Mundo Deportivo in the analyzed period. According to the analysis, story properties
showed a balance in total sample which means rate of use in each property.
Comparison and connection & flow properties were observed most with the same
rate which is 25.49% each and followed by “other” with 19.61% which includes
mostly mapping and photo based explanations. Statistics based data journalism
articles observed with 15.69% and change over time based articles with 7.84%.
The analysis presented that the least preferred style is predictions with 5.88%
(Table 14). Comparison based data journalism articles were observed majorly in
football articles with player comparisons, derbies, coach comparisons. Comparison
based data journalism articles mostly observed in 2018 with football articles which
include comparisons of national football teams in the 2018 FIFA World Cup.
Connection & flow were mostly observed in motorsports articles, specifically
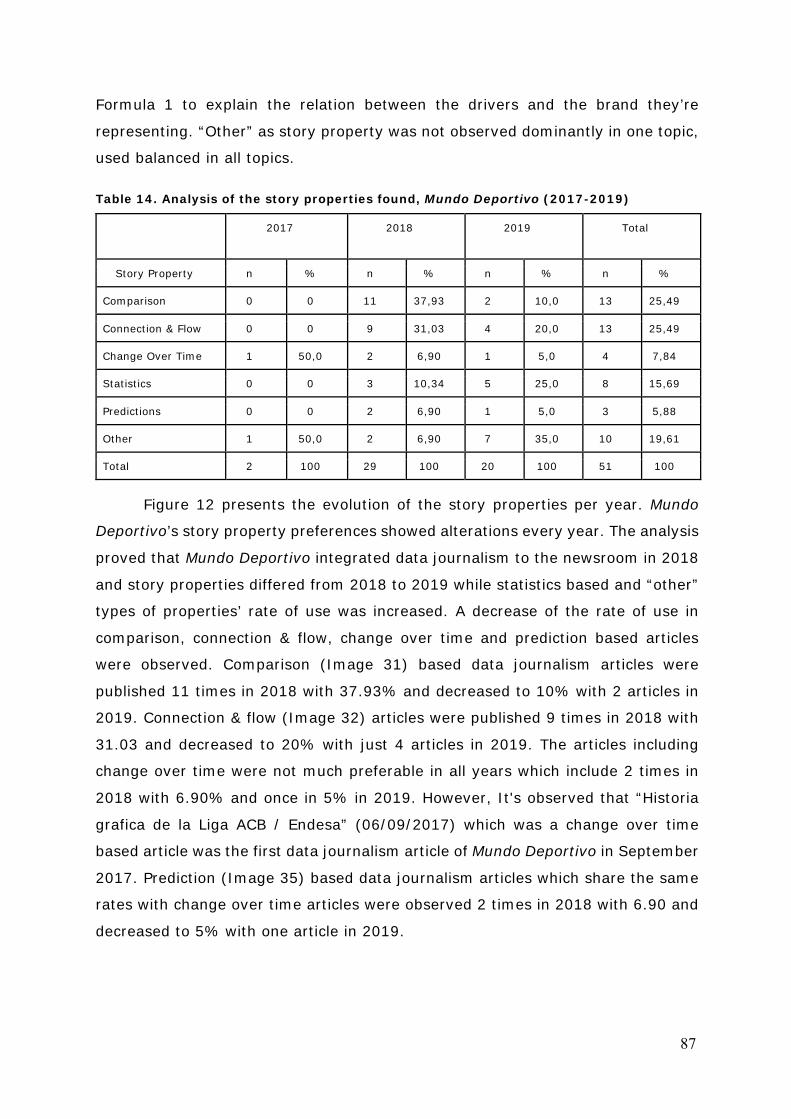
87
Formula 1 to explain the relation between the drivers and the brand they’re
representing. “Other” as story property was not observed dominantly in one topic,
used balanced in all topics.
Table 14. Analysis of the story properties found, Mundo Deportivo (2017-2019)
2017 2018 2019 Total
Story Property n % n % n % n %
Comparison 0 0 11 37,93 2 10,0 13 25,49
Connection & Flow 0 0 9 31,03 4 20,0 13 25,49
Change Over Time 1 50,0 2 6,90 1 5,0 4 7,84
Statistics 0 0 3 10,34 5 25,0 8 15,69
Predictions 0 0 2 6,90 1 5,0 3 5,88
Other 1 50,0 2 6,90 7 35,0 10 19,61
Total 2 100 29 100 20 100 51 100
Figure 12 presents the evolution of the story properties per year. Mundo
Deportivo’s story property preferences showed alterations every year. The analysis
proved that Mundo Deportivo integrated data journalism to the newsroom in 2018
and story properties differed from 2018 to 2019 while statistics based and “other”
types of properties’ rate of use was increased. A decrease of the rate of use in
comparison, connection & flow, change over time and prediction based articles
were observed. Comparison (Image 31) based data journalism articles were
published 11 times in 2018 with 37.93% and decreased to 10% with 2 articles in
2019. Connection & flow (Image 32) articles were published 9 times in 2018 with
31.03 and decreased to 20% with just 4 articles in 2019. The articles including
change over time were not much preferable in all years which include 2 times in
2018 with 6.90% and once in 5% in 2019. However, It's observed that “Historia
grafica de la Liga ACB / Endesa” (06/09/2017) which was a change over time
based article was the first data journalism article of Mundo Deportivo in September
2017. Prediction (Image 35) based data journalism articles which share the same
rates with change over time articles were observed 2 times in 2018 with 6.90 and
decreased to 5% with one article in 2019.
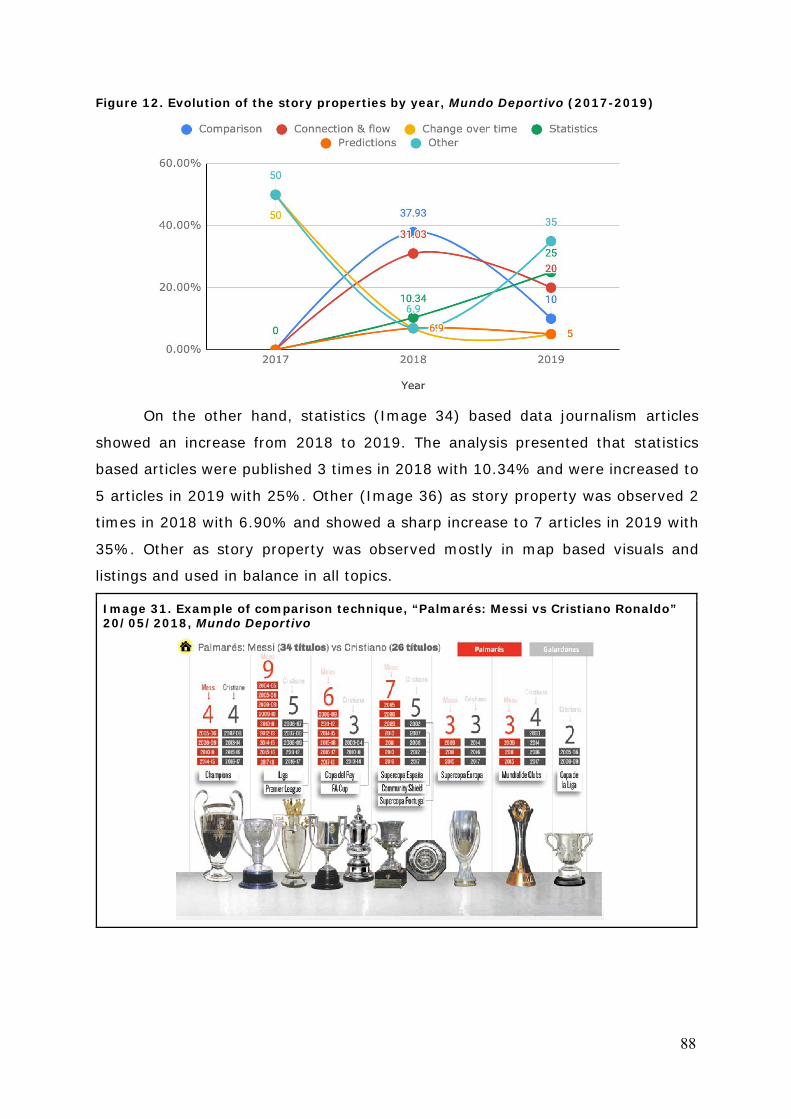
88
Figure 12. Evolution of the story properties by year, Mundo Deportivo (2017-2019)
On the other hand, statistics (Image 34) based data journalism articles
showed an increase from 2018 to 2019. The analysis presented that statistics
based articles were published 3 times in 2018 with 10.34% and were increased to
5 articles in 2019 with 25%. Other (Image 36) as story property was observed 2
times in 2018 with 6.90% and showed a sharp increase to 7 articles in 2019 with
35%. Other as story property was observed mostly in map based visuals and
listings and used in balance in all topics.
Image 31. Example of comparison technique, “Palmarés: Messi vs Cristiano Ronaldo” 20/05/2018, Mundo Deportivo
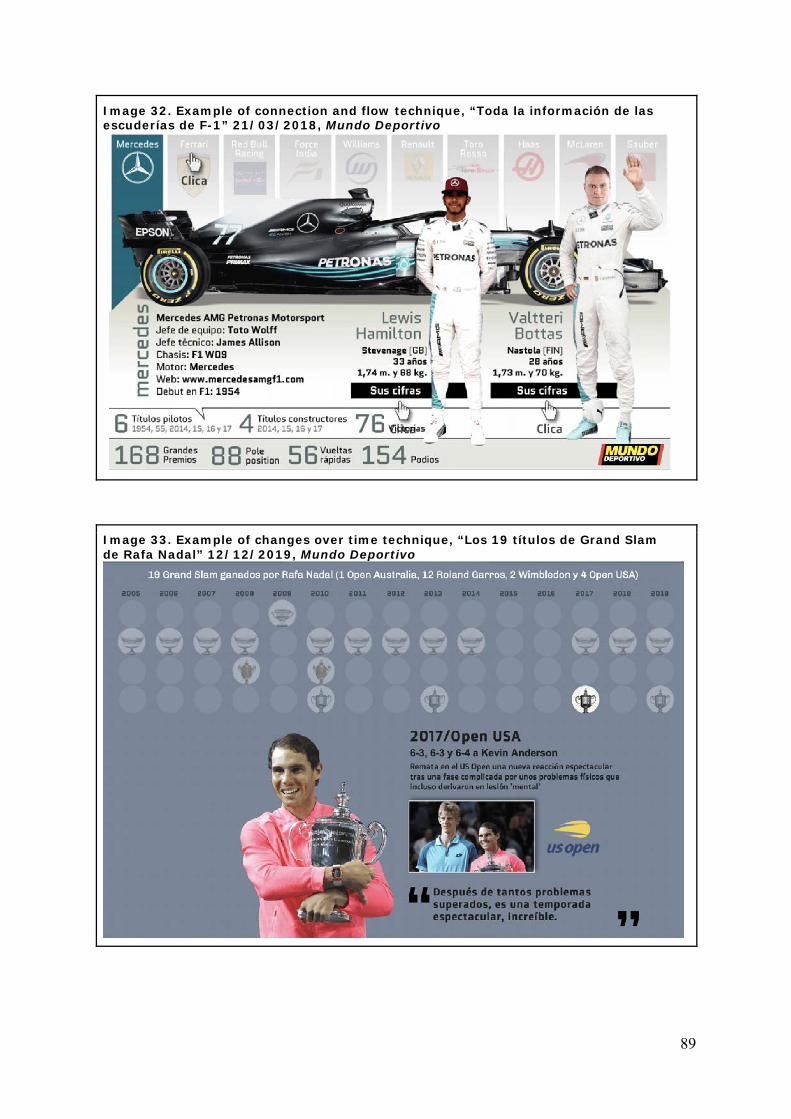
89
Image 32. Example of connection and flow technique, “Toda la información de las escuderías de F-1” 21/03/2018, Mundo Deportivo
Image 33. Example of changes over time technique, “Los 19 títulos de Grand Slam de Rafa Nadal” 12/12/2019, Mundo Deportivo
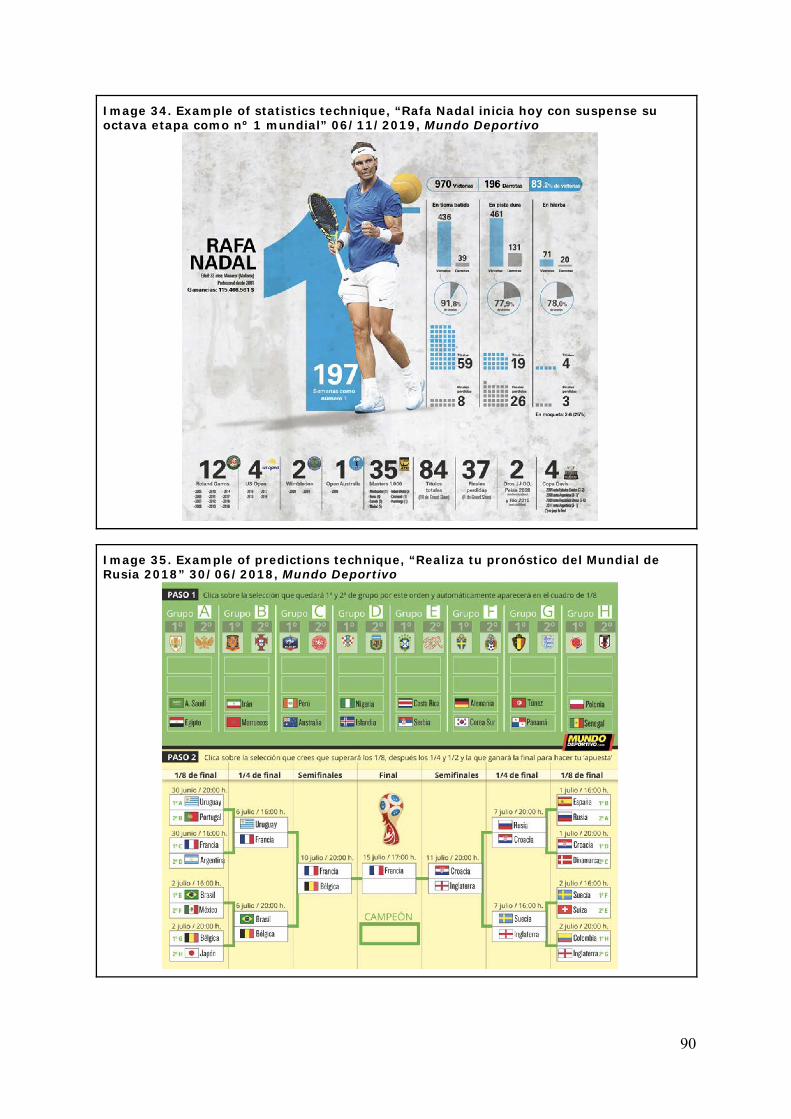
90
Image 34. Example of statistics technique, “Rafa Nadal inicia hoy con suspense su octava etapa como nº 1 mundial” 06/11/2019, Mundo Deportivo
Image 35. Example of predictions technique, “Realiza tu pronóstico del Mundial de Rusia 2018” 30/06/2018, Mundo Deportivo
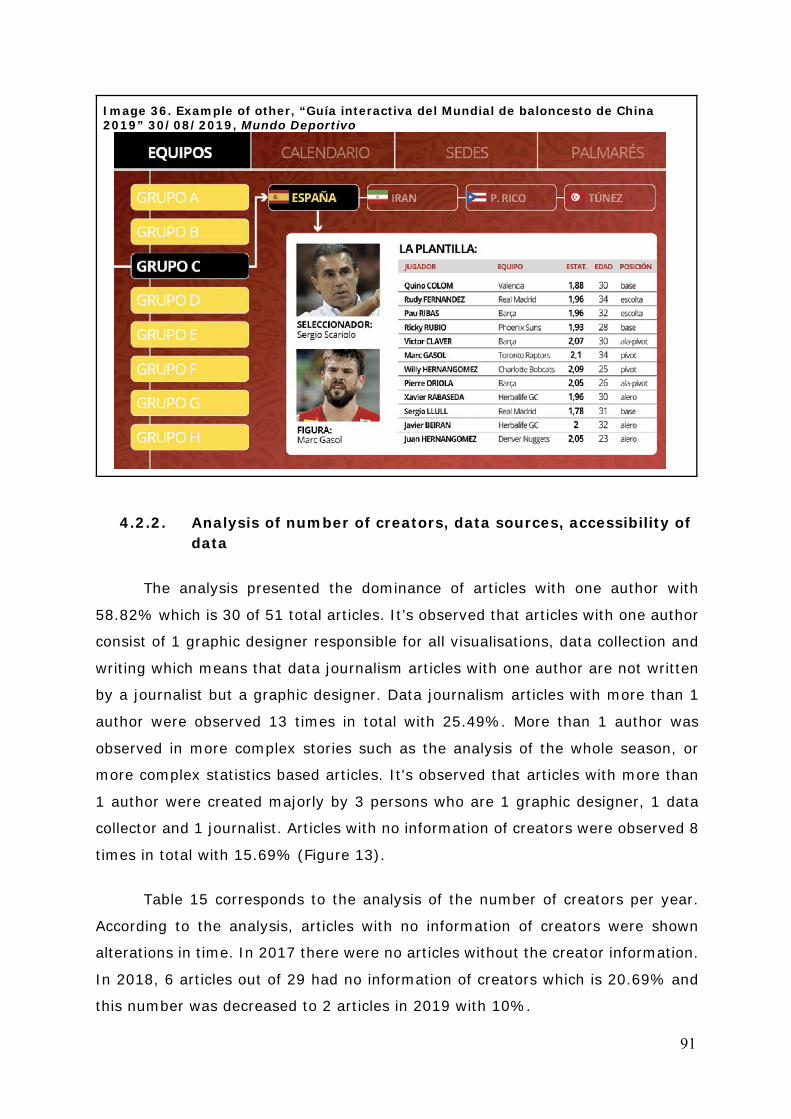
91
Image 36. Example of other, “Guía interactiva del Mundial de baloncesto de China 2019” 30/08/2019, Mundo Deportivo
4.2.2. Analysis of number of creators, data sources, accessibility of data
The analysis presented the dominance of articles with one author with
58.82% which is 30 of 51 total articles. It’s observed that articles with one author
consist of 1 graphic designer responsible for all visualisations, data collection and
writing which means that data journalism articles with one author are not written
by a journalist but a graphic designer. Data journalism articles with more than 1
author were observed 13 times in total with 25.49%. More than 1 author was
observed in more complex stories such as the analysis of the whole season, or
more complex statistics based articles. It's observed that articles with more than
1 author were created majorly by 3 persons who are 1 graphic designer, 1 data
collector and 1 journalist. Articles with no information of creators were observed 8
times in total with 15.69% (Figure 13).
Table 15 corresponds to the analysis of the number of creators per year.
According to the analysis, articles with no information of creators were shown
alterations in time. In 2017 there were no articles without the creator information.
In 2018, 6 articles out of 29 had no information of creators which is 20.69% and
this number was decreased to 2 articles in 2019 with 10%.
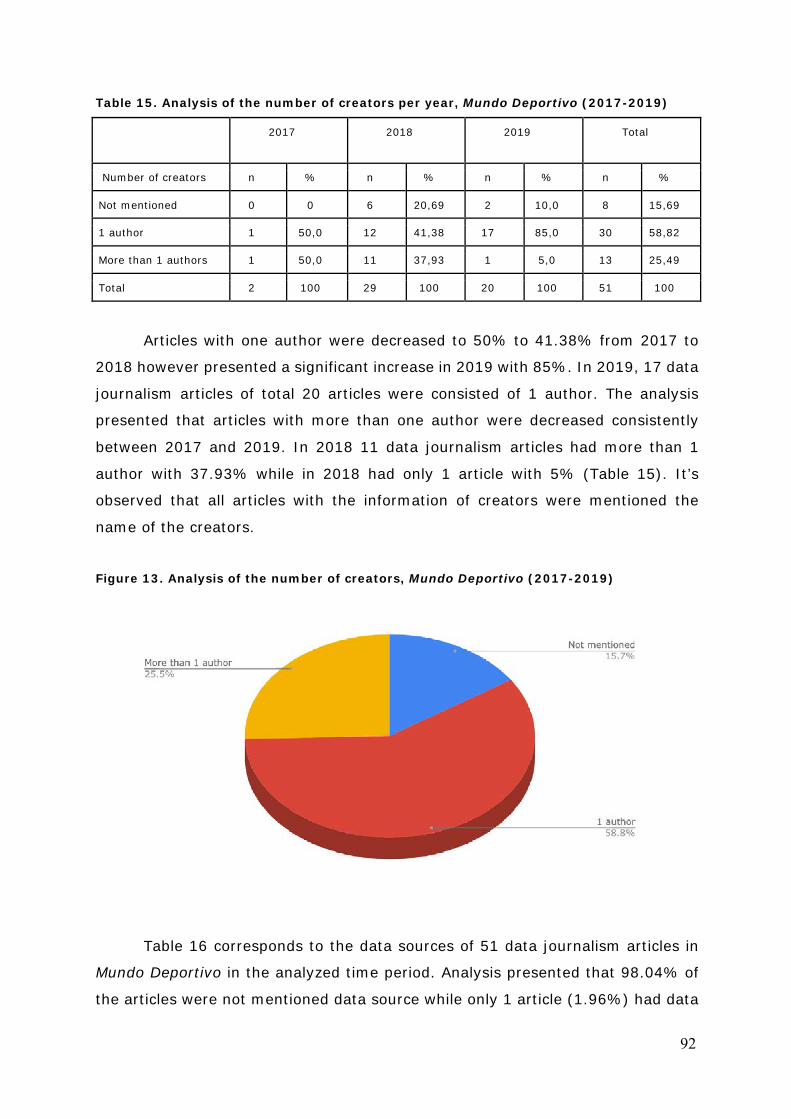
92
Table 15. Analysis of the number of creators per year, Mundo Deportivo (2017-2019)
2017 2018 2019 Total
Number of creators n % n % n % n %
Not mentioned 0 0 6 20,69 2 10,0 8 15,69
1 author 1 50,0 12 41,38 17 85,0 30 58,82
More than 1 authors 1 50,0 11 37,93 1 5,0 13 25,49
Total 2 100 29 100 20 100 51 100
Articles with one author were decreased to 50% to 41.38% from 2017 to
2018 however presented a significant increase in 2019 with 85%. In 2019, 17 data
journalism articles of total 20 articles were consisted of 1 author. The analysis
presented that articles with more than one author were decreased consistently
between 2017 and 2019. In 2018 11 data journalism articles had more than 1
author with 37.93% while in 2018 had only 1 article with 5% (Table 15). It’s
observed that all articles with the information of creators were mentioned the
name of the creators.
Figure 13. Analysis of the number of creators, Mundo Deportivo (2017-2019)
Table 16 corresponds to the data sources of 51 data journalism articles in
Mundo Deportivo in the analyzed time period. Analysis presented that 98.04% of
the articles were not mentioned data source while only 1 article (1.96%) had data
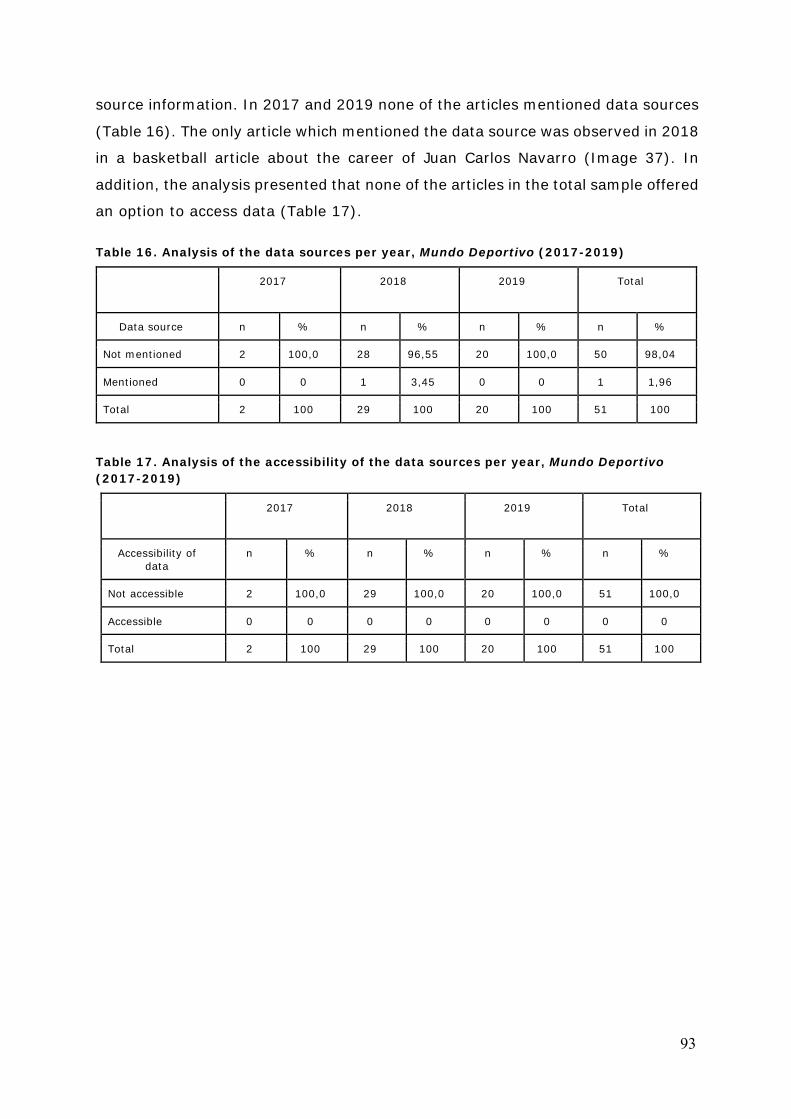
93
source information. In 2017 and 2019 none of the articles mentioned data sources
(Table 16). The only article which mentioned the data source was observed in 2018
in a basketball article about the career of Juan Carlos Navarro (Image 37). In
addition, the analysis presented that none of the articles in the total sample offered
an option to access data (Table 17).
Table 16. Analysis of the data sources per year, Mundo Deportivo (2017-2019)
2017 2018 2019 Total
Data source n % n % n % n %
Not mentioned 2 100,0 28 96,55 20 100,0 50 98,04
Mentioned 0 0 1 3,45 0 0 1 1,96
Total 2 100 29 100 20 100 51 100
Table 17. Analysis of the accessibility of the data sources per year, Mundo Deportivo (2017-2019)
2017 2018 2019 Total
Accessibility of data
n % n % n % n %
Not accessible 2 100,0 29 100,0 20 100,0 51 100,0
Accessible 0 0 0 0 0 0 0 0
Total 2 100 29 100 20 100 51 100
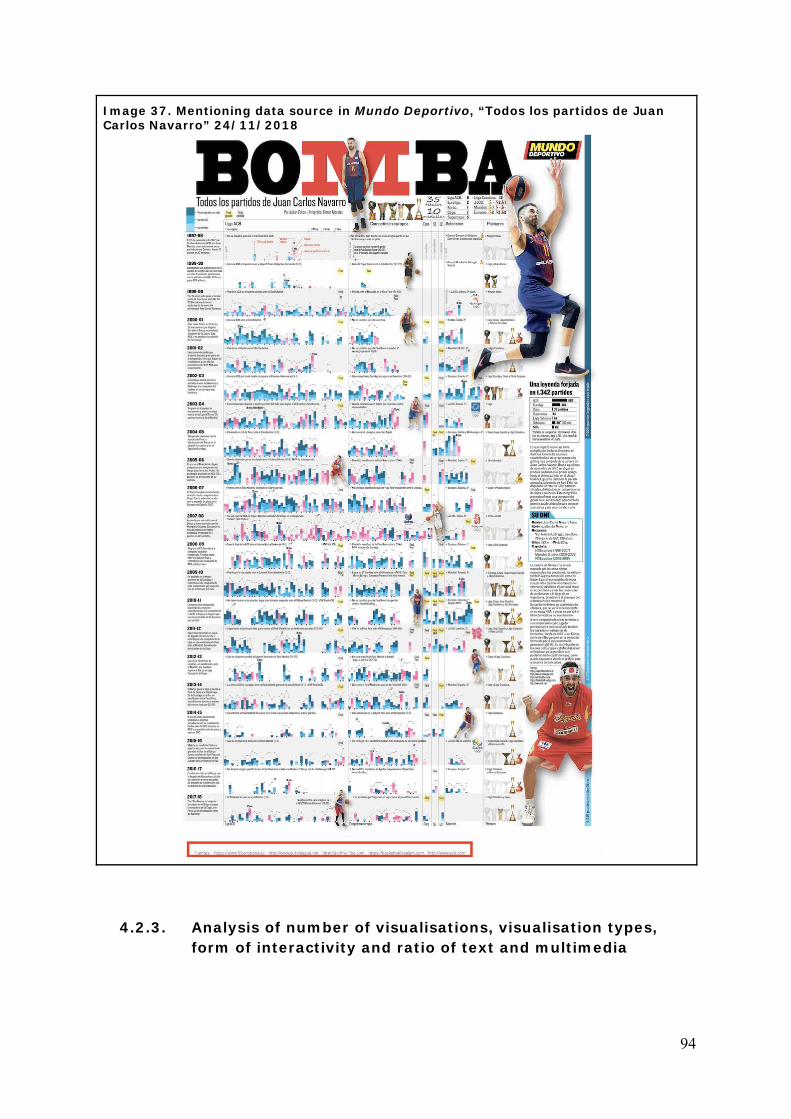
94
Image 37. Mentioning data source in Mundo Deportivo, “Todos los partidos de Juan Carlos Navarro” 24/11/2018
4.2.3. Analysis of number of visualisations, visualisation types, form of interactivity and ratio of text and multimedia
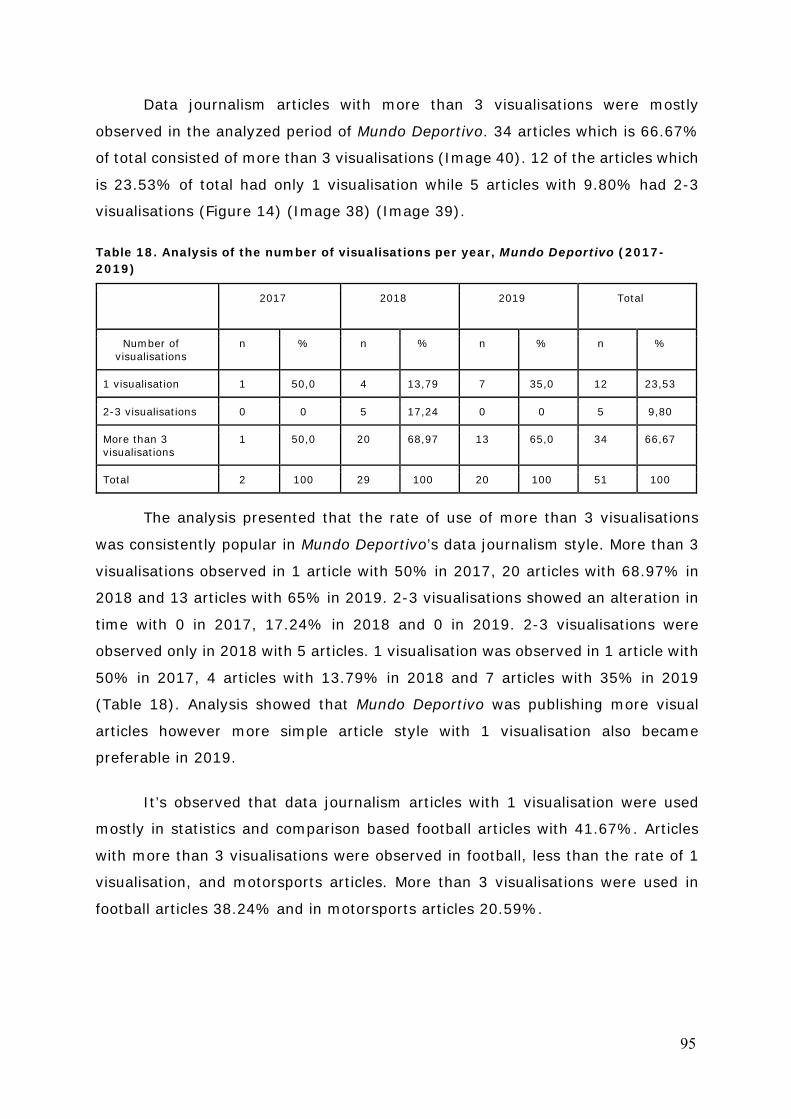
95
Data journalism articles with more than 3 visualisations were mostly
observed in the analyzed period of Mundo Deportivo. 34 articles which is 66.67%
of total consisted of more than 3 visualisations (Image 40). 12 of the articles which
is 23.53% of total had only 1 visualisation while 5 articles with 9.80% had 2-3
visualisations (Figure 14) (Image 38) (Image 39).
Table 18. Analysis of the number of visualisations per year, Mundo Deportivo (2017-2019)
2017 2018 2019 Total
Number of visualisations
n % n % n % n %
1 visualisation 1 50,0 4 13,79 7 35,0 12 23,53
2-3 visualisations 0 0 5 17,24 0 0 5 9,80
More than 3 visualisations
1 50,0 20 68,97 13 65,0 34 66,67
Total 2 100 29 100 20 100 51 100
The analysis presented that the rate of use of more than 3 visualisations
was consistently popular in Mundo Deportivo’s data journalism style. More than 3
visualisations observed in 1 article with 50% in 2017, 20 articles with 68.97% in
2018 and 13 articles with 65% in 2019. 2-3 visualisations showed an alteration in
time with 0 in 2017, 17.24% in 2018 and 0 in 2019. 2-3 visualisations were
observed only in 2018 with 5 articles. 1 visualisation was observed in 1 article with
50% in 2017, 4 articles with 13.79% in 2018 and 7 articles with 35% in 2019
(Table 18). Analysis showed that Mundo Deportivo was publishing more visual
articles however more simple article style with 1 visualisation also became
preferable in 2019.
It’s observed that data journalism articles with 1 visualisation were used
mostly in statistics and comparison based football articles with 41.67%. Articles
with more than 3 visualisations were observed in football, less than the rate of 1
visualisation, and motorsports articles. More than 3 visualisations were used in
football articles 38.24% and in motorsports articles 20.59%.
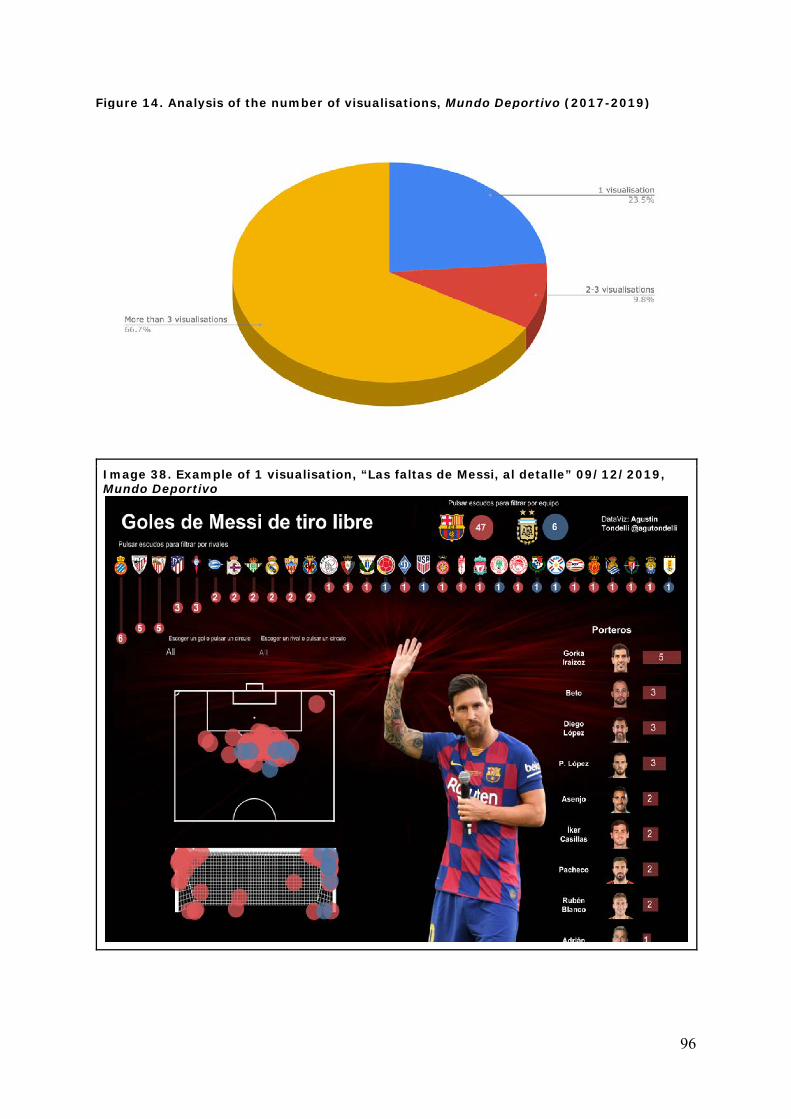
96
Figure 14. Analysis of the number of visualisations, Mundo Deportivo (2017-2019)
Image 38. Example of 1 visualisation, “Las faltas de Messi, al detalle” 09/12/2019, Mundo Deportivo
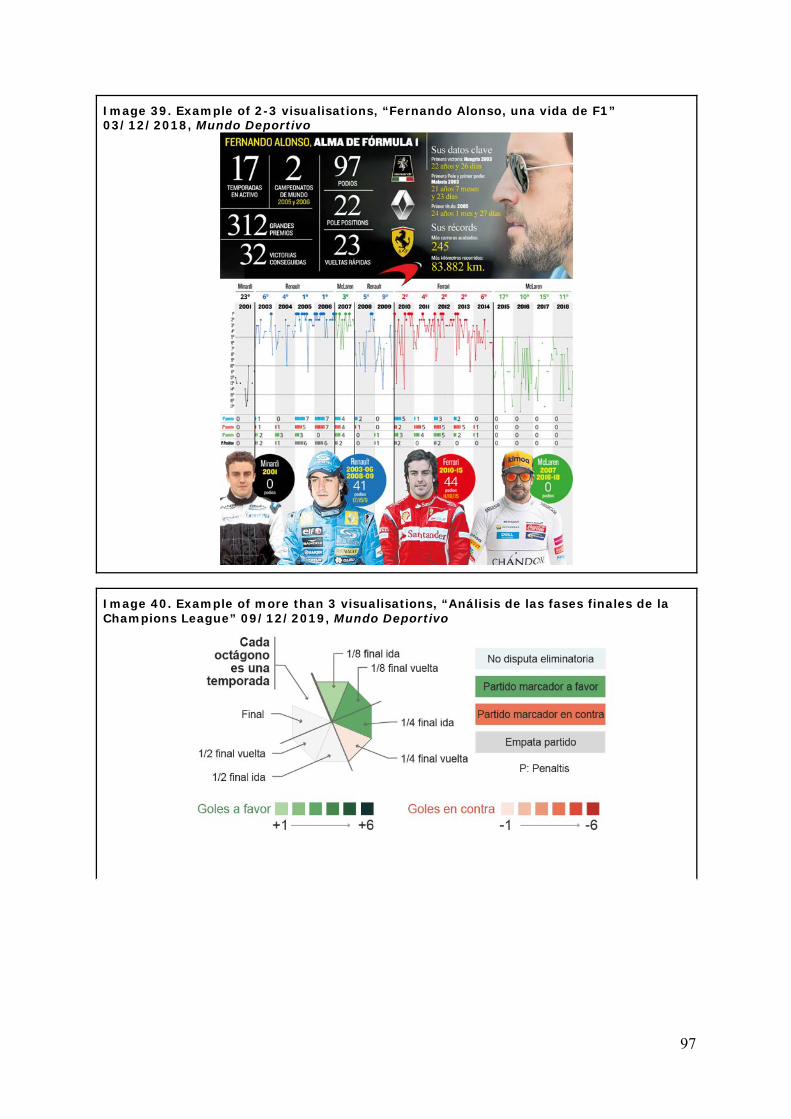
97
Image 39. Example of 2-3 visualisations, “Fernando Alonso, una vida de F1” 03/12/2018, Mundo Deportivo
Image 40. Example of more than 3 visualisations, “Análisis de las fases finales de la Champions League” 09/12/2019, Mundo Deportivo
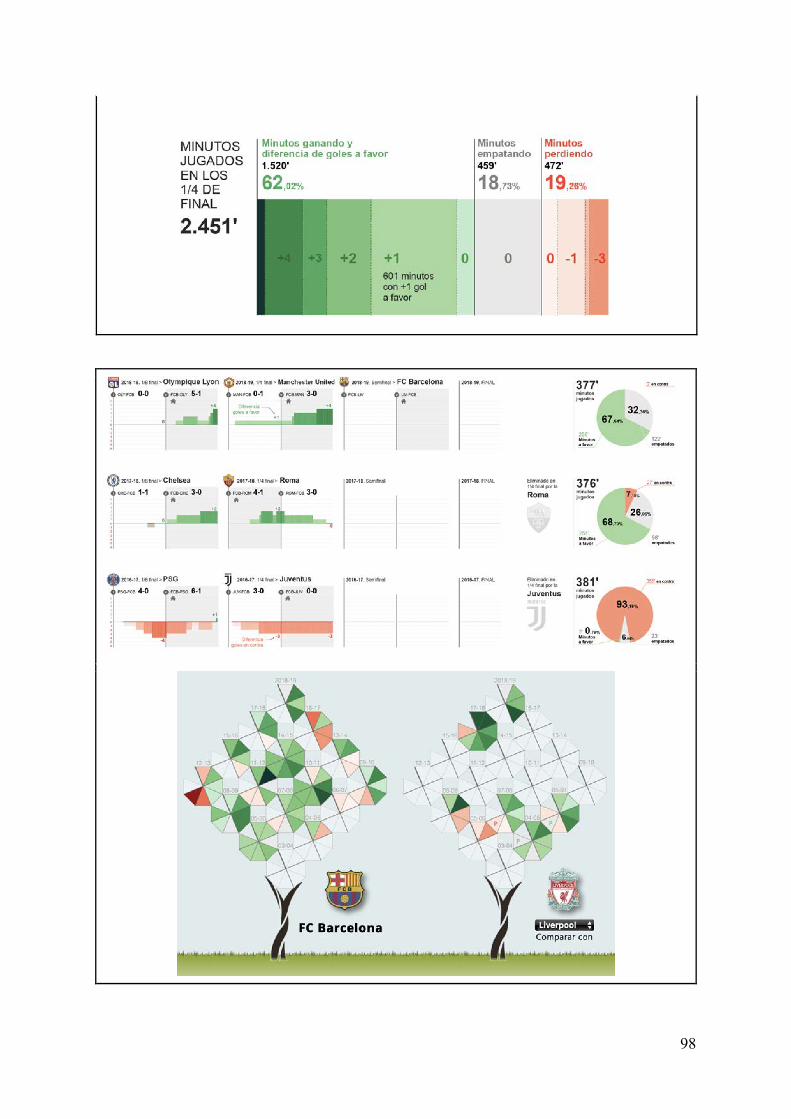
98
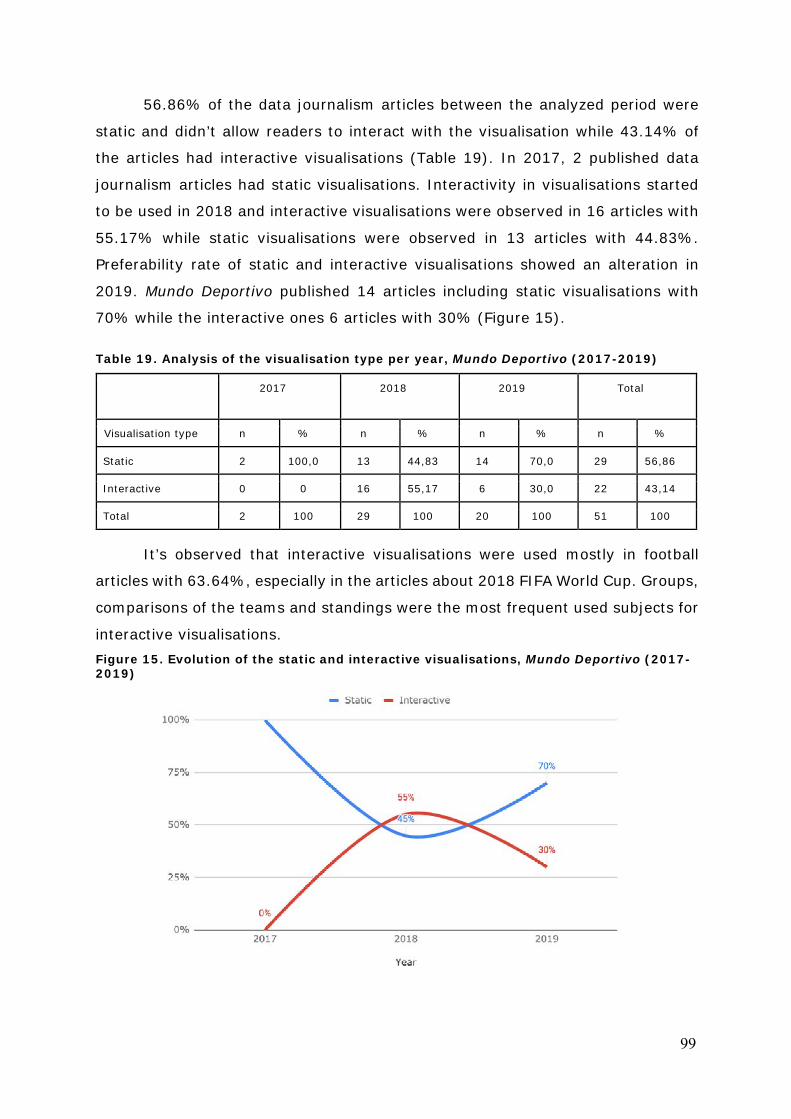
99
56.86% of the data journalism articles between the analyzed period were
static and didn’t allow readers to interact with the visualisation while 43.14% of
the articles had interactive visualisations (Table 19). In 2017, 2 published data
journalism articles had static visualisations. Interactivity in visualisations started
to be used in 2018 and interactive visualisations were observed in 16 articles with
55.17% while static visualisations were observed in 13 articles with 44.83%.
Preferability rate of static and interactive visualisations showed an alteration in
2019. Mundo Deportivo published 14 articles including static visualisations with
70% while the interactive ones 6 articles with 30% (Figure 15).
Table 19. Analysis of the visualisation type per year, Mundo Deportivo (2017-2019)
2017 2018 2019 Total
Visualisation type n % n % n % n %
Static 2 100,0 13 44,83 14 70,0 29 56,86
Interactive 0 0 16 55,17 6 30,0 22 43,14
Total 2 100 29 100 20 100 51 100
It’s observed that interactive visualisations were used mostly in football
articles with 63.64%, especially in the articles about 2018 FIFA World Cup. Groups,
comparisons of the teams and standings were the most frequent used subjects for
interactive visualisations. Figure 15. Evolution of the static and interactive visualisations, Mundo Deportivo (2017-2019)
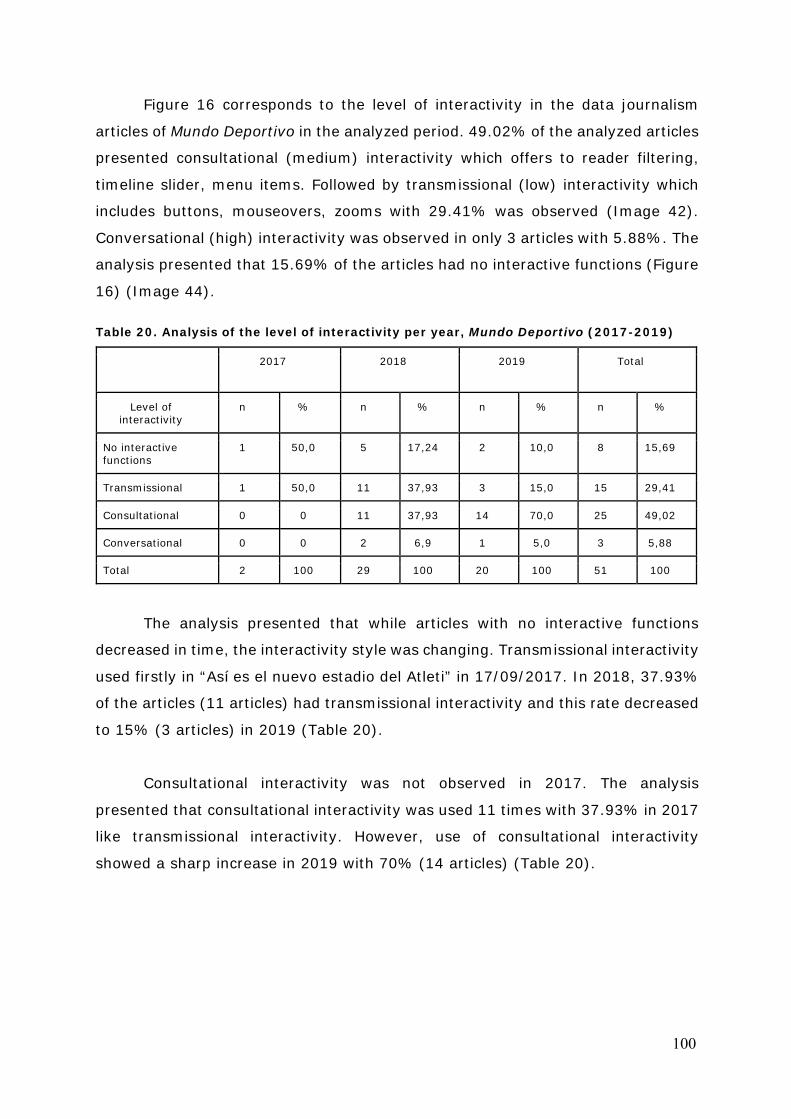
100
Figure 16 corresponds to the level of interactivity in the data journalism
articles of Mundo Deportivo in the analyzed period. 49.02% of the analyzed articles
presented consultational (medium) interactivity which offers to reader filtering,
timeline slider, menu items. Followed by transmissional (low) interactivity which
includes buttons, mouseovers, zooms with 29.41% was observed (Image 42).
Conversational (high) interactivity was observed in only 3 articles with 5.88%. The
analysis presented that 15.69% of the articles had no interactive functions (Figure
16) (Image 44).
Table 20. Analysis of the level of interactivity per year, Mundo Deportivo (2017-2019)
2017 2018 2019 Total
Level of interactivity
n % n % n % n %
No interactive functions
1 50,0 5 17,24 2 10,0 8 15,69
Transmissional 1 50,0 11 37,93 3 15,0 15 29,41
Consultational 0 0 11 37,93 14 70,0 25 49,02
Conversational 0 0 2 6,9 1 5,0 3 5,88
Total 2 100 29 100 20 100 51 100
The analysis presented that while articles with no interactive functions
decreased in time, the interactivity style was changing. Transmissional interactivity
used firstly in “Así es el nuevo estadio del Atleti” in 17/09/2017. In 2018, 37.93%
of the articles (11 articles) had transmissional interactivity and this rate decreased
to 15% (3 articles) in 2019 (Table 20).
Consultational interactivity was not observed in 2017. The analysis
presented that consultational interactivity was used 11 times with 37.93% in 2017
like transmissional interactivity. However, use of consultational interactivity
showed a sharp increase in 2019 with 70% (14 articles) (Table 20).
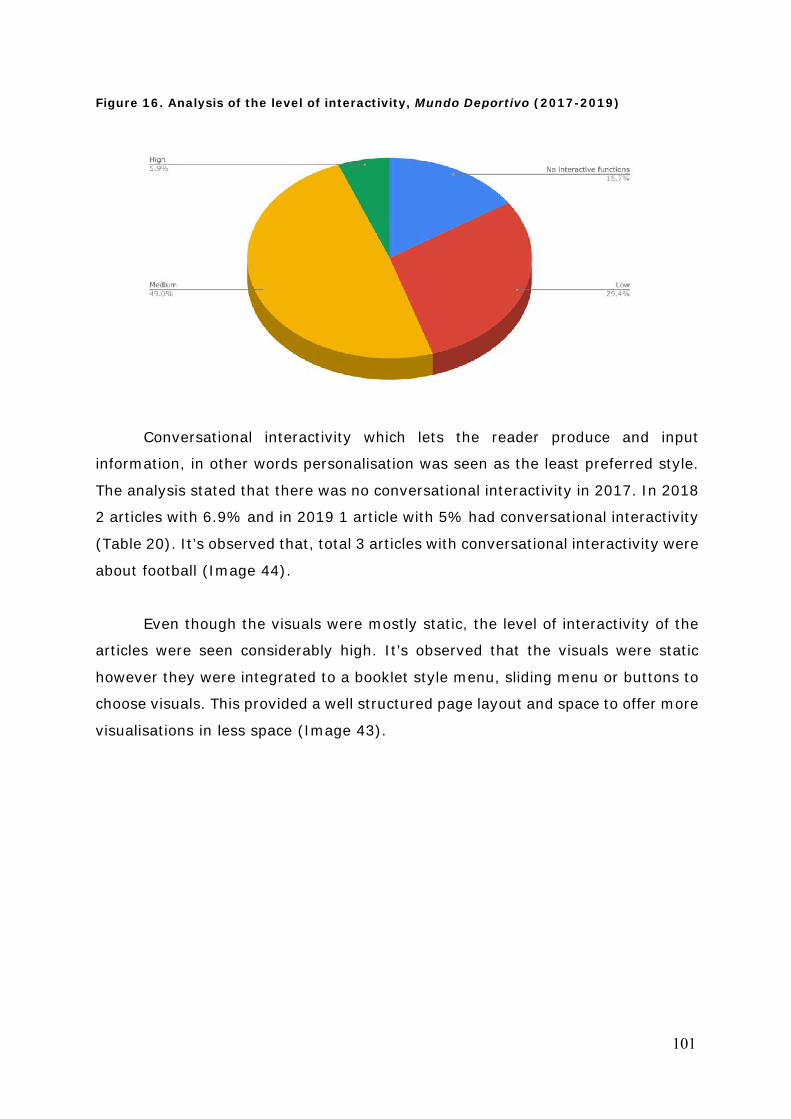
101
Figure 16. Analysis of the level of interactivity, Mundo Deportivo (2017-2019)
Conversational interactivity which lets the reader produce and input
information, in other words personalisation was seen as the least preferred style.
The analysis stated that there was no conversational interactivity in 2017. In 2018
2 articles with 6.9% and in 2019 1 article with 5% had conversational interactivity
(Table 20). It’s observed that, total 3 articles with conversational interactivity were
about football (Image 44).
Even though the visuals were mostly static, the level of interactivity of the
articles were seen considerably high. It’s observed that the visuals were static
however they were integrated to a booklet style menu, sliding menu or buttons to
choose visuals. This provided a well structured page layout and space to offer more
visualisations in less space (Image 43).
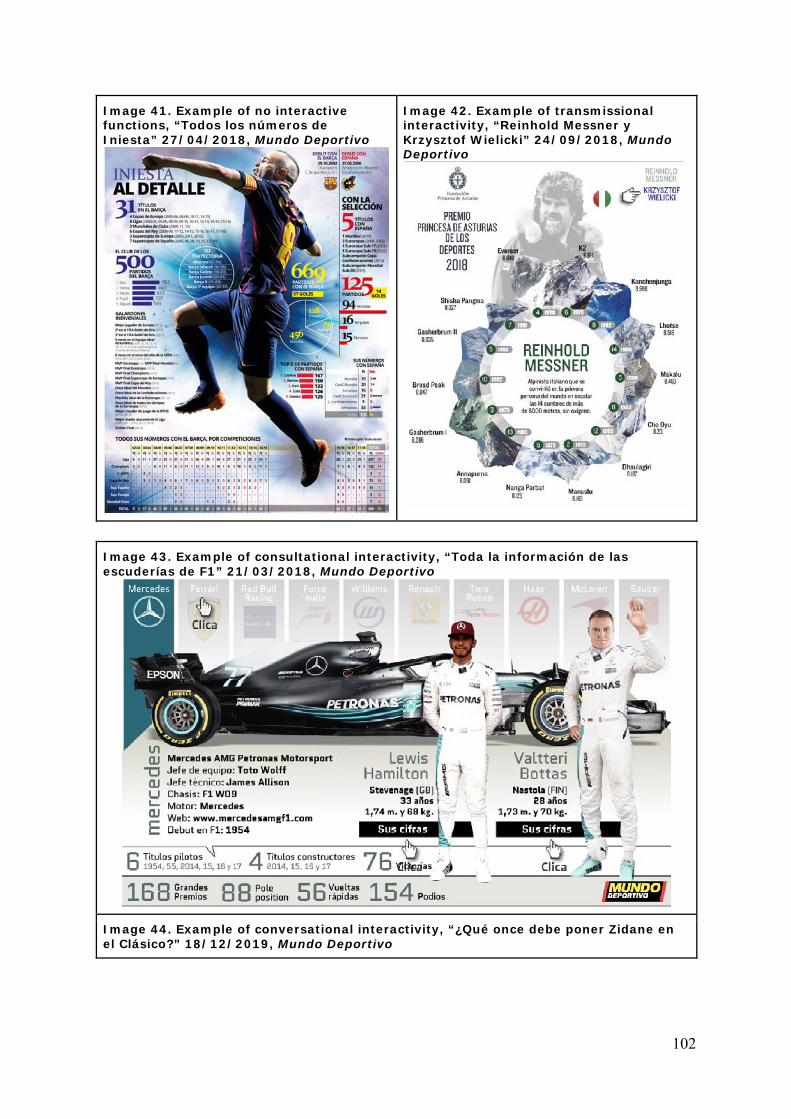
102
Image 41. Example of no interactive functions, “Todos los números de Iniesta” 27/04/2018, Mundo Deportivo
Image 42. Example of transmissional interactivity, “Reinhold Messner y Krzysztof Wielicki” 24/09/2018, Mundo Deportivo
Image 43. Example of consultational interactivity, “Toda la información de las escuderías de F1” 21/03/2018, Mundo Deportivo
Image 44. Example of conversational interactivity, “¿Qué once debe poner Zidane en el Clásico?” 18/12/2019, Mundo Deportivo
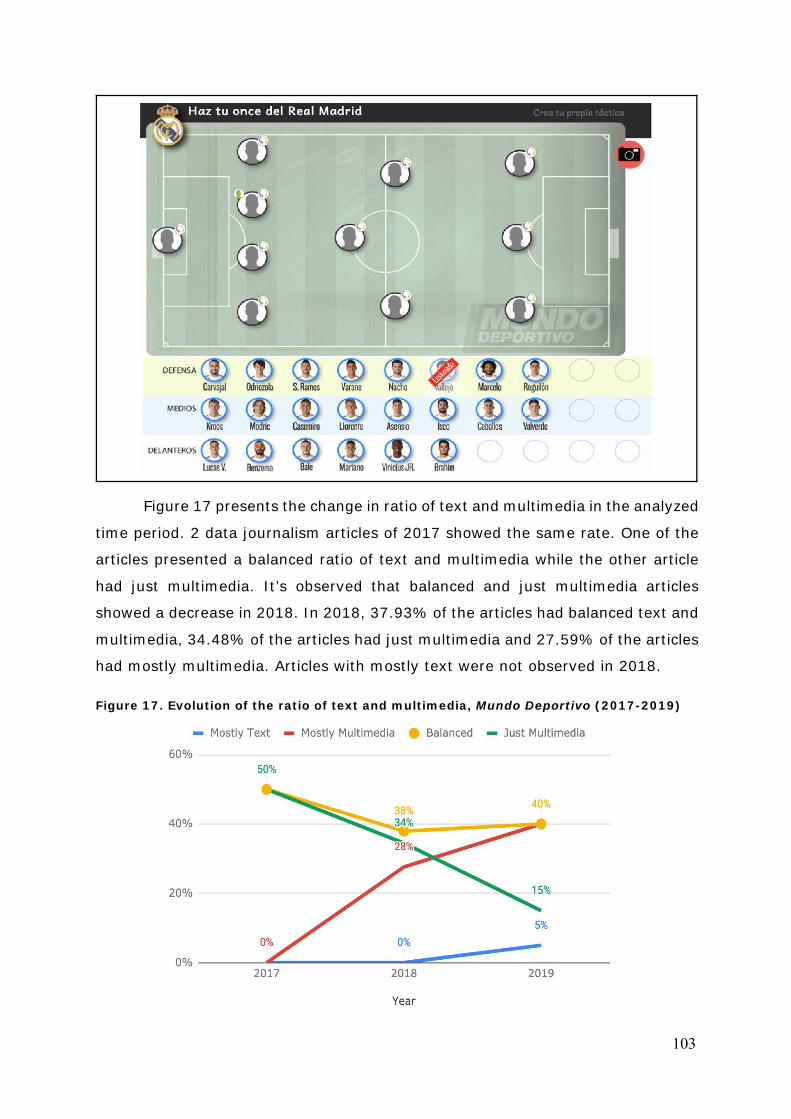
103
Figure 17 presents the change in ratio of text and multimedia in the analyzed
time period. 2 data journalism articles of 2017 showed the same rate. One of the
articles presented a balanced ratio of text and multimedia while the other article
had just multimedia. It’s observed that balanced and just multimedia articles
showed a decrease in 2018. In 2018, 37.93% of the articles had balanced text and
multimedia, 34.48% of the articles had just multimedia and 27.59% of the articles
had mostly multimedia. Articles with mostly text were not observed in 2018. Figure 17. Evolution of the ratio of text and multimedia, Mundo Deportivo (2017-2019)
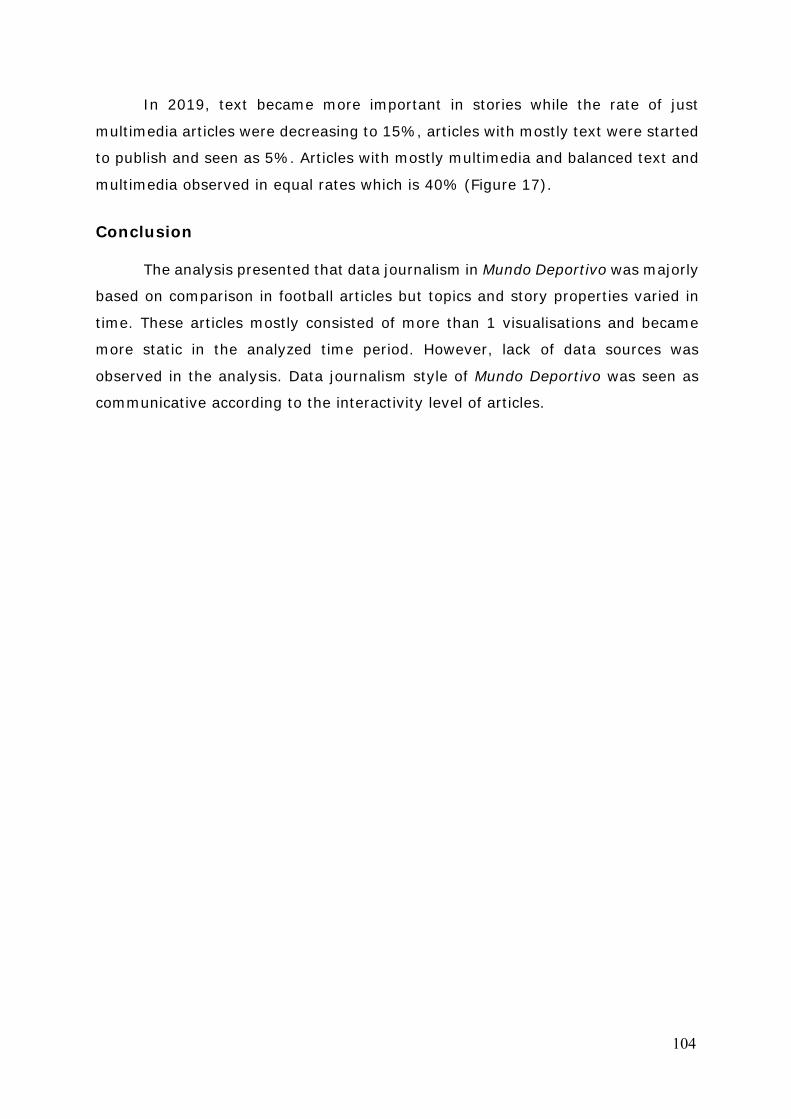
104
In 2019, text became more important in stories while the rate of just
multimedia articles were decreasing to 15%, articles with mostly text were started
to publish and seen as 5%. Articles with mostly multimedia and balanced text and
multimedia observed in equal rates which is 40% (Figure 17).
Conclusion
The analysis presented that data journalism in Mundo Deportivo was majorly
based on comparison in football articles but topics and story properties varied in
time. These articles mostly consisted of more than 1 visualisations and became
more static in the analyzed time period. However, lack of data sources was
observed in the analysis. Data journalism style of Mundo Deportivo was seen as
communicative according to the interactivity level of articles.
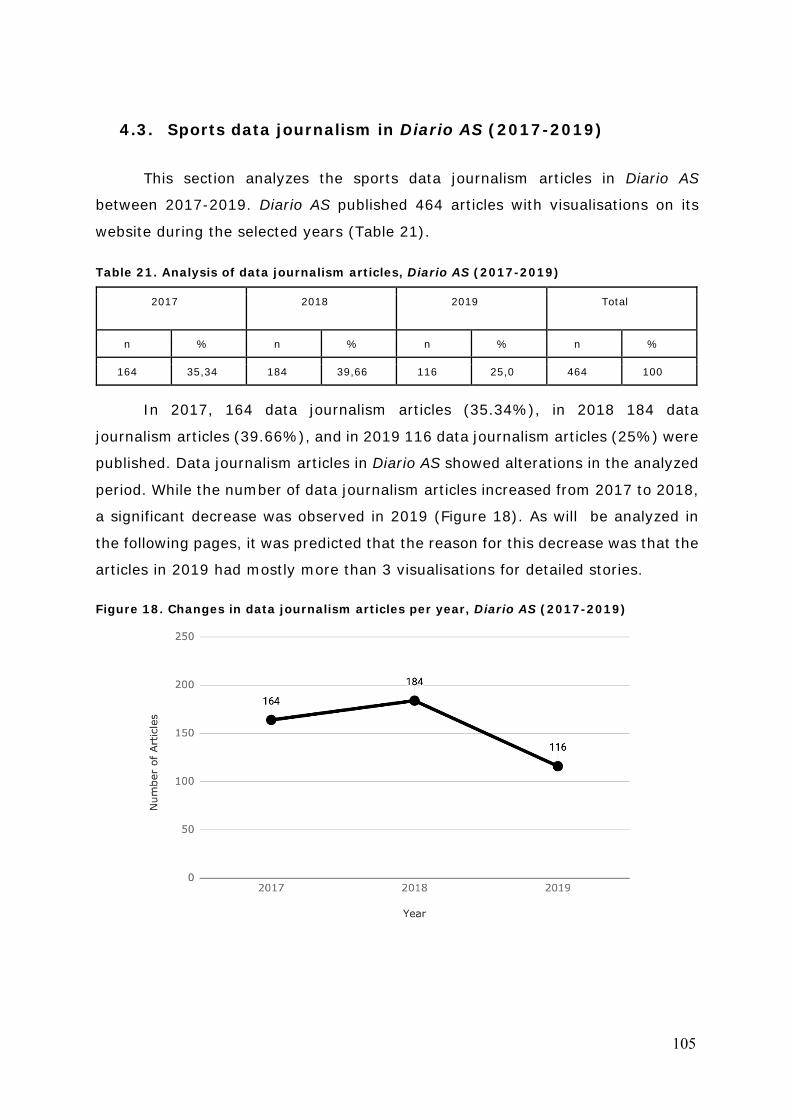
105
4.3. Sports data journalism in Diario AS (2017-2019)
This section analyzes the sports data journalism articles in Diario AS
between 2017-2019. Diario AS published 464 articles with visualisations on its
website during the selected years (Table 21).
Table 21. Analysis of data journalism articles, Diario AS (2017-2019)
2017 2018 2019 Total
n % n % n % n %
164 35,34 184 39,66 116 25,0 464 100
In 2017, 164 data journalism articles (35.34%), in 2018 184 data
journalism articles (39.66%), and in 2019 116 data journalism articles (25%) were
published. Data journalism articles in Diario AS showed alterations in the analyzed
period. While the number of data journalism articles increased from 2017 to 2018,
a significant decrease was observed in 2019 (Figure 18). As will be analyzed in
the following pages, it was predicted that the reason for this decrease was that the
articles in 2019 had mostly more than 3 visualisations for detailed stories. Figure 18. Changes in data journalism articles per year, Diario AS (2017-2019)
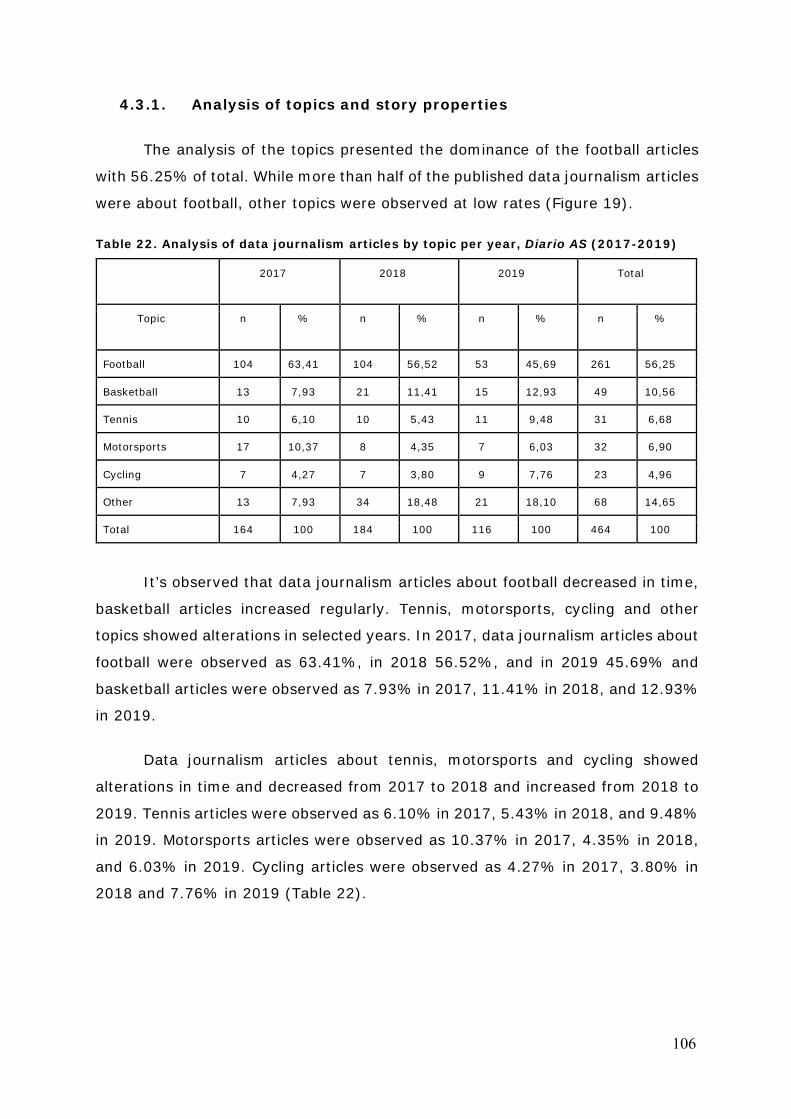
106
4.3.1. Analysis of topics and story properties
The analysis of the topics presented the dominance of the football articles
with 56.25% of total. While more than half of the published data journalism articles
were about football, other topics were observed at low rates (Figure 19).
Table 22. Analysis of data journalism articles by topic per year, Diario AS (2017-2019)
2017 2018 2019 Total
Topic n % n % n % n %
Football 104 63,41 104 56,52 53 45,69 261 56,25
Basketball 13 7,93 21 11,41 15 12,93 49 10,56
Tennis 10 6,10 10 5,43 11 9,48 31 6,68
Motorsports 17 10,37 8 4,35 7 6,03 32 6,90
Cycling 7 4,27 7 3,80 9 7,76 23 4,96
Other 13 7,93 34 18,48 21 18,10 68 14,65
Total 164 100 184 100 116 100 464 100
It’s observed that data journalism articles about football decreased in time,
basketball articles increased regularly. Tennis, motorsports, cycling and other
topics showed alterations in selected years. In 2017, data journalism articles about
football were observed as 63.41%, in 2018 56.52%, and in 2019 45.69% and
basketball articles were observed as 7.93% in 2017, 11.41% in 2018, and 12.93%
in 2019.
Data journalism articles about tennis, motorsports and cycling showed
alterations in time and decreased from 2017 to 2018 and increased from 2018 to
2019. Tennis articles were observed as 6.10% in 2017, 5.43% in 2018, and 9.48%
in 2019. Motorsports articles were observed as 10.37% in 2017, 4.35% in 2018,
and 6.03% in 2019. Cycling articles were observed as 4.27% in 2017, 3.80% in
2018 and 7.76% in 2019 (Table 22).
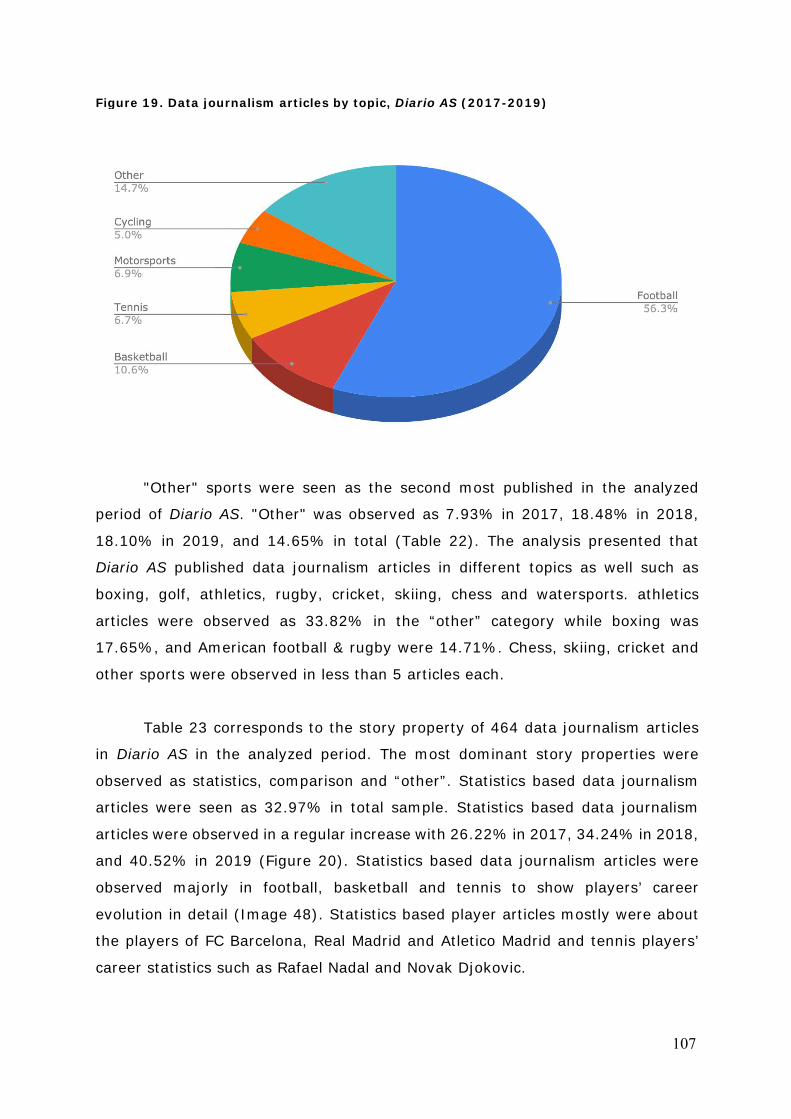
107
Figure 19. Data journalism articles by topic, Diario AS (2017-2019)
"Other" sports were seen as the second most published in the analyzed
period of Diario AS. "Other" was observed as 7.93% in 2017, 18.48% in 2018,
18.10% in 2019, and 14.65% in total (Table 22). The analysis presented that
Diario AS published data journalism articles in different topics as well such as
boxing, golf, athletics, rugby, cricket, skiing, chess and watersports. athletics
articles were observed as 33.82% in the “other” category while boxing was
17.65%, and American football & rugby were 14.71%. Chess, skiing, cricket and
other sports were observed in less than 5 articles each.
Table 23 corresponds to the story property of 464 data journalism articles
in Diario AS in the analyzed period. The most dominant story properties were
observed as statistics, comparison and “other”. Statistics based data journalism
articles were seen as 32.97% in total sample. Statistics based data journalism
articles were observed in a regular increase with 26.22% in 2017, 34.24% in 2018,
and 40.52% in 2019 (Figure 20). Statistics based data journalism articles were
observed majorly in football, basketball and tennis to show players’ career
evolution in detail (Image 48). Statistics based player articles mostly were about
the players of FC Barcelona, Real Madrid and Atletico Madrid and tennis players’
career statistics such as Rafael Nadal and Novak Djokovic.
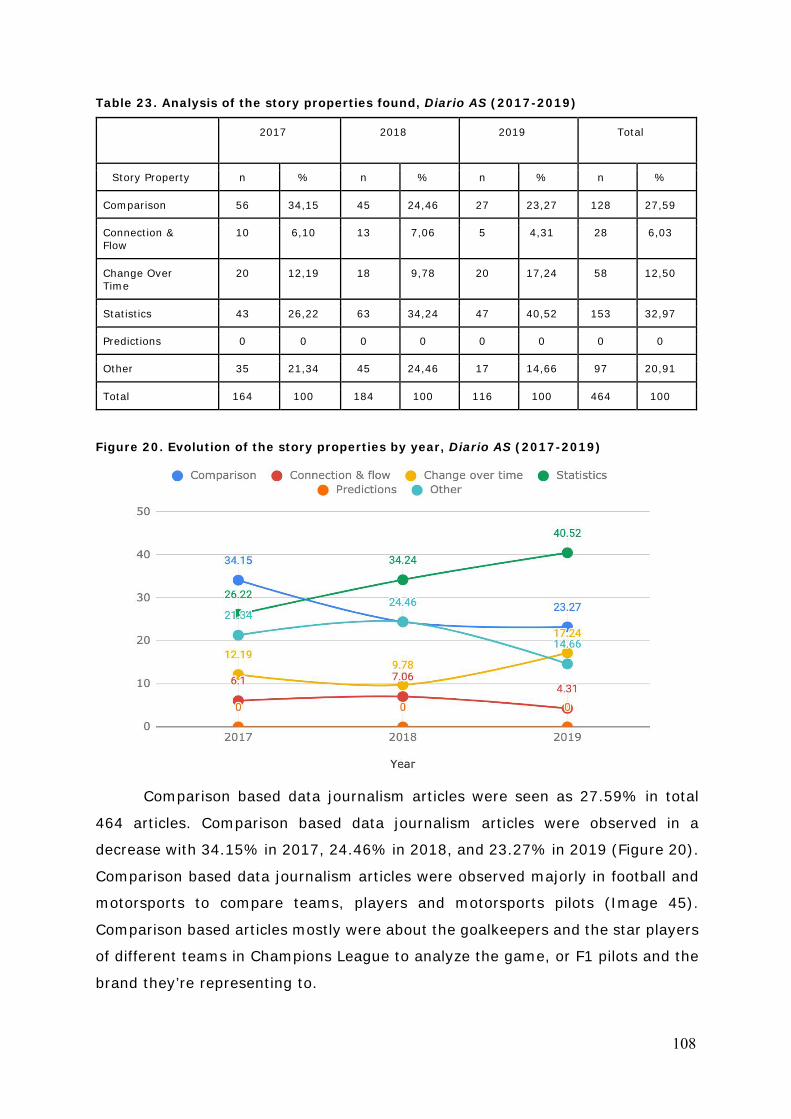
108
Table 23. Analysis of the story properties found, Diario AS (2017-2019)
2017 2018 2019 Total
Story Property n % n % n % n %
Comparison 56 34,15 45 24,46 27 23,27 128 27,59
Connection & Flow
10 6,10 13 7,06 5 4,31 28 6,03
Change Over Time
20 12,19 18 9,78 20 17,24 58 12,50
Statistics 43 26,22 63 34,24 47 40,52 153 32,97
Predictions 0 0 0 0 0 0 0 0
Other 35 21,34 45 24,46 17 14,66 97 20,91
Total 164 100 184 100 116 100 464 100
Figure 20. Evolution of the story properties by year, Diario AS (2017-2019)
Comparison based data journalism articles were seen as 27.59% in total
464 articles. Comparison based data journalism articles were observed in a
decrease with 34.15% in 2017, 24.46% in 2018, and 23.27% in 2019 (Figure 20).
Comparison based data journalism articles were observed majorly in football and
motorsports to compare teams, players and motorsports pilots (Image 45).
Comparison based articles mostly were about the goalkeepers and the star players
of different teams in Champions League to analyze the game, or F1 pilots and the
brand they’re representing to.
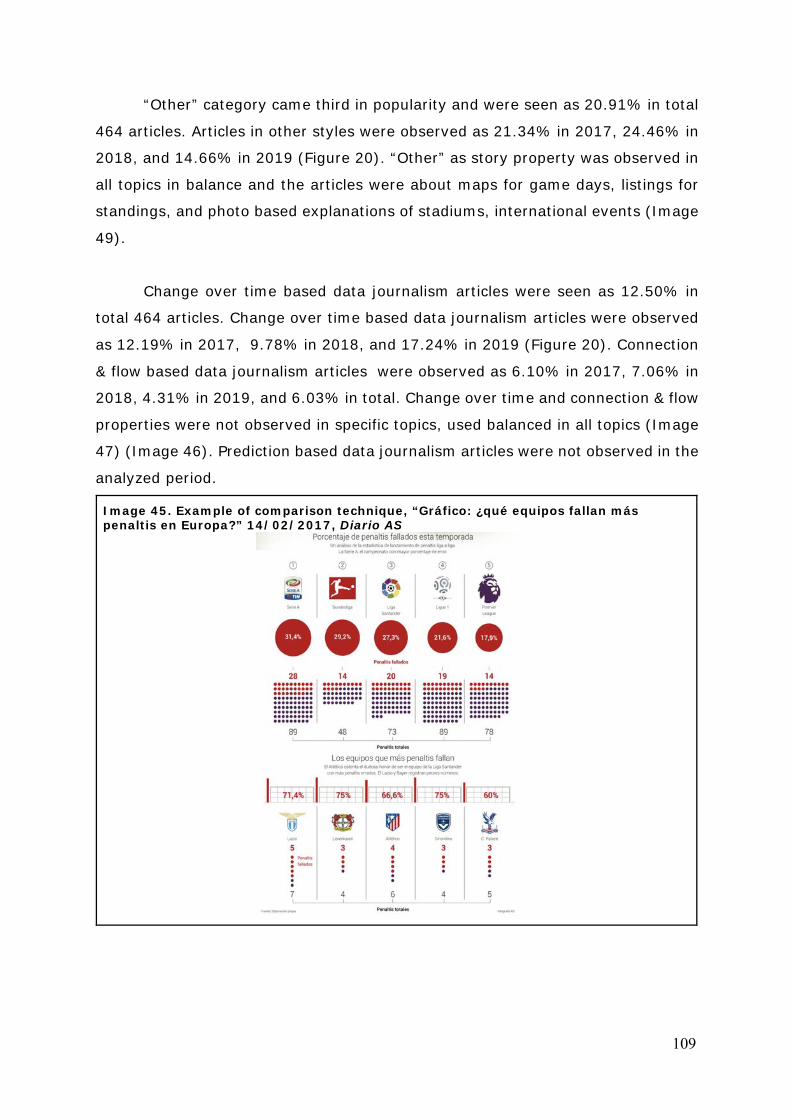
109
“Other” category came third in popularity and were seen as 20.91% in total
464 articles. Articles in other styles were observed as 21.34% in 2017, 24.46% in
2018, and 14.66% in 2019 (Figure 20). “Other” as story property was observed in
all topics in balance and the articles were about maps for game days, listings for
standings, and photo based explanations of stadiums, international events (Image
49).
Change over time based data journalism articles were seen as 12.50% in
total 464 articles. Change over time based data journalism articles were observed
as 12.19% in 2017, 9.78% in 2018, and 17.24% in 2019 (Figure 20). Connection
& flow based data journalism articles were observed as 6.10% in 2017, 7.06% in
2018, 4.31% in 2019, and 6.03% in total. Change over time and connection & flow
properties were not observed in specific topics, used balanced in all topics (Image
47) (Image 46). Prediction based data journalism articles were not observed in the
analyzed period.
Image 45. Example of comparison technique, “Gráfico: ¿qué equipos fallan más penaltis en Europa?” 14/02/2017, Diario AS
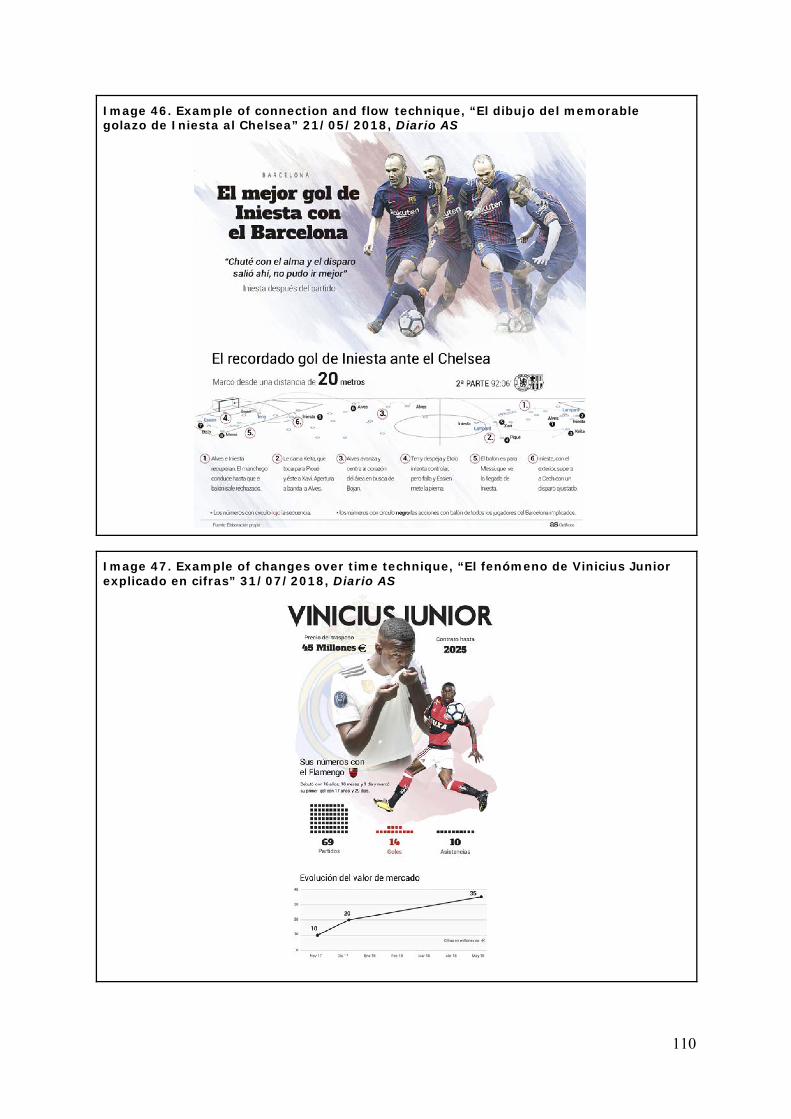
110
Image 46. Example of connection and flow technique, “El dibujo del memorable golazo de Iniesta al Chelsea” 21/05/2018, Diario AS
Image 47. Example of changes over time technique, “El fenómeno de Vinicius Junior explicado en cifras” 31/07/2018, Diario AS
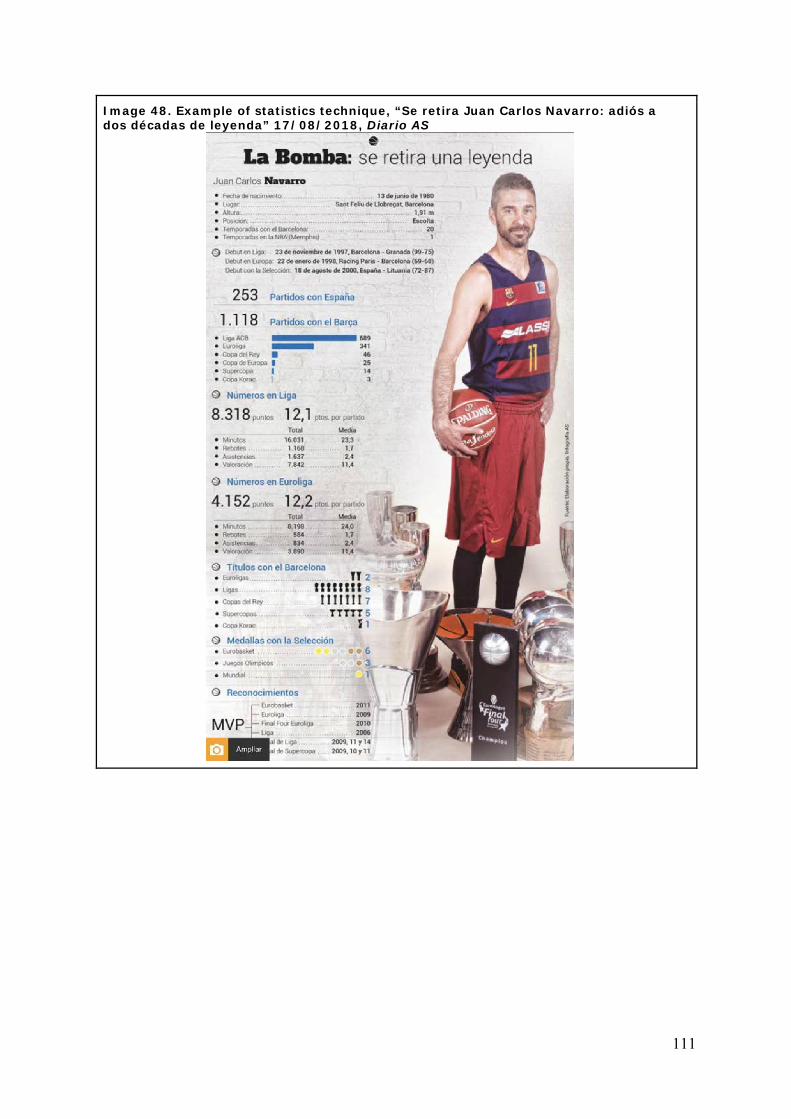
111
Image 48. Example of statistics technique, “Se retira Juan Carlos Navarro: adiós a dos décadas de leyenda” 17/08/2018, Diario AS
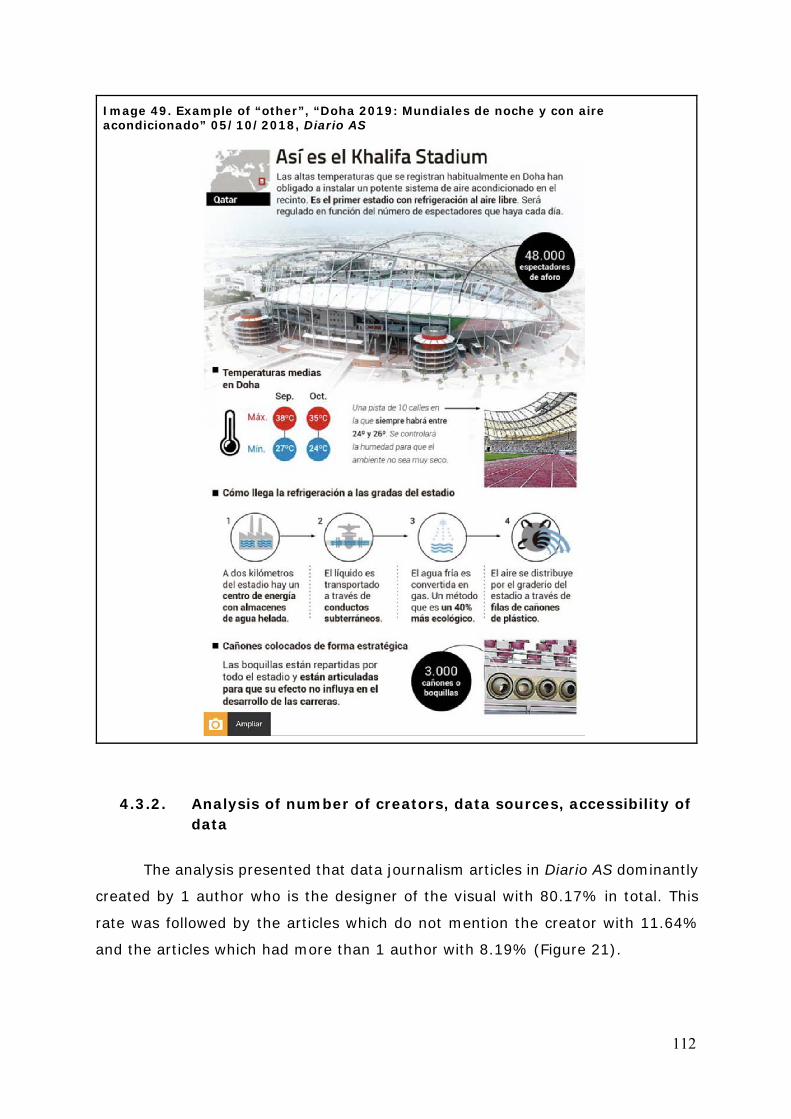
112
Image 49. Example of “other”, “Doha 2019: Mundiales de noche y con aire acondicionado” 05/10/2018, Diario AS
4.3.2. Analysis of number of creators, data sources, accessibility of data
The analysis presented that data journalism articles in Diario AS dominantly
created by 1 author who is the designer of the visual with 80.17% in total. This
rate was followed by the articles which do not mention the creator with 11.64%
and the articles which had more than 1 author with 8.19% (Figure 21).
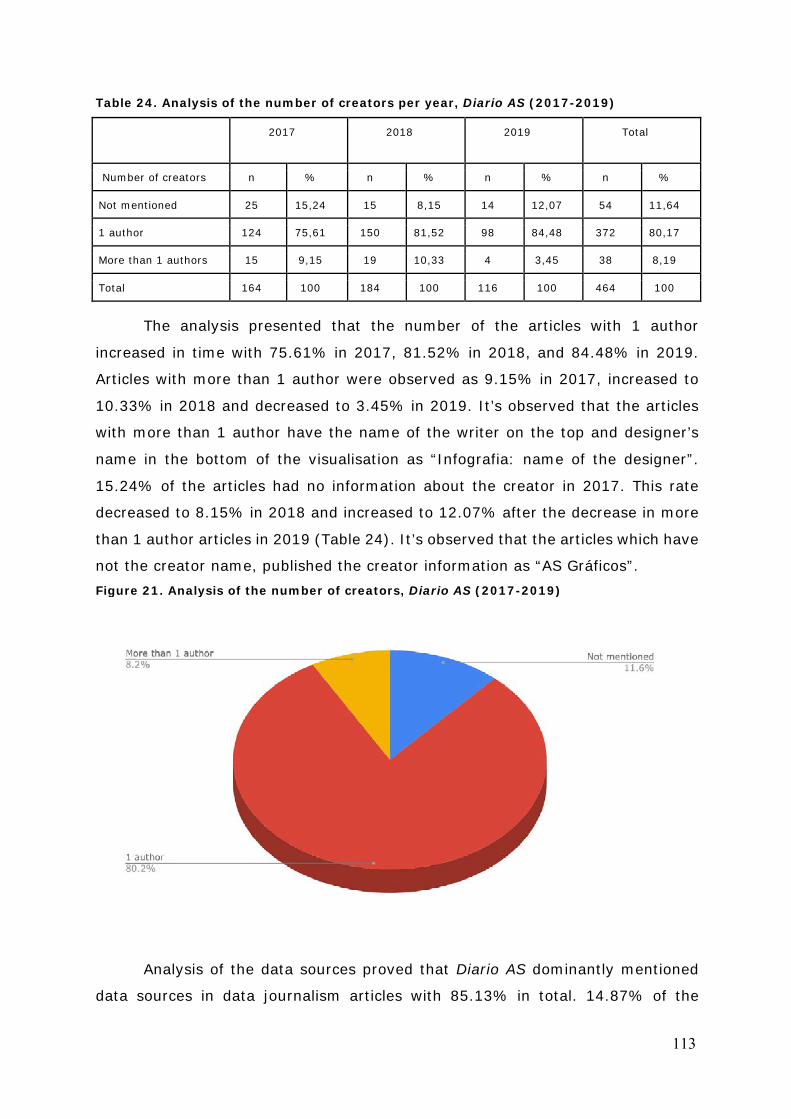
113
Table 24. Analysis of the number of creators per year, Diario AS (2017-2019)
2017 2018 2019 Total
Number of creators n % n % n % n %
Not mentioned 25 15,24 15 8,15 14 12,07 54 11,64
1 author 124 75,61 150 81,52 98 84,48 372 80,17
More than 1 authors 15 9,15 19 10,33 4 3,45 38 8,19
Total 164 100 184 100 116 100 464 100
The analysis presented that the number of the articles with 1 author
increased in time with 75.61% in 2017, 81.52% in 2018, and 84.48% in 2019.
Articles with more than 1 author were observed as 9.15% in 2017, increased to
10.33% in 2018 and decreased to 3.45% in 2019. It’s observed that the articles
with more than 1 author have the name of the writer on the top and designer’s
name in the bottom of the visualisation as “Infografia: name of the designer”.
15.24% of the articles had no information about the creator in 2017. This rate
decreased to 8.15% in 2018 and increased to 12.07% after the decrease in more
than 1 author articles in 2019 (Table 24). It’s observed that the articles which have
not the creator name, published the creator information as “AS Gráficos”. Figure 21. Analysis of the number of creators, Diario AS (2017-2019)
Analysis of the data sources proved that Diario AS dominantly mentioned
data sources in data journalism articles with 85.13% in total. 14.87% of the
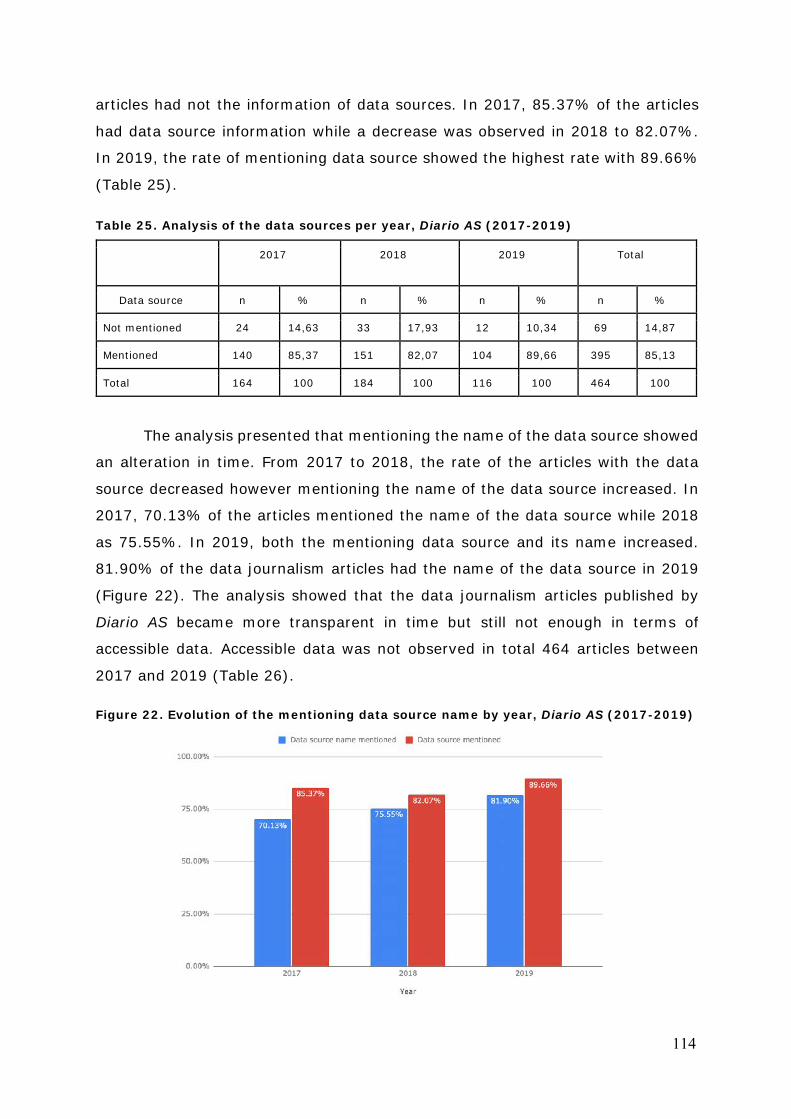
114
articles had not the information of data sources. In 2017, 85.37% of the articles
had data source information while a decrease was observed in 2018 to 82.07%.
In 2019, the rate of mentioning data source showed the highest rate with 89.66%
(Table 25).
Table 25. Analysis of the data sources per year, Diario AS (2017-2019)
2017 2018 2019 Total
Data source n % n % n % n %
Not mentioned 24 14,63 33 17,93 12 10,34 69 14,87
Mentioned 140 85,37 151 82,07 104 89,66 395 85,13
Total 164 100 184 100 116 100 464 100
The analysis presented that mentioning the name of the data source showed
an alteration in time. From 2017 to 2018, the rate of the articles with the data
source decreased however mentioning the name of the data source increased. In
2017, 70.13% of the articles mentioned the name of the data source while 2018
as 75.55%. In 2019, both the mentioning data source and its name increased.
81.90% of the data journalism articles had the name of the data source in 2019
(Figure 22). The analysis showed that the data journalism articles published by
Diario AS became more transparent in time but still not enough in terms of
accessible data. Accessible data was not observed in total 464 articles between
2017 and 2019 (Table 26). Figure 22. Evolution of the mentioning data source name by year, Diario AS (2017-2019)
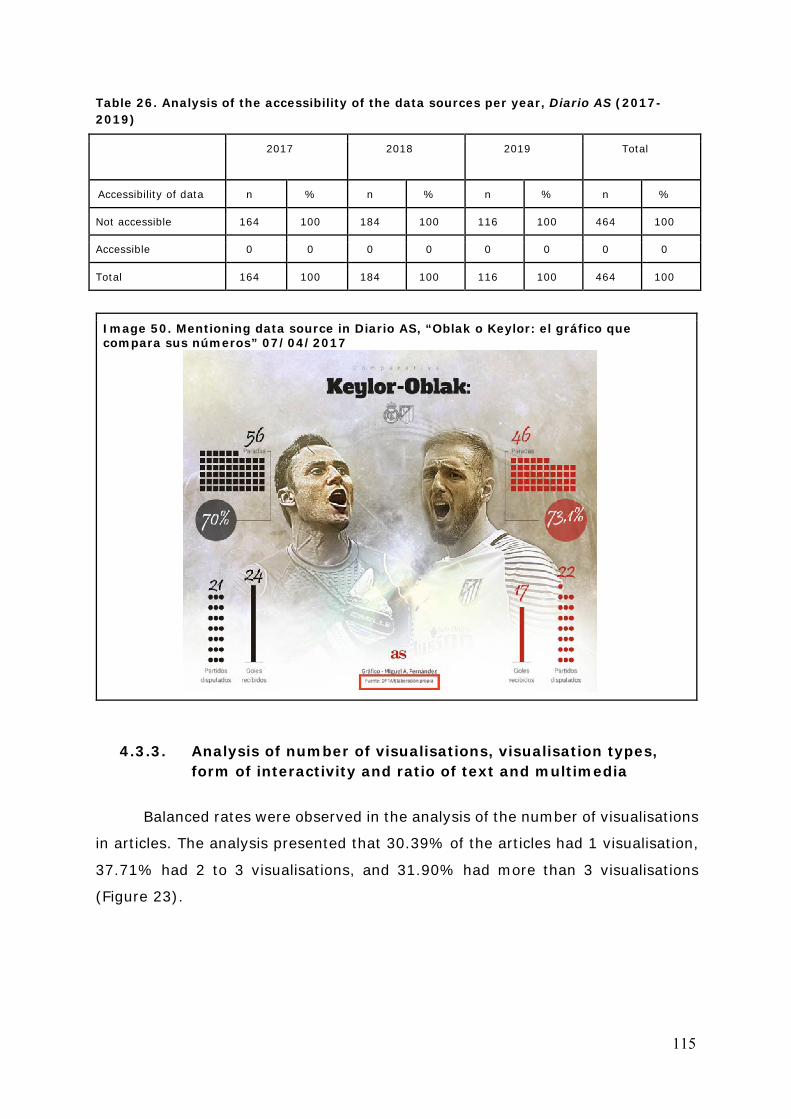
115
Table 26. Analysis of the accessibility of the data sources per year, Diario AS (2017-2019)
2017 2018 2019 Total
Accessibility of data n % n % n % n %
Not accessible 164 100 184 100 116 100 464 100
Accessible 0 0 0 0 0 0 0 0
Total 164 100 184 100 116 100 464 100
Image 50. Mentioning data source in Diario AS, “Oblak o Keylor: el gráfico que compara sus números” 07/04/2017
4.3.3. Analysis of number of visualisations, visualisation types, form of interactivity and ratio of text and multimedia
Balanced rates were observed in the analysis of the number of visualisations
in articles. The analysis presented that 30.39% of the articles had 1 visualisation,
37.71% had 2 to 3 visualisations, and 31.90% had more than 3 visualisations
(Figure 23).
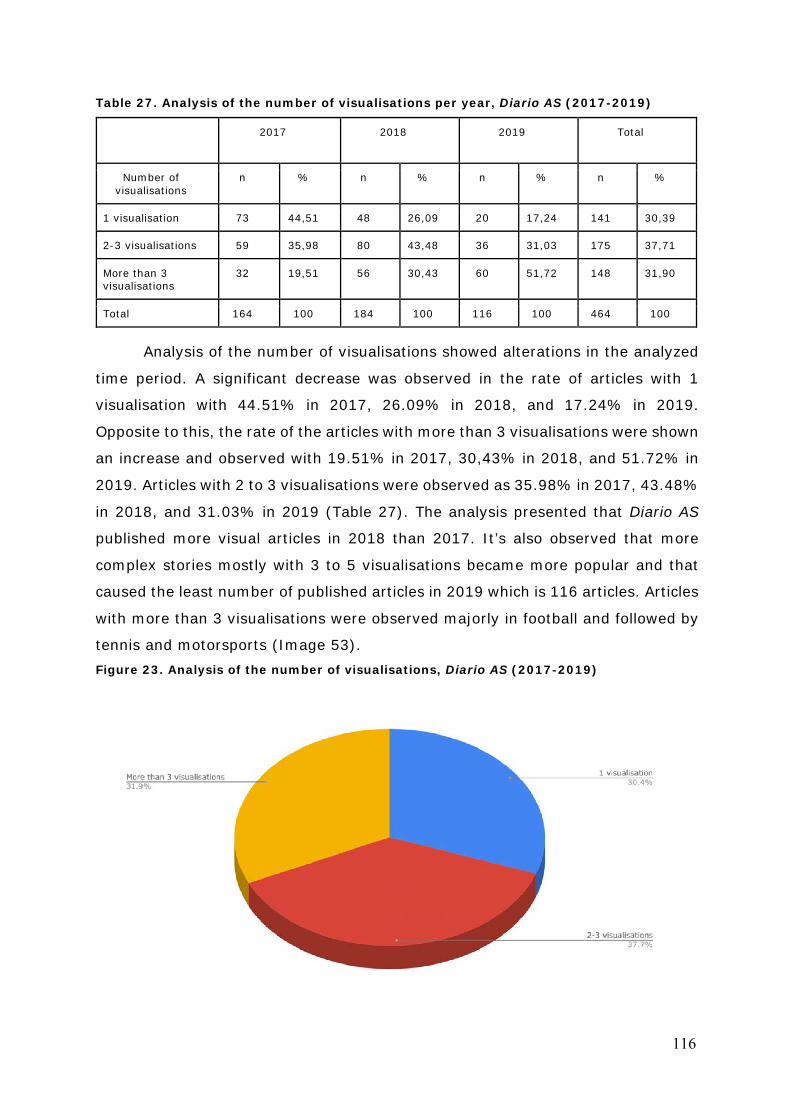
116
Table 27. Analysis of the number of visualisations per year, Diario AS (2017-2019)
2017 2018 2019 Total
Number of visualisations
n % n % n % n %
1 visualisation 73 44,51 48 26,09 20 17,24 141 30,39
2-3 visualisations 59 35,98 80 43,48 36 31,03 175 37,71
More than 3 visualisations
32 19,51 56 30,43 60 51,72 148 31,90
Total 164 100 184 100 116 100 464 100
Analysis of the number of visualisations showed alterations in the analyzed
time period. A significant decrease was observed in the rate of articles with 1
visualisation with 44.51% in 2017, 26.09% in 2018, and 17.24% in 2019.
Opposite to this, the rate of the articles with more than 3 visualisations were shown
an increase and observed with 19.51% in 2017, 30,43% in 2018, and 51.72% in
2019. Articles with 2 to 3 visualisations were observed as 35.98% in 2017, 43.48%
in 2018, and 31.03% in 2019 (Table 27). The analysis presented that Diario AS
published more visual articles in 2018 than 2017. It’s also observed that more
complex stories mostly with 3 to 5 visualisations became more popular and that
caused the least number of published articles in 2019 which is 116 articles. Articles
with more than 3 visualisations were observed majorly in football and followed by
tennis and motorsports (Image 53). Figure 23. Analysis of the number of visualisations, Diario AS (2017-2019)
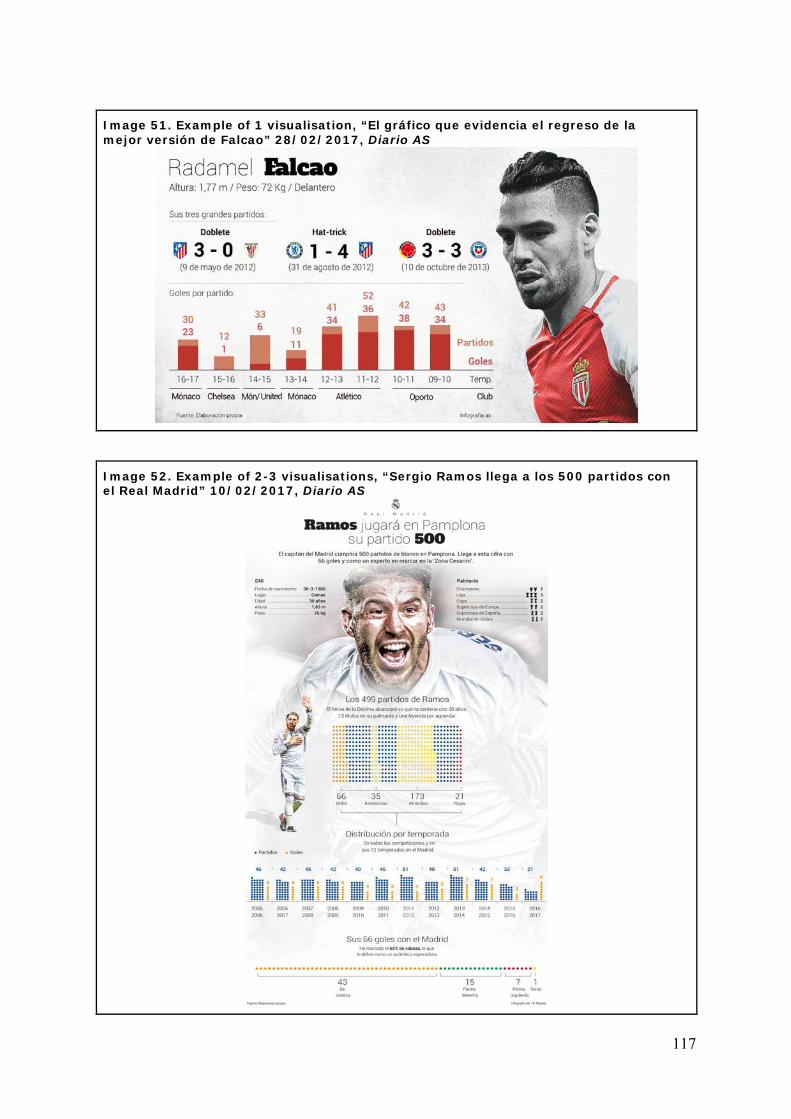
117
Image 51. Example of 1 visualisation, “El gráfico que evidencia el regreso de la mejor versión de Falcao” 28/02/2017, Diario AS
Image 52. Example of 2-3 visualisations, “Sergio Ramos llega a los 500 partidos con el Real Madrid” 10/02/2017, Diario AS
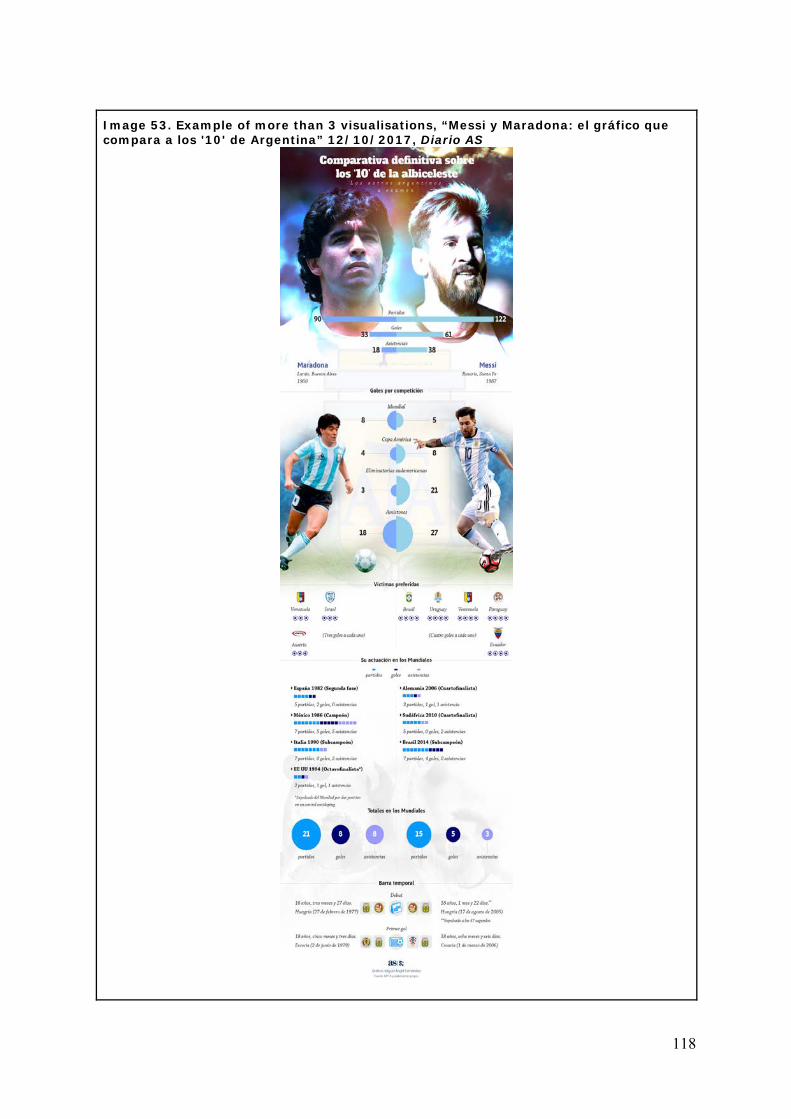
118
Image 53. Example of more than 3 visualisations, “Messi y Maradona: el gráfico que compara a los '10' de Argentina” 12/10/2017, Diario AS
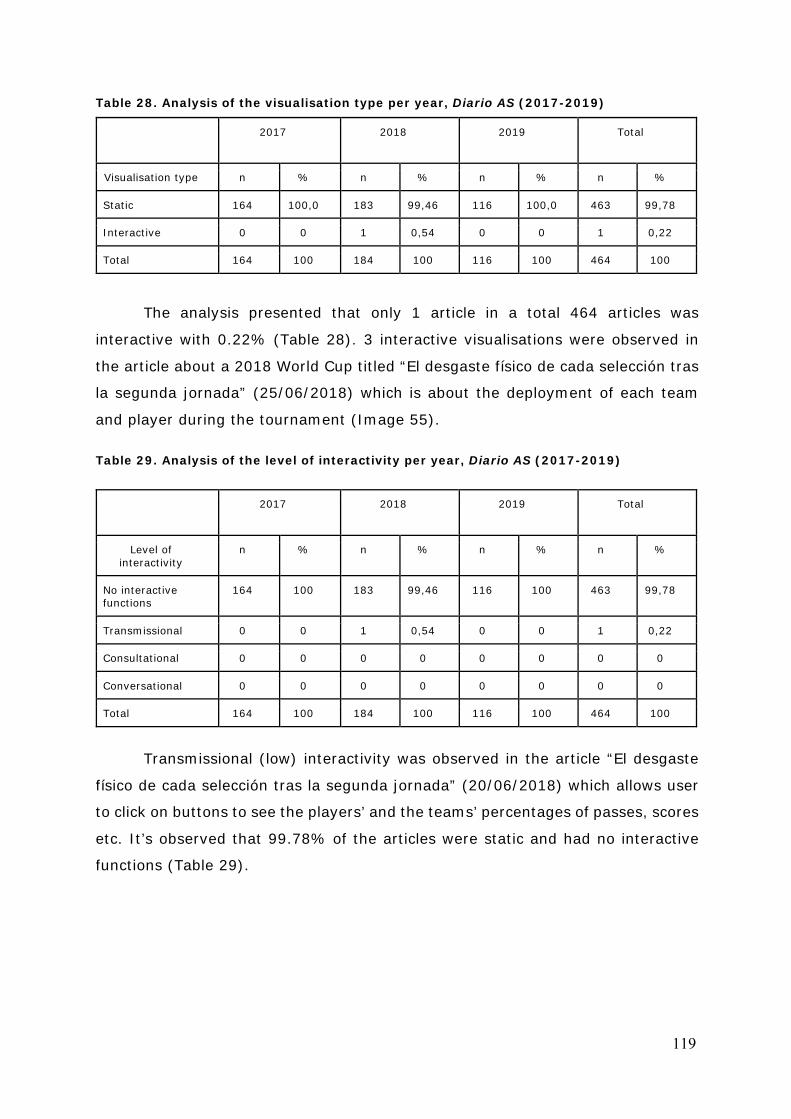
119
Table 28. Analysis of the visualisation type per year, Diario AS (2017-2019)
2017 2018 2019 Total
Visualisation type n % n % n % n %
Static 164 100,0 183 99,46 116 100,0 463 99,78
Interactive 0 0 1 0,54 0 0 1 0,22
Total 164 100 184 100 116 100 464 100
The analysis presented that only 1 article in a total 464 articles was
interactive with 0.22% (Table 28). 3 interactive visualisations were observed in
the article about a 2018 World Cup titled “El desgaste físico de cada selección tras
la segunda jornada” (25/06/2018) which is about the deployment of each team
and player during the tournament (Image 55).
Table 29. Analysis of the level of interactivity per year, Diario AS (2017-2019)
2017 2018 2019 Total
Level of interactivity
n % n % n % n %
No interactive functions
164 100 183 99,46 116 100 463 99,78
Transmissional 0 0 1 0,54 0 0 1 0,22
Consultational 0 0 0 0 0 0 0 0
Conversational 0 0 0 0 0 0 0 0
Total 164 100 184 100 116 100 464 100
Transmissional (low) interactivity was observed in the article “El desgaste
físico de cada selección tras la segunda jornada” (20/06/2018) which allows user
to click on buttons to see the players’ and the teams’ percentages of passes, scores
etc. It’s observed that 99.78% of the articles were static and had no interactive
functions (Table 29).
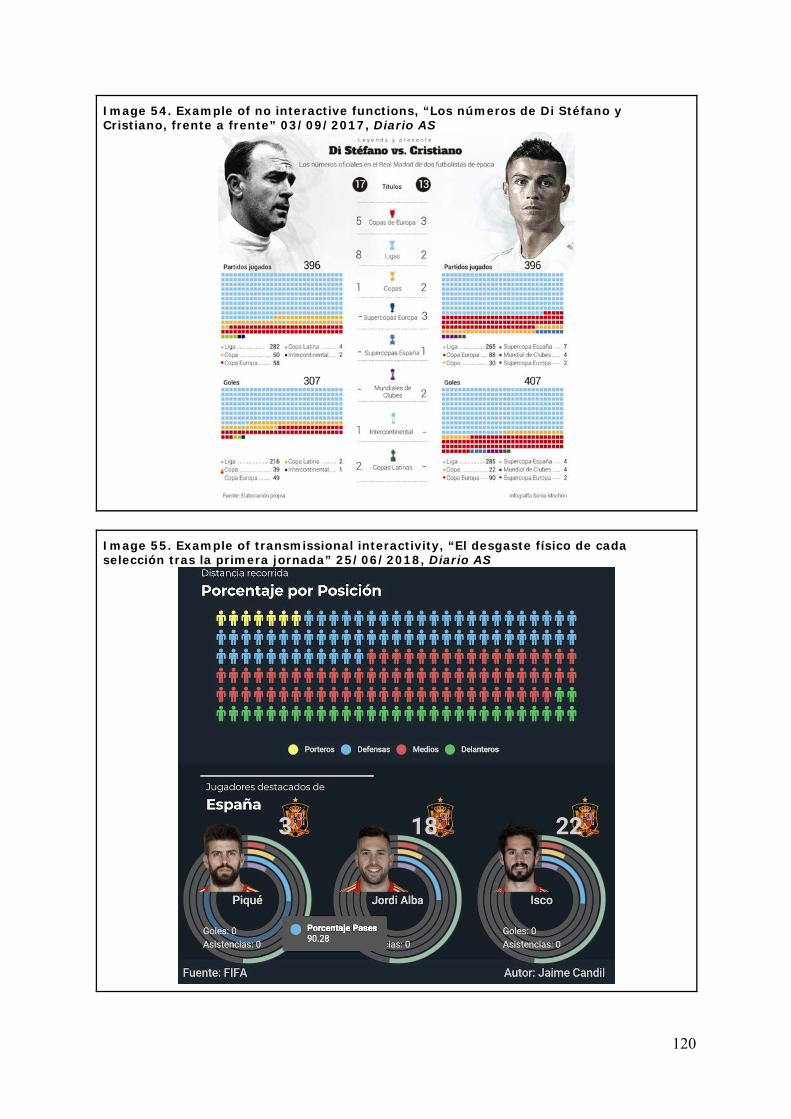
120
Image 54. Example of no interactive functions, “Los números de Di Stéfano y Cristiano, frente a frente” 03/09/2017, Diario AS
Image 55. Example of transmissional interactivity, “El desgaste físico de cada selección tras la primera jornada” 25/06/2018, Diario AS
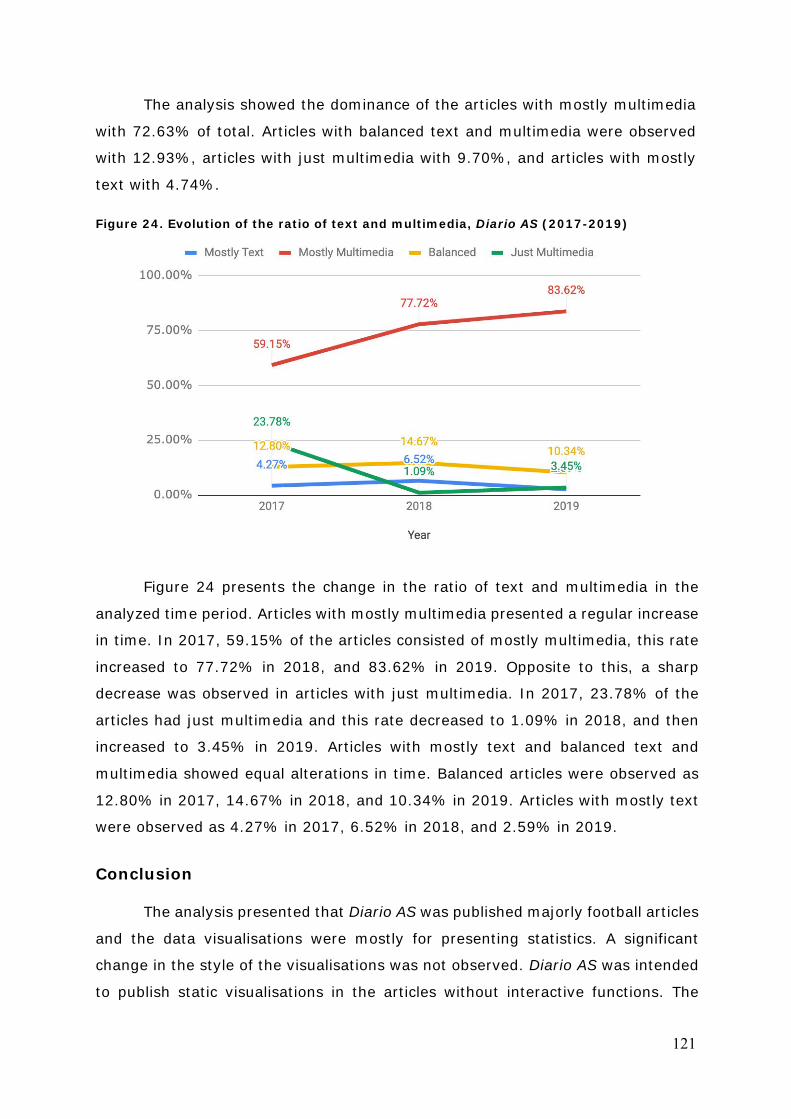
121
The analysis showed the dominance of the articles with mostly multimedia
with 72.63% of total. Articles with balanced text and multimedia were observed
with 12.93%, articles with just multimedia with 9.70%, and articles with mostly
text with 4.74%. Figure 24. Evolution of the ratio of text and multimedia, Diario AS (2017-2019)
Figure 24 presents the change in the ratio of text and multimedia in the
analyzed time period. Articles with mostly multimedia presented a regular increase
in time. In 2017, 59.15% of the articles consisted of mostly multimedia, this rate
increased to 77.72% in 2018, and 83.62% in 2019. Opposite to this, a sharp
decrease was observed in articles with just multimedia. In 2017, 23.78% of the
articles had just multimedia and this rate decreased to 1.09% in 2018, and then
increased to 3.45% in 2019. Articles with mostly text and balanced text and
multimedia showed equal alterations in time. Balanced articles were observed as
12.80% in 2017, 14.67% in 2018, and 10.34% in 2019. Articles with mostly text
were observed as 4.27% in 2017, 6.52% in 2018, and 2.59% in 2019.
Conclusion
The analysis presented that Diario AS was published majorly football articles
and the data visualisations were mostly for presenting statistics. A significant
change in the style of the visualisations was not observed. Diario AS was intended
to publish static visualisations in the articles without interactive functions. The

122
reason for the decreased number of the articles in 2019 was seen as the increased
number of visualisations in each article but still created by 1 person.
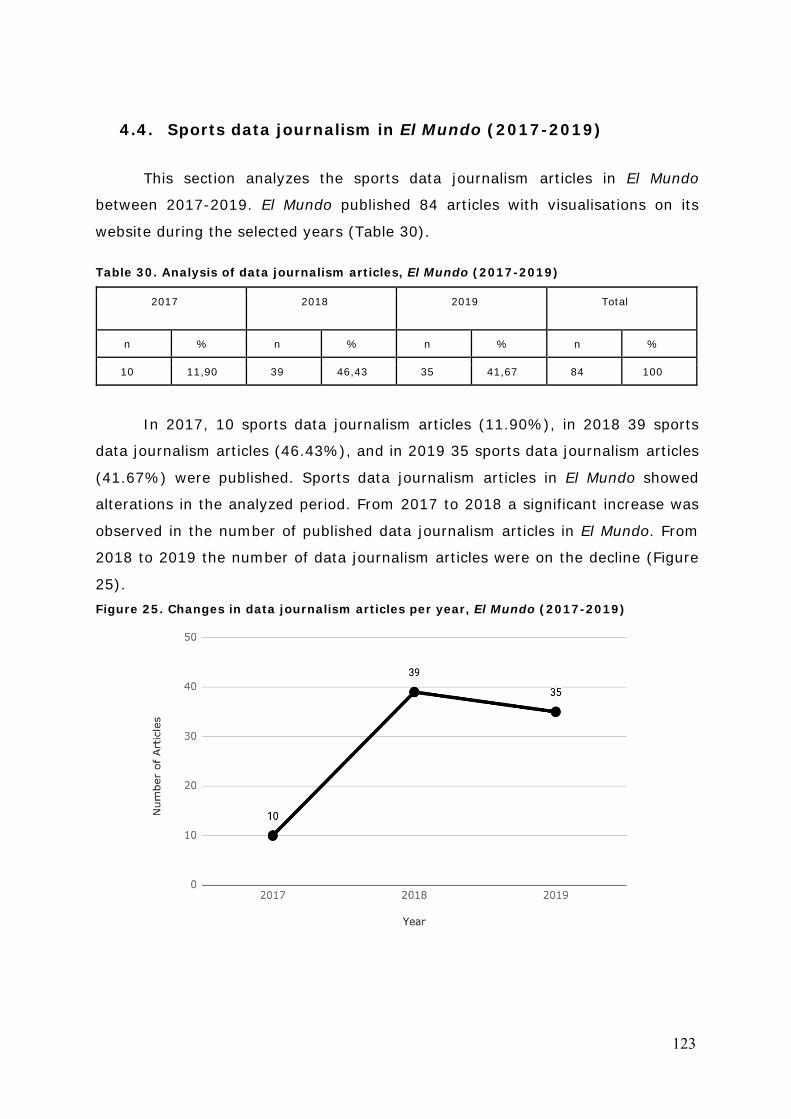
123
4.4. Sports data journalism in El Mundo (2017-2019)
This section analyzes the sports data journalism articles in El Mundo
between 2017-2019. El Mundo published 84 articles with visualisations on its
website during the selected years (Table 30).
Table 30. Analysis of data journalism articles, El Mundo (2017-2019)
2017 2018 2019 Total
n % n % n % n %
10 11,90 39 46,43 35 41,67 84 100
In 2017, 10 sports data journalism articles (11.90%), in 2018 39 sports
data journalism articles (46.43%), and in 2019 35 sports data journalism articles
(41.67%) were published. Sports data journalism articles in El Mundo showed
alterations in the analyzed period. From 2017 to 2018 a significant increase was
observed in the number of published data journalism articles in El Mundo. From
2018 to 2019 the number of data journalism articles were on the decline (Figure
25). Figure 25. Changes in data journalism articles per year, El Mundo (2017-2019)
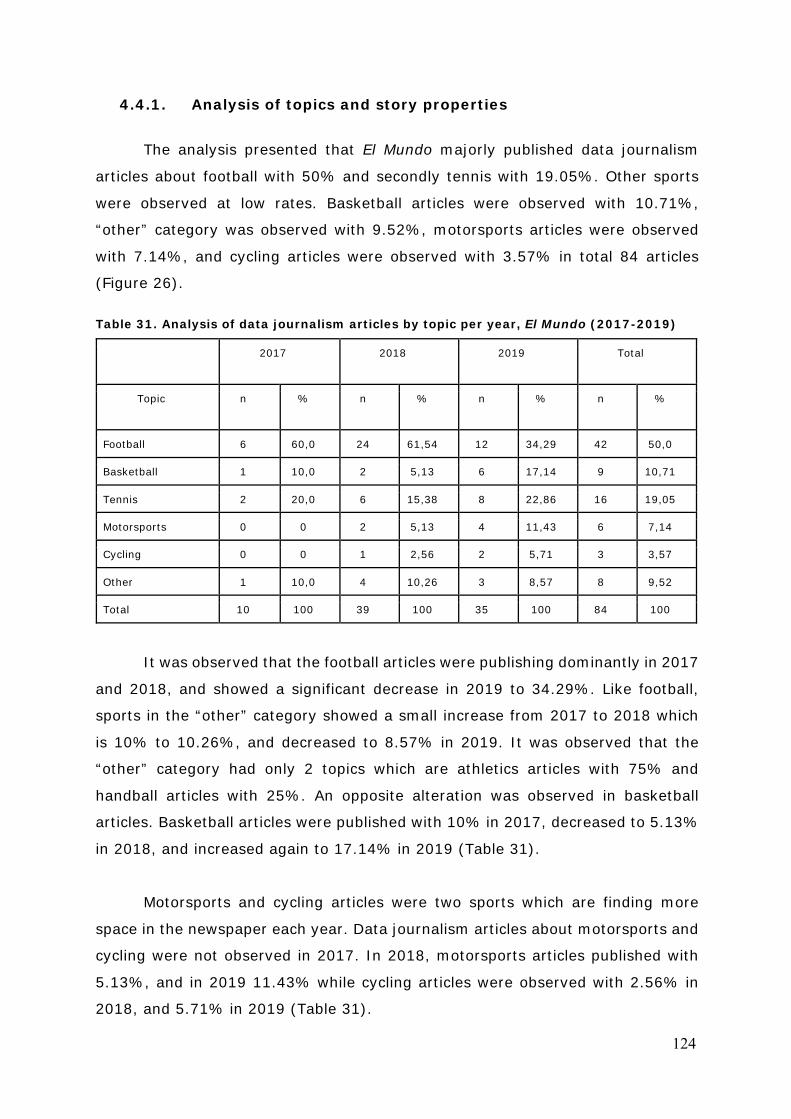
124
4.4.1. Analysis of topics and story properties
The analysis presented that El Mundo majorly published data journalism
articles about football with 50% and secondly tennis with 19.05%. Other sports
were observed at low rates. Basketball articles were observed with 10.71%,
“other” category was observed with 9.52%, motorsports articles were observed
with 7.14%, and cycling articles were observed with 3.57% in total 84 articles
(Figure 26).
Table 31. Analysis of data journalism articles by topic per year, El Mundo (2017-2019)
2017 2018 2019 Total
Topic n % n % n % n %
Football 6 60,0 24 61,54 12 34,29 42 50,0
Basketball 1 10,0 2 5,13 6 17,14 9 10,71
Tennis 2 20,0 6 15,38 8 22,86 16 19,05
Motorsports 0 0 2 5,13 4 11,43 6 7,14
Cycling 0 0 1 2,56 2 5,71 3 3,57
Other 1 10,0 4 10,26 3 8,57 8 9,52
Total 10 100 39 100 35 100 84 100
It was observed that the football articles were publishing dominantly in 2017
and 2018, and showed a significant decrease in 2019 to 34.29%. Like football,
sports in the “other” category showed a small increase from 2017 to 2018 which
is 10% to 10.26%, and decreased to 8.57% in 2019. It was observed that the
“other” category had only 2 topics which are athletics articles with 75% and
handball articles with 25%. An opposite alteration was observed in basketball
articles. Basketball articles were published with 10% in 2017, decreased to 5.13%
in 2018, and increased again to 17.14% in 2019 (Table 31).
Motorsports and cycling articles were two sports which are finding more
space in the newspaper each year. Data journalism articles about motorsports and
cycling were not observed in 2017. In 2018, motorsports articles published with
5.13%, and in 2019 11.43% while cycling articles were observed with 2.56% in
2018, and 5.71% in 2019 (Table 31).
125
Figure 26. Data journalism articles by topic, El Mundo (2017-2019)
Table 32 corresponds to the story property of 84 sports data journalism
articles in El Mundo in the analyzed time period. Story properties in the “other”
category were observed most in the analysis with 32.14% of total (Image 60). The
rate of the “other” category increased in time with 20% in 2017, 28.21% in 2018,
and 40% in 2019 (Figure 27). The observation made as the “other” category
majorly consisted of listing and photo based explanations of fixtures of leagues,
drawings of injuries and key positions of the games and maps about tournaments.
Table 32. Analysis of the story properties found, El Mundo (2017-2019)
2017 2018 2019 Total
Story Property n % n % n % n %
Comparison 2 20,0 12 30,77 12 34,29 26 30,95
Connection & Flow
1 10,0 3 7,69 2 5,71 6 7,14
Change Over Time
1 10,0 10 25,64 3 8,57 14 16,67
Statistics 4 40,0 3 7,69 4 11,43 11 13,10
Predictions 0 0 0 0 0 0 0 0
Other 2 20,0 11 28,21 14 40,0 27 32,14
Total 10 100 39 100 35 100 84 100
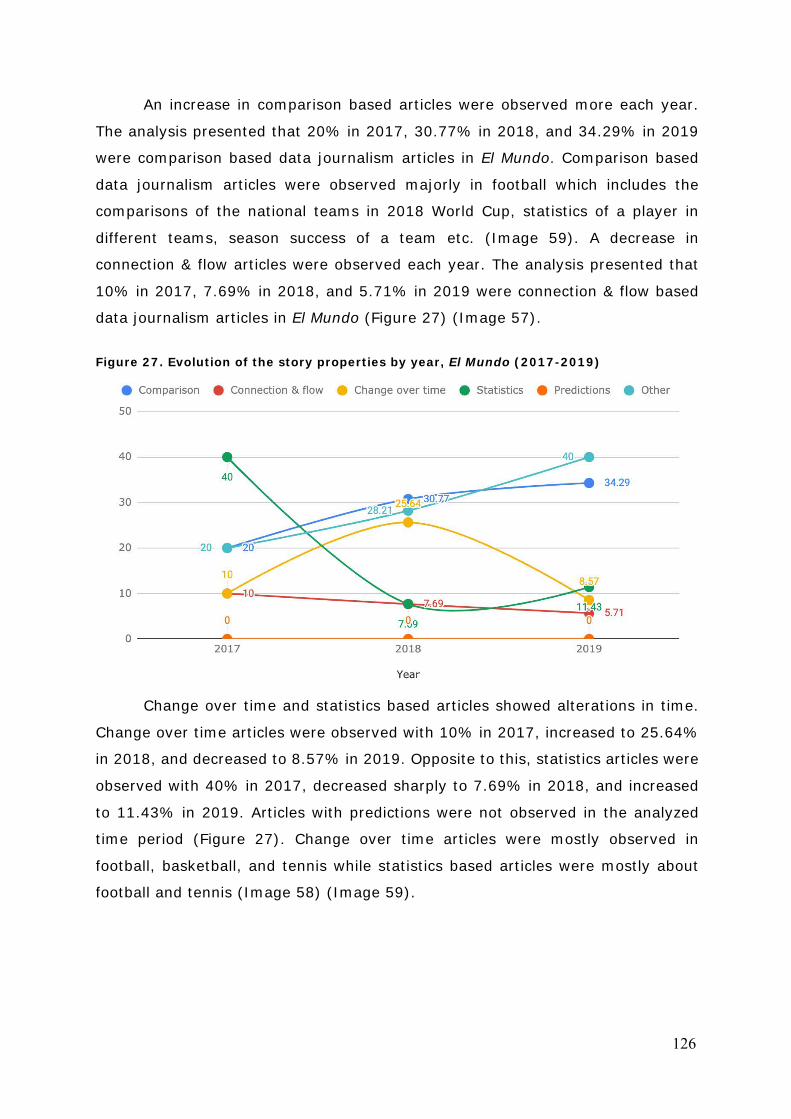
126
An increase in comparison based articles were observed more each year.
The analysis presented that 20% in 2017, 30.77% in 2018, and 34.29% in 2019
were comparison based data journalism articles in El Mundo. Comparison based
data journalism articles were observed majorly in football which includes the
comparisons of the national teams in 2018 World Cup, statistics of a player in
different teams, season success of a team etc. (Image 59). A decrease in
connection & flow articles were observed each year. The analysis presented that
10% in 2017, 7.69% in 2018, and 5.71% in 2019 were connection & flow based
data journalism articles in El Mundo (Figure 27) (Image 57).
Figure 27. Evolution of the story properties by year, El Mundo (2017-2019)
Change over time and statistics based articles showed alterations in time.
Change over time articles were observed with 10% in 2017, increased to 25.64%
in 2018, and decreased to 8.57% in 2019. Opposite to this, statistics articles were
observed with 40% in 2017, decreased sharply to 7.69% in 2018, and increased
to 11.43% in 2019. Articles with predictions were not observed in the analyzed
time period (Figure 27). Change over time articles were mostly observed in
football, basketball, and tennis while statistics based articles were mostly about
football and tennis (Image 58) (Image 59).
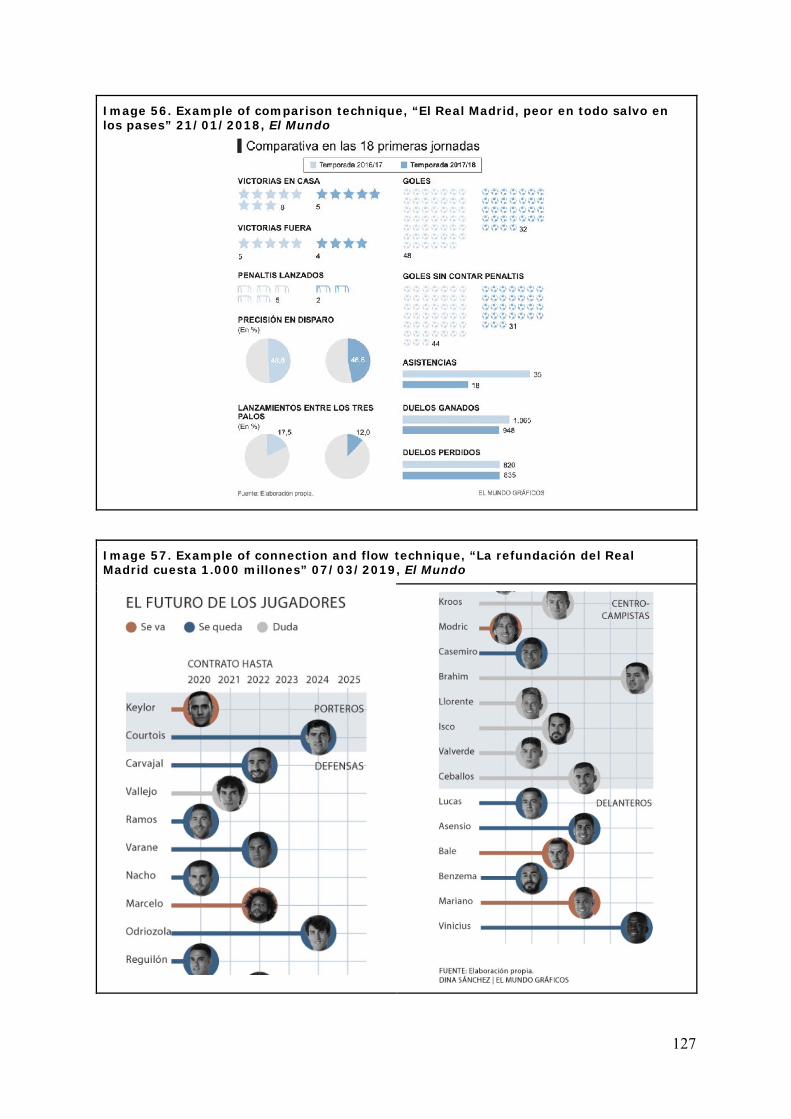
127
Image 56. Example of comparison technique, “El Real Madrid, peor en todo salvo en los pases” 21/01/2018, El Mundo
Image 57. Example of connection and flow technique, “La refundación del Real Madrid cuesta 1.000 millones” 07/03/2019, El Mundo
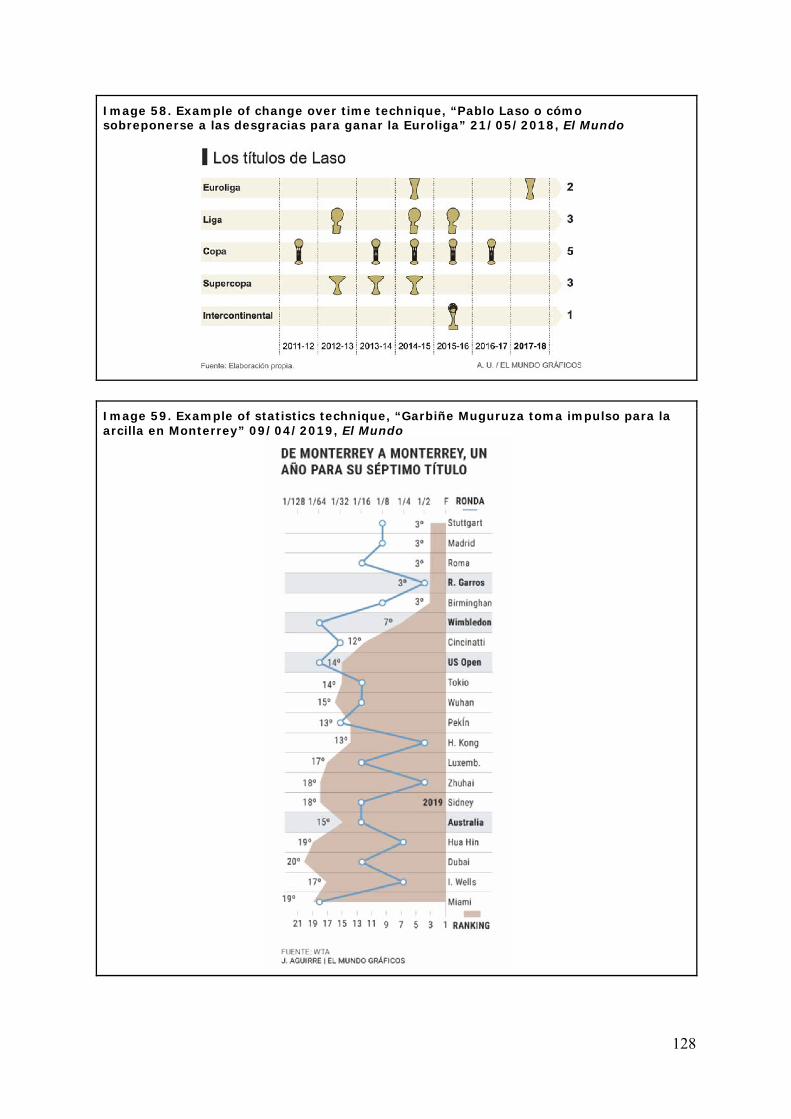
128
Image 58. Example of change over time technique, “Pablo Laso o cómo sobreponerse a las desgracias para ganar la Euroliga” 21/05/2018, El Mundo
Image 59. Example of statistics technique, “Garbiñe Muguruza toma impulso para la arcilla en Monterrey” 09/04/2019, El Mundo
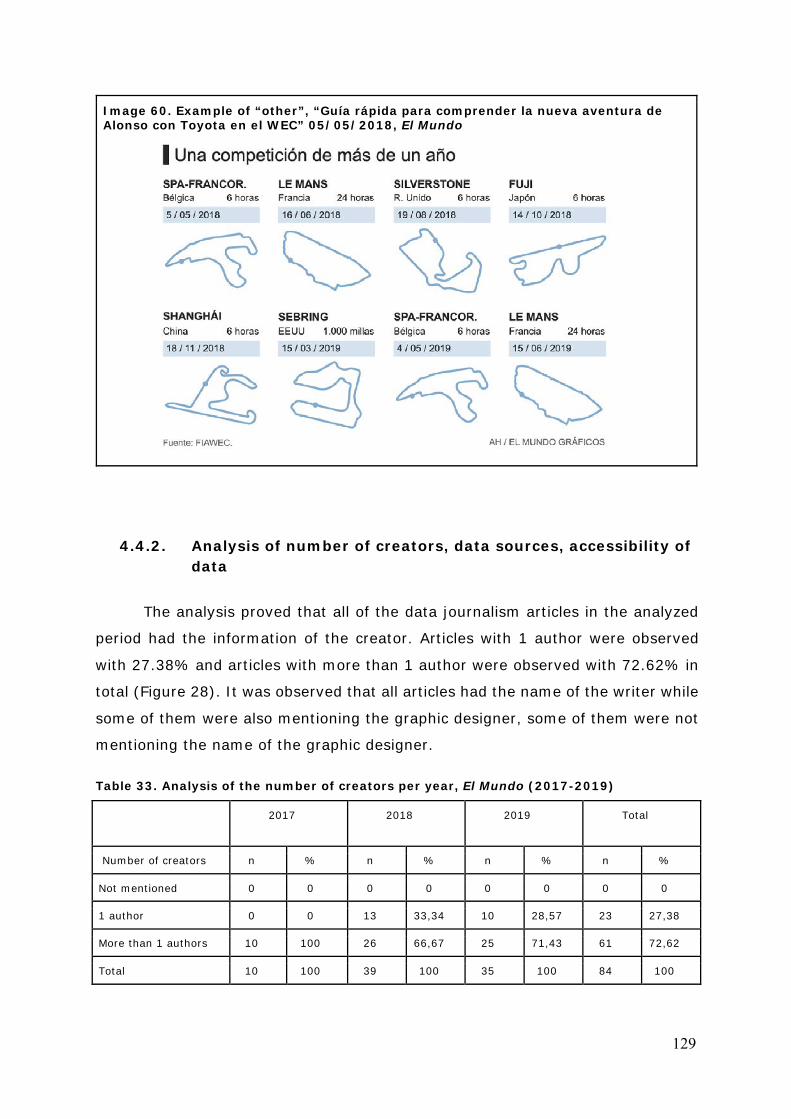
129
Image 60. Example of “other”, “Guía rápida para comprender la nueva aventura de Alonso con Toyota en el WEC” 05/05/2018, El Mundo
4.4.2. Analysis of number of creators, data sources, accessibility of data
The analysis proved that all of the data journalism articles in the analyzed
period had the information of the creator. Articles with 1 author were observed
with 27.38% and articles with more than 1 author were observed with 72.62% in
total (Figure 28). It was observed that all articles had the name of the writer while
some of them were also mentioning the graphic designer, some of them were not
mentioning the name of the graphic designer.
Table 33. Analysis of the number of creators per year, El Mundo (2017-2019)
2017 2018 2019 Total
Number of creators n % n % n % n %
Not mentioned 0 0 0 0 0 0 0 0
1 author 0 0 13 33,34 10 28,57 23 27,38
More than 1 authors 10 100 26 66,67 25 71,43 61 72,62
Total 10 100 39 100 35 100 84 100
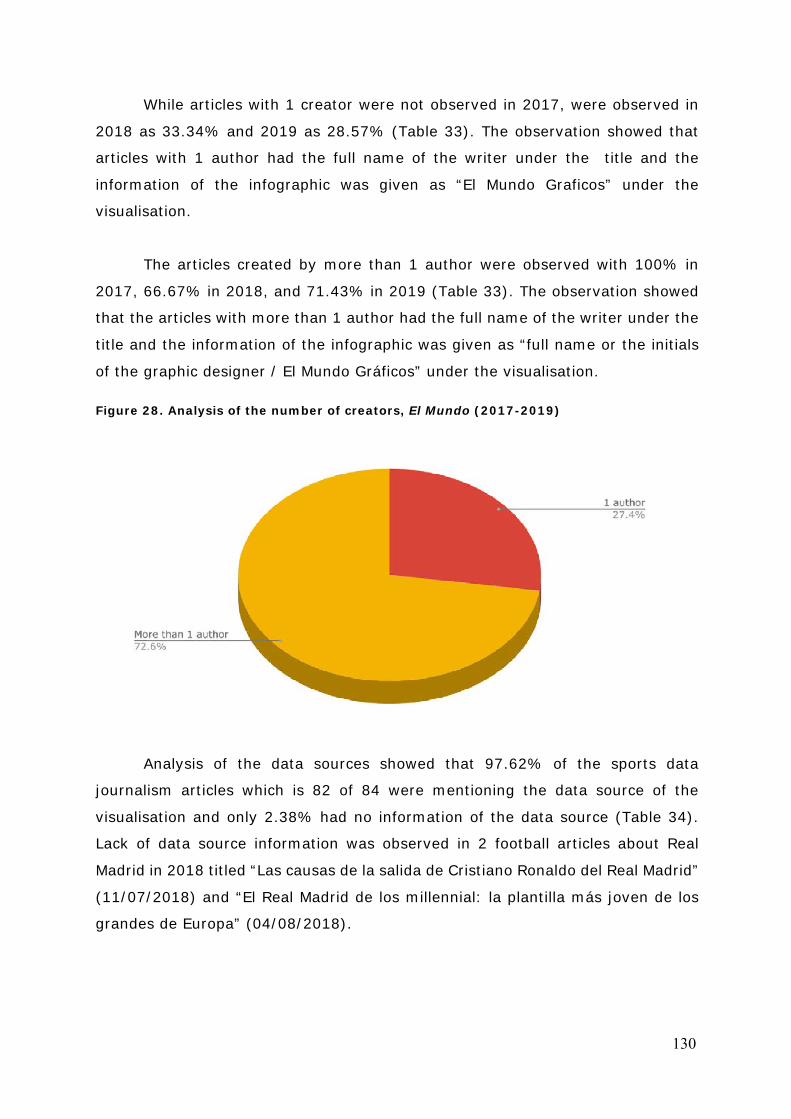
130
While articles with 1 creator were not observed in 2017, were observed in
2018 as 33.34% and 2019 as 28.57% (Table 33). The observation showed that
articles with 1 author had the full name of the writer under the title and the
information of the infographic was given as “El Mundo Graficos” under the
visualisation.
The articles created by more than 1 author were observed with 100% in
2017, 66.67% in 2018, and 71.43% in 2019 (Table 33). The observation showed
that the articles with more than 1 author had the full name of the writer under the
title and the information of the infographic was given as “full name or the initials
of the graphic designer / El Mundo Gráficos” under the visualisation. Figure 28. Analysis of the number of creators, El Mundo (2017-2019)
Analysis of the data sources showed that 97.62% of the sports data
journalism articles which is 82 of 84 were mentioning the data source of the
visualisation and only 2.38% had no information of the data source (Table 34).
Lack of data source information was observed in 2 football articles about Real
Madrid in 2018 titled “Las causas de la salida de Cristiano Ronaldo del Real Madrid”
(11/07/2018) and “El Real Madrid de los millennial: la plantilla más joven de los
grandes de Europa” (04/08/2018).
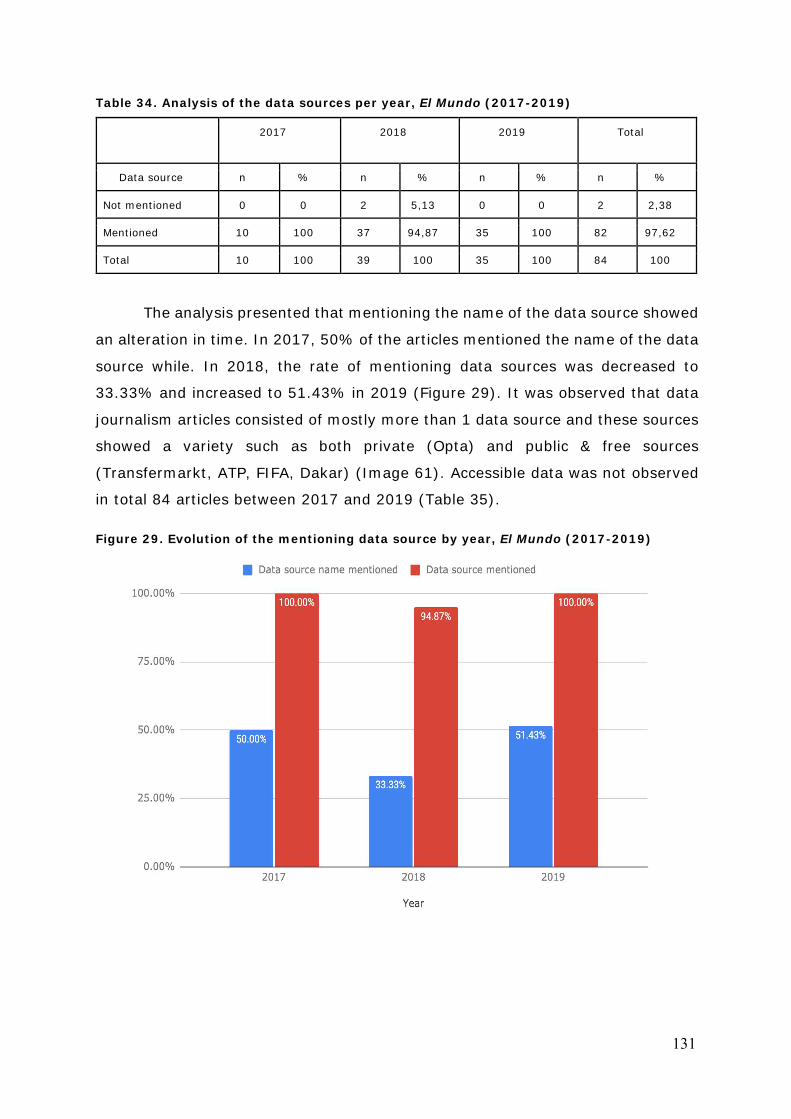
131
Table 34. Analysis of the data sources per year, El Mundo (2017-2019)
2017 2018 2019 Total
Data source n % n % n % n %
Not mentioned 0 0 2 5,13 0 0 2 2,38
Mentioned 10 100 37 94,87 35 100 82 97,62
Total 10 100 39 100 35 100 84 100
The analysis presented that mentioning the name of the data source showed
an alteration in time. In 2017, 50% of the articles mentioned the name of the data
source while. In 2018, the rate of mentioning data sources was decreased to
33.33% and increased to 51.43% in 2019 (Figure 29). It was observed that data
journalism articles consisted of mostly more than 1 data source and these sources
showed a variety such as both private (Opta) and public & free sources
(Transfermarkt, ATP, FIFA, Dakar) (Image 61). Accessible data was not observed
in total 84 articles between 2017 and 2019 (Table 35). Figure 29. Evolution of the mentioning data source by year, El Mundo (2017-2019)
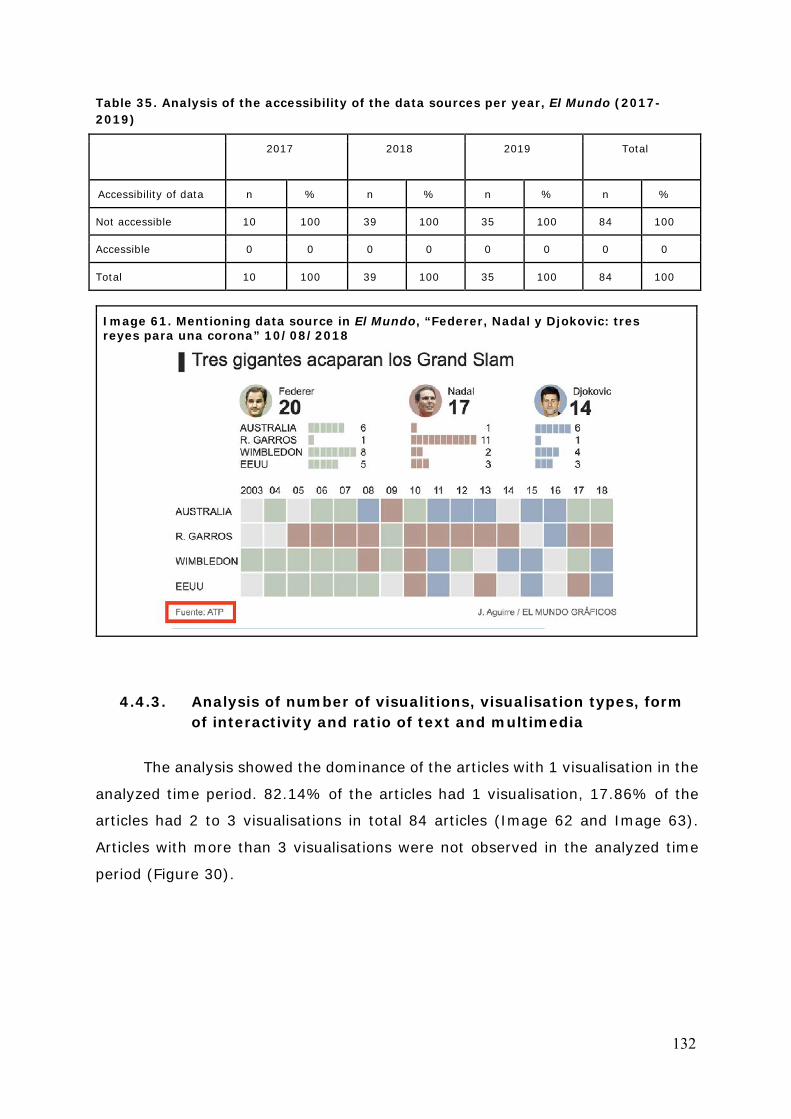
132
Table 35. Analysis of the accessibility of the data sources per year, El Mundo (2017-2019)
2017 2018 2019 Total
Accessibility of data n % n % n % n %
Not accessible 10 100 39 100 35 100 84 100
Accessible 0 0 0 0 0 0 0 0
Total 10 100 39 100 35 100 84 100
Image 61. Mentioning data source in El Mundo, “Federer, Nadal y Djokovic: tres reyes para una corona” 10/08/2018
4.4.3. Analysis of number of visualitions, visualisation types, form of interactivity and ratio of text and multimedia
The analysis showed the dominance of the articles with 1 visualisation in the
analyzed time period. 82.14% of the articles had 1 visualisation, 17.86% of the
articles had 2 to 3 visualisations in total 84 articles (Image 62 and Image 63).
Articles with more than 3 visualisations were not observed in the analyzed time
period (Figure 30).
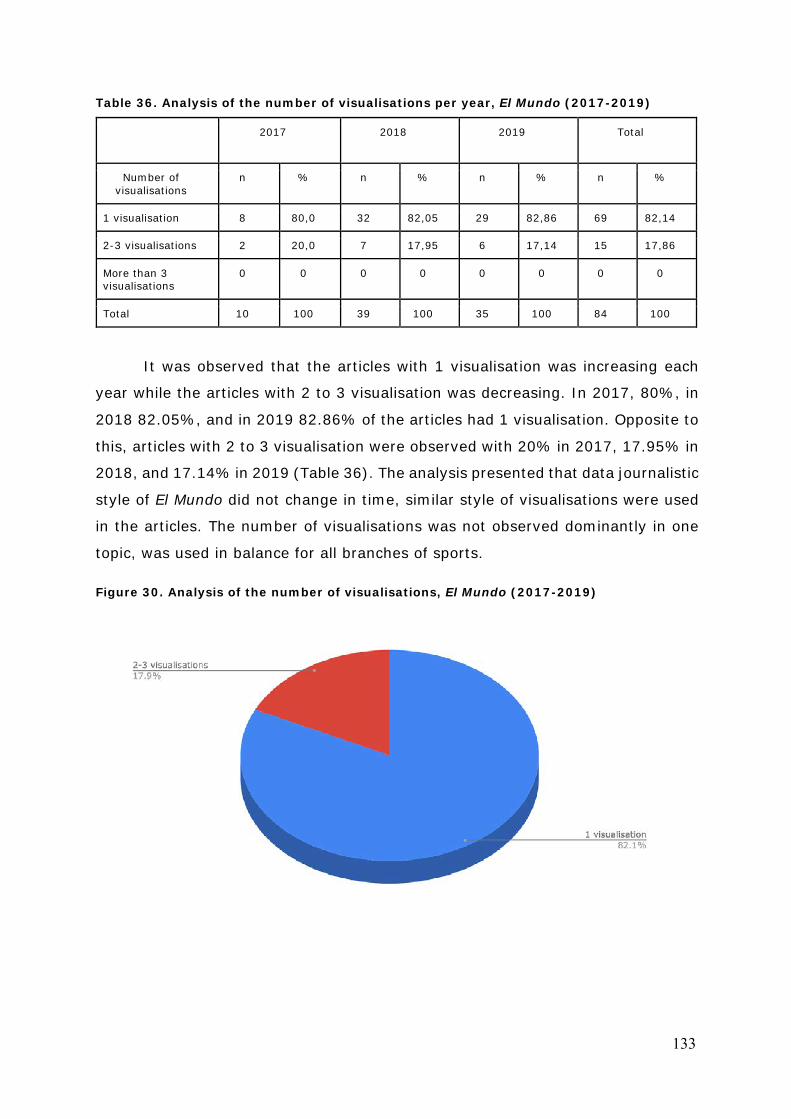
133
Table 36. Analysis of the number of visualisations per year, El Mundo (2017-2019)
2017 2018 2019 Total
Number of visualisations
n % n % n % n %
1 visualisation 8 80,0 32 82,05 29 82,86 69 82,14
2-3 visualisations 2 20,0 7 17,95 6 17,14 15 17,86
More than 3 visualisations
0 0 0 0 0 0 0 0
Total 10 100 39 100 35 100 84 100
It was observed that the articles with 1 visualisation was increasing each
year while the articles with 2 to 3 visualisation was decreasing. In 2017, 80%, in
2018 82.05%, and in 2019 82.86% of the articles had 1 visualisation. Opposite to
this, articles with 2 to 3 visualisation were observed with 20% in 2017, 17.95% in
2018, and 17.14% in 2019 (Table 36). The analysis presented that data journalistic
style of El Mundo did not change in time, similar style of visualisations were used
in the articles. The number of visualisations was not observed dominantly in one
topic, was used in balance for all branches of sports. Figure 30. Analysis of the number of visualisations, El Mundo (2017-2019)
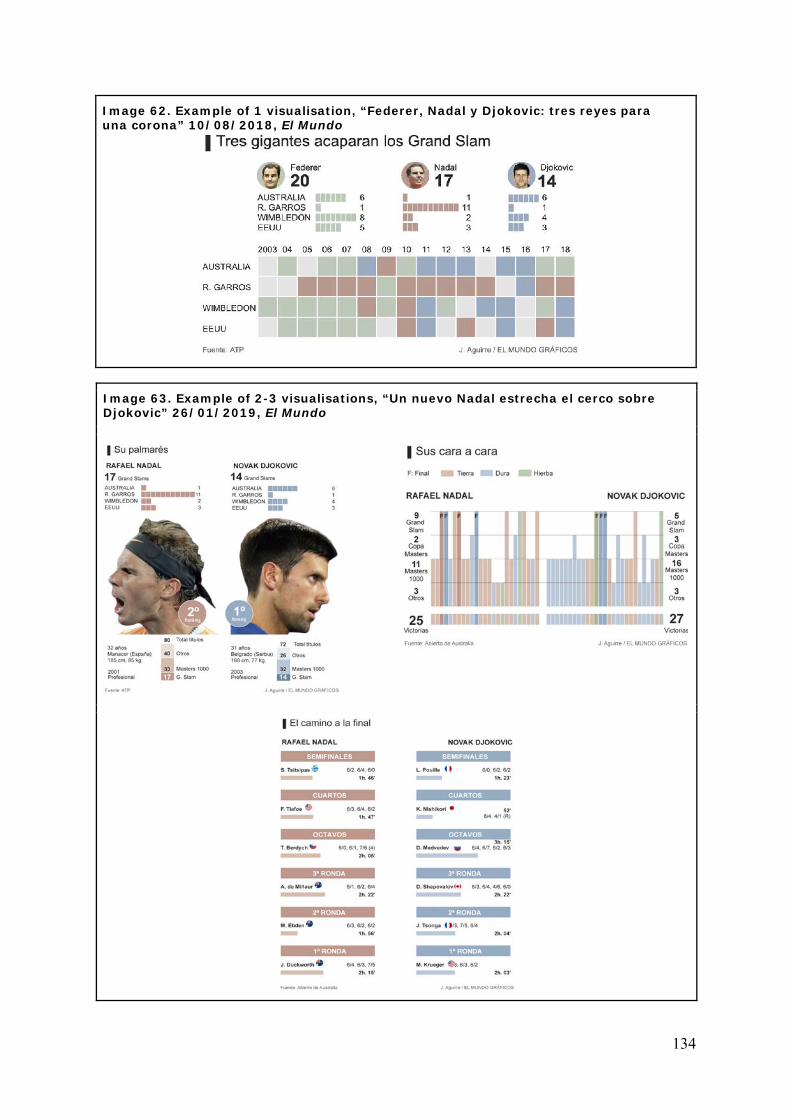
134
Image 62. Example of 1 visualisation, “Federer, Nadal y Djokovic: tres reyes para una corona” 10/08/2018, El Mundo
Image 63. Example of 2-3 visualisations, “Un nuevo Nadal estrecha el cerco sobre Djokovic” 26/01/2019, El Mundo
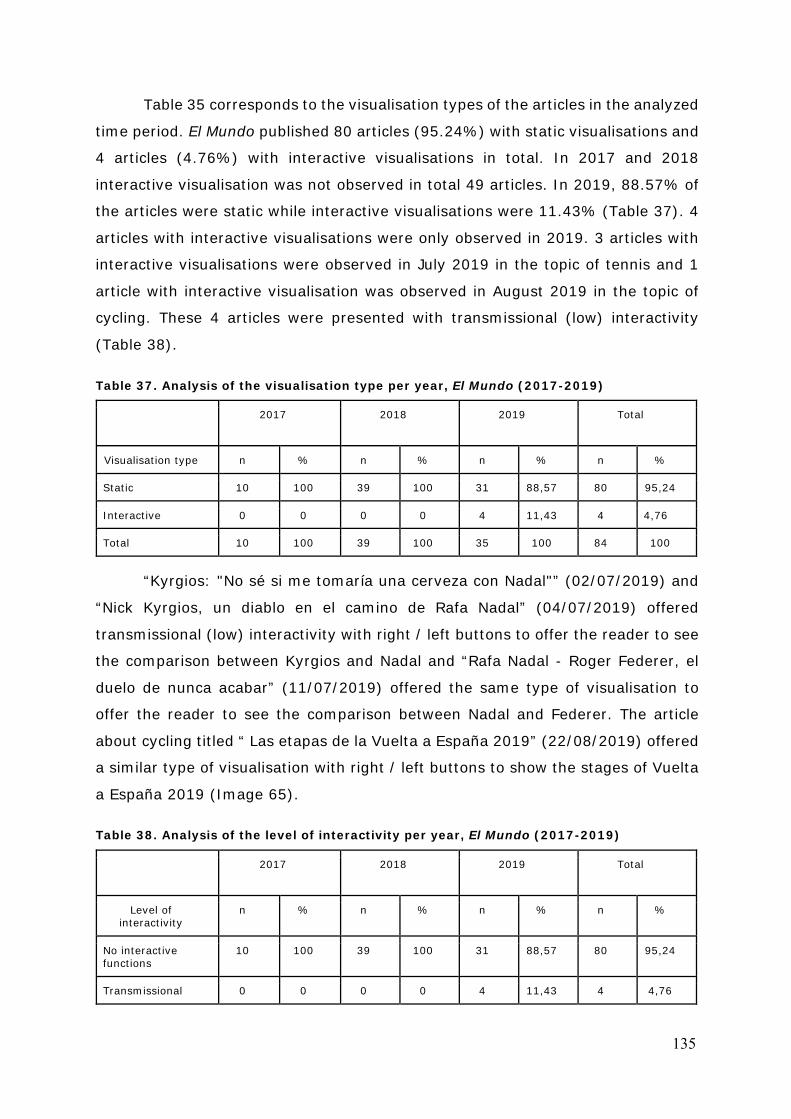
135
Table 35 corresponds to the visualisation types of the articles in the analyzed
time period. El Mundo published 80 articles (95.24%) with static visualisations and
4 articles (4.76%) with interactive visualisations in total. In 2017 and 2018
interactive visualisation was not observed in total 49 articles. In 2019, 88.57% of
the articles were static while interactive visualisations were 11.43% (Table 37). 4
articles with interactive visualisations were only observed in 2019. 3 articles with
interactive visualisations were observed in July 2019 in the topic of tennis and 1
article with interactive visualisation was observed in August 2019 in the topic of
cycling. These 4 articles were presented with transmissional (low) interactivity
(Table 38).
Table 37. Analysis of the visualisation type per year, El Mundo (2017-2019)
2017 2018 2019 Total
Visualisation type n % n % n % n %
Static 10 100 39 100 31 88,57 80 95,24
Interactive 0 0 0 0 4 11,43 4 4,76
Total 10 100 39 100 35 100 84 100
“Kyrgios: "No sé si me tomaría una cerveza con Nadal"” (02/07/2019) and
“Nick Kyrgios, un diablo en el camino de Rafa Nadal” (04/07/2019) offered
transmissional (low) interactivity with right / left buttons to offer the reader to see
the comparison between Kyrgios and Nadal and “Rafa Nadal - Roger Federer, el
duelo de nunca acabar” (11/07/2019) offered the same type of visualisation to
offer the reader to see the comparison between Nadal and Federer. The article
about cycling titled “ Las etapas de la Vuelta a España 2019” (22/08/2019) offered
a similar type of visualisation with right / left buttons to show the stages of Vuelta
a España 2019 (Image 65).
Table 38. Analysis of the level of interactivity per year, El Mundo (2017-2019)
2017 2018 2019 Total
Level of interactivity
n % n % n % n %
No interactive functions
10 100 39 100 31 88,57 80 95,24
Transmissional 0 0 0 0 4 11,43 4 4,76
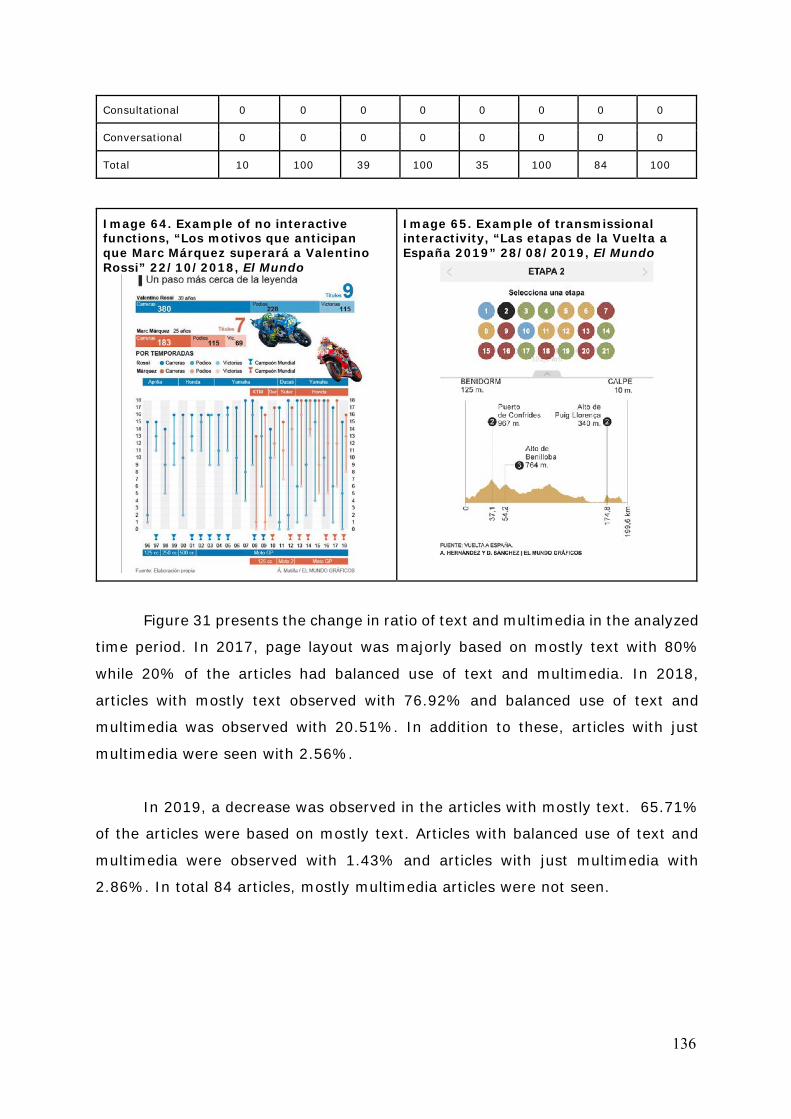
136
Consultational 0 0 0 0 0 0 0 0
Conversational 0 0 0 0 0 0 0 0
Total 10 100 39 100 35 100 84 100
Image 64. Example of no interactive functions, “Los motivos que anticipan que Marc Márquez superará a Valentino Rossi” 22/10/2018, El Mundo
Image 65. Example of transmissional interactivity, “Las etapas de la Vuelta a España 2019” 28/08/2019, El Mundo
Figure 31 presents the change in ratio of text and multimedia in the analyzed
time period. In 2017, page layout was majorly based on mostly text with 80%
while 20% of the articles had balanced use of text and multimedia. In 2018,
articles with mostly text observed with 76.92% and balanced use of text and
multimedia was observed with 20.51%. In addition to these, articles with just
multimedia were seen with 2.56%.
In 2019, a decrease was observed in the articles with mostly text. 65.71%
of the articles were based on mostly text. Articles with balanced use of text and
multimedia were observed with 1.43% and articles with just multimedia with
2.86%. In total 84 articles, mostly multimedia articles were not seen.
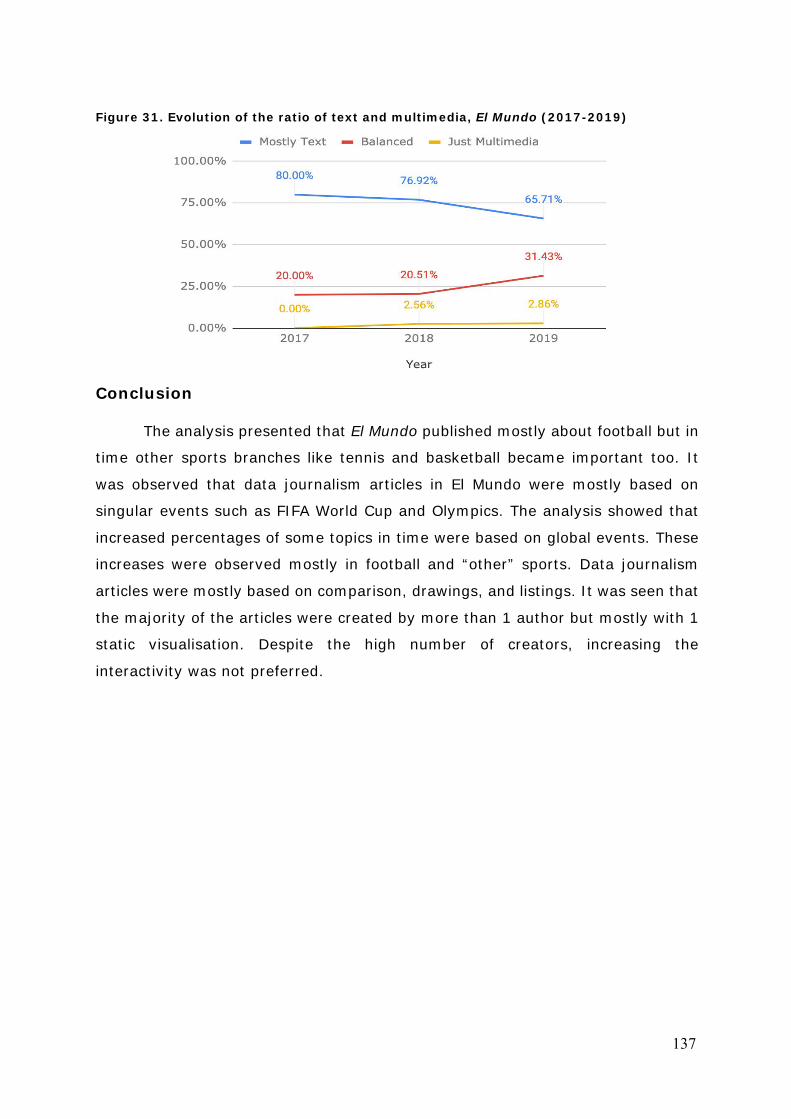
137
Figure 31. Evolution of the ratio of text and multimedia, El Mundo (2017-2019)
Conclusion
The analysis presented that El Mundo published mostly about football but in
time other sports branches like tennis and basketball became important too. It
was observed that data journalism articles in El Mundo were mostly based on
singular events such as FIFA World Cup and Olympics. The analysis showed that
increased percentages of some topics in time were based on global events. These
increases were observed mostly in football and “other” sports. Data journalism
articles were mostly based on comparison, drawings, and listings. It was seen that
the majority of the articles were created by more than 1 author but mostly with 1
static visualisation. Despite the high number of creators, increasing the
interactivity was not preferred.
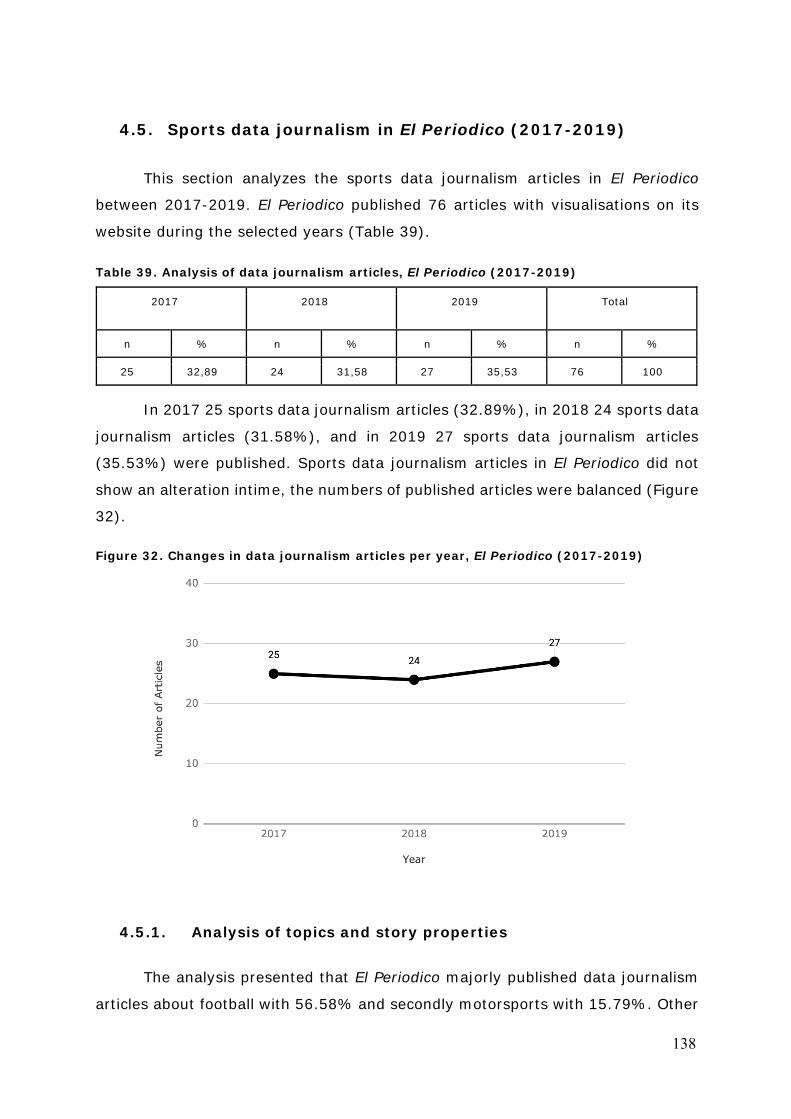
138
4.5. Sports data journalism in El Periodico (2017-2019)
This section analyzes the sports data journalism articles in El Periodico
between 2017-2019. El Periodico published 76 articles with visualisations on its
website during the selected years (Table 39).
Table 39. Analysis of data journalism articles, El Periodico (2017-2019)
2017 2018 2019 Total
n % n % n % n %
25 32,89 24 31,58 27 35,53 76 100
In 2017 25 sports data journalism articles (32.89%), in 2018 24 sports data
journalism articles (31.58%), and in 2019 27 sports data journalism articles
(35.53%) were published. Sports data journalism articles in El Periodico did not
show an alteration intime, the numbers of published articles were balanced (Figure
32). Figure 32. Changes in data journalism articles per year, El Periodico (2017-2019)
4.5.1. Analysis of topics and story properties
The analysis presented that El Periodico majorly published data journalism
articles about football with 56.58% and secondly motorsports with 15.79%. Other
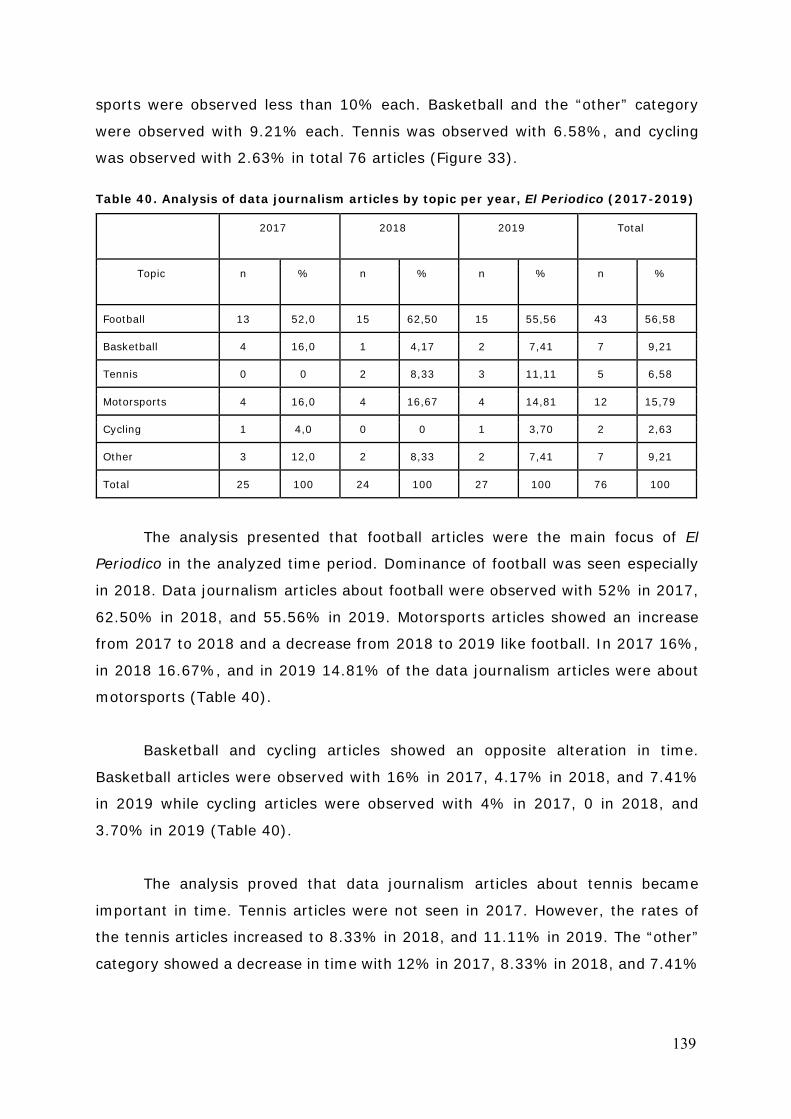
139
sports were observed less than 10% each. Basketball and the “other” category
were observed with 9.21% each. Tennis was observed with 6.58%, and cycling
was observed with 2.63% in total 76 articles (Figure 33).
Table 40. Analysis of data journalism articles by topic per year, El Periodico (2017-2019)
2017 2018 2019 Total
Topic n % n % n % n %
Football 13 52,0 15 62,50 15 55,56 43 56,58
Basketball 4 16,0 1 4,17 2 7,41 7 9,21
Tennis 0 0 2 8,33 3 11,11 5 6,58
Motorsports 4 16,0 4 16,67 4 14,81 12 15,79
Cycling 1 4,0 0 0 1 3,70 2 2,63
Other 3 12,0 2 8,33 2 7,41 7 9,21
Total 25 100 24 100 27 100 76 100
The analysis presented that football articles were the main focus of El
Periodico in the analyzed time period. Dominance of football was seen especially
in 2018. Data journalism articles about football were observed with 52% in 2017,
62.50% in 2018, and 55.56% in 2019. Motorsports articles showed an increase
from 2017 to 2018 and a decrease from 2018 to 2019 like football. In 2017 16%,
in 2018 16.67%, and in 2019 14.81% of the data journalism articles were about
motorsports (Table 40).
Basketball and cycling articles showed an opposite alteration in time.
Basketball articles were observed with 16% in 2017, 4.17% in 2018, and 7.41%
in 2019 while cycling articles were observed with 4% in 2017, 0 in 2018, and
3.70% in 2019 (Table 40).
The analysis proved that data journalism articles about tennis became
important in time. Tennis articles were not seen in 2017. However, the rates of
the tennis articles increased to 8.33% in 2018, and 11.11% in 2019. The “other”
category showed a decrease in time with 12% in 2017, 8.33% in 2018, and 7.41%
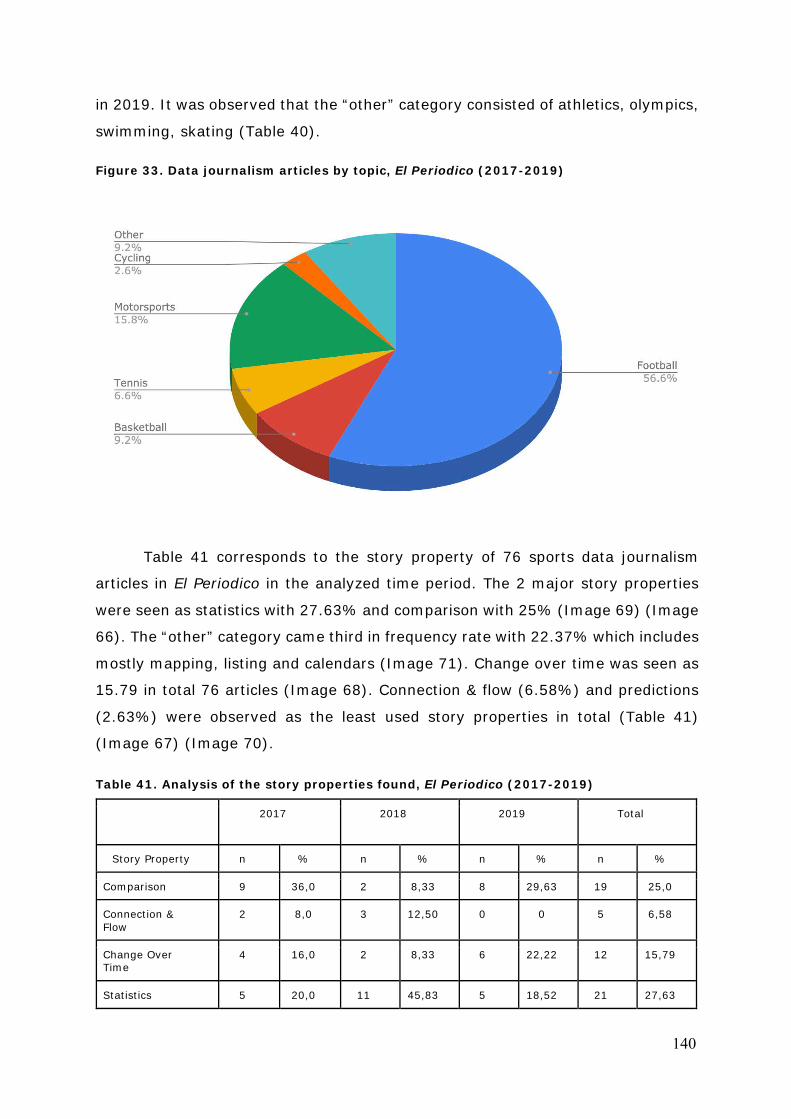
140
in 2019. It was observed that the “other” category consisted of athletics, olympics,
swimming, skating (Table 40). Figure 33. Data journalism articles by topic, El Periodico (2017-2019)
Table 41 corresponds to the story property of 76 sports data journalism
articles in El Periodico in the analyzed time period. The 2 major story properties
were seen as statistics with 27.63% and comparison with 25% (Image 69) (Image
66). The “other” category came third in frequency rate with 22.37% which includes
mostly mapping, listing and calendars (Image 71). Change over time was seen as
15.79 in total 76 articles (Image 68). Connection & flow (6.58%) and predictions
(2.63%) were observed as the least used story properties in total (Table 41)
(Image 67) (Image 70).
Table 41. Analysis of the story properties found, El Periodico (2017-2019)
2017 2018 2019 Total
Story Property n % n % n % n %
Comparison 9 36,0 2 8,33 8 29,63 19 25,0
Connection & Flow
2 8,0 3 12,50 0 0 5 6,58
Change Over Time
4 16,0 2 8,33 6 22,22 12 15,79
Statistics 5 20,0 11 45,83 5 18,52 21 27,63
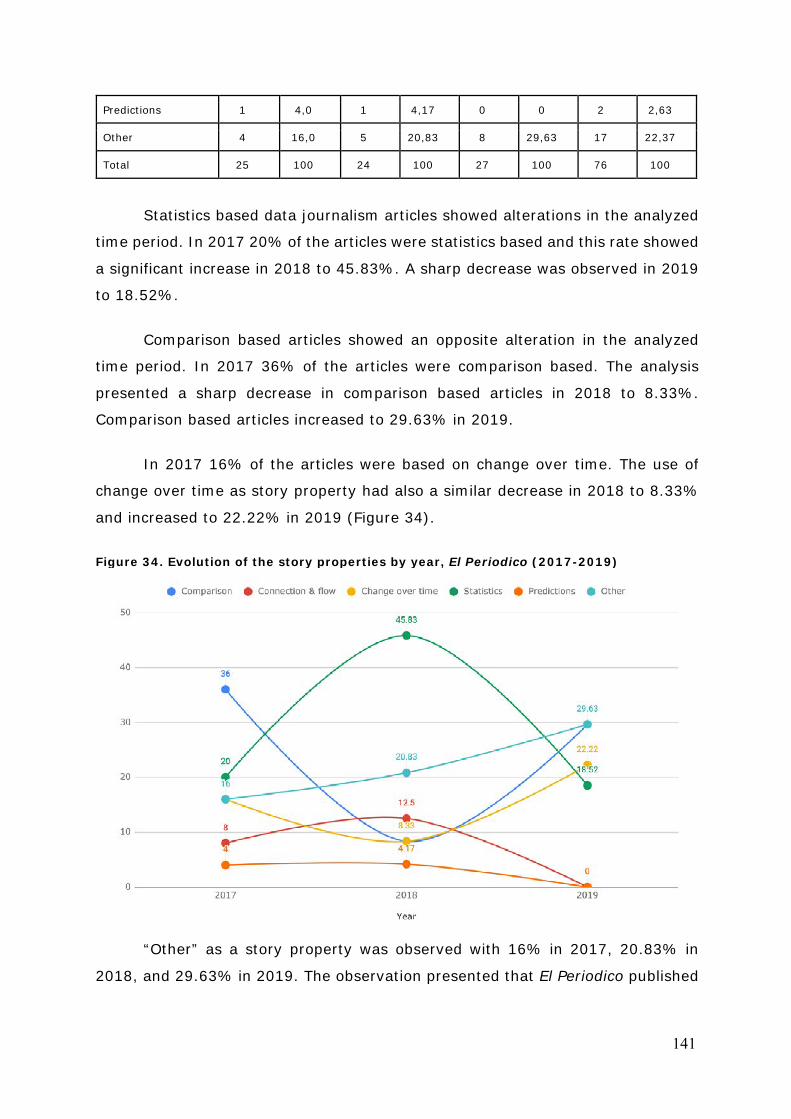
141
Predictions 1 4,0 1 4,17 0 0 2 2,63
Other 4 16,0 5 20,83 8 29,63 17 22,37
Total 25 100 24 100 27 100 76 100
Statistics based data journalism articles showed alterations in the analyzed
time period. In 2017 20% of the articles were statistics based and this rate showed
a significant increase in 2018 to 45.83%. A sharp decrease was observed in 2019
to 18.52%.
Comparison based articles showed an opposite alteration in the analyzed
time period. In 2017 36% of the articles were comparison based. The analysis
presented a sharp decrease in comparison based articles in 2018 to 8.33%.
Comparison based articles increased to 29.63% in 2019.
In 2017 16% of the articles were based on change over time. The use of
change over time as story property had also a similar decrease in 2018 to 8.33%
and increased to 22.22% in 2019 (Figure 34).
Figure 34. Evolution of the story properties by year, El Periodico (2017-2019)
“Other” as a story property was observed with 16% in 2017, 20.83% in
2018, and 29.63% in 2019. The observation presented that El Periodico published
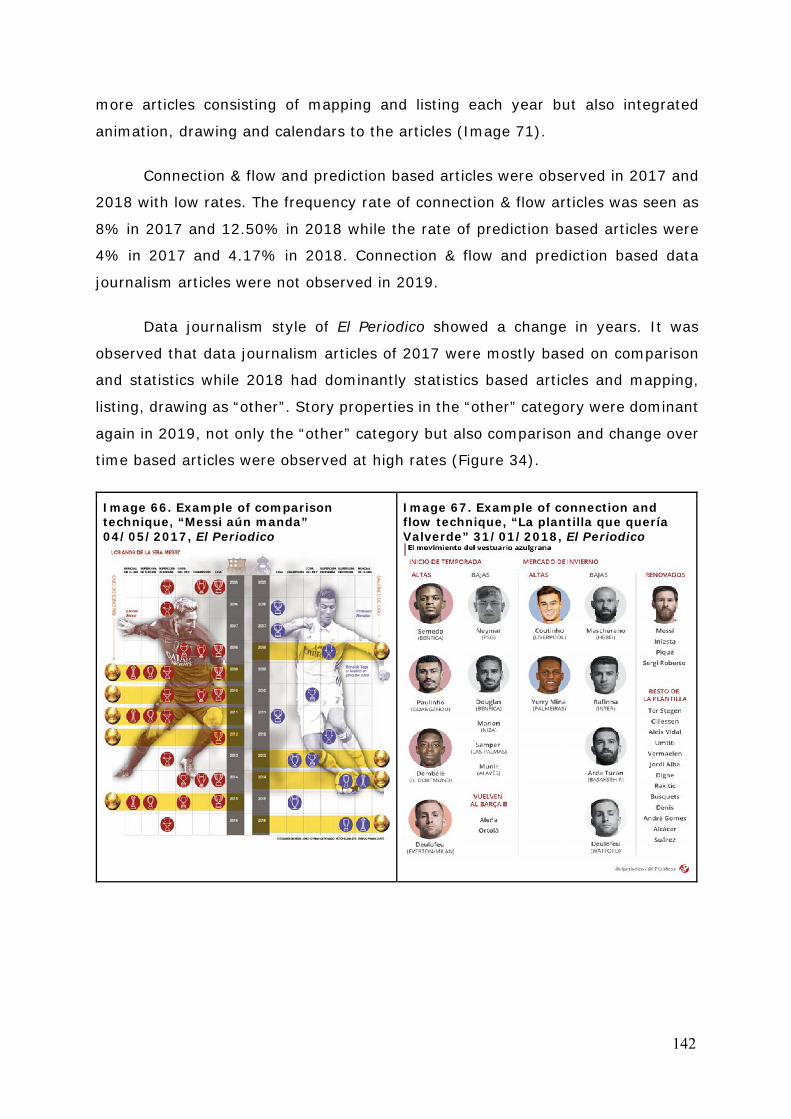
142
more articles consisting of mapping and listing each year but also integrated
animation, drawing and calendars to the articles (Image 71).
Connection & flow and prediction based articles were observed in 2017 and
2018 with low rates. The frequency rate of connection & flow articles was seen as
8% in 2017 and 12.50% in 2018 while the rate of prediction based articles were
4% in 2017 and 4.17% in 2018. Connection & flow and prediction based data
journalism articles were not observed in 2019.
Data journalism style of El Periodico showed a change in years. It was
observed that data journalism articles of 2017 were mostly based on comparison
and statistics while 2018 had dominantly statistics based articles and mapping,
listing, drawing as “other”. Story properties in the “other” category were dominant
again in 2019, not only the “other” category but also comparison and change over
time based articles were observed at high rates (Figure 34).
Image 66. Example of comparison technique, “Messi aún manda” 04/05/2017, El Periodico
Image 67. Example of connection and flow technique, “La plantilla que quería Valverde” 31/01/2018, El Periodico
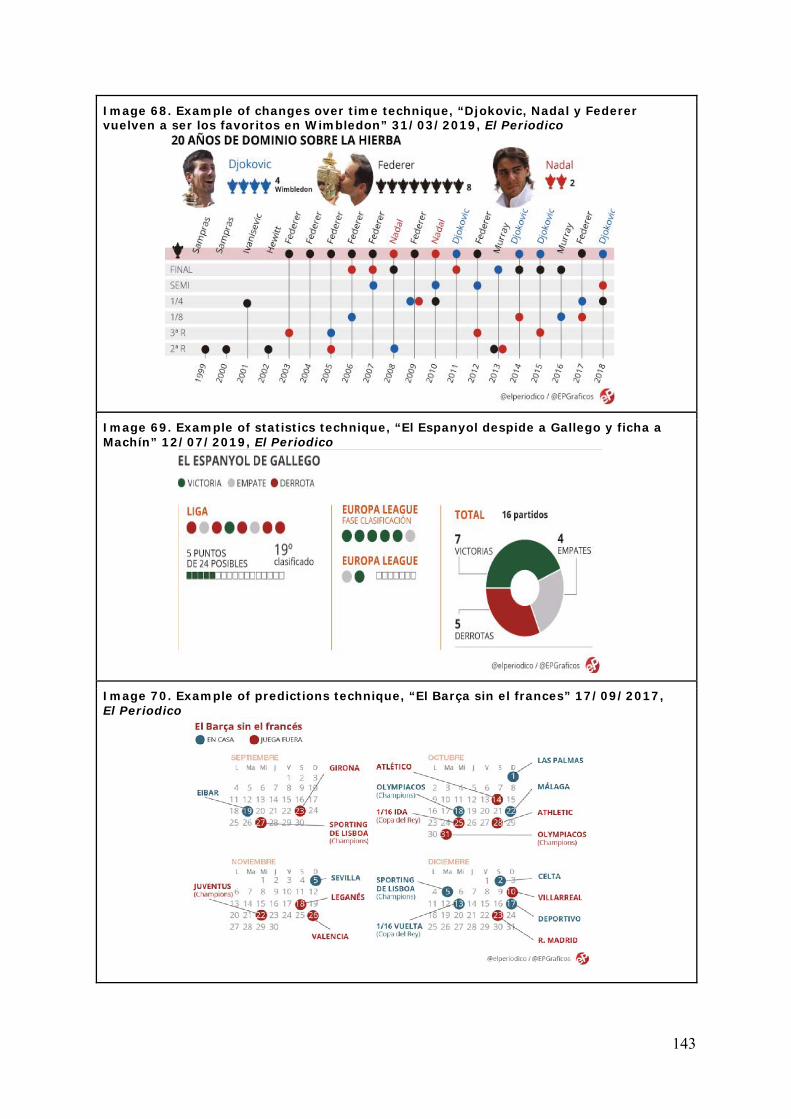
143
Image 68. Example of changes over time technique, “Djokovic, Nadal y Federer vuelven a ser los favoritos en Wimbledon” 31/03/2019, El Periodico
Image 69. Example of statistics technique, “El Espanyol despide a Gallego y ficha a Machín” 12/07/2019, El Periodico
Image 70. Example of predictions technique, “El Barça sin el frances” 17/09/2017, El Periodico
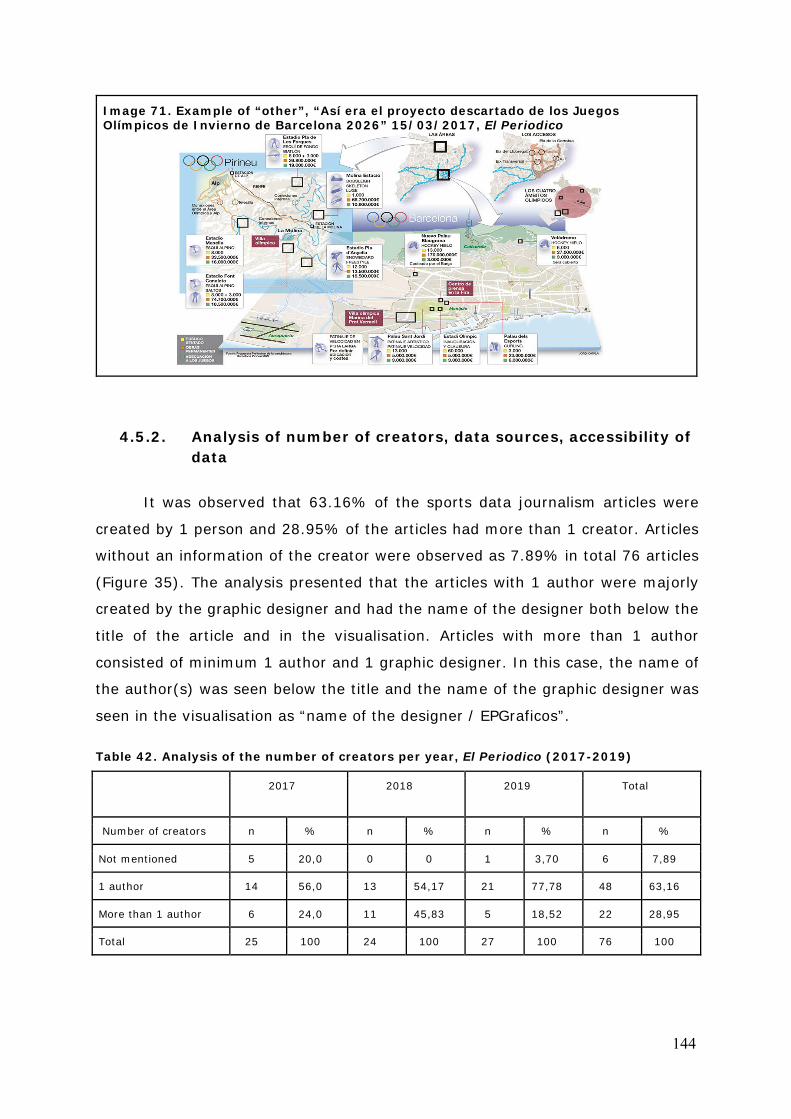
144
Image 71. Example of “other”, “Así era el proyecto descartado de los Juegos Olímpicos de Invierno de Barcelona 2026” 15/03/2017, El Periodico
4.5.2. Analysis of number of creators, data sources, accessibility of data
It was observed that 63.16% of the sports data journalism articles were
created by 1 person and 28.95% of the articles had more than 1 creator. Articles
without an information of the creator were observed as 7.89% in total 76 articles
(Figure 35). The analysis presented that the articles with 1 author were majorly
created by the graphic designer and had the name of the designer both below the
title of the article and in the visualisation. Articles with more than 1 author
consisted of minimum 1 author and 1 graphic designer. In this case, the name of
the author(s) was seen below the title and the name of the graphic designer was
seen in the visualisation as “name of the designer / EPGraficos”.
Table 42. Analysis of the number of creators per year, El Periodico (2017-2019)
2017 2018 2019 Total
Number of creators n % n % n % n %
Not mentioned 5 20,0 0 0 1 3,70 6 7,89
1 author 14 56,0 13 54,17 21 77,78 48 63,16
More than 1 author 6 24,0 11 45,83 5 18,52 22 28,95
Total 25 100 24 100 27 100 76 100
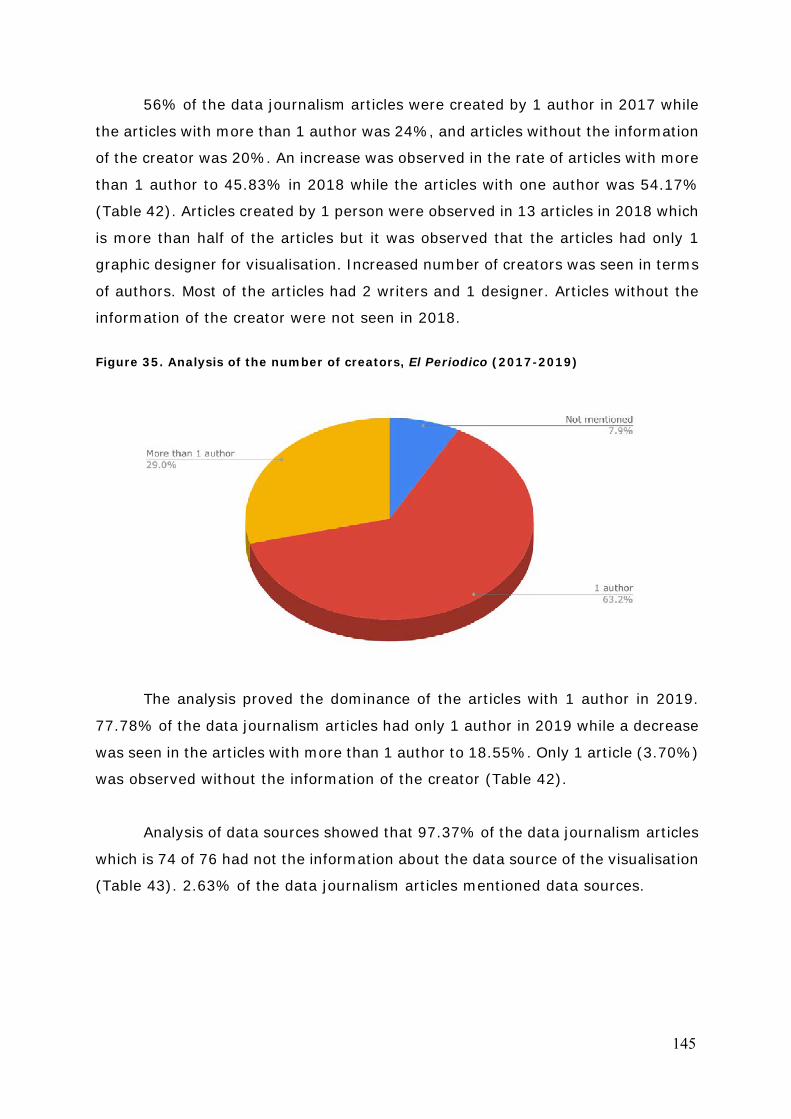
145
56% of the data journalism articles were created by 1 author in 2017 while
the articles with more than 1 author was 24%, and articles without the information
of the creator was 20%. An increase was observed in the rate of articles with more
than 1 author to 45.83% in 2018 while the articles with one author was 54.17%
(Table 42). Articles created by 1 person were observed in 13 articles in 2018 which
is more than half of the articles but it was observed that the articles had only 1
graphic designer for visualisation. Increased number of creators was seen in terms
of authors. Most of the articles had 2 writers and 1 designer. Articles without the
information of the creator were not seen in 2018.
Figure 35. Analysis of the number of creators, El Periodico (2017-2019)
The analysis proved the dominance of the articles with 1 author in 2019.
77.78% of the data journalism articles had only 1 author in 2019 while a decrease
was seen in the articles with more than 1 author to 18.55%. Only 1 article (3.70%)
was observed without the information of the creator (Table 42).
Analysis of data sources showed that 97.37% of the data journalism articles
which is 74 of 76 had not the information about the data source of the visualisation
(Table 43). 2.63% of the data journalism articles mentioned data sources.
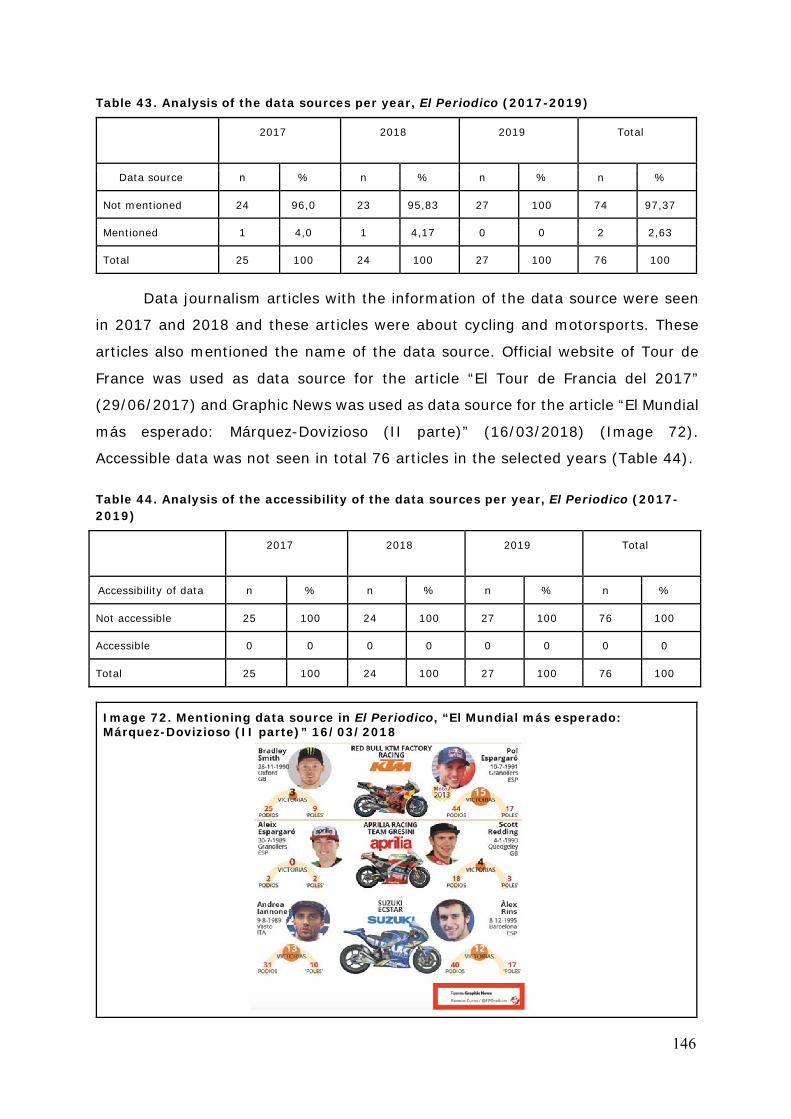
146
Table 43. Analysis of the data sources per year, El Periodico (2017-2019)
2017 2018 2019 Total
Data source n % n % n % n %
Not mentioned 24 96,0 23 95,83 27 100 74 97,37
Mentioned 1 4,0 1 4,17 0 0 2 2,63
Total 25 100 24 100 27 100 76 100
Data journalism articles with the information of the data source were seen
in 2017 and 2018 and these articles were about cycling and motorsports. These
articles also mentioned the name of the data source. Official website of Tour de
France was used as data source for the article “El Tour de Francia del 2017”
(29/06/2017) and Graphic News was used as data source for the article “El Mundial
más esperado: Márquez-Dovizioso (II parte)” (16/03/2018) (Image 72).
Accessible data was not seen in total 76 articles in the selected years (Table 44).
Table 44. Analysis of the accessibility of the data sources per year, El Periodico (2017-2019)
2017 2018 2019 Total
Accessibility of data n % n % n % n %
Not accessible 25 100 24 100 27 100 76 100
Accessible 0 0 0 0 0 0 0 0
Total 25 100 24 100 27 100 76 100
Image 72. Mentioning data source in El Periodico, “El Mundial más esperado: Márquez-Dovizioso (II parte)” 16/03/2018
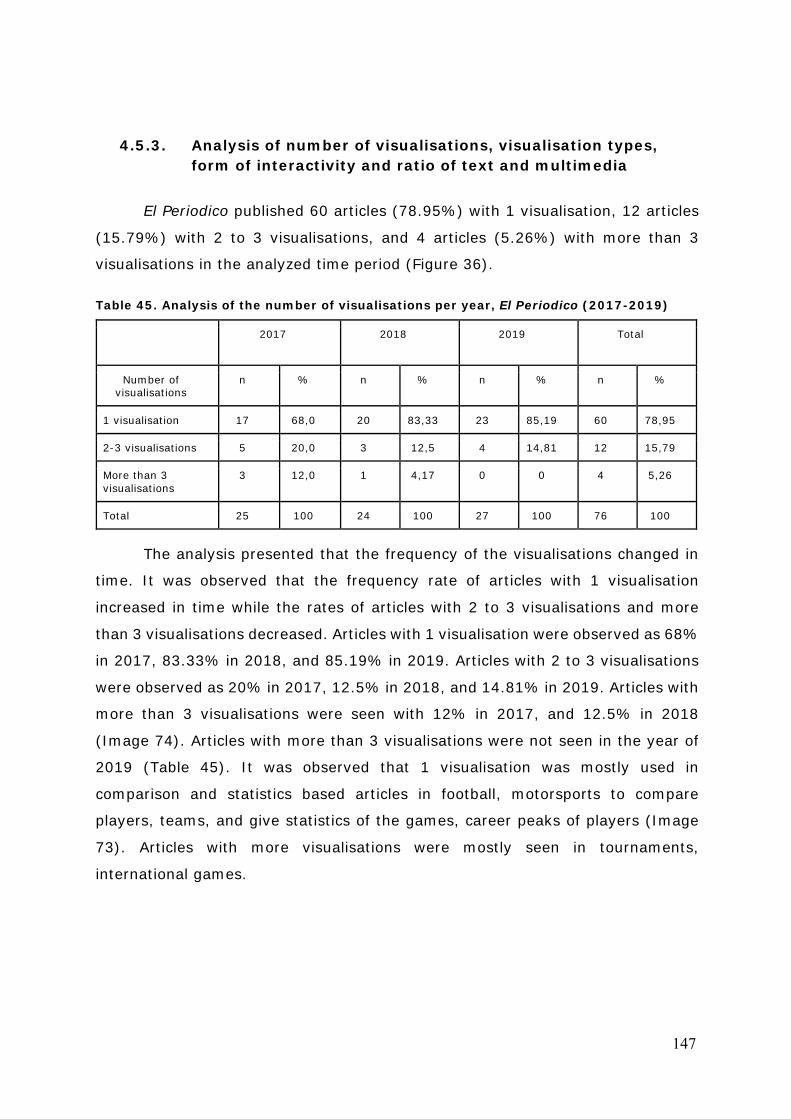
147
4.5.3. Analysis of number of visualisations, visualisation types, form of interactivity and ratio of text and multimedia
El Periodico published 60 articles (78.95%) with 1 visualisation, 12 articles
(15.79%) with 2 to 3 visualisations, and 4 articles (5.26%) with more than 3
visualisations in the analyzed time period (Figure 36).
Table 45. Analysis of the number of visualisations per year, El Periodico (2017-2019)
2017 2018 2019 Total
Number of visualisations
n % n % n % n %
1 visualisation 17 68,0 20 83,33 23 85,19 60 78,95
2-3 visualisations 5 20,0 3 12,5 4 14,81 12 15,79
More than 3 visualisations
3 12,0 1 4,17 0 0 4 5,26
Total 25 100 24 100 27 100 76 100
The analysis presented that the frequency of the visualisations changed in
time. It was observed that the frequency rate of articles with 1 visualisation
increased in time while the rates of articles with 2 to 3 visualisations and more
than 3 visualisations decreased. Articles with 1 visualisation were observed as 68%
in 2017, 83.33% in 2018, and 85.19% in 2019. Articles with 2 to 3 visualisations
were observed as 20% in 2017, 12.5% in 2018, and 14.81% in 2019. Articles with
more than 3 visualisations were seen with 12% in 2017, and 12.5% in 2018
(Image 74). Articles with more than 3 visualisations were not seen in the year of
2019 (Table 45). It was observed that 1 visualisation was mostly used in
comparison and statistics based articles in football, motorsports to compare
players, teams, and give statistics of the games, career peaks of players (Image
73). Articles with more visualisations were mostly seen in tournaments,
international games.
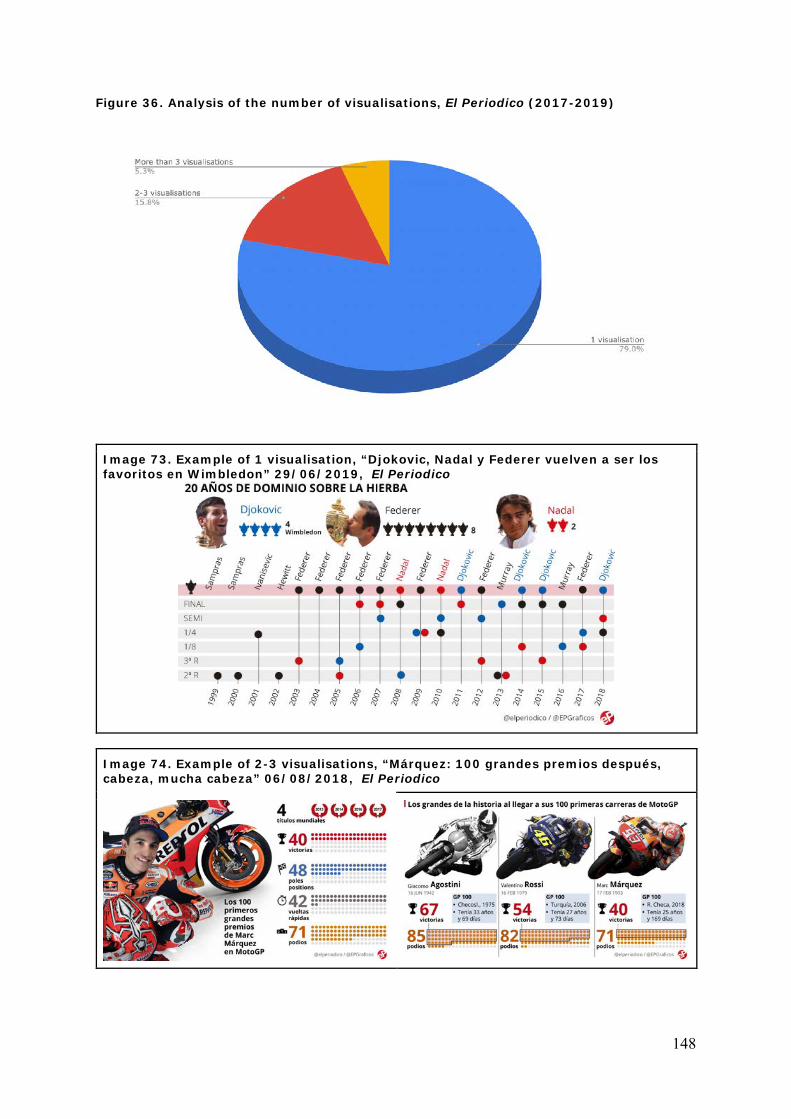
148
Figure 36. Analysis of the number of visualisations, El Periodico (2017-2019)
Image 73. Example of 1 visualisation, “Djokovic, Nadal y Federer vuelven a ser los favoritos en Wimbledon” 29/06/2019, El Periodico
Image 74. Example of 2-3 visualisations, “Márquez: 100 grandes premios después, cabeza, mucha cabeza” 06/08/2018, El Periodico
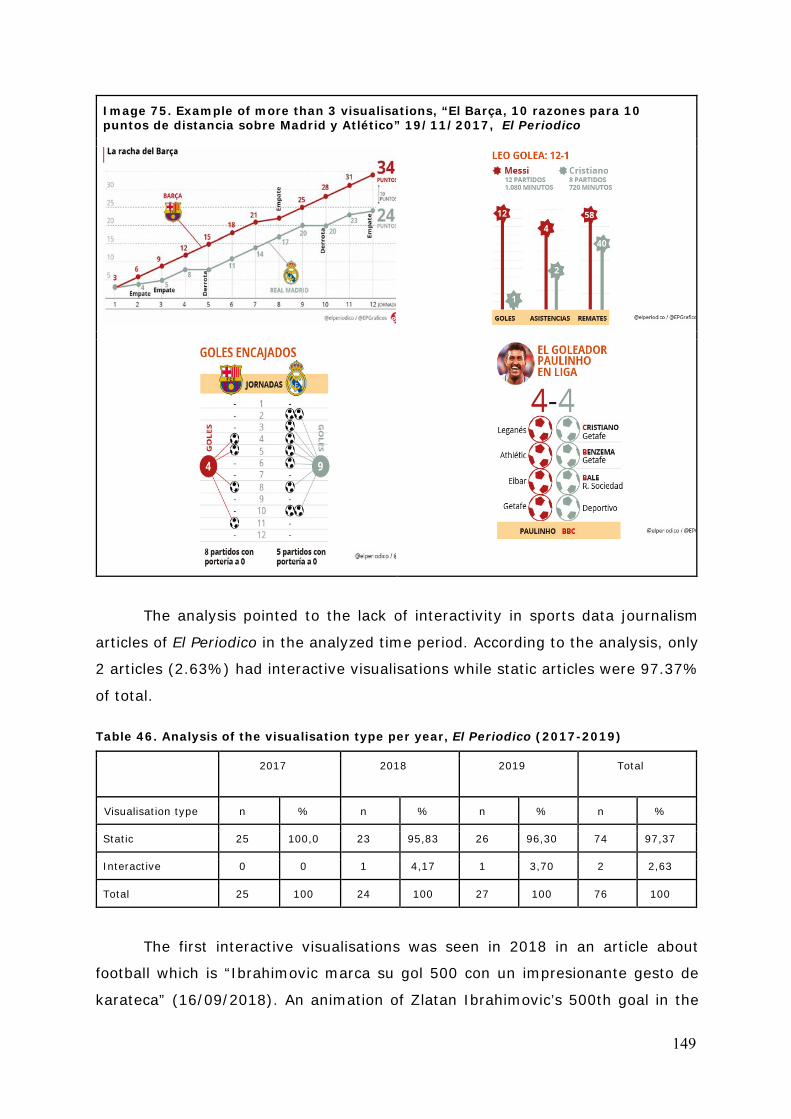
149
Image 75. Example of more than 3 visualisations, “El Barça, 10 razones para 10 puntos de distancia sobre Madrid y Atlético” 19/11/2017, El Periodico
The analysis pointed to the lack of interactivity in sports data journalism
articles of El Periodico in the analyzed time period. According to the analysis, only
2 articles (2.63%) had interactive visualisations while static articles were 97.37%
of total.
Table 46. Analysis of the visualisation type per year, El Periodico (2017-2019)
2017 2018 2019 Total
Visualisation type n % n % n % n %
Static 25 100,0 23 95,83 26 96,30 74 97,37
Interactive 0 0 1 4,17 1 3,70 2 2,63
Total 25 100 24 100 27 100 76 100
The first interactive visualisations was seen in 2018 in an article about
football which is “Ibrahimovic marca su gol 500 con un impresionante gesto de
karateca” (16/09/2018). An animation of Zlatan Ibrahimovic’s 500th goal in the
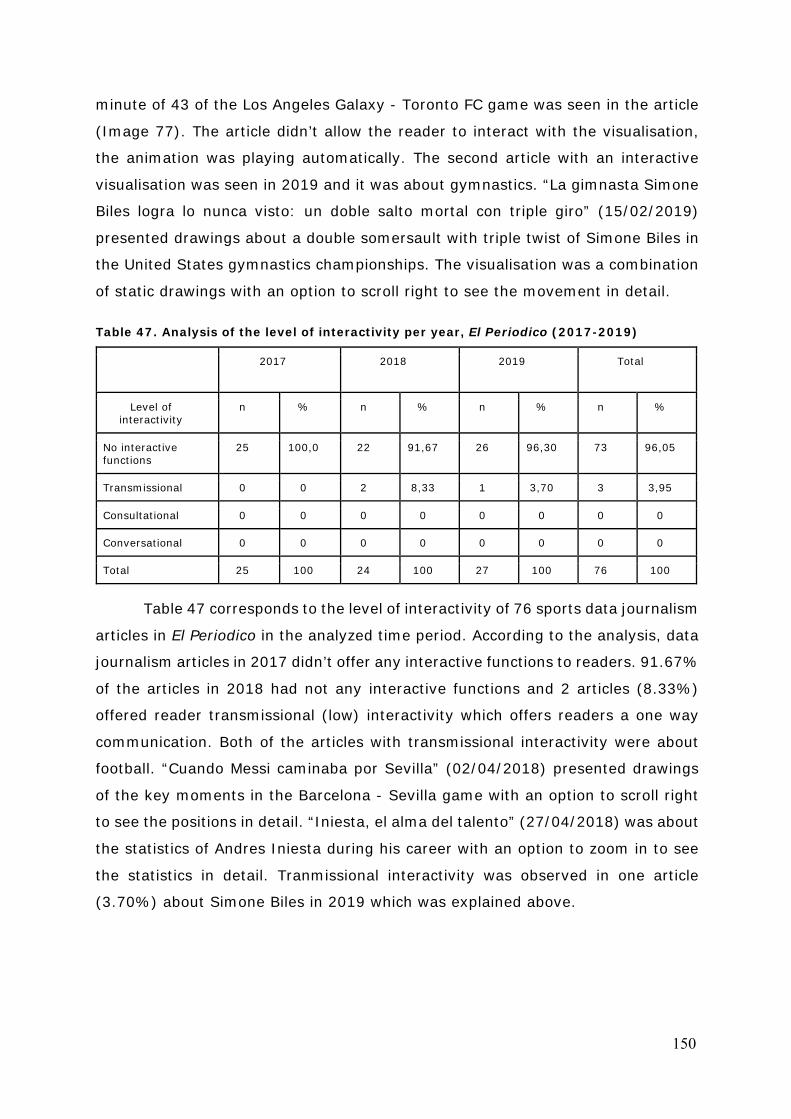
150
minute of 43 of the Los Angeles Galaxy - Toronto FC game was seen in the article
(Image 77). The article didn’t allow the reader to interact with the visualisation,
the animation was playing automatically. The second article with an interactive
visualisation was seen in 2019 and it was about gymnastics. “La gimnasta Simone
Biles logra lo nunca visto: un doble salto mortal con triple giro” (15/02/2019)
presented drawings about a double somersault with triple twist of Simone Biles in
the United States gymnastics championships. The visualisation was a combination
of static drawings with an option to scroll right to see the movement in detail.
Table 47. Analysis of the level of interactivity per year, El Periodico (2017-2019)
2017 2018 2019 Total
Level of interactivity
n % n % n % n %
No interactive functions
25 100,0 22 91,67 26 96,30 73 96,05
Transmissional 0 0 2 8,33 1 3,70 3 3,95
Consultational 0 0 0 0 0 0 0 0
Conversational 0 0 0 0 0 0 0 0
Total 25 100 24 100 27 100 76 100
Table 47 corresponds to the level of interactivity of 76 sports data journalism
articles in El Periodico in the analyzed time period. According to the analysis, data
journalism articles in 2017 didn’t offer any interactive functions to readers. 91.67%
of the articles in 2018 had not any interactive functions and 2 articles (8.33%)
offered reader transmissional (low) interactivity which offers readers a one way
communication. Both of the articles with transmissional interactivity were about
football. “Cuando Messi caminaba por Sevilla” (02/04/2018) presented drawings
of the key moments in the Barcelona - Sevilla game with an option to scroll right
to see the positions in detail. “Iniesta, el alma del talento” (27/04/2018) was about
the statistics of Andres Iniesta during his career with an option to zoom in to see
the statistics in detail. Tranmissional interactivity was observed in one article
(3.70%) about Simone Biles in 2019 which was explained above.
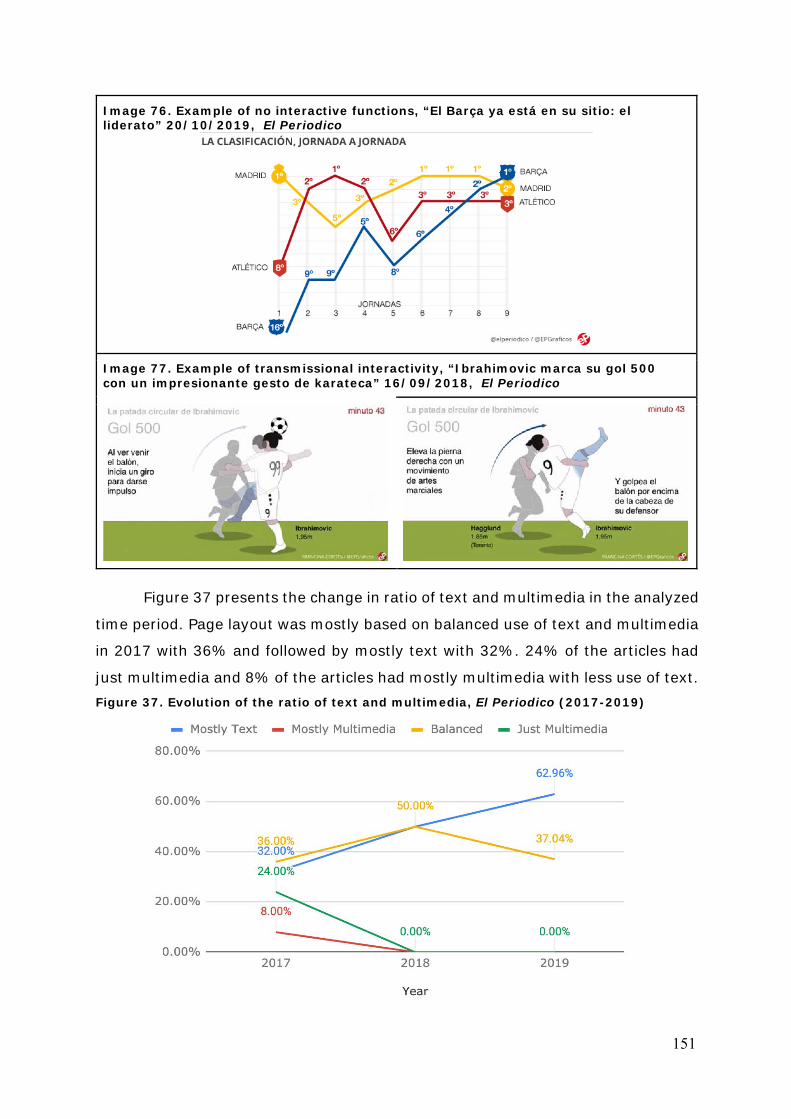
151
Image 76. Example of no interactive functions, “El Barça ya está en su sitio: el liderato” 20/10/2019, El Periodico
Image 77. Example of transmissional interactivity, “Ibrahimovic marca su gol 500 con un impresionante gesto de karateca” 16/09/2018, El Periodico
Figure 37 presents the change in ratio of text and multimedia in the analyzed
time period. Page layout was mostly based on balanced use of text and multimedia
in 2017 with 36% and followed by mostly text with 32%. 24% of the articles had
just multimedia and 8% of the articles had mostly multimedia with less use of text. Figure 37. Evolution of the ratio of text and multimedia, El Periodico (2017-2019)
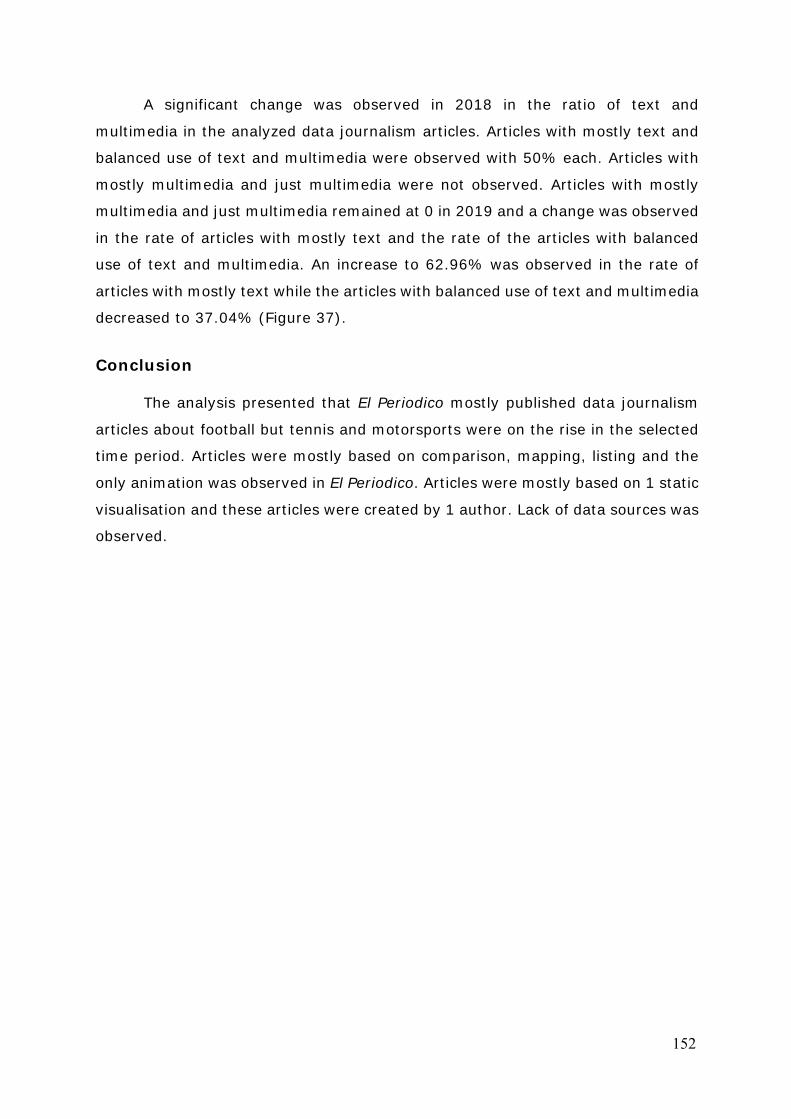
152
A significant change was observed in 2018 in the ratio of text and
multimedia in the analyzed data journalism articles. Articles with mostly text and
balanced use of text and multimedia were observed with 50% each. Articles with
mostly multimedia and just multimedia were not observed. Articles with mostly
multimedia and just multimedia remained at 0 in 2019 and a change was observed
in the rate of articles with mostly text and the rate of the articles with balanced
use of text and multimedia. An increase to 62.96% was observed in the rate of
articles with mostly text while the articles with balanced use of text and multimedia
decreased to 37.04% (Figure 37).
Conclusion
The analysis presented that El Periodico mostly published data journalism
articles about football but tennis and motorsports were on the rise in the selected
time period. Articles were mostly based on comparison, mapping, listing and the
only animation was observed in El Periodico. Articles were mostly based on 1 static
visualisation and these articles were created by 1 author. Lack of data sources was
observed.
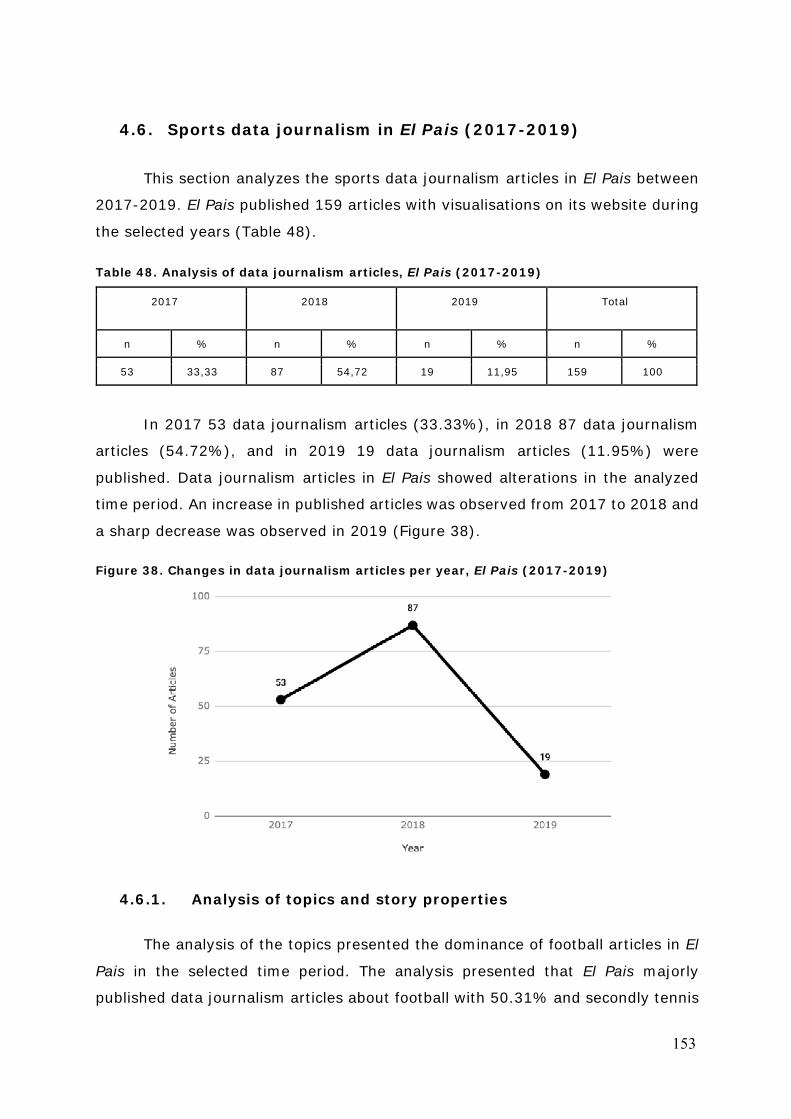
153
4.6. Sports data journalism in El Pais (2017-2019)
This section analyzes the sports data journalism articles in El Pais between
2017-2019. El Pais published 159 articles with visualisations on its website during
the selected years (Table 48).
Table 48. Analysis of data journalism articles, El Pais (2017-2019)
2017 2018 2019 Total
n % n % n % n %
53 33,33 87 54,72 19 11,95 159 100
In 2017 53 data journalism articles (33.33%), in 2018 87 data journalism
articles (54.72%), and in 2019 19 data journalism articles (11.95%) were
published. Data journalism articles in El Pais showed alterations in the analyzed
time period. An increase in published articles was observed from 2017 to 2018 and
a sharp decrease was observed in 2019 (Figure 38). Figure 38. Changes in data journalism articles per year, El Pais (2017-2019)
4.6.1. Analysis of topics and story properties
The analysis of the topics presented the dominance of football articles in El
Pais in the selected time period. The analysis presented that El Pais majorly
published data journalism articles about football with 50.31% and secondly tennis
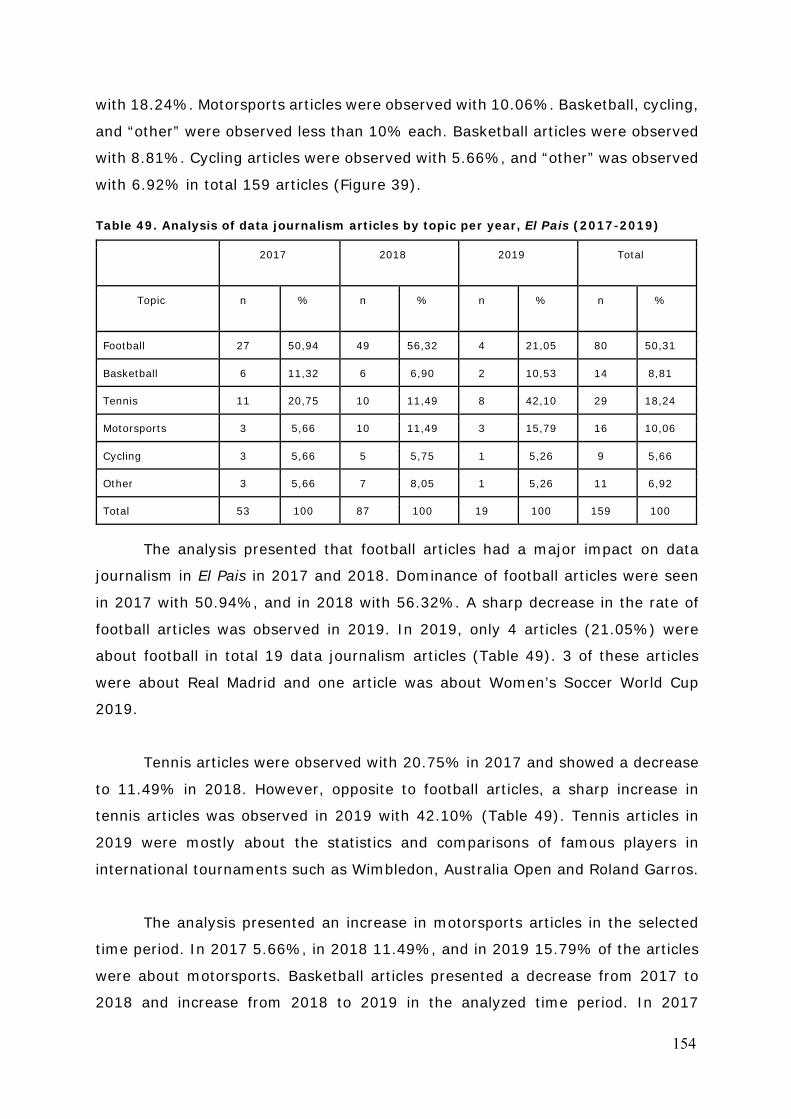
154
with 18.24%. Motorsports articles were observed with 10.06%. Basketball, cycling,
and “other” were observed less than 10% each. Basketball articles were observed
with 8.81%. Cycling articles were observed with 5.66%, and “other” was observed
with 6.92% in total 159 articles (Figure 39).
Table 49. Analysis of data journalism articles by topic per year, El Pais (2017-2019)
2017 2018 2019 Total
Topic n % n % n % n %
Football 27 50,94 49 56,32 4 21,05 80 50,31
Basketball 6 11,32 6 6,90 2 10,53 14 8,81
Tennis 11 20,75 10 11,49 8 42,10 29 18,24
Motorsports 3 5,66 10 11,49 3 15,79 16 10,06
Cycling 3 5,66 5 5,75 1 5,26 9 5,66
Other 3 5,66 7 8,05 1 5,26 11 6,92
Total 53 100 87 100 19 100 159 100
The analysis presented that football articles had a major impact on data
journalism in El Pais in 2017 and 2018. Dominance of football articles were seen
in 2017 with 50.94%, and in 2018 with 56.32%. A sharp decrease in the rate of
football articles was observed in 2019. In 2019, only 4 articles (21.05%) were
about football in total 19 data journalism articles (Table 49). 3 of these articles
were about Real Madrid and one article was about Women’s Soccer World Cup
2019.
Tennis articles were observed with 20.75% in 2017 and showed a decrease
to 11.49% in 2018. However, opposite to football articles, a sharp increase in
tennis articles was observed in 2019 with 42.10% (Table 49). Tennis articles in
2019 were mostly about the statistics and comparisons of famous players in
international tournaments such as Wimbledon, Australia Open and Roland Garros.
The analysis presented an increase in motorsports articles in the selected
time period. In 2017 5.66%, in 2018 11.49%, and in 2019 15.79% of the articles
were about motorsports. Basketball articles presented a decrease from 2017 to
2018 and increase from 2018 to 2019 in the analyzed time period. In 2017
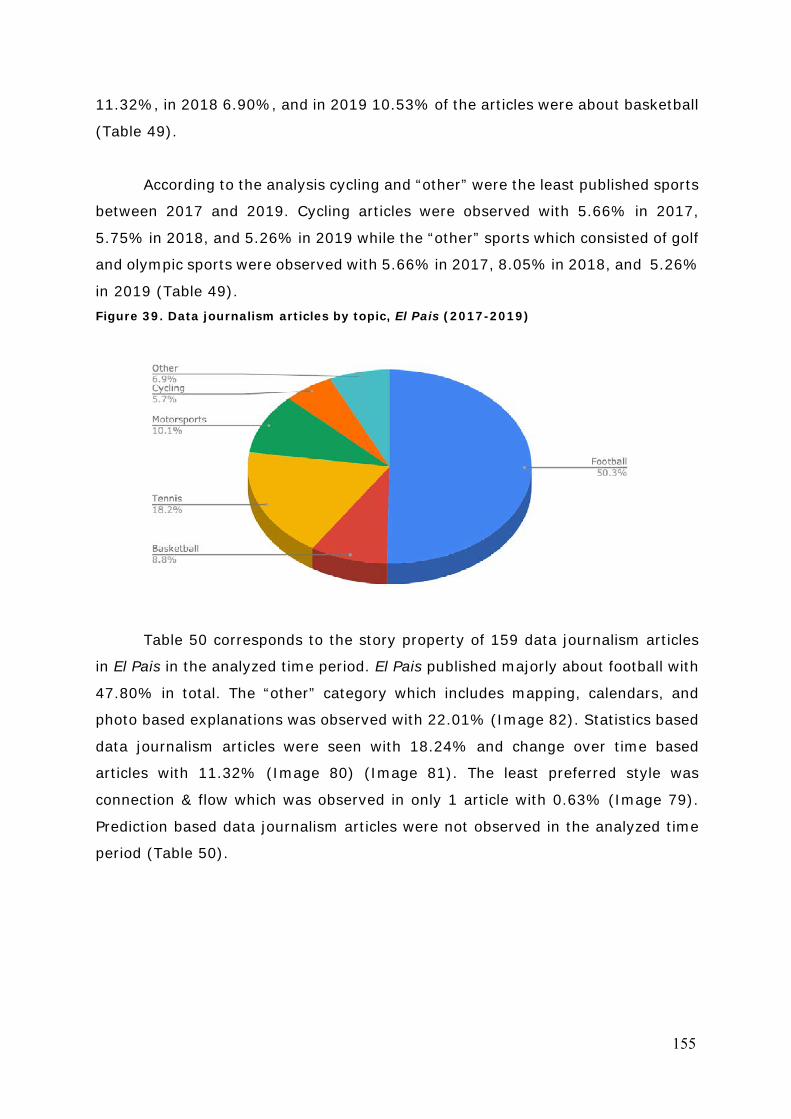
155
11.32%, in 2018 6.90%, and in 2019 10.53% of the articles were about basketball
(Table 49).
According to the analysis cycling and “other” were the least published sports
between 2017 and 2019. Cycling articles were observed with 5.66% in 2017,
5.75% in 2018, and 5.26% in 2019 while the “other” sports which consisted of golf
and olympic sports were observed with 5.66% in 2017, 8.05% in 2018, and 5.26%
in 2019 (Table 49). Figure 39. Data journalism articles by topic, El Pais (2017-2019)
Table 50 corresponds to the story property of 159 data journalism articles
in El Pais in the analyzed time period. El Pais published majorly about football with
47.80% in total. The “other” category which includes mapping, calendars, and
photo based explanations was observed with 22.01% (Image 82). Statistics based
data journalism articles were seen with 18.24% and change over time based
articles with 11.32% (Image 80) (Image 81). The least preferred style was
connection & flow which was observed in only 1 article with 0.63% (Image 79).
Prediction based data journalism articles were not observed in the analyzed time
period (Table 50).
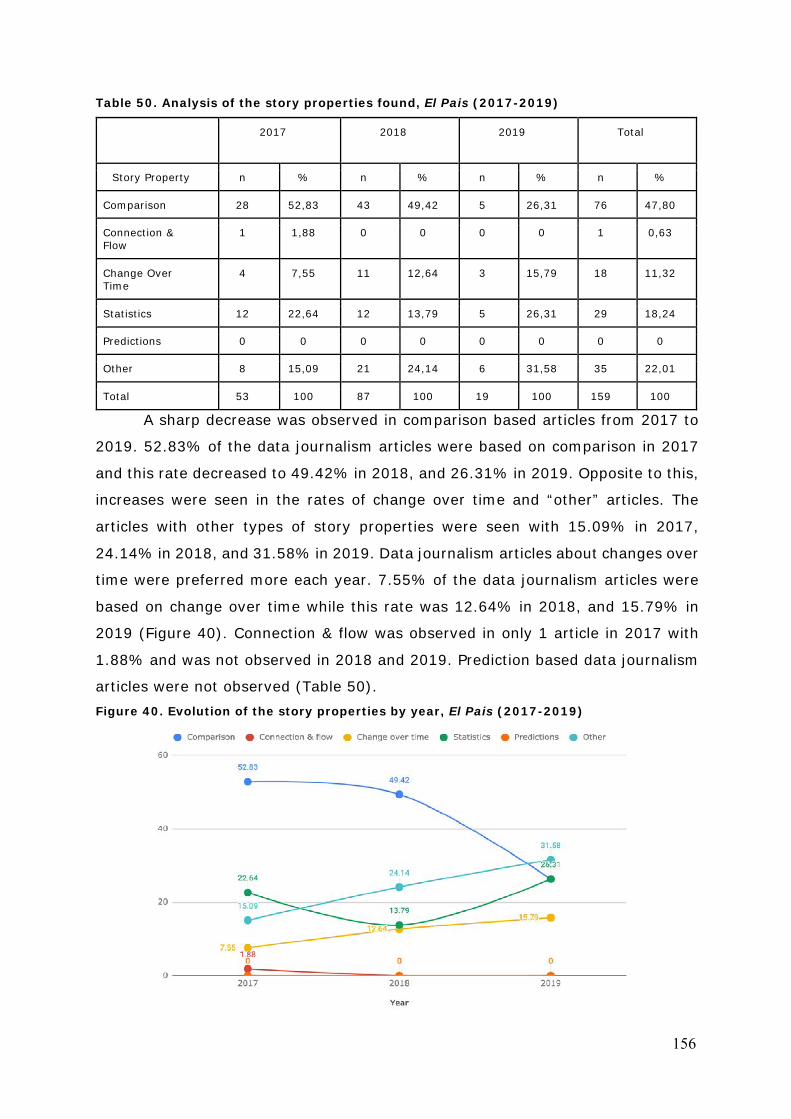
156
Table 50. Analysis of the story properties found, El Pais (2017-2019)
2017 2018 2019 Total
Story Property n % n % n % n %
Comparison 28 52,83 43 49,42 5 26,31 76 47,80
Connection & Flow
1 1,88 0 0 0 0 1 0,63
Change Over Time
4 7,55 11 12,64 3 15,79 18 11,32
Statistics 12 22,64 12 13,79 5 26,31 29 18,24
Predictions 0 0 0 0 0 0 0 0
Other 8 15,09 21 24,14 6 31,58 35 22,01
Total 53 100 87 100 19 100 159 100
A sharp decrease was observed in comparison based articles from 2017 to
2019. 52.83% of the data journalism articles were based on comparison in 2017
and this rate decreased to 49.42% in 2018, and 26.31% in 2019. Opposite to this,
increases were seen in the rates of change over time and “other” articles. The
articles with other types of story properties were seen with 15.09% in 2017,
24.14% in 2018, and 31.58% in 2019. Data journalism articles about changes over
time were preferred more each year. 7.55% of the data journalism articles were
based on change over time while this rate was 12.64% in 2018, and 15.79% in
2019 (Figure 40). Connection & flow was observed in only 1 article in 2017 with
1.88% and was not observed in 2018 and 2019. Prediction based data journalism
articles were not observed (Table 50). Figure 40. Evolution of the story properties by year, El Pais (2017-2019)
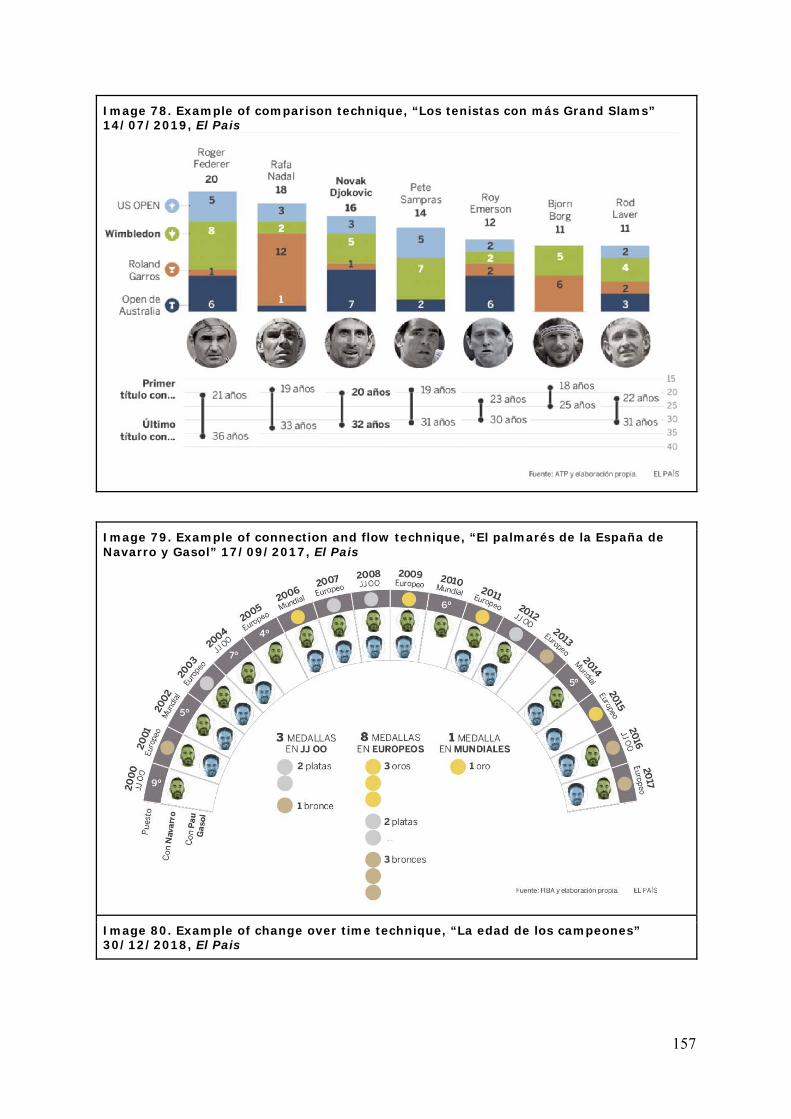
157
Image 78. Example of comparison technique, “Los tenistas con más Grand Slams” 14/07/2019, El Pais
Image 79. Example of connection and flow technique, “El palmarés de la España de Navarro y Gasol” 17/09/2017, El Pais
Image 80. Example of change over time technique, “La edad de los campeones” 30/12/2018, El Pais
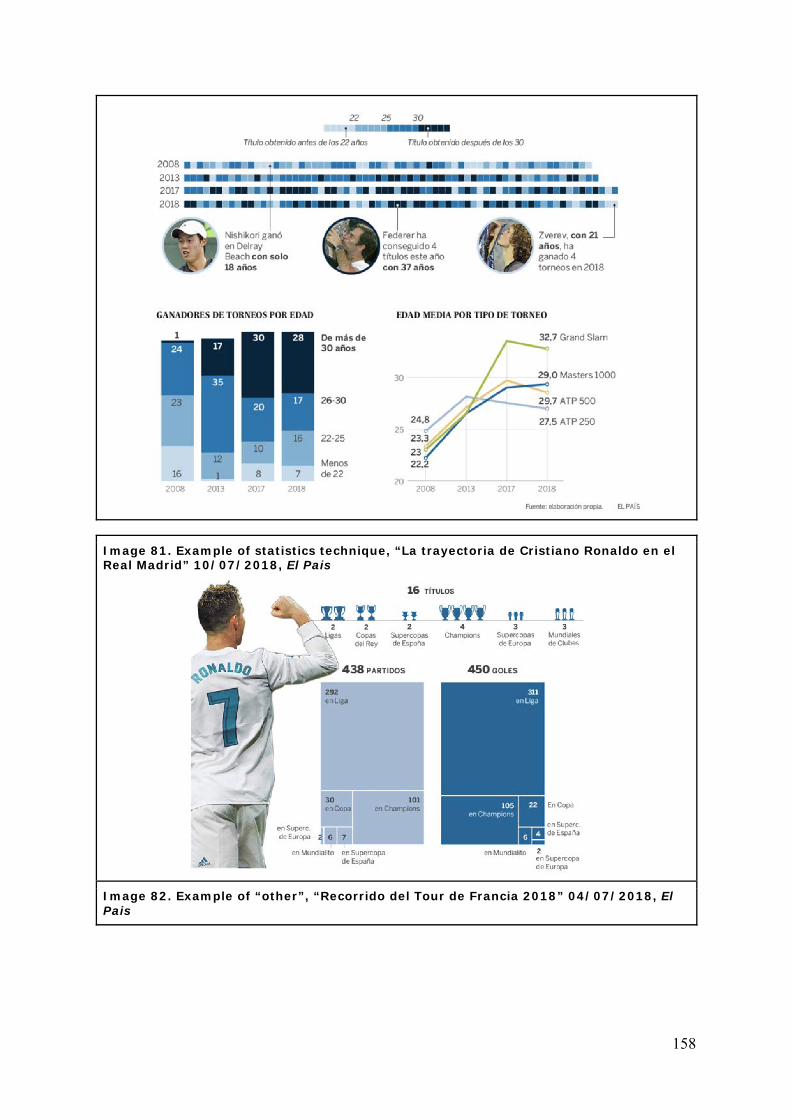
158
Image 81. Example of statistics technique, “La trayectoria de Cristiano Ronaldo en el Real Madrid” 10/07/2018, El Pais
Image 82. Example of “other”, “Recorrido del Tour de Francia 2018” 04/07/2018, El Pais
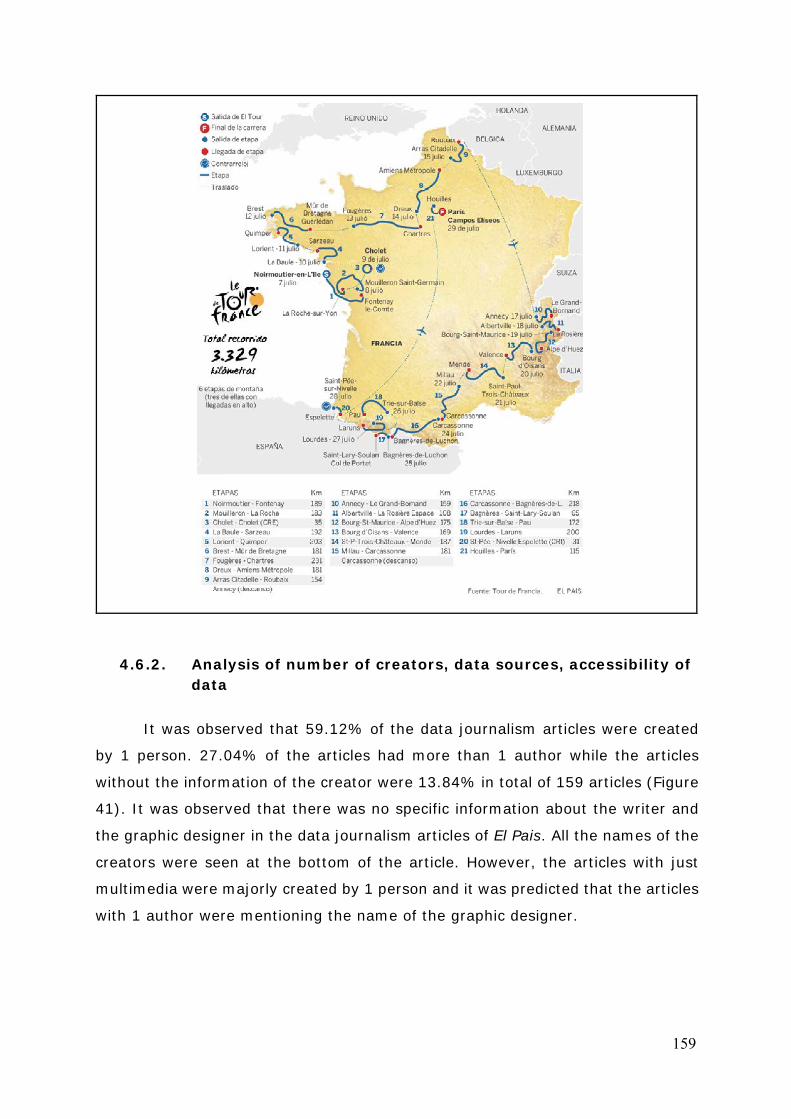
159
4.6.2. Analysis of number of creators, data sources, accessibility of data
It was observed that 59.12% of the data journalism articles were created
by 1 person. 27.04% of the articles had more than 1 author while the articles
without the information of the creator were 13.84% in total of 159 articles (Figure
41). It was observed that there was no specific information about the writer and
the graphic designer in the data journalism articles of El Pais. All the names of the
creators were seen at the bottom of the article. However, the articles with just
multimedia were majorly created by 1 person and it was predicted that the articles
with 1 author were mentioning the name of the graphic designer.
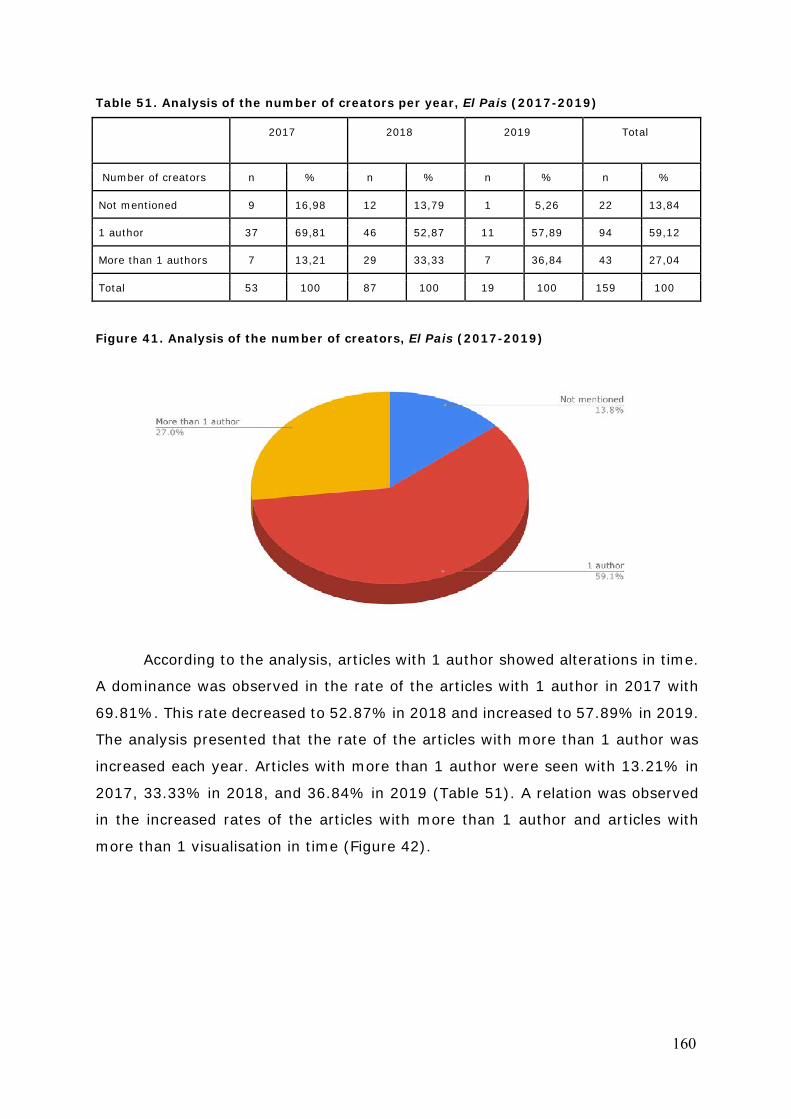
160
Table 51. Analysis of the number of creators per year, El Pais (2017-2019)
2017 2018 2019 Total
Number of creators n % n % n % n %
Not mentioned 9 16,98 12 13,79 1 5,26 22 13,84
1 author 37 69,81 46 52,87 11 57,89 94 59,12
More than 1 authors 7 13,21 29 33,33 7 36,84 43 27,04
Total 53 100 87 100 19 100 159 100
Figure 41. Analysis of the number of creators, El Pais (2017-2019)
According to the analysis, articles with 1 author showed alterations in time.
A dominance was observed in the rate of the articles with 1 author in 2017 with
69.81%. This rate decreased to 52.87% in 2018 and increased to 57.89% in 2019.
The analysis presented that the rate of the articles with more than 1 author was
increased each year. Articles with more than 1 author were seen with 13.21% in
2017, 33.33% in 2018, and 36.84% in 2019 (Table 51). A relation was observed
in the increased rates of the articles with more than 1 author and articles with
more than 1 visualisation in time (Figure 42).
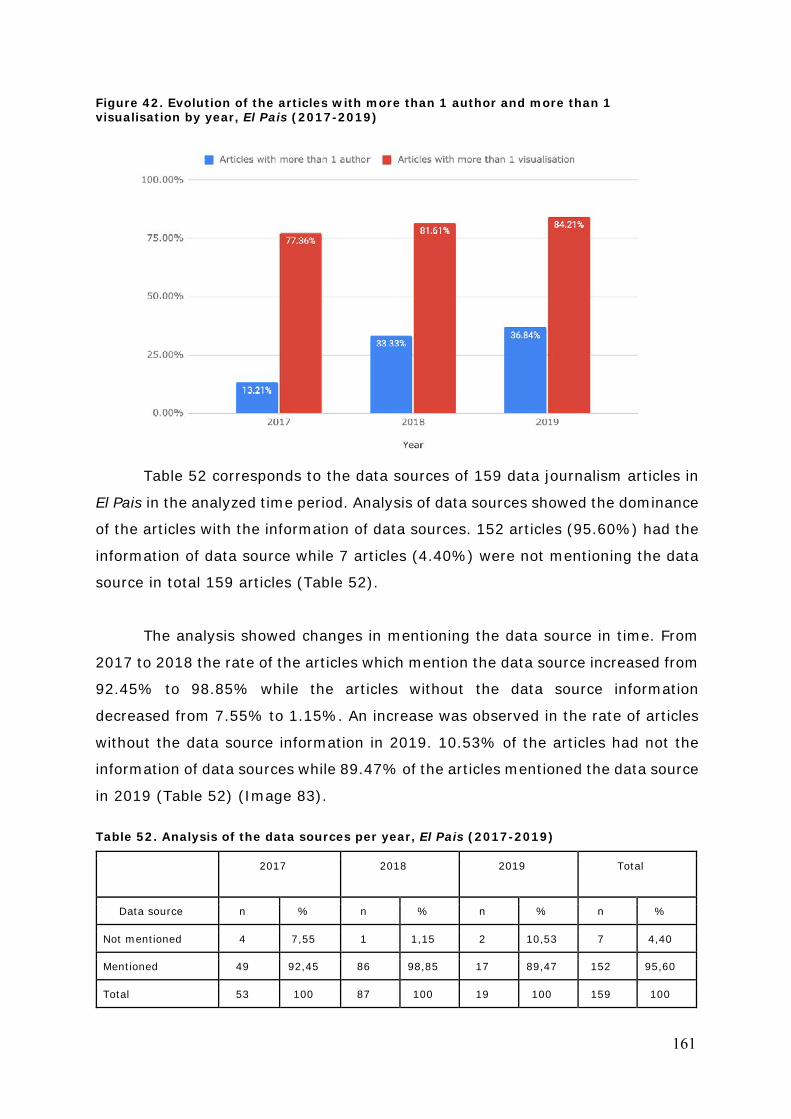
161
Figure 42. Evolution of the articles with more than 1 author and more than 1 visualisation by year, El Pais (2017-2019)
Table 52 corresponds to the data sources of 159 data journalism articles in
El Pais in the analyzed time period. Analysis of data sources showed the dominance
of the articles with the information of data sources. 152 articles (95.60%) had the
information of data source while 7 articles (4.40%) were not mentioning the data
source in total 159 articles (Table 52).
The analysis showed changes in mentioning the data source in time. From
2017 to 2018 the rate of the articles which mention the data source increased from
92.45% to 98.85% while the articles without the data source information
decreased from 7.55% to 1.15%. An increase was observed in the rate of articles
without the data source information in 2019. 10.53% of the articles had not the
information of data sources while 89.47% of the articles mentioned the data source
in 2019 (Table 52) (Image 83).
Table 52. Analysis of the data sources per year, El Pais (2017-2019)
2017 2018 2019 Total
Data source n % n % n % n %
Not mentioned 4 7,55 1 1,15 2 10,53 7 4,40
Mentioned 49 92,45 86 98,85 17 89,47 152 95,60
Total 53 100 87 100 19 100 159 100
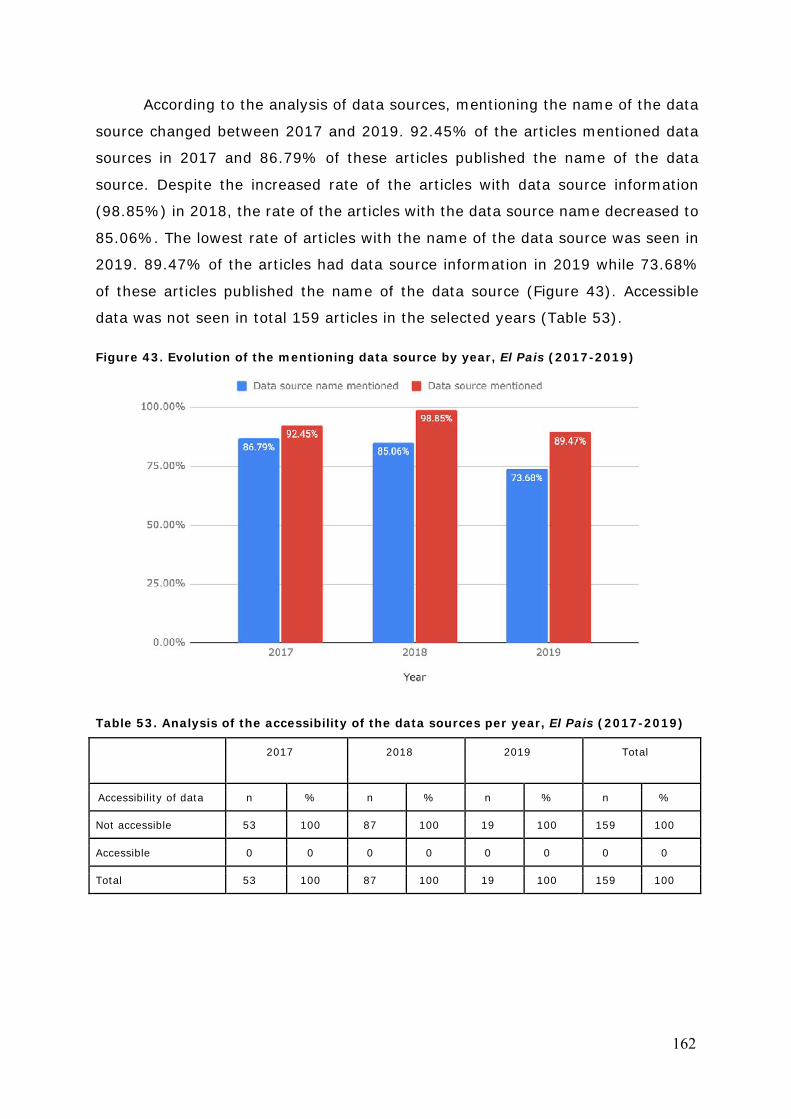
162
According to the analysis of data sources, mentioning the name of the data
source changed between 2017 and 2019. 92.45% of the articles mentioned data
sources in 2017 and 86.79% of these articles published the name of the data
source. Despite the increased rate of the articles with data source information
(98.85%) in 2018, the rate of the articles with the data source name decreased to
85.06%. The lowest rate of articles with the name of the data source was seen in
2019. 89.47% of the articles had data source information in 2019 while 73.68%
of these articles published the name of the data source (Figure 43). Accessible
data was not seen in total 159 articles in the selected years (Table 53). Figure 43. Evolution of the mentioning data source by year, El Pais (2017-2019)
Table 53. Analysis of the accessibility of the data sources per year, El Pais (2017-2019)
2017 2018 2019 Total
Accessibility of data n % n % n % n %
Not accessible 53 100 87 100 19 100 159 100
Accessible 0 0 0 0 0 0 0 0
Total 53 100 87 100 19 100 159 100
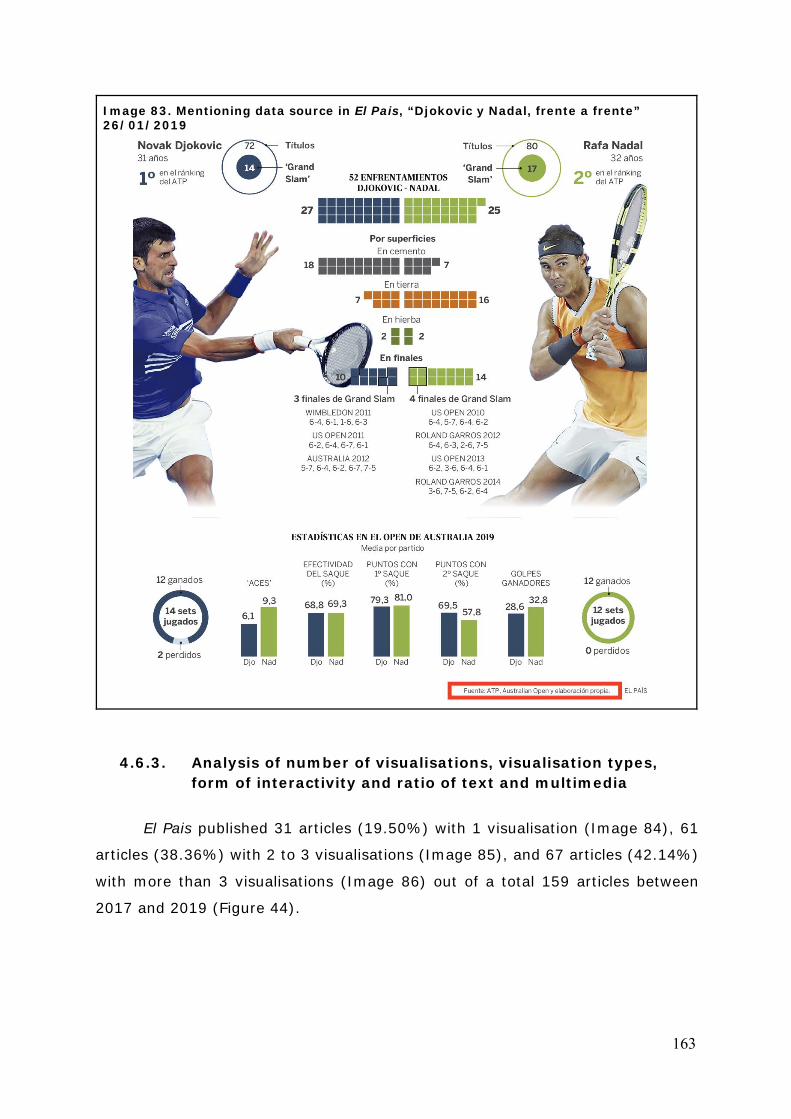
163
Image 83. Mentioning data source in El Pais, “Djokovic y Nadal, frente a frente” 26/01/2019
4.6.3. Analysis of number of visualisations, visualisation types, form of interactivity and ratio of text and multimedia
El Pais published 31 articles (19.50%) with 1 visualisation (Image 84), 61
articles (38.36%) with 2 to 3 visualisations (Image 85), and 67 articles (42.14%)
with more than 3 visualisations (Image 86) out of a total 159 articles between
2017 and 2019 (Figure 44).
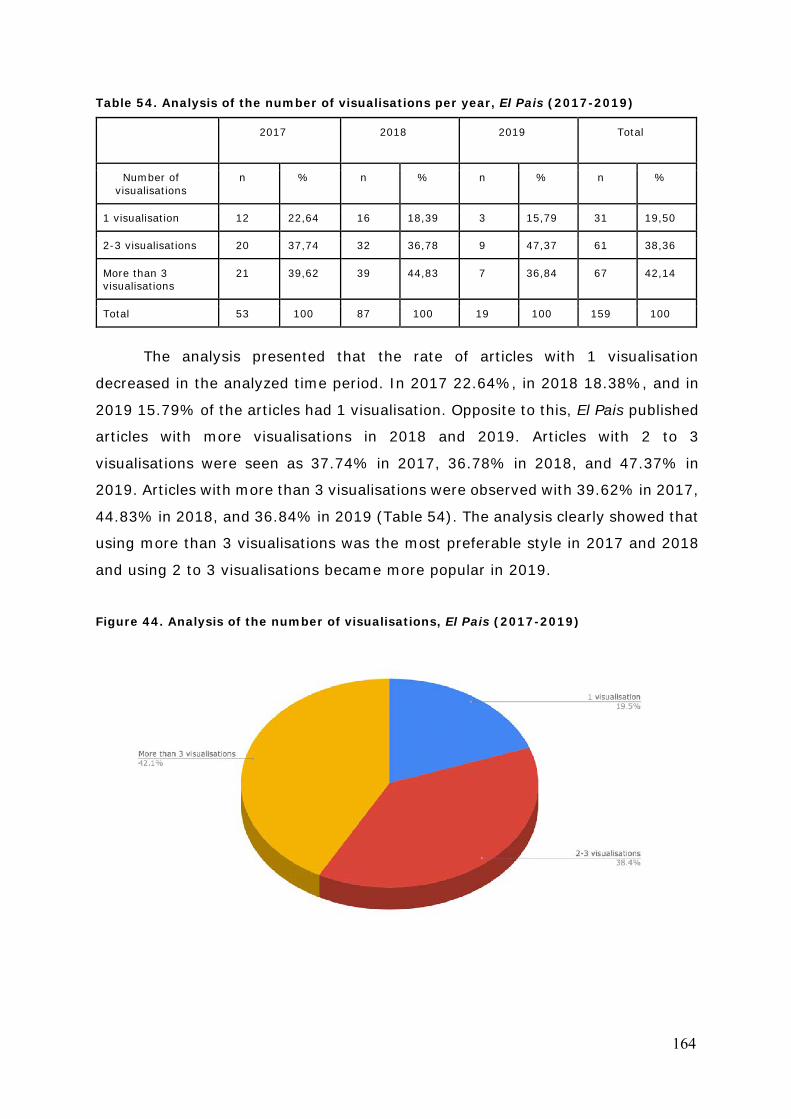
164
Table 54. Analysis of the number of visualisations per year, El Pais (2017-2019)
2017 2018 2019 Total
Number of visualisations
n % n % n % n %
1 visualisation 12 22,64 16 18,39 3 15,79 31 19,50
2-3 visualisations 20 37,74 32 36,78 9 47,37 61 38,36
More than 3 visualisations
21 39,62 39 44,83 7 36,84 67 42,14
Total 53 100 87 100 19 100 159 100
The analysis presented that the rate of articles with 1 visualisation
decreased in the analyzed time period. In 2017 22.64%, in 2018 18.38%, and in
2019 15.79% of the articles had 1 visualisation. Opposite to this, El Pais published
articles with more visualisations in 2018 and 2019. Articles with 2 to 3
visualisations were seen as 37.74% in 2017, 36.78% in 2018, and 47.37% in
2019. Articles with more than 3 visualisations were observed with 39.62% in 2017,
44.83% in 2018, and 36.84% in 2019 (Table 54). The analysis clearly showed that
using more than 3 visualisations was the most preferable style in 2017 and 2018
and using 2 to 3 visualisations became more popular in 2019.
Figure 44. Analysis of the number of visualisations, El Pais (2017-2019)
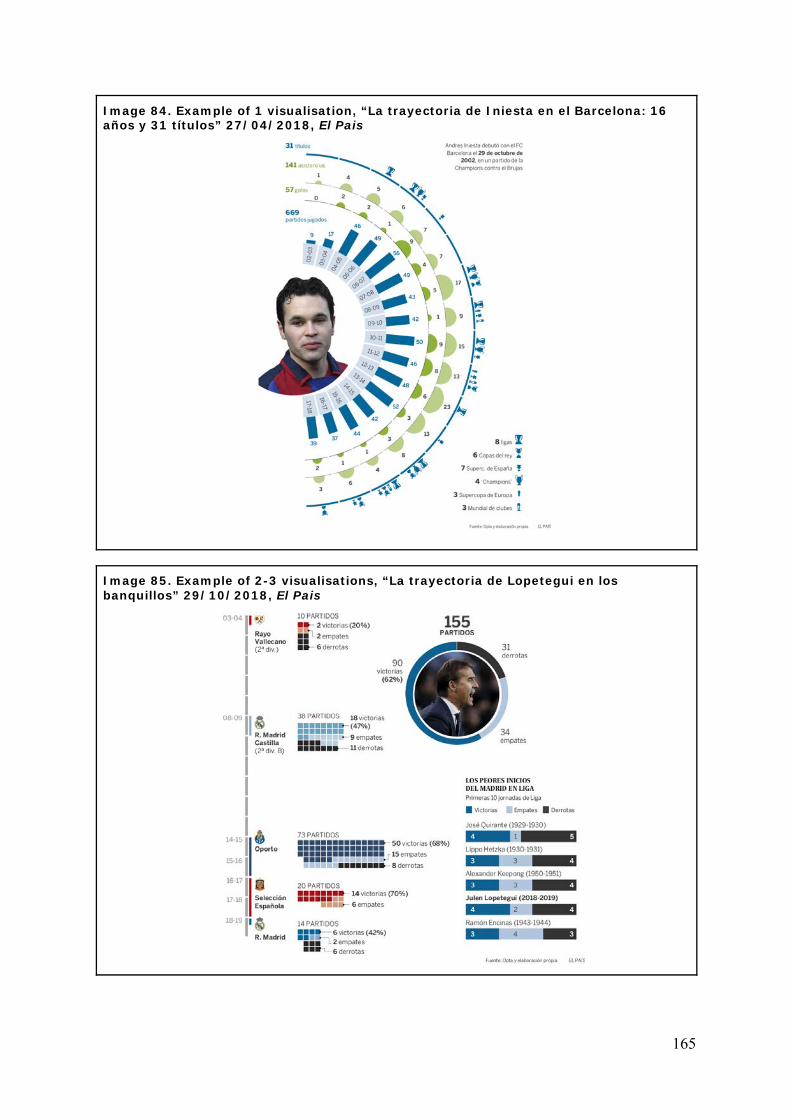
165
Image 84. Example of 1 visualisation, “La trayectoria de Iniesta en el Barcelona: 16 años y 31 títulos” 27/04/2018, El Pais
Image 85. Example of 2-3 visualisations, “La trayectoria de Lopetegui en los banquillos” 29/10/2018, El Pais
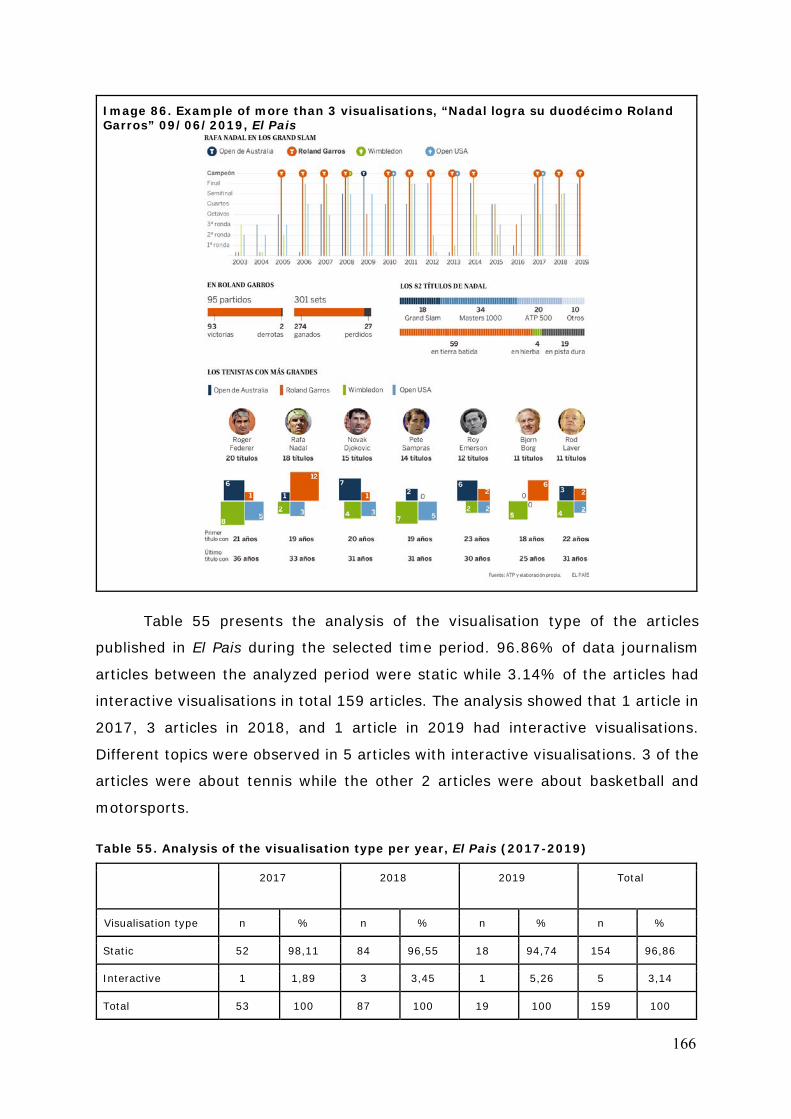
166
Image 86. Example of more than 3 visualisations, “Nadal logra su duodécimo Roland Garros” 09/06/2019, El Pais
Table 55 presents the analysis of the visualisation type of the articles
published in El Pais during the selected time period. 96.86% of data journalism
articles between the analyzed period were static while 3.14% of the articles had
interactive visualisations in total 159 articles. The analysis showed that 1 article in
2017, 3 articles in 2018, and 1 article in 2019 had interactive visualisations.
Different topics were observed in 5 articles with interactive visualisations. 3 of the
articles were about tennis while the other 2 articles were about basketball and
motorsports.
Table 55. Analysis of the visualisation type per year, El Pais (2017-2019)
2017 2018 2019 Total
Visualisation type n % n % n % n %
Static 52 98,11 84 96,55 18 94,74 154 96,86
Interactive 1 1,89 3 3,45 1 5,26 5 3,14
Total 53 100 87 100 19 100 159 100
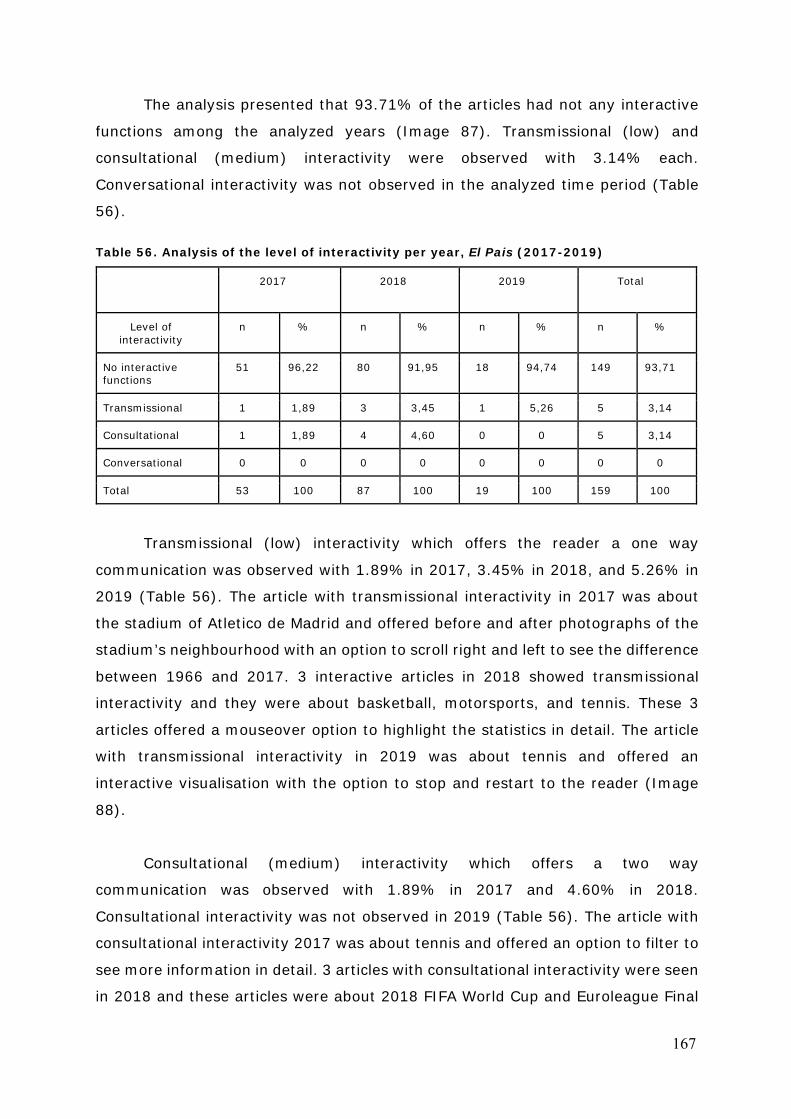
167
The analysis presented that 93.71% of the articles had not any interactive
functions among the analyzed years (Image 87). Transmissional (low) and
consultational (medium) interactivity were observed with 3.14% each.
Conversational interactivity was not observed in the analyzed time period (Table
56).
Table 56. Analysis of the level of interactivity per year, El Pais (2017-2019)
2017 2018 2019 Total
Level of interactivity
n % n % n % n %
No interactive functions
51 96,22 80 91,95 18 94,74 149 93,71
Transmissional 1 1,89 3 3,45 1 5,26 5 3,14
Consultational 1 1,89 4 4,60 0 0 5 3,14
Conversational 0 0 0 0 0 0 0 0
Total 53 100 87 100 19 100 159 100
Transmissional (low) interactivity which offers the reader a one way
communication was observed with 1.89% in 2017, 3.45% in 2018, and 5.26% in
2019 (Table 56). The article with transmissional interactivity in 2017 was about
the stadium of Atletico de Madrid and offered before and after photographs of the
stadium’s neighbourhood with an option to scroll right and left to see the difference
between 1966 and 2017. 3 interactive articles in 2018 showed transmissional
interactivity and they were about basketball, motorsports, and tennis. These 3
articles offered a mouseover option to highlight the statistics in detail. The article
with transmissional interactivity in 2019 was about tennis and offered an
interactive visualisation with the option to stop and restart to the reader (Image
88).
Consultational (medium) interactivity which offers a two way
communication was observed with 1.89% in 2017 and 4.60% in 2018.
Consultational interactivity was not observed in 2019 (Table 56). The article with
consultational interactivity 2017 was about tennis and offered an option to filter to
see more information in detail. 3 articles with consultational interactivity were seen
in 2018 and these articles were about 2018 FIFA World Cup and Euroleague Final
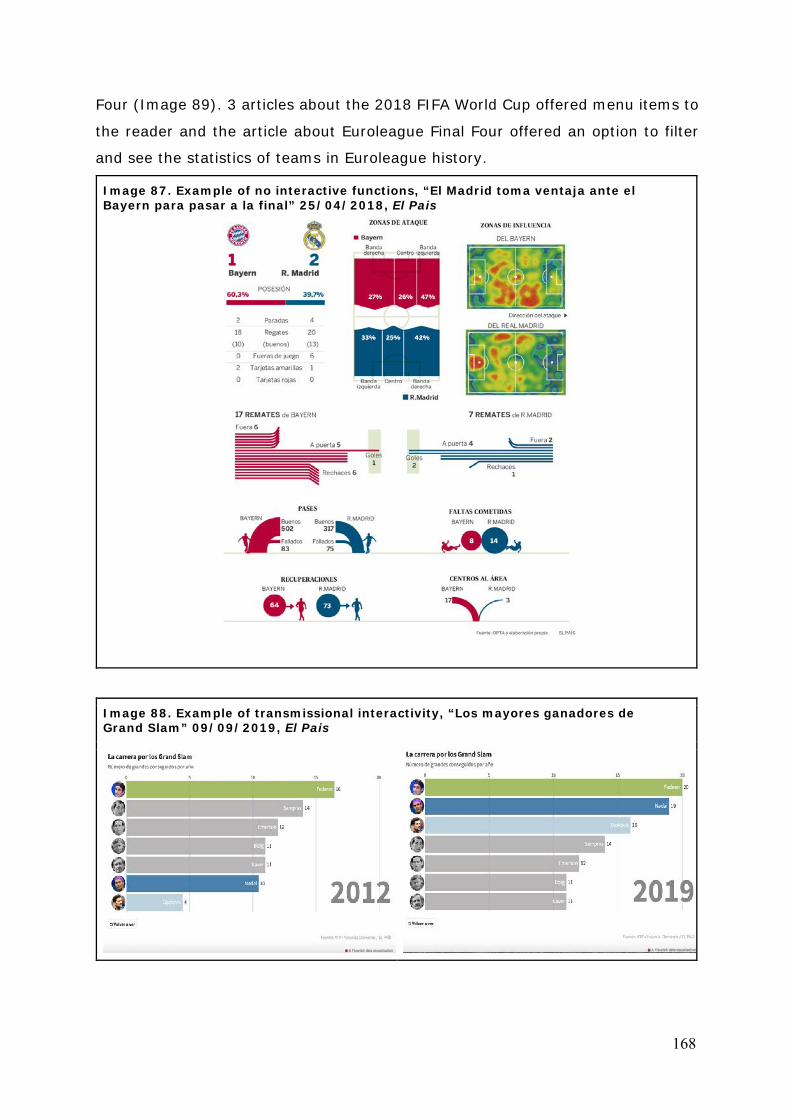
168
Four (Image 89). 3 articles about the 2018 FIFA World Cup offered menu items to
the reader and the article about Euroleague Final Four offered an option to filter
and see the statistics of teams in Euroleague history.
Image 87. Example of no interactive functions, “El Madrid toma ventaja ante el Bayern para pasar a la final” 25/04/2018, El Pais
Image 88. Example of transmissional interactivity, “Los mayores ganadores de Grand Slam” 09/09/2019, El Pais
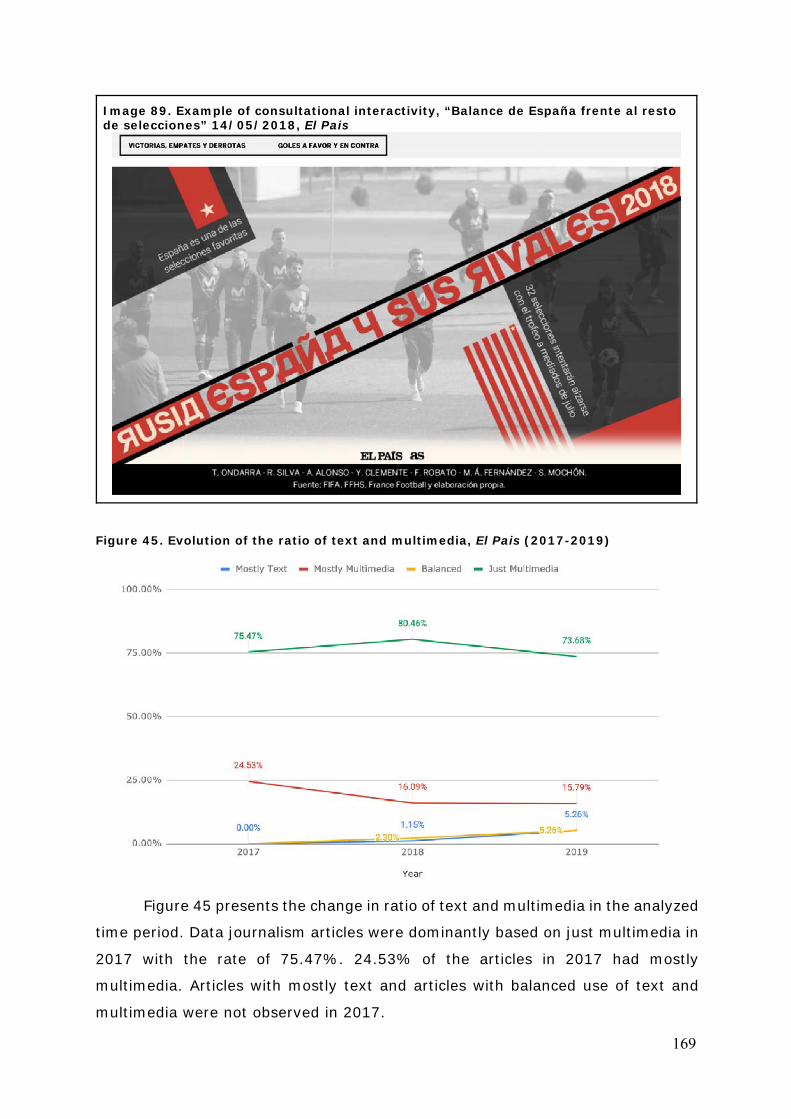
169
Image 89. Example of consultational interactivity, “Balance de España frente al resto de selecciones” 14/05/2018, El Pais
Figure 45. Evolution of the ratio of text and multimedia, El Pais (2017-2019)
Figure 45 presents the change in ratio of text and multimedia in the analyzed
time period. Data journalism articles were dominantly based on just multimedia in
2017 with the rate of 75.47%. 24.53% of the articles in 2017 had mostly
multimedia. Articles with mostly text and articles with balanced use of text and
multimedia were not observed in 2017.
170
Articles with just multimedia showed an increase to 80.46% in 2018. The
articles with mostly multimedia decreased to 16.09% and articles with mostly text
and balanced use of text and multimedia were observed at low rates. Articles with
balanced use of text and multimedia were observed with 2.30% and articles with
mostly text were observed with 1.15% (Figure 45).
Articles with just multimedia were dominant again in 2019 with 73.68%.
However, increased rates were observed in articles with mostly text and articles
with balanced use of text and multimedia with 5.26% each. Articles with mostly
multimedia were observed with 15.79% (Figure 45).
Conclusion
The analysis presented that El Pais published data journalism articles mostly
about football but tennis articles were on a sharp rise in the selected years. Articles
were mostly based on comparison, photo based explanations, and listings and the
visualisations were majorly static. Articles were majorly created by 1 author but a
relation was observed between the number of creators and number of
visualisations. In the analyzed time period El Pais increased the number of
visualisations and integrated more creators to the articles. This was predicted as
the reason for the decreased number of published articles.
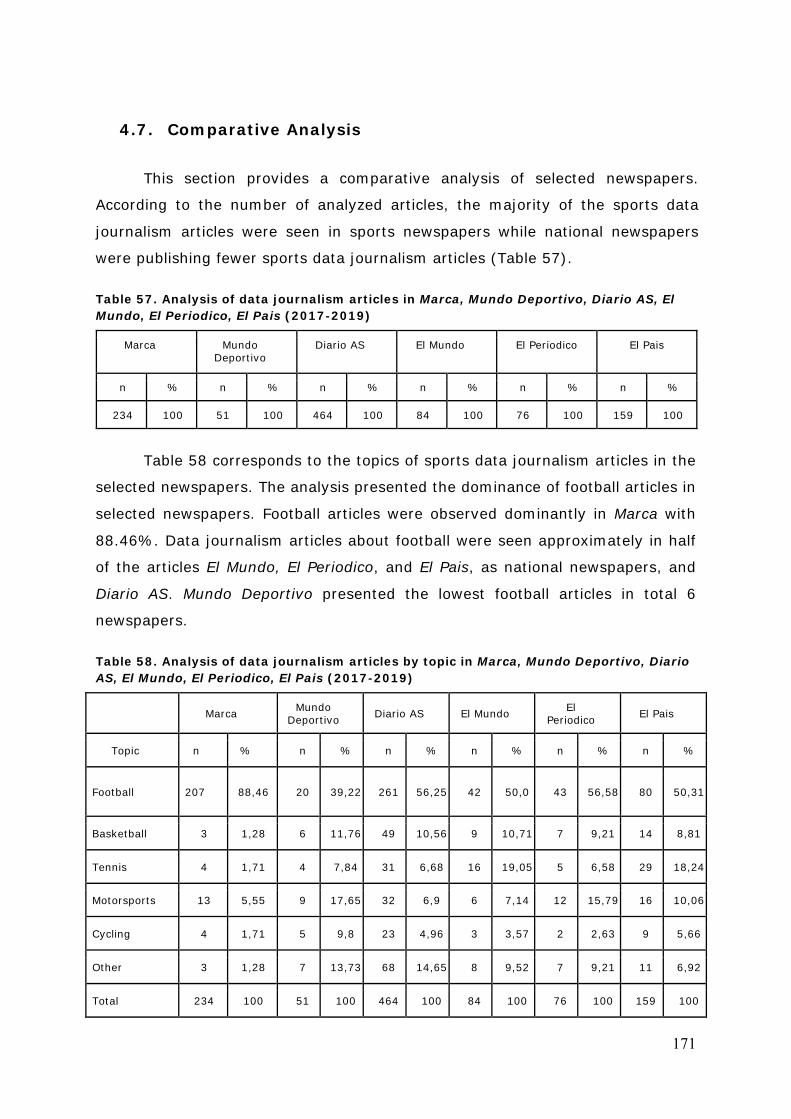
171
4.7. Comparative Analysis
This section provides a comparative analysis of selected newspapers.
According to the number of analyzed articles, the majority of the sports data
journalism articles were seen in sports newspapers while national newspapers
were publishing fewer sports data journalism articles (Table 57).
Table 57. Analysis of data journalism articles in Marca, Mundo Deportivo, Diario AS, El Mundo, El Periodico, El Pais (2017-2019)
Marca Mundo Deportivo
Diario AS El Mundo El Periodico El Pais
n % n % n % n % n % n %
234 100 51 100 464 100 84 100 76 100 159 100
Table 58 corresponds to the topics of sports data journalism articles in the
selected newspapers. The analysis presented the dominance of football articles in
selected newspapers. Football articles were observed dominantly in Marca with
88.46%. Data journalism articles about football were seen approximately in half
of the articles El Mundo, El Periodico, and El Pais, as national newspapers, and
Diario AS. Mundo Deportivo presented the lowest football articles in total 6
newspapers.
Table 58. Analysis of data journalism articles by topic in Marca, Mundo Deportivo, Diario AS, El Mundo, El Periodico, El Pais (2017-2019)
Marca Mundo Deportivo Diario AS El Mundo El
Periodico El Pais
Topic n % n % n % n % n % n %
Football 207 88,46 20 39,22 261 56,25 42 50,0 43 56,58 80 50,31
Basketball 3 1,28 6 11,76 49 10,56 9 10,71 7 9,21 14 8,81
Tennis 4 1,71 4 7,84 31 6,68 16 19,05 5 6,58 29 18,24
Motorsports 13 5,55 9 17,65 32 6,9 6 7,14 12 15,79 16 10,06
Cycling 4 1,71 5 9,8 23 4,96 3 3,57 2 2,63 9 5,66
Other 3 1,28 7 13,73 68 14,65 8 9,52 7 9,21 11 6,92
Total 234 100 51 100 464 100 84 100 76 100 159 100
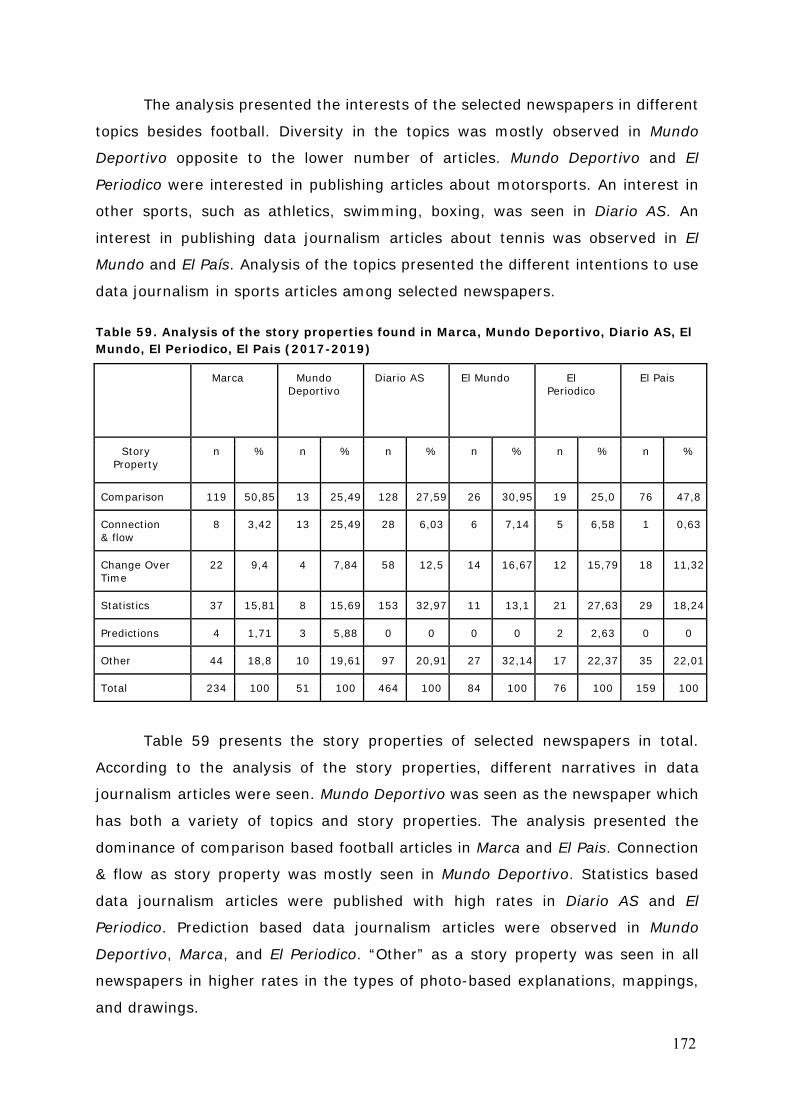
172
The analysis presented the interests of the selected newspapers in different
topics besides football. Diversity in the topics was mostly observed in Mundo
Deportivo opposite to the lower number of articles. Mundo Deportivo and El
Periodico were interested in publishing articles about motorsports. An interest in
other sports, such as athletics, swimming, boxing, was seen in Diario AS. An
interest in publishing data journalism articles about tennis was observed in El
Mundo and El País. Analysis of the topics presented the different intentions to use
data journalism in sports articles among selected newspapers.
Table 59. Analysis of the story properties found in Marca, Mundo Deportivo, Diario AS, El Mundo, El Periodico, El Pais (2017-2019)
Marca Mundo Deportivo
Diario AS El Mundo El Periodico
El Pais
Story Property
n % n % n % n % n % n %
Comparison 119 50,85 13 25,49 128 27,59 26 30,95 19 25,0 76 47,8
Connection & flow
8 3,42 13 25,49 28 6,03 6 7,14 5 6,58 1 0,63
Change Over Time
22 9,4 4 7,84 58 12,5 14 16,67 12 15,79 18 11,32
Statistics 37 15,81 8 15,69 153 32,97 11 13,1 21 27,63 29 18,24
Predictions 4 1,71 3 5,88 0 0 0 0 2 2,63 0 0
Other 44 18,8 10 19,61 97 20,91 27 32,14 17 22,37 35 22,01
Total 234 100 51 100 464 100 84 100 76 100 159 100
Table 59 presents the story properties of selected newspapers in total.
According to the analysis of the story properties, different narratives in data
journalism articles were seen. Mundo Deportivo was seen as the newspaper which
has both a variety of topics and story properties. The analysis presented the
dominance of comparison based football articles in Marca and El Pais. Connection
& flow as story property was mostly seen in Mundo Deportivo. Statistics based
data journalism articles were published with high rates in Diario AS and El
Periodico. Prediction based data journalism articles were observed in Mundo
Deportivo, Marca, and El Periodico. “Other” as a story property was seen in all
newspapers in higher rates in the types of photo-based explanations, mappings,
and drawings.
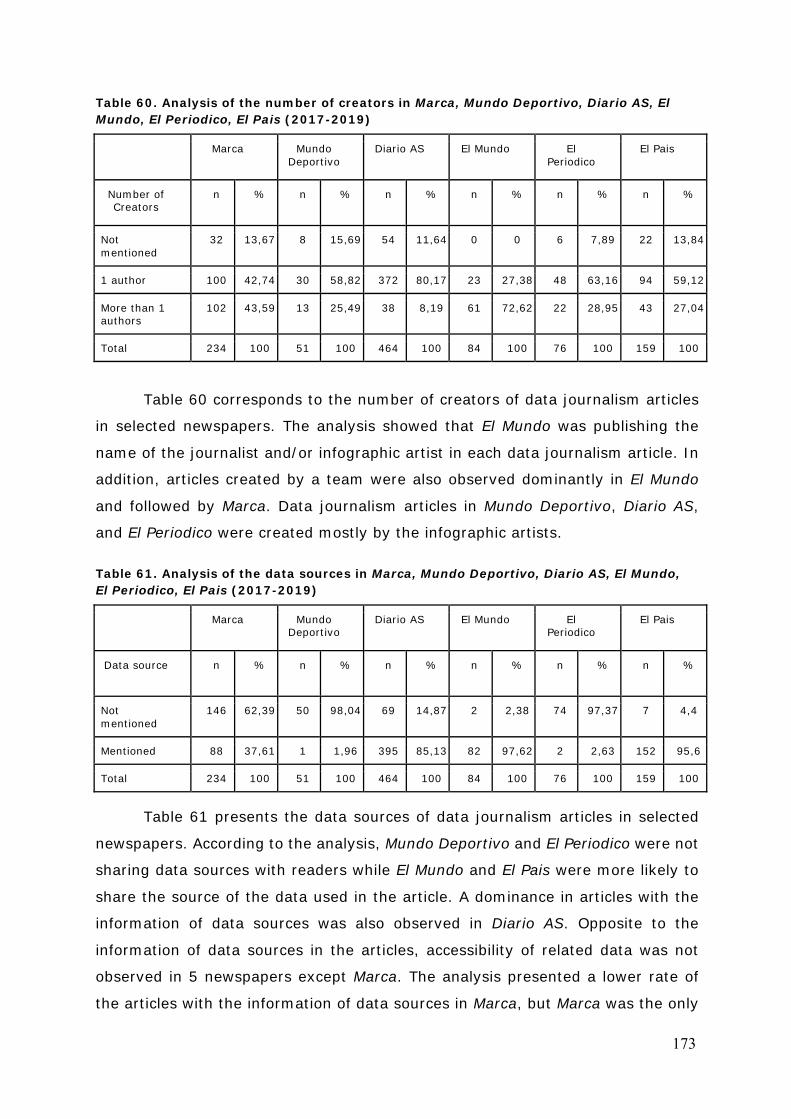
173
Table 60. Analysis of the number of creators in Marca, Mundo Deportivo, Diario AS, El Mundo, El Periodico, El Pais (2017-2019)
Marca Mundo Deportivo
Diario AS El Mundo El Periodico
El Pais
Number of Creators
n % n % n % n % n % n %
Not mentioned
32 13,67 8 15,69 54 11,64 0 0 6 7,89 22 13,84
1 author 100 42,74 30 58,82 372 80,17 23 27,38 48 63,16 94 59,12
More than 1 authors
102 43,59 13 25,49 38 8,19 61 72,62 22 28,95 43 27,04
Total 234 100 51 100 464 100 84 100 76 100 159 100
Table 60 corresponds to the number of creators of data journalism articles
in selected newspapers. The analysis showed that El Mundo was publishing the
name of the journalist and/or infographic artist in each data journalism article. In
addition, articles created by a team were also observed dominantly in El Mundo
and followed by Marca. Data journalism articles in Mundo Deportivo, Diario AS,
and El Periodico were created mostly by the infographic artists.
Table 61. Analysis of the data sources in Marca, Mundo Deportivo, Diario AS, El Mundo, El Periodico, El Pais (2017-2019)
Marca Mundo Deportivo
Diario AS El Mundo El Periodico
El Pais
Data source n % n % n % n % n % n %
Not mentioned
146 62,39 50 98,04 69 14,87 2 2,38 74 97,37 7 4,4
Mentioned 88 37,61 1 1,96 395 85,13 82 97,62 2 2,63 152 95,6
Total 234 100 51 100 464 100 84 100 76 100 159 100
Table 61 presents the data sources of data journalism articles in selected
newspapers. According to the analysis, Mundo Deportivo and El Periodico were not
sharing data sources with readers while El Mundo and El Pais were more likely to
share the source of the data used in the article. A dominance in articles with the
information of data sources was also observed in Diario AS. Opposite to the
information of data sources in the articles, accessibility of related data was not
observed in 5 newspapers except Marca. The analysis presented a lower rate of
the articles with the information of data sources in Marca, but Marca was the only
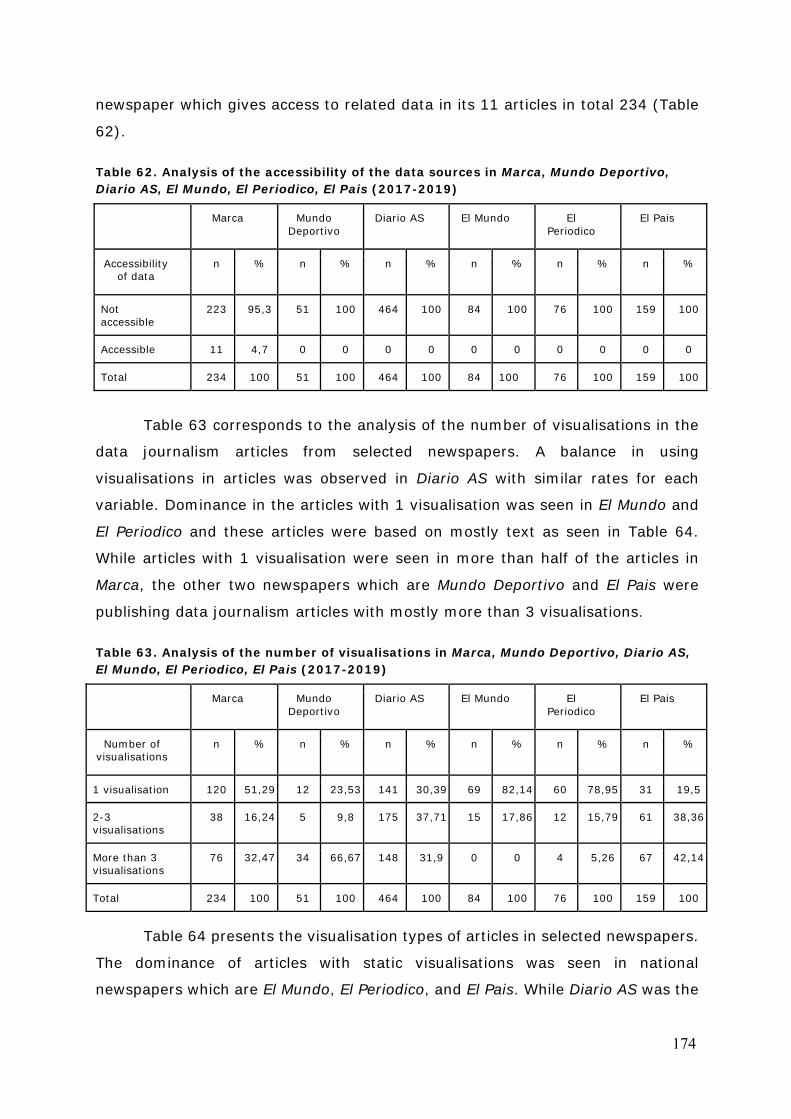
174
newspaper which gives access to related data in its 11 articles in total 234 (Table
62).
Table 62. Analysis of the accessibility of the data sources in Marca, Mundo Deportivo, Diario AS, El Mundo, El Periodico, El Pais (2017-2019)
Marca Mundo Deportivo
Diario AS El Mundo El Periodico
El Pais
Accessibility of data
n % n % n % n % n % n %
Not accessible
223 95,3 51 100 464 100 84 100 76 100 159 100
Accessible 11 4,7 0 0 0 0 0 0 0 0 0 0
Total 234 100 51 100 464 100 84 100 76 100 159 100
Table 63 corresponds to the analysis of the number of visualisations in the
data journalism articles from selected newspapers. A balance in using
visualisations in articles was observed in Diario AS with similar rates for each
variable. Dominance in the articles with 1 visualisation was seen in El Mundo and
El Periodico and these articles were based on mostly text as seen in Table 64.
While articles with 1 visualisation were seen in more than half of the articles in
Marca, the other two newspapers which are Mundo Deportivo and El Pais were
publishing data journalism articles with mostly more than 3 visualisations.
Table 63. Analysis of the number of visualisations in Marca, Mundo Deportivo, Diario AS, El Mundo, El Periodico, El Pais (2017-2019)
Marca Mundo Deportivo
Diario AS El Mundo El Periodico
El Pais
Number of visualisations
n % n % n % n % n % n %
1 visualisation 120 51,29 12 23,53 141 30,39 69 82,14 60 78,95 31 19,5
2-3 visualisations
38 16,24 5 9,8 175 37,71 15 17,86 12 15,79 61 38,36
More than 3 visualisations
76 32,47 34 66,67 148 31,9 0 0 4 5,26 67 42,14
Total 234 100 51 100 464 100 84 100 76 100 159 100
Table 64 presents the visualisation types of articles in selected newspapers.
The dominance of articles with static visualisations was seen in national
newspapers which are El Mundo, El Periodico, and El Pais. While Diario AS was the
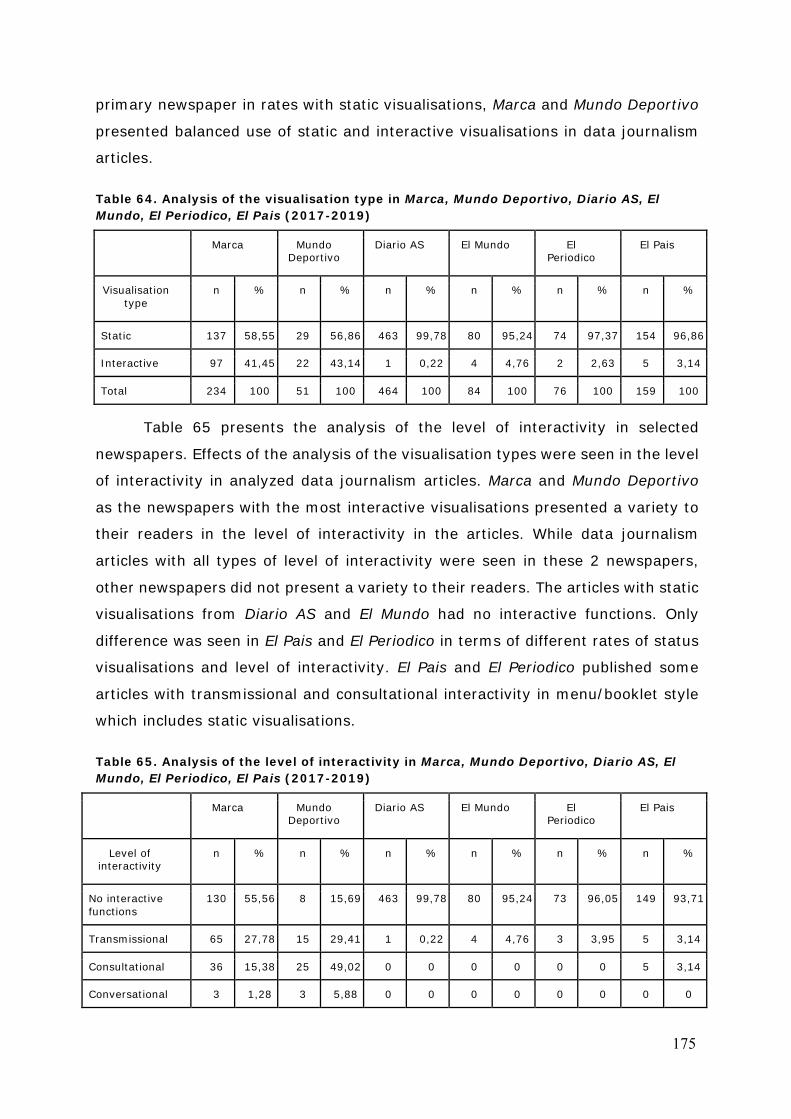
175
primary newspaper in rates with static visualisations, Marca and Mundo Deportivo
presented balanced use of static and interactive visualisations in data journalism
articles.
Table 64. Analysis of the visualisation type in Marca, Mundo Deportivo, Diario AS, El Mundo, El Periodico, El Pais (2017-2019)
Marca Mundo Deportivo
Diario AS El Mundo El Periodico
El Pais
Visualisation type
n % n % n % n % n % n %
Static 137 58,55 29 56,86 463 99,78 80 95,24 74 97,37 154 96,86
Interactive 97 41,45 22 43,14 1 0,22 4 4,76 2 2,63 5 3,14
Total 234 100 51 100 464 100 84 100 76 100 159 100
Table 65 presents the analysis of the level of interactivity in selected
newspapers. Effects of the analysis of the visualisation types were seen in the level
of interactivity in analyzed data journalism articles. Marca and Mundo Deportivo
as the newspapers with the most interactive visualisations presented a variety to
their readers in the level of interactivity in the articles. While data journalism
articles with all types of level of interactivity were seen in these 2 newspapers,
other newspapers did not present a variety to their readers. The articles with static
visualisations from Diario AS and El Mundo had no interactive functions. Only
difference was seen in El Pais and El Periodico in terms of different rates of status
visualisations and level of interactivity. El Pais and El Periodico published some
articles with transmissional and consultational interactivity in menu/booklet style
which includes static visualisations.
Table 65. Analysis of the level of interactivity in Marca, Mundo Deportivo, Diario AS, El Mundo, El Periodico, El Pais (2017-2019)
Marca Mundo Deportivo
Diario AS El Mundo El Periodico
El Pais
Level of interactivity
n % n % n % n % n % n %
No interactive functions
130 55,56 8 15,69 463 99,78 80 95,24 73 96,05 149 93,71
Transmissional 65 27,78 15 29,41 1 0,22 4 4,76 3 3,95 5 3,14
Consultational 36 15,38 25 49,02 0 0 0 0 0 0 5 3,14
Conversational 3 1,28 3 5,88 0 0 0 0 0 0 0 0
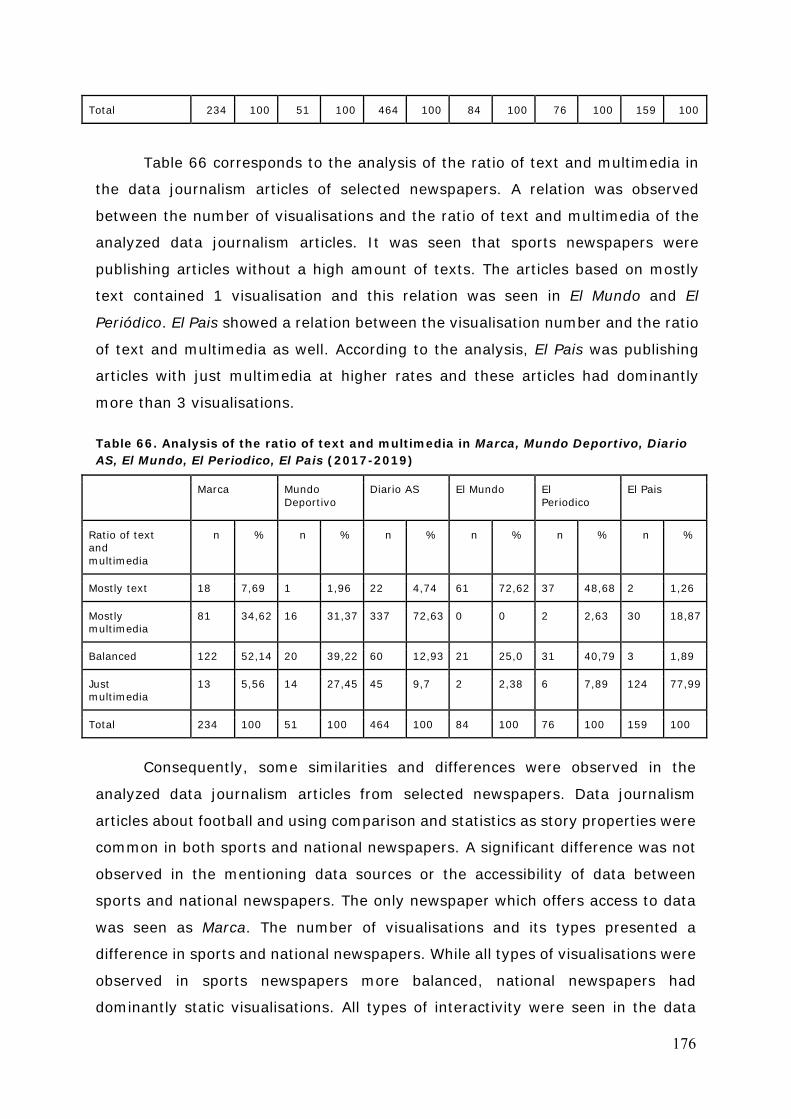
176
Total 234 100 51 100 464 100 84 100 76 100 159 100
Table 66 corresponds to the analysis of the ratio of text and multimedia in
the data journalism articles of selected newspapers. A relation was observed
between the number of visualisations and the ratio of text and multimedia of the
analyzed data journalism articles. It was seen that sports newspapers were
publishing articles without a high amount of texts. The articles based on mostly
text contained 1 visualisation and this relation was seen in El Mundo and El
Periódico. El Pais showed a relation between the visualisation number and the ratio
of text and multimedia as well. According to the analysis, El Pais was publishing
articles with just multimedia at higher rates and these articles had dominantly
more than 3 visualisations.
Table 66. Analysis of the ratio of text and multimedia in Marca, Mundo Deportivo, Diario AS, El Mundo, El Periodico, El Pais (2017-2019)
Marca Mundo Deportivo
Diario AS El Mundo El Periodico
El Pais
Ratio of text and multimedia
n % n % n % n % n % n %
Mostly text 18 7,69 1 1,96 22 4,74 61 72,62 37 48,68 2 1,26
Mostly multimedia
81 34,62 16 31,37 337 72,63 0 0 2 2,63 30 18,87
Balanced 122 52,14 20 39,22 60 12,93 21 25,0 31 40,79 3 1,89
Just multimedia
13 5,56 14 27,45 45 9,7 2 2,38 6 7,89 124 77,99
Total 234 100 51 100 464 100 84 100 76 100 159 100
Consequently, some similarities and differences were observed in the
analyzed data journalism articles from selected newspapers. Data journalism
articles about football and using comparison and statistics as story properties were
common in both sports and national newspapers. A significant difference was not
observed in the mentioning data sources or the accessibility of data between
sports and national newspapers. The only newspaper which offers access to data
was seen as Marca. The number of visualisations and its types presented a
difference in sports and national newspapers. While all types of visualisations were
observed in sports newspapers more balanced, national newspapers had
dominantly static visualisations. All types of interactivity were seen in the data

177
journalism articles of selected sports newspapers while conversational interactivity
was not observed in national newspapers. The ratio of text and multimedia of
analyzed articles also showed an alteration in sports and national newspapers.
Data journalism articles with balanced use of text and multimedia, and mostly
multimedia were chosen more in sports newspapers while national newspapers
were publishing data journalism articles with mostly text and just multimedia.
178
SECTION III: QUALITATIVE ANALYSIS
179
5. Qualitative Analysis of Marca, Mundo Deportivo, Diario AS, El Mundo, El Pais, El Confidencial
In this chapter, data journalism in Spain was discussed with 15 interviewees
from Marca, Mundo Deportivo, Diario AS, El Mundo, El País, and El Confidencial.
Interviewees answered 37 questions in 6 themes as; the production process in
Spanish newspapers, access to data in Spanish data journalism, being data
journalist in Spain, current environment in Spanish newspapers after integrating
data journalism, reader engagement in data journalism, and the future of data
journalism in Spain. In the first section, decision-making and workflow in the
newsrooms, tools and guidelines in sports data journalism, challenges in the
production of sports data journalism, characteristics of a good sports data article,
advantages and disadvantages of creating sports data journalism articles were
discussed with interviewees to understand the basics of data journalism in Spain
and highlighted the newsrooms differences, especially the difference between
sports and national newspapers.
In the second section, access to data in Spain was discussed with
interviewees with the subtopics including data sources of Spanish newspapers,
challenges in working with data in Spain, difference between the data access in
national and international events, and transparency of information in Spain to
draw conclusions about the current state of open data in Spain and external effects
on Spanish data journalism.
In the third section, questions about being a data journalist in Spain were
asked to interviewees and discussed about investment in data journalism in
Spanish newspapers and expected skills from data journalists in Spanish
newsrooms. The third section drew conclusions about the internal effects on
Spanish data journalism and presented the different needs in Spanish newsrooms.
In the fourth section, the current environment in Spanish newspapers after
integrating data journalism was discussed with interviewees and the working
conditions of journalists, current needs in the newsrooms, economic motivations
in data journalism were explained. Statements of interviewees presented the
180
different levels in Spanish newspapers in terms of integrating data journalism
better.
In the fifth section, reader engagement in data journalism was discussed
and the different levels of engagement in traditional articles and data articles were
highlighted. Interviewees shed light on the strategies to keep the interest of
readers with data journalism. In the sixth section, interviewees’ opinions on data
journalism and its future in Spain were discussed and both positive and negative
opinions were presented by interviewees.
5.1. Production Process in Spanish Newspapers
In this section, decision-making and workflow in the newsrooms, tools and
guidelines in sports data journalism, challenges in the production of sports data
journalism, characteristics of a good sports data article, advantages and
disadvantages of creating sports data journalism articles were discussed with
interviewees. Interviewees explained the workflows of the newsrooms, their
creative processes for data journalism articles, and the challenges they faced
during the creative process. These explanations were followed by the desired
aspects of data journalism articles and the level they were trying to reach. Lastly,
interviewees explained both negative and positive sides of sports data journalism
based on their experiences.
5.1.1. Decision-making and Workflow in the Newsrooms
Interviewees noted that the decision-making process was double-sided and
there are no strict rules. The decision-making process has been evaluated under
two headings as visualisation requests by journalists for their articles and article
proposals by infographic designers who already have data that tells a story. Jesus
Escudero, a data journalist, mentioned that El Confidencial Data Unit was working
in collaboration with sections and was making visualisation mostly based on
journalists’ requests. Escudero pointed to a difference in the decision-making
process for daily projects as, “For daily projects, we do all the visualisation and
181
create the daily news report in the data unit. So it’s more an informal decision”.57
He also explained the process when data unit has an idea for a data journalism
article:
When we have an idea and data, we present this idea to the reporting section
of the related topic. If they’re okay with the idea we start to work together.
Mainly we do the data part like combination, analysis, cleaning and visualising
and another colleague does the reporting part.
However, Dario Ojeda, a journalist from El Confidencial Sports Unit stated
that he was mostly choosing topics to work on himself to visualise and ask his
chief to publish the data based article. Tomas Alhambra who is an infographic
artist from Marca mentioned that they were working mainly in visualisation not
searching a story with these words:
In the infographic section we usually try to adapt a news story that comes to
us from an editor to view it correctly. So normally we are not the ones looking
for the information. But we can do it if we want to.
Ruben Gimeno who is also an infographic artist from Marca has shared the
same opinions with Alhambra but he stated the difference in the decision-making
process in breaking news. According to Gimeno’s statement, infographic artists
could take the responsibility to create a data based article and have it published
on the website as breaking news. Gimeno supported his statement with an
example:
Do you remember the terrorist attack in Paris? There was a match against
France and another national team. So, we (the infographic section) did the
localization of the place and we worked directly with the source we found on
the internet. So If it's breaking news, we need to find the information through
the journalist or documentation section to make visualisation.
Interviewees from AS, El Mundo, and Mundo Deportivo also have mentioned
the same double-sided decision-making process. A difference in the decision-
making process between sports and national newspapers was not observed
according to the statements of interviewees from 6 newspapers. Fernando Robato,
182
an infographic artist, mentioned the decision-making process in AS according to
priority and explained the priority as the visualisation requests which come from
reporters for data journalism articles. Ferran Morales from Mundo Deportivo
pointed to the same process in decision-making and mentioned that the
visualisation requests for data journalism articles mostly come from an editor and
added the percentage of editor-requested visualisation as 70% of the workload.
In addition to this, Morales also explained the articles which are suggested by
infographic section as:
We propose topics that may be of interest to the reader and we do larger
projects with more time. We start with looking for the data. Depending on the
topic, we go to the specialist editor in basketball, football or whoever to
complement our project. But it is a project of ours, we're independent. They
do not give us the data. We have data, we visualise it and an editor helps us
to explain it better in the text.
Paula Guisado, a data journalist from El Mundo, talked about the importance
of the news cycle and explained the process of preparing data journalism pieces
for hot topics. According to Guisado’s statements, the idea was coming from the
editor and data desk was searching data and proposing possible visualisations if it
fits to the topic. Marta Ley who is the colleague of Guisado, explained the data
journalism articles which created in the data desk as:
Sometimes you find some data that you think may be interesting. When you
analyze the data if you see an interesting topic you comment on it to the
related section.
Daniele Grasso, a data journalist from El Pais, mentioned a different
decision-making process than other interviewees. According to the statements of
Grasso, the starting point of a data journalism piece was generally the data,
sometimes a topic. Grasso also pointed that they’re not making visualisations in
some cases and explained the three ways of decision-making process in El Pais
as:
183
One point of view is, "this data set is super interesting, let's do something
with that". And the other point of view is "we can arrange an investigative
story with this dataset". Lastly "we are talking about this topic these days,
let's do something about it". So there are three types. And sometimes we
don't make an extra visualisation of data, if data tells a story without making
any visualisation. So we are not strict in this.
To sum up, different strategies were observed in the decision-making
process and the workflow of newspapers. Interviewees from El Confidencial,
Marca, AS, El Mundo, and Mundo Deportivo stated that the breaking news were
prepared inside the data/infographic department and data article requests for
investigative projects were coming from either the data/infographic department
or the reporting department to make a collaboration. A difference in the decision-
making process was observed in El Pais. Statement of Daniele Grasso presented
that the decision-making for a data journalism article was the duty of his team
and Visual Narratives section accordingly the dataset they have or a hot topic. It
was observed that data journalism articles were differentiated as data based, topic
based or reader interest based.
Interviewees mentioned that they were working independently for making
visualisations for a project unless it's a big project and also making collaborations
for projects was between different sections like data and reporting section or
infographic and data section. Miguel Angel Carbonero, an infographic artist,
mentioned that the infographics section of Marca take visualisation requests from
editors personally and if they need support for web development or data, they are
working as a team. Tomas Alhambra supported the statements of Carbonero in
terms of working independently and exemplified the workflow for big projects as:
We did one big project for cycling to commemorate the 80th anniversary of
the Vuelta Ciclista a España. So we made a huge file. We had previously
discussed it with an editor and then we distributed duties to ourselves in the
things we knew best. And then someone made the map part, another person
made a timeline etc. So that each one took a part and we were able to unify
everything at the end.
184
Differences in the workflow for daily coverages and big events have varied
at Mundo Deportivo too, as Ferran Morales, an infographic artist, mentioned.
According to his statement, the infographic section of Mundo Deportivo was
working in the same way as Marca, which was distributing the duties to colleagues
according to their interests, and talents and explained the distribution of tasks as:
Roger is very good at layout and web design, this is his potential. Vanesa is
good at illustration, and I have another thing, we work as a team, but each
one is in charge of one thing.
Roger Guillamet, an infographic artist, supported the statements of Morales
and exemplified the collaboration as:
Sometimes Ferran and I work together. He designs and I make the structure
the html or these kinds of things. For example, for the last World Cup we
made a project together about all the teams, star players. (...) We have the
programmers on floor 2 who also helped us. They helped us with programming
elements to make the interaction move from one page to another. The
programmers on floor 2 help us in these.
Daniele Grasso, a data journalist, explained the collaborations in El Pais as
inside the Visual Narratives Department which was a department includes data
unit and infographics section and pointed the reason of collaborations as the lack
of person in data unit which has only 3 people and added:
We use their (Visual Narratives Department) expertise and they use ours. For
example today we are publishing a story where we do most of the data work,
but then they produced a couple of graphics and wanted to add a couple of
graphics. (...) The easiest is to visualise. 80% of the time is analyzing the
data, understanding the story, finding a focus to a story, and so on. And then
20% of the time is the visualisation process.
Paula Guisado mentioned that they have more collaborations than in the
past in El Mundo because of the decreased number of people in the data section.
According to Guisado's statements, El Mundo data section had a bigger team
185
including web developer and graphic designer and the articles were being created
inside the department. However, more collaborations were made with the
infographic section in time because of the lack of web developers and graphic
designers in the data unit in recent times.
To sum up, interviewees mentioned that they were working independently
except big/investigative projects. For daily coverage, duties were assigned by their
chief and the tasks were distributed to the teams for big projects. Different
newsroom structures and sections were explained by interviewees. Data
journalism articles were created by different sections in each newspaper. Marca
had a wider team and was creating data journalism articles with 3 departments
as reporting section, data section, and infographics section. The data was coming
from the data section, visualised by the infographics section, and the reporting
section was writing the story. Mundo Deportivo and Diario AS had no specific data
sections. Creation process of data journalism articles were made by reporting and
infographics sections. Infographics sections’ main duty was the visualisation
process while reporting sections were bringing the story and the data together. A
similar newsroom structure was seen in the national newspapers. El Mundo, El
Confidencial, and El Pais had reporting and data sections and the data sections
were making visualisations. However, in the national newspapers, most of the
data journalism articles were created by the data section with all stages.
Interviewees explained the difference workflow in the regular coverages
and big events or investigative stories in detail and pointed to the importance of
daily news or breaking news. According to interviewees statements, preparation
for the projects for international events or investigative stories were starting
around 3 to 6 months before, because of the occupied daily schedule in the
newsrooms. Paula Guisado mentioned that the preparation for the big events
starts before the tournament with working on the data of historical plays, principle
players etc. Daniele Grasso exemplified the workflow for the UEFA Euro 2020 as:
We started preparing things now, and the tournament is in this summer. So
we prepared a special site, where data is just a part of this. There were more
people involved in this in time. We'll try to experiment a bit more because it’s
more difficult to experiment with things in a short time.

186
Fernando Robato mentioned that AS will start to work for UEFA Euro 2020
before 4 to 6 months and generally AS was starting to work for Olympic Games 8
months before the event. Opposite to this, Ferran Morales stated that data
journalism projects for Olympics were more easy than others because the
Olympics are repeated events and they have a background content from previous
games and this makes the process easier. Roger Guillamet mentioned the
workflow for big events and investigative projects in Mundo Deportivo as:
We have a daily job and we have a few hours to make graphics for the paper
and for the web. We make graphics for these. When we finish the paper and
the web, we have two hours left and these two hours we can work for another
project for the future. We need to start 4 to 5 months before. We have this
kind of template.
However, interviewees pointed to the lack of time for daily tasks, important
games, and international tournaments. Carlos Forjanes from AS explained the
difference between the workflow of Champions League and La Liga and pointed to
the workflow for the weeks with important games from both leagues as:
Real Madrid won the Champions League three years in a row. So I can tell you
that April to May is insane. It's insane for us, because we need to have full
coverage on wednesdays, saturdays and sundays. We need to work really
hard. (...) These competitions bring us so much work, because at the same
time we need to work on the domestic competition. So this is double work.
According to Miguel Angel Lara from Marca smaller games were not worth
the effort because when there’s bigger games or Champions League games in that
week, the spotlight was always on those games. Lara explained two data
journalism articles about Valladolid and Manchester City from the same week and
exemplified the difference as:
When the Champions League game of Manchester City, it’s different. The
protagonist is Guardiola, or a City player who is first class. It gives you a lot
of information and of course, the data supports you. But you have good
information about a Valladolid player too. But that’s smaller, less important
data. The value of the data is multiplied with Gundogan with Agüero.
187
Consequently, interviewees from Marca, AS, Mundo Deportivo, El País, El
Mundo, and El Confidencial made statements that were basically the same about
the decision-making process and workflow in the newsroom for daily tasks and big
events. Journalists, data journalists and infographic artists were proposing topics
for data journalism articles and it was observed that there were no strict rules.
But it was seen that the requests for data journalism articles were coming mostly
from editors and journalists. However, differences in the creation of data
journalism articles were observed in terms of included sections to an article’s
creation process. It was seen that the newspapers with a special data section were
achieving the 4 stages of a data journalism article which are extracting, cleaning,
analysing, and visualising inside the data section, either a data journalism article
request comes from an editor or the data section itself. Besides this, the
newspapers with infographics departments were working in collaboration and the
data journalism articles were requested by reporting sections. This situation was
showing some exceptions in breaking news as infographic artists and data
journalists were working independently for breaking news to inform the reader in
a fastest way. Infographic sections and data sections were free to take the
responsibility to create a data journalism article about breaking news and publish
it independently on the newspapers’ websites to inform the reader in a fastest way
and catch readers’ attention. It was observed that the decision-making process of
data journalism articles were working in a different way in El Pais. The requests
were coming from either the data section or reporting section but the articles were
created by the data section based on 3 reasons as interesting data, hot topic, or
current audience interest. Working with a group or a collaboration with different
sections were observed mostly in big events, international tournaments etc. It was
observed that, for these events, journalists, data journalists and infographic artists
were starting to work between 3 to 8 months before, depending on the event and
daily workflows of the newspapers. The statements explained the reason for long
preparation processes of bigger events as lack of people in the newsrooms and
the changing agenda of the newspapers because of the breaking news. Especially
the infographic artists and data journalists were starting to work for big and
international events 3 to 8 months before to create original contents for repetitive
events and desire to make experiments before showing to the public.
188
5.1.2. Tools and Guidelines in Sports Data Journalism
4 stages of creating a data journalism article which are extracting, cleaning,
analysing, and visualising were discussed and the softwares, online platforms, and
the advantages and disadvantages of these tools were explained by interviewees.
Tools used for data extracting, cleaning, analysing and visualisation are
summarized in Table 65. and It was seen that journalists, data journalists, and
infographic artistics were choosing the tool that they work on based on their
knowledge about the tools, most of the tools were not chosen by the newspaper.
Infographic artists mentioned that data extraction was done mainly by the
documentation unit or the journalists. The newspapers who had not a data
journalist but had infographic artists and documentation unit, data extraction and
data cleaning were done mainly by the documentation department and visualised
in the infographic department. However, it was seen that infographic artists were
also doing data extraction and data cleaning in some cases, for example for
individual projects. It was observed that the interviewees who are data journalists
have comprehensive knowledge of the tools for the whole process. Jesus Escudero
explained the data extraction in El Confidencial as:
It depends on the project. If the data is huge, if there is public statistics, we
can download the Excel file and work with that. We can ask for this information
by the transparency law. So, it depends on the project and what kind of data
is available or not. Or we can write out a database if there are a little bit of
records like 150 to 500 rows so it's more quick for us to pick something to
write and create our database.
Marta Ley from El Mundo pointed to her colleague Hugo Garrido from the
data unit and mentioned Python as his tool to extract data. When Marta Ley and
her colleague Paula Guisado needed to extract data, they were using Excel. Ferran
Morales and Vanesa Mauri from Mundo Deportivo Infographics section stated that
the infographic section of Mundo Deportivo was using Google extensions to
capture tables and when they needed to extract a general data, their choice was
Excel. Tomas Alhambra, an infographic artist from Marca, supported the statement
of Morales and Mauri and added that he was using an additional tool, import.io,
189
when he needed to extract data but mainly he was not doing this. Lorenzo Lara,
a data journalist from Marca, explained the tools to extract data as:
I use spreadsheets to extract data. It can be Google Drive, for example, it
allows you to extract some tables. I also use Tabula on some occasions, which
is very good for me to extract data from PDFs.
To sum up, interviewees mentioned 5 different tools to extract data. Excel
was the main tool for all newspapers and the other tools were differentiating
depending on the knowledge of the journalists, data journalists, and infographic
artists. For instance, El Mundo was using Python while El Pais was using R. Marca
was using more simple tools to extract data such as Tabula, and import.io. El
Confidencial, Mundo Deportivo and Diario AS were using Excel to extract data
(Table 65).
Interviewees mentioned 4 tools in general to clean data which are Excel, R,
OpenRefine, and Tableau. It was seen that the frequency of the use of these tools
differentiated in newspapers. Dario Ojeda from El Confidencial was using only
Excel to clean data while his colleague Jesus Escudero was working with more
tools which are Excel, R, and OpenRefine. Lorenzo Lara also pointed to the power
of OpenRefine and mentioned that he was using it in second place after
spreadsheets. It was seen that Paula Guisado and Marta Ley mentioned different
tools to clean data in El Mundo. Guisado was using OpenRefine while Ley was using
Excel and Tableau. Daniele Grasso stated that the data unit in El Pais was using
the tools simultaneously to get more benefit from these tools. Grasso explained
the cleaning and analysing process together as:
To clean the data we use R or OpenRefine. Normally it starts with R or Excel
and then uses OpenRefine and we go back to our Excel with cleaner data. And
then we start to make the graphs in scratch with our Excel to see what's going
on. To analyze the data we normally use Excel or R. We don't use Python
much because I can't use it, but Borja, for example, uses Python. But mostly
to make something interactive, with JavaScript and so on. So to analyze data
we use mostly R because it's more human readable than Python so it's easy
to use.
190
Jesus Escudero from El Confidencial shared the same opinions with Grasso
and mentioned the effectiveness of R to analyze data as:
If data is more complex I do the analysis with R because I think it is the best
tool to analyze statistics and data.
It was observed that other interviewees do not use R for data analysis, they
were using mostly Excel and Tableau. Ruben Gimeno and Tomas Alhambra from
Marca, Marta Ley and Paula Guisado from El Mundo mentioned that they were
using Excel for data analysis, mainly. However, they also mentioned Tableau for
data analysis. Alhambra explained his reason to use Tableau as:
I have worked a lot with Tableau. When you have a huge Excel, you cannot
analyze it quickly but it seems more easy to me in Tableau. Many times when
you have a giant Excel that you don't know where to handle the information,
it doesn't hard for you in Tableau. I have used Tableau many times just to
give me an idea of where the graph has to go. Although the representation is
not final. But it does give you a general idea of all the data you have.
It was observed that Ferran Morales, an infographic artist from Mundo
Deportivo, mentioned Tableau too but also different tools for data analysis with
these words:
We are currently using Flourish to draw conclusions. But in recent times there
is a part that is I want to analyze data internally and we are starting to do
little things in Tableau and PowerBI.
To sum up, a richness was observed in the tools for data cleaning and
analysing. The tools were differentiated by the knowledge of the journalists, data
journalists, and infographic artists like the data extraction process. Newspapers
who have someone with a knowledge of programming and coding were using more
complex tools such as Python and R. To clean data, Excel was the main tool for all
newspapers in the first place. However, a variety in the tools were observed in
national newspapers. El Confidencial was using Excel, R for cleaning and
analysing, El Mundo was using Excel, OpenRefine, and Tableau for both cleaning
191
and analysing, and El Pais was using Excel, R, OpenRefine for cleaning and
additionally Python and Javascript for analysing. Marca and Mundo Deportivo were
the newspapers which had more variety in tools to analyze data. Marca was using
Excel and Tableau, and Mundo Deportivo was using Tableau, PowerBI, and
Flourish. Diario AS was only using Excel for both cleaning and analysing (Table
65). Use of these tools were based on the size and the source of the data.
A variety of tools to visualise data was observed in interviewees’
statements. Interviewees explained the tools that they’re using based on the
visualisation’s interactivity and topic and also the tools’ expenses for the
newspaper. Dario Ojeda from El Confidencial mentioned Tableau and Datawrapper
for data visualisation and stated that he continues to learn more tools for data
journalism. His colleague Jesus Escudero talked about the tools for different type
of visualisations and said:
I use R in some projects but our main tool is Datawrapper for simple graphic
lines and bar charts. We use Datawrapper for the daily news. Also for static
infographics we use Adobe Illustrator, and for maps we use QGIS. For example
we use QGIS to insert a map of municipalities. We use QGIS to combine the
data and visualise them. And then the last two months we use Mapbox to do
some kinds of maps.
Escudero mentioned that they do not use Tableau and Flourish anymore
and explained the reason as:
We used them like four years ago but we left because it was not looking well
on mobile. So we don't use them anymore. And the problem with Tableau is
that you have few dashboards on one dashboard. They collapse in mobile.
(...) Five years ago, we were trying to show all data, but then we realized that
in mobile, you must do some simple graphics because you have very little
space in mobile. (...) For example, We have more than 8100 municipalities in
Spain. So in a detailed map on mobile, it's a mess, it collapses. We must
simplify the graphics, the data load. (...) If we produce a Datawrapper graphic
it can be visualised both on mobile, tablet, and desktop. So for us it is more
useful than Flourish or Tableau.
192
Paula Guisado mentioned the data visualisation tools used in El Mundo as
Flourish, Hype and Carto. A variety in tools was also observed in the statement of
the interviewees from Marca. Lorenzo Lara, a data journalist from Marca,
presented Tableau, Datawrapper, Flourish and Adobe Animate as his data
visualisation tools. Tomas Alhambra supported the statement of Lara and
explained the tools he’s using with these words:
Datawrapper is simple because it does everything for you. It takes all your
data and directly does it for you. In Tableau you have to know where to touch
to adapt it and maybe the same graphic does not work for mobile and for and
for PC. You have to do two versions. (...) It is also true that the visualisation
is more pleasant in Datawrapper. In other words, it is more user friendly (...)
For interactive visualisation what we have used is Hype and Adobe Animate.
(...) I believe that each one has its advantages and disadvantages (...) Now
I'm trying to learn JavaScript, jQuery, html, css. I think it is the way to make
better graphics, we can say more professional in the sense of training yourself
to be.
Fernando Robato mentioned that AS was using only Adobe Illustrator and
Photoshop for data visualisation and it was observed that the reason for using less
tools was the lack of interactivity in AS. Content analysis of data journalism articles
between 2017 and 2019 proved the statements of Robato. Because only 1
interactive article was seen in the analyzed time period. Robato agreed with this
observation and mentioned that they don’t use three dimensions for data
visualisation. Ferran Morales and Vanesa Mauri explained the data visualisation
tools of Mundo Deportivo as Adobe Photoshop and Adobe Illustrator but they
mentioned that lately they have started to use Adobe Animate and Flourish too
(Table 67).
A diversity in data visualisation tools were seen in El Pais. Daniele Grasso
explained all the tools of data unit with this words:
We have our own style created to make all the graphs in the El Pais style
which are on R. Sometimes we go to Datawrapper, where you can make super
easy interactive graphs. When we need maps we use Mapbox. Mapbox is the
tool that we must use. And then when we need to make a static infographic
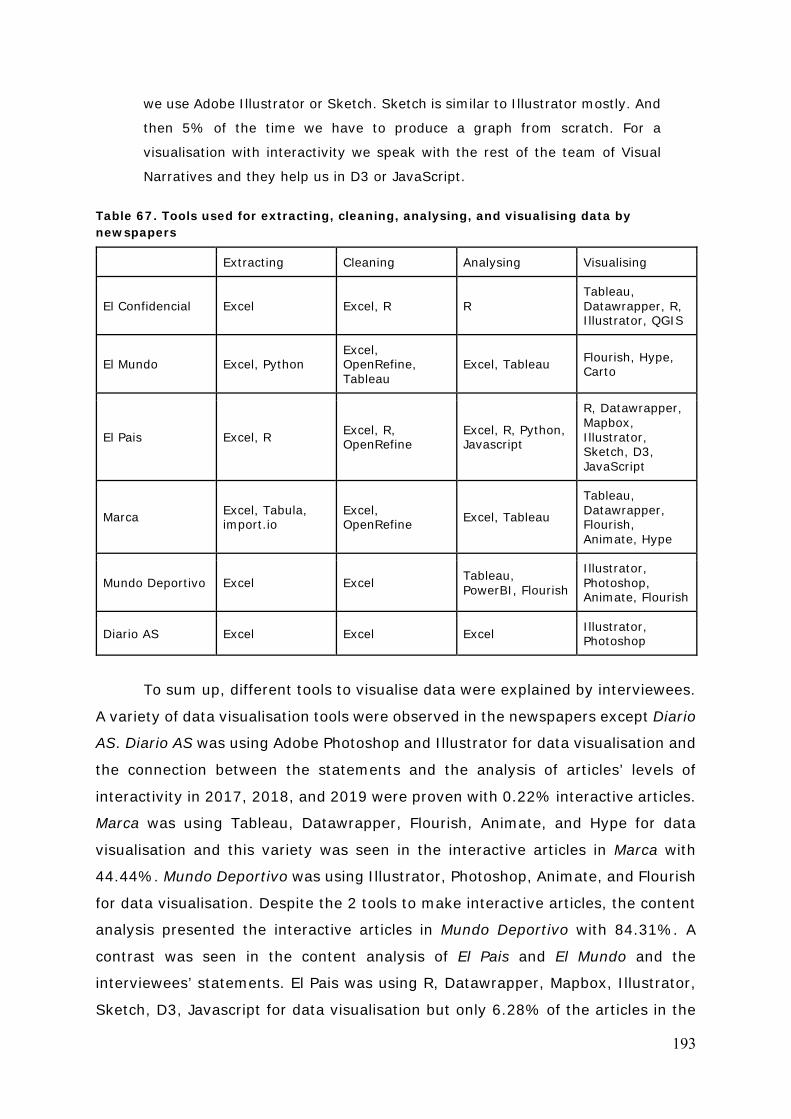
193
we use Adobe Illustrator or Sketch. Sketch is similar to Illustrator mostly. And
then 5% of the time we have to produce a graph from scratch. For a
visualisation with interactivity we speak with the rest of the team of Visual
Narratives and they help us in D3 or JavaScript.
Table 67. Tools used for extracting, cleaning, analysing, and visualising data by newspapers
Extracting Cleaning Analysing Visualising
El Confidencial Excel Excel, R R Tableau, Datawrapper, R, Illustrator, QGIS
El Mundo Excel, Python Excel, OpenRefine, Tableau
Excel, Tableau Flourish, Hype, Carto
El Pais Excel, R Excel, R, OpenRefine
Excel, R, Python, Javascript
R, Datawrapper, Mapbox, Illustrator, Sketch, D3, JavaScript
Marca Excel, Tabula, import.io
Excel, OpenRefine Excel, Tableau
Tableau, Datawrapper, Flourish, Animate, Hype
Mundo Deportivo Excel Excel Tableau, PowerBI, Flourish
Illustrator, Photoshop, Animate, Flourish
Diario AS Excel Excel Excel Illustrator, Photoshop
To sum up, different tools to visualise data were explained by interviewees.
A variety of data visualisation tools were observed in the newspapers except Diario
AS. Diario AS was using Adobe Photoshop and Illustrator for data visualisation and
the connection between the statements and the analysis of articles’ levels of
interactivity in 2017, 2018, and 2019 were proven with 0.22% interactive articles.
Marca was using Tableau, Datawrapper, Flourish, Animate, and Hype for data
visualisation and this variety was seen in the interactive articles in Marca with
44.44%. Mundo Deportivo was using Illustrator, Photoshop, Animate, and Flourish
for data visualisation. Despite the 2 tools to make interactive articles, the content
analysis presented the interactive articles in Mundo Deportivo with 84.31%. A
contrast was seen in the content analysis of El Pais and El Mundo and the
interviewees’ statements. El Pais was using R, Datawrapper, Mapbox, Illustrator,
Sketch, D3, Javascript for data visualisation but only 6.28% of the articles in the
194
analyzed period were interactive. El Mundo presented the same contrast with
4.76% interactive articles despite the use of Flourish, Hype, and Carto.
Interviewees agreed that they’re free to choose data visualisation tools but
mentioned that there were some exceptions if the company needs to buy a license.
Miguel Angel Carbonero from Marca explained this situation as:
We usually use free versions, there is no problem. We're authorized to use
any tool that does not involve an expense for the company. If it is a paid tool,
you have to negotiate it and see if it is feasible.
Ruben Gimeno from Marca agreed on Carbonero and added:
If I want to use a new medium, I can tell them.
Ferran Morales stated the same situation in Mundo Deportivo and
mentioned that they’re free to choose their data visualisation tools but If a license
is needed they need to talk with the related department to do a feasibility. Paula
Guisado explained this situation in El Mundo with these words:
If it's free we choose it. And if there is a license, then they decide. For
example, we wanted to use Mapbox like El Pais because it's better and you
have many possibilities. (...) So we tried to see if that was possible here. We
would learn how to use it because it's a learning curve, they thought about it,
but it was an expensive license so they decided to stick with Carto because
it's cheaper.
Daniele Grasso stated that they’re free to choose the data visualisation tool
and the company accepts. Grasso explained the way they started to use Mapbox
as:
For example, we talked with Mapbox and asked them for a six months trial.
We used a 6 months trial and we closed with them a one-year agreement. We
have a contract we can use whatever we want.
195
Besides the choice of data visualisation tools, interviewees also agreed that
they’re free to choose their stories' topics and narration formats but in some cases
an approval needed to be taken in the end. Paula Guisado explained this situation
in El Mundo as:
We obviously know what every newspaper leans in one way or at least in
Spain, I think it is like that. And you obviously know that but it doesn't affect
our everyday job. (...) If I have a good thing I think they will publish.
Marta Ley agreed the statements of her colleague Paula Guisado and added:
If you find a bomb, then your job is to tell them about it. Then they decide to
publish or not.
Daniele Grasso stated that they’re free to choose their stories and
narratives but there were some differences in the stories created by the data team
and created with collaboration with other sections. Grasso explained the difference
as:
The boss of the Visual Narratives Department always takes a look at what we
are doing, he approves mostly. We, only the three of us in the data team, try
to go quite straightforward when we produce stories, we have a quite special
kind of working style. When we work in the unit, we work in our own style.
For example, we are allowed to use the first plural person in the article like
"we made the map". When we work with other people in the newsroom, we
have to put "El Pais produced the map" and we try to be more direct.
Other interviewees basically stated that they’re free in their narration
format but there were some rules for color and typography in the general design
of the newspaper. Ruben Gimeno explained the guideline for color and typography
in Marca as:
We have a group of colors for different sections like Real Madrid, Atletico
Madrid, FC Barcelona, Primera Division, and motor. So you can choose blue
or yellow etc. The football section is green and blue. The entire Marca universe
is red. We always use the same typography, the same colors. But the way you
196
choose the data visualisation is your choice because we are enough
professionals to find a way to show these numbers.
Fernando Robato mentioned a similar guideline in AS and exemplified as:
For example we have blue for Real Madrid so when we make a graphic for the
Real Madrid section, we use some blue for different graphics. But we’re free
to choose the narrative format of the article.
Consequently, interviewees from Marca, AS, Mundo Deportivo, El País, El
Mundo, and El Confidencial exemplified different tools to extract, clean, analyze,
and visualise the data. Statements of the interviewees showed that Excel was the
main tool to extract data. However, the variety of tools were based on the profiles
in the newspapers with different talents. For instance, people from El Mundo and
El Pais were using Python and R which needs training or self-education to use it.
Excel was also the main tool to clean data for 6 newspapers while R, OpenRefine,
and Tableau were other tools to clean data. Tableau was seen in all stages of the
creation of a data journalism article. However, some journalists, data journalists,
and infographic artists were not using Tableau for data visualisation because of
the different errors in mobile and desktop version. Despite the fact that Tableau
is mainly a data visualisation tool, journalists, data journalists, and infographic
artists were using Tableau for cleaning and analysing because of the program’s
simplicity. However, a contradiction was observed in the tools for visualisation and
the content analysis of some of the newspapers. Interviewees mentioned various
tools to visualise data in a contrast of the low percentages of interactive articles.
For instance, Daniele Grasso from El Pais mentioned R, Datawrapper, Mapbox, D3,
and Javascript for data visualisation in El Pais but the quantitative analysis
presented only 3.14% interactivity between 2017 and 2019. The same
contradiction was observed in El Mundo. Interviewees from El Mundo pointed to
Flourish, Hype, and Carto for data visualisation in the newsroom and these tools
were offering both static and interactive features to its users but only 4.76%
interactivity was observed in El Mundo in the analyzed period. Qualitative and
quantitative analyzes of Mundo Deportivo, Marca, Diario AS showed consistency
in terms of the tools used to data visualisation and the amount of interactive
articles published in the analyzed time period. Interviewees stated that they’re
197
free to choose data visualisation tools they’ll use. However, a common idea was
observed that journalists, data journalists, and infographic artists need to
negotiate with their bosses if they want to use a tool with a paid license. The same
freedom was observed in the topics and narrative formats of the interviewees
stories. Interviewees agreed that they’re free to choose the narrative formats of
their projects but with some color and typography guidelines they need to take
into account.
5.1.3. Challenges in the Production of Sports Data Journalism
It was observed that journalists, data journalists and infographic artists
were facing several challenges when creating data journalism articles based on
sports data. Interviewees pointed to 3 main challenges in sports data journalism
articles as finding quality data and analysing, continuous alteration in narratives
and attracting readers. Dario Ojeda, Jesus Escudero, Tomas Alhambra, Paula
Guisado pointed to the data extraction, and analysis in terms of challenges in the
production of sports data journalism articles. However, some interviewees
mentioned opposite opinions in terms of challenges in data processes. For
example, Dario Ojeda from El Confidencial mentioned the difficulty in accessing
data which was addressed in the next sections about the open data and
transparency of information in Spain. A challenge to access data was the result of
the monopoly in the sector of data providers and the transparency portal in Spain
had not enough function. While Marta Ley from El Mundo was mentioning the
amount of sports data in Spain is a lot and Carlos Forjanes described the access
to sports data in Spain is more easy than past and added:
Recent years, in the big clubs’, like FC Barcelona and Real Madrid, annual
reports are very well documented in terms of the budget, the economic
operation, operations etc. They have a lot of numbers and you can work with
that. In the past, it was impossible to know the prices of every team in every
season. And now you can create infographics or stories with so much complex
data.
198
Jesus Escudero from El Confidencial stated that it’s easy to find data in some
topics but in some cases there is a lack of information and described this situation
as contrary. According to Escudero, this contrary is a risk in the production of
sports data journalism articles in Spain and explained with these words:
There are two main risks in sports data journalism and they are the contrary
of each other. In the lack of information, you need to do crowdsourcing or ask
for data by the transparency portal. The contrary effect is that: sometimes
you have huge data and you don't know what to look for, and you could be
wrong. The problem of a data journalist is that when you have huge data sets,
you want to use everything and it's very difficult to put aside some data.
Lorenzo Lara from Marca supported the statements of Escudero and pointed
to the lack of time to do a correct data analysis and visualisation in the newsrooms
as:
In good data journalism news, whether it is politics, sports, or whatever, I
believe that it takes time to be able to elaborate data in a correct way. It is
very difficult to do a deep analysis, do something a little more elaborated and
have a correct approach, because many times when you start an investigation
you realize in the halfway you need to take a course or make a turn or to find
another perspective. That is impossible here because the aim is to publish the
piece out as soon as possible.
Tomas Alhambra from Marca stated the challenge as finding a good quality
data, and stated that the quality of data determines the success of the article and
added:
I think the difficulty is the data itself. I think that is the most important thing.
In other words, if you don't have data, you don't have news and you don't
have a visualisation. So I think the most important and the most hardest thing
is to get good data that will allow you to make a good infographic.
Paula Guisado mentioned the lack of information and extracting data as a
challenge and explained:
199
Sometimes you find data in a PDF, that happens and you have to extract it.
And sometimes the data is not available for the public. (...) And sometimes
you would like to do a story on something, and you have to build the database
on your own. We did that many times. You have to collect information from
different places. (...) For example, I've seen FiveThirtyEight. They have a lot
of data on the NFL, Spanish football, or even GPS data for basketball. And I
think they started to do something like that in Spain too.
Miguel Angel Carbonero from Marca and Fernando Robato from AS
mentioned the continuous change in narratives and attracting readers as
challenges in sports data journalism. Miguel Angel Carbonero explained the
narratives as continuous changes in trends in data journalism like articles with
many maps, lots of data, or complex developments and stated that the data
journalist had to adapt to the new trends but they can’t know everything so it
takes time to adapt new developments in the data journalism industry. Fernando
Robato mentioned the same challenge and exemplified the difficulty in attracting
readers continuously in sports data journalism articles with these words:
Sometimes I have an idea and I don't know how to show this idea. For
example, we are working on a story for the Olympic Games. The first record
in 100 meters was in 1920 and this record was 10.6 seconds. And the last
record was 9.58 seconds. A man just reached 9.58 in 94 years. We waited 94
years to get that. So can you represent that in graphics? You can. But I want
to show you how hard that is. That is the main obstacle. (...) Sometimes it’s
not easy to make graphics as you think. Football happens every day. So how
could you present football in a different way to be attractive for the people?
For example, Cristiano Ronaldo used his right leg to make 27 goals and his
left leg to make 19 goals. Sometimes the people who work in the newspaper
think that is interesting for the people, but maybe not that important. Because
the next match you have the same information. I think that is not original.
You need to offer people special cases like unexpected players.
To sum up, internal and external challenges were observed in the
production of sports data journalism articles. Internal challenges were described
as lack of time and lack of necessary formation. The main obstacle in the
newsrooms was the time consuming breaking news and lack of enough time for
200
data journalism articles was a challenge for journalists, data journalists, and
infographic artists. Lack of necessary formation, background information, skills
were other challenges to create sports data journalism articles. External
challenges were described as either lack of or too much data, and the continuous
change in narratives. It was noteworthy that interviewees presented opposite
opinions about the available data amount. Dario Ojeda, Tomas Alhambra, Paula
Guisado mentioned the lack of data while Marta Ley, and Carlos Forjanes were
claiming there was too much data. Interviewees also mentioned the challenge to
attract readers because the narrative trends were changing constantly.
Interviewees’ statements about the constant changes were linked to new tools
and technological trends in journalism which is a possible result of technological
determinism and McLuhan’s theory.
Different points of views were observed in the statements of the
interviewees from national newspapers about the difference between sports data
articles and others like politics or economics. Some of the interviewees stated that
there’s no difference between the sports data articles and others. Paula Guisado
and Marta Ley from El Mundo proposed that there’s no difference in creating data
journalism articles about sports, economics, or politics for them in the infographic
section while Jesus Escudero from El Confidencial and Daniele Grasso from El Pais
were stating a difference between topics. Escudero explained the difference
between topics as:
In the end you're trying to simplify the numbers that everyone can understand
when they check the visualisation. The problem with the sport is that they are
broadcasting 24 hours a day. So you must look for something that is very
different from other news topics. In news media, from sports to politics, there
are reports for a reader to pick up and read. So for me the difference is the
competence or the number of articles that sports or politics produces every
day. So the risk is that.
Daniele Grasso explained the challenge in sports data articles as the
experiences in working with data in different sections and added:
201
Because in politics, economics, society sections they are totally used to using
data. Maybe they didn't do it before having an editing power as they do it
now, but it's okay. This is quite more difficult in sports than in other sections.
Consequently, interviewees from Marca, AS, Mundo Deportivo, El País, El
Mundo, and El Confidencial explained different challenges in sports data journalism
and mainly pointed to internal and external challenges in sports data journalism.
Internal challenges were seen as the lack of time, lack of formation and skills, and
the daily workload in the newsrooms. The outcomes of the internal challenges
were also observed in the previous sections about tools and guidelines in sports
data journalism and the workflow of the newspapers such as the long preparation
period for international events, collaborations between sections because of the
lack of formation and the workload of breaking news. These internal challenges
were also linked with quantitative analysis in terms of less interactivity in the
articles, the percentage of articles created by more than 1 author, and the
simplified data journalism articles in time. External challenges were observed as
the amount of data and the continuous change in narratives. A contradiction was
seen in the amount of data. Available data level was not consistent in all topics.
Either there was too much data about game and player statistics, or it was a
challenge to access data in other topics such as management of the clubs,
economical information, budgets, sponsors, etc. Sports were linked to different
sectors and topics and it was a business so accessing data in economical topics
was turning into a challenge for newspapers and also the newspapers were always
doubtful about the accuracy of the data. The main challenge was the data itself.
In addition, continuous change in narratives was stated by the interviewees as an
external challenge. Trends were always changing in journalism and due to the fact
that the new tools and techniques were arising because of the technological
determinism, journalists, data journalists, and infographic artists were facing
difficulties to follow new trends. The challenge to follow new narratives could be
associated with McLuhan’s “medium is the message” theory. Because the
information was shaping based on the way it was presented. In addition,
interviewees' statements pointed to the difficulty in attracting readers in sports
because sports were in everyday life, broadcasting 24 hours in a day and based
on repetitive events. Because of its repetitiveness, finding an original topic to work
on a data journalism article was an external challenge for journalists, data
202
journalists, and infographic artists. Data was one of the main characteristics for
sports but visualising that data in a story with a journalistic perspective and
presenting it to the reader in an original way was a challenge.
5.1.4. Characteristics of a Good Sports Data Article According to Journalists
It was observed that the interviewees shared different opinions about what
a good sports data journalism should contain. Interviewees pointed to the
importance of originality and research. Jesus Escudero from El Confidencial
explained the use of statistics of a game in a data journalism article as exhausting.
According to Escudero, these advanced statistics were useful for teams, like
explained in “Moneyball”, but these statistics were not working very well in articles
and Escudero added:
At last, fans want to see the match. They want to see Messi pass the ball more
to Suarez than Griezmann and these kinds of things. I don't see it as very
useful, I like more structural things. For example, why Marc Gasol works very
well in defense? But not in a particular match, in general. Two years ago, the
Washington Post published a sports data journalism article about American
football. There were more fights when the local teams lost with small points.
And I think it was very hard because they asked for information from
transparency. And they related the fights with the result of the games. So I
like this kind of information and I think they are more useful than a specific
match or competition.
Fernando Robato from AS supported the statements of Escudero and stated
that visualising all the data was a mistake and the important thing was research
based data journalism articles and added:
I prefer to put the focus on some curious things happening in sports. For
example, how is the sport using technology? How did technology impact
sports and changed the sport during the history of this sport? How does
science make an effect on the practice of this sport? I try to discover these
kinds of things. Or for example, the graphics for Manu Ginobili. You can
recognize a player with a move, we try to discover and identify these. So I
203
think you need to be a little bit curious to find that things make a difference
between you and the rest of the newspapers.
It was observed that the interviewees mentioned the significance of the
experiments in sports data journalism articles. However, the main obstacle was
the Spanish audience. Interviewees stated that the Spanish audience and Spanish
sports environment were not ready for these types of sports data journalism
practices. Daniele Grasso from El Pais mentioned the lack of interest through other
sports in Spain and the focus of the Spanish sports media as football. Grasso
explained the use of advanced statistics and experimenting in sports data
journalism as:
We are starting to use advanced statistics like expected goals and stuff like
that. Soccer has a huge fan base in Spain, but just a little part of them really
want to see those pretty freak statistics which are super accurate. (...)
Secondly, a really good sports story with stats and the data can become a
story that goes beyond what a simple chronicle can tell. For example, L’Ultimo
Uomo from Italy published an article and explained how many goalkeepers
start with a short pass, this is a statistic that I couldn't find. It's more like an
experiment, but it gives you an insight that there is no other way to give you
the "okay, this explains to you how the game is changing". I mean, goalkeeper
making more short passes and less long passes. This is really a big story. (...)
There will be UEFA Euro 2020. So we want to experiment with stuff like this.
We are not sure that the Spanish audience is ready. But we also have whole
Latin America that can read us. So we are going to try. On the other hand,
it's also true that soccer is sold by itself. If you put soccer in it, people want
to read, especially in Spain.
Ferran Morales and Roger Guillamet from Mundo Deportivo also explained
the interest in football articles in Spain and stated that a good sports data
journalism article was an article that people were interested in. Ferran Morales
exemplified a good sports data journalism article from Mundo Deportivo as:
One of the graphics we made was that people could make the eleven of FC
Barcelona, the tactic. Well, we are interested in visualisations or data
204
journalism that the user is a participant in the interactivity process. In this
type of news you have a lot of feedback from the user.
Roger Guillamet pointed to the significance of football articles in Spain and
claimed that the article was read by people if it contains Messi or Ronaldo.
Guillamet also explained his new article project:
For example, Messi is close to Pele in the scores in one club. He needs to make
23 goals to reach the top of Pele. So I’m interested in making a data
journalism project about this, Messi vs. Pele. I’ll see when Messi arrives at
this score. And I’m looking for information about Pele and Messi to see how I
can make this project.
It was observed that the interviewees from Marca mainly pointed to the
design and technical characteristics of a sports data journalism article that could
be considered as “good”. Ruben Gimeno mentioned the importance of catching
the reader's attention in a short time for a successful sports data journalism
article. According to Gimeno’s statements, a good sports data journalism article
in a few seconds through color, typography, illustration, etc. Because more than
70% of the readers of Marca were accessing content from mobile and they had a
few seconds to catch readers' attention, according to Gimeno’s statements. Miguel
Angel Carbonero supported the explanations of Gimeno and added:
For me, a good sports data story on the web and above all mobile does not
need too much interactivity. I used to think otherwise, but today the time of
consumption of information is very short. So, as a journalist, we must have
four or five key things we want to convey. And then for me, the ideal format
of interactive and visual news in Marca has to be a very shocking initial image
that is self-explanatory with the four general ideas, very easy to understand.
Consequently, interviewees explained their opinions about the
characteristics of a good sports data journalism article, and the opinions of the
interviewees were seen in two main topics as eye-catching design, and experiment
and research-based data articles. Statistical data of a game or a player were easily
accessible for readers and creating data journalism articles based on ready-made
205
that was not useful for readers. Opposite to these types of articles, a successful
sports data journalism article could answer a question like the relation of sports
and technology, how that particular sport is changed, or show statistics that are
found by researching and analysing. However, it was easy to catch Spanish
readers’ attention with football articles, especially if it includes FC Barcelona and
Real Madrid. Data journalism articles about other sports should’ve presented more
detailed, research-based stories to catch the attention. In addition, on the basis
of the statement of the interviewees, a good sports data journalism article had to
catch the reader's attention in a few seconds because the readers were following
the articles mostly from mobile and the articles had to be formatted based on
smartphones.
5.1.5. Advantages and Disadvantages of Creating Sports Data Journalism Articles
It was observed that interviewees stated different opinions about the
advantages and disadvantages of creating sports data journalism articles.
Statements about the disadvantages of creating sports data journalism articles
were not seen in the explanations of Dario Ojeda from El Confidencial and Ferran
Morales from Mundo Deportivo while Jesús Escudero from El Confidencial
mentioned only disadvantages. The rest of the interviewees stated both
advantages and disadvantages in the themes of audience interest, available data,
and topics to visualise. Most of the interviewees mentioned the available sports
data as an advantage. Dario Ojeda from El Confidencial claimed that sports data
journalism allowed the people to understand the games and sports in general
better and added:
The analytics and the advanced stats are important. If you like specific sports
and stats, you can understand better. For example, I like basketball. If you
understand advanced stats and analytics you can understand that there is a
reason behind the stats. So you can understand better that the sports is
possible with these tools, these visualisations, data journalists.
206
Ferran Morales from Mundo Deportivo referred the importance of working
with data and being a sports data journalist as:
I think it would have been difficult to draw the conclusion without analyzing
the data and show it to the reader with a total. How is framed? At what time?
Against what teams? To know all this data you need data journalism. I believe
that it is an advance that each time the news will have more quality because
more will be known. You work on the best data and you will be able to draw
other conclusions that you have not drawn so far, which is the important part
of data journalism.
Roger Guillamet supported the statements of Ferran Morales and added:
I think that it is an added value to the competition as Ferran said. You can get
news that another newspaper does not get and that is because only you have
worked with the data and only you have been able to get those conclusions.
And you can show ideas that are established with data, and state a hypothesis
and corroborate with data.
Statements of Daniele Grasso from El Pais presented the same idea with
Morales and Guillamet and claimed that a data journalist can create a story that
no one did before through data. However, according to Grasso’s opinions the
disadvantage was in the newsrooms because the journalists were not used to
working with data. Tomas Alhambra from Marca mentioned that available data in
sports is both an advantage and a disadvantage in some cases and said:
The advantage is you have all the data that happen in sports. There is a lot of
data to analyze like the games of the players. And the main disadvantage is
that other than that, there is no data on anything else.
A conflict was observed in the statements of Jesus Escudero from El
Confidencial and Miguel Angel Carbonero from Marca. Miguel Angel Carbonero
mentioned that creating sports data journalism is an advantage because it does
not enter into political conflicts. However, Jesus Escudero presented an opposite
opinion. According to Escudero, sports and politics were so close to each other in
Spain and this was a disadvantage:
207
Especially in Spain politics and sports are very ideological. You are on the left
or you are on the right. You support Real Madrid or you support Barcelona.
And if you support Barcelona, you can't say that Real Madrid played well.
Why? Is Real Madrid your enemy? Maybe this is because sports are too much
into politics.
Interviewees also mentioned the amount of audience in sports data
journalism as an advantage. Miguel Angel Carbonero and Ruben Gimeno from
Marca pointed to the audience in Spanish sports journalism. Gimeno claimed that
when a journalist created a sports data journalism piece, it’s easy to catch
attention and get millions of people. Carbonero supported the statement of
Gimeno and added:
The impact that your work has professionally is not the same as any other
medium. And almost with a minimum effort, your impact is huge. Your name
is getting published many times.
However, Carbonero also mentioned the variety of topics as a disadvantage
in sports data journalism. According to Carbonero’s statement the events that
happen periodically were forcing journalists in terms of creating original data
journalism articles, because topics could get boring for audience in time:
There is what we call the wheel of sports. I consider it to be a wheel that spins
every four years. Every four years there are Olympic Games and Eurocup.
And periodically there are Copa del Rey, Copa del Rey's Cup, Formula 1,La
Liga, the NBA. Every year the same organizations are happening.
Consequently, interviewees pointed to the different advantages and
disadvantages of creating sports data journalism articles. Interviewees mostly
mentioned that sports data journalists make sports more understandable when
they had data. Especially the articles based on hypotheses, research, and analysis
were adding value to sports and this could be provided only by sports data
journalism. In addition, experiment and research based data journalism articles
were allowing readers to doubt and criticize about a topic and this was adding
208
value to journalism too. Also, readers were showing interest in sports data
journalism articles and sports data journalism articles were making a bigger
impact with less effort compared to other topics. However, accessing data was a
disadvantage for newsrooms. In this point, accessible data was pointed as both
an advantage and disadvantage. Because data in certain topics were not easily
accessible and could create political and economical conflicts. Sports events were
repetitive and it was an disadvantage for newsrooms to create original articles. In
this point, lack of formation was the issue as described in previous sections.
Journalists, data journalists, and infographic artists had to be original when
presenting repetitive events, add value to the article with hypotheses and analyzes
to be novel but current teams of newspapers had not enough formation to work
with these types of data.
5.2. Access to Data in Spanish Data Journalism
In this section, data sources, challenges in working with data in Spain,
differences between the available data on national and international events, and
journalists’, data journalists’ and infographic artists’ opinions about transparency
of information in Spain were discussed. Interviewees mentioned their data sources
and how they were using the transparency portal and then explained the
challenges to access data in Spain through the transparency portal, data providers
and free sources. In addition, internal and external challenges in working with
data were discussed by journalists, data journalists, and infographic artists.
5.2.1. Data Sources of Spanish Newspapers
It was observed that the interviewees were using the same platforms to
obtain sports data and especially Opta, a British sports analytics company, had an
agreement with El Confidencial, El Mundo, El Pais, Marca, AS, and Mundo
Deportivo. All interviewees mentioned Opta as their first source for sports data.
However, interviewees explained different types of contracts made with Opta.
Miguel Angel Lara mentioned that Marca had an agreement with Opta to access
209
all the information on Opta Portal while Vanesa Mauri was explaining Mundo
Deportivo’s contract with Opta as receiving only the game day information
provided by Opta, they didn’t have an access to use Opta Portal to search for data.
Besides Opta, interviewees mentioned other subscription-based companies
and sources of official institutions (FIFA, UEFA, NBA, ATP, LaLiga, Euroleague,
Vuelta a España, etc.), free sports statistics websites (Overbasket, Transfermarkt,
WhoScored, Squawka, Statsbomb, Stats, FootballMe, etc.) and the transparency
portal. Jesus Escudero mentioned that they use transparency portal to access
some data and his colleague Dario Ojeda exemplified their use of transparency
portal and explained the other sports data sources as:
We wrote an article with Jesus about Vuelta de España, cycling and we
requested data from councils, regions, basically from the government. I
usually download data from free sources like Whoscored and Squawka for
football, the stats of NBA is free. These are not advanced stats, only regular
stats. But there are some services like Overbasket for Euroleague and I used
a premium service only for a month. I also used the free subscription in Instat
for basketball. I wrote about two or three articles.
Miguel Angel Carbonero from Marca stated that they use mostly official
reports besides Opta and the database of Marca and claimed that they were not
using Wikipedia and added:
Instead of databases, we used studies many times already carried out like the
studies of some external agencies. For example, there was a FIFA study
prepared by an agency but as basically was advertising research. We asked it
directly from the department itself. (...) We would look for a way to always
acquire from primary sources and access primary sources in official bodies,
but there were sources already within the website's own public content, such
as FIFA, UEFA, or La Liga. But never Wikipedia.
Opposite to Carbonero, Daniele Grasso from El Pais also mentioned that
they use Wikipedia as a data source and explained the other data sources besides
Opta as:
210
We use Transfermarkt. There is another webpage called Statsbomb. They are
really good too. So we want to ask them things, to try to do things with them
and explore them. And sometimes we go to betting sites to check and see if
there are some stories like "how many times the bets were right about this
team, or other one?". But I think that the top is Wikipedia, they have a huge
amount of data.
It was seen that the other interviewees also mentioned more or less the
same data sources but added different sources for sports data. Carlos Forjanes
from AS mentioned that he was using Business Insider to reach data about
economic situations of the clubs or transfer markets. Ferran Morales and Roger
Guillamet from Mundo Deportivo explained the effectiveness of Stats, a sports
analytics database like Opta, and FootballMe.
Consequently, it was seen that interviewees from six newspapers were
using Opta as primary sports data source and searching data from other sources
like Transfermarkt, Statsbomb, Stats, FootballMe, Business Insider, Whoscored,
Squawka to create different sports data journalism articles. Besides these sources,
interviewees also stated that they were using official pages and reports of sports
institutions, clubs, organizations such as NBA, FIFA, UEFA, La Liga, ATP to access
data. It was observed that data sources addressed by the interviewees were
compatible with the quantitative analysis. Analyzed data journalism articles of
Marca, Diario AS, El Mundo, and El Pais presented the mentioned data sources by
the interviewees while other newspapers were mentioning data sources rarely.
5.2.2. Challenges in Working with Data in Spain
It was observed that interviewees pointed to different challenges in working
with data in Spain such as accessing data, format of the accessed data, limitations
in accessing data in certain topics. Journalists, data journalists and infographic
artists who use transparency portals for their sports data journalism articles
explained the process of data request and its difficulties. Dario Ojeda and Jesus
Escudero from El Confidencial and Daniele Grasso from El Pais mentioned that the
211
legal response time of the public institutions was minimum one month but it was
challenging for them to get a response for all their requests. Dario Ojeda claimed
that some institutions were not responding requests in required time and added:
The minimum is one month because it's the legal process. It can be two, three
months, or never. I could say 30 percent of my requests were rejected.
Daniele Grasso from El Pais supported the statements of Ojeda and claimed
that the reasons for the late responses were that the portal was particularly new
and there were different rules between regions. He exemplified the waiting process
and way to ask for a data as:
At the moment we are preparing a big story, just based on transparency law.
And there are some autonomous communities that are making us wait for
three months before giving us an answer, because they ask us to take longer
to give us data. And then they asked to review later. I mean it's not easy to
go through the transparency law. (...) A big problem is that each region has
its own rules that apply. They have the general state transparency law. But
for example, the law in Navarra is more strict. You need larger timing than in
other states. In Catalonia they're working really well. (...) But also when I ask
something, I always send it from my Gmail and not saying that I am a
journalist working at El Pais.
Interviewees also pointed to the format of the data they accessed as a
challenge in the process of creating a data journalism article. Jesus Escudero from
El Confidencial mentioned that the data they received was not organized in general
and organizing and cleaning a database in spreadsheets was their daily work.
Dario Ojeda pointed to the same difficulty and claimed that they generally receive
PDF even if they were asking for a spreadsheet from public institutions. Daniele
Grasso supported the statements of Escudero and Ojeda and mentioned that the
half of the data he received was needed format. Marta Ley from El Mundo also
shared her experiences about non-readable data she receives and exemplified as:
For example we created a database with all the assets of MPs. Data was
received from the webpage of the Parliament published one by one, the
documents. And those were PDF but an image, not readable. So we created
212
the database with this information by hand. Each one was different because
they don't have a rule to fill it. It was the longest case. Because we had to
build the database with 350 people, and also senators, and also cleaning.
According to the Vanesa Mauri’s statements, formatting and cleaning a
database were 40% of her projects. Ferran Morales from Mundo Deportivo
mentioned the format of the data as a major problem and claimed that the 80%
of the data he receives needs format, combining and cleaning and he exemplified:
We did something about Juan Carlos Navarro, a basketball player, which is to
look for data from the ACB, data from Euroleague, data from the Cup and
then put it all together. In other words, there was not one dataset, they were
all there, but rather they were different sources and we grouped them
together because we wanted to tell a thing.
Miguel Angel Lara from Marca pointed to a different challenge in working
with data in Spain and mentioned the trustworthiness of the data. According to
Lara, when he received data he needed to compare the information with 2 or 3
more sources to make sure of the data. Lara mentioned the need for this process
for sports analytics websites and added:
For example, a Spanish based website called Tercer Tiempo, which has a lot
of information. But it has some errors. So I always have to confirm it. And of
course, as for the three sources, they take longer, but I think it is necessary.
But it also depends a bit on the type of report. A report of a player is simpler,
but if it is a whole team, it's more complex.
Interviewees mentioned the limitations in accessing sports data in both
Spain and other countries as lack of transparency, lack of available data in certain
topics such as economics or management. Miguel Angel Carbonero from Marca
mentioned the challenges in searching for a data in specific topics as:
On economic issues. The issue of money that moves in football because
money never seems transparent to me, is talking about what money goes to
which club. The accounts are never clear in any sports news. In the signings
it is not known what percentage goes to the club, what percentage goes to
213
the representative, what is paid for taxes etc. In the end is made a ball in
which you do not want to enter.
Ferran Morales from Mundo Deportivo pointed to the same challenge and
explained that the most important thing in an article was being reliable. According
to his statements, reliability was the priority of Mundo Deportivo. Other
interviewees mentioned the limitations in accessing data as lack of sources and
the monopoly in the sports analytics industry. Lorenzo Lara from Marca explained
the monopoly in the sports analytics industry as:
There is a kind of monopoly, because basically it is Opta and other companies
which are also a data provider, but it is really an exhausting monopoly, so it
is quite complicated. There are many competitions and many actions in the
game and that has to be carried out by a company. That is impossible for an
individual to carry.
Tomas Alhambra from Marca supported the statements of Lara and claimed
that newspapers had to accept this monopoly to create sports data journalism
articles and added:
It is very difficult to quantify everything that happens in a game, if you do not
have a company that offers you these data, it is impossible. You have to buy
the data.
Dario Ojeda from El Confidencial mentioned the lack of transparency and
public data in sports. Ojeda compared the institutions and organizations to explain
the challenge in available sports data and claimed that this challenge was seen
not only in Spain but also in general, Europe and added:
Did you look at the NBA? I think they are the best. They publish all
information, all the game data in their website and you can access that
information and you can write whatever you want. Here In Europe, not only
in Spain, we don't have that. Sports institutions have that data internally but
they don't publish. I think there is a big problem with that. I don't know why
they do that like in UEFA, Euroleague, in Spain Liga ACB, La Liga. We need
more transparency in data I think.
214
Miguel Angel Lara from Marca pointed to the same difficulty with Ojeda and
claimed that the amount of sports data is good but still not enough. Lara compared
the transparency and public data in skiing and football and explained:
FIS (International Ski Federation) has the international agency, a very good
database for me, one of the best, much better than FIFA, much better than
UEFA. In skiing can find a thousand things and is very easy. Now you can put
the skier, the type of competition, the position that has been, the time that
has been marked and you can make a huge filter. There is no such thing in
football. FIFA is very bad. UEFA doesn't have much else either. It's a little bit
better, but not much more either. The Spanish Federation is a little better,
but before it had no data. The English Federation is quite good, the French is
fine, the German is fine, but more complicated. For example, in Spain many
things are missing. I tell you that skiing is a minor sport but you have
everything.
Consequently, it was seen that journalists, data journalists, and infographic
artists were facing different challenges such as available data,requesting data
from transparency portal, limitations in accessing data in certain topics like
economic information of the clubs, organizations and institutions while working
with data. Interviewees pointed to the needed time when data was requested from
the transparency portal and they have to know the rule of each region in Spain.
Legal response time for data requests from transparency portal was minimum 1
month but it could be 3 months and in the end autonomous authorities could reject
the request. Different response times and regulations in each region were
challenging journalists to work on a national project. According to the statements
of the interviewees, there should have been the same regulation for each region
to access data in a desired level. On the other hand, journalists, data journalists,
and infographic artists mentioned that it’s an obligation to check the
trustworthiness of the data from other sources because there’s a problem in the
quality of data. In addition, the data that journalists received was not in a proper
format in general, formatting and cleaning was taking too much time. Lastly,
interviewees mentioned the monopoly in the sports analytics industry and lack of
available data in clubs, organizations and institutions, especially in football. It was
seen that the challenges in working with data was forcing journalists to create
better sports data journalism articles.
215
5.2.3. Difference Between the Data Access in National and International Events
It was observed that the interviewees had more difficulty in accessing data
for national and especially regional events in Spain, while accessing data for
international events were offering much variety. Interviewees explained the
possible reasons for the difficulties in accessing data for national events. However,
some interviewees claimed that there was no difference in accessing data for
national and international events if the data was provided by a company. Tomas
Alhambra from Marca explained that the level of access was the same through
data providers because the sports analytics industry was a monopoly. Miguel Angel
Carbonero, Alhambra’s colleague, supported the statements of Alhambra but
mentioned that accessing data for both international and national events was at
the same level if the topic does not involve politics or economics and explained
this situation as:
Sports economic data is complex internationally. I particularly think FIFA is
very opaque and it never makes anything clear. If someone asks me to do
information about FIFA numbers, I wouldn't be able to. I would have to ask
many colleagues for advice and be behind it and devote a lot of time with the
consequent problem. The big problem we have globally is the corporate
weakness that the press has. We are very powerful in audience level, but very
weak economically. We depend on a lot of economic interests that make us
very fragile. Then sometimes we don't go deep.
Jesús Escudero from El Confidencial supported the statements of Carbonero
in terms of being transparent but claimed that the problem with transparency and
accessing data was a challenge in national, and especially regional events and
added:
The problem is the lack of workers. So they have knowledge about the
transparency law, and at the national level they don't want to give you the
information. They work to find any argument to break the law and to deny the
request.
216
Daniele Grasso from El Pais also claimed that it was more challenging to
access data for national events but mentioned that accessing data for national
events was always easier than the regional events. Ferran Morales from Mundo
Deportivo explained accessing data for international events was easy due to better
planning, and implementation but it was getting harder at national and regional
level. However, Morales explained the changing situation in Barcelona as:
Barcelona City Council is promoting that more and more data is accessible to
everyone and it is a culture that is being given more and more importance.
But maybe in the national is not so much, because there is a lot of concern to
provide data.
Roger Guillamet supported the statements of Morales and mentioned the
importance of providing data to newspapers for minor sports and explained:
In small sports, it is more difficult to find information, but I think that, as
Ferran says, there will be more and more information and more data related
to small sports or handball, for example. I think that every time the
organization is more interested in passing data to be used in the media. I
think that small sports have to pass more information to the newspapers so
that sport has more visibility in the country.
Carlos Forjanes from AS pointed to the same difficulties in terms of
accessing data for lower leagues and minor sports but explained the reason of this
as the monopoly of Opta which is changing in time:
Until last season Opta didn't have coverage for all the matches. So you need
data from all the competition to analyze, this team versus other teams etc.
But it's difficult. For example they only have data of a team, only three games,
the other team has only one too. But they are working on that, and the Copa
del Rey will be more like La Liga, in terms of data. But they play in a lot of
teams from the Third Division. So it is so difficult to find data from teams from
the Third Division.
Dario Ojeda from El Confidencial and Miguel Angel Lara from Marca pointed
to the access level of the Premier League and Bundesliga and claimed that Spain
217
had a lack of available sources to access data. Lorenzo Lara from Marca mentioned
the same challenge and added another challenge to his statements which was
accessing data for historical events as:
If you want to go to historical topics it is much more complicated, even in
Spain you have to go practically to volumes of published newspapers. And for
example, this morning I was checking a referee who whistled in a game in
1925 because I had to have data to be able to complete my article.
Consequently, it was observed that journalists, data journalists, and
infographic artists were challenged by the access level of data in national events
in Spain. Journalists, data journalists, and infographic artists also mentioned the
difference between national and regional events in Spain in the context of data
source, available data, and requesting data. According to the interviewees it was
easier to find data for international events thanks to the available sources and
better planning and implementation of the organizations.
5.2.4. Journalists’ Opinions About the Transparency of Information in Spain
It was observed that the interviewees presented different opinions about
the transparency of information in Spain. Interviewees mentioned the lack of
transparency of information in Spain but also added that the level of transparency
was better than the past. Most of the interviewees pointed to the Transparency
Law and its effectiveness compared to the past. However, accessing data through
the web always needed to double-check, according to the interviewees. Darío
Ojeda and Jesus Escudero from El Confidencial, Lorenzo Lara from Marca, Marta
Ley and Paula Guisado from El Mundo specifically mentioned the effectiveness of
the Transparency Law but added that the law still needed to be improved. Dario
Ojeda mentioned that Spain had to create a board of transparency to inspect the
institutions in the level of available data through requests. Jesus Escudero
supported the statements of Ojeda and mentioned that Spain needed a culture
change to implement transparency law better and added:
218
In the law there is a little bit of transparency, but it's not enough. I think that
the problem in Spain with access to information is culture. The politics, public
workers continue thinking that the data and information belongs to them, it's
not true, it belongs to the public. We need a culture change. (...) I read in the
law that in a bit of a period of time if you don't get an answer, it means
rejection. Too many times we face this. You can ask the institution. And they
have three months to reply. The problem is, the institution can care about
transparency, but the execution of the transparency law doesn't have any
enforcement powers.
Marta Ley from El Mundo also pointed to the political culture of Spain as a
reason for not implementing transparency law at a desired level and explained:
If a specific institution is very predisposed to be transparent, it will be faster
in the responses. It will be more difficult for them to give you information or
if they deny it, it will be because they do not have it, or there is some
exception to the law that they can cling to. On the other hand, there are others
that are even more closed. That political culture is also lacking among officials.
Paula Guisado from El Mundo mentioned the journalists should use
transparency law more however the challenge was the time to wait for a reply for
the request. Guisado explained her opinions about the transparency law as:
It's a good tool that we have now. Until like five years ago, there was no way.
So we should use it much more than we do. And I think there are good stories
to be told, thanks to the transparency law. But because of the workflow of the
newsroom, it's hard to use. The rhythm doesn't work in transparency law,
because you have to wait for minimum a month, and then maybe they don't
give you data so you have to ask again. It doesn't go with the news cycle
here. You need something happening now. And for that kind of information
for context, you can't get in the transparency portal.
Opposite to her colleague, Marta Ley mentioned the positive sides of the
law and the effectiveness of the Transparency Council with these words:
Before we did not have a transparency law, now we do and I do believe that
it is getting better and better. In the end, I think it also depends a lot on the
219
body to whom you ask the disposition that it has to give you the information.
But the Transparency Council has a very good reputation among journalists
that it works very well when an organization does not want to give you
information. And you really have a right to receive it. It is an institution that
is almost always in favor of journalists or of those who request information.
However, Lorenzo Lara from Marca claimed that the law was developing but
when they couldn’t reach a data it was hard to go to the court for the companies
in the context of financial situations.
I think there is a long way to go. We have a transparency law in Spain. It is a
transparency law that is developing, let's say. Much remains to be done
because it is a law that does not guarantee you an absolute guarantee. If they
want, in the end they give you the data and if they don't want it they don't
give it to you. It's a bit like that. And if not, then you have to go to court and
see what happens. So, of course, imagine, in a company they weren't willing
or financially supportive to go to court or anything like that.
Lara also claimed that transparency of information was more complicated
in sports because the clubs were not public institutions. Lara explained the process
of getting data from clubs as:
I see that sports are a little more complicated. Because it is very difficult to
access, for example, football clubs, because they are not public institutions.
You can access club accounts, but you have to go to the Mercantile Registry
and spend money, obviously, because it is not free. That does not go for
transparency.
According to the statements of Fernando Robato from AS, the level of
transparency of information was at a good level compared to non-European
countries. However, Robato mentioned that the level of transparency needed more
improvement in Spain especially compared with Europe and explained:
Because for political reasons, there are newspapers who have different ideas.
For example, when I came to Spain, I took the ABC newspaper. I didn't know
a lot about Spanish history, but with the years I recognized ABC was right-
220
wing El Pais was left-wing. That is because if you read one newspaper, you
are just reading a little part of the truth. Not a lot. And inside the newspaper,
a lot of information is cut, not offering more information. If I need to put in
percentage numbers, I think of 80% transparency in this branch. But this is
my opinion. It depends on the topic, history, political situations. (...) We need
more transparency, even in sports newspapers, we are not researching a lot
of things, and that's a mistake.
Miguel Angel Carbonero from Marca mentioned that the transparency of
sports information was in a good level when the information does not enter into
politics and sports journalists had more chance to access data when they don’t
enter into politics or economics and added:
When there is political involvement, transparency is bad. Many times in sports
journalism have the possibility of not getting too involved in shady issues. The
football business moves a lot of money in Spain, but also with many political
interests. They are very important companies, the management behind and
then is usually shielded. I think that a lot and it's a problem we have in our
profession. (...) But it is getting worse and worse because of the institutional
secret generated by large corporations such as big football clubs or institutions
that even representatives of football stars.
Ruben Gimeno from Marca pointed to the similar topics and expressed his
concern for the trustworthiness of economical data in sports as:
If we are talking about football, sometimes I don't feel that signings are very
clear or very transparent. We do a lot of graphics in this like the most
expensive guy in sport this summer. And we make rankings with this data.
And I guess it's always something you don't know. So we publish this with our
data because then the journalists know the way that this contract was made.
And so we say 130 million, but you read in another newspaper and this is 135
million. So it's not very transparent, if you don't know the contracts very well.
Carlos Forjanes from AS mentioned the lack of transparency in football clubs
except Real Madrid and FC Barcelona. He explained his opinions and criticism
about the Spanish Football Federation as:
221
Transparency is not really good, besides Real Madrid and FC Barcelona's
annual reports. The transparency in sports here in Spain? I'm not on the same
page. Spanish Football Federation has scandals.
Tomas Alhambra from Marca claimed that there’s no transparency in sports
data except game statistics and explained:
It is not very transparent. We depend on private clubs and private clubs offer
less information. It's better for them because those are personal data. So it
seems to me that there is not much information. Except for what happens on
the pitch of football, basketball, tennis matches, there is nothing.
Miguel Angel Lara from Marca pointed to the different topic and claimed that
the data needs control by the journalist because of the trustworthiness issues.
When I search for data, it may not be right. It may be pretty good generally,
but sometimes not. That's why I have to find two or three more sources, at
least to see that it matches.
Ferran Morales from Mundo Deportivo supported the statements of Miguel
Angel Lara and mentioned the importance of finding additional data sources in
Mundo Deportivo as:
When we generate the data, we verify it a lot. In other words, we not only
choose a site and implement it, but we contrast it with different sources to
make it true. In other words, we try that the work that we reproduce is as
truthful as possible.
Consequently, it was seen that interviewees had different concerns
regarding the transparency of information in Spain both in general and in sports
data. Almost all interviewees stated that the transparency of information had to
be improved in Spain, but the current level was better than the past. To achieve
this, the law and its enforcement powers to implement were needed
improvements. According to the statements of the interviewees, the other
challenge against the transparency law in Spain was the politic culture and its
222
opaque style of information. It was also observed that there were concerns
regarding the transparency of sports data in Spain. Accessing sports data and its
transparency about a game was not a problem for the interviewees but it was hard
to access data when the topic was crossed with economical and political issues.
Because of the sports business in Spain, there were too many strong companies
and also politics were involved in sports and this situation was decreasing the
transparency in the sports industry. Lastly, interviewees mentioned the lack of
trustworthiness of data on the web and stated that the data had to be checked
more than 2 to 3 more sources to create an article with that data.
5.3. Being a Data Journalist in Spain
In this section, investments and opportunities in newspapers to gain data
journalism skills and also the necessary skills to work as a data journalist in
Spanish newspapers were discussed with journalists, data journalists, and
infographic artists. Interviewees discussed that not all the newspapers were
promoting education at the same level but expecting the same skills from their
staff.
5.3.1. Investment in Data Journalism in Spanish Newspapers
Interviewees explained the courses, training, and the opportunities
regarding the improvement of data journalism skills of the journalists and
investment in data journalism in the Spanish newspapers. It was observed that
the journalists, data journalists, and infographic artists had options to gain data
journalism skills both internally and externally but the main challenge was learning
the skills personally and after the working hours. Dario Ojeda from El Confidencial
mentioned that he was currently taking a data journalism course from El Pais
Journalism School but El Confidencial didn’t pay for the course. His colleague Jesus
Escudero mentioned that he was taking a R course independently however, El
Confidencial could pay for extra training of journalists after a negotiation. Escudero
also mentioned that El Confidencial organized a SQL course in 2017 but didn’t
continue to extracurricular courses for journalists. Carlos Forjanes and Fernando
Robato from AS pointed to the lack of education in AS. Forjanes mentioned that
223
AS had a virtual campus to gain journalistic skills but it was not efficient and
added:
We have a virtual campus like an online education, but it's only based on
videos. It's really difficult to learn by watching videos. For example the video
says: “try to get this data and write an article about it”. But I don't have
someone to guide. This is the wrong way to do it as a lesson.
Ferran Morales and Roger Guillamet mentioned that Mundo Deportivo had
no extra training, or an online system to gain new skills. Morales stated that the
management team of the newspaper was willing to support journalists to learn
new skills as:
Normally we propose it, we look for the trainers to optimize us in the training
on data and then we go in our direction as we want. It is because we
encourage training. In other words, we ask for it, not because the company
gives it to us, but because it is a bit of our requirement to learn new skills.
When we ask it the company gives it to us.
Daniele Grasso mentioned the El Pais Journalism School and stated that El
Pais were willing to pay for extra training for journalists. He exemplified the
attitude of El Pais towards extra courses to gain skills as:
I know that I can ask for training like a Python course. And they will pay for
me to do something like this. I'm actually planning to ask for something like
that this summer, and I know that it won't be a problem in theory.
Marta Ley and Paula Guisado mentioned that El Mundo had a school of
communication and journalism and they could take various types of training both
on-site and online. Ley also mentioned that they have a data journalism course in
the school of journalism and communication and journalists could ask for extra
training outside to gain new skills such as a D3 course she was taking recently.
Guisado supported the statements of Ley and added:
224
I think it's by law that big companies have to put some money on education
but it is not that big, because it's expensive. But some people can ask for a
master's degree and then the company pays for a part of it. There are different
options. And people usually are doing stuff for education here. They offered
different lectures to us. For example next Monday we have a lecture and we'll
talk about digital journalism. So they are usually doing that kind of stuff.
Interviewees from Marca mentioned that they had also options to ask for
extra training and also they were using the school of journalism and
communication with El Mundo because Marca and El Mundo belonged to the same
company. Tomas Alhambra from Marca explained some courses they took in the
newsroom as data journalism and D3 and added:
Even if you have a course that you are interested in doing, you comment on
it and they can even pay you a part of it or maybe the whole. In other words,
everything is for promoting the training of an employee.
Lorenzo Lara supported the statements of Alhambra and explained his
experience with the company. Lara stated his Master’s Degree in Investigative
Journalism he did last year and told that the company financed his course. Miguel
Angel Carbonero explained the effects and the benefits of the courses inside the
company as:
For me the courses were very beneficial, very dense and very difficult to
transfer everything we have learned from the courses to the professional
exercise, but they opened us a little bit the perspective and we got a little up
to date, especially in D3. We found it very complex development for the day
to day because of the little time we have, but it did open our minds. The
company has trained us in that sense and allowed us to train if we want. They
give aid and there is always good disposition on the part of the company. It
is a thing to be thankful for.
Consequently, it was observed that not all of the newspapers were
interested in the training of the stuff. El Confidencial and Diario AS were not willing
to pay for extra training and master degrees. Dario AS had a virtual campus to
gain journalistic skills but it was offering videos only. Without someone to guide
225
the journalists, videos on the virtual campus were not efficient to gain new skills.
It was seen that Marca and El Mundo which belong to the same company were
supporting the staff with the school of communication and journalism and also
with paying options for the journalists’ extra training and master degrees they
took outside of the newsroom. It was also seen that El Pais had the same structure
which is a school for journalism and the company were willing to pay journalists
for their own training they took outside. Mundo Deportivo was also promoting the
staff to learn new skills and willing to pay for extra courses. To sum up, it was
observed that Mundo Deportivo, Marca, El Mundo, and El Pais were promoting
education and supporting the newsroom staff to gain new skills with internal
education and providing economic support for external education while El
Confidencial and Diario AS were not investing enough budget for the trainings of
journalists.
5.3.2. Expected Skills from Data Journalists in Spanish Newspapers
The interviewees pointed to the different skills that they’re expecting from
a data journalist. It was observed that the interviewees' expectations from a data
journalist was changing based on their profession. Journalists mentioned more
about the knowledge of the topic while data journalists were asking different points
of views towards the stories and infographic artists were expecting more technical
skills. However, all interviewees agreed that a data journalist should have an
ability to do everything, but it was hard to find all skills in one person. Daniele
Grasso from El Pais mentioned some personal characteristics were expected from
data journalists because according to him, data visualisation programs could be
learned and explained:
Basically, solving problems that other people can’t solve. Because of the
amount of data, it's suspected that you can solve this problem. And then, the
skill to see stories in data that other people don't see. I mean, we can't pitch
stories that were the same stories pitched by other people. You always have
to be different from the others.
Ruben Gimeno from Marca claimed that to see stories in data, a data
journalist should have an understanding of the topic and the numbers. According
226
to Gimeno, that was the only way to create a different data journalism article
because traditional news writing was not that hard. Gimeno also added:
I think the news with graphics is much better if you know what you want to
tell. Because we see graphics in every paragraph we read. We see a lot of
graphics. You need to be able to see graphics everywhere, that is another skill
that is needed.
Lorenzo Lara from Marca pointed to the importance of being enthusiastic
about working with data and explained:
I think that the data journalist has to be passionate about his/her work.
Fundamentally you have to be in love with data. Because not everyone likes
it. And then you have to have a minimum technological training to be able to
scan, to be able to store that data, to be able to consult it, to analyze it. I
think you have to have technological training.
Jesús Escudero from El Confidencial stated a similar expectation from a data
journalist and mentioned the importance of gathering data to find a hypothesis for
a data journalism project. However, Escudero mentioned that the most important
skill was liking to work with data as Lorenzo Lara mentioned and added:
I think that the main tasks for data journalists are the ability to gather data
with transparency law, scraping data with Excel and spreadsheets. Because
90% of our time is for gathering information to compile, clean and analyze
them. We must be very good in this area. Gathering process and the opinion
process is very tedious. So if you don't like it, you can't do it. You must like
that process.
Dario Ojeda from El Confidencial pointed to the importance of the data
extraction process and claimed that a data journalist had to dominate Excel.
According to Ojeda other programs such as Tabula and Finereader were valuable
for a data journalist but when a data journalist dominated Excel, he could do
everything. Tomas Alhambra pointed to the same skill for a data journalist and
explained the most important skills as knowing how to handle databases and
technical skills to scrape websites to gather information.
227
Marta Ley from El Mundo and Miguel Angel Carbonero from Marca and Roger
Guillamet from Mundo Deportivo mentioned mostly the technical skills needed to
be a data journalist. According to the interviewees’ statements the technical skills
were knowing how to use Excel, Tableau, Carto, Flourish, Datawrapper, Illustrator
and also SEO. According to the statements of Ferran Morales from Mundo
Deportivo, it was unnecessary to talk about programs to use. Morales claimed that
the first skill a data journalist had to have was combining two professions which
are infographic artist and journalist and explained:
I believe that until they are merged, not much depth will be extracted.
Because the journalist does have the structure, the narration, the infographic
artist is clear about the visual part. The writer has the facility to search in
data, but the fact of capturing data, optimizing it are different. It is not a
priority now but I think it would be a very important part. In other words, the
journalist should be trained as he has made freedom in the media so that the
normal news editor knows how to capture data, synthesize it, visualise it
better. This is a necessity. I think it would be quite interesting that the editor
knows how to work with data more quickly every day.
Consequently, interviewees explained their expectations from a data
journalist in different topics. Firstly, a data journalist had to like working with data
and have a problem-solving skill. A data journalist had to have the characteristics
of a journalist and an infographic artist to be a good data journalist. Lastly, when
a data journalist combined the personal skills, s/he had to gain technical skills and
learn how to use related programs such as Excel, Tableau, Carto, Flourish,
Datawrapper, Adobe, etc.
5.4. Current Environment in Spanish Newspapers After Integrating Data Journalism
In this section, current working conditions and changes in the workload
after the integration of data journalism in Spanish newspapers, current needs to
create better data journalism articles, and newspapers’ economic motivations
were discussed with journalists, data journalists and infographic artists.
228
5.4.1. Working Conditions of Journalists in Spanish Newsrooms After Data Journalism
According to the statements of the interviewees, some changes were
observed in the newsroom after integrating data journalism to the journalistic
practice of the newspaper. Interviewees stated that the changes happened in daily
schedule and workload but not in salaries. Most of the interviewees stated that
they were satisfied with their current salary and working conditions when it’s
compared to the journalism environment in Spain. Jesús Escudero from El
Confidencial mentioned that he was happy with his working conditions and salary
according to the economical situation in Spain but he stated that the working
conditions were lower than other countries such as the USA and UK and explained
the reason of the lower conditions as the traditional journalism culture in Spain.
Interviewees from Marca also stated that they were satisfied with the salary and
working conditions however they had problems in time management for data
journalism articles. Lorenzo Lara from Marca mentioned that he was happy with
his conditions but he would like spend more time for data journalism and added:
It is true that I miss having a little more time to be able to do true journalism
of data. (...) Data journalism is what I do in my free time. But there are people
who have different hobbies, mine is data . So it's a problem and an advantage.
Roger Guillamet from Mundo Deportivo supported the statements of Lara
and mentioned the current problems in Spanish data journalism as precariousness
in the sector and the time management problems in data journalism and
explained:
In general, I think there is precariousness in journalism, the working
conditions are not what they should be and each newspaper has to see how
it evolves. We know that the sales of the paper newspaper are falling and that
means that the future of the newspapers is in question and it is not known
what the model is. Then the conditions should be better. We are happy in the
newspaper in the sense that there is a good working environment. We like the
theme, we like to work on what we have studied, but there would be many
things to improve and we will see over time to see how it evolves. And the
229
other issue is that what we were saying was that we would like to do more
data journalism and less daily paperwork, for example.
Fernando Robato from AS, Paula Guisado from El Mundo, Ferran Morales
and Roger Guillamet from Mundo Deportivo and Daniele Grasso from El Pais also
mentioned that they were satisfied with their conditions however they also
mentioned that the working conditions in Spanish press needed to be improved.
Daniele Grasso from El Pais mentioned that data journalists’ salaries were less
than it had to be however because of their freedom in El Pais, they were satisfied
in this moment. Ferran Morales from Mundo Deportivo mentioned that the title
“data journalist” became more common in Spain, the conditions will be better
because according to Morales there were still two different positions were needed
in data journalism in Spain: a journalist and an infographic artist, he also added:
The salary of the data journalist will be higher, because they are specialized
people and there will be less complexity, but currently this is not the case. It
is still the conventional redactor. It will be charged more from the profiles that
can be demanded of data journalism, data visualisation, infographics.
Interviewees who came from traditional journalism or graphic design
backgrounds also stated that data journalism had changed their working
conditions and current proficiency level. Carlos Forjanes from AS also claimed that
their working conditions had changed because sometimes they needed to work in
their free times because the working hours of sports journalism were variable
depending on the leagues and tournaments. Tomas Alhambra from Marca also
stated that data journalism was changing the working environment in Marca
because in time there were more people involved in data journalism. Miguel Angel
Lara supported the statements of Alhambra and claimed that the infographics
section had more workload after integrating data journalism to the newsroom and
explained:
The infographic section has grown a lot. Since I joined the newspaper it has
grown a lot. I rely a lot on them. I ask for a lot of data. I ask many things
because for me it is fundamental. They are increasingly a priority element.
The text can be good, but I think that a good graphic does a lot at the visual
230
and informational level, because you can find many things with a glance. Since
all the text can bore people, it can cost you more than one graphic to explain
many things. So they're important for us.
Lorenzo Lara also claimed that data journalism had increased the workload
but also made him a better journalist and added:
Since I've been working on this, I think it has helped me improve. I am
convinced that I see myself much more educated, much more with clearer
ideas. And I would like to do many more things that I can not do.
Consequently, interviewees stated that their working conditions were
changing, there were more workload but the organization in the newsrooms were
also changing because in time there were more people involved in data journalism.
Because of the increased number of data journalists their daily work plan was
getting simpler and more organized. In addition, Jesus Escudero from El
Confidencial and Daniele Grasso from El Pais stated that the fundamental
integration of data journalism to newsrooms could be possible if the tendency of
traditional journalism and connectivity to breaking news in Spain changed.
5.4.2. Current Needs in Spanish Newspapers for Better Data Journalism
It was observed that interviewees mentioned some necessities in their
newsrooms to create better data journalism articles. All interviewees from 6
newspapers mentioned a web developer was the main necessity and more people
who are dedicated to create only data journalism articles were needed.
Interviewees mentioned specialized people in some programs or interactivity as a
current need. Tomas Alhambra from Marca explained this need as:
I believe that the main problem or lack that we have is technical people
specialized in representation like programmers. We were the ones who had to
redo our orientation and because before, the graphics were made in Illustrator
and Photoshop. Now you need a lot more resources because there are a lot
more tools. You need to handle a lot more tools than ten years ago.
231
Ruben Gimeno supported his colleague’s statements and added:
We need more time for things, but we don’t. This means we need more people,
someone who does programming. Someone that we give to him the idea and
work with him and do our job more completely and faster I think.
Other interviewees from Marca also mentioned the lack of people who do
programming and claimed that they could create better sports data journalism
articles if they had extra people. Carlos Forjanes, a sports journalist from AS,
pointed to the same necessity but Forjanes mentioned that AS needed to create a
specific data journalism department for better articles. Forjanes explained this
need with the sports journalism’s irregular working hours and workload and
according to him it was a challenge to create sports data journalism articles in this
workflow:
We can order from people in the data journalism department. For example we
can say "the winter market closes on the first of February. So I need a very
big article about crossing data with the spendings of Italy, Spain" etc. But If I
need to do that, I have to spend so much time. If you're a sports data
journalist, you can do it half the time than me, or even less. You will be really
fast. You will be more accurate than me. You have the tools, you have the
experience, you have everything you need to do that.
Fernando Robato from the infographics department of AS supported the
statements of Forjanes and pointed to that they need to use more tools and web
development to create better data journalism articles. According to the statements
of Robato, there were only 3 people in the department, the workload was too
much, and it was a challenge for them to spend more time in data journalism
articles. Robato mentioned the necessity as people who are specialized in
mapping, interactive visualisations, and coding. Marta Ley and Paula Guisado
pointed to the same necessity in El Mundo and stated that if they had a developer
and an interactive designer the workflow could have been better. Daniele Grasso
from El Pais pointed to a person who is specialized in interactive design as what
El Pais needs.
232
Ferran Morales explained the current needs in Mundo Deportivo as:
I believe that a data analyst that helps staff like us, who are more visual,
would be fine. And it would also be a programmer who is a specialist in Python
and R who helps us optimize so much data capture. I think that these two
aspects would go well to complement the visual part that we have totally
assimilated.
Interviewees also stated that it was hard to follow new tools and there was
a lack of time to follow new developments in data journalism. Because they had
the daily work and they needed more tools to create investigative projects. Jesús
Escudero from El Confidencial explained the reason as journalistic traditions in
Spain. He claimed that, to create better projects, they needed more tools and
more people. But to achieve this, Spanish journalism had to spend less time in
breaking news. According to Escudero, the first thing that the newsrooms had to
do was gaining a new vision and new ideas.
Consequently, it was observed that the interviewees from 6 newspapers
mentioned the same necessities in order to create better data journalism projects.
The starting point was adapting different points of views and then creating data
journalism departments. To achieve this, newspapers had to hire programmers
and web developers. This necessity was seen in the results of the level of
interactivity of the selected newspapers. Especially the national newspapers had
less than 10% interactive articles in the analyzed time period. In addition,
programmers and web developers were needed for the articles with conversational
interactivity which includes a two way communication with the reader through
integrating the reader to the article with personalisation options. Conversational
interactivity was not observed in Diario AS, El Mundo, El Periodico, and El Pais,
while Mundo Deportivo with 5.88% of the articles and Marca with 1.28% of the
articles. It was seen that statements of the interviewees were consistent with the
results of the quantitative analysis.
233
5.4.3. Economic Motivations in Data Journalism
It was observed that the interviewees explained their organizations’
economic motivations to adapt data journalism as advertising incomes and
sponsored contents. Interviewees mentioned their ideas about subscription
models in newspapers and claimed that subscription models were quite new in
Spain. Jesús Escudero mentioned that El Confidencial had a subscription system
but the main economic motivation was advertisement incomes. Escudero stated
that increasing advertising incomes were coming from the increase content quality
and added:
Our bet is for quality. We can say “in data journalism we've got these great
products". The thing is that when you have a lot of views, you earn more
money with advertisements.
Paula Guisado and Marta Ley mentioned that a subscription model was
started in El Mundo because data journalism added value to the newspaper.
According to Gusaido’s statements, the management team of El Mundo adapted
data journalism as quality content they could sell. Marta Ley supported the
statements of Guisado and added:
With the payment strategy, which is very recent, we have been told that the
type of information in our data section is more favorable to being paid because
it is different.
Daniele Grasso mentioned the reason of creating a data department in El
Pais as using data journalism as a source of income and they were starting a new
subscription model:
I think that the data unit is also a way to create different stories and let people
pay for them. This is another reason that it was created.
Tomas Alhambra stated that Marca was preparing ad-free premium
subscriptions but this was still an idea. His colleague Miguel Angel Carbonero
claimed that subscription strategy was not necessary for Marca because when they
234
created a quality content, incomes came from advertisement or sponsored
contents and added:
Subscription strategy needs very dense data content. We are not very
interested in very specific data content because it consumes a lot of time and
being free gives us an added value. This is only used when the added value
can have an advertising revenue. In that strategy, you have to give the reader
something quality and something a little more. And you always try to enhance
the visual.
Ferran Morales also mentioned that the economic motivation of Mundo
Deportivo was advertising incomes and branded contents and subscription models
were not a necessity for sports data journalism in Spain because sponsored
contents had more potential than subscriptions. Roger Guillamet pointed to the
same issue and claimed that when newspapers created a quality content, the
reader engagement was increasing and became an income for newspapers.
Carlos Forjanes from AS mentioned that the motivation of doing data
journalism was illustrating the article better without any economic motivation.
Fernando Robato also stated that AS did not need a subscription model right now,
but could be created for the future when the quality of data journalism increased
more. According to Robato, the problem was that the companies’ were trying to
earn money from data journalism without created a special content and added:
People always pay when you offer information with really high quality. I don't
want to read the same thing in the newspaper that I can read in the blog or
on Twitter. That is a huge mistake in the newspapers. If you want to build a
paywall you need to offer quality to the people and the only way to get quality
is to invest in people. So many organizations are trying to get rich without an
investment in people and resources.
Consequently, interviewees from 6 newspapers presented their opinions
about the economic motivations behind the adaptation of data journalism in the
newsrooms. It was observed that the sports newspapers had no special economic
intention towards data journalism and they were not seeing subscription as a
235
need. Sports newspapers’ economic motivations to do data journalism were
advertising incomes and sponsored contents with increasing reader engagement
through quality content. Subscription models were seen in El Confidencial, El
Mundo, and El Pais and it was observed that national newspapers were trying to
adapt quality data journalism to the newsrooms to use data journalism as an
income for the newspaper. In this point, a contradiction was observed in the
economic motivations and investments. El Confidencial and Diario AS were using
data journalism as an income source for the newspaper but they were not making
the necessary investment to the education of the staff to publish better articles.
It was observed that Mundo Deportivo, El Pais, El Mundo, and Marca were
investing in data journalism and supporting the education of the staff and
transforming the new skills of the staff to an income source with quality data
journalism articles.
5.5. Reader Engagement in Data Journalism
In this section, reader engagement in data journalism was discussed with
journalists, data journalists and infographic artists. Interviewees mentioned the
changes in the engagements in traditional journalism articles and data journalism
articles and how to catch the reader’s attention through data journalism articles.
Interviewees also mentioned their ways to measure reader interest.
The interviewees explained the engagement with readers through data
journalism articles and differences in engagement between traditional and data
journalism articles. It was observed that the interviewees mentioned a better
engagement with readers through data journalism. Jesus Escudero from El
Confidencial mentioned that the successful engagement was based on time spent
in a piece and added:
I think that data journalism projects are well valued by people. Not only from
the number of visits, but mostly from the engagement time. They spend more
time on data journalism projects. So it's easier to engage with readers.
Daniele Grasso from El Pais mentioned that the engagement was high if the
newspaper was able to sell the story. According to the statements of Grasso, the
236
success rate of reader engagement was based on promoting the article in a correct
way and level of deepness of the story and added:
I have seen really great stories not really well sold on the homepage. So they
didn't generate much engagement. And there were stories that have much
engagement because they were sold. On the other hand, even if people don't
read it, they can see a big investigation story. So the newspaper is looking for
this kind of stuff.
Fernando Robato from AS also mentioned the effectiveness of data
journalism articles and claimed that the engagement was more easy with visuals.
According to Robato, people were likely to engage with the data journalism articles
because it was easier to get information through visuals. Carlos Forjanes from AS
mentioned that the higher engagement was seen in infographics and photo
galleries and these articles were more likely to be shared by people in social media.
Paula Guisado from El Mundo supported the statements of Forjanes and claimed
that people were more likely to spend time in infographics and photo galleries.
According to the statements of Guisado people were staying in the infographics
very long and this engagement time was followed by photographs.
Lorenzo Lara from Marca also supported the statements of Fernando Robato
and claimed that data journalism articles were getting more engagement than
traditional articles and explained the reason as the convenience of the data
journalism articles. Miguel Angel Lara pointed to the same ideas and added:
I think people appreciate it. For people, it is a type of journalism that
appreciates what they like, because, in the end, it is easier for them. It's more
direct. You can tell them that a player shot with his left leg 30 times more
than his right leg with a visual. It draws attention.
Marta Ley from El Mundo mentioned that the engagement of data
journalism articles were generally higher than the traditional articles but the
success were coming from choosing the right topic:
237
When we publish a graphic that perhaps lends itself a lot to interaction. There
is a lot of engagement with that information more than with plain text. But it
doesn't always work the same either. It depends on the topic.
Miguel Angel Carbonero from Marca stated that the success of data
journalism articles were coming from the design of the visuals:
The infographics are much appreciated thanks to the web audience, but
consumption is starting to be very fast. So we have to filter a lot of what to
put in the infographic, because consumption is very fast.
Tomas Alhambra from Marca pointed to the same issues with Carbonero
and claimed that the interactivity in data journalism articles decreased because it
was a challenge to engage with readers through articles with high interactivity.
Alhambra stated that data journalism articles transformed to a simpler style not
to lose reader engagement and explained:
I think interactivity and graphics were valued more. But now, with the
appearance of the mobile screen, interactivity is not valued so much as it is
information that interests you. I think that on the mobile phone it is more
uncomfortable to press the buttons etc. Now what is being developed are
many web pages that as they swipe, show you the information with gif, with
small transitions. But you don't have to be clicking or doing anything
interactive. Because now they value simplicity and immediacy more. 80% or
85% of Marca users, which is usually a very young audience, already watch
the news through their mobile.
According to Ruben Gimeno from Marca, reader engagement in Marca
between data journalism and other articles were not much different from each
other, the engagement was regularly high because Marca was always a visual
newspaper:
I think that people are very used to seeing visuals in Marca. So the audience
expects this from Marca. (...) If you see the social media accounts of different
newspapers they do the same we do.
238
Dario Ojeda from El Confidencial claimed that when a newspaper presents
a story with data, the article was looking more trusted and getting more
engagement. Ferran Morales from Mundo Deportivo supported the statements of
Ojeda and mentioned that the data journalism articles were looking more
elaborate and this was getting more engagement. Because journalists needed to
spend approximately 30 minutes to write a traditional data journalism articles
while a data journalism article needs 2 weeks to 2 months:
Whenever we have done analysis work on a lot of data, the user has predicted
that we have taught concepts or data that without this differentiation would
not have been achieved. We have had a lot of feedback from the user. They
haven't asked us for more because they don't know what to ask for more, but
the reaction is very good, always.
Journalists, data journalists, and infographic artists mentioned that they
were not using specific tools to measure reader engagement. However, they were
getting metrics from the related departments of the newspapers and also receiving
feedback through social media, news comments, and emails. Dario Ojeda from El
Confidencial mentioned that he was measuring the engagement through his
Twitter account and sometimes he was receiving emails from readers. Jesus
Escudero also mentioned that they were checking social media shares and
comments, especially Twitter, to see the engagement rate of a data journalism
article. Miguel Angel Carbonero mentioned that they have an old feedback system
in Marca but the system was working for the registered users. Carbonero claimed
that Marca was giving more importance to social media metrics to understand
reader engagement. Carbonero also added that data journalism articles based on
gamification were the most engaged articles. Ruben Gimeno from Marca supported
the statements of Carbonero and stated that they were receiving briefings
regularly but journalists were analysing the reader engagement individually
through social media, comments, and emails and explained:
In infographics, the first feedback is in the comments of the people. When
people are writing about something which is not about your graphic, that
means your graphic is okay. Because if you make any mistake, like a number
or a spelling mistake, they're writing. So if they are talking about football this
239
means good. The second one, we post on Facebook, in individualized sections.
You feel that people like it or not, but you don't get a very intense response.
Interviewees from El Pais and Mundo Deportivo mentioned that they were
following metrics regularly to connect with readers in a better way and to
understand their expectations. Daniele Grasso explained the measurement of
reader engagement in El Pais as:
When we make big infographics, we always check the audience. I mean, how
many people read the piece? How much time do people stay in the piece? And
then we can check, for example, the maps. How many people actually used
the maps? Not only looking and saying "Oh, what a beautiful map" but they
start touching it to enter. So these are the main things. In a while, we will
learn how many people subscribed to us, it will be sent to our newsroom.
Ferran Morales and Roger Guillamet also pointed to that they were following
the feedback from social media, article comments, but they were also receiving
the metrics for data journalism articles. Ferran Morales explained the metrics they
received as:
We know what they like is by the time they spend looking at the page, which
is much higher than in a piece of conventional news that many people have,
but after 10 seconds they go. On our pages, as there are more visualisations,
more time is spent and it is one of the metrics for us. And I believe that
metrics are becoming more and more important in the media.
Roger Guillamet supported the statements of Morales and exemplified the
time spent on data journalism articles as:
Users may stay in normal news items for around 20 seconds or 30 seconds.
But for example, in some projects of Ferran, it reached 4 minutes or 5 minutes
on average. And this is a very important average in these times when
everything is so fast.
Consequently, interviewees from 6 newspapers explained their opinions and
experiences about reader engagement through data journalism articles.
240
Interviewees agreed that data journalism articles were getting more engagement
than traditional news articles. Journalists, data journalists, and infographic artists
from El Mundo, El Confidencial, Marca, and AS were mostly based on social media,
article comments, and emails to measure reader engagement while El Pais and
Mundo Deportivo were using professional metrics and social media metrics. It was
observed that reader engagement was affected by the design of the article and
how a newspaper was selling that article. According to the design of a data
journalism article, some interviewees claimed that they started to create simpler
designs because the readers were using mostly mobile phones to access the article
and it was easier to get information with simpler designs through mobile. It was
also seen that readers were engaging more with the data journalism articles
because giving statistical information with visuals was drawing attention of
readers.
5.6. Journalists' Opinions on Data Journalism and Its Future in Spain
In this section, the current situation and the future of data journalism in
Spain, negative and positive expectations for the future were discussed with
journalists, data journalists and infographic artists. Interviewees’ explanations
were the basis of the workload in the newsrooms, difficulty in data access, and
lack of formation to explain the current situation of data journalism in Spain.
It was observed that the interviewees stated different points of views about
data journalism and its future in Spain. Some interviewees evaluated the current
situation of data journalism in Spain and stated the necessities. Jesús Escudero
from El Confidencial stated that a progress could be seen in data journalism in
Spain however the problem is lack of time in the newsrooms. Escudero pointed to
the increased amount of breaking news and mentioned that breaking news, as a
traditional journalism environment in Spain, was an obstacle against the
improvement of data journalism. According to Escudero, data journalism articles
could be created by journalists everyday but the progress could happen with
quality articles and daily data journalism articles were not in the desired level.
241
Escudero mentioned that the bright future was a possibility if the number of the
data journalism articles decreased while the quality was increasing and explained:
I think that we, data journalists, have to build our own databases to gather
our own information to create original products. And I think that I would like
to work for that. We don't have this ability in Spain yet. You can do many
articles but from my point of view, in less articles you have better quality. In
the quality and the quantity you must choose something. You can think that
you must do some reporting, longform projects, and also daily projects. But
you must give up one of them.
Miguel Angel Carbonero from Marca also pointed to the negative sides of
data journalism in Spain and claimed that the problems were over information and
the newspapers' point of views towards data journalism:
Data journalism is a tool for the journalist to generate news. It is not
interesting to have a large database. The interesting thing is to cross two
databases, get news, draw conclusions and then you use visualisation.
Because you're not interested in dumping so much data to an audience.
Precisely the big problem now is about information. There is abuse of over
information, there are problems that sources are contrasted. I think that
instead of focusing everything on seeing who makes the most complete
visibility with more colors, the important thing is to see who takes a large
database and pulls out the fact which is really meaningful or gives you
alarming news about an issue or a conclusion.
Ruben Gimeno from Marca supported the statements of Carbonero and
stated that he was enjoying data journalism articles but sometimes he was not
interested in the articles because every topic was not suitable for data journalism.
Gimeno claimed that if the quality was not increased, interest in data journalism
in Spain could decrease.
Positive and negative opinions for the future were seen in the statements
of the journalists, data journalists, and infographic artists. Dario Ojeda from El
Confidencial mentioned a bright future for data journalism in Spain, especially in
sports, because the use of data was improving slowly, and was on the rise
242
recently. Lorenzo Lara from Marca explained the bright future of data journalism
in Spain as:
I think it is a specialization within our profession, which has a long history. I
believe that many steps are being taken and each time I believe that we are
better. We are improving, we are learning and we are progressing, but I think
we have a good future.
Miguel Angel Lara supported the statements of Lorenzo Lara and claimed
that there were good profiles in the sector and data journalism was likely to grow
and consolidate. Fernando Robato from AS shared similar opinions with the
interviewees from Marca and stated the development of data journalism in Spain.
However, Robato explained the necessities to achieve better data journalism in
Spain as:
If you want to use data journalism, you need to have your own department
like El Pais and produce your own visualisations, your own information. So in
this direction is an open future, but not using only data visualisation. We need
to integrate data journalism in other parts. It's like when you are the director
of an orchestra. You can use the different instruments and the way you mix
them for the symphony. You have to mix it, and then take the best one.
Ferran Morales from Mundo Deportivo stated that a significant increase
towards data journalism was seen but this process was going slowly in Spain and
explained:
I think that every time the competition in quality goes up. So every time we
have the obligation to do more data journalism content. In other words, it is
not a fashion that has come and will go. That will be increasingly important
within the media.
Roger Guillamet pointed to the increased interest in data journalism and
explained the reason for this interest as the current environment of fake news.
According to Guillamet, audiences were appreciating stories with data because it
was more trustable.
243
According to Carlos Forjanes from AS, Daniele Grasso from El Pais, and
Paula Guisado from El Mundo, the future of data journalism was based on the
future of journalism in the world because journalism was changing and losing
readers constantly. Carlos Forjanes linked the decreased interest in newspapers
with technology and stated that data journalism was needing more engagement
than the current average, which was approximately 20 seconds, and this was a
disadvantage. Forjanes mentioned that the Spanish data journalism was not
innovator and this was another disadvantage for the future and exemplified:
For example, in TVs, they try to experiment. They're playing with that kind of
stuff which is more creative. I think that the user is receptive to that kind of
innovation. Even for somebody that is a more passive user. We need this in
newspapers. For myself, I like to play with infographics. But I know that the
engagement is 20 seconds, people are reading the first three lines. So you
have a limited time to show the infographic.
Paula Guisado from El Mundo pointed to the future of journalism and
claimed that it was unclear. According to Guisado, a progress in Spanish data
journalism was based on the changing path of journalism in general and claimed
that the future was not bright enough. Guisado mentioned that the data units in
the newspapers will be continuing in future, however, there won’t be data
journalists in the newspapers and explained:
A couple years ago, I felt that the logical path for data journalism was not to
be in a unit to spread. So there will be people in sections who know how to
deal with data. So they will do the normal job but also have this background.
Because you need time for data, and I don't think that Spanish newsrooms
can give that time to people. So probably there will be a data unit in some
newspapers. But it's not a bright future.
Daniele Grasso from El Pais stated similar opinions with Guisado and
claimed that data journalism will be an academic practice or a label for people in
future. Grasso mentioned that he was expecting a philosophical change in data
journalism than a practical one in future because data was important and in future
data will be integrated to journalism in general and added:
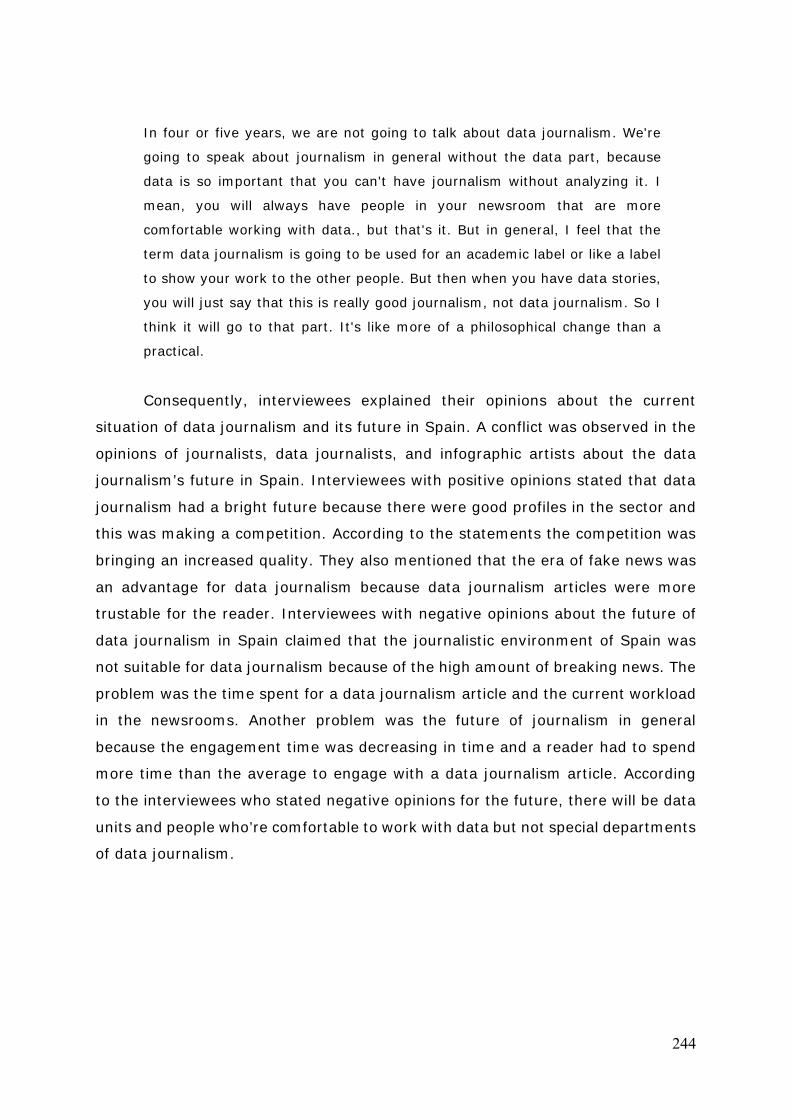
244
In four or five years, we are not going to talk about data journalism. We're
going to speak about journalism in general without the data part, because
data is so important that you can't have journalism without analyzing it. I
mean, you will always have people in your newsroom that are more
comfortable working with data., but that's it. But in general, I feel that the
term data journalism is going to be used for an academic label or like a label
to show your work to the other people. But then when you have data stories,
you will just say that this is really good journalism, not data journalism. So I
think it will go to that part. It's like more of a philosophical change than a
practical.
Consequently, interviewees explained their opinions about the current
situation of data journalism and its future in Spain. A conflict was observed in the
opinions of journalists, data journalists, and infographic artists about the data
journalism’s future in Spain. Interviewees with positive opinions stated that data
journalism had a bright future because there were good profiles in the sector and
this was making a competition. According to the statements the competition was
bringing an increased quality. They also mentioned that the era of fake news was
an advantage for data journalism because data journalism articles were more
trustable for the reader. Interviewees with negative opinions about the future of
data journalism in Spain claimed that the journalistic environment of Spain was
not suitable for data journalism because of the high amount of breaking news. The
problem was the time spent for a data journalism article and the current workload
in the newsrooms. Another problem was the future of journalism in general
because the engagement time was decreasing in time and a reader had to spend
more time than the average to engage with a data journalism article. According
to the interviewees who stated negative opinions for the future, there will be data
units and people who’re comfortable to work with data but not special departments
of data journalism.

245
SECTION IV: CONCLUSIONS AND DISCUSSION
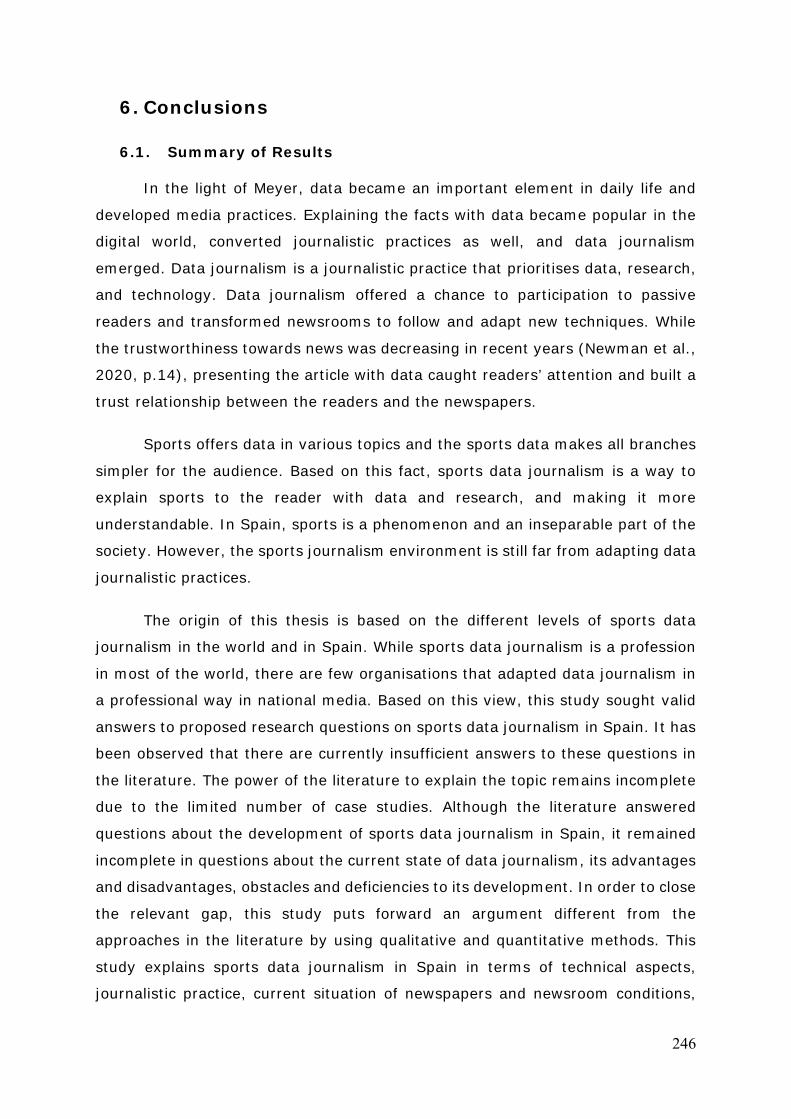
246
6. Conclusions
6.1. Summary of Results
In the light of Meyer, data became an important element in daily life and
developed media practices. Explaining the facts with data became popular in the
digital world, converted journalistic practices as well, and data journalism
emerged. Data journalism is a journalistic practice that prioritises data, research,
and technology. Data journalism offered a chance to participation to passive
readers and transformed newsrooms to follow and adapt new techniques. While
the trustworthiness towards news was decreasing in recent years (Newman et al.,
2020, p.14), presenting the article with data caught readers’ attention and built a
trust relationship between the readers and the newspapers.
Sports offers data in various topics and the sports data makes all branches
simpler for the audience. Based on this fact, sports data journalism is a way to
explain sports to the reader with data and research, and making it more
understandable. In Spain, sports is a phenomenon and an inseparable part of the
society. However, the sports journalism environment is still far from adapting data
journalistic practices.
The origin of this thesis is based on the different levels of sports data
journalism in the world and in Spain. While sports data journalism is a profession
in most of the world, there are few organisations that adapted data journalism in
a professional way in national media. Based on this view, this study sought valid
answers to proposed research questions on sports data journalism in Spain. It has
been observed that there are currently insufficient answers to these questions in
the literature. The power of the literature to explain the topic remains incomplete
due to the limited number of case studies. Although the literature answered
questions about the development of sports data journalism in Spain, it remained
incomplete in questions about the current state of data journalism, its advantages
and disadvantages, obstacles and deficiencies to its development. In order to close
the relevant gap, this study puts forward an argument different from the
approaches in the literature by using qualitative and quantitative methods. This
study explains sports data journalism in Spain in terms of technical aspects,
journalistic practice, current situation of newspapers and newsroom conditions,
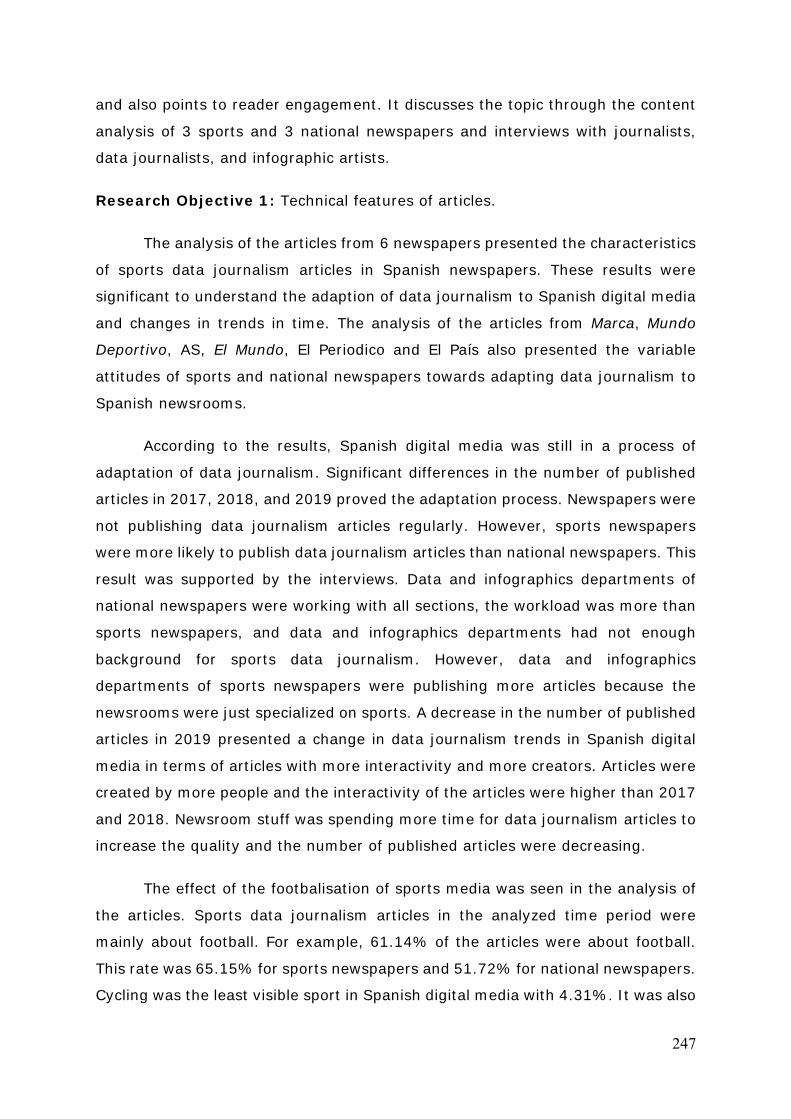
247
and also points to reader engagement. It discusses the topic through the content
analysis of 3 sports and 3 national newspapers and interviews with journalists,
data journalists, and infographic artists.
Research Objective 1: Technical features of articles.
The analysis of the articles from 6 newspapers presented the characteristics
of sports data journalism articles in Spanish newspapers. These results were
significant to understand the adaption of data journalism to Spanish digital media
and changes in trends in time. The analysis of the articles from Marca, Mundo
Deportivo, AS, El Mundo, El Periodico and El País also presented the variable
attitudes of sports and national newspapers towards adapting data journalism to
Spanish newsrooms.
According to the results, Spanish digital media was still in a process of
adaptation of data journalism. Significant differences in the number of published
articles in 2017, 2018, and 2019 proved the adaptation process. Newspapers were
not publishing data journalism articles regularly. However, sports newspapers
were more likely to publish data journalism articles than national newspapers. This
result was supported by the interviews. Data and infographics departments of
national newspapers were working with all sections, the workload was more than
sports newspapers, and data and infographics departments had not enough
background for sports data journalism. However, data and infographics
departments of sports newspapers were publishing more articles because the
newsrooms were just specialized on sports. A decrease in the number of published
articles in 2019 presented a change in data journalism trends in Spanish digital
media in terms of articles with more interactivity and more creators. Articles were
created by more people and the interactivity of the articles were higher than 2017
and 2018. Newsroom stuff was spending more time for data journalism articles to
increase the quality and the number of published articles were decreasing.
The effect of the footbalisation of sports media was seen in the analysis of
the articles. Sports data journalism articles in the analyzed time period were
mainly about football. For example, 61.14% of the articles were about football.
This rate was 65.15% for sports newspapers and 51.72% for national newspapers.
Cycling was the least visible sport in Spanish digital media with 4.31%. It was also
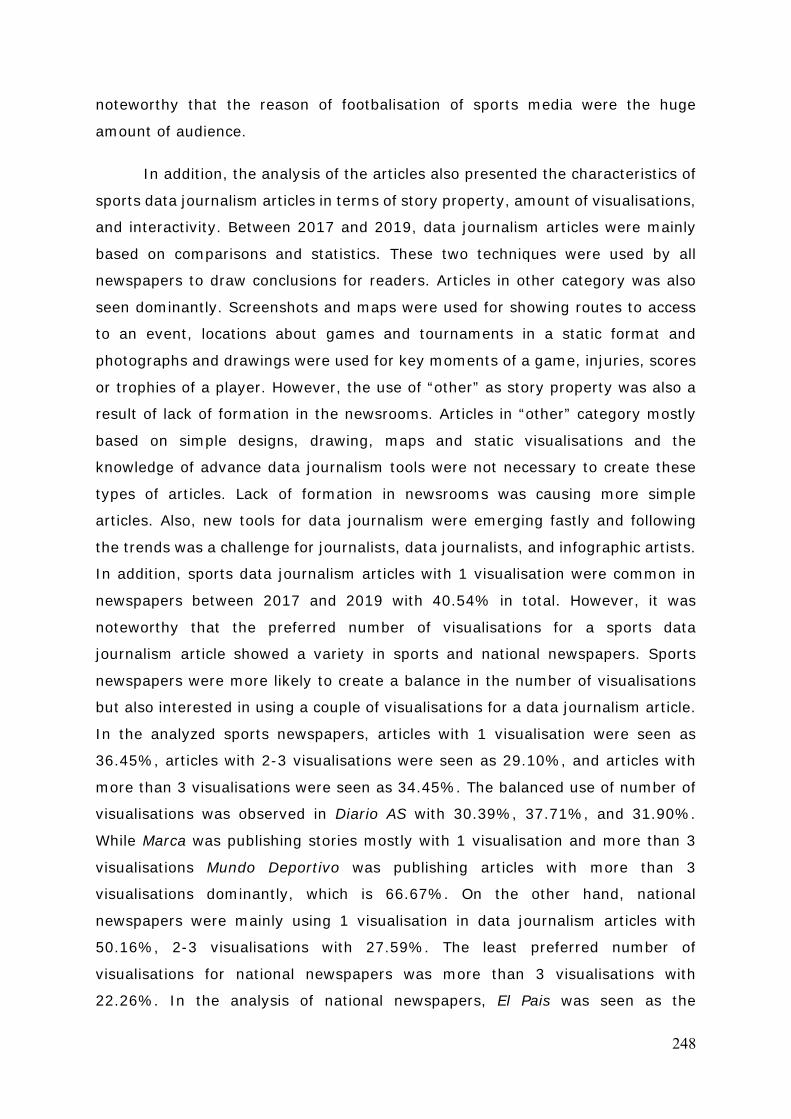
248
noteworthy that the reason of footbalisation of sports media were the huge
amount of audience.
In addition, the analysis of the articles also presented the characteristics of
sports data journalism articles in terms of story property, amount of visualisations,
and interactivity. Between 2017 and 2019, data journalism articles were mainly
based on comparisons and statistics. These two techniques were used by all
newspapers to draw conclusions for readers. Articles in other category was also
seen dominantly. Screenshots and maps were used for showing routes to access
to an event, locations about games and tournaments in a static format and
photographs and drawings were used for key moments of a game, injuries, scores
or trophies of a player. However, the use of “other” as story property was also a
result of lack of formation in the newsrooms. Articles in “other” category mostly
based on simple designs, drawing, maps and static visualisations and the
knowledge of advance data journalism tools were not necessary to create these
types of articles. Lack of formation in newsrooms was causing more simple
articles. Also, new tools for data journalism were emerging fastly and following
the trends was a challenge for journalists, data journalists, and infographic artists.
In addition, sports data journalism articles with 1 visualisation were common in
newspapers between 2017 and 2019 with 40.54% in total. However, it was
noteworthy that the preferred number of visualisations for a sports data
journalism article showed a variety in sports and national newspapers. Sports
newspapers were more likely to create a balance in the number of visualisations
but also interested in using a couple of visualisations for a data journalism article.
In the analyzed sports newspapers, articles with 1 visualisation were seen as
36.45%, articles with 2-3 visualisations were seen as 29.10%, and articles with
more than 3 visualisations were seen as 34.45%. The balanced use of number of
visualisations was observed in Diario AS with 30.39%, 37.71%, and 31.90%.
While Marca was publishing stories mostly with 1 visualisation and more than 3
visualisations Mundo Deportivo was publishing articles with more than 3
visualisations dominantly, which is 66.67%. On the other hand, national
newspapers were mainly using 1 visualisation in data journalism articles with
50.16%, 2-3 visualisations with 27.59%. The least preferred number of
visualisations for national newspapers was more than 3 visualisations with
22.26%. In the analysis of national newspapers, El Pais was seen as the
249
newspapers with different style of data journalism articles. Published data
journalism articles in El Pais presented a dominance of use of more than 3
visualisations with 42.14%, followed by 2-3 visualisations with 8.36%, and 1
visualisation with 19.50%. Opposite results were observed in El Mundo and El
Periodico. In the analysis of El Mundo and El Periodico, articles with more than 3
visualisations were seen as the least preferred with 5.26% in El Periodico and 0 in
El Mundo. El Periodico and El Mundo was using 1 visualisation dominantly.
Qualitative analysis presented a conclusion for these results. Based on the
interviews, spending sufficient time in a data journalism article was challenging
for journalists, data journalists, and infographic artists because of the daily work
and lack of staff. This was also the reason for the dominant use of static
visualisations, which is 96.55%, in data journalism articles created by national
newspapers. The same results of qualitative analysis also proved the reason for
lack of interactivity in data journalism articles created by national newspapers.
Lower number of visualisation numbers and level of interactivity were observed
as the result of the daily workload of the staff and newsroom conditions and this
situation was affecting the adaptation process of data journalism in newsrooms
negatively.
Research Objective 2: Changes in journalistic practice and production process
of articles.
Results of the analyzes drew a conclusion about the changes in journalistic
practice in Spain after integrating data journalism to newsrooms. While the daily
schedule and satisfaction rate were changing, working conditions did not show an
alteration in Spanish news media. Data journalism increased the workload of the
journalists, data journalists, and infographic artists and the qualitative analysis
presented a time management issue in newspapers. Lack of data journalism
departments was noteworthy and data journalism was the new duty of the staff
in the newspapers. Qualitative analysis presented that data journalism was
starting to change the journalistic culture in Spain because journalists were more
likely to involve data journalism articles than traditional articles, even in their free
times. According to the point of views of journalists, data journalists, and
infographic artists, Spanish news media needed more data and visualisations to
250
tell a story better to readers, in general to increase quality. Sharp boundaries
between sections were changing through data journalism, contents were getting
richer because there were more people involved in data journalism in each
newspaper in time. In addition, involvement of more people was decreasing the
daily work, creating a collaborative environment and increasing the level of quality
in data journalism articles.
The results of the qualitative analysis presented the creative process of a
data journalism article in terms of decision-making and choosing the technical
characteristics of an article. Interviews showed a double-sided decision-making
process. Journalists from different sections were coming to the data unit and
requesting visualisations for their articles or the data unit was proposing the idea
to the related section. The decision was taken by both journalists and data units
but they were working independently during the visualisation process unless it's
an investigation or detailed project. Duties and topics were assigned by chiefs in
meetings but the priority was given to the big stories or remarkable events. Topics
were chosen according to 3 aspects as data based, topic interest based, and reader
interest based. In this point, data journalists and infographic artists had a chance
to took responsibility for breaking stories which is mainly based on reader interest.
Newsrooms were trying to give the breaking news in first place and data
journalists and infographic artists could find the information, make visualisations,
write stories and publish without an approval. Decision-making process for double-
sided except breaking news. Topics chosen data based were recommended by
data journalists and infographic artists to discuss with related section and the
chiefs of those sections to get an approval based on data that data journalist or
infogprahic artist found. Opposite to this, data journalism articles were requested
by journalists and section chiefs based on topics and data and/or infographic
sections were finding data and making visualisations for the article. In addition,
qualitative analysis showed the increased collaboration between sections in the
analyzed time period because of the lack of staff and increased daily work. Since
the separate data journalism departments were not common in newsrooms,
articles were created by reporting, data, and infographic sections. Also,
collaborations were used for international events and tournaments and the
preparation for the project was starting from 3 to 8 months before depending on
the event. Because the events were repetitive and the originality was challenging
251
newsrooms. Publishing articles that depends on big projects, investigations, and
team work was challenging while the daily work was continuing. To publish better
and original stories, the preparation was starting quite early. Long preparation
time was needed to experiment and find the most original stories in order to
increase reader engagement.
In addition, a similarity between the tools used in the newspapers was
observed. Excel was the main tool to extract data in all newspapers. R, a
programming language, was also used by some newspapers if there’s a journalist
who knows how to use R in the newsroom. Excel, OpenRefine, Tableau and R were
observed as the tools to clean data in the 6 newspapers. According to the
qualitative analysis, data analysis was the challenging part of a data journalism
article and newspapers were using Excel, PowerBI, and Tableau to analyze data.
It was proved by the qualitative analysis that the easiest part was the
visualisation. There was a variety in the tools, and most of the tools were time
saving. Flourish, Tableau, Datawrapper, R, Hype, Carto, Mapbox, and Adobe
programs (Illustrator, Photoshop, Animate) were seen as the visualisation tools of
Spanish newspapers.
On the other hand, journalists, data journalists, and infographic artists were
free to choose the tools to work, and the narrative formats of their data journalism
articles. However, there were some steps to follow in order to work freely. The
staff of newspapers were choosing their data journalism tools freely if the tools
had not a subscription or a licence price. In order to use a tool with subscription
or licence they had to discuss with the management to request the tool.
Journalists, data journalists, and infographic artists were also choosing the
narration of their data journalism article. However, an approval from their chief
was a necessity in the end.
Finally, qualitative analysis presented that Spanish newspapers were not in
the desired level in data journalism. In considering the current situations of the
newspapers, there were common needs in order to achieve data journalism to the
desired level. It was noteworthy that all newspapers were facing lack of staff,
especially a web developer and an interactive designer. People who are specialized
in certain programs were an absolute need to increase the content quality. This
result was supported with the content analysis. Lack of interactivity in sports data
252
journalism articles were based on this need in the newsrooms. Issues regarding
lack of time and people could be solved by creating data journalism departments.
Creating data journalism departments was the way to bring new visions and ideas
to newspapers.
Research Objective 3: Internal and external effects that shaped data journalism.
There is a relation between available data and the adaptation of data
journalism in newsrooms. Data journalism was becoming a bigger part of the
newsrooms because the available data was increasing each year. However,
qualitative analysis presented the limitations and problems regarding accessing
data in Spain. According to the results, accessing data in certain topics, such as
the topics related to economics or politics, was challenging for Spanish media.
Qualitative analysis showed journalists’, data journalists’, and infographic artists’
point of views towards available data. The first issue was the low trustworthiness
of data. Confirming data from 2 or 3 more sources was a necessity for newsroom
staff. Especially the data related to economic issues was not fully transparent. Low
trustworthiness and lack of transparency were mainly observed in economic data
in sports, especially in football. Minor sports had more transparent data than
football because football was not just a sport and it was linked with different
sectors. However, there were more available and open data for international
events compared to Spain. In addition, Spain had different dynamics in available
data because of the country’s regime. National data was not sufficient, even
regional data was the most challenging for journalists, data journalists, and
infographic artists. In this context, an issue with the transparency portal was
occurring because each region had different policies regarding the transparency
portal and the portal was not sufficiently efficient in each region.
The results of the qualitative analysis presented another limitation
regarding accessible data and its format. The data was not in a proper format
predominantly and data cleaning and formatting were necessary. This issue was
combined with time management problems in the newsrooms and presented a
negative effect on Spanish data journalism. In addition, there was a monopoly in
the sports analytics industry. Newspapers were making an agreement with Opta,
a sports analytics company, to access detailed sports data about the games,
253
players, teams, and tournaments because the staff could not collect all sports
data.
Working on sports data journalism articles had both negative and positive
sides. Finding quality data was the most challenging side for journalists, especially
in the topics related to economics and management. Also, boundaries and
limitations were observed in the topics for sports journalism because the sector
was economically dependent. Originality was a noteworthy issue in sports data
journalism because the tournaments were repetitive and it was a challenge to
create original content. This was explained as “the wheel of sports”. Also,
narratives and trends were changing constantly in sports and adaptation had to
be fast to new trends. In this context, lack of originality and new trends was
affecting readers engagement in a negative way.
On the other hand, creating sports data stories had positive sides for
newspapers. Except the accessible data in certain topics, analytics and advanced
statistics about the games and players were available for sports data journalism
articles. Sports data journalism articles with analytics and advanced statistics were
making sports more understandable for the spectators and it was adding value to
the competition. In addition, through the amount of sports readers, newspapers
were engaging with them with less effort because sports were more likely to be
clicked by readers. Sports data journalism articles were selling themselves and it
was bringing more sponsored content and advertisement to the newsrooms.
Economic intentions were one of the reasons for adapting data journalism in
Spanish newsrooms.
According to the interviews, a significant difference between the reader
engagement in traditional and data journalism articles were seen. Data journalism
articles were providing more reader engagement to the newspaper and also well
valued by readers. Number of visits and engagement times of the data journalism
articles were proving the success rate of reader engagement. The reason for the
higher reader engagement in data journalism articles was the effectiveness of
getting information through data journalism pieces. Visualisations were giving the
main message in a more eye-catching way and readers were engaging with the
articles. In addition, data and visualisations were drawing a more trustworthy look
to the article. Specifically in sports, data journalism was the most effective way to
254
engage with readers in terms of presenting analytics and advanced statistics in a
visualisation in a more simple but also dynamic way for readers.
On the other hand, keeping the reader engagement stable for a newspaper
was becoming a challenge in time because the consumption was fast. In the
context of “the wheel of sports”, changing trends and narratives, choosing accurate
topics for the data journalism articles were determining the reader engagement.
In addition, narratives in data journalism were constantly changing because
readers were more interested in reading from mobiles. In time, reader
engagement through data journalism became linked with the simpler visualisations
which work well in mobile.
Consequently, qualitative and quantitative analyzes of 6 newspapers
brought similar conclusions. According to the results, characteristics of the data
journalism articles of selected newspapers had similarities. In addition, qualitative
analysis presented similar conclusions in open data and transparency, integration
of data journalism to newsrooms and current needs, creative processes of data
journalism articles, and reader engagement.
6.2. Discussion
In the light of all results, the interest of the public towards data journalism
is undeniable. However, I believe that this interest is not sustained in case with
the current quality of the articles. Data journalism is not seen as a significant
qualification and opportunity in Spanish newsrooms. From my standpoint, few
reasons can be listed to explain the slow adaptation of data journalism in Spanish
newsrooms. The very first reason is the dominance of the traditional journalism
environment in Spain. Because of the rapid change in the country’s agenda,
newsrooms can’t devote sufficient time to new media practices. Newsrooms are
publishing news for a rapid consumption but data journalism needs time, planning,
and research. At this point, lack of formation in the newsroom staff is the second
deficiency to create quality data journalism articles. Data journalism articles in
Spanish newsrooms are mostly created by traditional reporters and infographic
artists. However, data journalism is a profession that needs a background and
research qualifications. To increase the quality of the articles, the job definition of
the staff should be clarified. Because as it is seen in the pioneers of data journalism
255
which are the United States, the United Kingdom, data journalism articles are
created by ‘data journalists’ who are responsible for all stages of the process.
Because not all data tells a story or not all data needs a visualisation and a data
journalist should know where to look and how to find story in larger databases. In
Spain, a lack of data journalism departments is seen. While the reporters and
infographic artists are working on daily work, breaking news and other newsroom
duties, they can’t allocate time to data journalism projects and this directly affects
the quality of the articles. Lastly, open data level and the transparency culture of
Spain can be listed as another reason for the current level of data journalism.
While the trustworthiness towards news is decreasing each year, data journalism
is a great tool to inform society. Data journalism articles attract the attention of
the reader in the era of disinformation. However, I see that there is not enough
investment in data journalism to use the opportunity that this era offers. In my
opinion, newspapers want to use data journalism as an income source with
sponsored content or subscription model but the investment is not enough to offer
the quality that people want to pay for. However, the adaptation of data journalism
is still continuing and the journalistic environment of Spain values this profession
more in time. More people involve data journalism in newsrooms and educate
themselves in this area. I believe that data journalism will be on the agenda of
the newsrooms in the years ahead and the quality will increase each year.
In the case of sports data journalism in Spain, it’s clearly seen that the
quality of the articles are higher than other topics such as politics, culture or
economics. In my opinion, the adaptation of data journalism in sports newspapers
is at a higher level than national newspapers. Amount of the available data, public
interest, and working on a specialized topic can be listed as the reasons for this
adaptation. Spain has a sports culture and there’s a huge audience in sports. This
situation causes more quality content produced by newspapers. Especially in the
international perspective, not only Spanish people have a huge interest in sports
but also the sports industry in Spain is more international. In this point, an interest
to publish high quality sports data journalism articles is clearly seen in newsrooms.
Publishing quality articles in sports newspapers is also the reason for working on
a specialized area. Data desks, infographic artists, and reporters are specialized
in sports and sports newspapers’ daily workload is not affected by Spain’s daily
agenda like national newspapers. In the light of my observations and
256
conversations in the newsrooms, I can claim that the intention to work on data
journalism in Spanish newsrooms is also based on the feedback from the reader.
Official statistics, engagement levels and social media metrics are supportive
causes to spend more time on data driven articles in sports newspapers because
sports data journalism articles attract the attention of the reader more than
traditional sports reporting.
Sports offers a huge amount of data and advanced statistics. However, not
all statistics are comprehensible for all readers and data driven sports articles
make sports more understandable. Accessible sports data is valuable when an
article tells the story behind that data. In this case, sports data offers stories to
Spanish newsrooms and decreases the chance of conflict. However, the sports
industry in Spain also affects sports journalism negatively. Because the sports
industry in Spain is international and linked with politics and economics. A
challenge can be seen in searching data that linked other topics or topics can cause
political conflict. In my opinion, sports data journalism articles in Spain are
objective, have a higher quality than other topics but the originality and novelty
are missing because of telling the same types of stories instead of investigative
projects.
Consequently, the current level of sports data journalism in Spain is
promising for the future since more newspapers are interested in publishing more
data articles about sports because of its public interest. Sports data journalism in
Spain has an opportunity to be one of the pioneers in the world because of the
interest towards the industry in Spain, but this opportunity can be used if the
newspapers tell original stories and discuss its relation with other areas.
6.3. Suggestions
This thesis presented the current level of data journalism in Spanish
newsrooms and explained the opportunities and threats in its development. In
order to adapt data journalism fully and follow journalistic trends in the world,
some suggestions to the newsrooms were identified.
257
Firstly, newsrooms need to create specialized data journalism departments
and use the expertise of professionals. Hiring specialised people for data
journalism departments is a way to decrease the workload of infographics
departments. Creating separate data journalism departments allows the
departments’ members to improve themselves, follows trends and news tools to
adapt in the newsroom. This provides enough time for data journalism
departments to spend time on learning new tools.
Secondly, data journalism departments need to collaborate with other
departments to use their expertise in specific topics to create successful articles.
Also, data journalism departments need a minimum of 1 data scientist, 1 data
journalist, and 1 programmer. The data scientist needs to create a database for
the newsroom to not depend on data providers to create a data journalism article.
Thirdly, newsrooms need to use the transparency portal more often to
collect data and give feedback to authorities about their experience. Transparency
portal’s functionality increases as the portal is used oftenly.
6.4. Limitations and Further Research
The aim of this research was understanding data journalism in Spain from
different perspectives and analyze the internal and external factors related to
Spanish data journalism. Also, due to a gap in Spanish data journalism in the
literature, this research leans to a descriptive analysis to open a way for more
critical studies. In addition, because the arrival of data journalism was relatively
late in Spain, the articles was determined by 2017, 2018, and 2019. However, to
understand and analyze Spanish data journalism a wider sample is needed for
future research.
Media and technology become inseparable and the need for data and new
skills is an ongoing need in the current journalistic environment and will appear
on agenda in the next years. Data journalism will be more important with the
support of fact-checking and the need of the public in trusted news. In the light of
this, it’s necessary to carry this topic a step forward with a broader sample. Also,
further research about the level of open data and transparency is a need to study
the basis of data journalism.
258
Bibliography
Alieva, I. (2017). Data Journalism And Democracy: How American Mass Media
Framed The 2016 Presidential Campaign In The United States Using Data Visualisation. University of Missouri-Columbia. Retrieved from https://mospace.umsystem.edu/xmlui/handle/10355/61993
Allan, S., Thorsen, E. (2009). Journalism, public service and BBC News Online.
In G.M. and G.R. (Ed.) News online: transformations and continuities (p.20-37) Basingstoke: Palgrave MacMillian
Appelgren, E., Nygren, G. (2014). Data Journalism in Sweden: Introducing new
methods and genres of journalism into old organizations. Digital Journalism, 2(3), 394-405.
Appelgren, E. (2017). An Illusion of Interactivity: The paternalistic side of data
journalism. Journalism Practice, 12(3), 308-325. Appelgren, E., Salaverría, R. (2018). The Promise of the Transparency Culture.
Journalism Practice, 12(8), 986-996. Arias, D., Sánchez García, P., Redondo, M. (2018). Profile of the data journalist
in Spain: training, sources and tools. Doxa Comunicación, 27, 273-293. Baack, S. (2011). A new style of news reporting: Wikileaks and data-driven
journalism. Cyborg Subjects, 10, 1-10. Baack, S. (2018). Practically Engaged: The entanglements between data
journalism and civic tech. Digital Journalism, 6(6), 673-692. Berger, G. (2018). Is There a Future for Journalism?. Journalism Practice, 12(8),
939-953. Blanchett Neheli, N. (2018). News by Numbers. Digital Journalism, 6(8), 1041-
1051. Blanco Castilla, E., Quesada, M. (2016). Periodismo de datos. Cuadernos
Artesanos de Comunicación. La Laguna, Tenerife: Latina. Boczkowski, P. (2004). Digitizing the News: Innovation in Online Newspapers.
Cambridge: The MIT Press. Borges Rey, E. (2016). Unravelling Data Journalism. Journalism Practice, 10(7),
833–843. Bryman, A. (2012). Social Research Methods. Oxford, New York: Oxford
University Press. Cairo, A. (2013). The functional art: An introduction to information graphics and
visualization. Berkeley, California: New Riders.
259
Cairo, A. (2016). The truthful art: Data, charts, and maps for communication. Miami, Florida: New Riders.
Cairo, A. (2017). Nerd journalism: How data and digital technology transformed
news graphics. Universitat Oberta de Catalunya. Retrieved from http://hdl.handle.net/10609/66768
Charbonneaux, J., Gkouskou-Giannakou, P. (2015). “Data Journalism”, an
investigation Practice?: A glance at the German and Greek cases. Brazilian Journalism Research, 11(2), 244-267.
Chiasson, T., Gregory, D., et al. (2014). Data+Design: A simple introduction to
preparing and visualizing information. London: Infoactive. Coddington, M. (2015). Clarifying Journalism’s Quantitative Turn. Digital
Journalism, 3(3), 331-348. Cortés del Alamo, H., Elías, C., Luengo Cruz, M. (2018). Periodismo de datos y
transparencia al margen de los grandes medios. Revista Científica De Comunicación Y Tecnologías Emergentes, 16(2), 66-87.
Craig, D., Zion, L. (2014). Ethics for Digital Journalists: Emerging Best Practices.
New York, NY: Routledge. Cushion, S., Lewis, J., Callaghan, R. (2016). Data Journalism, Impartiality and
Statistical Claims. Journalism Practice, 11(10), 1198-1215. De Maeyer, J., Libert, M., Domingo, D., Heinderyckx, F., Le Cam, F. (2015).
Waiting for Data Journalism: A qualitative assessment of the anecdotal take-up of data journalism in French-speaking Belgium. Digital Journalism, 3(3), 432-446.
Díaz Noci, J. (2013). A history of journalism on the Internet: a state of the art
and some methodological trends. Revista Internacional de Historia de la Comunicación, 1(1), 253-272.
Domingo, D. (2006). Development of the Internet as a news medium in four
Catalan online newsrooms. Universitat Rovira i Virgili. Retrieved from https://www.tdx.cat/handle/10803/4190#page=1
Domingo, D., Heinonen, A. (2017). Weblogs and Journalism. Nordicom Review,
29(1), 3-15. Engebretsen, M., Kennedy, H., Weber, W. (2018). Data Visualisation in
Scandinavian Newsrooms. Nordicom Review, 39(2), 3-18. Ferreras Rodriguez, E.M. (2016). El periodismo de Datos en España. Estudios
sobre el Mensaje Periodístico, 22(1), 255-272. Fink, K., Anderson, C.W. (2015). Data Journalism in the United States: Beyond
the “usual suspects”. Journalism Studies, 16(4), 467-481.
260
García-Avilés, J.A., Carvajal Prieto, M., Arias Robles, F. (2018). Implantación de la innovación en los cibermedios españoles: análisis de las percepciones de los periodistas. Revista Latina de Comunicación Social, 73, 369-384.
Garrison, B. (1998). Computer-Assisted Reporting. New Jersey, NJ: Lawrence
Erlbaum Associates. Gehrke, M., Mielniczuk, L. (2017). Philip Meyer , the outsider who created
Precision Journalism. Intexto, 39, 4-13. Grassler, M. (2018). El rol del periodista de datos en el proceso de los sistemas
de gestión y decisión pública y en la recuperación de la confianza entre el ciudadano y las instituciones públicas. Universidad Autónoma de Barcelona. Retrieved from http://hdl.handle.net/10803/462769
Gray, J., et al. (2012). The Data Journalism Handbook. California: O'Reilly
Media. Hammond, P. (2016). From computer-Assisted to data-Driven: Journalism and
Big Data. Journalism: Theory, Practice & Criticism, 18(4), 408–424. Heravi, B. (2018). 3WS of Data Journalism Education. Journalism Practice,
13(3), 1-18. Hermida, A., Young, M.L. (2017). Finding the Data Unicorn: A hierarchy of
hybridity in data and computational journalism. Digital Journalism, 5(2), 159-176.
Hermida, A., Young, M.L. (2019). Data journalism and the regeneration of news.
New York: NY: Routledge. Horky, T., Pelka, P. (2017). Data Visualisation in Sports Journalism. Digital
Journalism, 5(5), 587-606. Howard, A. (2014). The Art and Science of Data-Driven Journalism. Colombia
Journalism School. Kalatzi O., Bratsas, C., Veglis, A. (2018). The Principles, Features and
Techniques of Data Journalism. Studies in Media and Communication, 6(2), 36-44.
Karlsen, J., Stavelin, E. (2014). Computational Journalism in Norwegian
Newsrooms. Journalism Practice, 8(1), 34-48. Knight, A. (2008). Journalism in the age of blogging. Journalism Studies, 9(1),
117-131. Knight, M. (2010). Blogging and citizen journalism. The Citizen in
Communication: Edited by Nathalie Hyde-Clarke. Knight, M. (2015). Data journalism in the UK: a preliminary analysis of form and
content. Journal of Media Practice, 16(1), 55-72.
261
Labarga Adan, I., Gonzalez Diez, L., Perez Cuadrado, P. (2018). Digital native
magazines in the field of Sports in Spain: the case of MARCA Plus. Revista Mediterránea de Comunicación, 9(1), 451-463.
La-Rosa, L., Sandoval-Martín, T. (2016). The Transparency Law‘s insufficiency
for Data Journalism‘s practices in Spain. Revista Latina de Comunicación Social, 71, 1208-1229.
Lewis, S. (2015). Journalism In An Era Of Big Data: Cases, concepts, and
critiques. Digital Journalism, 3(3), 321-330. Lewis, N., Waters, S. (2017). Data Journalism and the Challenge of Shoe-
Leather Epistemologies. Digital Journalism, 6(6), 719-736. Lim, J. (2018). Representation of data journalism practices in the South Korean
and US television news. the International Communication Gazette, 0(0), 1–25.
Loosen, W., Reimer, J., De Silva-Schmidt, F. (2017). Data-Driven Reporting – an
On-Going (R)Evolution? A Longitudinal Analysis of Projects Nominated for the Data Journalism Awards 2013– 2015. Journal of Hans-Bredow-Institut for Media Research, 41.
López, P.J. (2016). Antecedentes y fundamentos del Periodismo de datos.
Universidad Complutense de Madrid. Retrieved from http://hdl.handle.net/10630/12465.
Lowrey, W., Mackay Burleson, J. (2008). JOURNALISM AND BLOGGING: A test of
a model of occupational competition. Journalism Practice, 2(1), 64-81. Manfredi Sánchez, J.L., Rojas Torrijos, J.M., Herranz de la Casa, J.M. (2015).
Entrepreneurial journalism: Sports journalism in Spain. Revista Latina de Comunicación Social, 70, 69-90.
Mair, J., Keeble, R.L. (2013). Data Journalism: Mapping the future. United
Kingdom: Abramis Academic Publishing. Mair, J., Keeble, R.L., Lucero, M., Moore, M. (2017). Data Journalism: Past,
Present and Future. United Kingdom: Abramis Academic Publishing. Masip, P. (2002). Role of online information on news reporting in Catalan
newsrooms. Presentation in 23rd Conference and General Assembly IAMCR IAMCR 2002. Barcelona.
Meyer, P. (2002). Precision Journalism: A Reporter’s Introduction to Social
Science Methods. Lanham, Md: Rowman & Littlefield. Mi, M. (2015). How Newspapers Respond to Technological Change : a
Comparison between the UK and China. University of Westminster. Retrieved from https://westminsterresearch.westminster.ac.uk/item/96x14/how-
262
newspapers-respond-to-technological-change-a-comparison-between-the-uk-and-china
Michalski, D. (2016). Reader Engagement with Data Journalism: Comparing the
Guardian and Washington Post's Coverage of People Killed by Police. University of Nevada. Retrieved from http://dx.doi.org/10.34917/9302952
Minto, R. (2016). Sports Geek: A visual tour of sporting myths, debate, and
data. London: Bloomsbury Publishing Plc. Olivo, M.T. (2015). Visualizing the News : An Analysis of a Year in Interactive
News from The New York Times and The Washington Post. Rochester Institute of Technology. Retrieved from https://scholarworks.rit.edu/theses/8910
Palomo, B., Teurel, L., Blanco Castilla, E. (2019). Data Journalism Projects Based
on User-Generated Content. How La Nacion Data Transforms Active Audience into Staff. Digital Journalism, 7(9), 1270-1288.
Peiro, K., Guallar, J. (2013). Introducció al periodisme de dades.
Característiques, panoràmica i exemples. Item: revista de biblioteconomia i documentació, 57, 22-36.
Ritchie, J., Lewis, J. (2003). QUALITATIVE RESEARCH PRACTICE: A Guide for
Social Science Students and Researchers. London: Sage Publications. Rivera, A., Rojas Torrijos, J.L. (2016). El Español and El Confidencial , models of
data sports journalism in Spanish native digital news media. Doxa Comunicación, 23, 1-23.
Rogers, S. (2011). Facts Are Sacred: The Power of Data. London: Guardian
Books. Rogers, S., et al. (2017). Data Journalism in 2017: The Current State and
Challenges Facing the Field Today. Google News Lab. Rojas Torrijos, J.L. (2017). The digital strategy of internationalisation of Marca in
Latin America. Revista de Comunicación, 17(1), 133-154. Rojas Torrijos, J.L. (2015). New perspectives on Sports Journalism in Spain: first
magazines for tablets and smartphones in daily newspapers Marca and Sport. Fonseca Journal of Communication, 10(10), 29-49.
Royal, C. (2012). The Journalist as Programmer: A Case Study of the New York
Times Interactive News Technology Department. #ISOJ: the Official Research Journal of the International Symposium for Online Journalism, 2(1), 5–24.
Rubio Jiménez, M. (2013). ¿Cómo y cuánto usamos los periodistas españoles las
herramientas dispuestas por la ley de transparencia?. Cuadernos de Periodistas, 34, 33-42.
263
Schulze, T. (2015). Data Journalism , Millennials & Social Networks. Universidade Fernando Pessoa. Retrieved from http://hdl.handle.net/10284/5039
Scott, B. (2005). A Contemporary History of Digital Journalism. Television & New
Media, 6(1), 89–126. Segel, E., Heer, J. (2010). Narrative Visualization: Telling Stories with Data.
IEEE TRANSACTIONS ON VISUALIZATION AND COMPUTER GRAPHICS, 16(6), 1139-1148.
Siapera, E., Veglis, A. (2012). The Handbook of Global Online Journalism.
Sussex, UK: John Wiley & Sons, Inc. Stalph, F. (2017). Classifying Data Journalism: A content analysis of daily data-
driven stories. Journalism Practice, 12(10), 1332-1350. Stravelin, E. (2013). Computational Journalism: When journalism meets
programming. University of Bergen. Retrieved from https://hdl.handle.net/1956/7926
Tandoc Jr, E.C., Oh, S.K. (2017). Small Departures, Big Continuities?: Norms,
values, and routines in The Guardian’s big data journalism. Journalism Studies, 18(8), 997-1015.
Tulloch, C., Ramon, X. (2017). Take Five: How Sports Illustrated and L’Équipe
redefine the long-form sports journalism genre. Digital Journalism, 5(5), 652-672.
Uscinski, J., Butler, R.W. (2013). The (naïve) epistemology of fact- checking.
Critical Review: A journal of politics and society, 25(2), 162–180. Veglis, A., Bratsas, C. (2017). Towards a Taxonomy of Data Journalism. Journal
of Media Critiques, 3(11), 109-121. Wilke, C.O. (2019). Fundamentals of Data Visualization. Sebastapol, California:
O’Reilly Media. Wright, S., Doyle, K. (2018). The Evolution of Data Journalism: A Case Study of
Australia. Journalism Studies, 20(13), 1811-1827. Young, M., Hermida, A., Fulda, J. (2018). What Makes for Great Data
Journalism?: A content analysis of data journalism awards finalists 2012–2015. Journalism Practice, 12(1), 115-135.
Zelizer, B., Allan, S. (2004). Journalism After September 11. New York, NY:
Routledge Zhang, S., Feng, J. (2018). A Step Forward?: Exploring the diffusion of data
journalism as journalistic innovations in China. Journalism Studies, 20(9), 1281-1300.

264
Zhang, X. (2018). Visualisation, Technologies, or the Public?. Digital Journalism, 6(6), 737-758.
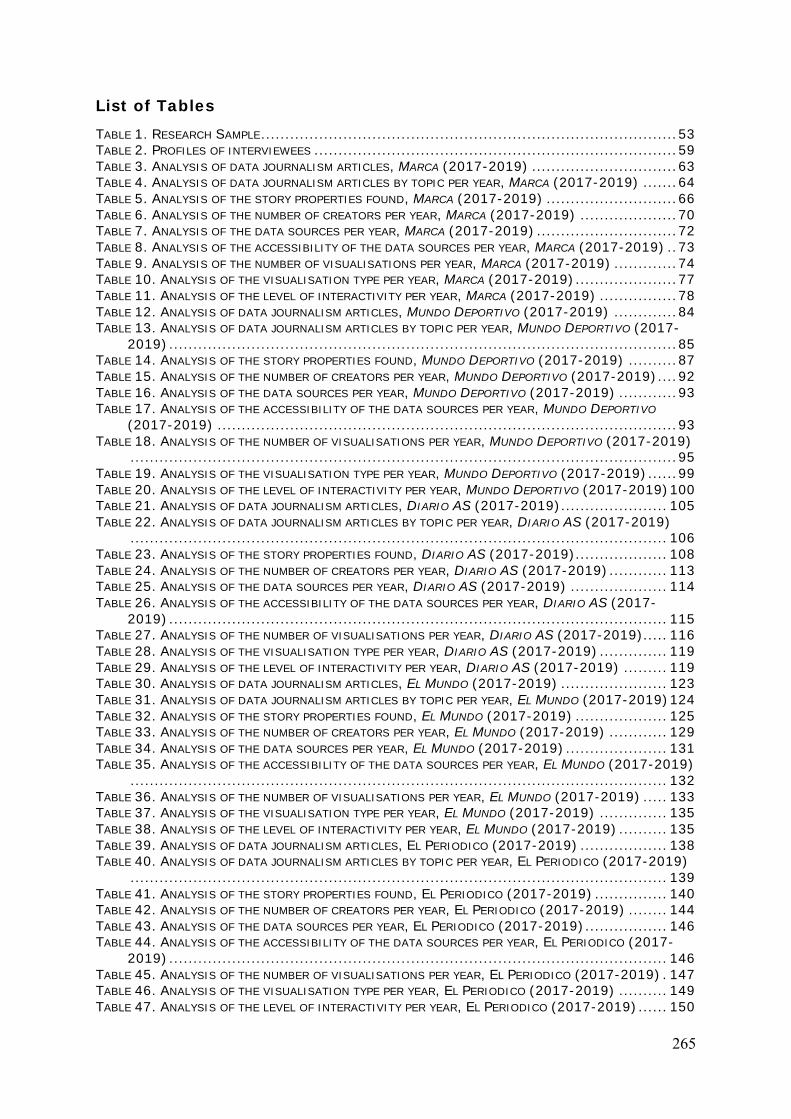
265
List of Tables
TABLE 1. RESEARCH SAMPLE ...................................................................................... 53 TABLE 2. PROFILES OF INTERVIEWEES ........................................................................... 59 TABLE 3. ANALYSIS OF DATA JOURNALISM ARTICLES, MARCA (2017-2019) .............................. 63 TABLE 4. ANALYSIS OF DATA JOURNALISM ARTICLES BY TOPIC PER YEAR, MARCA (2017-2019) ....... 64 TABLE 5. ANALYSIS OF THE STORY PROPERTIES FOUND, MARCA (2017-2019) ........................... 66 TABLE 6. ANALYSIS OF THE NUMBER OF CREATORS PER YEAR, MARCA (2017-2019) .................... 70 TABLE 7. ANALYSIS OF THE DATA SOURCES PER YEAR, MARCA (2017-2019) ............................. 72 TABLE 8. ANALYSIS OF THE ACCESSIBILITY OF THE DATA SOURCES PER YEAR, MARCA (2017-2019) .. 73 TABLE 9. ANALYSIS OF THE NUMBER OF VISUALISATIONS PER YEAR, MARCA (2017-2019) ............. 74 TABLE 10. ANALYSIS OF THE VISUALISATION TYPE PER YEAR, MARCA (2017-2019) ..................... 77 TABLE 11. ANALYSIS OF THE LEVEL OF INTERACTIVITY PER YEAR, MARCA (2017-2019) ................ 78 TABLE 12. ANALYSIS OF DATA JOURNALISM ARTICLES, MUNDO DEPORTIVO (2017-2019) ............. 84 TABLE 13. ANALYSIS OF DATA JOURNALISM ARTICLES BY TOPIC PER YEAR, MUNDO DEPORTIVO (2017-
2019) ......................................................................................................... 85 TABLE 14. ANALYSIS OF THE STORY PROPERTIES FOUND, MUNDO DEPORTIVO (2017-2019) .......... 87 TABLE 15. ANALYSIS OF THE NUMBER OF CREATORS PER YEAR, MUNDO DEPORTIVO (2017-2019) .... 92 TABLE 16. ANALYSIS OF THE DATA SOURCES PER YEAR, MUNDO DEPORTIVO (2017-2019) ............ 93 TABLE 17. ANALYSIS OF THE ACCESSIBILITY OF THE DATA SOURCES PER YEAR, MUNDO DEPORTIVO
(2017-2019) ............................................................................................... 93 TABLE 18. ANALYSIS OF THE NUMBER OF VISUALISATIONS PER YEAR, MUNDO DEPORTIVO (2017-2019)
................................................................................................................. 95 TABLE 19. ANALYSIS OF THE VISUALISATION TYPE PER YEAR, MUNDO DEPORTIVO (2017-2019) ...... 99 TABLE 20. ANALYSIS OF THE LEVEL OF INTERACTIVITY PER YEAR, MUNDO DEPORTIVO (2017-2019) 100 TABLE 21. ANALYSIS OF DATA JOURNALISM ARTICLES, DIARIO AS (2017-2019) ...................... 105 TABLE 22. ANALYSIS OF DATA JOURNALISM ARTICLES BY TOPIC PER YEAR, DIARIO AS (2017-2019)
............................................................................................................... 106 TABLE 23. ANALYSIS OF THE STORY PROPERTIES FOUND, DIARIO AS (2017-2019) ................... 108 TABLE 24. ANALYSIS OF THE NUMBER OF CREATORS PER YEAR, DIARIO AS (2017-2019) ............ 113 TABLE 25. ANALYSIS OF THE DATA SOURCES PER YEAR, DIARIO AS (2017-2019) .................... 114 TABLE 26. ANALYSIS OF THE ACCESSIBILITY OF THE DATA SOURCES PER YEAR, DIARIO AS (2017-
2019) ....................................................................................................... 115 TABLE 27. ANALYSIS OF THE NUMBER OF VISUALISATIONS PER YEAR, DIARIO AS (2017-2019) ..... 116 TABLE 28. ANALYSIS OF THE VISUALISATION TYPE PER YEAR, DIARIO AS (2017-2019) .............. 119 TABLE 29. ANALYSIS OF THE LEVEL OF INTERACTIVITY PER YEAR, DIARIO AS (2017-2019) ......... 119 TABLE 30. ANALYSIS OF DATA JOURNALISM ARTICLES, EL MUNDO (2017-2019) ...................... 123 TABLE 31. ANALYSIS OF DATA JOURNALISM ARTICLES BY TOPIC PER YEAR, EL MUNDO (2017-2019) 124 TABLE 32. ANALYSIS OF THE STORY PROPERTIES FOUND, EL MUNDO (2017-2019) ................... 125 TABLE 33. ANALYSIS OF THE NUMBER OF CREATORS PER YEAR, EL MUNDO (2017-2019) ............ 129 TABLE 34. ANALYSIS OF THE DATA SOURCES PER YEAR, EL MUNDO (2017-2019) ..................... 131 TABLE 35. ANALYSIS OF THE ACCESSIBILITY OF THE DATA SOURCES PER YEAR, EL MUNDO (2017-2019)
............................................................................................................... 132 TABLE 36. ANALYSIS OF THE NUMBER OF VISUALISATIONS PER YEAR, EL MUNDO (2017-2019) ..... 133 TABLE 37. ANALYSIS OF THE VISUALISATION TYPE PER YEAR, EL MUNDO (2017-2019) .............. 135 TABLE 38. ANALYSIS OF THE LEVEL OF INTERACTIVITY PER YEAR, EL MUNDO (2017-2019) .......... 135 TABLE 39. ANALYSIS OF DATA JOURNALISM ARTICLES, EL PERIODICO (2017-2019) .................. 138 TABLE 40. ANALYSIS OF DATA JOURNALISM ARTICLES BY TOPIC PER YEAR, EL PERIODICO (2017-2019)
............................................................................................................... 139 TABLE 41. ANALYSIS OF THE STORY PROPERTIES FOUND, EL PERIODICO (2017-2019) ............... 140 TABLE 42. ANALYSIS OF THE NUMBER OF CREATORS PER YEAR, EL PERIODICO (2017-2019) ........ 144 TABLE 43. ANALYSIS OF THE DATA SOURCES PER YEAR, EL PERIODICO (2017-2019) ................. 146 TABLE 44. ANALYSIS OF THE ACCESSIBILITY OF THE DATA SOURCES PER YEAR, EL PERIODICO (2017-
2019) ....................................................................................................... 146 TABLE 45. ANALYSIS OF THE NUMBER OF VISUALISATIONS PER YEAR, EL PERIODICO (2017-2019) . 147 TABLE 46. ANALYSIS OF THE VISUALISATION TYPE PER YEAR, EL PERIODICO (2017-2019) .......... 149 TABLE 47. ANALYSIS OF THE LEVEL OF INTERACTIVITY PER YEAR, EL PERIODICO (2017-2019) ...... 150
266
TABLE 48. ANALYSIS OF DATA JOURNALISM ARTICLES, EL PAIS (2017-2019) .......................... 153 TABLE 49. ANALYSIS OF DATA JOURNALISM ARTICLES BY TOPIC PER YEAR, EL PAIS (2017-2019) ... 154 TABLE 50. ANALYSIS OF THE STORY PROPERTIES FOUND, EL PAIS (2017-2019) ...................... 156 TABLE 51. ANALYSIS OF THE NUMBER OF CREATORS PER YEAR, EL PAIS (2017-2019) ................ 160 TABLE 52. ANALYSIS OF THE DATA SOURCES PER YEAR, EL PAIS (2017-2019) ........................ 161 TABLE 53. ANALYSIS OF THE ACCESSIBILITY OF THE DATA SOURCES PER YEAR, EL PAIS (2017-2019)
............................................................................................................... 162 TABLE 54. ANALYSIS OF THE NUMBER OF VISUALISATIONS PER YEAR, EL PAIS (2017-2019) ........ 164 TABLE 55. ANALYSIS OF THE VISUALISATION TYPE PER YEAR, EL PAIS (2017-2019) .................. 166 TABLE 56. ANALYSIS OF THE LEVEL OF INTERACTIVITY PER YEAR, EL PAIS (2017-2019) ............. 167 TABLE 57. ANALYSIS OF DATA JOURNALISM ARTICLES IN MARCA, MUNDO DEPORTIVO, DIARIO AS, EL
MUNDO, EL PERIODICO, EL PAIS (2017-2019) ...................................................... 171 TABLE 58. ANALYSIS OF DATA JOURNALISM ARTICLES BY TOPIC IN MARCA, MUNDO DEPORTIVO, DIARIO
AS, EL MUNDO, EL PERIODICO, EL PAIS (2017-2019) ............................................. 171 TABLE 59. ANALYSIS OF THE STORY PROPERTIES FOUND IN MARCA, MUNDO DEPORTIVO, DIARIO AS, EL
MUNDO, EL PERIODICO, EL PAIS (2017-2019) ...................................................... 172 TABLE 60. ANALYSIS OF THE NUMBER OF CREATORS IN MARCA, MUNDO DEPORTIVO, DIARIO AS, EL
MUNDO, EL PERIODICO, EL PAIS (2017-2019) ...................................................... 173 TABLE 61. ANALYSIS OF THE DATA SOURCES IN MARCA, MUNDO DEPORTIVO, DIARIO AS, EL MUNDO,
EL PERIODICO, EL PAIS (2017-2019) ................................................................. 173 TABLE 62. ANALYSIS OF THE ACCESSIBILITY OF THE DATA SOURCES IN MARCA, MUNDO DEPORTIVO,
DIARIO AS, EL MUNDO, EL PERIODICO, EL PAIS (2017-2019) ................................... 174 TABLE 63. ANALYSIS OF THE NUMBER OF VISUALISATIONS IN MARCA, MUNDO DEPORTIVO, DIARIO AS,
EL MUNDO, EL PERIODICO, EL PAIS (2017-2019) .................................................. 174 TABLE 64. ANALYSIS OF THE VISUALISATION TYPE IN MARCA, MUNDO DEPORTIVO, DIARIO AS, EL
MUNDO, EL PERIODICO, EL PAIS (2017-2019) ...................................................... 175 TABLE 65. ANALYSIS OF THE LEVEL OF INTERACTIVITY IN MARCA, MUNDO DEPORTIVO, DIARIO AS, EL
MUNDO, EL PERIODICO, EL PAIS (2017-2019) ...................................................... 175 TABLE 66. ANALYSIS OF THE RATIO OF TEXT AND MULTIMEDIA IN MARCA, MUNDO DEPORTIVO, DIARIO
AS, EL MUNDO, EL PERIODICO, EL PAIS (2017-2019) ............................................. 176 TABLE 67. TOOLS USED FOR EXTRACTING, CLEANING, ANALYSING, AND VISUALISING DATA BY
NEWSPAPERS ................................................................................................ 193
267
List of Figures
FIGURE 1. CHANGES IN DATA JOURNALISM ARTICLES PER YEAR, MARCA(2017-2019) ................... 63 FIGURE 2. DATA JOURNALISM ARTICLES BY TOPIC, MARCA (2017-2019) ................................. 65 FIGURE 3. EVOLUTION OF THE CHANGE IN COMPARISON TECHNIQUE AS STORY PROPERTY BY YEAR, MARCA
(2017-2019) ............................................................................................... 67 FIGURE 4. ANALYSIS OF THE NUMBER OF CREATORS, MARCA (2017-2019) ............................... 71 FIGURE 5. EVOLUTION OF THE MENTIONING DATA SOURCE BY YEAR, MARCA (2017-2019) ............. 72 FIGURE 6. ANALYSIS OF THE NUMBER OF VISUALISATIONS, MARCA (2017-2019) ....................... 75 FIGURE 7. EVOLUTION OF THE STATIC AND INTERACTIVE VISUALISATIONS, MARCA (2017-2019) ..... 77 FIGURE 8. ANALYSIS OF THE LEVEL OF INTERACTIVITY, MARCA (2017-2019) ............................ 79 FIGURE 9. EVOLUTION OF THE RATIO OF TEXT AND MULTIMEDIA, MARCA (2017-2019) ................. 83 FIGURE 10. CHANGES IN DATA JOURNALISM ARTICLES PER YEAR, MUNDO DEPORTIVO (2017-2019) . 84 FIGURE 11. DATA JOURNALISM ARTICLES BY TOPIC, MUNDO DEPORTIVO (2017-2019) ................ 86 FIGURE 12. EVOLUTION OF THE STORY PROPERTIES BY YEAR, MUNDO DEPORTIVO (2017-2019) ...... 88 FIGURE 13. ANALYSIS OF THE NUMBER OF CREATORS, MUNDO DEPORTIVO (2017-2019) .............. 92 FIGURE 14. ANALYSIS OF THE NUMBER OF VISUALISATIONS, MUNDO DEPORTIVO (2017-2019) ....... 96 FIGURE 15. EVOLUTION OF THE STATIC AND INTERACTIVE VISUALISATIONS, MUNDO DEPORTIVO (2017-
2019) ......................................................................................................... 99 FIGURE 16. ANALYSIS OF THE LEVEL OF INTERACTIVITY, MUNDO DEPORTIVO (2017-2019) ......... 101 FIGURE 17. EVOLUTION OF THE RATIO OF TEXT AND MULTIMEDIA, MUNDO DEPORTIVO (2017-2019)
............................................................................................................... 103 FIGURE 18. CHANGES IN DATA JOURNALISM ARTICLES PER YEAR, DIARIO AS (2017-2019) ......... 105 FIGURE 19. DATA JOURNALISM ARTICLES BY TOPIC, DIARIO AS (2017-2019) ......................... 107 FIGURE 20. EVOLUTION OF THE STORY PROPERTIES BY YEAR, DIARIO AS (2017-2019) .............. 108 FIGURE 21. ANALYSIS OF THE NUMBER OF CREATORS, DIARIO AS (2017-2019) ...................... 113 FIGURE 22. EVOLUTION OF THE MENTIONING DATA SOURCE NAME BY YEAR, DIARIO AS (2017-2019)
............................................................................................................... 114 FIGURE 23. ANALYSIS OF THE NUMBER OF VISUALISATIONS, DIARIO AS (2017-2019) ............... 116 FIGURE 24. EVOLUTION OF THE RATIO OF TEXT AND MULTIMEDIA, DIARIO AS (2017-2019) ........ 121 FIGURE 25. CHANGES IN DATA JOURNALISM ARTICLES PER YEAR, EL MUNDO (2017-2019) .......... 123 FIGURE 26. DATA JOURNALISM ARTICLES BY TOPIC, EL MUNDO (2017-2019) ......................... 125 FIGURE 27. EVOLUTION OF THE STORY PROPERTIES BY YEAR, EL MUNDO (2017-2019) .............. 126 FIGURE 28. ANALYSIS OF THE NUMBER OF CREATORS, EL MUNDO (2017-2019) ...................... 130 FIGURE 29. EVOLUTION OF THE MENTIONING DATA SOURCE BY YEAR, EL MUNDO (2017-2019) ..... 131 FIGURE 30. ANALYSIS OF THE NUMBER OF VISUALISATIONS, EL MUNDO (2017-2019) ............... 133 FIGURE 31. EVOLUTION OF THE RATIO OF TEXT AND MULTIMEDIA, EL MUNDO (2017-2019) ......... 137 FIGURE 32. CHANGES IN DATA JOURNALISM ARTICLES PER YEAR, EL PERIODICO (2017-2019) ...... 138 FIGURE 33. DATA JOURNALISM ARTICLES BY TOPIC, EL PERIODICO (2017-2019) ..................... 140 FIGURE 34. EVOLUTION OF THE STORY PROPERTIES BY YEAR, EL PERIODICO (2017-2019) .......... 141 FIGURE 35. ANALYSIS OF THE NUMBER OF CREATORS, EL PERIODICO (2017-2019) .................. 145 FIGURE 36. ANALYSIS OF THE NUMBER OF VISUALISATIONS, EL PERIODICO (2017-2019) ........... 148 FIGURE 37. EVOLUTION OF THE RATIO OF TEXT AND MULTIMEDIA, EL PERIODICO (2017-2019) ..... 151 FIGURE 38. CHANGES IN DATA JOURNALISM ARTICLES PER YEAR, EL PAIS (2017-2019) ............. 153 FIGURE 39. DATA JOURNALISM ARTICLES BY TOPIC, EL PAIS (2017-2019) ............................ 155 FIGURE 40. EVOLUTION OF THE STORY PROPERTIES BY YEAR, EL PAIS (2017-2019) .................. 156 FIGURE 41. ANALYSIS OF THE NUMBER OF CREATORS, EL PAIS (2017-2019) .......................... 160 FIGURE 42. EVOLUTION OF THE ARTICLES WITH MORE THAN 1 AUTHOR AND MORE THAN 1 VISUALISATION
BY YEAR, EL PAIS (2017-2019) ........................................................................ 161 FIGURE 43. EVOLUTION OF THE MENTIONING DATA SOURCE BY YEAR, EL PAIS (2017-2019) ........ 162 FIGURE 44. ANALYSIS OF THE NUMBER OF VISUALISATIONS, EL PAIS (2017-2019) ................... 164 FIGURE 45. EVOLUTION OF THE RATIO OF TEXT AND MULTIMEDIA, EL PAIS (2017-2019) ............ 169

268
Annex I. Interview Questions
Production Process 1. Can you explain the decision making process in your organization? How do
you choose stories and their techniques? 2. Do you work autonomously or work with a group during the creation
process? (for group please explain) 3. What tools do you use to extract data? 4. What tools do you use to clean data? 5. What tools do you use to analyze data? 6. What tools do you use to visualize data? 7. Do you choose the tools to work on or are they chosen by the company? 8. Do you have any guidelines in your company for storytelling or are you
free to choose your narration format? 9. What's the aspects of good sports data stories? 10. What are the main difficulties journalists face when developing data
journalism pieces in sports? 11. Is there any challenging difference between sports data stories and
others? (question for national newspapers) 12. How do you manage the workflow for the regular coverages and specific
investigative production and also big events? How does the workflow and time management differentiate in these cases?
13. Is there any data journalism department in your company? Access & Use of Data
1. Do you have any subscription or agreement with sports data agencies or other organizations to obtain and share data?
2. How do you find sports data? Can you name your main sources? 3. How long does it take to access necessary data? 4. Does data that you access in a proper format? 5. What do you think about the transparency of information in Spain? 6. What are the limitations and problems about accessing sports data? 7. Which one is harder to access data? International events or national
events? Why? Profiles of Journalists and General Work System
1. What is your educational background? Do you have any specific education in data journalism? If yes, can you please mention your education?
2. Does your organisation offer any training or convenience (paying for training, or giving available hours) to learn data journalism skills?
3. What type of skills are expected from journalists for data journalism practices?
4. Do your working conditions satisfy you in terms of salaries, working hours, and the overall journalistic practice you achieve?
5. Are there any significant changes in your working conditions after the change in your journalistic practice? If yes can you please compare your old and new working environment?
6. Can you describe the work system in your company? 7. Did data journalism change the work system? If yes, how? If not, how did
you integrate data journalism to your traditional work system? 8. Is there any internal and external needs currently in your organization to
adopt data journalistic practices in sports? Can you please name it?
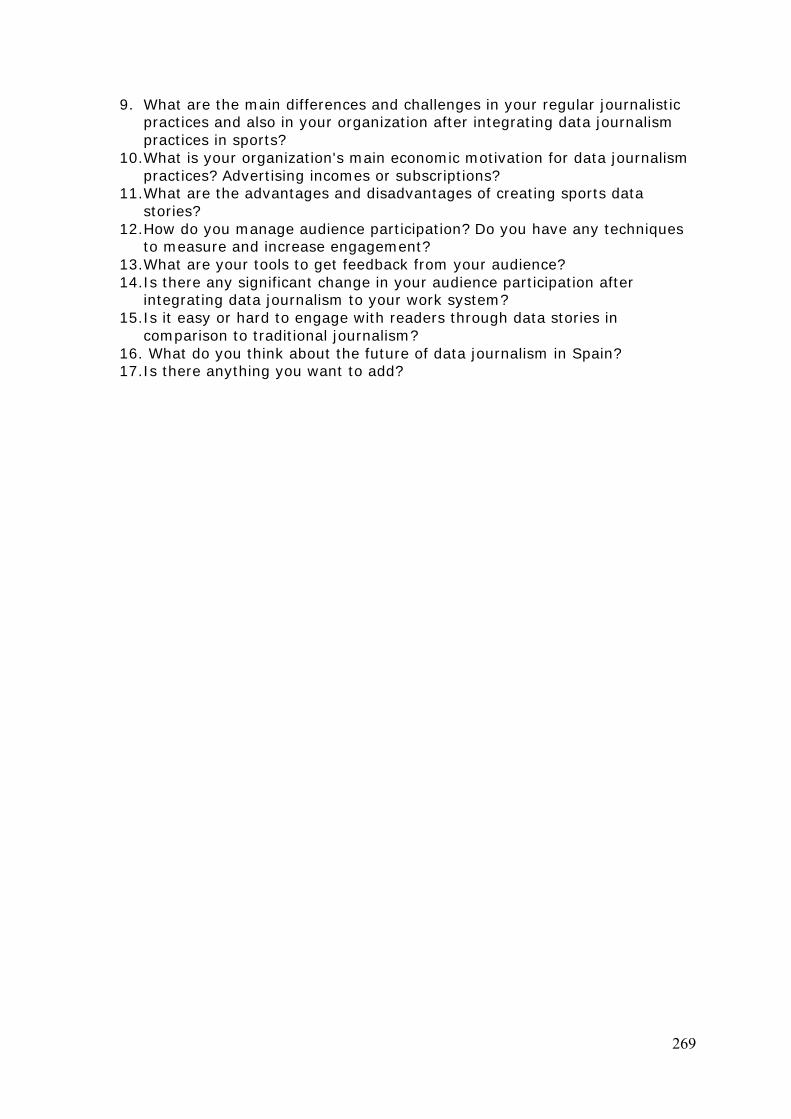
269
9. What are the main differences and challenges in your regular journalistic practices and also in your organization after integrating data journalism practices in sports?
10. What is your organization's main economic motivation for data journalism practices? Advertising incomes or subscriptions?
11. What are the advantages and disadvantages of creating sports data stories?
12. How do you manage audience participation? Do you have any techniques to measure and increase engagement?
13. What are your tools to get feedback from your audience? 14. Is there any significant change in your audience participation after
integrating data journalism to your work system? 15. Is it easy or hard to engage with readers through data stories in
comparison to traditional journalism? 16. What do you think about the future of data journalism in Spain? 17. Is there anything you want to add?
270
Endnotes
1 https://www.journalism.co.uk/news/new-york-times-digitises-entire-archive/s2/a5472/ 2 https://www.blog.google/products/news/look-how-news-google-works/ 3 http://www.holovaty.com/writing/chicagocrime.org-tribute/ 4 https://multimedia.journalism.berkeley.edu/tutorials/digital-transform/ 5 https://www.theatlantic.com/technology/archive/2012/12/new-york-times-snow-fall-feature/320253/ 6 https://www.independent.co.uk/news/media/press/the-independent-becomes-the-first-national-newspaper-to-embrace-a-global-digital-only-future-a6869736.html 7 https://www.pulitzer.org/winners/staff-7 8 http://powerreporting.com/color/ 9 https://simonrogers.net/2014/05/25/introduction-to-data-journalism/ 10 https://www.theguardian.com/news/datablog/2011/jan/31/wikileaks-data-journalism 11 https://wikileaks.org/irq/ 12 https://www.theguardian.com/news/datablog/2009/may/13/mps-expenses-houseofcommons 13 https://www.theguardian.com/news/datablog/2010/oct/23/wikileaks-iraq-data-journalism 14 https://trends.google.com/trends/explore?date=2009-01-01%202019-12-31&q=data%20journalism 15 https://trends.google.com/trends/explore?date=2009-01-01%202019-01-01&q=data%20journalism 16 https://www.washingtonpost.com/news/ask-the-post/wp/2013/01/29/introducing-truth-teller-political-fact-checking/ 17 http://www.washingtonpost.com/wp-srv/special/national/nsa-timeline/m/ 18 https://www.theguardian.com/news/datablog/2010/jul/27/wikileaks-afghanistan-data-datajournalism 19 https://www.theguardian.com/news/datablog/2011/dec/09/data-journalism-reading-riots 20 http://jplusplus.org/en/ 21 https://noda2018.se/ 22 https://www.britannica.com/topic/Freedom-of-the-Press-Act-of-1766 23 https://dataharvest.eu/ 24 https://diavgeia.gov.gr/en 25 http://publicspending.net/payer.php?graph=greece 26 https://www.caixinglobal.com/2018-06-08/caixin-wins-gen-2018-data-journalism-award-for-best-large-data-journalism-team-a-first-for-a-chinese-media-outlet-101267017.html 27 https://pia.gov.ph/features/articles/1015983 28 https://www.naver.com/ 29 http://www.rtve.es/noticias/elecciones/autonomicas-municipales/programas-electorales/puntos/ 30 https://www.medialab-prado.es/en/activities/data-journalism-seminar 31 https://blogs.elconfidencial.com/comunicacion/en-contacto/2017-04-11/el confidencial-european-data-journalism-network_1365061/ 32 Act 19/2013, of 9 December, on Transparency, Access to Public Information, and Good Governance https://transparencia.gob.es/transparencia/dam/jcr:2fcd5d26-cf51-4775-8d44-6683586f1ee9/ley-de-transparencia-ingles.pdf 33 https://civio.es/en/about-us/ 34 https://dondevanmisimpuestos.es/ 35 https://civio.es/en/your-right-to-know/about-this-project/ 36 https://maldita.es/maldita-es-journalism-to-not-be-fooled/ 37 https://www.newtral.es/metodologia-transparencia/ 38 https://elpais.com/tecnologia/2019/03/12/actualidad/1552350738_032029.html
271
39 Cited from Rob Minto, Sports Data Journalism chapter of Mair, John. Data Journalism: Past, Present and Future, Abramis Academic Publishing, 2017. 40 https://www.economist.com/node/21603828 41 https://www.economist.com/node/21603828 42 https://www.vox.com/pages/about-us 43 https://fivethirtyeight.com/features/what-the-fox-knows/ 44 https://fivethirtyeight.com/features/how-france-and-croatia-made-it-to-the-world-cup-final-in-one-chart/ 45 https://fivethirtyeight.com/features/psg-and-real-madrid-werent-supposed-to-have-this-many-problems/ 46 https://as.com/masdeporte/2012/05/31/polideportivo/1338501892_850215.html 47 https://as.com/opinion/2012/05/31/portada/1338490561_850215.html 48 https://ecodiario.eleconomista.es/otros-deportes/noticias/6045404/09/14/Nace-la-revista-digital-mensual-Elite-Sport-que-ofrecera-el-rostro-humano-del-deporte.html 49 https://www.europapress.es/deportes/noticia-revista-elite-sport-incorpora-plataforma-digital-eleconomista-20150112141937.html 50 https://www.publico.es/deportes/publico-y-revista-elite-sport.html 51 Mentioned in 2015. The blog about sports journalism which is written by José Luis Rojas Torrijos https://periodismodeportivodecalidad.blogspot.com/2015/01/marca-plus-y-el-futuro-de-un-periodismo.html 52 https://onlinejournalismblog.com/2011/07/07/the-inverted-pyramid-of-data-journalism/ 53 https://onlinejournalismblog.com/2011/07/13/the-inverted-pyramid-of-data-journalism-part-2-6-ways-of-communicating-data-journalism/ 54 https://blog.datawrapper.de/colors/index.html 55 https://medium.com/@kennelliott/39-studies-about-human-perception-in-30-minutes-4728f9e31a73 56 https://blog.datawrapper.de/guide-what-to-consider-when-creating-tables/ 57 Original statement in English. Those statements originally in Spanish have been translated to English.


