Embed Size (px)
Citation preview
Testing the Influence of Habitat Structureand Geographic Distance on the GeneticDifferentiation of Mouse Lemurs (Microcebus)in Madagascar
Bettina M. Scheel1 & Johanna Henke-von der Malsburg2&
Peggy Giertz2 & S. Jacques Rakotondranary2,3 &
Bernhard Hausdorf1 & Jörg U. Ganzhorn2
Received: 26 April 2015 /Accepted: 19 June 2015 /Published online: 27 August 2015# Springer Science+Business Media New York 2015
Abstract The evolution of the high level of microendemism in Madagascar’s biotaremains poorly understood. Allopatric speciation or adaptations to local conditionsalong continuous gradients are two mechanisms that could have contributed to theextraordinary radiation of lemurs. Here we tested whether mouse lemurs (Microcebusgriseorufus) occurring across three adjacent but distinct vegetation formations (rangingfrom dry forest to spiny bush) in southwestern Madagascar showed signs of geneticdifferentiation that could be interpreted as incipient speciation and adaptation todifferent environmental conditions using analysis of molecular variance and distance-based redundancy analysis. In the context of a mark-recapture study, mouse lemurswere captured with Sherman live traps set eight times for four nights per trappingsession in standardized trapping grids in the three vegetation formations betweenOctober 2007 and February 2009. For genetic analyses, we used tissue samples from41 female and 35 male M. griseorufus. Genetic differentiation between demes asestimated by amplified fragment length polymorphism (AFLP) data (as parental
Int J Primatol (2015) 36:823–838DOI 10.1007/s10764-015-9855-z
Bettina M. Scheel and Johanna Henke-von der Malsburg contributed equally to this work.
Electronic supplementary material The online version of this article (doi:10.1007/s10764-015-9855-z)contains supplementary material, which is available to authorized users.
* Jörg U. [email protected]
1 Centre for Natural History, Zoological Museum, 20146 Hamburg, Germany2 Department of Animal Ecology and Conservation, University of Hamburg, 20146 Hamburg,
Germany3 Département de Paléontologie et d’Anthropologie Biologique, Faculté des Sciences, Université
d’Antananarivo, Antananarivo 101, Madagascar

markers) and mitochondrial D-loop sequences (as maternally inherited markers) wasmore pronounced in philopatric females than in males, which are the dispersing sex inthis species. In single-factor analyses, isolation-by-ecology had about the same statis-tical effect as isolation by distance, but isolation-by-ecology was no longer significantonce isolation by distance was taken into account. Despite some differentiation betweenlocal demes, STRUCTURAMA, a Bayesian approach for inferring population structurefrom genetic data, assigned all individuals to a single population. Thus, we did not findevidence for incipient ecological speciation as a result of adaptation to the threeinvestigated habitat types on a small geographic scale based on the available samples.
Keywords Evolution . Lemurs . Madagascar . Microendemism . Primates . Speciation
Introduction
The processes that led to the high diversity and small scale microendemism ofMadagascar’s biota remain enigmatic (Brown et al. 2014; Dewar and Richard 2007;Pearson and Raxworthy 2009; Vences et al. 2009). Among other processes, theadvance and retreat of humid forests during climate changes could have createdecotones that inhibited the exchange of animals across vegetation boundaries and theseecotones could have contributed to the evolution of species on small geographicalscales (Wilmé et al. 2006). The hypothesis of Wilmé et al. has been confirmed bypattern analyses of some lemur and other taxa but could not explain the distribution ofother groups (Brown et al. 2014; Pearson and Raxworthy 2009; Wollenberg et al.2008). The hypothesis of Wilmé et al. (2006) is strongly supported by the distributionof two partially sympatric species of mouse lemurs, Microcebus murinus andM. griseorufus. In regions where these two species occur together, M. murinus isrestricted to more mesic sites whereas M. griseorufus inhabits dry and spiny forests.These different preferences result in sharp species boundaries, e.g., along the borderbetween gallery forests and adjacent spiny forests in Berenty (Yoder et al. 2002) orAndohahela National Park in southern Madagascar (Rakotondranary and Ganzhorn2011; Rakotondranary et al. 2011). At stable ecotones stretching continuously overseveral kilometers, the two species can hybridize but maintain species identities just afew meters farther away within their specific vegetation formation, whereas in mosaic-type patterns of the different vegetation formations, the two species of Microcebushybridize (Gligor et al. 2009; Hapke et al. 2011). The question thus remains of howlarge the vegetation differences need to be to generate and to maintain species separa-tion (Sommer et al. 2014).
In the present study we used ecotones in Tsimanampetsotsa National Park betweenthree vegetation formations to test whether these ecotones are sufficient to reduce geneflow across these vegetation boundaries within a seemingly contiguous population ofMicrocebus griseorufus, i.e., whether or not there is evidence for incipient ecologicalspeciation (Rundle and Nosil 2005; Schluter 2001, 2009; Shafer and Wolf 2013). Theseecotones resemble the transition between gallery and spiny forests that forms theboundary betweenM. murinus andM. griseorufus in other parts of Madagascar (Gligoret al. 2009; Hapke et al. 2011; Rakotondranary and Ganzhorn 2011; Rakotondranaryet al. 2010, 2011; Yoder et al. 2002; Fig. 1). The ecotones at Tsimanampetsotsa are less
824 B. M. Scheel et al.

pronounced than those in Berenty or Andohahela National Park. Thus, we couldinvestigate whether such slight vegetation differences might be sufficient to causemeasurable genetic differentiation within a continuous lemur population. If theTsimanampetsotsa ecotones represented barriers for gene flow, we would expectdiscontinuities in the genetic composition of individuals sampled in the differentvegetation formations of Tsimanampetsotsa. Females are philopatric and males arethe dispersing sex in all Microcebus species studied so far. In addition, females tend toproduce matrilineal grouping patterns within a population (Fredsted et al. 2004; Génin
Fig. 1 (A) Distinct vegetation boundary between gallery forest and spiny forest in Andohahela National Parkwhere the ecotone between the gallery forest and the spiny forest marks the distribution limits of Microcebusmurinus (in the gallery forest) andM. griseorufus (in the spiny forest). (B) Less distinct vegetation boundary inTsimanampetsotsa between littoral forest at the foot of the Mahafaly Plateau (corresponding to trapping grids 1and 4) and the spiny forest on the limestone cliff (in the background) rising toward the Mahafaly Plateau(corresponding to trapping grids 2 and 5). Andohahela photo: C.-P. Carstens; Tsimanampetsotsa photo: J. U.Ganzhorn.
Genetic Differentiation of Mouse Lemurs 825

2008; Radespiel et al. 2001; Wimmer et al. 2002). Under the assumption that ecotonesinhibit gene flow and thus facilitate the evolution of distinct lemur species, wehypothesize that mouse lemurs from the three contiguous vegetation formations ofTsimanampetsotsa have distinct genetic characteristics and that differences between thedemes should be more pronounced in mitochondrial markers that are inherited onlyfrom the more philopatric females than in nuclear markers inherited from both parents.Thus, we used the hypervariable region 1 of the mitochondrial D-loop as a maternallyinherited marker and amplified fragment length polymorphism (AFLP) data as nuclearmarkers to investigate the differentiation patterns in Tsimanampetsotsa. The mitochon-drial sequences allowed the reconstruction of the relationships of the females, whereaswe used the AFLP data, which are dominant presence/absence data, to infer thedelimitation of populations and the assignment of the sampled individuals to thesepopulations based on an optimization of Hardy–Weinberg equilibrium within popula-tions. Furthermore, the different inheritance of the two marker classes allowed us toinfer differences between the differentiation patterns of females and males.
Materials and Methods
Study Site
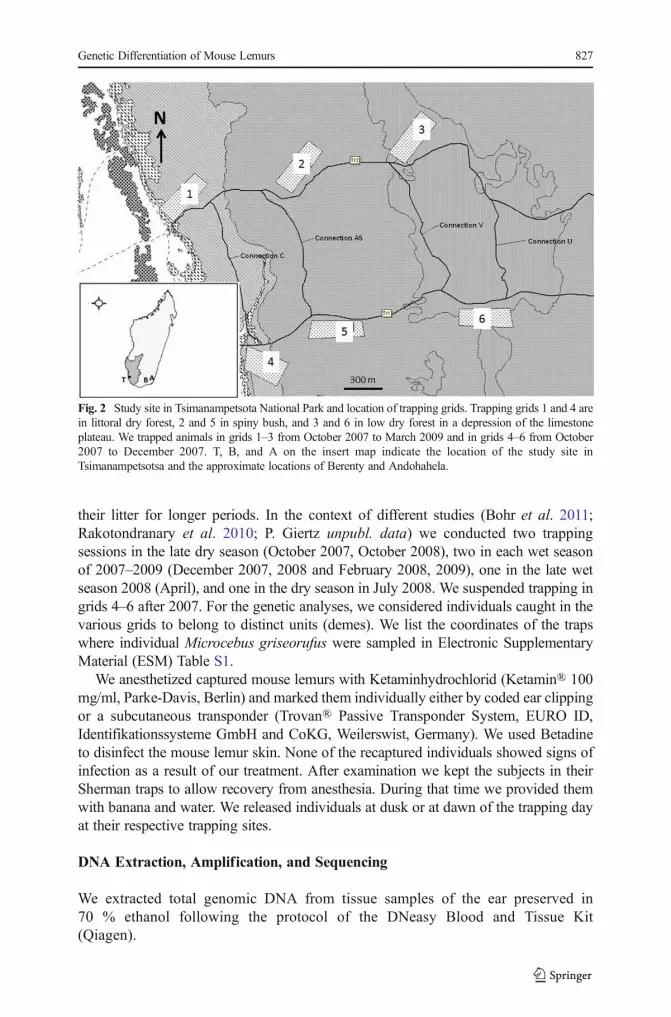
We collected samples for genetic analyses in the northwestern part ofTsimanampetsotsa National Park (230,000 ha), ca. 85 km south of Toliara (S 24°01′;E 43°44′) in the southwest of Madagascar from April 2007 to March 2009. The areareceives on average ca. 400 mm of rain per year (Andriatsimietry et al. 2009). It ischaracterized by a soda lake in the coastal plain that mounts toward the east to theabutting Mahafaly Plateau, a limestone ridge with a cliff of 40–100 m height. Towardthe east, the plateau is interspersed with depressions where sandy soils have accumu-lated. Owing to the orographic and edaphic conditions of the region, three distincthabitat types can be distinguished (Ratovonamana et al. 2011; Rakotondranary et al.2010; Fig. 1B): 1) littoral dry forest on sand at the foot of the limestone plateau adjacentto the soda lake; 2) spiny, xerophytic bush on calcareous soil on the slope of theMahafaly Plateau; and 3) low dry forest on ferruginous soil in a depression of thelimestone plateau. As a result of abrupt changes in soil characteristics, the threeformations are separated by clear ecotones, though there are no barriers to dispersalsuch as rivers or steep sloped separating the habitat types.
Mouse Lemur Captures
We established two trapping grids (150 m × 400 m) in each habitat type along two2.5 km transects (Fig. 2). Trapping grids in the different vegetation formations alongtransects were ca. 500 m apart. The two grids within a given vegetation formation wereca. 1 km apart. We set Sherman live traps (H. B. Sherman Traps, Tallahassee, FL: 7.57.5 × 30.5 cm) at a height of 1–2 m at each junction (25 m distance) of a trail system,resulting in 119 trap stations per grid. We baited traps with pieces of ripe bananasbefore sunset and checked them before sunrise. During the weaning season (February)we checked traps at midnight, to ensure that lactating females were not separated from
826 B. M. Scheel et al.
their litter for longer periods. In the context of different studies (Bohr et al. 2011;Rakotondranary et al. 2010; P. Giertz unpubl. data) we conducted two trappingsessions in the late dry season (October 2007, October 2008), two in each wet seasonof 2007–2009 (December 2007, 2008 and February 2008, 2009), one in the late wetseason 2008 (April), and one in the dry season in July 2008. We suspended trapping ingrids 4–6 after 2007. For the genetic analyses, we considered individuals caught in thevarious grids to belong to distinct units (demes). We list the coordinates of the trapswhere individual Microcebus griseorufus were sampled in Electronic SupplementaryMaterial (ESM) Table S1.
We anesthetized captured mouse lemurs with Ketaminhydrochlorid (Ketamin® 100mg/ml, Parke-Davis, Berlin) and marked them individually either by coded ear clippingor a subcutaneous transponder (Trovan® Passive Transponder System, EURO ID,Identifikationssysteme GmbH and CoKG, Weilerswist, Germany). We used Betadineto disinfect the mouse lemur skin. None of the recaptured individuals showed signs ofinfection as a result of our treatment. After examination we kept the subjects in theirSherman traps to allow recovery from anesthesia. During that time we provided themwith banana and water. We released individuals at dusk or at dawn of the trapping dayat their respective trapping sites.
DNA Extraction, Amplification, and Sequencing
We extracted total genomic DNA from tissue samples of the ear preserved in70 % ethanol following the protocol of the DNeasy Blood and Tissue Kit(Qiagen).
Fig. 2 Study site in Tsimanampetsota National Park and location of trapping grids. Trapping grids 1 and 4 arein littoral dry forest, 2 and 5 in spiny bush, and 3 and 6 in low dry forest in a depression of the limestoneplateau. We trapped animals in grids 1–3 from October 2007 to March 2009 and in grids 4–6 from October2007 to December 2007. T, B, and A on the insert map indicate the location of the study site inTsimanampetsotsa and the approximate locations of Berenty and Andohahela.
Genetic Differentiation of Mouse Lemurs 827

We amplified a ca. 690 bp long fragment of the mitochondrial D-loop containing thehypervariable region 1 with one primer binding to the constant region of the D-loop(mih1coau: 5′-GTTATAGTTTCAGGTTAGTCA-3′) and one primer binding to the cyto-chrome b gene (TsimMgCytbfw2: 5′-TCGGACAAGTGGCCTCTAT-3′) (Hapke et al.2011). Amplifications were performed in 25-μl volumes containing 17.4 μl of purifiedwater, 2.5 μl of 10× polymerase chain reaction (PCR) buffer (Qiagen), 1 μl of dNTP mix(5mMeach), 1μl of each primer (10μM), 0.1μl of TaqDNApolymerase (5U/μl; Qiagen),and 2μl of template DNA. Typical PCR conditions comprised an initial denaturation step for2 min at 92°C, followed by 35 cycles of 40 s denaturation at 92°C, 60 s annealing at 55°C,and 60 s elongation at 72°C, and one final elongation step of 5 min at 72°C.
We purified the PCR products using thermosensitive alkaline phosphatase (1 U/μl)and exonuclease I (20 U/μl; Thermo Scientific) in a ratio of 2:1 at 37°C for 15 min.Both strands of the amplified fragments were sequenced at Macrogen Europe Labora-tory (Amsterdam).
DNA Sequence Analyses
We assembled forward and reverse sequences using ChromasPro version 1.7.5(Technelysium, Tewantin, Australia). We aligned the sequences with the MUSCLEalgorithm (Edgar 2004) as implemented in MEGA version 6.06 (Tamura et al. 2013).We deposited the DNA sequences analyzed in this article in GenBank under accessionnumbers KP793607–KP793682. We determined HKY+I (Hasegawa et al. 1985) as themost appropriate substitution model based on the Bayesian information criterion withMEGA. We constructed a median-joining network based on the D-loop sequences(Bandelt et al. 1999) using the program PopART (Leigh and Bryant 2014) with ε = 0.
AFLP
We digested ca. 100 ng genomic DNAwith 5 units of EcoRI (Thermo Scientific) and 3units of Tru1I (MseI) (Thermo Scientific) in a 25-μl reaction volume containing 2×Tango buffer (Thermo Scientific) for 1 h at 37°C followed by 1 h at 65°C. 25 μl ofligation mix containing 5 pmol of the EcoRI adapter, 50 pmol of the Tru1I adapter,12.5 nmol of ATP (Thermo Scientific), and 3 units of T4 DNA ligase and its buffer(Thermo Scientific) were added to the digestion product and incubated at 16°C for 8 h.We diluted the ligation products 1:5 with sterile ddH2O, and stored at –40°C.
For preselective PCR, we used primers with one selective base (PEcoRI-A andPMseI-C). We added 5 μl of the diluted ligation product to 20 μl of the preselectivePCR mastermix, consisting of 13.25 μl of ddH2O, 2.5 μl of 10× PCR buffer(biolabproducts), 1.5 μl of MgCl2 (25 mM), 1 μl of dNTP (5 mM each), 0.75 μl ofPEcoRI-A (10 μM), 0.75 μl of PMseI-C (10 μM), and 0.25 μl of TaqDNA polymerase(5 U/μl; biolabproducts). We ran preselective PCR in 21 cycles (94°C for 30 s, 56°Cfor 60 s, 72°C for 60 s) with a final extension step at 72°C for 10 min. We limitedramping speed to 1°C per second. We checked a random sample of preselective PCRproducts on a 1 % agarose gel. We diluted the PCR products 1:10 with sterile ddH2O.
For selective PCR we used five primers (modified from Chaveerach et al. 2007 andFischer et al. 2011) with three additional bases at the 3′ end (Table I). We used sixprimer combinations (SMseI/SEcoRIDYE): CAG/ACCFAM, CAG/AACNED, CAG/
828 B. M. Scheel et al.

AGCHEX, CTT/ACCFAM, CTT/AACNED, CTT/AGCHEX. We added 5 μl of the dilutedpreselective PCR product to 20 μl of the selective PCR mastermix, consisting of11.88 μl of ddH2O, 2.5 μl of 10× PCR buffer, 3.5 μl of MgCl2 (25 mM), 1 μl ofdNTP (5 mM each), 0.13 μl of labeled SEcoRI-XXX primer (10 μM), 0.75 μl ofSMseI-XXX primer (10 μM), and 0.25 μl of Taq DNA polymerase (5 U/μl). Forselective PCR we applied a touchdown PCR, starting with 94°C for 30 s, 65°C for 30 s,and 72°C for 60 s, followed by nine cycles of 1°C decrease of annealing temperatureper cycle; 30 cycles with 94°C for 30 s, 56°C for 30 s, and 72°C for 60 s; and a finalelongation step at 72°C for 30 min. Ramping speed was limited to 1°C/s.
We mixed 2 μl of the selective PCR product of each SMseI-CAG/SEcoRI-XXXprimer combination and of each SMseI-CTT/SEcoRI-XX primer combination, respec-tively. We blended 1 μl of each mixed selective PCR product with 10 μl of mastermix,consisting of 0.15 μl of GeneScan 500 ROX Size Standard (Applied Biosystems) and9.85 μl of Hi-Di-Formamide (Applied Biosystems). We denatured the samples at 95°Cfor 8 min and then separated them electrophoretically using pop4-polymer (AppliedBiosystems) on an ABI PRISM 3730 capillary sequencer (Applied Biosystems).
We tested reproducibility of the AFLP method by running six randomly chosensamples from digestion to selective PCR in duplicates. We calculated the replicatereproducibility rate as the mean percentage of matching character states betweenreplicates of the same individual.
AFLP Signal Detection and Scoring
We used a Peak Scanner version 1.0 (Applied Biosystems) for AFLP signal detection.We applied light smoothing to the analysis; all other settings were left at the defaultvalues. Based on the Peak Scanner output we conducted automated binning and scoringwith RawGeno version 2 (Arrigo et al. 2009), an add-on package for the free statisticalsoftware R (R Core Team 2013). For scoring we set the binning parameters to 1.0 forminimum bin width and 1.5 for maximum bin width following Arrigo et al. (2009). Weset the scoring range to 50–400 bp. Filtering parameters remained the same at eachbinning parameter constellation: We set the value for low-fluorescence bins to 100relative fluorescent units and the value for low-frequency bins to 1. We eliminated binswith reproducibility lower than 80 %.
Table I Primers and fluorescent dye labels used for AFLP
Primer Sequence 5′- Labeling
PA-EcoRI-A 5′- GAC TGC GTA CCA ATT CA -3′ None
PA-MseI-C 5′- GAT GAG TCC TGA GTA AC -3′ None
SEcorRI ACC 5′- GAC TGC GTA CCA ATT CA ACC -3′ FAM
SEcorRI AGC 5′- GAC TGC GTA CCA ATT CA AGC -3′ HEX
SEcorRI AAC 5′- GAC TGC GTA CCA ATT CA AAC -3′ NED
SMseI CAG 5′- GAT GAG TCC TGA GTA AC CAG -3′ None
SMseI CTT 5′- GAT GAG TCC TGA GTA AC CTT -3′ None
Modified from Chaveerach et al. (2007) and Fischer et al. (2011).
Genetic Differentiation of Mouse Lemurs 829

Inferring Population Structure Using STRUCTURAMA
We used STRUCTURAMA (Huelsenbeck and Andolfatto 2007; Huelsenbeck et al. 2011)to infer the population structure based on the AFLP data. The use of AFLP data for theapproach implemented in STRUCTURAMA has been justified by Falush et al. (2007).STRUCTURAMAgroups individuals into clusters such that Hardy–Weinberg equilibriumwithin clusters is maximized. The number of populations and the assignment of individualsto clusters are considered random variables that follow a Dirichlet process prior in thisBayesian approach. We ran the Markov chain Monte Carlo analysis for 1,000,000 cycles,sampled every 100th cycle, and discarded the first 4000 samples as burn-in.
Genetic Differentiation Between Demes
We used analysis of molecular variance (Excoffier et al. 1992) to estimate thepartitioning of genetic variance among demes and within demes and the differentiationbetween demes using GenAlEx version 6.41 (Peakall and Smouse 2006). We deter-mined significance with 9999 permutations. Because of the low sample sizes we didnot consider the specimens from trapping grids 5 and 6 in these analyses.
Isolation by Distance and Effect of Habitat on Genetic Differentiation
We used distance-based redundancy analysis (dbRDA; Legendre and Anderson 1999;McArdle and Anderson 2001) as implemented in DISTLM (Anderson 2004) to testwhether the genetic differentiation of the investigated demes can be explained by isolationby distance (Wright 1943); by Bhabitat^ (= isolation-by-ecology; Shafer and Wolf 2013),i.e., by the three vegetation types; and whether habitat still has a significant effect on thegenetic structure if distance is considered by including the geographical coordinates of thecapture sites as covariates. We did not apply Mantels tests here because there are concernsthat these are not appropriate for this purpose (e.g., Guillot and Rousset 2013; Raufasteand Rousset 2001). We calculated HKY+I distances based on the mitochondrial D-loopsequences with PAUP* 4.0 beta 10 (Swofford 2002) and Jaccard distances based onAFLPdata using PhylTools version 1.32 (Buntjer 2001). We performed a multiple regressionanalysis of the genetic distance matrices and the distances between capture sites (enteredas latitude and longitude obtained by the GPS) to assess the percentage of the geneticvariability explained by isolation by distance. We estimated the percentage of the geneticvariability explained by isolation-by-ecology with a regression analysis of the geneticdistance matrices and a set of two dummy variables (each with states 0 and 1) coding thethree habitats where we had caught the subjects. Finally, we analyzed the genetic distancematrices using dbRDAwith Bhabitat^ (= isolation-by-ecology) as predictor variable andthe geographic coordinates as covariate to determine the importance of the subdivisioninto clusters. For all these analyses, we ran 9999 permutations to estimate P values.
Ethical Note
We conducted this research under the Accord de Collaboration among the University ofAntananarivo and the University of Hamburg. Research protocols were approved and
830 B. M. Scheel et al.

permits authorized by Commission Tripartite of the Direction des Eaux et Forêts deMadagascar adhering to the legal requirements of Madagascar.
Results
Differentiation in mtDNA
We found 13 different mtDNA haplotypes in the D-loop sequences of 76 reddish-graymouse lemurs (41 females, 35 males; ESM Tables S2 and S3). Fifty-one sites of the 656sites without alignment gaps or missing data were polymorphic with one substitution ateach site. The HKY+I distances between the sequences ranged from 0.0 % to 4.1 %(mean 2.2 ± 1.0 %). Figure 3 shows a median-joining network based on the D-loophaplotypes. The sexes differed in haplotype composition and frequency (ESMTable S2). We found 12 haplotypes in males and 10 occurred in females. We foundmost rare haplotypes, i.e., haplotypes that were found in fewer than 10 % of thesampled individuals of a deme, in males (nine in males, three in females; differencenot significant according to χ2 test).
Fig. 3 Median-joining network based on D-loop sequences of 76 individuals of Microcebus griseorufussampled in Tsimanampetsotsa between April 2007 and March 2009 showing the distribution of the haplotypesacross trapping grids (histograms) and sexes.
Genetic Differentiation of Mouse Lemurs 831

Ten percent of the variance in the D-loop sequences was found between demes. Thepairwise ΦPT values based on the mtDNA sequences (Table II) indicated that differen-tiation across the ecotone between trapping grid 1 in littoral dry forest and trapping grid3 in low dry forest on the plateau was stronger than between the two trapping grids 1and 4 located within the littoral dry forest. The geographically intermediate deme attrapping grid 2 in spiny bush was weakly differentiated from that at trapping grid 1 andnot significantly differentiated from that at trapping grid 3. If we considered onlyfemales (Table III), a higher percentage of the observed variance (17 %) was betweendemes.
The two demes at trapping grids 1 and 4 in littoral dry forest were not significantlydifferentiated (Table III), but the differentiation between these demes and the demes inlow dry forest on the plateau was larger than in the comparison considering thecombined data for females and males (Table II). If we considered only males(Table III), we observed only 6 % of the total variance in males was between demesand there was no significant differentiation between any of the investigated demes.
Isolation by distance explained 10.9 % of the observed variance in dbRDA based onthe HKY+I distances between the mitochondrial D-loop sequences of all individuals(df = 75, pseudo-F = 4.46, P < 0.001). About the same percentage of the observedvariance (8.8 %, df = 75, pseudo-F = 3.53, P = 0.001) was explained by using habitat aspredictor variable. With habitat as predictor variable and the geographical coordinatesas covariates, the contribution of habitat in addition to the geographical distances (3.4%) was nonsignificant (df = 75, pseudo-F = 1.42, P = 0.225).
Table II Differentiation of the demes of Microcebus griseorufus investigated in Tsimanampetsotsa betweenApril 2007 and March 2009 based on mtDNA data (N = 64 individuals)
Trapping grid 1 Trapping grid 2 Trapping grid 3 Trapping grid 4
Trapping grid 1 (N = 16) 0.035 0.005 0.023
Trapping grid 2 (N = 16) 0.072 0.306 <0.001
Trapping grid 3 (N = 16) 0.109 0.009 0.001
Trapping grid 4 (N = 16) 0.089 0.156 0.134
ΦPT values are shown below the diagonal; P values are shown above the diagonal. Percentage of variancebetween demes: ΦPT = 0.095, P < 0.001.
Table III Differentiation of the demes ofMicrocebus griseorufus investigated in Tsimanampetsotsa betweenApril 2007 and March 2009 based on mtDNA data
Trapping grid 1 Trapping grid 2 Trapping grid 3 Trapping grid 4
Trapping grid 1 (5 males, 11 females) 0.000 0.055 0.026
Trapping grid 2 (10 males, 6 females) 0.088 0.060 0.099
Trapping grid 3 (7 males, 9 females) 0.268*** 0.147* 0.122
Trapping grid 4 (7 males, 9 females) 0.091 0.168* 0.228**
ΦPT values of females (N = 35) are shown below the diagonal, ΦPT values of males (N = 29) above thediagonal. Percentage of variance between demes: ΦPT = 0.167, P < 0.001 for females; ΦPT = 0.058, P = 0.103for males.*P < 0.05; **P < 0.01; ***P < 0.001.
832 B. M. Scheel et al.

If we considered only females, the proportion of variance explained by isolation bydistance increased to 20.2 % (df = 40, pseudo-F = 4.794, P < 0.001) and the proportionof the variance explained by isolation-by-ecology increased to 19.6 % (df = 40, pseudo-F = 4.63, P < 0.001). The analysis with habitat as predictor variable and the geograph-ical distance as covariate was not significant (9.0 %, df = 40, pseudo-F = 2.29, P =0.093). If we considered only males, neither isolation by distance (8.7 %, df = 34,pseudo-F = 1.52, P = 0.163), nor isolation-by-ecology (13.9 %, df = 34, pseudo-F =1.62, P = 0.134), nor the effect of habitat with geographical distance as covariate (6.0%, df = 34, pseudo-F = 1.06, P = 0.363) was significant.
Differentiation in AFLP
Using six primer combinations, we scored 793 fragments of 50–400 bp length of which633 were polymorphic in 78 mouse lemur individuals (40 females, 38 males; ESMTable S1). The reproducibility rate was 97.1 % (N = 6). Jaccard distances betweenindividuals ranged from 6.7 % to 34.9 % (mean 26.1 ± 2.8 %). STRUCTURAMAcalculated the posterior probability that the sampled Microcebus griseorufus individ-uals form a single population as 1.0.
Compared to the variance in the mtDNA, a smaller though highly significant portionof the variance in the nuclear AFLP markers, only 3 %, was explained by differenti-ation between demes (Table IV). The differentiation between demes at trapping grids 1and 3 is also stronger than between the two demes at trapping grids 1 and 4 if weconsidered all individuals (Table IV). Surprisingly, the demes at trapping grids 3 and 4were even less differentiated than the demes at trapping grids 1 and 4. If only femaleswere considered (Table V), the demes at trapping grids 3 and 4 were not significantlydifferentiated. If we considered only males (Table V), the demes at trapping grids 1 and3 were significantly differentiated, whereas the demes at trapping grids 1 and 4 werenot significantly differentiated. This indicates exchange of males between these demeswithin the littoral dry forest, but less frequent gene flow between demes across theecotone.
A distance-based redundancy analysis on the Jaccard distances between the AFLPmarker sets of all sampled individuals revealed that isolation by distance explained 4.9% of the observed variance (df = 77, pseudo-F = 1.917, P < 0.001). Although isolation-by-ecology (habitat) explained a slightly higher percentage of the observed variance(4.5 %, df = 77, pseudo-F = 1.782, P < 0.001), habitat did not explain a significant
Table IV Differentiation of the demes of Microcebus griseorufus we investigated in Tsimanampetsotsabetween April 2007 and March 2009 based on AFLP data (N = 69 individuals)
Trapping grid 1 Trapping grid 2 Trapping grid 3 Trapping grid 4
Trapping grid 1 (N = 18) 0.001 0.001 0.001
Trapping grid 2 (N = 15) 0.042 0.002 0.001
Trapping grid 3 (N = 17) 0.041 0.029 0.026
Trapping grid 4 (N = 19) 0.033 0.025 0.013
ΦPT values are shown below the diagonal; P values are shown above the diagonal. Percentage of variancebetween demes: ΦPT = 0.030, P < 0.001.
Genetic Differentiation of Mouse Lemurs 833

proportion of the variance in addition to the geographical distances (3.6 %, df = 77,pseudo-F = 1.433, P = 0.221). If we considered only females, the proportion ofvariance explained by isolation by distance increased to 8.9 % (df = 39, pseudo-F =1.802, P < 0.001) and the proportion of variance explained by isolation-by-ecologydecreased to 3.6 % (df = 39, pseudo-F = 1.43, P = 0.022). An analysis with the habitatas predictor variable and the geographical coordinates as covariates was again nonsig-nificant (5.2 %, df = 39, pseudo-F = 1.057, P = 0.377). If we considered only males,isolation by distance (6.9 %, df = 37, pseudo-F = 1.299, P = 0.016) and isolation-by-ecology (4.2 %, df = 37, pseudo-F = 1.585, P = 0.002) were significant. However, ananalysis with habitat as predictor variable and the geographical distances as covariateswas not significant (7.1 %, df = 37, pseudo-F = 1.367, P = 0.257).
Discussion
Though mouse lemurs showed signs of population differentiation, all individuals fromTsimanampetsotsa National Park form a single population according toSTRUCTURAMA. Genetic differentiation between demes was more pronounced inphilopatric females than in males. In single-factor analyses, isolation-by-ecology hadabout the same statistical effect as isolation by distance, but isolation-by-ecology wasno longer significant once isolation by distance was taken into account.
The structure of the demes of the reddish-gray mouse lemur in the different habitatsis strongly affected by differences in the behavior of females and males. The findingsthat there are more mitochondrial haplotypes in males; that rare haplotypes, i.e.,haplotypes that are found in <10 % of a deme, are found mainly in males; and that amuch lower percentage of variance can be ascribed to differences between the demes inmales (6 % in males vs. 17 % in females with regard to mtDNA, 3 % in males vs. 5 %in females with regard to the AFLP data) all indicate that males move between demeswhereas large-scale movement of females is much rarer. This corresponds to the patternfound in other mouse lemur species and populations (Dammhahn and Kappeler 2005;Génin 2008; Fredsted et al. 2004; Radespiel et al. 2001, 2003; Schwab and Ganzhorn2004; Wimmer et al. 2002) and is further confirmed by the lack of isolation by distancein males in contrast to females. These patterns are more distinct in the mitochondrialsequences than in the AFLP data because the mitochondrial sequences are not affected
Table V Differentiation of the demes of Microcebus griseorufus we investigated in Tsimanampetsotsabetween April 2007 and March 2009 based on AFLP data
Trapping grid 1 Trapping grid 2 Trapping grid 3 Trapping grid 4
Trapping grid 1 (7 males, 11 females) 0.058** 0.039* 0.014
Trapping grid 2 (9 males, 6 females) 0.051** 0.029* 0.029*
Trapping grid 3 (9 males, 8 females) 0.058** 0.039* 0.025*
Trapping grid 4 (9 males, 10 females) 0.057** 0.058** 0.004
ΦPT values of females (N = 35) are shown below the diagonal, ΦPT values of males (N = 34) above thediagonal. Percentage of variance between demes: ΦPT = 0.045, P < 0.001 for females; ΦPT = 0.032, P < 0.001for males.*P < 0.05; **P < 0.01; ***P < 0.001.
834 B. M. Scheel et al.

by male migration as a result of the maternal inheritance of mtDNA. Potential differ-entiation of the philopatric females in the mainly nuclear AFLP markers is obscured byrecombination with the nuclear genomes of migrating males originating from otherhabitats. Home ranges of Microcebus griseorufus are <1 ha (Bohr et al. 2011; Génin2008). These small home ranges, together with female philopatry and a matrilinearsocial structure, facilitate spatial genetic differentiation. Yet, individuals disperse overseveral hundred meters (Génin 2008) and males from other Microcebus species canmake extended excursions (Dammhahn and Kappeler 2005; Eberle and Kappeler 2002,2004; Fredsted et al. 2004; Génin 2008; Radespiel et al. 2003, 2008; Schwab andGanzhorn 2004). Though we never caught the same individual in more than one grid(Giertz unpubl. data), our data indicate that the ecotones found at Tsimanampetsotsa donot represent effective barriers for movements of M. griseorufus between vegetationformations.
Statistical effects of isolation-by-ecology were similar to isolation by distance inmost comparisons, irrespective of the type of genetic markers and of whether weconsidered all individuals or only females or only males. Although the differentiationof the mtDNA sequences and the AFLP markers between the demes with regard tohabitat was not significant once isolation by distance was considered, the proportion ofvariation explained by isolation-by-ecology (4.4–9.5 %) matched the results document-ed in a meta-analysis of other studies (ca. 5 %; Shafer andWolf 2013). Thus, the lack ofevidence for incipient speciation at the predominantly neutral genetic markers may bethe result of a lack of power to detect the expected signature of incipient ecologicalspeciation with neutral loci. Thibert-Plante and Hendry (2010) have shown that theexpected signature of ecological speciation is not reliably detected with neutral geneticmarkers when divergent selection is weak or migration is either low or high. In part, thelack of power may also be a result of the insufficient number of individuals caught inthe replicate grids in spiny bush and low dry forest on the plateau. Thus, we had torestrict the comparisons within the same habitat to the littoral dry forest.
Alternatively, the lack of evidence for incipient ecological speciation at the predomi-nantly neutral genetic markers may be the result of a true lack of differentiating adaptationof the examined demes to the different habitat types. This might be due to the smallextension of the different habitats at Tsimanampetsotsa or the alternation of narrow stripesof dry forest, spiny bush, and again dry forest in the study area. At more pronouncedecotones between different habitats, such as between gallery forests and adjacent spinyforest (Fig. 1A),Microcebus griseorufus could be well separated from otherMicrocebusspecies (Yoder et al. 2002), but can also hybridize with the ecologically and morpholog-ically well-differentiated Microcebus murinus (Gligor et al. 2009; Hapke et al. 2011).However, in this case habitat differences and selection seems to be strong enough topreserve the distinctness of both species in adjacent habitats. In TsimanampetsotsaNational Park migrating and opportunistically matingmales may easily cross the ecotonesbetween all three habitats, although we never recaptured a marked individual in a habitatother than the one where it had been captured before (P. Giertz unpubl. data). Thus, theremight be a lack of significant differentiation as a result of gene flow by migrating malesthat counteracts starting adaptation of the philopatric females even if there is divergentselection in the different habitats in Tsimanampetsotsa National Park.
The findings from Tsimanampetsotsa could be due to the fact that ecotones atTsimanampetsotsa were less pronounced than at Andohahela, where ecotones provide
Genetic Differentiation of Mouse Lemurs 835

clear separation of different Microcebus species (Fig. 1A). The habitats atTsimanampetsotsa may not be so different from a Microcebus’ point of view that theyinduce incipient speciation within a contiguous population. In contrast, the clear speciesseparation at Andohahela might reflect a situation in which a species (M. griseorufus)comes into contact with a species (M. murinus) secondarily after both (or just one)species have acquired specific adaptations in allopatry. Thus, the result of this studyshould not be considered as conclusive evidence against ecological speciation in mouselemurs. Yet, a failure to detect signatures of ecological speciation in additional casestudies would indirectly strengthen hypotheses that propose that the high biodiversityon Madagascar is the result of evolutionary divergence in allopatry (Brown et al. 2014;Goodman and Ganzhorn 2004; Olivieri et al. 2007; Pearson and Raxworthy 2009;Vences et al. 2009; Wilmé et al. 2006; Wright 1999).
Acknowledgments The study was conducted under the BAccord de Collaboration^ between MadagascarNational Parks (MNP, formerly ANGAP), the University of Antananarivo, and the University of Hamburg.We thank MNP, Chantal Andrianarivo, Jocelyn Rakotomalala, Domoina Rakotomalala, the late OlgaRamilijaona, Daniel Rakotondravony, Charlotte Rajeriarison, and Roger Edmond for their collaboration andsupport. We acknowledge the authorization and support of this study by the Ministère de l’Environement, desEaux et Forêts et du Tourisme, MNP, and the University of Antananarivo. Tolona Andrianasolo kindlymanaged administrative affairs. Kasola Charles (Edson), Fisy Luis, and Kateffona Florent (Antsara) providedimportant help in the field. For their excellent support we acknowledge Sabine Baumann, Yvonne Bohr, JuttaHammer, Matthias Marquart, Jana Jeglinski, Iris Kiefer, Susanne Kobbe, and the staff of the campAndranovao. Andreas Hapke provided very helpful suggestions on the genetic analyses. We thank JoannaSetchell and the reviewers for their work and very helpful comments. The study was financed by the DeutscheForschungsgemeinschaft (Ga 342/15), the Volkswagen Foundation, and WWF Germany.
References
Anderson, M. J. (2004). DISTML v.5: A FORTRAN computer program to calculate a distance-basedmultivariate analysis for a linear model. Department of Statistics, University of Auckland.
Andriatsimietry, R., Goodman, S. M., Razafimahatratra, E., Jeglinski, J. W. E., Marquard, M., & Ganzhorn, J.U. (2009). Seasonal variation in the diet of Galidictis grandidieri Wozencraft, 1986 (Carnivora:Eupleridae) in a sub-arid zone of extreme southwestern Madagascar. Journal of Zoology, 279, 410–415.
Arrigo, N., Tuszynski, J. W., Ehrich, D., Gerdes, T., & Alvarez, N. (2009). Evaluating the impact of scoringparameters on the structure of intra-specific genetic variation using RawGeno, an R package forautomating AFLP scoring. BMC Bioinformatics, 10, 33.
Bandelt, H.-J., Forster, P., & Röhl, A. (1999). Median-joining networks for inferring intraspecific phylogenies.Molecular Biology and Evolution, 16, 37–48.
Bohr, Y. E. M. B., Giertz, P., Ratovonamana, Y. R., & Ganzhorn, J. U. (2011). Gray-brown mouse lemurs(Microcebus griseorufus) as an example of distributional constraints through increasing desertification.International Journal of Primatology, 32, 901–913.
Brown, J. L., Cameron, A., Yoder, A. D., & Vences, M. (2014). A necessarily complex model to explain thebiogeography of the amphibians and reptiles of Madagascar. Nature Communications, 5, Article 5046.
Buntjer, J. B. (2001). PhylTools version 1.32. Laboratory of plant breeding. Wageningen: WageningenUniversity and Research Centre.
Chaveerach, A., Tanee, T., Sattayasai, N., Tanomtong, A., Suareze, S. A., & Nuchadomrong, S. (2007).Genetic relationships of langur species using AFLP markers. Pakistan Journal of Biological Sciences, 10,1445–1451.
Dammhahn, M., & Kappeler, P. M. (2005). Social system ofMicrocebus berthae, the world's smallest primate.International Journal of Primatology, 26, 407–435.
Dewar, R. E., & Richard, A. F. (2007). Evolution in the hypervariable environment of Madagascar.Proceedings of the National Academy of Sciences of the United States of America, 104, 13723–13727.
836 B. M. Scheel et al.

Eberle, M., & Kappeler, P. M. (2002). Mouse lemurs in space and time: a test of the socioecological model.Behavioral Ecology and Sociobiology, 51, 131–139.
Eberle, M., & Kappeler, P. M. (2004). Selected polyandry: female choice and inter-sexual conflict in a smallnocturnal solitary species (Microcebus murinus). Behavioral Ecology and Sociobiology, 57, 91–100.
Edgar, R. C. (2004). MUSCLE: a multiple sequence alignment method with reduced time and spacecomplexity. BMC Bioinformatics, 5, 113.
Excoffier, L., Smouse, P. E., & Quattro, J. M. (1992). Analysis of molecular variance inferred from metricdistances among DNA haplotypes: application to human mitochondrial DNA restriction data. Genetics,131, 479–491.
Falush, D., Stephens, M., & Pritchard, J. K. (2007). Inference of population structure using multilocusgenotype data: dominant markers and null alleles. Molecular Ecology Notes, 7, 574–578.
Fischer, M. C., Foll, M., Excoffier, L., & Heckel, G. (2011). Enhanced AFLP genome scans detect localadaptation in high-altitude populations of a small rodent (Microtus arvalis). Molecular Ecology, 20,1450–1462.
Fredsted, T., Pertoldi, C., Olesen, J. M., Eberle, M., & Kappeler, P. M. (2004). Microgeographic heterogeneityin spatial distribution and mtDNA variability of gray mouse lemurs (Microcebus murinus, Primates:Cheirogaleidae). Behavioral Ecology and Sociobiology, 56, 393–403.
Génin, F. (2008). Life in unpredictable environments: first investigation of the natural history of Microcebusgriseorufus. International Journal of Primatology, 29, 303–321.
Gligor, M., Ganzhorn, J. U., Rakotondravony, D., Ramilijaona, O. R., Razafimahatratra, E., Zischler, H., &Hapke, A. (2009). Hybridization between mouse lemurs in an ecological transition zone in southernMadagascar. Molecular Ecology, 18, 520–533.
Goodman, S. M., & Ganzhorn, J. U. (2004). Biogeography of lemurs in the humid forests of Madagascar: therole of elevational distribution and rivers. Journal of Biogeography, 31, 47–55.
Guillot, G., & Rousset, F. (2013). Dismantling the Mantel tests. Methods in Ecology and Evolution, 4, 336–344.
Hapke, A., Gligor, M., Rakotondranary, S. J., Rosenkranz, D., & Zupke, O. (2011). Hybridization of mouselemurs: different patterns under different ecological conditions. BMC Evolutionary Ecology, 11, 297.
Hasegawa, M., Kishino, H., & Yano, T. (1985). Dating the human-ape splitting by a molecular clock ofmitochondrial DNA. Journal of Molecular Evolution, 22, 160–174.
Huelsenbeck, J. P., & Andolfatto, P. (2007). Inference of population structure under a Dirichlet process model.Genetics, 175, 1787–1802.
Huelsenbeck, J. P., Andolfatto, P., & Huelsenbeck, E. T. (2011). Structurama: Bayesian inference of popula-tion structure. Evolutionary Bioinformatics, 7, 55–59.
Legendre, P., & Anderson, M. J. (1999). Distance-based redundancy analysis: testing multispecies responsesin multifactorial ecological experiments. Ecological Monographs, 69, 1–24.
Leigh, J. W., & Bryant, D. (2014). PopART: Full-feature software for population genetics. http://popart.otago.ac.nz.
McArdle, B. H., & Anderson, M. J. (2001). Fitting multivariate models to community data: a comment ondistance-based redundancy analysis. Ecology, 82, 290–297.
Olivieri, G. L., Zimmermann, E., Randrianambinina, B., Rasoloharijaona, S., Rakotondravony, D.,Guschanski, K., & Radespiel, U. (2007). The ever-increasing diversity in mouse lemurs: three newspecies in north and northwestern Madagascar. Molecular Phylogenetics and Evolution, 43, 309–327.
Peakall, R., & Smouse, P. E. (2006). GENALEX 6: genetic analysis in Excel. Population genetic software forteaching and research. Molecular Ecology Notes, 6, 288–295.
Pearson, R. G., & Raxworthy, C. J. (2009). The evolution of local endemism in Madagascar: watershed versusclimatic gradient hypotheses evaluated by null biogeographic models. Evolution, 63, 959–967.
R Core Team. D2013]. R: A language and environment for statistical computing, version 2.15.2. Vienna: RFoundation for Statistical Computing. Available at www.R-project.org.
Radespiel, U., Lutermann, H., Schmelting, B., Bruford, M. W., & Zimmermann, E. (2003). Patterns anddynamics of sex-biased dispersal in a nocturnal primate, the grey mouse lemur, Microcebus murinus.Animal Behaviour, 65, 709–719.
Radespiel, U., Rakotondravony, R., & Chikhi L. (2008). Natural and anthropogenic determinants of geneticstructure in the largest remaining population of the endangered golden-brown mouse lemur, Microcebusravelobensis. American Journal of Primatology 70, 860–870.
Radespiel, U., Sarikaya, Z., Zimmermann, E., & Bruford, M.W. (2001). Sociogenetic structure in a free-livingnocturnal primate population: sex-specific differences in the grey mouse lemur (Microcebus murinus).Behavioral Ecology and Sociobiology, 50, 493–502.
Genetic Differentiation of Mouse Lemurs 837

Rakotondranary, J. S., Ratovonamana, Y. R., & Ganzhorn, J. U. (2010). Distributions et caractéristiques desmicrohabitats de Microcebus griseorufus (Cheirogaleidae) dans le Parc National de Tsimanampetsotsa(Sud-ouest de Madagascar). Malagasy Nature, 4, 55–64.
Rakotondranary, S. J., & Ganzhorn, J. U. (2011). Habitat separation of sympatric Microcebus spp. in the dryspiny forest of south-eastern Madagascar. Folia Primatologica, 82, 212–223.
Rakotondranary, S. J., Struck, U., Knoblauch, C., & Ganzhorn, J. U. (2011). Regional, seasonal andinterspecific variation in 15N and 13C in sympatric mouse lemurs. Naturwissenschaften, 98, 909–917.
Ratovonamana, Y. R., Rajeriarison, C., Edmond, R., & Ganzhorn, J. U. (2011). Phenology of differentvegetation types in Tsimanampetsotsa National Park, south-western Madagascar. Malagasy Nature, 5,14–38.
Raufaste, N., & Rousset, F. (2001). Are partial mantel tests adequate? Evolution, 55, 1703–1705.Rundle, H. D., & Nosil, P. (2005). Ecological speciation. Ecology Letters, 8, 336–352.Schluter, D. (2001). Ecology and the origin of species. Trends in Ecology & Evolution, 7, 372–380.Schluter, D. (2009). Evidence for ecological speciation and its alternative. Science, 323, 737–741.Schwab, D., & Ganzhorn, J. U. (2004). The distribution and population structure of Microcebus berthae, the
smallest known primate and its habitat use in relation to other sympatric cheirogaleids. InternationalJournal of Primatology, 25, 307–330.
Shafer, A. B. A., & Wolf, J. B. W. (2013). Widespread evidence for incipient ecological speciation: a meta-analysis of isolation-by-ecology. Ecology Letters, 16, 940–950.
Sommer, S., Rakotondranary, S. J., & Ganzhorn, J. U. (2014). Maintaining microendemic primate speciesidentity along an environmental gradient – parasites as drivers for species differentiation. Ecology andEvolution, 4, doi: 10.1002/ece3.1311.
Swofford, D. L. (2002). PAUP*: Phylogenetic analysis using parsimony and other methods, version 4.0b10.Sunderland: Sinauer Associates.
Tamura, K., Stecher, G., Peterson, D., Filipski, A., & Kumar, S. (2013). MEGA6: molecular evolutionarygenetics analysis version 6.0. Molecular Biology and Evolution, 30, 2725–2729.
Thibert-Plante, X., & Hendry, A. P. (2010). When can ecological speciation be detected with neutral loci?Molecular Ecology, 19, 2301–2314.
Vences, M., Wollenberg, K. C., Vieites, D. R., & Lees, D. C. (2009). Madagascar as a model region of speciesdiversification. Trends in Ecology & Evolution, 24, 456–465.
Wilmé, L., Goodman, S. M., & Ganzhorn, J. U. (2006). Biogeographic evolution of Madagascar’smicroendemic biota. Science, 312, 1063–1065.
Wimmer, B., Tautz, D., & Kappeler, P. M. (2002). The genetic population structure of the gray mouse lemur(Microcebus murinus), a basal primate fromMadagascar. Behavioral Ecology and Sociobiology, 52, 166–175.
Wollenberg, K. C., Vieites, D. R., van der Meijden, A., Glaw, F., Cannatella, D. C., & Vences, M. (2008).Patterns of endemism and species richness in Malagasy cophyline frogs support a key role of mountain-ous areas for speciation. Evolution, 62, 1890–1907.
Wright, P. C. (1999). Lemur traits and Madagascar ecology: coping with an island environment. Yearbook ofPhysical Anthropology, 42, 31–72.
Wright, S. (1943). Isolation by distance. Genetics, 28, 114–138.Yoder, A. D., Burns, M. M., & Génin, F. (2002). Molecular evidence of reproductive isolation in sympatric
sibling species of mouse lemurs. International Journal of Primatology, 23, 1335–1343.
838 B. M. Scheel et al.


