Embed Size (px)
Citation preview

TEXTURE AND COLOUR CHANGES IN MEAT DURING COOKING RELATED TO THERMAL
DENATURATION OF MUSCLE PROTEINS1
H. MARTENS, E. STABURSVIK and M. MARTENS Norwegian Food Research Institute
N - 1432 Aas- NLH, Norway (Manuscript received Jan. 4, 1982; in linal form May 1 , 1982)
ABSTRACT
Differential scanning calorimetry was used to select temperatures that diferentiated between thermal denaturation of the three major structural protein species in bovine muscle: myosin, collagen and actin.
Samples of m. semimembranosus, m. semitendinosus and m. psoas major were heated to those different temperatures and evaluated sensorially. Three groups of sensory properties were needed to describe the main texture changes observed in the meat:
1. Firmness 2. Fiber cohesivity, bite-off force, residual bolus 3. Juiciness Firmness increased with thermal denaturation of the myofibrillar pro-
teins (myosin; 40-60’C and actin; 66-73OC). Fiber cohesivity etc. decreased with collagen denaturation (56-62’C). Reduction in juiciness was pri- marily associated with actin denaturation, while cooking loss increased over the whole temperature range.
The property “total chewing work”, a composite of the first two texture groups mentioned, yielded like the judges’ “total texture preference”, opti- mal texture in the 60-67’C temperature region, implying denatured myosin and collagen but native actin. This meat was light pink-gray in colour, while the cooking juice released was dark red.
INTRODUCTION
In order to optimize a food process with respect to sensory quality, it is important to understand the main physical factors that influence the quality of the products. To the consumer the toughness is probably
’ In part presented at the 5th In t . Congress of‘ Food Science and Technology, Kyoto, ,Japan Sept. 1978
Journal of Texture Studies 13 (1982) 291-309. All Rights Reserved. @ Cop.vright 1982 by Food & Nutrition Press, lnc.. M‘esYport, Connecticut. 29 1

292 H. MARTENS, E. STABURSVIK and M. MARTENS
the most critical quality factor of the meat. In cooking of meat the time/ temperature program has strong influence on the final toughness as well as other quality factors such as juiciness, colour and taste. In the present paper we examine the effect of cooking terpperature and time on the eating quality of bovine muscles and relate these to thermal denaturation of protein molecules.
Meat Toughness
Adult mammalian muscles consist mainly of water (75%) and pro- teins (19%). Bovine meat toughness is a complex property which de- pends mainly on the two protein systems which give the muscle its mechanical strength, namely the connective tissue (giving tensile strength) and the myofibrils (giving contractile strength), (Lawrie 1979). The connective tissue consists mainly of the protein collagen ( ~ 5 % of total protein weight, depending on muscle type), which in slightly different forms exists in the muscle in strong, dense structures ranging from microscopic endomysium sheets surrounding individual muscle fibers to massive tendons.
The myofibrils (60% of total protein weight, Lawrie 1979) consist of complex patterns of several protein species, with myosin and actin as the predominating ones (about 60% and 20% of the myofibril protein weight, respectively). The myofibrils form the highly orga- nized patterns of the contractile muscle fibers. Each of these two protein systems give toughness contributions that respond to a num- ber of different physical factors.
The connective tissue toughness in a cooked meat sample depends, among other things on: (1) the amount of collagen in the sample (depending mainly on animal type and muscle type), (2) how easily the collagen is softened by cooking the meat sample, (this varies, e.g. with the age of the animal), and (3) on how the meat sample was cooked, in terms of time and temperatures.
The myofibrillar toughness, on the other hand, depends, among other things, on: (1 ) the degree of stretchinglshortening in the fibrils caused by the rigor mortis contraction of the carcass muscle (deter- mined mainly by the carcass temperature at the time of rigor mortis), (2 ) the pH of thepost rigor muscle (normally around 5.4, but in some cases up in the range 6-7) , and (3) how the meat sample was cooked, in terms of time and temperatures.
The third major protein system in meat is constituted by the sar- coplasmic proteins (29% of total protein weight, Lawrie 1979), a mixture of several water soluble protein types, e.g. the major coloured component in muscles, myoglobin, which represents about 1% of the total protein weight.

TEXTURE CHANGE IN MEAT 293
Protein Denaturation A large amount of experimental data has already been published
relating heat denaturation of muscle proteins to texture changes in heat-treated meat (Hamm 1977). But some uncertainty and confusion still appear to exist with regard to the denaturation temperatures of the different important proteins, as well as to their texture roles.
A protein molecule in its natural state usually consists of a chain of amino acids folded together in a “native” structure, which is partic- ular to that protein type. The native molecules may exist in solution (e.g. sarcoplasmic proteins in meat) or as natural aggregates (e.g. in collagen fibers or myofibrils). The native structure of a protein mol- ecule is held together by internal molecular forces that in most cases are weakened as the temperature increases, leading to “thermal den- aturation” above certain temperatures: The amino acid chain is more or less unfoled, whereby parts of the interior of the previously native molecule is exposed a t the molecular surface, changing the molecule’s affinity to other molecules.
If this affinity increases, the degree of aggregation between pro- tein molecules will increase, sometimes forming precipitating particles of continuous, tough water-binding gels, as in eggwhite (Hegg et al. 1979). If the affinity decreases, a solubilazation of the native aggre- gate may follow instead. The two processes, thermal denaturation and change in degree of aggregation, may have quite different reaction rates. Depending on whether the native or the denatured aggregates are the mechanically stronger, the denaturation of a protein type in meat may lead to a softening or toughening of the sample.
Previously, many denaturation studies in meat were based on in- direct methods, e.g. protein solubility studies, which do not distinguish between protein denaturation and protein aggregation. Differential Scanning Calorimetry (DSC) offers a direct method for studying how the different main proteins in meat denature with increasing tem- perature (Martens and Vold 1976; Wright et al. 1977; Stabursvik and Martens 1979; 1980).
Texture Changes
Instrumental testing like Warner-Bratzler shear press (Bouton et al. 1981; Moller et al. 1981) and sensory evaluation (Harries 1972; Larmond 1976; Howard 1976) are the most common methods for studying the texture in meat.
During cooking of normal bovine meat (no cold-shortening, normal pH) the toughness is known to change in a t least three successive steps (Davey and Gilbert 1974). Heating meat to around 5OoC yields an increased toughness, which in general is ascribed to myofibrillar

294 H. MARTENS, E. STABURSVIK and M. MARTENS
denaturation (Bouton and Harris 1972). Between 50 and 6OoC the toughness then decreases. This improved tenderness is usually inter- preted in terms of collagen denaturation (Bouton and Harris 1981; Moller et al. 198l) , although the effect of increased protolytic activity in the muscle has also been postulated (Davey and Niederer 1977). Further increases above 6OoC leads to increased toughness again. This texture change has tentatively been related to several different physical factors, such as increased cooking losses, protein coagulation, collagen shrinkage etc. (Bouton et al. 1981). In the meat texture lit- erature it has not been shown conclusively what type of protein causes the coagulation, or why the cooking loss increases in this temperature range. How can myofibril protein denaturation contribute to texture changes both below 5OoC and above 6OoC but not in between?
DSC studies of meat show that myosin denatures in a t least two steps, one in the 4O-5O0C range and one in the 50-60°C range, prob- ably representing light meromyosin and heavy meromyosin, respec- tively (Stabursvik and Martens 1980). Since some uncertainty exists, “light meromyosin” and “heavy meromyosin” are enclosed in quota- tion marks below. In the latter range also collagen denatures (Martens and Vold 1976), while actin in meat denatures a t higher temperatures (Martens and Vold 1976; Wright et a2. 1977).
The similarity in temperature response, between the protein dena- turations on one hand and the texture changes in meat on the other point to a casual relationship between the two. While not presenting rigorous proofs of this relationship, the present paper seeks to give a simple molecular explanation of the main texture changes in normal bovine meat during cooking. Colour changes are also included, since they can also be related to protein denaturation by DSC analysis.
EXPERIMENTAL
DSC Denaturation Studies DSC studies were performed in a Perkin Elmer DSC-2, fitted with
an Intracooler-I1 unit. Each meat sample was analyzed in two or three replicates of 12-15 mg wet weight each, in standard aluminium sealed sample holders, at a heating rate of 10°C/min and 0.5 mcal/s sensi- tivity as described by Stabursvik and Martens (1980). Time/tem- perature relationships for the thermal denaturation of the major proteins were established by studying the remaining DSC signals from samples of meat which had been heated to various temperatures.
For actin denaturation a detailed kinetic study was performed. Meat samples in sealed DSC sample pans were kept immersed in water

TEXTURE CHANGE I N MEAT 295
bath for different times a t 7 different temperatures (60,63, 65,66, 67, 68 and 69OC) prior to DSC analysis. After puncturing the sample pans and drying them a t 105OC overnight, the protein weight in each sample was determined by weighing. The experiment was performed on m. semimembranosus with normal post rigor pH (5.4) and ab- normally high pH (6.2), in order to study possible pH effects on the thermostability of actin in muscle. The area of the remaining DSC peak was determined by cutting and weighing after manually drawing a smooth DSC baseline under the peak. The relative remaining area was fitted to a first order exponential decay curve a t each temperature for each muscle pH. The rate constants were fitted to the Arrhenius equation of temperature dependency.
Sample Treatment For Sensory Analysis
Three different muscle types were tested. In the first experiment slices of beef (post rigor bovine m. semimembranosus from 6 different 1 '/z year old bulls, slaughtered and stored so as to avoid cold short- ening and ageing effects), cut in the frozen state to 1 cm thickness, were vacuum packed and stored a t - 2OoC for 2-6 weeks. The samples were thawed a t 4OC and then heated in plastic bags at 1.2OClrnin to 7 different maximum temperatures (45, 53, 63, 67, 73, 79, or 85OC) and held a t these maximum temperatures for 2 different holding times (5 or 20 min) before rapid cooling to a room temperature by im- mersion in tap water. Cooking loss was measured volumetrically (m1/100 g raw muscle). The degree of protein denaturation in the samples was verified by DSC. The pH of each muscle was measured.
In subsequent experiments on m. psoas major and m. semitendin- osus from 8 different 1 Yz year old bulls (no cold shortening or ageing) the slices were similarly treated, but slightly different maximum temperatures were chosen (37 raw), 48, 54, 58, 60, 63, 65, 67, 69, 73, and 79OC). A 10 min holding time a t the maximum temperature was used. The results from these latter experiments will only be briefly mentioned, since they are similar to the ones obtained on n. semimem branosus.
Sensory Evaluation
The sensory evaluation of the heat treated meat samples was per- formed in blue light by a trained laboratory panel of 10 persons. The temperature of the meat samples was 2OOC. Each judge received two strips of each sample, cut parallel to the muscle fibers (approx. 1 X 1 X 5 cm.). Each temperature/time combination was judged in three

296 H. MARTENS, E. STABURSVIK and M. MARTENS
replicates for m. semi-membranosus and in two replicates for m. psoas major and m. semitendinosus. The following 11 colour and texture properties were evaluated on 9-point scales:
Colour-lightness of a freshly cut surface (1 = very light, 9 = very dark). Fiber cohesivity-the force required to separate the muscle fibers with the fingers (1 = very easy, 9 = very difficult). Firmness-the force necessary to compress the meat strip about 30% with the molar teeth (1 = very low, 9 = very high). Bite-off force-the force necessary to bite off the meat strip by the front teeth perpendicularly to the fiber direction (1 = very low, 9 = very high). Juiciness 1-juiciness perceived in first bite (1 = very dry, 9 = very juicy ) . Juiciness 2-juiciness perceived during chewing (1 = very dry, 9 = very juicy). Total chewing work-the work necessary for chewing the meat strip ready for swallowing (1 = very little, 9 = very much). Heterogeneity-perceived heterogeneity of the meat strip during chewing (1 = not heterogenous, 9 = very heterogenous). Residual bolus-the volume of unchewable residue to be swallowed (1 = very little, 9 = very much). Total impression of texture-texture preference (1 = very bad, 9 = very good). Total impression of flavour-flavour preference (1 = very bad, 9 = very good).
Two reference samples, heat treated a t 45OC and 85OC for 5 min, were served for each session. For each of the three muscle types the scores of these two references on the 9-point scales for each property were agreed upon within the panel after two initial evaluation ses- sions. These reference scores were printed on the evaluation sheets for that muscle type. The order of the cooking regimes (temperature, holding time) to be assessed was randomized within each of the rep- licates, which were separated in time. For each session slices from the 2 muscles of only one given animal were chosen; the same animal was used, both for references and for samples to be assessed in order to reduce the effects of animal differences. Six samples were served in each session, and the orders of preparation and serving with respect to the judges, were randomized. The judges were not informed about the purpose of the experiment, and did not discover this during the ex- periment, probably due to the blue light. The colour of the released cooking juice from the samples was assessed by a simple sensory

TEXTURE CHANGE IN MEAT 297
evaluation ( 1 = very light, 9 = very dark) in day light in the labo- ratory.
RESULTS AND DISCUSSION
DSC Denaturation Studies
Figure 1 illustrates the use of DSC to assess the effects of various cooking procedures on the proteins in the bovine post rigor m. semimembranosus muscle. For better visualization representative thermograms were selected and redrawn with manual smoothing and baseline subtraction. (For more detail on the DSC technique, see Stabursvik and Martens 1980).
Figure 1 gives the “thermograms” of muscle tissue (a) , connective tissue ( f ) , and drip juice (g) without any heat treatment in advance. Stabursvik and Martens (1980) concluded that, a t normal pH (5.4), the first peak ( I ) of the muscle tissue thermogram (a) corresponds to myosin (“light mero-myosin”, LMM), the third peak (111) mainly to actin, while the second peak (11) reflects denaturation signals from both myosin (“heavy mero-myosin”, HMM), collagen ( f ) and sarco- plasmic proteins (g). The heme proteins myoglobin and hemoglobin, which give meat its red colour, are not present in high enough con- centrations to be detected by DSC in the drip juice (g). Separate studies of isolated hemoglobin and myoglobin preparations show that they are quite thermostable, denaturing in the 65-80°C range, de- pending on oxygenation level etc. Thermograms ( j ) of myoglobin (from whale muscle, 0.8% solution in H 2 0 , Hagerdahl and Martens 1976) and of hemoglobin (k) (pig blood sediment after natural clot- ting) illustrate this thermostability.
Denaturation Kinetics Thermograms b-e, h and i represent partially heat treated meat
samples. Due to the thermal lag in DSC samples scanned a t 10°C/min, and due to the fact that thermal denaturation of muscle protein in meat is irreversible, a protein in meat may be denatured a t temperatures well below its DSC peak. This is illustrated in Fig. 1 for actin, where the DSC peak starts above 7OoC with a maximum above 8OoC (a), while significant denaturation has taken place after heating to as low as 67OC for 5 min (c) with about 50% denaturation after 20 min (d).
Thus it is difficult to read accurate denaturation temperature data directly from the thermogram of a raw meat sample. But for a sample

298 H. MARTENS, E. STABURSVIK and M. MARTENS
40 60 80 100 SCANNING TEMP. O C
FIG. 1. DIFFERENTIAL SCANNING CALORIMETRY (DSC) THERMO- GRAMS OF POST RIGOR BOVINE M. SEMIMEMBRANOSUS MUSCLE PROTEINS AFTER DIFFERENT HEAT TREATMENTS: ENDOTHERMAL HEAT DENATURATION SIGNAL VERSUS SCANNING TEMPERATURE;
SCANNING RATE: 10°C/MIN Upper part: Muscle tissue: without heat pre-treatment (a ) and after heating to 53OC for 5 min (b), 67OC for 5 min (c), 67OC for 20 min (d) and 73OC for 5 min (e). Thermogram with broken lines ( f ) represents manually dissected connective tissue. Lower part: Water soluble sarcoplasmic proteins in thaw drip juice; without heat pretreatment (g), after heating to 53OC (h), and 63OC ( i ) for 5 min. Approximate denaturation temperatures of the red heme-proteins myoglobin ( j ) and hemoglobin
( k ) are indicated with broken lines.
Thermograms a-e have been scaled to the same sample dry weight (3 nig, corre- sponding to about 15 mg.wet weight). As scaled, thermogram f represents a 0.8 mg (dry weight) samples of connective tissue, and g-k represent 15 p1 liquid; due to the low concentration, the myoglobin thermogram (j) was amplified 5 times yompared to the other ones. The thermograms are smoothed and the baselines are simplified, for illustration.
that has been heat treated prior to the DSC analysis, the area under its DSC peak is proportional to the amount of remaining native protein in the sample after the first heat treatment.
In the isothermal denaturation kinetics study for actin, the relative amount of remaining native actin appeared to decrease approximately as first order reaction with holding time. The obtained rate constants for both pH 5.4 and 6.2 fitted well (r>0.99) to the Arrhenius rate equation, yielding estimated activation energies of 83.7 kcal and 91.1

TEXTURE CHANGE IN MEAT 299
kcal, and In (constant term) of 120.0 and 142.7, respectively. In Fig. 2 the estimated times required to reach lo%, 50% and 90% denaturation are plotted against temperature. The means of meat with normal (5.4) and abnormal (6.2) pH were used to estimate the curves. An approx- imate doubling of the denaturation rate with every 2OC temperature increase can be observed, with 50% denaturation after about 20 min at 67OC. On the basis of those results and results from DSC studies of larger preheated meat samples, the maximum temperatures for the sensory evaluations were selected. The temperatures selected for the m. semimembranosus experiment are described in Table 1.
Table 1. Thermal denaturation of various protein constituents in bovine rn. sernirnernbranasus rnuscle after 5 rnin holding time a t the 7 end temperatures se- lected. The results are given as percent of DSC peak area remaining after heat treatment. Important changes are underlined I.
End Temperatures O C 45 53 63 67 73 79 85
STRUCTURAL PROTEINS: Myosin (LMM) 80 20 0 0 0 0 0 Myosin (HMM) 100 100 0 0 0 0 0 Collagen 100 100 0 0 0 0 0 Actin 100 100 100 80 10 0 0 SOLlJBLE PROTEINS: Sarcoplasma proteins 100 90 30 10 1 0 0 Heme-proteins (niyo- 100 100 100 100 70 10 0 globin, hemoglobin)
' Partial denaturation fractions are approximate LMM = Light iiieroinyosin. HMM = Heavy Meroinyosin
Sensory Evaluation
pH measurements of the m. semimembranosus muscles used for sensory evaluation showed that two animals used in the last of the 3 replicates had abnormally high pH (>6.2), yielding so-called Dark, Firm and Dry (DFD) meat. The sensory results from these samples were quite abnormal. The texture effect of muscle pH will be discussed in a forthcoming publication (Stabursvik manuscript in preparation). The following results are the mean values of only the samples with normal post rigor pH (5.4-5.8), i.e. the mean of 2 or 3 replicates.
Texture. Figures 3-6 show some of the sensory texture properties of m. semimembrnnosus in the temperature range studied. The figures give the mean of the results found for the two holding times, since these were similar in most cases. The few significant time effects ob- served will be discussed below.

300 H. MARTENS, E. STABURSVIK and M. MARTENS
C .- 180
w' s c 150
120
90
60
30
64 66 68 70 72 TEMP, O C
FIG. 2. DENATURATION RATE OF ACTIN GIVEN AS THE NUMBER OF MINUTES NECESSARY TO REACH lo%, 50% AND 90% DENATURATION,
SHOWN AS A FUNCTION OF HOLDING TEMPERATURE For the 50% curve the individual results are given for m. semimembranosus of normal post rigor pH (5.4, triangles) and of abnormally high pH (>6.2, circles). The curves
represent the means of the two pH levels.
Table 2. Texture changes in bovine muscle during cooking, interpreted in terms of thermal denaturation of the three maior muscle Droteins'
Molecular Process; Myosin Collagen Actin
Denaturation Denaturation Denaturation
Firmness ++ ( - ) +++ Fiber cohesivity --- Bite-off force + Residual bolus -- Juiciness (--) Total chewing work ++ Total texture impression ++
+ + ++
---
- --- ---
-- Denaturation temperature 40-54 LMM 56-62 66-73
'Sensory score increases and decreases, with increasing temperature are represented by + and -, respectively. Number of signs represent relative size of respective texture changes. Dena- turation temperature rangev determined from DSC analysis, represent <lo% and >906 den- aturation after 5 min heating. Temperatures are given to approximately * 2OC
53-60 HMM

TEXTURE CHANGE IN MEAT 30 1
The results from the subsequent experiment on m. semitendinosus and m. psoas major were in most respects similar to those of m. semimembranosus, In Fig. 7 only the firmness, fiber cohesivity and total chewing work for the m. psoas major experiment are given.
The interpretation of the results in Fig. 3-7 is summarized in Table 2.
I I I I 1
I I I I I
50 60 70 80 90 TEMP, “C
FIG. 3. SENSORICALLY MEASIJRED FIRMNESS O F BOVINE M . SEMIMEMBRANOSIJS AS A FIJNC‘I’ION OF HEAT T R E A T M E N T
‘I’EM PERA‘I’I IRE Mean 0 1 2 holding times ;ind 2-3 replic;ites are given; i~ver;ige error ol‘tlie metin.
s = 0.21. -
Firmness. The firmness (solid circles, Fig. 3 and 7 ) increased dras- tically in the temperature region below 53OC and between 6 3 and 73 OC. Both those temperature ranges correspond to niyofibrillar protein denaturation: Below 53OC the most heat labile part of the large myosin molecule (“light meromyosin”), denatures (Fig. 1 ) and between 63 and 73OC actin denatures (Fig. 1 . 2). In m. sernirnern- hrctnosus samples the firrnness (Fig. 3 ) did not change in the 53-63OC region, where collagen and the rest of the niyosin molecule (“heavy meromyosin”) denatures. In the two other muscles (Fig. 7 ) it de- creased somewhat in this region.
Firmness appears to be the most direct sensory measure of the tnyofibrillar protein denaturations, although it can be somewhat in-

302 H. MARTENS, E. STABURSVIK and M. MARTENS
fluenced by the collagen denaturation. In molecular terms, thermal denaturation of myofibrillar proteins apparently leads to increased protein-protein aggregation, resulting in increased firmness. Dena- turation of “light meromyosin” and actin appears to be more impor- tant than denaturation of “heavy meromyosin” for the firmness in- crease in these samples. It may be that the former two denaturations lead to the formation of aggregation bonds in weak parts of the myofibril, while denaturation of the latter occurs in already density aggregated parts of the myofibril.
’I 2
I L I I 1 I I 1
50 60 70 ao 90 TEMP, OC
FIG. 4. FIBER COHESIVITY, RESILIENCE AND RESlDlJAL BOLIJS OF M . SEMZMEMBRANOSUS AS FUNCTIONS OF HEAT PRETREATMENT
TEMPERATURES Fiber cohesivity (0)X = 0.24 Bite-off force (o)T = 0.20. Residual bolus ( A ) -
s = 0.28
Fiber Cohesivity etc. Fiber cohesivity remained more or less con- stant during the denaturation of “light meromyosin” and actin, but fell drastically in the 53-63OC range. We were unable to find heat treatment conditions that selectively differentiated between the denaturation of “heavy meromyosin” and collagen, but considering that the meat fibers are surrounded by collagen sheets, i t is natural to ascribe this decrease in fiber cohesivity to collagen denaturation.

TEXTURE CHANGE IN MEAT 303
> u 7 - E 5 6 - v)
5 -
4 -
3 -
2 -
1 L
i -I
v)
45 s 40 2
Y
35 g 30 ' 25
20
15
10
5
50 60 70 a0 90 TEMP, OC
FIG. 5. J lJICINESS AND COOKING LOSS OF M . SEMIMEMBRANOSUS AS FIJNCTIONS OF HEAT PRETREATMENT TEMPERATURE
Juiciness ( 0 , mean of juiciness in first bite and juiciness during chewing; left scale;
scale; S = 1.01 ). S = 0.16). Cooking loss (0, = nil liquid expressed from 100 g meat sample, right
Similar texture improvements were observed in the same temper- ature region for other sensory variables, particularly residual bolus and bite-off force (Fig. 3) , and perceived heterogeneity (not shown because it was very similar to residual bolus). But these other varia- bles also varied somewhat in other temperature ranges, particularly in the actin denaturation range.
Thus fiber cohesivity appears to be the most direct sensory measure of collagen denaturation. In molecular terms, thermal denaturation of the highly aggregated native collagen seems to reduce the toughness of the collagen fibers in the meat.
Juiciness. As the juiciness assessed in the first bite (juiciness 1) and during chewing (juiciness 2) were similar to each other, only their mean is given in Fig. 5 . Juiciness fell slightly from 45 to 63OC in the m. semimembranosus, drastically between 63 and 73 "C and again slightly between 73 and 79OC. Correspondingly, the cooking loss in- creased (Fig. 5 ) , although more uniformly with temperature. The two other muscles showed similar juiciness variations. With the inclusion
304 H. MARTENS, E. STABURSVIK and M. MARTENS
> - k J 9 - a
8 - > [r
2 2 7 -
: 6 -
5 -
4 -
3 -
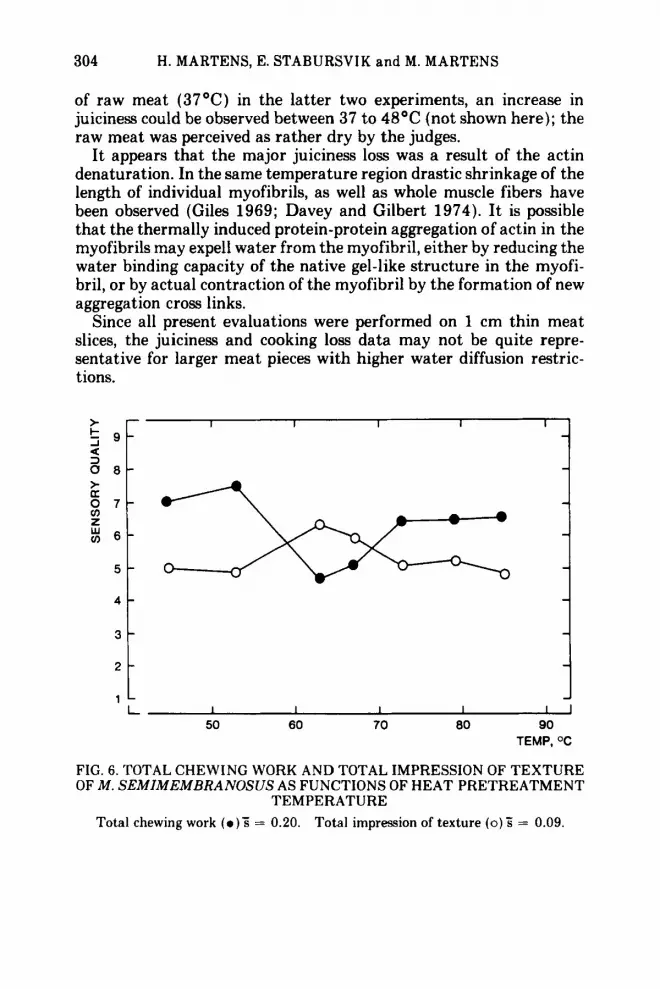
of raw meat (37OC) in the latter two experiments, an increase in juiciness could be observed between 37 to 48OC (not shown here); the raw meat was perceived as rather dry by the judges.
I t appears that the major juiciness loss was a result of the actin denaturation. In the same temperature region drastic shrinkage of the length of individual myofibrils, as well as whole muscle fibers have been observed (Giles 1969; Davey and Gilbert 1974). It is possible that the thermally induced protein-protein aggregation of actin in the myofibrils may expel1 water from the myofibril, either by reducing the water binding capacity of the native gel-like structure in the myofi- bril, or by actual contraction of the myofibril by the formation of new aggregation cross links.
Since all present evaluations were performed on 1 cm thin meat slices, the juiciness and cooking loss data may not be quite repre- sentative for larger meat pieces with higher water diffusion restric- tions.
2 t 1 L I I I I I J
TEMP, OC 50 60 70 80 90
FIG. 6. TOTAL CHEWING WORK AND TOTAL IMPRESSION OF TEXTURE OF M . SEMIMEMBRANOSUS AS FUNCTIONS OF HEAT PRETREATMENT
TEMPERATURE Total chewing work ( 0 ) ; = 0.20. Total impression of texture ( 0 ) 5 = 0.09.

TEXTURE CHANGE IN MEAT 305
a 0 s 7 . W v)
6 -
5 .
4 '
3 '
2 '
Over-all texture. The total chewing work (Fig. 6 and 7), apparently summing up the myofibrillar and the collagen contributions to toughness, shows a clear minimum for meat heated to temperatures in the 60-63OC range, i.e. meat containing denatured myosin and col- lagen, but still native actin. The total subjective texture impression (Fig. 6 ) yielded a clear maximum for the same condition. Lower cooking temperatures yielded soft but chewy meat with tough con- nective tissue. Higher temperatures yielded a harder and dryer meat, probably because of actin denaturation, even though i t had a softened connective tissue.
1 L J L ' I 1 I I I J
TEMP, O C 40 50 60 70 00 90
FIG. 7. SOME TEXTURE VARIABLES OF M. PSOAS MAJOR AS FUNCTIONS OF HEAT PRETREATMENT TEMPERATURE, AFTER 10 MIN HOLDING
TIME Firmness ( 0 ) S = 0.30. Total chewing work (0)s =
0.40. Fiber cohesivity ( A ) S = 0.24.
Temperatures between 73OC and 85OC yielded little texture changes within 20 min cooking time, (except for some juiciness loss) presumably because all texture relevant proteins were denatured al-

306 H. MARTENS, E. STABURSVIK and M. MARTENS
ready a t 73OC. The slow, ongoing solubilization of collagen (conver- sion to gelatin) a t these temperatures (Lawrie 1979) does not appear to have any significant texture effects when measured at 2OoC, where the gelatin solidifies.
The texture differences between 5 and 20 min holding time were insignificant with two exceptions: juiciness generally decreased and cooking loss generally increased with holding time for all the tem- peratures, probably due to water diffusion out of the sample. At 67OC, firmness, bite-off force and total chewing work increased and total texture impression decreased significantly from 5 to 20 min. This is probably due to the ongoing actin denaturation at this temperature; Figure 2 shows a half-life of about 20 min at 67OC as opposed to 110 min a t 63OC and 10 min a t 69OC.
Bouton et aZ. (1981 ) studied heat induced texture changes in bovine muscles of various qualities by a Warner-Bratzler (WB) shear device. For muscle of similar quality as the three muscles used here (unaged, no cold shortening, young animals) their results for the initial WB yield force appear similar to our sensory firmness scores. Their peak shear force, likewise, appears similar to our total chewing work scores.
They found cold-shortened meat responded quite differently to heating, in that the texture improvement occurring in normal muscles between 50 and 6OoC did not take place; instead a drastic increase both in initial yield force and peak shear force could be observed, continuing past 70OC. Assuming the same denaturation temperatures of myosin, collagen and actin in normal and cold-shortened muscles, one may speculate on a possible major toughness contribution from the denaturation the “heavy meromyosin” in cold shortened muscles (as opposed to normal muscles).
Bouton et aZ. (1981) found that aged and unaged meat responded differently to heat treatment, mainly in the sense that the toughening effect here ascribed to actin denaturation was less pronounced in the aged meat. This is not unexpected, since ageing is known to affect the myofibrils, not the connective tissue (Olson et al. 1976).
Bouton et al. (1981) also found that the age of the animal influ- enced the texture effects here ascribed to collagen denaturation; m. semimembranosus muscles from veal showed the characteristic tex- ture improvement in the range 55-60°C, while the corresponding temperature range in old cows was about 60-65OC. In our DSC studies we have not been able to see any major denaturation temperature difference between collagen from young and old cows (Martens and Vold 1976). The results of Bouton et al. may indicate that the in- creased cross-linking in the collagen of old cows slows down the rate of collagen solubilization after the thermal denaturation of the collagen.

TEXTURE CHANGE I N MEAT 307
In addition to the simpie two-factor model of “myofibrillar dena- turation” and “collagen denaturation” other factors may also play a possible role for heat induced texture changes in meat. The texture relevance of denatured sarcoplasmic proteins may be of some signifi- cance; one would expect to see it (Fig. 1) mainly as a firmness increase in the 53-67OC region, where the firmness actually was found to be constant or decrease. Their contribution, like the contribution from “heavy meromyosin” denaturation, may be masked by the larger collagen denaturation effect. Minor, but structurally important myofibrillar protein fractions may likewise be expected to play a possible role for the texture changes. One would expect the proteins in the “2’’-line to lower the firmness when they denature, and minor proteins in the grooves of the helical actin/myosin fibrils to increase the firmness when they denature. Not knowing their thermal stabil- ity, one might primarily expect them to denature in the temperature range most commonly observed for proteins in their natural biological environment (55-7OOC). Their effects cannot be elucidated from the present data. The proteolytic activity of the cathepsins and other tenderizing enzymes may be expected to increase with temperature, as long as they are not themselves denatured, e.g. between 55 and 65OC (Davey and Niederer 1977). However, recent studies by Bouton and Harris (1981) indicate that the role of proteases in improving the meat texture in this temperature range is small compared to that of collagen denaturation.
Thus, it appears that the two phenomena of “myofibrillar dena- turation” and “collagen denaturation” dominate the heat-induced texture changes in bovine muscles of normal quality, by causing ag- gregation changes and loss of water holding capacity.
Colour. Figure 8 shows the temperature dependency of colour light- ness of freshly cut surfaces of the cooked m. semimembranosus meat and of the expressed meat juice. As in the previous figures the mean of the results from the two holding times ( 5 and 20 min) is given. (The meat lightness increased with holding time in the 45-63OC range and decreased with time a t 67 and 73OC. The juice colour became sig- nificantly lighter with time a t 73 and 79OC. Otherwise the two holding times gave similar colour scores).
The results obtained in the corresponding experiments on m. psoas major and m. sernitendinosus were similar to the ones shown in Fig. 8.
The figure indicates that the denaturation of colourless proteins (sarcoplasmic and myofibrillar) in the temperature range 45-67 O C
gives rise to opaque precipitates (Hegg et al. 1979) which apparently give optical masking of the still native red heme proteins hemoglobin

308 H. MARTENS, E. STABURSVIK and M. MARTENS
2 9 - w z 1 - 8 - I P J 7 -
a >
8 6 - z W m 5 -
4 -
3 -
2 -
and myoglobin. At higher temperatures (67-79OC) the interior sur- face of the meat in blue light became somewhat darker again; in day light it actually changed from light pink-gray to darker brown-gray. The reason is probably the thermal denaturation of myoglobin and hemoglobin causing brown precipitates to be formed in the meat. Like texture, the interior colour changes of meat due to heat treatment seem to be caused by various protein denaturation processes.
r I I 1 I I 1
I L J L I I I I I 1
50 60 70 80 90 TEMP, OC
FIG. 8. COLOUR OF MEAT INTERIOR AND COLOUR OF MEAT JlJlCE OF M. SEMIMEMBRA NOSUS AS FUNCTIONS OF HEAT PRETREATMENT
TEMPERATURE Colour of freshly cut surface of meat ( 0 ) : = 0.14. Colour of released juice (o)F =
0.1 5.
CONCLUSIONS
A good temperature correspondence was found between protein denaturation, measured in DSC, and sensory texture and colour changes in meat. We interpreted this as a causal relationship linking molecular transitions to the well known changes from “raw” to “rare”, “medium” and “well done” beef‘.

TEXTURE CHANGE IN MEAT 309
REFERENCES
BOUTON, P.F. and HARRIS, P.V. 1972. The effects of cooking temperature and time on some mechanical properties of meat. J . Food Sci. 37,140-144.
BOUTON, P.F. and HARRIS, P.V. 1981. Changes in the tenderness of meat cooked a t 50-65°C. J. Food Sci. 46, 475-478.
BOUTON, P.F., HARRIS, P.V. and RATCLIFF, D. 1981. Effect of cooking temperature and time on the shear properties of meat. J. Food Sci. 46, 1082-1087.
DAVEY, C.L. and GILBERT, K.V. 1974. Temperature - dependent cooking toughness in beef. J. Sci. Fd. Agric. 25, 931-938.
DAVEY, C.L. and NIEDERER, A.F. 1977. Cooking tenderizing in beef. Meat Sci. 1, 271-275.
GILES, B.G. 1969. Changes in meat produced by cooking. 15th Eur. Meet. Meat Res. Work., Helsinki, pp. 286-292.
HAMM, R. 1977. Change of Muscle Protein during Heating of Meat. In Physical, Chemical and Biological Changes in Food caused by Thermal Processing, (T . Hplyem and 0. Kvile, eds.), pp. 101-134. Applied Sci. Publ., London.
HARRIES, J.M. 1972. Meat Texture. I. Subjective assessment of the texture of cooked beef. J . Texture Studies.3, 101-114.
HEGG, P.O., MARTENS, H. and LOFQVIST, B. 1979. Effects of pH and neutral salts on the formation and quality of thermal aggregates of oval- bumin. A study on thermal aggregation and denaturation. J . Sci. Fd. Agric. 30, 981-993.
HOWARD, A. 1976. Psychometric scaling of sensory texture of meat. J. Texture Studies. 7, 95-107.
HAGERDAHL, B. and MARTENS, H. 1976. Influence of water content on the stability of myoglobin to heat treatment. J . Food Sci. 41, 933-937.
LARMOND, E. 1976. Texture measurement in meat by sensory evaluation. J. Texture Studies. 7, 87-93.
LAWRIE, R.A. 1979. Meat Science. Pergamon Press, Oxford. MARTENS, H. and VOLD, E. 1976. DSC Studies of Muscle Protein Den-
aturation. 22nd..Eur. Meet. Meat Res. Work., Malnio, Sweden, p.Jg.3. MOLLER, A.J., SORENSEN. S.E. and LARSEN, M. 1981. Differentiation
of myofibrillar and connective tissue strength in beef muscles by Warner-Bratzler shear parameters. J. Texture studies 12, 71-83.
OLSON, D.G., PARRISH, F.C. and STROMER, M.H. 1976. Myofibril fragmentation and shear resistance of three bovine muscles during post mortem storage. J. Food Sci. 71. 1036-1041.
STABIJRSVIK, E. and MARTENS, H. 1979. Proteins in white and red muscle compared by differential scanning calorimetry (DSC). 25th Eur. Meet. Meat Res. Work., Budapest, pp. 383-386.
STABIJRSVIK, E. and MARTENS, H. 1980. Thermal denaturation of' proteins in Post Rigor muscle tissue as studied by differential scanning calorimetry. J. Sci. Fd. Agric. 31, 1034- 1042.
WRIGHT, D., LEACH, I.B. and \YILDING, P. 1977. Differential Sciinning Calorimetric Studies of Muscle and Its Constituent Proteins. J. Sci. Fd. Agric. 28. 557-564.