Embed Size (px)
Citation preview
Energy Vol. 17, No. 10, pp. 907-918, 1992 Printed in Great Britain. All rights reserved
0360-5442/92 $5.00 + 0.00 Copyright @I 1992 Pergamon Press Ltd
INTERFUEL AND INTERMODE SUBSTITUTION FOR COOKING
S. POKHAREL, M. CHANDRASHEKAR+ and J. B. ROBINSOP
Systems Design Engineering, University of Waterloo, Waterloo, Ontario, N2L 3G1, Canada
(Received 26 February 1992)
Abstract - The energy-use cost options for a service (cooking) with seven fuels and their different end-use devices under prevalent market conditions are examined with a model developed in Lotus version 3.1. This model has been used for a policy analysis of cooking-energy use in Nepal. The results, which are applicable to most of the developing and least-developed countries, indicate that readjustment of market price and improvement of end-use device efficiency could attract consumers for interfuel and intermode substitution, and renewable energy resources would then become a viable solution for meeting the cooking energy demand.
1. INTRODUCTION
In many Third World countries, population growth has outpaced the growth in energy- supply capability, necessitating judicious alteration in the energy-consumption pattern. Such an alteration requires adoption of policy measures like marginal cost pricing of energy resources, providing subsidies and incentives, and stressing conservation. A large proportion of energy in developing countries (DCs) and least-developed countries (LDCs) is consumed in the household sector. More than half of the energy consumed in household is used for cooking.‘-‘j The economies of DCs and LDCs are characterized differently in rural and urban areas. In rural areas, commercial energy sources are not tradable because traditional energy sources (fuelwood, agricultural residues) are perceived as a bounty of nature and are abundantly used.
Some of the rural areas are becoming economically important because of political and economic decentra.lization and are slowly turning into urban areas where energy resources could be traded. People from other rural areas tend to migrate to urban areas seeking a better quality of life. This practice causes a rapid growth in the urban population and necessitates comprehensive planning to meet urban energy needs.’
’ Author for correspondence. ’ Department of Environmental Resource Studies,
907
908 S. Pofowam. et al
In urban areas, economy, efficiency and personal preference govern the choice of a fuel and end-use device (mode). If consumers are educated as to costs, then they may tend to switch to a more efficient and lower-cost energy option to satisfy their energy needs in the long run; switching requires a time lag because, at a given time, the capital unit owned by the consumer cannot be sold for its economic value. However, other factors than costs also affect energy choices. Personal preferences for different fuels vary because of associated fuel characteristics, like unpleasant odour of kerosene and danger of gas explosion with LPG.’
Cooking service is taken as the focus of this work as it is a major energy-consuming activity in DCs and LDCs and there is considerable scope for reducing this energy by interfuel and intermode substitution. The labour cost for cooking has been excluded because of its low shadow price. This work is expected to help energy planners in understanding consumer behaviour for inter-fuel and intermode substitution for cooking and in managing energy sources.
2. THE MODEL
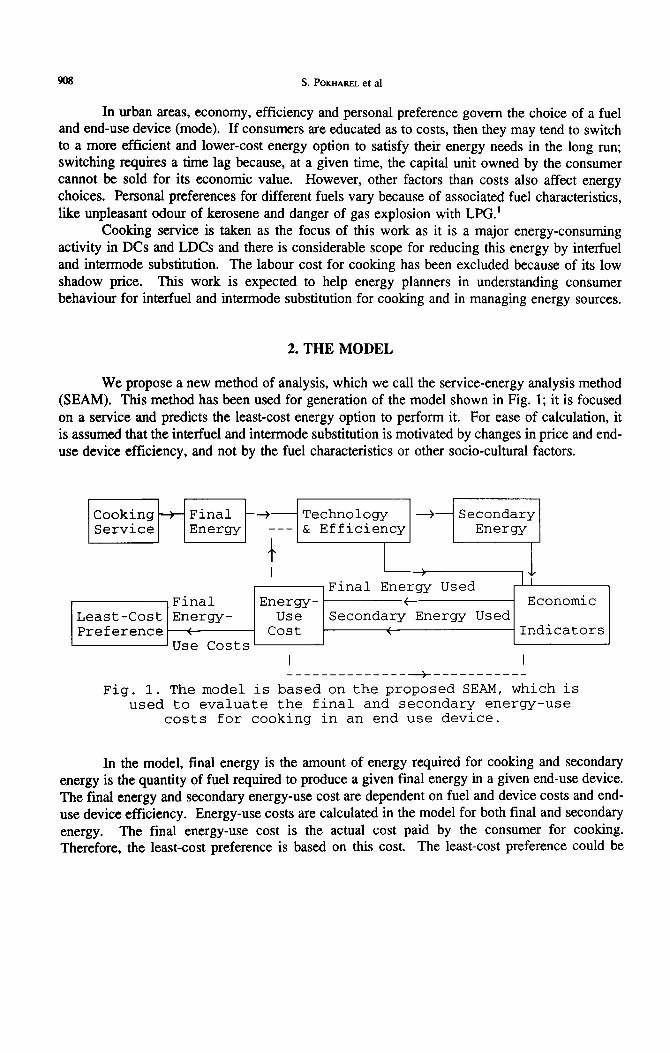
We propose a new method of analysis, which we call the service-energy analysis method (SEAM). This method has been used for generation of the model shown in Fig. 1; it is focused on a service and predicts the least-cost energy option to perform it. For ease of calculation, it is assumed that the interfuel and intermode substitution is motivated by changes in price and end- use device efficiency, and not by the fuel characteristics or other socio-cultural factors.
Cooking Technology 1 +&zzJ IService] IEnergy] i--i& Efficiejcyl 1 Energy11
Fig. 1. The model is based on the proposed SEAM, which is used to evaluate the final and secondary energy-use
costs for cooking in an end use device.
In the model, final energy is the amount of energy required for cooking and secondary energy is the quantity of fuel required to produce a given final energy in a given end-use device. The final energy and secondary energy-use cost are dependent on fuel and device costs and end- use device efficiency. Energy-use costs are calculated in the model for both final and secondary energy. The final energy-use cost is the actual cost paid by the consumer for cooking. Therefore, the least-cost preference is based on this cost. The least-cost preference could be
Interfuel and intennode substitution for cooking 909
altered by changing the prices of fuel and the end-use device, as well as end-use device efficiency. In Fig. 1, the main analysis is indicated by continuous lines while the sensitivity analysis is indicated by discontinuous lines.
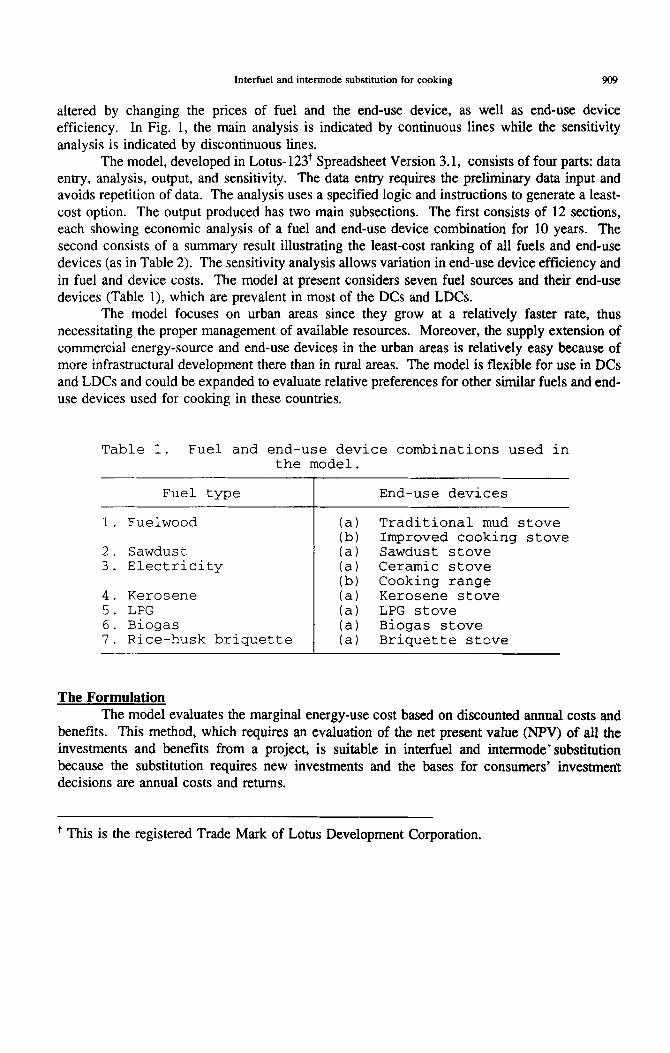
The model, developed in Lotus- 123+ Spreadsheet Version 3.1, consists of four parts: data entry, analysis, output, and sensitivity. The data entry requires the preliminary data input and avoids repetition of data. The analysis uses a specified logic and instructions to generate a least- cost option. The output produced has two main subsections. The first consists of 12 sections, each showing economic analysis of a fuel and end-use device combination for 10 years. The second consists of a summary result illustrating the least-cost ranking of all fuels and end-use devices (as in Table 2). The sensitivity analysis allows variation in end-use device efficiency and in fuel and device costs. The model at present considers seven fuel sources and their end-use devices (Table l), which are prevalent in most of the DCs and LDCs.
The model focuses on urban areas since they grow at a relatively faster rate, thus necessitating the proper management of available resources. Moreover, the supply extension of commercial energy-source and end-use devices in the urban areas is relatively easy because of more infrastructural development there than in rural areas. The model is flexible for use in DCs and LDCs and could be expanded to evaluate relative preferences for other similar fuels and end- use devices used for cooking in these countries.
Table 1. Fuel and end-use device combinations used in the model.
Fuel type End-use devices
1. Fuelwood
2. Sawdust 3. Electricity
4. Kerosene 5. LPG 6. Biogas 7, Rice-husk briquette
(a) (b) (a) (a) (b) (a) (a) (a) (a)
Traditional mud stove Improved cooking stove Sawdust stove Ceramic stove Cooking range Kerosene stove LPG stove Biogas stove Briquette stove
The Formulation The model evaluates the marginal energy-use cost based on discounted annual costs and
benefits. This method, which requires an evaluation of the net present value (NPV) of all the investments and benefits from a project, is suitable in interfuel and intermode’substitution because the substitution requires new investments and the bases for consumers’ investment decisions are annual costs and returns.
+ This is the registered Trade Mark of Lotus Development Corporation.
910 S. PoKmmL et al
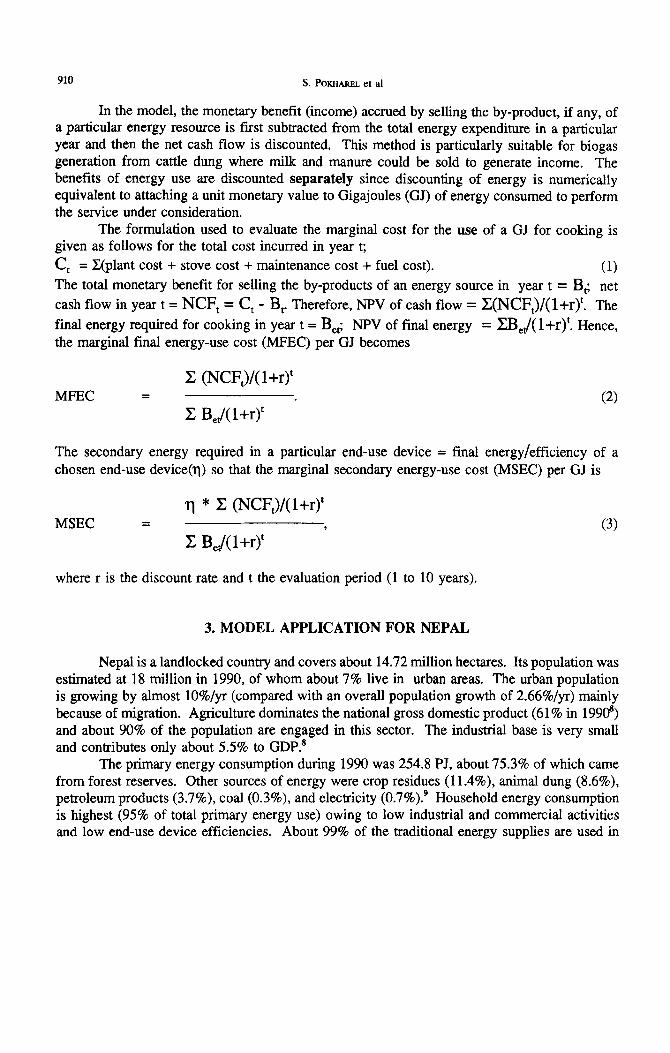
In the model, the monetary benefit (income) accrued by selling the by-product, if any, of a particular energy resource is first subtracted from the total energy expenditure in a particular year and then the net cash flow is discounted. This method is particularly suitable for biogas generation from cattle dung where milk and manure could be sold to generate income. The benefits of energy use are discounted separately since discounting of energy is numerically equivalent to attaching a unit monetary value to Gigajoules (GJ) of energy consumed to perform the service under consideration.
The formulation used to evaluate the marginal cost for the use of a GJ for cooking is given as follows for the total cost incurred in year t; C, = X(plant cost + stove cost + maintenance cost + fuel cost). (1) The total monetary benefit for selling the by-products of an energy source in year t = B,; net
cash flow in year t = NCF, = C, - B,. Therefore, NW of cash flow = C(NCF,)/( l+r)‘. The
final energy required for cooking in year t = B,; NPV of final energy = ZB,J( l+r)‘. Hence, the marginal final energy-use cost (MFEC) per GJ becomes
I2 (NCFJ/( 1 +r)’ MFEC =
’ (2)
Z BJ( l+r)’
The secondary energy required in a particular end-use device = final energy/efficiency of a chosen end-use device(q) so that the marginal secondary energy-use cost (MSEC) per GJ is
MSEC = TJ * IS (NCF,)/( l+r)’
’ I: BJ( l+r)’ (3)
where r is the discount rate and t the evaluation period (1 to 10 years).
3. MODEL APPLICATION FOR NEPAL
Nepal is a landlocked country and covers about 14.72 million hectares. Its population was estimated at 18 million in 1990, of whom about 7% live in urban areas. The urban population is growing by almost lO%/yr (compared with an overall population growth of 2.66%&r) mainly because of migration. Agriculture dominates the national gross domestic product (61% in 1990s) and about 90% of the population are engaged in this sector. The industrial base is very small and contributes only about 5.5% to GDP.8
The primary energy consumption during 1990 was 254.8 PJ, about 75.3% of which came from forest reserves. Other sources of energy were crop residues (11.4%), animal dung (8.6%), petroleum products (3.7%), coal (0.3%), and electricity (0.7%).9 Household energy consumption is highest (95% of total primary energy use) owing to low industrial and commercial activities and low end-use device efficiencies. About 99% of the traditional energy supplies are used in
Interfuel and internode substitution for cooking 911
the household sector. Almost 75% of the energy consumed in the household is used for cooking. The forests have declined” from 10,245,OOO ha in 1964 to 8,910,OOO ha in 1978 (a loss
of about 20% of the forested area) and this trend is continuing. The total sustainable yield of forests in 1986 was estimated at 6.3 million mt (metric tons), whereas the total fuelwood consumed in the same year was 11.0 million mt. In 1990, about 2.3 million mt of crop residue and 2.0 million mt of animal dung were burnt for energy purposes mainly in the- households. Hydroelectric power is developed indigenously. The total installed hydroelectricity generation capacity is about 235 MW and the estimated economic potential is 42 GW.” The diesel-electric generation capacity is 55 MW. Coal and petroleum products are imported and almost all of these are consumed in the urban areas. The import value of petroleum products accounted for 28% of total merchandise export earnings during 1990.’ Biogas and briquettes are also used for cooking. There are about 5800 biogas plants (producing about 77,700 GJ of primary energy annually) and eight briquette factories (annual briquette production capacity = 3500 mt).
The Final Energy The average final energy consumption per family (six members) is estimated at 5.32 GJ/yr
based on annual consumption of 158 kg of LPG and 730 kWh of electricity in a middle income household (Rs 48,000/yrt) in Kathmandu. ’ The thermal efficiencies are 55% for an LPG stove (gas rating = 3500 kcal/hr, Indian Standards # 4246) and 35% for a ceramic electric stove (1 kW). This final energy consumption is comparable to that of 5.42 GJ/yr for an urban family in Sri Lanka.’ The data used in the model were collected in Kathmandu (capital), Birgunj, Hetauda, Biratnagar, Butwal, and Narayangarh (urban areas).
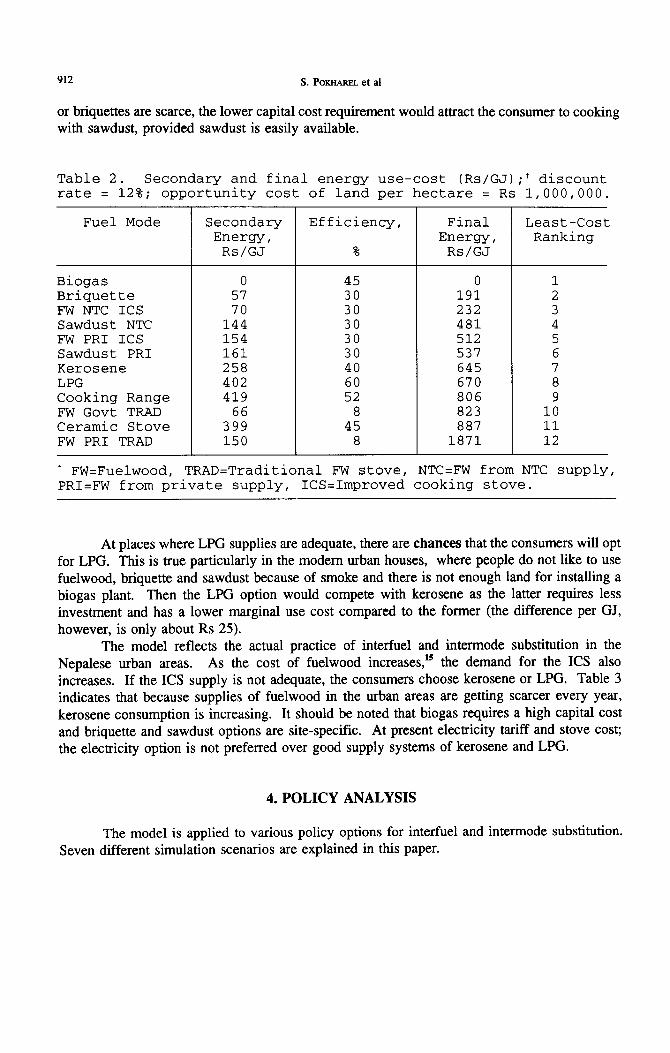
Results and Analmis Table 2 indicates that the final energy-use cost of a IO-m3 biogas plant is the least ( a lo-
m3 biogas plant provides about 6 GJ of final energy annually). The energy-use cost of a biogas plant is very low, in fact negative, because of higher annual returns obtained by selling milk and manure (see Refs. 12-13 for technical details on biogas).
In the analysis, we consider a briquette factory with a daily production capacity of 4.8 mt of briquette. At a 30% efficiency of the briquette stove, this plant can satisfy the annual energy needs of 1350 households. However, the briquette option would be second if the briquette is sold at Rs 75/quintal (break-even cost) to Rs 9O/quintal (see Ref. 14 for details on briquettes).
The fuelwood option with the use of an improved cooking stove (ICS) is preferred at places where there are no options for installing biogas plants or buying briquettes. Consumers will buy fuelwood from the private supply (which is about 100% more expensive than from government sources) to burn in an ICS if the government supply (through the Nepal Timber Corporation, hereafter referred as NTC) is not available. The analysis indicates that the chance of burning fuelwood in a traditional stove with fuelwood purchased from private supply is remote. Where there is no motivation for installing a biogas plant or where supplies of fuelwood
+ US $ 1.0 = Rs 43.0 (rupees); * authors’ survey.
912 s. POKHAREL et al
or briquettes are scarce, the lower capital cost requirement would attract the consumer to cooking with sawdust, provided sawdust is easily available.
Table 2. Secondary and final energy use-cost (Rs/GJ);+ discount rate = 12%; opportunity cost of land per hectare = Rs l,OOO,OOO.
Fuel Mode
Biogas 0 45 0 1 Briquette 57 30 191 2 FW NTC ICS 70 30 232 3 Sawdust NTC 144 30 481 4 FW PRI ICS 154 30 512 5 Sawdust PRI 161 30 537 6 Kerosene 258 40 645 7 LPG 402 60 670 8 Cooking Range 419 52 806 9 FW Govt TRAD 66 8 823 10 Ceramic Stove 399 45 887 11 FW PRI TRAD 150 8 1871 12
Secondary Energy, Rs/GJ
Efficiency,
%
Final Energy, Rs/GJ
Least-Cost Ranking
' FW=Fuelwood, TRAD=Traditional FW stove, NTC=FW from NTC supply, PRI=FW from private supply, ICS=Improved cooking stove.
At places where LPG supplies are adequate, there are chances that the consumers will opt for LPG. This is true particularly in the modern urban houses, where people do not like to use fuelwood, briquette and sawdust because of smoke and there is not enough land for installing a biogas plant. Then the LPG option would compete with kerosene as the latter requires less investment and has a lower marginal use cost compared to the former (the difference per GJ, however, is only about Rs 25).
The model reflects the actual practice of interfuel and intermode substitution in the Nepalese urban areas. As the cost of fuelwood increases,” the demand for the ICS also increases. If the ICS supply is not adequate, the consumers choose kerosene or LPG. Table 3 indicates that because supplies of fuelwood in the urban areas are getting scarcer every year, kerosene consumption is increasing. It should be noted that biogas requires a high capital cost and briquette and sawdust options are site-specific. At present electricity tariff and stove cost; the electricity option is not preferred over good supply systems of kerosene and LPG.
4. POLICY ANALYSIS
The model is applied to various policy options for interfuel and intermode substitution. Seven different simulation scenarios are explained in this paper.
Interfuel and internode substitution for cooking 913
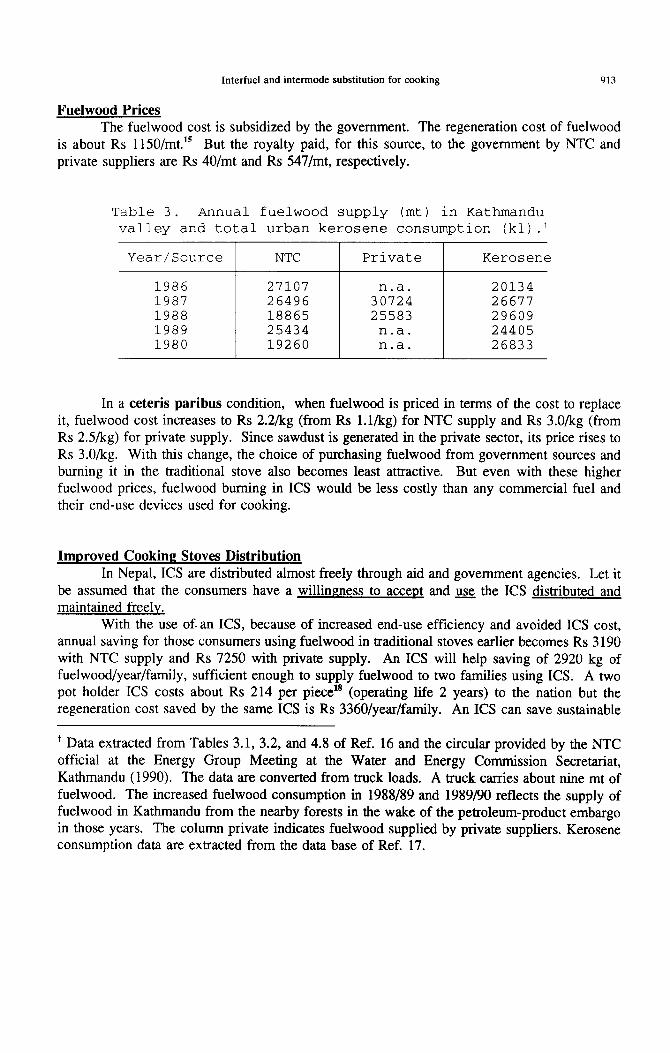
Fuelwood Prices The fuelwood cost is subsidized by the government. The regeneration cost of fuelwood
is about Rs 1 150/mt.15 But the royalty paid, for this source, to the government by NTC and private suppliers are Rs 40/mt and Rs 547/mt, respectively.
Table 3. Annual fuelwood supply (mt) in Kathmandu valley and total urban kerosene consumption (kl).'
Year/Source NTC Private Kerosene
1986 27107 1987 26496 1988 18865 1989 25434 1980 19260
3FE4 25583 n.a. n-a.
20134 26677 29609 24405 26833
In a ceteris paribus condition, when fuelwood is priced in terms of the cost to replace it, fuelwood cost increases to Rs 2.2/kg (from Rs l.l/kg) for NTC supply and Rs 3.O/kg (from Rs 2S/kg) for private supply. Since sawdust is generated in the private sector, its price rises to Rs 3.O/kg. With this change, the choice of purchasing fuelwood from government sources and burning it in the traditional stove also becomes least attractive. But even with these higher fuelwood prices, fuelwood burning in ICS would be less costly than any commercial fuel and their end-use devices used for cooking.
Improved Cooking Stoves Distribution In Nepal, ICS are distributed almost freely through aid and government agencies. Let it
be assumed that the consumers have a willingness to accept and use the ICS distributed and maintained freelv.
With the use of. an ICS, because of increased end-use efficiency and avoided ICS cost, annual saving for those consumers using fuelwood in traditional stoves earlier becomes Rs 3190 with NTC supply and Rs 7250 with private supply. An ICS will help saving of 2920 kg of fuelwood/year/family, sufficient enough to supply fuelwood to two families using ICS. A two pot holder ICS costs about Rs 214 per piece” (operating life 2 years) to the nation but the regeneration cost saved by the same ICS is Rs 3360/year/family. An ICS can save sustainable
’ Data extracted from Tables 3.1, 3.2, and 4.8 of Ref. 16 and the circular provided by the NTC official at the Energy Group Meeting at the Water and Energy Commission Secretariat, Kathmandu (1990). The data are converted from truck loads. A truck carries about nine mt of fuelwood. The increased fuelwood consumption in 1988/89 and 1989/90 reflects the supply of fuelwood in Kathmandu from the nearby forests in the wake of the petroleum-product embargo in those years. The column private indicates fuelwood supplied by private suppliers. Kerosene consumption data are extracted from the data base of Ref. 17.
914 S. Porn et al
supply of about 1.6 hectares of forest per year and help to reduce land erosion and siltation. ICS distribution should be a continuous process, otherwise the consumers will go back to the traditional stove once the ICS breaks. This trend was noticed in Thapa families near Dakshin- Kali in Kathmandu where ICS’s were distributed under community forestry program but never monitored.+
The final energy-use cost to consumers using ICS purchased from market for burning fuelwood from government and private supply reduces to Rs 22O/GJ and Rs 5OO/GJ, respectively because of avoided ICS cost, Such a policy of free distribution, monitoring and redistribution of ICS acts as an insurance for its continuous use.
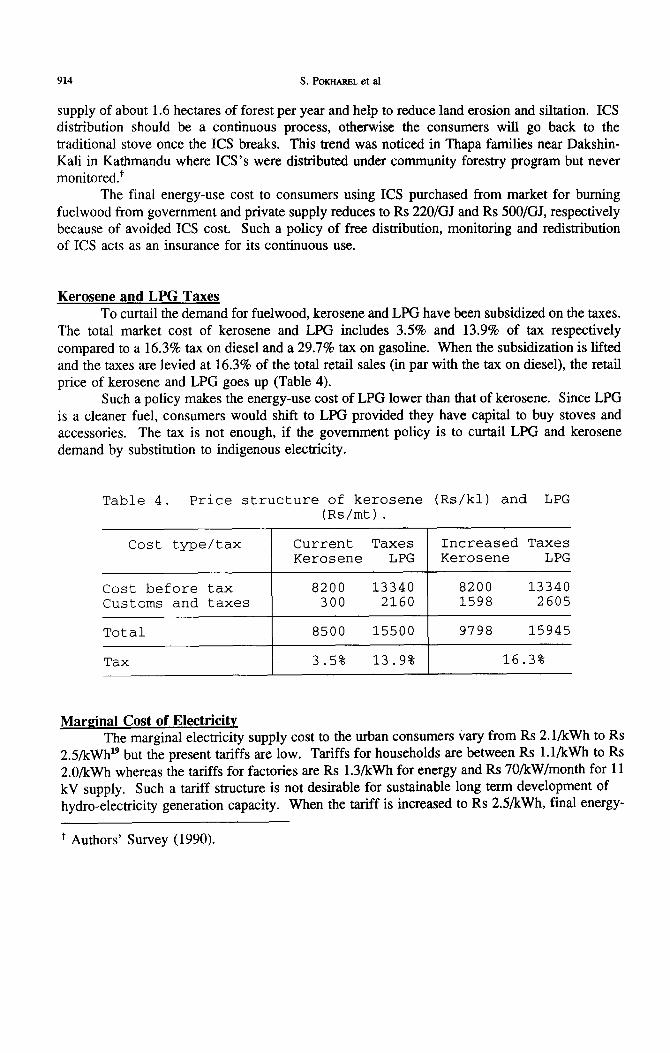
Kerosene and LPG Taxes To curtail the demand for fuelwood, kerosene and LPG have been subsidized on the taxes.
The total market cost of kerosene and LPG includes 3.5% and 13.9% of tax respectively compared to a 16.3% tax on diesel and a 29.7% tax on gasoline. When the subsidization is lifted and the taxes are levied at 16.3% of the total retail sales (in par with the tax on diesel), the retail price of kerosene and LPG goes up (Table 4).
Such a policy makes the energy-use cost of LPG lower than that of kerosene. Since LPG is a cleaner fuel, consumers would shift to LPG provided they have capital to buy stoves and accessories. The tax is not enough, if the government policy is to curtail LPG and kerosene demand by substitution to indigenous electricity.
Table 4. Price structure of kerosene (Rs/kl) and LPG (Rs/mt).
Cost type/tax Current Taxes Increased Taxes Kerosene LPG Kerosene LPG
Cost before tax 8200 13340 8200 13340 Customs and taxes 300 2160 1598 2605
Total I 8500 15500 ( 9798 15945
Tax I 3.5% 13.9% 1 16.3%
Marginal Cost of Electricity The marginal electricity supply cost to the urban consumers vary from Rs 2.l/kWh to Rs
2.5/kWhr9 but the present tariffs are low. Tariffs for households are between Rs l.l/kWh to Rs 2.0/kWh whereas the tariffs for factories are Rs 1.3/kWh for energy and Rs 70/kW/month for 11 kV supply, Such a tariff structure is not desirable for sustainable long term development of hydro-electricity generation capacity. When the tariff is increased to Rs 2.5/kWh, final energy-
+ Authors’ Survey (1990).
Interfuel and internode substitution for cooking 915
use cost per GJ increases by about 83%. The electricity option for cooking in cooking range becomes more expensive than that with NTC supplied fuelwood burnt in a traditional stove.
Such an upward revision of tariff would also affect the consumers using briquettes. The final energy-use cost of briquette increases by 15% with almost 100% increase in electricity tariff (for briquette production). Still, briquette remains to be the second preferred option.
Price of Rice Husk Rice husk is the only raw material for briquettes in the extrusion technology considered
in this study. When such briquette factories are installed in the vicinity of threshing mills then the demand for rice husk increases causing an increase in its price. This was particularly true in Butwal (western Nepal) where the price of rice husk increased from almost nothing to Rs O.l/kg in 1988 (increased in six years) after the installation of the briquette factory.
In a ceteris paribus condition, even if the price of rice husk is Rs 0.32/kg, the briquette option would be preferable over fuelwood (in ICS). If rice husk is available at Rs O.l/kg, the briquette option would be viable over fuelwood (in ICS) at fuelwood price of Rs O.SO/kg or more. This indicates that briquette factory should not be installed at places where fuelwood collection is easy or purchase price fuelwood is low (when the forests are near, selling price of fuelwood tends to be low).
Subsidizine the Capital Cost As it has been seen earlier, if the biogas plant is operated as a dairy farm and briquette
production is operated as a cooperative factory, then they are the least cost options. These installations, however, require a large investments. The government could introduce soft loans or subsidization policy to reduce the burden of large investments.
If the biogas plant are installed in the family with livestock and the by-products of biogas are not sold, the final energy-use cost increases to Rs 583/GJ. This energy-use cost is less than that for LPG and kerosene. Therefore, if the intended policy is to replace kerosene and LPG with biogas, then there is no need to provide any subsidy. However, even if a subsidy of 50% is provided on material and accessories cost (and maintenance) in such cases, biogas will not be an attractive (final energy-use cost then reduces to Rs 46O/GJ) over NTC supplied fuelwood burnt in an ICS.
If the briquette factories are subsidized by 50% on capital, the cost of briquette reduces by 17%. Such a subsidy (about $ 25,000) for each plant is a large sum for the government. Instead of subsidies, therefore, government involvement should be directed to the consumers’ education and efficient stoves s~pply.*~ Customs duty and income taxes from the briquette installation could be lowered to attract more entrepreneurs to briquette production.
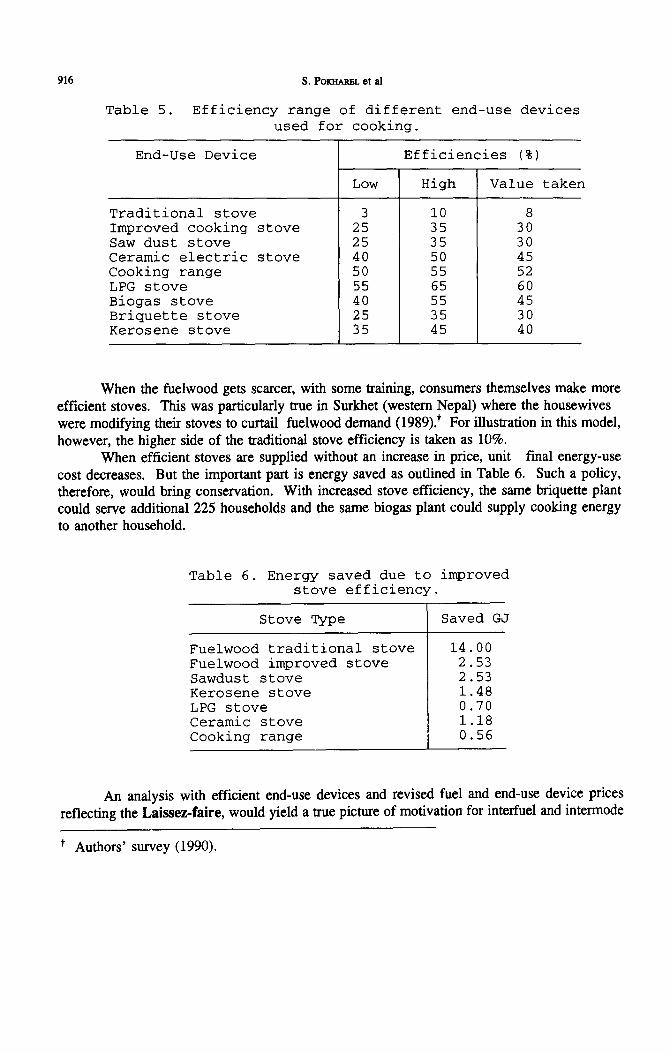
End-Use Device Efficiency Standardization Interfuel and intermode substitution and conservation could be achieved by improving
end-use device efficiency. Table 5 shows values of end-use efficiency assumed earlier and their higher and lower limits for different end-use devices.
916 S. PornL et al
Table 5. Efficiency range of different end-use devices used for cooking.
End-Use Device l-
Traditional stove 3 10 8 Improved cooking stove 25 35 30 Saw dust stove 25 35 30 Ceramic electric stove 40 50 45 Cooking range 50 55 52 LPG stove 55 65 60 Biogas stove 40 55 45 Briquette stove 25 35 30 Kerosene stove 35 45 40
Low
Efficiencies (%I
High Value taken
When the fuelwood gets scarcer, with some training, consumers themselves make more efficient stoves. This was particularly true in Surkhet (western Nepal) where the housewives were modifying their stoves to curtail fuelwood demand (1989).+ For illustration in this model, however, the higher side of the traditional stove efficiency is taken as 10%.
When efficient stoves are supplied without an increase in price, unit final energy-use cost decreases. But the important part is energy saved as outlined in Table 6. Such a policy, therefore, would bring conservation. With increased stove efficiency, the same briquette plant could serve additional 225 households and the same biogas plant could supply cooking energy to another household.
Table 6. Energy saved due to improved stove efficiency.
Stove Type Saved GJ
Fuelwood traditional stove 14.00 Fuelwood improved stove 2.53 Sawdust stove 2.53 Kerosene stove 1.48 LPG stove 0.70 Ceramic stove 1.18 Cooking range 0.56
An analysis with efficient end-use devices and revised fuel and end-use device prices reflecting the Laissez-faire, would yield a true picture of motivation for interfuel and intermode
+ Authors’ survey (1990).
Interfuel and intermode substitution for cooking 917
substitution. Such a solution is desirable for free trade economy and an effective conservation consequence. The government’s effort could be directed towards the development of efficient stoves for conservation. Money saved because of conservation could be used for subsidizing the cost of efficient stoves.
5. CONCLUSION
Based on our analysis, the following conclusions are drawn which are applicable to most of the DCs and LDCs. Interfuel and inter-mode substitution is governed not only by the fuel and end-use device costs but also by the capital costs required for switching. Fuelwood is not a cheap option for cooking from both the consumers’ and the nations’ perspective. For correct economic development, the prices and values of commodities should represent their appropriate levels. Free trade of fuel and end-use devices with strict enforcement of efficiency standardization will not only lead to responsible interfuel and intermode substitution but it will also generate extra energy through conservation.
In the long run, a soft energy path+ approach should be followed for energy supply. Even with a free market economy and with proper management of resources, a renewable indigenous energy source keeps the capability of supplying energy for cooking needs at low costs.
The biogas option is most attractive if the plant could be operated as a dairy farm. Lack of awareness, motivation and initiating capital are the major constraints for its development. In the urban areas, because of higher opportunity cost of land, there is no incentive to install the biogas plant. But this approach could be an answer to sub-urban areas. A nominal subsidy, a long term loan and awareness programs may be necessary to spark the biogas installation.
Each fuel and end-use device has its limitations, price and characteristics: When the regulation is altered for some commodity, its effect is not limited to itself, but this would cause a change in market demand for other fuel and end-use device combination. Fuel cross subsidization policy could be adopted as a measure for directing the use of a particular combination only for the short run. Our analysis considers only the economic costs and leaves out important technical, social, and behavioral issues that would need to be addressed in policy implementation.
Acknowledgements - We are indebted to J.D. Fuller (Department of Management Science) and L. Smith (Department of Economics) for their advice during the course of this research.
’ The book Life After Oil*’ states that the soft approach emphasizes energy conservation to reduce energy demand to manageable levels that can be met by renewable, decentralized, ecologically-sustainable energy sources.
918 S. POmuREL et al
REFERENCES
1.
2.
3.
5.
6.
7.
8 9.
10
11.
12. 13. 14.
15.
16.
17.
18.
19.
20.
21.
M. Munasinghe, Enernv Pricing and Demand Management, Westview Press, Boulder, Colorado, USA (1985). International Conference on Integrating Energy and Environmental Management, “The Need for Energy Efficiency and Conservation,” The Energy Conservation Centre, Bangkok, Thailand (1989). Tata Energy Research Institute (TERI), Energv Policv Issues, Vol 4, New Delhi, India (1988). N.M. Islam, “Rural Energy and Rural Development,” Department of Geography, University of Reading, Reading, England (1987). B. Sudarsono, “Overview of Power Sector in Asia,” Lecture material on Seventh Asian School on Energy, Asian Institute of Technology, Bangkok, Thailand (1990). H. Sarkar and G.M. Kadekodi, Energv Pricing in India, International Labour Organization, Geneva, Switzerland (1988). United Nations Centre for Human Settlement (Habitat), Enerav Requirement and Utilization in Rural and Urban Low-Income Settlements, Nairobi, Kenya (1984). Ministry of Finance, “Economic Survey 1990,” Kathmandu, Nepal (1990). S. Pokharel, “Estimates of Energy Balances of Nepal (draft), 1990/91,” University of Waterloo, Waterloo, Canada (1991). Water and Energy Commission Secretariat (WECS), “Energy Sector Synopsis Report 1985/86,” Singha Durbar, Kathmandu, Nepal (1987). Water and Energy Commission Secretariat, “Nepal and Its Energy Scene,” Kathmandu, Nepal (1989). UN/ESCAP, Updated Guidebook on Biogas Develoument, Bangkok, Thailand (1984). UNICEF, Biogas Plants in Nepal, Katbmandu, Nepal (1985). S. Pokharel, “An Evaluation of Rice Husks Densification Technology in Nepal,” WECS, Kathmandu, Nepal (1988). S.P. Sharma, EnerPv Pricing Policies in Nepal, International Labour Organization, Geneva, Switzerland (1987). United States Agency for International Development, “Forest Products Marketing Systems in Nepal,” Kathmandu, Nepal (1989). S. Pokharel, “Energy Balance Sheet of Nepal 1989/90,” WECS, Kathmandu, Nepal (1990). K. Rijal and S.S. Graham, “An Evaluation of Alternate Energy Technology,” WECS, Nepal (1987). Department of Electricity, “Tariff Study Report,” Ministry of Water Resources, Katbmandu, Nepal (1982). S. Pokharel, M. Chandrashekhar and J.B. Robinson, “Biogas Potential and Implementation Issues in Nepal,” Journal of Engineering for International Development, l(l), pp. 45-56, Queen’s University, Kingston, Canada (1991). R. Bott, D. Brooks and J.B. Robinson, Life After Oil, Hurtig Publishers, Edmonton, Canada (1983).