Embed Size (px)
Citation preview

The Description–Experience Gap in RiskyChoice: The Role of Sample Size andExperienced Probabilities
ROBIN HAU1*, TIMOTHY J. PLESKAC2,JURGEN KIEFER3 and RALPH HERTWIG1
1Department of Psychology, University of Basel, Switzerland2Department of Psychology, Michigan State University, USA3Center of Human-Machine-Systems,Technical University, Berlin, Germany
ABSTRACT
Risky prospects come in different forms. Sometimes options are presented withconvenient descriptions summarizing outcomes and their respective likelihoods. Peoplecan thus make decisions from description. In other cases people must call on theirencounters with such prospects, making decisions from experience. Recent studiesreport a systematic and large description–experience gap. One key determinant of thisgap is people’s tendency to rely on small samples resulting in substantial sampling error.Here we examine whether this gap exists even when people draw on large samples.Although smaller, the gap persists. We use the choices of the present and previousstudies to test a large set of candidate strategies that model decisions from experience,including 12 heuristics, two associative-learning models and the two-stage model ofcumulative prospect theory. This model analysis suggests—as one explanation for theremaining description–experience gap in large samples—that people treat probabilitiesdifferently in both types of decisions. Copyright # 2008 John Wiley & Sons, Ltd.
key words decision from experience; heuristics; risky choice; sampling
INTRODUCTION
Experience matters. Although this statement sounds like a banal cliche, there is a steadily increasing body ofresearch suggesting that cognitive processes and overt behavior depend on whether information is acquiredthrough personal experience or by descriptive summaries of events. Consider, for instance, Bayesianreasoning. When base rates have been directly experienced they are more likely to be used than whensymbolically described with a single summary statistic (e.g., Koehler, 1996; Weber, Bockenholt, Hilton, &Wallace, 1993). Risk perception provides another instance of a description–experience gap. Israeli residentsliving in an area that experienced repeated terrorist attacks were found to be more risk seeking than
Journal of Behavioral Decision MakingJ. Behav. Dec. Making, 21: 493–518 (2008)Published online 8 May 2008 in Wiley InterScience(www.interscience.wiley.com) DOI: 10.1002/bdm.598
*Correspondence to: Robin Hau, Department of Psychology, University of Basel, Missionsstrasse 64a, 4051 Basel, Switzerland.E-mail: [email protected]
Copyright # 2008 John Wiley & Sons, Ltd.

international tourists merely equipped with, albeit gruesome, descriptions of attacks (Yechiam, Barron, &Erev, 2005).
Experience matters. Consider the disparities between experts’ recommendations and actual insurancedecisions. Insurance agents and insurance brochures provide dry facts and figures to potential clients aboutthe risks of such events as flooding. Yet, people tend not to purchase insurance—unless legally required to—for events that occur with low frequency but have severe consequences (Anderson, 1974; Kunreuther, 2006;Slovic, Fischhoff, Lichtenstein, Corrigan, & Combs, 1977). In 2005, for example, damage caused byhurricanes from the North Atlantic totaled around $165 billion—only half of those losses were insured(Munich Re Group, 2006). One reason may be that dry facts and figures cannot take the place of authenticexperience (but see Yechiam et al., 2005).
Experience matters—but why? There are a number of theoretical constructs that can help to explain whyand how experienced information differs from symbolically described information. They range from thenotion of psychological distance (Trope & Liberman, 2003) to the speculation that directly experiencedinformation invokes an implicit rather than an explicit learning system (Koehler, 1996). In this paper,we investigate a description–experience gap in risky decision-making. Specifically, we examine whethermaking experience- and description-based information increasingly equivalent also renders thempsychologically equivalent. Second, we test an extensive set of candidate strategies that may underliedecisions from experience.
THE DESCRIPTION–EXPERIENCE GAP IN CHOICES BETWEEN MONETARY GAMBLES
Gambling problems have time and again played a key role in the development of theories of human choice.Luca Paccioli’s problem of points (developed in 1494; cf. Hacking, 1975), the St. Petersburg paradox(Bernoulli, 1738/1954), the Allais paradox (Allais, 1953, 1979), and the Ellsberg paradox (Ellsberg, 1961)are just a few of the gambling problems that have instigated the development of the theories of mathematicalprobability and expectation, the expected utility theory, as well as descriptive alternatives to expected utility.When Savage (1954) proposed that virtually all alternative courses of action have risky, not perfectlypredictable consequences and that everyday choices could be seen as equivalent to choices betweenmonetarygambles, one of the longest lived and most frequently studied tasks in psychologists’ (and economists’)laboratories was born.
Since Edwards (1954), in his seminal paper, pioneered the study of preferences between monetarygambles in psychology the focus, however, has predominantly been on decisions made from description. In arecent meta-analysis of studies involving decisions between a two-outcome risky prospect and a sure thing(with equal expected value), Weber, Shafir, and Blais (2004) reported that all 20 studies (encompassing 226choice situations) called for decisions between symbolically described gambles: That is, the outcomes ofeach option and their probabilities are provided, and the information is conveyed numerically, in terms ofwritten probabilities, visual pie charts, or frequency distributions. Hertwig, Barron, Weber, and Erev (2004)referred to such decisions as decisions from description. Without any doubt, there are important real-worldequivalents of such description-based decisions. When people have access to information such as newspaperweather forecasts, drug-package inserts, and mutual-fund brochures, all of which provide convenientdescriptions of risky prospects, they can arrive at decisions from description.
These examples notwithstanding, people, businesses, and organizations often cannot help but makechoices without resorting to summary descriptions of choice outcomes and probabilities. For instance, wecannot rely on descriptions of risky prospects in the countless mundane situations in which we decidewhetheror not to back up our computer hard drive, cross a busy street, or go out on a date. Being ignorant of the precisepayoffs (outcomes and probabilities), however, we can draw small samples of experience, thus makingdecisions from experience (Hertwig et al., 2004). For instance, one sip of wine, perhaps even as little as a sniff
Copyright # 2008 John Wiley & Sons, Ltd. Journal of Behavioral Decision Making, 21, 493–518 (2008)
DOI: 10.1002/bdm
494 Journal of Behavioral Decision Making

or a look, determines whether the contents of the bottle are drinkable. Enjoying a 2-week free trial of a dailynewspaper tells us whether it is to our political taste. A quick look on the online traffic cams tells us whichroute to choose for the morning commute. Glancing at the plates of the other guests helps us to determinewhich dish to choose from a restaurant’s menu. Polling friends about which of two new movies they enjoyedrenders our night at the movies more pleasurable.
Experience can come in different forms. For instance, it may be crystallized in terms of old experiencewith similar scenarios (see Klein, 1998; Tversky & Fox, 1995). Alternatively, a person may have theopportunity to sample from his or her options, thus gaining novel experience. Hertwig et al.’s (2004) studyillustrates how this foraging for information can be studied in the laboratory. Participants saw two buttons ona computer screen and were told that each button was associated with a payoff distribution. Clicking on agiven button elicited the sampling of an outcome (with replacement) from its distribution. Respondents couldsample in whatever order they desired. During this exploration, they neither earned nor lost any money.Instead, they simply learned about the properties of the distributions for a future choice. They were instructedto sample until they felt confident enough to decide which deck to choose in a final draw involving realmonetary payoffs. Once they terminated sampling, they indicated their preferred option. Finally, respondentsplayed out the selected option and received real payoffs. For illustration, a respondent may have sampled thesequences {3, 3, 3, 3, 3, 3, 3} and {0, 0, 0, 0, 0, 32, 0, 0, 0, 0} from distributions A and B, respectively. Afterthese sequences, the respondent terminates sampling and indicates A to be the preferred choice. One finalrandom draw from distribution Amay result in outcome 3, reflecting the respondent’s earnings in this choice.
WHAT CAUSES THE DESCRIPTION–EXPERIENCE GAP?
Hertwig et al. (2004) compared respondents’ choices based on sampled experience with those of a secondgroup who, responding to the same problems, made decisions from description. That is, information aboutoutcomes and their probabilities were conveniently packaged and laid out in front of the participants. Choicesdiffered drastically across groups. Description-based choices were consistent with prospect theory’sassumption of overweighting of rare (low-probability) events (Kahneman & Tversky, 1979). In contrast, inexperience-based choices people chose as if the impact of objectively rare outcomes was attenuatedcompared both to the weight given in decisions from description and to the weight they deserved according totheir objective probabilities.
Hertwig et al. (2004) identified two factors that appear to be behind the humble impact of rare events onpeople’s choices. First, respondents’ information search effort was correspondingly humble. Specifically, thetotal number of draws per decision problem was relatively small, with a median of 15 draws (17 draws inWeber et al.’s, 2004, decisions-from-experience study). Small samples exact an important consequence:Owing to the skewness of the binomial distribution with low p, small ns make it more likely that a personencounters the rare event less frequently than expected (np) than more frequently than expected (for detailssee Hertwig, Barron, Weber, & Erev, 2006). Second, Hertwig et al. (2004) reported that observations madelate in the sequence of n observations had more impact on the choice process than they deserved (i.e., morethan 1/n). This recency effect makes the functional sample size of observations from which people derivetheir choice even smaller, thus further accentuating the underrepresentation of rare events.
In a comment to Hertwig et al. (2004), Fox and Hadar (2006) argued that ‘‘our internal analysis of[Hertwig et al.’s] data and our replication show that the so-called ‘underweighting’ of low-probability eventsin decisions from experience is driven almost entirely by a tendency to undersample low-probability events’’(p. 161). In addition, Fox and Hadar used the two-stage model of cumulative prospect theory (Tversky & Fox,1995; Fox & Tversky, 1998) to improve our understanding of decisions from experience. According to thismodel, people form a belief about the likelihoods of the outcomes of an uncertain option, and based on thisevaluate the option. The latter step is modeled in terms of cumulative prospect theory’s value and weighting
Copyright # 2008 John Wiley & Sons, Ltd. Journal of Behavioral Decision Making, 21, 493–518 (2008)
DOI: 10.1002/bdm
R. Hau et al. The Description–Experience Gap 495

functions (Tversky & Kahneman, 1992). In the case of decisions from experience, Fox and Hadar used aperson’s experienced relative frequencies of events in the two distributions (e.g., 32 and 0 in option B of theaforementioned example) as a proxy for the person’s subjective belief. Then, they entered this belief into thevalue and weighting functions (using the median parameter estimates as specified in Tversky & Kahneman).Thus applied, the two-stage model was reported to predict 69% of the individual choices in the Hertwig et al.data set.1
If sampling error is behind the description–experience gap—which, next to recency, was one of the twofactors put forth by Hertwig et al. (2004) and emphasized by Fox and Hadar (2006)—this gap will be reducedto the extent that participants sample more. With larger samples, the sample probabilities are bound toresemble the objective probabilities more closely, thus providing a less distorted picture of the world.Alternatively, however, the description–experience gap may prove to be (partly) independent of the actualsample size people take. Such a dissociation could occur if people employed decision strategies that usemerely part of the actually experienced sample (e.g., due to recency or primacy) or that completely disregardexperienced relative frequencies and other proxies for event likelihoods altogether (e.g., the maximaxheuristic).
In this paper we will investigate the robustness of and the reasons behind the description–experience gap.To this end, we first aim to replicate the original decisions from experience, using a different sample ofparticipants (Study 1). In Studies 2 and 3, we then examinewhether the description–experience gap continuesto exist even when people draw on large samples of experience to make a choice. In the final part of the paper,we examine which decision strategies can model decisions from experience and to what extent models thatpay no or less heed to experienced relative frequencies may perform better in explaining people’s choicesthan models that take explicit advantage of the experienced frequencies.
STUDY 1. HOW ROBUST IS THE DESCRIPTION–EXPERIENCE GAP?
As a first step in our investigation, we sought to replicate the description–experience gap as observed byHertwig et al. (2004). Our motivation for a replication was to establish the robustness both of the humblesampling behavior and the distinct pattern in respondents’ decisions from experience, using a larger numberof respondents per problem (44 vs. 25 in Hertwig et al.) and drawing on a sample of students whose training inquantitative reasoning and economic concepts (e.g., opportunity costs, see below) is likely to be lesssophisticated than that of students in industrial engineering and economics at the Technion.
MethodParticipantsTwo groups of participants made either decisions from experience or decisions from description. Theexperience group was made up of 44 psychology students from the University of Basel (11 males,33 females). The mean age was 23.4 (SD! 6.4), with a range from 20 to 40 years. Respondents in thedescription group participated in a web-based study. To draw on the same pool of student participants in bothgroups, we excluded all nonstudents from the description group. A total of 110 respondents (45 males, 65females) remained. Their mean age was 23.2 years (SD! 3.0 years), ranging from 19 to 35 years.
1We conducted the same analysis and arrived at 67% correct predictions. So far we have not been able to determine the source of thediscrepancy but have observed that swapping prospect theory’s parameters for the weighting function (d and g) yields 69% performance.
Copyright # 2008 John Wiley & Sons, Ltd. Journal of Behavioral Decision Making, 21, 493–518 (2008)
DOI: 10.1002/bdm
496 Journal of Behavioral Decision Making

Design and procedureThe participants responded to the same six choice problems used by Hertwig et al. (2004). They are listed inTable 1. All instructions and stimuli were presented on a computer screen. It was divided in half, one half blueand the other green, representing two decks of cards, each linked to an outcome distribution (henceforth, weuse the term deck rather than distribution). People could explore the decks by pressing one of two color-codedbuttons on a keyboard, thus eliciting the sampling of an outcome (with replacement). The outcome appearedfor 1 second in 200 pt Verdana font over a full-screen background colored like the selected deck. The initialscreen showing both decks then replaced this screen, and the person could sample another outcome.Respondents were instructed to sample until they felt confident enough to decide fromwhich deck to draw fora real payoff. Yet, in 36 of the 264 total trials respondents did not sample from one or even both decks.Judging from our post-experimental interviews, this lack of curiosity was most likely due to the meagerfinancial incentives in this study. We excluded these trials from the analysis.
Participants responded to the problems in a random order. After completing all six problems, participantsplayed out their choices and were paid 0.05 Swiss Francs (approx. US $0.04) for each point won (e.g.,outcome 3 in Problem 1 was equivalent to US $0.12). We chose a payment scheme as close as possible to thatused in the original study, because different incentives can affect people’s search behavior and opportunitycosts. Note that Hertwig et al. (2004) paid the equivalent of $0.02 for each point. We pay 0.05 Swiss Francsbecause it is the lowest available denomination.
In the description group, respondents saw the same six problems described on a computer screen as theexperience group (Table 1) in a random order. For instance, the description of Problem 1 read as follows: ‘‘4with a chance of 80%, 0 otherwise,’’ and ‘‘3 with a chance of 100%.’’ Participants were told that one ofthem would be randomly selected, and his or her choices would be played out. For this one participant, eachpoint won was worth CHF 0.50 (approx. US $0.41) instead of CHF 0.05. We will use the results of thisdescription group as a point of reference in Studies 1–3. In the latter two studies, we will successively make
Table 1. Summary of the decision problems and choice proportions in Study 1
Decisionproblem
Hertwig et al. Study 1
OptionsaExperience(n! 25)
Experience(n! 44)
Description(n! 110)
Deck H Deck LChoice H(in %)
Choice H(in %)
Predictionb
for Hchoices Differencec
Choice H(in %)
1 4, 0.8 3, 1 88 62d Higher "29 (z! 3.79, p! .001) 332 4, 0.2 3, 0.25 44 55 Lower #27 (z! 3.23, p! .001) 723 #3, 1 #32, 0.1 28 11 Lower #26 (z! 3.94, p< .001) 374 #3, 1 #4, 0.8 56 45 Higher "14 (z! 1.61, p! .108) 315 32, 0.1 3, 1 20 15 Lower #48 (z! 6.78, p< .001) 636 32, 0.025 3, 0.25 12 28 Lower #19 (z! 2.30, p! .022) 47
aThe deck containing a rare event is underlined. H indicates the deck with the higher expected value, L the one with the lower expectedvalue. For each deck, only the nonzero outcome is presented along with its probability; the other outcome is 0 with the complementaryprobability.bThe entries in this column indicate whether the proportion of participants choosing the H option should be higher or lower in theexperience groups (relative to the description group), assuming that rare events have less impact on decisions from experience than ondecisions from description.cThis column indicates the percentage of H choices in the experience group minus the percentage of H choices in the description group,along with z-statistics and p-values testing for a difference between these groups (all tests are two tailed).dThis proportion is significantly lower than the proportion observed in the experience group in Hertwig et al. (z! 2.66, p< .008).
Copyright # 2008 John Wiley & Sons, Ltd. Journal of Behavioral Decision Making, 21, 493–518 (2008)
DOI: 10.1002/bdm
R. Hau et al. The Description–Experience Gap 497

changes to the experience group and investigate how these changes alter decisions from experience (relativeto the experience and description groups in Study 1).
ResultsTable 1 lists proportions of individuals who chose the higher expected value gamble (see column labeled‘‘Choice H’’) in the description and experience groups in Study 1. Across all problems, the average (absolute)difference between the percentage of respondents choosing option H in the description and experience groupswas 27 percentage points (36 percentage points in Hertwig et al., 2004). Differences were statisticallysignificant for all problems except for Problem 4. Equally important, the direction of each difference wasconsistent with that predicted by the assumption that rare events have less impact on decisions fromexperience than on decisions from description. Table 1 also lists the choice in Hertwig et al.’s experiencegroup. Except for Problem 1, differences between the percentage of respondents choosing option H inHertwig et al.’s experience group and Study 1’s experience group were small and nonsignificant.
Beyond choice, we also analyzed people’s sampling efforts. Our students collected even less informationthan the Technion students in Hertwig et al. (2004). Figure 1 displays the median number of draws taken foreach problem. On average, participants drew a median of 11 total draws per problem (compared to 15 in theoriginal study); the first and third quartiles of total number of observations were 5 and 20, respectively.Replicating another finding in the original study, the average number of draws for both decks was roughlyequal.
Respondents’ modest sampling effort systematically distorted the probabilities with which theyencountered rare events. Across all problems the rare event was not even encountered in 50.3% of all trials.Moreover, it was sampled less often than implied by its objective probability in an additional 10.5% of thesamples. Finally, the median difference between the experienced relative frequency and the objectiveprobability of the nonzero outcomes was 10.9 percentage points.
To conclude, Study 1 found the same description–experience gap reported by Hertwig et al. (2004).Second, respondents relied on small samples of experience, thus not encountering rare events or encountering
Figure 1. Median number of draws in Study 1 for each of the six decision problems. Results are shown separately for thetotal number of draws and for draws of the decks with the higher (H) and lower (L) expected values. For each deck, onlyone outcome is given, followed by its probability; the second outcome, which is not stated, was 0 and occurred with a
probability complementary to the stated one. The axis is scaled to allow for easy comparison with Figure 2
Copyright # 2008 John Wiley & Sons, Ltd. Journal of Behavioral Decision Making, 21, 493–518 (2008)
DOI: 10.1002/bdm
498 Journal of Behavioral Decision Making

them less frequently than expected according to their objective probability. Third, respondents, on average,sampled roughly equally frequently from both options per problem. We succeeded in replicating the samepattern of decisions from experience that had been previously observed, by using a sample of students quitedifferent from the economics and industrial engineering students investigated in the original study.
STUDY 2. THE DESCRIPTION–EXPERIENCE GAP: DO HIGHER INCENTIVES MAKE ITDISAPPEAR?
Searching for information takes time—time during which people cannot pursue other activities. In otherwords, sampling is costly in terms of the things that one has to forgo. Economists refer to this cost asopportunity cost. Taking opportunity costs into account, respondents’ reliance on small samples in Study 1may be perfectly reasonable. To appreciate this point, consider Problem 1 (Table 1). Every draw from thesure-thing deck yields a ‘‘3,’’ and a draw from the risky-prospect deck results in either ‘‘4’’ or ‘‘0,’’ with theformer being four times as likely as the latter (0.8 vs. 0.2). One respondent in our Study 1 sampled four timesfrom the sure-thing deck, each time encountering ‘‘3,’’ and sampled three times from the risky-prospect deck,encountering ‘‘0’’ once and ‘‘4’’ two times. At this point, the mental model of the respondent may have been:a choice between a certain ‘‘3’’ versus a 0.67 chance of an outcome ‘‘4.’’ The respondent ended up selectingthe risky option. The difference between the expected values of ‘‘3’’ and ‘‘2.67’’ translates into a payoffdifference of 1.3¢. In light of the opportunity costs, spending more time exploring these decks may thusindeed be deemed futile (see Harrison, 1989; Smith, 1982, on the precept of payoff dominance; and vonWinterfeldt & Edwards, 1986, for a discussion of flat maxima).
Study 2 investigates three questions related to the costs of information search: First, does increasing thestakes—thus rendering it more expensive not to choose the higher expected value deck—result in moresearch? Second, more search, if it happens, should lead to information in the experience condition thatbecomes increasingly, statistically speaking, equivalent to the description condition. But will decisions fromexperience based on more information simply mirror decisions from description? Third, although sampleprobabilities will resemble the objective probabilities more closely with more search, how closely willpeople’s beliefs about the likelihood of events track the probabilities experienced in the sample?
MethodParticipantsA total of 39 students (16 males, 23 females) from the University of Basel participated in the study. Theirmean age was 23.8 years (SD! 3.6 years), ranging from 18 to 33 years.
Design and procedureWe used the samematerial and procedure as in the experience group of Study 1, except for two changes. First,we increased the stakes by an order of magnitude: For each respondent, each point won was worth CHF 0.50(approx. US $0.41) instead of CHF 0.05. Second, after each problem respondents were asked to report whatoutcomes they encountered during sampling and to estimate their relative frequency. We will comparepeople’s choices in Study 2 to those made by the description group of Study 1.
ResultsPeople search more when stakes are higher. Figure 2 displays the median number of draws per problem. Themedian number of draws per problemwas 33 cards (range: 2–226, interquartile range: 17.5–50), about double
Copyright # 2008 John Wiley & Sons, Ltd. Journal of Behavioral Decision Making, 21, 493–518 (2008)
DOI: 10.1002/bdm
R. Hau et al. The Description–Experience Gap 499
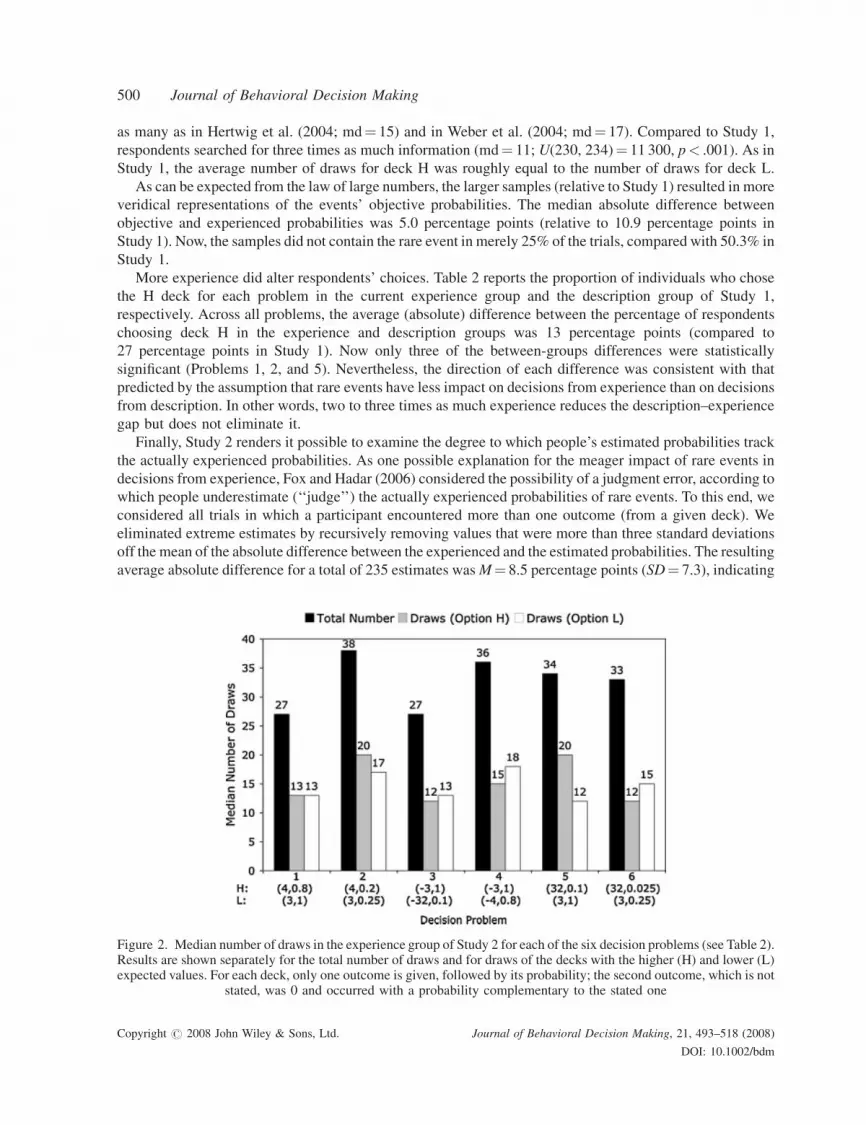
as many as in Hertwig et al. (2004; md! 15) and in Weber et al. (2004; md! 17). Compared to Study 1,respondents searched for three times as much information (md! 11; U(230, 234)! 11 300, p< .001). As inStudy 1, the average number of draws for deck H was roughly equal to the number of draws for deck L.
As can be expected from the law of large numbers, the larger samples (relative to Study 1) resulted in moreveridical representations of the events’ objective probabilities. The median absolute difference betweenobjective and experienced probabilities was 5.0 percentage points (relative to 10.9 percentage points inStudy 1). Now, the samples did not contain the rare event in merely 25% of the trials, compared with 50.3% inStudy 1.
More experience did alter respondents’ choices. Table 2 reports the proportion of individuals who chosethe H deck for each problem in the current experience group and the description group of Study 1,respectively. Across all problems, the average (absolute) difference between the percentage of respondentschoosing deck H in the experience and description groups was 13 percentage points (compared to27 percentage points in Study 1). Now only three of the between-groups differences were statisticallysignificant (Problems 1, 2, and 5). Nevertheless, the direction of each difference was consistent with thatpredicted by the assumption that rare events have less impact on decisions from experience than on decisionsfrom description. In other words, two to three times as much experience reduces the description–experiencegap but does not eliminate it.
Finally, Study 2 renders it possible to examine the degree to which people’s estimated probabilities trackthe actually experienced probabilities. As one possible explanation for the meager impact of rare events indecisions from experience, Fox and Hadar (2006) considered the possibility of a judgment error, according towhich people underestimate (‘‘judge’’) the actually experienced probabilities of rare events. To this end, weconsidered all trials in which a participant encountered more than one outcome (from a given deck). Weeliminated extreme estimates by recursively removing values that were more than three standard deviationsoff the mean of the absolute difference between the experienced and the estimated probabilities. The resultingaverage absolute difference for a total of 235 estimates wasM! 8.5 percentage points (SD! 7.3), indicating
Figure 2. Median number of draws in the experience group of Study 2 for each of the six decision problems (see Table 2).Results are shown separately for the total number of draws and for draws of the decks with the higher (H) and lower (L)expected values. For each deck, only one outcome is given, followed by its probability; the second outcome, which is not
stated, was 0 and occurred with a probability complementary to the stated one
Copyright # 2008 John Wiley & Sons, Ltd. Journal of Behavioral Decision Making, 21, 493–518 (2008)
DOI: 10.1002/bdm
500 Journal of Behavioral Decision Making

that people’s estimates were clearly not perfectly aligned with the probabilities. Echoing a finding obtained inmany other studies (see Gottlieb, Weiss, & Chapman, 2007; Hertwig, Pachur, & Kurzenhauser, 2005), wealso observed slight overestimation of small and underestimation of large probabilities. The regression line inFigure 3a, predicting the estimated frequencies from the experienced frequency, shows this phenomenon,typically interpreted as a consequence of regression toward the mean (Hertwig et al., 2005). In other words, tothe extent that there is a judgment error (Fox &Hadar), it should foster rather than diminish the impact of rareevents.
To conclude, Study 2 yielded three insights into the description–experience gap. Increasing financialstakes increased search. Compared to Study 1, respondents sampled three times as much. In addition, moresearch reduced the difference in choices between the experience and the description groups, but did noteliminate it. This finding confirms sampling error due to small samples as a key reason for the disparitybetween both types of decisions, consistent with Fox and Hadar (2006) and Hertwig et al. (2004). Finally, wealso found that the amount of experience our respondents sought did not yield completely accurate beliefsabout the events’ objective probabilities: The estimated probabilities were such that rare events wereoverestimated. In light of this slight overestimation the remaining description–experience gap—consistentwith the assumption that rare events in decisions from experience have less impact than in decisions fromdescription—is notable.
STUDY 3. THE DESCRIPTION–EXPERIENCE GAP: DOES EXTENSIVE SEARCHMAKE IT DISAPPEAR?
Although people sampled more information in Study 2, relative to Study 1, there was still a total of 25% oftrials in which the rare event was not encountered. If this number were further reduced, would thedescription–experience gap shrink further and eventually disappear? Study 3 was designed to investigate this
Table 2. Summary of the decision problems and choice proportions in Study 2
Decisionproblem
Study 2 Study 1
OptionsaExperience(n! 39)
Description(n! 110)
Deck H Deck L Choice H (in %)Predictionb
for H choices Differencec Choice H (in %)
1 4, 0.8 3, 1 56 Higher "23 (z! 2.52, p! .011) 332 4, 0.2 3, 0.25 51 Lower #21 (z! 2.31, p! .021) 723 #3, 1 #32, 0.1 36 Lower #1 (z! 0.11, p! .911) 374 #3, 1 #4, 0.8 36 Higher "5 (z! 0.56, p! .573) 315 32, 0.1 3, 1 36 Lower #27 (z! 3.01, p! .003) 636 32, 0.025 3, 0.25 46 Lower #1 (z! 0.11, p! .914) 47
aThe deck containing a rare event is underlined. H indicates the deck with the higher expected value, L the one with the lower expectedvalue. For each deck, only the nonzero outcome is presented along with its probability; the other outcome is 0 with the complementaryprobability.bThe entries in this column indicate whether the proportion of participants choosing the H option should be higher or lower in theexperience groups (relative to the description group), assuming that rare events have less impact on decisions from experience thandecisions from description.cThis column indicates the percentage of H choices in the experience group minus the percentage of H choices in the description group ofStudy 1, along with z-statistics and p-values testing for a difference between these groups (all tests are two tailed).
Copyright # 2008 John Wiley & Sons, Ltd. Journal of Behavioral Decision Making, 21, 493–518 (2008)
DOI: 10.1002/bdm
R. Hau et al. The Description–Experience Gap 501

possibility: Specifically, respondents were required to sample a total of 100 times before they could rendertheir final choice.
MethodParticipantsForty students from the University of Basel participated (15 males, 25 females). Their mean age was 24 years(SD! 4.1 years), with a range from 19 to 38 years.
Figure 3. Scatterplot of experienced sample probabilities and participants’ corresponding estimates for Studies 2 (Panela) and 3 (Panel b). Every point represents the probability with which a person experienced an outcome and his or herrespective estimate. Optimal calibration is indicated by the diagonal. The dashed lines mark the least-square regression
lines for Studies 2 and 3, separately. Outliers were removed from the data before fitting the regression lines
Copyright # 2008 John Wiley & Sons, Ltd. Journal of Behavioral Decision Making, 21, 493–518 (2008)
DOI: 10.1002/bdm
502 Journal of Behavioral Decision Making

Design and procedureWe used the same material and procedure as in the experience group of Study 2, except that the samplingphase was not terminated by the participants but ended after they had sampled a total of 100 cards from bothdecks combined. Respondents were informed that the program would require them to sample 100 times.Otherwise, they could sample in whatever order they preferred and could distribute their 100 draws betweendecks as they saw fit. After each choice, they were asked to estimate the probability with which the variousoutcomes occurred in the sample. They received the same monetary payment as in Study 2. Again, we willcompare the results to the decisions from description observed in Study 1.
ResultsSampling 100 times provided respondents with quite accurate experiences of the outcomes’ objectiveprobabilities. Specifically, the median absolute difference between objective and experienced probabilitieswas 3.3 percentage points (compared with 10.9 and 5.0 percentage points in Studies 1 and 2, respectively).Moreover, respondents encountered the rare event at least once in all but 10% of their samples (compared to50.3 and 25% in Studies 1 and 2, respectively).
Does this substantially larger sample render the description–experience gap smaller than in Study 2?Table 3 lists the proportions of choices of deck H across problems. The gap did not close. Across all problems,the average (absolute) difference between the percentage of respondents choosing deck H in Study 3 and thedescription group in Study 1 was 17 percentage points (compared to 13 percentage points in Study 2). Again,three of the between-groups differences were statistically significant (Problems 1, 4, and 5). The direction ofeach difference was consistent with that predicted by the assumption that rare events have less impact ondecisions from experience than on decisions from description for all problems except Problem 2. If onesubtracts the Problem 2 difference from the sum of all absolute differences and then calculates the averagedifference, the gap between the experience group (Study 3) and the description group (Study 1) is still15 percentage points. In other words, tripling the size of the experience sample, relative to Study 2, does notappear to further reduce the description–experience gap.
Table 3. Summary of the decision problems and choice proportions in Study 3
Decisionproblem
Study 3 Study 1
Optionsa Experience (n! 40) Description (n! 110)
Deck H Deck LChoice H(in %)
Predictionb
for H choices DifferencecChoice H(in %)
1 4, 0.8 3, 1 65 Higher "32 (z! 3.64, p! .000) 332 4, 0.2 3, 0.25 78 Lower "6 (z! 0.77, p! .443) 723 #3, 1 #32, 0.1 30 Lower #7 (z! 0.82, p! .415) 374 #3, 1 #4, 0.8 55 Higher "24 (z! 2.66, p! .008) 315 32, 0.1 3, 1 40 Lower #23 (z! 2.55, p! .011) 636 32, 0.025 3, 0.25 38 Lower #9 (z! 1.00, p! .319) 47
aThe deck containing a rare event is underlined. H indicates the deck with the higher expected value, L the one with the lower expectedvalue. For each deck, only the nonzero outcome is presented along with its probability; the other outcome is 0 with the complementaryprobability.bThe entries in this column indicate whether the proportion of participants choosing the H option should be higher or lower in theexperience groups (relative to the description group), assuming that rare events have less impact on decisions from experience than ondecisions from description.cThis column indicates the percentage of H choices in the experience group minus the percentage of H choices in the description group ofStudy 1, along with z-statistics and p-values testing for a difference between these groups (all tests are two tailed).
Copyright # 2008 John Wiley & Sons, Ltd. Journal of Behavioral Decision Making, 21, 493–518 (2008)
DOI: 10.1002/bdm
R. Hau et al. The Description–Experience Gap 503

Using the same procedures as in Study 2, we analyzed people’s estimates of the outcomes’ probabilities inthe sample of 100 draws. The average absolute difference in a total of 286 estimates wasM! 6.6 percentagepoints (SD! 5.2). Again, we observed a slight overestimation of small sample probabilities andunderestimation of large sample probabilities. By comparing the two regression lines in Figure 3a andFigure 3b, one can infer that this pattern of over- and underestimation was less pronounced than in Study 2. Ifone further increased the sample size from 100 to, say, 500 draws, the pattern of over- and underestimationwould likely be even further reduced, and, perhaps, eliminated. Yet, the results in Study 3, relative to those inStudy 2, suggest that such extensive samples will not further diminish the description–experience gap.
THE DESCRIPTION–EXPERIENCE GAP ACROSS STUDIES 1–3
What have we learned about the description–experience gap from these three studies? More experiencereduces the gap but does not make it disappear. Figure 4 corroborates this conclusion. Assuming that the rareevent in a problem favors a deck in which it is included (if the rare event is desirable) or the opposite deck(if the rare event is undesirable), we calculated, collapsing across problems in each study, the averageproportion with which the favored deck was selected in decisions from experience (Studies 1–3) anddecisions from description (Study 1). In Study 1’s decision from description group the option favored by therare event was chosen in 59% of cases, relative to 34, 46, and 44% in experience groups of Studies 1–3. Alldescription–experience gaps are statistically significant.
WHICH MODEL ACCOUNTS BEST FOR DECISIONS FROM EXPERIENCE?
In the final part of the paper, we examine which decision strategies can predict decisions from experience andto what extent models that pay no or less heed to experienced sample probabilities may perform better thanmodels that take explicit advantage of the experienced probabilities. If, for instance, a strategy that uses solelyoutcome information and ignores probabilities altogether proves to be a good model of decisions fromexperience, this could explain why the description–experience gap persists even in light of more sampledexperience. The candidate models can be separated into two categories: associative-learning models andmodels of heuristics. In addition, our model comparison will include the two-stage model of cumulative
Figure 4. The description–experience gap and the median number of draws in the respective experience groups. The barsindicate the average percentage of choices for the option favored by the rare event. Error bars indicate$ one standard error
Copyright # 2008 John Wiley & Sons, Ltd. Journal of Behavioral Decision Making, 21, 493–518 (2008)
DOI: 10.1002/bdm
504 Journal of Behavioral Decision Making

prospect theory as a model for decisions from experience (as suggested by Fox & Hadar, 2006). In whatfollows, we briefly describe the contestants.
Two-stage model of cumulative prospect theoryThe two-stage model assumes that people first form subjective beliefs of the probability of events, and thenenter these beliefs into cumulative prospect theory’s weighting function (Fox & Tversky, 1998; Tversky &Fox, 1995). A descriptive alternative to expected utility theory, cumulative prospect theory was developed asa model of how people make decisions from description (Kahneman&Tversky, 1979; Tversky &Kahneman,1992). Applied to decisions from experience (here, two-outcome gambles), the two-stage model ofcumulative prospect theory (for brevity, we will henceforth refer only to the two-stage model) consists ofthree steps.
Step 1. Assess the sample probability, that is, the relative frequency, pi, of the nonzero outcome in deck j.2
Step 2. Calculate the expected gain (loss) of deck j, Ej,
Ej ! w %pj& n %xj&
where w represents a weighting function for the probabilities experienced in the sample, and n represents avalue function for the experienced outcomes. According to Tversky and Kahneman (1992), the weightingfunction w is:
w%pj& !
pgj
pgj " 1#pj% &g% &1=g; if x ' 0
pdj
pdj" 1#pj% &d! "1=d ; if x < 0
8>>><
>>>:(1&
The g and d are adjustable parameters that fit the shape of the function for gains and losses, respectively. Bothparameters are typically assumed to range between 0 and 1, resulting in an inverse S-shape that overweightssmall probabilities and underweights large ones. The value function n is:
n%xj& !xaj ; if xj ' 0
#l jxjjb# $
; if xj < 0
(
(2&
The a and b are adjustable parameters that fit the curvature for the gain and loss domain, respectively. Finally,the l parameter (l> 1) scales loss aversion.
Step 3. Choose the most attractive deck.
Equations (1) and (2) include five adjustable parameters, but l has no bearing on nonmixed gambles and istherefore irrelevant to our analysis. Following Fox and Hadar (2006), we use the median estimates of Tverskyand Kahneman (1992) to predict choices (a! b! 0.88, g ! 0.61, d! 0.69). These values imply over-weighting of small probabilities, underweighting of large probabilities, and diminishing sensitivity to gainsand losses. One serious objection to using these values in the current context is that they were derived from
2Note that the two-stage model would use people’s estimates of the sample probabilities. Like Fox and Hadar (2006) in their reanalysis ofHertwig et al.’s (2004) data, we used people’s actually experienced sample probabilities instead, thus avoiding the introduction ofadditional noise into the modeling. However, we also conducted the same analysis with people’s estimated probabilities from Studies 2and 3. As a consequence, the predictive performance of the two-stage model decreased in Study 2 (by 7 percentage points) and increased(by 3 percentage points) in Study 3, respectively. Averaged across both studies, the model’s performance was thus better with the actuallyexperienced than with the estimated probabilities.
Copyright # 2008 John Wiley & Sons, Ltd. Journal of Behavioral Decision Making, 21, 493–518 (2008)
DOI: 10.1002/bdm
R. Hau et al. The Description–Experience Gap 505

decisions from description, thus they may not be appropriate for modeling decisions from experience. Toaddress this objection, we also fit the four parameters to Hertwig et al.’s (2004) data thus generating a set ofparameters specific for decisions from experience (for details see below).
Associative-learning modelsOn a very different view, human choice is not conceptualized as a calculated (Bernoullian orNeo-Bernoullian) expected utility, but as a response gauged from experience. This process is modeledwith associative-learning models (see, e.g., Busemeyer & Myung, 1992; Bush & Mosteller, 1955; Estes,1959) according to which favorable experiences boost the propensity of choosing the deck associated withthem; by extension, unfavorable experiences diminish that propensity (e.g., Barron & Erev, 2003; Denrell,2007; Erev & Barron, 2005; March, 1996). We investigate two experiential-learning models, thevalue-updating model and the fractional-adjustment model.
Value-updating model. Hertwig et al. (2006) developed the value-updating model to account for the resultsof Hertwig et al. (2004). It assumes that learners update their estimates of the value of an alternative after eachnew draw from that deck by computing a weighted average of the previously estimated value and the value ofthe most recently experienced outcome. The model consists of two steps:
Step 1. Set your initial expectation about the values Aj(0) of deck j to zero. After the tth draw from that deckupdate the value of that deck according to the following term:
Aj%t& ! 1# vt% & Aj t # 1% & " vt% & xt% & (3&
where Aj(t) represents the value of the deck j after t samples are drawn. The weight accorded to the newoutcome is v! (1/t)w, where w is a recency parameter. If w! 1, all outcomes are equally weighted; if w< 1,more recent outcomes receive more weight, implying a recency effect, and if w> 1, earlier outcomes receivemore weight, implying a primacy effect.3
Step 2. Once sampling is terminated, select the deck with the highest value.
The structure of the model is such that the value, Aj(t), represents a weighted average of (a) the value of thedeck, based on the t#1 previously sampled outcomes, Aj(t#1), and (b) the value of the most recent outcome,xt. The sample sizes are empirically determined, whereas the recency parameter is fitted to the Hertwig et al.(2004) data. The input to the value-updating model is whatever sample size and sample sequence arespondent chose to experience.
Fractional-adjustment model. As a second associative-learning model, we include March’s (1996)fractional-adjustment model that Weber et al. (2004) used to describe the learning process in decisions fromexperience observed in their study. The model consists of two steps.
Step 1. Set the initial propensity pj,0 to choose each deck to 0.5. Increment the propensity of choosing deckj after sampling trial t according to the observation of the payoff, xj, using the following rule:
pj;t !1# 1# a% &xj 1# pj;t#1
! "% &if xj ' 0
pj;t#1 1# a% &xj if xj < 0
(
3Hertwig et al. (2006) assumed that the experienced values are transformed using cumulative prospect theory’s value function (seeEquation 2). Since the predictive performance of the value-updatingmodel proved to be nearly identical with and without these additionalparameters in all our analyses, we removed them from Equation 3.
Copyright # 2008 John Wiley & Sons, Ltd. Journal of Behavioral Decision Making, 21, 493–518 (2008)
DOI: 10.1002/bdm
506 Journal of Behavioral Decision Making

Parameter a is adjustable and controls the degree of learning. It is bound between 0 and 1. If a! 0, then therewill be no learning.
Step 2. Choose the deck with the larger propensity.4
As with the parameters of the previous two models, the learning parameter a will be fitted to the Hertwiget al. (2004) data.
Outcome and dual heuristicsHeuristics can be separated into two classes: those that use solely outcome information and ignoreprobabilities (outcome heuristics), and those that use at least rudimentary probability information (dualheuristics). Outcome heuristics such as maximax and minimax (see Luce & Raiffa, 1957) were originallyproposed as models for decisions under ignorance in which people have no information aboutprobabilities. In decisions from experience, people initially have no probability information, and if searchis terminated early it is only modestly reliable. Therefore, heuristics that use either no probabilityinformation or merely rudimentary probability information may be good candidates for decisions fromexperience.
In our analysis, we include most of the classic heuristics simulated by Thorngate (1980), the lexicographicand the equal-weight heuristics (Dawes, 1979) from Payne, Bettman, and Johnson (1993), and the tallyingheuristic and the priority heuristic (Brandstatter, Hertwig, & Gigerenzer, 2006). The heuristics are describedin Tables 4 and 5, in which their algorithm is explained using the following sampling experience (from two
Table 4. Outcome heuristics applied to decisions from experience
Heuristic Choice policy steps
Equiprobable Step 1: Calculate the arithmetic mean of all experienced outcomes within a deckStep 2: Choose the deck with the higher meanExample choice: Equiprobable chooses B, because B has a higher mean (16) than A (3)
Equal weight Step 1: Calculate the sum of all experienced outcomes within a deckStep 2: Choose the deck with the higher sumExample choice: Equal weight chooses B, because B has a higher sum (32) than A (3)
Minimax Step 1: Choose the deck with largest experienced minimum outcomeExample choice: Minimax chooses A, because B has a lower minimum outcome (0)than A (3)
Maximax Step 1: Choose the deck with the higher experienced maximum outcomeExample choice: Maximax chooses B, because its maximum outcome (32) is higherthan A’s (3)
Better than average Step 1: Calculate the grand average of all experienced outcomes from all decksStep 2: For each deck, count the number of outcomes equal to or above the grandaverageStep 3: Choose the deck with the highest number of such outcomesExample choice: The grand average equals 11.66 (32" 3" 0/3). The better than averageheuristic chooses deck B, because only deck B has one outcome above this threshold
Notes: The prediction for each heuristic refers to the choice between decks A and B, respectively, given a person experienced sequence 3,3, 3, 3, 3, 3, 3, 3, 3, 3 from deck A, and sequence 0, 0, 0, 0, 0, 0, 32, 0, 0, 0 from deck B. Note that the term outcome, as used in the table,does not refer to each single event experienced but to a class of identical events. For instance, the sample from deck B includes theoccurrence of two outcomes, ‘‘0’’ and ‘‘32;’’ the latter occurred once, the former nine times in the sample.
4The original choice rule was stochastic where the person chose the deck with a probability consistent with the propensity. We havemodified this rule to make choice deterministic and consistent with all the other models described here.
Copyright # 2008 John Wiley & Sons, Ltd. Journal of Behavioral Decision Making, 21, 493–518 (2008)
DOI: 10.1002/bdm
R. Hau et al. The Description–Experience Gap 507
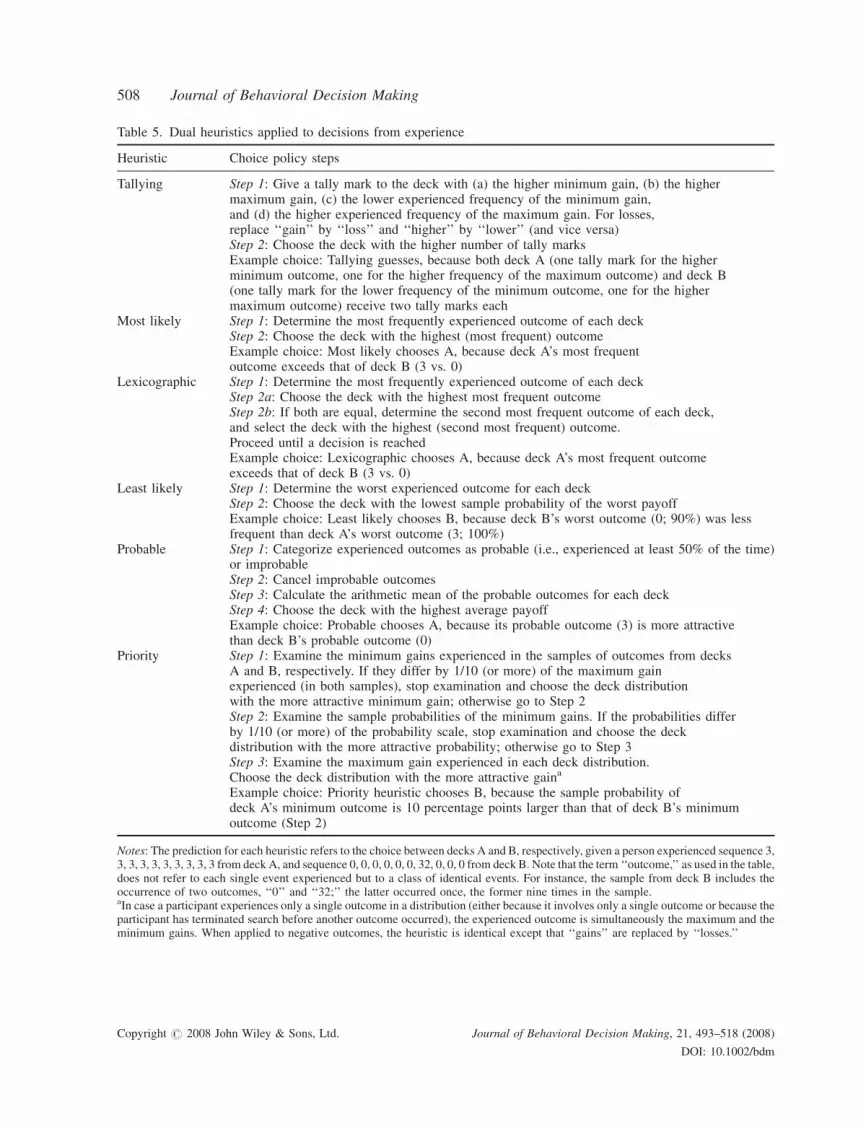
Table 5. Dual heuristics applied to decisions from experience
Heuristic Choice policy steps
Tallying Step 1: Give a tally mark to the deck with (a) the higher minimum gain, (b) the highermaximum gain, (c) the lower experienced frequency of the minimum gain,and (d) the higher experienced frequency of the maximum gain. For losses,replace ‘‘gain’’ by ‘‘loss’’ and ‘‘higher’’ by ‘‘lower’’ (and vice versa)Step 2: Choose the deck with the higher number of tally marksExample choice: Tallying guesses, because both deck A (one tally mark for the higherminimum outcome, one for the higher frequency of the maximum outcome) and deck B(one tally mark for the lower frequency of the minimum outcome, one for the highermaximum outcome) receive two tally marks each
Most likely Step 1: Determine the most frequently experienced outcome of each deckStep 2: Choose the deck with the highest (most frequent) outcomeExample choice: Most likely chooses A, because deck A’s most frequentoutcome exceeds that of deck B (3 vs. 0)
Lexicographic Step 1: Determine the most frequently experienced outcome of each deckStep 2a: Choose the deck with the highest most frequent outcomeStep 2b: If both are equal, determine the second most frequent outcome of each deck,and select the deck with the highest (second most frequent) outcome.Proceed until a decision is reachedExample choice: Lexicographic chooses A, because deck A’s most frequent outcomeexceeds that of deck B (3 vs. 0)
Least likely Step 1: Determine the worst experienced outcome for each deckStep 2: Choose the deck with the lowest sample probability of the worst payoffExample choice: Least likely chooses B, because deck B’s worst outcome (0; 90%) was lessfrequent than deck A’s worst outcome (3; 100%)
Probable Step 1: Categorize experienced outcomes as probable (i.e., experienced at least 50% of the time)or improbableStep 2: Cancel improbable outcomesStep 3: Calculate the arithmetic mean of the probable outcomes for each deckStep 4: Choose the deck with the highest average payoffExample choice: Probable chooses A, because its probable outcome (3) is more attractivethan deck B’s probable outcome (0)
Priority Step 1: Examine the minimum gains experienced in the samples of outcomes from decksA and B, respectively. If they differ by 1/10 (or more) of the maximum gainexperienced (in both samples), stop examination and choose the deck distributionwith the more attractive minimum gain; otherwise go to Step 2Step 2: Examine the sample probabilities of the minimum gains. If the probabilities differby 1/10 (or more) of the probability scale, stop examination and choose the deckdistribution with the more attractive probability; otherwise go to Step 3Step 3: Examine the maximum gain experienced in each deck distribution.Choose the deck distribution with the more attractive gaina
Example choice: Priority heuristic chooses B, because the sample probability ofdeck A’s minimum outcome is 10 percentage points larger than that of deck B’s minimumoutcome (Step 2)
Notes: The prediction for each heuristic refers to the choice between decks A and B, respectively, given a person experienced sequence 3,3, 3, 3, 3, 3, 3, 3, 3, 3 from deck A, and sequence 0, 0, 0, 0, 0, 0, 32, 0, 0, 0 from deck B. Note that the term ‘‘outcome,’’ as used in the table,does not refer to each single event experienced but to a class of identical events. For instance, the sample from deck B includes theoccurrence of two outcomes, ‘‘0’’ and ‘‘32;’’ the latter occurred once, the former nine times in the sample.aIn case a participant experiences only a single outcome in a distribution (either because it involves only a single outcome or because theparticipant has terminated search before another outcome occurred), the experienced outcome is simultaneously the maximum and theminimum gains. When applied to negative outcomes, the heuristic is identical except that ‘‘gains’’ are replaced by ‘‘losses.’’
Copyright # 2008 John Wiley & Sons, Ltd. Journal of Behavioral Decision Making, 21, 493–518 (2008)
DOI: 10.1002/bdm
508 Journal of Behavioral Decision Making

decks, A and B):
Sequence A : 3; 3; 3; 3; 3; 3; 3; 3; 3; 3Sequence B : 0; 0; 0; 0; 0; 0; 32; 0; 0; 0
The decks represent the following lotteries (we chose the sequences so that the frequencies of the outcomesexactly matched their objective probabilities):
A : 3 for sure:B : 10% chance to win 32
90% chance to win 0
In addition, we include a heuristic, the natural-mean heuristic (Hertwig & Pleskac, 2008) that, unlike some ofthe other heuristics, is tailored to the sequentially encountered outcome information unique to decisions fromexperience. This heuristic cannot be applied to decisions from description. The natural-mean heuristic wasoriginally proposed in the context of n-armed bandit problems (Sutton & Barto, 1998) as a simple method forestimating the values of actions (e.g., the play of one of a slot machine’s levers), and for using the estimates tomake action selection decisions.5 According to Sutton and Barto, ‘‘the true value of an action is the meanreward received when the action is selected. One natural way to estimate this is by averaging the rewardsactually received when the action was selected’’ (p. 27). The natural-mean heuristic consists of two steps:
Step 1. Calculate the natural mean of experienced observations in both decks by summing, separately foreach deck, all n experienced outcomes and then dividing by n.Step 2. Choose the deck with the larger natural mean (i.e., the deck that had the best average outcome in thesampling phase).
The natural-mean heuristic has several interesting characteristics. For one the natural-mean heuristicmakes the same outcome or choice predictions as the expected-value calculus applied to sampledprobabilities and outcomes. However, the heuristic arrives at a choice through a different process. Ratherthan keeping track of all outcomes and their respective probabilities, multiplying each by the other andsumming up, the heuristic tots up all experienced rewards (or losses) per deck and then divides this sum by thesample size per deck to yield the ‘‘natural mean.’’ When a person draws samples of equal size—which aboutone-fifth to one-third of people did in Studies 1–3—the heuristic requires merely summing across alloutcomes from a deck. One interpretation of the natural-mean heuristic is that it is a simple andpsychologically feasible (in particular in continuous outcome distributions) instantiation of expected value.Because of the natural-mean’s relation to expected value this also means that at the outcome level theheuristic is mathematically nested within Fox and Tversky’s (1998) two-stage model and Hertwig et al.’s(2006) value-updating model. In fact, if the adjustable parameters within the latter two models are fixedto be 1, then all three models will make identical predictions.
Fitting the models to existing dataSome of the strategies in our analysis are parametric models. In order to avoid the problem of overfitting, weemploy the generalization approach (Busemeyer & Wang, 2000). That is, for each model with adjustableparameters we found the optimal set of parameters for the aggregate choices in the experience group inHertwig et al. (2004), using the number of correct predictions as an optimization criterion. On the basis of theresulting parameter values, we predicted choices in Studies 1–3. A benefit of this generalization method is
5Note that, unlike in n-armed bandit problems, in decisions from experience, as studied here, the outcomes in the sampling stage representhypothetical but not actual rewards. That is, sampling is exogenous (Denrell, 2007).
Copyright # 2008 John Wiley & Sons, Ltd. Journal of Behavioral Decision Making, 21, 493–518 (2008)
DOI: 10.1002/bdm
R. Hau et al. The Description–Experience Gap 509

that in a new data set, it puts models with adjustable parameters on equal footing with models withoutadjustable parameters. Thus, this procedure accounts for both goodness-of-fit as well as model complexity.
To fit the two-stage model and the two associative-learning models, we varied all the adjustableparameters in steps of 0.01 between 0 and 1 and calculated the number of correct ‘‘predictions’’ for eachvalue or combination of values. The set of parameters that produced the maximum number of correct choicepredictions was selected as the parameter estimate.6 Figure 5 displays the performance of the models whenfitted to Hertwig et al.’s (2004) decisions from experience, relative to the performance of the natural-meanheuristic and the two-stage model using the parameters estimated by Tversky and Kahneman (1992). Table 6reports the fitted parameters for all models. As Figure 5 shows, Tversky and Kahneman’s (1992) parametervalues are not well suited to fit Hertwig et al.’s decisions from experience data. By fitting parameters, theperformance can be increased to 82%, relative to 67%. The optimized parameters for the two-stage model, inparticular the weighting function parameters, are very close to unity (Table 6)—an issue to which we returnin the discussion. Moreover, Figure 5 shows that even with optimal parameters, the two-stage model and thevalue-updating model perform only slightly better than the natural-mean heuristic (which is nested withinboth models). Finally, the fractional-adjustment model performs worse than the other fitted models and thenatural-mean heuristic, respectively.
PREDICTING DECISIONS FROM EXPERIENCE
How well do the models predict decisions from experience in Studies 1–3? To find out, we pooled the 732individual choices in these studies, and predicted them based on the individual sampling sequences,separately for the heuristics, the associative-learning models, and the two-stage model. Figure 6 plots thepredictive performance of all candidate strategies.
With 69% correct predictions, the two best-performing strategies were the maximax heuristic and thetwo-stage model with parameters fitted to decisions from experience. Clearly, the top performing models areclose. Comparing all strategies with the performance of the best ones using two-sided z-tests, we found that a
Figure 5. Model performance for Hertwig et al.’s (2004) decisions from experience data. For comparison, the two-stagemodel (TSM) with parameters estimated by Tversky and Kahneman (1992) for decisions from description and the
natural-mean heuristic, are included. Error bars indicate$ one standard error
6Owing to the discrete nature of the criterion ‘‘correct predictions,’’ maxima of optimal parameters are truly flat in the sense that severalparameter values make the exact same number of correct predictions. Therefore, we chose from the optimal values the one that is closestto the mean of all optimal values.
Copyright # 2008 John Wiley & Sons, Ltd. Journal of Behavioral Decision Making, 21, 493–518 (2008)
DOI: 10.1002/bdm
510 Journal of Behavioral Decision Making

total of six strategies did not predict reliably worse than the best two strategies. These are the natural-meanheuristic (68% correct, z! 0.57, p! .57), the lexicographic heuristic (68% correct, z! 0.63, p! .53), thepriority heuristic (67% correct, z! 1.03, p! .30), and the value-updating model (66% correct, z! 1.30,p! .20), the two-stage model (66% correct, z! 1.31, p! .19) with the median parameters of Tversky andKahneman (1992; 66% correct, z! 1.31, p! .19), and the fractional-adjustment model (65% correct,z! 1.70, p! .09).
In light of this ‘‘tight race,’’ what can we learn from such an analysis? First, an outcome heuristic that takesno probabilities into account, the maximax heuristic, appears to be a candidate strategy for decisions fromexperience. In light of a recent extensive analysis of decisions from description this performance isremarkable: in that investigation the maximax heuristic performed dismally (see Brandstatter et al., 2006;Figure 7). Second, the top contenders reliably outperform a number of heuristics, namely, all strategies to theright of the fractional-adjustment model in Figure 6. In contrast, three heuristics, maximax, the lexicographic
Table 6. Optimal parameters fit to the data of Hertwig et al. (2004)
Model Optimal parameters Implication
Two-stage model a! .94, b! .86, g ! .99, d! .93 Diminishing returns for gains and losses,more pronounced for losses; nearlylinear weighting of probabilities
Value-updating model w! .75 Substantial recency effectFractional-adjustment model a! .05 Slow change of choice propensity
Notes: Parameters were varied in steps of .01 to maximize correct choice predictions; where several parameter values performed equallywell, we chose those values that were closest to the mean of all optimal values.
Figure 6. Predictive performance of the models across decisions from experience obtained in Studies 1–3. The models,sorted by performance, are: MAX, maximax; TSM HBWE, two-stage model with parameters fitted to the Hertwig et al.(2004) data; NM, natural mean; LEX, lexicographic; PH, priority heuristic; VUM, value-updating model; TSM T&K,two-stage model with the Tversky and Kahneman (1992) parameter; FRAC, fractional-adjustment model; EQP,equiprobable; TAL, tallying; EQW, equal weight; ML, most likely; PROB, probable; BTA, better than average; LL,least likely; MIN, minimax. The strategies represented by dark gray bars performed significantly (z-test, p<. 05) worsethan the two best strategies. For a description of the heuristics, see Tables 4 and 5. Error bars indicate$ one standard error
Copyright # 2008 John Wiley & Sons, Ltd. Journal of Behavioral Decision Making, 21, 493–518 (2008)
DOI: 10.1002/bdm
R. Hau et al. The Description–Experience Gap 511

heuristic, and the natural-mean heuristic, appear to be promising candidate models. Third, several strategiesachieved very similar performance, yet they did not simply make the same predictions. Take the two mostsuccessful strategies, maximax and the two-stage model with ‘‘experience’’ parameters. Both made theexact same number of correct predictions, but their predictions matched only in about 70% of all cases. Thissuggests that there may be no single ‘‘best’’ model describing all individuals best. Rather, it may be thatpeople who tend to be more risk seeking are better described in terms of the maximax heuristic where thedeck with the best possible outcome, no matter how likely it is, is chosen. Finally, using ‘‘experience’’ ratherthan ‘‘description’’ parameters for the two-stage model appears to boost the model’s predictive performance.Experience parameters imply a linear weighting function for experienced probabilities.
Admittedly, our analysis is only a first step toward a better understanding of decisions from experience.Nevertheless, it identifies a number of tasks ahead such as clarifying the role of ‘‘experienced probabilities,’’and it points to a constructive competition between models embodying quite different policies in this choicedomain.7
HOW TO DESCRIBE AND MODEL PEOPLE’S SEARCH BEHAVIOR
In the model analysis, we focused on how to predict choices from the sampled information once search wasover. Yet, we also made a number of observations about the sampling process that are worth summarizing andthat could inform future analyses. One is symmetry. In Studies 1–3, we found that in 33, 26, and 20% of thetrials, respectively, people sampled the exact same number of draws from both decks. Moreover, the median
Figure 7. Weighting functions for decisions from description and decisions from experience. Theweighting functions forgains (w") and losses (w#), respectively, with the parameters estimated from Hertwig et al.’s (2004) data and Tverskyand Kahneman (1992), respectively. Note that w" is visually indistinguishable from the light gray diagonal that indicates
linear weighting; w# is slightly more S-shaped
7Following Hertwig et al. (2004), we probed for a recency effect by splitting all sample sequences in half and using the natural-meanheuristic to predict choices either from the first half or the last half of the sample. Contrary to previous findings (Hertwig et al., 2004,2006), the difference between the two is negligible (58 vs. 60%, z! .757, ns), indicating at best a very weak effect.
Copyright # 2008 John Wiley & Sons, Ltd. Journal of Behavioral Decision Making, 21, 493–518 (2008)
DOI: 10.1002/bdm
512 Journal of Behavioral Decision Making

deviation from perfect symmetry (in terms of equal-sized samples) was 6, 6, and 10 percentage points for thetrials of Studies 1–3, respectively. Another property of search is the number of transitions between decks. In49, 35, and 44% of trials in Studies 1–3, respectively, respondents chose to switch exactly once between thedecks. They first sampled in one deck; then, they switched to the other, never to return to the first one. Thetendency to do ‘‘first things first,’’ rather than going back and forth, also became manifest in the small numberof actual transitions relative to the maximum number of possible transitions between decks (given samplesize n, the maximum number of transitions is n#1). The median ratio is 0.20, 0.07, and 0.08 in Studies 1–3,respectively. Still another property of search is relative stability. For instance, a person’s tendency to switchversus not-to-switch between decks proved relatively stable, with median correlations (between individuals’transition ratios across problems) of 0.78, 0.62, and 0.72 in Studies 1–3, respectively. Similarly, a person’stendency to sample extensively or to rely on small samples also appears relatively stable, with mediancorrelations of 0.71 and 0.68 in Studies 1 and 2, respectively (in Study 3 all respondents were required tosample 100 times). The latter propensity has been shown by Rakow, Demes, and Newell (in press) to berelated to interindividual differences in working-memory capacity.
GENERAL DISCUSSION
Experience matters. As Barron and Erev (2003), Gottlieb et al. (2007), Hertwig et al. (2004), Newell andRakow (2007), and Weber et al. (2004) observed, decisions from experience and decisions from descriptioncan differ widely. In decisions from experience, small-probability events have less impact on people’s choicesthan in decisions from descriptions. According to Hertwig et al. (2004), there are two reasons for thisbehavior: reliance on small samples and recency. People drew relatively small samples from the outcomedistributions, thus risking underestimating the likelihood of rare events or not even encountering it. Inaddition, in the sequential sampling process, more recent outcomes had more impact on the final evaluation ofthe decks than they deserved (i.e., more than 1/n). In Study 1, we replicated reliance on small samples: Peoplefrequently undersampled the rare event and infrequently chose the deck favored by the rare event (Figure 4).In Studies 2 and 3, we boosted the size of the sample by providing higher stakes and by directing people’ssearch. Now, the deck favored by the rare event was chosen more often than before. Nevertheless, thereremained marked and systematic differences between the description and experience groups. In half of theproblems of Studies 2 and 3, we found differences replicating those observed by Hertwig et al. (2004).
Why did these differences persist? Underestimating the probability of rare events is no longer a likelycause. In the large majority of samples in Studies 2 and 3 (75 and 90%, respectively) participants experiencedthe rare events at least once. In addition, if anything, the sample probabilities of rare events wereoverestimated (Figure 3). Does the remaining description–experience gap result from recency? In fact, couldrecency perhaps even be more pronounced than in Hertwig et al. (2004) due to the substantially largersequences of outcomes in Studies 2 and 3? We found little evidence for recency. (Footnote 7). Using only thesecond half of all samples to predict choices was not superior to using only the first half. Furthermore, thevalue-updating model that explicitly incorporates a recency parameter did not outperform other models thatignore serial position effects. This echoes a finding by Rakow et al. (in press), who found recency effects inonly one of three experience conditions of their experiments, concluding that recency plays only a minor rolein distinguishing between decisions from description and decisions from experience.
What then could explain the remaining description–experience gap? One factor that emerged from ourstudies is the distinct ‘‘treatment’’ of probabilities in decisions from description and experience, respectively.Our analysis of different models indicates that in decisions from experience, probabilities either (a) do notmatter to people’s choices at all (maximax heuristic), (b) are implicitly taken at face value (the natural-meanheuristic tracks the expected value without using an explicit representation of probabilities), or (c) are takenexplicitly at face value (see the two-stage model’s weighting parameters in Table 6). To illustrate the latter
Copyright # 2008 John Wiley & Sons, Ltd. Journal of Behavioral Decision Making, 21, 493–518 (2008)
DOI: 10.1002/bdm
R. Hau et al. The Description–Experience Gap 513

point consider Figure 7. It plots the weighting functions using the optimal parameters for the two-stage modelderived from the data of Hertwig et al. (2004), relative to the weighting function of cumulative prospecttheory using Tversky and Kahneman’s (1992) estimates derived from decisions from description. Theoptimal parameters imply nearly linear treatment of probabilities. In other words, the characteristic pattern ofoverweighting of low-probability events, and underweighting of high-probability events, gauged fromdecisions from description, disappears in decisions from experience.
What does this mean for the ability of the two-stage model, and by extension, cumulative prospect theoryto account for decisions from experience? In our view, the answer depends on what one believes to be theessence of cumulative prospect theory. If one understands its essence to be an algebraic model withparameters adjustable across a wide range, then the theory indeed performs well in predicting decisions fromexperience (Figure 6). Alternatively, one may see the theory’s essence to be an elegant quantitative summaryof well-known and robust behavioral phenomena observed in decisions from description, with parametervalues that imply characteristic and psychologically meaningful forms of the value and probability weightingfunctions. On this view, the overweighting of rare events, implied by the inverse S-shape of the probabilityweighting function, is integral to cumulative prospect theory. In decisions from experience, suchoverweighting does not appear to occur. Consequently, one may conclude that the essence of prospect theorydoes not generalize to decisions from experience. People are doomed to disagree on how to interpretparameterized models such as prospect theory. For the time being, we believe that Hertwig et al.’s (2004) callfor more than one theory of risky choices is not, as Fox and Hadar (2006) argued, premature.
Limitations of the current studiesIn order to be able to compare the current set of results to past ones, we adopted the decision problems and theexperimental methodology used previously. The benefit of comparability is, however, not without costs. Inwhat follows, we discuss the potential limitations of the current studies, and, by extension, pointers to futurestudies.
Limited set of problemsIn our studies, we used the same six decision problems investigated by Fox and Hadar (2006) and Hertwiget al. (2004), which in turn represent a subset of those used by Barron and Erev (2003). Having established—using this small set of problems—that the description–experience gap is not eliminated when people draw onlarge samples, one task ahead is to examine how robust and large the gap is across a wider range of problems,including mixed gambles, gambles with more than two outcomes, and gambles with a wider range ofprobabilities. Indeed, Ert and Erev (2007) and Yechiam and Busemeyer (2006) have already made steps inthis direction, finding a tendency to underweight rare events across other problems; so did Erev, Glozman,and Hertwig (2008). The latter also identified two conditions that are likely to increase the impact of rareevents, namely, when they become increasingly similar to comparison stimuli (constituting the context of achoice) and when they are explicitly presented.
Using a small set of problems renders it tempting to focus on modal choices per problem and on varyingchoice proportions per problem across studies. Because of the multiple sources of variance influencingdecisions from experience, we resisted this temptation, focusing instead on the overall pattern. In decisionsfrom description, there are at least two sources of variance, namely, variability across individuals andvariability within the individual. Both sources of variability are likely to be amplified in decisions fromexperience. The same person may perceive the same decision problem differently, depending on how muchinformation the person sampled. By analogy, different people may perceive the same decision problemdifferently, depending on how much information they sampled. Moreover, the stochastic nature of thesampling process means that choices vary as the same sampling behavior leads to randomly distorted
Copyright # 2008 John Wiley & Sons, Ltd. Journal of Behavioral Decision Making, 21, 493–518 (2008)
DOI: 10.1002/bdm
514 Journal of Behavioral Decision Making

samples. Take, for example, Problem 1 of Hertwig et al. (2004), in which people chose between ‘‘4 with aprobability of .8 versus 3 for sure.’’ In their experience group, participants chose the risky option 88% of thetime, a proportion significantly larger than the 62% observed in Study 1 (Table 1). Across the total of 229draws from the risky-option deck made by all participants in Hertwig et al., the outcome ‘‘4’’ was experienced194 times. That is, in 85% of all draws respondents saw ‘‘4’’—a proportion that is significantly different fromthe objective probability (.8). In contrast, in Study 1, across the total of 189 draws from the same deck, ‘‘4’’was experienced 153 times (81%)—a close approximation of the objective probability. One needs to becareful not to read too much into this random variation in experience and in resulting choices.
Model fitting on the aggregate levelDue to the relatively small number of decision problems, we could not determine individual parameters forthe two-stage model, the value-updating model, and the fractional-adjustment model. Rather, we fitted theirparameters to the aggregate choice data. Admittedly, this is not an ideal way of fitting parameters as theyare typically assumed to capture individual differences in, for instance, speed of learning, or the degreeof overweighting of rare events. Again, this highlights the importance of studying more problems inthe future and, in particular, of letting the same respondent make numerous choices to arrive at reliableindividual-specific parameter estimates. Such a more encompassing set of problems should also includeproblems that, at least in theory, are designed to increase the chances of testing between the modelsconsidered here. In practice, however, the extent to which a specific decision problem yields divergingpredictions depends to some extent on participants’ information search.
Model tests on the choice levelWe tested all 15 models against the observed choices. Some of them, however, are meant to model bothchoice and process. Therefore, they can be tested on those two levels: choice and process. For instance, if aheuristic such as maximax predicts choices well, it may still fail in describing the process, thus falsifying it asa process model. The natural-mean heuristic is an interesting case as on the level of choice it is tantamount tothe expected value calculus. On the level of process, however, the heuristic and the calculus imply differentprocesses. The latter assumes weighting (i.e., multiplication of outcomes with their respective probabilities)and summing. In contrast, the heuristic tots up all experienced rewards (or losses) per deck and divides thissum by the sample size per deck. It requires no explicit representation of the probability, and no weighting.Though this simpler process appears more psychologically plausible (and has been proposed in the context ofn-armed bandit problems; see Sutton & Barto, 1998), let us emphasize that our studies did not test thisprocess. Until future experiments have tested the postulated process (also against the processes assumed byother models), the natural-mean heuristic is a model that predicts choice well, assuming a process that has notbeen tested.
Lab versus online study, and incentivesLet us conclude with one further possible limitation. Respondents in the description group of Study 1completed an online questionnaire, whereas respondents in the experience groups in Studies 1–3 came to thelab; the former respondents also operated under a different payment scheme. These differencesnotwithstanding, our results and conclusions would be the same if we compared choices in the experiencegroups not only to those in the current online description group but also to those in the lab description groupin Hertwig et al. (2004). This is consistent with the conjecture that in description-based choice,performance-contingent payoffs appear not to change choices markedly (e.g., Tversky & Kahneman, 1992;but see Hertwig & Ortmann, 2001) and that findings in lab and online studies of preferential choice using
Copyright # 2008 John Wiley & Sons, Ltd. Journal of Behavioral Decision Making, 21, 493–518 (2008)
DOI: 10.1002/bdm
R. Hau et al. The Description–Experience Gap 515

monetary gambles agree (Birnbaum, 1999). Future studies, however, should explore the impact of financialincentives, for instance, by keeping constant the rate of return across the two types of decisions.
CONCLUSION
Our findings suggest that representation matters. Although different representations of the same statisticalinformation are mathematically equivalent (e.g., frequencies vs. probabilities), psychologically they are not.Experienced and described probabilities can be mathematically equivalent but psychologically they maytrigger different cognitive strategies. In other words, the description–experience gap could be anothermanifestation of the important insight, that information representation shapes how people reason and howmuch risk they are willing to take (e.g., Gigerenzer & Hoffrage, 1995; Gottlieb et al., 2007; Hoffrage,Lindsey, Hertwig, & Gigerenzer, 2000; Tversky & Kahneman, 1981).
ACKNOWLEDGEMENTS
Ralph Hertwig was supported by Swiss National Science Foundation Grant 100013-107741/1 and TimothyPleskac was supported by National Institute of Mental Health Research Service Award (MH019879) awardedto Indiana University.We thank Robin Hogarth, Manuel Klimek, and Jorg Rieskamp for helpful comments onearlier drafts of the manuscript. We are also grateful to Laura Wiles for editing the manuscript.
REFERENCES
Allais, M. (1953). Le comportement de l’homme rationnel devant le risque: Critique des postulats et axiomes de l’ecoleamericaine. Econometrica, 21, 503–546.
Allais, M. (1979). The foundations of a positive theory of choice involving risk and a criticism of the postulates andaxioms of the American school. In M. Allais, & O. Hagen (Eds.), Expected utility hypotheses and the Allais paradox.(pp. 27–145). Dordrecht: Reidel.
Anderson, D. R. (1974). The national flood insurance program—problems and potential. Journal of Risk and Insurance,41, 579–599.
Barron, G., & Erev, I. (2003). Small feedback-based decisions and their limited correspondence to description-baseddecisions. Journal of Behavioral Decision Making, 16, 215–233.
Bernoulli, D. (1954). Exposition of a new theory on the measurement of risk. Econometrica, 22, 23–36. (Translation ofBernoulli, D. [1738]. Specimen Theoriae Novae de Mensura Sortis. Papers of the Imperial Academy of Sciences in St.Petersburg, 5, 175–192.)
Birnbaum, M. H. (1999). Testing critical properties of decision making on the internet. Psychological Science, 10,399–407.
Brandstatter, E., Gigerenzer, G., & Hertwig, R. (2006). The priority heuristic: Making choices without trade-offs.Psychological Review, 113, 409–432.
Busemeyer, J. R., & Myung, I. J. (1992). An adaptive approach to human decision-making learning-theory, deci-sion-theory, and human-performance. Journal of Experimental Psychology. General, 121, 177–194.
Busemeyer, J. R., & Wang, Y. M. (2000). Model comparisons and model selections based on generalization criterionmethodology. Journal of Mathematical Psychology, 44, 171–189.
Bush, R. R., & Mosteller, F. (1955). Stochastic models for learning. New York: Wiley.Dawes, R. M. (1979). The robust beauty of improper linear models in decision making. American Psychologist, 23,
571–582.Denrell, J. (2007). Adaptive learning and risk taking. Psychological Review, 114, 177–187.Edwards, W. (1954). The theory of decision making. Psychological Bulletin, 51, 380–417.Ellsberg, D. (1961). Risk, ambiguity, and the savage axioms. Quarterly Journal of Economics, 75, 643–669.
Copyright # 2008 John Wiley & Sons, Ltd. Journal of Behavioral Decision Making, 21, 493–518 (2008)
DOI: 10.1002/bdm
516 Journal of Behavioral Decision Making

Erev, I., & Barron, G. (2005). On adaptation, maximization, and reinforcement learning among cognitive strategies.Psychological Review, 112, 912–931.
Erev, I., Glozman, I., & Hertwig, R. (2008). What impacts the impact of rare events. Journal of Risk and Uncertainty, 36,153–177. DOI: 10.1007/s11166-008-9035-2
Ert, E., & Erev, I. (2007). Replicated alternatives and the role of confusion, chasing, and regret in decisions fromexperience. Journal of Behavioral Decision Making, 20, 305–322.
Estes, W. K. (1959). The statistical approach to learning. In S. Koch (Ed.), Psychology: A study of a science Vol. 2(380–491). New York: McGraw-Hill.
Fox, C. R., & Hadar, L. (2006). Decisions from experience! sampling errorR prospect theory: Reconsidering Hertwig,Barron, Weber & Erev (2004). Judgment and Decision Making, 1, 159–161.
Fox, C. R., & Tversky, A. (1998). A belief-based account of decision under uncertainty. Management Science, 44, 879.Gigerenzer, G., & Hoffrage, U. (1995). How to improve Bayesian reasoning without instruction: Frequency formats.Psychological Review, 102, 684–704.
Gottlieb, D. A., Weiss, T., & Chapman, G. B. (2007). The format in which uncertainty information is presented affectsdecision biases. Psychlogical Science, 15(3), 240–246.
Hacking, I. (1975). Emergence of probability. Cambridge: Cambridge University Press.Harrison, G. W. (1989). Theory and misbehavior of first-price auctions. American Economic Review, 79, 749–762.Hertwig, R., Barron, G., Weber, E. U., & Erev, I. (2004). Decisions from experience and the effect of rare events in riskychoice. Psychological Science, 15, 534–539.
Hertwig, R., Barron, G., Weber, E. U., & Erev, I. (2006). The role of information sampling in risky choice. In K. Fiedler,& P. Juslin (Eds.), Information sampling and adaptive cognition. (pp. 75–91). New York: Cambridge University Press.
Hertwig, R., &Ortmann, A. (2001). Experimental practices in economics: Amethodological challenge for psychologists?Behavioral and Brain Sciences, 24, 383–451.
Hertwig, R., Pachur, T., & Kurzenhauser, S. (2005). Judgments of risk frequencies: Tests of possible cognitivemechanisms. Journal of Experimental Psychology: Learning, Memory, and Cognition, 31, 621–642.
Hertwig, R., & Pleskac, T. J. (2008). The game of life: How small samples render choice simpler. In N. Chater, M.Oaksford, (Eds.), The probabilistic mind: Prospects for rational models of cognition (pp. 209–236). Oxford, UK:Oxford University Press.
Hoffrage, U., Lindsey, S., Hertwig, R., & Gigerenzer, G. (2000). Communicating statistical information. Science, 290,2261–2262.
Kahneman, D., & Tversky, A. (1979). Prospect theory: An analysis of decision under risk. Econometrica, 47, 263–291.
Klein, G. (1998). Sources of power: How people make decisions. Cambridge, MA: The MIT press.Koehler, J. J. (1996). The base rate fallacy reconsidered: Descriptive, normative, and methodological challenges.Behavioral and Brain Sciences, 19, 1–53.
Kunreuther, H. (2006). Disaster mitigation and insurance: Learning from Katrina. The Annals of the American Academyof Political and Social Science, 604, 208–227.
Luce, R. D., & Raiffa, H. (1957). Games and decisions. New York: Wiley.March, J. G. (1996). Learning to be risk averse. Psychological Review, 103, 309–319.Munich Re Group, Munchener Ruck. (2006). Hurrikane—starker, haufiger, teurer. Munchen: Munchener Ruck.Newell, B. R., & Rakow, T. (2007). The role of experience in decisions from description. Psychonomic Bulletin andReview, 14, 1133–1139.
Payne, J. W., Bettman, J. R., & Johnson, E. J. (1993). The adaptive decision maker. New York: Cambridge UniversityPress.
Rakow, T., Demes, K., & Newell, B. (in press). Biased samples not mode of presentation: Re-examining the apparentunderweighting of rare events in experience-based choice. Organizational Behavior and Human Decision Processes.
Savage, L. J. (1954). The foundations of statistics. New York: John Wiley & Sons.Slovic, P., Fischhoff, B., Lichtenstein, S., Corrigan, B., & Combs, B. (1977). Preference for insuring against probablesmall losses: Insurance implications. Journal of Risk and Insurance, 44, 237–258.
Smith, V. L. (1982). Microeconomic systems as an experimental science. American Economic Review, 72, 923–955.Sutton, R. S., & Barto, A. G. (1998). Reinforcement learning: An introduction. Cambridge; MA: The MIT Press.Thorngate, W. (1980). Efficient decision heuristics. Behavioral Science, 25, 219–225.Trope, Y., & Liberman, N. (2003). Temporal construal. Psychological Review, 110, 403–421.Tversky, A., & Fox, C. R. (1995). Weighing risk and uncertainty. Psychological Review, 102, 269–283.Tversky, A., & Kahneman, D. (1981). The framing of decisions and the psychology of choice. Science, 211, 453–458.Tversky, A., & Kahneman, D. (1992). Advances in prospect theory: Cumulative representation of uncertainty. Journal ofRisk and Uncertainty, 5, 297–323.
Copyright # 2008 John Wiley & Sons, Ltd. Journal of Behavioral Decision Making, 21, 493–518 (2008)
DOI: 10.1002/bdm
R. Hau et al. The Description–Experience Gap 517

vonWinterfeldt, D., & Edwards,W. (1986).Decision analysis and behavioral research. NewYork: Cambridge UniversityPress.
Weber, E. U., Boeckenholt, U., Hilton, D. J., & Wallace, B. (1993). Determinants of diagnostic hypothesis generation:Effects of information, base rates, and experience. Journal of Experimental Psychology: Learning, Memory, andCognition, 19, 1151–1164.
Weber, E. U., Shafir, S., & Blais, A.-R. (2004). Predicting risk sensitivity in humans and lower animals: Risk as varianceor coefficient of variation. Psychological Review, 111, 430–445.
Yechiam, E., Barron, G., & Erev, I. (2005). The role of personal experience in contributing to different patterns ofresponse to rare terrorist attacks. Journal of Conflict Resolution, 49, 430–439.
Yechiam, E., & Busemeyer, J. R. (2006). The effect of foregone payoffs on underweighting small probability events.Journal of Behavioral Decision Making, 19, 1–16.
Authors’ biographies:
Robin Hau is a doctoral student of Cognitive and Decision Sciences in the Department of Psychology at the University ofBasel, Switzerland. His research focuses on experience-based decisions and cognitive modeling.
Timothy J. Pleskac is an Assistant Professor of Applied Cognitive Science in the Department of Psychology at MichiganState University. His research focuses on developing formal cognitive models in the area of cognitive decision theory.
Juergen Kiefer did his Ph.D. as a student of the graduate program ‘‘prometei’’ at the Center of Human–MachineInteraction, TU Berlin, and is now senior researcher and project leader at the usability company, eye square. His interestsfocus on human multitasking, human–computer interaction, usability, and intuitive design.
Ralph Hertwig is Professor of Cognitive and Decision Sciences in the Department of Psychology at the University ofBasel, Switzerland. His research focuses on models of bounded rationality, social intelligence, and methodology of thesocial sciences.
Author’s addresses:
Robin Hau, Department of Psychology, University of Basel, Missionsstrasse 64a, 4051 Basel, Switzerland.
Timothy J. Pleskac, Department of Psychology, Michigan State University, USA.
Juergen Kiefer, Center of Human-Machine-Systems, Technical University, Berlin, Germany.
Ralph Hertwig, Department of Psychology, University of Basel, Switzerland.
Copyright # 2008 John Wiley & Sons, Ltd. Journal of Behavioral Decision Making, 21, 493–518 (2008)
DOI: 10.1002/bdm
518 Journal of Behavioral Decision Making