Embed Size (px)
Citation preview

No. 22 - December 1980
The Dwarf Blue Compact GalaxiesJean Audouze, Michel Dennefeld and Oaniel Kunth,Institut d'Astrophysique du CNRS, Paris
1. Introduction
Among the very different types of galaxies which can beanalysed, the dwarf blue compact galaxies have been firstrecognized as a class by Sargent and Searle (1970: Astrophysical Journal. 162,455). Some important properties let them bepriceless tools to enlighten many basic astrophysical problems, such as the primordial nucleosynthesis and cosmology,the chemical evolution of galaxies and the theories of starformation. These galaxies are generally dwarf irregular objectswith low mass but the bulk of the luminosity is in the blue range.Their spectra look strikingly like those of a giant H 1I region. Thatis why they have been called extragalactic H II region bySargent and Searle. From their emission lines it is ratherstraightforward to derive their He, N, 0, Ne and possibly Sconten!. Some of these abundances, including some of ourown results obtained at La Silla, are summarized in Section 3.
Finally we will show the most important implications ofresults deduced from the study of these galaxies:
(i) Their weak metaliicity can be correlated with their highatomic hydrogen content and their blue luminosity. Theseobjects are especially important for galactic evolution models,because they appear to be much less evolved galaxies thanours and because they also show obvious signs of recentbursts of star formation.
(ii) From the comparison between their helium and theirmetal content we can deduce the primordial abundance inhelium. This is one of the basic parameters to select among themany possible cosmological models describing the earlyphases of the Universe. Moreover and within the canonical BigBang model it could provide some insight on a few characteristics of the physics of elementary particles, such as the numberof different classes of not yet observed leptons.
2. The Morphology of the Blue Compact Galaxies
Two recent kinds of surveys have been performed. One ofspectroscopic nature by Kunth and Sargent (1979: Astronomyand Astrophysics Suppl.. 36,259; 1980: ESO preprint no. 99)and a photographic one by Barbieri et al. (1979: Astronomyand Astrophysics Suppl., 37, 541).
These objects, which do not seem to belong to a specificcategory of the Hubble classification (there are a few ellipticallike galaxies which can be considered as blue compactobjects), are mainly characterized by their relatively small size- the size of the emitting region is only a fraction of a kpc. Theyshow strong emission lines (see e.g. a typical spectrum of Tol116 in Fig. 1) and have quite a faint absolute visual magnitude
TOl116 --[011I)
"'-Ho
HJl
"-[Oll)
/ Hr
j~.~'\ 1;9111) Hel [Sll)
! ~3727 4753 5779 6805
Fig. 1: This is a speelrum of Tololo 116 laken by J. Audouze and M.Oennefeld al La Silla wilh Ihe 105 al Ihe Cassegrain foeus of Ihe 3.6 mleleseope.
1

(Mv ~ - 17). Their colour indices U-B and B-V range respectively between - 0.4 and - 0.75 and 0.4 and 0.0.
The total mass of these objects can be estimated by theclassical (but not very accurate) method of the velocity dispersions. For instance in the case of I Zw 129 and II Zw 70.O'Connell and Kraft (1972: Aslrophysical Journal, 175, 335)found quite low velocity dispersions (25-30 km/s), no evidence for unusual gas motion and deduced masses of theorder of a few 109M0.
These galaxies have been thoroughly analysed in 21 cm(see for instance Balkowski et al. 1978: Aslronomy andAstrophysics. 69, 263). Their gas content compared to theirtotal mass can be as high as 0.22 in the case of I1 Zw 70. Theyreally appear to be among the most gas rich galaxies. A carefulmapping of II Zw 70-71 revealed that these two galaxies forman interacting system. By combining infrared with radio observations Jaffe et al. (1978: Astrophysical Journal. 224, 808)seem to propose that II Zw 40 has a gas/dust ratio similar to thatof our galaxy. This type of conclusion is a bit surprising whenone considers the apparent low metaliicity of these objects.
To summarize, although their optical morphology is fairlyheterogeneous, a large fraction of these galaxies are amongthe lightest, the most irregular and bluest galaxies. Theirirregularity and small mass suggest that they should be aprioriless aHected by dynamical effects, such as spiral structure, andshould accrete very little extragalactic material. We also pointout that up to now there is no clear evidence of an underlyingstellar old population which would have a direct implication onthe nature of these objects (see Section 4.2).
3. The Composition of the Blue Compact Galaxies
The analyses of the composition of these rather unevolvedgalaxies are performed in the same way as those of the H 1Iregions. We have observed such objects ourselves, likeMark 750, CPG 217 and Tololo 116, by using the ESO 3.6 mtelescope on La Silla, equipped with the Boiler and Chivensspectrograph and the Image Dissector Scanner. From the[0111] lines one can deduce the temperature of the emitting gas,which is about 10'K, while the electron density, as deducedfrom the [S 11] lines. amounts to a few hundred electrons cm 3.
The ionized mass is of the order of 106M0.
Since the problem of line transfer is not crucial, the derivationof cosmic abundances from observed intensities is straightforward. The major problem in giving the final abundances is thecorrection made to account for unseen ionization stages.
From various authors one may stress that the metal contentof these objects is strikingly deficient as compared to theStandard Abundances.
In the case of I Zw 18 the O/H deficiency is as high as 37. Theless deficient objects show underabundances by factors ofabout 3. The same trend is observed for Ne, N and Sand alsothe helium content, wh ich make these objects suitable for adiscussion of the primordial helium.
Notice that the abundances of Magellanic type irregulargalaxies (LMC, SMC, NGC, 6822) are within the range ofabundances found for these compact galaxies, although neverso extreme.
4. Astrophysical Implications
The implications of these observations concern:(i) the evolution of these objects. In this respect one would
like to know if they underwent bursts of stellar formation, whenthese bursts occurred and what triggered them.
(ii) the primordial helium content.
2
4.1. Chemical Evolution of the Blue Compacl Galaxies
Because of the high gaseous content and the low metallicities of blue compact galaxies, it is important to analyse theevolution of these objects, wh ich is fairly easily accounted for,theoretically.
As noted by Audouze and Tinsley (1976: Annual Review ofAslronomy and Astrophysics, 14,43), when the gas content isstill high, the so-called Instant Recycling Approximation holds,i. e. one can neglect the lifetime of the stars with respect to theevolution time scale of the system, the relations describing theevolution of the gas density and the metallicity can be solvedalgebraically. In particular, one can define the yield of metalproduction, i. e. the amount of metal produced per unit of masslocked into stars.
In the so-called "simple models" where this approximation ismade, the relation between the metaliicity Z, the gas contentand the yield p is Z = pln (M,ot/Mgas)'
This relation has been weil verified in the case of the sampiestudied by Lequeux et al. (1979: Aslronomy and Aslrophysics.80, 155). With a linear least square fit on their data they find:
Z = (- 0.03 ± 0.16) 10-2 + (3.9 ± 0.10) 1O-31n MIOI
Mga,
which means that the yield in blue compact galaxies is - 10 3This implies that the primordial metaliicity tor these galaxiesmight have been zero and that the value of the yield deducedfrom this relation is therefore quite consistent with the valuesdeduced by Pagel (1978: Monthly Notices of Ihe RoyalAslronomical Society. 183, 18) and Pagel and Patchett (1975:M. N R. A S. 172, 13) for the solar neighbourhood (p = 5± 1 10-3). This yield can only be reproduced in models ofchemical evolution if one takes into account important stellarmass loss effects (Chiosi and Caimmi, 1979: Astronomy andAstrophysics. 80, 234): theoretical models lead to yields ashigh as 1.3 10 2 without mass loss and 2 10 4 to 10 3 withmass losses. The mass loss processes, wh ich might berelated to the blue colour of these objects and to their highionization rates, are necessary to account for their evolution.
One can notice also that there may be a relation between thetotal mass of the galaxies and their metallicity. According toLequeux et al.: Log MTot = 8.18 + 230 Z where MTol isexpressed in solar masses. We believe that this relation is justan indicative trend, the lower limit of 108MO should be considered with much caution.
Finally, the Ne/O ratio is normal, wh ich means that Ne is asprimary as O. By contrast, N/O is about twice as small in thesegalaxies as it is for Orion or the Sun. The scatter of theobserved N/O ralios, however, clearly indicates that N isneither purely primary nor purely secondary; this conclusionwould agree with the findings of Alloin et al. (1979: Aslronomyand Astrophysics, 78, 200) from H II regions observed inspirals.
4.2. Siellar Bursts in B/ue Compact Ga/axies
The blue colour of these objects is due to a presently intenserate of star formation. The concept of burst seems to apply veryweil to this class of galaxies, since their low metallicity indicatesthat the present rate of star formation exceeds much theaverage rate in the past. The basic question (which may be apure semantic one) is to know whether these galaxies areyoung and experience their first burst, or if these objects areold, have already formed stars and are just suffering a newburst.
This question has not yet received convincing answers.Searle and Sargent (1972: Aslrophysical Journal, 173,25), onstatistical grounds, argued that these galaxies must be old.

All meetings will take place at ESO in Garching, unless statedotherwise.
Tentative Time-table of Council Sessionsand Committee Meetings in 1981
However, Lequeux and Viallelond (1981: Astronomy andAstrophysics, in press) have been able to investigate thisproblem in the case of I Zw 18. For this object, they compare theluminosity due to ionizing Lyman continuum photons, the larUV flux around 1700 A, which is mainly due to the B0,85 stars,the blue luminosity and the abundance 01 oxygen. By usingcurrent models 01 chemical evolution 01 galaxies, such as thosewhich describe the evolution 01 their luminosity, they show thatthe luminosity in the Lyman continuum and the luminosity in thelar UV evolve differently with time. The Lyman continuumluminosity depends on more massive stars than the lar UV andthe visible luminosity. From the observed properties 01 I Zw 18they argue that arecent burst of duration 4-61 06 years might beresponsible lor the major part of the observed oxygen. Theywould conclude that I Zw 18, which appears to be formed 01about six debris interacting gravitationally, is just starting itsfirst burst 01 star formation.
May 4May 7-8May 7May 8May 21-22June 4November 10November 11-12November 13Nov. 30-Dec. 1-2December 3-4
Committee 01 CouncilFinance CommitteeScientilic Technical CommitteeUsers CommitteeObserving Programmes CommitteeCouncil, StockholmScientilic Technical CommitteeFinance CommitteeCommittee 01 CouncilObserving Programmes CommitteeCouncil
••
1 kpcI I
Fig. 2: This is a blue pieture of 11 Zw 40 taken at the prime foeus of the 5 m teleseope at Palomar and lent to O. Kunth by W. L. W. Sargent. NorthEast is at the top left corner. The seale shows Ihe distanee in kiloparsec.
3

This conclusion may apply only to I Zw 18 among the knowncompact galaxies. Lequeux and Viallefond would propose thatother galaxies, such as 1I Zw 70-71, wh ich are more complex,rotating, and which have had time to become relaxed systems,are older than I Zw 18.
4.3. The Primordial Helium Abundance
Let us denote by Y the fractional helium abundance bymass. A comparison between the helium and the metal contentimplies that the corresponding galactic enrichments !',.Y and!',.Z are proportional: !',.Y = a.!',.Z with a. "'" 3. Again such a highvalue for a. can only be reproduced in models of chemicalevolution involving important stellar mass loss. Without massloss, the a. coefficient would only be at most 0.5 to 0.1. This canbe easily understood if one recalls that helium can be reproduced by low-mass stars, while in massive stars the metalenrichment increases more than the helium enrichment.
Recent studies have been devoted to the determination ofthe primordial helium abundance by extrapolating Y to Z = O.Lequeux et al. (1979: Astronomy and Astrophysics, 80, 155)and, more recently, Kunth and Sargent (1981: in preparation), on a wider sampie of blue compact galaxies, havediscussed this relation (Y, Z), out of which the "primordial"value seems to converge to about Yp = 0.235 ± 0.010 with thevalue quoted above, and by adopting the canonical' Big Bangtheory to account for the early phases of the Universe, one candeduce an upper limit for the present density of the Universe Q~3-5 10-31 9 cm-2 (see ·e.g. Yang et al. 1979: AstrophysicalJournal, 227, 697).
Therefore, the Universe is expanding for ever (it is open!);the primordial nucleosynthesis is able to account for theobserved abundances of deuterium. Moreover, it provides aquite strict limit on the number of possible different families ofleptons, which should be ~ 3. If the discovery of the tau lepton isconfirmed, one should not find any new type of leptons unlessthe canonical Big Bang models do not apply. From suchconclusions, the observations of the blue compact galaxies areof prime importance in cosmology.
5. Conclusion
Significant progress has been made on this class of quiteunevolved galaxies.
(i) their primordial content of helium now seems to be weilestablished Y = 0.233 and is consistent with an open Universe,a canonical Big Bang model and no unknown type of leptons.
(ii) The helium over metal enrichment is about 3 and seemsto indicate that the stellar mass loss plays an important role infixing this ratio at this value.
(iii) The blue compact galaxies are quite unevolved: onegalaxy, I Zw 18, has an oxygen abundance about 40 timeslower than the solar value. They are weil described by thesimple models with instant recycling approximation. Thismeans that their primordial metaliicity might have been equal tozero. The value of the yield, deduced from the comparison ofthe metaliicity with the gas content, implies that stellar masslosses should operate. Moreover, there is a correlation between the metallicity and the total mass of these galaxies, forwh ich nitrogen appears to be partially secondary.
, In sueh models one assumes that:(i) the early Universe was homogeneous and isotropie,(ii) there was no signilieant amount 01 antimatter,(iii) General Relativily aeeounls weil for lhe gravitational interaetions,(iv) lhe leptons are non degenerated,(v) there were no unknown elementary partieles, and(vi) the early phases of the Universe were dense and hot (T > 10" K)
4
(iv) These objects have very different morphological aspectsalthough they have rather low masses, high intrinsic luminosities, conspicuous hot H II regions and blue colours. Some ofthem are isolated, while a few others, like 1I Zw 70, belong tointeractive systems. One of the most intriguing object is IZw 18,which seems to be made of several interacting debris wh ichhave just experienced a very recent burst of star formation. Thedifferences between some of the blue compact galaxies mightcome from the time when the bursts of star formation occurred.
The advent of forthcoming UV missions, like the spacetelescope or the post IUE projects, will obviously reveal morecharacteristics of these very important galaxies: their actualnature and why their rate of star formation is sudden rather thancontinuous. It would allow better determinations of mass losseffects, and measurements of the composition in carbon. As ithas been seen for I Zw 18, the far UV luminosity provides someinformation on the occurrence of the stellar bursts. Moreover, if(as it is expected in UV projects like Magellan) the 900-11 00 Awavelength is observable, a direct measurement of the deuterium abundance in such unevolved objects would be of utmostinterest for cosmological models.
PERSONNEL MOVEMENTS
STAFF
ARRIVALS
Europe
VÖLK, Elisabeth, D, Secretary, 1.11.1980GUSTAFSSON, Karl, S, Analyst/Programmer, 1.1.1981HESS, Guy, F, Designer/Draughtsman, 1.1.1981POMAROLl, Edouard, F, Electro-mechanician, 1.1.1981
DEPARTURES
Europe
ANDERSSON, Sölve, S, Electronics Technician, 31 12.1980
Chile
VOGT, Nikolaus, D, Astronomer, 30.11.1980
ASSOCIATES
ARRIVALS
Chile
NISSEN, Poul, DK, 1.2-31.7.1981
FELLOWS
ARRIVALS
Europe
BAADE, Dietrich, D, 1.2.1981BENVENUTI, Piera, I, 1.2.1981KRUSZEWSKI, Andrzej, Poland, 1.2.1981
DEPARTURES
Europe
MELNICK, Jorge, Chile. 28.2.1981
COOPERANTSARRIVALS
Chile
ANGEBAULT, Louis, F, Cooperant, 29.10.1980

Physical Studies of Asteroids an Observing Programme at ESOClaes-Ingvar Lagerkvist, Astronomical Observatory, Uppsala
Fig. 1: Photoelectric lightcurve of the asteroid 250 Bettina observedwith the ESO 50 cm telescope on September 10, 1980. The observedVmagnitude is plotted versus universal time. 250 Bettina has a rotationperiod of 5~1.
two minima per rotation cycle (the normal triaxial model thatseems to work quite weil for more than 90 % of the asteroids),thus supposing that the change of brightness depends on theshape of the asteroid rather than on variations of the albedoover the surface, we get for 250 Bettina aperiod of 5?1. Onlyone asteroid, Vesta, has a lightcurve indicating that the changein brightness depends on variations of the albedo over thesurface of the asteroid. Some asteroids have Iightcurvesshowing three maxima and minima per rotation cycle and they
Introduction
The majority of the asteroids are small and tiny bodiesorbiting the sun between Mars and Jupiter. One can estimatethe total number of asteroids with diameters greater than 1 kmto be more than 700,000. Compared to the major planets, thethermal and geological evolution of the asteroids has beenmodest. Observing asteroids gives us thus not only clues to theorigin and evolution of the asteroids, but also to that of theplanetary system.
This article attempts to give a short description of theprogramme "Physical Studies of Asteroids" forwhich the majorpart of the observations is conducted at ESO, La Silla. One partof the programme deals with detailed studies of rather brightasteroids, aiming at a better understanding of rotational properties, shapes, compositional types and other physical parameters essential for studies of asteroids. Correlations betweenrotation period and size, period and compositional type, shapeand size, and properties of family asteroids, are some of theproblems studied with the aid of photoelectric UBV photometry.Another part of the programme deals with the properties of thevery small asteroids, wh ich have sizes of only a few kilometres.How have these been formed? Are they collisional products ordo they more resemble the original planetesimals? What istheir history of evolution? The ESO Schmidt telescope hasbeen used to study these questions.
Studies of Bright Asteroids
Figure 1 presents a lightcurve of the asteroid 250 Bettina,obtained during September 1980 with the ESO 50 cm telescope. If we assume that the lightcurve shows two maxima and
12~IS
IZ~Z5 I-
.. ..... . ... . ... . ...: \
......:..
....:. ......
.-
I o~ 10 10dZO IOd 30
-
-
-
-
ur
V(1. 0) I- ... . -...... ..~ ....• . •m • . .
7.65 • . -•• ••.'
-• •
•• •m • •7.97 -
• •..- • -
• •• • • •
- -• • • •
•• . ••• '. •• •·1· I ·1·00 0.2 04 0.6 0.8 1.0 PHASE
Fig. 2: composite lightcurve of 63 Ausonia observed at ESO during two nights in March 1980. The absolu'e magnitude (V{1,0] = Vobs -510g(r· ] -Om035 . phase angle) is plotted versus phase. The amplitude of 0':'95 is remarkably large for an asteroid with a diameter of nearly 100kilomelres. 63 Ausonia has aperiod of 9!'3.
5

are thus of a somewhat more complicated shape than thenormal triaxial model.
Figure 2 displays a composite lightcurve 01 63 Ausonia,observed in March 1980 with the ESO 50 cm telescope.Ausonia is nearly 100 km in diameter and the lightcurveamplitude, 0~95, is remarkably large for an asteroid 01 this size.No other main-belt asteroid this big has such an irregularshape.
UBV observations of asteroids provide us not only withinformation about the rotation periods and shapes, but givealso information about the composition of the material on theasteroids' surfaces. Most asteroids can be divided into a lewdistinct compositional types from their UBV colours. The mostcommon types are: C (carbonaceous chondrites), 5 (silicaceous) and M (metallic).OI the asteroids greater than 50 km indiameter, 76 % are 01 type C, 16 % 01 type 5, 5 % 01 type M.From the colour indices B-V=0':'70 and U-B=0':'27 we canclassify 250 Bettina to be of a compositional type close to M.Because of the small number 01 M asteroids, only a few havebeen observed so lar, but there are indications that theasteroids of type M have a faster spin than the other asteroids.The reason for this may be that they have a greater density.Another asteroid of this type, also observed at ESO in September 1980, 201 Penelope, has aperiod of about 4 hours.
During lour observing runs at ESO a total of 15 asteroidshave so far been observed long enough to make it possible todetermine their rotation periods. Table 1 summarizes verybriefly some of the results obtained during the first threeobserving runs. During August/September 1980 about 20lightcurves were observed 01 the asteroids 33, 101, 201, 250,386 and 432.
The ESO 50 cm telescope has proved to be very efficient forthis type 01 observations. The accurate setting of the telescopemakes linding charts unnecessary, accurate coordinates takenfrom the yearly volume of the Ephemerides af Minar Planets is
1979 QU2
Table 1. Physical data far same of the abserved asteroids
Asteroid Period Amplitude B-V U-B Type
63 0?3873 0':'95 0~92 0~53 S64 0?365 > 0':'44 0':'74 0':'28 CME85 0·2864 0':'16 0~67 0~30 C95' 0?3620 0~25
133' 0~5293 0~25 0~90 0~51 S135 0~429 0~17 0~70 0~28 CME218' 0·268 0':'22 0':'86 0':'44 S485' 0~7331 0~12 0':'85 0~43 S683' 0~1801 0~12 0':'69 0':'31 C792' 0?382 0':'62 0':'71 0':'21 M
, Observer M. Carlsson
enough for having the asteroid more or less in the diaphragmafter setting the telescope. Since the telescope is computercontrolled, it is possible to observe quite fast; during September 1980 it was thus possible to observe the asteroids 33Polyhymnia, 101 Helena and 386 Siegena more er lesssimultaneously during the same night. 101 Helena seems tohave aperiod close to 24" but the other two rotate faster.
Studies of Small Unnumbered Asteroids
Most of the plate material was collected with the Schmidttelescope at ESO during 5 nights in 1978-1980. Many plates 01the same fjeld in the ecliptic, taken during the same night, makeit possible to obtain photographic lightcurves of a large numberof small unnumbered asteroids. Kodak plates of type 098-04,combined with the Schott lilter GG 495, give a limiting magnitudeolV -18m(exposuretime5-6minutes). The unnumberedasteroids are lound on a plate with long exposure time, thus
1979 QM
Fig. 3: Two out ofsevera/ hundreds ofasteraids found during the work. The asteroid 1979 QM is probab/y an Amorasteroid. The /arge diffuse spotsare just ink dots marking the asteroids' trai/s.
6

making it quite easy to pick out the trails of the asteroids amongthe round images of the stars. This has given for each of theobserved fields almost 150 newly discovered asteroids.Figure 3 is a copy of apart of a plate taken during August 1979.The figure shows the trail of an ordinary main-belt asteroid,1979 aU2, and that of a faster-moving object, probably anAmor asteroid (an asteroid with perihel ion weil inside the orbitof Mars).
Additional plates are taken for positions in order to deriveorbital elements, and thus distances, and, from that, estimatesof the diameters of the asteroids. The positions on some of theplates from 1979 were measured with the ESO Optronicmachine, giving nearly 800 positions of some 140 newlydiscovered asteroids. Since this part of the programme still is ina preliminary phase, it is too early to draw any conclusionsabout the physical nature of the small asteroids.
Mapping th~ Southern Skywith the ESO 1m Schmidt TelescopeH. -E. Schuster, ESO
To any astronomer, professional or amateur, the PalomarObservatory Sky Survey (shortly POSS) is a well-known andusefultool. The whole northern sky is photographed' and printsfrom these photographs are available in the libraries of nearlyall important observatories and astronomical institutes in theworld.
Such a collection of photographs represents a sort of inventory of the universe, at least of the part accessible with ourpresent instrumentation. In a simple way, this photographieinventory serves just to see what we have in the sky. Whatstars, clusters, nebulae, galaxies are there? Later, having donea selection, astronomers may concentrate on single objects orc1asses of objects for a deeper detailed investigation.
It is not necessary to explain here at long the importance andusefulness of the Palomar Sky Survey. In a certain sense it hasbecome a "classic" al ready and has set alandmark and a highlevel in the field of sky mapping. Its only disadvantage, if onemay say so, is the fact that it is limited to the northernhemisphere.
So, since the end of the fifties when the POSS had beenfinished and distributed to the astronomers, there has been thewish and the need to have a similar atlas of the southern sky.
One large obstacle to such an atlas was the fact that therewas no adequate instrument available in the south for makingthe survey.
The instrument best fitted for such a photographie survey is awide-angle camera with the following three important specifications:(1) as already mentioned, it should have a wide field, other
wise it would be necessary take thousands of plates tocover a certain range of the sky, instead of only a fewhundred;
(2) it should be powerful in "Iight-catching", in order to reachfaint objects, or, roughly spoken, it should look into the skyas deep as possible;
(3) and the plate scale should be reasonably large as farextended objects, galaxies for instance, a fair resolutionwould help the user of the survey to try a first morphologicalc1assification of the objects.
The instrument of best choice is then, in consequence, aSchmidt camera.
There have been Schmidt cameras in operation in the southsince long, but of smaller size and not as powerful as thePalomar Schmidt telescope. Once the northern atlas had beencompleted, one wished of course not only just a continuation tothe south but a continuation which would be compatible. Thatmeans: the same field size, or nearly the same, the same
limiting magnitude, or better if possible, and the same scaling inorder to have comparable overlapping fields.
During the seventies, two large Schmidt telescopes cameinto operation; they had exactly the same scale as the PalomarSchmidt (1 mm = - 67 arcseconds) and fulfilled also thespecifications of power and fjeld size. These are the UnitedKingdom Schmidt telescope, based in Australia, and the ESO1m Schmidt telescope on La Silla. 80th telescopes are nowengaged in producing maps of the southern sky similar to thegreat example the Palomar Survey has set.
The laborious task has been distributed in such a way thatboth telescopes are busy with maps of different colours. ESOhas taken the part of producing an atlas in the RED range,which is being realized on the fine grain KODAK IlIa-F emulsionbehind a filter RG 630. In this way, a band-pass is defined from
Second ESO/ESA Workshopon the Use of the Space Telescope and Coordinated
Ground-based Research
ESO, Garehing, 18-19 February 1981
Optical Jets in Galaxies
List of Topics
- Introduction: Jets and other evidence for outflow inactive galaxies
- The ST - important parameters for planning observations
- Imaging observations of optical emission from jets- Spectroscopic evidence for collimated outflow in active
galaxies- The MB7 jet- Centaurus A- aso jet: 3C 273 and other aso jets- Coma A- Radio emission from jets- X-ray emission from jets
Relevant theoretical aspects- Discussion- Concluding remarks
Organizers: F. Macchetto, ESTEC - G. Miley, LeidenM. Tarenghi, ESO.
7

about 6300 to 6900A with the famous H-alpha line included.The exposure time for each plate is 2 hours, which is quite atask for a large-field camera aiming at the ideal condition tohave good images all over the field of 5.5 x 5.5 degrees. TheKODAK IlIa-F emulsion is a fine-grain emulsion, which resultsin high resolution, but the plates have to be pretreated beforebeing used in the camera. This rather complicated and somewhat "tricky" process of sensibilization has to be applied;otherwise the response of the emulsion to light would be verylow.
As a standard, at present, the plates are heated under 65° Cin agas flow of 2 liters per minute, in the following way: for 30minutes in pure nitrogen gas and then another 2 hours in amixture of 96 % nitrogen and 4 % hydrogen. This method isliable to variations depending on the original quality of theemulsion which varies with age and also intrinsically between
factory delivery. So nearly permanent tests are necessary tohave the emulsion under contro!.
The ESO RED atlas is under work at present, and about 5 to6 years will be necessary to complete the 606 fields coveringthe sky from declination -17? 5 down to the southerncelestial pole.
It is a rather time consuming and sometimes difficult work toproduce the necessary 606 master plates which are copiedlater for distribution.
Many parameters have to be obeyed carefully in order to geta good acceptable plate worth to be copied.Sensibilization mayfail, intrinsic emulsion faults, i. e., scratches or holes in theemulsion, unproper development, breakage of the plate, guiding errors during the exposure are only some of the problemswhich may occur and disqualify a plate to be an original forcopying.
Fig. 1: Field No. 209 of the RED atlas is one of the first already distributed fields.
8

In addition, there are what we may call problems put bynature: moontime, clouds and bad seeing, wh ich do not permitus to take atlas plates of high standards and cause delay inproduction.
To get a dozen good plates is nothing worth to be mentioned,but to have 606 plates of equally good quality in a reasonablylimited time is something which can be fully appreciated only bysomebody who has been busy himself in atlas and mappingprojects, even if this may appear a little bit arrogant. And thisrefers only to the production of the master plates; another andcertainly also troublesome task is the copying process, which isdone in Europe - that is to obtain from one good original thenecessary 20 or 50 or 100 equally good copies.
Fortunately, ESO could achieve a lot of valuable experiencein atlas work before starting the above-mentioned RED atlas.
Experience which resulted in improvements of the telescopeand skills and "know-how" concerning plate handling andcopying processes.
ESO had been busy for some years al ready in producing aBLUE atlas of the southern sky. This so-calied Quick BlueSurvey or QBS was completed about one and a half year agoand has been distributed to many observatories in ESOcountries and others.
The same 606 fields are covered as now for the RED atlas;the emulsion of the plates used was KODAK Ila-O behind a filter GG385 giving a band-pass from about 3850 to 5000A; theexposure time was one hour, and a limiting magnitude of 20.5to 21 is reached. We hope to get deeper with the aforementioned RED atlas, possibly to the 22nd magnitude. To get the606 good master plates for the finished BLUE atlas, altogether1039 plates had to be taken, which leads to a ratio of 58 %
Fig. 2: Infrared plate (IV N + RG 715) of the Large Magellanic Cloud.
9

accepted plates to 42 % rejected ones. It is interesting to notethat this ratio is nearly exactly the same as the one of thePalomar group with the northern atlas.
Rejected plates are not completely useless; many of themhave only a scratch or an unaesthetic patch, or a brokencorner - details which do not allow them to be copied, but theyare still useful and stored together with the master plates in theESO files in the Garehing archives.
The ESO Quick Blue Survey is now in full use and a directfollow-up work is also nearly finished. In collaboration withUppsala Observatory, ESO has scanned the 606 southern skyfields, and any object larger than 1 mm (or about67 arcsees) iscompiled in a catalogue, with the coordinates and a preliminarydescription. This catalogue, which contains several thousandobjects, and the sky surveys done in Chile and Australia are thebasis for future photometrie and spectrographic programmeswith the large telescopes now in operation in the south.
As said above, moontime does not permit us to take BLUE or
RED atlas plates, the background would get to high. Thereexists, however, a combination of emulsion and filter whichmakes it possible to work even during full moon and to reach acolour band-pass which has become more and more of interestfor astronomers. Using a KODAK IV-N emulsion with a filterRG715 the so-called near infrared is covered. The IV-Nemulsion needs a careful wet sensibilizatiQn in a solution ofsilvernitrate, and then an immediate drying before use in thetelescope. ESO has in its files in Garehing aselected atlasalong the band of the southern Milky Way. This IR atlas is notmeant for distribution but available for use in Garehing. On theother extreme of the spectrum, the ultraviolet has called moreand more the attention of astronomers. Sporadically, there areinformal talks about an atlas in the UV band. The same talksconcern the possibility to have an atlas of objective prismspectra of the southern sky or at least of certain selected areas.But for the moment and for some time in the future the ESORED atlas is the main task of the La Silla Schmidt.
Simultaneous Optical and Satellite ObservationsProvide New Understanding of a Famous NovaH. Drechsel, J. RaheRemeis-Observatory Bamberg, and NASA-Goddard Space Flight Center, Greenbe/t, MD, USA
A. HolmComputer Seiences Corporation, Si/ver Spring, MD, 20910, USA
J. KrautterLandessternwarte-Königstuh/, Heide/berg
Most stars in our Galaxy appear to be stable and shine withessentially the same intensity over millions of years. Novae(and supernovae), on the other hand, suffer suddenly a gigantic explosion. Their brightness increases in only a day or two bymore than several1 0,000 times, marking them often the brightest objects in the night sky, before they eventually fade in thecourse ofseveral years to theirformer relatively insignificant preoutburst brightness. These stars were called "novae" (whichliterally means "new stars"), long befare it was realized thatthey are not new at all, but existed already as stars long beforetheir outburst. Nova Aquilae (1918) is actually one of the veryfew objects which had been known to exist before it turned intoa "nova".
Until now, more than 150 "normal" novae have been recorded in our Galaxy, and typically one or more can be observed in a year. Although many novae remain undetected, itis estimated that about 25 appear per year in our Galaxy.
In the outburst, a shell is ejected with typical velocities ofabout 2000 km/sec. In many cases, the expansion of thisenvelope could be followed in direct photographs. In the caseof nova V 603 Aquilae (see Fig. 1), the envelope showed aradial velocity of about1 700 km/sec; it expanded by about1" peryear.
11 is now generally accepted that novae are in fact closebinary systems, consisting of a very compact object, wh ich isprobably a white dwarf, and a large, cooler late-type secondarythat fills its Lagrangian lobe. The hydrogen-rich material lost bythe expanding cooler star flows through the inner Lagrangian
10
point towards the white dwarf, forming a fast rotating ring ofmaterial around it.
To obtain a better understanding of a typical old nova,extended optical observations with the ESO 1.5 and 3.6 mtelescopes as weil as ultraviolet measurements with the IUEsatellite were conducted.
Nova Aquilae (1918) was the brightest new star thatappeared in the sky since Tycho's and Kepler's supernovae in1572 and 1604, which reached a maximum brightness of -4m
and -3m, respectively (Clark and Stephenson, 1977). 11 shone
with a visual magnitude of -1 ~1 ,on June 10,1918, and was thebrightest nova discovered since the invention of the telescope.11 is a spectacular example of a "fast" nova that went through avery sharp light maximum and showed a steep brightnessdecrease which was followed by pronounced post-maximumf1uctuations (Payne-Gaposchkin, 1957). The fading nova wassoon found to be surrounded by a small nebula (Barnard, 1919)which expanded at a uniform rate (Mustel and Boyarchuk,1970), and which by now has essentially vanished (Williams,1980).
The binary character of nova V 603 Aquilae was discoveredby Kraft (1964) from an analysis of Palomar coude spectrograms. The radial velocity curve had aperiod of 3h 19~5 and arather small amplitude of v. sin i = 38 km S-1, which indicates alow inclination of the system. Pronounced eclipses of theaccretion disk around the white dwarf by the late main sequence star were therefore not expected.
Although, over the years, light fluctuations were reported bya number of authors, up to now, no photometrie measurements

1926 1930 1933 1940
Fig. 1: Photographs of the expanding envelope around the old nova V 603 Aquilae, taken at Mt. Wilson Observatory (from Mustel and Boyarchuk,1970).
covering time intervals 01 the order 01 the binary period havebeen reported. Now, exactly 62 years after the outburst, onJune 10, 1980, the brightness and spectroscopic behaviour 01nova Aquilae was monitored for eight hours continuously by theIUE satellite. At practically the same time, as weil as earlier andlater, the nova was observed with the ESO 1.52 m and 3.6 mtelescopes.
Photometric measurements were made with the Fine ErrorSensor (FES) onboard the IUE with 5.1 sec integration perobservation. The FES is an unfiltered image dissector tube withan S-20 photocathode. In the track mode, the stellar visualmagnitude can be derived from the FES count rate for theobserved star. These measurements revealed pronouncedperiodic changes in the lightcurve with an amplitude of about0'."3 and aperiod of 3" 18'."3 (Rahe et al., 1980). The magnitudeduring maximum light was about 11 ~7. A statistical flickeringwith a typical time scale of one or a few minutes is alwayssuperimposed on the lightcurve.
In principal, the light variations could be due to orientationeffects. The observed brightness depends on the angle underwhich the radiating surface is seen. Part of the light comes from
a hot area which arises lrom the release of kinetic energy olthematerial transferred from the late star to the accretion diskaround the white dwarf. In addition, light can be reflected andre-radiated from those regions 01 the cool companion which arefacing the accretion disk and are thus considerably heated byits radiation and by the white dwarf.
The viewing angle of these surface areas varies periodicallywith phase and can produce a sinusoidal lightcurve. Such abehaviour was, e. g., observed lor the old novae RR Pic 1925and HR Dei 1967. Another, perhaps even more likely explanation is that during the observed minimum phases, the hot areais partially eclipsed by the late companion or the optically thickmaterial of the disk itself. This, however, implies a higherinclination angle than previously assumed.
Strongly correlated with the visuallightcurve are changes inthe ultraviolet emission line f1uxes 01 C IV (1548,1550 A), Si IV(1393, 1402 A), and He 1I (1640 A) by about a lactor of two(Drechsel et al., 1980). The intensity 01 these lines is highestduring maximum light at about phase 0.5 and lowest nearorbital phase 0.0. The correlation of their intensity with theorbital motion suggests that they originate in close proximity to
so + 0 0 4023 __*_.t-.*"----$-*----4---*------Jl--*-----* _. *_ Jj--*----*--.l----*--------'1 .. ... 1
V 603 AQL
<P=2.0
~
•I.. ,.·At •.,
, t •••
••
t
•
<P= 1.0
~
<P= 0.0
~11.6
• •11.8 t • • •
• • • •••
12.0 • ..
15 16 17 18 19 20 21 22UTJUNE 10, 1980
Fig. 2: lightcurve of V 603 Aql as observed with the Fine error Sensor (FES) of IUE, on June 10, 1980, between 14 and 22" Ur. The field star BD+ 0 0 4023 was used as comparison star. The phases (ep) given cossespond to the orbital period of 3" 18'1'3 of the close binary system. Arrows atbottom indicate the limes of mid-exposure of IUE spectra. These measurements revealed that nova Aquilae is in fact an eclipsing binary.
11

....I
o<t:
5
10
....~
Aill 1855
~ Sill 1892
~"'~.
SWP 9248 ($=0.52) .o
V 603 AQL
NIß] 1750
~
CN 1550
Hell 1640
~
SiN 1400
A
SWP 9250 ($=0.94)
Lya (geocorona)
M....I
oorXX::>-lu.
5
....I
1Il.NI
E(.)
1IlCl~
11l
10
o
1200 1300 1400 1500 1600
WAVELENGTH (Ä)
1700 1800 1900
Fig. 3: Two selected IUE short wavelength spectrograms of V 603 Aql obtained at orbital phase 0.52 and during the eclipse at phase 0.94.Pronounced variations of the strengths of C IV (1550), Si IV (1400) and He 11 (1640) as weil as of N IV] (1486) - but in an opposite sense - areclearly noticeable.
WAVELENGTH (A)
Fig. 4: Optical observations of V 603 Aquilae, obtained in June 1980with the ESO 3.6 m telescope, equipped with the Boiler and ChivensCassegrain spectrograph and lOS. Dispersion 39 Almm, wavelengthregion 4290-5050 A. The four spectrograms shown are typical exampies of the more than 40 spectrograms obtained continuously duringone complete orbital cycle (3hI8~"3)of the c/ose binary. Variations in theline strengths (e.g., Hell at 468604) and profiles (e.g., H-gamma at4340 04) with the orbital phase ep are clearly noticeable.
References
the two stars. Several semi-forbidden lines ean be identified;the most prominent is N IV] (1486 A). Theyoriginate probably ina somewhat extended region of diluted gases, and theirintensity is not affeeted by eclipse effeets. The effeets of masstransfer from the late main sequenee star onto the disksurrounding the white dwarf eomponent should also be notieeable in X-ray observations of this old nova.
More than 40 speetrograms were obtained with the ESO3.6 m teleseope during one eomplete orbital eyele. Similar tothe UV speetra, very pronouneed, short-term ehanges oe·eurred in the emission lines, espeeially of He 11 (4686 A). Theanalysis of these optieal speetra and their eorrelation to the UVmeasurements is in progress, and first results look already verypromising.
Barnard, E. E.: 1919, Astrophysical Journal, 49, 199.Clark, D. H. and Stephenson, F. R.: 1977, "The Historical Super
novae", Pergamon Press, Oxford, New York.Drechsel, H., Rahe, J., Holm, A. and Krautter, J.: 1980,Astronomyand
Astrophysics, submitted for publication.Krafl, R. P.: 1964, Astrophysical Journal, 139,457.Mustel, E. R. and Boyarchuk, A. A.: 1970, Astrophysics and Space
Sciences, 6, 183.Payne-Gaposchkin, C.: 1957, "The Galactic Novae", Norlh-Holland
Pub!. Company, Amsterdam.Rahe, J., Boggess, A., Drechsel, H., Holm, A. V., and Krautter, J.:
1980, Astronomy and Astrophysics. Letters, 88, L9.Williams, R. E.: 1980, private communicalion.
C 1114647 He 114686 H 4861
NII1464011iFeil I ßMg 11 Fe 11 I 4731 JFe 11 4924
Hy 4481 14550 I4340 I /'Y't/"I'.~I~,
1
.p4 \.-. ~,rI' A A '"~ r/J = 091
U ~i,IJfVV'l\J"v".J. W"./' - }j"j'+ I, r"~'"
I"'" !""''\~J A., I1 '~=0.97
./ .. .;J\"',r~ ,. :-";'J\.""~,/oJ\JI"'" ' ." . I .\ .
.... ".\y..< r/J = 0.69
Ci)fZ:::J
>0:«0:f(l)
0:«->f-Cf)
Z~ ,~A h l :,.•·.\
Z lJ/'//'~:·6~3·~~'L"'·
12

ESO COUNCIL DECISIONSAt its last meeting on November 26, 1980, the ESO Council
took a number of decisions; among them we note:
- The approval of the ESO plans to submit a proposal toESA to host the Space Telescope European CoordinatingFacility.
- The approval of the 1981 budget, including 5 million DMfor the installation on La Silla of the Max-Planck-Geselischaft 2.2 m telescope.
- Professor P. Ledoux was elected President of Councilfrom July 1, 1981. Professor J.-F. Denisse will continue asPresident until that time.
Mr. H. Grage was elected Chairman of the Finance Committee for the year 1981.
Professor B. Westerlund was elected Chairman of theObserving Programmes Committee for 1981. ProfessorHunger was Chairman of the OPC in 1980.
Professor P. Lena was reconfirmed as Chairman of theScientific Technical Committee.
- The inauguration of the ESO Headquarters in Garchingwill take place on May 5, 1981.
List of PreprintsPublished at ESO Scientific GroupSeptember- November 1980
118. M. Azzopardi, J. Breysaeher and G. Muralorio: Speetroseopy 01the Small Magellanie Cloud Emission Line Star Hen S 18.Astronomy and Astrophysics, Research Note. Oelober 1980.
119. J. Bergeron, T. Maccacaro and C. Perola: Far UV Sludy on theNon-thermal Activily in lhe Narrow Line Galaxies NGC 4507 andNGC 5506. Astronomy and Astrophysics. Oelober 1980.
120. L. Martinel and P. Magnenat: Invariant Surfaces and OrbitalBehaviour in Dynamical Systems with 3 Degrees 01 Freedom.Astronomy and Astrophysics. Oclober 1980.
121. S. D'Odorico, P. Benvenuti, M. DenneIeid, M. A. Dopita and A.Greve: Astrophysical Inlerpretation 01 lhe n 1200-7300 AEmission Line Speclrum 01 a Filament in lhe Cygnus LoopSupernova Remnanl. Astronomy and Astrophysics, Main Journal. November 1980.
122. M.-H. Ulrich: 3C273: A Review 01 Recenl Resulls. SpaceScience Reviews. November 1980.
123. G. Chincarini, M. Tarenghi and C. Beltis: Observations 01 Galaxies in the Southern Clusler CA0340-538. Astronomy andAstrophysics. November 1980.
124. R. Schoembs and N. Vogt: High-time Resolution Spectroscopy 01VW Hydri and WX Hydri. Astronomy and Astrophysics, MainJournal. November 1980.
125. W. Eichendor!, A. Heck, J. Isserstedt, J. Lub, M. Pakull, B.Reipurth and A. M. van Genderen: On the Nature 01 the 125-dayCepheid V810 Cen (= HR 4511): IUE Spectra. Astronomy andAstrophysics. November 1980.
The Density of the Broad-Line Emission Region in Seyfert 1GalaxiesM. P. Veron and P. Veron, ESO
One of the characteristics of Seyfert 1 nuclei and quasars isthe presence in their spectrum of broad permitted Iines or broadwings to the permitted lines. The forbidden lines show no suchwings. Because broad He I and He Illines appear in the spectraof quasars and Seyfert 1 galaxies, it seems very likely that ionssuch as 0+, 0++ or Ne" actually do exist in the broad-lineregion and that the forbidden lines are suppressed by collisional de-excitation in a region with electron densities Ne > 107
-10+8 cm-3 (Souffrin, 1969, Astronomy and Astrophysics, 1,305; Anderson 1970, Astrophysical Journal, 162, 743). Someclass 1 Seyfert 1 galaxies and low redshift quasars exhibit ananomalously strong Hel A 5876 Aline; this has been believedto show an unusually large helium-to-hydrogen abundanceratio; however, in a high-density nebula, the He I triplet lineintensities are significantly enhanced by electron collisionalexcitation. Theoretical and observational evidence shows thatthe gas which gives rise to the broad He Ilines is characterizedby Ne- 5 x 109 cm -3 and T - 15,000° K with normal abundance(Netzer 1978, Ap. J, 219,822; Feldman and MacAlpine 1978,Ap. J, 221, 486).
On the other hand, the presence of a broad [C 111] A 1909 Aline in the spectrum of almost every QSO where it should beobservable sets an upper density limit Ne :s 10'0 cm 3 (Osterbrock 1970, Ap. J, 160,25); this line has also been observed inthe UV spectrum of the Seyfert 1 galaxy NGC 4151 (Boksenberg et al. 1978, Nature, 275, 404).
It has become customary to assume that the density of thedense region in all quasars and Seyfert 1 nuclei was the same,
in the range 1085 -1095 cm 3. However, both higher and lowervalues have been suggested; in the case of the QSO Q1 011 +25 (= TON 490) which has a redshift z = 1.63, the lines of CIIIat 977 and 1909 Ahave been observed (the first one with theInternational Ultraviolet Explorer) with an intensity ratio of 1.4wh ich corresponds to Ne - 199 cm-3 if Te = 30,000° K andto Ne = 3 x 10'0 cm-3 if Te = 15,000° K (Nussbaumer andSchild 1979, Astronomy and Astrophysics, Letters, 75, L17).
ANNOUNCEMENTof an ESO Conference in Garching
24-27 March 1981
ESO is organizing a conference on
Scientific Importance of High AngularResolution at Infrared and Optical Wavelengths
to be held in the ESO building in Garchingon 24-27 March 1981
The Scientific Organizing Committee: M. H. Ulrich,Chairman - A. Boksenberg - D. Dravins - A. Labeyrie- P
Lena - G. Weigelt.
13

Fig. 1: Speetrum of NGC 1365 obtained with the Boiler and Chivensspeetrograph and the lOS attaehed to the ESO 3.6 m teleseope. Theexposure time was 30 min, the entranee aperture 2 by 4 aresee. Adispersion of 60 Almm was used, whieh gives aresolution of about3.2 A (FWHM). The emission lines shown here are Hß and [0111]At.. 4959, 5007.
Most of the spiral Seyfert 1 galaxies have permitted Fe 11lines in their spectra but the forbidden [Fe 11] lines are usuallynot observed; if they are suppressed by collisional de-excitation, then Ne 2: 107 cm-3 (Phillips 1978, Ap. J Suppt. 38, 187).However, both the forbidden and the permitted Fe Illines havebeen observed in the spectrum of the Seyfert 1 galaxy I Zw 1,which yields to a density Ne - 107 cm-3 (Oke and Lauer 1979,Ap. J, 230, 360).
In the course of a spectroscopic study of the line profile inemission-line galaxies, carried out with the ESO 3.6 m telescope on La Silla, we have found out that, in addition to a broad
NGC 1365
4900 '.5O 5000 WllVe1lnglhlK)5050
Hß component, the spectrum of two Seyfert 1 galaxies(NGC 1365 and NGC 7469) show a broad component underthe forbidden line [0111] A5007 (Fig. 1). In both cases, theintensity of the broad N2 component is about half of that of thebroad Hß component. For the narrow components, we haveI(N2)/I(Hß) = 4 and 6 for NGC 1365 and NGC 7469 respectively. If we made the assumption that the excitation conditionin both the low and high density regions are the same, then, inthe broad line region, the N2 line is collisionally de-excited by afactor of 8 and 12 respectively.
According to the formula given by Seaton (1975, M.N., 170,475), this implies a density of (1-3) x 106 cm 3 for an electrontemperature in the range Te = (1-3) x 104 K. In NGC 7469,the [0111] A4363 narrow line is rather strong, being about atenth of the strength of the narrow component of the [0111]A 5007 line, indicating a rather high temperature in the lowdensity region (Wampler 1971, Ap. J, 164, 1; Anderson 1970,Ap. J, 162, 743); if the temperature is the same in the highdensity region, the broad component of the A4363 line wouldbe as strong as the A5007 line, as, at densities not exceeding3 x 106 cm-3, the auroralline is not significantly suppressed bycollisions.
These observations have shown that the broad emissionline regions of Seyfert 1 galaxies may have densities as low as- 106 cm-3 , much smaller than previously thought.
We plan to try to detect the auroralline of [0111] in these twogalaxies and to observe more bright Seyfert 1 galaxies to findout if such low densities are common in the broad line regions.
Optical and Ultraviolet Spectroscopy of the Nucleiof Seyfert GalaxiesH. Schleicher and H. W. Yorke, Universitäts-Sternwarte, Göttingen
The launching of the International Ultraviolet Explorer (IUE)in 1978 has made the ultraviolet sky in the wavelength regionfrom 1150 A to 3200 A accessible to detailed spectroscopicstudy. The IUE is a satellite in a geosynchronous orbit,equipped with a 45 cm telescope with two spectrographs. For amore detailed description of this satellite, the interested readeris referred to the article by A. Heck et al. (Messenger No. 15,Oec. 1978). Although the diameter of the IUE telescope is quitesmall-its size is more typical of an amateur telescope than of ascientific instrument-it has been used successfully even forextragalaclic spectroscopy.
"rI
m~
~~ ; ~o 0~
~Sl mCi; w....,..,
~
~,. = 0. a=. . . . .
r r u. r .:I:~ u. u. rI I I I I I I I I
394ß 4795 56 0 6 os
Fig. 1: The optieal speetrum of Akn 120, obtained with the lOS. Therelative flux is plotted versus observed wavelength. No eorreetion dueto galaetie extinetion has been applied. The dashed line indieates theeontinuum.
14
Seyfert Nuclei
The nuclei of Seyfert galaxies have become popular subjectsfor research, since it was realized that they resemble asos inseveral respects. Seyfert nuclei have smaller redshifts thanasos; they are much less luminous and are embedded in aclearly visible galactic disko The optical spectrum of a Seyfertnucleus is dominated by very broad emission lines of theBalmer sequence and by the relatively narrow forbidden linesof [0111] (in this article we will restriet ourselves to the case ofSeyfert 1). Several other broad, but weaker, emission linesseen in Seyferts originate from Hel and Fell. Fig. 1 shows theoptical spectrum of Akn 120, wh ich one of us (H. S.) obtainedwith the lOS at the ESO 3.6 m telescope. Note the asymmetrie,bumpy structure of the Balmer lines. The shapes of thepermitted lines can be explained by a model in wh ich the gas isconfined in clouds or filaments surrounding a central compactsource of continuum radiation. These filaments move relativeto each other with high velocities. A bump in the H ßprofile ofAkn 120, e. g. 80 Ashortward of line centre, would be producedby filaments which move towards us (relative to the meanvelocity of all filaments) with a velocity component of 4800 km/soObviously the narrow forbidden lines originate in a differentregion of the nucleus with much smaller internal velocities(:s 600 km/s). Forbidden lines occur only if the electron densityis less than - 107 cm- 3 . The absence of broad wings in the [0111]lines therefore indicates that the electron density exceeds107 cm-3 in the "broad line" filaments.
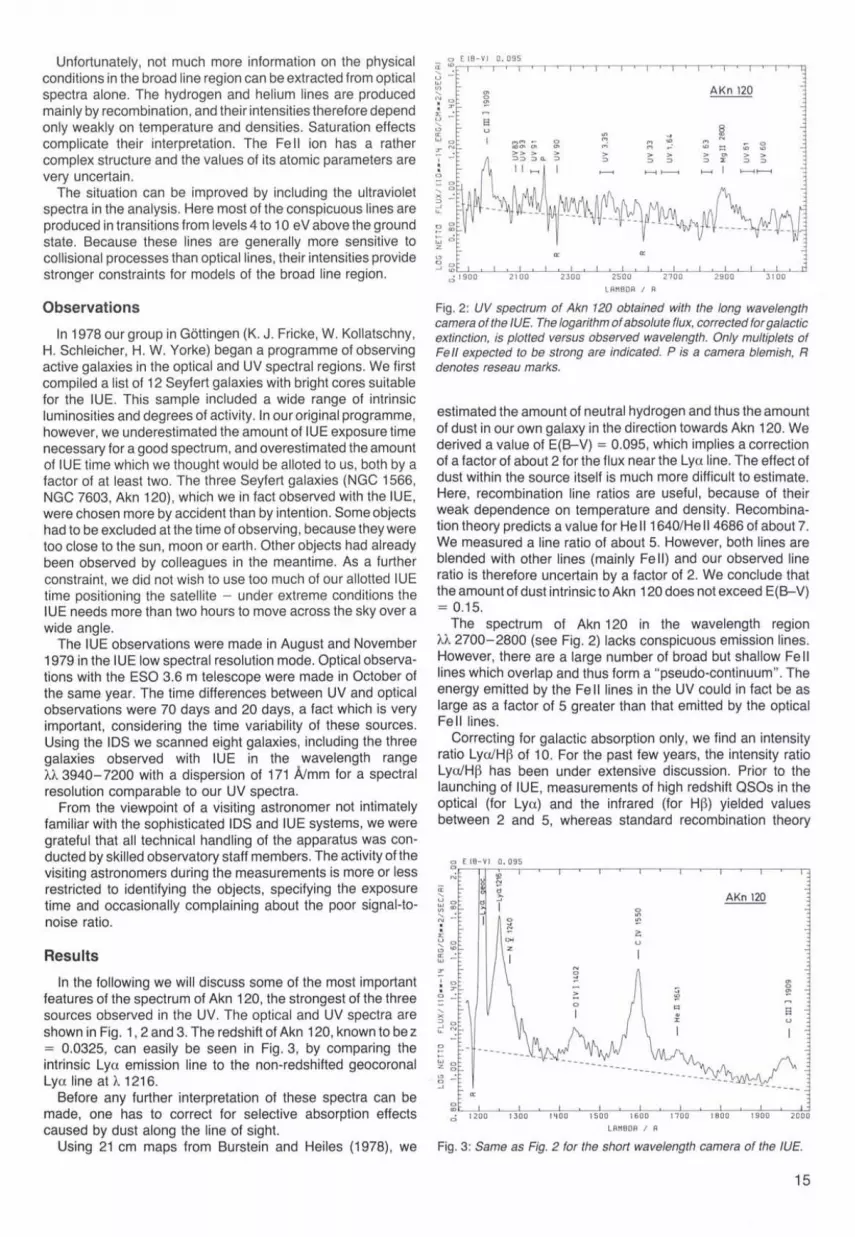
Unfortunately, not much more information on the physicalconditions in the broad line region can be extracted from opticalspectra alone. The hydrogen and helium lines are producedmainly by recombination, and their intensities therefore dependonly weakly on lemperature and densilies. Saturation eHectscomplicate their interpretation. The Fe 11 ion has a rathercomplex structure and the values of its atomic parameters arevery uncertain.
The situation can be improved by including the ultravioletspectra in the analysis. Here most of the conspicuous lines areproduced in transitions from levels 4 to 10 eV above the groundstate. Because these lines are generally more sensitive tocollisional processes than opticallines, their intensities providestronger constraints for models of the broad line region.
~ (IB-V) 0.095
'"00,. '"
..:8u
:;: ~~ a; 0
'"..: » > >:>:> :>0- :>
I I .....
C>o 0
-' :';-;,9~0~0'---'-~2~'o~o'-..I.~2~30"'"0-'------'-':;2~50;;;-0-'----'----'.,2~70;;;-0-'----'L..,2~90!:-::0-'-'--',3:-:'1!:-::OO~
LAMBOA / A
Fig. 3: Same as Fig. 2 tor the short wavelength eamera ot the IUE.
o
"'"'
1500 I 00 1700 I BOO 1900 2000
LAMBOA / A
0 E IB-VI 0.0950
N~
~ d
~~ d f..:
0
" '><~ :i: z::; ..:
N0
-~
....x
~0N
..::=w 0z 0
'" ..:0-'
n:0
'"ci 1200 1300 l l l00
estimated the amount of neutral hydrogen and thus the amountof dust in our own galaxy in the direction towards Akn 120. Wederived a value of E(B-V) = 0.095, which implies a correctionof a factor of about 2 for the flux near the Lya line. The eHect ofdust within the source itself is much more diHicult to estimate.Here, recombination line ratios are useful, because of theirweak dependence on temperature and density. Recombination theory predicts a value for He 11 1640/He 11 4686 of about 7.We measured a line ratio of about 5. However, both lines areblended with other lines (mainly Fe 11) and our observed lineratio is therefore uncertain by a factor of 2. We conclude thatthe amount of dust intrinsic to Akn 120 does not exceed E(B-V)= 0.15.
The spectrum of Akn 120 in the wavelength regionn 2700-2800 (see Fig. 2) lacks conspicuous emission lines.However, there are a large number of broad but shallow Fe I1lines which overlap and thus form a "pseudo-continuum". Theenergy emitted by the Fe 11 lines in the UV could in fact be aslarge as a factor of 5 greater than that emitted by the opticalFeillines.
Correcting for galactic absorption only, we find an intensityratio Lya/Hß of 10. For the past few years, lhe intensity ratioLya/Hß has been under extensive discussion. Prior to thelaunching of IUE, measurements of high redshift asos in theoptical (for Lya) and the infrared (for Hß) yielded valuesbetween 2 and 5, whereas standard recombination theory
Fig. 2: UV speetrum ot Akn 120 obtained with the lang wavelengtheamera ot the IUE. The logarithm otabsolute f1ux, eorreeted torgalaetieextinetion, is plotted versus observed wavelength. Only multiplets otFe 11 expeeted to be strang are indieated. P is a eamera blemish, Rdenotes reseau marks.
Observations
In 1978 our group in Göttingen (K. J. Fricke, W. Kollatschny,H. Schleicher, H. W. Yorke) began a programme of observingactive galaxies in the optical and UV spectral regions. We firstcompiled a list of 12 Seyfert galaxies with bright cores suitablefor the IUE. This sampie included a wide range of intrinsicluminosities and degrees of activity. In our original programme,however, we underestimated the amount of IUE exposure timenecessary for a good spectrum, and overestimated the amountof IUE time which we lhoughl would be alloled 10 us, both by afaclor of at least two. The three Seyfert galaxies (NGC 1566,NGC 7603, Akn 120), which we in fact observed with lhe IUE,were chosen more by accident than by intention. Some objectshad to be excluded at the time of observing, because they weretoo close to the sun, moon or earth. Other objects had alreadybeen observed by colleagues in the meantime. As a furtherconstrainl, we did not wish to use too much of our allotted IUEtime positioning the satellite - under extreme conditions theIUE needs more than two hours to move across the sky over awide angle.
The IUE observations were made in August and November1979 in the IUE low spectral resolution mode. Optical observations with the ESO 3.6 m telescope were made in October ofthe same year. The time diHerences between UV and opticalobservations were 70 days and 20 days, a fact wh ich is veryimportant, considering the time variabilily of these sourees.Using the lOS we scanned eight galaxies, including the threegalaxies observed with IUE in the wavelength rangen 3940- 7200 with a dispersion of 171 Almm for a spectralresolution comparable to our UV spectra.
From the viewpoint of a visiting astronomer not intimatelyfamiliar with the sophisticated lOS and IUE systems, we weregrateful that all technical handling of the apparatus was conducted by skilIed observatory staff members. The activity of thevisiting astronomers during the measurements is more or lessrestricted to identifying the objects, specifying the exposuretime and occasionally complaining about the poor signal-tonoise ratio.
Results
In the following we will discuss some of the most importantfeatures of the spectrum of Akn 120, the strongest of the threesources observed in the UV. The oplical and UV spectra areshown in Fig. 1,2 and 3. The redshift of Akn 120, known to be z= 0.0325, can easily be seen in Fig. 3, by comparing theintrinsic Lya emission line to the non-redshifted geocoronalLya line at A1216.
Before any further interpretation of these spectra can bemade, one has to correct for selective absorption eHectscaused by dust along the line of sight.
Using 21 cm maps from Burstein and Heiles (1978), we
15

10 11 12 13 14 15 16 17 18log (v/Hz)
Fig.4: The overall spectrum of Akn 120, combining observations invarious frequency ranges by severa/ authors during 1968 to 1980. At 5GHz (6 cm), on/y an upper limit of the flux is known.
predicts a value around 40. Even when saturation effects in theBalmer lines and collisional processes are taken into account,the expected line ratio is not changed very much. In order toexplain this discrepancy, Ferland and Netzer (1979: Astrophysical Journal, 228, 274) have included the effects of internaldust in their calculations and obtain a value Lya/Hß = 13 forinternal E(B-V) = 0.15. This model is marginally consistentwith our results. If Akn 120 were to have no internal dust,however, there would still be a discrepancy of at least a factor of3 between observation and theory.
Fortunately, the important line ratios Lya/C IV 1550/He II1640/CIII] 1909 are not affected strongly by internal dust aslong as E(B-V) < 0.15. We have compared our observedvalues with dust-free model calculations by Davidson andNetzer (1979: Reviews of Modern Physics, 51, 715) and obtain
0
-1 radio(6ern)
-2 T>-~ -3~u..
0>-40
-5
-6
IR opt. uvI In
)4",IUElOS
x-ray
a reasonable fit for a certain value of the adjustable parameterU,. U, is equal to the ratio of the density of incident ionizingphotons to the electron density in the broad line filaments.Once a value for U, has been fixed, the temperature andionization stratification within the filament is given. Due to thepresence of the C 111] 1909 line, the electron density should beof the order of 109 cm-a The temperature in the region wherehelium is singly ionized is about 17,000 K. It is possible toestimate the distance of the filaments from the central source ofionizing radiation, if the flux of ionizing photons, the electrondensity and the value for U, are known. Extrapolating theobserved UV continuum to wavelengths shortward of theLyman limit, we estimate the typical distance of the filaments tothe central source to be 1 pc. A more realistic model of thebroad line region should include tens of thousands of filamentseach with a different value for U" depending on its distancefrom the central source. These filaments would cover about10% of the sky as seen from the central continuum source.
Very little is known about the nature of the central sourcewhich provides the energy radiated away directly in the continuum or indirectly in the emission Iines. From the variability ofthe continuum, its size must be smaller than 30 light days,much smaller than the distance to the broad line producingfilaments. Fig. 4 shows the distribution of the continuum over alarge range of the electromagnetic spectrum. The continuumdecreases from the infrared to the soft X-ray region with anoverall spectral index of a = 1 (Fv a V-o). At 6 GHz the objectwas weaker than 30 mJy, indicating a cut-off somewhere in themm or cm wavelength range.
There is a jump of a factor of 2 in the flux between the opticaland ultraviolet. Because the optical and UV measurementswere made only 20 days apart, it is unlikely that such a jumpcan be explained by the source's variability alone. Low-redshiftasos often have a bump in their continuum in the spectralrange where this jump occurs in Akn 120. Simultaneous opticaland UV measurements of Akn 120 are necessary in order toclarify the situation.
NEW FACILITIES AND IMPROVEMENT OF EXISTING INSTRUMENTATION
Fast Photometry - New Facilities at La SillaH. Pedersen, ESO
The standard photometric equipment at La Silla has 1second of time as the shortest integration time. This is fullysufficient for most observing programmes. There are, however,several kinds of phenomena which have timescales of about asecond or shorter. Among the fastest phenomena, one couldmention the optical outbursts of the X-ray bursters (see TheMessenger No. 18,34) or occultations of stars by objects in thesolar system.
The astronomer who intends to do such observations willnormally need to know the absolute time of each singleintegration, at least to an accuracy corresponding to theduration of the integration. Various computer programmes andpieces of hardware have hitherto been accommodated to theneeds of the La Silla observers, but so far, all timing informationhad to rely on calibrations using radio signals, e. g. the WWVtime-signals at 15 kHz.
The availability of an atomic-beam clock on La Silla (TheMessenger No. 16, 11) prompted us to design a new set-up for
16
doing "fast photometry". As soon as the basic principles ofoperations had been defined, Messrs. D. Hofstadt and F.Gutierrez started programming. Within 10 days they hadcompleted a programme of about 2000 lines of assemblercode--without an error. Immediately thereafter, the programme, with its associated hardware, was taken into use bothat the 3.6 m and the Danish 1.5 m telescopes.
The fastest data-taking rate is 1 kHz, but any integer multipleof 1 ms can be used as integration time. The photomultipliersinterchangingly feed two sets of counters, one set being readwhile the other is counting. Thereby, the loss of time betweentwo successive integrations can be kept very short-of theorder of nanoseconds. Each single integration-from up to fourphotomultipliers-is written on magnetic tape for later analysis.An on-line pen recorder shows the signal strength in two of thechannels. The time resolution of the pen recorder can beselected as any integer multiple of the integration time.
The programme is controlled from a Hewlett Packard terminal. From there, the observer selects integration time and

starts/stops the data acquisition. Other commands allowchanges of the time base and scale parameters for the penrecorder. The observer can also request to be informed about
the average of the following N integrations, N being anobserver-defined integer.
After the end of the observations, the magnetic tape orselected parts of it can be replayed on a graphie terminal orplotted on an x-y plotter. This can eventually be done at a lowertime resolution than used for the observations. The off-lineprogramme, together with similar editing, copying and listingprogrammes, have been written by Dr. C. Motch. We intendalso to write a conversion programme that will transform thedata to the FITS format.
So far, the programme has been used with the Behr photometer, the IR photometer and the new general-purpose photometer, all at the 3.6 m telescope and at the Danish 1.5 m withthe Roden photometer, the Strömgren photometer and aDanish double-channel photometer. At the two remainingphotometrie telescopes, the ESO 50 cm and 1 m, the new fastphotometry software cannot be used because of differenthardware configurations. When used with the IR and generalpurpose photometers at the 3.6 m telescope, the diaphragmand filter wheels have to be set in advance. Later on, however,we intend to merge the fast-photometry programme with thenormal photometry programmes, thereby giving the observerfull command over the instrument.
700
200. MILU SECS
DANlSH l. 5 M - E. S. D. LA SlLLA
Sf. fil>lE =2314BI50. " INf =
200
SIll!
BIN
An example of a typical application of the fast-photometry software.The figure shows an optical outburst of the X-ray bursterMXB 1636-53recorded on July 8, 1980. The burst rises in about 2 seconds to nearly 5times its pre-burst average. The observation was made in white light atthe Danish 1.5 m telescope at La Silla.
~
~'50
~
" '00
~~EI
50
-Sky
0a 100 200
Pointing of the 3.6 m TelescopeAndre B. Muller, ESO
Results
Table 1 shows the pointing results of last August 23/24 and24/25 at the prime focus equipped with the triplet adapter; rbeing the distance between the centre of the cross wire and thecalculated pointing position:
r = V( -h-c-oS-Ö-)=-2+-(ß-ö)2
where h is the error in hour angle and ßb the error indeclination for the acquired objecl.
The first li ne contains the rms errors in r, ßh cos band ßÖ.The remaining part of the table shows how many stars inquantity and percentage were acquired within 5, 10, 15 and 20arcseconds. The table shows that the pointing in declination isbetter than in right ascension.
Table 2 gives the results of the pointing test at the Cassegrain focus last August 27/28. It needs no further explanation.Here again the pointing in declination is better than in rightascension.
Table 1
Prime foeus Aug 23/24 + 24/25. 83 objeels.
Ö = 0" ± 3':846 = 86.8%51 = 96.2%53 = 100 %
ö = 0" ± 3:'671 = 85.5%83 = 100%-6" ~~ö~ + 8"
h eos ö = 0" ± 6':441 = 77.4%48 = 90.6%53 = 100 %
h eos ö = 0" ± 6':151 = 61.4%78 = 94.0%82 = 98.8%83 = 100 %
Table 2
Cassegrain foeus Aug 27/28. 53 objeels.
r = 0" ± 6:'530 = 56.6%46 = 86.8%53 = 100 %
r = 0" _ T138 = 45.8%74 = 892%82 = 988%83 = 100 %
n (53)n ~ 5"n ~ 10"n ~ 15"
n (83)n ~ 5"n ~ 10"n ~ 15"n ~ 20"
The pointing of a telescope on a certain celestial object isachieved when the object is acquired in the field of view of thetelescope and on the centre of a cross-wire system or anymarking that indicates the centre of this field. Star acquisitionwith the 3.6 m telescope is computer-controlled. However, thebehaviour of the telescope, mainly concerning f1exures in thetelescope structure, misalignments in the telescope axes andoptics, must be known in detail. To find the different contributions to the total pointing error, a pointing programme wasdeveloped at the Anglo-Australian Observatory by P. Wallacefor the pointing of the Anglo-Australian telescope, and thisprogramme was made available to the author, thanks toDonald Morton, Director of the AAO, and P. Wallace.
The author performed the first pointing tests at the primefocus of the 3.6 m telescope, and the data were reduced at theAAO by P. Wallace, who developed a pointing model for thistelescope. Basically, this pointing model is still in use. For someerrors, which were discovered in the long run, corrections to theexisting ones were added.
Pointing at the Cassegrain focus showed large erratic errors,and it took quite some time to locate the cause. Pointing testsshowed a weakness in the support of the Cassegrain mirror,caused by the collimation device. Transducer measurementsperformed by J. van den Brenk, P. Halleguen and J. van derVen of the TRS (Technical Research Support) group of ESOLa Silla clearly demonstrated this weakness. It was effectivelycured by J. van der Ven, and new tests showed a considerableimprovement in pointing.
The pointing programme was implemented in the telescopecomputer by D. Hofstadt, head of the TRS, and is used forpointing in the prime focus with the Gascoigne corrector and inthe Cassegrain focus with any auxiliary equipmenl.
The programme for the remote control of the triplet adapter inthe prime focus does not yet allow the implementation of thepointing programme. However, for the time being, an HP 41calculator can take care of the pointing with this equipment.
17

Conclusion
For prime focus and Cassegrain focus, acquisition of visibleobjects, as a rule, is better than 10". All stars during the abovementioned tests were acquired within 20", covering a sky area5 hours east to 5 hours west in right ascension and from -850
to +250 in declination.For invisible objects, a visible pointing calibrator and off-set
coordinates for acquisition of the invisible object must be used.The invisible object can then be acquired with an accuracy of± 1.5 arcsec in right ascension and ± 1 arcsec in declination,wh ich is the resolution of the telescope encoders.
For infrared observations, scanning an area of 10 x 10arcsec2 will, as a rule, acquire the object. Scanning an area of20 x 20 arcsec2 may sporadically be necessary.
Off-set may be desirable for very faint objects, where objectacquisition may require a long integration time. It goes withoutargument that off-set coordinates should be calculated in day
time and that the observer knows the coordinates of his objectaccurately for a certain equinox to enable the calculation of theapparent places.
Future Pointing Investigations
A programme for data reductions has been prepared by K.Teschner, programmer of the TRS. This enables the fastcalculation of the telescope coefficients lrom new pointingdata.
A plotting programme to visualize the residual errors is beingprepared, which may guide the decisions on pointing improvements. Recently, J. Lub (ESO astronomer) has joined in thepointing activity at the 3.6 m telescope. The limiting pointingaccuracy is set by the hysteresis effects 01 the telescope, towhich the reaction arms in right ascension and declinationcontribute largely, being respectively, ± 7 and ± 5 arcsec.
The ESO 1 m Schmidt Telescope Equipped with aRaeineWedgeAndre B. Muller, ESO
Since November 1980 a Racine wedge can be used inphotometric programmes with the ESO Schmidt telescope.
Optical Data
The wedge has an aperture of 144 mm, a thickness of10 mm and is made of UBK 7 glass. The effective surface 01 theSchmidt corrector plate, taking into account the vignetting ofthe wedge, the plateholder device and the spider arms, is5745 cm 2
. Therelore, the magnitude difference ~m betweendirect image and wedge image, taking into account 8% lightloss due to the wedge reflection, is 3m96. The magnitude rangecan be enlarged using diaphragms in lront of the wedge.Design and construction of the wedge support were done at LaSilla (J. van der Ven and W. Vanhauwaert).
The wedge was optically tested in Geneva (M. Le Luyer andM. Wensveen). The transmission is
30 % at A = 300 nm50 % at A = 308 nm70% atA = 318 nm90 % at A = 375 nm92 % at A = 700 nm
The 8 % light loss is due to the reflections at the two uncoatedsurfaces. The F/D for the wedge beam is 21.2 producing an airydisk at the best focus of 1.5 arcsec diameter at A = 420 nm.
The wedge causes a delocusing of 1 mm in the local plane 01the Schmidt telescope which, lor F/D = 21.2, gives a spread 0147 microns or 3 arcsec. The image is perfect as was lound Irominterferometric tests.
The relracting angle of the wedge is 60 arcsec resulting in anangular separation between the main beam and the wedgebeam 01 31" or about 0.5 mm on the photographic plate.
Vignetting
The Racine wedge is mounted directly in front 01 the corrector plate in the north-east corner. Mounting or demounting thewedge is a matter of minutes.
Although somewhat better vignetting conditions exist bymounting the wedge in the local plane on lhe plateholder
18
device, this possibility was abandoned lor reasons 01 mechanical stability 01 the plateholder device.
The exposed area of the Schmidt plate is 290 x 290 mm2.
The drawing shows the critical radius R of the unvignetted area
N
E .....-------1'--------1 W
s01 the plate. R = 154.9 mm. This means that lor stars situatedon the circle with this critical radius, the projection of thecorrector plate on the mirror in the direction 01 the incidentparallel beam is tangent to the circumference of the mirror.Stars outside this circle in the lour plate corners are vignettedand cannot be used for photometry without special platecorrections.
The plateholder device and the spider arms obstruct 24.1 %of the incident parallel beam. As the dimension of this obstruction is much smaller than that of the corrector plate, its shadowon the mirror is weil within the projeclion 01 the corrector plateon the mirror. The vignetting due to this obstruction is, there-

fore, eonstant within the plate area with radius Rand has nophotometrie eonsequenees. However, the position of thisobstruetion with respeet to the eorreetor-plate beam is notfixedand moves as a funetion of the angle of ineidenee of this beam.As a eonsequenee, in eertain direetions the plateholder devieeeauses vignetting of the beam passing through the wedge. This
After an interruption of a lew weeks, due to the move from Geneva toGarehing, scientific life soon started again at ESO. The first seminartook place on October 7; Dr. Sidney van den Bergh from the DominionAstrophysical Observatory at Victoria, Canada, was talking about"NGC 5128 and its globular clusters". ~
Despues de una in/errupci6n de algunas semanas, debida al/raslado de Ginebra a Garehing, se ha reanudado la vida cien/ifica enESo. EI primer seminario se celebr6 el 7 de oc/ubre pasado; el doc/orSidney van den Bergh, dei Dominion As/rophysical Observa/ory, enVic/oria, Canada, habl6 sobre "NGC 5128Y sus cumulos globulares ".
The Image Processing System is working again in the new building.EI Sis/ema de Tra/amien/o de Imagenes es/a de nuevo funcionando,
en un edificio nuevo. ....
is unavoidable for large-field eameras. The shadowed area inthe drawing indieates the area of wedge vignetting. Thevignetting starts along the line V and reaehes its largest value atpoint L where it amounts to about Q'?'5. However, about 85 % ofthe plate is undisturbed by it. A detailed report on the wedgevignetting is being prepared and will be available within short.
ALGUNOS RESUMENES
Cartografia dei cielo australcon el telescopio de Schmidt de 1 metro
EI "Palomar Observatory Sky Survey" es un medio auxiliar bienconocido y ütil para los astronomos. Todo el cielo dei hemisferio Norteesta captado en lotografias, cuyas reproducciones se encuentranarchivadas en las bibliotecas de casi todos los observatorios importantes dei mundo.
Tal coleccion de lotografias le permite ver al astronomo que clase deobjetos se hallan en el cielo, y le permite hacer una seleccion de losobjetos que pretende estudiar en detalle.
Dos telescopios se estan dedicando ahora a producir un atlas similardei hemisferio celeste austral. Tratase dei telescopio de Schmidt dei
Reino Unido, instalado en Australia, y dei telescopio de Schmidt de 1metro, instalado en La Silla. La trabajosa tarea se ha repartido de modoque los dos mencionados telescopios estan produciendo mapas deicielo de diferentes colores. ESO esta elaborando un mapa partiendode lotografias tomadas en el rojo. EI tiempo de exposicion para cadaplaca es de 2 horas, y se tardara unos 5 a 6 anos para completar los606 sectores que cubren el cielo desde la declinacion -17".5 hasta elpolo celeste Sur. EI proceso de producci6n de las 606 placas originalesque se necesitan, y que es preciso copiar par su posterior distribuci6n,es una labor bastante dificil y larga. Cualquier rasguno 0 mancha en laemulsion, cualquier lalta en el revelado, una ruptura de placas, erroresde guiado durante la exposici6n, etc., son ejemplos de las dificultadesque pueden presentarse y hacer que una placa sea inservible para lareproduccion.
Una tarea igualmente dificil y lIena de complicaciones es el procesode reproducci6n que se esta realizando enGarching, con la finalidad deobtener, de un buen original, copias de buena calidad y en la cantidad
19

NUEVAS POSIBILIDADES Y PERFECCIONAMIENTO DE LOS INSTRUMENTOS
J. Audouze, M. Dennefeld and D. Kunth: The Dwarf Blue Compact Galaxies 1Tentative Time-table 01 Council Sessions and Committee Meetings in 1981 . . . . . . . . . . . . . 3Personnel Movements . . . . . . . . . . . . . . . . . . . . . . . . . . . . . . . . . . . . . . . . . . . . . . . . . . . . . 4C.-1. Lagerkvist: Physical Studies of Asteroids-an Observing Programme at ESO 5H.-E. Schuster: Mapping the Southern Sky with the ESO 1 m Schmidt Telescope 7Announcement 01 an ESO/ESA Workshop on "Optical Jets in Galaxies" 7H. Drechsel, J. Rahe, A. Holm and J. Krautter: Simullaneous Optical and Satellite
Observations Provide New Understanding of a Famous Nova. . . . . . . . . . . . . . . . . . . .. 10ESO Council Decisions 13List 01 Preprints Published at ESO Scientific Group 13M. P. Veron and P. Veron: The Density 01 the Broad-Line Emission Region in Seylert 1
Galaxies . . . . . . . . . . . . . . . . . . . . . . . . . . . . . . . . . . . . . . . . . . . . . . . . . . . . . . . . . . . .. 13Announcement of an ESO Conference on the "Scientilic Importance of High Angular
Resolution at Inlrared and Optical Wavelengths 13H. Schleicher and H. W. Yorke: Optical and Ultraviolet Spectroscopy of the Nuclei 01 Seyfert
Galaxies . . . . . . . . . . . . . . . . . . . . . . . . . . . . . . . . . . . . . . . . . . . . . . . . . . . . . . . . . . . .. 14H. Pedersen: Fast Photometry- New Facilities at La Silla. . . . . . . . . . . . . . . . . . . . . . . . . .. 16A. B. Muller: Pointing of the 3.6 m Telescope 17A. B. Muller: The ESO 1 m Schmidt Telescope Equipped with a Racine Wedge 18Aigunos Resumenes . . . . . . . . . . . . . . . . . . . . . . . . . . . . . . . . . . . . . . . . . . . . .. 19
20
que se necesite. Alortunadamente, ESO estuvo en condiciones de reunir una valiosa practica en la elaboracion de mapas antes dededicarse al mencionado atlas de lotografiastomadas en luz roja. ESO ya se habia dedicado durante varios arios a la realizacion de unatlas dei cielo austral con imagenes captadasen luz azul.
Este atlas, lIamado "Quick Blue Survey"(QBS), se completo hace aproximadamente
Enfocamiento dei telescopiode 3,6 metros
Por algun tiempo, se presentaron problemas para enfocar con precision el telescopiode 3,6 metros. En los controies realizados porel doctor A. Muller en el foco de Cassegrain, secomprobaron errores considerables, presentandose sin regularidad determinada, causados por una debilidad dei soporte dei espejosegundario, debilidad que se ha podido remediar ahora. Los errores sistematicos procedentes de la estructura mecanica dei telescopio, fueron medidos y neutralizados con ayudade un programa desarrollado por el doctor P.Wallace, dei Anglo-Australian Observatory.Un programa de enfocamiento en el que setienen en consideracion estos errores, ha sidomejorado por D. Holstadt, permitiendo ahoraenlocar el telescopio hacia todo objeto celeslecon una exactitud de aproximadamente 5 segundos de arco, exactitud que se considerarasatislactoria por la mayoria de los astronomos,exceptuando acaso a los que se dediquen aobservaciones en ondas de infrarrojo.
Fotometria rapidaen La Silla
Los seriores D. Hofstadt y F. Gutierrez, deESO en La Silla, han desarrollado un nuevoprograma de computador para la fotometriarapida. Este programa ya se esta aplicando,con su correspondiente equipo de aparatos
Contents
ario y medio, y ya se ha distribuido a muchosobservatorios de paises miembros de ESO, yde otros paises.
Con un contenido de muchos miles de objetos, este catalogo y las lotografias de la esleraceleste que se estan tomando en Chile y enAustralia son el fundamento para luturos programas de lotometria y espectrografia a quese dedicaran los grandes telescopios actualmente instalados en el hemislerio Sur.
auxiliares, en el telescopio de ESO de 3,6metros y en el telescopio danes de 1,5 metros.La nueva instalacion resultara en particularventajosa para la observacion de lenomenosque se producen en Iracciones de tiempo deun segundo 0 menos, como, por ejemplo,erupciones opticas de fuentes de rayos X, uocultaciones de astros por objetos dei sistemasolar.
EI telescopio de Schmidtde 1 metro, equipadocon un prisma de Racine
Uno de los mas dificiles problemas a resolver por los observadores es la determinacionexacta de la magnitud de estrellas debiles.Entre las soluciones que se olrecen pararesolverlo, esta el uso dei prisma de Racineque, instalado enfrente de la lente de correccion dei telescopio de Schmidt, produce decada estrella una imagen secundaria, en 4magnitudes mas debil que la imagen principal.Comparando la imagen principal de estrellasdebiles, por una parte, con la imagen secundaria de estrellas mas brillantes y de magnitudconocida, por otra parte, se ha encontrado unaposibilidad para ampliar la serie de estrellas dereferencia, en un grado de 4 magnitudes. Nocabe duda de que muchos de los observadores que se ven en la necesidad de determinarla magnitud de estrellas debiles en las placasde Schmidt, se serviran de este complemento,disponible desde el mes de noviembre pasado.


