Embed Size (px)
Citation preview
The Effect of Demand on Stock Prices: Evidence from
the S&P Index Float Adjustment
Ernest N. Biktimirov
Faculty of Business
Brock University
St. Catharines, Ontario, L2S 3A1
Canada
905.688.5550 x 3843
Abstract
I examine the effect of demand on stock prices by analyzing the transition of the S&P
500 index from market capitalization to free float weighting, which occurred in 2005. I find that
a decrease in demand produced a permanent stock price decline, which was accompanied by
significant abnormal trading volume. The results provide support for the downward-sloping
demand curve hypothesis.
Keywords: stock prices, trading volume, event study, stock indexing, mutual funds.
JEL Classification: G12, G14
The Effect of Demand on Stock Prices: Evidence from
the S&P Float Adjustment
Abstract
I examine the effect of demand on stock prices by analyzing the transition of the S&P
500 index from market capitalization to free float weighting, which occurred in 2005. I find that
a decrease in demand produced a permanent stock price decline, which was accompanied by
significant abnormal trading volume. The results provide support for the downward-sloping
demand curve hypothesis.
Keywords: stock prices, trading volume, event study, stock indexing, mutual funds.
JEL Classification: G12, G14
1. Introduction
Do demand curves for stocks slope downward? Different events have been examined to
address this question, but presented evidence is contradictory. It remains one of the unsolved
mysteries of finance. One of the main problems of the examined events is their inability to
separate competing explanations for the observed stock price behavior. Specifically, researchers
frequently used additions to the S&P 500 index to analyze the demand curves for stocks. The
effect of increased demand by index fund, however, cannot be disentangled from the information
effect of inclusion in the S&P 500 index. To address this challenge, I examine an event that
affected the demand for stocks by index funds, but, at the same time, was not associated with any
information effects. This event is the transition of the S&P 500 index from market capitalization
to free float weighting, which occurred in 2005. As a result of this transition, the weights of 98
3
stocks decreased in the S&P 500 index. These stocks experienced a decline in demand by index
funds that had to sell the stocks to reflect their new, decreased weights.
This transition did not involve information effects for three reasons. First, the event was
not associated with addition to, or deletion from, an index, thus eliminating a certification effect.
Second, the event had been long known in advance, given that the Standard and Poor’s
announced its plan to bring the S&P 500 index to full float adjustment a year earlier, in March
2004. Third, six months in advance investors knew the float factors of all companies in the S&P
500 index and therefore, they were able to calculate ahead of time the expected selling volume
by index funds.
This paper contributes to the literature by examining a unique information-free event.
The decrease in demand that is not associated with any information effects makes this event a
natural laboratory for differentiating among competing hypotheses. I find that a decrease in
demand caused by the transition of the S&P 500 index from market capitalization to free float
weighting produces a stock price decline, which is accompanied by significant abnormal trading
volume. Examination of the stock price behavior after the transition shows that this stock price
decrease is permanent, which supports the downward-sloping demand curve hypothesis.
2. Previous research
Various studies have examined different events to investigate the relation between the
demand for stocks and their prices. Kraus and Stoll (1972) and Dann, Mayers, and Raab (1977)
find a significant price decline associated with large block trades. Scholes (1972) and Mikkelson
and Partch (1985) present similar results by analyzing secondary offerings. If demand curves for
stocks are flat, stock prices should not decline because of increased supply. Therefore, the results
4
of these studies seem to support the downward-sloping demand curve hypothesis. However,
given that large block sales and secondary offerings may convey negative information about a
firm’s future prospects, the evidence presented by these studies cannot be used to disentangle the
downward-sloping demand curve from information hypotheses.
A significant body of research examines market reactions of stocks added to or removed
from popular indexes. Biktimirov, Cowan and Jordan (2004) find transitory changes in price and
trading volume for stocks added to or deleted from the Russell 2000 index. Chung and
Kryzanowski (1997, 1998) and Masse, Hanrahan, Kushner, and Martinello (2000) show a
significant price increase associated with additions to the TSE 300 index. Though Beneish and
Gardner (1995) do not observe a price change for additions to the Dow Jones Industrial Average,
they find a significant price decline for deletions from the index.
The majority of index effect studies focus on the S&P 500 index effect. Such studies
include those by Shleifer (1986), Harris and Gurel (1986), Jain (1987), Dhillon and Johnson
(1991), Beneish and Whaley (1996, 1997, 2002), Lynch and Mendenhall (1997), Erwin and
Miller (1998), and Denis, McConnell, Ovtchinnikov, and Yu (2003), which show significant
positive stock price reactions to the announcement of new additions to the S&P 500 index.
To explain stock price behavior around index changes, the researchers have offered
several hypotheses that differ not only in reasons for abnormal returns, but also in duration. The
price pressure hypothesis is the only explanation that predicts a transitory change in the price of
new additions. According to this hypothesis, buying pressure causes stock prices to increase,
which encourages passive traders to sell their shares. The following stock price declines permit
the traders to reinstate their holdings at a profit. Harris and Gurel (1986) present evidence
5
consistent with the price pressure hypothesis by finding a full price reversal for securities added
to the S&P 500 index.
In contrast, the downward-sloping demand curve (or imperfect substitutes) hypothesis
predicts that price changes are permanent because the long-run demand for stocks slopes
downward. Increased demand from index funds causes stock prices to rise, while large block
sales trigger stock price declines. Shleifer (1986) finds a permanent price increase for new
additions to the S&P 500 index, which supports the downward-sloping demand curve hypothesis.
One potential problem with the S&P 500 index effect studies is that under the
information-signaling hypothesis (e.g., Jain, 1987) the addition of a stock to the index sends
favorable news about the future prospects of a firm. The presence of possible news in the
announcement of changes to the index makes it difficult to discriminate among competing
hypotheses.
At least three papers examine new events that are free of information content. Kaul,
Mehrotra, and Morck (2000) analyze the effect of a preannounced increase in the weights for 31
stocks in the TSE 300 index in 1996. They use the downward-sloping demand curve hypothesis
to explain significant permanent 2.3% abnormal returns for affected stocks.
Biktimirov (2004) examines the effect of demand on stock prices by analyzing the
conversion of the TIPs 35 and TIPs 100 exchange-traded funds into the i60 Fund, which
occurred at the Toronto Stock Exchange on March 6, 2000. Similar to Kaul, Mehrotra, and
Morck (2000), Biktimirov present evidence consistent with for the downward-sloping demand
curve hypothesis.
In contrast, Cha and Lee (2001) find support for the horizontal demand curve by
examining equity mutual fund flows.

6
Thus, researchers still find conflicting evidence on the slope of the demand curve for
stocks. Therefore, further research that examines new events and samples is needed. This paper
expands previous research by studying a unique information-free event. Relative to the cases of
TSE weight adjustments analyzed by Kaul, Mehrotra, and Morck (2000) and exchange-traded
funds conversion analyzed by Biktimirov (2004), in which all stocks had the same event day, the
S&P 500 float adjustment examined in this study has two event days. Also, my sample size is 46
stocks, versus 31 in Kaul, Mehrotra, and Morck (2000) and 28 stocks in Biktimirov (2004).
3. The event and data
To provide a better representation of the investable securities in the investment universe,
Standard and Poor’s brought its one of the world’s most recognizable indexes, the S&P 500, to
free float in 2005. Originally, the S&P 500 used market capitalization weighting where the
number of shares outstanding multiplied by a stock’s price determines a company’s weight in the
index. Float adjustment advances the market-cap weighting by only counting shares that are
available for purchase on open markets rather than the total shares outstanding.
The Standard and Poor’s free float adjustment was not new among managers of stock
indexes. For example, Morgan Stanley Capital International Inc. (MSCI) made a similar change
to all of its equity indexes in 2002.
The adjustment was accomplished in two steps: the half-float adjustment and the full-
float adjustment. The half-float adjustment, which took all affected stocks to 50 percent of their
free-float, took place on March 18, 2005. The full-float adjustment, which brought all stocks to
their full-float weights, occurred six months later, on September 16, 2005.

7
As a result of the free-float adjustment, 98 stocks in the S&P 500 index had their weights
decreased. The affected stocks had float factors decreases of different magnitude, ranging from
the minimum decrease to 0.9 for T.R. Price Group to the maximum decrease to 0.48 for Brown-
Forman Corporation. The effect of free-float adjustment is expected to be more pronounced for
companies that experienced large weight declines. After removing News Corporation that was
added to the S&P 500 index in December 2004, the final sample includes 46 stocks had their
float factor decreased to, at least, 0.80.
4. Analyses
4.1. Abnormal return
To examine whether the float adjustment causes abnormal returns for the sample
stocks, I use the Fama-French (1993) three-factor model:
Rjt - Rft = αt + βt (Rmt - Rft) + stSMBt + htHMLt + εjt. (1)
For day t, Rjt is the rate of return of the jth stock, Rft is the one-month Treasury bill rate, and Rmt
is the Center for Research in Security Prices (CRSP) value-weighted return on all NYSE,
AMEX, and Nasdaq stocks. The Fama-French (1993) market-wide factors SMB (small minus
big) and HML (high minus low) are constructed using six value-weighted stock portfolios
formed on size and book-to-market, respectively. SMB is the average return on the three small-
stock portfolios minus the average return on the three big-stock portfolios. HML is the average
return on the two value-stock portfolios minus the average return on the two growth-stock
portfolios. The estimate of the intercept αt represents the average abnormal return for day t.
Because I have only two event days, I use the “crude dependence” adjustment described
by Brown and Warner (1980) to correct for a possible event clustering problem. In addition to a
8
parametric t-test, I also calculate two nonparametric statistics, a sign test suggested by Corrado
and Zivney (1992) and Cowan (1992), and a rank test described by Corrado (1989).
Nonparametric tests do not require a symmetrical distribution of security abnormal returns for
correct specification. I estimate the parameters of the Fama-French (1993) three-factor model
over a period that runs for 250 trading days, from 280 to 31 days before March 16, 2005. As
robustness checks, I also used one-factor market model, market adjusted model, and a post-event
estimation period. These returns are similar to those obtained with the pre-event estimation
period.
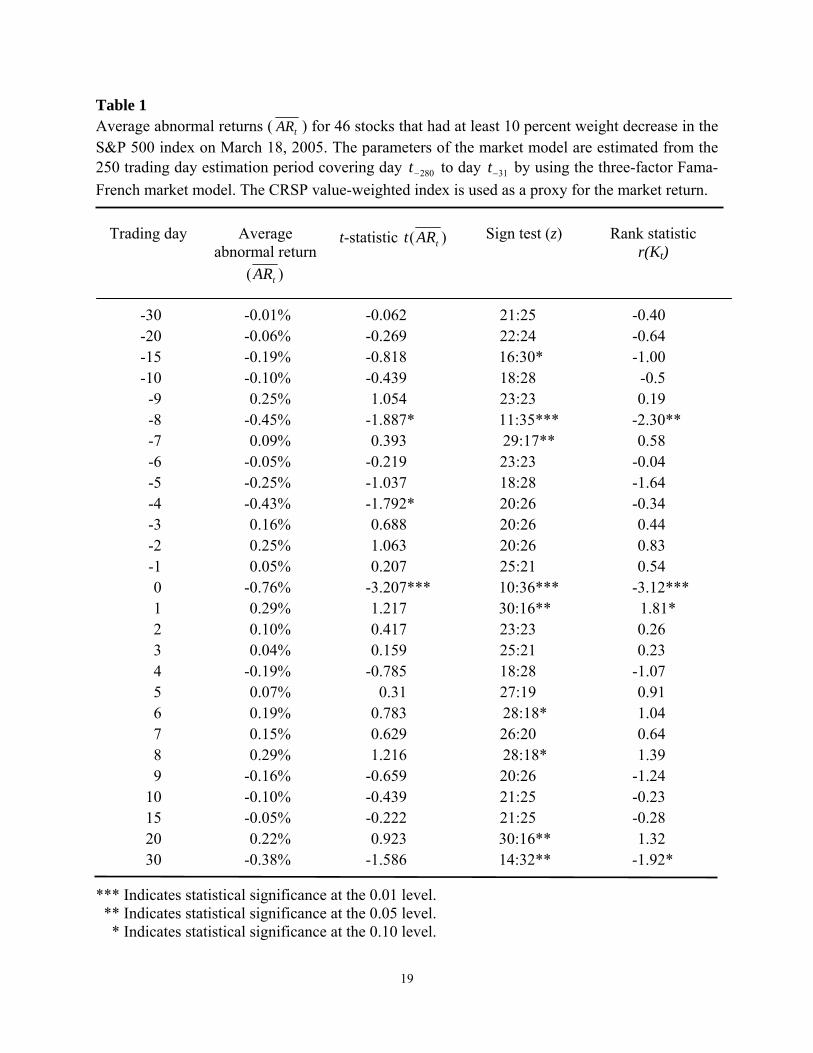
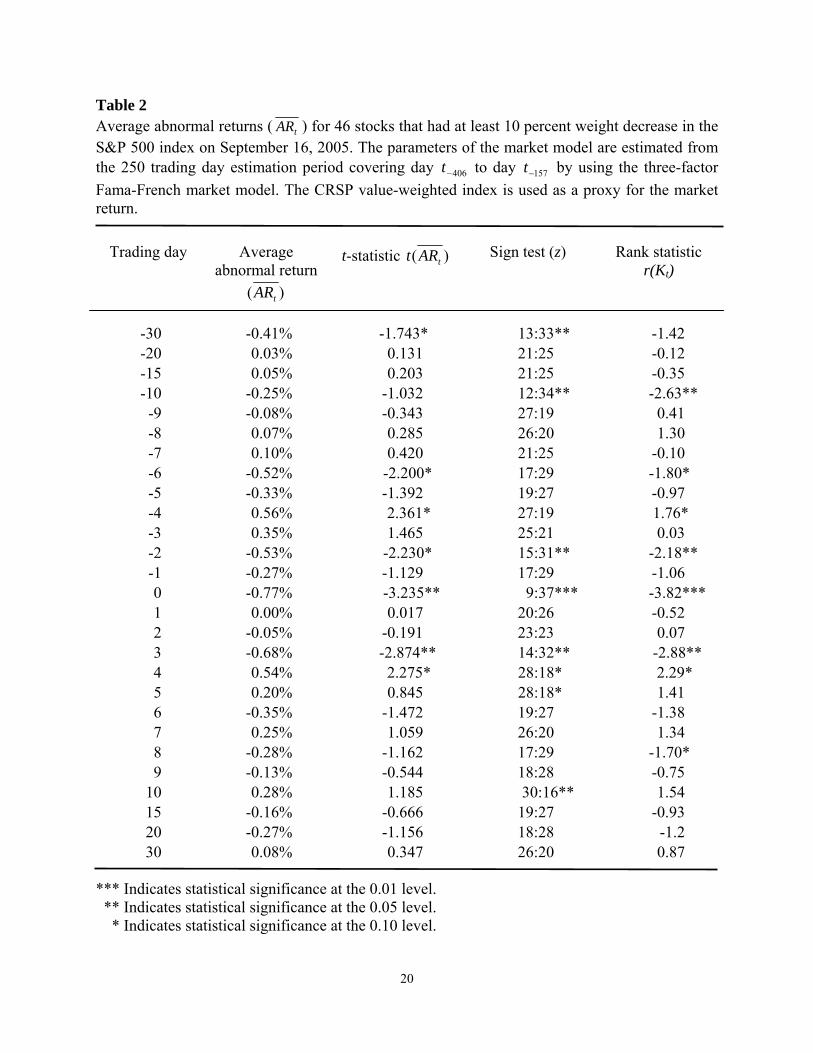
Table 1 and Table 2 present the abnormal return results around the half-float adjustment
day, March 18, 2005, and the full-float adjustment day, September 16, 2005, respectively.
[Table 1 about here]
[Table 2 about here]
As Table 1 and Table 2 show, sample stocks experience significant negative abnormal
returns on the half-float and full-float adjustment days. The average abnormal return for the
sample is -0.76% (t = -3.207) on March 18, 2005, and -0.77% (t = -3.235) on September 16,
2005. All three statistics are significant at the 1% level on both days. These significant negative
abnormal returns do not seem to reverse the following days.
Table 3 displays average cumulative abnormal returns for the sample stocks for different
periods. While the sample stocks seem to show decline in value in the periods preceding the float
adjustment days, the stocks do not exhibit price reversal in the following periods. The average
cumulative abnormal returns over the 30-day period running from day +1 to day +30 are
9
insignificant for both the half-float adjustment and the full-float adjustment. These results are
inconsistent with the price-pressure hypothesis and support the downward sloping demand curve
hypothesis.
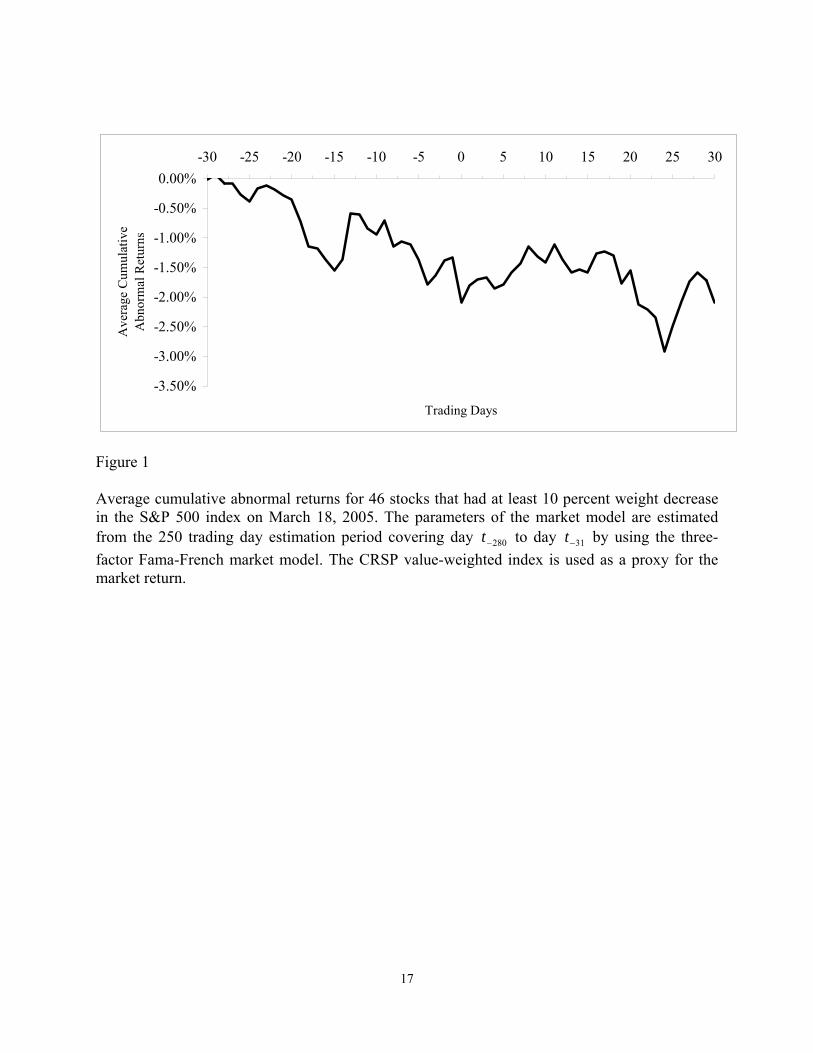
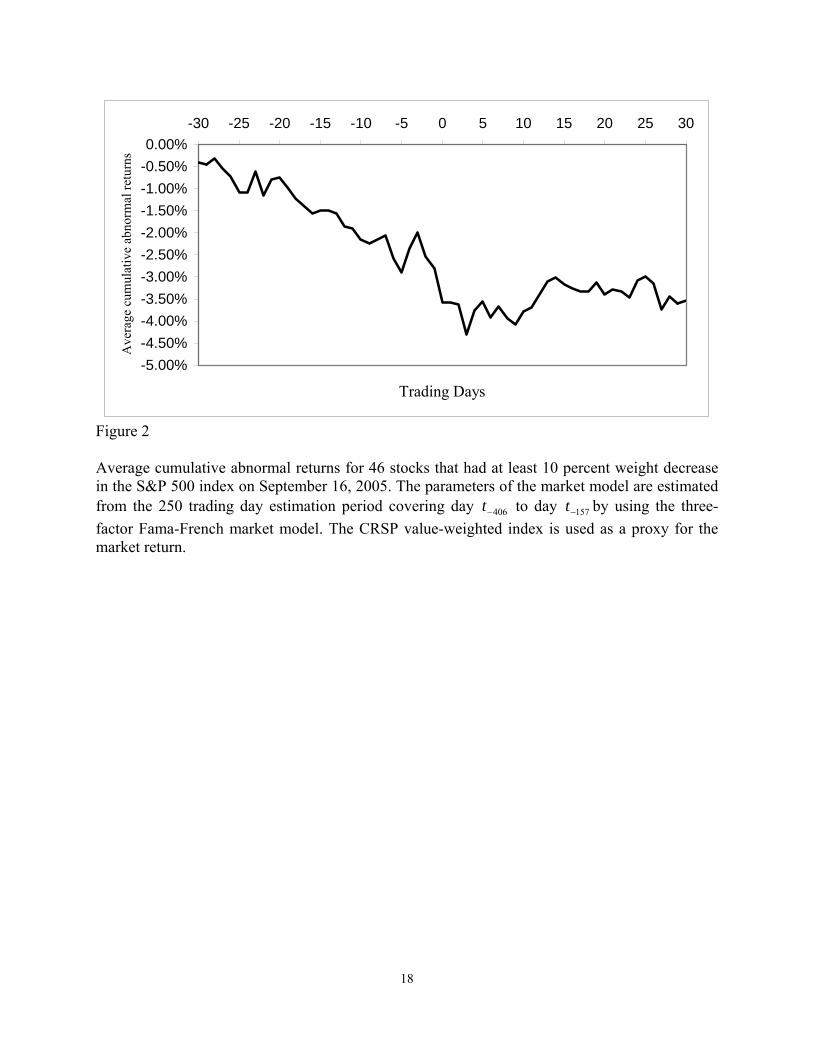
The abnormal returns around the half-float and full-float adjustment days are plotted for
the (-30,+30) window in Figure I and Figure 2, respectively. As shown, in both cases, it is clear
that, as indicated by our analysis in Table 1, stock price decline associated with weight
adjustment is permanent. The almost complete absence of a price reversal effect constitutes
evidence in favor of the downward-sloping demand hypothesis.
[Figure 1 about here]
[Figure 2 about here]
4.2. Trading volume
I analyze trading volume around the reconstitution date using procedures similar to those
in Campbell and Wasley (1996). The purpose of this analysis is to determine if abnormal volume
is associated with the abnormal returns found in the previous section. A brief description of
methods for calculating abnormal volume follows.
First, I calculate the log-transformed percentage of shares outstanding:1
tiV , = )000255.0100
ln(,
, +ti
ti
Sn
, (2)
1 Ajinkya and Jain (1989) and Cready and Ramanan (1991) show the importance of log transformation of the volume data to approximate a normal distribution. As in Cready and Ramanan, we add 0.000255 to the daily percentage of shares outstanding to accommodate zero volume.
10
where ni,t is the number of shares traded for security i on day t, and Si,t is the number of shares
outstanding on day t.
Next, I estimate market model abnormal trading volume as:2
)( ,,, tmiititi VVAV βα +−= , (3)
where αi and βi are computed via ordinary least squares. The market model volume for day t is
calculated by using all NYSE-AMEX stocks:
, ,1
1 t
m t i tit
NV V
N =
= ∑ , (4)
where Nt is the number of all NYSE-AMEX stocks on day t.
For robustness checks, I use different test statistics, estimation periods, and proxies for
the market. For example, I use both a parametric t-test and two nonparametric tests: sign test and
rank test. I report both sign test and rank test statistics because Campbell and Wasley (1996) find
that the nonparametric test statistic is always more powerful in detecting abnormal trading
volume than the parametric test statistic. In addition to the pre-event estimation period, I also
investigated a post-event estimation period. As for the proxy for market trading volume, I also
use the volume of Nasdaq stocks. Neither the estimation period nor the choice of overall market
volume affects the general results. To save space, the main results, which are reported in Table 4
and Table 5, use the pre-event estimation period and NYSE-AMEX stocks in the calculation of
the market trading volume.
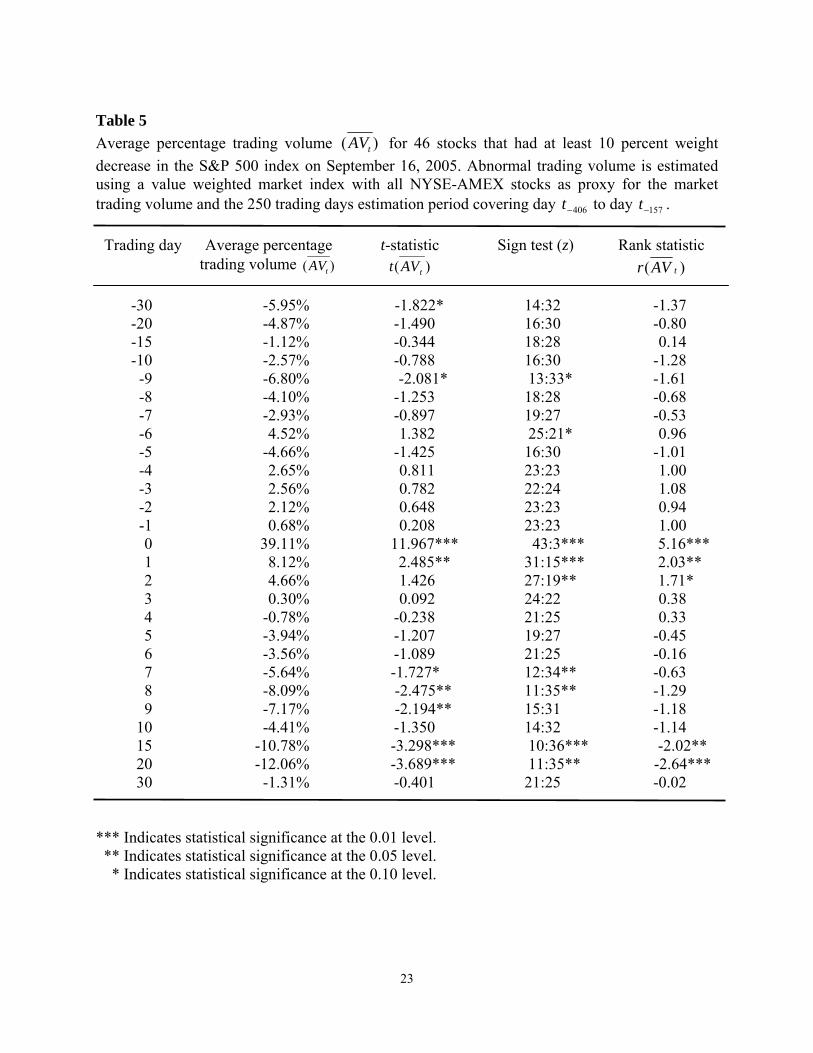
[Table 4 about here]
[Table 5 about here]
2 The estimation period runs for 250 days from -280 to -31 days before the March 18, 2005, and abnormal volumes are calculated for the 61 days centered on the reconstitution day.
11
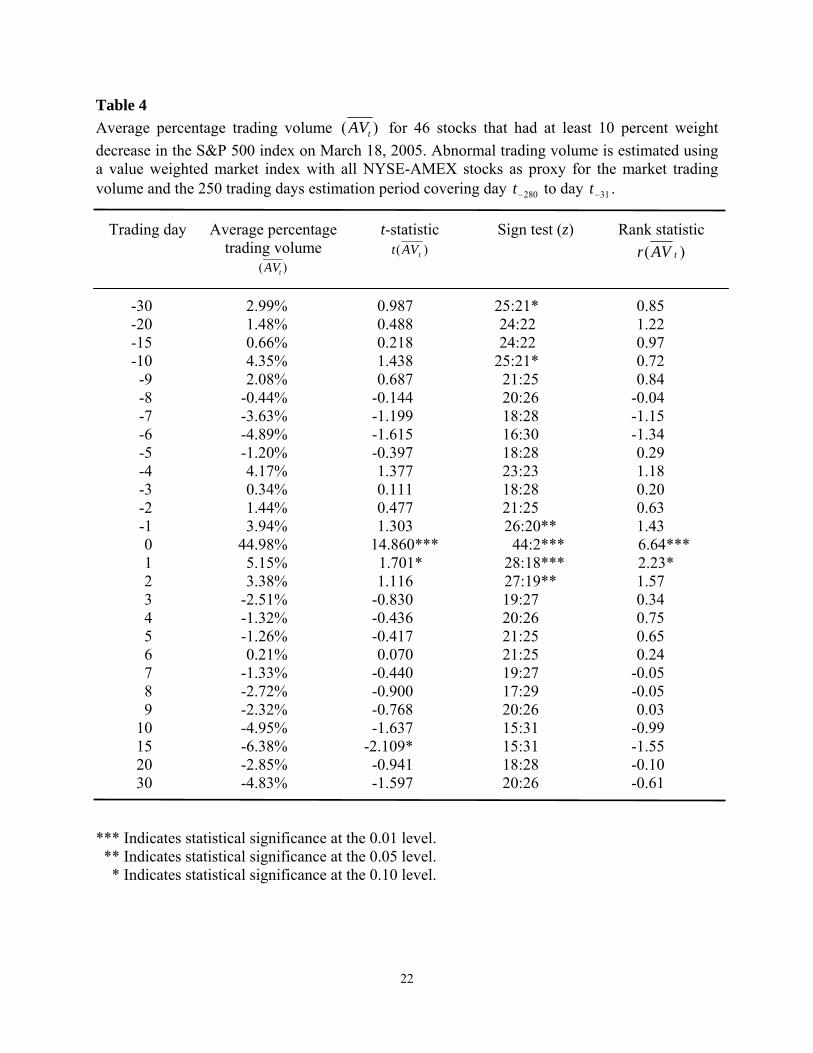
Table 4 and Table 5 display abnormal trading volumes for 61-day event periods around
March 18 and September 16, 2005, respectively. Consistent with the abnormal return results, the
stocks experience significant increases in trading volume on the event days. The trading volume
increases by 44.98% on March 18 and by 39.44% on September 16, 2005. All test statistics, the
parametric t-test, sign and rank tests, are significant at the 1% level on these days. The trading
day after September 16, 2005, trading volume is only 8.14% above normal, and quickly declines
in the following days.
5. Summary and conclusions
A large number of studies address the question of whether the demand curve for stocks is
downward-sloping. However, the presence of possible news in events makes it difficult to
discriminate among competing hypotheses. Furthermore, recent studies derive different
conclusions about the slope of the demand curve for stocks. This paper contributes to the
literature by examining a new information-free event.
To provide a better representation of the investable securities in the investment universe,
Standard and Poor’s brought its one of the world’s most recognizable indexes, the S&P 500, to
free float in 2005. The adjustment was accomplished in two steps: the half-float adjustment and
the full-float adjustment. The half-float adjustment, which took all affected stocks to 50 percent
of their free-float took place on March 18, 2005. The full-float adjustment, which brought all
stocks to their full-float weights occurred six months later, on September 16, 2005.

12
As a result of the free-float adjustment, 98 stocks in the S&P 500 index had their weights
decreased. I examine the effect of decrease in demand on 46 stocks, that had the largest declines
in their weights.
I find that a decrease in demand for the stocks is associated with a significant decline in
value on both the half-float and full-float adjustment days. The average abnormal return for the
sample is -0.76% on March 18, 2005, and -0.77% on September 16, 2005. These decreases in
value are accompanied by significant abnormal trading volume.
The examination of stock price behavior after the events days suggests that the loss in
value is permanent. Taken together, the observed results are consistent with the downward-
sloping demand curve hypothesis.

13
References
Ajinkya, B. B. and P. C. Jain, 1989. The behavior of daily stock market trading volume, Journal
of Accounting and Economics 11, 331-359.
Amihud, Y. and H. Mendelson, 1986. Asset pricing and the bid-ask spread, Journal of Financial
Economics 17, 223-249.
Asquith, P., 1983. Merger bids, uncertainty, and stockholder returns, Journal of Financial
Economics 11, 51-83.
Beneish, M. D. and J. C. Gardner, 1995. Information costs and liquidity effects from changes in
the Dow Jones Industrial Average list, Journal of Financial and Quantitative Analysis 30,
135-157.
Beneish, M. D. and R. E. Whaley, 1996. An anatomy of the “S&P game”: The effects of
changing the rules, Journal of Finance 51, 1909-1930.
Beneish, M. D. and R. E. Whaley, 1997. A scorecard from the S&P game, Journal of Portfolio
Management 23, 16-23.
Beneish, M. D. and R. E. Whaley, 2002. S&P 500 index replacements, Journal of Portfolio
Management 29, 51-60.
Biktimirov, E. N., A. R. Cowan, and B. D. Jordan, 2004. Do demand curves for small stocks
slope down? Journal of Financial Research 27, 161–178.
Biktimirov E. N. 2004. “The effect of demand on stock prices: Evidence from index fund
rebalancing,” The Financial Review 39 (3), 455-472.
14
Brown, S. J. and J. B. Warner, 1980. Measuring security price performance, Journal of Financial
Economics 8, 205-258.
Cha, H. and B. Lee, 2001. The market demand curve for common stocks: Evidence from equity
mutual fund flows, Journal of Financial and Quantitative Analysis 36, 195-220.
Chung, R. and L. Kryzanowski, 1997. Analyst following and market behavior around TSE300
index revisions, in SBF – Bourse de Paris, ed.: Organization and Quality of Equity
Markets (Presses Universitaires de France, Paris).
Chung, R. and L. Kryzanowski, 1998. Are the market effects associated with revisions to the
TSE300 index robust? Multinational Finance Journal 2, 1-36.
Corrado, C. J., 1989. A nonparametric test for abnormal security-price performance in event
studies, Journal of Financial Economics 23, 385-395.
Corrado, C. J. and T. L. Zivney, 1992. The specification and power of the sign test in event study
hypothesis tests using daily stock returns, Journal of Financial and Quantitative Analysis
27, 465-478.
Cowan, A. R., 1992. Nonparametric event study tests, Review of Quantitative Finance and
Accounting 2, 343-358.
Dann, L. Y., D. Mayers, and R. J. Raab, 1977. Trading rules, large blocks and the speed of price
adjustment, Journal of Financial Economics 4, 3-22.
Denis, D. K, J. J. McConnell, A. V. Ovtchinnikov, and Y. Yu, 2003. S&P 500 index additions
and earnings expectations, Journal of Finance 58, 1821-1840.
Dhillon, U. and H. Johnson, 1991. Changes in the Standard and Poor's 500 list, Journal of
Business 64, 75-85.
15
Erwin, G. R. and J. M. Miller, 1998. The liquidity effects associated with addition of a stock to
the S&P 500 index: Evidence from bid/ask spreads, Financial Review 33, 131-146.
Fama, E. F. and K. R. French, 1993, Common risk factors in the returns on stocks and bonds,
Journal of Financial Economics 33, 3-56.
Harris, L. and E. Gurel, 1986. Price and volume effects associated with changes in the S&P 500
list: New evidence for the existence of price pressures, Journal of Finance 41, 815-829.
Jain, P. C., 1987. The effect on stock price of inclusion in or exclusion from the S&P 500,
Financial Analysts Journal 43, 58-65.
Kaul, A., V. Mehrotra, and R. Morck, 2000. Demand curves for stocks do slope down: New
evidence from an index weights adjustment, Journal of Finance 55, 893-912.
Kraus, A. and H. R. Stoll, 1972. Price impacts of block trading on the New York Stock
Exchange, Journal of Finance 27, 569-588.
Lynch, A. W. and R. R. Mendenhall, 1997. New evidence on stock price effects associated with
changes in the S&P 500 index, Journal of Business 70, 351-383.
Masse, I., R. Hanrahan, J. Kushner, and F. Martinello, 2000. The effect of additions to and
deletions from the TSE 300 index on Canadian share prices, Canadian Journal of
Economics 33, 341-360.
Mikkelson, W. H. and M. M. Partch, 1985. Stock price effects and costs of secondary
distributions, Journal of Financial Economics 14, 165-194.
Ruback, R. S., 1982. The effect of discretionary price control decisions on equity values, Journal
of Financial Economics 10, 83-105.

16
Scholes, M. S., 1972. The market for securities: Substitution versus price pressure and the effects
of information on share prices, Journal of Business 45, 179-211.
Shleifer, A., 1986. Do demand curves for stocks slope down? Journal of Finance 41, 579-590.
17
-3.50%
-3.00%
-2.50%
-2.00%
-1.50%
-1.00%
-0.50%
0.00%-30 -25 -20 -15 -10 -5 0 5 10 15 20 25 30
Trading Days
Ave
rage
Cum
ulat
ive
Abn
orm
al R
etur
ns
Figure 1 Average cumulative abnormal returns for 46 stocks that had at least 10 percent weight decrease in the S&P 500 index on March 18, 2005. The parameters of the market model are estimated from the 250 trading day estimation period covering day 280−t to day 31−t by using the three-factor Fama-French market model. The CRSP value-weighted index is used as a proxy for the market return.
18
-5.00%-4.50%-4.00%-3.50%-3.00%-2.50%-2.00%-1.50%-1.00%-0.50%0.00%
-30 -25 -20 -15 -10 -5 0 5 10 15 20 25 30
Trading Days
Ave
rage
cum
ulat
ive
abno
rmal
retu
rns
Figure 2 Average cumulative abnormal returns for 46 stocks that had at least 10 percent weight decrease in the S&P 500 index on September 16, 2005. The parameters of the market model are estimated from the 250 trading day estimation period covering day 406−t to day 157−t by using the three-factor Fama-French market model. The CRSP value-weighted index is used as a proxy for the market return.
19
Table 1 Average abnormal returns ( tAR ) for 46 stocks that had at least 10 percent weight decrease in the S&P 500 index on March 18, 2005. The parameters of the market model are estimated from the 250 trading day estimation period covering day 280−t to day 31−t by using the three-factor Fama-French market model. The CRSP value-weighted index is used as a proxy for the market return.
Trading day Average abnormal return
)( tAR
t-statistic )( tARt Sign test (z) Rank statistic r(Kt)
-30 -0.01% -0.062 21:25 -0.40 -20 -0.06% -0.269 22:24 -0.64 -15 -0.19% -0.818 16:30* -1.00 -10 -0.10% -0.439 18:28 -0.5 -9 0.25% 1.054 23:23 0.19 -8 -0.45% -1.887* 11:35*** -2.30** -7 0.09% 0.393 29:17** 0.58 -6 -0.05% -0.219 23:23 -0.04 -5 -0.25% -1.037 18:28 -1.64 -4 -0.43% -1.792* 20:26 -0.34 -3 0.16% 0.688 20:26 0.44 -2 0.25% 1.063 20:26 0.83 -1 0.05% 0.207 25:21 0.54 0 -0.76% -3.207*** 10:36*** -3.12*** 1 0.29% 1.217 30:16** 1.81* 2 0.10% 0.417 23:23 0.26 3 0.04% 0.159 25:21 0.23 4 -0.19% -0.785 18:28 -1.07 5 0.07% 0.31 27:19 0.91 6 0.19% 0.783 28:18* 1.04 7 0.15% 0.629 26:20 0.64 8 0.29% 1.216 28:18* 1.39 9 -0.16% -0.659 20:26 -1.24
10 -0.10% -0.439 21:25 -0.23 15 -0.05% -0.222 21:25 -0.28 20 0.22% 0.923 30:16** 1.32 30 -0.38% -1.586 14:32** -1.92*
*** Indicates statistical significance at the 0.01 level. ** Indicates statistical significance at the 0.05 level. * Indicates statistical significance at the 0.10 level.
20
Table 2 Average abnormal returns ( tAR ) for 46 stocks that had at least 10 percent weight decrease in the S&P 500 index on September 16, 2005. The parameters of the market model are estimated from the 250 trading day estimation period covering day 406−t to day 157−t by using the three-factor Fama-French market model. The CRSP value-weighted index is used as a proxy for the market return.
Trading day Average abnormal return
)( tAR
t-statistic )( tARt Sign test (z) Rank statistic r(Kt)
-30 -0.41% -1.743* 13:33** -1.42 -20 0.03% 0.131 21:25 -0.12 -15 0.05% 0.203 21:25 -0.35 -10 -0.25% -1.032 12:34** -2.63** -9 -0.08% -0.343 27:19 0.41 -8 0.07% 0.285 26:20 1.30 -7 0.10% 0.420 21:25 -0.10 -6 -0.52% -2.200* 17:29 -1.80* -5 -0.33% -1.392 19:27 -0.97 -4 0.56% 2.361* 27:19 1.76* -3 0.35% 1.465 25:21 0.03 -2 -0.53% -2.230* 15:31** -2.18** -1 -0.27% -1.129 17:29 -1.06 0 -0.77% -3.235** 9:37*** -3.82*** 1 0.00% 0.017 20:26 -0.52 2 -0.05% -0.191 23:23 0.07 3 -0.68% -2.874** 14:32** -2.88** 4 0.54% 2.275* 28:18* 2.29* 5 0.20% 0.845 28:18* 1.41 6 -0.35% -1.472 19:27 -1.38 7 0.25% 1.059 26:20 1.34 8 -0.28% -1.162 17:29 -1.70* 9 -0.13% -0.544 18:28 -0.75
10 0.28% 1.185 30:16** 1.54 15 -0.16% -0.666 19:27 -0.93 20 -0.27% -1.156 18:28 -1.2 30 0.08% 0.347 26:20 0.87
*** Indicates statistical significance at the 0.01 level. ** Indicates statistical significance at the 0.05 level. * Indicates statistical significance at the 0.10 level.

21
Table 3 Average cumulative abnormal returns ( tCAR ) for 46 stocks that had a weight decrease in the S&P 500 index because of the half-float adjustment on March 18, 2005, and the full-float adjustment on September 16, 2005. The parameters of the market model are estimated from the 250 trading day estimation period by using the three-factor Fama-French market model. The CRSP value-weighted index is used as a proxy for the market return.
March 18, 2005 (half-float adjustment) September 16, 2005 (full-float adjustment) Time period
( tCAR ) t-statistic )( tARt
Sign test (z)
Rank statistic
r(Kt)
( tCAR ) t-statistic )( tARt
Sign test (z)
Rank statistic
r(Kt)
-30,+30 -2.09% -1.125 20:26 -1.659* -3.50% -1.888* 14:32** -2.11** -30, -1 -1.33% -1.024 15:31** -1.367 -2.79% -2.141** 16:30* -3.07*** 0,+30 -0.75% -0.570 24:22 -0.983 -0.72% -0.543 23:23 0.06 1,+30 0.01% 0.006 25:21 -0.430 0.05% 0.039 27:19 0.75
22
Table 4 Average percentage trading volume )( tAV for 46 stocks that had at least 10 percent weight decrease in the S&P 500 index on March 18, 2005. Abnormal trading volume is estimated using a value weighted market index with all NYSE-AMEX stocks as proxy for the market trading volume and the 250 trading days estimation period covering day 280−t to day 31−t .
Trading day Average percentage trading volume
)( tAV
t-statistic )( tAVt
Sign test (z) Rank statistic )( tAVr
-30 2.99% 0.987 25:21* 0.85 -20 1.48% 0.488 24:22 1.22 -15 0.66% 0.218 24:22 0.97 -10 4.35% 1.438 25:21* 0.72 -9 2.08% 0.687 21:25 0.84 -8 -0.44% -0.144 20:26 -0.04 -7 -3.63% -1.199 18:28 -1.15 -6 -4.89% -1.615 16:30 -1.34 -5 -1.20% -0.397 18:28 0.29 -4 4.17% 1.377 23:23 1.18 -3 0.34% 0.111 18:28 0.20 -2 1.44% 0.477 21:25 0.63 -1 3.94% 1.303 26:20** 1.43 0 44.98% 14.860*** 44:2*** 6.64*** 1 5.15% 1.701* 28:18*** 2.23* 2 3.38% 1.116 27:19** 1.57 3 -2.51% -0.830 19:27 0.34 4 -1.32% -0.436 20:26 0.75 5 -1.26% -0.417 21:25 0.65 6 0.21% 0.070 21:25 0.24 7 -1.33% -0.440 19:27 -0.05 8 -2.72% -0.900 17:29 -0.05 9 -2.32% -0.768 20:26 0.03
10 -4.95% -1.637 15:31 -0.99 15 -6.38% -2.109* 15:31 -1.55 20 -2.85% -0.941 18:28 -0.10 30 -4.83% -1.597 20:26 -0.61
*** Indicates statistical significance at the 0.01 level. ** Indicates statistical significance at the 0.05 level. * Indicates statistical significance at the 0.10 level.
23
Table 5 Average percentage trading volume )( tAV for 46 stocks that had at least 10 percent weight decrease in the S&P 500 index on September 16, 2005. Abnormal trading volume is estimated using a value weighted market index with all NYSE-AMEX stocks as proxy for the market trading volume and the 250 trading days estimation period covering day 406−t to day 157−t .
Trading day Average percentage trading volume )( tAV
t-statistic )( tAVt
Sign test (z) Rank statistic )( tAVr
-30 -5.95% -1.822* 14:32 -1.37 -20 -4.87% -1.490 16:30 -0.80 -15 -1.12% -0.344 18:28 0.14 -10 -2.57% -0.788 16:30 -1.28 -9 -6.80% -2.081* 13:33* -1.61 -8 -4.10% -1.253 18:28 -0.68 -7 -2.93% -0.897 19:27 -0.53 -6 4.52% 1.382 25:21* 0.96 -5 -4.66% -1.425 16:30 -1.01 -4 2.65% 0.811 23:23 1.00 -3 2.56% 0.782 22:24 1.08 -2 2.12% 0.648 23:23 0.94 -1 0.68% 0.208 23:23 1.00 0 39.11% 11.967*** 43:3*** 5.16*** 1 8.12% 2.485** 31:15*** 2.03** 2 4.66% 1.426 27:19** 1.71* 3 0.30% 0.092 24:22 0.38 4 -0.78% -0.238 21:25 0.33 5 -3.94% -1.207 19:27 -0.45 6 -3.56% -1.089 21:25 -0.16 7 -5.64% -1.727* 12:34** -0.63 8 -8.09% -2.475** 11:35** -1.29 9 -7.17% -2.194** 15:31 -1.18
10 -4.41% -1.350 14:32 -1.14 15 -10.78% -3.298*** 10:36*** -2.02** 20 -12.06% -3.689*** 11:35** -2.64*** 30 -1.31% -0.401 21:25 -0.02
*** Indicates statistical significance at the 0.01 level. ** Indicates statistical significance at the 0.05 level. * Indicates statistical significance at the 0.10 level.