Embed Size (px)
Citation preview
The effect of depth, distance from dam and habitaton spatial distribution of fish in an artificialreservoir
Introduction
The spatial distribution of fish within a water body isnot random. At the first level, abiotic conditionsdetermining the environment are heterogeneous. Fishutilise habitats within a water body that are physio-logically convenient mainly in terms of oxygenconcentration and water temperature (the ‘to be ornot to be’ rule) (Straskraba 1974; Brandt 1980;Kubecka & Wittingerova 1998; Brosse & Lek 1999;Gido & Matthews 2000; Matthews et al. 2004). Bioticfactors also play role – food availability, predation risk
and competition (the ‘to eat and not be eaten’ rule)(Bohl 1980; Eckmann & Imbrock 1996; Mous et al.2004; Gliwicz et al. 2006). It means that for eachontogenetic stage of fish (ecospecies; Brosse et al.2007), biotic and abiotic conditions cross at anequilibrium which represents an optimum for spatialoccurrence within a specific water body.
During nine summers, we sampled fish communityof the Rımov Reservoir, Czech Republic. The reser-voir has one tributary and is located in a narrow valley.The water column has well-developed thermal strat-ification during summer. According to this, the
Ecology of Freshwater Fish 2009: 18: 247–260Printed in Malaysia Æ All rights reserved
� 2008 The AuthorsJournal compilation � 2008 Blackwell Munksgaard
ECOLOGY OFFRESHWATER FISH
Prchalova M, Kubecka J, Cech M, Frouzova J, Drastık V, Hohausova E,Juza T, Kratochvıl M, Matena J, Peterka J, Rıha M, Tuser M, Vasek M. Theeffect of depth, distance from dam and habitat on spatial distribution of fishin an artificial reservoir.Ecology of Freshwater Fish 2009: 18: 247–260. � 2008 The Authors.Journal Compilation � 2008 Blackwell Munksgaard
Abstract – Spatial distribution of the fish community in the deep canyon-shaped Rımov Reservoir, Czech Republic, was studied using overnightgillnetting fishing in 1999–2007. Effects of depth, distance from the dam tothe tributary and habitat type (benthic and pelagic) on fish communitystructure, catch per unit of effort (CPUE), biomass per unit of effort(BPUE) and average weight were tested. Fish were recorded in all sampleddepths and parts of the reservoir. Redundancy analysis revealed that effectsof three environmental variables were significant and most variability wasexplained by depth, then by distance from the dam and habitat type. CPUEand BPUE of all species decreased with depth and responses of individualspecies to depth were similar for juvenile and adult fish. Number ofspecies, CPUE and BPUE of all species except perch increased headingtowards the tributary and peaked close to or at the tributary part of thereservoir. Responses of juvenile fish to distance from the dam differed fromthat of adult fish. Structure of fish community differed in benthic andpelagic habitats with species preferably occupying epipelagic (bleak, asp,rudd and juvenile bleak, roach and bream) or littoral waters (perch,pikeperch, ruffe, roach, bream and juvenile percids). This study showedthat fish distribution in the reservoir followed distinct patterns, which wereprobably shaped by a combination of physiological constraints plus trade-off between food resources and competition.
M. Prchalova1,2, J. Kubecka1,2,M. Cech1,2, J. Frouzova1,2,V. Drastık1,2, E. Hohausova1,2,T. Juza1,2, M. Kratochvıl1,2,J. Matena1, J. Peterka1,2,M. Rıha1,2, M. Tuser1,2, M. Vasek1,2
1Biology Centre of the Academy of Sciences ofthe Czech Republic, v.v.i., Institute of Hydrobiol-ogy, Ceske Budejovice, Czech Republic, 2Facultyof Science, University of South Bohemia, CeskeBudejovice, Czech Republic
Key words: horizontal distribution; vertical dis-tribution; gillnet; reservoir; Cyprinidae; Percidae;redundancy analysis
M. Prchalova, Biology Centre of the Academy ofSciences of the Czech Republic, v.v.i., Institute ofHydrobiology, Na Sadkach 7, 370 05 CeskeBudejovice, Czech Republic; e-mail:[email protected]
Accepted for publication October 15, 2008
doi: 10.1111/j.1600-0633.2008.00342.x 247
reservoir has distinct longitudinal and vertical gradi-ents of abiotic factors as water temperature, oxygenand phosphorus concentrations (Straskrabova et al.1994; Hejzlar & Vyhnalek 1998; Sed’a & Devetter2000; Masın et al. 2003; Simek et al. 2003). Alsobiotic features such as phytoplankton biomass,primary production, chlorophyll a concentration, rot-ifers and cladoceran densities follow the gradient ofabiotic factors (Seda & Devetter 2000; Jezbera et al.2003; Vasek et al. 2003). Other studies on juvenile fishin pelagic and in inshore habitats (Cech & Kubecka2006; Vasek et al. 2006; T. Juza, unpublished data)and adult fish in pelagic habitats (Vasek et al. 2003,2004; Drastık et al. 2008) show that majority of fishspecies prefer the most productive areas and thewarmest depth layers within the reservoir.
The aims of this study are to model the distributionof the fish community along the vertical and longitu-dinal gradients, and in pelagic and benthic habitats.The vertical gradient is represented by depth and thelongitudinal gradient is referred as a distance fromthe dam of the reservoir. We expect fish to inhabit theupper part of the stratified water column in both typesof habitats. We assume that the density of fish ishighest at the tributary part of the reservoir in bothtypes of habitats.
Many authors lament the lack of knowledgeregarding habitat use and the preferences of individualfish ecospecies (e.g. Brosse & Lek 2002; Brosse et al.2007) as there could be serious intra- and inter-species (Vondracek et al. 1989; Cech et al. 2005;Prchalova et al. 2006) and inter-water body differ-ences (Rowe 1994; Jeppesen et al. 2006). Therefore,we analyse juvenile (0+ year old) and adult fish (1+year and older) individuals of each species separatelyas well as the community as a whole expecting thatdifferent ecospecies have different preferences inspatial distribution.
Study area
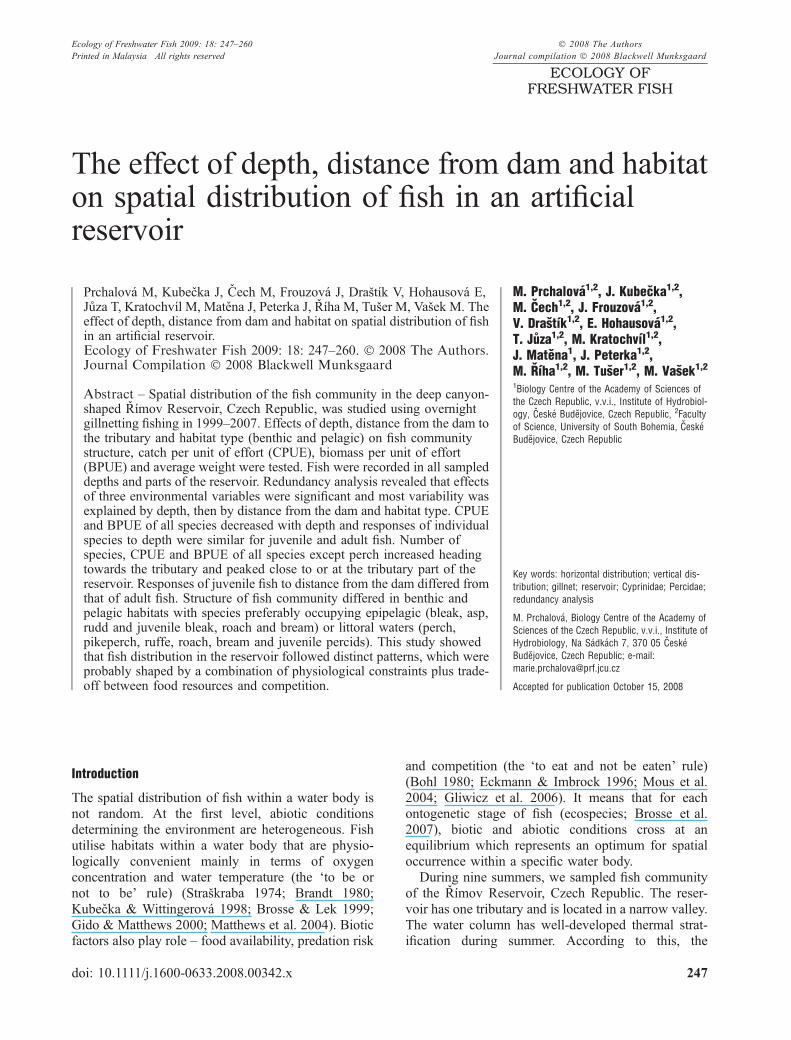
The Rımov Reservoir was built in 1978 on the MalseRiver (South Bohemia, Czech Republic) as a watersupply reservoir with an additional function ofpreventing floods. Reservoir canyon-shaped mor-phometry corresponds to the original deep valley(Fig. 1). Typical retention time is approximately100 days. The maximum depth of the reservoir is45 m at the dam. The average depth is 16 m. Themaximum volume is 33.6 millions m3 and the surfacearea is 210 ha at elevation of 417 m a.s.l. It is adimictic reservoir with thermal stratification develop-ing from April through October (Fig. 2) and watertransparency (Secchi depth) in the dam part reachesapproximately 1.5 m during late summer. Structuralheterogeneity of the littoral zone as well as water
macrophyte growth are limited because of water levelfluctuations and steep banks. The last 15 years of thedevelopment of the fish community of the reservoirwere characterised by very stable cyprinid dominatedfish assemblage (M. Rıha, unpublished data) and bystable annual concentrations of total phosphorus (TP)at the dam (average 30.39, SD 3.29 lgÆl)1; AnnualReports of the Institute of Hydrobiology).
As a water supply reservoir, the proximate sur-rounding of the reservoir is protected area withprohibited access. The only activities on the reservoirare limited to shore maintenance by the Vltava RiverAuthority and research by the Institute of Hydrobiol-ogy. During 9 years of this study, no permanent oreven temporal flocks of piscivorous birds wererecorded on the reservoir. Thus, the distribution offish in the Rımov Reservoir was unlikely to be affected
Fig. 1. Map of the Rımov Reservoir, Czech Republic. The shadedareas show locations for fish community samplings during the9 years of the study.
Prchalova et al.
248
by human activities (Scheuerell & Schindler 2004),piscivory by avian predators (Eckmann & Imbrock1996) as well as by the water transparency andpresence of water marcophytes (Bohl 1980; Jacobsenet al. 2004; Mous et al. 2004; Jeppesen et al. 2006).
Methods
Gillnet sampling
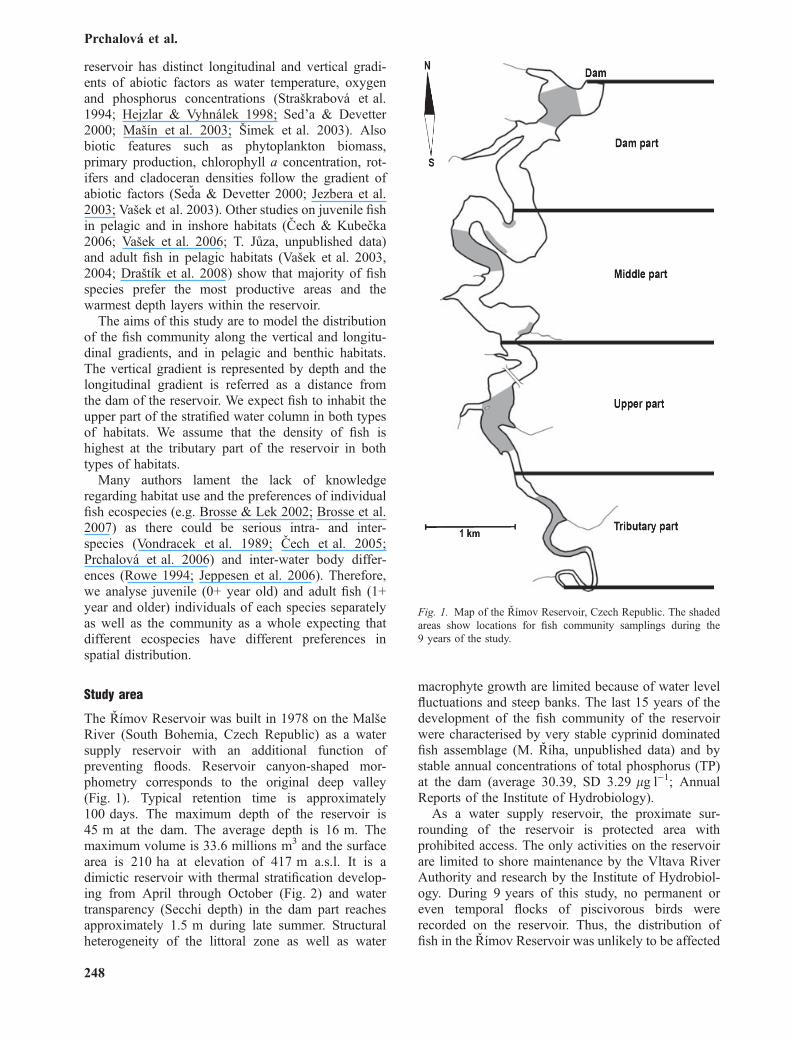
Benthic and pelagic gillnets (Pokorny-sıte, Brloh,Czech Republic) were used to sample benthic andpelagic habitats. Benthic habitat was defined as a waterlayer 1.5 m above the bottom and was sampled bybenthic gillnets with a height of 1.5 m. Benthicgillnets were set to the depth layers 0–3, 3.1–6,6.1–9, 9.1–12, 12.1–18 and >20 m (Fig. 2a), parallelto the shore. Pelagic habitats were defined as volumesof the stratified open water, having no contact with thebottom or shore – with a minimum distance of 1.5 mfrom the closest bottom. Pelagic gillnets were of three
types (Fig. 2a): Surface gillnets were set from thesurface down to 4.5 m, supported by big floats on theupper line. Gillnets set to the depth layer 5–9.5 m wereequipped with floats on 5 m long strings. Gillnets withweights on 5 m strings attached to the lead line wereset to the depth layer 9.5–5 m above the bottom. In thetributary part, a surface pelagic gillnet 3 m high wasused.
Benthic and pelagic gillnets were of the samestructure. Multimesh gillnets were used in 2004–2007.These gillnets consisted of 2.5 m long blocks of meshsizes that were sewn together along the full height(Nordic type; Appelberg et al. 1995). During 1999–2003, a series of single gillnet blocks were used –25 m long blocks of different mesh sizes were tiedtogether. In both periods, 16 mesh sizes were used.Twelve mesh sizes (5, 6.25, 8, 10, 12.5, 15.5, 19.5, 24,29, 35, 43 and 55 mm, knot-to-knot) were made asgiven by European Standard Document EN 14757(2005). Four larger mesh sizes were added to enablethe catching of larger fish: 70 and 90 mm (thread
Fig. 2. Example of the vertical distributionof dissolved oxygen (a) and water temper-ature (b) in four parts of the Rımov Reser-voir (see Fig. 1), August 2005. Columnsbelow BH and PH abbreviations showsampled depth layers of benthic (BH a–f)and pelagic habitats (PH X–Z): a � 0–3 m,b � 3.1–6 m, c � 6.1–9 m, d � 9.1–12 m,e � 12.1–18 m, f � >20 m, X � 0–4.5 m,Y � 5–9.5 m and Z � 9.5–5 m from thebottom.
Distribution of fish in an artificial reservoir
249
diameter 0.25 mm) and multifilament 110 and135 mm (4 and 6 · 0.15 mm respectively).
Gillnets were set overnight (installed at 18:00–20:00 hours and lifted the next day at 6:00–8:00 hours) at predefined depth layers at four partsalong the longitudinal axis of the reservoir (Fig. 1).The placement depth was measured by an acousticdepth gauge. At each depth layer at each location, aminimum effort of two gillnets and a typical effort offour gillnets was applied each year. Each gillnet thenrepresented a sample in the data analyses.
All fish caught were measured to the nearest 0.5 cmand fish in representative subsamples were weighed tothe nearest gram. Weights of the rest of the fish werecalculated using species-specific length–weight rela-tionships based on representative subsample. Alto-gether, 23,794 fish individuals with a total weight of2733 kg were caught during the study. The resultswere expressed separately as the catch per unit ofeffort (CPUE) (fishÆ1000 m)2Ænight)1; ‘abundance’ inthe further text) for adult fish (1+ year and older) andfor juvenile fish (0+ year old), as the biomass per unitof effort (BPUE) of adult fish (kgÆ1000 m)2Ænight)1;‘biomass’ in the further text) and as the average weightof adult fish (g; ratio of absolute BPUE and absoluteCPUE). The threshold size separating juvenile andadult fish was set according to the length–frequencydistribution supported by the scale reading for eachspecies.
The samplings were carried out every Augustduring the period 1999–2007. The exception was2002, when the sampling was done in July. Whenpossible, August was chosen as the best time forextensive sampling of the reservoir fish community asjuveniles of a majority of fish species are large enoughto be sampled using gillnets and identified. Also nospawning or wintering migrations take place duringthis part of the year (Hladık & Kubecka 2003).
Catchability of gillnets could vary among habitats.Certain studies provided evidence that catchability offish decreased with decreasing water temperature (e.g.Borgstrom 1989; Linløkken & Haugen 2006) and withincreasing density of fish (e.g. Borgstrom 1992; Olin& Malinen 2003; Linløkken & Haugen 2006).According to this, it could be misleading to comparehabitats with very different water temperature or fishdensity. However, no guideline for handling thisCPUE variance exists and we neglect it in this study.
Data analysis
Direct gradient redundancy analysis (RDA) was usedto test effects of depth, distance from the dam andhabitat type (benthic and pelagic) on fish communityusing multivariate statistics (Canoco software, Bio-metris – Plant Research International,Wageningen, The
Netherlands). The unimodal method of the canonicalcorrespondence analysis usually gives a better fit ofnatural communities’ responses, as organisms usuallyhave optima instead of a linear response along aresource gradient (ter Braak & Verdonschot 1995; Gido& Matthews 2000; Irz et al. 2002; Jezbera et al. 2003).However, many of our samples were empty and cannot,therefore, be compared with the others using the chi-square distance, which is implied by unimodalmethods.Consequently, we used a linear method, whichemployed linear Euclidean distances for comparingsamples (Leps & Smilauer 2003). Besides, the length ofthe gradient in the detrended correspondence analysisindicated that we could use the linear method.
The environmental (explanatory) variables were: thequantitative variables of depth and distance from thedam and the qualitative dummy (i.e. zero or one)variables for the habitat type (benthic or pelagic) andfor each sampled year (1999–2007). The distance fromthe dam was measured along the middle of thereservoir basin. The variable year was used as acovariate as we did not intent to interpret its effect;however, we wanted to take this effect into accountduring interpreting effects of the other variables.
Two basic types of data sets were tested: the firsttype included data sets with only one dependentvariable – the total abundance and number of speciesof juvenile fish, the total abundance, total biomass andnumber of species of adult fish and the total averageweight of adult fish. RDA allowed testing regressionin data sets even with one dependent variable, becausesuch analysis fully corresponded with Anova (terBraak & Smilauer 2002). Excluding number ofspecies, data were log-transformed [y¢ = log10 (y + 1)]and centred by species (no centring for samples wereperformed). Scaling was focused on inter-sampledistances and no post-transformation of species scoreswere carried out.
The second type of data sets had many dependentvariables (equal to number of species) in abundance ofjuvenile fish community and in abundance, biomassand average weight of the adult fish community.Excluding the number of species, the data were log-transformed [y¢ = log10 (y + 1)] and centred by spe-cies (no centring for samples were performed). Scalingwas focused on inter-species correlations, speciesscores were divided by the standard deviation andsamples were standardised by norm.
Statistical significances were analysed by MonteCarlo permutation tests. The unrestricted type ofpermutation tests was performed with blocks definedby covariates to quantify the effect of a givenenvironmental variable (the samples were permutedonly within blocks and never across blocks; Leps &Smilauer 2003). Species in the adult fish communitywith more than 20 occurrences and all species in the
Prchalova et al.
250
juvenile fish community were included in the analyses(Table 1).
Both types of effects – marginal and conditional –of environmental variables were observed. The mar-ginal effect was an effect of only one explanatoryvariable when the effects of other explanatory vari-ables (except covariates) were ignored. In case of theconditional effect, an explanatory variable explainedvariability in addition to the variability explained byvariables already included.
The responses of dependent variables to individualenvironmental variables were fitted using general linearmodels (GLMs; CanoDraw software, Petr Smilauer,Faculty of Science, University of South Bohemia,
Ceske Budejovice, Czech Republic). GLMs with thelinear and quadratic degree were compared and thedegree with significant fit and ⁄or with the better fit (i.e.lower Akaike information criterion, AIC, a measure ofthe goodness of fit of the model) was selected.
Results
Depth
The depth had the strongest significant effect on everysampled characteristic of the fish community (Tables 2and 3). Abundance, biomass and the number of speciesof adult as well as of juvenile fish communities
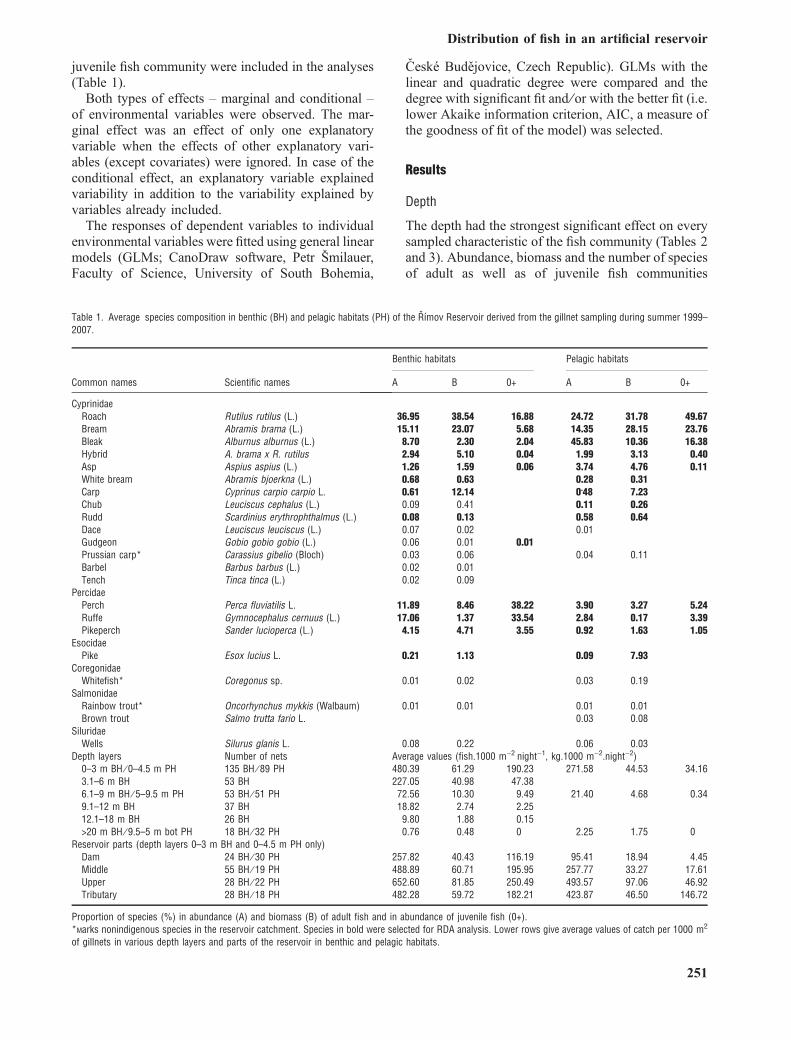
Table 1. Average species composition in benthic (BH) and pelagic habitats (PH) of the Rımov Reservoir derived from the gillnet sampling during summer 1999–2007.
Common names Scientific names
Benthic habitats Pelagic habitats
A B 0+ A B 0+
CyprinidaeRoach Rutilus rutilus (L.) 36.95 38.54 16.88 24.72 31.78 49.67Bream Abramis brama (L.) 15.11 23.07 5.68 14.35 28.15 23.76Bleak Alburnus alburnus (L.) 8.70 2.30 2.04 45.83 10.36 16.38Hybrid A. brama x R. rutilus 2.94 5.10 0.04 1.99 3.13 0.40Asp Aspius aspius (L.) 1.26 1.59 0.06 3.74 4.76 0.11White bream Abramis bjoerkna (L.) 0.68 0.63 0.28 0.31Carp Cyprinus carpio carpio L. 0.61 12.14 0.48 7.23Chub Leuciscus cephalus (L.) 0.09 0.41 0.11 0.26Rudd Scardinius erythrophthalmus (L.) 0.08 0.13 0.58 0.64Dace Leuciscus leuciscus (L.) 0.07 0.02 0.01Gudgeon Gobio gobio gobio (L.) 0.06 0.01 0.01Prussian carp* Carassius gibelio (Bloch) 0.03 0.06 0.04 0.11Barbel Barbus barbus (L.) 0.02 0.01Tench Tinca tinca (L.) 0.02 0.09
PercidaePerch Perca fluviatilis L. 11.89 8.46 38.22 3.90 3.27 5.24Ruffe Gymnocephalus cernuus (L.) 17.06 1.37 33.54 2.84 0.17 3.39Pikeperch Sander lucioperca (L.) 4.15 4.71 3.55 0.92 1.63 1.05
EsocidaePike Esox lucius L. 0.21 1.13 0.09 7.93
CoregonidaeWhitefish* Coregonus sp. 0.01 0.02 0.03 0.19
SalmonidaeRainbow trout* Oncorhynchus mykkis (Walbaum) 0.01 0.01 0.01 0.01Brown trout Salmo trutta fario L. 0.03 0.08
SiluridaeWells Silurus glanis L. 0.08 0.22 0.06 0.03
Depth layers Number of nets Average values (fish.1000 m)2Ænight)1, kg.1000 m)2.night)2)0–3 m BH ⁄ 0–4.5 m PH 135 BH ⁄ 89 PH 480.39 61.29 190.23 271.58 44.53 34.163.1–6 m BH 53 BH 227.05 40.98 47.386.1–9 m BH ⁄ 5–9.5 m PH 53 BH ⁄ 51 PH 72.56 10.30 9.49 21.40 4.68 0.349.1–12 m BH 37 BH 18.82 2.74 2.2512.1–18 m BH 26 BH 9.80 1.88 0.15>20 m BH ⁄ 9.5–5 m bot PH 18 BH ⁄ 32 PH 0.76 0.48 0 2.25 1.75 0
Reservoir parts (depth layers 0–3 m BH and 0–4.5 m PH only)Dam 24 BH ⁄ 30 PH 257.82 40.43 116.19 95.41 18.94 4.45Middle 55 BH ⁄ 19 PH 488.89 60.71 195.95 257.77 33.27 17.61Upper 28 BH ⁄ 22 PH 652.60 81.85 250.49 493.57 97.06 46.92Tributary 28 BH ⁄ 18 PH 482.28 59.72 182.21 423.87 46.50 146.72
Proportion of species (%) in abundance (A) and biomass (B) of adult fish and in abundance of juvenile fish (0+).*Marks nonindigenous species in the reservoir catchment. Species in bold were selected for RDA analysis. Lower rows give average values of catch per 1000 m2
of gillnets in various depth layers and parts of the reservoir in benthic and pelagic habitats.
Distribution of fish in an artificial reservoir
251
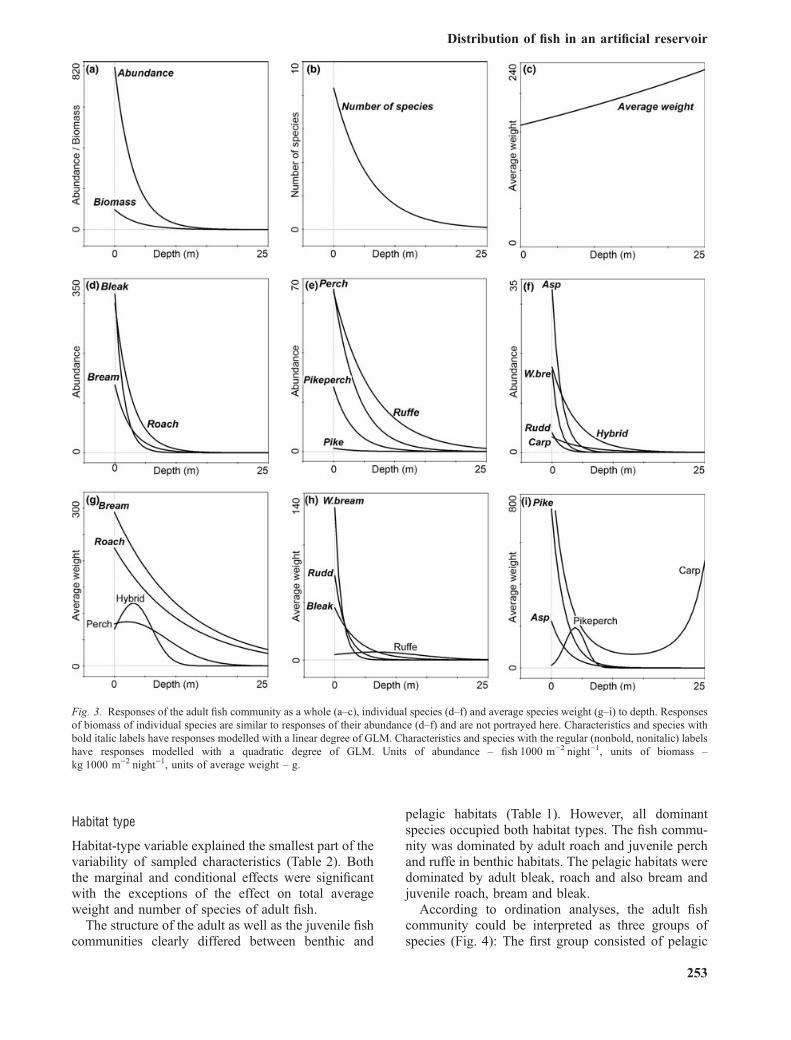
decreased steeply with the depth (Figs. 3–6). The totalaverage weight of adult fish slightly increased withdepth,whichwas caused by several catches of very largeindividual fish in depth layers below 18 m (Fig. 3c).
Abundance and biomass of all species decreasedwith the depth (Figs. 3d–f, 4, 5c and d, 6). However,the response of each species differed from each other(Table 4, Figs. 3d–f and 5c, d). Adult bleak, asp, whitebream and rudd showed the steepest decrease inabundance with depth (regression coefficient B inrange )0.7 to )0.9, Table 4). A slower decrease wasfound in adult roach, bream, perch, pikeperch, pikeand roach · bream hybrid (B � )0.3 to )0.4). Abun-dance of adult ruffe and carp demonstrated the lowestdecrease with depth (B � )0.2). Juveniles of roachand perch showed the steepest decrease with depth(B � )0.7). Juvenile bleak and pikeperch decreasedmoderately (B � )0.5) and juvenile bream and ruffedemonstrated the lowest decrease with depth(B � )0.3). GLM depth model was significant forall tested ecospecies and their responses successfullyfit the model with a linear degree (Table 4).
Responses of average weight of adult fish to depthdiffered among species more than responses of theirabundance (Fig. 3). The most common response was amore or less steep decrease of average weight with theincreasing depth as in the case of roach, bream, bleak,asp, pike, white bream and rudd (B in range )0.1to )0.9; Fig. 3g–i). Models of response of aver-age weight to depth were significant for all testedspecies.
Distance
The distance from the dam had the second strongesteffect on fish community characteristics (Tables 2and 3). Both marginal and conditional effects of thedistance were significant with the exception of theconditional effect on total average weight.
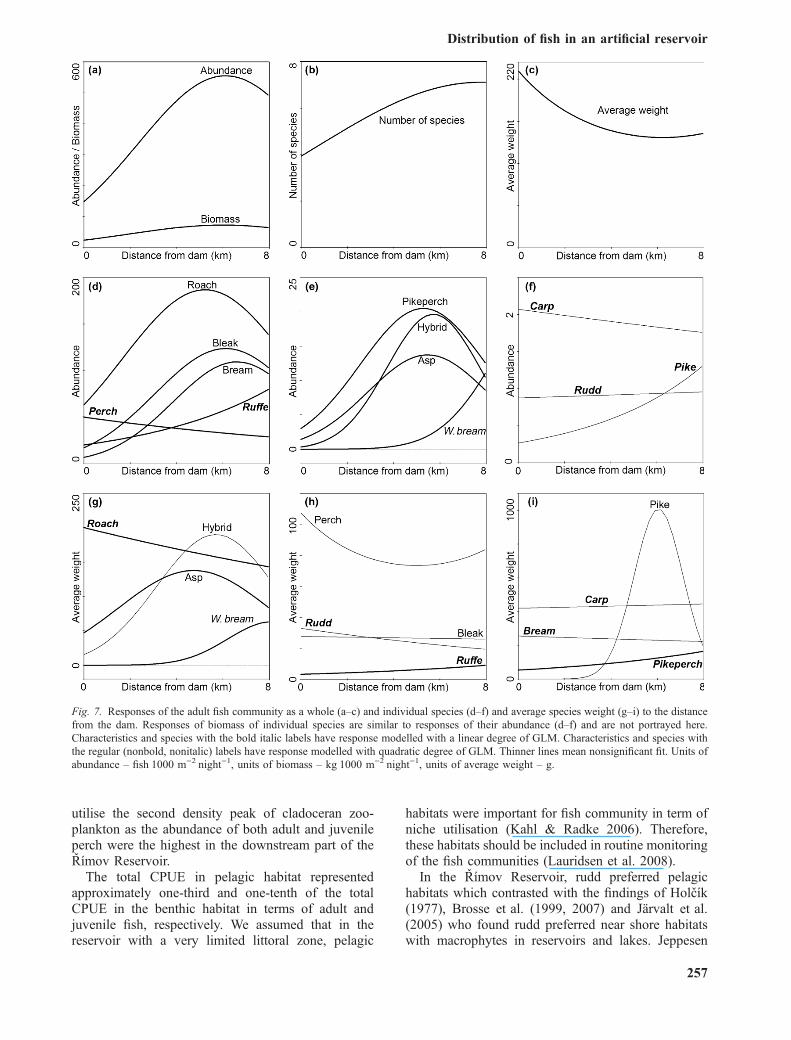
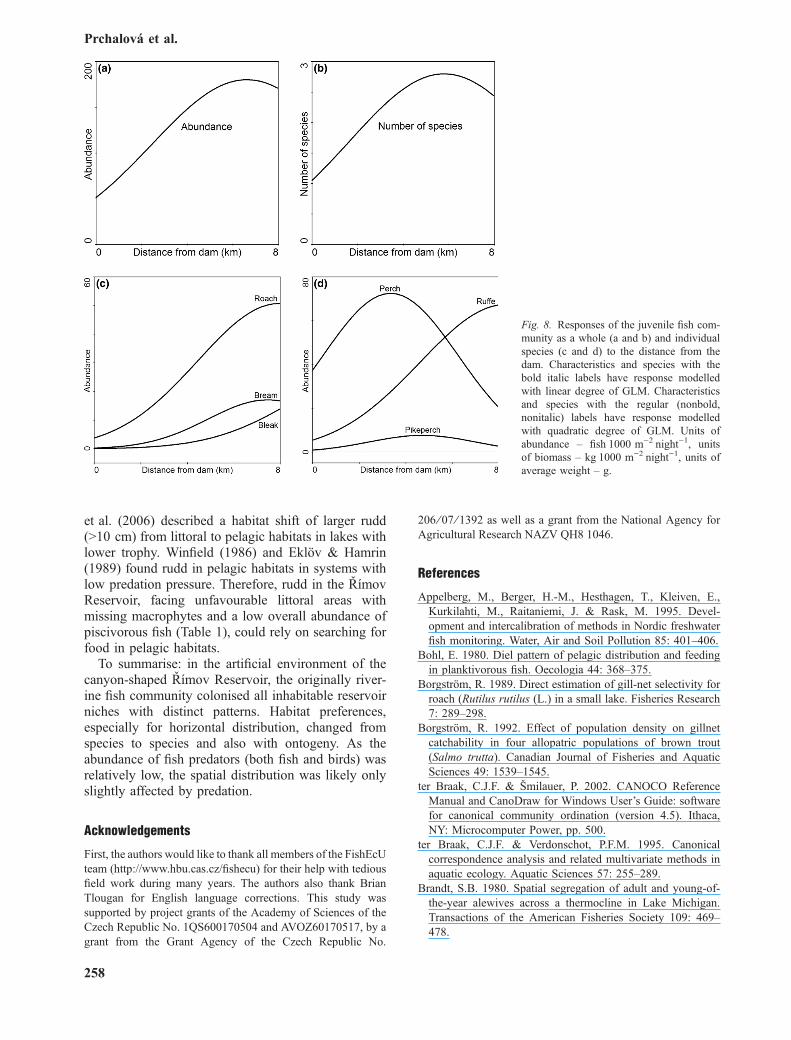
The total abundance and biomass of adult fish(Fig. 7a) and the total abundance and the number ofspecies of juvenile fish (Fig. 8a and b) continuouslyincreased heading away from the dam and reached theoptimum close to the tributary approximately 6 kmfrom the dam. The number of species of adult fishreached maximum at the tributary part (Fig. 7b). Theaverage weight of adult fish was highest at the damand in the middle part of the reservoir (Fig. 7c).
Responses of individual species of adult fishcommunity to distance from the dam differed fromeach other. In general, the community in the dam partwas similar to the community in the middle part andthese two differed from the community in the upperand tributary parts of the reservoir (Figs. 4 and 6). Themost common response was modelled significantlywith the quadratic degree with values increasingcontinuously from the dam and peaking close to thetributary (Table 4, Fig. 7). All tested species werefound in all parts of the reservoir. Only white breamwere strictly bounded to the tributary and the upperparts of the reservoir (Fig. 7e).
Responses of most species of the juvenile commu-nity differed from those of the adult fish (Fig. 8). Allspecies fit better with the quadratic degree of thesignificant model (Table 4).
Modelling of responses of average weight of adultfish to the distance from the dam showed that fish ofdifferent sizes inhabited different parts of the reservoir.Roach, pikeperch and ruffe had significant fit with thelinear degree of the model: The largest individuals ofroach were caught at the dam (Fig. 7g) and averageweight of pikeperch and ruffe increased from the damto the tributary (Fig. 7h and i). Asp and white breamhad significant fit with the quadratic degree of themodel: The largest asp were recorded around 5.5 kmfrom the dam and the largest white bream were caughtat the tributary part (Fig. 7g).
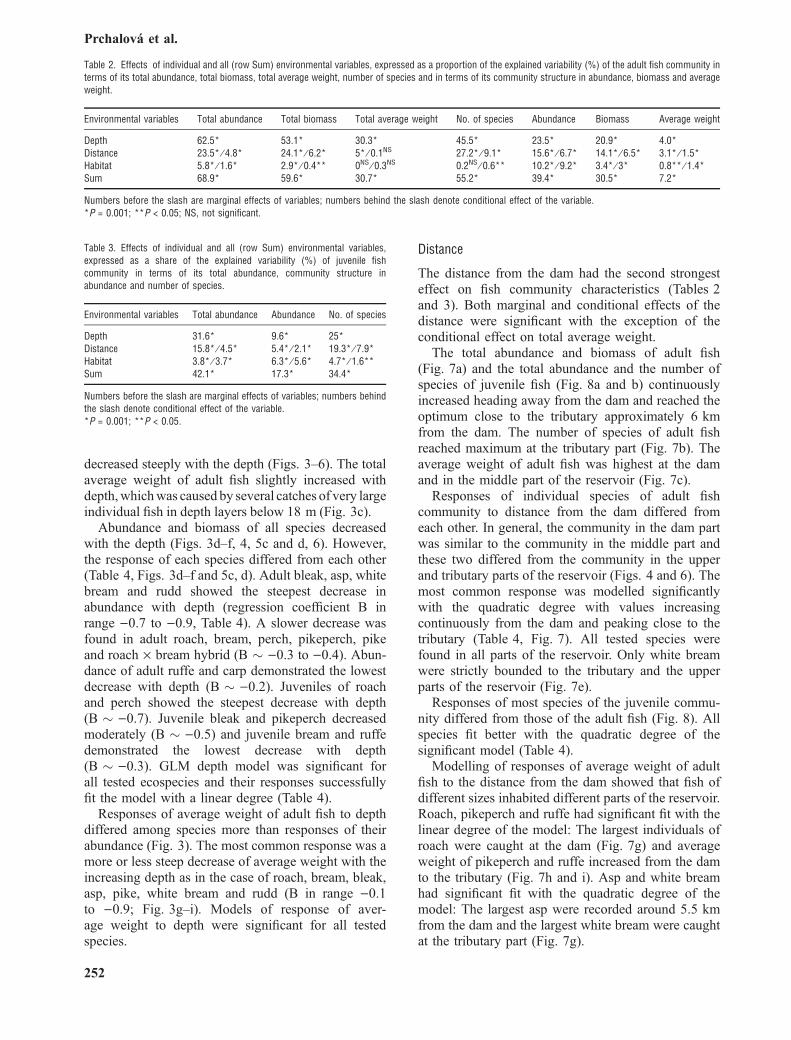
Table 2. Effects of individual and all (row Sum) environmental variables, expressed as a proportion of the explained variability (%) of the adult fish community interms of its total abundance, total biomass, total average weight, number of species and in terms of its community structure in abundance, biomass and averageweight.
Environmental variables Total abundance Total biomass Total average weight No. of species Abundance Biomass Average weight
Depth 62.5* 53.1* 30.3* 45.5* 23.5* 20.9* 4.0*Distance 23.5* ⁄ 4.8* 24.1* ⁄ 6.2* 5* ⁄ 0.1NS 27.2* ⁄ 9.1* 15.6* ⁄ 6.7* 14.1* ⁄ 6.5* 3.1* ⁄ 1.5*Habitat 5.8* ⁄ 1.6* 2.9* ⁄ 0.4** 0NS ⁄ 0.3NS 0.2NS ⁄ 0.6** 10.2* ⁄ 9.2* 3.4* ⁄ 3* 0.8** ⁄ 1.4*Sum 68.9* 59.6* 30.7* 55.2* 39.4* 30.5* 7.2*
Numbers before the slash are marginal effects of variables; numbers behind the slash denote conditional effect of the variable.*P = 0.001; **P < 0.05; NS, not significant.
Table 3. Effects of individual and all (row Sum) environmental variables,expressed as a share of the explained variability (%) of juvenile fishcommunity in terms of its total abundance, community structure inabundance and number of species.
Environmental variables Total abundance Abundance No. of species
Depth 31.6* 9.6* 25*Distance 15.8* ⁄ 4.5* 5.4* ⁄ 2.1* 19.3* ⁄ 7.9*Habitat 3.8* ⁄ 3.7* 6.3* ⁄ 5.6* 4.7* ⁄ 1.6**Sum 42.1* 17.3* 34.4*
Numbers before the slash are marginal effects of variables; numbers behindthe slash denote conditional effect of the variable.*P = 0.001; **P < 0.05.
Prchalova et al.
252
Habitat type
Habitat-type variable explained the smallest part of thevariability of sampled characteristics (Table 2). Boththe marginal and conditional effects were significantwith the exceptions of the effect on total averageweight and number of species of adult fish.
The structure of the adult as well as the juvenile fishcommunities clearly differed between benthic and
pelagic habitats (Table 1). However, all dominantspecies occupied both habitat types. The fish commu-nity was dominated by adult roach and juvenile perchand ruffe in benthic habitats. The pelagic habitats weredominated by adult bleak, roach and also bream andjuvenile roach, bream and bleak.
According to ordination analyses, the adult fishcommunity could be interpreted as three groups ofspecies (Fig. 4): The first group consisted of pelagic
Fig. 3. Responses of the adult fish community as a whole (a–c), individual species (d–f) and average species weight (g–i) to depth. Responsesof biomass of individual species are similar to responses of their abundance (d–f) and are not portrayed here. Characteristics and species withbold italic labels have responses modelled with a linear degree of GLM. Characteristics and species with the regular (nonbold, nonitalic) labelshave responses modelled with a quadratic degree of GLM. Units of abundance – fishÆ1000 m)2Ænight)1, units of biomass –kgÆ1000 m)2Ænight)1, units of average weight – g.
Distribution of fish in an artificial reservoir
253
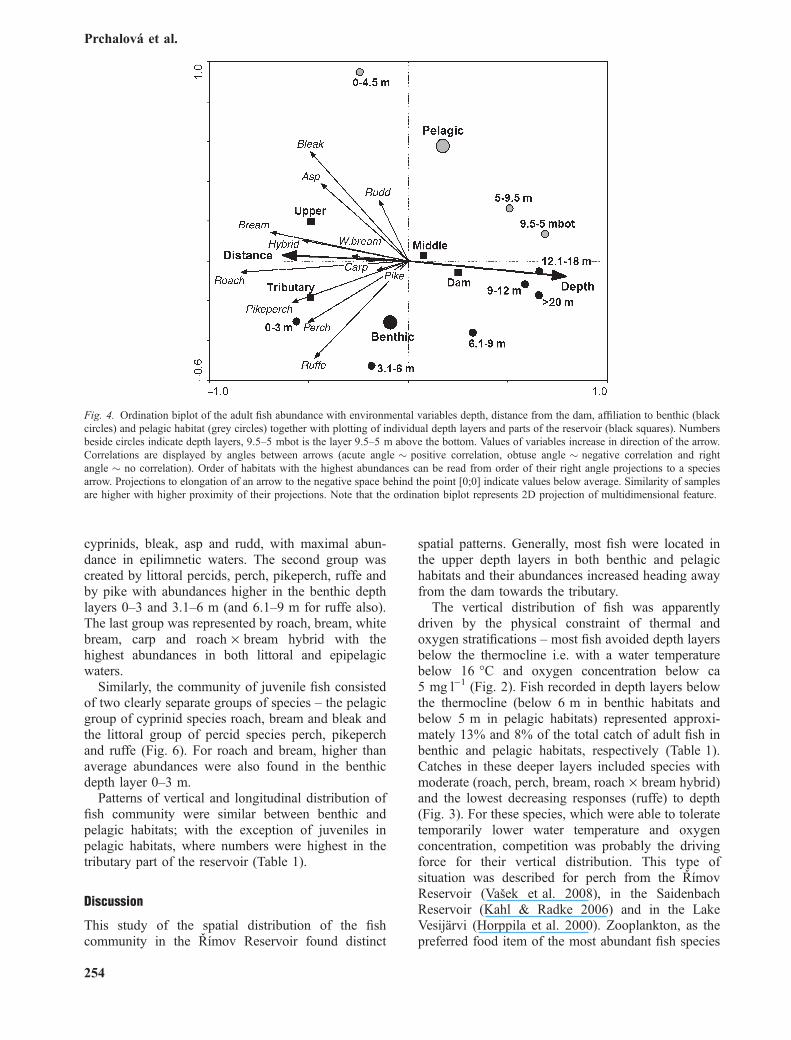
cyprinids, bleak, asp and rudd, with maximal abun-dance in epilimnetic waters. The second group wascreated by littoral percids, perch, pikeperch, ruffe andby pike with abundances higher in the benthic depthlayers 0–3 and 3.1–6 m (and 6.1–9 m for ruffe also).The last group was represented by roach, bream, whitebream, carp and roach · bream hybrid with thehighest abundances in both littoral and epipelagicwaters.
Similarly, the community of juvenile fish consistedof two clearly separate groups of species – the pelagicgroup of cyprinid species roach, bream and bleak andthe littoral group of percid species perch, pikeperchand ruffe (Fig. 6). For roach and bream, higher thanaverage abundances were also found in the benthicdepth layer 0–3 m.
Patterns of vertical and longitudinal distribution offish community were similar between benthic andpelagic habitats; with the exception of juveniles inpelagic habitats, where numbers were highest in thetributary part of the reservoir (Table 1).
Discussion
This study of the spatial distribution of the fishcommunity in the Rımov Reservoir found distinct
spatial patterns. Generally, most fish were located inthe upper depth layers in both benthic and pelagichabitats and their abundances increased heading awayfrom the dam towards the tributary.
The vertical distribution of fish was apparentlydriven by the physical constraint of thermal andoxygen stratifications – most fish avoided depth layersbelow the thermocline i.e. with a water temperaturebelow 16 �C and oxygen concentration below ca5 mgÆl)1 (Fig. 2). Fish recorded in depth layers belowthe thermocline (below 6 m in benthic habitats andbelow 5 m in pelagic habitats) represented approxi-mately 13% and 8% of the total catch of adult fish inbenthic and pelagic habitats, respectively (Table 1).Catches in these deeper layers included species withmoderate (roach, perch, bream, roach · bream hybrid)and the lowest decreasing responses (ruffe) to depth(Fig. 3). For these species, which were able to toleratetemporarily lower water temperature and oxygenconcentration, competition was probably the drivingforce for their vertical distribution. This type ofsituation was described for perch from the RımovReservoir (Vasek et al. 2008), in the SaidenbachReservoir (Kahl & Radke 2006) and in the LakeVesijarvi (Horppila et al. 2000). Zooplankton, as thepreferred food item of the most abundant fish species
Fig. 4. Ordination biplot of the adult fish abundance with environmental variables depth, distance from the dam, affiliation to benthic (blackcircles) and pelagic habitat (grey circles) together with plotting of individual depth layers and parts of the reservoir (black squares). Numbersbeside circles indicate depth layers, 9.5–5 mbot is the layer 9.5–5 m above the bottom. Values of variables increase in direction of the arrow.Correlations are displayed by angles between arrows (acute angle � positive correlation, obtuse angle � negative correlation and rightangle � no correlation). Order of habitats with the highest abundances can be read from order of their right angle projections to a speciesarrow. Projections to elongation of an arrow to the negative space behind the point [0;0] indicate values below average. Similarity of samplesare higher with higher proximity of their projections. Note that the ordination biplot represents 2D projection of multidimensional feature.
Prchalova et al.
254
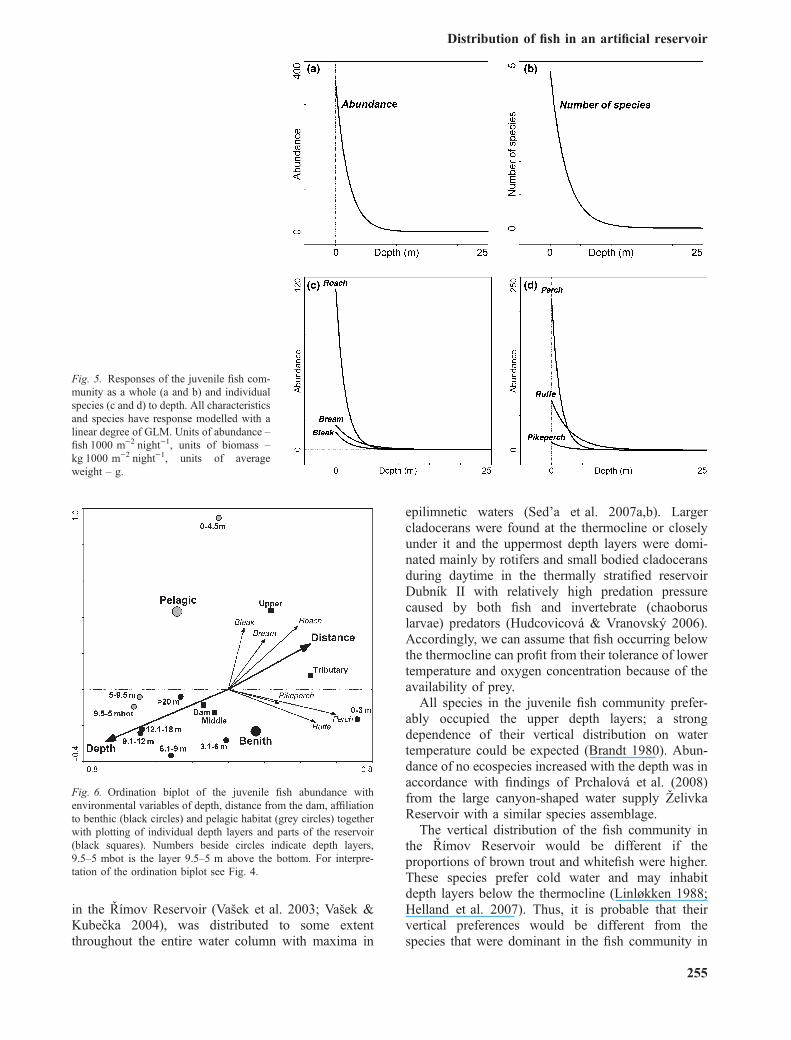
in the Rımov Reservoir (Vasek et al. 2003; Vasek &Kubecka 2004), was distributed to some extentthroughout the entire water column with maxima in
epilimnetic waters (Sed’a et al. 2007a,b). Largercladocerans were found at the thermocline or closelyunder it and the uppermost depth layers were domi-nated mainly by rotifers and small bodied cladoceransduring daytime in the thermally stratified reservoirDubnık II with relatively high predation pressurecaused by both fish and invertebrate (chaoboruslarvae) predators (Hudcovicova & Vranovsky 2006).Accordingly, we can assume that fish occurring belowthe thermocline can profit from their tolerance of lowertemperature and oxygen concentration because of theavailability of prey.
All species in the juvenile fish community prefer-ably occupied the upper depth layers; a strongdependence of their vertical distribution on watertemperature could be expected (Brandt 1980). Abun-dance of no ecospecies increased with the depth was inaccordance with findings of Prchalova et al. (2008)from the large canyon-shaped water supply ZelivkaReservoir with a similar species assemblage.
The vertical distribution of the fish community inthe Rımov Reservoir would be different if theproportions of brown trout and whitefish were higher.These species prefer cold water and may inhabitdepth layers below the thermocline (Linløkken 1988;Helland et al. 2007). Thus, it is probable that theirvertical preferences would be different from thespecies that were dominant in the fish community in
Fig. 5. Responses of the juvenile fish com-munity as a whole (a and b) and individualspecies (c and d) to depth. All characteristicsand species have response modelled with alinear degree of GLM. Units of abundance –fishÆ1000 m)2Ænight)1, units of biomass –kgÆ1000 m)2Ænight)1, units of averageweight – g.
Fig. 6. Ordination biplot of the juvenile fish abundance withenvironmental variables of depth, distance from the dam, affiliationto benthic (black circles) and pelagic habitat (grey circles) togetherwith plotting of individual depth layers and parts of the reservoir(black squares). Numbers beside circles indicate depth layers,9.5–5 mbot is the layer 9.5–5 m above the bottom. For interpre-tation of the ordination biplot see Fig. 4.
Distribution of fish in an artificial reservoir
255
the Rımov Reservoir and were included in theanalyses.
We could interpret changes in fish numbers andcommunity structure on the longitudinal axis of thereservoir as a gradient of fish communities along thegeneral trophic gradient. Fish abundance and biomassincreased with trophy and were high in eutrophicwaterbodies (e.g. Jeppesen et al. 2002, 2005; Rasket al. 2003; Garcia et al. 2006) as well as in theupstream parts of the Rımov Reservoir. Cyprinidsprevailed in these parts of the reservoir and waterbodieswith high trophy (e.g. Olin et al. 2002, 2006). Contrary,mesotrophic downstream parts of the Rımov Reservoirand waterbodies with lower trophy had higher propor-tion of perch in the community (Persson et al. 1988).
Moreover, high abundances of juvenile fish at thetributary could be positively influenced by tributaryspawning of many fish species of the Rımov Reservoir(Hladık & Kubecka 2003) followed by a downstreamdrift of eggs, larvae and juveniles (Peterka et al. 2004).Further, a high number of species could be related tothe proximity of the river as a species source(Fernando & Holcık 1991).
However, the tributary part of the Rımov Reservoircould be too trophic for many abundant ecospecies.
Abundances of these ecospecies had optima not at thetributary but approximately 1–2 km downstream fromit. Griffiths (2006) compared many reservoirs andlakes and showed that the lacustrine fish biomassincreased up to the concentration of TP of 140 lgÆl)1,in waters with a higher concentration of TP biomasslevelled off or decreased. The concentration of TP atthe tributary of the Rımov Reservoir reached a valueof 155 lgÆl)1 (August 1999, depth 0.5 m; Jezberaet al. 2003; Masın et al. 2003), which could be thevalue higher than optimum for the above-mentionedecospecies. Further, the tributary part of the RımovReservoir was quite shallow and narrow and as suchthere could be serious lack of space to obtain thehighest fish density (Vasek et al. 2003).
The longitudinal distribution of planktonic crusta-cean had two peaks, the first one in the upper part ofthe reservoir and the second one in the dam part andpartially in the downstream area of the middle part ofthe Rımov Reservoir (Sed’a & Devetter 2000; Sed’aet al. 2007a,b). Experiments with perch and roachshowed that perch were better in evaluating predationrisk and in taking advantage of different prey avail-ability in refuge habitats (Persson & Eklov 1995;Eklov & Persson 1996). So, it seemed that perch could
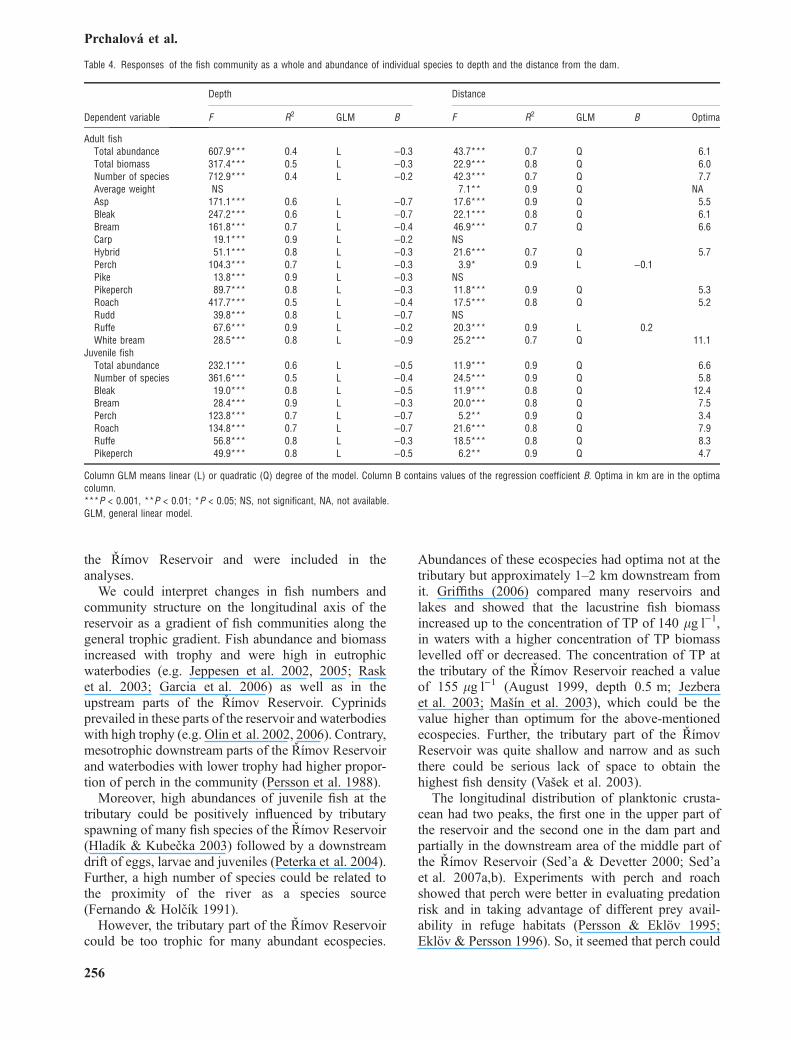
Table 4. Responses of the fish community as a whole and abundance of individual species to depth and the distance from the dam.
Dependent variable
Depth Distance
F R2 GLM B F R2 GLM B Optima
Adult fishTotal abundance 607.9*** 0.4 L )0.3 43.7*** 0.7 Q 6.1Total biomass 317.4*** 0.5 L )0.3 22.9*** 0.8 Q 6.0Number of species 712.9*** 0.4 L )0.2 42.3*** 0.7 Q 7.7Average weight NS 7.1** 0.9 Q NAAsp 171.1*** 0.6 L )0.7 17.6*** 0.9 Q 5.5Bleak 247.2*** 0.6 L )0.7 22.1*** 0.8 Q 6.1Bream 161.8*** 0.7 L )0.4 46.9*** 0.7 Q 6.6Carp 19.1*** 0.9 L )0.2 NSHybrid 51.1*** 0.8 L )0.3 21.6*** 0.7 Q 5.7Perch 104.3*** 0.7 L )0.3 3.9* 0.9 L )0.1Pike 13.8*** 0.9 L )0.3 NSPikeperch 89.7*** 0.8 L )0.3 11.8*** 0.9 Q 5.3Roach 417.7*** 0.5 L )0.4 17.5*** 0.8 Q 5.2Rudd 39.8*** 0.8 L )0.7 NSRuffe 67.6*** 0.9 L )0.2 20.3*** 0.9 L 0.2White bream 28.5*** 0.8 L )0.9 25.2*** 0.7 Q 11.1
Juvenile fishTotal abundance 232.1*** 0.6 L )0.5 11.9*** 0.9 Q 6.6Number of species 361.6*** 0.5 L )0.4 24.5*** 0.9 Q 5.8Bleak 19.0*** 0.8 L )0.5 11.9*** 0.8 Q 12.4Bream 28.4*** 0.9 L )0.3 20.0*** 0.8 Q 7.5Perch 123.8*** 0.7 L )0.7 5.2** 0.9 Q 3.4Roach 134.8*** 0.7 L )0.7 21.6*** 0.8 Q 7.9Ruffe 56.8*** 0.8 L )0.3 18.5*** 0.8 Q 8.3Pikeperch 49.9*** 0.8 L )0.5 6.2** 0.9 Q 4.7
Column GLM means linear (L) or quadratic (Q) degree of the model. Column B contains values of the regression coefficient B. Optima in km are in the optimacolumn.***P < 0.001, **P < 0.01; *P < 0.05; NS, not significant, NA, not available.GLM, general linear model.
Prchalova et al.
256
utilise the second density peak of cladoceran zoo-plankton as the abundance of both adult and juvenileperch were the highest in the downstream part of theRımov Reservoir.
The total CPUE in pelagic habitat representedapproximately one-third and one-tenth of the totalCPUE in the benthic habitat in terms of adult andjuvenile fish, respectively. We assumed that in thereservoir with a very limited littoral zone, pelagic
habitats were important for fish community in term ofniche utilisation (Kahl & Radke 2006). Therefore,these habitats should be included in routine monitoringof the fish communities (Lauridsen et al. 2008).
In the Rımov Reservoir, rudd preferred pelagichabitats which contrasted with the findings of Holcık(1977), Brosse et al. (1999, 2007) and Jarvalt et al.(2005) who found rudd preferred near shore habitatswith macrophytes in reservoirs and lakes. Jeppesen
Fig. 7. Responses of the adult fish community as a whole (a–c) and individual species (d–f) and average species weight (g–i) to the distancefrom the dam. Responses of biomass of individual species are similar to responses of their abundance (d–f) and are not portrayed here.Characteristics and species with the bold italic labels have response modelled with a linear degree of GLM. Characteristics and species withthe regular (nonbold, nonitalic) labels have response modelled with quadratic degree of GLM. Thinner lines mean nonsignificant fit. Units ofabundance – fishÆ1000 m)2Ænight)1, units of biomass – kgÆ1000 m)2Ænight)1, units of average weight – g.
Distribution of fish in an artificial reservoir
257
et al. (2006) described a habitat shift of larger rudd(>10 cm) from littoral to pelagic habitats in lakes withlower trophy. Winfield (1986) and Eklov & Hamrin(1989) found rudd in pelagic habitats in systems withlow predation pressure. Therefore, rudd in the RımovReservoir, facing unfavourable littoral areas withmissing macrophytes and a low overall abundance ofpiscivorous fish (Table 1), could rely on searching forfood in pelagic habitats.
To summarise: in the artificial environment of thecanyon-shaped Rımov Reservoir, the originally river-ine fish community colonised all inhabitable reservoirniches with distinct patterns. Habitat preferences,especially for horizontal distribution, changed fromspecies to species and also with ontogeny. As theabundance of fish predators (both fish and birds) wasrelatively low, the spatial distribution was likely onlyslightly affected by predation.
Acknowledgements
First, the authors would like to thank all members of the FishEcUteam (http://www.hbu.cas.cz/fishecu) for their help with tediousfield work during many years. The authors also thank BrianTlougan for English language corrections. This study wassupported by project grants of the Academy of Sciences of theCzech Republic No. 1QS600170504 and AVOZ60170517, by agrant from the Grant Agency of the Czech Republic No.
206 ⁄ 07 ⁄ 1392 as well as a grant from the National Agency forAgricultural Research NAZV QH8 1046.
References
Appelberg, M., Berger, H.-M., Hesthagen, T., Kleiven, E.,Kurkilahti, M., Raitaniemi, J. & Rask, M. 1995. Devel-opment and intercalibration of methods in Nordic freshwaterfish monitoring. Water, Air and Soil Pollution 85: 401–406.
Bohl, E. 1980. Diel pattern of pelagic distribution and feedingin planktivorous fish. Oecologia 44: 368–375.
Borgstrom, R. 1989. Direct estimation of gill-net selectivity forroach (Rutilus rutilus (L.) in a small lake. Fisheries Research7: 289–298.
Borgstrom, R. 1992. Effect of population density on gillnetcatchability in four allopatric populations of brown trout(Salmo trutta). Canadian Journal of Fisheries and AquaticSciences 49: 1539–1545.
ter Braak, C.J.F. & Smilauer, P. 2002. CANOCO ReferenceManual and CanoDraw for Windows User’s Guide: softwarefor canonical community ordination (version 4.5). Ithaca,NY: Microcomputer Power, pp. 500.
ter Braak, C.J.F. & Verdonschot, P.F.M. 1995. Canonicalcorrespondence analysis and related multivariate methods inaquatic ecology. Aquatic Sciences 57: 255–289.
Brandt, S.B. 1980. Spatial segregation of adult and young-of-the-year alewives across a thermocline in Lake Michigan.Transactions of the American Fisheries Society 109: 469–478.
Fig. 8. Responses of the juvenile fish com-munity as a whole (a and b) and individualspecies (c and d) to the distance from thedam. Characteristics and species with thebold italic labels have response modelledwith linear degree of GLM. Characteristicsand species with the regular (nonbold,nonitalic) labels have response modelledwith quadratic degree of GLM. Units ofabundance – fishÆ1000 m)2Ænight)1, unitsof biomass – kgÆ1000 m)2Ænight)1, units ofaverage weight – g.
Prchalova et al.
258
Brosse, S. & Lek, S. 1999. Predicting fish distribution in amesotrophic lake by hydroacoustic survey and artificialneural networks. Limnology and Oceanography 44: 1293–1303.
Brosse, S. & Lek, S. 2002. Relationships between environ-mental characteristics and the density of age-0 Eurasian perchPerca fluviatilis in the littoral zone of a lake: a nonlinearapproach. Transactions of the American Fisheries Society131: 1033–1043.
Brosse, S., Guegan, J.-F., Tourenq, J.-N. & Lek, S. 1999. Theuse of artificial neural networks to assess fish abundance andspatial occupancy in the littoral zone of a mesotrophic lake.Ecological Modeling 120: 299–311.
Brosse, S., Grossman, G.D. & Lek, S. 2007. Fish assemblagepatterns in the littoral zone of a European reservoir.Freshwater Biology 52: 448–458.
Cech, M. & Kubecka, J. 2006. Ontogenetic changes in thebathypelagic distribution of European perch fry Percafluviatilis monitored by hydroacoustic methods. Biologia,Bratislava 61: 211–219.
Cech, M., Kratochvıl, M., Kubecka, J., Drastık, V. & Matena, J.2005. Diel vertical migrations of bathypelagic perchfry Perca fluviatilis L. Journal of Fish Biology 66: 685–702.
Drastık, V., Kubecka, J., Tuser, M., Cech, M., Frouzova, J. &Jarolım, O. 2008. The effect of hydropower on fish stocks:comparison between cascade and non-cascade reservoirs.Hydrobiologia 609: 25–36.
Eckmann, R. & Imbrock, F. 1996. Distribution and diel verticalmigration of Eurasian perch (Perca fluvialtilis L.) duringwinter. Annales Zoologici Fennici 33: 679–686.
Eklov, P. & Hamrin, S.F. 1989. Predator efficiency and preyselection: interactions between pike Esox lucius, perch Percafluviatilis and rudd Scardinius erythrophthalmus. Oikos 56:149–156.
Eklov, P. & Persson, L. 1996. The response of prey to the riskof predation: proximate cues for refuging juvenile fish.Animal Behaviour 51: 105–115.
European Standard Document EN 14,757 2005. Water quality –sampling of fish with multimesh gillnets, CEN TC 230.
Fernando, C. H. & Holcık, J. 1991. Fish in reservoirs.Internationale Revue gesampten Hydrobiologie 76: 149–167.
Garcia, X.-F., Diekmann, M., Bramick, U., Lemcke, R. &Mehner, T. 2006. Correlations between type-indicator fishspecies and lake productivity in German lowland lakes.Journal of Fish Biology 68: 1144–1157.
Gido, K.B. & Matthews, W.J. 2000. Dynamics of the offshorefish assemblage in southwestern reservoir (Lake Texoma,Oklahoma–Texas). Copeia 2000: 917–930.
Gliwicz, Z.M., Slon, J. & Szynkarczyk, I. 2006. Trading safetyfor food: evidence from gut contents in roach and bleakcaptured at different distances offshore from their daytimelittoral refuge. Freshwater Biology 51: 823–839.
Griffiths, D. 2006. The direct contribution of fish to lakephosphorus cycles. Ecology of Freshwater Fish 15: 86–95.
Hejzlar, J. & Vyhnalek, V. 1998. Longitudinal heterogeneity ofphosphorus and phytoplankton concentrations in deep-valleyreservoirs. International Review of Hydrobiology 83: 139–146.
Helland, I.P., Freyhof, J., Kasprzak, P. & Mehner, T. 2007. Tem-perature sensitivity of vertical distributions of zooplankton
and planktivorous fish in a stratified lake. Oecologia 151:322–330.
Hladık, M. & Kubecka, J. 2003. Fish migration between atemperate reservoir and its main tributary. Hydrobiologia504: 251–266.
Holcık, J. 1977. Changes in fish community of Klıcavareservoir with particular reference to Eurasian perch (Percafluviatilis), 1957–72. Journal of Fisheries Research Board ofCanada 34: 1734–1747.
Horppila, J., Ruuhijarvi, J., Rask, M., Karppinen, C., Nyberg,K. & Olin, M. 2000. Seasonal changes in the diets andrelative abundances of perch and roach in the littoral andpelagic zones of a large lake. Journal of Fish Biology 56: 51–72.
Hudcovicova, M. & Vranovsky, M. 2006. Vertical distributionof pelagial zooplankton in a middle-sized dimictic valleyreservoir. Biologia 61: 171–177.
Irz, P., Laurent, A., Messad, S., Pronier, O. & Argillier, C.2002. Influence of site characteristics on fish communitypatterns in French reservoirs. Ecology of Freshwater Fish 11:123–136.
Jacobsen, L., Berg, S., Jepsen, N. & Skov, C. 2004. Does roachbehaviour differ between shallow lakes of different environ-mental state? Journal of Fish Biology 65: 135–147.
Jarvalt, A., Krause, T. & Palm, A. 2005. Diel migration andspatial distribution of fish in a small stratified lake. Hydro-biologia 547: 197–203.
Jeppesen, E., Jensen, J.P. & Sondergaard, M. 2002. Response ofphytoplankton, zooplankton, and fish to re-oligotrophication:An 11 year study of 23 Danish lakes. Aquatic EcosystemHealth & Management 5: 31–43.
Jeppesen, E., Jensen, J.P., Sodergaard, M. & Lauridsen, T.2005. Response of fish and plankton to nutrient loadingreduction in eight shallow Danish lakes with special empha-sis on seasonal dynamics. Freshwater Biology 50: 1616–1627.
Jeppesen, E., Pekcan-Hekim, Z., Lauridsen, T.L., Sondergaard,M. & Jensen, J.P. 2006. Habitat distribution of fish in latesummer: changes along a nutrient gradient in Danish lakes.Ecology of Freshwater Fish 15: 180–190.
Jezbera, J., Nedoma, J. & Simek, K. 2003. Longitudinalchanges in protistan bacterivory and bacterial production intwo canyon-shaped reservoirs of different trophic status.Hydrobiologia 504: 115–130.
Kahl, U. & Radke, R.J. 2006. Habitat and food resource use ofperch and roach in a deep mesotrophic reservoir: enoughspace to avoid competition? Ecology of Freshwater Fish 15:48–56.
Kubecka, J. & Wittingerova, M. 1998. Horizontal beaming as acrucial component of acoustic stock assessment in freshwaterreservoirs. Fisheries Research 35: 99–106.
Lauridsen, T., Landkildehus, F., Jeppesen, E., Jørgensen, T. &Søndergaard, M. A. 2008. Comparison of methods forcalculating Catch Per Unit Effort (CPUE) of gill net catchesin lakes. Fisheries Research 93: 204–211.
Leps, J. & Smilauer, P. 2003. Effects of habitat and foodresources on morphology and ontogenetic growth trajectoriesin perch. Cambridge: Cambridge University Press, pp. 269
Linløkken, A. 1988. Vertical distribution of brown trout (Salmotrutta) and perch (Perca fluviatilis) in an acidified lake.Water, Air and Soil Pollution 40: 203–213.
Distribution of fish in an artificial reservoir
259
Linløkken, A. & Haugen, T.O. 2006. Density and temperaturedependence of gill net catch per unit effort for perch, Percafluviatilis, and roach, Rutilus rutilus. Fisheries Managementand Ecology 13: 261–269.
Masın, M., Jezbera, J., Nedoma, J., Straskrabova, V., Hejzlar, J.& Simek, K. 2003. Changes in bacterial community compo-sition and microbial activities along the longitudinal axis oftwo canyon-shaped reservoirs with different inflow loading.Hydrobiologia 504: 99–113.
Matthews, W.J., Gido, K.B. & Gelwick, F.P. 2004. Fishassemblages of reservoirs, illustrated by Lake Texoma(Oklahoma - Texas, USA) as a representative system. Lakeand Reservoir Management 20: 219–239.
Mous, J.P., van Densen, W.L.T. & Machiels, M.A.M. 2004.Vertical distribution patterns of zooplanktivorous fish in ashallow, eutrophic lake, mediated by water transparency.Ecology of Freshwater Fish 13: 61–69.
Olin, M. & Malinen, T. 2003. Comparison of gillnet and trawlin diurnal fish community sampling. Hydrobiologia 506 509:443–449.
Olin, M., Rask, M., Ruuhijarvi, M., Kurkilahti, M., Ola-Opas,P. & Ylonen, O. 2002. Fish community structure inmesotrophic and eutrophic lakes of southern Finland: therelative abundances of percids and cyprinids along a trophicgradient. Journal of Fish Biology 60: 593–612.
Olin, M., Rask, M., Ruuhijarvi, J., Keskitalo, J., Horppila, J.,Tallberg, P., Taponen, T., Lehtovaara, A. & Sammalkorpi, I.2006. Effect of biomanipulation on fish and planktoncommunities in ten eutrophic lakes of southern Finland.Hydrobiologia 553: 67–88.
Persson, L. & Eklov, P. 1995. Prey refuges affecting interac-tions between piscivorous perch and juvenile perch androach. Ecology 76: 70–81.
Persson, L., Andersson, G., Hamrin, S.F. & Johansson, L. 1988.Predation regulation and primary production along theproductivity gradient of temperate lake ecosystems. In:Carpenter, S. R., ed. Complex interactions in lake commu-nities. New York: Springer Verlag, pp. 45–65.
Peterka, J., Vasek, M., Kubecka, J., Hladık, M. & Hohausova,E. 2004. Drift of juveniles after riverine spawning of fishesfrom the Rımov reservoir, Czech Republic. Ecohydrologyand Hydrobiology 4: 459–468.
Prchalova, M., Kubecka, J., Hladık, M., Hohausova, E., Cech,M. & Frouzova, J. 2006. Fish habitat preferences in anartificial reservoir system. Verhandlungen der InternationalenVereinigung fur Limnologie 29: 1890–1894.
Prchalova, M., Kubecka, J., Vasek, M., Peterka, J., Sed’a, J.,Juza, T., Rıha, M., Jarolım, O., Tuser, M., Kratochvıl, M.,Cech, M., Drastık, V., Frouzova, J. & Hohausova, E. 2008.Patterns of fish distribution in a canyon-shaped reservoir.Journal of Fish Biolog 73: 54–78.
Rask, M., Olin, M., Keskitalo, J., Lehtovaara, A., Ruuhijarvi, J.& Vesala, S. 2003. Responses of plankton and fish commu-nities to mass removal of planktivorous fish ain a two-basinlake in southern Finland. Hydrobiologia 506–509: 451–457.
Rowe, D.K. 1994. Vertical segregation and seasonal changes infish depth distributions between lakes of contrasting trophicstatus. Journal of Fish Biology 45: 787–800.
Scheuerell, M.D. & Schindler, D.E. 2004. Changes in thespatial distribution of fishes in lakes along a residentialdevelopment gradient. Ecosystems 7: 98–106.
Sed’a, J. & Devetter, M. 2000. Zooplankton communitystructure along a trophic gradient in a canyon-shaped damreservoir. Journal of Plankton Research 22: 1829–1840.
Sed’a, J., Kolarova, K., Petrusek, A. & Machacek, J. 2007a.Daphnia galeata in the deep hypolimnion: spatial differen-tiation of a ‘‘typical epilimnetic’’ species. Hydrobiologia 594:47–57.
Sed’a, J., Petrusek, A., Machacek, J. & Smilauer, P. 2007b.Spatial distribution of the Daphnia longispina species com-plex and other planktonic crustaceans in the heterogeneousenvironment of canyon-shaped reservoirs. Journal of Plank-ton Research 29: 619–628.
Simek, K., Hornak, K., Masın, M., Christaki, U., Nedoma, J.,Weinbauer, M.G. & Dolan, J.R. 2003. Comparing the effectsof resource enrichment and grazing on a bacterioplanktoncommunity of a meso-eutrophic reservoir. Aquatic MicrobialEcology 31: 123–135.
Straskraba, M. 1974. Seasonal cycle of the depth distribution offish in the Klıcava Reservoir. Czech Journal of AnimalSciences 19: 656–660.
Straskrabova, V., Hejzlar, J., Prochazkova, L. & Vyhnalek, V.1994. Eutrophication in stratified deep reservoirs. WaterScience and Technology 30: 273–279.
Vasek, M. & Kubecka, J. 2004. In situ diel patterns ofzooplankton consumption by subadult ⁄ adult roach Rutilusrutilus, bream Abramis brama, and bleak Alburnus alburnus.Folia Zoologica 53: 203–214.
Vasek, M., Kubecka, J., Cech, M., Drastık, V., Matena, J.,Peterka, J. & Prchalova, M. 2008. Diel variation in gillnetcatches and vertical distribution of pelagic fishes in astratified European reservoir. Fisheries Research ????: ???(in press).
Vasek, M., Kubecka, J. & Sed’a, J. 2003. Cyprinid predation onzooplankton along the longitudinal profile of a canyon-shaped reservoir. Archiv fur Hydrobiologie 156: 535–550.
Vasek, M., Kubecka, J., Peterka, J., Cech, M., Drastık, V.,Hladık, M., Prchalova, M. & Frouzova, J. 2004. Longitudinaland vertical spatial gradients in the distribution of fish withina canyon-shaped reservoir. International Review of Hydro-biology 89: 352–362.
Vasek, M., Kubecka, J., Matena, J. & Sed’a, J. 2006.Distribution and diet of 0+ fish within a canyon-shapedEuropean reservoir in late summer. International Review ofHydrobiology 91: 178–194.
Vondracek, B., Baltz, D.M., Brown, L.R. & Moyle, P.B. 1989.Spatial, seasonal and diel distribution of fishes in Californiareservoir dominated by native fishes. Fisheries Research 7:31–35.
Winfield, I.J. 1986. The influence of simulated aquatic macro-phytes on the zooplankton consumption rate of juvenileroach, Rutilus rutilus, rudd, Scardinius erythrophthalmus,and perch, Perca fluviatilis. Journal of Fish Biology 29: 37–48.
Prchalova et al.
260


