Embed Size (px)
Citation preview

1 2 3 4 5 6 7 8 9 1011121314151617181920212223242526272829303132333435363738394041424344454647484950515253545556575859606162636465
1
The Hippo pathway effector YAP controls mouse hepatic stellate cell activation
Inge Mannaertsa*, Sofia Batista Leitea*, Stefaan Verhulsta, Sofie Claerhoutb, Nathalie Eysackersa, Lien F.R. Thoena, Anne Hoorensc, Hendrik Reynaerta, Georg Halderb, Leo A. van Grunsvena
*Equal contribution Affiliations a Liver Cell Biology Lab, Vrije Universiteit Brussel, 1090 Brussel, Belgium b VIB Center for the Biology of Disease, and KU Leuven Center for Human Genetics, University of Leuven, 3000 Leuven, Belgium c Department of Pathology, Universitair Ziekenhuis Brussel, Brussels, Belgium Email contacts [email protected] , [email protected] , [email protected], [email protected], [email protected], [email protected] , [email protected] , [email protected], [email protected], [email protected] Contact Information Leo A. van Grunsven Liver Cell Biology Lab, Vrije Universiteit Brussel Laarbeeklaan 103, 1090 Brussels, Belgium [email protected] +32 2 477 44 07 List of Abbreviations HSC, hepatic stellate cell; ECM, extracellular matrix; CCl4, carbontetrachloride; CBDL, Common Bile Duct Ligation; Lox, lysyl oxidase; αSMA, α Smooth muscle actin (encoded by Acta2, actin, alpha 2, smooth muscle, aorta); ALT, alanine aminotransferase; TGFβ1, Transforming growth factor-β1; Ankrd1, cardiac ankyrin repeat protein ; Ctgf, Connective Tissue Growth Factor; YAP, Yes-associated Protein; VP, verteporfin; PDMS, Polydimethylsiloxane; 3D, Three-dimensional. Word Count Abstract: 237 Word Count Text (incl abstract): 6347
Number of figures and tables: 7 figures Conflict of interest: None
Author's contributions:
I.Mannaerts study concept and design; acquisition of data; analysis and interpretation of data; statistical analysis; drafting of the manuscript; analysis. S.B.Leite acquisition of data; analysis and interpretation of data, critical revision of the manuscript. S.Verhulst data analysis and interpretation of data; statistical analysis. N. Eysackers acquisition of data; analysis and interpretation of data; statistical analysis. L.F.R.Thoen acquisition of data; analysis and interpretation of data. A.Hoorens provision of samples, interpretation of data, H. Reynaert interpretation of data and critical revision of the manuscript,
*Manuscript changes underlinedClick here to view linked References

1 2 3 4 5 6 7 8 9 1011121314151617181920212223242526272829303132333435363738394041424344454647484950515253545556575859606162636465
2 S.Claerhout analysis and interpretation of data, critical revision of the manuscript. G.Halder study concept and design, interpretation of data, critical revision of the manuscript. L.v.Grunsven study concept and design, obtained funding; interpretation of data, critical revision of the manuscript.

1 2 3 4 5 6 7 8 9 1011121314151617181920212223242526272829303132333435363738394041424344454647484950515253545556575859606162636465
3 Abstract
Background and aims: Hepatic stellate cell activation is a wound-healing response to liver injury. However,
continued activation of stellate cells during chronic liver damage causes excessive matrix deposition and the
formation of pathological scar tissue leading to fibrosis and ultimately cirrhosis. The importance of sustained
stellate cell activation for this pathological process is well recognized, and several signaling pathways that
can promote stellate cell activation have been identified, such as the TGFβ-, PDGF-, and LPS-dependent
pathways. However, the mechanisms that trigger and drive the early steps in activation are not well
understood.
Methods and results: We identified the Hippo pathway and its effector YAP as a key pathway that controls
stellate cell activation. YAP is a transcriptional co-activator and we found that it drives the earliest changes
in gene expression during stellate cell activation. Activation of stellate cells in vivo by CCl4 administration to
mice or activation in vitro caused rapid activation of YAP as revealed by its nuclear translocation and by the
induction of YAP target genes. YAP was also activated in stellate cells of human fibrotic livers as evidenced
by its nuclear localization. Importantly, knockdown of YAP expression or pharmacological inhibition of
YAP prevented hepatic stellate cell activation in vitro and pharmacological inhibition of YAP impeded
fibrogenesis in mice.
Conclusions: YAP activation is a critical driver of hepatic stellate cell activation and inhibition of YAP
presents a novel approach for the treatment of liver fibrosis.
Keywords Fibrosis; spheroid; Gene expression profiling; Ankrd1; Ctgf, Hepatic stellate cell; liver; YAP

1 2 3 4 5 6 7 8 9 1011121314151617181920212223242526272829303132333435363738394041424344454647484950515253545556575859606162636465
4 Chronic liver injury is a world-wide burden on health systems. While impressive progress has been made in
the treatment of viral hepatitis C[1,2], other causes of chronic liver diseases, such as obesity and metabolic
syndrome, are still difficult to treat but represent an increasing proportion of patients feeding the need for
better anti-fibrotic therapies. Hepatic stellate cells (HSCs) are the main source of excessive extracellular
matrix (ECM) deposition independent of the cause of liver disease.[3,4] A key objective is therefore to
understand the mechanisms that trigger the switch of quiescent HSCs in a healthy liver to activated,
myofibroblastic HSCs in an injured liver.[4] Several extracellular cues are known that can regulate HSC
activation, including apoptotic bodies from dying hepatocytes, pro-fibrogenic cytokines such as TNFα and
TGFβ from Kupffer cells[5], changes in composition and cross-linking of the surrounding matrix[6], and
cell-cell and cell-matrix contacts.[7] However, knowledge on these factors is largely obtained from studies of
HSCs that have been cultured in vitro for several days; thus how the earliest steps of HSC activation are
regulated remains largely unexplained. By analyzing the patterns of gene expression during HSC activation
we identified the Hippo pathway and its downstream effector Yes-associated protein (YAP) as a critical
regulator of HSC activation. The Hippo signalling pathway was discovered in Drosophila, but it is
evolutionarily conserved in vertebrates where it plays important roles in the control of organ growth during
development, stem cell biology, and the progression of various diseases, in particular cancer.[8,9] At the core
of the Hippo pathway is a kinase cascade that culminates in the phosphorylation and inactivation of the
transcriptional co-activator YAP.[8,9] When the Hippo pathway kinases are inactive, YAP translocates to the
nucleus where it interacts with transcription factors such as the TEAD1–4 proteins[8-10] and promotes the
expression of target genes. We investigated the role of YAP in the process of HSC activation using in vivo
and in vitro models of fibrosis. We found that YAP is activated and translocates into the nucleus very early
during HSC activation, where it drives the expression of target genes. Importantly, YAP is essential for HSC
activation and pharmacological inhibition of YAP function inhibits HSC activation in vitro and fibrogenesis
in vivo.
Materials and methods
Materials and methods are available in supplementary information.
Results

1 2 3 4 5 6 7 8 9 1011121314151617181920212223242526272829303132333435363738394041424344454647484950515253545556575859606162636465
5
YAP target genes are induced early during HSC activation
In order to discover novel pathways that drive liver fibrogenesis, we embarked on a strategy in which we
first determined the changes in gene expression that arise during the development of fibrogenesis and then
used this set of genes to identify pathways that may regulate these genes. To identify mechanisms underlying
the initiation of fibrogenesis as it operates in vivo, and because plating HSCs on plastic dishes artificially
induces HSC activation[11], we compared gene expression profiles from unseeded HSCs that were directly
isolated from healthy and fibrotic livers. Hereto, we performed microarray analysis on freshly isolated HSCs
from healthy mice and on HSCs isolated from mice treated for 2 or 4 weeks with CCl4 (Suppl1). Comparison
of the gene expression profiles (Figure1A) identified 299 and 368 genes whose expression levels were
significantly changed after 2 and 4 weeks of CCl4 treatment respectively. Notably, the vast majority of these
genes, namely 269 genes, overlapped between the two time points (90% at 2 weeks and 73% at 4 weeks).
We also compared these profiles with the gene expression of day 10 in vitro activated HSCs. Similar to the
in vivo comparison, we found that activation of HSCs in vitro caused significant changes in the expression of
1029 genes. Notably, over 80% of the genes that changed during the activation of HSCs in vivo were also
affected in the in vitro HSC activation model, as previously observed [12]. On the other hand, the in vitro
activation of HSCs affected about three times more genes than the in vivo activation. These results indicate
that the in vitro activation method recapitulates most aspects of gene regulation in vivo but that it induces
many more changes in addition to the changes observed in vivo. Thus less than 30% of differentially
regulated genes in vitro corresponded to changes that were also observed in vivo (Figure1B). Notably, both
models identified genes related to processes that are known to be involved in HSC activation, such as matrix
remodeling and actin binding (Figure1C, Suppl2A). We then surveyed the list of induced genes in order to
discover novel regulators of HSC activation and noticed that several of the most strongly induced genes are
targets of the Hippo pathway effector YAP. For instance, the commonly assayed YAP target genes Ankrd1
(cardiac ankyrin repeat protein) and Ctgf (connective tissue growth factor), showed a striking upregulation;
25.6-fold in vitro and 6.4-fold in vivo for Ankrd1, and 2-fold in vitro and 1.6-fold in vivo for Ctgf. Expanding
this analysis to a Hippo target gene signature that was defined from expression data of cultured cells and
cancer tissues[13], showed that 15/179 genes were up-regulated during in vitro and in vivo HSC activation
(Suppl2B). We further quantified the induction of Ctgf and Ankrd1 in HSCs isolated from two models of

1 2 3 4 5 6 7 8 9 1011121314151617181920212223242526272829303132333435363738394041424344454647484950515253545556575859606162636465
6 chronic liver injury: mice repeatedly treated with CCl4 and mice that underwent common bile duct ligation
(CBDL). We observed a strong induction of Ankrd1 and a moderate induction of Ctgf mRNA over time in
both models (Figure1D). To determine how early these YAP target genes are induced, we administered a
single dose of CCl4 and isolated HSCs at regular time points after the injection. Ankrd1 and Ctgf expression
were strongly up-regulated already two hours after the CCl4 injection when compared to healthy controls
(0h). Remarkably, the YAP target genes were induced significantly earlier than the classical HSC activation
marker Acta2 (Figure1E), which was elevated only after 24hours. The kinetics of YAP target gene
expression was similar during in vitro HSC activation where Ctgf and Ankrd1 expression was strongly
induced as early as 10hours after plating primary mouse HSCs (Figure1F). This induction was massive and
although the expression declined after 10hours, at day 10 both genes were still significantly higher when
compared to freshly isolated HSCs (300-fold upregulation for Ankrd1 and 6-fold for Ctgf, Figure1F). These
data thus show that in vivo and in vitro activation of HSCs triggers an early induction of YAP target genes.
Nuclear YAP expression in mouse and human fibrotic livers
Based on the above data we hypothesized that YAP gets activated during HSC activation. To test this we
assayed YAP localization. YAP activity is regulated by phosphorylation, which causes YAP inactivation and
nuclear to cytoplasmic translocation. Activation of YAP is thus associated with its translocation from the
cytoplasm into the nucleus[10]. Double-immunohistochemistry to detect YAP and αSMA on liver sections
revealed nuclear YAP localization in activated, αSMA-positive HSCs in the fibrous septae in livers of CCl4-
treated mice but not in livers from healthy mice. In addition, fibrous livers had elevated levels of nuclear and
cytoplasmic YAP in biliary cells and hepatocytes (Figure2A). We also stained for picrosirius, ANKRD1 and
DESMIN on serial sections and observed ANKRD1-positive cells in fibrotic regions and hepatocytes of
diseased livers (Suppl3). In non-fibrotic human livers, YAP was detected in round nuclei of biliary epithelial
cells in portal tracts. Strikingly, livers from hepatitis C patients showed strong nuclear staining in
perisinusoidal cells in the liver lobules and also in myofibroblastic cells located in the fibrotic areas
(Figure2B). These data show that fibrotic mouse and human livers have highly induced levels of nuclear
YAP denoting activation of YAP in myofibroblasts.
YAP1 activation is an early event during HSC activation

1 2 3 4 5 6 7 8 9 1011121314151617181920212223242526272829303132333435363738394041424344454647484950515253545556575859606162636465
7 We quantified YAP localization at early and late time points during HSC activation. In freshly isolated,
quiescent HSCs, YAP localized exclusively in the cytoplasm. In contrast, 10hours after in vitro activation by
plating, more than 70% of cells had nuclear YAP, and 100% of cells had nuclear YAP after 10days. When
HSCs were activated in vivo, about 50% of HSCs had nuclear YAP (Figure3A, Suppl4). In addition to its
localization, YAP is regulated at the level of protein stability. Indeed, we found that the total levels of YAP
and those of its phosphorylated form were robustly elevated 10hours after seeding, while the levels of Yap
mRNA were only slightly increased. The strong upregulation of YAP protein levels was paralleled by an
increase in CTGF and ANKRD1 protein and mRNA levels and only later followed by upregulation of α-
SMA at day10 (Figure 1F and 3B,C). Altogether, we conclude from the kinetics of YAP activation and
nuclear translocation, that activation of YAP is a fast and very early event during HSC activation.
YAP is essential for HSC activation
We next wanted to determine the function of YAP during HSC activation. Our first idea to do this was to
knock down YAP using the standard protocol for siRNA transfection of HSCs, in which primary HSCs are
transfected after 1day of in vitro culturing. Activation of HSCs would then be assayed after further culturing
the transfected HSCs. However, this protocol may not be appropriate here because our data showed that
YAP already translocated to the nucleus and that the peaks of Ankrd1 and Ctgf expression already passed at
the time of knockdown in this protocol (Figure1,3). Therefore, with this method, the knockdown of YAP
would take effect only after YAP had already been activated. Indeed, although the siRNA knockdown of
YAP was efficient, it did not affect HSC activation as measured by Acta2, Col1a1, and Lox expression, and
PDGFbb-induced proliferation (Suppl5). We therefore developed a new method that allowed us to first
culture the HSCs under conditions where they remain quiescent, transfect them with siRNAs under these
conditions, and then determine their potential to be activated by plating them on regular culture plates.
Because HSC activation is influenced by matrix stiffness in vitro [11,14], we reasoned that culturing HSCs
in 3D-spheroids such that they could not attach to any substrate may keep them quiescent. Indeed, when we
cultured freshly isolated mouse HSCs in spheroids of about 200μm diameter by gentle rotation of U-bottom
plates they did not induce expression of Acta2, Ankrd1, or Ctgf in contrast to cells grown in conventional
2D-cultures (Figure4A). Importantly, when 4-day old 3D-spheroids were transferred to non-rotating

1 2 3 4 5 6 7 8 9 1011121314151617181920212223242526272829303132333435363738394041424344454647484950515253545556575859606162636465
8 conditions in flat-bottom plates, cells moved out of the 3D-structures and started to spread on the plastic
surface. This resulted in an induction of the HSC activation marker Acta2 and of Ankrd1 and Ctgf expression
(Figure4B). We conclude that the 3D-environment prevents HSC activation and that a switch to a stiff
microenvironment is sufficient to induce YAP activity and HSC activation.
This new method thus gave us the distinctive ability to control the timing of HSC activation, and we then
used it to determine the role of YAP for HSC activation. We first knocked down YAP levels by transfecting
siRNAs during the aggregation of quiescent HSCs. After four days, the spheroids were transferred to regular
attachment cultures to induce and monitor HSC activation. Control cells that were transfected with non-
targeting siRNAs (Scramble) induced robust expression of Acta2, Col1a1, Ankrd1 and Ctgf indicating that
they were efficiently activated. In contrast, HSCs with knockdown of YAP did not induce these genes
(Figure4C). In addition, we wanted to test for the function of YAP with a different strategy that did not rely
on downregulation of YAP levels by siRNA silencing. To do this, we inhibited YAP activity by treating cells
with verteporfin (VP), a pharmacological inhibitor of YAP that disrupts the YAP/TEAD complex.[15]
Treatment of HSCs with VP at the time of seeding also abolished the induction of Acta2 and Col1a1
expression that is normally observed after 7 days and suppressed the induction of Ankrd1 and Ctgf
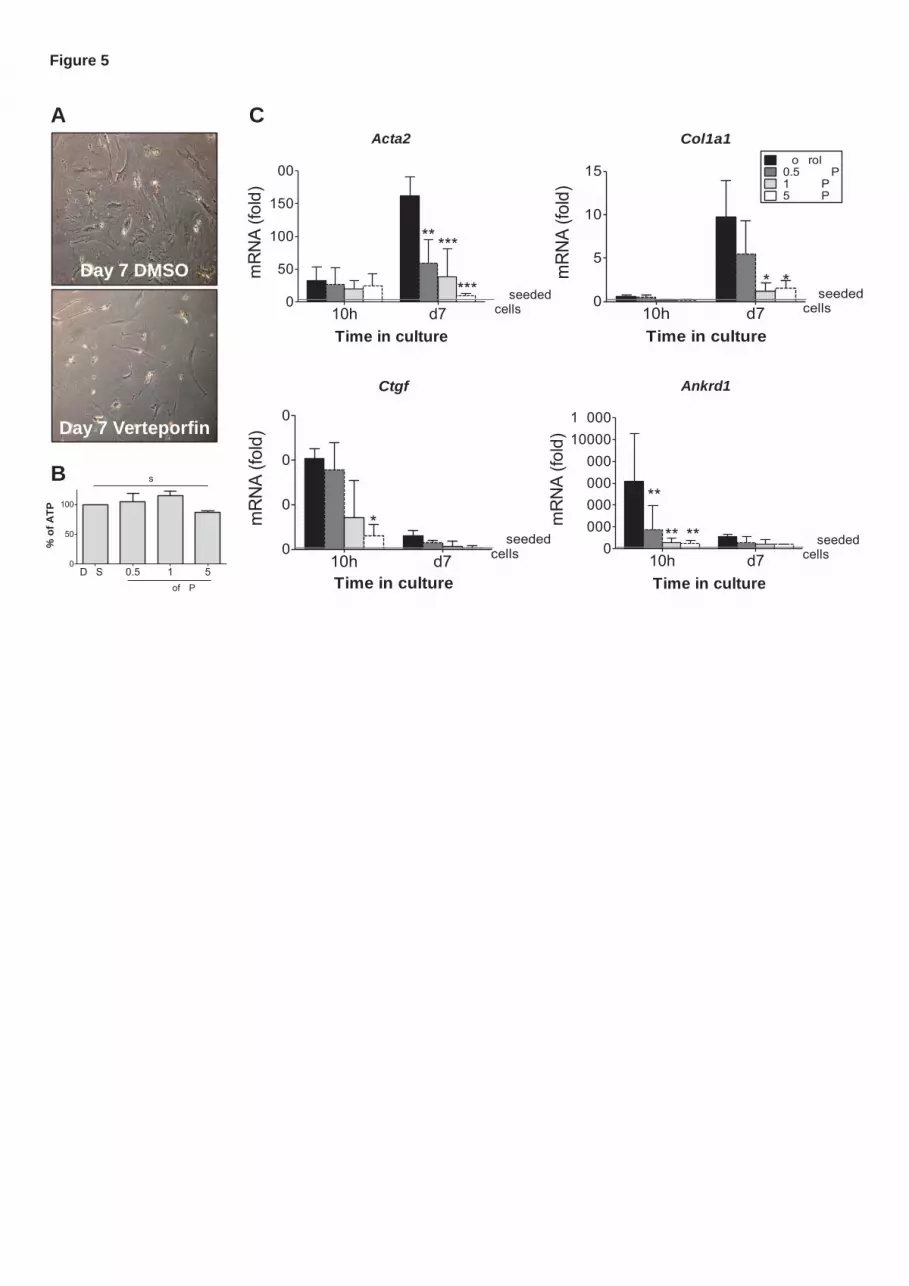
expression and the changes in cell morphology normally observed after 10 hours (Figure5A and C).
Importantly, VP treatment did not affect cell viability (Figure5B). Altogether, these results show that YAP is
essential for HSC activation.
The finding that HSCs get activated by plating them on tissue culture plates but not when grown in 3D-
spheroids confirms that the physical properties of the microenvironment regulate the status of HSCs.[11]
This is interesting because YAP is similarly regulated by the microenvironment: it is active and localized in
the nucleus in cells grown on regular, stiff cell culture plates, but is inactive and cytoplasmic in cells grown
on soft substrates or in 3D matrices. We thus wanted to test whether it is the substrate stiffness that regulates
YAP and HSC activation. When we cultured primary HSCs on soft collagen-coated PDMS-substrates (1.5
kPa), they induced much lower levels of Acta2 at day 7 (Figure6A) and did not spread as much as when they
were cultured on hard plastic dishes. Similarly, HSCs cultured on soft substrate had strongly reduced nuclear
translocation of YAP, which remained largely cytoplasmic (Figure6B) and the induction of its target genes
1 2 3 4 5 6 7 8 9 1011121314151617181920212223242526272829303132333435363738394041424344454647484950515253545556575859606162636465
9 Ankrd1 and Ctgf was completely blocked (Figure6A). These results show that the mechanical properties of
the extracellular matrix have profound effects on YAP activity and HSC activation in vitro.
Inhibition of YAP diminishes fibrogenesis in vivo
Next, we asked whether disruption of YAP-signaling could affect fibrogenesis in vivo. Mice were treated
with CCl4 for four weeks and then injected with a single dose of VP four hours prior to the last CCl4-
injection. Mice were sacrificed 24hours after the last CCl4 injection for analysis of serum, fibrogenesis and
HSC activation. Quantification of cross-linked collagen revealed a decrease of Sirius red stained area in
CCl4+VP mice (Figue7C). VP-treatment did not significantly affect total liver mRNA levels of Lox, Ankrd1
or CTGF (Suppl6). However, VP-treatment caused a significant reduction of Col1a1 and Lox expression in
isolated HSCs compared to control HSCs of CCl4-only treated animals. Acta2 expression was also lower,
although this was not statistically significant in isolated HSCs (Figure7B). Finally, mRNA levels of Ankrd1
and Ctgf also dropped (Figure7D). Notably, these effects of VP were not due to changes in CCl4-liver
toxicity since ALT-levels were not affected by VP-treatment (Figure7A).
These data show that YAP is essential for HSC activation and fibrosis and that pharmacological inhibition of
YAP can inhibit fibrogenesis in a mouse model of fibrosis.
Discussion
Architectural distortion of the liver is known to be a consequence of persisting parenchymal damage and
chronic HSC activation. The massive contribution of activated HSCs to fibrogenesis was proven using
elegant genetic mouse models [16] and emphasizes the importance of understanding the HSC activation
process. We show here that the Hippo pathway effector YAP is an early and key regulator in the HSC
activation process. This conclusion is based on four major observations: 1) Yap target genes are up-regulated
early during HSC activation in vitro and in vivo, and for the YAP targets Ctgf and Ankrd1 this is most
pronounced 10hours after seeding of the cells; 2) Upon HSC activation, YAP translocates into the nucleus in
vitro and in vivo; 3) siRNA-mediated silencing of YAP or pharmacological inhibition of YAP blocks
induction of its target genes and HSC activation in vitro. 4) In vivo treatment of fibrotic mice with the YAP
inhibitor VP reduces fibrogenesis. Together, these results show that YAP is an early and key regulator of
HSC activation.

1 2 3 4 5 6 7 8 9 1011121314151617181920212223242526272829303132333435363738394041424344454647484950515253545556575859606162636465
10 The Hippo pathway has already been recognized as an important regulator of liver development.[17] In the
mouse, liver specific over-expression of Yap[18,19] or deletion of Mst1/2[20] and other upstream regulators
[21] that result in Yap-hyperactivity causes hepatomegaly. These mice have bigger livers because of an
activated progenitor cell compartment and hyperproliferation of hepatocytes and bile duct cells, and develop
liver cancers at later stages.[18,19,21] In addition, patients with biliary diseases or mice with biliary
obstruction show YAP activation in bile epithelial cells as well as hepatocytes and deletion of YAP in bile
duct ligated mice compromised bile epithelial cell- and hepatocyte proliferation.[22] Interestingly, activation
of YAP in hepatocytes transforms them into a ductular/progenitor state characterized by pan-cytokeratin,
HNF4α and Sox9 expression.[23] Thus, Hippo signaling may control progenitor cell activation and
hepatocyte lineage proliferation.
Here we document a key role for YAP during the activation of HSCs. Activation of HSCs is a general
response to liver damage inducing the hyper-production of ECM to protect the damaged tissue. A function
for YAP as a stress sensor and driver of regenerative behavior is not only observed in HSCs but also in other
cell types and organs. For example, Yap expression is up-regulated in epithelial cells of the intestinal crypts
in response to tissue damage caused by toxins, and conditional deletion of Yap abrogates regeneration of
damaged gut tissue.[24] In the heart, YAP overexpression promotes the regeneration of heart muscle after
ischemia, and YAP also plays a role during wound healing.[25-27] Similarly, increasing substrate stiffness
caused nuclear localization of YAP/TAZ in fibroblasts. Furthermore, fibroblasts expressing active YAP
promote fibrosis when transplanted into murine lungs, demonstrating that YAP/TAZ activation can drive a
pro-fibrotic response in vivo.[28] These observations in other organs together with our data thus suggest that
YAP is a regulator of regenerative cell behavior in a more general sense.
Our study raises a number of important questions about the regulation and function of YAP that will need to
be answered in future studies. First, what are the signals and mechanisms that activate YAP in HSCs in vivo?
One mechanism could be that mechanical forces activate YAP in HSCs, as matrix stiffness is known to
regulate YAP localization and activity.[29,30] Notably, liver elasticity decreases during the progression of
liver disease and measurements of such changes in liver stiffness form the basis of elastography methods
used to diagnose and monitor liver disease.[31] Thus, an increase in liver stiffness is associated with acute
liver failure in rats and patients [6,32] and this increase in stiffness precedes matrix deposition. Although the
study investigating rat liver fibrosis did not determine liver stiffness before day three after CCl4

1 2 3 4 5 6 7 8 9 1011121314151617181920212223242526272829303132333435363738394041424344454647484950515253545556575859606162636465
11 administration[6], it is unlikely that tissue stiffness increases sufficiently to induce YAP signaling two hours
after CCl4 injection. We thus postulate that other, currently unknown signaling mechanisms exist, that
initially activate YAP in HSCs. It is possible that these signals involve changes in the contacts between
HSCs and hepatocytes upon hepatocytic damage, or changes in growth factor availability. In that respect it is
interesting that the Hippo pathway shows crosstalk with the WNT and TGFβ pathways[33,34], which are
implicated in the initiation and perpetuation of HSC activation and in fibrogenesis.[35,36] Once activated,
ECM deposition by HSCs causes ECM stiffening, which then may signal back to HSCs to further activate
YAP in a positive feedback loop.
For some of our experiments we needed to keep isolated HSCs in a quiescent state. However, plating HSCs
on regular culture plates was sufficient to activate HSCs, probably because they are ultra-stiff (1GPa)[6]. We
thus analyzed HSCs that were activated in vivo and compared them to HSCs from healthy mice. Similar
studies have been performed by others[12], however in our study, cells were not seeded after isolation.
Notably, we found that the gene expression profile of in vitro activated HSCs was more similar to that of in
vivo activated HSCs after 4 weeks of CCl4 treatment compared to that after 2 weeks of CCl4. The extremely
high substrate stiffness of the culture dishes may thus promote a highly pronounced myofibroblastic
phenotype in vitro. Our data thus further emphasize that the use of in vitro models needs to be considered
carefully and is only recommended when a gene of interest shows a similar regulation of expression during
HSC activation in vivo. We used two different strategies to culture HSCs under more physiological, that is
“softer”, culture conditions: in 3D-spheroids and on soft PDMS-substrates. Cells cultured in 3D-spheroids
showed a pronounced repression of HSC activation and YAP signaling that was stronger than the effect of
culturing HSCs on PDMS. This may be due to an even lower stiffness of spheroids than PDMS-substrates
and because cells in spheroids form 3D-structures that present more natural cell-cell interactions.[37]
Another potential mechanism for the induction of YAP activity in HSCs is deregulation of integrin signaling,
as αv-integrin expression changes significantly upon liver injury.[7] Because integrins are sensors and
transducers of changes in ECM composition and elasticity, upregulation of αv-integrin may speed up actin
stress-fiber formation in HSCs during activation and/or lead to changes in the release and activation of latent
growth factors. It is also possible that YAP is activated in a Hippo-independent manner[38,39]. Therefore
research on the contribution of Hippo related kinases to YAP activation in HSCs will be subject of future
studies.
1 2 3 4 5 6 7 8 9 1011121314151617181920212223242526272829303132333435363738394041424344454647484950515253545556575859606162636465
12 The second important question raised by our studies is how does YAP regulate HSC activation? We found
that the strong upregulation of Ankrd1 and Ctgf gene expression in activated HSCs was completely
dependent on YAP. YAP regulates Ankrd1 and Ctgf not only in HSCs, but also in many other cell types.
Interestingly, Ankrd1 and Ctgf were induced earlier than classical markers for HSC activation and YAP may
thus regulate gene expression at the early stages of HSC activation. Ctgf has an essential function in liver
fibrosis and HSC activation [40,41] and it also acts as a ligand for αvβ3 integrin thereby regulating HSC
cell/matrix adhesion.[42] Ankrd1 is a ankyrin repeat protein expressed in the I-band of skeletal muscle where
it functions as a messenger for stress-response pathways and plays a role in muscle remodeling. Upon stretch
sensing it can translocate to the nucleus and modulate gene expression as a co-factor[43] for transcription
factors such as p53.[44] Thus the two YAP target genes Ankrd1 and Ctgf have been directly implicated in
liver fibrosis (Ctgf) or have been associated with regenerative processes in other tissues (Ankrd1). In
addition, we expect that YAP regulates other genes that then contribute to the complex phenotypic changes
associated with HSC activation.
A most fascinating question is whether pharmacological inhibition of YAP has therapeutic efficacy for
patients suffering from liver fibrosis and whether such treatment helps reversing fibrogenesis in other organs.
In hepatitis C patients we observed nuclear YAP staining in fibrotic areas, suggesting active YAP signaling
in activated stellate cells in human. We were not able to correlate the number of cells with nuclear YAP
expression to the stage of the disease, most likely due to the very chronic nature of human disease.[15,45]
Strikingly, injection of a single dose of VP into CCl4-treated mice reduced the fibrosis and caused a
reduction of Col1a1 and Lox mRNA levels of isolated HSCs. It will be exciting to expand on these studies
and to further test the effects of VP and other means of YAP inhibition in different animal models of chronic
liver injury and fibrosis in other organs. In conclusion, we show the involvement of YAP in the onset and
progression of liver fibrosis. YAP is activated very early on during HSC activation and it is essential for
HSC activation since interference with YAP signaling reduces HSC activation and fibrogenesis (Figure7E).
YAP thus presents as a novel target to treat fibrosis in liver disease.
Acknowledgements
I. Mannaerts and S. Claerhout are supported by a Fund of Scientific Research Flanders FWO-V post-doctoral fellowships (12N5415N LV, 12P7515N) and L. A. van Grunsven is supported by the Vrije Universiteit Brussel (GOA78, OZR1930). L. Thoen and S. Verhulst are funded by the Institute for the Promotion of Innovation through Science and Technology in Flanders (IWT-Vlaanderen; SB/101577 and SB/121548).

1 2 3 4 5 6 7 8 9 1011121314151617181920212223242526272829303132333435363738394041424344454647484950515253545556575859606162636465
13 We would like to acknowledge Jean Marc Lazou, Danielle Blyweert, Ivan Moya and Eddy Himpe for technical support.

1 2 3 4 5 6 7 8 9 1011121314151617181920212223242526272829303132333435363738394041424344454647484950515253545556575859606162636465
14 References [1] Poordad F, Hezode C, Trinh R, Kowdley KV, Zeuzem S, Agarwal K, et al. ABT-450/r–Ombitasvir and Dasabuvir
with Ribavirin for Hepatitis C with Cirrhosis. New England Journal of Medicine 2014;370:1973-1982. [2] Zeuzem S, Jacobson IM, Baykal T, Marinho RT, Poordad F, Bourlière M, et al. Retreatment of HCV with ABT-
450/r–Ombitasvir and Dasabuvir with Ribavirin. New England Journal of Medicine 2014;370:1604-1614. [3] Mederacke I, Hsu CC, Troeger JS, Huebener P, Mu X, Dapito DH, et al. Fate tracing reveals hepatic stellate cells
as dominant contributors to liver fibrosis independent of its aetiology. Nat Commun 2013;4. [4] Friedman SL. Hepatic Stellate Cells: Protean, Multifunctional, and Enigmatic Cells of the Liver. Physiol Rev
2008;88:125-172. [5] Pinzani M, Marra F. Cytokine receptors and signaling in hepatic stellate cells. Semin Liver Dis 2001;21:397-416. [6] Georges PC, Hui JJ, Gombos Z, McCormick ME, Wang AY, Uemura M, et al. Increased stiffness of the rat liver
precedes matrix deposition: implications for fibrosis. Am J Physiol Gastrointest Liver Physiol 2007;293:G1147-1154.
[7] Henderson NC, Arnold TD, Katamura Y, Giacomini MM, Rodriguez JD, McCarty JH, et al. Targeting of αv integrin identifies a core molecular pathway that regulates fibrosis in several organs. Nature Medicine 2013;19:1617-1624.
[8] Halder G, Johnson RL. Hippo signaling: growth control and beyond. Development 2010;138:9-22. [9] Moroishi T, Hansen CG, Guan K-L. The emerging roles of YAP and TAZ in cancer. Nat Rev Cancer 2015;15:73-
79. [10] Ota M, Sasaki H. Mammalian Tead proteins regulate cell proliferation and contact inhibition as transcriptional
mediators of Hippo signaling. Development 2008;135:4059-4069. [11] Olsen AL, Bloomer SA, Chan EP, Gaca MDA, Georges PC, Sackey B, et al. Hepatic Stellate Cells Require a Stiff
Environment for Myofibroblastic Differentiation. American Journal of Physiology - Gastrointestinal and Liver Physiology 2011;301:G110-118.
[12] De Minicis S, Seki E, Uchinami H, Kluwe J, Zhang Y, Brenner DA, et al. Gene expression profiles during hepatic stellate cell activation in culture and in vivo. Gastroenterology 2007;132:1937-1946.
[13] Mohseni M, Sun J, Lau A, Curtis S, Goldsmith J, Fox VL, et al. A genetic screen identifies an LKB1–MARK signalling axis controlling the Hippo–YAP pathway. Nature Cell Biology 2013;16:108-117.
[14] Guvendiren M, Perepelyuk M, Wells RG, Burdick JA. Hydrogels with differential and patterned mechanics to study stiffness-mediated myofibroblastic differentiation of hepatic stellate cells. Journal of the Mechanical Behavior of Biomedical Materials 2013;In Press.
[15] Liu-Chittenden Y, Huang B, Shim JS, Chen Q, Lee SJ, Anders RA, et al. Genetic and pharmacological disruption of the TEAD-YAP complex suppresses the oncogenic activity of YAP. Genes Dev 2012;26:1300-1305.
[16] Mederacke I, Hsu CC, Troeger JS, Huebener P, Mu X, Dapito DH, et al. Fate tracing reveals hepatic stellate cells as dominant contributors to liver fibrosis independent of its aetiology. Nat Commun 2013;4:2823.
[17] Dong J. Differences in Yes-associated protein and mRNA levels in regenerating liver and hepatocellular carcinoma. Molecular Medicine Reports 2011.
[18] Camargo FD, Gokhale S, Johnnidis JB, Fu D, Bell GW, Jaenisch R, et al. YAP1 Increases Organ Size and Expands Undifferentiated Progenitor Cells. Current Biology 2007;17:2054-2060.
[19] Dong J, Feldmann G, Huang J, Wu S, Zhang N, Comerford SA, et al. Elucidation of a Universal Size-Control Mechanism in Drosophila and Mammals. Cell 2007;130:1120-1133.
[20] Zhou D, Conrad C, Xia F, Park J-S, Payer B, Yin Y, et al. Mst1 and Mst2 Maintain Hepatocyte Quiescence and Suppress Hepatocellular Carcinoma Development through Inactivation of the Yap1 Oncogene. Cancer Cell 2009;16:425-438.
[21] Lu L, Li Y, Kim SM, Bossuyt W, Liu P, Qiu Q, et al. Hippo signaling is a potent in vivo growth and tumor suppressor pathway in the mammalian liver. Proceedings of the National Academy of Sciences 2010;107:1437-1442.
[22] Bai H, Zhang N, Xu Y, Chen Q, Khan M, Potter JJ, et al. Yes-associated protein regulates the hepatic response after bile duct ligation. Hepatology 2012;56:1097-1107.
[23] Yimlamai D, Christodoulou C, Galli Giorgio G, Yanger K, Pepe-Mooney B, Gurung B, et al. Hippo Pathway Activity Influences Liver Cell Fate. Cell 2014;157:1324-1338.
[24] Barry ER, Morikawa T, Butler BL, Shrestha K, de la Rosa R, Yan KS, et al. Restriction of intestinal stem cell expansion and the regenerative response by YAP. Nature 2012;493:106-110.
[25] Del Re DP, Yang Y, Nakano N, Cho J, Zhai P, Yamamoto T, et al. Yes-associated protein isoform 1 (Yap1) promotes cardiomyocyte survival and growth to protect against myocardial ischemic injury. J Biol Chem 2013;288:3977-3988.
[26] Xin M, Kim Y, Sutherland LB, Murakami M, Qi X, McAnally J, et al. Hippo pathway effector Yap promotes cardiac regeneration. Proceedings of the National Academy of Sciences 2013;110:13839-13844.
[27] Heallen T, Morikawa Y, Leach J, Tao G, Willerson JT, Johnson RL, et al. Hippo signaling impedes adult heart regeneration. Development 2013;140:4683-4690.

1 2 3 4 5 6 7 8 9 1011121314151617181920212223242526272829303132333435363738394041424344454647484950515253545556575859606162636465
15 [28] Liu F, Lagares D, Choi KM, Stopfer L, Marinković A, Vrbanac V, et al. Mechanosignaling through YAP and TAZ
drive fibroblast activation and fibrosis; 2014. [29] Low BC, Pan CQ, Shivashankar GV, Bershadsky A, Sudol M, Sheetz M. YAP/TAZ as mechanosensors and
mechanotransducers in regulating organ size and tumor growth. FEBS Letters 2014;588:2663-2670. [30] Dupont S, Morsut L, Aragona M, Enzo E, Giulitti S, Cordenonsi M, et al. Role of YAP/TAZ in
mechanotransduction. Nature 2011;474:179-183. [31] Kim BK. Clinical application of liver stiffness measurement using transient elastography in chronic liver disease
from longitudinal perspectives. World Journal of Gastroenterology 2013;19:1890. [32] Dechêne A, Sowa J-P, Gieseler RK, Jochum C, Bechmann LP, El Fouly A, et al. Acute liver failure is associated
with elevated liver stiffness and hepatic stellate cell activation. Hepatology 2010;52:1008-1016. [33] Morgan JT, Murphy CJ, Russell P. What do mechanotransduction, Hippo, Wnt, and TGFβ have in common? YAP
and TAZ as key orchestrating molecules in ocular health and disease. Experimental Eye Research 2013;115:1-12. [34] Wang J, Park J-S, Wei Y, Rajurkar M, Cotton Jennifer L, Fan Q, et al. TRIB2 Acts Downstream of Wnt/TCF in
Liver Cancer Cells to Regulate YAP and C/EBPα Function. Molecular Cell 2013;51:211-225. [35] Yoshida K, Matsuzaki K. Differential Regulation of TGF-beta/Smad Signaling in Hepatic Stellate Cells between
Acute and Chronic Liver Injuries. Front Physiol 2012;3:53. [36] Jiang F, Parsons CJ, Stefanovic B. Gene expression profile of quiescent and activated rat hepatic stellate cells
implicates Wnt signaling pathway in activation. Journal of Hepatology 2006;45:401-409. [37] Cukierman E, Pankov R, Stevens DR, Yamada KM. Taking cell-matrix adhesions to the third dimension. Science
2001;294:1708-1712. [38] Chan SW, Lim CJ, Chong YF, Pobbati AV, Huang C, Hong W. Hippo Pathway-independent Restriction of TAZ
and YAP by Angiomotin. Journal of Biological Chemistry 2011;286:7018-7026. [39] Feng X, Degese Maria S, Iglesias-Bartolome R, Vaque Jose P, Molinolo Alfredo A, Rodrigues M, et al. Hippo-
Independent Activation of YAP by the GNAQ Uveal Melanoma Oncogene through a Trio-Regulated Rho GTPase Signaling Circuitry. Cancer Cell 2014;25:831-845.
[40] Gressner OA, Lahme B, Demirci I, Gressner AM, Weiskirchen R. Differential effects of TGF-β on connective tissue growth factor (CTGF/CCN2) expression in hepatic stellate cells and hepatocytes. Journal of Hepatology 2007;47:699-710.
[41] Liu Y, Liu H, Meyer C, Li J, Nadalin S, Koenigsrainer A, et al. TGF- mediated connective tissue growth factor (CTGF) expression in hepatic stellate cells requires Stat3 activation. Journal of Biological Chemistry 2013;288:30708-30719.
[42] Gao R, Brigstock DR. Connective Tissue Growth Factor (CCN2) Induces Adhesion of Rat Activated Hepatic Stellate Cells by Binding of Its C-terminal Domain to Integrin αvβ3 and Heparan Sulfate Proteoglycan. Journal of Biological Chemistry 2004;279:8848-8855.
[43] Kojic S, Radojkovic D, Faulkner G. Muscle ankyrin repeat proteins: their role in striated muscle function in health and disease. Crit Rev Clin Lab Sci 2011;48:269-294.
[44] Kojic S, Nestorovic A, Rakicevic L, Belgrano A, Stankovic M, Divac A, et al. A novel role for cardiac ankyrin repeat protein Ankrd1/CARP as a co-activator of the p53 tumor suppressor protein. Archives of Biochemistry and Biophysics 2010;502:60-67.
[45] Brodowska K, Al-Moujahed A, Marmalidou A, Meyer zu Horste M, Cichy J, Miller JW, et al. The clinically used photosensitizer Verteporfin (VP) inhibits YAP-TEAD and human retinoblastoma cell growth in vitro without light activation. Experimental Eye Research 2014;124:67-73.
1 2 3 4 5 6 7 8 9 1011121314151617181920212223242526272829303132333435363738394041424344454647484950515253545556575859606162636465
16 Figure Legends
Figure1. Identification of YAP target genes in in vitro and in vivo activated mHSCs. (A) Gene expression profiling and heat map of primary freshly isolated quiescent HSCs (0h), in vitro activated cells (d10), and cells isolated after 2 or 4 weeks of CCl4 treatment. Except for the in vitro activation, cells were not plated after isolation. (B) Venn-diagram displaying the overlaps of differentially expressed genes when comparing in vitro activated mHSCs (vitro) or cells after 2 (2w CCl4) or 4 (4w CCl4) weeks of CCl4 treatment with quiescent freshly isolated HSCs. Size of the groups is relative to the number of genes. (C) Top 5 processes identified by gene ontology analysis of the differentially expressed genes that overlap between in vitro and in vivo HSC activation. (D) mRNA expression of Yap1 and down-stream genes Ctgf and Ankrd1 after in vivo HSC activation was analyzed using qPCR on freshly isolated purified HSCs following chronic CCl4 treatments or after common bile duct ligation (CBDL). (E) mRNA expression in mHSCs isolated after acute injury with CCl4 is depicted at the indicated time points after the injection. For each time point 3 livers were pooled per repeat. (F) Expression of Yap and downstream regulators was investigated in primary mouse hepatic stellate cells by qPCR at early and late stages of the culture. Expression is calculated relative to freshly isolated unseeded cells (0h). For all time points n≥3, */#p<0.05,**/##p<0.01,***/###p<0.001 Figure2. IHC of YAP in non-fibrotic and fibrotic mouse and human liver. (A) Protein expression of YAP1 in vivo was investigated by immunohistochemistry on paraffin sections of fibrotic mouse livers (induced by CCl4). Activated stellate cells were labeled using an αSMA antibody. (B) Consecutive 5-μm sections of human livers from hepatitis C patients were stained for Picrosirius or YAP (brown) and counterstained with hematoxylin.
Figure3. YAP protein expression and subcellular localization. (A) Subcellular localization of YAP was determined by immunofluorescence using an anti-YAP1 antibody and an Alexa-488 labeled secondary antibody, HSC activation was confirmed by α-SMA immunofluorescence (Alexa-633, red). Cytospins were prepared for freshly isolated cells and in vivo activated cells (0h, 4weeks CCl4, 6 weeks CCl4), cells for in vitro activation were cultured on coverslips for 10h and 10 days. The number of cells with nuclear YAP-staining was counted at each time point. (B) YAP mRNA levels were measured by qPCR in HSCs after acute CCl4 injury and after culture-induced activation. (C) Protein expression of YAP1, P-YAP1, CTGF and ANKRD1 during in vitro HSC activation was investigated by western blot. α-SMA was used to confirm HSC activation and GAPDH as control for equal loading. n≥3,*p<0.05,**p<0.01,***p<0.001 Figure4. Culture of HSCs in 3D-spheroids reduces YAP signaling and HSC activation (A) Freshly isolated HSCs were cultured in 96-well plates under gentle rotation to prevent attachment. After 24 hours, 3D-spheroids were formed. At regular intervals 3D-spheroids (3D) and plastic controls (2D) were collected for analysis of HSC activation markers and YAP down-stream gene expression by qPCR. (B) After 4 days in 3D-culture the primary HSC spheroids were transferred to a flat-bottom 96-well plate without rotation to allow cell attachment. Three days after reseeding cells were collected (3D→2D) for qPCR. Graphs represent expression at day7 relative to freshly isolated unseeded cells t= 0h. In the picture the line shows the area covered by cells 3days after transferring of the spheroid. (C) For transfection of HSCs in 3D-culture cells were incubated with the siRNA complexes from the moment of seeding, while cells were still in suspension. 4days after seeding spheroids were either kept in rotating plates (marked by the line “day7 3D-spheroid”) or transferred to non-stirring culture conditions for 3days to allow cell attachment. At day7 mRNA expression was analyzed by qPCR, a scramble or non-silencing siRNA was used as control. Within each repeat at least 6spheroids were pooled. n≥3; within each repeat at least 6 spheroids were pooled,*p<0.05,**p<0.01,***p<0.001 Figure5. Inhibition of YAP blocks HSC activation in vitro Freshly isolated HSCs (3hours after seeding) were treated with verteporfin (VP) to interrupt YAP-TEAD interaction. (A) Cell morphology, (B) ATP-levels and (C) mRNA expression were analyzed. Graphs represent expression at day7 relative to fresh unseeded cells (“unseeded cells”-line) n≥3, *p<0.05,**p<0.01,***p<0.001 Figure6. Culture on soft substrates inhibits YAP signaling. (A) Primary mHSCs were seeded on 1,5kPa PDMS substrates coated with 0,1mg/ml collagen-I. Microscopy shows morphological differences between cells cultured on plastic (insert) and on PDMS. At the indicated time points cells were collected for mRNA analysis of Acta2, Ctgf and Ankrd1. (B) In cells cultured on PDMS substrates, YAP1 localization was investigated by immunofluorescence. Cells with nuclear staining are represented as a percentage of the total number of cells.

1 2 3 4 5 6 7 8 9 1011121314151617181920212223242526272829303132333435363738394041424344454647484950515253545556575859606162636465
17 Figure7. In vivo inhibition of YAP signaling with verteporfin. Mice were pre-treated with 7 injections of CCl4, next a single dose of VP (100mg/kg body weight) was administered 4hours before the 8th CCl4-injection. Mice were sacrificed 24hours later for analysis of serum, fibrogenesis and HSC activation.(n=5) (A) Serum ALT-levels. (B) mHSCs were FACS-sorted based on UV-positivity and immediately processed for mRNA analysis of HSC activation markers Col1a1, Lox and Acta2. (C) 1 lobe of each liver was used for Sirius red stainings. The % of red-stained area was quantified using imageJ. (D) YAP target gene expression (Ankrd1, Ctgf) was measured by qPCR. */#p<0.05,**/##p<0.01,***/###p<0.001 (E) During liver injury tissue elasticity decreases due to ECM-accumulation. Very early during HSC activation YAP translocates to the nucleus, leading to high Ctgf and Ankrd1 expression which precedes fibrogenic marker expression.

Acta
2 Ct
gf
d10
0h
2w C
Cl 4
4w C
Cl 4
# Gene Ontology P-value
1 Extracellular matrix 3.35 .10-75
2 Proteinaceous Extracellular matrix
1.36.10-70
3 Immune system process 1.58 .10-40
4 Actin binding 8.34 .10-40
5 Angiogenesis 4.60 .10-38
In vitro activation CBDL Chronic CCl4 Acute CCl4 F
A C
D E
Ankr
d1
-2
0
2
4
6
8
###
##
### ######
dCt o
ver G
apdh
0
2
4
6
## ##
dCt o
ver G
apdh
0.0
0.5
1.0
1.5
2.0
2.5
mR
NA
(fold
)
0h 2h 6h 10h 24h0
5
10
15*
Time after CCl4 injection
mR
NA
(fold
)
0
1
2
3
4
5 ns
mR
NA
(fold
)Ac
ta2
Ctgf
An
krd1
0
100
200
300
400
500 *
**
mR
NA
(fold
)0
20
40
60
80 ***
*mR
NA
(fold
)
0h 2h 10h d1 d4 d7 d100
2000
4000
6000
8000
*
*
Time in culture
mR
NA
(fold
)Ac
ta2
Ctgf
An
krd1
Sham 3 days 10 days
0
5
10
15
post CBDL
###
0
2
4
6
8
##
### ###
0
2
4
6
Ctrl 2 4 6 8
0
5
10
15
weeks of CCl4
####
##
dCt o
ver G
apdh
B
Figure 1

A 2 weeks CCl4 4 weeks CCl4 Control
YAP1
– α
SMA
F0-1
F3
Non-fibrotic
F2-3
B
50 μm 50 μm
50 μm 50 μm
50 μm
Figure 2

0h
d10 culture 10h culture
4w CCl4 6w CCl4
YAP1
– α
SMA
- DAP
I
In vitro activation Acute CCl4
A
C
0h 2h 10h d1 d4 d7 d100
1
2
3
4
5Yap1
Time in culture
mR
NA
(fold
)
0h 2h 6h 10h 24h0.0
0.5
1.0
1.5
2.0
2.5Yap1*
Time after CCl4
mR
NA
(fold
)
0h 10h d10 4w 6w0
50
100
******
******
Culture CCl4
% o
f nuc
lear
YA
P1
B
CTGF 38 kDa
P-YAP 70 kDa
ANKRD1 40 kDa
YAP 70 kDa
αSMA 42 kDa
GAPDH 36 kDa
Figure 3

Day 7 3D→2D
C
B
A
2D 3D 3D 2D�
��
���
���
2��
2�� Acta2
�
�
��
��
���
���
2D 3D 3D 2D�
2��
4��
6��
��� Ankrd1
����
��
���
���
2D 3D 3D 2D�
�
��
��
2� Ctgf
�
��
��
� �
����
�
��� �� Day 4 �� ��� �� �4 ���
����
2���
3���
4��� 2D3D
Ankrd1
���
���
Time in culture
��
��
�����
�
�� ��� �� �4 ���
��
���
���
2���
Acta2
Time in culture
��
��
�����
�
�� ��� �� �4 ���
2�
4�
6�
Ctgf
���
���
Time in culture
��
��
�����
�
4 days 3D culture
3 days 2D culture
aggregation transfer
��� k���k����� ������ ������� a����a���� �� ����
���������� a� �a� � ��� 3D → 2D
���a
���
�
����
� siRNA
YAP 70kDa
GAPDH 35kDa
YAP10.0
0.5
1.0
1.5
day 7 3Dspheroid
**mR
NA
(fold
)
Ctgf Ankrd10
5
10
15
day 7 3Dspheroid** *m
RN
A (fo
ld)
Acta2 Col1a1 Lox0
5
10
15
day 7 3Dspheroid
ScramblesiYAP1
******m
RN
A (fo
ld)
Quiescent HSC
Figure 4
A
Day 7 DMSO
Day 7 Verteporfin
C
D�S� 0.5 1 50
50
100
�s
�� of �P
% o
f ATP
B
Col1a1
10h d70
5
10
15�o��rol0.5 �� �P1 �� �P5 �� �P
* *��seededcells
Time in culture
mR
NA
(fold
)
Acta2
10h d70
50
100
150
�00
** ***
*** ��seededcells
Time in culture
mR
NA
(fold
)
Ctgf
10h d70
�0
�0
�0
*��seededcells
Time in culture
mR
NA
(fold
)
Ankrd1
10h d70
�000�000�000�000
100001�000
**
** ** ��seededcells
Time in culturem
RN
A (fo
ld)
Figure 5

PDMS
d8 Plastic 10h PDMS d8 PDMS
YAP1
- D
API
B
A
0h 10h ��h d� d70
1000
�000
3000 Plas�icPD�S
Ankrd1
**
Time in culture
mR
NA
(fold
)
0h 10h ��h d� d70
10
�0
30
�0
50
Ctgf
***
Time in culture
mR
NA
(fold
)
0h 10h ��h d� d70
50
100
150
�00
�50
Acta2
*
Time in culture
mR
NA
(fold
)
plastic
10 ho�rs � days0
50
100 Plas�icPD�S
Time in culture
***
***
% o
f nuc
lear
YA
P1
Day 4
Figure 6

B A
C
D
E
�o��rol ��l� ��l���P0
�
�
�
�
10
Sirius Red Quantification
***�s
***
% o
f Red
Are
a
�o��rol ��l� ��l���P0
5000
10000
15000
�0000
Serum ALT����
ALT
IU/L
�o��rol ��l� ��l���P
��0����
Acta2��� �s
dCt o
ver G
apdh
�o��rol ��l� ��l���P
��
��
0
�
�
Col1a1��� ��
dCt o
ver G
apdh
�o��rol ��l� ��l���P
0
5
10
15
Lox��� �
dCt o
ver G
apdh
�o��rol ��l� ��l���P
0
5
10
15
Ankrd1��� ��
dCt o
ver G
apdh
�o��rol ��l� ��l���P
0
�
�
�
�
Ctgf
� �s
dCt o
ver G
apdh
CCl4 CCl4+VP
Figure 7

Supplementary material and figuresClick here to download Supplementary material: Supplementary materials and figures.docx

Supplementarymaterialsandmethods
Humanliversamples
Human liver specimens taken from liver explants or needle liver biopsies taken for diagnostic purposes were used for this study. As non‐fibrotic controls we used resected livers from adenoma patients. The fibrotic livers were obtained from hepatitis C patient, with different stages of fibrosis, scored according to Metavir. Tissues were fixed in formalin and fibrosis was assessed by Sirius Red staining. Ethical approval was granted by the Ethics Committee of the University hospital Brussels.
PDMSsubstratesTo culture cells in “near in vivo” conditions Elastically Supported Surface dishes were obtained
from Idibi (Proxylab, Beloeil, Belgium), these dishes have a 40 μm Polydimethylsiloxane (PDMS)
layer with a stiffness of 1.5 kPa on top of a 100 μm thick glass cover. Before seeding the cells, the
dishes were coated with 0.1 mg/ml Collagen I (BD bioscience) to allow cell attachment.
Verteporfin Verteporfin (VP) was purchased from Sigma‐Aldrich. A 1000x stocks were prepared in DMSO to
keep the final concentration of DMSO to 0.1 % for in vitro experiments. For animal treatments a
100 mg/ml stock in DMSO was further diluted in PBS make a 10 mg/ml suspension. The VP
suspension is administered by intraperitoneal injection at a dose of 100 mg/kg.
mRNAextraction,reversetranscriptionandquantitativerealtimePCRTotal RNA was extracted from cells using the ReliaPrep RNA Cell Miniprep System (Promega,
Madison, WI). Reverse‐transcription using the Revert Aid Kit (ThermoFisher Scientific, St. Leon‐Rot,
Germany) allowed conversion of RNA to cDNA. The RT reaction was performed at 25 °C for ten
minutes followed by 30 minutes at 50 °C. For quantitative real‐time polymerase chain reaction
(qPCR), GoTaq qPCR Master Mix with BRYTE green (Promega) was used, subjected to qPCR in a
7500 real time PCR system and analysed using System SDS software v2.0.5 (Applied Biosystems),
using Gapdh for normalisation. Reliability of GAPDH as house‐keeping gene was determined using
Normfinder(23). Fold change differences between samples were determined using the
comparative Ct (δδCt) method. The expression level of different targets, relative to Gapdh (δCt)
and relative to the calibrator, was given by 2‐δδCt. Primers produced by Integrated DNA
Technologies (Leuven, Belgium) are listed in Table 1.
Table 1. Primers used for qPCR analysis.
Gene
Symbol
RefSeq accession number Forward primer Reverse primer
Gapdh NM_008084 tgtccgtcgtggatctgac cctgcttcaccaccttcttg
Acta2 NM_007392 ccagcaccatgaagatcaag tggaaggtagacagcgaagc
Yap1 NM_001171147.1, NM_009534.3 gagggactccgaatgcag cgagagtgataggtgccactg
Ctgf NM_010217.1 tgacctggaggaaaacattaaga agccctgtatgtcttcacactg
Ankrd1 NM_013468 ggaacaacggaaaagcgagaa gaaacctcggcacatccaca

Lox NM_010728 ctcctgggagtggcacag cttgctttgtggccttcag
Col1a1 NM_007742 acctaagggtaccgctgga tccagcttctccatctttgc
MicroarrayanalysisDouble‐stranded cDNA was synthesised from total RNA originating from quiescent (freshly
isolated, not cultured) cultured for 10 days and in vivo activated mouse HSCs. First,
preamplification using the Pico Ovation WTA V2 System was performed. After in vitro transcription
and fragmentation, cRNA was biotin labelled, 2 µg of the labelled cRNA was hybridised to
Affymetrix GeneChip Mouse Gene 2.0 ST arrays (Affymetrix, Santa Clara, CA). Two independent
biological replicates were included in each of the groups: Quiescent (0h), vitro activated (d10), in
vivo activated (2w CCl4 and 4w CCl4). The hybridisation cocktail, including the fragmented target
and probe array controls, was then hybridised to the probe arrays during a 16‐hour incubation
period. Next, the arrays underwent automated washing and staining on a fluidics station and
intensities were measured by a scanner. The *.cel files were imported into GeneSpringGX 12
(Agilent, Santa Clara, CA) for normalisation and data analysis. To create an expression matrix, the
raw data were pre‐processed using the multi‐array average (RMA) algorithm consisting of
background correction, quantile normalisation & probe summarisation. Sample and hybridisation
quality was checked by principal component analysis (PCA) and by analysing the hybridisation
controls. A fold change cut‐off of 2.0 in combination with an ANOVA identified differentially
expressed transcripts. p‐Value computation was done asymptotically (p‐value cut‐off of 0.05) and
Benjamini‐Hochberg was used for multiple testing corrections. GO‐analysis was performed in
Genespring and Incromap freeware was used for KEGG‐network analysis. A scheme of the
experimental set up is available in supplementary figure 1A.
Western blotCells were collected with ice cold lysis buffer (170 mM NaCl, 10 mM EDTA, 50 mM Tris pH 7.4, 50
mM NaF, 0.2 mM dithiothreitol and 0.5% NP‐40) supplemented with protease and phosphatase
inhibitors. The protein concentration was measured using a bicinchoninic acid (BCA)
determination kit (Pierce Chemical Co, Rockford, IL). Ten micrograms of protein were separated on
a 8% Tris–glycine SDS‐Polyacrylamide gel and transferred onto polyvinyldifluoride (PVDF)
membranes (Amersham Biosciences, Little Chalfont, UK) using a semi‐dry blotting apparatus
(ApolloTM, Continental Lab Products, San Diego, CA, USA). Afterwards the membrane was blocked
by 5% milk in PBS‐Tween. Primary antibodies (listed in Table 2) were incubated overnight at 4°C
and after one hour incubation with a horseradish peroxidase conjugated secondary antibody
(1/20000) (Dako, Glostrup, Denmark), proteins were visualized with an ECL chemiluminescence
detection system (Pierce Chemical Co.).
ImmunofluorescenceCells were fixed with 4% PFA – CB‐sucrose fixing solution. After washing and permeabilization,
cells were incubated with 5% blocking solution (3% normal serum +2%BSA). Primary antibodies
were incubated overnight at 4°C, followed by washing steps and incubation with alexa‐coupled
secondary antibody (1/200) for 1 hour at room temperature. Finally cells were mounted with DAPI

containing medium and pictures were made using a confocal fluorescent microscope (Zeis LSM
710 NLO) and quantification was carried out using ImageJ software (http://imagej.nih.gov/ij/).
Immunohistochemistry
Liver tissue from healthy and injured mice was formalin fixed and embedded in paraffin. 5 µm
sections were prepared. Antigen retrieval citrate buffer (pH6.0) was used. This was followed by
permeablization (PBS‐Tween, 0.05%), blocked with 5% blocking solution (3% normal serum +2%
BSA) and incubated with primary antibody. After rinsing, sections were incubated with
streptavidin–peroxidase conjugate. Peroxidase reactivity was visualised with 3,3’‐
diaminobenzidine (DAB)/H2O2.
Table2.AntibodiesusedforWesternBlotandimmunochemistryProteins Supplier Application
1 Application 2 Application 3
GAPDH Abcam WB,1/30000 SMA(‐Cy3) Sigma WB,1/10000 IF, 1/1000 IHC,1/100ANKRD SantaCruz WB,1/250 IF, 1/200 IHC,1/50YAP1 Cell SignallingTechnology WB,1/250 IF, 1/100 IHC,1/50P‐YAP Cell SignallingTechnology WB,1/250 Desmin Neomarkers;Thermo IHC,1/75 CTGF SantaCruz WB,1/200
siRNA transfectionAfter isolations mouse HSCs were cultured for 24 hours and medium was refreshed 1 hour prior to
transfection. Cells were transfected using siRNAs (5nM) and Hiperfect according to the
manufacturer’s instructions. Cells were transfected twice over 5 days and collected 3 days after
the final transfection. A non‐silencing siRNA was used as a control. Sequences were ordered at IDT
DNA Technologies (Leuven, Belgium). In the 3D‐spheroids, siRNA containing lipoplexes were added
to the freshly isolated cells during the aggregation process.
Statistical analysis
Results are presented as the mean + SD. Data were subjected to analysis of variance (ANOVA)
followed by Tukey’s post‐test. Statistical analysis of values for comparison between 2 groups was
performed using two tailed Student t‐test. *** P<0.001, ** P<0.01,* P<0.05

Supplementary figure 1
AIn vitro
activation
0h d10culture
CCl4 CCl4 CCl4 CCl4 CCl4 CCl4CCl4 CCl4
2 weeks 4 weeks
In vivo activation
Control 2w CCl4_1 2w CCl4_2 4w CCl4_1 4w CCl4_20
10000
20000
30000
40000
ALT
IU/L
HEP 0h 2w CCl4 4w CCl4
-5
0
5
10
15
*****
***
Cyp3a11
dCt C
yp3a
11 o
ver G
apdh
KC 0h 2w CCl4 4w CCl4
0
5
10
15
******
***
F4/80dC
t F4/
80 o
ver G
apdh
LSEC 0h 2w CCl4 4w CCl4
-2
0
2
4
6
8
******
***
Stab2
dCt S
tab2
ove
r Gap
dh
0h 2w CCl4 4w CCl4 HEP KC LSEC
0
5
10
15
20
HSC
***
Desmin
dCt D
esm
in o
ver G
apdh
D.
UV+ UV+ UV+
B CSerum ALT (IU/L) 2 weeks CCl4day 10 4 weeks of CCl4
Supplementary figure 1. Experimental set‐up and quality controls for microarray.(A) Experimental set‐up for the samples used in the microarray analysis. Primary stellate cells were isolated fromhealthy mice and from mice treated with carbontetrachloride (2 or 4 weeks). (B) Induction of liver injury wasdetermined by ALT‐measurements in serum of control and CCl4 treated mice. (C) HSCs were isolated with FACS, basedon UV‐positivity. Cells of 2‐3 mice were pooled. (D) Purity of the isolated cell fractions was confirmed by qPCR for HSCspecific marker Desmin and by looking at the presence of Cyp3a11, Stab2 and F4/80. These are markers specific forhepatocytes (HEP), Liver sinusoidal endothelial cells (LSEC) and Kupffer cells (KC) respectively. **p<0,01; ***p<0,001.

Supplementary figure 2
A BFold Change of HSC activation markers relative to quiescent unseeded cells
Supplementary figure 2. Microarray analysis.(A) Expression of well established HSC activation markers was checked in the array data to confirm proper HSCactivation by in vitro culture and by CCl4 treatment in vivo. Expression is displayed as fold change relative to quiescentunseeded cells. (B) Expression profiles of genes part of the recently published hippo signature list was investigated inour array. About 10% of the Hippo target genes changes at least 1.5 fold during in vitro + in vivoHSC activation.
Hippo down‐stream genes changed during HSC activation
10
3111
00 1
vitro
2w CCl4 4w CCl4
Adamts12
Ankrd1
Anxa3
Axl
Ctgf
Ggt5
Gprc5b
Itga5
Krt8
Nt5e
Olfml3
Olr1
Tgfb2
Tgm2
Thbs1
Genesymbol FC 10 days in vitro FC 2w in vivo FC 4w in vivo
Ntm ‐1.92 ‐1.64 ‐1.74
Acta2 46.48 27.42 27.58
Col4a2 2.583 2.851 3.569
Lox 39.61 17.8 13.64
Loxl2 5.15 2.84 2.84

Supplementary figure 3
Supplementary figure 3. Serial sections stained for picrosirius, YAP, desmin and ANKRD1. Protein expression of YAPand ANKRD1 in vivo was investigated by immunohistochemistry on paraffin serial sections of fibrotic mouse livers(induced by CCl4). A first section was stained with picrosirius to show scar formation. HSCs were visualized using ananti‐DESMIN antibody. Areas in the square are magnified and arrowheads mark potential sites where DESMIN‐positive cells express ANKRD1.
DESMINYAP ANKRD1Sirius
4 w
ee
ks o
f CC
l 4

Supplementary figure 4
Supplementary figure 4. Seperate channels of IF stainings for YAP and αSMA. immunofluorescence using an anti‐YAP1 antibody (Alexa‐488, green), HSC activation was confirmed by α‐SMA immunofluorescence (Alexa‐633, red).Cytospins were prepared for freshly isolated cells and in vivo activated cells (0h, 4weeks CCl4, 6 weeks CCl4), cells forin vitro activation were cultured on coverslips for 10 hours and for 10 days.
DAPI YAP SMA
0h
10h
d10
4w CCl4
6w CCl4

Supplementary figure 5
Supplementary figure 5. siRNA‐mediated YAP knock‐down in 2D‐cultured HSCs.siRNA transfections in primary HSCs. In 2D‐culture HSCs were transfected at day 1 and 5 of the culture. (A) At day 8mRNA expression of Yap, YAP down‐stream genes (Ctgf and Ankrd1) and HSC activation markers (Acta2, Lox, Col1a1)was measured by qPCR. (B) The effect on PDGF‐bb HSC proliferation was investigated. Cells were treated withgrowth factor for 48 hours and proliferation was tested by QPCR for CyclinA and Ki67. Gapdh was used asendogenous control and deltadeltaCtmethod was used for analysis.
YAP10.0
0.5
1.0
1.5
***
mR
NA
(fo
ld)
Ctgf Ankrd10.0
0.5
1.0
1.5
mR
NA
(fo
ld)
Acta2 Col1a1 Lox0.0
0.5
1.0
1.5 ScramblesiYAP1
mR
NA
(fo
ld)
Cyclin A Ki670
1
2
3
4ScramblesiYAP
Solvens
PDGFbb-induced HSC proliferation
mR
NA
(fo
ld)
A
B

Supplementary figure 6
Supplementary figure 6. Effect of Verteporfin treatment on stellate cell activation markers and Hippo target geneexpression in mRNA extracts from total liver. Fold change was calculated relative to the expression in control mice,using the ddCt method, with Gapdh as housekeeping control.
Acta2
Control CCl4 CCl4+VP0
20
40
60 *
mR
NA
(fo
ld)
Lox
Control CCl4 CCl4+VP0
10
20
30
mR
NA
(fo
ld)
Ankrd1
Control CCl4 CCl4+VP0
5
10
15
mR
NA
(fo
ld)
Ctgf
Control CCl4 CCl4+VP0
5
10
15
20
mR
NA
(fo
ld)


