Embed Size (px)
Citation preview
The perceived quality of soundscape in three urban parksin Rome
Giovanni Brambilla and Veronica GalloCNR-IDASC, Institute of Acoustics and Sensors “O. M. Corbino,” via del Fosso del Cavaliere 100,00133 Rome, Italy
Francesco Asdrubalia) and Francesco D’AlessandroCIRIAF, Interuniversity Research Center on Pollution from Physical Agents, University of Perugia,Via G. Duranti 67, 06125 Perugia, Italy
(Received 4 May 2012; revised 29 March 2013; accepted 11 April 2013)
The present paper reports a socio-acoustic survey carried out in three large urban parks in Rome,
selected on the basis of the outcome of a preliminary online survey. According to the experimental
protocol applied in a previous study carried out in Milan and Naples, binaural recordings in 85 sites
and interviews with 266 users of the three parks were performed only during the day in summer-
time. On the basis of selected acoustical descriptors, the sonic environment of the three parks was
categorized and, thanks to statistical analysis, three clusters were identified. The results confirm
that the sound environment in urban parks is often considered as “good” or “excellent” even if the
sound pressure level is nearly always higher than the limits commonly used to define quiet areas.
This is due to the influence of other factors, such as the presence of trees, natural features, and the
tranquility; all of these components cannot be neglected in the assessment of the soundscape
because they directly affect the psychological state of the person.VC 2013 Acoustical Society of America. [http://dx.doi.org/10.1121/1.4807811]
PACS number(s): 43.50.Qp, 43.50.Rq, 43.50.Sr [KML] Pages: 832–839
I. INTRODUCTION
The Directive 2002/49/EC of the European Parliament
and of the Council relating to the assessment and manage-
ment of environmental noise introduces the concept of “quiet
areas,” either inside agglomeration or in open country.
However, criteria based on measurements to identify such
areas have not been defined yet, mainly due to the lack of
knowledge of the effect of noise on the perceived sound-
scape quality.1
Several studies have been carried out over the last dec-
ade showing that for the analysis of the perception of the
sonic environment quality a multidisciplinary approach is
more appropriate rather than focusing on cumulative noise
indicators only, i.e., the equivalent sound pressure level
(LAeq) or the day-evening-night level (Lden).2,3 This holistic
approach should take into account the several non-acoustical
features characterizing the “quiet areas,” such as visual and
microclimate aspects, which may interact with auditory
judgements and, therefore, influence the evaluation of the
perceived quality of these environments. For instance, the
interaction between audio and video in quiet areas has been
investigated and an engineering model for the “tranquility”
as a function of the noise level and proportion of the natural
features has been proposed.4
The importance of “quiet areas” is widely recognized
as they provide, at least temporarily, opportunities for a
feeling of relaxation, calm and recovery from noise
pollution to which the population is exposed in everyday
life.5,6 This essential health-promoting function should be
preserved and improved, especially for the urban parks, as
they can be easily accessed by the users but, at the same
time, they are often surrounded by noisy areas due to the
sound emission of road traffic, industries, and other sources.
In particular, the extent of the park has an important influ-
ence on the maximum tranquility that can be achieved due
to effects of distance in reducing traffic noise immission
from the boundary roads and the provision of a high per-
centage of natural features.7
A review of the literature of studies carried out in Italy
on soundscape of potentially quiet areas8 has shown that
only few of these included noise monitoring and interviews
to people to know their ratings on the various aspects of the
environment. These studies were performed mainly in urban
parks in Naples and in Milan.9
This paper describes a socio-acoustic survey carried out
in three urban parks in Rome aimed to investigate the users’
perception of the environment quality in the parks, including
the sonic one, and its relationship with selected acoustical
parameters. The study is the first performed in the urban
green areas in Rome and its structure and methodology is
comparable with the previous surveys carried out in urban
parks in Naples and Milan.9
A preliminary survey on the web was performed to
tune the questionnaire to be used in the field and to iden-
tify the parks to be investigated. The in situ surveys were
carried out taking binaural recordings of the sonic environ-
ment and simultaneous interviews to people in the park.
Additional analyses were performed in order to relate the
a)Author to whom correspondence should be addressed. Electronic mail:
832 J. Acoust. Soc. Am. 134 (1), Pt. 2, July 2013 0001-4966/2013/134(1)/832/8/$30.00 VC 2013 Acoustical Society of America
Downloaded 18 Jul 2013 to 10.0.105.106. Redistribution subject to ASA license or copyright; see http://asadl.org/terms
survey data with the acoustical parameters determined
from the recordings.
II. SELECTION OF THE URBAN PARKS
A preliminary survey was performed to identify the
most frequented urban parks in Rome and to assess other
aspects of these areas. In order to quickly reach an adequate
number of subjects, the survey was carried out on the web
by a questionnaire containing 15 questions and sent via
e-mail to people living in the Municipality of Rome. The
questionnaire was available on the web for 15 days and 121
people responded.
The questions dealt with several items, among which
the most frequented parks, the most pleasant and unpleasant
ones, the reason for going to the park, the degree of satisfac-
tion of the sonic environment and of the area considering
other aspects, such as vegetation, air pollution, security,
cleanliness, and so on.
Based on the outcomes of this poll, the urban parks of
Villa Pamphili (P), Villa Borghese (B), and Parco Caffarella
(C) were selected for the field survey because they were the
most visited. They have a wide extension with different
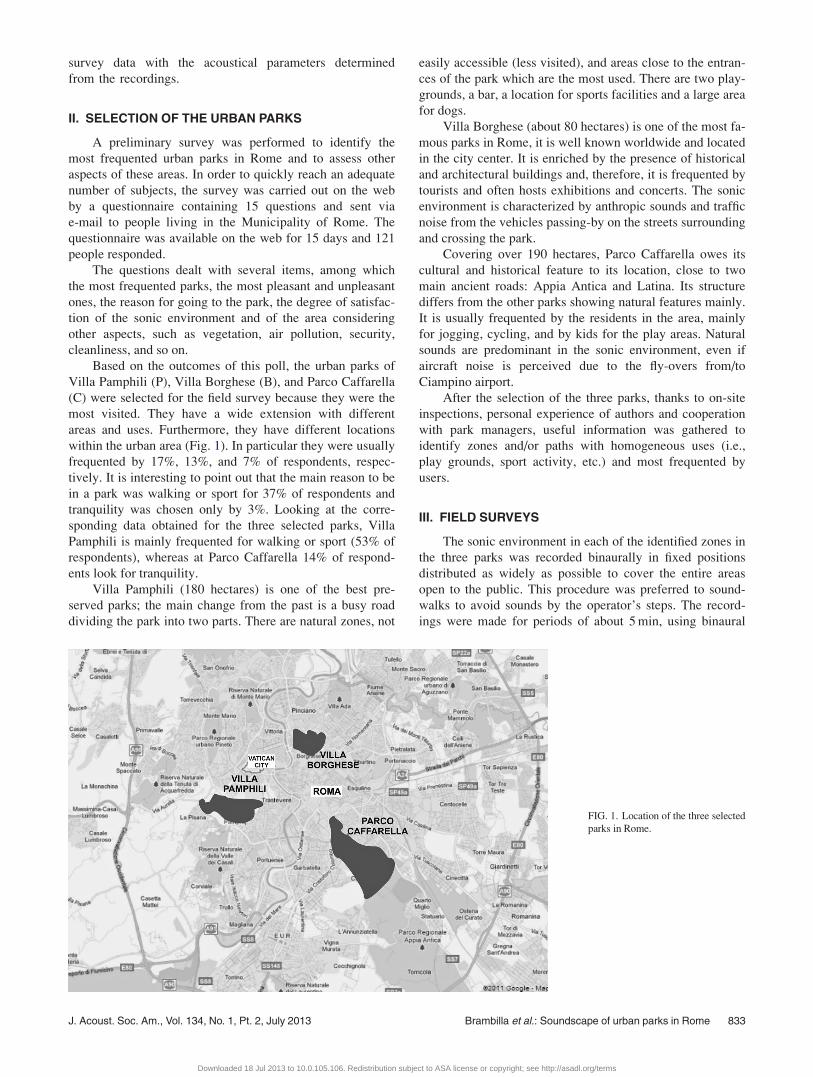
areas and uses. Furthermore, they have different locations
within the urban area (Fig. 1). In particular they were usually
frequented by 17%, 13%, and 7% of respondents, respec-
tively. It is interesting to point out that the main reason to be
in a park was walking or sport for 37% of respondents and
tranquility was chosen only by 3%. Looking at the corre-
sponding data obtained for the three selected parks, Villa
Pamphili is mainly frequented for walking or sport (53% of
respondents), whereas at Parco Caffarella 14% of respond-
ents look for tranquility.
Villa Pamphili (180 hectares) is one of the best pre-
served parks; the main change from the past is a busy road
dividing the park into two parts. There are natural zones, not
easily accessible (less visited), and areas close to the entran-
ces of the park which are the most used. There are two play-
grounds, a bar, a location for sports facilities and a large area
for dogs.
Villa Borghese (about 80 hectares) is one of the most fa-
mous parks in Rome, it is well known worldwide and located
in the city center. It is enriched by the presence of historical
and architectural buildings and, therefore, it is frequented by
tourists and often hosts exhibitions and concerts. The sonic
environment is characterized by anthropic sounds and traffic
noise from the vehicles passing-by on the streets surrounding
and crossing the park.
Covering over 190 hectares, Parco Caffarella owes its
cultural and historical feature to its location, close to two
main ancient roads: Appia Antica and Latina. Its structure
differs from the other parks showing natural features mainly.
It is usually frequented by the residents in the area, mainly
for jogging, cycling, and by kids for the play areas. Natural
sounds are predominant in the sonic environment, even if
aircraft noise is perceived due to the fly-overs from/to
Ciampino airport.
After the selection of the three parks, thanks to on-site
inspections, personal experience of authors and cooperation
with park managers, useful information was gathered to
identify zones and/or paths with homogeneous uses (i.e.,
play grounds, sport activity, etc.) and most frequented by
users.
III. FIELD SURVEYS
The sonic environment in each of the identified zones in
the three parks was recorded binaurally in fixed positions
distributed as widely as possible to cover the entire areas
open to the public. This procedure was preferred to sound-
walks to avoid sounds by the operator’s steps. The record-
ings were made for periods of about 5 min, using binaural
FIG. 1. Location of the three selected
parks in Rome.
J. Acoust. Soc. Am., Vol. 134, No. 1, Pt. 2, July 2013 Brambilla et al.: Soundscape of urban parks in Rome 833
Downloaded 18 Jul 2013 to 10.0.105.106. Redistribution subject to ASA license or copyright; see http://asadl.org/terms
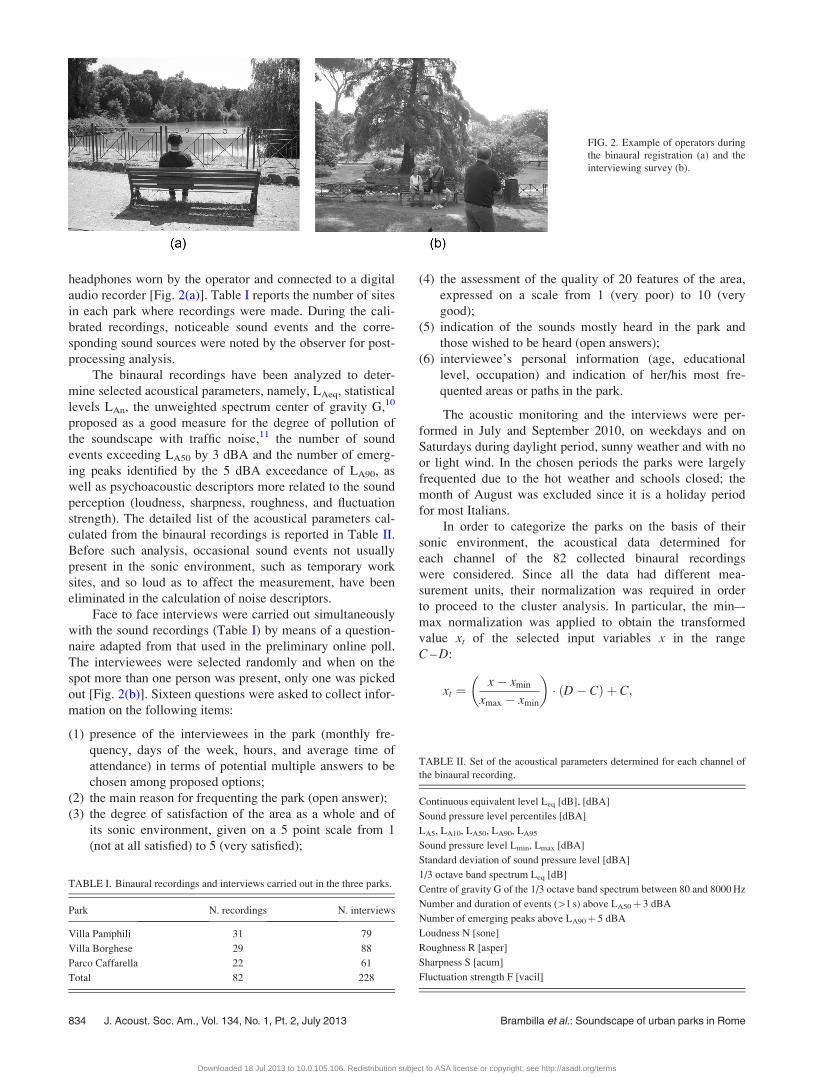
headphones worn by the operator and connected to a digital
audio recorder [Fig. 2(a)]. Table I reports the number of sites
in each park where recordings were made. During the cali-
brated recordings, noticeable sound events and the corre-
sponding sound sources were noted by the observer for post-
processing analysis.
The binaural recordings have been analyzed to deter-
mine selected acoustical parameters, namely, LAeq, statistical
levels LAn, the unweighted spectrum center of gravity G,10
proposed as a good measure for the degree of pollution of
the soundscape with traffic noise,11 the number of sound
events exceeding LA50 by 3 dBA and the number of emerg-
ing peaks identified by the 5 dBA exceedance of LA90, as
well as psychoacoustic descriptors more related to the sound
perception (loudness, sharpness, roughness, and fluctuation
strength). The detailed list of the acoustical parameters cal-
culated from the binaural recordings is reported in Table II.
Before such analysis, occasional sound events not usually
present in the sonic environment, such as temporary work
sites, and so loud as to affect the measurement, have been
eliminated in the calculation of noise descriptors.
Face to face interviews were carried out simultaneously
with the sound recordings (Table I) by means of a question-
naire adapted from that used in the preliminary online poll.
The interviewees were selected randomly and when on the
spot more than one person was present, only one was picked
out [Fig. 2(b)]. Sixteen questions were asked to collect infor-
mation on the following items:
(1) presence of the interviewees in the park (monthly fre-
quency, days of the week, hours, and average time of
attendance) in terms of potential multiple answers to be
chosen among proposed options;
(2) the main reason for frequenting the park (open answer);
(3) the degree of satisfaction of the area as a whole and of
its sonic environment, given on a 5 point scale from 1
(not at all satisfied) to 5 (very satisfied);
(4) the assessment of the quality of 20 features of the area,
expressed on a scale from 1 (very poor) to 10 (very
good);
(5) indication of the sounds mostly heard in the park and
those wished to be heard (open answers);
(6) interviewee’s personal information (age, educational
level, occupation) and indication of her/his most fre-
quented areas or paths in the park.
The acoustic monitoring and the interviews were per-
formed in July and September 2010, on weekdays and on
Saturdays during daylight period, sunny weather and with no
or light wind. In the chosen periods the parks were largely
frequented due to the hot weather and schools closed; the
month of August was excluded since it is a holiday period
for most Italians.
In order to categorize the parks on the basis of their
sonic environment, the acoustical data determined for
each channel of the 82 collected binaural recordings
were considered. Since all the data had different mea-
surement units, their normalization was required in order
to proceed to the cluster analysis. In particular, the min–-
max normalization was applied to obtain the transformed
value xt of the selected input variables x in the range
C – D:
xt ¼x� xmin
xmax � xmin
� �� ðD� CÞ þ C;
FIG. 2. Example of operators during
the binaural registration (a) and the
interviewing survey (b).
TABLE I. Binaural recordings and interviews carried out in the three parks.
Park N. recordings N. interviews
Villa Pamphili 31 79
Villa Borghese 29 88
Parco Caffarella 22 61
Total 82 228
TABLE II. Set of the acoustical parameters determined for each channel of
the binaural recording.
Continuous equivalent level Leq [dB], [dBA]
Sound pressure level percentiles [dBA]
LA5, LA10, LA50, LA90, LA95
Sound pressure level Lmin, Lmax [dBA]
Standard deviation of sound pressure level [dBA]
1/3 octave band spectrum Leq [dB]
Centre of gravity G of the 1/3 octave band spectrum between 80 and 8000 Hz
Number and duration of events (>1 s) above LA50þ 3 dBA
Number of emerging peaks above LA90þ 5 dBA
Loudness N [sone]
Roughness R [asper]
Sharpness S [acum]
Fluctuation strength F [vacil]
834 J. Acoust. Soc. Am., Vol. 134, No. 1, Pt. 2, July 2013 Brambilla et al.: Soundscape of urban parks in Rome
Downloaded 18 Jul 2013 to 10.0.105.106. Redistribution subject to ASA license or copyright; see http://asadl.org/terms
where C¼ 0 and D¼ 1 were chosen. The input variables
were the LAeq level, the noise climate LA10 – LA90, the per-
centile LA50, the 5th percentile of loudness N5, the mean val-
ues of sharpness S, roughness R, fluctuation strength F, and
the unweighted spectrum center of gravity in terms of lg(G).
The hierarchical cluster analysis was performed by means of
the IBM SPSS Statistics software, applying Ward algorithm
for agglomerative clustering, squared Euclidean distance,
and selecting the single solution of three clusters in order to
distinguish the three parks. To determine the significance of
the input variables in the clustering agglomeration, the
ANOVA was also performed. To validate the output of this
clustering, the k-means procedure was applied considering
three clusters and setting as initial centroids those obtained
from the previous hierarchical cluster analysis.
IV. RESULTS AND DISCUSSION
A. Acoustical data
According to the current Italian legislation, quiet areas
are included in the most sensitive acoustic zone, for which
the outdoor LAeq level referred to day-time period (06–22 h)
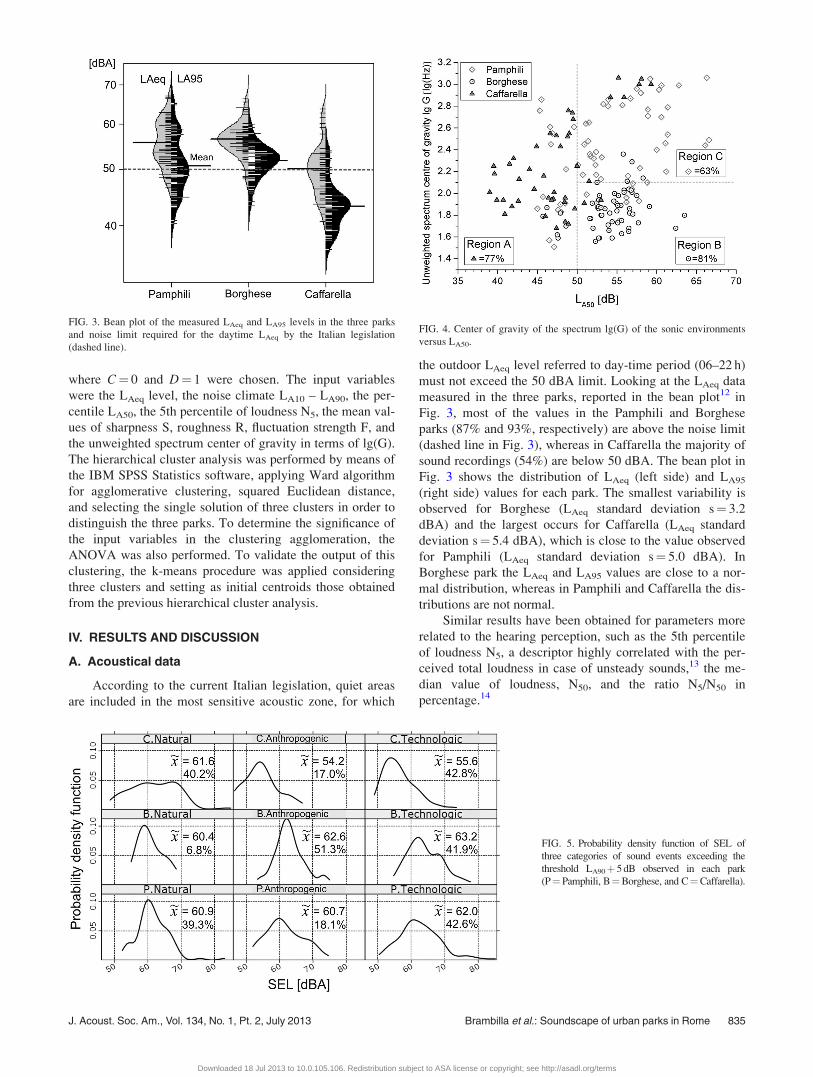
must not exceed the 50 dBA limit. Looking at the LAeq data
measured in the three parks, reported in the bean plot12 in
Fig. 3, most of the values in the Pamphili and Borghese
parks (87% and 93%, respectively) are above the noise limit
(dashed line in Fig. 3), whereas in Caffarella the majority of
sound recordings (54%) are below 50 dBA. The bean plot in
Fig. 3 shows the distribution of LAeq (left side) and LA95
(right side) values for each park. The smallest variability is
observed for Borghese (LAeq standard deviation s¼ 3.2
dBA) and the largest occurs for Caffarella (LAeq standard
deviation s¼ 5.4 dBA), which is close to the value observed
for Pamphili (LAeq standard deviation s¼ 5.0 dBA). In
Borghese park the LAeq and LA95 values are close to a nor-
mal distribution, whereas in Pamphili and Caffarella the dis-
tributions are not normal.
Similar results have been obtained for parameters more
related to the hearing perception, such as the 5th percentile
of loudness N5, a descriptor highly correlated with the per-
ceived total loudness in case of unsteady sounds,13 the me-
dian value of loudness, N50, and the ratio N5/N50 in
percentage.14
FIG. 3. Bean plot of the measured LAeq and LA95 levels in the three parks
and noise limit required for the daytime LAeq by the Italian legislation
(dashed line).
FIG. 4. Center of gravity of the spectrum lg(G) of the sonic environments
versus LA50.
FIG. 5. Probability density function of SEL of
three categories of sound events exceeding the
threshold LA90þ 5 dB observed in each park
(P¼Pamphili, B¼Borghese, and C¼Caffarella).
J. Acoust. Soc. Am., Vol. 134, No. 1, Pt. 2, July 2013 Brambilla et al.: Soundscape of urban parks in Rome 835
Downloaded 18 Jul 2013 to 10.0.105.106. Redistribution subject to ASA license or copyright; see http://asadl.org/terms
The above outcomes show that, according to acoustic
data only, wide areas of the three parks should not be consid-
ered so “quiet” and, therefore, this might concur to reduce
the function of the park as far as relaxation and calm is
concerned.15
Among the acoustical parameters, the median value of
the sound pressure level in dBA, that is LA50, has been
observed to be a better predictor for quietness rather than
LAeq.11 This statistical level has been contrasted with the
unweighted spectrum center of gravity G as formulated by
Raimbault,16 an acoustic measure of the spectral content of
the soundscape, calculated according to the following
formula:
G ¼
Xi
½10Li=10 � Bi�X
i
½10Li=10�;
where Li is the unweighted sound pressure level in dB, meas-
ured for each third octave band-width Bi from 80 Hz to
8 kHz. The lg(G) data are plotted in Fig. 4 versus LA50,
which is less sensitive to peaks in the sound pressure level
than LAeq.
The dashed lines in the plot, corresponding to
LA50¼ 50 dB and lg(G)¼ 2.1[log(Hz)], satisfactorily distin-
guish the three sonic environments of the three parks. As
shown in Fig. 4, 77% of recordings taken at Caffarella are in
the same region (A in the plot), 81% of those made at
Borghese are in region B and 63% of those taken at Pamphili
are within region C.
It is worth pointing out that the sound events perceived
in the three parks are numerous and produced by several
types of sources, from natural to anthropogenic and techno-
logical ones, such as vehicle pass-by, aircraft fly-over, and
so on. For instance, Fig. 5 shows the probability density
function of the SEL values of events exceeding the threshold
of LA90þ 5 dB for each park. In each subplot the median
value of SEL (~x) and the percentage of events of the same
type (referred to the total observed in the same park) are
reported. In Borghese park the anthropogenic events are pre-
dominant, whereas in the other two parks the technological
events are more frequent and in Caffarella these events show
SEL values lower than in Pamphili.
Regarding the categorization of the parks on the basis of
the acoustical descriptors of their sonic environment, the
ANOVA showed that all the eight input variables were sig-
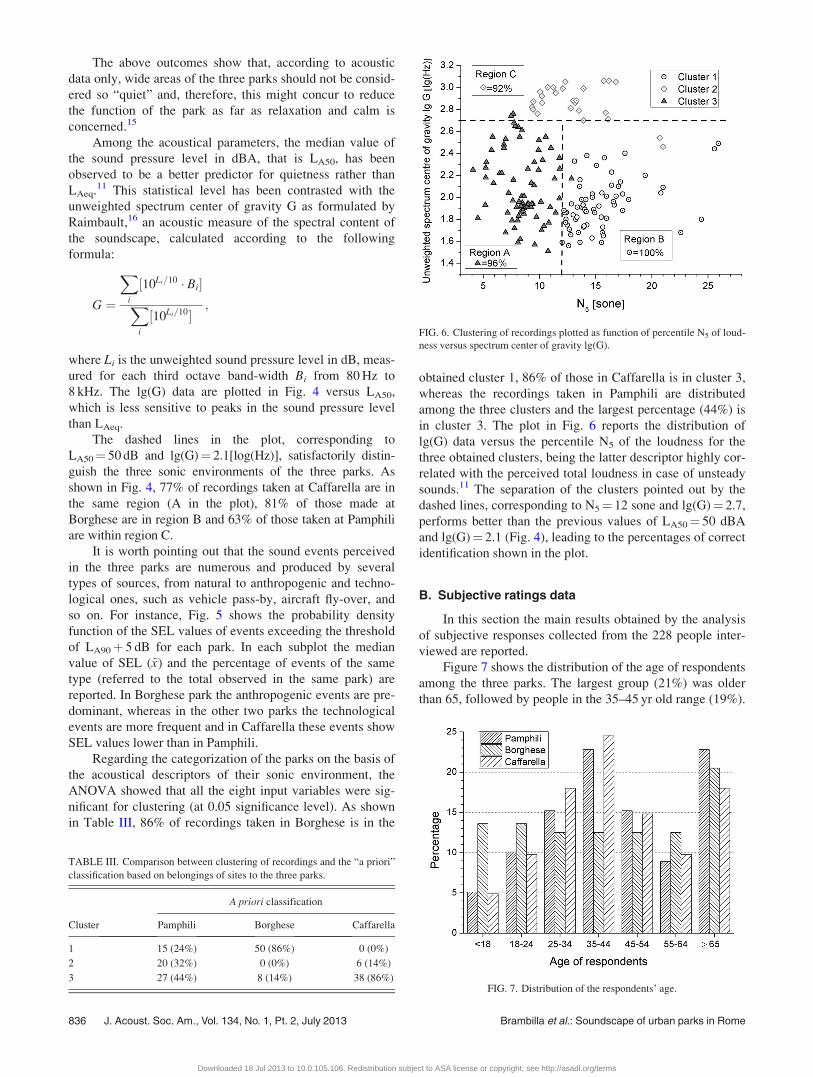
nificant for clustering (at 0.05 significance level). As shown
in Table III, 86% of recordings taken in Borghese is in the
obtained cluster 1, 86% of those in Caffarella is in cluster 3,
whereas the recordings taken in Pamphili are distributed
among the three clusters and the largest percentage (44%) is
in cluster 3. The plot in Fig. 6 reports the distribution of
lg(G) data versus the percentile N5 of the loudness for the
three obtained clusters, being the latter descriptor highly cor-
related with the perceived total loudness in case of unsteady
sounds.11 The separation of the clusters pointed out by the
dashed lines, corresponding to N5¼ 12 sone and lg(G)¼ 2.7,
performs better than the previous values of LA50¼ 50 dBA
and lg(G)¼ 2.1 (Fig. 4), leading to the percentages of correct
identification shown in the plot.
B. Subjective ratings data
In this section the main results obtained by the analysis
of subjective responses collected from the 228 people inter-
viewed are reported.
Figure 7 shows the distribution of the age of respondents
among the three parks. The largest group (21%) was older
than 65, followed by people in the 35–45 yr old range (19%).
FIG. 6. Clustering of recordings plotted as function of percentile N5 of loud-
ness versus spectrum center of gravity lg(G).
TABLE III. Comparison between clustering of recordings and the “a priori”
classification based on belongings of sites to the three parks.
A priori classification
Cluster Pamphili Borghese Caffarella
1 15 (24%) 50 (86%) 0 (0%)
2 20 (32%) 0 (0%) 6 (14%)
3 27 (44%) 8 (14%) 38 (86%)FIG. 7. Distribution of the respondents’ age.
836 J. Acoust. Soc. Am., Vol. 134, No. 1, Pt. 2, July 2013 Brambilla et al.: Soundscape of urban parks in Rome
Downloaded 18 Jul 2013 to 10.0.105.106. Redistribution subject to ASA license or copyright; see http://asadl.org/terms
Males (52%) were slightly higher than females (48%). In
addition 53% of respondents frequented the parks more than
four times a month and their largest fraction (41%) reported
to be in the park for a period between 1 and 2 h. Because of
these results, it is likely that the ratings provided by the sub-
jects are outcomes of their consolidated experience of the
park rather than occasional ones.
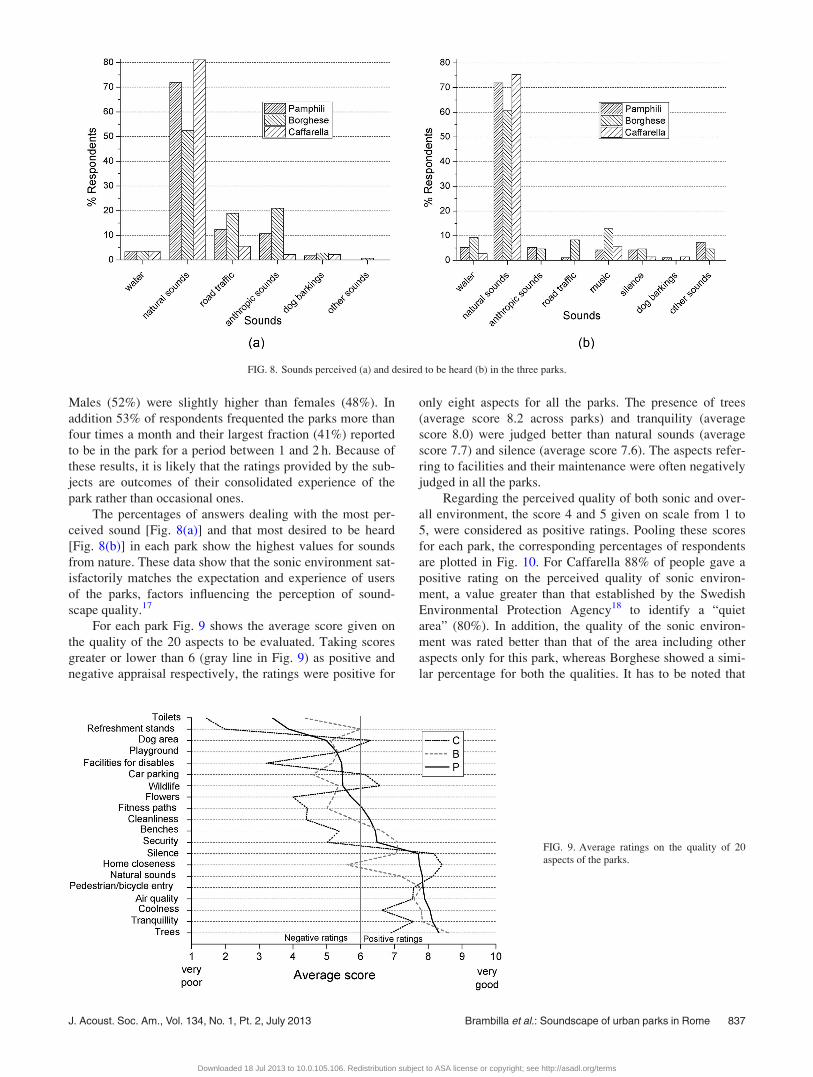
The percentages of answers dealing with the most per-
ceived sound [Fig. 8(a)] and that most desired to be heard
[Fig. 8(b)] in each park show the highest values for sounds
from nature. These data show that the sonic environment sat-
isfactorily matches the expectation and experience of users
of the parks, factors influencing the perception of sound-
scape quality.17
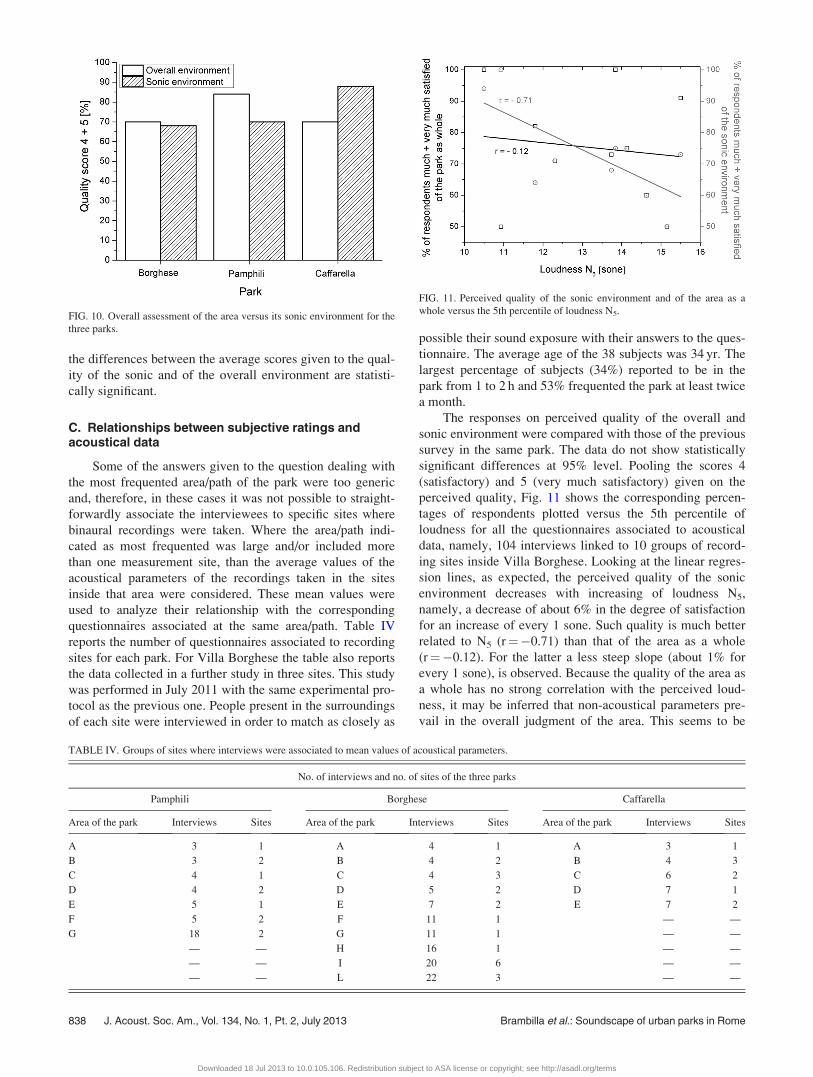
For each park Fig. 9 shows the average score given on
the quality of the 20 aspects to be evaluated. Taking scores
greater or lower than 6 (gray line in Fig. 9) as positive and
negative appraisal respectively, the ratings were positive for
only eight aspects for all the parks. The presence of trees
(average score 8.2 across parks) and tranquility (average
score 8.0) were judged better than natural sounds (average
score 7.7) and silence (average score 7.6). The aspects refer-
ring to facilities and their maintenance were often negatively
judged in all the parks.
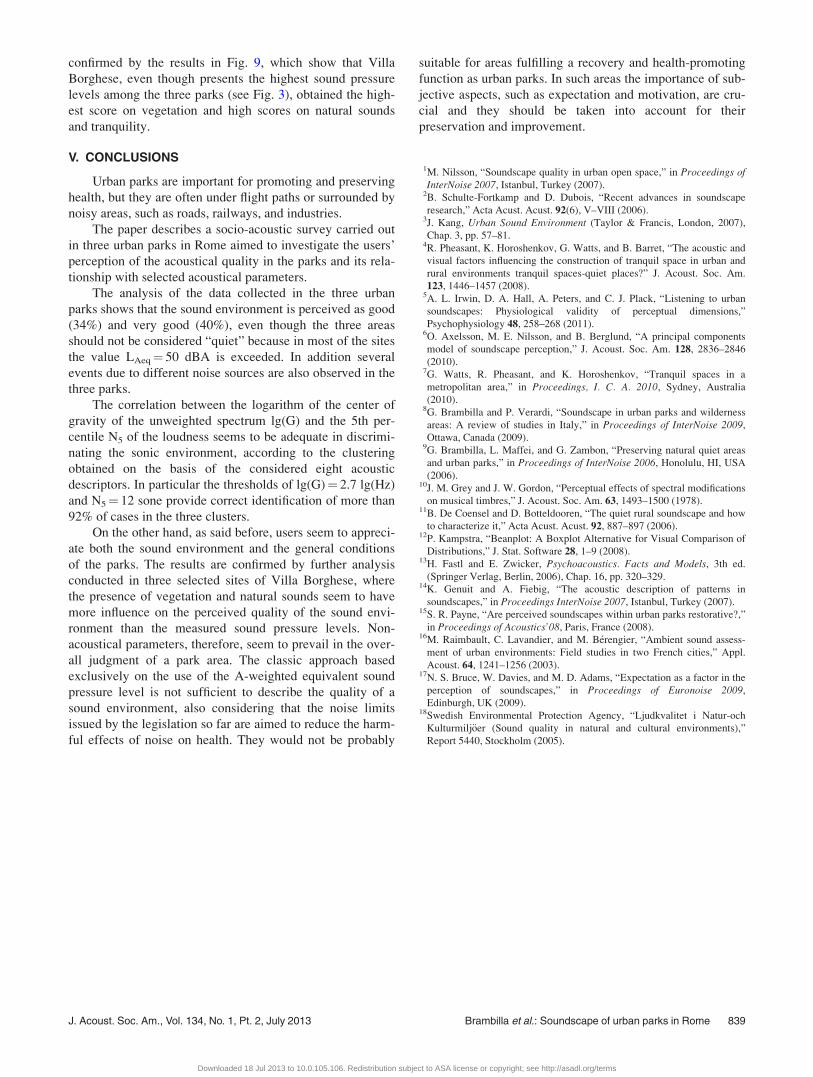
Regarding the perceived quality of both sonic and over-
all environment, the score 4 and 5 given on scale from 1 to
5, were considered as positive ratings. Pooling these scores
for each park, the corresponding percentages of respondents
are plotted in Fig. 10. For Caffarella 88% of people gave a
positive rating on the perceived quality of sonic environ-
ment, a value greater than that established by the Swedish
Environmental Protection Agency18 to identify a “quiet
area” (80%). In addition, the quality of the sonic environ-
ment was rated better than that of the area including other
aspects only for this park, whereas Borghese showed a simi-
lar percentage for both the qualities. It has to be noted that
FIG. 8. Sounds perceived (a) and desired to be heard (b) in the three parks.
FIG. 9. Average ratings on the quality of 20
aspects of the parks.
J. Acoust. Soc. Am., Vol. 134, No. 1, Pt. 2, July 2013 Brambilla et al.: Soundscape of urban parks in Rome 837
Downloaded 18 Jul 2013 to 10.0.105.106. Redistribution subject to ASA license or copyright; see http://asadl.org/terms
the differences between the average scores given to the qual-
ity of the sonic and of the overall environment are statisti-
cally significant.
C. Relationships between subjective ratings andacoustical data
Some of the answers given to the question dealing with
the most frequented area/path of the park were too generic
and, therefore, in these cases it was not possible to straight-
forwardly associate the interviewees to specific sites where
binaural recordings were taken. Where the area/path indi-
cated as most frequented was large and/or included more
than one measurement site, than the average values of the
acoustical parameters of the recordings taken in the sites
inside that area were considered. These mean values were
used to analyze their relationship with the corresponding
questionnaires associated at the same area/path. Table IV
reports the number of questionnaires associated to recording
sites for each park. For Villa Borghese the table also reports
the data collected in a further study in three sites. This study
was performed in July 2011 with the same experimental pro-
tocol as the previous one. People present in the surroundings
of each site were interviewed in order to match as closely as
possible their sound exposure with their answers to the ques-
tionnaire. The average age of the 38 subjects was 34 yr. The
largest percentage of subjects (34%) reported to be in the
park from 1 to 2 h and 53% frequented the park at least twice
a month.
The responses on perceived quality of the overall and
sonic environment were compared with those of the previous
survey in the same park. The data do not show statistically
significant differences at 95% level. Pooling the scores 4
(satisfactory) and 5 (very much satisfactory) given on the
perceived quality, Fig. 11 shows the corresponding percen-
tages of respondents plotted versus the 5th percentile of
loudness for all the questionnaires associated to acoustical
data, namely, 104 interviews linked to 10 groups of record-
ing sites inside Villa Borghese. Looking at the linear regres-
sion lines, as expected, the perceived quality of the sonic
environment decreases with increasing of loudness N5,
namely, a decrease of about 6% in the degree of satisfaction
for an increase of every 1 sone. Such quality is much better
related to N5 (r¼�0.71) than that of the area as a whole
(r¼�0.12). For the latter a less steep slope (about 1% for
every 1 sone), is observed. Because the quality of the area as
a whole has no strong correlation with the perceived loud-
ness, it may be inferred that non-acoustical parameters pre-
vail in the overall judgment of the area. This seems to be
FIG. 10. Overall assessment of the area versus its sonic environment for the
three parks.
TABLE IV. Groups of sites where interviews were associated to mean values of acoustical parameters.
No. of interviews and no. of sites of the three parks
Pamphili Borghese Caffarella
Area of the park Interviews Sites Area of the park Interviews Sites Area of the park Interviews Sites
A 3 1 A 4 1 A 3 1
B 3 2 B 4 2 B 4 3
C 4 1 C 4 3 C 6 2
D 4 2 D 5 2 D 7 1
E 5 1 E 7 2 E 7 2
F 5 2 F 11 1 — —
G 18 2 G 11 1 — —
— — H 16 1 — —
— — I 20 6 — —
— — L 22 3 — —
FIG. 11. Perceived quality of the sonic environment and of the area as a
whole versus the 5th percentile of loudness N5.
838 J. Acoust. Soc. Am., Vol. 134, No. 1, Pt. 2, July 2013 Brambilla et al.: Soundscape of urban parks in Rome
Downloaded 18 Jul 2013 to 10.0.105.106. Redistribution subject to ASA license or copyright; see http://asadl.org/terms
confirmed by the results in Fig. 9, which show that Villa
Borghese, even though presents the highest sound pressure
levels among the three parks (see Fig. 3), obtained the high-
est score on vegetation and high scores on natural sounds
and tranquility.
V. CONCLUSIONS
Urban parks are important for promoting and preserving
health, but they are often under flight paths or surrounded by
noisy areas, such as roads, railways, and industries.
The paper describes a socio-acoustic survey carried out
in three urban parks in Rome aimed to investigate the users’
perception of the acoustical quality in the parks and its rela-
tionship with selected acoustical parameters.
The analysis of the data collected in the three urban
parks shows that the sound environment is perceived as good
(34%) and very good (40%), even though the three areas
should not be considered “quiet” because in most of the sites
the value LAeq¼ 50 dBA is exceeded. In addition several
events due to different noise sources are also observed in the
three parks.
The correlation between the logarithm of the center of
gravity of the unweighted spectrum lg(G) and the 5th per-
centile N5 of the loudness seems to be adequate in discrimi-
nating the sonic environment, according to the clustering
obtained on the basis of the considered eight acoustic
descriptors. In particular the thresholds of lg(G)¼ 2.7 lg(Hz)
and N5¼ 12 sone provide correct identification of more than
92% of cases in the three clusters.
On the other hand, as said before, users seem to appreci-
ate both the sound environment and the general conditions
of the parks. The results are confirmed by further analysis
conducted in three selected sites of Villa Borghese, where
the presence of vegetation and natural sounds seem to have
more influence on the perceived quality of the sound envi-
ronment than the measured sound pressure levels. Non-
acoustical parameters, therefore, seem to prevail in the over-
all judgment of a park area. The classic approach based
exclusively on the use of the A-weighted equivalent sound
pressure level is not sufficient to describe the quality of a
sound environment, also considering that the noise limits
issued by the legislation so far are aimed to reduce the harm-
ful effects of noise on health. They would not be probably
suitable for areas fulfilling a recovery and health-promoting
function as urban parks. In such areas the importance of sub-
jective aspects, such as expectation and motivation, are cru-
cial and they should be taken into account for their
preservation and improvement.
1M. Nilsson, “Soundscape quality in urban open space,” in Proceedings ofInterNoise 2007, Istanbul, Turkey (2007).
2B. Schulte-Fortkamp and D. Dubois, “Recent advances in soundscape
research,” Acta Acust. Acust. 92(6), V–VIII (2006).3J. Kang, Urban Sound Environment (Taylor & Francis, London, 2007),
Chap. 3, pp. 57–81.4R. Pheasant, K. Horoshenkov, G. Watts, and B. Barret, “The acoustic and
visual factors influencing the construction of tranquil space in urban and
rural environments tranquil spaces-quiet places?” J. Acoust. Soc. Am.
123, 1446–1457 (2008).5A. L. Irwin, D. A. Hall, A. Peters, and C. J. Plack, “Listening to urban
soundscapes: Physiological validity of perceptual dimensions,”
Psychophysiology 48, 258–268 (2011).6O. Axelsson, M. E. Nilsson, and B. Berglund, “A principal components
model of soundscape perception,” J. Acoust. Soc. Am. 128, 2836–2846
(2010).7G. Watts, R. Pheasant, and K. Horoshenkov, “Tranquil spaces in a
metropolitan area,” in Proceedings, I. C. A. 2010, Sydney, Australia
(2010).8G. Brambilla and P. Verardi, “Soundscape in urban parks and wilderness
areas: A review of studies in Italy,” in Proceedings of InterNoise 2009,
Ottawa, Canada (2009).9G. Brambilla, L. Maffei, and G. Zambon, “Preserving natural quiet areas
and urban parks,” in Proceedings of InterNoise 2006, Honolulu, HI, USA
(2006).10J. M. Grey and J. W. Gordon, “Perceptual effects of spectral modifications
on musical timbres,” J. Acoust. Soc. Am. 63, 1493–1500 (1978).11B. De Coensel and D. Botteldooren, “The quiet rural soundscape and how
to characterize it,” Acta Acust. Acust. 92, 887–897 (2006).12P. Kampstra, “Beanplot: A Boxplot Alternative for Visual Comparison of
Distributions,” J. Stat. Software 28, 1–9 (2008).13H. Fastl and E. Zwicker, Psychoacoustics. Facts and Models, 3th ed.
(Springer Verlag, Berlin, 2006), Chap. 16, pp. 320–329.14K. Genuit and A. Fiebig, “The acoustic description of patterns in
soundscapes,” in Proceedings InterNoise 2007, Istanbul, Turkey (2007).15S. R. Payne, “Are perceived soundscapes within urban parks restorative?,”
in Proceedings of Acoustics’08, Paris, France (2008).16M. Raimbault, C. Lavandier, and M. B�erengier, “Ambient sound assess-
ment of urban environments: Field studies in two French cities,” Appl.
Acoust. 64, 1241–1256 (2003).17N. S. Bruce, W. Davies, and M. D. Adams, “Expectation as a factor in the
perception of soundscapes,” in Proceedings of Euronoise 2009,
Edinburgh, UK (2009).18Swedish Environmental Protection Agency, “Ljudkvalitet i Natur-och
Kulturmilj€oer (Sound quality in natural and cultural environments),”
Report 5440, Stockholm (2005).
J. Acoust. Soc. Am., Vol. 134, No. 1, Pt. 2, July 2013 Brambilla et al.: Soundscape of urban parks in Rome 839
Downloaded 18 Jul 2013 to 10.0.105.106. Redistribution subject to ASA license or copyright; see http://asadl.org/terms