Embed Size (px)
Citation preview

The Premedieval Origin of PortolanCharts: New Geodetic Evidence
Roel Nicolai, Utrecht University
Abstract: Portolan charts are highly realistic medieval charts that show remarkablyaccurate coastlines of the Mediterranean and the Black Sea. They emerged suddenly,without any predecessors or a clear developmental path, in Italy during the thirteenthcentury. There is broad scholarly agreement that these charts are original creations ofEuropean medieval culture. However, corroborating evidence is lacking, and a con-vincing explanation of the method of their construction has so far not been provided.In this essay it is demonstrated by means of geodetic analysis that the overall shape ofthe coastlines corresponds closely to that on a modern map based on the Mercatorprojection. It is further demonstrated that this correspondence cannot possibly be dueto chance. Consequently, the existence of a Mercator or Mercator-like map projectionon portolan charts is incompatible with the assumed medieval origin of these charts.Portolan charts are far more sophisticated than has hitherto been recognized. Theirconstruction was well beyond the capabilities of cartographers from either medievalEurope or the Arabic-Islamic world. This conclusion serves to reopen the question ofthe origins of the geometric data and the construction methods that until now haveappeared to underlie medieval portolan charts.
KEY QUESTIONSThe earliest extant portolan chart, known as the Carte Pisane, is conventionally dated to theend of the thirteenth century and shows the Mediterranean area with proportions that areessentially correct.1 Portolan charts are far superior to the contemporary mappaemundi of theEuropean intellectual clerical elite and to contemporary Arabic-Islamic maps in the realismwith which they render the coastlines of their core area, which consists of the Mediterranean,the Black Sea, and the Atlantic coast from Cap Draa in present-day Morocco up to andincluding the south coast of England. Portolan charts are far more accurate than, and shareno characteristics with, the highest cartographic achievements known from antiquity,
Mathematical Institute, Utrecht University, P.O. Box 80010, 3508 TA Utrecht, Netherlands; [email protected] The Bibliotheque Nationale de France, owner of the Carte Pisane (Departement des Cartes et Plans, Res. Ge. B1118),postulates the end of the thirteenth century. See also Tony Campbell, “Census of Pre-Sixteenth-Century Portolan Charts,”Imago Mundi, 1986, 38:67–94. Ramon Pujades has recently attempted to make a case for an early fifteenth-century origin:Ramon J. Pujades i Bataller, “The Pisana Chart: Really a Primitive Portolan Chart Made in the Thirteenth Century?” Bulletindu Comite Francais de Cartographie, 2013, 216(6):17–32.
Isis, volume 106, number 3. © 2015 by The History of Science Society.All rights reserved. 0021-1753/2015/10603-0001$10.00
517

Claudius Ptolemy’s scientifically designed maps. They appear to be entirely unrelated to anyknown cartographic tradition.
The medieval origin of the surviving portolan charts is not disputed. It is the origin of thegeometric information on those charts—that is, the shape of the coastlines—that is the subjectof this essay. The accuracy of these charts leaves no doubt that they are based on geometricmeasurements rather than on a mental image of the Mediterranean world, as is the case withmappaemundi and contemporary Arabic-Islamic maps.
While consensus holds that portolan charts are original European medieval creations, anumber of questions relevant to the history of science have not yet received a satisfactoryanswer. On what geometric measurement data are these charts based, how was this datacollected, and how did it attain the necessary accuracy? How did medieval cartographersconstruct portolan charts from the underlying measurement data? What knowledge andtechnology are required to make such accurate charts, including and in particular theirapparent map projection? Any answers to those questions will have to be reconciled with thestate of science and technology in the medieval period.
The most enigmatic aspects of these charts are their accuracy and their close resemblanceto a modern map based on the Mercator map projection or the equirectangular projection.The difference between these two map projections will be discussed later in this essay. A mapprojection may be described as a mathematical relationship between the coordinates on thesphere (latitude and longitude) and map coordinates (X and Y). Any representation of aportion of the spherical earth on a flat surface may be said to involve some kind of projection,but geodetic-cartographic map projections are designed to minimize—or, rather, control—theinevitable distortions, according to some criterion. There are map projections that render allmeridians true to scale; others render small shapes without distortion; and yet others show theareas of countries and regions in their correct relative size.
The relevance of the questions I have posed is demonstrated by the fact that the Mercatorprojection was only introduced in 1569, by the Flemish cartographer Gerard Mercator. Thescience of geodesy had yet to be invented when the portolan charts first came into use, andthe geodetic technique of triangulation, which was used in the eighteenth century to constructthe geometric framework of the first scientifically produced topographical map, now knownas the Cassini map of France, was still more than three centuries away. The hypothesis ofportolan charts’ medieval origin requires a convincing explanation for the gap that existsbetween the state of medieval science and technology (as far as this is known), on the onehand, and the requirements for scientific mapping of the large area portrayed by portolancharts, on the other.
PORTOLAN CHARTS: CHARACTERISTICS, FACTS, AND SCHOLARLYVIEWSSerious research into the origin of portolan charts began in the middle of the nineteenthcentury, and a number of diverse hypotheses as to their origin and the method of theirconstruction have since been proposed. The different points of view have converged to aconsensus that postulates a medieval origin and assumes that the charts were drawn frommeasurements of compass bearings and estimates of distances sailed made by medievalmariners during trading voyages. Although this view is often presented as an established factto the world beyond the small communities of medievalists and map historians, corroboratingevidence is lacking and hardly any aspect of this hypothesis has ever been properly tested. Theorigin of portolan charts has therefore remained a matter of speculation. I have recentlycompleted a critical review of the constituent aspects of the hypothesis of a medieval origin
518 Roel Nicolai The Premedieval Origin of Portolan Charts
and have tested its geodetic aspects using quantitative methods.2 A full geodetic analysis ofthese charts had not been available before my study. The results are surprising: the hypothesisof a medieval origin for portolan charts must be rejected unequivocally; the depiction of thecoastlines on portolan charts cannot have a medieval origin. The implication is that thesecharts are copies of older maps or charts. Portolan charts cannot be falsifications made at somelater date: there are simply too many surviving charts and their impact on later cartography istoo clearly evident.
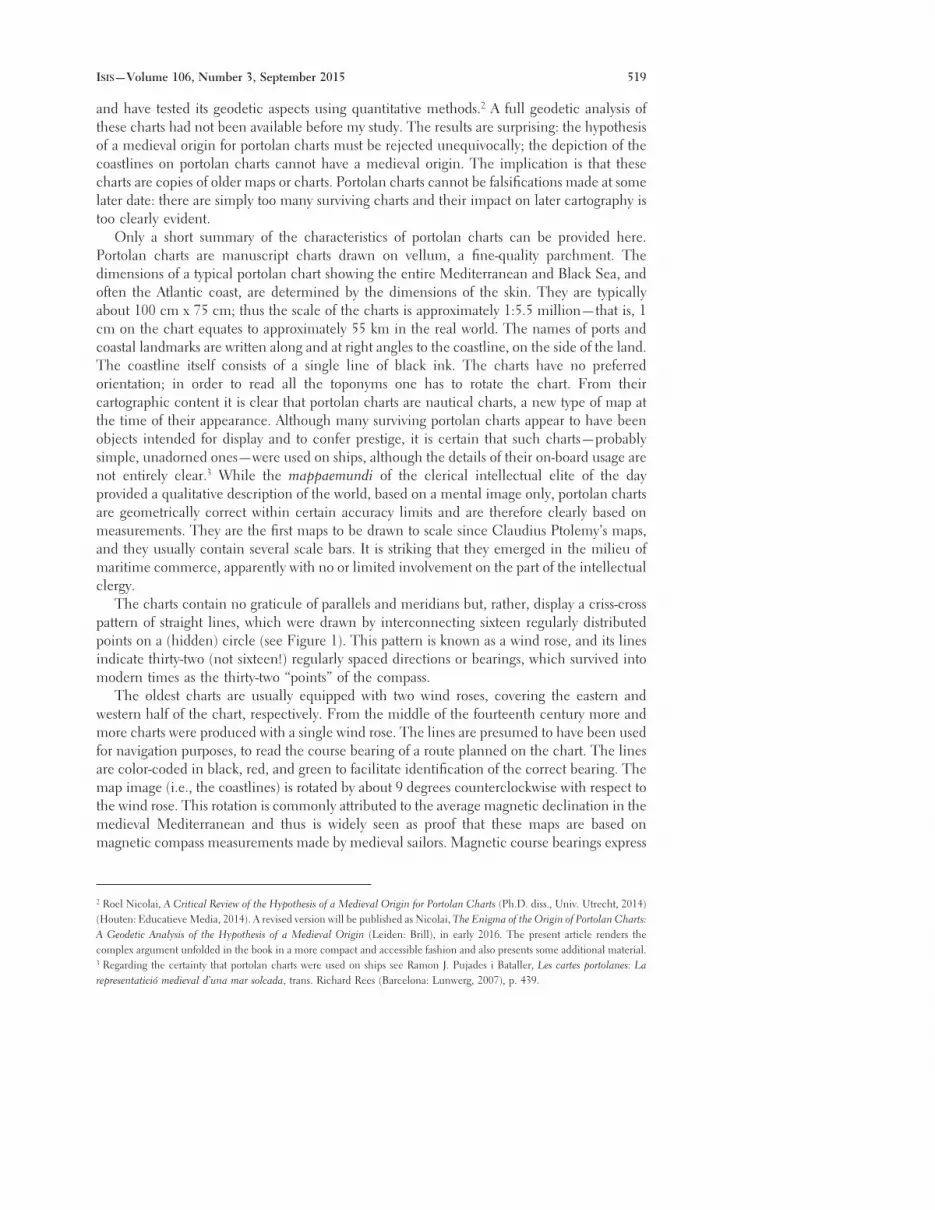
Only a short summary of the characteristics of portolan charts can be provided here.Portolan charts are manuscript charts drawn on vellum, a fine-quality parchment. Thedimensions of a typical portolan chart showing the entire Mediterranean and Black Sea, andoften the Atlantic coast, are determined by the dimensions of the skin. They are typicallyabout 100 cm x 75 cm; thus the scale of the charts is approximately 1:5.5 million—that is, 1cm on the chart equates to approximately 55 km in the real world. The names of ports andcoastal landmarks are written along and at right angles to the coastline, on the side of the land.The coastline itself consists of a single line of black ink. The charts have no preferredorientation; in order to read all the toponyms one has to rotate the chart. From theircartographic content it is clear that portolan charts are nautical charts, a new type of map atthe time of their appearance. Although many surviving portolan charts appear to have beenobjects intended for display and to confer prestige, it is certain that such charts—probablysimple, unadorned ones—were used on ships, although the details of their on-board usage arenot entirely clear.3 While the mappaemundi of the clerical intellectual elite of the dayprovided a qualitative description of the world, based on a mental image only, portolan chartsare geometrically correct within certain accuracy limits and are therefore clearly based onmeasurements. They are the first maps to be drawn to scale since Claudius Ptolemy’s maps,and they usually contain several scale bars. It is striking that they emerged in the milieu ofmaritime commerce, apparently with no or limited involvement on the part of the intellectualclergy.
The charts contain no graticule of parallels and meridians but, rather, display a criss-crosspattern of straight lines, which were drawn by interconnecting sixteen regularly distributedpoints on a (hidden) circle (see Figure 1). This pattern is known as a wind rose, and its linesindicate thirty-two (not sixteen!) regularly spaced directions or bearings, which survived intomodern times as the thirty-two “points” of the compass.
The oldest charts are usually equipped with two wind roses, covering the eastern andwestern half of the chart, respectively. From the middle of the fourteenth century more andmore charts were produced with a single wind rose. The lines are presumed to have been usedfor navigation purposes, to read the course bearing of a route planned on the chart. The linesare color-coded in black, red, and green to facilitate identification of the correct bearing. Themap image (i.e., the coastlines) is rotated by about 9 degrees counterclockwise with respect tothe wind rose. This rotation is commonly attributed to the average magnetic declination in themedieval Mediterranean and thus is widely seen as proof that these maps are based onmagnetic compass measurements made by medieval sailors. Magnetic course bearings express
2 Roel Nicolai, A Critical Review of the Hypothesis of a Medieval Origin for Portolan Charts (Ph.D. diss., Univ. Utrecht, 2014)(Houten: Educatieve Media, 2014). A revised version will be published as Nicolai, The Enigma of the Origin of Portolan Charts:A Geodetic Analysis of the Hypothesis of a Medieval Origin (Leiden: Brill), in early 2016. The present article renders thecomplex argument unfolded in the book in a more compact and accessible fashion and also presents some additional material.3 Regarding the certainty that portolan charts were used on ships see Ramon J. Pujades i Bataller, Les cartes portolanes: Larepresentaticio medieval d’una mar solcada, trans. Richard Rees (Barcelona: Lunwerg, 2007), p. 439.
ISIS—Volume 106, Number 3, September 2015 519

the course direction relative to magnetic north, not true (geographic) north. The differencebetween true north and magnetic north is the magnetic declination; a positive value formagnetic declination means that a magnetic needle would point east of true north. Magneticdeclination as a phenomenon was unknown in the medieval Mediterranean world.
The coastlines of the accurate core area of Mediterranean portolan charts were to a largeextent copied from earlier portolan charts. That does not imply that the extant charts are“slavish” copies of a single original, as was suggested by Adolf Erik Nordenskiöld, but thesimilarities in the coastline shape are far more noticeable than the differences. Research hasuncovered other interesting aspects of the geometric characteristics of these charts. In 1987Scott Loomer established the Mercator projection as the best-fitting map projection from a listof nine candidate projections, with the equirectangular projection a close runner-up.4 Fur-thermore, regional scale differences exist in various parts of every portolan chart. This hasbeen known since the middle of the nineteenth century and is usually interpreted as anindication that portolan charts are mosaics of partial charts of independently charted sub-basins of the Mediterranean.
4 Adolf E. Nordenskiöld, Periplus: An Essay on the Early History of Charts and Sailing-Directions, trans. Francis A. Bather(Stockholm: P. A. Norstedt, 1897), facsimile rpt. (Eastford, Conn.: Marino, 2003), p. 18; and Scott A. Loomer, “A CartometricAnalysis of Portolan Charts: A Search for Methodology” (Ph.D. diss., Univ. Wisconsin–Madison, 1987), pp. 133, 146.
Figure 1. Tracing of the portolan chart by Angelino Dulcert (1339). The dimensions of theoriginal chart, located at the Bibliotheque nationale de France, Paris, are approximately 75 cmx 105 cm. Unlike most portolan charts, this chart consists of two sheets of vellum stucktogether. The dashed coastlines indicate the area outside the accurate core area of the chart.The two wind roses are shown in grey so as not to obscure the coastline details.
520 Roel Nicolai The Premedieval Origin of Portolan Charts

A curious characteristic of portolan charts is the fact that while they are very realistic withrespect to the entire Mediterranean and Black Sea area, in many places the local coastal detailis poor.5 This is paradoxical, given that these charts are supposed to have been built up fromsurface measurements: such a construction process would work from the details toward thewhole. To achieve a certain degree of accuracy for the entire chart, the details have to bemapped with greater accuracy, as errors will, on statistical grounds, not automatically cancelout but instead accumulate as the area being mapped is extended. In addition to the pooragreement with reality along local stretches of coastline that we see on surviving portolancharts, numerous coastal features have also been exaggerated in size: bays are deeper than theywould be when drawn to scale, while promontories tend to be larger.
THE CONSENSUS VIEW: A MEDIEVAL EUROPEAN ORIGINThe hypothesis of a medieval origin for portolan charts describes what has been understoodas the most likely scenario. I would stress again that the medieval origin of the survivingphysical charts is not disputed. My challenge concerns the origin of the accurate rendering ofthe overall coastline geometry. Although there are still a few proponents of an ancient origin,the charts themselves do not contain even a hint of such an origin. They show no similarityto the maps of Claudius Ptolemy.6 Researchers who propose an ancient origin usually do sobecause they reject a medieval European origin as inadequate to explain the accuracy of thecharts. An Arabic-Islamic origin is highly improbable, as the earliest extant Arabic-Islamiccharts date from the fifteenth century and quantitative analysis has shown that they are lessaccurate than European portolan charts, of which they appear to be copies.7 By a process ofelimination, therefore, scholars arrive at a hypothesis of a medieval European origin, with themost likely site the Ligurian coast of Italy.
The associated question of how these charts were constructed is far more difficult toanswer, and many researchers who study portolan charts hold the view that, while they feelcertain of the charts’ medieval origin, the process of their construction is not (yet) well enoughunderstood. I noted earlier that a presumed medieval origin of the charts requires anexplanation of how they are supposed to have been constructed that can be reconciled withwhat is known about the state of medieval science and technology. While specific details areavoided in many published variants of the hypothesis of a medieval origin, the most likelyaccount of the hypothesized process of construction runs as follows.8
1. It is assumed that medieval European mariners practiced a disciplined form ofnavigation, estimating the speed and direction of the ship at regular intervals—forexample, four-hour watch intervals. The navigation technique in which one starts at aknown location and calculates the change in position from speed and bearing isknown as dead reckoning. Estimated or measured values of successive intervals are
5 Nicolai, Critical Review of the Hypothesis of a Medieval Origin for Portolan Charts (cit. n. 2), pp. 36–37. See Section 2.2.2:“A Contradiction of Tobler’s First Law of Geography” for a more extensive description. See also Patrick Gautier Dalche,“Cartes marines, representation du littoral et perception de l’espace au Moyen Âge: Un etat de la question,” in Castrum VII:Zones cotieres et plaines littorales dans le monde mediterraneen au Moyen Age, ed. Jean-Marie Martin (Rome: Ecole Francaisede Rome, 2002), pp. 25–28.6 Pujades, Les cartes portolanes (cit. n. 3), pp. 506–508.7 Loomer, “Cartometric Analysis of Portolan Charts” (cit. n. 4), p. 148; and Pujades, Les cartes portolanes, pp. 508–509.8 The four points listed paraphrase and elaborate the account in Tony Campbell, “Portolan Charts from the Late ThirteenthCentury to 1500,” in The History of Cartography, Vol. 1: Cartography in Prehistoric, Ancient, and Medieval Europe and theMediterranean, ed. J. B. Harley and David Woodward (Chicago: Univ. Chicago Press, 1987), pp. 371–463, esp. p. 388.
ISIS—Volume 106, Number 3, September 2015 521

assumed to have been compounded into a single bearing and distance for a journeybetween any two coastal points along the route the ship traveled. Data of this sort ispresumed to form the empirical basis of the portolan chart. The magnetic compassemerged practically simultaneously with portolan charts in the Mediterranean, and itis therefore still a subject of debate among proponents of a medieval origin whetheror not the compass was used in portolan chart construction.
2. The estimates of bearings and distances between coastal points from many journeysand many mariners are presumed to have been collated centrally, thus forming abody of quantitative geometric data of the Mediterranean, the Black Sea, and theAtlantic coasts. A process of improvement in the accuracy of the quantitativeknowledge of directions and distances between coastal points is generally assumed.This assumption is justified by the intuitive notion that a single measurement of anydistance or bearing would be insufficiently precise to explain the accuracy of portolancharts. Some authors speak of “averaging,” but the majority do not specify any processthrough which the accuracy of these estimates might have been improved.9
3. The first portolan chart is presumed to have been constructed from this conjecturalcentrally collated body of navigation data using a technique known as plane charting.Plane charting assumes a flat or plane geometry for the surface of the earth: in otherwords, the curvature of the earth’s surface is ignored. It was widely believed in theMiddle Ages that the earth is indeed spherical, but it was not understood how oneshould account for the curvature of its surface in the construction of maps. Modernresearchers who study portolan charts generally agree that any data mismatches thatwould have arisen from measurement errors were corrected, or “reconciled,” by someempirical graphical method, while the effects of earth curvature on charting areconsidered to be negligible. The assumption that no geodetic-cartographic mapprojection was used in their construction is usually expressed by assertions thatportolan charts are projectionless.10
4. These assertions seem to be contradicted by the results of research using methods ofcartometric analysis. Cartometric analysis is any form of numerical analysis of thegeometric properties of a map or chart. Such methods have demonstrated that themap image of portolan charts shows remarkably good agreement with the map imageof a modern map based on the Mercator projection. In spite of these results, broadconsensus exists among portolan chart researchers that there is no contradiction at all.They consider the close agreement with any map projection to be an unintentionalby-product of the plane-charting technique. This view is put forth without anysupporting evidence and is often justified only by statements to the effect that the“effects of earth curvature are negligible in a relatively small portion of the earth’ssurface such as the Mediterranean.”11 This assumption is mandatory in order touphold the hypothesis of a medieval origin of portolan charts constructed frommeasured distances and bearings: medieval cartographers would not have known how
9 See, e.g., Pujades, Les cartes portolanes (cit. n. 3), p. 510; and Heinrich Winter, “The Origin of the Sea Chart,” Imago Mundi,1956, 13:39–44, esp. p. 39.10 Campbell, “Portolan Charts from the Late Thirteenth Century to 1500” (cit. n. 8), p. 385; and Armando Cortesao, Historyof Portuguese Cartography, Vol. 1 (Coimbra: Junta de Investigacoes de Ultramar-Lisboa, 1969), p. 217.11 Cortesao, History of Portuguese Cartography, Vol. 1, p. 365; and Eva R. Taylor, “The Sailor in the Middle Ages,” Journal ofNavigation, 1948, 1:191–196, on p. 191 (quotation). See also Richard Pflederer, “Portolan Charts—Vital Tool of the Age ofDiscovery, Sailing Guides,” History Today, 2002, 52(5), http://www.historytoday.com/richard-pflederer/portolan-charts.
522 Roel Nicolai The Premedieval Origin of Portolan Charts

to correct the raw measurements in such a way that a Mercator or similar projectionwould emerge. This knowledge only developed centuries later.
For the hypothesis of a medieval origin to be accepted as true, all four of theseassumptions must hold: they build on one another, culminating in assumption 4. In spiteof the consensus, there is also broad agreement among researchers that the hypothesis ofa medieval origin is not corroborated by any evidence. Tony Campbell makes the pointin tactful but clear terms in his 1987 contribution to the History of Cartography project:“Among the research problems connected with portolan charts, the question of theirorigin is perhaps the most intractable. . . . Despite the thousands of scholarly wordsexpended on the subject, most of the hypotheses about portolan chart origins haveremained just that. In the absence of corroborating data they often appear to be lessexplanations than creation myths.” Patrick Gautier Dalche expresses the same view morebluntly: “The question of the origins of these charts has given rise to a torrent of theories,of which the essential characteristic is that none of them has a solid foundation.” RamonPujades i Bataller summarized the situation as follows: “[Because the charts are] oftenexamined only from the geographical perspective and on the fringe of any kind ofhistorical contextualization[,] an extremely wide variety of opinions— often more dog-matic than scientific— have been expressed regarding the time and place of their birth.”12
Not every researcher will subscribe to the four-point hypothesis outlined above. Arecent trend is to avoid being specific about the charts’ origin and construction method,seeing them as “the offspring, not of a specific place, but of a Mediterranean seaborneculture in its broadest geographical sense—a heritage as common as the lingua franca, ormixture of languages, that seamen used,” as Pujades describes this trend.13 GautierDalche sees portolan charts as the product of “Mediterranean maritime culture in itsentirety, characterized by multiple cultural exchanges.” According to him, portolan chartsare an expression of a “revolution in the representation of space.”14 The close agreementof portolan charts with the Mercator map projection is dismissed as irrelevant or as anoptical illusion or is not even mentioned, and the accuracy of the charts is played down.15
The apparently deliberate lack of specificity of such “explanations” makes verification orfalsification next to impossible.
We might ask whether the hypothesis of a medieval origin for portolan charts lendsitself to scientific verification (or falsification) at all or whether the answers are forever lost“in the mists of time.” Indeed, considerably more numerical information may be extractedfrom these charts than has been obtained until now, and such information may facilitateproper testing of the hypothesis of a medieval origin. The history of cartography is usuallyconsidered to belong to the domain of the humanities. Although there have beenexcursions into more exact, numerical methods of analysis, portolan charts and theirhypothesized construction process have never been approached from the perspective ofgeodesy. While the domain of cartography may be described as the representation ofspatial information in the form of maps, geodesy comprises not only the study of the size
12 Campbell, “Portolan Charts from the Late Thirteenth Century to 1500” (cit. n. 8), p. 380; Patrick Gautier Dalche, Cartemarine et portolan au XIIe siecle: Le “Liber de existencia rivierarum et forma maris nostri mediterranei” (Pise, circe 1200) (Rome:Ecole Francaise de Rome, 1995), p. 28; and Pujades, Les cartes portolanes (cit. n. 3), p. 506.13 Pujades, Les cartes portolanes, p. 515. Pujades does not support this notion.14 Gautier Dalche, “Cartes marines, representation du littoral et perception de l’espace au Moyen Âge” (cit. n. 5), pp. 20, 31.15 Ibid., pp. 15, 25–28; and Pujades, Les cartes portolanes (cit. n. 3), p. 460.
ISIS—Volume 106, Number 3, September 2015 523

and shape of the earth but, applied to smaller parts of the earth’s surface, also theestablishment of geodetic frameworks that form the geometric basis of modern maps andcharts. Such geodetic (or geometric) frameworks are built up from surface—and, nowa-days, surface-to-space— geodetic measurements. Examples are found in the classicaltriangulation networks that underlie the national mapping of most countries. A morepertinent example would be the centrally collated body of distances and bearings, referredto earlier, that would collectively build up such a geometric framework covering theMediterranean and the Black Sea. It is from such a network of bearings and distancesbetween coastal points such as ports and landmarks that portolan charts are presumed tohave been drawn. The question of how accurate the underlying measurements need to beto produce a map of a prespecified accuracy is a fundamentally geodetic question, as isthe question of whether the Mercator or any other projection might emerge coinciden-tally from the “plane-charting” process.
This essay focuses on the compatibility of the Mercator projection, or a similar mapprojection, with the image of the coastlines on a portolan chart produced by plane charting.It will be shown that such a projection is incompatible with that simple construction methodand that therefore the whole hypothesis of a medieval origin will have to be rejected.
THE ACCURACY OF PORTOLAN CHARTSBefore immersing the reader in the question of the map projection, I must establish theaccuracy of portolan charts. This, in turn, introduces the question of how the concept of the“accuracy” of a map or chart is to be defined. The accuracy of a measurement is usuallydefined as the closeness of that value to its true value. One might therefore be tempted toexpand this principle to a map: measure distances and angles between a number of repre-sentative points on the map and compare them with the true values between these points inthe “real world,” after correction for the scale of the map. This approach would, however, failto take into account that the “true” values are measured on the spherical earth, whereas themeasurements on the map are made on a flat surface. In other words, this comparative measure-ment would fail to take into account the inevitable distortions that result from projecting sphericalgeometry onto a flat surface. That such projection is not possible without distorting the sphericalsurface is readily demonstrated when one tries to flatten a large piece of orange peel: it cannot bedone without stretching or tearing the peel. Before map accuracy can be estimated in the wayoutlined above, it must be known how the distances and angles measured on the map are distortedby the map projection. Each type of map projection introduces its own characteristic distortionsof angles and distances between points. For example, parallels and meridians are shown as straightlines on some map projections and as curved lines on others. Moreover, their spacing may vary.Thus each map projection has its own characteristic “fingerprint” of distortions. The distortion ofdistances may be calculated for many map projections as a multiplication or scale factor. Onlywhen that scale distortion has been taken into account can distances between points on the mapbe compared with corresponding distances on the earth’s surface and the difference between thetwo used to quantify errors in the mapping of geographic features—in other words, to establish theaccuracy of the map or chart.
The Mercator projection is a conformal map projection—that is, it renders small shapeswithout distortion. Furthermore, it projects a rhumb line, a line that intersects all meridiansat a constant angle on the sphere, as a straight line on the map. It is this property that makesthe Mercator projection so exceptionally useful in navigation, because the course of a shipthat keeps a constant compass bearing is a rhumb line on the sphere. The ship’s coursetherefore plots as a straight line on a Mercator chart. The Mercator projection does come with
524 Roel Nicolai The Premedieval Origin of Portolan Charts

a drawback: its scale becomes progressively larger as latitude increases (see Figure 2). In orderto plot the change in a ship’s position after a day’s sailing on a Mercator chart correctly usingdead reckoning, a navigator must stretch the distance sailed by the ship during the dayaccordingly. The length of a segment of rhumb line on the sphere is shorter than itscorresponding length on the Mercator chart by a factor approximately equal to the cosine ofthe average latitude of that line segment, after the nominal scale of the chart has been takeninto consideration.
When it is known or suspected that a portolan chart is based on the Mercator projectionor closely resembles such a projection (or any other projection, for that matter), a researchermay digitally determine a “best fit” between the portolan chart and a reference Mercator mapby shifting the portolan chart, rotating it and changing its scale until a “best fit” with thereference chart is achieved. This may be done computationally by executing this “best-fitting”process using a least-squares algorithm. In this process a large number of corresponding pairsof points on the portolan chart and the reference chart, called identical points, are selected;then the best-fitting process is executed on those points. The two charts will of course not bea perfect match; small differences, called residuals or residual errors, will remain in thepositions of identical points on the portolan chart after the best fit to the reference map.The least-squares algorithm minimizes the sum of the squares of these residuals by optimizingthe shift, rotation, and scale of the portolan chart with respect to the reference chart. Whenall systematic distortion components have thus been removed in the best-fitting process, theresidual errors in X and Y coordinates of the chart will reflect the random errors in the identicalpoints and are representative of the accuracy of the chart. The Mean Squared Error (MSE)needs to be computed separately for the X coordinates and the Y coordinates, and the largerof the two is taken as a measure of the accuracy of the chart (MSEchart). That is usually asomewhat conservative estimate of map accuracy, as it ignores the fact that the map may bemore accurate in the complementary direction.16 It is customary to express chart accuracy as
16 This may be illustrated by a simple example. If the MSE value in the X direction of the map and the MSE in the Y directionof the map were both 100 km2, the map may be said to have a map accuracy of 10 km in all directions. Had the squares of
Figure 2. Scale distortion of distances in the Mercator projection.
ISIS—Volume 106, Number 3, September 2015 525

a linear quantity and take the square root of that number, the Root Mean Squared Error, orRMSEchart, which may be interpreted as the mean point accuracy of the map or chart. Theconcept of chart accuracy assumes randomness of the remaining map errors, which willexhibit a certain spread around a mean value of zero (see Figure 3).
If the underlying map projection of portolan charts is not the Mercator projection butanother type of projection—or perhaps no projection at all—the mean of all residuals will notbe close to zero but will deviate systematically from zero, and the distribution of the residualswill be skewed. The MSE will in that case be larger, as it will contain not only thecontribution of the random chart errors but, in addition, a systematic component or bias,consisting of the sum of the squares of all systematic deviations in the identical points. Onemay use this principle to determine what the best-fitting map projection to a portolan chartis. Map projections that do not fit as well as others will have a larger MSE because of this bias.After all, the accuracy of the chart remains the same; only the systematic deviation or bias inthe MSE changes, depending on whether the map projection used in the cartometric analysisis a better or worse approximation of the true map projection of the chart.
This approach was followed by Loomer, who found that the Mercator projection resultedin the smallest MSE for all twenty-six portolan charts he investigated. This does not prove thatportolan charts are based on the Mercator projection, however. Another projection may fitbetter yet; or, as the consensus view on this matter holds, there may not be an underlyingprojection even though it may look like it—in much the way that one may sometimes seemto see a human face that is not really there in the knots and depressions of a tree trunk.
My analysis of five early portolan charts distinguished itself from most other cartometricstudies in that I treated each chart as a composite of several partial charts instead of as a single
the residuals in the X and the Y directions been added together, the sum would have amounted to 200 km2. The square rootof that figure would be about 14 km, which would be an incorrect value for the accuracy of the map. For that reason theresiduals in the X coordinates and the residuals in the Y coordinates need to be separated.
Figure 3. Histogram of the (normalized) residuals in the 836 identical points of the portolanchart of Angelino Dulcert (1339) after application of a piecewise best-fitting process to theMercator projection. The solid black line is the theoretical normal or Gaussian errordistribution. The white bars in the tails of the distributions belong to identical points that wererejected in the least-squares fit.
526 Roel Nicolai The Premedieval Origin of Portolan Charts

entity. (See Table 1.) If portolan charts are indeed mosaic charts, as all relevant research seemsto indicate, then it is incorrect to analyze them as single coherent entities.17 I did not makea priori assumptions about the exact extents of the subcharts and the locations of their joinsbut determined these iteratively from the data by means of statistical testing. The rejection ofone identical point at a time will reduce the MSE of the remaining subset of points if therejected point is inconsistent with that subset. This procedure, which is entirely repeatable,allows for the establishment of a number of coherent subsets of points, which may beinterpreted to correspond to subcharts, each with its own scale and orientation. The differ-ences in scale and orientation per subchart that were thus computed were statisticallysignificant. Almost as a by-product, the chart accuracy was determined per subchart of eachof the five portolan charts analyzed (see Figure 4).
An RMSEchart of 11 km corresponds to about 2 mm on the chart, which is extremelyaccurate for a medieval chart, even when one realizes that the RMSE indicates the radius ofa circle of uncertainty corresponding with a confidence level of approximately 39 percent.This is much better than has been assumed until now—which is understandable, since allresearchers who have conducted quantitative analyses of portolan charts treated them as singleentities, not as composites of subcharts.
Analysis of the five charts confirms that portolan charts are mosaic charts (see Figure 5).There is significant agreement in the locations of the joins between the subcharts across theportolan charts analyzed, although some important differences have come to light as well.
The most important and intriguing aspect of these subcharts is that their boundaries orjoins do not follow the expected boundaries of the traditional sub-basins of the Mediterranean
17 On portolan charts as mosaics see, e.g., Loomer, “Cartometric Analysis of Portolan Charts” (cit. n. 4), pp. 160–165.
Table 1. Five Portolan Charts Analyzed
Name in ThisArticle Cartographer
Date ofCreation Location
CatalogueNumber
IdenticalPoints
Carte Pisane Anon. Genoese End 13thcentury
BnF, Cartes etPlans, Paris
Ge B 1118 444
Ricc 3827 Anon. Genoese 1300–1325 Bib. Riccardiana,Florence
3827 1,015
Dulcert 1339 AngelinoDulcert
1339 BnF, Cartes etPlans, Paris
Ge B 696 836
Ristow- SkeltonNo. 3(RS-3)
Anon. Genoese 1325–1350 Library ofCongress,Washington
742
Roselli 1466 Petrus Roselli 1466 James Ford BellLibrary,Minneapolis
bell001281466mRo
860
Source.—Roel Nicolai, A Critical Review of the Hypothesis of a Medieval Origin for PortolanCharts (Ph.D. diss., Univ. Utrecht, 2014) (Houten: Educatieve Media, 2014), Ch. 7: “Carto-metric Analysis of Five Charts.”
ISIS—Volume 106, Number 3, September 2015 527

(e.g., Aegean Sea, Adriatic Sea, etc.), as is usually assumed. The subcharts that constitute themosaic chart of the Mediterranean notably exhibit considerable overlaps and some gaps, asshown in Figure 5. In view of the ultimate conclusion that these charts cannot be medieval,the overlaps of the subcharts suggest that the mosaic was composed by overlaying commonsections of coastlines on the original partial charts. This process may explain why the scalesand orientations of adjacent subcharts are similar in magnitude, as shown in Figures 6 and 7.Joining two adjacent subcharts in this manner may be done using different sections of
Figure 5. Tracing of the portolan chart by Angelino Dulcert (1339) with 836 identical points,divided into coherent subsets of points, identified with partial charts.
Figure 4. Accuracy (RMSE) of the subcharts of a Mediterranean portolan chart.
528 Roel Nicolai The Premedieval Origin of Portolan Charts
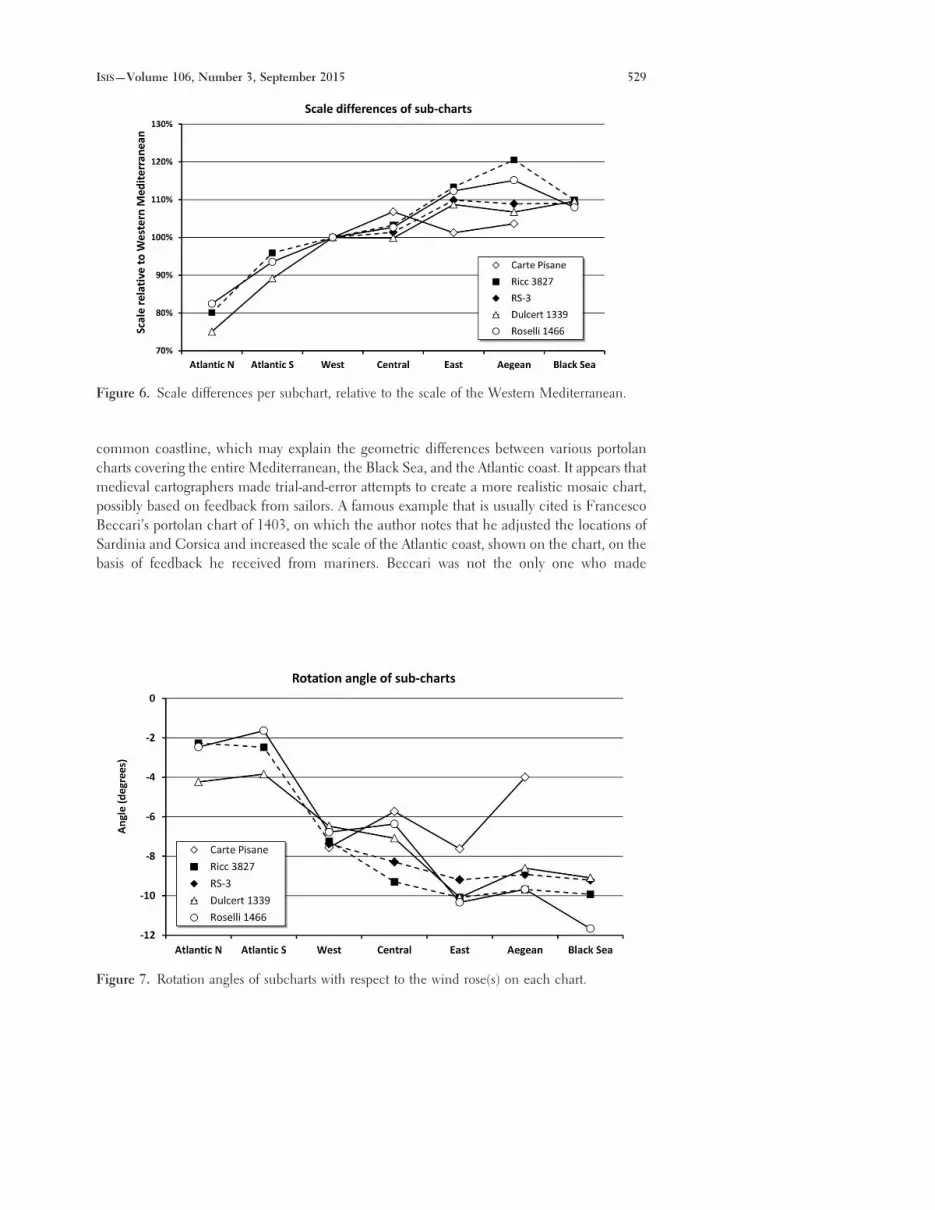
common coastline, which may explain the geometric differences between various portolancharts covering the entire Mediterranean, the Black Sea, and the Atlantic coast. It appears thatmedieval cartographers made trial-and-error attempts to create a more realistic mosaic chart,possibly based on feedback from sailors. A famous example that is usually cited is FrancescoBeccari’s portolan chart of 1403, on which the author notes that he adjusted the locations ofSardinia and Corsica and increased the scale of the Atlantic coast, shown on the chart, on thebasis of feedback he received from mariners. Beccari was not the only one who made
Figure 6. Scale differences per subchart, relative to the scale of the Western Mediterranean.
Figure 7. Rotation angles of subcharts with respect to the wind rose(s) on each chart.
ISIS—Volume 106, Number 3, September 2015 529

modifications to the design of his portolan charts; nor was he the first, as a comparison of thelocations of Corsica and Sardinia on the five charts I analyzed demonstrates.18
PLANE CHARTING AND THE CONSTRUCTION OF A MERCATORCHARTThe process of constructing a chart using the Mercator projection from geometric measure-ments made aboard ships has the following in common with the process of dead-reckoningnavigation using a Mercator chart. In both cases measurements of sailed distance and coursedirection are used, in the first case to plot the position of coastal features on the map and inthe second to plot the ship’s position. In both cases, as well, these measurements require acorrection to account for the different geometrical characteristics of the spherical surface ofthe earth and the plane surface of the chart. As explained earlier, the Mercator projection doesnot require the course direction to be corrected, but distance sailed must be corrected bydividing it by the cosine of the mean latitude.19 After correction for nominal chart scale,distances on a Mercator chart are therefore in principle longer than corresponding distanceson the spherical earth, as the cosine of latitude varies from unity at the equator to zero at thepoles.20
In the process of plane charting no corrections are made to any geometrical measurementmade on the surface of the spherical earth. For the course bearing that is likewise true forMercator charting, but with regard to the distances the two methods diverge considerably.Take two equal distances on the sphere in the Western Mediterranean, one along thenorthern coast and one along the southern Mahgreb coast: the distance along the northerncoast would project some 10 percent longer on a Mercator chart than the distance along thesouthern coast.
The plane-charting process that is described as part of the four-point origin hypothesisimplies that all data mismatches, whether they result from measurement errors or fromignoring earth curvature—the two error sources are indistinguishable—were reconciled bysome graphical method. It is impossible to reconstruct such a method reliably, as there are anunlimited number of ways in which that might be done, but a guiding principle may beestablished as follows. The hypothetical medieval cartographer, in the process of drawing hischart from the presumed centrally available body of navigation data, would discover a dataconflict when the position of the same point—for example, a cape—could be determined bytwo bearing and distance pairs from different points that have already been charted, as shownin Figure 8. The most likely way he would have dealt with such conflicting information wouldbe to draw the cape somewhere in the middle, between the two independent positiondeterminations. The same would hold if more bearings and distances to the same cape wereavailable. This principle can easily be simulated in the least-squares calculation process byallocating appropriate weights to the different bearings and distances in the assumed geodeticnetwork.
For the plane-charting process to produce, by coincidence, an image compatible with the
18 Nicolai, Critical Review of the Hypothesis of a Medieval Origin for Portolan Charts (cit. n. 2), pp. 243–245 (Section 7.6.4:“The Wanderings of Corsica and Sardinia”).19 This is an approximation, as the latitude of the ship changes as it sails any course different from due east or due west.20 In nautical practice the situation is slightly more complex, as nautical charts on the Mercator projection have been designedto be true to scale at a specified parallel of latitude. Distances on the chart are longer than those on the sphere when they aresituated at a higher latitude than the true-to-scale parallel and shorter when situated at a lower latitude.
530 Roel Nicolai The Premedieval Origin of Portolan Charts
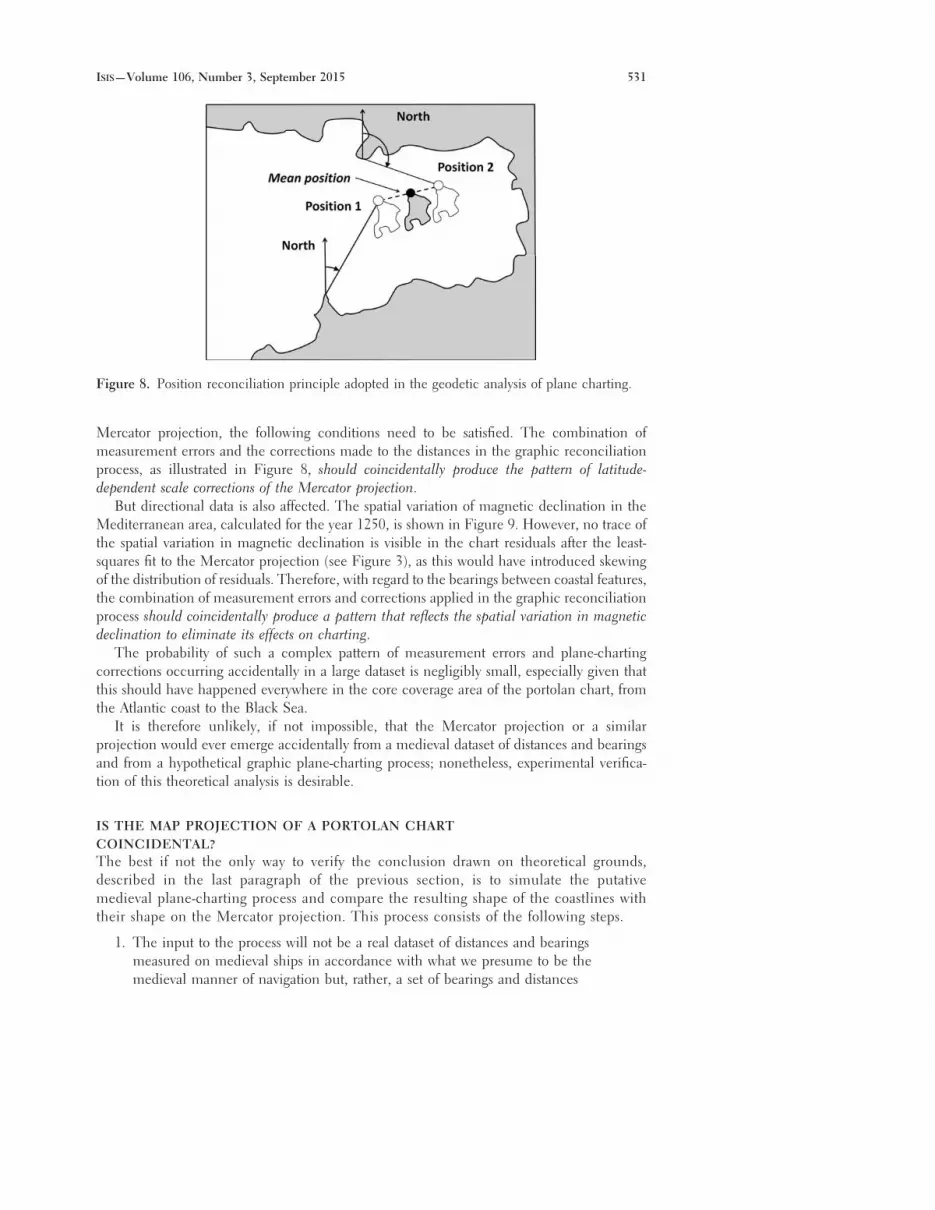
Mercator projection, the following conditions need to be satisfied. The combination ofmeasurement errors and the corrections made to the distances in the graphic reconciliationprocess, as illustrated in Figure 8, should coincidentally produce the pattern of latitude-dependent scale corrections of the Mercator projection.
But directional data is also affected. The spatial variation of magnetic declination in theMediterranean area, calculated for the year 1250, is shown in Figure 9. However, no trace ofthe spatial variation in magnetic declination is visible in the chart residuals after the least-squares fit to the Mercator projection (see Figure 3), as this would have introduced skewingof the distribution of residuals. Therefore, with regard to the bearings between coastal features,the combination of measurement errors and corrections applied in the graphic reconciliationprocess should coincidentally produce a pattern that reflects the spatial variation in magneticdeclination to eliminate its effects on charting.
The probability of such a complex pattern of measurement errors and plane-chartingcorrections occurring accidentally in a large dataset is negligibly small, especially given thatthis should have happened everywhere in the core coverage area of the portolan chart, fromthe Atlantic coast to the Black Sea.
It is therefore unlikely, if not impossible, that the Mercator projection or a similarprojection would ever emerge accidentally from a medieval dataset of distances and bearingsand from a hypothetical graphic plane-charting process; nonetheless, experimental verifica-tion of this theoretical analysis is desirable.
IS THE MAP PROJECTION OF A PORTOLAN CHARTCOINCIDENTAL?The best if not the only way to verify the conclusion drawn on theoretical grounds,described in the last paragraph of the previous section, is to simulate the putativemedieval plane-charting process and compare the resulting shape of the coastlines withtheir shape on the Mercator projection. This process consists of the following steps.
1. The input to the process will not be a real dataset of distances and bearingsmeasured on medieval ships in accordance with what we presume to be themedieval manner of navigation but, rather, a set of bearings and distances
Figure 8. Position reconciliation principle adopted in the geodetic analysis of plane charting.
ISIS—Volume 106, Number 3, September 2015 531

calculated between points along the Mediterranean coastline that have beenscaled from a modern map. The errors in those positions are negligible incomparison with those found on a portolan chart, and they may therefore beconsidered to be error free. Hence also the values of the bearings and distancescalculated from those positions may be considered to be error free. Thesebearings and distances will be calculated over a spherical earth of moderndimensions. The outcome of this step is a geodetic network or framework oferror-free distances and bearings on the curved surface of the earth, computedbetween the selected coastal points that constitute the nodes of the framework.To simulate medieval compass bearings, the calculated bearings will have themagnetic declination for the year 1250 applied to them.
2. When the network of distances and bearings between coastal points is flattened in theplane mismatches will appear owing to the fact that earth curvature is ignored. Thehypothesis of a medieval origin for portolan charts assumes that the cartographermanaged to reconcile these data mismatches (which the hypothesis considers to benegligible), together with data mismatches due to measurement errors, by somegraphical adjustment process. I have simulated this presumed process by performingthe adjustment using least-squares estimation (LSE) with measurement weightsmimicking the process illustrated in Figure 8. LSE will compute corrections to thebearings and distances such that they will fit together in the map plane, as well ascalculating the optimum positions of the coastal points described in step 1. This willwarp the shape of the geodetic framework and, hence, the coastline shape that would
Figure 9. Magnetic declination for the year 1250, calculated from the paleomagnetic modelCALS7k.2. The values shown are positive, which means that a compass needle would havepointed away from north, toward the east, by the amounts shown on this map. See M. Korte, A.Genevey, C. G. Constable, U. Frank, and E. Schnepp, “Continuous Geomagnetic FieldModels for the Past Seven Millennia, I: A New Global Data Compilation,” Geochemistry,Geophysics, Geosystems, 2005, 6(20):1–28, Q02H16, doi:10.1029/2004GC000800; and Korteand Constable, “Continuous Geomagnetic Field Models for the Past Seven Millennia, II:CALS7K,” ibid., pp. 1–18, Q02H16, doi:10.1029/2004GC000801.
532 Roel Nicolai The Premedieval Origin of Portolan Charts

result from “joining the dots” of the geodetic framework nodes. Let the coastlineshape thus constructed be referred to as a synthetic portolan chart. The question iswhether this warping of the coastline shape is enough to be have a measurableimpact. No measurement errors play a role in the generation of this syntheticportolan chart, only magnetic declination and the effects of ignoring earth curvature.
3. If the map projection is indeed a coincidental by-product of the plane-chartingprocess, the warped shape of the coastlines—that is, the synthetic portolanchart—will agree closely with the coastline shape found on a real portolan chart.This can be measured by subjecting the synthetic portolan chart to the sameprocess of cartometric analysis to which the real charts were subjected.
A realistic geodetic framework of distances and compass bearings needs to be specified, onethat takes properly into account the trade routes and prevailing summer winds in theMediterranean and the Black Sea. A key factor that determined the preference for certainroutes and the avoidance of others was the consistency of the summer winds in the Mediter-ranean. The dominant wind direction is north to northwest. Thus for most of the summer thesouthern shores were lee shores, which any sailor would rather avoid—and certainly with asailing ship that had difficulty in making headway against the wind. Moreover, the many reefsand rocky shoals along the southern shores increased the danger of running aground. Thereare few islands along the southern coast that might offer shelter in case of sudden adverseweather. The northern shores are safer. Many islands, surrounded by deep water, offeredshelter in an emergency, and on them, in contrast to the islands on the southern coast, freshwater was readily available. All these factors led to the development of a maritime trunk routethat ran along the northern Mediterranean coast.21 Some writers have claimed that, thanks toits lateen rig, a medieval ship could sail any course its master wished except due into the wind,but this is an unduly optimistic and naive view. The advantage offered by this type of rig, ifsuch an advantage existed, was largely undone by the rounded bilges of the hull, which offeredlittle or no resistance to leeway.22
Sailing routes over open sea would therefore have been mainly in a southern to south-eastern direction. Christian sailors certainly frequented Moslem trading ports in North Africa,but the bulk of the shipping to and from Byzantium and the Levant followed the northerncoast. Routes along the southern coast would also have been used, but far less frequently thanthe trunk route along the northern coast.
With these considerations in mind, I constructed three geodetic networks, for the Westernand Eastern Mediterranean and for the Black Sea (see Figure 10). Following steps 1 and 2 ofthe process described above, positions of the nodal points along the coast and islands may becalculated by means of least-squares estimation. These positions, representing the syntheticportolan chart, were then fed into the same cartometric analysis process as the identical pointsselected on the real portolan charts, as described in step 3. The Mean Squared Error of thefit to the Mercator projection, MSEplane charting, is a measure of the mismatch in shape betweenthe synthetic chart—in essence, the plane-charted network that was computed—and theMercator projection. If the Mercator projection is a coincidental by-product of the plane-
21 John H. Pryor, Geography, Technology, and War: Studies in the Maritime History of the Mediterranean, 649–1571, paperbacked. (Cambridge: Cambridge Univ. Press, 1992), pp. 21, 53.22 For the suggestion that lateen rigs offered significant choice in the matter of sailing course see David W. Waters, The Art ofNavigation in England in Elizabethan and Early Stuart Times (London: Hollis & Carter, 1958), p. 21. For the view that therounded bilges of the hull would counteract those advantages see Pryor, Geography, Technology, and War, pp. 34–37.
ISIS—Volume 106, Number 3, September 2015 533

charting process, this MSEplane charting will be zero or very close to zero, expressing a very goodfit of the synthetic portolan chart to the Mercator projection.
The reader is now asked to jump back mentally to the accuracy estimates of the realportolan charts. These were expressed in Figure 4 as RMSE values of around 11 km for eachsubchart. This figure was calculated by splitting the sum of the squared residuals into twocomponents, one in an east–west and the other in a north–south direction. The larger of thetwo represents omnidirectional chart accuracy. In other words, an accuracy of 11 km shouldbe interpreted as meaning 11 km in any direction, but it should be remembered that eitherin the east–west or the north–south direction the accuracy will be slightly better. For thefollowing analysis the squares of all residuals—that is, both in the east–west and in thenorth–south direction—are required. The average of the Mean Squared Errors of all subchartsof the five charts I analyzed is 196 km2, which we will consider to be representative for theMSE of a typical portolan (sub)chart.
The accuracy of a typical portolan chart represented by an MSE value of 196 km2 may beconsidered to have three independent components. The effect of navigation accuracy on thepositions of coastal points would be the main contributor. This component will be designatedby MSEnavigation accuracy. The second component is the effect of the exaggeration of coastalfeatures imposed by the cartographer (deeper bays and larger promontories), MSEfeature exaggeration.I have estimated this to be 4 km in all directions. Therefore it contributes 32 km2 to the totalchart accuracy: MSEportolan chart � 196 km2. The hypothesis that the map projection of portolancharts is coincidental implies that the assumed plane-charting process does not add significantlyto the error budget of the chart. The relationship between the accuracy components may bewritten in a more compact form as follows:
Figure 10. Geodetic network of bearings and distances in the Western Mediterranean.Distances between coastal points are of the order of 50–100 km. Similar networks may bedesigned for the Eastern Mediterranean and the Black Sea.
534 Roel Nicolai The Premedieval Origin of Portolan Charts

MSEportolan chart� MSEnavigation accuracy� MSEfeature exaggeration � MSEplane charting.
All elements in this equation are by definition greater than or equal to zero. Alternatively, theequation may be represented in the form shown in Table 2.
However, the geodetic network computation described at the beginning of this section isbased on error-free navigation measurements, without the addition of feature exaggeration.Only the MSEplane charting component was computed. This led to the results for the threegeodetic networks of the Western and Eastern Mediterranean and the Black Sea shown inTable 3.
First, the geodetic network calculation demonstrates that the distortion introduced byplane charting is far from negligible when compared to a Mercator or equirectangularreference chart. Indeed, the distortion introduced thereby is considerable; hence, at first sightthe conclusion to be drawn from Table 3 is straightforward: portolan charts cannot have beenconstructed by means of plane charting.
However, the straightforward addition of the three accuracy components is a simplifiedrendering of the true situation. Two of the three components are random variables, and onlythe contribution by plane charting, MSEplane charting, is a constant. The addition of the threecomponents is valid only for the expectations (expected values) of the random variables. Thetwo random variables are subject to some variability with regard to their expectation. There-fore, the question that needs to be answered is how likely it is that a fortuitous combination ofrandom measurement errors in the distances and bearings between the coastal points mightaccidentally generate a Mercator-like map image for all three areas analyzed. This problemneeds to be approached through statistics. Omitting the details, let me sum up the calculationby stating that the likelihood of the scenario described in the previous sentence is negligible.23
For the Western and Eastern Mediterranean it is impossible that a Mercator-like map imagewould result coincidentally from plane charting, while for the Black Sea it is not unlikely. Thepart of the earth’s surface that is covered by the Black Sea is small enough for the mapprojection to be coincidental, given the navigation accuracy assumed in the analysis.
However, it makes no sense to assume that the Black Sea was charted by means of planecharting while the Mediterranean was not. Hence, the conclusion must be that the Mercator
23 The random variables in the accuracy budget of a typical portolan chart can be reduced to a central F-distribution and anoncentral F-distribution. The statistical testing involves the calculation of the probability of a Type II error—i.e., theprobability that the chart was constructed by plane charting and that the shape of the charted coastline does not deviatesignificantly from the coastline on a Mercator chart.
Table 2. Components of the MSE chart accuracy in km2, based on a nominal chart with anexpected RMSE, or one-sigma accuracy of 11 km, assuming that the map projection iscoincidental
Western Mediterranean Eastern Mediterranean Black Sea
MSEnavigation accuracy 164 164 164MSEfeature exaggeration 32 32 32MSEplane charting 0 0 0MSEportolan chart 196 196 196
ISIS—Volume 106, Number 3, September 2015 535

map projection on portolan charts, revealed by cartometric analysis, cannot be a coincidentalby-product of the plane-charting method. The Mercator projection must therefore be anintentional aspect of the construction process of portolan charts—and that constructionprocess cannot be the plane-charting process. To be sure, the conclusion applies to the partialcharts from which the Mediterranean portolan chart was constructed as a mosaic. There is noknown alternative process that would coincidentally produce a Mercator (or other) mapprojection.
The results of the analysis I have presented must lead to rejection of the entire hypothesisof a medieval origin for portolan charts. On the basis of current knowledge of the state ofscience in the Middle Ages, it must be concluded that the construction of portolan charts wasbeyond the capabilities of medieval cartographers, mariners, and intellectual clerics. The roleof the medieval cartographer in the creation of the accurate Atlantic, Mediterranean, andBlack Sea coastlines appears to be limited to copying older partial charts, creating a mosaic,and exaggerating coastal features.
MERCATOR OR EQUIRECTANGULAR PROJECTION?To analyze five charts with the assumption that they are based on the Mercator projection andthen to conclude that they are indeed based on the Mercator projection might look like circularreasoning. However, several studies have already established that, with respect to portolan charts,a cylindrical map projection is the best-fitting type of map projection, as such a projection willrender the meridians as a lattice of straight, parallel lines. A conical map projection would resultin the meridians converging toward the north, which is not the case with portolan charts. Inaddition, the correspondence of the residuals of the piecewise fit to the Mercator projection of theDulcert chart (1339) with the normal or Gaussian error distribution suggests that the Mercatorprojection or a Mercator-like projection fits very well, as shown in Figure 3. Other types of mapprojection are less likely, as Loomer’s study demonstrated.24
Two types of cylindrical map projection are candidates for portolan charts—namely, theMercator projection and the equirectangular projection. The latter is also known as theequidistant cylindrical projection. On a Mercator chart the spacing between parallels atintervals of equal number of degrees increases logarithmically toward the poles. The Mercatorprojection is in principle true to scale only at the equator. The parallels and meridians thusspan a rectangular graticule. The higher the latitude, the more the rectangles are stretched ina north–south direction. On the other hand, the equirectangular projection generates a lattice
24 In particular, Loomer, “Cartometric Analysis of Portolan Charts” (cit. n. 4), p. 133, suggested that a cylindrical projectionbest fit the portolan charts; for his demonstrations that other types of projection are less likely see pp. 146, 154, 158.
Table 3. Expected accuracy of a typical portolan chart, taking into account the distortionintroduced by plane charting
Western Mediterranean Eastern Mediterranean Black Sea
MSEnavigation accuracy 164 164 164MSEfeature exaggeration 32 32 32MSEplane charting 165 323 58MSEportolan chart 361 521 254
536 Roel Nicolai The Premedieval Origin of Portolan Charts

of rectangles with a constant height-to-width ratio. Only two parallels are thus projected trueto scale, symmetric with respect to the equator, but all meridians are true to scale. This mapprojection was known in antiquity: it was used by Claudius Ptolemy’s predecessor Marinus ofTyre. Ptolemy states that Marinus proposed an equirectangular projection of which thetrue-to-scale parallel was the “parallel of Rhodes,” at approximately 36° N. This results in aspacing of the meridians that is 0.8 times the spacing of the parallels, as shown in Figure 11.
For an area with a limited latitude extent, such as the Mediterranean region, an equirect-angular projection may be designed that closely approximates the Mercator projection. Whena modern map using the equirectangular projection of—for example—the Western Mediter-ranean is placed on a light table and is overlaid with a modern map of the same scale and thesame area that uses the Mercator projection, the differences in the depicted coastlines will beclearly visible, because modern maps are exceedingly accurate. For a portolan chart, however,although it is very accurate in the context of its time, it is difficult if not impossible todistinguish the Mercator projection from the equirectangular. Almost equal MSE values willbe computed after the best-fitting process is applied to these two projections. For smaller areassuch as the Black Sea it is impossible to distinguish the two. Nevertheless, portolan chartsshare more characteristics with the Mercator projection than with the equirectangular pro-jection.
Once it is understood that it is difficult to distinguish the Mercator projection from theequirectangular projection, though, it is tempting to consider the equirectangular projectionmore likely than the Mercator projection as the underlying projection of portolan chartsbecause its graticule is simpler to construct. It was also known in antiquity and therefore doesnot constitute an apparent anachronism, while positing the Mercator projection as a basis forportolan charts does. Construction of the graticule (the lattice of meridians and parallels) ofthe equirectangular projection is indeed much more straightforward than construction of thegraticule of the Mercator projection, because the latter contains a logarithmic function.The equirectangular graticule may be constructed simply with a ruler and a pen. However,the advantage disappears when a chart is constructed from a set of surface geometricmeasurements—which, we have to assume, is how the first portolan chart was constructed. Inorder to draw a chart on the equirectangular projection, the cartographer would have to applylatitude-dependent corrections not only to distances but also to directions, so the latitude ofeach pair of points therefore needs to be measured as well. Moreover, these corrections are soimpractical that the relevant formulas cannot be found in modern geodesy textbooks. Bycontrast, all that needs to be done to produce the Mercator projection is divide all distances
Figure 11. Map of Europe on the Mercator projection (left) and on the equirectangularprojection (right) with true-to-scale parallel of 36° N latitude and a graticule of 10° latitude andlongitude intervals.
ISIS—Volume 106, Number 3, September 2015 537

by the cosine of the mean latitude of the two end points of the distance and leave anydirections uncorrected (except for magnetic declination, but that is not a map projectioncharacteristic). This also requires measurement of latitude, of course, but apart from that it isin principle a good deal easier to construct a Mercator chart from such surface measurementsthan an equirectangular chart. The alternative would be first to calculate latitude andlongitude of all points along the coastline from the surface measurements. Plotting those ina preconstructed equirectangular graticule would then be straightforward, but the complica-tion of that option lies in the calculation of the latitudes and longitudes for all points. To sumup: when the starting point of mapping is a set of geometric measurements (directions,distances, and bearings) between points along the Mediterranean coast, the Mercator projec-tion is the simpler projection from a construction perspective.
ADDITIONAL EVIDENCE AGAINST A MEDIEVAL ORIGINThe results from the previous sections are sufficient to reject a medieval origin for portolancharts unequivocally: even with a perfect set of measurements of bearings and distancescovering the Mediterranean it is impossible to generate a chart with the characteristics of aportolan chart by means of plane charting. Questions regarding the timely introduction of themagnetic compass and the quality of medieval navigation have therefore become irrelevant.Nevertheless, for the sake of thoroughness, it is worth looking at these factors.
It was stated earlier that there is no consensus as to the role of the magnetic compass amongresearchers who study portolan charts. Was its usage in the Mediterranean sufficientlywidespread by the time the first portolan charts appeared to permit the assumption that it mayhave played a role in their construction—that is, in the collection of the body of navigationdata that is presumed to have formed the empirical basis of portolan chart construction? Someresearchers believe it was; others do not; the majority simply ignore the timing issue.
The earliest reference to the compass in Europe dates from 1187, when Alexander Neckammentions its use on dark nights and during the day when the sky is overcast.25 He describesthis use not as a novelty, but as an established practice. The compass he describes is a so-called“floating compass,” a needle stuck crosswise through a piece of cork or straw, floating in abowl of water. The needle was magnetized by moving a piece of lodestone in circles above thebowl with the floating needle and then withdrawing it suddenly. This type of compass, usuallyreferred to in documents from that period as the “needle” (“acus”), was only a rough indicatorof north and would have been unsuitable for making quantitative measurements of a ship’sheading. The next stage in the development of the compass occurred when the needle wasplaced on a vertical pin, allowing it to rotate freely. To protect this delicate construction,needle and spindle were placed in a small wooden box, and thus it is that the compassacquired the name “buxola” or “bussola,” which literally means “small box.” This wordappears to refer to the compass as a single unit rather than a collection of separate features,as was the case with the floating compass. The first description of such a compass occurs in1269, when the Frenchman Pierre de Maricourt, also known as Petrus Peregrinus, mentionsit in a letter to a friend.26 Peregrinus also notes that the cardinal directions and even a degreescale may be marked on the rim of the wooden box containing the needle. Furthermore, he
25 Thomas Wright, ed., A Volume of Vocabularies (London, 1857), p. 114. The text included in this volume is AlexanderNeckam’s De Utensilibus, written between 1175 and 1183.26 Peter J. Smith, “Petrus Peregrinus’ Epistola: The Beginning of Experimental Studies of Magnetism in Europe,” Earth ScienceReviews, 1970, 6:A11–A18, esp. p. A13.
538 Roel Nicolai The Premedieval Origin of Portolan Charts

describes an alidade as part of the unit. In principle such an instrument would be suitable formaking sufficiently accurate measurements—for example, to coastal landmarks. The finalmedieval improvement to the compass was made when the compass card marked with acompass rose of thirty-two “winds” was fixed to the needle, such that the card would rotatefreely with the needle. Such a compass is called a “mariner’s compass,” and its great advantageis that it allows the ship’s heading to be read directly on the instrument. It is unclear when thisinnovation was made. The term “buxola” or “bussola” gradually replaced the term “needle”(“acus”), and this change is generally associated with the transition from the simple floatingcompass to the compass described by Peregrinus or the mariner’s compass. The key questionis when this transition took place. Peter Pelham collated references to the compass fromcontemporary literature and found that the term “buxola” (with spelling variants) begins toappear only in the middle of the fourteenth century. In a more recent study, Ramon Pujades,who investigated notarial records in the archives of Catalonia, Valencia, Majorca, Genoa,Sicily, and Venice, arrived at the same conclusion; he found that the first recorded use of theterm “bussola” in these documents occurs in 1349.27
Therefore it appears very unlikely that a compass of the sort described by Peregrinus or themariner’s compass was in widespread use aboard ships before the middle of the fourteenthcentury. That is far too late for the instrument to have played a role in the presumed collectionof a large body of navigation data across the whole Mediterranean, the Black Sea, and theAtlantic coast of Europe. Nevertheless, the possibility cannot be excluded that Peregrinus’sinvention was used aboard ships on a much more limited basis and perhaps in the establish-ment of the orientation of the first subchart, from which the mosaic would have beencompiled. The most likely candidate for that is the Western Mediterranean subchart, whichhas the most consistent orientation of all subcharts among the five portolan charts analyzed(see Figure 7).
The late availability of a suitable compass undermines the hypothesis that a large body ofnavigation data was collected from which a chart—any chart, not just one on the Mercatorprojection—could have been constructed. Without the availability of a suitable compass,no geodetic framework could have been measured from which the shape of the Medi-terranean and Black Sea coasts might have been constructed. In theory, one mightimagine a trilateration network—that is, a framework consisting of distances only betweencoastal points— but this would have to have been an extremely dense network, with manydistances measured over the open sea, as every key point along the Mediterranean coastwould have to be the corner point of one or more triangles. Triangles built up fromsuccessive series of three successive coastal points located nearly on a straight line wouldnot be acceptable. Therefore a trilateration network would depend on a large number of(long) cross-sea distance measurements in many directions, the measurement of whichwould have been hampered by the inability of medieval ships to sail in directions atsignificant angles to the Mediterranean’s prevailing northerly to northwesterly summerwinds. Furthermore, it is unlikely that sailors would have been able to sail a straightcourse without the help of a direction-indicating instrument.
Nonetheless, in order to ensure that my conclusions are independent of the abovearguments, I conducted my analysis of the compatibility of the Mercator map projection with
27 Peter T. Pelham, “The Portolan Charts: Their Construction and Use in the Light of Contemporary Techniques of MarineSurvey and Navigation” (M.A. thesis, Victoria Univ. Manchester, 1980), pp. 64–65; and Pujades, Les cartes portolanes (cit. n.3), p. 444.
ISIS—Volume 106, Number 3, September 2015 539

the assumption that the compass was in widespread use early enough to have contributed tothe hypothetical body of navigation data.
Another important question concerns the accuracy of medieval navigation—excludingvisual navigation from landmark to landmark, as that method is not quantitative. For navi-gating across stretches of open water, dead reckoning was the only option for quantitativenavigation. Until the invention of the English log in the sixteenth century, ship’s speed, thebasis for the calculation of distance, was estimated in subjective ways. From antiquity to theMiddle Ages, progress was measured in terms of “day’s sailing,” for which sometimes anominal equivalent in a unit of length existed. Ibn Jubayr, a twelfth-century Arab traveler,states that Arab sailors used the majra, a standard figure for a day’s sailing that they equatedto 100 Arab miles (about 190 km).28 More precise estimation methods are only known fromdescriptions in later centuries and have to be extrapolated back to the Middle Ages. Suchmethods assume that the ship’s speed was estimated and then multiplied by time elapsed toobtain the distance the ship had traveled over that interval. Navigators estimated the ship’sspeed either from experience—by looking at the bow wave of the ship, the froth created bythe ship, and the way the sails set as a result of the pressure of the wind—or by a slightly lesssubjective but still crude method that may be called a gunwale log. This assumes two markerson the ship’s railing or bulwark, one close to the bow and the other near the stern, separatedby a calibrated distance. The navigator would have an assistant throw a chip of wood into thewater at the bow marker and then estimate the time it took to sight the chip across the sternmarker by reciting a rhyme or ditty, pacing down the deck, counting his steps, or taking hispulse. Although not improbable, there is no evidence for the use of either method in thetwelfth and thirteenth centuries.
I developed a quantitative model that takes into account the main factors contributing tothe accuracy of the putative medieval dead-reckoning navigation method.29 This model is (onpurpose) highly optimistic, as it assumes that medieval sailors diligently estimated their ship’sprogress in this way at every four-hour watch interval. The model also assumes that errors werecanceled out to a large degree because successive independent interval estimates were madeover the course of a long journey. Furthermore, it assumes that the ship traveled along aperfectly straight (rhumb) line to the end point of its route. Even with the most optimisticassumptions, the resulting standard deviation is 17 percent of the entire distance. A figure oftwice the standard deviation, which corresponds to a confidence level of 95 percent, equals34 percent of the distance. That is quite inaccurate. The factor that is chiefly responsible forthis inaccuracy is the lack of an objective time standard. The intuitive assumption, mentionedat the beginning of this essay, that some form of accuracy improvement would have beenneeded is thus borne out by this simulation model.
The question of how accurate such measurements needed to be to create a portolan chartis actually irrelevant. As I have shown, with the medieval method of chart construction—planecharting—as the only viable option, the shape of the Mediterranean coastline on a portolanchart could never have emerged, regardless of the navigation accuracy. However, one mightbe interested to know what navigation accuracy would have been required, had the hypo-thetical medieval cartographer been able to correct the observations to obtain the Mercatorprojection. As it cannot be assumed that a medieval cartographer would even have known
28 Ibn Jubayr, The Travels of Ibn Jubayr, trans. Roland Broadhurst (New Delhi: Goodword, 2007), p. 26.29 Nicolai, Critical Review of the Hypothesis of a Medieval Origin for Portolan Charts (cit. n. 2), pp. 151–161, 439–449 (Section5.9 and Appendix III).
540 Roel Nicolai The Premedieval Origin of Portolan Charts

about these corrections, the question is purely hypothetical. Additionally, he would haveneeded the mean latitude along every distance measured, but Mediterranean navigation neverused latitude determination as a tool. If that had been used, portolan charts would not havebeen rotated with respect to true north by the anticlockwise angle of about 9 degrees, as wasmentioned at the beginning of this essay. However, had he known how to correct his distancesand had he known the mean latitude at which each distance had been measured, the accuracythat is demonstrated by portolan charts would have necessitated position determination ofcoastal features of about 9 to 10 km, whereas the accuracy model I developed leads to anestimated positional accuracy of coastal features of 60 km for the Western Mediterranean, 120km for the Eastern Mediterranean, and around 70 km for the Black Sea—in all cases basedon highly optimistic assumptions.30 Without some means of improving the accuracy ofdistance and bearing estimates, the construction of any chart having the accuracy demon-strated by portolan charts would have been impossible.
It is nowadays considered almost self-evident that the accuracy of a measurement may beimproved by taking a series of observations and then calculating the arithmetic mean.However, that process was not self-evident in the Middle Ages. According to the statisticianRobin L. Plackett, the astronomer Tycho Brahe was the first to use this concept, toward theend of the sixteenth century; it took another century before the fact that calculation of themean gave a more precise value than a single measurement was understood in wider scientificcircles. Steven M. Stigler is even more cautious, stating that “by the middle of the eighteenthcentury at least one statistical technique was in frequent use in astronomy and navigation: thetaking of a simple arithmetic mean among a small collection of measurements made underessentially the same conditions and usually by the same observer.”31 An understanding of thistechnique in medieval times cannot therefore be assumed. Although many researchers haveassumed that the calculation of the arithmetic mean from a series of single measurementswould be a plausible way in which the accuracy of bearing and distance estimates could havebeen improved, this is a clear example of presentist thinking: it may be obvious in thetwenty-first century, but it certainly was not in the thirteenth. Assumptions that a more“intuitive” central value might have been determined, without actually calculating the mean,also have to be rejected. In that period any such advanced treatment of a series of singlemeasurements is equally unlikely: the basic understanding of the concept of “random error”simply did not exist in the Middle Ages. An alternative hypothetical schema, pushing thisprocess of accuracy improvement entirely into a graphic reconciliation method, would havebeen considerably more difficult. This technique became an option only in modern geodesy.
CONCLUSIONS
1. Portolan charts are confirmed to be mosaics of subcharts, each of which is quitesophisticated, having a mean point accuracy of approximately 10–12 km. Theconclusion that they are mosaics of partial charts is not new; confirmation of thehigh accuracy of the subcharts is. Also new is the conclusion that the mosaic wasprobably constructed by a process of fitting together overlapping sections ofcoastline visible on the partial charts.
30 Ibid., pp. 374–380 (Section 9.8: “Network Adjustment #1—Accuracy”).31 Robin L. Plackett, “Studies in the History of Probability and Statistics, VII: The Principle of the Arithmetic Mean,”Biometrica, 1958, 45:130–135, esp. pp. 131, 132: and Steven M. Stigler, The History of Statistics: The Measurement ofUncertainty before 1900 (Cambridge, Mass.: Harvard Univ. Press, Belknap, 1998), p. 16.
ISIS—Volume 106, Number 3, September 2015 541
2. The shape of the Mediterranean coastline as rendered on a portolan chart isdifferent from the shape of the coastline constructed from plane charting to astatistically significant degree. The charts therefore cannot have been constructedusing the plane-charting method.
3. The partial charts are based on a map projection. As this map projection cannotbe a coincidental by-product of a presumed plane-charting technique (seeconclusion 2), it can only have been applied intentionally as part of theconstruction process. This map projection is most likely the Mercator projection,but an alternative is the equirectangular projection, which in the limited latituderange of the Mediterranean can hardly be distinguished from the Mercatorprojection.
4. The magnetic compass, in a form that would have allowed it to be used as a toolin the position determination of coastal points, appears to have come intowidespread use only during the first half of the fourteenth century. It thereforecould not have played a role in the construction of these charts, but it may havebeen used in the establishment of the main orientation of portolan charts.
5. The navigation accuracy with conjectured medieval methods is too poor for suchdata to have been the basis of the construction of any map as accurate as portolancharts. This is true even when highly optimistic assumptions are made about thenavigation process and environmental conditions.
6. Methods to improve the accuracy of single navigation data estimates by averagingcannot be posited as an argument to explain the accuracy of portolan charts. Theawareness that estimates of a bearing or distance between two points may beimproved by calculating the arithmetic mean of a series of single measurementsentered scientific practice only in the course of the seventeenth century.
7. The main conclusion is that portolan charts are not the primitive, projectionlesscharts that they have been believed to be. It seems reasonable to assume thatmosaics of partial charts were created during the Middle Ages, but theconstruction of the partial charts themselves was well beyond the capabilities ofmedieval cartographers. These partial charts must date from a period before theMiddle Ages.
WHERE DID PORTOLAN CHARTS COME FROM?If portolan charts are not an original creation of medieval Italian mariner-cartographers, wheredid they come from—or, rather, where did the original partial charts come from? The chartsthemselves do not provide any clue to a possible answer, nor does contemporary documen-tation. What follows therefore cannot be anything but an educated guess.
The most likely scenario explaining their appearance in medieval Italy seems to be thatItalian merchants acquired the source charts through their trade with Byzantium. TheByzantine Empire itself is an unlikely origin point for these charts. In view of their sophisti-cation and accuracy, as demonstrated above, construction of the original source chartsrequires a civilization with sufficient mathematical, geodetic, and cartographic expertise andalso a high level of instrument making. To the best of our knowledge, Byzantine culture didnot even come close to satisfying these requirements. Even so, the role of Byzantium inpreserving the legacy of antiquity is undisputed. Byzantine mariners may even have used thesecharts themselves, although it is doubtful that charts of high accuracy would have beennecessary for trading journeys inside their own empire.
Italians may have seen greater potential for the use of these charts. There is even an
542 Roel Nicolai The Premedieval Origin of Portolan Charts

indirect indication that they may have been used during the Crusades and therefore may haveexisted as early as the twelfth century. John H. Pryor has pointed out that a step change incrusading logistics occurred in the twelfth century.32 While troops and horses for the FirstCrusade traveled overland to Palestine, maritime transport (including night sailing) developedduring the twelfth century, so that for the Second and Third Crusades large numbers ofsoldiers, knights, and horses were transported to the Holy Land by ship. Since no significantdevelopments took place in shipbuilding during that period, a new development in navigationmay have a certain prima vista plausibility.
What then about an origin for the source charts in Greek antiquity? If the standardhypothesis of a medieval origin required evidence, then so would any new hypothesis that thesource charts may have been constructed in antiquity. As has been argued above, theconstruction of charts covering such a large area constitutes a huge, complex, and advancedgeodetic-cartographic task. At this point there is simply no evidence that the Greeks (or anyother ancient civilization) would have possessed the required knowledge and instruments—or, for that matter, that they would have had any reason to perform such a task. Successfulproof that portolan charts are Greek in origin would overturn our current ideas about ancientGreek knowledge and skills, while the absence of such proof leaves us with a highlyunsatisfactory mystery—one that can be resolved only through empirical evidence that is asyet missing completely. Our current ideas about Greek knowledge cannot be regarded as fullysettled, however. The discovery of the mysterious Antikythera mechanism, which contains acomplicated system of gears constituting what may be an early analogue astronomicalcomputer, has demonstrated that sufficiently.33 The research that has been carried out on thismechanism so far may provide a stimulus to look even more critically at our established ideasabout Greek science. But whether such a critical look will help us resolve the enigma of theportolan charts must remain anybody’s guess, my own included.
32 John H. Pryor, “A Medieval Maritime Revolution: The Logistics of Crusading by Sea, 1097–1204,” paper presented atCollege Station, Texas, in 2007 (made available by the author).33 Jo Marchant, Decoding the Heavens: Solving the Mystery of the World’s First Computer (London: Windmill, 2009).
ISIS—Volume 106, Number 3, September 2015 543


