Embed Size (px)
Citation preview
THE VERMONT DIFFERENCE: DIRECT DEMOCRACY TO THE IMPACT OF PROGRESSIVE POLITICS
by Colleen R. Jackson
A thesis submitted to Johns Hopkins University in conformity with the requirements for the degree of the Master of Arts in Government
Baltimore, Maryland May, 2021
© 2021 Colleen R. Jackson All Rights Reserved
ii
ABSTRACT
The Vermont political environment is home to three, frequently lauded, unique attributes
that separates it from other states. This thesis investigates why and how Vermont sees such a
prevalence in split ticket voting, how the most successful third party in the country, the Vermont
Progressive Party, has been able to establish and maintain success in Vermont for the last forty
years, and investigates of the current state, successes, failures, and future of direct democracy in
Vermont’s town meetings. The thesis then asks whether each of these elements is replicable
outside of the Vermont political environment and what the implications are for expansion of
these attributes to other states and nationwide. The research uses a range of methodologies: an
IVR survey and in-depth follow up interviews for split ticket voters, in-depth interviews of
members of the Vermont Progressive Party, and an online survey of Vermont town clerks. This
thesis finds that split ticket voters in Vermont point to a number of reasons for splitting their
ticket, most prominently, however, it is due to the close connection that Vermonters feel to their
political representatives which can transcend party label. The Progressive Party’s success is
largely due to Bernie Sanders’ proof of concept when he became mayor of Burlington, VT, in
addition to community-building organization techniques, and a legislative environment that does
not overly hinder third party candidates and parties. Direct democracy in the form of open and
hybrid town meeting in Vermont provides benefits in the form of negotiation, issue-education,
and community building. However, lower participation rates and recent events that are pulling
towns away from direct democracy indicate an uncertain future for town meeting direct
democracy. The research finds that these three aspects of Vermont’s political environment are
more complicated and less than the ideal that many academics, pundits, and activists argue for.
However, they also present significant positives and it is clear that certain political environments
iii
could lead to expanding split ticket voting and the presence of successful third parties and
ultimately potentially less contentious and more representative democracy to states outside of
Vermont and the nation.
This Master’s thesis was completed under the direction of Dr. Dorothea Wolfson, Dr.
Straus and Dr. Hill. It was read by Lee Drutman and Al From.
iv
PREFACE
I was born in California and have lived in five different U.S. states and three different
countries. After moving to Vermont in 2018, I started to learn about and personally experience
many of the unique attributes that I investigate in this thesis. I met and talked with split ticket
voters, town clerks, and members of the Progressive Party. I bought chickens from our then-
Lieutenant Governor. I participated in town meeting day. In choosing what to study for my
thesis, I wanted to highlight these fascinating, and often overlooked, aspects of Vermont politics.
In so doing, I hope to expand our understanding, not only of Vermont, but of possibilities for the
future of our national political system. I hope that my research will be read and considered by
both academics and individuals, particularly Vermonters, interested in the fascinating intricacies
and possibilities of Vermont’s political environment.
I would like to thank my family for their encouragement and help throughout this
process. I particularly want to thank my husband, Shannon Jackson, for his encouragement and
steadfast support, and my mother, Kathleen Ragan, for the hours of guidance and proof-reading.
Thank you also, to: Bill McInturff, Charles Lineweaver, Molly O’Brien, Deirdre Lineweaver,
Michelle Jackson, Brad Jackson, Hillary Jackson, and Zachary Benuck. I would not have been
able to do this without you.
Finally, thank you to Johns Hopkins University, my advisor and the professors who
helped me write this thesis. Dr. Dorothea Wolfson, thank you for being an unfailing advocate for
me during this process. Thank you, also to Dr. Jacob Straus and Dr. Kathryn Wagner Hill for
your help, encouragement, and guidance.
Colleen R. Jackson, Burlington Vermont, 5.12.21
v
TABLE OF CONTENTS
Abstract……………………………………………………………………………………………ii
Preface……………………………………………………………………………………………iv
Table of Contents………………………………………………………………………………….v
List of Tables……………………………………………………………………………………..vii
List of Figures ……………………………………………………………………………………ix
Thesis Introduction……………………….………………………………………………………1
Chapter 1: An Investigation of the Theory in Practice: Split-Ticket Voting in Vermont’s 2018
Elections………………………………………………………………………………………….12
Chapter 1: Introduction…………………………………………………………………..12
Chapter 1: Literature Review ……………………………………………………………15
Chapter 1: Methodology………………………………………………………………….24
Chapter 1: Results………………………………………………………………………..28
Chapter 1: Discussion ……………………………………………………………………47
Chapter 1: Conclusion……………………………………………………………………52
Chapter 2: The Reality of Multiparty Politics in America: The Vermont Progressive Party and its
forty-years of success…………………………………………………………………………….54
Chapter 2: Introduction…………………………………………………………………..54
Chapter 2: Literature Review…………………………………………………………….55
Chapter 2: Methodology………………………………………………………………….63
Chapter 2: Results………………………………………………………………………..64
Chapter 2: Discussion ……………………………………………………………………85
Chapter 2: Conclusion……………………………………………………………………90
vi
Chapter 3: The Future of Direct Democracy and Town Meetings in Vermont…………………...93
Chapter 3: Introduction…………………………………………………………………..93
Chapter 3: Literature Review.……………………………………………………………95
Chapter 3: Methodology………………………………………………………………...106
Chapter 3: Results………………………………………………………………………108
Chapter 3: Discussion …………………………………………………………………..146
Chapter 3: Conclusion…………………………………………………………………..152
Thesis Conclusion……………………………………………………………………................154
Appendix A: Vermont Split-Ticket Voter/Democratic Defector Survey Toplines……………...164
Appendix B: Precinct Calculations for Split Ticket Voters……………………………………..187
Appendix C: Progressive Activists and In-Depth Interview Questions…………………………204
Appendix D: Public Opinion Survey Findings on Progressives…………………………………207
Appendix E: Town Clerks Survey Topline……………………………………………………...216
Bibliography……………………………………………………………………………………240
Curriculum Vita………………………………………………………………………………...251
vii
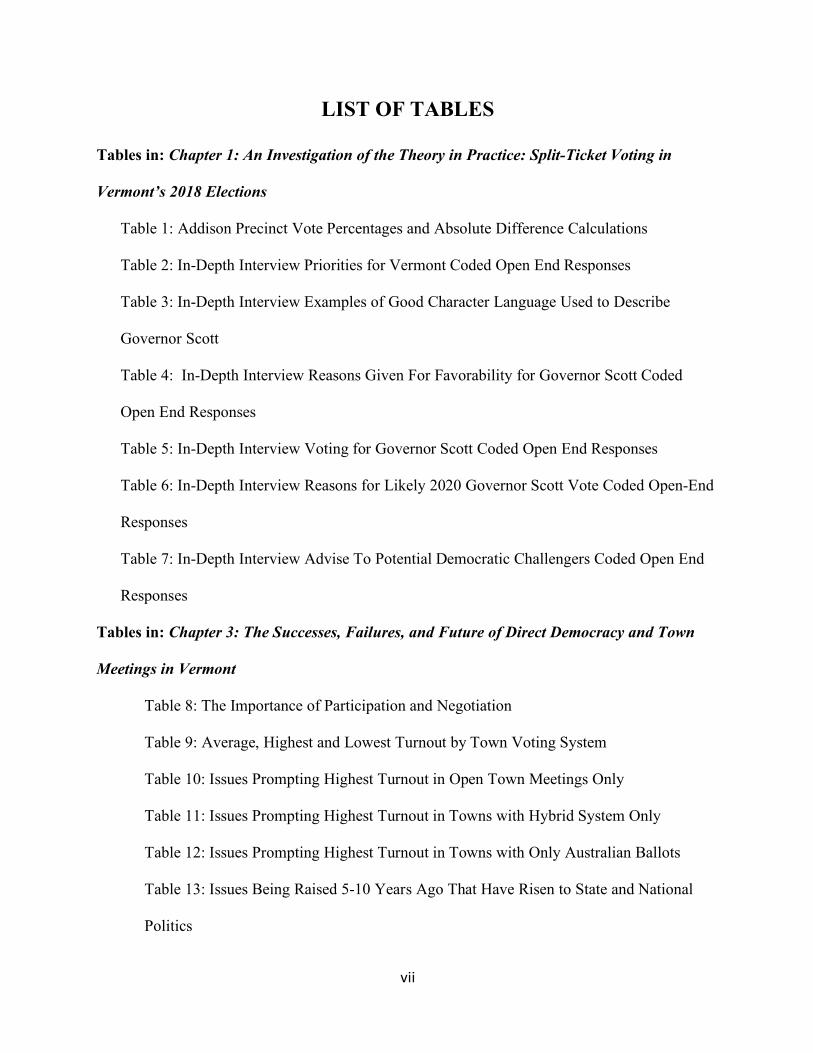
LIST OF TABLES
Tables in: Chapter 1: An Investigation of the Theory in Practice: Split-Ticket Voting in
Vermont’s 2018 Elections
Table 1: Addison Precinct Vote Percentages and Absolute Difference Calculations
Table 2: In-Depth Interview Priorities for Vermont Coded Open End Responses
Table 3: In-Depth Interview Examples of Good Character Language Used to Describe
Governor Scott
Table 4: In-Depth Interview Reasons Given For Favorability for Governor Scott Coded
Open End Responses
Table 5: In-Depth Interview Voting for Governor Scott Coded Open End Responses
Table 6: In-Depth Interview Reasons for Likely 2020 Governor Scott Vote Coded Open-End
Responses
Table 7: In-Depth Interview Advise To Potential Democratic Challengers Coded Open End
Responses
Tables in: Chapter 3: The Successes, Failures, and Future of Direct Democracy and Town
Meetings in Vermont
Table 8: The Importance of Participation and Negotiation
Table 9: Average, Highest and Lowest Turnout by Town Voting System
Table 10: Issues Prompting Highest Turnout in Open Town Meetings Only
Table 11: Issues Prompting Highest Turnout in Towns with Hybrid System Only
Table 12: Issues Prompting Highest Turnout in Towns with Only Australian Ballots
Table 13: Issues Being Raised 5-10 Years Ago That Have Risen to State and National
Politics
viii
Table 14: Issues Clerks Believe May Rise to State and National Politics in the Future
Table 15: Maximum Number of Registered Ballots Before Australian Ballots Are Needed
by Town Meeting Voting System
Table 16: Maximum Number of Registered Ballots Before Australian Ballots Are Needed
by Clerk Experience
Table 17: Greatest Strengths of Open Town Meetings by Town Voting System
Table 18: Greatest Strengths of Open Town Meetings by Clerk Experience
Table 19: Weaknesses of Open Town Meetings by Town Meeting Voting System
Table 20: Weaknesses of Open Town Meetings by Clerk Experience
Table 21: Strengths of the Australian Ballot by Town Voting System
Table 22: Strengths of the Australian Ballot by Clerk Experience
Table 23: Weaknesses of the Australian Ballot by Town Voting System
Table 24: Weaknesses of the Australian Ballot by Town Voting System
Table 25: Ways in Which Policy Formation Would Be Better or Worse if Open Town
Meetings Were Eliminated by Town Meeting Voting System
Table 26: Ways in Which Policy Formation Would Be Better or Worse if Open Town
Meetings Were Eliminated by Clerk Experience
Table 27: Ability to Address Aspects of Town Meetings by Town Meeting Voting
System
Table 28: Ability to Address Specific Aspects of Town Meetings by Clerk Experience
Tables in: Appendix E: Public Opinion Survey Findings on Progressives
Table 29: Issue importance by Party Identification
Table 30: Favorability Towards The Three Parties
ix
LIST OF FIGURES
Figures in: Introduction
Figure 1: Divided State Governments Over Time
Figure 2: Party Breakdown - Vermont House, Vermont Senate, and Burlington City
Council
Figures in: Chapter 1: An Investigation of the Theory in Practice: Split-Ticket Voting in
Vermont’s 2018 Elections
Figure 3: Divided State Governments Over Time
Figure 4: Comparative Midpoints Model
Figure 5: IVR Survey on Direction of Vermont
Figure 6: IVR Survey Favorability Towards Key Political Figures in Vermont
Figure 7: In-Depth Interview Split Ticket Voter 2018 Vote
Figure 8: In-Depth Interviews Total Support for Vermont Legislative Issues
Figures in: Chapter 2: The Reality of Multiparty Politics in America: The Vermont
Progressive Party and it's forty-years of success
Figure 9: Reasons for Progressive Party Success by Number of Interviewees Who
Mention the Issue
Figures in: Chapter 3: The Successes, Failures, and Future of Direct Democracy and Town
Meetings in Vermont
Figure 10: Map of Survey Responses by Town
Figure 11: Clerks’ Years as a Voter in Town Meetings
Figure 12: Orderliness of Open Town Meetings by System
Figure 13: Frequency of Policy Amendment in Open Town Meetings
x
Figure 14: Change in Town Meeting Participation Rates Compared to 3-5 Years Ago
Figure 15: Change in Town Meeting Participation Rates By Town Meeting Voting
System
Figure 16: Too Many Participants and Government Effectiveness
Figure 17: Too Many Participants and Government Effectiveness by Clerk Experience
Figure 18: Too Few Participants and Government Effectiveness
Figure 19: Too Few Participants and Government Effectiveness by Clerk Experience
Figure 20: The Decision-Making Process in Open Town Meetings by Town Voting
System
Figure 21: Open Town Meetings and the Effect on Community Relationships by Town
Voting System
Figure 22: Open Town Meetings and the Effect on Community Relationships by Clerk
Experience
Figure 23: Better or Worse Policy Formation by Town Meeting Voting System
Figure 24: Better or Worse Policy Formation by Clerk Experience
Figure 25: Ability to Address Specific Aspects of Town Meetings
Figures in: Appendix E: Public Opinion Survey Findings on Progressives
Figure 26: Preferred Majority Party in Vermont
Figure 27: Vermont Voters' Party Identification
Figure 28: Party Identification vs. "Closer To" Ideological Preference
Figure 29: Party Identification Comparison between VDP and Zuckerman for VT
Surveys
1
THESIS INTRODUCTION
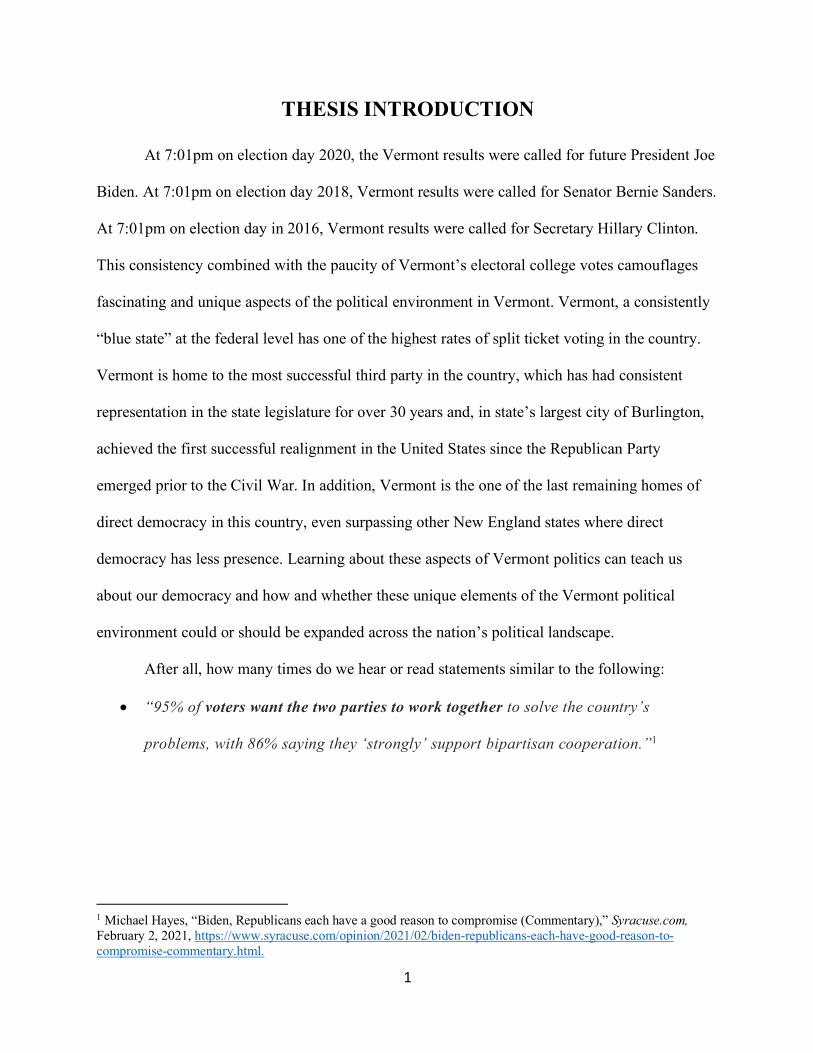
At 7:01pm on election day 2020, the Vermont results were called for future President Joe
Biden. At 7:01pm on election day 2018, Vermont results were called for Senator Bernie Sanders.
At 7:01pm on election day in 2016, Vermont results were called for Secretary Hillary Clinton.
This consistency combined with the paucity of Vermont’s electoral college votes camouflages
fascinating and unique aspects of the political environment in Vermont. Vermont, a consistently
“blue state” at the federal level has one of the highest rates of split ticket voting in the country.
Vermont is home to the most successful third party in the country, which has had consistent
representation in the state legislature for over 30 years and, in state’s largest city of Burlington,
achieved the first successful realignment in the United States since the Republican Party
emerged prior to the Civil War. In addition, Vermont is the one of the last remaining homes of
direct democracy in this country, even surpassing other New England states where direct
democracy has less presence. Learning about these aspects of Vermont politics can teach us
about our democracy and how and whether these unique elements of the Vermont political
environment could or should be expanded across the nation’s political landscape.
After all, how many times do we hear or read statements similar to the following:
• “95% of voters want the two parties to work together to solve the country’s
problems, with 86% saying they ‘strongly’ support bipartisan cooperation.”1
1 Michael Hayes, “Biden, Republicans each have a good reason to compromise (Commentary),” Syracuse.com, February 2, 2021, https://www.syracuse.com/opinion/2021/02/biden-republicans-each-have-good-reason-to-compromise-commentary.html.
2
• “Nearly two-thirds of Americans say the U.S. needs a third major political party
because the GOP and Democratic Party ‘do such a poor job representing the American
people,’”2
• “Americans don’t feel Congress represents them very well… only 25 percent of
respondents felt people like them were even somewhat well represented in Congress, with
60 percent saying they were not well represented.”3
This thesis investigates these three aspects of Vermont’s, and the nation’s, politics and
strives to use this research to determine how these unique elements have occurred in Vermont,
whether they meet the expectations of those who vocally call for similar changes across the
country, how they could potentially be replicated, and the implications of expanding these
aspects to other states and across the country.
Split Ticket Voting in Vermont
The first chapter in this thesis investigates split ticket voting in Vermont’s 2018 election.4
In 2018, prominent news agencies declared the election a “blue wave” for Democrats.5
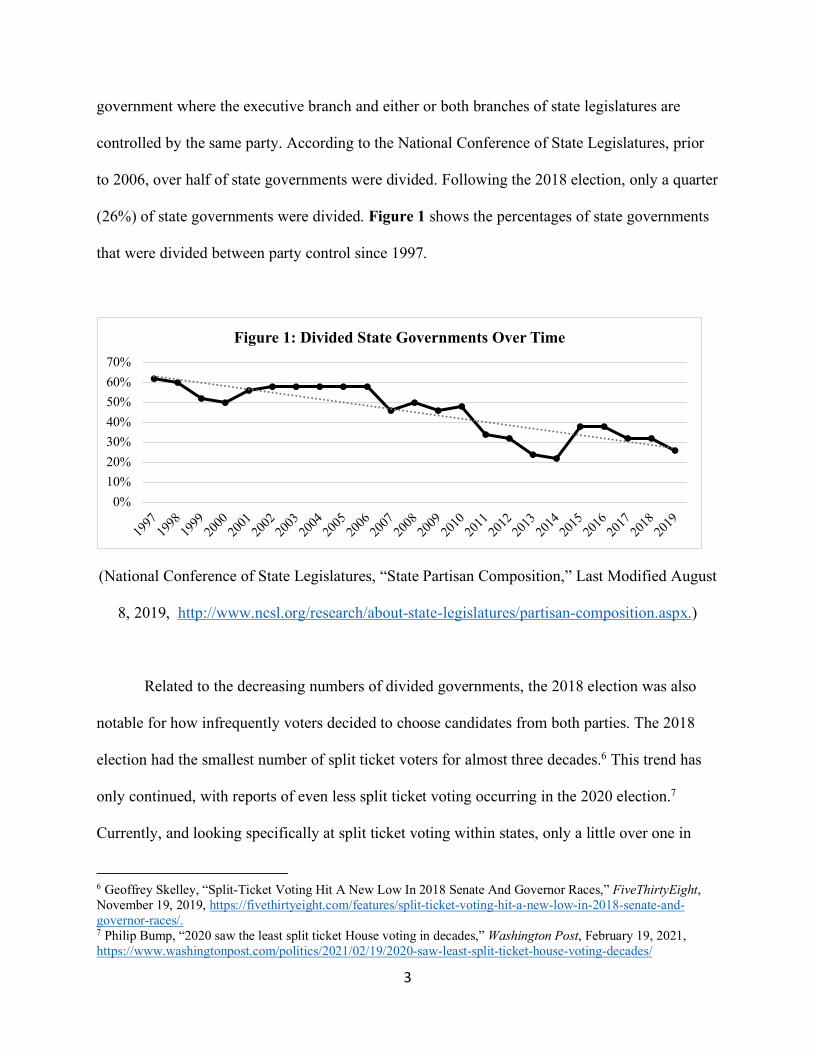
Nationally, this election continued a long-term trend towards fewer divided state governments: a
2 John Bowden, “62 percent say third political party is needed in US,” The Hill, February 15, 2021, https://thehill.com/blogs/blog-briefing-room/news/538889-62-percent-say-third-political-party-is-needed-in-us?fbclid=IwAR2R40EU3pHgMw8CBOysr6HbZOzqTSdrugkw7pge6IIIBZCD8meobucXmzg. 3 Mark Mellman, “Mellman: How well does Congress represent America,” The Hill, April 23, 2019, https://thehill.com/opinion/campaign/440326-mellman-how-well-does-congress-represent-america. 4 There are multiple ways of defining split ticket voting. In many instances, it references voting for a presidential candidate from one party and a member of the House or Senate that represents another party. This chapter defines split ticket voting as any defection from a party-line vote from president (although 2018 was not a presidential election) to votes for state Representatives and Senators. 5 Harry Eten, “Latest House results confirm 2018 wasn't a blue wave. It was a blue tsunami,” CNN, December 6, 2018, https://www.cnn.com/2018/12/06/politics/latest-house-vote-blue-wave/index.html.; Matthew Yglesias, “Democrats’ blue wave was much larger than early takes suggested,” Vox, November 13, 2018, https://www.vox.com/policy-and-politics/2018/11/13/18082490/blue-wave.; and Sabrina Siddiqui, “The Democratic blue wave was real,” The Guardian, November 17, 2018, https://www.theguardian.com/us-news/2018/nov/16/the-democratic-blue-wave-was-real.
3
government where the executive branch and either or both branches of state legislatures are
controlled by the same party. According to the National Conference of State Legislatures, prior
to 2006, over half of state governments were divided. Following the 2018 election, only a quarter
(26%) of state governments were divided. Figure 1 shows the percentages of state governments
that were divided between party control since 1997.
(National Conference of State Legislatures, “State Partisan Composition,” Last Modified August
8, 2019, http://www.ncsl.org/research/about-state-legislatures/partisan-composition.aspx.)
Related to the decreasing numbers of divided governments, the 2018 election was also
notable for how infrequently voters decided to choose candidates from both parties. The 2018
election had the smallest number of split ticket voters for almost three decades.6 This trend has
only continued, with reports of even less split ticket voting occurring in the 2020 election.7
Currently, and looking specifically at split ticket voting within states, only a little over one in
6 Geoffrey Skelley, “Split-Ticket Voting Hit A New Low In 2018 Senate And Governor Races,” FiveThirtyEight, November 19, 2019, https://fivethirtyeight.com/features/split-ticket-voting-hit-a-new-low-in-2018-senate-and-governor-races/. 7 Philip Bump, “2020 saw the least split ticket House voting in decades,” Washington Post, February 19, 2021, https://www.washingtonpost.com/politics/2021/02/19/2020-saw-least-split-ticket-house-voting-decades/
0%10%20%30%40%50%60%70%
1997
1998
1999
2000
2001
2002
2003
2004
2005
2006
2007
2008
2009
2010
2011
2012
2013
2014
2015
2016
2017
2018
2019
Figure 1: Divided State Governments Over Time
4
five Americans live in a state with a divided government.8 Vermont is one of only three states
with a Republican governor and a Democratic legislature.9.
In Vermont in 2018, left-leaning politicians continued their winning streak: democratic
socialist and Independent Senator Bernie Sanders was elected along with Democratic Senator
Peter Welch and Progressive Democrat Lt. Governor David Zuckerman. In addition, Vermont
voters elected a veto-proof Democratic and Progressive majority to the state legislature.10
However, in addition to these resounding liberal and Democratic victories, Vermont voters also
re-elected Republican Governor Phil Scott.11 This occurred because of substantial split-ticket
voting across Vermont.
It is also important to note that since 2018, split ticket voting at the federal level has
continued to decrease while split ticket voting in Vermont has increased. In his analysis of the
2020 election, Geoffrey Skelley of FiveThirtyEight found, “Just 16 out of 435 districts backed a
presidential nominee from one party and a House candidate from the other party…That translates
to just 4 percent of districts ‘splitting’ their tickets in 2020, the smallest share in the past 70
8 Ballotpedia, “State government trifectas,” accessed May 3, 2021 https://ballotpedia.org/State_government_trifectas. 9 Ibid. The two other states with Republican governors and Democratic legislatures are Maryland and Massachusetts. In addition, there are eleven states total with divided states governments: Kansas, Kentucky, Louisiana, Maryland, Massachusetts, Michigan, Minnesota, North Carolina, Pennsylvania, Vermont, and Wisconsin. 10 Office of the Vermont Secretary of State, “Official Report of the Canvassing Committee United States and Vermont Statewide Offices: General Election, November 6 2018,” accessed October 24, 2018, https://sos.vermont.gov/media/awufmkui/2018generalofficialresults.pdf; Ballotpedia, “Veto-proof state legislatures and opposing party governors in the 2018 elections,” accessed October 18, 2019, https://ballotpedia.org/Veto-proof_state_legislatures_and_opposing_party_governors_in_the_2018_elections. 11 Vermont Secretary of State, “Official Report of the Canvassing Committee United States and Vermont Statewide Offices: General Election, November 6, 2018.”
5
years.”12 Meanwhile, in the 2020 election in Vermont, Governor Phil Scott received over 10
points more than in his 2018 victory: receiving 55% of the vote in 2018 and 69% in 2020.13
The first chapter in this thesis investigates the reasons behind Vermont’s divided
government and split ticket voting. The research conducted includes both qualitative and
quantitative research: an IVR survey to identify split ticket voters in Vermont, followed by 78
interviews conducted by this researcher with split ticket voters.
The chapter finds and discusses the correlation between the split-ticket voting patterns
observed in 2018 in Vermont against the literature’s prominent theories to determine the
motivating factors in split-ticket voting in the 2018 election and the possible motivations for
upcoming races including the 2020 Vermont gubernatorial race. The research answers what is
driving this split-ticket voting? It provides key insight into what may increase split-ticket voting
not only in Vermont, but across the country.
The Vermont Progressive Party
In addition to disproportionate numbers of split ticket voting, Vermont is currently home
to the most successful third party in the country: The Vermont Progressive Party.
The existence of a consistently electorally successful third party in the United States is
extremely rare. While a number of independents have succeeded at reaching political office
across the country, sustained success across multiple candidates who identify as part of the same
party is an extreme anomaly. For decades, scholars have pointed to various election laws and
12 Geoffrey Skelley, “Why Only 16 Districts Voted for A Republican And A Democrat in 2020,” FiveThirtyEight, February 24, 2021, https://fivethirtyeight.com/features/why-only-16-districts-voted-for-a-republican-and-a-democrat-in-2020/. 13 NBC News, “Vermont Governor Election Results,” last modified December 27, 2021, https://www.nbcnews.com/politics/2020-elections/vermont-governor-results.
6
rules that have encouraged and ensured the two-party system. This stands in stark contrast to the
majority of other democracies around the world with multiparty political systems. The
Progressive Party, however, has been able to overcome many of the hurdles placed on third
parties in the United States.
The beginning of the Progressive Party dates back to Senator Sanders 1981 victory in the
Burlington mayor’s race. His victory, and the group of individuals who helped him lead the
largest city in Vermont, led to the creation of the Progressive Coalition, and then the remarkable
success of the Vermont Progressive Party. On its website, the Progressive Party proudly states,
“For nearly 40 years, an unbroken stream of Progressives have served on the Burlington City
Council and Vermont Legislature. These range from Progressive-endorsed independents, like
Senator Bernie Sanders, to fusion candidates endorsed by the Progressive Party and Democratic
Party.”14 In the last 40 years, Progressives have consistently been represented in the state
legislature, have elected the highest ranked third party official in the country, Former Lieutenant
Governor David Zuckerman, and have become one of the two major parties in the city of
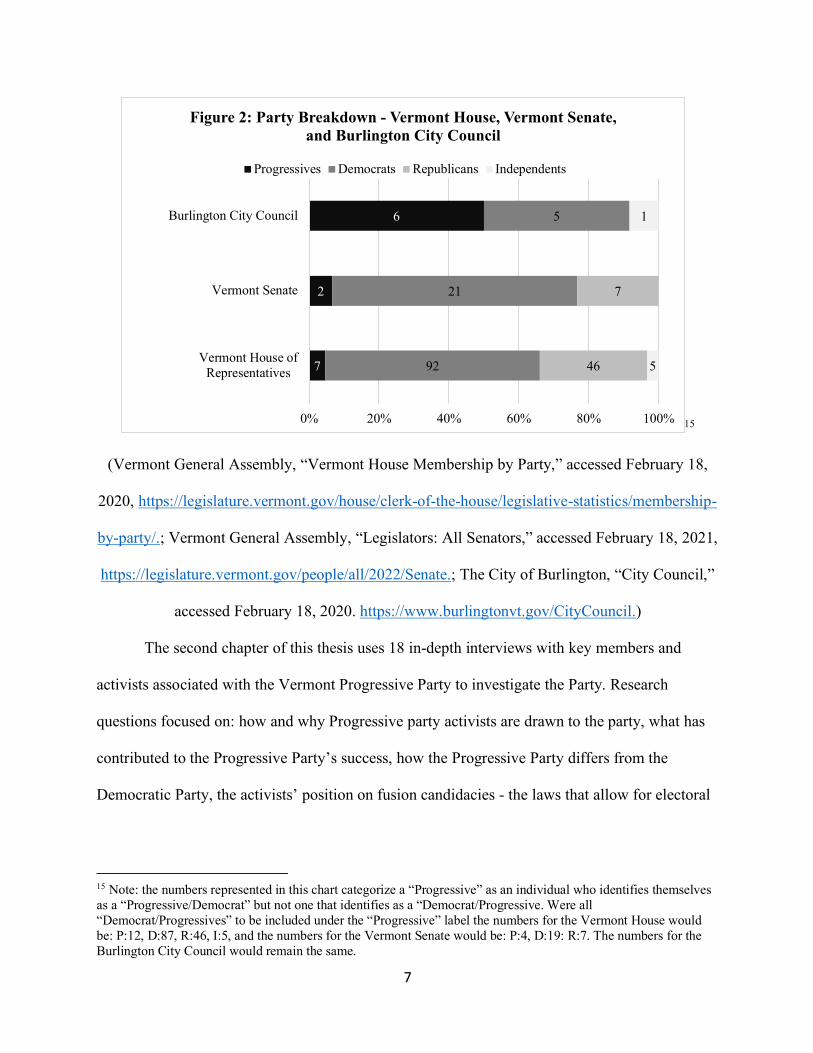
Burlington. Figure 2 below shows the 2021-2022 party breakdown for the Burlington City
Council, Vermont Senate and Vermont House of Representatives, demonstrating Progressives’
presence in these three bodies.
14 The Vermont Progressive Party, “Elected Progressives,” accessed February 18, 2021, https://www.progressiveparty.org/elected-progressives.
7
15
(Vermont General Assembly, “Vermont House Membership by Party,” accessed February 18,
2020, https://legislature.vermont.gov/house/clerk-of-the-house/legislative-statistics/membership-
by-party/.; Vermont General Assembly, “Legislators: All Senators,” accessed February 18, 2021,
https://legislature.vermont.gov/people/all/2022/Senate.; The City of Burlington, “City Council,”
accessed February 18, 2020. https://www.burlingtonvt.gov/CityCouncil.)
The second chapter of this thesis uses 18 in-depth interviews with key members and
activists associated with the Vermont Progressive Party to investigate the Party. Research
questions focused on: how and why Progressive party activists are drawn to the party, what has
contributed to the Progressive Party’s success, how the Progressive Party differs from the
Democratic Party, the activists’ position on fusion candidacies - the laws that allow for electoral
15 Note: the numbers represented in this chart categorize a “Progressive” as an individual who identifies themselves as a “Progressive/Democrat” but not one that identifies as a “Democrat/Progressive. Were all “Democrat/Progressives” to be included under the “Progressive” label the numbers for the Vermont House would be: P:12, D:87, R:46, I:5, and the numbers for the Vermont Senate would be: P:4, D:19: R:7. The numbers for the Burlington City Council would remain the same.
7
2
6
92
21
5
46
7
5
1
0% 20% 40% 60% 80% 100%
Vermont House ofRepresentatives
Vermont Senate
Burlington City Council
Figure 2: Party Breakdown - Vermont House, Vermont Senate, and Burlington City Council
Progressives Democrats Republicans Independents
8
success at the state level but also inherently tie Progressive officials to the Democratic Party -
and the future of the Progressive Party.
An investigation into the Vermont Progressive Party is a unique opportunity to determine
how third parties can be successful and compare these findings to the many scholarly works that
have laid out the hurdles to success and how laws could be changed or circumvented by third
parties to achieve success. The research also allows for an investigation of how a third party has
been able continue to succeed in a two-party environment – an environment that scholars see as
hostile to third parties.
This chapter allows us learn more about third parties in our political party system and
what would and could be the case around the country if more political party options were able to
be presented to voters and non-voters as viable options on their ballots. For members of third
parties across the country, the Vermont Progressive Party can also present some clear guidance,
not only on how to overcome barriers to gain electoral success, but also to maintain that success.
Lastly, an investigation of the Vermont Progressive Party and the environmental factor that have
led to its success forces us to answer the questions: How do we define third parties? Where does
the line blur between being one party and another? And does our definition of major party need
to be changed regionally?
Town Meetings and Direct Democracy in Vermont
In 1838, Alexis De Tocqueville described that in New England town meetings, “the
principle of popular sovereignty is not, as in certain nations, hidden or sterile; it is recognized by
mores, proclaimed by laws. It expands with freedom’s expansion and meets no obstacle on the
9
way to its ultimate ends.”16 The town meeting-style of direct democracy that De Tocqueville
described almost two centuries ago still exists in its original form in areas of Vermont.
For centuries, every year on the first Tuesday in March, Vermonters come together in
their local municipalities to discuss issues and vote on town meeting day. Topics range from the
school budget to mergers, and which local officials will represent their communities in the years
to come. Many Vermonters are deeply proud of this form of democracy in addition to the
consistency with which Vermont has held true to direct democracy: The Secretary of State’s “A
Citizen’s Guide to Vermont Town Meeting” describes that:
“Vermont town meeting is a tradition dating back to before there was a Vermont. The first town meeting was held in Bennington in 1762, 15 years before Vermont was created. In the late 1700s, as today, town citizens in Vermont held meetings so that they could address the problems and issues they faced collectively. Popular matters of legislation in earlier town meetings included whether or not to let pigs run free or whether smallpox vaccinations should be allowed in the town (some thought vaccinations were dangerous). Voters also decided what goods or labor could be used as payment for taxes… Town meeting also served a social function (as it does today), bringing people together who might not otherwise know each other. This can strengthen social ties within a town and help people work together to tackle community problems.”17
The final chapter of this thesis investigates the future of town meetings in Vermont.
While the quote above seems to paint a straightforward picture of town meeting day in Vermont,
the reality is much more complicated. While many rural towns have maintained town meeting
day in its original form, many others have transitioned towards hybrid systems that combine a
town meeting or a town meeting-like informational meeting with government-organized ballot
voting (also called the Australian ballot), while other towns and the few cities in Vermont solely
16 Alexis de. Tocqueville, Democracy In America (New York: G. Dearborn & Co., 1838), 62. 17 Office of the Vermont Secretary of State, “A Citizen’s Guide to Vermont Town Meeting,” last modified 2018, https://sos.vermont.gov/media/uomghd2h/citizen-guide-text-2.pdf.
10
use Australian ballots. One town, Brattleboro, uses representative democracy in its town
meetings.18 Other New England states have experienced similar changes, updates, and migrations
away from the traditional in-person town meeting. This migration away from in-person town
meeting day has only been exacerbated by the coronavirus pandemic. In fact, for the last two
years, this in-person style meeting has been discontinued almost unanimously across the state in
favor of coronavirus-safe town meeting voting procedures.19 In addition, many Vermonters and
legislators are advocating for making universal mail in ballots a permanent fixture of election
day in Vermont.20
The final chapter of this thesis investigates the benefits and detriments of the in-person
town meeting as it compares to Australian ballot system. It investigates whether the current
system still reflects the various aspects of town meetings though the centuries that scholars have
both praised and criticized, what the future of town meetings in Vermont might hold, and, were
they to disappear, what Vermonters could lose. It does so through a quantitative survey of over
half of the town clerks in Vermont– the group most intimately acquainted with town meeting day
– in addition to in-depth interviews with four clerks to ascertain more qualitative information
about the findings and these clerks’ reactions to the survey results in addition to some additional
questions about the future of town meeting in light of the new rules and regulations put into
place during the coronavirus pandemic.
While the research for this chapter was conducted prior to and then just following the
coronavirus pandemic’s shutting down in-person town meeting day, the implications of the
18 Ibid. 19 Kevin O’Connor, “Majority of Vermont’s floor-meeting towns turn to ballots for March 2,” VT Digger, February 24, 2021, https://vtdigger.org/2021/02/24/majority-of-vermonts-floor-meeting-towns-turn-to-ballots-for-march-2/?fbclid=IwAR0v6JCGdgylCPBFTJrCGW7vw_gsR0rq04ZXXrdHCCzLadegzVUNH_vWHkE. 20 Ashley Moore, “Vote-by-Mail,” Alliance for A Better Vermont, February 24, 2021, https://www.abettervermont.org/2021-blog/universal-vote-by-mail.
11
findings have gained importance as Vermont considers moving away from the in-person town
meetings that scholars have lauded as the purest form of direct democracy. This research
demonstrates what Vermont could lose, and gain, if it continues along this path.
Together, these three chapters delve into some of the unique aspects that sets Vermont’s
political system and democracy apart from other states. They also investigate three key elements
of democracy that political scientists, pundits, and average Americans look to as solutions to our
growing partisanship and political dissatisfaction. Learning about the intricacies of split ticket
voting, successful third parties, and town-meeting style direct democracy teaches us not only
about Vermont, but also holds valuable insights into the state of, and potential paths forward, for
how states could potentially replicate these elements and change our democracy at the national
level as well.
12
CHAPTER 1: AN INVESTIGATION OF THEORY IN
PRACTICE: SPLIT-TICKET VOTING IN VERMONT’S 2018
ELECTION
INTRODUCTION
The 2018 midterm election was labeled a “blue wave” by prominent news agencies.21
After the dust settled, House Democrats had gained 40 seats, “the largest Democratic House gain
since 1974.”22 Further, “House Democrats to [won] about 10 million more votes than House
Republicans. That’s the largest raw vote margin in a House midterm election ever.”23
Democratic wins, however, were not solely at the national level. Democrats also reduced the
Republican lead in governorships from 17 to 4, and gained 332 state legislature seats.24
The 2018 election also continued a long-term trend of fewer divided state governments.
According to the National Conference of State Legislatures, before 2006, over half of state
governments were divided—when any of the two legislative chambers or the governorship is
held by a different party. Following the 2018 election, only a quarter (26%) of state governments
were divided. Figure 1 shows the percentages of state governments that were divided between
party control since 1997.
21 Harry Eten, “Latest.”; Matthew Yglesias, “Democrats’”; and Scot Siddiqui, “The Democrats.” 22 Harry Eten, “Latest.” 23 Harry Eten, “Latest.” 24 Z. Byron Wolf and Joyce Tseng, “The 2018 blue wave, in 3 charts,” CNN, November 18, 2018, https://www.cnn.com/2018/11/28/politics/blue-wave-2018/index.html.
13
(National Conference of State Legislatures, “State Partisan Composition,” Last Modified August
8, 2019, http://www.ncsl.org/research/about-state-legislatures/partisan-composition.aspx.)
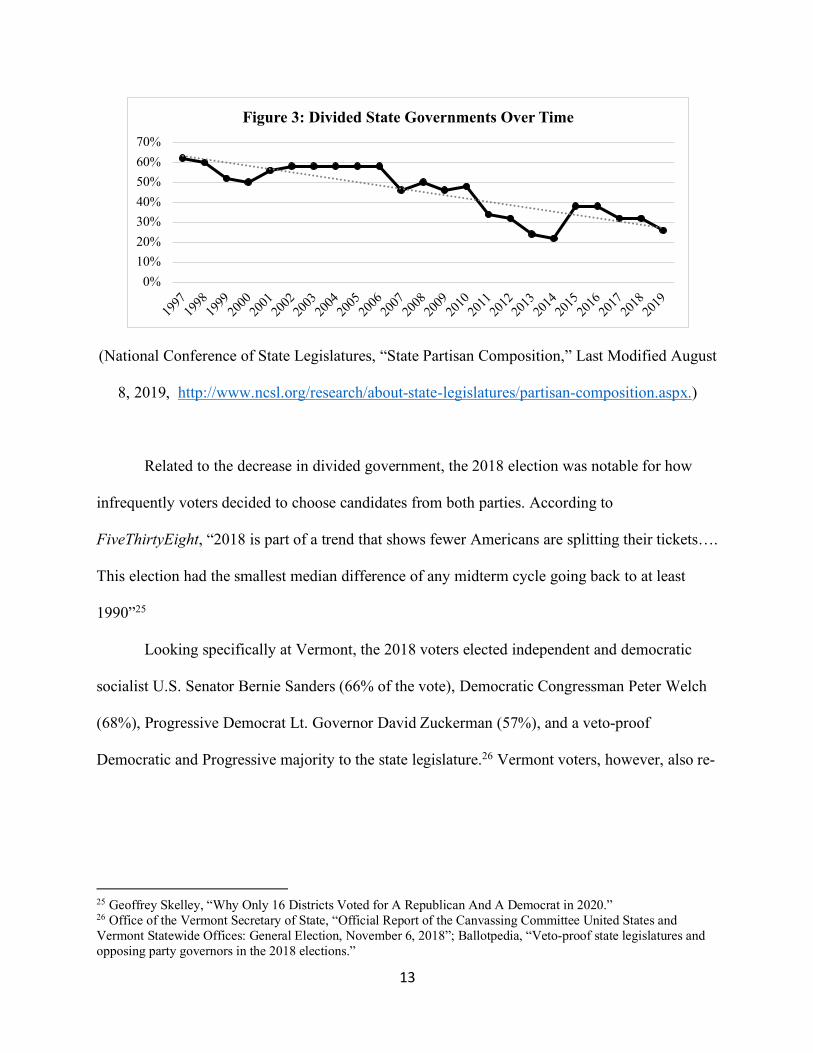
Related to the decrease in divided government, the 2018 election was notable for how
infrequently voters decided to choose candidates from both parties. According to
FiveThirtyEight, “2018 is part of a trend that shows fewer Americans are splitting their tickets….
This election had the smallest median difference of any midterm cycle going back to at least
1990”25
Looking specifically at Vermont, the 2018 voters elected independent and democratic
socialist U.S. Senator Bernie Sanders (66% of the vote), Democratic Congressman Peter Welch
(68%), Progressive Democrat Lt. Governor David Zuckerman (57%), and a veto-proof
Democratic and Progressive majority to the state legislature.26 Vermont voters, however, also re-
25 Geoffrey Skelley, “Why Only 16 Districts Voted for A Republican And A Democrat in 2020.” 26 Office of the Vermont Secretary of State, “Official Report of the Canvassing Committee United States and Vermont Statewide Offices: General Election, November 6, 2018”; Ballotpedia, “Veto-proof state legislatures and opposing party governors in the 2018 elections.”
0%10%20%30%40%50%60%70%
1997
1998
1999
2000
2001
2002
2003
2004
2005
2006
2007
2008
2009
2010
2011
2012
2013
2014
2015
2016
2017
2018
2019
Figure 3: Divided State Governments Over Time
14
elected Republican Governor Phil Scott (54%).27 This was only possible because of party-line
defection in the form significant split-ticket voting.
The 2018 election was Governor Scott’s first reelection after having been elected as
Vermont’s 82nd Governor in 2016. Governor Scott previously served three terms as Vermont’s
Lieutenant Governor, and represented Washington county as a state senator. Since his election in
2016, Scott has frequently made national news for expressing opinions and signing legislation
that has deviated from President Trump’s or the Republican Party’s position on the issue.
Examples of this include Governor Scott calling for Trump’s resignation following the January
6th assault on the capitol,28 voicing that he would not vote for President Trump in 2020,29 and
signing substantial gun control legislation.30 Governor Scott faced Democratic challenger
Christine Hallquist in his 2018 reelection bid. Hallquist received substantial national attention as
the “first transgender candidate to be nominated for a governorship by a major party.”31
However, despite the historic nature of her candidacy, was not considered to be a strong
candidate with the Cook Political Report maintaining the prediction of “solid Republican”
throughout the campaign.32 Governor Scott would then go on to win reelection against a stronger
candidate, Lieutenant Governor David Zuckerman during the 2020 election.
27 Office of the Vermont Secretary of State, “Official Report of the Canvassing Committee United States and Vermont Statewide Offices: General Election, November 6 2018.” 28 Wislong Ring, “Vermont’s Republican governor: Trump shouldn’t be in office,” AP, February 7, 2020, https://apnews.com/article/vermont-donald-trump-trump-impeachment-vt-state-wire-politics-4bd062c6be264be69c130d03137a515f 29 Jemima McEvoy, “Vermont Gov. Scott Joins Republicans Who Won’t Vote Trump – But Not Ready To Endorse Biden, Either,” Forbes, August 21, 2020, https://www.forbes.com/sites/jemimamcevoy/2020/08/21/vermont-gov-scott-joins-republicans-who-wont-vote-trump-but-not-ready-to-endorse-biden-either/?sh=1ed0cc22564b. 30 Jason Hanna and Lawrence Davidson, “Vermont governor signs sweeping gun control measures” CNN, April 11, 2018, https://www.cnn.com/2018/04/11/us/vermont-gun-control. 31 Jess Bidgood, “Christine Hallquist, a Transgender Woman, Wins Vermont Governor’s Primary,” The New York Times, August 4, 2018, https://www.nytimes.com/2018/08/14/us/politics/christine-hallquist-vermont.html. 32 Ibid
15
The strength of Governor Scott’s 2018 victory, as well as its deviation from the
overarching trend in the United States raises the question: what is driving this split-ticket voting?
Answering this question provides insight into modern day split-ticket voting not only in
Vermont, but across the country. It also presents insight into how a Republican governor has
been successful in what has become a consistently blue state.
This chapter outlines the scholarly research on split-ticket voting and reasons behind
divided government to establish a number of theories to why split-ticket voting occurs, describes
the methodology for collecting both qualitative and quantitative data from Vermont, reports the
findings from interviews conducted, and discusses the correlation between the split-ticket voting
patterns observed in 2018 in Vermont against the literature’s prominent theories to determine the
motivating factors in split-ticket voting in the 2018 election and the possible motivations for the
2020 Vermont gubernatorial race.
LITERATURE REVIEW
Over the years, a number of theories have emerged to explain split-ticket voting and
partisan defection. They can be split into two main categories: motivated/intentional split-ticket
voting and unintentional split-ticket voting. Intentional split-ticket voting theories interpret
voters’ split-tickets as behavior as intentionally designed to lead to a divided government. In
other words, the voters split their tickets on purpose. Unintentional theories of split-ticket voting
interpret split-ticket voting as a result of a lack of understanding or caring about the results of the
election or of that type of voting. The next few sections lay out some of the most prominent
intentional and unintentional split-ticket voting theories:
16
Intentional Split-Ticket Voting
The most prominent theory on intentional split-ticket voting is the Balancing Theory. The
Balancing Theory describes split-ticket voting as an intentional act on the part of the voter to
create a divided government: “voters understand … that the executive and the legislature
together determine public policy, so that when control of the two institutions is divided any
adopted policies must be compromises between the two party’s platforms.”33 Therefore,
moderate voters, whose ideal policy positions lie between the two parties, will split their ticket in
order to create a government where the opposing parties will necessarily need to compromise
and ultimately coalesce around more moderate positions.
Thus, according to this theory, “ticket-splitters come from the central, moderate range of
the ideological spectrum. More extreme voters cast straight tickets, while moderate voters are
more likely to split their tickets.”34 The author of the Balancing Theory, Morris Fiorina,
predicted that less partisanship and less difference between the parties would lead to less need
for balancing behavior and therefore less ticket splitting while more partisanship and more
differences between the parties would lead to more need for balancing behavior and ticket
splitting.
The Balancing Theory has been corroborated by a number of scholars.35 Looking
specifically at the state level, one study finds evidence of balancing split-ticket voting behavior
33 Morris Fiorina, Divided Government (Needleman Heights: Allyn & Bacon, 1992), 74. 34 Fiorina, Divided Government, 76. 35 See: Thomas Carsey and Geoffrey Layman, “Policy Balancing and Preferences for Party Control of Government,” Political Research Quarterly, Vol. 57, No. 4 (Dec., 2004): 541-550.; James Garand, and Marci Glascock Lichtl, “Explaining Divided Government in the United States: Testing an Intentional Model of Split-ticket Voting,” British Journal of Political Science, Vol. 30, No. 1 (Jan., 2000).; and Dean Lacy, Emmerson Niou, Phillip Paolino, and Robert Rein, “Measuring Preferences for Divided Government: Some Americans Want Divided Government and Vote to Create It,” Political Behavior, Vol. 41, Issue 1, (March 2019): 79-103.
17
at the state government level,36 while other scholars have built off of the original balancing
theory to argue that the decision to split-ticket vote is part of “moderating behavior” that voters
engage in strategically: straight ticket votes can be considered “moderating behavior” if the party
of the president is known or predicted.37 Similarly, another study put forward “Cognitive
Madisonianism,” a theory that draws significantly from the balancing theory and suggests that a
number of voters split their tickets due to, “a conscious decision that it is somehow “good” to
check power and balance policy, as our nation’s Founders might have wanted.”38
While many scholars have corroborated and built off of the Balancing Theory, a number
of studies also challenge its assumptions. For example, several studies have evaluated a number
of the propositions that would be outcomes of the Balancing Theory (e.g. that greater
polarization would lead to increases in split-ticket voting). One study found that sincere voting
and incumbency bias to be more likely factors behind split-ticket voting.39 Other scholars also
find more evidence of sincere voting than strategic/balancing behavior in their work.40 Another
prominent intentional theory of split-ticket voting revolves around “Sincere Voting.” This theory
36 Michael Bailey and Elliot Fullmer, “Balancing in the U.S. States, 1978-2009,” State Politics & Policy Quarterly, Vol. 11, No. 2 (June 2011): 148-166. 37 Alberto Alesina and Howard Rosenthal, “A Theory of Divided Government,” Econometrica, Vol. 64, No. 6 (Nov., 1996): 1311-1341. 38 Michael Lewis-Beck and Richard Nadeau, “Split-ticket Voting: The Effects of Cognitive Madisonianism,” The Journal of Politics, Vol. 66 No. I, (February 2004): 97-112. 39 See: Richard Born, “Split-Ticket Voters, Divided Government, and Fiorina's Policy-Balancing Model,” Legislative Studies Quarterly, Vol. 19, No. 1 (February 1994); and Richard Born, “Congressional Incumbency and the Rise of Split-Ticket Voting,” Legislative Studies Quarterly, Vol. 25, No. 3 (August 2000): 365-387. 40 See: Thomas Brunell and Bernard Grofman, “Testing sincere versus strategic split-ticket voting at the aggregate level: Evidence from split house–president outcomes, 1900–2004,” Electoral Studies, Vol. 28, Issue 1, (March 2009): 62-69; Barry Burden and David Kimball, “A New Approach to the Study of Ticket Splitting,” The American Political Science Review, Vol. 92, No. 3 (Sept. 19, 1998); John Geer, Amy Carter, James McHenry, Ryan Teten, and Jennifer Hoef, “Experimenting With the Balancing Hypothesis,” Political Psychology, Vol. 25, Issue 1, (Mar. 2004): 49-63; Jeffrey Karp and Marshall Garland, “Ideological Ambiguity and Split-ticket Voting,” Political Research Quarterly, Vol. 60, No. 4, (December 2007); and Franco Mattei and John Howes, “Competing Explanations of Split-Ticket Voting in American National Elections,” American Politics Quarterly, Vol. 28, No. 3, (July 2000): 379-407.
18
argues that split-ticket voting is not a tactical move made by a voter, instead, it is a sincere
representation of his or her policy positions.41
There are a number of versions of this Sincere Voting theory. The most cited argues that
split-ticket voters vote for the different parties based on the parties’ different “strengths” in
different offices. This theory, developed following a significant period of divided government
when Democrats held firm control over Congress, while Republicans held the White House,
surmises that, “offered two presidential candidates, voters choose the one they think more likely
to keep taxes low and defense strong and to govern competently. Offered two House candidates,
voters choose the one they think more likely deliver local benefits and to protect their favorite
programs.”42 Thus, voters are sincerely splitting their ticket based on an analysis of how the
candidates’ strengths match up with the roles of the office.
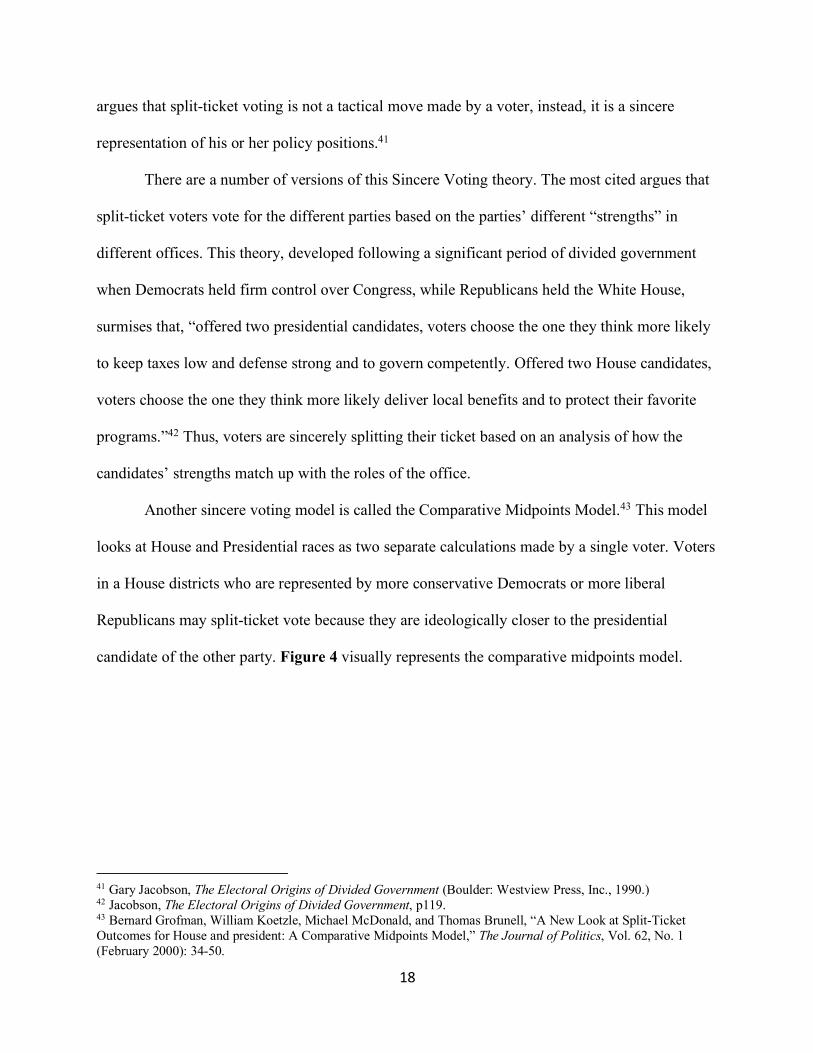
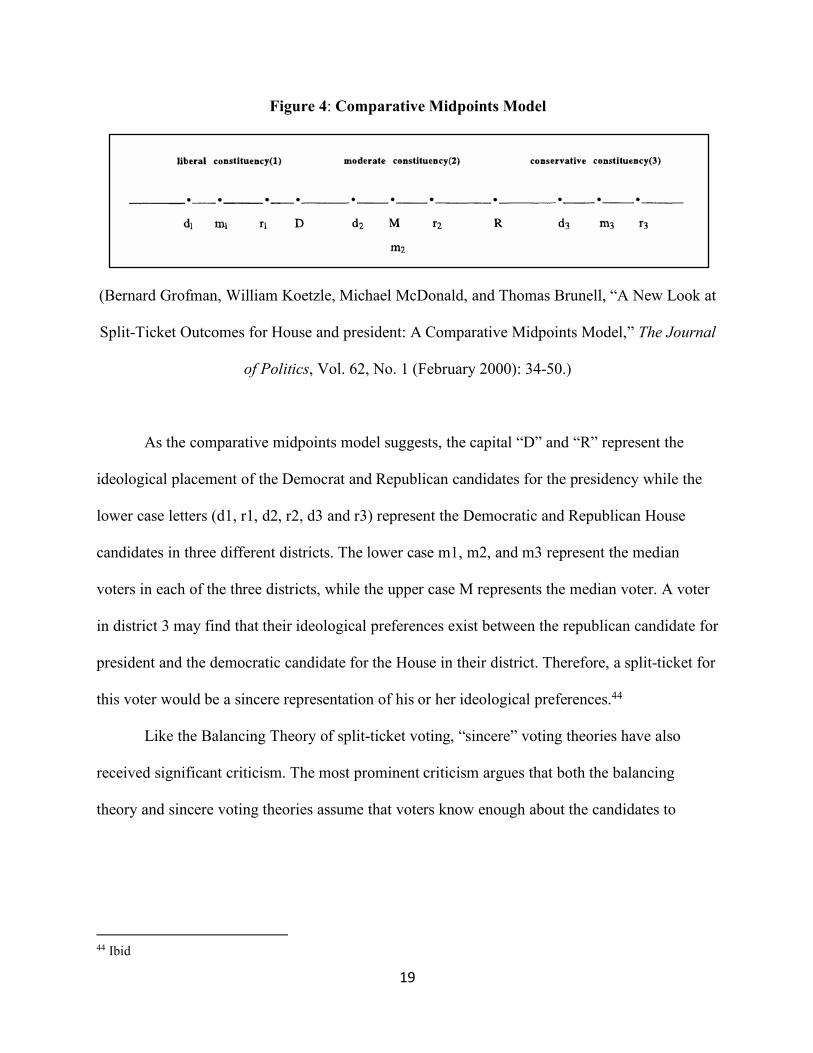
Another sincere voting model is called the Comparative Midpoints Model.43 This model
looks at House and Presidential races as two separate calculations made by a single voter. Voters
in a House districts who are represented by more conservative Democrats or more liberal
Republicans may split-ticket vote because they are ideologically closer to the presidential
candidate of the other party. Figure 4 visually represents the comparative midpoints model.
41 Gary Jacobson, The Electoral Origins of Divided Government (Boulder: Westview Press, Inc., 1990.) 42 Jacobson, The Electoral Origins of Divided Government, p119. 43 Bernard Grofman, William Koetzle, Michael McDonald, and Thomas Brunell, “A New Look at Split-Ticket Outcomes for House and president: A Comparative Midpoints Model,” The Journal of Politics, Vol. 62, No. 1 (February 2000): 34-50.
19
Figure 4: Comparative Midpoints Model
(Bernard Grofman, William Koetzle, Michael McDonald, and Thomas Brunell, “A New Look at
Split-Ticket Outcomes for House and president: A Comparative Midpoints Model,” The Journal
of Politics, Vol. 62, No. 1 (February 2000): 34-50.)
As the comparative midpoints model suggests, the capital “D” and “R” represent the
ideological placement of the Democrat and Republican candidates for the presidency while the
lower case letters (d1, r1, d2, r2, d3 and r3) represent the Democratic and Republican House
candidates in three different districts. The lower case m1, m2, and m3 represent the median
voters in each of the three districts, while the upper case M represents the median voter. A voter
in district 3 may find that their ideological preferences exist between the republican candidate for
president and the democratic candidate for the House in their district. Therefore, a split-ticket for
this voter would be a sincere representation of his or her ideological preferences.44
Like the Balancing Theory of split-ticket voting, “sincere” voting theories have also
received significant criticism. The most prominent criticism argues that both the balancing
theory and sincere voting theories assume that voters know enough about the candidates to
44 Ibid
20
understand either: how the candidates’ positions would balance out in the context of a divided
government or exactly how proximate the candidates’ positions are to the voters’ positions.45
In more recent years, the notion of Ambivalence—an individual being torn between the
two parties by cross-pressures—has emerged as another intentional or “motivated” theory of
split-ticket voting. One study that focuses on ambivalence uses American National Election
Study (ANES) data to determine that ticket splitting is, in part, driven by ambivalence: where
voters feel conflicted between the two parties and project this conflict onto their voting behavior.
That study concludes that “divided government occurs in part because citizens are divided within
themselves.”46
Building off of this finding, another study found that access to information plays a
significant role in the decision-making process for these ambivalent voters.47 Ambivalent voters
with low political knowledge and/or no access or exposure to campaign information are likely to
engage in economic voting. In contrast, ambivalent voters with high political knowledge and/or
exposure to campaign information are more likely to engage in ideological voting.48
Unintentional Split-Ticket Voting
In contrast to the intentional theories of split-ticket voting that place significant weight on
the voters’ intentions in the ballot box, unintentional theories of split-ticket voting argue that
split-ticket voting is a result of external influences, and are not due to a calculated motive on
behalf of the voter.
45 Karp and Garland, “Ideological Ambiguity.” 46 Kenneth Mulligan, “Partisan Ambivalence, Split-Ticket Voting, and Divided Government,” Political Psychology, Vol 32, No. 3, (2011). 47 Scott Basinger, and Howard Lavine, “Ambivalence, Information, and Electoral Choice,” The American Political Science Review, Vol. 99, No. 2 (May, 2005). 48 Christopher Armitage and Mark Conner, “Attitudinal Ambivalence: A Test of Three Key Hypotheses,” Personality and Social Psychology Bulletin, Vol. 26, Issue 11, (2000): 14-21.
21
A number of scholars have compared partisan affiliation with split-ticket voting.49 They
consistently find that voters who identify with more extreme ideologies or partisanship are less
likely to split-ticket vote. This theory of Partisan Sorting predicts that, over time, increasing
polarization will contribute to ideological sorting and should therefore reduce split-ticket voting:
first because “As the psychological self-concept narrows, voters are unable to bring themselves
to cross party lines”50 and second, because “as sorting increases, Americans increasingly dislike
and distrust each other on a social level—even more than they disagree on policy outcomes.”51
Ultimately, this partisan-sorting theory predicts that split-ticket voting will decrease as
partisanship increases and conversely, split-ticket voting will increase as partisanship decreases.
Corroborating this, academics have found that, “split ballots are most common when
[Republican] and the Democratic candidate are nearest each other, blurring their ideological
differences enough to make partisan considerations in voting behavior less important.”52 These
predictions and findings are in direct contradiction with Fiorina’s balancing theory prediction
that polarization will lead to more split-ticket voting.
Taking the link between a lack of partisanship and split-ticket voting further, many
scholars also point to Indifference as a driver for split-ticket voting. To clarify the terminology:
in the political context an ambivalent individual holds an equal number of positive and negative
views of both parties or candidates while an indifferent individual has no opinions of the parties
or candidates. For instance, “when people are indifferent about candidates, the choice is neither
49 See: Paul Beck, Lawrence Baum, Aage Clausen, and Charles Smith, Jr., “Patterns and Sources of Ticket Splitting in Subpresidential Voting,” American Political Science Review, Vol. 86, No. 4 (December 1992); and Ian McAllister and Robert Darcy, “Sources of Split-ticket Voting in the 1988 American Elections,” Political Studies, XL, (1992): 695-712. 50 Nicholas Davis and Lilliana Mason, “Sorting and the Split-Ticket: Evidence from Presidential and Subpresidential Elections,” Political Behavior. 38(2) (2015): 337-354. https://link.springer.com/article/10.1007/s11109-015-9315-7. 51 Ibid. 52 Burden and Kimball, “A New Approach to the Study of Ticket Splitting.”
22
difficult nor crucial. However, when citizens are ambivalent about them, the choice may be
difficult but substantial in election.”53 Thus, scholars have investigated the difference in split-
ticket voting between indifferent and ambivalent individuals. Proponents of the “indifference”
theory demonstrate that while ambivalence is positively correlated with split-ticket voting, in
fact, “indifference—the complete absence of affective political attachments—has a greater
positive effect on split-ticket voting.”54 Thus, while some voters may be split within themselves
and using the ballot box to voice those cross-pressured feelings, others are simply indifferent to
the candidate options before them and thus, they are more likely to select their candidates at
random which leads to an increased proportion of these individuals who split-ticket vote.55
The last overarching theory of unintentional split-ticket voting points to Incumbency
Advantage as one of the driving factors behind split-ticket voting. A number of scholars have
used regression analyses to investigate the motivations behind split-ticket voting and in many
instances the findings single out incumbency as a driving factors behind split-ticket voting.56
Specifically during the increase in split-ticket voting in the 1956-68 and 1972-92 periods,
“incumbency was a powerful determinant of [this] step jump in ticket-splitting that occurred.” In
fact, “22.4% of the overall rise from 1956-68 to 1972-92, and 32.5% of that specifically
occurring in losing-presidential-party districts, can be attributed to nothing more elaborate than
this one factor.”57
53 Sung-jin Yoo, “Two Types of Neutrality: Ambivalence versus Indifference and Political Participation,” Journal of Politics, Vol. 72 Issue 1, (January 2010): 163-177. 54 Nicholas Davis, “The Role of Indifference in Split-Ticket Voting,” Political Behavior. 37(1) (2014): 67-86, https://link.springer.com/article/10.1007/s11109-013-9266-9. 55 See also: Judd Thornton, “Getting Lost on the Way to the Party: Ambivalence, Indifference, and Defection with Evidence from Two Presidential Elections,” Social Science Quarterly, v. 95, issue 1, (March 2014): 184-201. 56 Beck, Baum, Clausen, and Smith, “Patterns and Sources.” 57 Born, “Congressional Incumbency.”
23
The theory argues that incumbent visibility advantages the incumbent by encouraging
“cross-party” or split-ticket voting because, voters will give the incumbent the “benefit of the
doubt” when confronted with the options the ballot box.58 Ultimately, even small amounts of
benefit of the doubt can “dramatically change the nature of electoral competition and generate
barriers to entry”59 for challengers. In addition, the insulating effects of benefit of the doubt are
magnified the closer the incumbent’s positions are to the ‘center’ or median voter.60 This
correlates with split-ticket voting theories like Partisan Sorting that find that split-ticket voting is
more likely when the parties are closer together.
Incumbency advantage is frequently pointed to by scholars as a driving or at least a
supplementary force in split-ticket voting: due to name recognition, fundraising capacity, and
experience.61 In fact, incumbency is such a recognized influence on split-ticket voting that some
scholars criticize other theories for not including or discounting the incumbency advantage:
“Jacobson and Fiorina assume that all seats are open at the same time or with the same
frequency.”62 Instead, proponents of this theory find that majority or minority status will lead to
decreased and increased (respectively) rates of retirement in the two parties. Minority party seats
will disproportionately turn into open races which will further disadvantage the minority party.63
Therefore, these scholars argue party control of the legislature and executive branches are not as
representative of the will of the people as Jacobson and Fiorina suggest in their theories.
58 Scott Feld and Bernard Grofman, “Incumbency Advantage, Voter Loyalty, and the Benefit of the Doubt,” Journal of Theoretical Politics, 3(2) (1991). 59 Ibid. 60 Ibid 61 See: Burden and Kimball, “A New Approach;” Richard Forgette and Glen Platt, “Voting for the Person, Not the Party: Party Defection, Issue Voting, and Process Sophistication,” Social Science Quarterly, Vol. 80, No. 2, (June 1999); Mattei and Howes, “Competing Explanations;” and Mcallister and Darcy, “Sources of Split-ticket Voting.” 62 Stephen Ansolabehere and Alan Gerber, “Incumbency Advantage and the Persistence of Legislative Majorities,” Legislative Studies Quarterly, Vol. 22, No. 2 (May 1997): 161-178. 63 Ibid.
24
Ultimately the academics behind these intentional and unintentional theories of split-
ticket voting recognize that these theories are not mutually exclusive. Even Fiorina qualified his
theory, stating that, “all in all, the empirical support for this kind of policy balancing model is
mixed… [and] many colleagues believe that such models make too severe informational
demands on the voter. But I never advanced such a model as an explanation of all ticket
splitting.”64 Ultimately, the goal of each of these theories is to investigate the motivations or
reasons behind the split-ticket voters who may have substantial influence on the outcomes of
elections and the creations of divided government. My research below investigates the Vermont
2018 election when a group of split-ticket voters led to a divided Vermont government. The
discussion of my results will parse out which theories of split-ticket voters fit best within the
context of the 2018 election in Vermont.
METHODOLOGY
The first goal of the methodology was to identify Vermont split-ticket voters for further
research. To locate these split-ticket voters, data from the Vermont Secretary of State were
utilized. The Vermont Secretary of State’s website provides town and precinct-level vote totals
and percentages for Vermont elections. To determine the towns and precincts with the highest
proportions of split-ticket voters, it was necessary to compare key race vote totals. These
calculations were accomplished by finding the average absolute difference between Senator
Bernie Sanders’ and Governor Phil Scott’s percent of the vote, between Representative Peter
Welch’s and Governor Phil Scott’s percent of the vote, and between Lieutenant Governor David
Zuckerman’s and Governor Phil Scott’s percent of the vote.
64 Fiorina, Divided Government, 153.
25
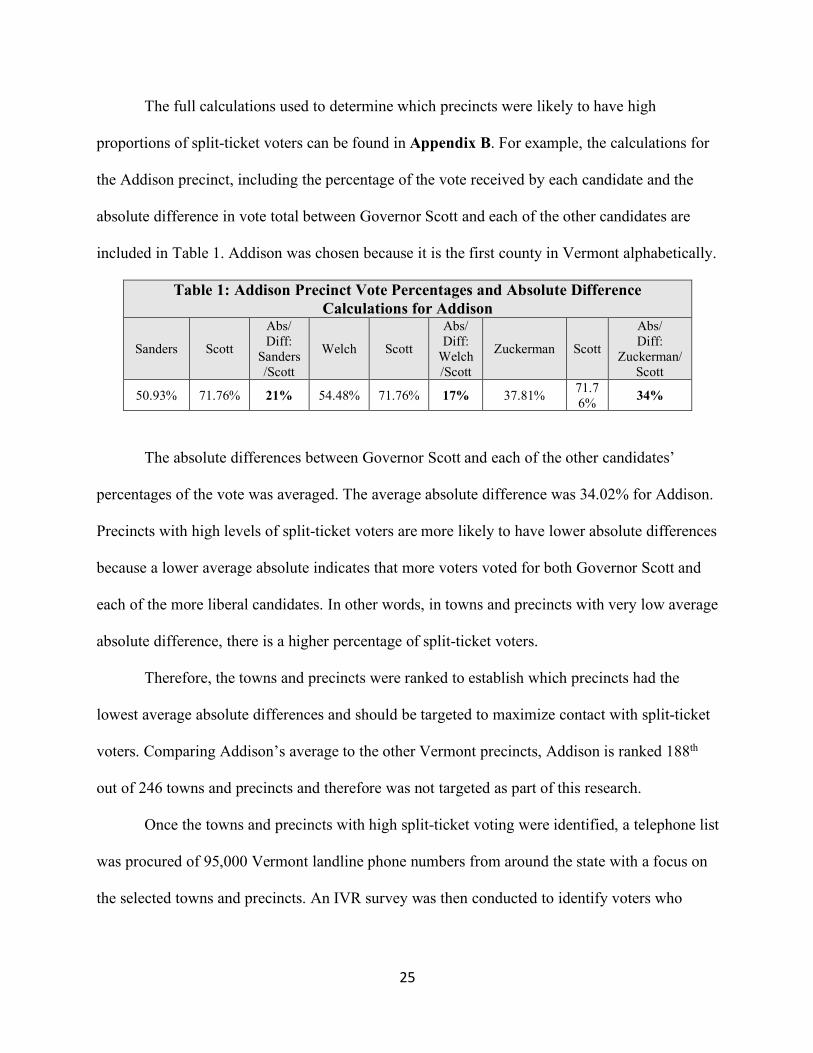
The full calculations used to determine which precincts were likely to have high
proportions of split-ticket voters can be found in Appendix B. For example, the calculations for
the Addison precinct, including the percentage of the vote received by each candidate and the
absolute difference in vote total between Governor Scott and each of the other candidates are
included in Table 1. Addison was chosen because it is the first county in Vermont alphabetically.
Table 1: Addison Precinct Vote Percentages and Absolute Difference Calculations for Addison
Sanders Scott
Abs/ Diff:
Sanders/Scott
Welch Scott
Abs/ Diff:
Welch /Scott
Zuckerman Scott
Abs/ Diff:
Zuckerman/Scott
50.93% 71.76% 21% 54.48% 71.76% 17% 37.81% 71.76% 34%
The absolute differences between Governor Scott and each of the other candidates’
percentages of the vote was averaged. The average absolute difference was 34.02% for Addison.
Precincts with high levels of split-ticket voters are more likely to have lower absolute differences
because a lower average absolute indicates that more voters voted for both Governor Scott and
each of the more liberal candidates. In other words, in towns and precincts with very low average
absolute difference, there is a higher percentage of split-ticket voters.
Therefore, the towns and precincts were ranked to establish which precincts had the
lowest average absolute differences and should be targeted to maximize contact with split-ticket
voters. Comparing Addison’s average to the other Vermont precincts, Addison is ranked 188th
out of 246 towns and precincts and therefore was not targeted as part of this research.
Once the towns and precincts with high split-ticket voting were identified, a telephone list
was procured of 95,000 Vermont landline phone numbers from around the state with a focus on
the selected towns and precincts. An IVR survey was then conducted to identify voters who
26
voted a split-ticket and to collect data on some non-split-ticket voters. Between August 16, and
August 21, 2019, the IVR survey identified 207 split-ticket voters who met the following criteria:
1. Voted in the 2018 election;
2. Identified as: A Democrat, an Independent-lean Democrat, or a Strong Independent; and
3. Voted for Governor Scott in 2018, is either somewhat or very likely to vote for Governor
Scott in 2020, or is favorable to Governor Scott.
The IVR questionnaire included minimal questions to maximize response rate. These
included the three key questions related to Governor Scott (favorability, 2018 vote, and likely
2020 vote), knowledge of and favorability toward other prominent politicians in Vermont, a right
direction/ wrong track question, and demographic information. The full IVR questionnaire and
topline responses are included in Appendix A.
While the 207 voters identified by the IVR survey were not all split-ticket voters in 2018
(some were favorable to Governor Scott but had not voted for him), their favorability, past
voting behavior, and potential future voting behavior placed them within the category of either a
split-ticket voter or a potential split-ticket voter. Following the identification of these 207 split-
ticket voters, two attempts were made to contact each individual for possible in-depth interviews.
The attempts were made over the phone and at different times during the day to maximize
possible contact. Ultimately, 78 follow-up interviews were conducted with these voters between
August 26, and September 17, 2019.
The goal was to collect both quantitative and qualitative data on Vermont political issues
and Governor Scott. These voters were also asked to complete a projection exercise about how a
Democratic candidate potentially running against Governor Scott could appeal to them. The full
follow up interview questionnaire and topline results are also included in Appendix A.
27
As with most surveys, there are a number of elements to this methodology that may
contribute to some bias in the results. First, it is important to acknowledge potential response
bias in that these individuals elected to participate not once but twice in this survey and that split-
ticket voters who elected participated in this survey may have different opinions from those who
elected not to participate.65 Second, selection bias may also be at play. The methodology was
designed to target the areas with highest concentration of split-ticket voters in Vermont. It may
be the case that split-ticket voters in different areas of the state hold different opinions and that
this methodology may not have fully captured that range of opinions. Prominent research
organizations mitigate this type of selection bias by ensuring demographic consistency.66
Therefore, demographic information for this survey was tracked. Gender, education, works
status, and marital status were all relatively consistent with Vermont demographics. However,
the survey skewed slightly older and more retired than the full Vermont population. In addition,
this survey was conducted using a landline telephone sample due to cost constraints. While,
according to the National Health Statistics Report from the Center for Disease Control, Vermont
has traditionally been one of the states with the fewest cellphone-only households,67 split-ticket
voters from households with landlines who were surveyed may hold different opinions than
those who live in cellphone-only households.
65 Scott Keeter, Nick Hatley, Courtney Kennedy, and Arnold Lau, “What Low Response Rates Mean for Telephone Surveys,” Pew Research Center: Methods, May 15, 2017, https://www.pewresearch.org/methods/2017/05/15/what-low-response-rates-mean-for-telephone-surveys/. 66 Andrew Mercer, Arnold Lau, and Courtney Kennedy, “For Weighting Online Opt-In Samples, What Matters Most?,” Pew Research Center: Methods, January 26, 2018, https://www.pewresearch.org/methods/2018/01/26/for-weighting-online-opt-in-samples-what-matters-most/. 67 Stephen Blumberg, Nadarajasundaram Ganesh, Julian Luke, and Gilbert Gonzales, “Wireless Substitution: State-level Estimates from the National Health Interview Survey, 2012,” National Health Statistics Reports, No. 70, December 18, 2013, https://www.cdc.gov/nchs/data/nhsr/nhsr070.pdf; and National Center for Health Statistics, “National Health Interview Survey Early Release Program,” released August, 2015, https://www.cdc.gov/nchs/data/nhis/earlyrelease/wireless_state_201608.pdf.
28
RESULTS
Interactive Voice Response Survey
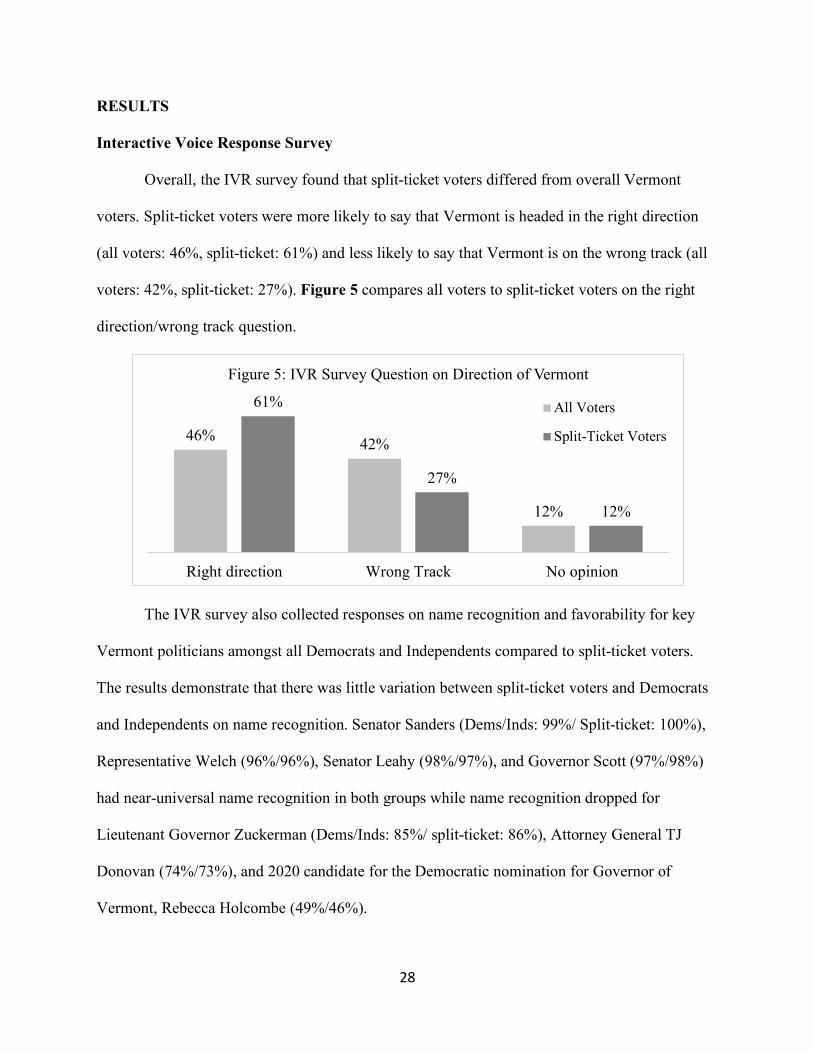
Overall, the IVR survey found that split-ticket voters differed from overall Vermont
voters. Split-ticket voters were more likely to say that Vermont is headed in the right direction
(all voters: 46%, split-ticket: 61%) and less likely to say that Vermont is on the wrong track (all
voters: 42%, split-ticket: 27%). Figure 5 compares all voters to split-ticket voters on the right
direction/wrong track question.
The IVR survey also collected responses on name recognition and favorability for key
Vermont politicians amongst all Democrats and Independents compared to split-ticket voters.
The results demonstrate that there was little variation between split-ticket voters and Democrats
and Independents on name recognition. Senator Sanders (Dems/Inds: 99%/ Split-ticket: 100%),
Representative Welch (96%/96%), Senator Leahy (98%/97%), and Governor Scott (97%/98%)
had near-universal name recognition in both groups while name recognition dropped for
Lieutenant Governor Zuckerman (Dems/Inds: 85%/ split-ticket: 86%), Attorney General TJ
Donovan (74%/73%), and 2020 candidate for the Democratic nomination for Governor of
Vermont, Rebecca Holcombe (49%/46%).
46% 42%
12%
61%
27%
12%
Right direction Wrong Track No opinion
Figure 5: IVR Survey Question on Direction of Vermont
All Voters
Split-Ticket Voters
29
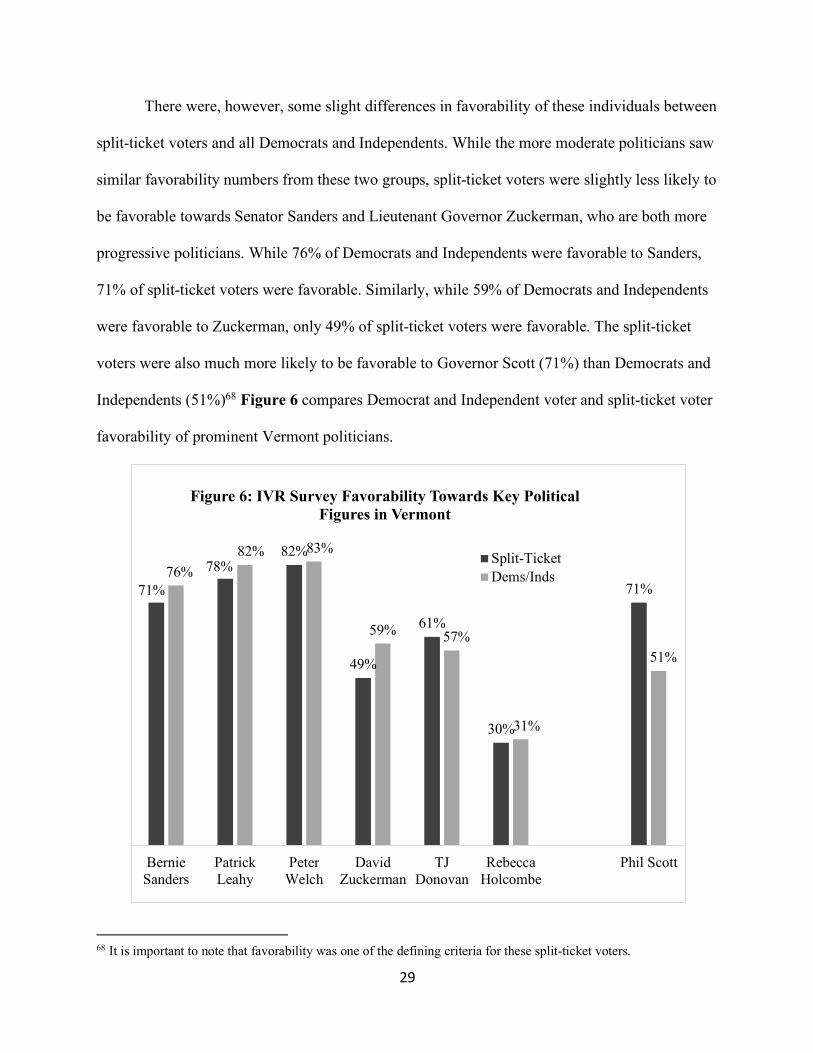
There were, however, some slight differences in favorability of these individuals between
split-ticket voters and all Democrats and Independents. While the more moderate politicians saw
similar favorability numbers from these two groups, split-ticket voters were slightly less likely to
be favorable towards Senator Sanders and Lieutenant Governor Zuckerman, who are both more
progressive politicians. While 76% of Democrats and Independents were favorable to Sanders,
71% of split-ticket voters were favorable. Similarly, while 59% of Democrats and Independents
were favorable to Zuckerman, only 49% of split-ticket voters were favorable. The split-ticket
voters were also much more likely to be favorable to Governor Scott (71%) than Democrats and
Independents (51%)68 Figure 6 compares Democrat and Independent voter and split-ticket voter
favorability of prominent Vermont politicians.
68 It is important to note that favorability was one of the defining criteria for these split-ticket voters.
71%78%
82%
49%
61%
30%
71%76%
82% 83%
59% 57%
31%
51%
BernieSanders
PatrickLeahy
PeterWelch
DavidZuckerman
TJDonovan
RebeccaHolcombe
Phil Scott
Figure 6: IVR Survey Favorability Towards Key Political Figures in Vermont
Split-TicketDems/Inds
30
In-Depth Interviews
As mentioned above, the original IVR survey was designed to identify individuals who
met at least one of the following criteria for further research.
(1) are favorable to Governor Scott;
(2) voted for Governor Scott in 2018; or
(3) were either very or somewhat likely to vote for Governor Scott in 2020.
Ultimately, 207 were identified and 78 of those participated in further research. The
results outlined below are from those 78 more in-depth interviews.
The first couple questions in the interviews were designed to obtain a broad
understanding of these voters’ overarching ideological and voting preferences. First, having
previously collected party identification in the IVR survey, the question was asked again to
ensure relative continuity. The results demonstrated that the vast majority of these individuals
did meet the party identification criteria for the research and were also comprised of a good mix
of Democrats, Independents, and Progressives. The respondents were split between identifying
as Democrats (41%) and Independents (41%). Additionally, six self-identified as a Progressive
and seven indicated that they did not have a preference. One individual gave different answers –
he identified himself as an independent in the IVR survey but as a Republican in the follow-up
interview.
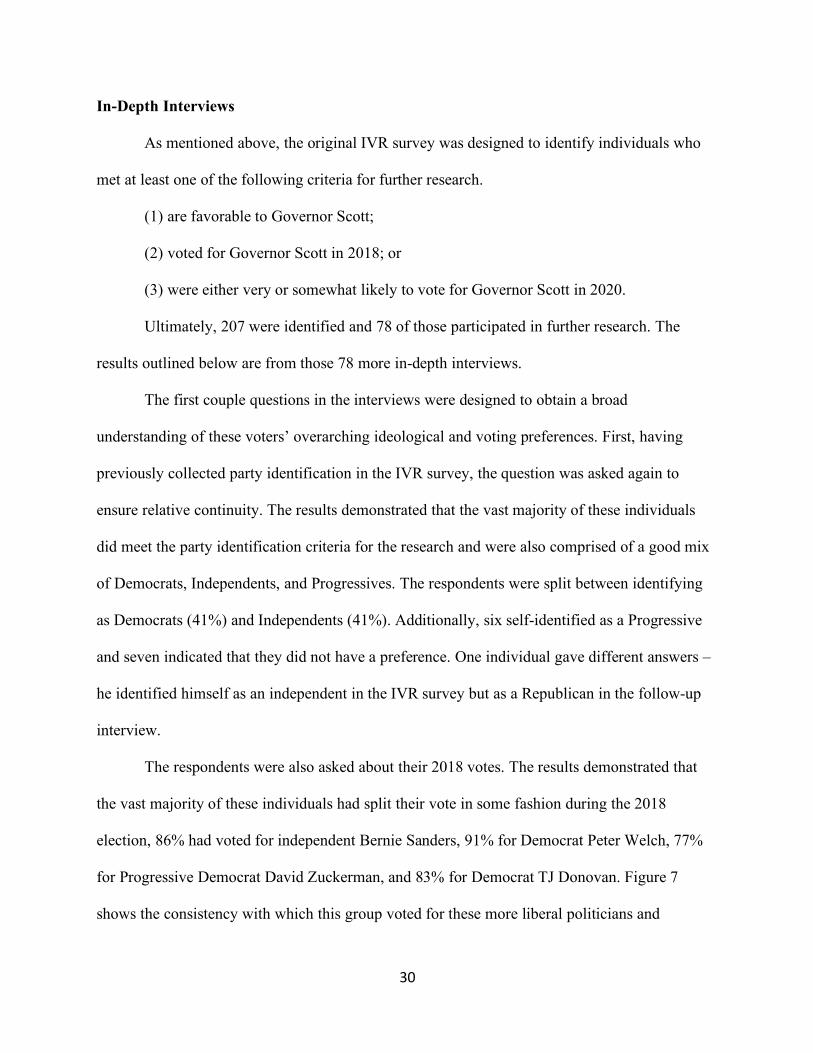
The respondents were also asked about their 2018 votes. The results demonstrated that
the vast majority of these individuals had split their vote in some fashion during the 2018
election, 86% had voted for independent Bernie Sanders, 91% for Democrat Peter Welch, 77%
for Progressive Democrat David Zuckerman, and 83% for Democrat TJ Donovan. Figure 7
shows the consistency with which this group voted for these more liberal politicians and
31
compares those percentages with their vote for Governor Scott. Therefore, with some variation,
the group of individuals identified and interviewed for this survey had, for the large part, voted
down-ticket Democrat/Independent for all races except for the gubernatorial race. Therefore,
these were not simply split-ticket voters, they were Democratic-defecting split-ticket voters.
Figure 7: In-Depth Interview Split Ticket Voter 2018 Vote
Questions about specific policy issues were also included in order to assess whether these
voters’ party identification lined up with their issue preferences. The survey respondents were
presented with a number of proposals that “may be or are being considered by the Vermont State
Legislature.” The included proposals were derived from a list of pending legislation from the
Vermont State Legislature’s website and some issues championed by the Scott administration.69
The respondents were asked how much they supported or opposed these proposals. The
respondents’ answers indicated that not only had the majority of these individuals voted for
down-ticket Democrat/Independent in the 2018 election, but they also supported many of the
Democratic-leaning legislative proposals. In fact, they were more likely to support the more
liberal ideas than they were to support Governor Scott’s administration’s preferences.
69 Vermont General Assembly, “Bills Released for Introduction But Not Yet Introduced,” accessed October 20, 2019, https://legislature.vermont.gov/bill/released/2020; Vermont Official State Website, “Office of Governor Phil Scott,” accessed October 12, 2019, https://governor.vermont.gov/.
32
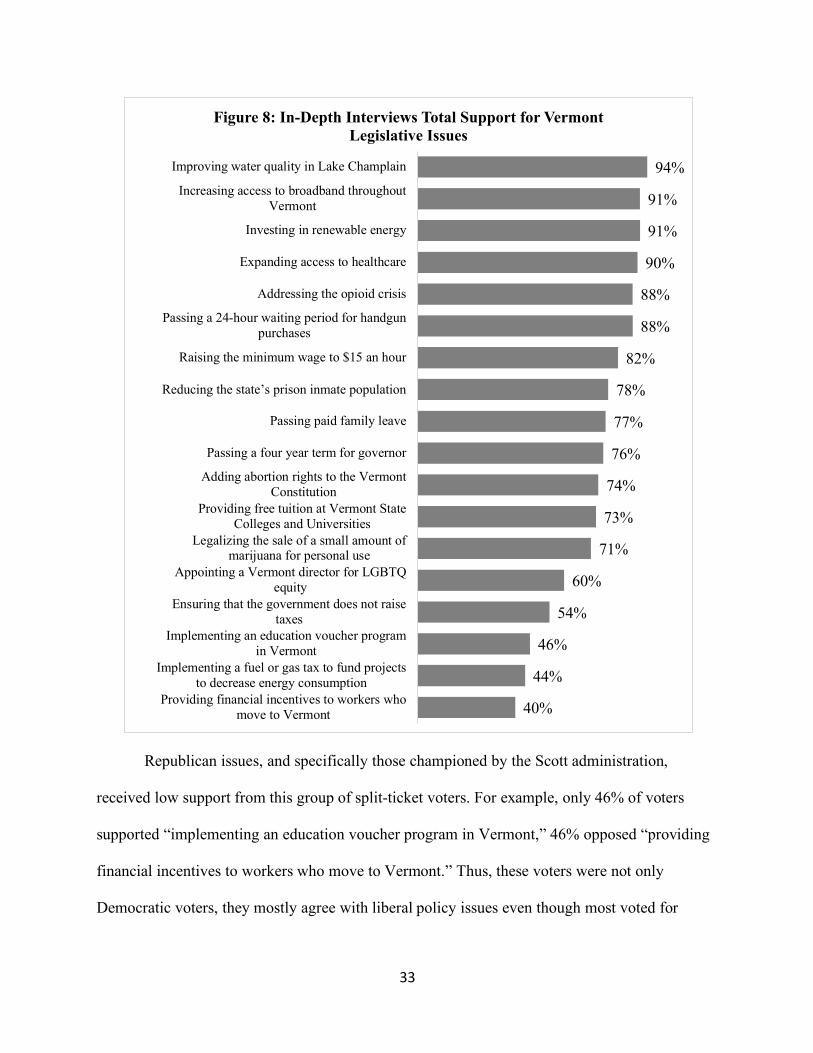
The proposals with the highest support were either neutral or traditionally Democratic
positions. For example, 94% of respondents supported “improving the water quality in Lake
Champlain,” 91% supported “investing in renewable energy sources,” 91% supported
“increasing access to broadband throughout Vermont,” and 90% supported “expanding access to
healthcare.” The respondents also expressed significant support for many of the most liberal
positions: 88% supported “passing a 24-hour waiting period for handgun purchases,” 82%
supported “raising the minimum wage to $15 an hour,” 77% supported “passing paid family
leave,” 74% supported “adding abortion rights to the Vermont Constitution,” 73% supported
“providing free tuition at Vermont state colleges and universities,” and 71% supported
“legalizing the sale of a small amount of marijuana for personal use.” Figure 8, on the next page,
ranks support for each of these issues.
33
Republican issues, and specifically those championed by the Scott administration,
received low support from this group of split-ticket voters. For example, only 46% of voters
supported “implementing an education voucher program in Vermont,” 46% opposed “providing
financial incentives to workers who move to Vermont.” Thus, these voters were not only
Democratic voters, they mostly agree with liberal policy issues even though most voted for
40%
44%
46%
54%
60%
71%
73%
74%
76%
77%
78%
82%
88%
88%
90%
91%
91%
94%
Providing financial incentives to workers whomove to Vermont
Implementing a fuel or gas tax to fund projectsto decrease energy consumption
Implementing an education voucher programin Vermont
Ensuring that the government does not raisetaxes
Appointing a Vermont director for LGBTQequity
Legalizing the sale of a small amount ofmarijuana for personal use
Providing free tuition at Vermont StateColleges and Universities
Adding abortion rights to the VermontConstitution
Passing a four year term for governor
Passing paid family leave
Reducing the state’s prison inmate population
Raising the minimum wage to $15 an hour
Passing a 24-hour waiting period for handgunpurchases
Addressing the opioid crisis
Expanding access to healthcare
Investing in renewable energy
Increasing access to broadband throughoutVermont
Improving water quality in Lake Champlain
Figure 8: In-Depth Interviews Total Support for Vermont Legislative Issues
34
Governor Scott. Later questions in the survey addressed the question of why this discrepancy
occurred in the 2018 Vermont gubernatorial election.
The final question on issue preference asked the respondents to choose between two
competing priorities: progressive values or economics. When asked to specifically choose
between supporting a candidate (or lean towards supporting a candidate) who “focuses on
progressive values and economic justice” or “a candidate who focuses on issues like the
economy and balancing the state budget,” 46% of respondents either supported (26%) or leant
towards supporting (21%) candidates who focus on progressive values and economic justice.
Thirty eight percent either supported (24%) or leant towards supporting (14%) candidates who
focus on issues like the economy and balancing the state budget. Fifteen percent of respondents
volunteered that both best describe how they generally support candidates in Vermont.
Therefore, these split-ticket voters not only largely supported more democratic policy positions,
when they were forced to choose, a plurality said they would support a candidate who focused on
progressive policies over one that focused on the economy and balancing the state budget. Later
questions in the survey investigated these voters’ decisions in 2018 to determine why they did
not follow this path in 2018.
This liberal-leaning amongst these split-ticket voters did not emerge as strongly when
asked about their political priorities in an open-ended format. Fifty-nine percent of the split-
ticket voters’ responses mentioned the economy, high taxation, and the need to create jobs in
Vermont. These responses largely focused on the split-ticket voters’ own bottom lines and many
articulated the fear that any increased taxation would harm their standard of living. This was the
first real evidence of these split-ticket voters being drawn in two different directions
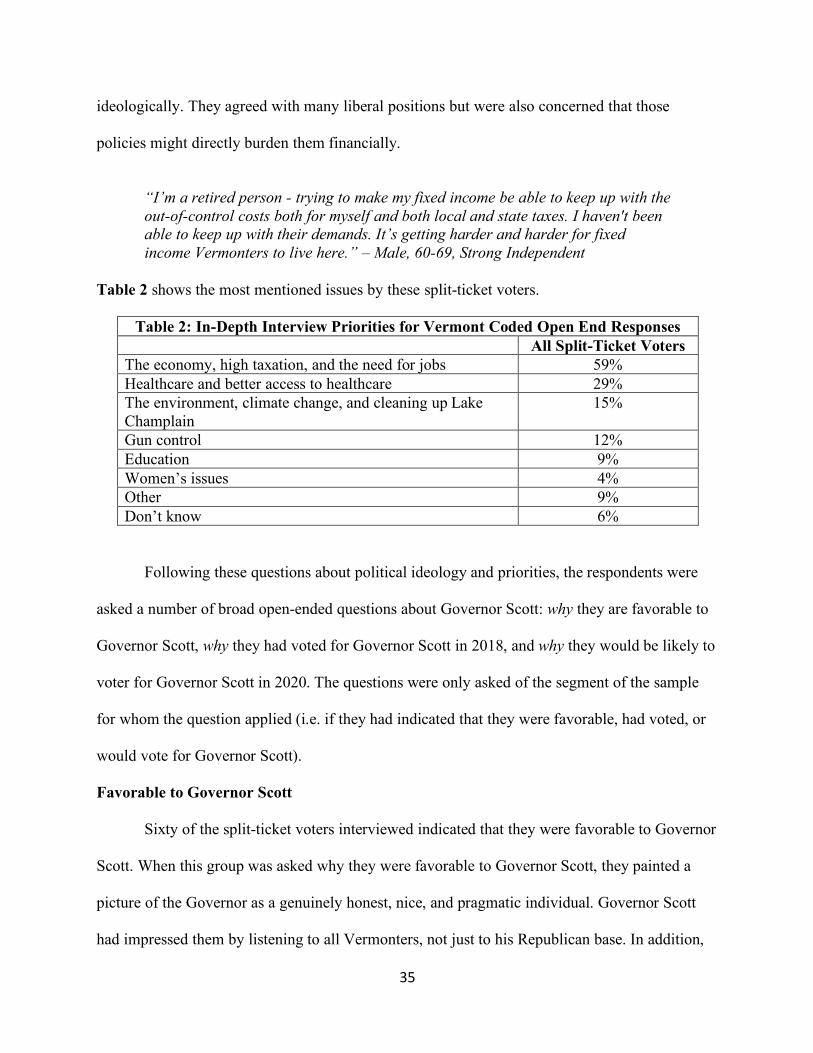
35
ideologically. They agreed with many liberal positions but were also concerned that those
policies might directly burden them financially.
“I’m a retired person - trying to make my fixed income be able to keep up with the out-of-control costs both for myself and both local and state taxes. I haven't been able to keep up with their demands. It’s getting harder and harder for fixed income Vermonters to live here.” – Male, 60-69, Strong Independent
Table 2 shows the most mentioned issues by these split-ticket voters.
Table 2: In-Depth Interview Priorities for Vermont Coded Open End Responses All Split-Ticket Voters The economy, high taxation, and the need for jobs 59% Healthcare and better access to healthcare 29% The environment, climate change, and cleaning up Lake Champlain
15%
Gun control 12% Education 9% Women’s issues 4% Other 9% Don’t know 6%
Following these questions about political ideology and priorities, the respondents were
asked a number of broad open-ended questions about Governor Scott: why they are favorable to
Governor Scott, why they had voted for Governor Scott in 2018, and why they would be likely to
voter for Governor Scott in 2020. The questions were only asked of the segment of the sample
for whom the question applied (i.e. if they had indicated that they were favorable, had voted, or
would vote for Governor Scott).
Favorable to Governor Scott
Sixty of the split-ticket voters interviewed indicated that they were favorable to Governor
Scott. When this group was asked why they were favorable to Governor Scott, they painted a
picture of the Governor as a genuinely honest, nice, and pragmatic individual. Governor Scott
had impressed them by listening to all Vermonters, not just to his Republican base. In addition,
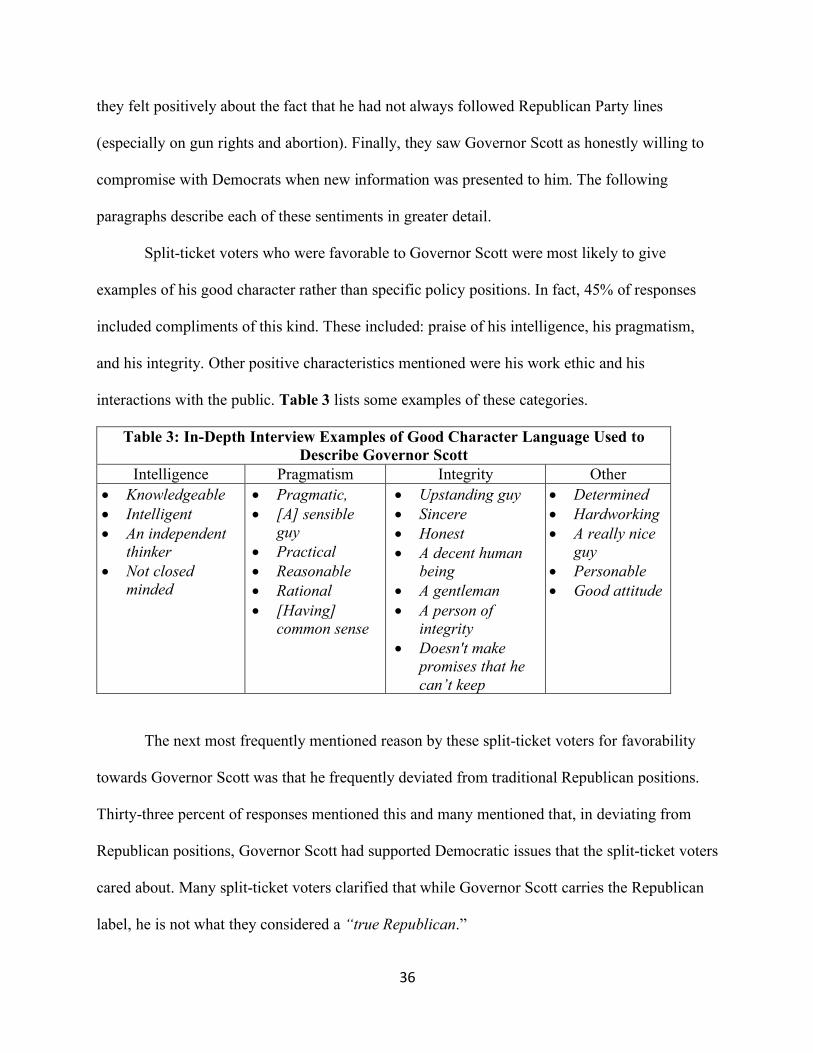
36
they felt positively about the fact that he had not always followed Republican Party lines
(especially on gun rights and abortion). Finally, they saw Governor Scott as honestly willing to
compromise with Democrats when new information was presented to him. The following
paragraphs describe each of these sentiments in greater detail.
Split-ticket voters who were favorable to Governor Scott were most likely to give
examples of his good character rather than specific policy positions. In fact, 45% of responses
included compliments of this kind. These included: praise of his intelligence, his pragmatism,
and his integrity. Other positive characteristics mentioned were his work ethic and his
interactions with the public. Table 3 lists some examples of these categories.
Table 3: In-Depth Interview Examples of Good Character Language Used to Describe Governor Scott
Intelligence Pragmatism Integrity Other • Knowledgeable • Intelligent • An independent
thinker • Not closed
minded
• Pragmatic, • [A] sensible
guy • Practical • Reasonable • Rational • [Having]
common sense
• Upstanding guy • Sincere • Honest • A decent human
being • A gentleman • A person of
integrity • Doesn't make
promises that he can’t keep
• Determined • Hardworking • A really nice
guy • Personable • Good attitude
The next most frequently mentioned reason by these split-ticket voters for favorability
towards Governor Scott was that he frequently deviated from traditional Republican positions.
Thirty-three percent of responses mentioned this and many mentioned that, in deviating from
Republican positions, Governor Scott had supported Democratic issues that the split-ticket voters
cared about. Many split-ticket voters clarified that while Governor Scott carries the Republican
label, he is not what they considered a “true Republican.”
37
“I don't consider him a true Republican. If the U.S. Senate is what the Republican Party is, Scott is not a true Republican. He does not blindly follow that. He is a Democratic-Republican rather than a true Republican.” – Female, 60-69, Democrat
Many respondents gave specific examples of the ways that he has deviated from some
traditional Republican positions. The respondents most frequently mentioned his more liberal
positions on gun legislation and abortion—two issues that had recently dominated the political
news in Vermont. Similarly, 27% mentioned that he was willing to compromise (or had been
forced to compromise) with the Vermont legislature and Democrats across the aisle.
“I would like to see him compromise more but I think he has compromised especially in gun control. That shows to me that a pragmatic Republican still exists and he has been less polarizing that our current national politics.” – Male, 50-59, Progressive
Another group of responses were simply generally positive. Twenty three percent of
responses included a simple generic description that Governor Scott was doing a “good job” and
that they simply did not have anything to complain about.
Next, 20% of responses pointed to the feeling that Governor Scott’s approach to
governing considers and cares about all Vermonters not just his base. These Democratic
defectors felt that Governor Scott respects them and other Democrats and Independents as his
constituents just as much as the Republicans in the state. These split-ticket voters mention that he
does this “even though” he is a Republican.
“I don't think he necessarily represents the Republican Party as much as he is
trying to represent all of Vermont.” – Female, 60-69, Independent–Lean
Democrat
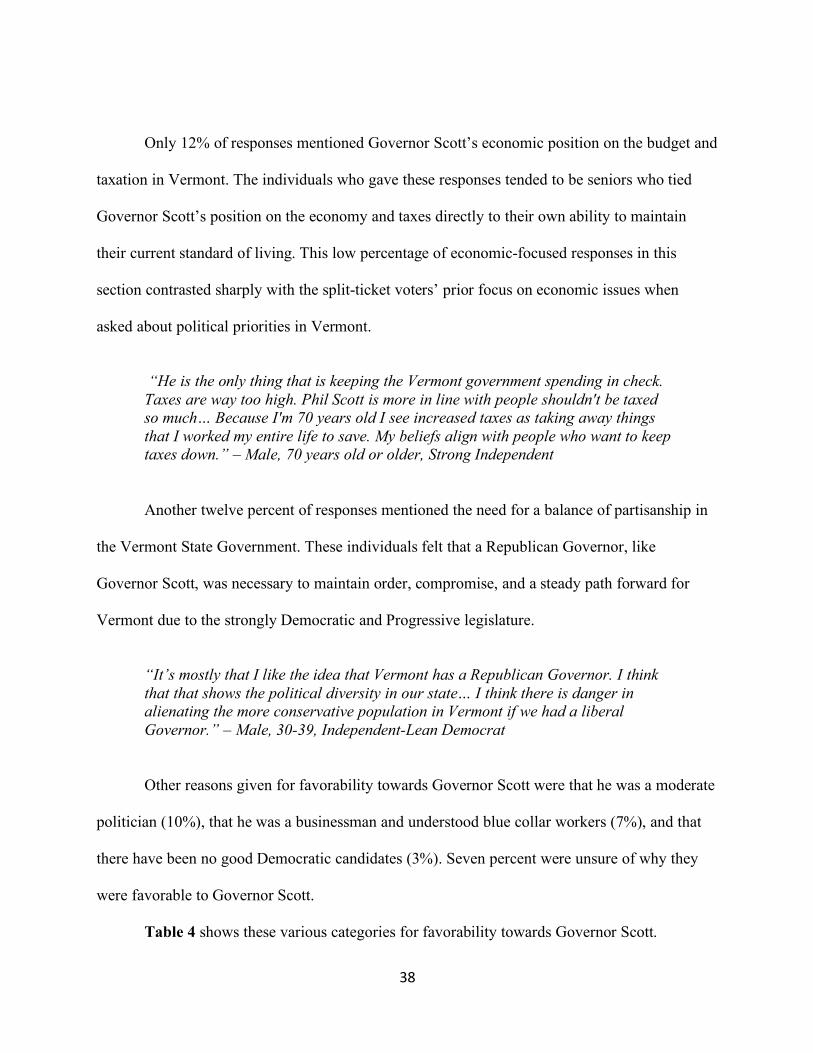
38
Only 12% of responses mentioned Governor Scott’s economic position on the budget and
taxation in Vermont. The individuals who gave these responses tended to be seniors who tied
Governor Scott’s position on the economy and taxes directly to their own ability to maintain
their current standard of living. This low percentage of economic-focused responses in this
section contrasted sharply with the split-ticket voters’ prior focus on economic issues when
asked about political priorities in Vermont.
“He is the only thing that is keeping the Vermont government spending in check. Taxes are way too high. Phil Scott is more in line with people shouldn't be taxed so much… Because I'm 70 years old I see increased taxes as taking away things that I worked my entire life to save. My beliefs align with people who want to keep taxes down.” – Male, 70 years old or older, Strong Independent
Another twelve percent of responses mentioned the need for a balance of partisanship in
the Vermont State Government. These individuals felt that a Republican Governor, like
Governor Scott, was necessary to maintain order, compromise, and a steady path forward for
Vermont due to the strongly Democratic and Progressive legislature.
“It’s mostly that I like the idea that Vermont has a Republican Governor. I think that that shows the political diversity in our state… I think there is danger in alienating the more conservative population in Vermont if we had a liberal Governor.” – Male, 30-39, Independent-Lean Democrat
Other reasons given for favorability towards Governor Scott were that he was a moderate
politician (10%), that he was a businessman and understood blue collar workers (7%), and that
there have been no good Democratic candidates (3%). Seven percent were unsure of why they
were favorable to Governor Scott.
Table 4 shows these various categories for favorability towards Governor Scott.
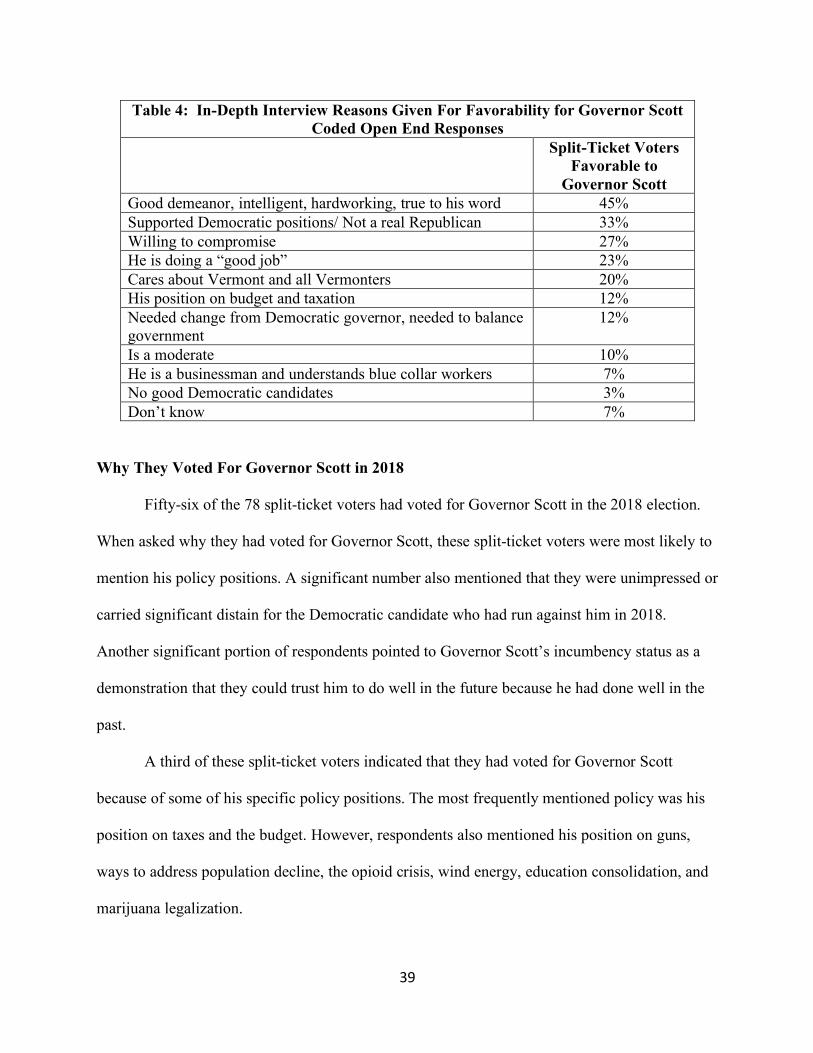
39
Why They Voted For Governor Scott in 2018
Fifty-six of the 78 split-ticket voters had voted for Governor Scott in the 2018 election.
When asked why they had voted for Governor Scott, these split-ticket voters were most likely to
mention his policy positions. A significant number also mentioned that they were unimpressed or
carried significant distain for the Democratic candidate who had run against him in 2018.
Another significant portion of respondents pointed to Governor Scott’s incumbency status as a
demonstration that they could trust him to do well in the future because he had done well in the
past.
A third of these split-ticket voters indicated that they had voted for Governor Scott
because of some of his specific policy positions. The most frequently mentioned policy was his
position on taxes and the budget. However, respondents also mentioned his position on guns,
ways to address population decline, the opioid crisis, wind energy, education consolidation, and
marijuana legalization.
Table 4: In-Depth Interview Reasons Given For Favorability for Governor Scott Coded Open End Responses
Split-Ticket Voters Favorable to
Governor Scott Good demeanor, intelligent, hardworking, true to his word 45% Supported Democratic positions/ Not a real Republican 33% Willing to compromise 27% He is doing a “good job” 23% Cares about Vermont and all Vermonters 20% His position on budget and taxation 12% Needed change from Democratic governor, needed to balance government
12%
Is a moderate 10% He is a businessman and understands blue collar workers 7% No good Democratic candidates 3% Don’t know 7%
40
“He does support jobs in Vermont. he wants to keep people in Vermont. He
supported paying people to come into Vermont. I thought that was creative and I
think we need that.” – Male, 60-69, Democrat
Interestingly, the next most frequently given reason for voting for Governor Scott in 2018
was that Christine Hallquist, the Democratic nominee for Governor, was not a good candidate. A
full quarter of responses mentioned her inadequacy in some form. Objection to her ranged from
some of her specific policy positions with which they disagreed (for instance, that she was a
“corporate democrat”) to insults and questions about whether her gender transition indicated an
inability to be Governor of Vermont.
“I listened to the debate and he just made more sense. Christine Hallquist really blew it. She was totally out of it. She came down on him about who he had voted for and he said he would write it in [rather than saying Trump.] She didn't do her homework.” – Female, 60-69, Democrat These split-ticket voters’ familiarity with Governor Scott also seemed to benefit him in
2018. Sixteen percent of responses simply mentioned that they were familiar with him and his
work as Governor. One respondent stated outright that their vote was driven by “the incumbent
thing.” Another respondent talked about the fact that Governor Scott had high name recognition
and that she liked that she had, “seen him out there… in the community.”
Fourteen percent of responses used generic terminology to describe Governor Scott. In
addition, only a few responses mentioned the fact that Governor Scott was willing to
compromise (5%) and that having a Republican Governor balances out the Democratic
legislature (4%).
41
“No specific policies. He comes across as being genuine and truthful.” – Female,
60-69, Independent-Lean Democrat
Interestingly, nineteen percent of respondents were unsure or said that they didn’t
remember why they had voted for Governor Scott in 2018. This could be an indication that split
ticket voters relied on his high name recognition. Alternatively, Hallquist was the, “first
transgender candidate to be nominated for a governorship by any major party”70 and there may
have been some discomfort talking about her candidacy.
Table 5 shows the various reasons given for a 2018 vote for Governor Scott.
Table 5: In-Depth Interview Voting for Governor Scott Coded Open End Responses
Split-Ticket Voters Who Voted for Governor Scott in 2018
Specific policy agreement 33% Christine Hallquist was not a good candidate 25% Incumbency benefits: name recognition, solid performance, no big bad changes
16%
He is a good guy 14% Willing to compromise 5% Able to balance the Democrats in the legislature 4% Don’t know 19%
Why They Are Likely to Vote for Governor Scott In 2020
Seventy-six percent of split-ticket voters indicated that they were either somewhat or very
likely to vote for Governor Scott in 2020. When these respondents were asked why they were
likely to vote for Governor Scott, a small but significant shift emerged in their answers. While
Governor Scott’s policy positions and his track record in the office were major points brought
forward by the respondents, a plurality of respondents qualified their answer with the fact that
70 Jess Bidgood, “Christine Hallquist, a Transgender Woman, Wins Vermont Governor’s Primary.”
42
their vote in 2020 could largely depend on the Democratic candidate who would be running
against Governor Scott.
Twenty-eight percent of these split-ticket voters said that their decision in 2020 would
depend on the candidate or candidates who run against Governor Scott. Some mentioned specific
candidates who they would rather vote for, while others spoke in more generalities.
“Depends who he is running against. I pick character over party in Vermont. We
can do that here we are lucky.”- Female, 50-59, Progressive
Twenty-six percent of these split-ticket voters mentioned Governor Scott’s policy
proposals, especially his stance on taxes and the economy. Those that mentioned policies were
largely concerned with spending in Vermont and drew a direct connection between Governor
Scott’s policy positions on the economy and taxes with their own bottom line. Other’s used the
question as an opportunity to talk not only about the policies that he supported but those that they
would want him to support more. The largest subset of this group of split-ticket voters were
those who mentioned the need to continue to hold firm in his position on the state budget, the
economy, and especially keeping taxes low.
“[I would want him] to continue to try to make the state more affordable. At my age, I knew more people I grew up with who are moving out of the state and the primary reason is that they can’t afford to live here in their retirement years. There are too many elected officials who don't live month to month on that fixed income. I have lived here my whole life and we are thinking about moving because in a handful of years I won’t be able to pay for my standard of living. I will either have to go back to work or move elsewhere.” – Male, 60-69, Strong Independent
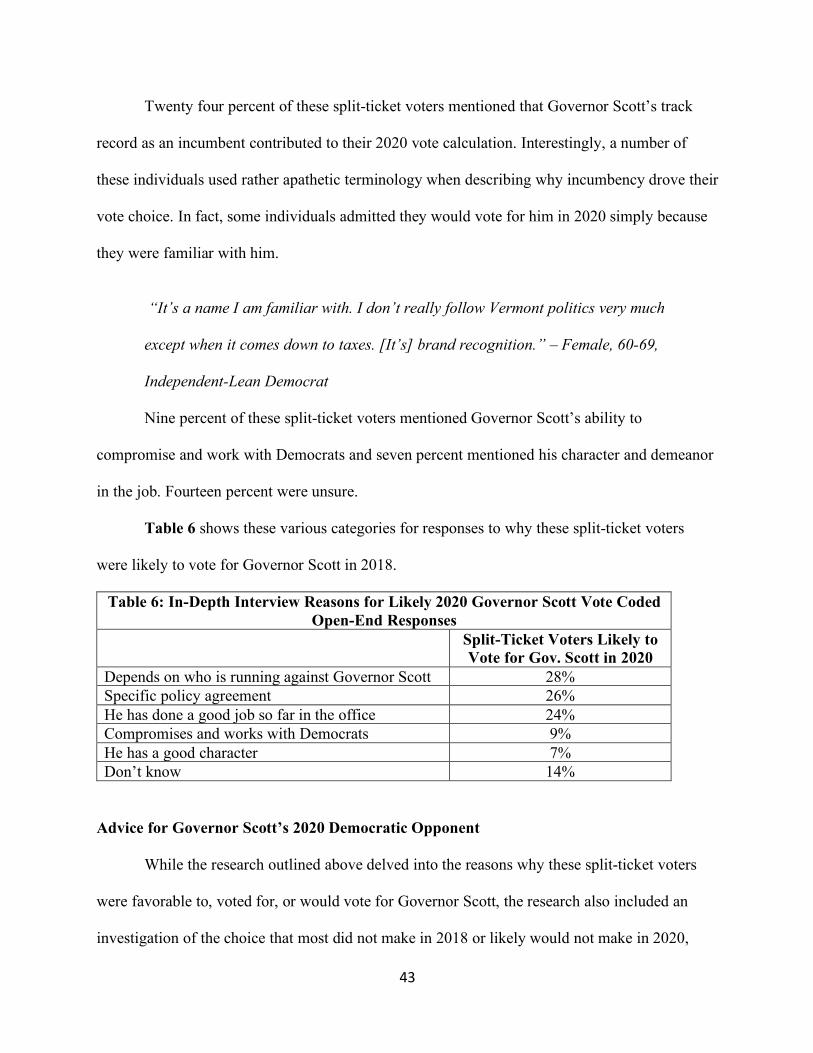
43
Twenty four percent of these split-ticket voters mentioned that Governor Scott’s track
record as an incumbent contributed to their 2020 vote calculation. Interestingly, a number of
these individuals used rather apathetic terminology when describing why incumbency drove their
vote choice. In fact, some individuals admitted they would vote for him in 2020 simply because
they were familiar with him.
“It’s a name I am familiar with. I don’t really follow Vermont politics very much
except when it comes down to taxes. [It’s] brand recognition.” – Female, 60-69,
Independent-Lean Democrat
Nine percent of these split-ticket voters mentioned Governor Scott’s ability to
compromise and work with Democrats and seven percent mentioned his character and demeanor
in the job. Fourteen percent were unsure.
Table 6 shows these various categories for responses to why these split-ticket voters
were likely to vote for Governor Scott in 2018.
Table 6: In-Depth Interview Reasons for Likely 2020 Governor Scott Vote Coded Open-End Responses
Split-Ticket Voters Likely to Vote for Gov. Scott in 2020
Depends on who is running against Governor Scott 28% Specific policy agreement 26% He has done a good job so far in the office 24% Compromises and works with Democrats 9% He has a good character 7% Don’t know 14%
Advice for Governor Scott’s 2020 Democratic Opponent
While the research outlined above delved into the reasons why these split-ticket voters
were favorable to, voted for, or would vote for Governor Scott, the research also included an
investigation of the choice that most did not make in 2018 or likely would not make in 2020,
44
voting for Governor Scott’s Democratic opponent. Therefore, the split-ticket voters were asked
to “give advice” to a Democratic candidate running for Governor in 2020. This specific approach
of asking for “advice” was used to maximize honest answers rather than putting the respondents
on the defensive by asking “why they had not” voted for the Democratic nominee in 2018. The
results indicated that these split-ticket voters cared very much about which issues the Democratic
governor candidates take on. They believe in many progressive issues but want to ensure that a
candidate’s more liberal issues are balanced with fiscal restraint. Many also want a candidate
who is honest and truthful, and who cares about and listens to Vermonters.
Forty percent of these split-ticket voters mentioned a certain favorite policy when asked
what advice they would give to a prospective Democratic candidate for governor. Once again,
the economy, employment, and lowering taxes rose to the top. Twenty-six percent of responses
included mentions about Democratic candidates needing to be more fiscally sound in terms of
the Vermont budget, economy, employment, and taxes. Twenty-four percent of total responses
included mentions of progressive issues like healthcare, taking care of the environment, raising
the minimum wage, and climate change. However, some responses included overlap between
socially liberal and fiscally conservative policy ideas. This indicates that many split-ticket voters
were supportive of more Democratic and progressive policies, but recognized that choices need
to be made in order to maintain a balanced budget.
“Stick to the basics. No pie in the sky stuff. I like minimum wage and Medicare For All but pick one of those pieces. I think we need to raise minimum wage. If they are going to do something stick to something that is meaningful to the majority of Vermonters. Things that are tangible. Stick to the economy and wages.” Male, 60-69, Democrat
45
Twenty-one percent of responses mentioned the need for the Democratic candidate to be
more moderate, more realistic, and to avoid “fringe issues” that could tend to isolate more
moderate voters. However, a couple or respondents qualified that this was largely dependent on
which issues they were talking about.
“Stop talking to specific groups only. That is the downfall of the progressive agenda. You are looking at the small group of progressives and that makes everyone else feel left out. That is not a good idea.” – Female, 50-59, Strong Independent
Eighteen percent of these split-ticket voters wanted the candidate to be genuine, honest
and truthful. Some of these respondents pointed to national politics as an example of a path that
they did not want Vermont politics to go down. In addition, 17% included the need for the
Democratic candidate to connect with and listen to every day Vermonters.
“The state of Vermont does not end at Rutland and White River Junction. Southern Vermont is the stronghold of the Democrats. in 2016 and 2018 the candidate for governor came to Billows Falls. When candidates come to our towns and talks to us that makes a difference. It is critical to me that we see our candidates. Whenever they are in town I take the time to visit them and find out what they are doing.” – Male, 60-69, Democrat
Thirteen percent of responses included a desire for a candidate who would be willing to
compromise with the other side of the aisle and to work with the legislature. Nine percent of
responses mentioned a need for a solid track record. Another eight percent of responses
encouraged the Democratic candidate to be more progressive – sometimes pointing to Senator
Sanders as the example. Ten percent of respondents indicated that they were unsure.
In addition to the findings above, two key insights emerged from the responses to these
questions. Only two respondents indicated that they would hesitate to vote for any Democratic
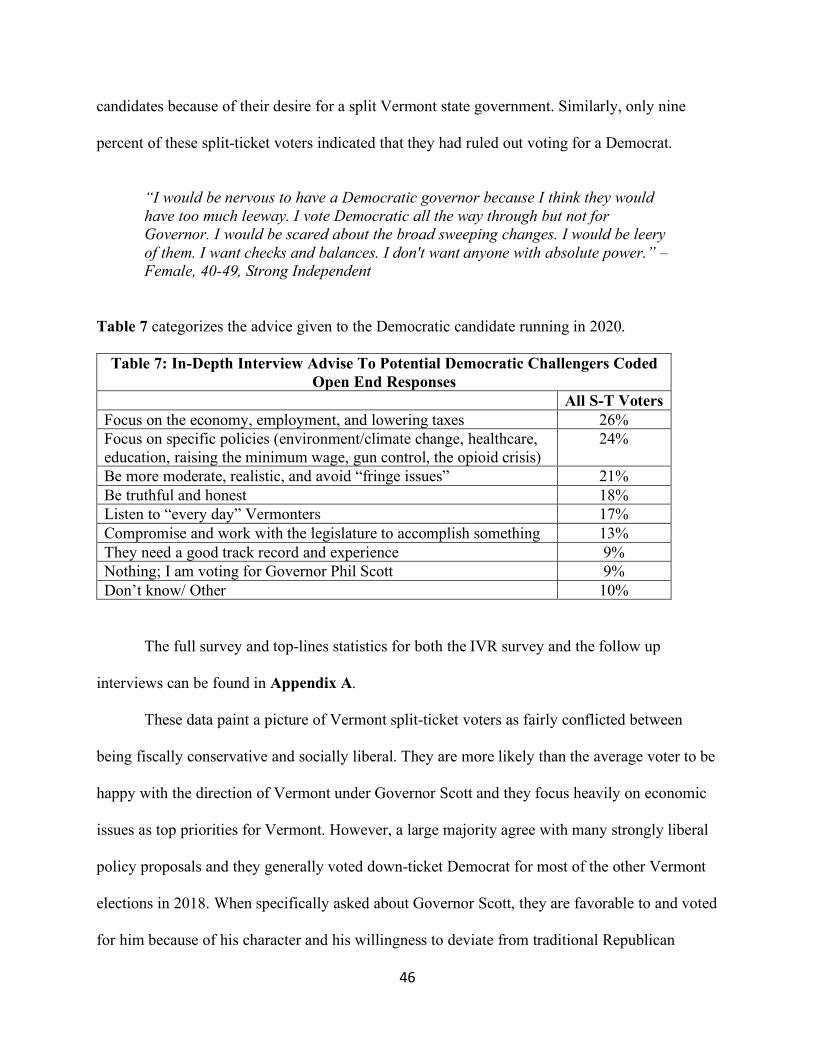
46
candidates because of their desire for a split Vermont state government. Similarly, only nine
percent of these split-ticket voters indicated that they had ruled out voting for a Democrat.
“I would be nervous to have a Democratic governor because I think they would have too much leeway. I vote Democratic all the way through but not for Governor. I would be scared about the broad sweeping changes. I would be leery of them. I want checks and balances. I don't want anyone with absolute power.” – Female, 40-49, Strong Independent
Table 7 categorizes the advice given to the Democratic candidate running in 2020.
Table 7: In-Depth Interview Advise To Potential Democratic Challengers Coded Open End Responses
All S-T Voters Focus on the economy, employment, and lowering taxes 26% Focus on specific policies (environment/climate change, healthcare, education, raising the minimum wage, gun control, the opioid crisis)
24%
Be more moderate, realistic, and avoid “fringe issues” 21% Be truthful and honest 18% Listen to “every day” Vermonters 17% Compromise and work with the legislature to accomplish something 13% They need a good track record and experience 9% Nothing; I am voting for Governor Phil Scott 9% Don’t know/ Other 10%
The full survey and top-lines statistics for both the IVR survey and the follow up
interviews can be found in Appendix A.
These data paint a picture of Vermont split-ticket voters as fairly conflicted between
being fiscally conservative and socially liberal. They are more likely than the average voter to be
happy with the direction of Vermont under Governor Scott and they focus heavily on economic
issues as top priorities for Vermont. However, a large majority agree with many strongly liberal
policy proposals and they generally voted down-ticket Democrat for most of the other Vermont
elections in 2018. When specifically asked about Governor Scott, they are favorable to and voted
for him because of his character and his willingness to deviate from traditional Republican
47
positions. However, these split-ticket voters are not set on voting for Governor Scott in 2020 and
are relatively open to a Democratic opponent, depending on his or her issue-focus. It is clear that
Governor Scott is a popular Governor and has a relatively strong hold on the governorship.
While Vermonters elected a divided state government in 2018, if the 2020 election had been
decided by these split-ticket voters in a coronavirus-free environment, a strong Democratic
candidate may have endangered Governor Scott’s position as the only Republican statewide
official in Vermont.
DISCUSSION
Most theories about split-ticket voting use aggregate data to find correlations between
split-ticket voting and potential motivations. The methodology used in this research does not
allow such broad sweeping statements. However, it does enable the testing of Vermont split-
ticket voters’ stated reasons for splitting their tickets against some of the more prominent
theories.
The most striking outcome of this research is that there was little evidence of the
Balancing Theory. Only two individuals of the seventy-eight Vermont split-ticket voters
indicated that they had voted for Governor Scott to “balance” the Democratic legislature.
“I favored him over Hallquist because I thought he was moderate on issues and
would balance against a Democratic legislature”- Male, 50-59, Independent-
Lean Democrat
In contrast, there was far more support for the Sincere Voting Model. While this theory is
generally used to talk about the differences between presidential and congressional split-ticket
48
voting, the theory can easily be adjusted to the differences between gubernatorial and
congressional split-ticket voting. In both instances, voters are considering an executive in
addition to members of Congress. These are two very different and distinct roles. This theory
argues that, “Offered two presidential candidates, voters choose the one they think more likely to
keep taxes low and defense strong and to govern competently. Offered two House candidates,
voters choose the one they think more likely deliver local benefits and to protect their favorite
programs”71
The results indicate that this may have been a frequent calculation made by these
Vermont split-ticket voters. The Vermont split voters’ answers correlated significantly with a
Sincere Voting Model’s prediction that economy and taxation play a larger role in electing an
executive. When asked in an open-end format about their policy priorities for Vermont, the vast
majority of split-ticket voters immediately spoke about the Vermont economy, taxes, and
keeping people and jobs in Vermont. Similarly, when asked why they had voted for Governor
Scott in 2018 or would vote for Governor Scott in 2020, many immediately mentioned his stance
on taxes and the budget. Thus, many of these split-ticket voters sincerely believed that a vote for
Governor Scott was in line with their fiscal vision for the state. While this research did not delve
into the motivations behind the votes for Senate, U.S. House or Lieutenant Governor, there is a
possibility that split-ticket voters used a separate calculation for those races.
“[Governor Scott] does support jobs in Vermont. he wants to keep people in
Vermont. He supported paying people to come into Vermont. I thought that was
creative and I think we need that.” – Male, 60-69, Democrat
71 Jacobson, The Electoral Origins of Divided Government, 119.
49
Cross-pressures that make a voters’ opinions of both parties neutralize any lean in either
direction is termed “ambivalence.” This was somewhat evident in the cognitive dissonance that
emerged when contrasting these split-ticket voters’ stated priorities with their support for many
policies that would invariably lead to higher taxes. They were concerned about their own bottom
line, increased taxes, and the economy. However, these split-ticket voters were also supportive of
some of the most expensive and economy-affecting progressive policies like raising the
minimum wage and Medicare for All unprompted. Therefore, ambivalence may have played a
role in neutralizing the policy draws from both sides. That said, the pattern of down-ticket
Democratic voting and singularly defecting from party line to vote for Governor Scott speaks to
more than mere ambivalence across the board. These voters selected to split-ticket vote for
Governor Scott specifically which points to more of an intentional Sincere Voting Model rather
than ambivalence or ambivalence only within the context of the gubernatorial race.
The split-ticket voting theory of voter Indifference also saw some support in the data, but
it was less evident than the Sincere Voting Model. Almost two-in-ten split-ticket voters were
unsure or could not remember why they had selected Governor Scott over Hallquist in the 2018
election. While there is a possibility that this might be due to measurement error rather than an
honest response, this high a level of “don’t know” responses may indicate that many split-ticket
voters were indifferent about this particular election. A few voters even admitted to indifference
when asked about why they had voted for Governor Scott.
“Honestly nothing comes to mind. Name recognition. Perhaps he was Lieutenant
Governor under a Democrat.” – Male, 40-49, Democrat
50
Interestingly, split-ticket voting in Vermont, a state that is largely considered one of the
most liberal in the country, is already partial evidence against the Partisan Sorting theory of split-
ticket voting. However, the fact that these split-ticket voters identified as moderates (40%) at a
much higher rate than the total voters surveyed (29%) lends some credence to the idea that more
moderate voters who are less extreme or partisan are more likely to split-ticket vote. Many also
pointed to Governor Scott being a moderate as one of the reasons why they were favorable to
him, why they had voted for him in 2018 and why they would likely vote for him in 2020. That
said, as with the Ambivalence theory of split-ticket voting, this theory does not help explain why
voters selectively chose to express their more moderate stances when voting for Governor Scott
and not for a race with a far more liberal Democratic candidate like Senator Bernie Sanders or
Lieutenant Governor David Zuckerman.
“He generally takes moderate positions. Open to compromise, particularly since he was reelected and the composition of the legislature has change. He is not closed minded and is willing to change his view on issues when new information comes forward. He is a bit more conservative than I would like but he is moderate enough that I am generally satisfied.” – Male, 60-69, Democrat
Finally, in the data, there was significant evidence of the power of Incumbency as an
incentive to split-ticket vote. First and foremost, when asked why they were favorable towards
Governor Scott, 45% included compliments of his character, mentioned they had “met him
before,” and knew information about his activities out of work. (“I like that he is a race car
driver.”) This demonstrated that Governor Scott has benefitted from being a more familiar face
and having been in office and around Vermont communities. These split-ticket voters had been
exposed to Governor Scott for a substantial period of time and this exposure has prompted
51
favorable opinions of Governor Scott, specifically in regards to his character, and that he “listens
to all Vermonters.”
These positive views and Governor Scott’s high name recognition lead these split-ticket
voters to articulate that they have been and are willing to give Governor Scott the benefit of the
doubt. Specific responses where the split-ticket voters talk about Governor Scott not being great,
but also not shaking the boat too much firmly corroborates Feld and Grofman’s theory of
“benefit of the doubt” that falls under the Incumbency Advantage theory. The fact that a
significant number of these split-ticket voters see Governor Scott as a moderate or “not a real
Republican” also aligns with the findings that the insulating effects of benefit of the doubt are
magnified the closer the incumbent’s positions are to the “center” or median voter. The split-
ticket voters’ negative reactions to the Democratic candidate Hallquist also corroborated much of
the academic work that finds that amateur, and therefore less appealing, candidates tend to run
against strong incumbents. Christine Hallquist’s lack of any prior electoral experience, in
addition to her poor performance in the debates and on the campaign trail closely fit this
Incumbency Advantage theory.
“He is doing alright. I like him. I don’t know how I would want him to change.
Keep what he is doing.”- Female, 50-59, Democrat
It is clear from the comparison between this research on Vermont split-ticket voters and
the larger political theories on split-ticket voter motivation that elements of truth exist within
most theories of split-ticket voting. There were a few split-ticket voters who fit each model, the
Balancing Theory, the Ambivalence and Indifference theories, and the Partisan Sorting Theory.
52
However, these Vermont split-ticket voters show far more evidence of the Sincere Voting Model
and Incumbency Advantage theories.
CONCLUSION
Split-ticket voting has declined in recent years. The 2018 midterms were no exception.
However, this was not universally the case. In both 2018 and 2020, Vermont experienced
significant split-ticket voting in the form of Democratic defection. In 2018, Vermont elected
Democratic Socialist Senator Bernie Sanders, Democrat Representative Peter Welch, and
Progressive Democrat Lieutenant Governor David Zuckerman, as well as a veto proof majority
for Democrats and Progressives in the Vermont State Legislature. Last but not least, Vermonters
also elected Republican Governor Phil Scott by a substantial margin. This grouping of elected
officials has resulted in considerable cooperation, negotiation, and compromise between
Vermont’s Republican governor, the Democratic legislature and federal delegation. The
legislature’s stated goals were, in many cases, moderated, and Governor Scott has deviated from
the Republican line in many instances. In other words, Vermont’s political environment reflects
the type of situation that many people wish for across the country. This research into split ticket
voting in Vermont, allows us to see what has driven this type of voting and therefore, how it
could potentially happen in other areas across the country.
A review of the prominent academic theories on split-ticket voting demonstrates a wide
variety of possible split-ticket voting motivations. However, only a couple theories are strongly
upheld by the results from interviews of Vermont split-ticket voters. These Vermont split-ticket
voters are voting sincerely when they select more liberal members of Congress and their state
legislature in addition to a Republican governor. They believe in many of the liberal ideas that
53
the federal and state legislature is considering. However, they are ultimately concerned about
their own bottom line when it comes to the Vermont economy and their state taxes. In addition,
despite Governor Scott’s being a Republican, these split-ticket voters were willing to give him
the benefit of the doubt largely because they feel that they know him personally as a genuine and
well-meaning individual. The voters are also able to compare Scott favorably (and more
liberally) to other Republicans, which helps them separate his Republicanism from national
Republicans like then-President Donald Trump and Senator Mitch McConnell.
For individuals attempting to replicate this type of split ticket voting in other states and
across the country steps could be taken to duplicate portions of the environment here in Vermont
by creating more in-person connection with voters and creating space between gubernatorial or
other in-state candidates other external national figures of the same party.
This research on Vermont split-ticket voters allows us to determine which motivations
played a larger role for Vermonters in this election, how a Republican governor was able to win
Vermont, and it also gives us insight into how candidates and parties could encourage split ticket
voting in other states.
54
CHAPTER 2: THE REALITY OF MULTIPARTY POLITICS IN
AMERICA: THE VERMONT PROGRESSIVE PARTY AND ITS
FORTY-YEARS OF SUCCESS
INTRODUCTION
In 1981, Bernie Sanders became the mayor of Burlington Vermont by a margin of ten
votes. His victory set into motion a political movement in Vermont that led to the emergence and
continued presence of the most successful third party in the country: The Vermont Progressive
Party. The Vermont Progressive Party website proudly states: “For nearly 40 years, an unbroken
stream of Progressives have served on the Burlington City Council and Vermont legislature.”72
Currently, nine members of the Vermont state legislature identify as Progressives first, another
seven identify as Progressive second.73 The Progressive Party also currently holds a majority on
the Burlington City Council.74 To give perspective to this success: currently, from members of
congress to state legislatures across the country, there are 46 elected individuals who do not
identify with a party, 33 of them are independents who range from liberal to conservative, 9
members of the Vermont Progressive Party, and the remaining four identify with three different
third parties.75
72 The Vermont Progressive Party, “Elected Progressives,” accessed February 18, 2021, https://www.progressiveparty.org/elected-progressives. 73 Ibid; Due to the existence of fusion candidacies in Vermont, elected officials can elect to be a part of more than one party. The party an elected individual puts first is considered to be their “primary” party. 74 The City of Burlington, “City Council,” accessed February 18, 2020, https://www.burlingtonvt.gov/CityCouncil. 75 Ballotpedia, “Current independent and third-party federal and state officeholders,” Accessed May 3, 2021, https://ballotpedia.org/Current_independent_and_third-party_federal_and_state_officeholders. Officeholders from non-states were not included in this calculation.
55
Unlike the majority of other democracies around the world with multiparty systems, the
United States has an entrenched two-party system. Scholarly work has laid out clear reasons why
the political structure of our government encourages two major parties – and discourages third
parties. It has also investigated various ways in which third parties can succeed, in many
instances, using the Vermont Progressive Party as an example. However, no analysis has
investigated the evolution of a single third party over an extensive period of success – what that
party looks like over time, who is drawn to that party, and how a third party continues to be
successful in the face of continued institutional barriers to success.
Learning more about the Vermont Progressive Party allows us to learn more about third
parties in our political party system and what could be the case around the country if more
political party options were presented. For members of third parties across the country, the
Vermont Progressive Party can also present some guidance, not only on how to overcome
barriers to gain electoral success, but to maintain that success. Lastly, an investigation of the
Vermont Progressive Party’s success enables us to ask the questions: How do we define third
parties? Where does the line blur between being a part of a third party or a major party?
LITERATURE REVIEW
Scholars have investigated the rise and fall of political parties in the United States of
America from the framer’s conversations about emerging factions,76 to books published in 2020.
A significant amount of energy is spent disabusing readers that the United States has only two
76 See: James Madison, “Federalist 10,” Congress.gov Resources, 1787, https://www.congress.gov/resources/display/content/The+Federalist+Papers#TheFederalistPapers-10; and George Washington, “Transcript of George Washington’s Farewell Address,” OurDocuments.gov, 1796, https://www.ourdocuments.gov/doc.php?flash=false&doc=15&page=transcript
56
successful parties. The history of third parties in this country is frequently described.77 While
third parties have rarely achieved electoral success, Hicks argues “What is of infinitely greater
consequence is the final success of so many of the principles for which they have fought.”78
In addition to uplifting third party success, much literature speaks to institutional factors
that contribute to why the United States has an entrenched two-party system that disincentivizes
third parties. 79 A consistent theme presents the fact that the two parties do not fully represent the
political positions of the public80 and that many disapprove of their party options.81
The largest institutional element in creating a two-party electoral system and,
consequently, the largest hurdle to third parties is winner-take-all elections. Duverger’s Law
contends that, “the simple-majority single-ballot system favors the two-party system.”82 Scholars
frequently reference this law in their work.83 They also contrast this winner-take-all form of
elections with proportional elections in other democracies.84
77 See: David Gillespie, Challengers to Duopoly (Columbia: University of South Carolina Press, 2012); and Eric Chester, True Mission: Socialists and the Labor Party Question in the U.S. (Sterling: Pluto Press, 2004). 78 John Hicks, “The Third Party Tradition in American Politics,” The Mississippi Valley Historical Review, 20(1) (1933): 3-28, http://www.jstor.org/stable/1902325; See also Jonathan Martin, Empowering Progressive Third Parties in the United States: Defeating Duopoly, Advancing Democracy (New York: Routledge, 2016), 5. 79 See: Steven Rosenstone, Roy Behr, and Edward Lazarus, Third Parties in America, 2nd ed. (Princeton: Princeton University Press, 1984), p11; and Theresa Amato, Grand Illusion: The Myth of Voter Choice in a Two-Party Tyranny (New York: The New Press, 2009). 80 Gerald Pomper, Elections in America: Control and Influence in Democratic Politics (New York: Dodd, Mead & Company, 1968), 45; Lee Drutman, Breaking The Two Party Doom Loop (New York: Oxford University Press, 2020), 150. 81 Pomper, Elections in America, 5; Stokely Carmichael and Charles Hamilton, Black Power: The Politics of Liberation in America (New York: Vintage, 1967), 42; and John Bowden, “62 percent say third political party is needed in US,” The Hill, February 15, 2021, https://thehill.com/blogs/blog-briefing-room/news/538889-62-percent-say-third-political-party-is-needed-in-us?fbclid=IwAR2R40EU3pHgMw8CBOysr6HbZOzqTSdrugkw7pge6IIIBZCD8meobucXmzg. 82 William Riker, “The Two-Party System and Duverger's Law: An Essay on the History of Political Science,” The American Political Science Review, 76(4), (1982): 753-766. 83 Paul Herrnson, “Two-Party Dominance and Minor-Party Forays in American Politics,” in eds. Paul Herrnson, and John Green, Multiparty Politics in America, 2nd ed. (Lantham: Rowman & Littlefield Publishers Inc., 2002), 12. 84 David Reynolds, Democracy Unbound: Progressive Challenges to the Two Party System (Boston: South End Press, 1997), 269.
57
Scholars argue that the winner-take-all system also creates the “spoiler effect” or
“strategic voting.”85 Amato writes: “Spoiler logic is rooted in an insidious assumption – that the
two major parties own the votes and voters.” She argues: “based on this assumption, including
any third party or independent is invariable a zero-sum proposition. It is intruding on the major
parties’ playing field, rather than expanding the electorate.”86 Thus, much literature that theories
and explains how third parties could be successful considers how third parties and third-party
candidates can avoid being seen as a spoiler.87
Scholars also point to finances and institutional capacity as aspects of the United States
electoral system that support only the two major parties. Schraufnagel argues: “third parties do
not have the same financial resources as the two major political parties”88 and lack of resources
invariably leads to failure.89 Institutional financial impediments also deter third party
development. Bennett gives the example: “Under the Federal Election Campaign Act of 1974,
Republicans and Democrats… were eligible to receive a grant of $2 million to cover the costs of
their quadrennial convention. Minor parties could receive a fraction of this amount.”90
Compounding on these hurdles, scholars point to media coverage as another institutional
impediment.91 Gillespie describes, “the mainstream media’s flagrant neglect of third-party and
independent campaigns and its clear preference for covering the two-party contest”92 hinders
85 Drutman, Breaking The Two Party Doom Loop, 259. 86 Theresa Amato, “Beyond the ‘spoiler’ myth,” in Empowering Progressive Third Parties in the United States, ed. Martin, 117. 87Terry Bouriches, Building Progressive Politics: The Vermont Story (Madison: Center for a New Democracy, 1993), 39. 88 Scot Schraufnagel, Third Party Blues: The Truth and Consequences of Two-Party Dominance (New York: Routledge, 2011), 2. 89 Ibid. 90 James Bennet, Not Invited to the Party: How the Demopublicans Have Rigged the System and Left Independents Out in the Cold (New York: Springer, 2009), 133. 91 See: Bernard Tamas, The Demise and Rebirth of American Third Parties (New York: Routledge, 2018), 146. 92 David Gillespie, Challengers to Duopoly (Columbia: University of South Carolina Press, 2012), 19.
58
third party growth. Lack of media coverage compounds: “the major criterion for most forms of
media exposure is ‘electability’ which minor parties are hard-pressed to demonstrate. Of course,
the electability standard can become a self-fulfilling prophesy, with lack of attention dooming
minor parties to a poor finish”93
Finally, many scholars point to some institutional rules implemented by the two major
parties that create hurdles for third party development.94 Piven describes: “the major parties have
colluded in the development of an array of additional legal obstructions to ward off pesky
challengers.”95 These include raising qualifications for third parties,96 especially ballot access
laws.97 Some scholarly work also investigates the adoption of the Australian ballot as an
institutional impediment to third parties.98
Scholars also investigate the role that third parties play in American politics. For
example, third parties are frequently mentioned around political realignment – the process by
which parties shift and/or are replaced by third parties to accommodate changes in public opinion
or the emergence of a new prominent issue. In these analyses, third parties are considered merely
a part of the process that either ends with realignment or does not. For instance, the Minnesota
Farmer-Labor Party is seen as “one of the most successful progressive third-party coalitions in
93 Diana Dwyre and Robin Kolodny, “Barriers to minor-party success and prospects for change,” in Multiparty Politics in America, eds. Herrnson and Green, 170; See also: Reynolds, Democracy Unbound, 54. 94 See: David Gillespie, Politics at the Periphery: Third Parties in Two-Party America, (Columbia: University of South Carolina Press, 1993); and Theodore Lowi, “Toward a More Responsible Three-Party System: Deregulating American Democracy,” in The State of the Parties: The Changing Role of Contemporary American Parties, 4th ed., eds. John Green and Rick Farmer (Lantham: Rowman & Littlefield, 2003), 354. 95 Frances Piven, Challenging Authority: How Ordinary People Change America (New York: Rowman & Littlefield Publishers, Inc., 2006), 6. 96 Walter Dean Burnham, Critical Elections and the Mainsprings of American Politics (New York: W. W. Norton & Company Inc., 1970), 94. 97 John Bibby and Sandy Maisel, Two Parties – or More?: The American Party System, 2nd ed. (Boulder: Westview Press, 2003), 70. 98 See: James Bennet, Not Invited to the Party: How the Demopublicans Have Rigged the System and Left Independents Out in the Cold (New York: Springer, 2009), 3; and Schraufnagel, Third Party Blues, 33.
59
American history.”99 The party grew in influence and was successful at electing numerous
candidates to political office, and twenty years after its inception, agreed to merge with the
Democratic Party. Using this and others as examples. Sundquist believes that there is no
realignment process in which a multiparty system emerges.100 Sundquist explains: “At no time in
the history of this country has there been a sustained period of multiparty competition. Third
Parties have come on the scene but only briefly; the new party has replaced an existing party as
one of the major parties or it has been absorbed by an existing party or it has faded away.”101
Third parties are also described as vehicles for voters to express their preferences and
concern with the two major parties. Rosenstone, Behr and Lazarus state: “Three motivations
prompt people to vote for a third party. Citizens do so when they feel the major parties have
deteriorated so much that they no longer function as they are supposed to, when an attractive
third-party candidate runs, or when they have acquired an allegiance to a third party itself.”102
Expanding on this idea, Chressanthis finds, “people who vote for third parties do so under
similar motivations as people who vote for the major parties.”103 These are not wholly protest
votes: “votes for third parties represent the transmission of individual preferences by people who
believe that their vote is important and that in the aggregate their signal may be interpreted as a
signal to alter the direction of current policies as run by the major parties”104
99 Tom O’Connell, “Minnesota Farmer-Labor Party, 1924-1944” Mnopedia, April 23, 2021, https://www.mnopedia.org/minnesota-farmer-labor-party-1924-1944. 100 James Sundquist, Dynamics of the Party System: Alignment and Realignment of Political Parties in the United States, Revised Edition, (Washington, D.C.: The Brookings Institution, 1983), 38. 101 Ibid. 102 Rosenstone, Behr, and Lazarus, Third Parties in America, 126-7 103 George Chressanthis, “Third party voting and the rational voter model: Empirical evidence from recent presidential elections.” Public Choice, 65 (1990): 189-193. 104 Ibid.
60
Some work also investigates the motivations of third party candidates. Looking
specifically at presidential races, Rosenstone, Behr, and Lazarus argue that third party
challengers “emerge when they perceive weakness in the two major parties. They run either
when the major parties have disappointed a large minority faction, when the parties do not pay
sufficient attention to the issues of concern to the voters, when there is an incumbent president
on which to focus discontent, or when the previous election suggest that one major party may be
too weak or too large to hold its supporters together.”105 To Rosenstone Behr, and Lazarus, third
party affiliation for candidates is a political move that is initiated by the major parties’ failure.
They argue: “A politician will not even contemplate a third party run until the major parties force
him to.”106
In contrast, other scholars point to issue-based reasons for third-party affiliation.
Gillespie argues, “Purists dominate the ranks of many minor parties, and even when leavened by
the presence and influence of some pragmatists, a party may hold that its commitment to creed or
devotion to defining issues is more important than winning elections.”107 Affiliation is not a
political calculus, but is instead inflexible and electorally harmful: “Minor party candidates tend
to hold firm ideological convictions. Most reject pragmatic strategies that might build broader
support for their party”108 This analysis is derived from Lasswell’s Psychopathology and
Politics:
“Among political figures there are two distinct personality types: political agitators and political administrators. Political administrators are pragmatic, goal-centered people who are most successful, and gratified personally, in position of governmental leadership and influence. Political agitators are more rigid people who invest their psychic energies in a mission or cause. They frame their political appeals in emotion and exhortative
105 Rosenstone, Behr, and Lazarus, Third Parties in America, 203. 106 Rosenstone, Behr, and Lazarus, Third Parties in America, 194. 107 Gillespie, Challengers to Duopoly, 42. 108 Herrnson and Green, eds. Multiparty Politics in America, 82.
61
language, and they vilify their adversaries as enemies of the good. Gratification for political agitators comes in the heat of the political contest, the struggle, rather than in the daily routine of governing.”109
There is a relative consensus that third parties are made up of “agitators” rather than
“administrators” and that this works to the parties’ detriment. This is the basis for much advice
given to third parties to help electoral success: “U.S. progressive third party movement is more
likely to succeed if it channels its idealism and sense of urgency into an approach to gaining
power that is pragmatic, yet is also farsighted and dynamic.”110
The Vermont Progressive Party’s success is also mentioned as a third party that has been
able to achieve success.111 These works mention the unique political environment including: the
lack of a major party challenger to the incumbent Democratic mayor when Bernie decided to run,
a media that covered Bernie as a legitimate challenger, and the small population of Burlington.
There are also entire pieces of academic writing that wholly focus on the emergence of
the Progressive Party in Vermont. Guma’s The People’s Republic focuses on Sanders, his
campaigns, and his decisions as mayor of Burlington. Guma’s underlying analysis rests on the
realignment theory. He describes the political environment that led to the unlikely Sanders
victory and investigates the ensuing “revolution” to determine if this was a true realignment.112
The book leaves this question open: “If Sanders is a historic inevitability will the Democrats be
replaced one day by a Progressive Party or merely a permanent campaign machine? Are we
seeing in Vermont the birth of a humanistic socialist movement, or a cult of the charismatic
109Harold Lasswell, Psychopathology and Politics (Chicago: University of Chicago Press, 1930). 110 Jonathan Martin, “Introduction,” in Empowering Progressive Third Parties in the United States, ed. Martin, 6. 111 See: Jonathan Martin, “Introduction” in Empowering Progressive Third Parties in the United States, ed. Martin, 7; See also Gillespie, Challengers to Duopoly, 6 and 44. 112 Greg Guma, The People’s Republic: Vermont and the Sanders Revolution (Shelburne: The New England Press, 1989), 182.
62
hero?”113 There is no discussion of what came to pass: The Progressive Party replacing the
Republican party in Burlington while also growing to be a significant third party in state politics.
Similarly,Bouriches’ Building Progressive Politics, focused on the emergence of the
Progressive Coalition, was published in 1993 and Guma’s The People’s Republic in 1989.
Neither book covers the subsequent decline and reemergence of the Progressive Party in
Burlington, nor its sustained presence in the Vermont legislature for the past three decades.
Bouriches wrote a more recent article entitled “Lessons of the Vermont Progressive Party.”
However, this piece, like his earlier work, focuses on the emergence of the Progressive Party and
the hurdles that hindered Bernie, the Progressive Coalition, and the Progressive Party, not the
Party’s sustained success.114
Senator Sanders’ books Outsider in the House and Our Revolution both describe how
Bernie became involved in politics, his historic election as a “socialist” mayor in Burlington, and
the rise of the Progressive Coalition and the Progressive Party. Sanders describes his motivations
throughout the books: “I was to present Vermont voters with a political perspective from outside
of the two-party system.”115 He also describes the hurdles that third-party candidates face in
electoral politics in the United States: “the perpetual bane of American third parties. ‘I fully
agree with what you’re saying, Bernie’ someone in the audience would invariably tell me after a
debate. ‘but I don’t want to waste my vote on a third-party candidate.’”116 Sanders also uses the
Progressives’ – and his own – success to intimate that third party politics is possible elsewhere:
“If an independent progressive movement could win in America’s most rural state – and until
113 Guma, The People’s Republic, 183. 114 Bouriches. Building Progressive Politics. 115 Bernard Sanders, Outsider in the White House (New York: Verso, 2015), 19. 116 Sanders, Outsider in the White House, 20-1.
63
most recently, one of America’s most Republican – then it might be possible for progressives to
do likewise anywhere in the nation.”117
Ultimately, there is substantial scholarly work on third parties: how they do and can
succeed, why they exist, and case studies on specific parties. The Vermont Progressive Party has
been mentioned by a number of these academic works. However, this past research focuses on
the beginnings of these parties – how they can begin to take hold, overcome obstacles, and
specifically how the Progressive Party in Vermont was able to succeed initially. It has been four
decades since Bernie Sanders won the mayor’s race in Burlington. His victory evolved into the
Progressive Coalition, the Progressive Party, and now four generations of Progressives in
Vermont. The following research investigates the Progressive Party as it is now, how the
members see their past and current success, and what they see in the future of the party.
METHODOLOGY
The data for this paper has been collected from in-depth interviews with 18 individuals
closely associated with the Vermont Progressive Party including Progressive elected officials,
Progressive Party staff, academics, and other Progressive Party activists. Interviews were
conducted between November 6th, 2020 and December 15th, 2020. A full list of the Progressive
Party activists interviewed, their association with the Progressive Party and the questions asked
can be found in Appendix C. Interviews ranged from 30 minutes to over an hour. In addition,
further research compiled from public opinion polls on Vermont Progressive Party can be found
in Appendix D.
117 Sanders, Outsider in the White House, 54.
64
RESULTS
WHY ACTIVISTS SUPPORT THE PROGRESSIVE PARTY
Much has been written about Senator Sanders during his time as mayor, but little research
has looked at who Progressives are and what they care about. Thus, the first question in this
research was: “Why are you a Progressive Party activist?”
A number of key issues immediately emerged. The issues most consistently mentioned
are: eschewing corporate contributions, being a party that works for “everyone,” and fighting for
the drastic action needed for the climate crisis. The sections below break down these issues.
A Party Free of Corporate Influence and Contributions
One of the distinguishing features of the Progressive Party in Vermont is that any
candidate must forgo corporate contributions. To Progressive Party activists, this ensures that
their candidates are not beholden to corporate interests. Progressives also share the goal of
expanding this stance to all political parties across Vermont and the country.118
This is an issue frequently mentioned by the interviewed activists. Carter Neubiser said,
“I can’t in good faith work for a candidate or a party that take corporate money. That was the
first issue for why I supported Bernie... That’s the big differentiator.” Progressive activists see
taking of corporate money as synonymous with corruption, or the potential of corruption. When
describing how he became involved in politics, and with the Progressive Party specifically, City
Councilor Jack Hansen described, “I was pretty jaded by American politics and conventional
politics and the conventional system and the corporate power and the level of corruption.”
118 “We are the only major party that refuses the culture and practice of corporate contributions in politics; we understand that working people are not fully represented in a society that accepts corporate personhood” (The Vermont Progressive Party, “Our Platform,” accessed December 15, 2020. https://www.progressiveparty.org/platform.)
65
To these activists, government should be led by individuals who are beholden only to the
people. Many call for campaign finance reform and publicly financed elections to ensure that
corporations and wealthy individuals also do not hold outsized influence. Barbara Prine stated,
“It’s important to have a Party that stands up for the needs of the people and the planet, not
corporate interests.” This eschewing of corporate contributions is mentioned across the board by
these Progressive Party activists.
A Party That Works for Everyone
Vermont Progressive Party is also supported because of its focus on the economic
wellbeing of average and disadvantaged Vermonters. Activists mention a progressive economic
approach that values workers through a number of issues. Some of the more modern economic
issues included: raising the minimum wage to $15/hour and paid family leave. More long-term
issues included: addressing wealth disparity, the dangers of capitalism, standing up for low
income and disadvantaged people, raising taxes on the wealthy, and being against the economic
“status quo.”
Older Progressive activists were more likely to mention economic issues as a driving
force. Martha Abbott said one of the issues that drew her to involvement with the Liberty Union
Party and the Progressive Coalition and then the Progressive Party was economic priorities. In
the midst of the Vietnam War, she asked herself: “If we weren’t spending all that money on the
military and war, what could we be doing for the humans?” Similarly, Erhard Mahnke believes
Vermont must put “people over profits... Our orientation as a capitalist society is really towards
money and greed and power and corporations are ranked above individuals and we need to
66
reverse that.” In contrast, those in the second and third Progressive generations were more likely
to see economics as secondary to other issues like climate policy.
Addressing the Climate Crisis
For younger generations, addressing the climate crisis with the urgency it deserves is one
of the most prominent issues that connects them to the Progressive Party. City Councilor Hansen
said: “If you look at the [Progressive] Party’s platform and what they stand for – for me, the
most important issue is climate change.”
Progressive Party activists in middle generations talk about climate urgency as part of a
larger view of the platform. Senator Pearson said if he could only pick one issue, it would be
climate change. However, he continued: “they are all wrapped together: climate change, income
inequality, racial justice, Healthcare. All of the issues.” To Pearson, a focus on the economy also
runs through each of these issues and Progressives have been true to that economic mission.
For Progressive activists in older generations, climate activism can be an important
additional issue or sometimes an afterthought. Martha Abbott, who had described the importance
of economic issues in depth then added, “My mother was always an environmentalist. That
became a real important issue to me too.” Her environmental activism working to close the
Yankee Nuclear Power Plant was for supporting the health and safety of the workers in addition
to environmental reasons.
An Alternative to the Two-Party System
Activists also mention their support for the Progressive Party in the context of fighting
for an electoral system that has more than just two options. Megan Polyte’s immediate answer to
67
this question concerned the systemic change that the Progressive Party represents: “I came to the
Progressive Party primarily because I am opposed to the two-party system. If you don’t have at
least three choices it will be the least-worst choice. That is an antithesis to democracy itself.”
Progressive Party elected officials especially spoke to this issue. Both Representatives
Vyhovski and Colburn expressed: “I find the bipartisan system to be problematic.” Former
Lieutenant Governor Zuckerman explained: “I am both attracted to the Progressive Party and the
concept of more than two parties.”
Progressive Party activists believe that the existence of a third party presents specific
benefits to the legislative system: creating room for debate, discussion and movement, and
allowing for legislators to create bi-partisan support for policy that negates the traditional
oppositional model. Zuckerman spoke to both of these elements. First, he explained the space
that a third party creates within the legislative process: “I think our political system with only
two major parties gets polarized. But as soon as there gets more viable choices it broadens the
discussion.” Zuckerman gave specific examples where Progressives’ more liberal stances opened
opportunities for more left-leaning Democrats to move left. For example, his long-term advocacy
around cannabis contributed to passing medical marijuana and paved the way for the legal
market for recreational cannabis. Carter Neubiser also mentioned: “The fact that the Democrats
are talking about $15 minimum wage, climate change, the global warming solutions act, paid
family leave. That is all a result of our organizing from the 90s. We are moving the conversation
in the public and on the ground but also within the Democratic establishment.” Neubiser also
spoke in more combative terms arguing that, “There is a value in a small but significant block
hitting this issue over and over again. It is something that we can use as a lever to push the
68
Democrats. There is also always something hanging over the Democrats – the accountability that
we can find someone and run someone against the worst of them.”
Zuckerman also spoke to the way that Progressives have been able to negate the
traditional oppositional model between the two parties: “Those of us who understand the
Progressive Party don’t see the political landscape as linear. [We see it as] even circular and
scattershot.” He referenced both populism and economic issues that resonate across the
traditional political spectrum that Progressives have made a mainstay in their messaging:
“The Progressive message that I am a part of is one around economic justice, which often if one were to bend the line between two points and connect them, that is where I think there is common ground between the “right” and the “left.” … whether one is on the left or the right on social issues, many are being pushed to the bottom economically. … This is being exploited by the two [traditional] parties.” – Former Lt. Gov. Zuckerman
Similarly, Representative Colburn told an anecdote about a Progressive candidate who
“flipped” a Trump voter because they connected on economic issues and challenging the status
quo. Colburn said that this stems from the Progressive “orientation around economic justice.
[When you] bring people in through the economics there can be clarity and understanding.”
Thus, the Progressive Party is attractive to these activists both because of the left-leaning
issues that the Party represents in addition to the role that the Party plays in changing the
political landscape to one that encourages collaboration rather than opposition.
HOW ACTIVISTS DIFFERENTIATE THE DEMOCRATIC PARTY FROM THE
PROGRESSIVE PARTY
A significant amount of literature around third parties investigates third parties as
separate entities from the two major parties. In Burlington, elected officials follow this
69
traditional pattern where elected officials hold only one party label. However, in the Vermont
state legislature, all sixteen of the individuals who classify themselves as Progressive also carry
the Democratic Party label. Considering this overlap at the state level, but the relative lack of
scholarly research on such overlaps, this researcher wanted to delve into how members of the
Progressive Party differentiate the two parties.
Different Structures
When asked what differentiates the Democratic and Progressive Parties many Progressive
activists point out the structural differences: The Democratic Party is larger, with more
resources, and more statewide and national support.
In contrast, Progressive Party activists see the Progressive Party as more movement-
based and closer to the people. Senator Pollina described: “The commitment of grassroots
organizing to electoral politics… That is important part of being a [Progressive] elected official.”
To be closer to the people, Progressive Party activists argue that the Progressive Party uses in-
person organizing much more and much more effectively than the Democratic Party. This results
in a difference in the perceived power base of each party. Wronski pointed out that “So often
organizations try to keep tight control over their supporters. Instead, we said ‘this is your
organization.’” In contrast, The Democratic Party is seen as being run with a far tighter fist by
the party leadership.
Different Priorities and Focus
Progressive Party activists see the Progressive Party as being focused on the issues above
any candidate and the Democratic Party as being focused on winning above the issues. Martha
70
Abbott described that the Progressive Party’s “primary focus is on issues and organizing around
issues rather than getting specific people elected.”
Progressive Party activists argue that because the Democratic Party is more focused on
winning and being, becoming, or holding onto power, the Democratic Party is less likely to stand
firmly on issues when there is an indication that being principled about that issue may lose them
seats or make future elections more difficult. Mahnke argued, “the mainstream of the Democratic
Party is often unwilling to stand by what I would say should be their principles.” Abbott
explained that it is not that the individuals in the Democratic Party are not dedicated to issues,
but that the focus of the larger party puts the issues on the back burner: “I know that many, most,
people involved in the Democratic party believe in the issues. But I think the underlying
structure creates a problem for people who are very well intentioned. Because the underlying
structure is about the election more than it is about the policy.” Steve Hitgen argued that this
focus on issues versus focus on winning makes the Progressive Party a party fighting for
something, while the Democratic Party is a party fighting against something: “What you see in
the Progressive Party you see a spectrum of people but the goal is not to be anti-Republican but
to advance those principles. Otherwise they would just be Democrats.”
Ultimately, Progressive activists believe that there is something fundamentally wrong
with current the status quo and feel that the Progressive Party’s structure is able to “speak truth
to power.” In contrast, they believe that the Democratic Party is committed to winning through
the status quo which makes Democratic Party leadership less likely to make the changes that
Progressives see as necessary. Throughout the interviews, many Progressives argued that this
leads to a disconnect between the Democratic Party’s stated goals and their willingness to go the
distance to implement those goals:
71
“The Democrats tend to be generally in agreement with [progressive values] but tepid in
execution.” – Senator Chris Pearson
“[The Democratic Party] doesn’t follow through with what is on their platform” –
Representative Emma Mulvaney Stanak
“Democrats don’t follow through with what they say they want” – Barb Prine
“While [Democrats] may still espouse them, they do not implement them through
policy.” – Erhard Mahnke
Platform Differences
Many Progressive activists feel that the platforms of the two parties overlap significantly
– and are becoming more closely aligned. Emilie Krasnow explained that, “The platform of the
Progressives has helped push and change the Platform of the Democratic party. Both platforms
are pretty similar but it was not always like that.” Representative Vyhovski stated,“I firmly
believe that the Dems and Progs agree on the same issues on the surface” and Representative
Colburn pointed out, that it is “increasingly interesting that the platforms are aligning more and
more not less.” Megan Polyte also articulated the similarities in the platform but argued that this
similarity only disguises the differences in priorities and structure mentioned above: “The
platform of the Democratic party is similar in its words. But it didn’t feel as authentic to me.
Even the cleanliness felt exclusionary.”
72
That said, Progressive Party activists do feel that there are some specific issue differences
between the platforms. The Progressive Party platform is seen as going farther and being bolder
on progressive issues. Activists point to issues like climate change, cannabis legislation, and
progressive economic issues as examples of where the Progressive Party takes the issues farther
than the Democratic Party, and specifically the leadership of the party, is willing to go.
Many Progressive activists, and especially those in older generations, argue that the
parties diverge on economic policy. Progressives, they argue, are far closer to working class
Vermonters. Senator Pearson stated that the Progressive Party is “doggedly focused on the
economy and trying to reshape the economy in a way that works for working people and the
middle class.” Erhard Mahnke stated “I wish [Democrats] would stay closer and truer to the roots
of the party to the working class and moderate means… the Democratic party doesn’t seem to be
able to articulate a basic economic message that resonates with working class voters.” In
contrast, Mahnke argues that the Progressive Party is dedicated to continuing to connect with
those working-class Vermonters.
Representative Colburn also argued that the Progressive Party platform is much more
antimilitaristic than the Democratic Party platform: “Our platform is different. It is more explicit
about being anti-militarist.”
Finally, the largest area of divergence is on campaign finance. Many Progressive activists
believe that this is one of, if not the, defining difference between the parties. Prine explained that
Democrats “have never been anti-corporate. They embrace corporations. Maybe they don’t really
mean those principles [but] as long as they continue to embrace corporate money they will
continue to give in.” Hitgen stated that the two parties differ because for the Progressive Party,
“there is also the fundamental commitment to an anti-corporate Democracy.”
73
HOW ACTIVISTS GET INVOLVED IN THE VERMONT PROGRESSIVE PARTY
As intimated above, there are “generations” of activists who have different visions of the
Progressive Party.
1. The Founding Generation
This group of individuals are those who were part of creating the Progressive Party or
whose political involvement began far before the existence of the Party. Individuals in this
generation include: Martha Abbott, Terry Bouriches, and Erhard Manhke.
These activists center their commitment to the Party around economic issues. For
instance, Erhard Mahnke has dedicated both his political and professional career to affordable
housing. Mahnke explained that, “I am a Progressive because we are able to implement things
and put forward ideas that may seem radical when they are first imposed but once implemented
and successful they become part of the mainstream.” Mahnke stated, “[The Community Land
Trust] is something that stared as a ‘crazy’ Progressive notion. We embraced it early on in
Burlington and it has grown to become an international movement.” Mahnke believes that
“housing is a basic human right and it should not be traded on and speculated on.” His stance on
economic justice and housing drives his commitment to the Progressive Party.
Similarly, Martha Abbott stated, “not long after the founding of Liberty Union Party, I
started working with Bernie. We worked on telephone service rates and electrical service rates.”
To Abbott, these economic issues were of utmost importance because they “made a real
difference in people’s lives.” Abbot most cares about, “wages, benefits, healthcare, all the things
that the system requires of people who are going to be productive members of society.”
74
Many of these “first generation” activists worked directly with Senator Sanders in the
Liberty Union Party, his early campaigns, or when he was Mayor of Burlington. They speak of
him as part of the movement toward progressive policy and as a colleague in that effort.
2. The Inspired Generation(s)119
These individuals came of age and into political life with Bernie Sanders as Mayor of
Burlington or as Congressman. They include: Former Lt. Governor Zuckerman, Senator Pearson,
and Representative Colburn.
Zuckerman described that his first exposure to Progressive ideas: “I didn’t know about
the Progressive Party when I first got involved. I learned about Bernie Sanders when I heard
Bernie speak at UVM in 1992. It was through volunteering on his campaign that I met local
folks, primarily in Burlington who were engaged in the Progressive Coalition.”
A prominent characteristic of this generation is that, more than any other generation, they
connect their Progressive vision with pragmatism. These individuals have personal experience
with how Progressive ideas can be implemented to help people, because they have seen it
happen. Representative Colburn stated, “I was in High School when Bernie was Mayor. I
benefitted directly from the Mayor’s youth office. That was my introduction.”
This generation is more likely than the first generation to mention social and
environmental issues. Learning about climate change was what first inspired Pearson to get
involved politically. Colburn was involved in reproductive access work. However, permeating
this generation’s approach, is a firm dedication to the people, in economic realities, and in a
collaborative approach. Zuckerman stated, “What intrigued me about the Coalition was that there
were people who had varying social and economic justice ideology that were working as a
119 Some Progressive activists separate this group into two generations.
75
coalition to help each other’s focus be amplified. One person might be interested in
environmental justice, economic. They would each support each other in the coalition.”
Many of these individuals credit Sanders as an inspiration and a mentor. To them, he has
led the way on Progressive issues from inside of government, not just as an organizer outside the
system. His work demonstrates how to take Progressive ideas and make them a reality.
3. The New Generation
The “new” generation of Progressives came to political life following the failure of
Progressive Mayor Bob Kiss’ leadership in Burlington, and the subsequent the rise of
progressive politics during Senator Bernie Sanders’ campaign for president. Their views on
Progressive politics are more idealistic and tend to be broader-focused than the largely economic
examples presented by the older generations. There is also a heavy emphasis on social issues and
fighting climate change. While some mention a commitment to economic issues, they almost
exclusively bring up the economy as a subsidiary argument. Individuals in this generation
include City Councilor Jack Hanson, the Executive Director of the Progressive Party Josh
Wronski, and mayoral campaign manager and former Progressive candidate Carter Neubiser.
Neubiser explained: “I’m from Connecticut so I did Bernie volunteering in my home
state… Bernie was the first one where there was an existential need for him to win. I got a third
job in my neighborhood to be able to donate $30 a week.” Or for Hansen, “[Bernie] was a
politician but he was speaking to the issues... I had never heard a politician talk that way. It
changed the way I viewed electoral politics. He made me realize that you can be a part of the
system and still challenge it from the inside.”
To this generation, Sanders is a fighter for justice and for progressive ideals. Many are
inspired by his unwavering support for progressive issues in the face of an unfair system. This
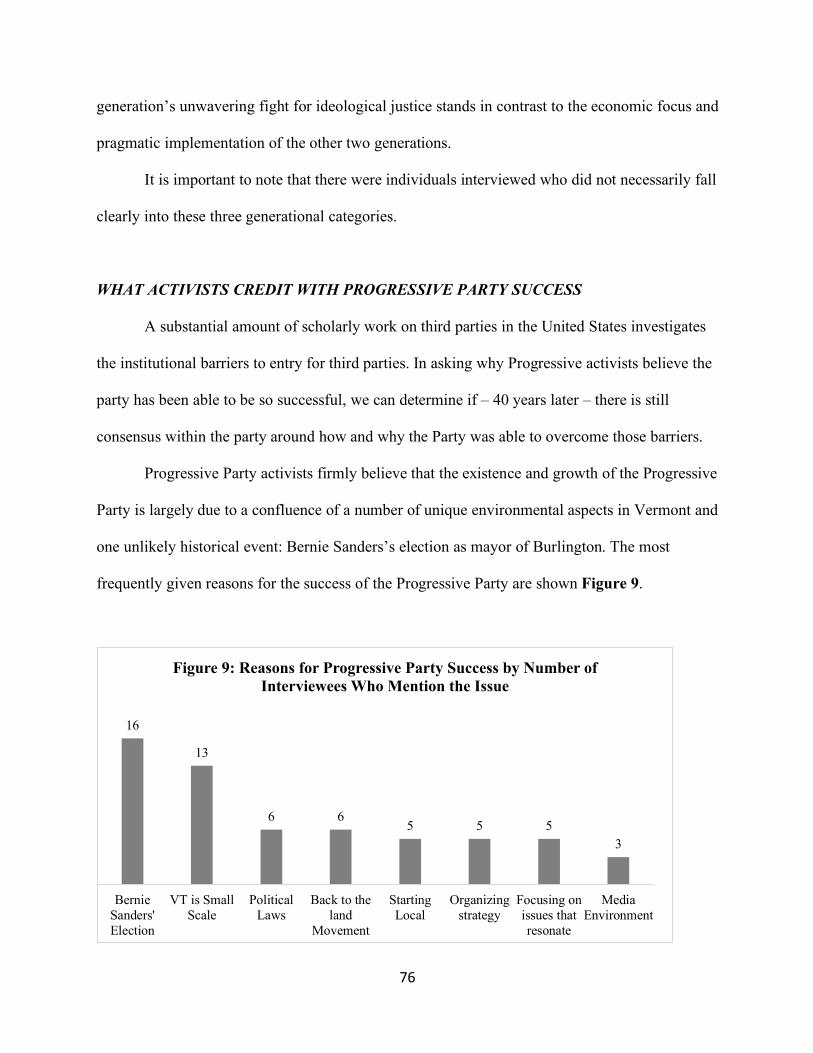
76
generation’s unwavering fight for ideological justice stands in contrast to the economic focus and
pragmatic implementation of the other two generations.
It is important to note that there were individuals interviewed who did not necessarily fall
clearly into these three generational categories.
WHAT ACTIVISTS CREDIT WITH PROGRESSIVE PARTY SUCCESS
A substantial amount of scholarly work on third parties in the United States investigates
the institutional barriers to entry for third parties. In asking why Progressive activists believe the
party has been able to be so successful, we can determine if – 40 years later – there is still
consensus within the party around how and why the Party was able to overcome those barriers.
Progressive Party activists firmly believe that the existence and growth of the Progressive
Party is largely due to a confluence of a number of unique environmental aspects in Vermont and
one unlikely historical event: Bernie Sanders’s election as mayor of Burlington. The most
frequently given reasons for the success of the Progressive Party are shown Figure 9.
16
13
6 65 5 5
3
BernieSanders'Election
VT is SmallScale
PoliticalLaws
Back to theland
Movement
StartingLocal
Organizingstrategy
Focusing onissues thatresonate
MediaEnvironment
Figure 9: Reasons for Progressive Party Success by Number of Interviewees Who Mention the Issue
77
Bernie Sanders and Proving that Progressives Can Win
The most frequent reason given by Progressive activists for the success of the Party is
Sanders’ success. Jack Hansen states, “Bernie coming in and having that ‘miracle’ election was
shocking. You have up-ended the Democratic machine in the largest city in the state.” Bernie ran
a progressive, issue-focused campaign and governed Burlington with an eye towards those
priorities. Abbot stated, “He raised the conversation on all those issues so effectively, that we
were able to till that soil. We were able to continue those fights in-state while he was in
Washington.” Zuckerman added that the Progressive Party has been successful “because [of] the
original success of Bernie and other people running outside of the Democratic party and then
operating government in a successful way. Once that success occurred that gave legitimacy to
the idea that another party could exist.” Steve Hitgen said, “The practical achievement of being
elected was a really important one.” In this way, Sanders established a “proof of concept” not
unlike other charismatic third party leaders throughout history like founders of the Wisconsin
Progressives Party Phillip and Robert La Follette.120
Most Progressive Party activists believe that Bernie and other Progressives’ have
demonstrated legitimacy that will continue. For example, Zuckerman described that, “There are
now children and even grandchildren of original progressives that are involved…The fact that
we have multi-generational engagement helps with the continuum.” Hitgen, however, believes
that the success of the Party continues to rest with Senator Sanders’ success: “There is still, to
this day, a ‘Bernie gets hit by a bus’ situation. Who is the unapologetically left leader in Vermont
if that happens? There is no answer for that… Without him I don’t know what we do next.”
120 Ronald L. Feinman, "Philip La Follette: The Second Son," Reviews in American History 11, no. 3 (1983): 409-13. Accessed May 4, 2021, doi:10.2307/2702475.
78
Vermont’s Political Environment
Progressive activists describe the political environment in Vermont as “unique” and
believe that the Progressive Party’s success is linked to a number of these characteristics.
Small Scale: Activists consistently link the “small scale” of Vermont politics to the
Party’s success. Jack Hansen pointed this out immediately: “The smallness of Vermont is huge.
The fact that the largest city in the state is 40,000 people opens it up.” This scale enables
candidates to work hard knocking doors and connect with their communities. Senator Pearson
explained: “When you run for the house you have a district of either 4,000 or 8,000 people. You
can knock all of those doors and if you work hard enough, you can knock them twice.”
Because of the logistical benefits of the small scale, money is less of an issue. Anthony
Pollina stated: “Vermont is a small state which makes campaigning easier in terms of the money
you need.” Wronski explained how this works in Burlington: “You can win a City Council
election with 400 or 1200 people…Money doesn’t matter as much. Someone can raise $3-4000
and still run a very effective campaign.” At the state level, Senator Pearson said, “If you spend
$10,000 on a legislative race you would be setting records.”
The Electorate: Mahnke and Jack Hansen both mentioned an influx of progressive-
minded individuals to Vermont during the 1960s and 1970s. Erhard stated “a lot of it starts with
the back-to-the-land movement in the latter half of the 60s and 70s.” Similarly, Jack stated that
the Party was boosted by the “Hippies that moved to Vermont.”
Progressive activists also mention the community-based politics. Shannon Jackson said:
“people can really talk with their neighbors and understand the problems that they face.”
Similarly, Polyte said: “People were already more inclined to view things through the lens of the
79
person communicating it rather than through a party.” This unique attribute of the electorate
helps voters vote for the person, not the party, and therefore benefits third-party candidates.
Political Rules and Laws: Progressive activists also mention that many Vermont political
laws have been beneficial or at least neutral to third-parties. For example, Vermont politics allow
for the existence fusion candidates who run with more than one party label. This is also used by
the Working Families Party in New York. This is when candidates run in the Democratic
primaries, but also organize write-in campaigns for the Progressive nomination. This enables
competition between Democrat and Progressive candidates to occur within the Democratic
primary rather than the general election, and removes the “spoiler effect.”
Progressive activists see both the positives and negatives in fusion candidates. To
Pearson, fusion is not ideal but a necessity because “even a really strong Independent or
Progressive probably cannot win in Chittenden county because of the nature of the ballot.” Most
Progressive activists agree that the ability to “run fusion” helps Progressives get elected while
they push for changes to the electoral system that would open up third party candidacies in the
general election without introducing the spoiler problem – like ranked choice voting.
Jack Hansen also pointed out that the political structure in Vermont which allows for
candidates from different parties to serve as Lieutenant Governor and Governor allowed former
Lt. Governor Zuckerman to serve as the highest-ranking Progressive Party official in the country.
Hansen argues this would have been much less likely if Vermont laws required the Governor and
Lt. Governor to run on the same ticket. Representative Mulvaney Stanak also pointed to the ease
of getting on the ballot: “There is a structural reason [for Progressive Party success] – we have
one of the easiest ways to gain ballot access. The threshold is to organize towns and counties. It
is not easy but it is way easier than party structure in other states.”
80
Vermont Media: Finally, Progressive activists point to the structure of local, Vermont
media as a relative benefit to the Party. Activists ascribe a portion of Bernie’s victory in 1981 to
how the media covered the race. Bouriches stated, “[Bernie was] in all the TV and daily
newspaper without having to pay. The existence of local news in a city where politics are small
scale helped Progressives get a foothold of legitimacy in elections.” Burlington media has also
helped Progressives gain legitimacy statewide. Wronski stated: “Burlington is the largest city in
Vermont. [Progressive victories] became state news and even national [news.]”
Progressive Party Strategy
Progressive activists also point to Party strategy fundamental to their success. Three
aspects of Progressive Party strategy rise to the top: starting local, on-the-ground organizing, and
talking about issues that resonate. By starting with local elections, the Progressive Party and
Progressive candidates gain legitimacy within their communities which they can build out to
larger constituencies. Neubiser contrasted the Progressive Party’s success in starting locally with
third parties, like the Green Party that have tried to start nationally: “The amount of influence we
have is outsized because we started at the local level. When you look at the Green Party they
don’t have a lot of infrastructure. You waste the resources on that one [national] candidate. What
happens when he loses? That is not how you organize long term.”
Similarly, Progressive activists pointed to the culture of grassroots organizing in the
Party. Colburn sees Progressive “organizing continue to resonate with people and out-organize
paid canvassers and glossy mailers…there is something about the grassroots model and the way
the Party really seeded itself locally in a state where there were already some really ripe
81
conditions.” Similarly, Jackson noted that when candidates are familiar with their communities,
“the Progressive Party’s solutions and organizing tactics really work in that situation.”
Finally, Progressive activists point to how well Progressive issues resonate across party
labels. Mahke argued: “When you have the right values that are people-oriented and toward
people who feel left out and left behind, that resonates across ideological lines.”
THE FUTURE OF THE PROGRESSIVE PARTY
The Positives of 2020
For the most part, Progressive activists do not think that the 2020 elections significantly
altered the Party’s status in Vermont. While Progressives Lieutenant Governor Zuckerman and
Senator Tim Ashe lost at the statewide level, there were new Progressive leaders elected to the
Vermont State Legislature. Representative Mulvaney Stanak argued, “In Burlington, we are
winning across the city.” Jackson also pointed out that at the state level, the newly elected
Progressives “back filled” the positions lost by other Progressives.
Progressives point to the 2020 political conditions as an extreme aberration from the
norm. Prine argued that we have to “put aside” Zuckerman’s governor’s race because “it was
impossible to beat Phil Scott when he did and continues to do a good job on the pandemic.”
Similarly, Representative Mulvaney Stanak commented, “There are a whole lot of reasons why
up-ticket they lost. We are living through a pandemic with a psychotic racist, sexist and we have
a Republican governor who looks pretty tame. It was a referendum on Scott not killing us during
the pandemic.” However, despite this relatively positive reaction to the recent 2020 elections,
Progressive activists see a number of looming decisions and potential pitfalls for the Party.
82
A Deepening Rural and Urban Divide?
Progressives have been strongest in Chittenden county where Burlington is located and
where the Progressive Party began. However, the Party has historically made a concerted effort
to expand to other areas of the state. Senator Pearson, pointed out, “We recruited and won three
rural seats…And it really put Progressives in the map in Montpelier.” Many Progressive activists
feel that, in recent years, the Party’s focus has migrated back to Burlington. Polyte stated,
“Anthony Pollina’s connections with being a founder of NOFA and work with Bernie gave him
credibility with rural Vermonters. I don’t see that as continuing for very much into the future.
Those connections are getting weaker and weaker.” As a result, some activists, like
Representative Vyhovski believe that, “one of the biggest decisions to be made is if we want to
continue to funnel primarily into Burlington or if [we] truly wants to be a statewide party.”
Senator Pearson sees this as an opportunity for the Party: “The Progressives could play a
really important role. Rural Vermont and rural U.S. are more impacted by economic issues and
that is our bread and butter. If we could build bridges there it could have great impact. It would
prove that the left should not ignore rural districts and concerns.” Other Progressives, however,
do not feel that a concentration in Burlington is necessarily a bad thing. Representative Colburn
pointed out that Chittenden County “tends to be the more left leaning county in the state…
[however] If you put your leader from a pretty purple district, you are forcing them to choose
between pushing the Party position on platform and doing what is the right thing for their
district.” To Colburn, Progressives should be led by someone from who has the freedom to
advance unabashedly progressive social issues.
83
What Issues Should The Progressive Party Focus On?
Some Progressive activists argue that the Party has been and is moving too far to the left
and is leaving behind the key economic argument that they believe cemented Bernie’s success.
In contrast to the traditional economic focus, Prine argued, “issues number 1, 2, and 3 for
younger folks is climate, climate, climate.” Mahnke is concerned that young Progressives are not
considering the basic values of economic justice, instead “there is beginning to be this frame that
the radical progressive party is going to lead Burlington back into trouble the way that Bob Kiss
did. We spent years rebuilding the progressive brand in Burlington.” Prine suggested that
Progressives “figure out a way to bridge the gap between the older and younger Progressives”
and that “we are not even talking the same language in rural areas.” In contrast, Neubiser, who is
part of the younger generation, argued:
“Our motivation and our ideology is a pure one. I do think that we know these issues are the right thing to do in this point in history. These issues are the right solutions and I fundamentally believe that they are going to win the day.” – Carter Neubiser
Challenging Democrats or Pulling Them Far Enough Left
Two of the elected Progressives from the second generation, Zuckerman and Pearson
both mentioned the possibility of the Democratic Party absorbing the Progressive Party if the
Democratic Party were to fully adopt Progressive values. Zuckerman said, “Progressives are
often accused of wanting to take down the Democratic party. I come back with, if the
Democratic Party was more progressive we wouldn’t need to exist... It may be that the
Progressive Party disappears when the electoral body passes progressive issues.” Similarly,
Pearson argued if the Democratic party focused more on progressive issues, “there would be no
need or appetite for the Progressive Party.” It is important to note that neither elected official
84
indicated that they believed that this would happen. Nonetheless, their mentioning it
demonstrates that they would consider the merging of the parties.
Other, younger, Progressive activists describe a much more adversarial future for the
Progressive and Democratic Parties. Neubiser and Wronski both indicated that their goal would
be for Progressives to be the most prominent alternative candidates to Democrats in the state.
Neubiser envisions: “In the next 20 years [the Progressive Party] will challenge the Republicans
as the second biggest party in the state.” Similarly, Wronski argued, “I can see how we could
have 30-40 house seats [in the Vermont legislature] and could really be a player.”
This represents a significant difference between these two groups of activists. This could
stem from a generational divide. However, it could also stem from the fact that the two elected
officials, Lt. Governor Zuckerman and Senator Pearson run as under both party labels. In
contrast, Neubiser ran as a Progressive in Burlington and Wronski has not run for office.
Who Will Lead The Party?
With the 2020 losses for key Progressives: Lieutenant Governor Zuckerman in his
campaign for governor, Senator Ashe in his campaign for lieutenant governor, and former party
leader Representative Robin Chestnut Tangerman, some Progressive Party activists feel that
there is a leadership vacuum in the Progressive Party. As Polyte bluntly said: “I don’t know who
the next Progressive leader is going to be.” Progressive activists want to be deliberate in looking
for that leadership but have different focuses. Hitgen argued, “You need people at the top as
characters that people can latch on to.” Other activists pointed to the need for diversity. For
instance, Colburn pointed out, “There is a real appetite for women leaders, for women of color.”
Whereas Abbott wanted to continue the current leadership trend, she wanted the Progressive
85
Party to find leaders who can identify with rural voters like Lieutenant Governor Zuckerman,
who is also a farmer, and Senator Bernie Sanders whose integrity and economic message
resonates in rural areas.
Celebrating and Pushing for More Diversity
One segment of Progressive activists wants to celebrate the diversity already achieved by
the Party. Another segment is concerned that not enough has been done. Jeremy Hansen
celebrated the recent 2020 election of the Progressive Vermont “squad”: “The fact that we have
this squad of freshman legislators coming in is significant. The fact that it is a majority LGBTQ
is something to celebrate. To show that Progressives walk the talk.”Members of the Squad,
however, are not as positive about the amount of diversity in the Progressive Party. Mulvaney
Stanak argued the Party needs “to be putting BIPOC people in homes [in the Progressive Party]
and not just unseen labor.” Similarly, Colburn stated the Progressive Party should “start to
change the face of who the Progressive leadership is in ways that help us be true to our vision
that the voices who have not been heard are at the table.” Finally, Vyhovski believes that the
Progressive Party “needs to be really thoughtful about welcoming underrepresented voices and
minority voices.”
DISCUSSION
Is the Progressive Party A Third Party?
The first and most important question that this research must address is the question:
What is a third party? In literature about third parties, they are distinct entities from the two
major parties. The reality for the Progressive Party in Vermont is more complicated.
86
Since Bernie’s election in 1981, Progressives have controlled the mayor’s office for
almost three decades, Democrats controlled it for nine years, and Republicans for two. The
makeup of the Burlington City Council similarly points to a Progressive vs. Democrat Party
system in the city. It is clear that, at the local level in Burlington, a critical realignment has
occurred. The Progressive Party is no longer a third party in Burlington, but has supplanted the
Republicans as a major party.
In contrast to Burlington, the Progressive Party is almost inextricably linked to the
Democratic party at the state level. While some individuals have been elected to the state
legislature as pure Progressives, no current Progressive elected official is. In the Vermont
legislature, the Progressive Party’s representation relies heavily on fusion candidate laws and the
Democratic primary. Were it not for the Progressive Party’s prominence in Burlington, an
argument could be made that the Progressive Party is not as much an independent third party but
a subsidiary of the Democratic Party. This may become even more true if, as some Progressive
activists predict, the Vermont Democratic party continues to adopt progressive issues. As we
move forward with the study of third parties, it is important to recognize that the lines between
parties as third parties emerge may not be as clear cut as scholarly work has typically laid out.
Both Typical and Atypical Third Party Success
Traditionally, third parties have been successful by forcing major parties to adopt their
positions. Progressives in Vermont have succeeded in this way around key progressive issues
such as: raising the minimum wage, paid family leave, cannabis reform, and marriage equality.
These victories demonstrate strong parallels third party successes throughout American history
including, “the abolition of child labor, limitation of work hours, establishment of minimum
87
wages and graduated income taxes, broadening access to public education, expansion of suffrage
to previously excluded groups, institution of direct election of U.S. senators, use of public
referenda”121 and more. A key difference between the successes of other third parties and the
Vermont Progressive Party is that issue-focused success has been in addition to and likely
significantly aided by electoral victories.
The Unlikely Path To Success
Winner-Take-All Systems: Progressive activists believe that winner-take-all plurality
elections continue to be a hurdle to the Party’s success. Many mentioned the dangers of being
seen as a spoiler. They feel caught: if they run in the Democratic primary they are accused of
hijacking the Democratic Party; if they run in the general they are labeled as “spoilers.” Many
also speak with concern and regret of the very few times in recent elections when Progressives
have “damaged” the party’s reputation by running as a third candidate in a general election that
resulted in a Republican victory.122 Progressive activists feel that political conditions in Vermont
help mitigate this spoiler effect and offer alternatives. For instance, they can run fusion and
personally connect and build relationships with the voters in their communities outside of party
labels. This is also true for the Working Families Party in New York and elsewhere.
Legitimacy: Many activists feel that while Sanders helped the party with that initial
boost, the Party has now developed legitimacy of its own. However, Hitgen is an outlier. He
believes that Sanders’ success is still inextricably linked to the Party’s success. When Sanders
121 Martin, Empowering Progressive Third Parties in the United States, 5. 122 While this does not occur often, in 2016 four Progressive candidates ran in the Democratic primary and, after losing in the primary, used the Progressive nomination to run in the general. In one of these cases, the Republican won by fewer votes than the Progressive received. Media reported that the Progressive “cost the Democrats a seat in the House. (John Walters, “Two Bites of the Apple” The Vermont Political Observer, October 27, 2016, https://thevpo.org/2016/10/27/two-bites-of-the-apple/ and John Walters, “Two-Biters Bites Again” The Vermont Political Observer, November 10, 2016, https://thevpo.org/2016/11/10/two-biter-bites-again/ )
88
ends his tenure in office, an investigation of the path taken by the Progressive Party could
resolve this question.
Media: As local media disappears around the country,123 fewer third parties are able to
demonstrate legitimacy through the media, receive earned media, or afford paid media.
Progressive activists believe, as scholars have pointed out, that the local news environment in
Vermont, and especially Burlington, has helped boost the Progressive Party. Progressives are
frequently covered in local news. The Progressive mayoral candidate was substantially
covered.124 Progressives at the statewide level are frequently mentioned in local news.125 It
seems that the local news environment in Burlington has continued to aid the Progressive Party
in establishing and maintaining legitimacy.
Institutional Hurdles: Progressive activists acknowledge that there were and are fewer
institutional hurdles present in Vermont. They point to the relative ease of ballot access and the
ability to run as fusion candidates. However, Progressive activists are well aware of the
continued institutional hurdles. A clear example is Polyte’s concern that, “in two years if the
Progressives don’t find someone to run on the statewide ticket to get 5% that will be a problem”
due to ballot laws. Similarly, many Progressive activists feel that fusion candidacies are an
important stepping stone but also stop the party from being fully autonomous at the state level. It
is clear that institutional hurdles still for third parties even once they establish legitimacy.
123Clara Hendrickson, “Local journalism in crisis: Why America must revive its local newsroom,” Brookings Institution, November 12, 2019, https://www.brookings.edu/research/local-journalism-in-crisis-why-america-must-revive-its-local-newsrooms/. 124Courtney Lamdin, “Can Max Tracy Ride the City’s Progressive Wave to Become Burlington’s Next Mayor?” Seven Days, February 3, 2021, https://www.sevendaysvt.com/vermont/can-max-tracy-ride-the-citys-progressive-wave-to-become-burlingtons-next-mayor/Content?oid=32242023. 125 For instance, the Progressive agenda was mentioned by Kit Norton in his “Final Reading” stating “The House Progressive Caucus on Tuesday outlined an ambitious set of policy priorities it plans to push this biennium, sending the message that it intends to move the Democratic majority as far left as possible.” (Kit Norton, “Final Reading: Progs lay out ambitious agenda,” VTDigger, February 10, 2021, https://vtdigger.org/2021/02/10/final-reading-progs-lay-out-an-ambitious-agenda/.
89
Who Are Progressives?
As mentioned in the literature review, there seems to be a relative consensus among
scholars that third parties are made up of “agitators,” “idealists,” or even “purists” rather than
“administrators” and that this makeup works to the third parties’ detriment. In this analysis of the
Progressive Party, it is clear that the younger generation of Progressives fit far more closely into
the “agitator” or “activist” category described by Lasswell.126 For example, statements by
Neubiser and Wronski were more combative toward the Democratic Party. In contrast, those in
the older generation were much more likely to fall into the “administrator” category.127 These
older Progressives frequently mentioned the need for Progressives to be pragmatic and appeal to
working class individuals. However, Sanders’ success is seen as being a combination of these
two characteristics: “[Bernie’s] socialist ideology was still attractive to the true believers who did
the nitty-gritty work, but the administration’s policies were often pure pragmatism.”128
In 2020 the Progressive Party held a primary for the mayor’s race between two prominent
Progressives: City Council President Max Tracy, the ultimate winner, and City Councilor Brian
Pine. The narrative in the primary described the contest as an “‘Ideologue’ vs. ‘bridge
builder.’”129 In addition, following Tracy’s primary victory, former Progressive Mayor, Peter
126Lasswell states: “the agitator… is enough agitated about public policy to communicate his excitement to those around him. He idealizes the magnitude of the desirable social changes which are capable of being produced by a specific line social action… The agitator easily infers that he who disagrees with him is in communion with the devil, and that opponents show bad faith or timidity…The agitator is willing to subordinate personal considerations to the superior claims of principle.” (Lasswell, Psychopathology and Politics, 78). 127 Lasswell states: “administrators are distinguished by the value which they place upon the co-ordination of effort in continuing activity.” (Lasswell, Psychopathology and Politics, 263). 128 Guma, The People’s Republic, 92. 129 Grace Elletson, “‘Ideologue’ vs. ‘bridge builder’: What kind of Progressives are Pine and Tracy?” VT Digger, November 25, 2020, https://vtdigger.org/2020/11/25/ideologue-vs-bridge-builder-what-kind-of-progressives-are-pine-and-tracy/.
90
Clavelle, endorsed the incumbent Democrat, rather than the Progressive.130 This may indicate an
“agitator” versus “administrator” split within the Burlington Progressive Party.
If, as scholars suggest, the success of a third party is linked to pragmatism and a
willingness to compromise on issue purity, the Vermont Progressive Party is a perfect point of
analysis. Currently, Progressive activists describe a decision point about the focus of the Party:
with older generations wanting to pull Progressive focus back to rural communities, economic
issues, and pragmatism, and younger generations wanting a greater focus on climate and social
justice issues. Future research may be able to look at a correlation between pragmatism and
success for the Progressive Party as it evolves from this decision point. For the moment,
however, the near-victory for the “ideologue” Burlington mayoral candidate, Max Tracy,131 the
emergence and success of young Progressive activists on the Burlington City council and
activists like Progressive Representative Taylor Small, the first openly transgender member of
the Vermont Legislature, demonstrate that individuals in the Progressive Party that Lasswell
would likely deem “agitators” are able to succeed electorally.
CONCLUSION
The Vermont Progressive Party has done something that no modern third party has been
able to do: maintain four decades of success as a third party. Research on how the Party has
achieved this success, the individuals that it has drawn to the party, and where the Progressive
Party’s path will lead into the future allows us to learn more about the potential for other third
parties across the country. The Progressive Party’s experience tells us where our current theories
130 Pat Bradley, “Clavelle Endorses Weinberger,” WAMC Northeast Public Radio, January 14, 2021, https://www.wamc.org/post/clavelle-endorses-weinberger. . 131Grace Elletson, “Burlington Mayor Miro Weinberger narrowly wins fourth term,” VT Digger, March 2, 2021, https://vtdigger.org/2021/03/02/burlington-mayor-miro-weinberger-narrowly-wins-fourth-term/.
91
are correct, where they fail to fully address the reality for the Vermont Progressive Party, and
how other third parties across the country could potentially replicate this success.
The experience of the Vermont Progressive Party confirms a number of scholarly theories
around third parties: specifically, both the hurdles and optimal environmental conditions for third
party development and success. Strong local media, proof of concept and legitimacy sparked by
Bernie’s election, low ballot requirements, small populations, and the availability of fusion
candidacies have helped Vermont Progressives.
Scholarly work, however, usually treats third parties as either outside of the two-party
system with little or no chance of substantial electoral success, or as part of a realignment where
the third party will ultimately supplant or be taken over by one of the major parties. This research
and the experience of the Vermont Progressive Party demonstrates that there is a lack of
scholarly theories about a third option: limited but substantial sustained success. The Vermont
Progressive party has achieved a realignment in Burlington, but has remained a consistent third
party option at the state level.
Scholarly work has also largely categorized third parties as replete with ideologues and
purists, pointing to this as one of the reasons for lack of electoral success. The interviews with
Progressive activists demonstrate that there is a range of individuals attracted to the Vermont
Progressive Party from pragmatists to idealists and that candidates from both sides of the party
have been able to be successful. Therefore, in other states and nationally, ideological passion is
not necessarily a damning attribute for members of third party. However, mimicking the
Vermont Progressive Party’s combination of pragmatists and idealists could be a boon.
For members of third parties across the country, the Vermont Progressive Party also
presents some guidance for a potential path towards and political environment that would allow
92
third parties to overcome barriers, gain electoral success, and maintain that success. For instance,
institutional barriers should continue to be fought, local media should be supported, and fusion
candidacies can be used as a stepping stone. Finally, the Vermont Progressive Party
demonstrates that combining pragmatism with idealism could develop long-lasting third party
legitimacy across the country.
93
CHAPTER 3: THE SUCCESSES, FAILURES, AND FUTURE OF
DIRECT DEMOCRACY AND TOWN MEETINGS IN VERMONT
INTRODUCTION
Every year, on the first Tuesday in March, Vermonters come together in their local
municipalities for town meeting day, an opportunity to vote on all kinds of local- and state-wide
issues. Whether it is a presidential election year, like 2020, or not, Vermont votes on local issues
like the school budget, whether the town will buy a new ambulance, or which local officials will
represent them in the year to come. Vermont’s version of the town meeting is distinct from other
states, including those in other parts of New England that employ similar structures like
representational town meetings. In many rural towns across the state, Vermonters physically
come together at town meetings to debate, discuss, and vote on these issues.
Direct democracy in the form of town meetings is generally considered one of the purest
forms of democracy. In 1838, Alexis De Tocqueville described that in New England town
meetings, “the principle of popular sovereignty is not, as in certain nations, hidden or sterile; it is
recognized by mores, proclaimed by laws. It expands with freedom’s expansion and meets no
obstacle on the way to its ultimate ends.”132 Modern New Englanders, Vermonters included, are
still proud of this direct democracy.
The town meeting has been a mainstay in the area’s politics before Vermont was a state.
The Secretary of State’s “A Citizen’s Guide to Vermont Town Meeting” proudly describes that:
“Vermont town meeting is a tradition dating back to before there was a Vermont. The first town meeting was held in Bennington in 1762, 15 years before Vermont was created.
132 Alexis de Tocqueville, Democracy In America, 62.
94
In the late 1700s, as today, town citizens in Vermont held meetings so that they could address the problems and issues they faced collectively. Popular matters of legislation in earlier town meetings included whether or not to let pigs run free or whether smallpox vaccinations should be allowed in the town (some thought vaccinations were dangerous). Voters also decided what goods or labor could be used as payment for taxes… Town meeting also served a social function (as it does today), bringing people together who might not otherwise know each other. This can strengthen social ties within a town and help people work together to tackle community problems.”133
However, the history of Vermont town meetings has not been as straightforward as the
Office of the Vermont Secretary of State suggests. While many rural towns maintain town
meeting day in its original form, many others have transitioned towards hybrid systems that
combine a town meeting or a town meeting-like informational meeting with government-
organized ballot voting (also called the Australian ballot), while other towns and the few cities in
Vermont solely use Australian ballots. One town, Brattleboro, uses representative democracy in
its town meetings.134 Other New England states have experienced similar changes, updates, and
migrations away from the traditional in-person town meeting. Like Brattleboro, many towns in
Massachusetts are now using a representative town meeting: In his book, Local Government in
Rural America, published in 1957, Clyde Snider described that, “several of the more populous
towns of Massachusetts and occasional towns in other states have found it expedient to abandon
the town meeting in its traditional form in favor of the representative or limited meeting.”135
The future of town meetings in Vermont and across New England is being questioned. As
attendance falls and some towns grow, many are questioning whether town meetings—and direct
democracy—have a future in America and Vermont. One book on the Vermont town meetings
argued that, “This generation of Vermonters will choose whether to keep or to lose town
133 Office of the Vermont Secretary of State, “A Citizen’s Guide to Vermont Town Meeting.” 134 Ibid. 135Clyde Snider, Local Government in Rural America (Westport: Greenwood Press Publishers, 1957), 205.
95
meeting. Will the democratic inheritance of our brave little state be passed on to the next
generation intact? The decision is in our hands.”136
This chapter specifically investigates town meetings in Vermont through the eyes of town
clerks. These clerks are some of the individuals most intimately connected with town meetings.
In 1930, John Fairfield described town clerks in his book, Town Government in Massachusetts
1620-1930: “Every town has a clerk. In many respects he is the most important local official—if
not in dignity, at least in general service.”137 This is still true today in Vermont where clerks post
the town meeting warning,138 attend, and keep record of each town meeting throughout the state.
They are intimately acquainted with the benefits as well as with the struggles and weaknesses of
this form of democracy. This research seeks to investigate whether the current system still
reflects the various aspects of town meetings though the centuries that scholars have both praised
and criticized, what the future of town meetings in Vermont might hold, and, were they to
disappear, what Vermonters could lose.
LITERATURE REVIEW
Scholarly writing about town meetings in New England is extremely broad in historical
scope, but also shallow in terms of more recent investigations into the various elements of town
meetings. This is especially true for town meetings specifically in Vermont. Town meetings and
136 Susan Clark and Frank Bryan, All Those In Favor: Rediscovering the Secrets of Town Meeting and Community (Burlington: RavenMark Inc., 2005), 84. 137 John Fairfield, Town Government in Massachusetts (1620 –1930) (Cambridge: Harvard University Press, 1930), 157. 138 A town meeting warning is the official name for the notice that, by law, must be posted and published within the town to let town residents know about the upcoming town meeting and the measures upon which the town residents will be voting. (Vermont League of Cities & Towns, “Town Meeting Help, 2019,” Last modified 2019, https://www.vlct.org/town-meeting-2019-help.)
96
the notion of direct democracy have been mentioned in a number of sources throughout the
history of this country, but few modern scholars have done extensive research on the subject.
A broad amount of scholarly work on town meetings describes the function of town
meetings in great detail but comes to few conclusions about the benefits, negatives, or even the
future of town meetings. These descriptions generally start with how the warning is posted for
the meeting, the roles of town clerks and moderators, and even what issues are generally
discussed in town meetings. The best example of this sort of literature specifically related to
Vermont is the Secretary of State’s “Citizen’s Guide to Vermont Town Meeting.”139 Similarly,
Nuquist’s Town Government in Vermont explains the nuances and structure of town meetings in
Vermont140 and All Those in Favor explains the Vermont town meeting in logistical depth even
including guidance for town moderators in addition to advice about, “ten things you can do over
time to improve your town meeting”141 Other work looks specifically looks at other states like
Massachusetts: Town Government in Massachusetts (1620-1930) describes the development of
the structure of town meetings in Massachusetts from the 1600s through to 1930.142 Additional
scholarly works describe town meetings across all New England states. The New England Town
Meeting: Democracy in Action is the best example of this broad-scope logistical outline of town
meetings.143 It specifically includes the intricate logistics differences between town meetings in
each of the New England states.144 While the more modern works like All Those in Favor and
“Citizen’s Guide to Vermont Town meeting” give a relatively good picture of the current state of
139 Office of the Vermont Secretary of State, “A Citizen’s Guide to Vermont Town Meeting.” 140 Andrew Nuquist, Town Government in Vermont (Essex Junction: Essex Publishing Company, Inc., 1964). 141 Clark and Bryan, All Those In Favor, 65 and 73. 142 Fairfield, Town Government in Massachusetts (1620 –1930). 143 Joseph Zimmerman, The New England Town Meeting: Democracy in Action (Westport: Praeger Publishers, 1999). 144 Ibid.
97
town meeting logistics in Vermont, much of this work is dated with information that does not
still apply to town meetings in the areas that it describes.
Scholarly work is not limited to purely descriptive work, however. It also extends to
scholarly work that comes to conclusions about town meeting days including work that is largely
theory-focused. This theory-focused scholarly work largely falls into three categories: the notion
of direct democracy as the “purest” form of democracy, the pride in participation that comes with
being a part of this type of government, and the educational value of discussing issues in an open
setting with peers. Many historical scholars were the first to use these theories when discussing
town meetings, however, are not the only ones who use these arguments and theories today.
Despite centuries between these historical scholars and today’s academic research, these themes
continue to emerge in modern works praising the direct democracy of a town meeting.
Some historical scholars, like Thomas Jefferson in 1782, describe direct democracy in
town meetings as a “purer” entity that will best reflect the will and serve the needs of the people
it represents: “Every government degenerates when trusted to the rulers of the people alone. The
people themselves therefore are its only safe depositories.”145 In fact, Jefferson laments that the
American governmental system is less perfect than he believes the American people deserve:
“the people [of America] have less regular control over their agents, than their rights and their
interests required.”146 Similarly, much of Ralph Waldo Emerson’s writings on town meetings fits
into this same category. Emerson describes the town meeting with language that approximates
adoration for facilitating the direct connection between government and the governed: “in this
open democracy, every opinion had an utterance, every objection, every fact, every acre of land,
145 Paul Ford, The Writings of Thomas Jefferson, vol. 4 (New York: G.P Putnam’s Sons, 1894), 64. 146 Saul Padover, ed. Democracy by Thomas Jefferson (New York: Greenwood Press, Publishers, 1939), 63.
98
every bushel of rye, its entire weight.”147 Like both Emerson and Jefferson, Alexis De
Tocqueville is highly impressed with the direct connection between the people and their
government. De Tocqueville recognizes that there are some defects to the system, but he praises
it for the strong connection between the people and the decisions being made in government:
“Though the government is not without its defects, indeed, it is easy to point them out, they do
not strike the eye, because the government really does emanate from the governed, and as long as
it continues to struggle its way forward, it will be protected by a sort of paternal pride.”148
Modern scholarly work also points to direct democracy in town meetings as an ideal form
of government. In their book, All Those In Favor, Susan Clark and Frank Bryan reiterate the
same argument that Jefferson used two centuries prior, that:
“In town meeting governments, no elected representatives intervene between the citizen and what the government says or how it acts… In a Vermont town every citizen is a legislator. In a Vermont town the government truly is by and of the people… They are legislatures operated by ordinary citizens who don’t leave their lawmaking to someone else.”149
Similarly, more modern scholars argue that, “the moral basis for [deliberative
democracy] is common to many concepts of democracy. Persons should be treated not merely as
objects of legislation as passive subjects to be rules, but as autonomous agents who take part in
the governance of their own society, directly or through their representatives.”150 Thus, even
centuries later, scholars continue to point to deliberative democracy and town meetings as one of
the purest and best forms of democracy. In fact, Clark and Bryan take this argument one step
147 Ralph Waldo Emerson, The Complete Works of Ralph Waldo Emerson (Seattle: Pacific Publishing Studio, 2018), 125. 148 Tocqueville, Democracy In America, 76-77. 149 Clark and Bryan, All Those In Favor, 15. 150 Amy Gutmann and Dennis Thompson, Why Deliberative Democracy? (Princeton: Princeton University Press, 2004), 3.
99
farther, arguing that, “Vermonters still practice (and practice most thoroughly) the planet’s single
best example of the single best way to live in peace [- the town meeting.]”151
The connection between the participants and the government is also a frequent argument
put forth by scholars for the benefits of town meetings and direct democracy. The argument
states that because citizens are able to participate, debate, and discuss issues that directly affect
their government and their lives, they feel more strongly connected to the government and its
decisions than they would otherwise. In Donald Robinson’s book Town Meeting: Practicing
Democracy in Rural New England, Robinson describes that, “this book is about the practice of
democracy. It focuses on Ashfield, Massachusetts, a rural town of about two thousand
inhabitants in the foothills of the Berkshires, in western New England.” 152 While Robinson
acknowledges that some of the decisions made by the town are not perfect, he argues that this
form of direct democracy is eminently laudable for his community.153
De Tocqueville specifically described this aspect of the town meeting in regards to New
Englanders: “The New Englander is attached to his town because it is strong and independent; he
takes an interest in it because he helps direct its affairs, he loves it because it gives him no reason
to complain about his lot in life.”154 Similarly, Emerson describes that, “general contentment is
the result [of town meetings.] And the people truly feel that they are lords of the soil. In every
winding road, in every stone fence, in the smokes of the poor-house chimney, in the clock on the
church, they read their own power, and consider, at leisure, the wisdom and error of their
judgement.”155
151 Clark and Bryan, All Those In Favor, 13. 152 Donald Robinson, Town Meeting: Practicing Democracy in Rural New England (Amherst: University of Massachusetts Press, 2011), 1. 153 Ibid. 154 Tocqueville, Democracy In America, 77. 155 Emerson, The Complete Works of Ralph Waldo Emerson, 126.
100
Some modern scholars also point to this consensus building as a benefit of town meetings
and deliberative democracy. Rebecca Townsend’s article, “Town Meeting as a Communication
Event: Democracy’s Act Sequence, Research on Language and Social Interaction” specifically
investigates the ways in which norms and rules dictate how democracy functions within
Amherst’s town hall and how that can benefit the community as a whole.156 In addition, Susan
Clark and Frank Bryan praise this aspect of town meetings: they argue that town meetings
increase community and comradeship because, “face to face participation teaches forbearance
and tolerance. It teaches respect for others’ views. It teaches citizenship”157 and in addition to
this comradeship, residents respect the town meeting decisions more because of the process:
“[b]y allowing citizens actually to fashion the laws themselves, it creates a sense of “ownership”
of the town’s business not present when decisions are made by others.”158 Similarly, Archon
Fung, in his book Empowering Democracy, argues, “even when some participants disagree with
group deliberations, they may be more easily reconciled to the outcomes because others have
justified the bases of their positions in good faith.”159 Thus, for centuries, scholars have argued
that the process of deliberative democracy facilitates acceptance and buy-in to the ultimate
outcome.
The final most prominent argument for the benefits of town meetings is the educational
benefit. Many of the historical scholars also point to the process of deliberative democracy as an
educational process. They argue that the people who attend and engage in town meetings have
the opportunity to discuss, debate, and change minds. Jefferson and De Tocqueville both speak
156 Rebecca Townsend, “Town Meeting as a Communication Event: Democracy's Act Sequence,” Research on Language and Social Interaction, Volume 42:1 (2009). 157 Clark and Bryan, All Those In Favor, 38. 158 Ibid. 159 Archon Fung, Empowering Participation (Princeton: Princeton University Press, 2004), 17.
101
to this in their descriptions of town meetings.160 In addition, a political observer in the 1890s,
Lord James Bryce, described that, “the primary assembly is admittedly the best. It is the cheapest
and most efficient; it is the most educative of the citizens who bear a part in it. The Town
Meeting has been not only the source but the school of democracy.”161 Clark and Bryan argue
that, “[t]own meetings allow citizens to hear ‘both sides of the story.’ It builds an appreciation
for the complications often involved in the simplest policies”162 In his book, Archon also points
to the fact that, “citizens themselves may become wiser and more understanding and accepting of
different views and preferences after encountering them in discourse”163 Thus, these scholars –
both historic and more modern – point to the educational benefits of direct democracy in the
form of town meetings.
While each of the characteristics listed above is valid and, obviously, long lasting
arguments, they are also largely theoretical and observational rather than the result of
methodological research. These scholars speak about the “ability” of everyone to participate in
generalities. They rarely acknowledge that participation is not universal or address other
criticisms of town meetings.
Less favorable descriptions have emerged in scholarly work that focuses on specific
tangibles and measurables in town meetings. Many scholars have described and investigated
town meetings’ low attendance rates, the ability for factions to emerge, and the creation of a
setting where some might feel more empowered than others to participate.
The most pervasive concern raised by scholars about town meetings is low attendance.
Even those who think very highly of town meetings acknowledge that this is an issue. In their
160 See: Padover ed., Democracy by Thomas Jefferson; and Tocqueville, Democracy In America. 161 James Bryce, The American Commonwealth, 2nd ed. rev. (London: Macmillan and Company, 1891), 591. 162 Clark and Bryan, All Those In Favor, 38. 163 Fung, Empowering Participation, 17.
102
book, whose goal is to make a strong case for the benefits of town meetings, Clark and Bryan
acknowledge that, “while it is doubtful that there was ever a ‘golden era’ of town meeting when
nearly everyone turned out every year, attendance was much higher in the early days than today.
Even well into the 20th century it was much higher than it is now.”164 In his book Town
Government in Vermont, Andrew Nuquist speaks about how these low attendance rates call the
future of town meetings into question: “It is the widespread nature of this abstinence from town
affairs that causes many of the fears about the future of the town system of government.”165
Similarly, in his book The New England Town Meeting: Democracy in Action, Joseph
Zimmerman explains the results of low attendance, in that, “the relatively small percentage of
registered voters who attend town meetings, with the exceptions of towns with very small
populations, raises the question whether the participants are representative of the electorate at
large.”166 Victor DeSantis and David Hill use a survey of Massachusetts registered voters to test
theories of political participation in town meetings in their article “Citizen Participation in Local
Politics: Evidence from New England Town Meetings” and ultimately confirm low attendance
rates.167 Thus, these scholars describe and argue that while everyone has the “ability” to attend,
universal attendance is far from the reality of town meetings and this can distort what would
have or could have otherwise been a democratic outcome.
A result of low attendance also leads to the capacity for certain self-selected factions or
specific individuals to emerge and control the outcome of town meetings. Case studies and
recent data have demonstrated this to be the case: Jenkins, Roscoe, and Borges’ article “Voters in
164 Clark and Bryan, All Those In Favor, 27. 165 Nuquist, Town Government in Vermont, 19. 166 Zimmerman, The New England Town Meeting, 10. 167 Victor DeSantis and David Hill, “Citizen Participation in Local Politics: Evidence from New England Town Meetings,” State & Local Government Review, Vol. 36, No. 3 (Autumn, 2004): 166-173.
103
Representative Town Meetings” analyses the town meeting in Dartmouth, Massachusetts and its
representativeness as compared to the larger population and find it to be less than perfect with
more educated and elderly groups over-represented.168 James Madison was one of the first to
criticize town meetings for this. In Federalist Number 58, he argues that in direct democracies
like town meetings, “a single orator, or an artful statesman, was generally seen to rule with as
complete a sway as if a scepter had been placed in his single hand.”169
Almost two decades later, in the 1980s, Jane Mansbridge visited a small town in Vermont
to put together a case study for how this specific town conducted its town meeting and how the
townspeople participated and felt about this form of government. She found that, “[t]he poorer,
less-educated townspeople not only participate less than the rich but also are significantly less
likely to feel that they have any say in the town.”170 Mansbridge argues that the elite dominance
at the town meeting disrupts the idea of a town meeting as a pure or perfect form of democracy:
“The idea that participation created entitlement ignores the problem of representation. When
interests differ, the underlying principles of adversary democracy require that the interest of the
citizens be represented in proportion to their number”171
In his book, Government in Rural America, Lancaster Lane describes that in some town
meetings, “Factions multiply, minority groups become insistent, and meetings come to be
tumultuous, unrepresentative and the sport of wire-pullers”172 In his book written in the 1950s,
Local Government in Rural America, Clyde Snider blames specific groups for this factionalism:
168 Shannon Jenkins, Douglas Roscoe, and David Borges, “Voters in Representative Town Meetings,” New England Journal of Political Science, 9, no. 2, (September 2016): 134-163, https://c62a1cd8-e60b-4682-b2c5-a937642d5637.filesusr.com/ugd/7d6421_32bc900557c046f88fc938aa571fdc79.pdf. 169 James Madison, “Federalist 58,” Congress.gov Resources, 1788. https://www.congress.gov/resources/display/content/The+Federalist+Papers#TheFederalistPapers-58. 170 Jane Mansbridge, Beyond Adversary Democracy (New York: Basic Books, Inc., Publishers, 1980), 109. 171 Mansbridge, Beyond Adversary Democracy, 118. 172 Lane Lancaster, Government in Rural America (Westport: Greenwood Press Publishers, 1952), 42.
104
“European immigration…has introduced population elements unaccustomed to democratic
institution and especially in industrial communities, has fostered factionalism.”173 A more
modern scholarly article found that specifically in Dartmouth, an elite and informed faction
emerged: “the less engaged and informed fall off as elections provide less and less information,
leaving the remaining group smaller but fairly engaged and informed.”174 However, these
scholars also argued that this may not necessarily be a bad thing because bringing “in more
voters to make the electorate broader is likely to bring in people with less information and
engagement, which may potentially undermine representation of the public’s preferences even
more,”175 they do acknowledge, however, that this does “not approach the democratic ideal.”176
Thus, for as long as people have been praising town meetings because they allow
everyone the “ability” to participate, critics have also pointed to some of the negative effects of
the folks and factions who do participate.
Some scholars also question whether the study of town meetings as a “pure” or the
“purest” form of democracy is accurate because it is not scalable to larger groups of individuals.
While town meetings can work well in New England, the specific town meeting form of
government only works well in small autonomous towns. Even Jefferson questions the capacity
for the New England town meeting to be expanded beyond the townships in which it was
formed: “Such a government is evidently restrained to very narrow limits of space and
population. I doubt if it would be practicable beyond the extent of a New England township.”177
Similarly, although Nuquist is not favorable towards the Australian ballot, stating that, “it
173 Clyde Snider, Local Government in Rural America (Westport: Greenwood Press Publishers, 1957), 199. 174 Shannon Jenkins, Douglas Roscoe, and David Borges, “Voters in Representative Town Meetings,” New England Journal of Political Science, 9, no. 2, (September 2016): 134-163, https://c62a1cd8-e60b-4682-b2c5-a937642d5637.filesusr.com/ugd/7d6421_32bc900557c046f88fc938aa571fdc79.pdf. 175 Ibid. 176 Ibid. 177 Padover ed., Democracy by Thomas Jefferson, 61.
105
destroys the chief characteristic of the gathering,”178 and that it “has resulted in less competent
voting,”179 he does acknowledge that, “the old town meeting is not possible where towns have
hundreds or even thousands of voters. There is no structure in many of these towns to
accommodate all who might wish to come and the Australian ballot must be used.”180
In addition, scholars have found that the less autonomy a town government has in a more
complex governmental structure, the less interest townspeople have in the town meeting. In
Government in Rural America, Lancaster describes that, “After a certain point has been passed in
population growth and density—say 5,000 persons in the relatively limited area of an average
town – questions of administration come to grow more difficult and such questions do not lend
themselves to solution by general discussion.”181 In, Citizen Participation in Local Politics:
Evidence from New England Town Meetings, Victor DeSantis and David Hill argue that rather
than the simplicity of a town meeting, “more complex government structures that incorporate the
notion of division of labor are necessary for modern democracy.”182 Mansbridge also explains
that, “Since the eighteenth century, and at a more accelerated pace since reapportionment of the
state legislature in 1965, Vermont towns have lost to the state government many of their
traditional power over roads, schools, police welfare and zoning.”183 Ultimately, these critics
argue that once a certain threshold has been reached, town meetings and other forms of direct
democracy are not feasible.
The research in this chapter follows the path of much of the scholarly research done on
town meetings by investigating each of the aspects of town meetings described above—both by
178 Nuquist. Town Government in Vermont, 161. 179 Ibid. 180 Nuquist. Town Government in Vermont, 162. 181 Lancaster, Government in Rural America, 42. 182 DeSantis and Hill, “Citizen Participation in Local Politics.” 183 Mansbridge, Beyond Adversary Democracy, 43.
106
analyzing responses in terms of the more theoretical approaches like connection to the
government as well as the more tangible characteristics like participation rates.
METHODOLOGY
After developing the goals of this research, a questionnaire was written to answer the key
research questions. Meetings were then set up with two Vermont clerks to ensure that the
questionnaire would fulfill its goal. Barre City Clerk, Carol Dawes, and Montpelier City Clerk
John Odum were both interviewed. Each suggested some adjustments to the survey which were
implemented. The clerks of Burlington and Essex Junction were also contacted but were not
interviewed due to the Burlington clerks’ recent retirement and calendar conflicts.
A list of all Vermont clerks, their town, and contact information was procured from the
Vermont Secretary of State’s website.184 The emails from this list were used to disseminate the
survey to all Vermont town clerks. The survey was sent to each of Vermont’s 248 clerks prior to
the workday on January 7, 2020. The first email read:
[NAME],
I hope you are doing well and had a wonderful holiday season.
My name is Colleen Jackson. I am currently getting my Master’s Degree in Government from Johns Hopkins University. My Master’s thesis is specifically about what makes Vermont – my home state – unique and different politically.
I am reaching out to ask if you would be willing to take a survey about town meeting day.
Please click on this link to take the survey: https://forms.gle/BXeVCEXyPASWkC8G9
184 Office of the Vermont Secretary of State. “Guide to Vermont’s Town Clerks, Treasurers & County Clerks,” last modified, March 22, 2021, https://sos.vermont.gov/media/8d88cbe434ced0e/2020townclerkguide.pdf.
107
Few people in political academia write about Vermont politics these days, but I believe that we have so much to offer and to teach them about a modern form of American democracy that has been a part of American politics for centuries.
I am so excited and curious to hear what you have to think about town meeting day.
My plan is to share the results in the aggregate with all town clerks once I have compiled all the findings. This way, you can all see the results but they will not be linked to any specific individual in the report.
Thank you for your willingness to participate and please do not hesitate to reach out to me if you have any questions about this survey. My email is [email protected] and my phone number is (802) 735 4884. Alternatively, my advisor, Dr. Dorothea Wolfson can be contacted at [email protected]. Sincerely, Colleen Jackson
Fifty-five Vermont town clerks responded to the survey following this initial email.
Three days later, on January 10, a reminder email was sent to the clerks who had not yet
responded. The reminder email included the same information as the original email with an
added first paragraph:
“So far, 55 town clerks in Vermont have participated in this survey about town meeting
day, would you be able to join them?”
Following this reminder email, one hundred and six clerks in total had responded to the
survey. On January 16, a final reminder was sent to the clerks who had not yet responded. Once
again, the same information was included in the email but initial paragraph as adjusted to read:
“The outpouring of support from the clerks of Vermont for this survey has been
incredible! As of this morning, 106 clerks around Vermont have participated in this
survey about town meeting day, would you be able to join them?”
108
The survey was ultimately completed by 127 town clerks in Vermont representing 52%
of Vermont’s townships. The full survey topline can be found in Appendix E. The vast majority
of these surveys were completed online while two clerks asked and were provide with the
questions in a follow up email upon request. Unbeknownst to this researcher at the time, Clerk
Carol Dawes, who was interviewed by this researcher about the questionnaire and who also
serves in the Vermont Municipal Clerks & Treasurers Association, communicated about the
legitimacy of research through the Vermont clerks list serve and encouraged the other Vermont
clerks to complete the survey after it was first sent out. This likely resulted in the higher-than-
expect response rate for the survey.
The results from the survey were then compiled and communicated to four clerks from a
range of towns throughout the state with whom this researcher conducted in-depth interviews to
ascertain more qualitative information about the findings and these clerks’ reactions to the
survey results in addition to a couple additional questions about the future of town meeting in
light of the new rules and regulations put into place during the coronavirus pandemic (which
began after the administration of the clerks survey.) Finally, the PowerPoint was sent to all
Vermont town clerks with a note that comments and questions were encouraged to facilitate this
researcher’s understanding of the results and answers.
RESULTS
One hundred and twenty-seven of Vermont town clerks responded to this survey.
Together, they represent 52% of towns in Vermont and 57% of all Vermonters. The towns from
which this researcher received a survey were:
109
Alburgh, Andover, Barnard, Barre City, Barre Town, Barton, Belvidere, Bennington,
Berkshire, Bethel, Bolton, Braintree, Brandon, Bridgewater, Bristol, Brookline, Cabot, Calais,
Cambridge, Canaan, Castleton, Chelsea, Corinth, Cornwall, Coventry, Danby, Dover,
Dummerston, East Dorset, East Montpelier, Enosburg, Essex, Fair Haven, Fairfax, Fairfield,
Fayston, Ferrisburgh, Georgia, Goshen, Grafton, Granby, Grand Isle, Granville, Guildhall,
Guilford, Hardwick, Hartford, Hartland, Highgate, Hinesburg, Holland, Hubbardton, Huntington,
Ira, Isle La Motte, Jay, Jericho, Lowell, Lyndon, Maidstone, Manchester, Marlboro, Marshfield,
Milton, Monkton, Montgomery, Mount Holly, Mount Tabor, New Haven, Newfane, Northfield,
Norton, Pawlet, Peacham, Peru, Pomfret, Proctor, Putney, Reading, Richford, Richmond, Ripton,
Rutland City, Rutland Town, S Burlington, Salisbury, Searsburg, Sharon, Shoreham,
Shrewsbury, South Hero, St Johnsbury, St. Albans Town, Stamford, Starksboro, Stowe,
Strafford, Sudbury, Tinmouth, Topsham, Underhill, Vergennes, Vernon, Waitsfield, Walden,
Wardsboro, Warren, Washington, Waterbury, Waterford, Waterville, Weathersfield, Wells, West
Fairlee, Westfield, Westford, Westminster, Weybridge, Williamstown, Williston, Wilmington,
Windham, Windsor, Winooski, Woodbury, Woodford, and Woodstock.
The map in Figure 1, seen on the next page, highlights the towns from which each of the
completed surveys originated and demonstrates that results originated from areas across the state
in both rural (northern, eastern, and southern areas of Vermont) and urban areas (towns near
Burlington and Rutland.)
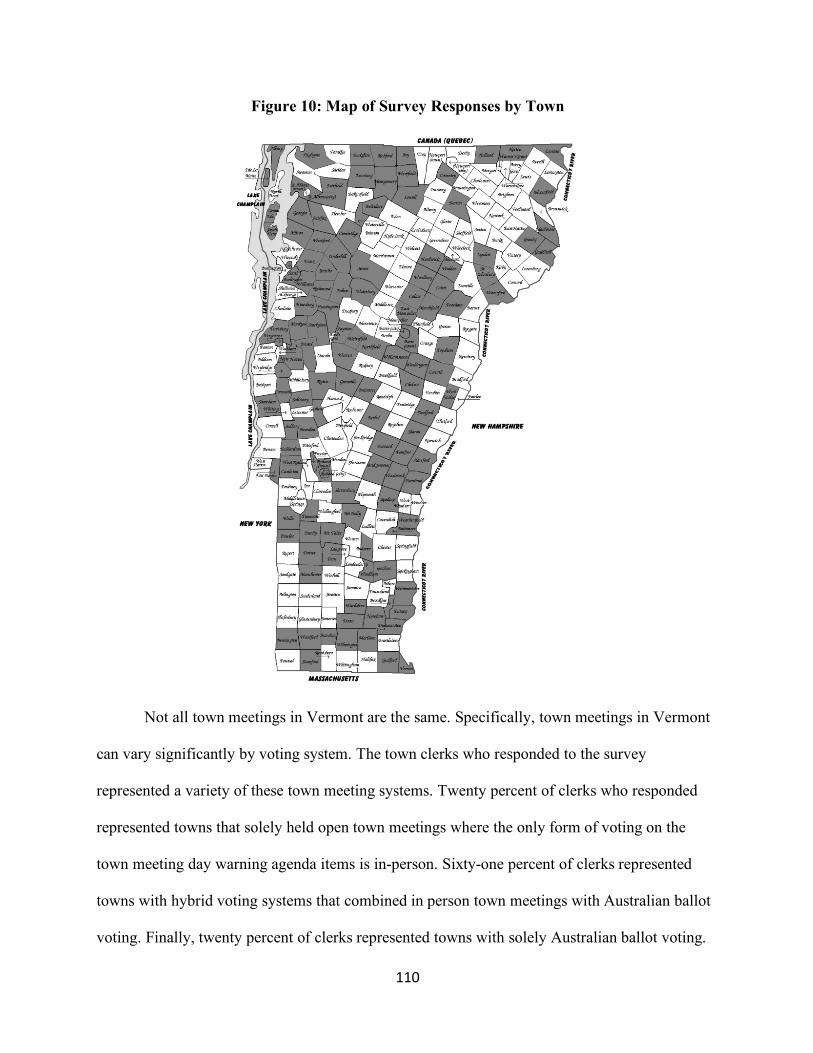
110
Figure 10: Map of Survey Responses by Town
Not all town meetings in Vermont are the same. Specifically, town meetings in Vermont
can vary significantly by voting system. The town clerks who responded to the survey
represented a variety of these town meeting systems. Twenty percent of clerks who responded
represented towns that solely held open town meetings where the only form of voting on the
town meeting day warning agenda items is in-person. Sixty-one percent of clerks represented
towns with hybrid voting systems that combined in person town meetings with Australian ballot
voting. Finally, twenty percent of clerks represented towns with solely Australian ballot voting.
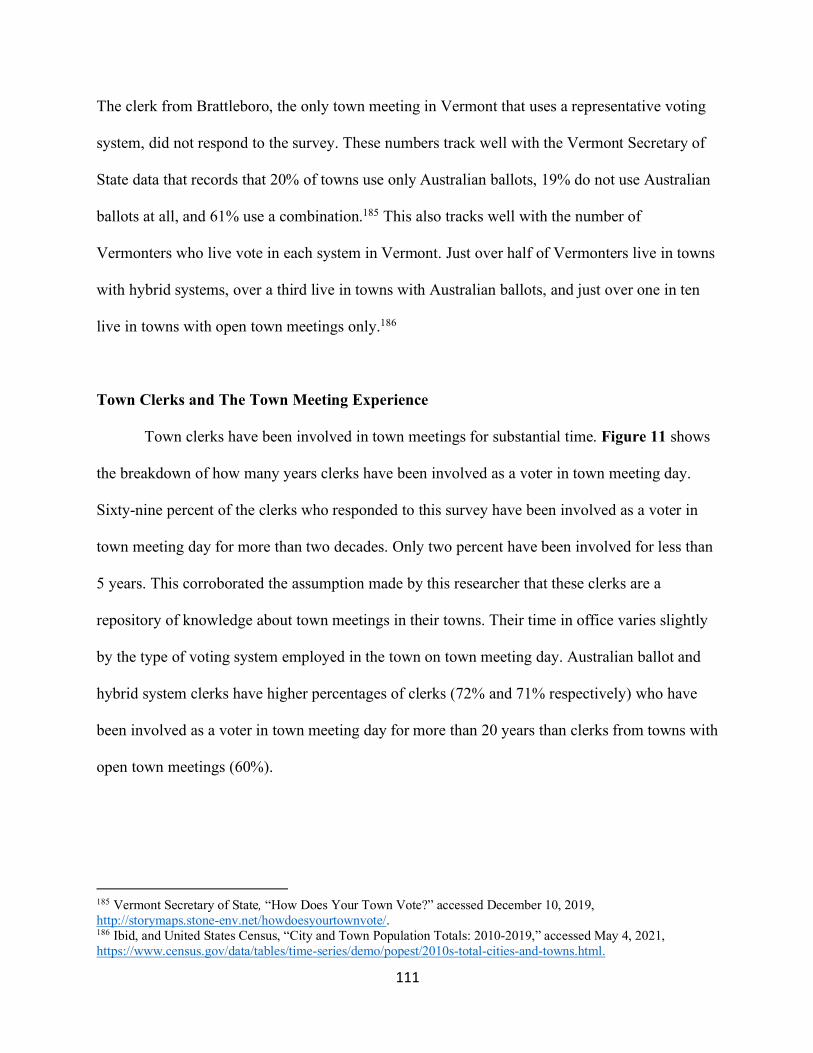
111
The clerk from Brattleboro, the only town meeting in Vermont that uses a representative voting
system, did not respond to the survey. These numbers track well with the Vermont Secretary of
State data that records that 20% of towns use only Australian ballots, 19% do not use Australian
ballots at all, and 61% use a combination.185 This also tracks well with the number of
Vermonters who live vote in each system in Vermont. Just over half of Vermonters live in towns
with hybrid systems, over a third live in towns with Australian ballots, and just over one in ten
live in towns with open town meetings only.186
Town Clerks and The Town Meeting Experience
Town clerks have been involved in town meetings for substantial time. Figure 11 shows
the breakdown of how many years clerks have been involved as a voter in town meeting day.
Sixty-nine percent of the clerks who responded to this survey have been involved as a voter in
town meeting day for more than two decades. Only two percent have been involved for less than
5 years. This corroborated the assumption made by this researcher that these clerks are a
repository of knowledge about town meetings in their towns. Their time in office varies slightly
by the type of voting system employed in the town on town meeting day. Australian ballot and
hybrid system clerks have higher percentages of clerks (72% and 71% respectively) who have
been involved as a voter in town meeting day for more than 20 years than clerks from towns with
open town meetings (60%).
185 Vermont Secretary of State, “How Does Your Town Vote?” accessed December 10, 2019, http://storymaps.stone-env.net/howdoesyourtownvote/. 186 Ibid, and United States Census, “City and Town Population Totals: 2010-2019,” accessed May 4, 2021, https://www.census.gov/data/tables/time-series/demo/popest/2010s-total-cities-and-towns.html.
112
The town clerks surveyed, on average, have spent over a decade (11.6 years) serving their
towns as clerks. In a post-survey interview, a town clerk from a town with a hybrid voting
system commented that she felt this demonstrated a dangerous precipice in the future of town
meeting day organization. When her predecessor was ready to retire, she described that she had
been at the office every day, ready and willing to take over the role. However, now that she
herself is ready to retire after more than 20 years in the office, nobody has come to her to request
the position or even to learn more about what it would be like. She is unsure of who will take the
role of town clerk once she leaves and is concerned that there is no longer enthusiasm,
willingness, or even ability to take on the role (especially with more drug use and abuse in her
community, which she believes suppresses the pool of possible successors.)
Tenures in office also differs slightly by the voting system. Clerks serving towns with
hybrid systems (12.5) have, on average, served longer than town clerks for towns with only open
town meetings (11.3) and only Australian Ballots (9.1).
Less than 5 years, 2%
5 to 10 …
11 to 15 years, …
16 to 20 years, 9%More than 20 years, 69%
Figure 11: Clerks’ Years as a Voter in Town MeetingsQ2. How many years have you personally been involved as a voter in town
meeting day in Vermont?
113
Thirty one percent of clerks have served under 6 years as a town clerk, while 69% have
served 6 years or more. Throughout the rest of this analysis, clerks who have served less than six
years will be referred to as clerks with “less experience” while those who have served six years
or more will be referred to as clerks with “more experience.” This distinction was made by this
researcher to specifically see if whether the conflict between the theoretical versus practical
emerges between clerks who have had less experience with town meetings and thus might rely
on theory and a more idealistic approach to town meetings and clerks who have had more
experience with the practical realities of town meetings.
A number of the questions in the survey were designed to get a better understanding of
the average town meeting experience in Vermont. Good decorum at town meetings is frequently
described in the literature. This survey asked clerks whether that was still something that rang
true. Ultimately, no town clerk whose town holds open town meetings described the process as
disorderly and Figure 12 shows the breakdown of the rest of the results. Eighty-four percent of
clerks in towns with open town meetings (including only those with hybrid systems and those
with just open town meetings) said that town meetings were very orderly and 16% said they were
somewhat orderly. Clerks from towns with hybrid systems were more likely to describe the
process as very orderly (88%) than those from towns with only open town meetings (76%).
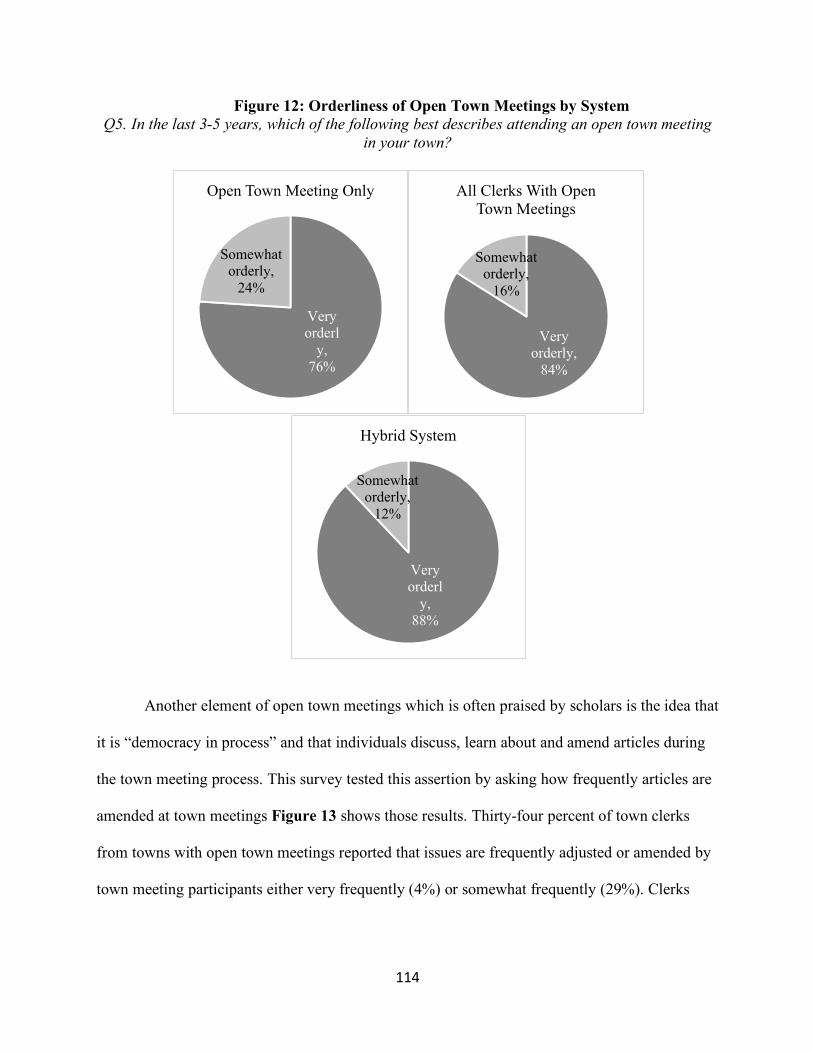
114
Figure 12: Orderliness of Open Town Meetings by System Q5. In the last 3-5 years, which of the following best describes attending an open town meeting
in your town?
Another element of open town meetings which is often praised by scholars is the idea that
it is “democracy in process” and that individuals discuss, learn about and amend articles during
the town meeting process. This survey tested this assertion by asking how frequently articles are
amended at town meetings Figure 13 shows those results. Thirty-four percent of town clerks
from towns with open town meetings reported that issues are frequently adjusted or amended by
town meeting participants either very frequently (4%) or somewhat frequently (29%). Clerks
Very orderl
y, 76%
Somewhat orderly,
24%
Open Town Meeting Only
Very orderly,
84%
Somewhat orderly,
16%
All Clerks With Open Town Meetings
Very orderl
y, 88%
Somewhat orderly,
12%
Hybrid System
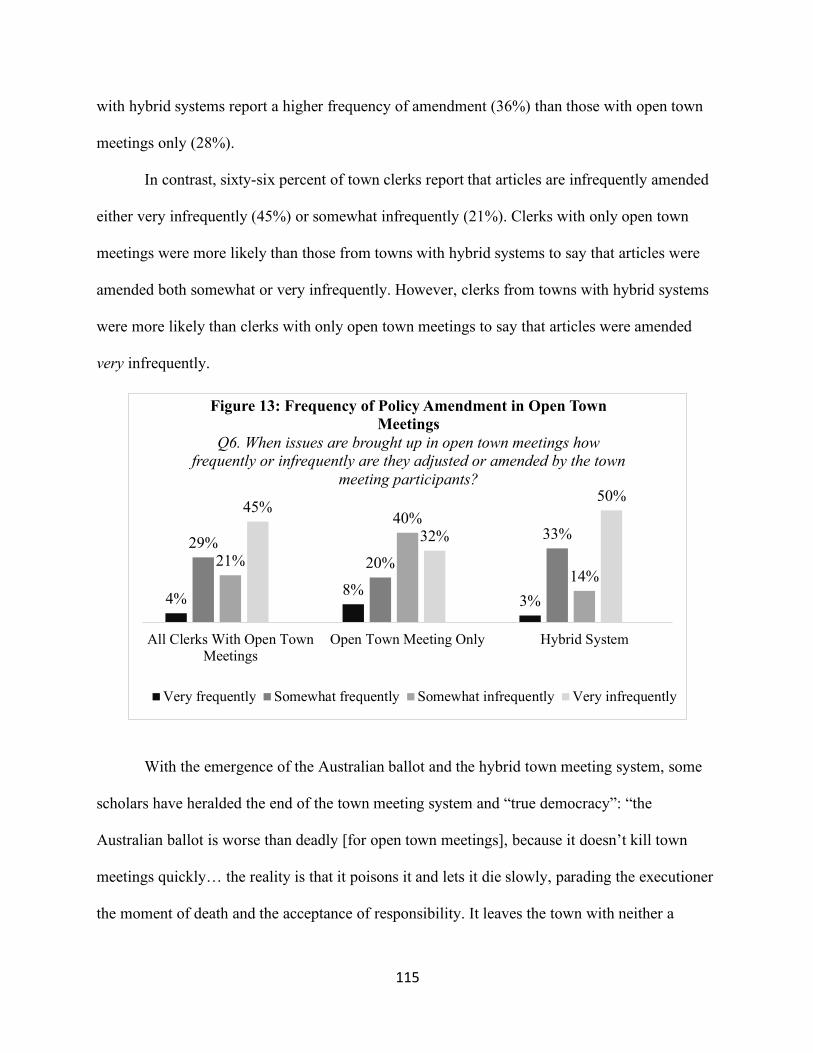
115
with hybrid systems report a higher frequency of amendment (36%) than those with open town
meetings only (28%).
In contrast, sixty-six percent of town clerks report that articles are infrequently amended
either very infrequently (45%) or somewhat infrequently (21%). Clerks with only open town
meetings were more likely than those from towns with hybrid systems to say that articles were
amended both somewhat or very infrequently. However, clerks from towns with hybrid systems
were more likely than clerks with only open town meetings to say that articles were amended
very infrequently.
With the emergence of the Australian ballot and the hybrid town meeting system, some
scholars have heralded the end of the town meeting system and “true democracy”: “the
Australian ballot is worse than deadly [for open town meetings], because it doesn’t kill town
meetings quickly… the reality is that it poisons it and lets it die slowly, parading the executioner
the moment of death and the acceptance of responsibility. It leaves the town with neither a
4% 8%3%
29%20%
33%
21%
40%
14%
45%
32%
50%
All Clerks With Open TownMeetings
Open Town Meeting Only Hybrid System
Figure 13: Frequency of Policy Amendment in Open Town Meetings
Q6. When issues are brought up in open town meetings how frequently or infrequently are they adjusted or amended by the town
meeting participants?
Very frequently Somewhat frequently Somewhat infrequently Very infrequently
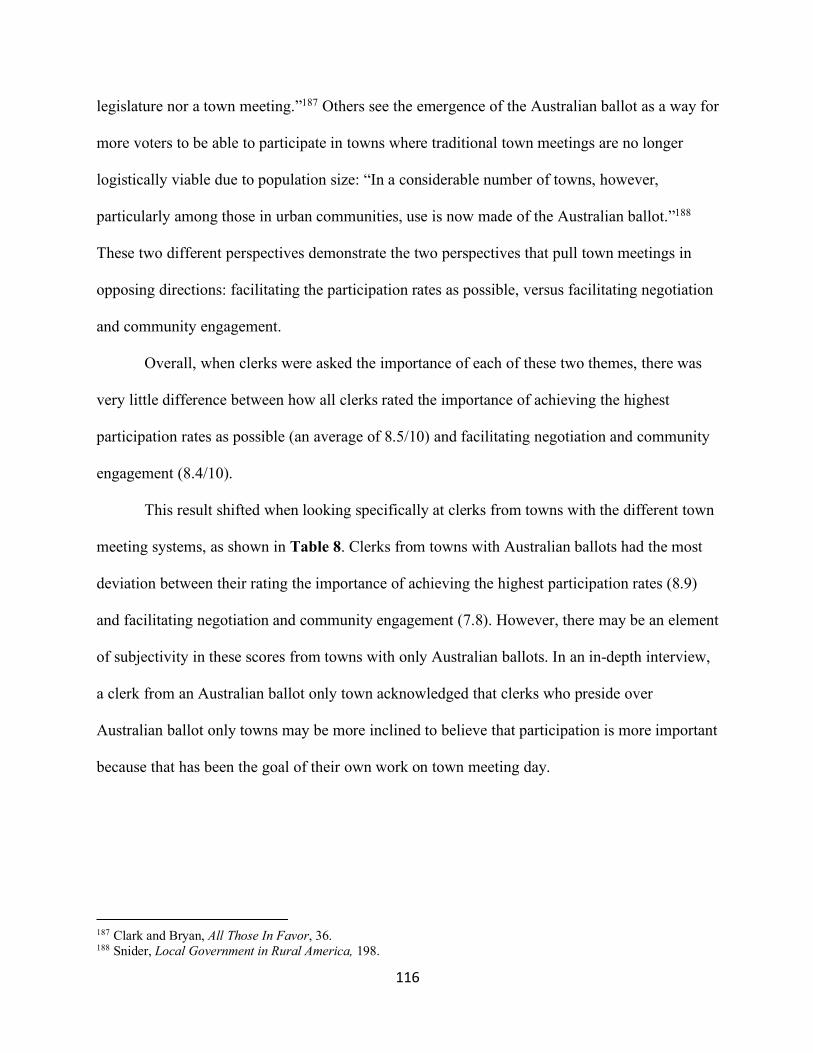
116
legislature nor a town meeting.”187 Others see the emergence of the Australian ballot as a way for
more voters to be able to participate in towns where traditional town meetings are no longer
logistically viable due to population size: “In a considerable number of towns, however,
particularly among those in urban communities, use is now made of the Australian ballot.”188
These two different perspectives demonstrate the two perspectives that pull town meetings in
opposing directions: facilitating the participation rates as possible, versus facilitating negotiation
and community engagement.
Overall, when clerks were asked the importance of each of these two themes, there was
very little difference between how all clerks rated the importance of achieving the highest
participation rates as possible (an average of 8.5/10) and facilitating negotiation and community
engagement (8.4/10).
This result shifted when looking specifically at clerks from towns with the different town
meeting systems, as shown in Table 8. Clerks from towns with Australian ballots had the most
deviation between their rating the importance of achieving the highest participation rates (8.9)
and facilitating negotiation and community engagement (7.8). However, there may be an element
of subjectivity in these scores from towns with only Australian ballots. In an in-depth interview,
a clerk from an Australian ballot only town acknowledged that clerks who preside over
Australian ballot only towns may be more inclined to believe that participation is more important
because that has been the goal of their own work on town meeting day.
187 Clark and Bryan, All Those In Favor, 36. 188 Snider, Local Government in Rural America, 198.
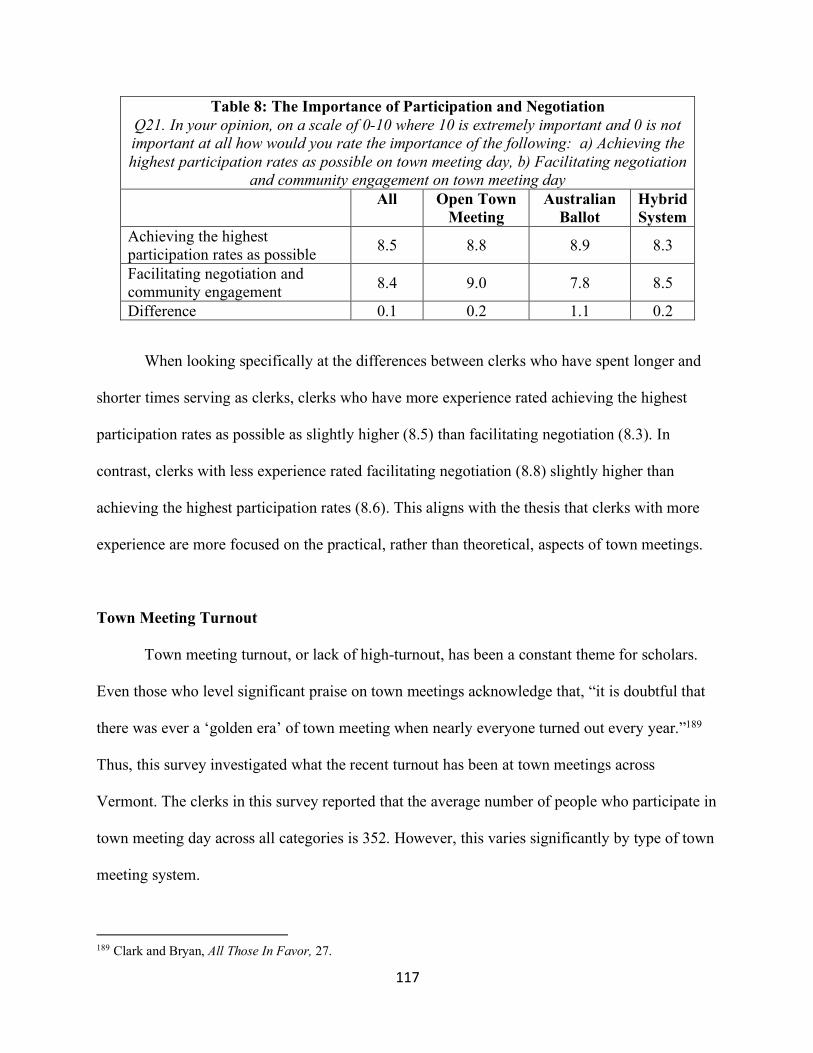
117
Table 8: The Importance of Participation and Negotiation Q21. In your opinion, on a scale of 0-10 where 10 is extremely important and 0 is not important at all how would you rate the importance of the following: a) Achieving the highest participation rates as possible on town meeting day, b) Facilitating negotiation
and community engagement on town meeting day All Open Town
Meeting Australian
Ballot Hybrid System
Achieving the highest participation rates as possible 8.5 8.8 8.9 8.3
Facilitating negotiation and community engagement 8.4 9.0 7.8 8.5
Difference 0.1 0.2 1.1 0.2
When looking specifically at the differences between clerks who have spent longer and
shorter times serving as clerks, clerks who have more experience rated achieving the highest
participation rates as possible as slightly higher (8.5) than facilitating negotiation (8.3). In
contrast, clerks with less experience rated facilitating negotiation (8.8) slightly higher than
achieving the highest participation rates (8.6). This aligns with the thesis that clerks with more
experience are more focused on the practical, rather than theoretical, aspects of town meetings.
Town Meeting Turnout
Town meeting turnout, or lack of high-turnout, has been a constant theme for scholars.
Even those who level significant praise on town meetings acknowledge that, “it is doubtful that
there was ever a ‘golden era’ of town meeting when nearly everyone turned out every year.”189
Thus, this survey investigated what the recent turnout has been at town meetings across
Vermont. The clerks in this survey reported that the average number of people who participate in
town meeting day across all categories is 352. However, this varies significantly by type of town
meeting system.
189 Clark and Bryan, All Those In Favor, 27.
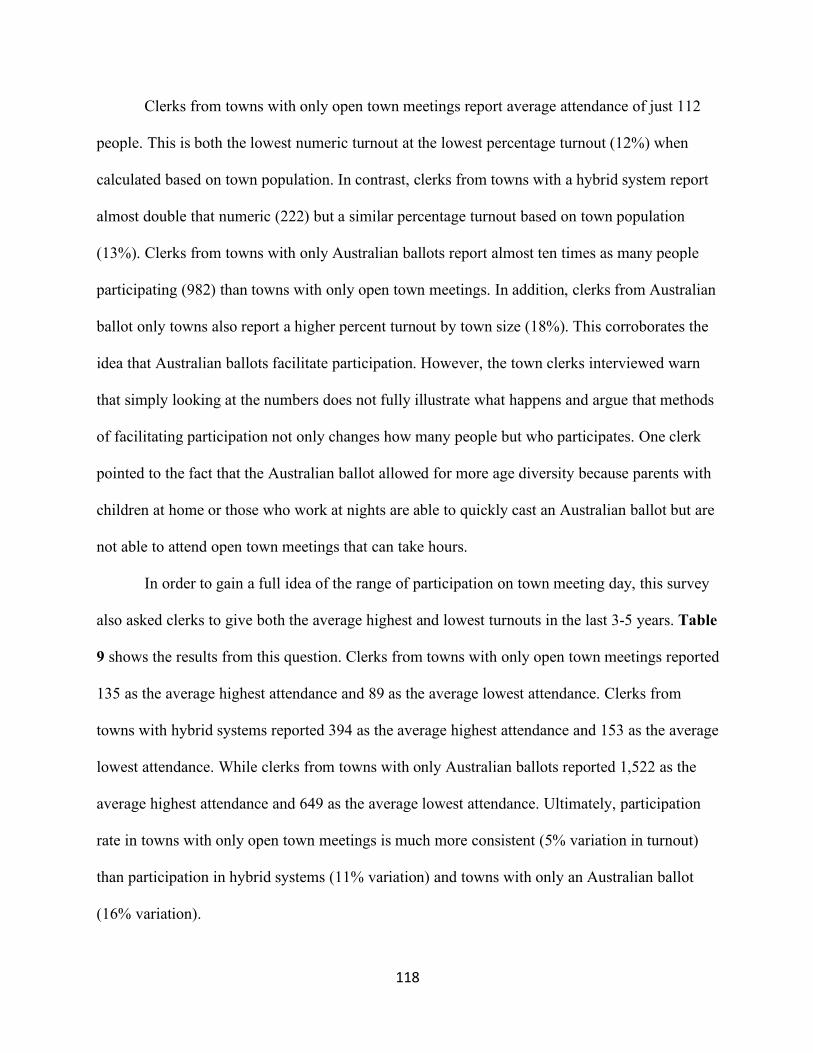
118
Clerks from towns with only open town meetings report average attendance of just 112
people. This is both the lowest numeric turnout at the lowest percentage turnout (12%) when
calculated based on town population. In contrast, clerks from towns with a hybrid system report
almost double that numeric (222) but a similar percentage turnout based on town population
(13%). Clerks from towns with only Australian ballots report almost ten times as many people
participating (982) than towns with only open town meetings. In addition, clerks from Australian
ballot only towns also report a higher percent turnout by town size (18%). This corroborates the
idea that Australian ballots facilitate participation. However, the town clerks interviewed warn
that simply looking at the numbers does not fully illustrate what happens and argue that methods
of facilitating participation not only changes how many people but who participates. One clerk
pointed to the fact that the Australian ballot allowed for more age diversity because parents with
children at home or those who work at nights are able to quickly cast an Australian ballot but are
not able to attend open town meetings that can take hours.
In order to gain a full idea of the range of participation on town meeting day, this survey
also asked clerks to give both the average highest and lowest turnouts in the last 3-5 years. Table
9 shows the results from this question. Clerks from towns with only open town meetings reported
135 as the average highest attendance and 89 as the average lowest attendance. Clerks from
towns with hybrid systems reported 394 as the average highest attendance and 153 as the average
lowest attendance. While clerks from towns with only Australian ballots reported 1,522 as the
average highest attendance and 649 as the average lowest attendance. Ultimately, participation
rate in towns with only open town meetings is much more consistent (5% variation in turnout)
than participation in hybrid systems (11% variation) and towns with only an Australian ballot
(16% variation).
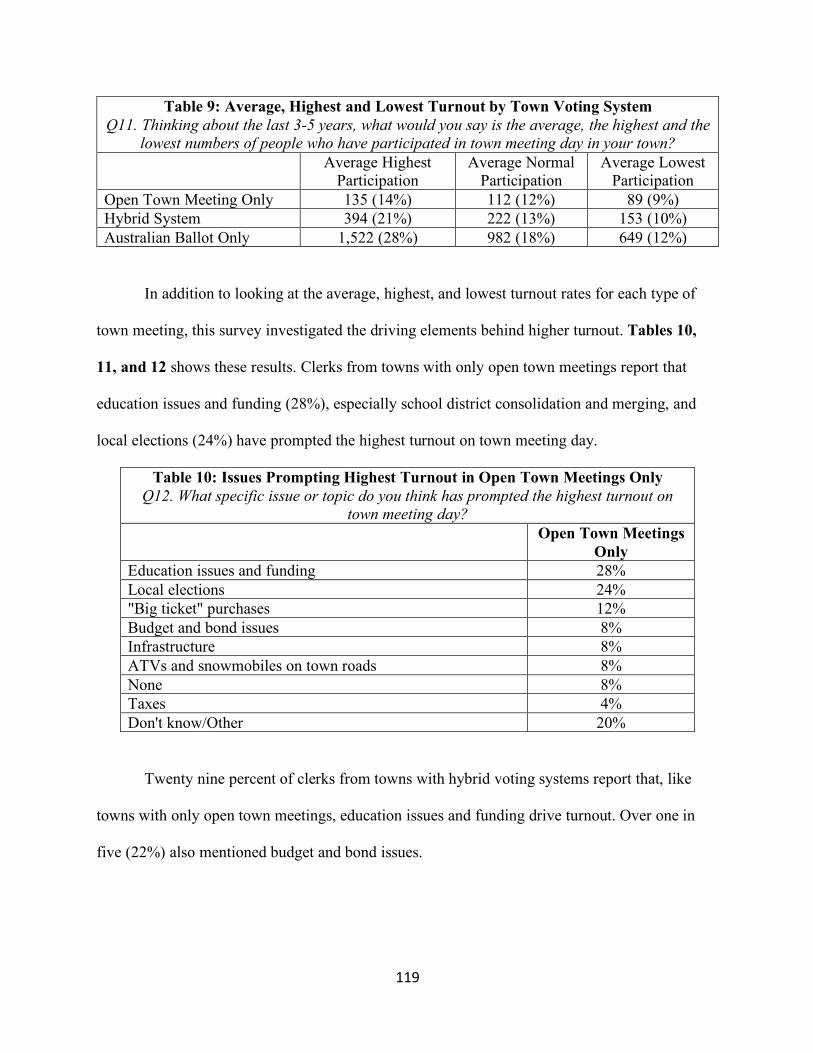
119
Table 9: Average, Highest and Lowest Turnout by Town Voting System Q11. Thinking about the last 3-5 years, what would you say is the average, the highest and the
lowest numbers of people who have participated in town meeting day in your town? Average Highest
Participation Average Normal
Participation Average Lowest
Participation Open Town Meeting Only 135 (14%) 112 (12%) 89 (9%) Hybrid System 394 (21%) 222 (13%) 153 (10%) Australian Ballot Only 1,522 (28%) 982 (18%) 649 (12%)
In addition to looking at the average, highest, and lowest turnout rates for each type of
town meeting, this survey investigated the driving elements behind higher turnout. Tables 10,
11, and 12 shows these results. Clerks from towns with only open town meetings report that
education issues and funding (28%), especially school district consolidation and merging, and
local elections (24%) have prompted the highest turnout on town meeting day.
Table 10: Issues Prompting Highest Turnout in Open Town Meetings Only Q12. What specific issue or topic do you think has prompted the highest turnout on
town meeting day? Open Town Meetings
Only Education issues and funding 28% Local elections 24% "Big ticket" purchases 12% Budget and bond issues 8% Infrastructure 8% ATVs and snowmobiles on town roads 8% None 8% Taxes 4% Don't know/Other 20%
Twenty nine percent of clerks from towns with hybrid voting systems report that, like
towns with only open town meetings, education issues and funding drive turnout. Over one in
five (22%) also mentioned budget and bond issues.
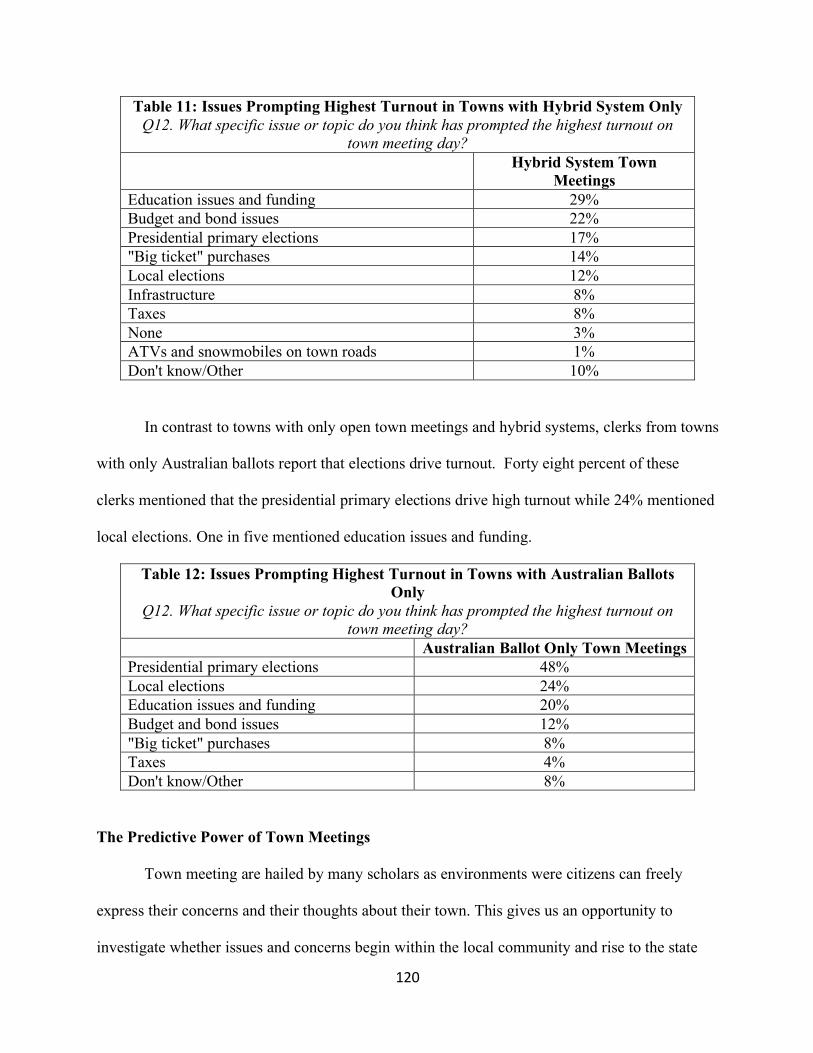
120
Table 11: Issues Prompting Highest Turnout in Towns with Hybrid System Only Q12. What specific issue or topic do you think has prompted the highest turnout on
town meeting day? Hybrid System Town
Meetings Education issues and funding 29% Budget and bond issues 22% Presidential primary elections 17% "Big ticket" purchases 14% Local elections 12% Infrastructure 8% Taxes 8% None 3% ATVs and snowmobiles on town roads 1% Don't know/Other 10%
In contrast to towns with only open town meetings and hybrid systems, clerks from towns
with only Australian ballots report that elections drive turnout. Forty eight percent of these
clerks mentioned that the presidential primary elections drive high turnout while 24% mentioned
local elections. One in five mentioned education issues and funding.
Table 12: Issues Prompting Highest Turnout in Towns with Australian Ballots Only
Q12. What specific issue or topic do you think has prompted the highest turnout on town meeting day?
Australian Ballot Only Town Meetings Presidential primary elections 48% Local elections 24% Education issues and funding 20% Budget and bond issues 12% "Big ticket" purchases 8% Taxes 4% Don't know/Other 8%
The Predictive Power of Town Meetings
Town meeting are hailed by many scholars as environments were citizens can freely
express their concerns and their thoughts about their town. This gives us an opportunity to
investigate whether issues and concerns begin within the local community and rise to the state
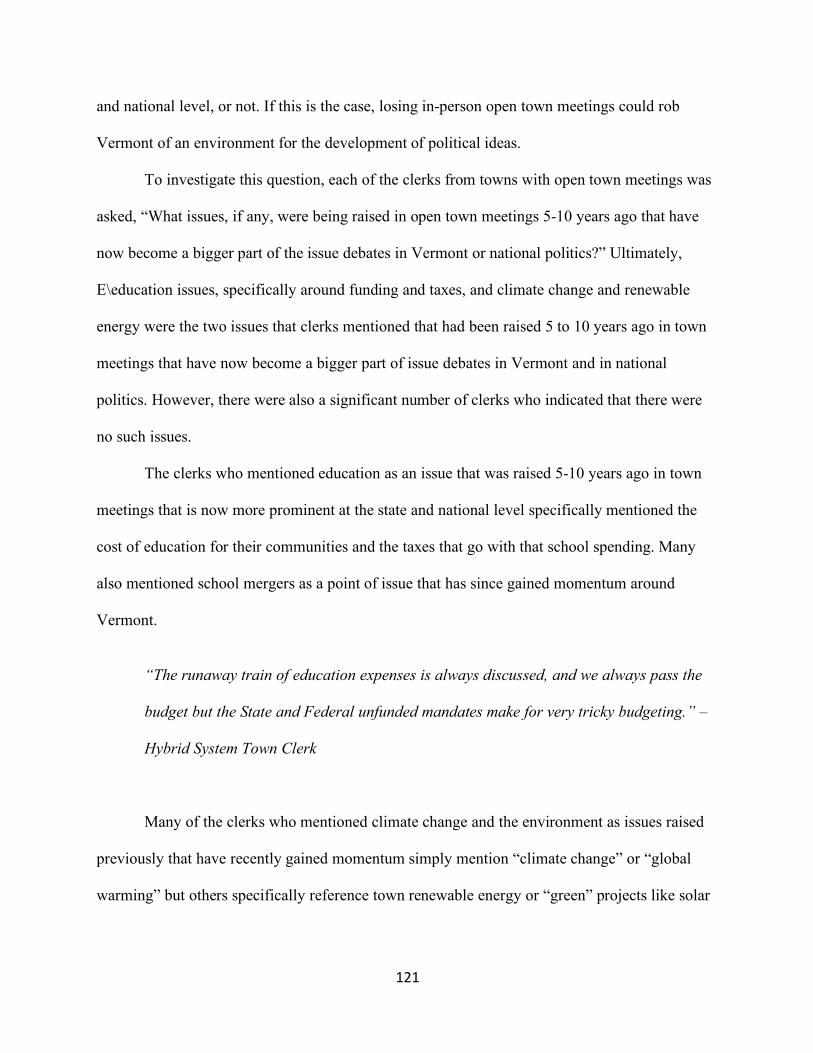
121
and national level, or not. If this is the case, losing in-person open town meetings could rob
Vermont of an environment for the development of political ideas.
To investigate this question, each of the clerks from towns with open town meetings was
asked, “What issues, if any, were being raised in open town meetings 5-10 years ago that have
now become a bigger part of the issue debates in Vermont or national politics?” Ultimately,
E\education issues, specifically around funding and taxes, and climate change and renewable
energy were the two issues that clerks mentioned that had been raised 5 to 10 years ago in town
meetings that have now become a bigger part of issue debates in Vermont and in national
politics. However, there were also a significant number of clerks who indicated that there were
no such issues.
The clerks who mentioned education as an issue that was raised 5-10 years ago in town
meetings that is now more prominent at the state and national level specifically mentioned the
cost of education for their communities and the taxes that go with that school spending. Many
also mentioned school mergers as a point of issue that has since gained momentum around
Vermont.
“The runaway train of education expenses is always discussed, and we always pass the
budget but the State and Federal unfunded mandates make for very tricky budgeting.” –
Hybrid System Town Clerk
Many of the clerks who mentioned climate change and the environment as issues raised
previously that have recently gained momentum simply mention “climate change” or “global
warming” but others specifically reference town renewable energy or “green” projects like solar
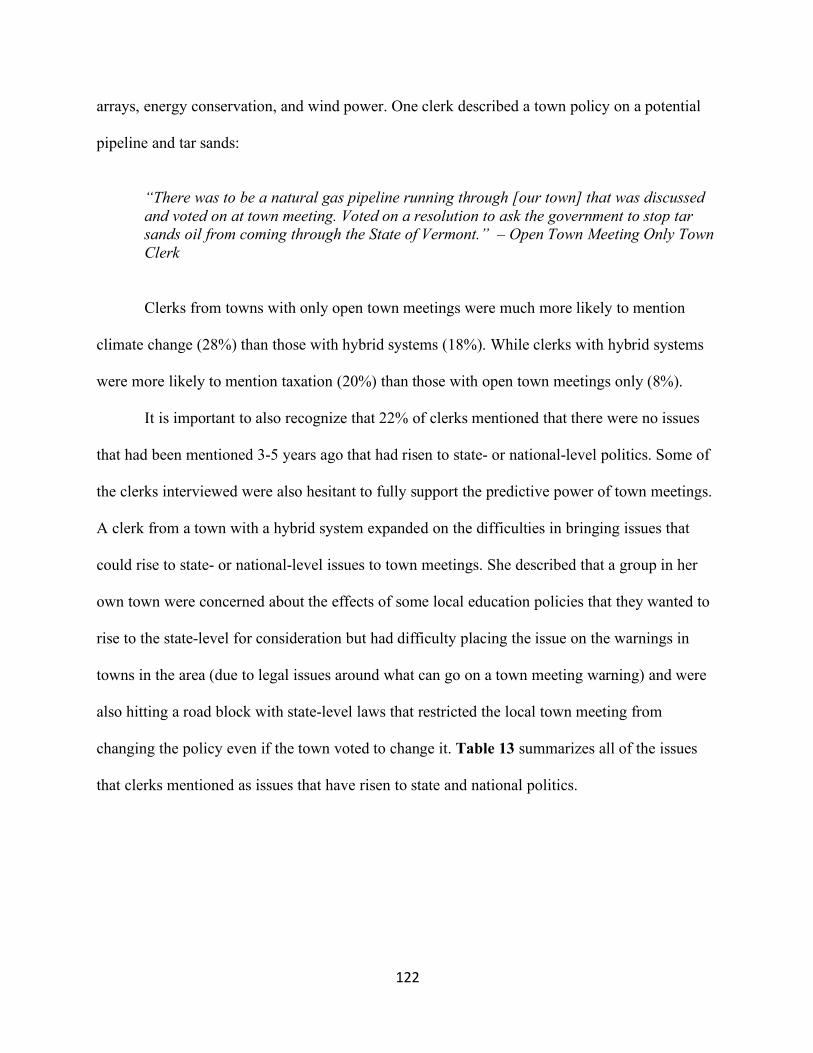
122
arrays, energy conservation, and wind power. One clerk described a town policy on a potential
pipeline and tar sands:
“There was to be a natural gas pipeline running through [our town] that was discussed and voted on at town meeting. Voted on a resolution to ask the government to stop tar sands oil from coming through the State of Vermont.” – Open Town Meeting Only Town Clerk
Clerks from towns with only open town meetings were much more likely to mention
climate change (28%) than those with hybrid systems (18%). While clerks with hybrid systems
were more likely to mention taxation (20%) than those with open town meetings only (8%).
It is important to also recognize that 22% of clerks mentioned that there were no issues
that had been mentioned 3-5 years ago that had risen to state- or national-level politics. Some of
the clerks interviewed were also hesitant to fully support the predictive power of town meetings.
A clerk from a town with a hybrid system expanded on the difficulties in bringing issues that
could rise to state- or national-level issues to town meetings. She described that a group in her
own town were concerned about the effects of some local education policies that they wanted to
rise to the state-level for consideration but had difficulty placing the issue on the warnings in
towns in the area (due to legal issues around what can go on a town meeting warning) and were
also hitting a road block with state-level laws that restricted the local town meeting from
changing the policy even if the town voted to change it. Table 13 summarizes all of the issues
that clerks mentioned as issues that have risen to state and national politics.
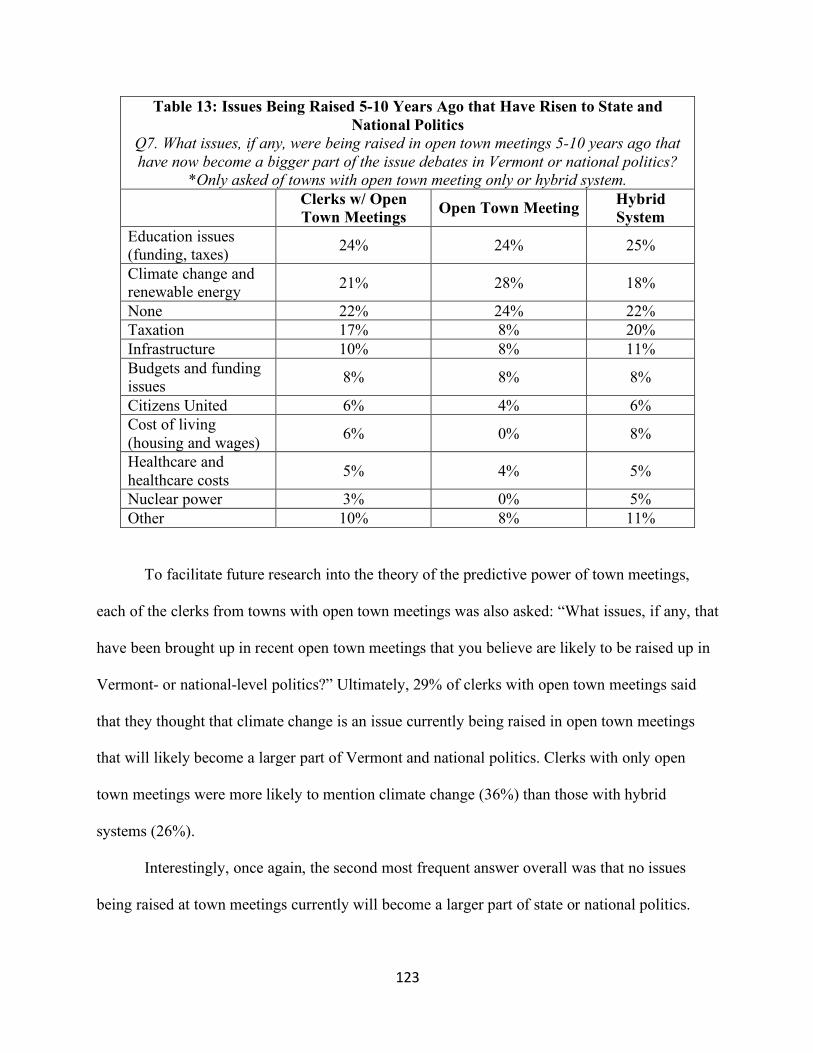
123
Table 13: Issues Being Raised 5-10 Years Ago that Have Risen to State and National Politics
Q7. What issues, if any, were being raised in open town meetings 5-10 years ago that have now become a bigger part of the issue debates in Vermont or national politics?
*Only asked of towns with open town meeting only or hybrid system. Clerks w/ Open
Town Meetings Open Town Meeting Hybrid System
Education issues (funding, taxes) 24% 24% 25%
Climate change and renewable energy 21% 28% 18%
None 22% 24% 22% Taxation 17% 8% 20% Infrastructure 10% 8% 11% Budgets and funding issues 8% 8% 8%
Citizens United 6% 4% 6% Cost of living (housing and wages) 6% 0% 8%
Healthcare and healthcare costs 5% 4% 5%
Nuclear power 3% 0% 5% Other 10% 8% 11%
To facilitate future research into the theory of the predictive power of town meetings,
each of the clerks from towns with open town meetings was also asked: “What issues, if any, that
have been brought up in recent open town meetings that you believe are likely to be raised up in
Vermont- or national-level politics?” Ultimately, 29% of clerks with open town meetings said
that they thought that climate change is an issue currently being raised in open town meetings
that will likely become a larger part of Vermont and national politics. Clerks with only open
town meetings were more likely to mention climate change (36%) than those with hybrid
systems (26%).
Interestingly, once again, the second most frequent answer overall was that no issues
being raised at town meetings currently will become a larger part of state or national politics.
124
The third most frequent answer for clerks with open town meeting only was education issues
(28%). Table 14 summarizes all of these results.
When diving into the specific wording of the answers given by clerks, once again, the
town clerks mentioned “climate change” and “global warming” in general terms. However, some
spoke to some direct action that their towns have recently taken to formalizing the towns
commitment to addressing the issue and to pressure the state government.
“The voters discussed a non-binding resolution on encouraging the state to meet its 50%
renewable energy promise by 2050.” – Open Town Meeting Only Clerk
“We passed a voter petitioned renewable energy article two years ago with very detailed
wording, but with an entirely volunteer taskforce, nothing has been done.” - Hybrid
System Town Clerk
Table 14: Issues That Clerks Believe May Rise to State and National Politics in the Future
Q8. What issues, if any, that have been brought up in recent open town meetings that you believe are likely to be raised up in Vermont- or national-level politics?
All Open Town Meeting
Hybrid System
Climate change 29% 36% 26% None 22% 24% 22% Education 21% 28% 18% Taxes 9% 4% 11% Infrastructure 9% 4% 11% Healthcare access and costs 7% 4% 8% Aging population 4% 0% 6% Cannabis marketplace 3% 4% 3% Cost of living 3% 4% 3% Budget Issues 3% 0% 5% Other 12% 4% 15%
125
While “None” was the second most given answer for a current issue with the potential for
momentum, education was the third most prominent answer. Once again, the cost of education,
taxes to fund schools, and issues with school consolidations were the most prominent issues
related to education. Some clerks also mentioned the decreasing school-aged population in
Vermont.
Once again, the town clerks interviewed were hesitant to fully support the idea of the
predictive power of town meetings. A couple pointed to the coronavirus as an example that it is
sometimes difficult to predict what will emerge in future politics.
Taking all of this into account, the results about whether town meetings have the ability
to predict future state- and national-level politics is mixed. The predictive power of town
meetings seems to be limited to issues like climate change and education that are political issues
both at the local and national level. Even then, some of the logistical aspects of what can go on a
town meeting warning can hinder the ability of open town meetings to predict.
The Future of Town Meetings
Much of the scholarly discussion around the future of town meetings has mentioned the
participation rates in town meetings. Some observers have noted that, “commencing with
Madison’s derision of direct democracy, however, town meeting government has been criticized
primarily for low attendance by registered voters and the alleged domination of the meetings by
special interest groups.”190 Since Madison’s criticisms, the future of open town meetings has
become more and more linked with town meeting participation. The question emerges: Are town
meetings still “direct democracy” or even an effective form of government if participation is low.
190 Zimmerman, The New England Town Meeting, 2-3.
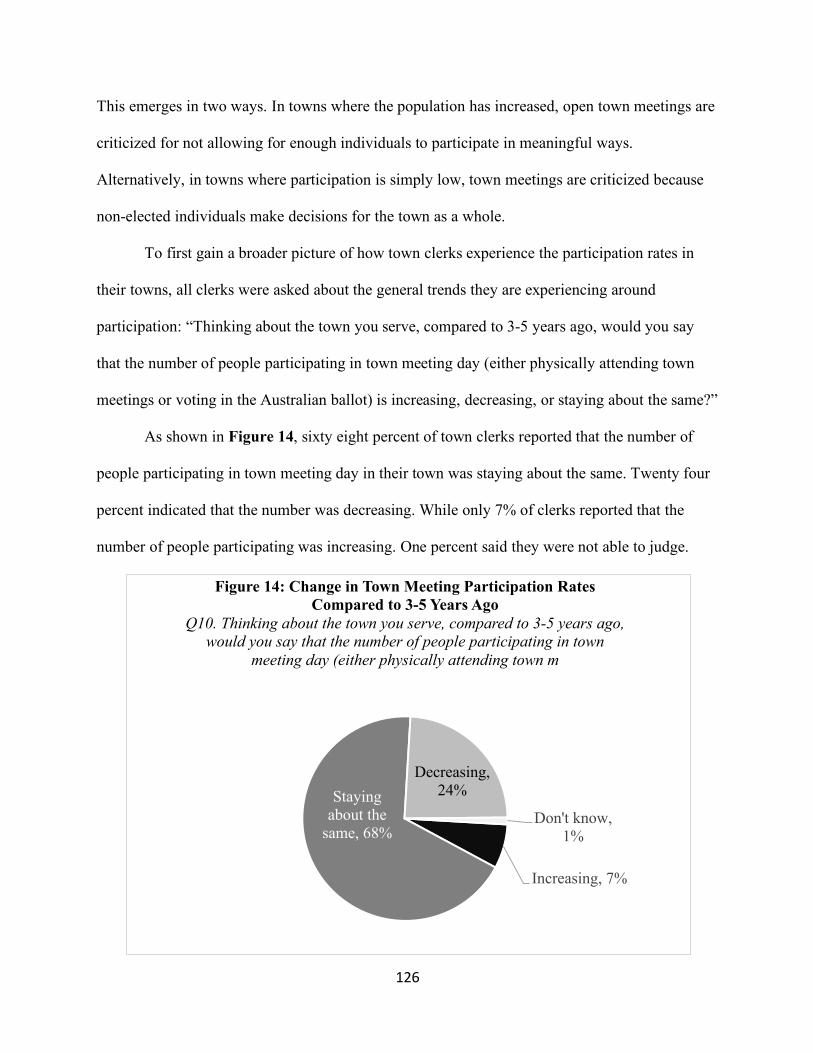
126
This emerges in two ways. In towns where the population has increased, open town meetings are
criticized for not allowing for enough individuals to participate in meaningful ways.
Alternatively, in towns where participation is simply low, town meetings are criticized because
non-elected individuals make decisions for the town as a whole.
To first gain a broader picture of how town clerks experience the participation rates in
their towns, all clerks were asked about the general trends they are experiencing around
participation: “Thinking about the town you serve, compared to 3-5 years ago, would you say
that the number of people participating in town meeting day (either physically attending town
meetings or voting in the Australian ballot) is increasing, decreasing, or staying about the same?”
As shown in Figure 14, sixty eight percent of town clerks reported that the number of
people participating in town meeting day in their town was staying about the same. Twenty four
percent indicated that the number was decreasing. While only 7% of clerks reported that the
number of people participating was increasing. One percent said they were not able to judge.
Increasing, 7%
Staying about the
same, 68%
Decreasing, 24%
Don't know, 1%
Figure 14: Change in Town Meeting Participation Rates Compared to 3-5 Years Ago
Q10. Thinking about the town you serve, compared to 3-5 years ago, would you say that the number of people participating in town
meeting day (either physically attending town m
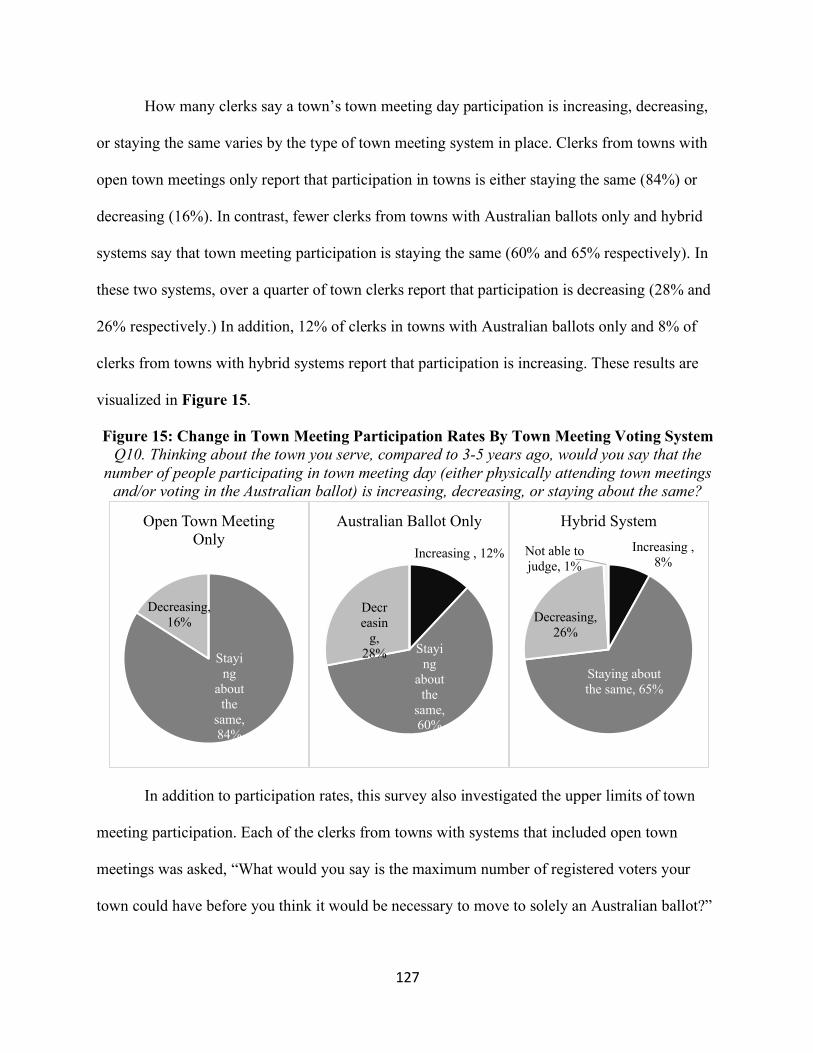
127
How many clerks say a town’s town meeting day participation is increasing, decreasing,
or staying the same varies by the type of town meeting system in place. Clerks from towns with
open town meetings only report that participation in towns is either staying the same (84%) or
decreasing (16%). In contrast, fewer clerks from towns with Australian ballots only and hybrid
systems say that town meeting participation is staying the same (60% and 65% respectively). In
these two systems, over a quarter of town clerks report that participation is decreasing (28% and
26% respectively.) In addition, 12% of clerks in towns with Australian ballots only and 8% of
clerks from towns with hybrid systems report that participation is increasing. These results are
visualized in Figure 15.
Figure 15: Change in Town Meeting Participation Rates By Town Meeting Voting System Q10. Thinking about the town you serve, compared to 3-5 years ago, would you say that the
number of people participating in town meeting day (either physically attending town meetings and/or voting in the Australian ballot) is increasing, decreasing, or staying about the same?
In addition to participation rates, this survey also investigated the upper limits of town
meeting participation. Each of the clerks from towns with systems that included open town
meetings was asked, “What would you say is the maximum number of registered voters your
town could have before you think it would be necessary to move to solely an Australian ballot?”
Staying
about the
same, 84%
Decreasing, 16%
Open Town Meeting Only
Increasing , 12%
Staying
about the
same, 60%
Decreasin
g, 28%
Australian Ballot OnlyIncreasing ,
8%
Staying about the same, 65%
Decreasing, 26%
Not able to judge, 1%
Hybrid System
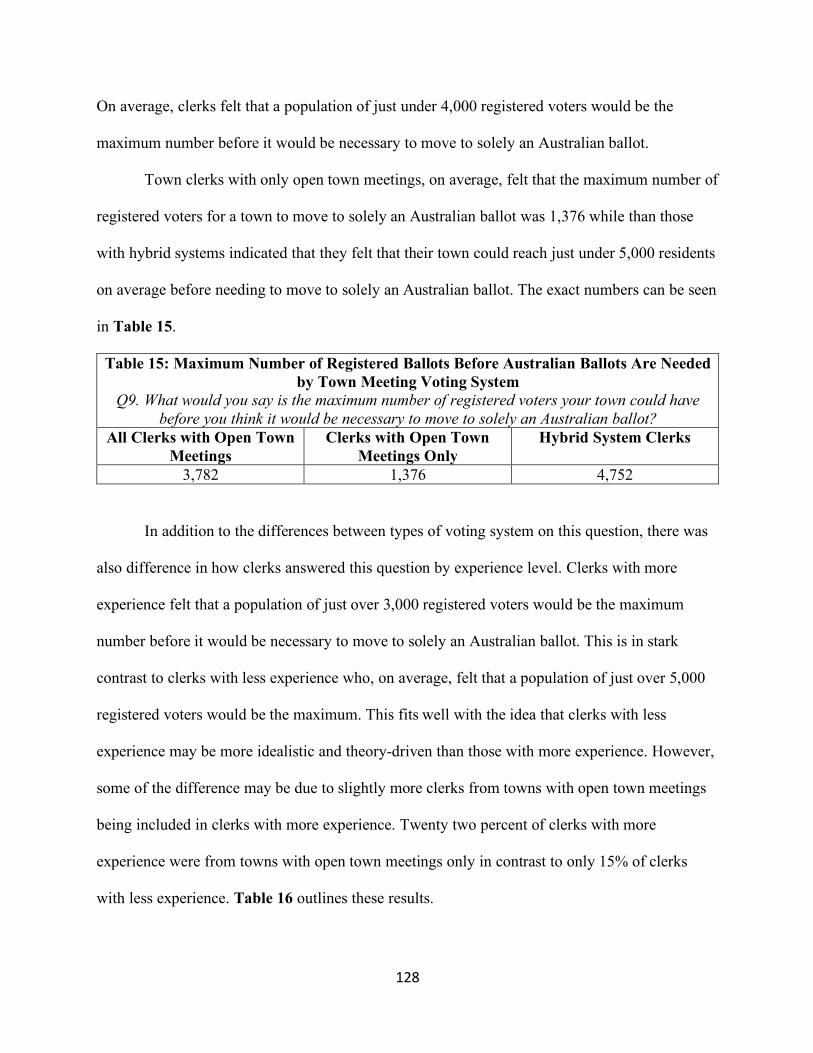
128
On average, clerks felt that a population of just under 4,000 registered voters would be the
maximum number before it would be necessary to move to solely an Australian ballot.
Town clerks with only open town meetings, on average, felt that the maximum number of
registered voters for a town to move to solely an Australian ballot was 1,376 while than those
with hybrid systems indicated that they felt that their town could reach just under 5,000 residents
on average before needing to move to solely an Australian ballot. The exact numbers can be seen
in Table 15.
Table 15: Maximum Number of Registered Ballots Before Australian Ballots Are Needed by Town Meeting Voting System
Q9. What would you say is the maximum number of registered voters your town could have before you think it would be necessary to move to solely an Australian ballot?
All Clerks with Open Town Meetings
Clerks with Open Town Meetings Only
Hybrid System Clerks
3,782 1,376 4,752
In addition to the differences between types of voting system on this question, there was
also difference in how clerks answered this question by experience level. Clerks with more
experience felt that a population of just over 3,000 registered voters would be the maximum
number before it would be necessary to move to solely an Australian ballot. This is in stark
contrast to clerks with less experience who, on average, felt that a population of just over 5,000
registered voters would be the maximum. This fits well with the idea that clerks with less
experience may be more idealistic and theory-driven than those with more experience. However,
some of the difference may be due to slightly more clerks from towns with open town meetings
being included in clerks with more experience. Twenty two percent of clerks with more
experience were from towns with open town meetings only in contrast to only 15% of clerks
with less experience. Table 16 outlines these results.
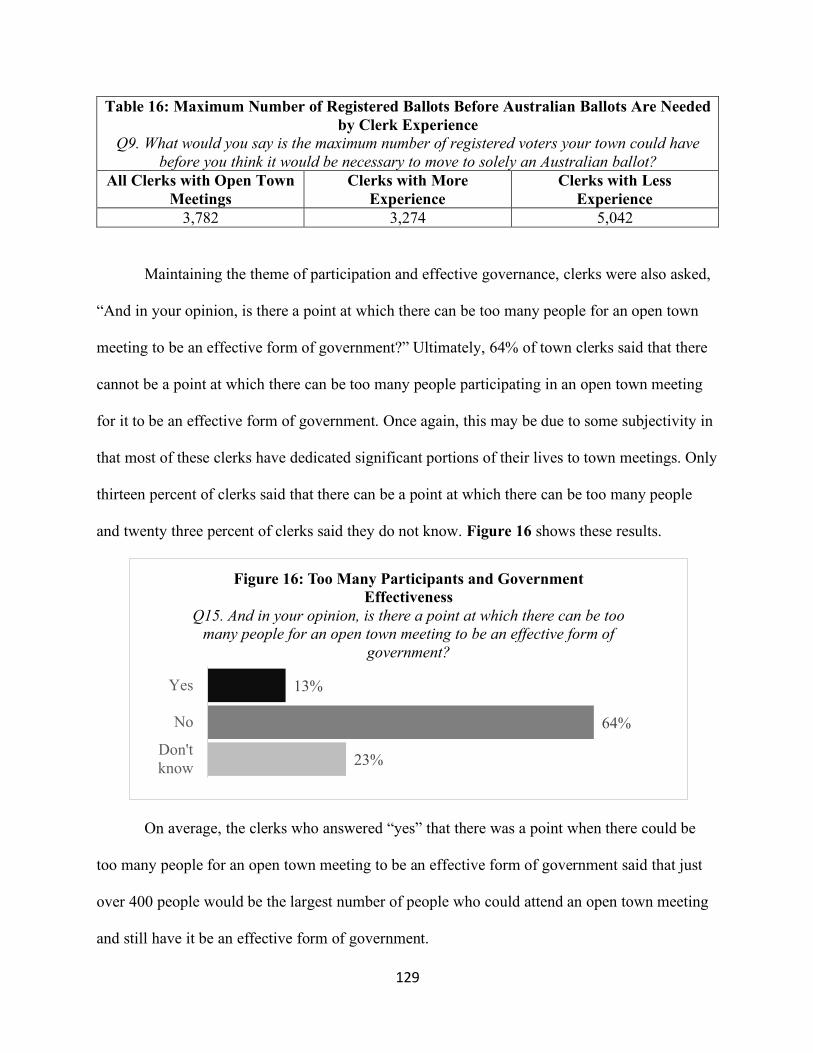
129
Table 16: Maximum Number of Registered Ballots Before Australian Ballots Are Needed by Clerk Experience
Q9. What would you say is the maximum number of registered voters your town could have before you think it would be necessary to move to solely an Australian ballot?
All Clerks with Open Town Meetings
Clerks with More Experience
Clerks with Less Experience
3,782 3,274 5,042
Maintaining the theme of participation and effective governance, clerks were also asked,
“And in your opinion, is there a point at which there can be too many people for an open town
meeting to be an effective form of government?” Ultimately, 64% of town clerks said that there
cannot be a point at which there can be too many people participating in an open town meeting
for it to be an effective form of government. Once again, this may be due to some subjectivity in
that most of these clerks have dedicated significant portions of their lives to town meetings. Only
thirteen percent of clerks said that there can be a point at which there can be too many people
and twenty three percent of clerks said they do not know. Figure 16 shows these results.
On average, the clerks who answered “yes” that there was a point when there could be
too many people for an open town meeting to be an effective form of government said that just
over 400 people would be the largest number of people who could attend an open town meeting
and still have it be an effective form of government.
23%
64%
13%
Don'tknow
No
Yes
Figure 16: Too Many Participants and Government Effectiveness
Q15. And in your opinion, is there a point at which there can be too many people for an open town meeting to be an effective form of
government?
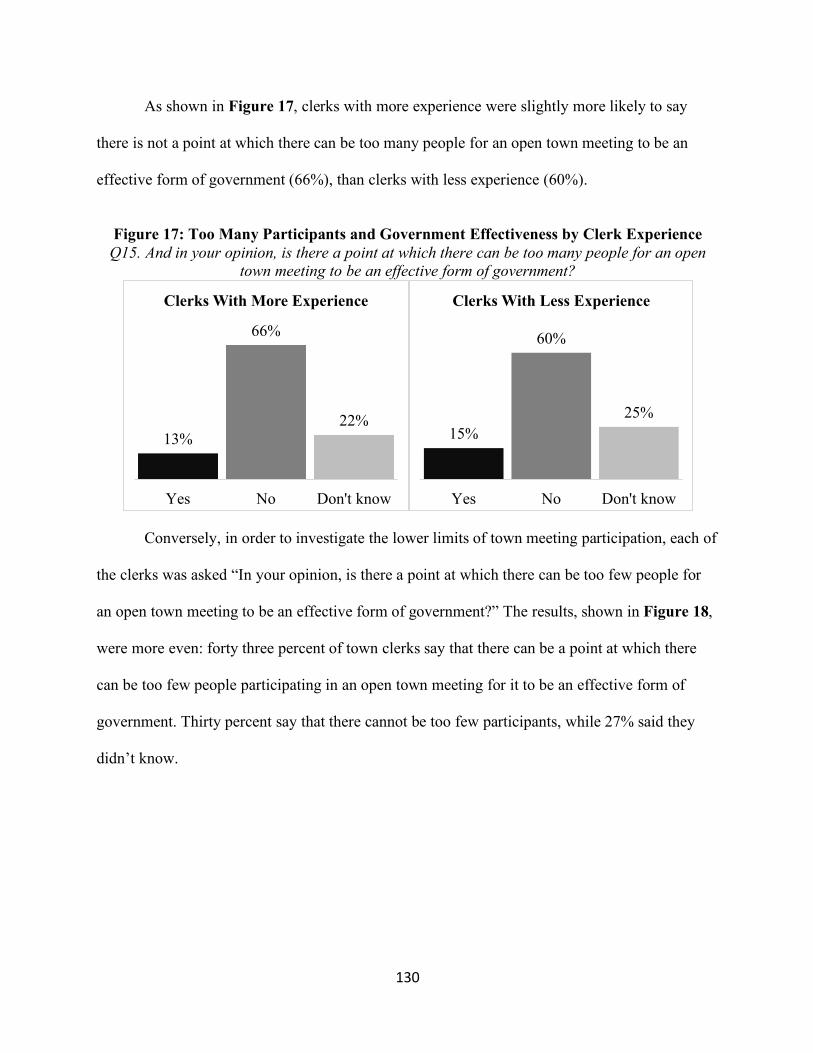
130
As shown in Figure 17, clerks with more experience were slightly more likely to say
there is not a point at which there can be too many people for an open town meeting to be an
effective form of government (66%), than clerks with less experience (60%).
Figure 17: Too Many Participants and Government Effectiveness by Clerk Experience Q15. And in your opinion, is there a point at which there can be too many people for an open
town meeting to be an effective form of government?
Conversely, in order to investigate the lower limits of town meeting participation, each of
the clerks was asked “In your opinion, is there a point at which there can be too few people for
an open town meeting to be an effective form of government?” The results, shown in Figure 18,
were more even: forty three percent of town clerks say that there can be a point at which there
can be too few people participating in an open town meeting for it to be an effective form of
government. Thirty percent say that there cannot be too few participants, while 27% said they
didn’t know.
13%
66%
22%
Yes No Don't know
Clerks With More Experience
15%
60%
25%
Yes No Don't know
Clerks With Less Experience
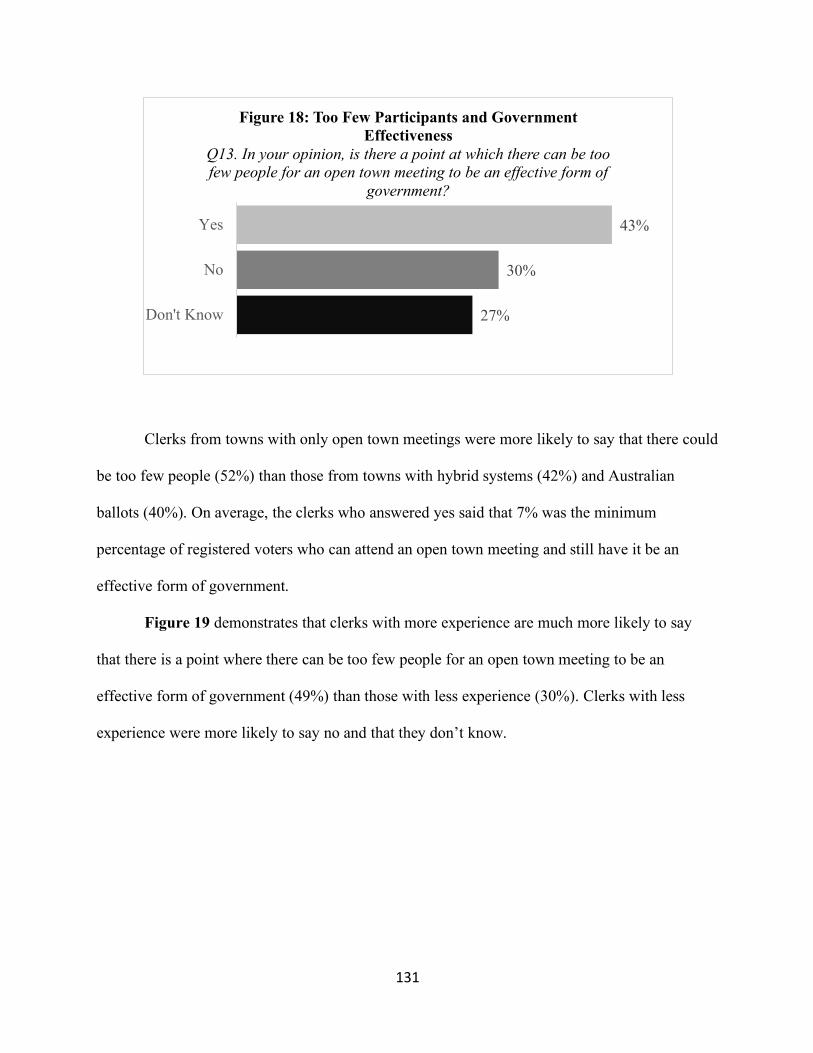
131
Clerks from towns with only open town meetings were more likely to say that there could
be too few people (52%) than those from towns with hybrid systems (42%) and Australian
ballots (40%). On average, the clerks who answered yes said that 7% was the minimum
percentage of registered voters who can attend an open town meeting and still have it be an
effective form of government.
Figure 19 demonstrates that clerks with more experience are much more likely to say
that there is a point where there can be too few people for an open town meeting to be an
effective form of government (49%) than those with less experience (30%). Clerks with less
experience were more likely to say no and that they don’t know.
27%
30%
43%
Don't Know
No
Yes
Figure 18: Too Few Participants and Government Effectiveness
Q13. In your opinion, is there a point at which there can be too few people for an open town meeting to be an effective form of
government?
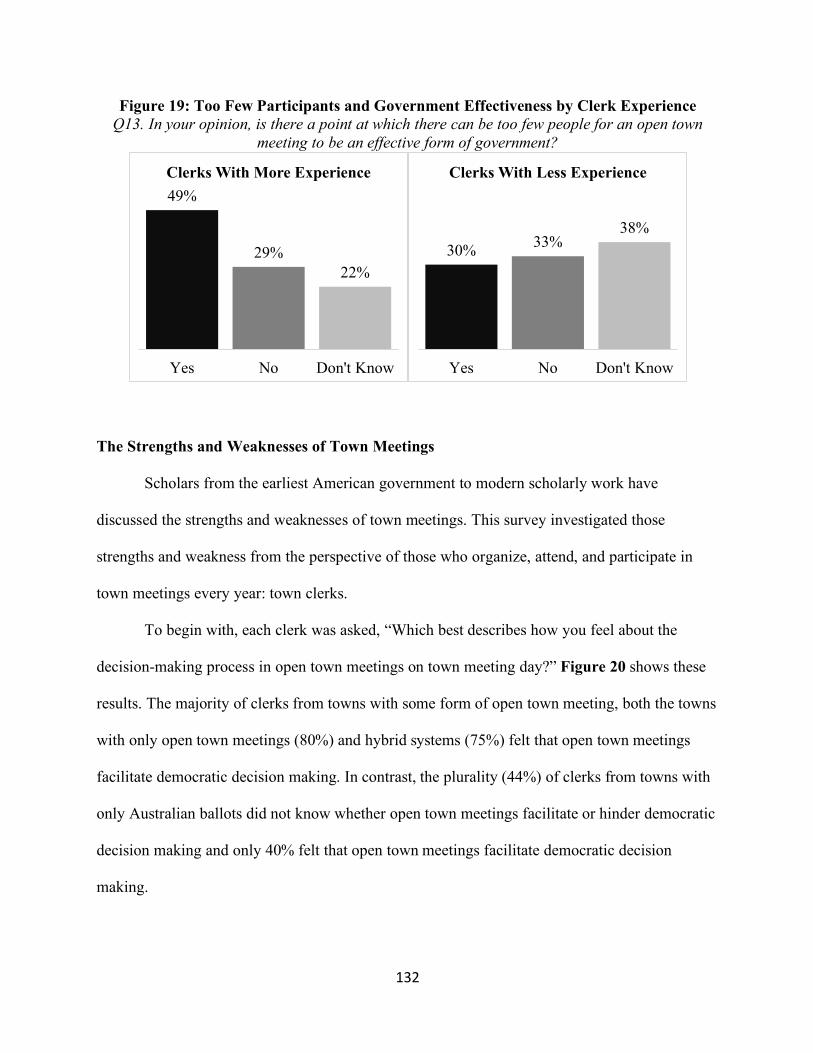
132
Figure 19: Too Few Participants and Government Effectiveness by Clerk Experience Q13. In your opinion, is there a point at which there can be too few people for an open town
meeting to be an effective form of government?
The Strengths and Weaknesses of Town Meetings
Scholars from the earliest American government to modern scholarly work have
discussed the strengths and weaknesses of town meetings. This survey investigated those
strengths and weakness from the perspective of those who organize, attend, and participate in
town meetings every year: town clerks.
To begin with, each clerk was asked, “Which best describes how you feel about the
decision-making process in open town meetings on town meeting day?” Figure 20 shows these
results. The majority of clerks from towns with some form of open town meeting, both the towns
with only open town meetings (80%) and hybrid systems (75%) felt that open town meetings
facilitate democratic decision making. In contrast, the plurality (44%) of clerks from towns with
only Australian ballots did not know whether open town meetings facilitate or hinder democratic
decision making and only 40% felt that open town meetings facilitate democratic decision
making.
49%
29%22%
Yes No Don't Know
Clerks With More Experience
30% 33%38%
Yes No Don't Know
Clerks With Less Experience
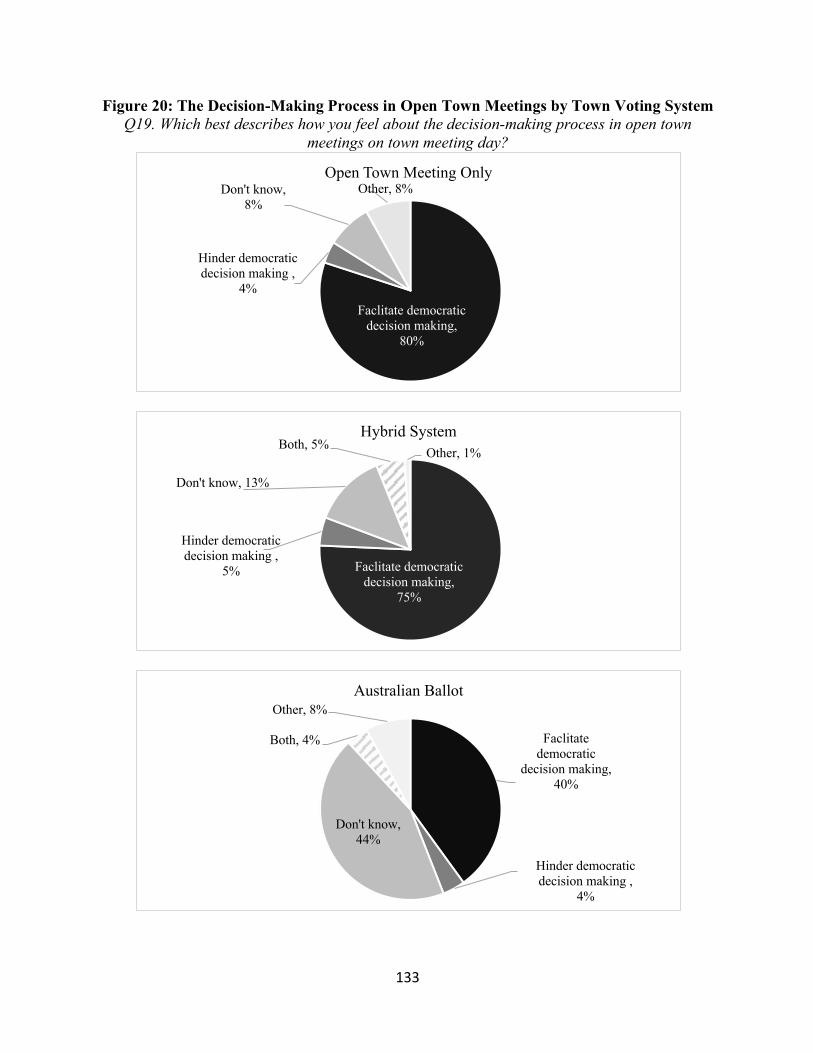
133
Figure 20: The Decision-Making Process in Open Town Meetings by Town Voting System Q19. Which best describes how you feel about the decision-making process in open town
meetings on town meeting day?
Faclitate democratic decision making,
80%
Hinder democratic decision making ,
4%
Don't know, 8%
Other, 8%Open Town Meeting Only
Faclitate democratic decision making,
75%
Hinder democratic decision making ,
5%
Don't know, 13%
Both, 5% Other, 1%Hybrid System
Faclitate democratic
decision making, 40%
Hinder democratic decision making ,
4%
Don't know, 44%
Both, 4%
Other, 8%Australian Ballot
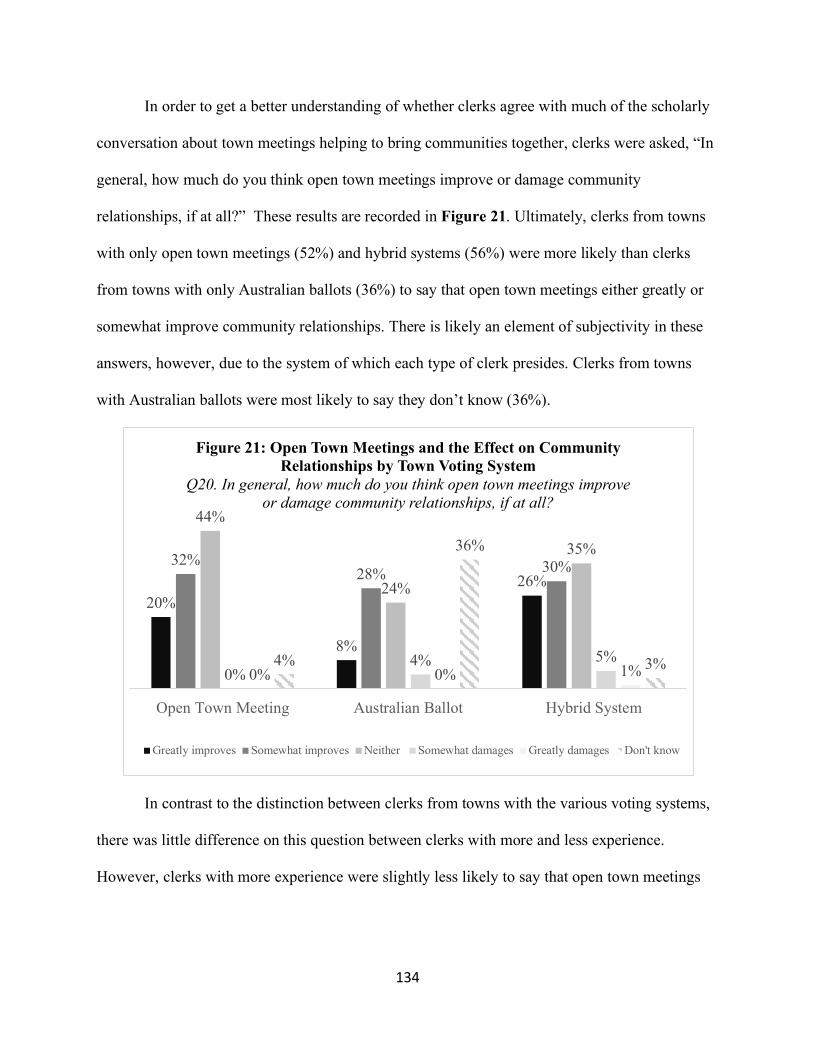
134
In order to get a better understanding of whether clerks agree with much of the scholarly
conversation about town meetings helping to bring communities together, clerks were asked, “In
general, how much do you think open town meetings improve or damage community
relationships, if at all?” These results are recorded in Figure 21. Ultimately, clerks from towns
with only open town meetings (52%) and hybrid systems (56%) were more likely than clerks
from towns with only Australian ballots (36%) to say that open town meetings either greatly or
somewhat improve community relationships. There is likely an element of subjectivity in these
answers, however, due to the system of which each type of clerk presides. Clerks from towns
with Australian ballots were most likely to say they don’t know (36%).
In contrast to the distinction between clerks from towns with the various voting systems,
there was little difference on this question between clerks with more and less experience.
However, clerks with more experience were slightly less likely to say that open town meetings
20%
8%
26%32%
28% 30%
44%
24%
35%
0%4% 5%
0% 0% 1%4%
36%
3%
Open Town Meeting Australian Ballot Hybrid System
Figure 21: Open Town Meetings and the Effect on Community Relationships by Town Voting System
Q20. In general, how much do you think open town meetings improve or damage community relationships, if at all?
Greatly improves Somewhat improves Neither Somewhat damages Greatly damages Don't know
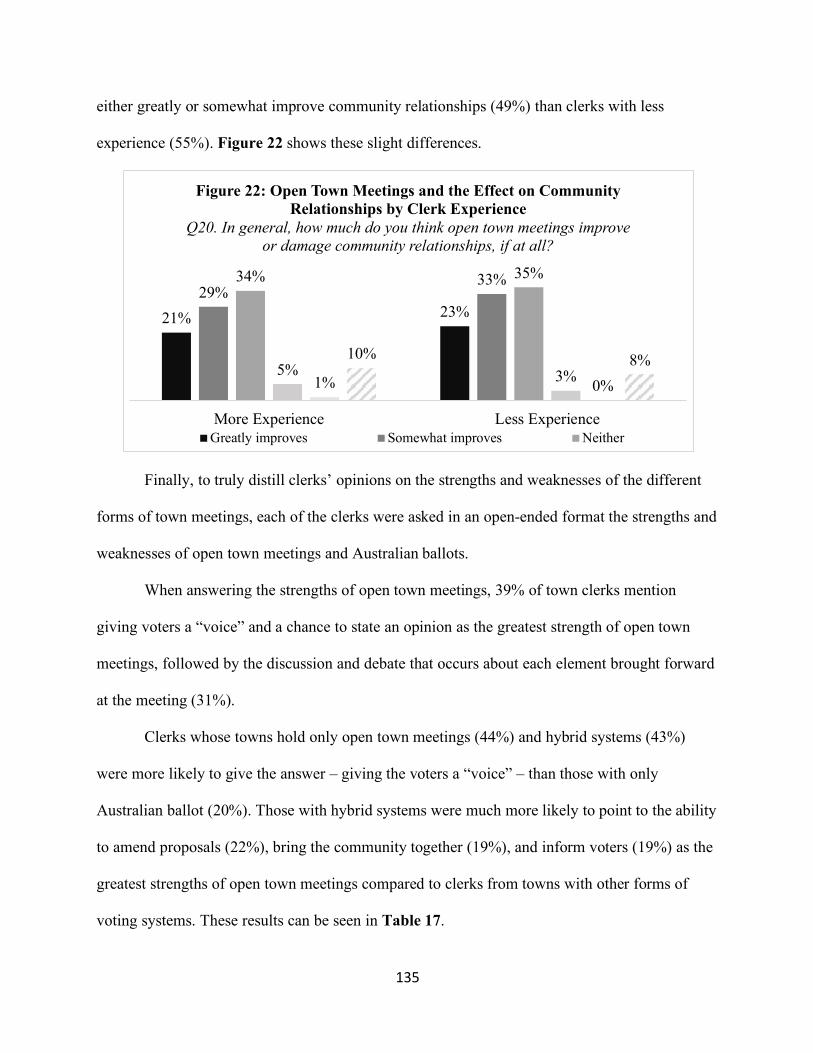
135
either greatly or somewhat improve community relationships (49%) than clerks with less
experience (55%). Figure 22 shows these slight differences.
Finally, to truly distill clerks’ opinions on the strengths and weaknesses of the different
forms of town meetings, each of the clerks were asked in an open-ended format the strengths and
weaknesses of open town meetings and Australian ballots.
When answering the strengths of open town meetings, 39% of town clerks mention
giving voters a “voice” and a chance to state an opinion as the greatest strength of open town
meetings, followed by the discussion and debate that occurs about each element brought forward
at the meeting (31%).
Clerks whose towns hold only open town meetings (44%) and hybrid systems (43%)
were more likely to give the answer – giving the voters a “voice” – than those with only
Australian ballot (20%). Those with hybrid systems were much more likely to point to the ability
to amend proposals (22%), bring the community together (19%), and inform voters (19%) as the
greatest strengths of open town meetings compared to clerks from towns with other forms of
voting systems. These results can be seen in Table 17.
21% 23%29%
33%34% 35%
5% 3%1% 0%
10% 8%
More Experience Less Experience
Figure 22: Open Town Meetings and the Effect on Community Relationships by Clerk Experience
Q20. In general, how much do you think open town meetings improve or damage community relationships, if at all?
Greatly improves Somewhat improves Neither
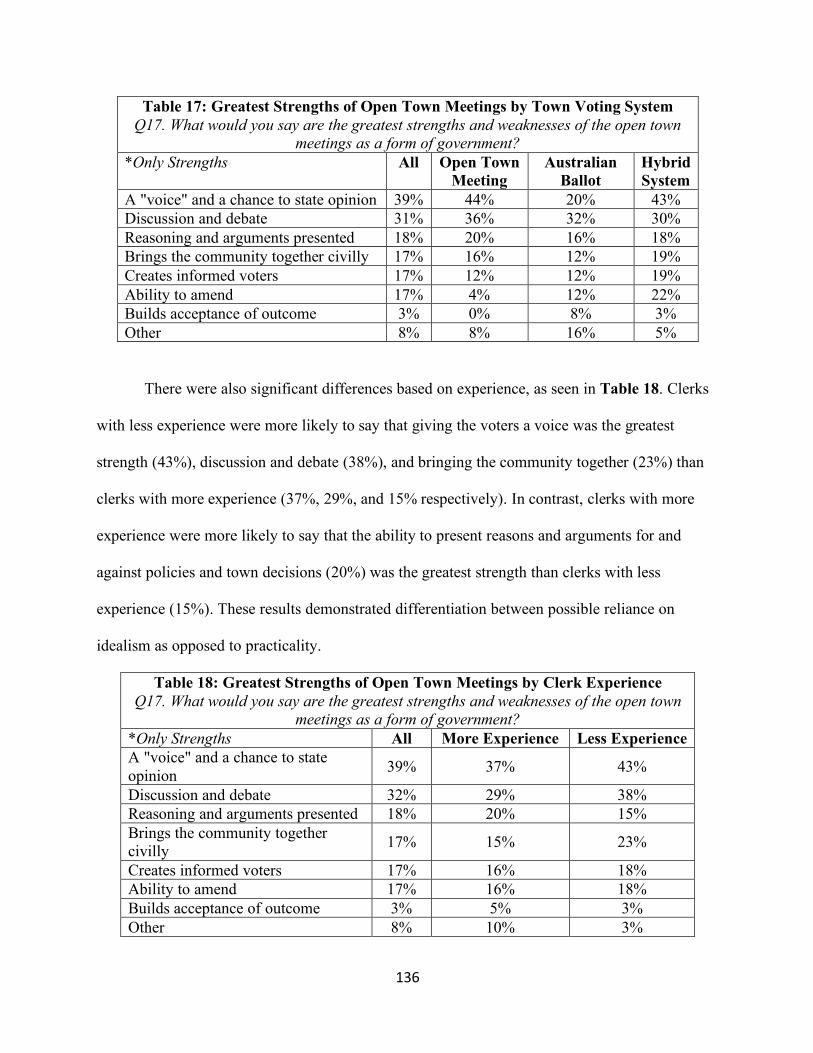
136
Table 17: Greatest Strengths of Open Town Meetings by Town Voting System Q17. What would you say are the greatest strengths and weaknesses of the open town
meetings as a form of government? *Only Strengths All Open Town
Meeting Australian
Ballot Hybrid System
A "voice" and a chance to state opinion 39% 44% 20% 43% Discussion and debate 31% 36% 32% 30% Reasoning and arguments presented 18% 20% 16% 18% Brings the community together civilly 17% 16% 12% 19% Creates informed voters 17% 12% 12% 19% Ability to amend 17% 4% 12% 22% Builds acceptance of outcome 3% 0% 8% 3% Other 8% 8% 16% 5%
There were also significant differences based on experience, as seen in Table 18. Clerks
with less experience were more likely to say that giving the voters a voice was the greatest
strength (43%), discussion and debate (38%), and bringing the community together (23%) than
clerks with more experience (37%, 29%, and 15% respectively). In contrast, clerks with more
experience were more likely to say that the ability to present reasons and arguments for and
against policies and town decisions (20%) was the greatest strength than clerks with less
experience (15%). These results demonstrated differentiation between possible reliance on
idealism as opposed to practicality.
Table 18: Greatest Strengths of Open Town Meetings by Clerk Experience Q17. What would you say are the greatest strengths and weaknesses of the open town
meetings as a form of government? *Only Strengths All More Experience Less Experience A "voice" and a chance to state opinion 39% 37% 43%
Discussion and debate 32% 29% 38% Reasoning and arguments presented 18% 20% 15% Brings the community together civilly 17% 15% 23%
Creates informed voters 17% 16% 18% Ability to amend 17% 16% 18% Builds acceptance of outcome 3% 5% 3% Other 8% 10% 3%
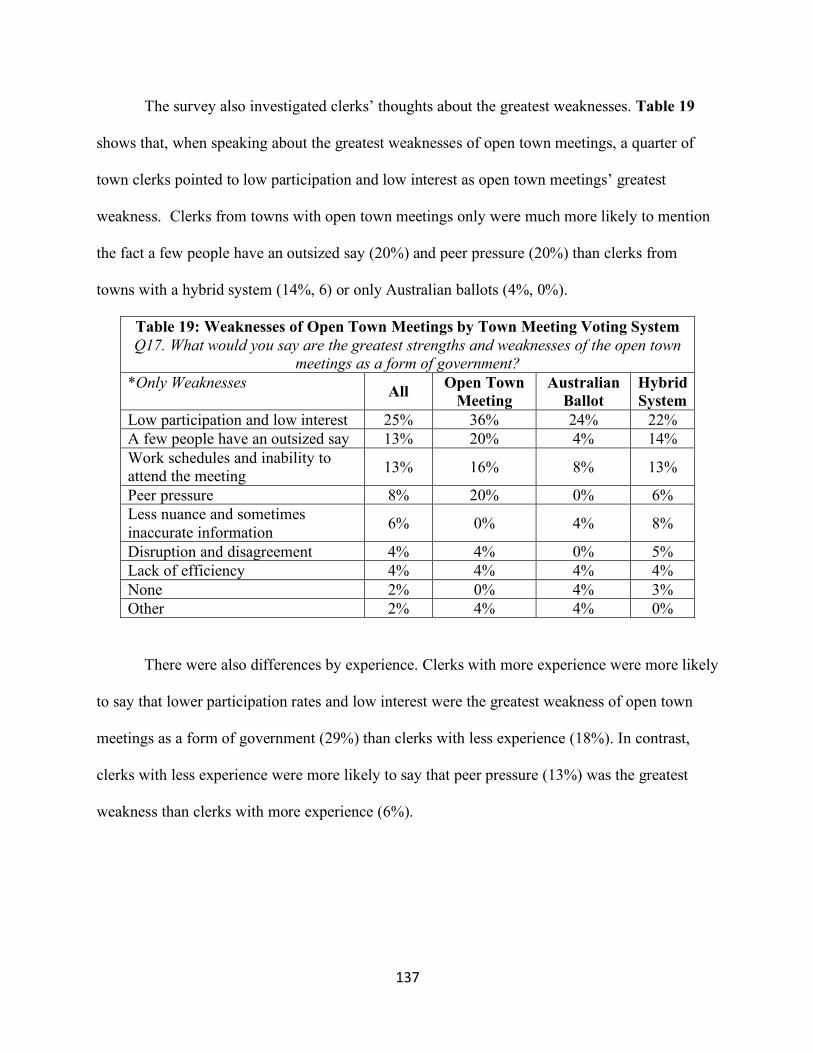
137
The survey also investigated clerks’ thoughts about the greatest weaknesses. Table 19
shows that, when speaking about the greatest weaknesses of open town meetings, a quarter of
town clerks pointed to low participation and low interest as open town meetings’ greatest
weakness. Clerks from towns with open town meetings only were much more likely to mention
the fact a few people have an outsized say (20%) and peer pressure (20%) than clerks from
towns with a hybrid system (14%, 6) or only Australian ballots (4%, 0%).
Table 19: Weaknesses of Open Town Meetings by Town Meeting Voting System Q17. What would you say are the greatest strengths and weaknesses of the open town
meetings as a form of government? *Only Weaknesses All Open Town
Meeting Australian
Ballot Hybrid System
Low participation and low interest 25% 36% 24% 22% A few people have an outsized say 13% 20% 4% 14% Work schedules and inability to attend the meeting 13% 16% 8% 13%
Peer pressure 8% 20% 0% 6% Less nuance and sometimes inaccurate information 6% 0% 4% 8%
Disruption and disagreement 4% 4% 0% 5% Lack of efficiency 4% 4% 4% 4% None 2% 0% 4% 3% Other 2% 4% 4% 0%
There were also differences by experience. Clerks with more experience were more likely
to say that lower participation rates and low interest were the greatest weakness of open town
meetings as a form of government (29%) than clerks with less experience (18%). In contrast,
clerks with less experience were more likely to say that peer pressure (13%) was the greatest
weakness than clerks with more experience (6%).
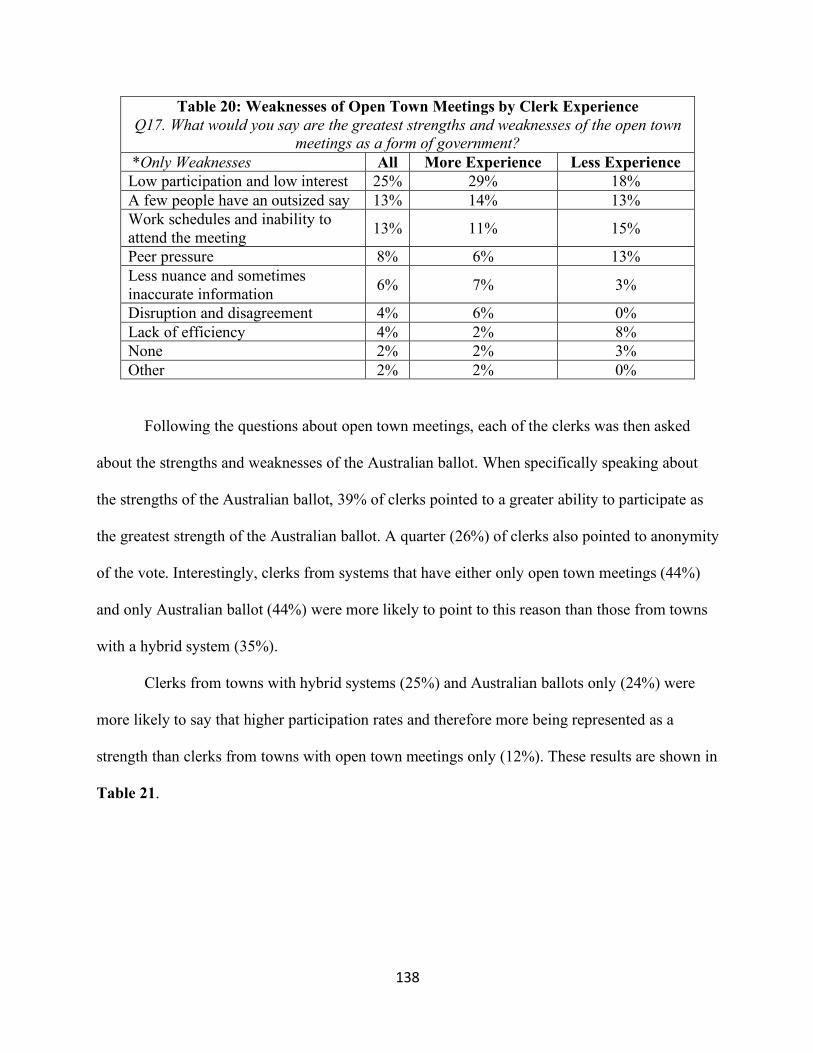
138
Table 20: Weaknesses of Open Town Meetings by Clerk Experience Q17. What would you say are the greatest strengths and weaknesses of the open town
meetings as a form of government? *Only Weaknesses All More Experience Less Experience Low participation and low interest 25% 29% 18% A few people have an outsized say 13% 14% 13% Work schedules and inability to attend the meeting 13% 11% 15%
Peer pressure 8% 6% 13% Less nuance and sometimes inaccurate information 6% 7% 3%
Disruption and disagreement 4% 6% 0% Lack of efficiency 4% 2% 8% None 2% 2% 3% Other 2% 2% 0%
Following the questions about open town meetings, each of the clerks was then asked
about the strengths and weaknesses of the Australian ballot. When specifically speaking about
the strengths of the Australian ballot, 39% of clerks pointed to a greater ability to participate as
the greatest strength of the Australian ballot. A quarter (26%) of clerks also pointed to anonymity
of the vote. Interestingly, clerks from systems that have either only open town meetings (44%)
and only Australian ballot (44%) were more likely to point to this reason than those from towns
with a hybrid system (35%).
Clerks from towns with hybrid systems (25%) and Australian ballots only (24%) were
more likely to say that higher participation rates and therefore more being represented as a
strength than clerks from towns with open town meetings only (12%). These results are shown in
Table 21.
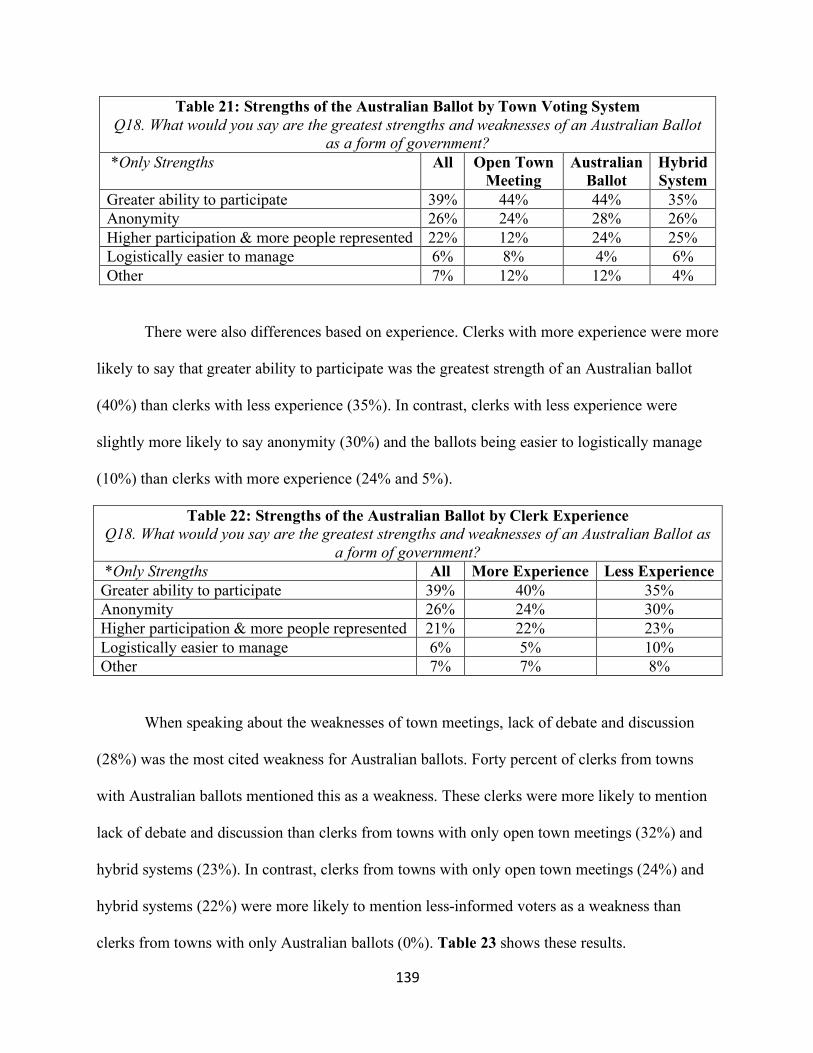
139
Table 21: Strengths of the Australian Ballot by Town Voting System Q18. What would you say are the greatest strengths and weaknesses of an Australian Ballot
as a form of government? *Only Strengths All Open Town
Meeting Australian
Ballot Hybrid System
Greater ability to participate 39% 44% 44% 35% Anonymity 26% 24% 28% 26% Higher participation & more people represented 22% 12% 24% 25% Logistically easier to manage 6% 8% 4% 6% Other 7% 12% 12% 4%
There were also differences based on experience. Clerks with more experience were more
likely to say that greater ability to participate was the greatest strength of an Australian ballot
(40%) than clerks with less experience (35%). In contrast, clerks with less experience were
slightly more likely to say anonymity (30%) and the ballots being easier to logistically manage
(10%) than clerks with more experience (24% and 5%).
Table 22: Strengths of the Australian Ballot by Clerk Experience Q18. What would you say are the greatest strengths and weaknesses of an Australian Ballot as
a form of government? *Only Strengths All More Experience Less Experience Greater ability to participate 39% 40% 35% Anonymity 26% 24% 30% Higher participation & more people represented 21% 22% 23% Logistically easier to manage 6% 5% 10% Other 7% 7% 8%
When speaking about the weaknesses of town meetings, lack of debate and discussion
(28%) was the most cited weakness for Australian ballots. Forty percent of clerks from towns
with Australian ballots mentioned this as a weakness. These clerks were more likely to mention
lack of debate and discussion than clerks from towns with only open town meetings (32%) and
hybrid systems (23%). In contrast, clerks from towns with only open town meetings (24%) and
hybrid systems (22%) were more likely to mention less-informed voters as a weakness than
clerks from towns with only Australian ballots (0%). Table 23 shows these results.
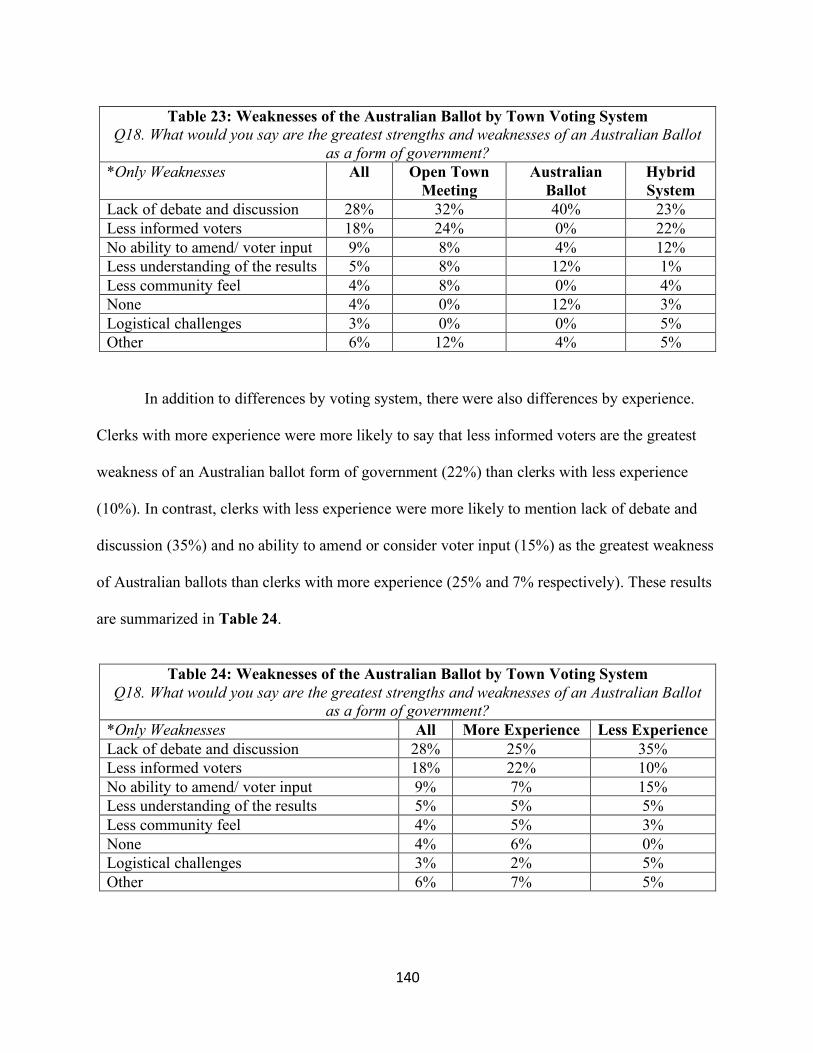
140
In addition to differences by voting system, there were also differences by experience.
Clerks with more experience were more likely to say that less informed voters are the greatest
weakness of an Australian ballot form of government (22%) than clerks with less experience
(10%). In contrast, clerks with less experience were more likely to mention lack of debate and
discussion (35%) and no ability to amend or consider voter input (15%) as the greatest weakness
of Australian ballots than clerks with more experience (25% and 7% respectively). These results
are summarized in Table 24.
Table 24: Weaknesses of the Australian Ballot by Town Voting System
Q18. What would you say are the greatest strengths and weaknesses of an Australian Ballot as a form of government?
*Only Weaknesses All More Experience Less Experience Lack of debate and discussion 28% 25% 35% Less informed voters 18% 22% 10% No ability to amend/ voter input 9% 7% 15% Less understanding of the results 5% 5% 5% Less community feel 4% 5% 3% None 4% 6% 0% Logistical challenges 3% 2% 5% Other 6% 7% 5%
Table 23: Weaknesses of the Australian Ballot by Town Voting System Q18. What would you say are the greatest strengths and weaknesses of an Australian Ballot
as a form of government? *Only Weaknesses All Open Town
Meeting Australian
Ballot Hybrid System
Lack of debate and discussion 28% 32% 40% 23% Less informed voters 18% 24% 0% 22% No ability to amend/ voter input 9% 8% 4% 12% Less understanding of the results 5% 8% 12% 1% Less community feel 4% 8% 0% 4% None 4% 0% 12% 3% Logistical challenges 3% 0% 0% 5% Other 6% 12% 4% 5%
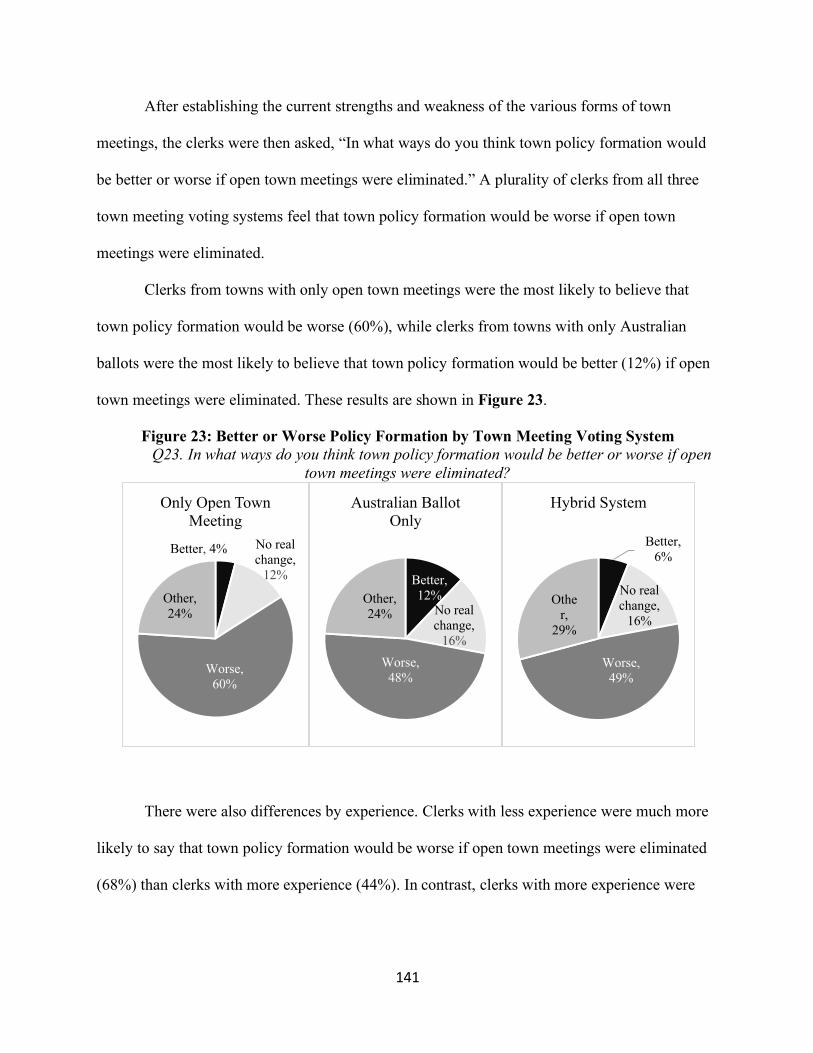
141
After establishing the current strengths and weakness of the various forms of town
meetings, the clerks were then asked, “In what ways do you think town policy formation would
be better or worse if open town meetings were eliminated.” A plurality of clerks from all three
town meeting voting systems feel that town policy formation would be worse if open town
meetings were eliminated.
Clerks from towns with only open town meetings were the most likely to believe that
town policy formation would be worse (60%), while clerks from towns with only Australian
ballots were the most likely to believe that town policy formation would be better (12%) if open
town meetings were eliminated. These results are shown in Figure 23.
Figure 23: Better or Worse Policy Formation by Town Meeting Voting System Q23. In what ways do you think town policy formation would be better or worse if open
town meetings were eliminated?
There were also differences by experience. Clerks with less experience were much more
likely to say that town policy formation would be worse if open town meetings were eliminated
(68%) than clerks with more experience (44%). In contrast, clerks with more experience were
Better, 4% No real change,
12%
Worse, 60%
Other, 24%
Only Open Town Meeting
Better, 12%
No real change,
16%Worse,
48%
Other, 24%
Australian Ballot Only
Better, 6%
No real change,
16%
Worse, 49%
Other,
29%
Hybrid System
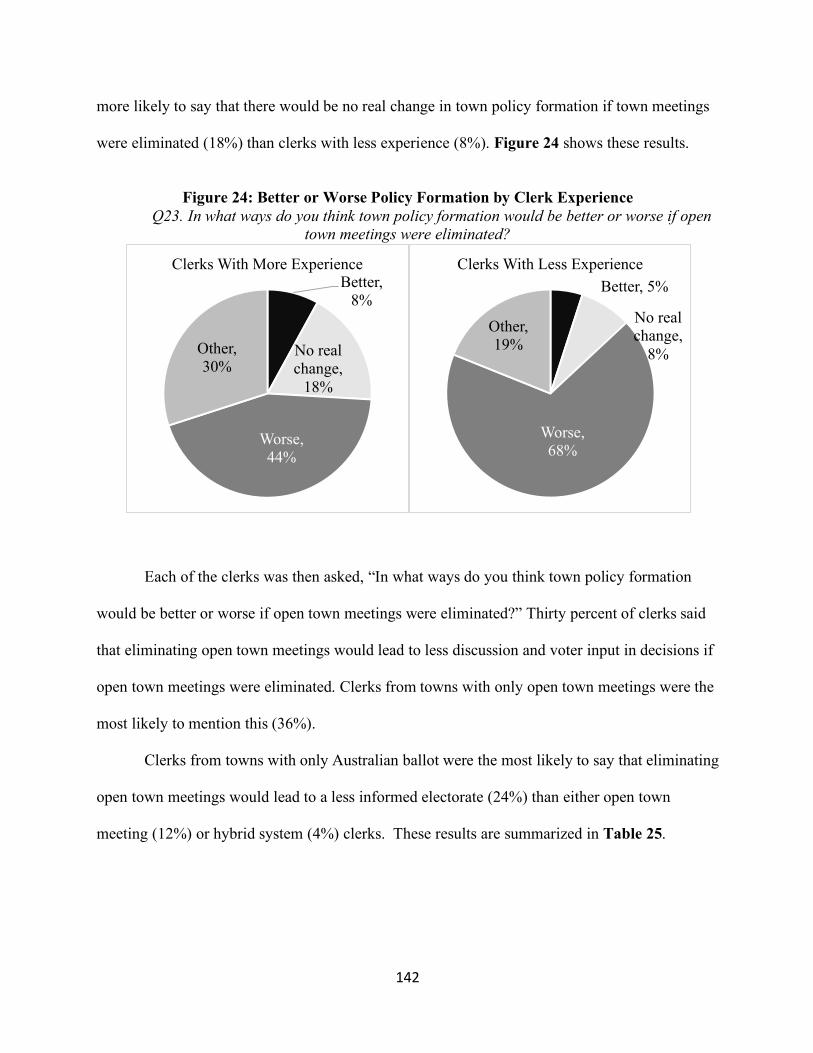
142
more likely to say that there would be no real change in town policy formation if town meetings
were eliminated (18%) than clerks with less experience (8%). Figure 24 shows these results.
Figure 24: Better or Worse Policy Formation by Clerk Experience
Q23. In what ways do you think town policy formation would be better or worse if open town meetings were eliminated?
Each of the clerks was then asked, “In what ways do you think town policy formation
would be better or worse if open town meetings were eliminated?” Thirty percent of clerks said
that eliminating open town meetings would lead to less discussion and voter input in decisions if
open town meetings were eliminated. Clerks from towns with only open town meetings were the
most likely to mention this (36%).
Clerks from towns with only Australian ballot were the most likely to say that eliminating
open town meetings would lead to a less informed electorate (24%) than either open town
meeting (12%) or hybrid system (4%) clerks. These results are summarized in Table 25.
Better, 8%
No real change,
18%
Worse, 44%
Other, 30%
Clerks With More ExperienceBetter, 5%
No real change,
8%
Worse, 68%
Other, 19%
Clerks With Less Experience
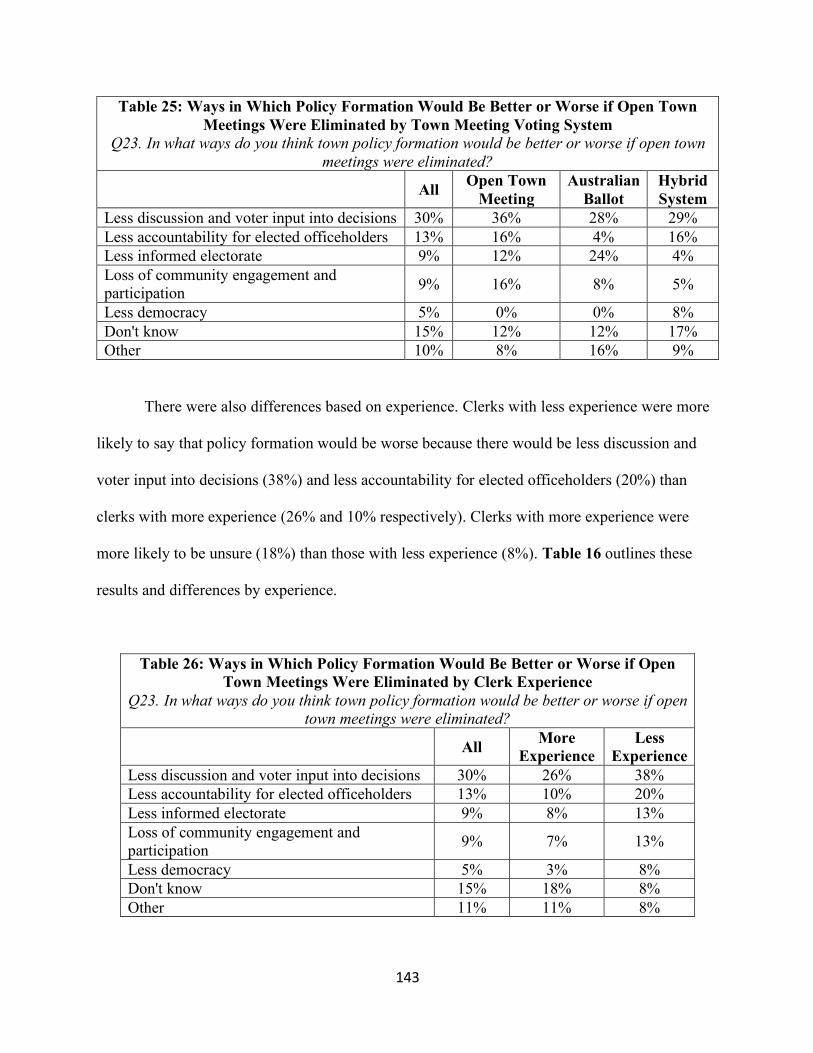
143
Table 25: Ways in Which Policy Formation Would Be Better or Worse if Open Town Meetings Were Eliminated by Town Meeting Voting System
Q23. In what ways do you think town policy formation would be better or worse if open town meetings were eliminated?
All Open Town Meeting
Australian Ballot
Hybrid System
Less discussion and voter input into decisions 30% 36% 28% 29% Less accountability for elected officeholders 13% 16% 4% 16% Less informed electorate 9% 12% 24% 4% Loss of community engagement and participation 9% 16% 8% 5%
Less democracy 5% 0% 0% 8% Don't know 15% 12% 12% 17% Other 10% 8% 16% 9%
There were also differences based on experience. Clerks with less experience were more
likely to say that policy formation would be worse because there would be less discussion and
voter input into decisions (38%) and less accountability for elected officeholders (20%) than
clerks with more experience (26% and 10% respectively). Clerks with more experience were
more likely to be unsure (18%) than those with less experience (8%). Table 16 outlines these
results and differences by experience.
Table 26: Ways in Which Policy Formation Would Be Better or Worse if Open Town Meetings Were Eliminated by Clerk Experience
Q23. In what ways do you think town policy formation would be better or worse if open town meetings were eliminated?
All More Experience
Less Experience
Less discussion and voter input into decisions 30% 26% 38% Less accountability for elected officeholders 13% 10% 20% Less informed electorate 9% 8% 13% Loss of community engagement and participation 9% 7% 13%
Less democracy 5% 3% 8% Don't know 15% 18% 8% Other 11% 11% 8%
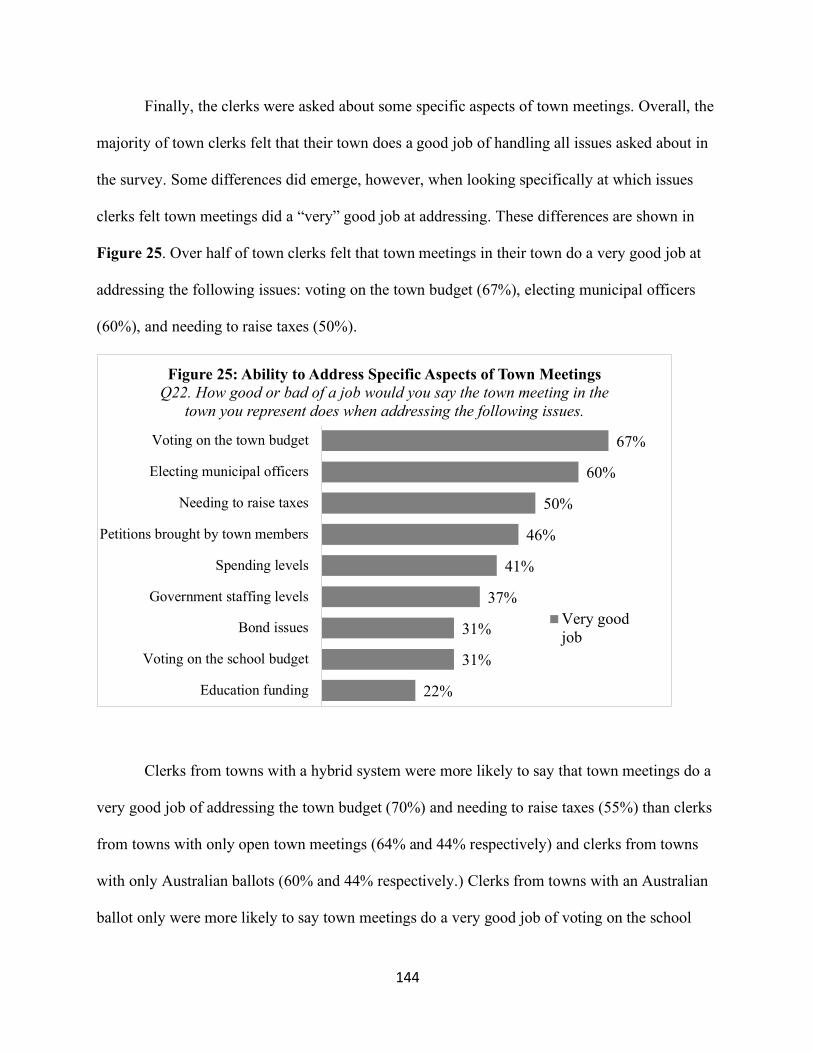
144
Finally, the clerks were asked about some specific aspects of town meetings. Overall, the
majority of town clerks felt that their town does a good job of handling all issues asked about in
the survey. Some differences did emerge, however, when looking specifically at which issues
clerks felt town meetings did a “very” good job at addressing. These differences are shown in
Figure 25. Over half of town clerks felt that town meetings in their town do a very good job at
addressing the following issues: voting on the town budget (67%), electing municipal officers
(60%), and needing to raise taxes (50%).
Clerks from towns with a hybrid system were more likely to say that town meetings do a
very good job of addressing the town budget (70%) and needing to raise taxes (55%) than clerks
from towns with only open town meetings (64% and 44% respectively) and clerks from towns
with only Australian ballots (60% and 44% respectively.) Clerks from towns with an Australian
ballot only were more likely to say town meetings do a very good job of voting on the school
22%
31%
31%
37%
41%
46%
50%
60%
67%
Education funding
Voting on the school budget
Bond issues
Government staffing levels
Spending levels
Petitions brought by town members
Needing to raise taxes
Electing municipal officers
Voting on the town budget
Figure 25: Ability to Address Specific Aspects of Town MeetingsQ22. How good or bad of a job would you say the town meeting in the
town you represent does when addressing the following issues.
Very goodjob
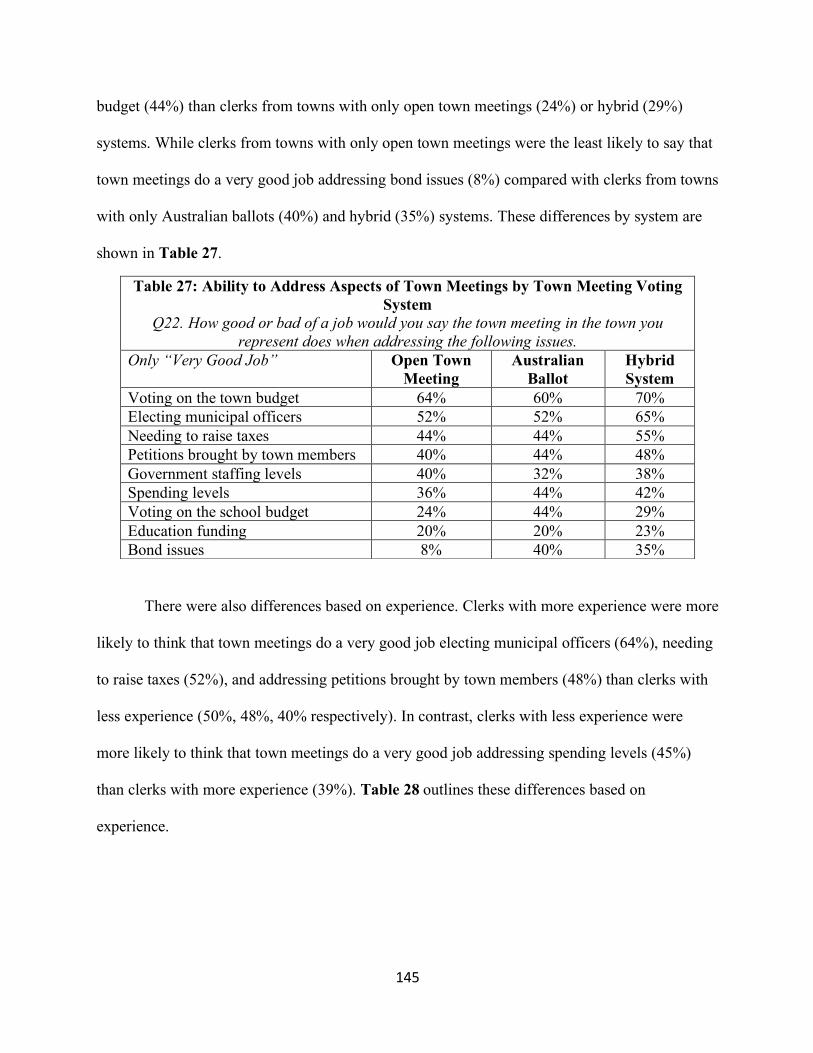
145
budget (44%) than clerks from towns with only open town meetings (24%) or hybrid (29%)
systems. While clerks from towns with only open town meetings were the least likely to say that
town meetings do a very good job addressing bond issues (8%) compared with clerks from towns
with only Australian ballots (40%) and hybrid (35%) systems. These differences by system are
shown in Table 27.
There were also differences based on experience. Clerks with more experience were more
likely to think that town meetings do a very good job electing municipal officers (64%), needing
to raise taxes (52%), and addressing petitions brought by town members (48%) than clerks with
less experience (50%, 48%, 40% respectively). In contrast, clerks with less experience were
more likely to think that town meetings do a very good job addressing spending levels (45%)
than clerks with more experience (39%). Table 28 outlines these differences based on
experience.
Table 27: Ability to Address Aspects of Town Meetings by Town Meeting Voting System
Q22. How good or bad of a job would you say the town meeting in the town you represent does when addressing the following issues.
Only “Very Good Job” Open Town Meeting
Australian Ballot
Hybrid System
Voting on the town budget 64% 60% 70% Electing municipal officers 52% 52% 65% Needing to raise taxes 44% 44% 55% Petitions brought by town members 40% 44% 48% Government staffing levels 40% 32% 38% Spending levels 36% 44% 42% Voting on the school budget 24% 44% 29% Education funding 20% 20% 23% Bond issues 8% 40% 35%
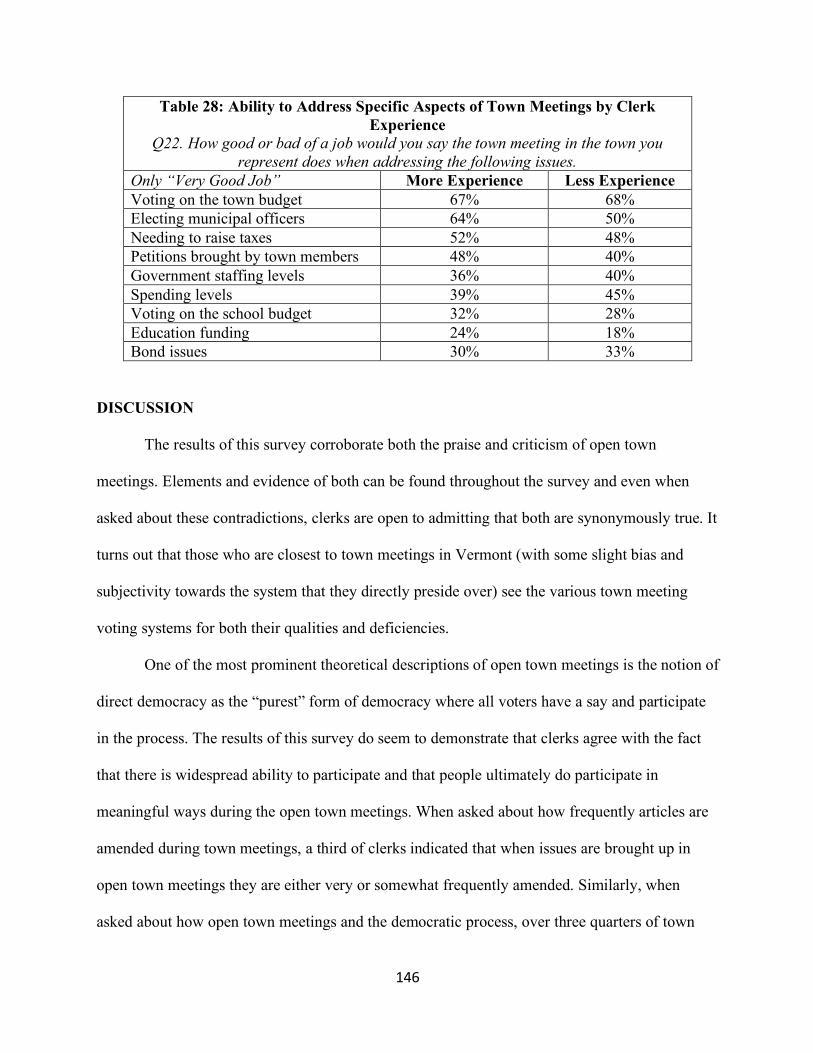
146
Table 28: Ability to Address Specific Aspects of Town Meetings by Clerk Experience
Q22. How good or bad of a job would you say the town meeting in the town you represent does when addressing the following issues.
Only “Very Good Job” More Experience Less Experience Voting on the town budget 67% 68% Electing municipal officers 64% 50% Needing to raise taxes 52% 48% Petitions brought by town members 48% 40% Government staffing levels 36% 40% Spending levels 39% 45% Voting on the school budget 32% 28% Education funding 24% 18% Bond issues 30% 33%
DISCUSSION
The results of this survey corroborate both the praise and criticism of open town
meetings. Elements and evidence of both can be found throughout the survey and even when
asked about these contradictions, clerks are open to admitting that both are synonymously true. It
turns out that those who are closest to town meetings in Vermont (with some slight bias and
subjectivity towards the system that they directly preside over) see the various town meeting
voting systems for both their qualities and deficiencies.
One of the most prominent theoretical descriptions of open town meetings is the notion of
direct democracy as the “purest” form of democracy where all voters have a say and participate
in the process. The results of this survey do seem to demonstrate that clerks agree with the fact
that there is widespread ability to participate and that people ultimately do participate in
meaningful ways during the open town meetings. When asked about how frequently articles are
amended during town meetings, a third of clerks indicated that when issues are brought up in
open town meetings they are either very or somewhat frequently amended. Similarly, when
asked about how open town meetings and the democratic process, over three quarters of town
147
clerks from towns with open town meetings felt that open town meetings facilitated the
democratic decision-making process.
There is also ample evidence that people engage in constructive debate and discussion at
open town meetings. Clerks from towns with only open town meetings were more likely to say
that open town meetings are only somewhat orderly, indicating that a significant amount of
heated debate and discussion can emerge, but when asked how much town meetings improve or
damage community relationships, a majority of clerks from both towns with only open town
meetings and hybrid systems say that open town meetings either greatly or somewhat improve
community relationships. Town clerks also indicate that this direct democracy would be lacking
under systems without open town meetings. When asked about the greatest weaknesses of the
Australian ballot as a form of government, town clerks most mentioned “Lack of debate and
discussion” as the greatest weakness. Those who are most intimately aware of the Australian
ballot process were the most likely to mention this weakness.
The pride that many scholars point to in the participation that comes with being a part of
this type of government is also clearly evident in these clerks’ descriptions of town meeting day.
This emerged most clearly in the tone and tenor of the in-depth interviews conducted with clerks
to gather more qualitative research on the data. However, it is also evident in the clerks’ long
tenure in office which has consistently been a tenant of open town meetings in New England: in
1952 Lane Lancaster wrote that, “[e]ven today there are numerous cases on record of clerks who
have served twenty, thirty, or even forty years, and there are a few cases in which father and son
between them have held the office for nearly a century.”191 This tenure in office speaks to the
position and the participation in this form of democracy as more than just a job.
191 Lancaster, Government in Rural America, 39.
148
Finally, the educational value of discussing issues in an open setting with peers also
clearly emerges in the data. When asked about the strengths of open town meetings, the fact that
reasoning and arguments are given an opportunity to be presented, and that it, “creates informed
voters” were each mentioned unprompted by two-in-ten clerks. Many of these clerks also linked
this educational value to the fact that these debates and the education that comes from
understanding the other side, builds acceptance of the outcome. In addition, when asked about
the weaknesses of the Australian ballot, clerks from both towns with only open town meetings
and hybrid systems mentioned that using Australian ballots means less informed viewers. Some
clerks also mentioned that this led to less understanding of the results on the part of the town
leadership; for instance, one clerk from a town with only an Australian ballot stated that it is
sometimes hard to know why something fails to pass under an Australian ballot system because
they don’t know the context of why people voted no: “was it too much money? Was it too little
money? What would the voters have liked instead?”
Some of the less favorable characteristics described by scholars are also evident in this
survey research. First and foremost, low open town meeting participation is clearly evident. The
lowest average, lowest highest, and lowest participation rates for town meeting day are reported
by towns with only open town meetings. In fact, the average highest participation rate for towns
with only open town meetings (14%) is only slightly higher than the average lowest participation
rate for towns with Australian ballots only (12%). There are, however, some mixed results in
terms of trends in participation. The vast majority of clerks from towns with only open town
meetings report that the number of people participating on town meeting day is staying about the
same and about one-in-six clerks from only open town meeting towns say that it is decreasing. In
contrast, the answers from clerks from towns with only Australian ballots varies much more.
149
More of these clerks (28%) say that participation is decreasing, but more also say that
participation is increasing (12%). The same is true for clerks from towns with hybrid voting
systems. Thus, it seems that participation in towns with open town meetings is lower but more
consistent, whereas participation in towns with Australian ballots or hybrid systems are higher
but more volatile and changing.
The danger of the outsized say of factions was also evident in the data (although the term
“faction” was not broadly used by clerks.) The fact that, “a few people have an outsized say” was
the second most frequently mentioned weakness of open town meetings. In addition, clerks from
towns with only open town meetings, who are most familiar with this system, were the most
likely to mention this as a weakness, followed by clerks from towns with hybrid voting systems.
In contrast, one of the greatest strengths mentioned in relation to Australian ballots was the fact
that more people are represented in the voting process. Clerks from towns with Australian ballots
only and hybrid systems were the most likely to point to this greater representation. When asked
in in-depth interviews, clerks were both proud of but concerned about the fact that a dedicated
group of townsfolk could successfully bring forward issues to be placed on the warning to be
discussed at the open town meetings.
Similarly, the concern that open town meetings can create a setting where some might
feel more empowered than others to participate also emerged in the survey question about the
strengths and weaknesses of the two different systems. One of the most mentioned weaknesses
of open town meetings was that work schedules make it so that some have an inability to attend
the meeting. In an in-depth interview, a clerk from a town with an Australian ballot only system
described exactly how this empowers some over others because the time when town meetings are
designated to be held affects who is able to come: when they are held in the middle of the day,
150
the elderly feel safer and more able to attend, whereas when they are held in the evenings,
younger folk and those who work feel more able to come. In addition, clerks also mentioned
peer pressure in open town meetings as a weakness which aligns well with Jane Mansbridge’s
findings that education level and membership in certain town “groups” are a driving factor in
who believes their voice has a right to be heard.192 Clerks from towns with only open town
meetings were the most likely to mention both of these weaknesses.
The Predictive Power of Town Meetings
This survey also investigated something that few scholars have discussed over the years:
the predictive power of town meetings. The results, as with the praise and criticisms of open
town meetings, were relatively mixed. While some clerks did indicate that there were issues that
were raised in town meetings 5-10 years ago that have now become a greater part of state and
national level politics, a significant number of clerks felt that no such issues existed and the
clerks who participated in the in-depth interviews were hesitant to commit to this theory. In order
to gain a more definitive answer on this question, more research would need to be done into
where and how the issues that clerks reported that rose from local to state- and national-level
politics emerged. An investigation of town meeting minutes from 5-10 years ago on climate
change might give us a better picture of this evolutionary process. Similarly, this research
collected information on the issues brought up in town meetings today that many clerks think
will become greater parts of state- and national-level politics. Further research in 5-10 years will
be able to determine whether these clerks are accurate in their predictions.
192 Mansbridge, Beyond Adversary Democracy.
151
The Future of Town Meetings in Vermont
This research was originally designed to be able to analyze the potential future of open
town meetings in Vermont based on the opinions of town clerks and the participation and
changes in participation rates of the varying types of town meeting voting systems. Absent other
considerations, the low participation rates in towns with only open town meetings, paired with
rural exodus in Vermont193 already painted a shaky future for open town meetings in Vermont.
While some politicians have spoken about the need to expand broadband to encourage growth in
small rural towns,194 little has been successfully done at the state level and struggling small
towns have been unsuccessful at drawing more young populations. In fact, the remaining factor
driving the continuation of open town meetings in Vermont was largely described by clerks in
the in-depth interviews to be Vermonters’ stubbornness about tradition rather than anything else.
The population trends, lowering participation rates, and Vermont stubbornness, however,
are not the only consideration now when analyzing the future of town meetings in Vermont.
Between conducting this survey and the writing of this analysis, the COVID-19 pandemic has
spread across the globe and impacted lives and politics here in Vermont. Following the
pandemic’s appearance in the state, a bill was proposed in the Vermont House of
Representatives, H.681, that “would allow Vermont towns and school districts to forgo floor
meetings and instead adopt Australian ballot voting for 2020.”195 It was passed into law as Act
92. With these options in place for the near future, it is unclear whether they will also will
become the norm moving forward in Vermont for small towns or whether this will be merely a
193 Erin Petenko, “As Vermonters leave small towns, Burlington region grows,” VT Digger, October 3, 2019, https://vtdigger.org/2019/10/03/as-vermonters-leave-small-towns-they-flock-to-burlington-region/. 194 Taylor Dobbs, “Another Vermont Pol Promises Broadband. Could It Work This Time?” Seven Days, July 25, 2018, https://www.sevendaysvt.com/vermont/another-vermont-pol-promises-broadband-could-it-work-this-time/Content?oid=18421305. 195 Tim Camerato, “Vermont bill may mean mail-in, drive-by voting for Town Meeting,” Valley News, March 26, 2020, https://www.vnews.com/Vermont-Makes-Town-Meeting-Changes-33551810.
152
passing deviation from traditional open town meetings in towns across the state. On the whole,
the clerks interviewed by this researcher were unsure about this future, but the two clerks from
towns with only Australian ballot voting systems were more sure of this being a critical and
significant step towards more Australian ballot voting in Vermont and the decline of open town
meetings.
CONCLUSION
Both praise and criticism have been consistently leveled at open town meetings in
Vermont and across New England – from the writings of our founding fathers like Thomas
Jefferson and scholars like Alexis De Tocqueville, to much more recent academic works on
modern Vermont politics. This research finds that town clerks today offer examples of both the
praise and criticisms and agree with the underlying sentiments in both. Clerks believe in the
benefits of the direct democracy, negotiation, education, and community building that comes
with open town meetings. However, they also acknowledge the detriments of low participation
rates, factions, and peer pressure that can emerge in open town meetings.
Ultimately, the findings in this research around participation rates at open town meetings
combined with rural exodus demographic data and the more recent policies enacted during the
coronavirus that are pulling towns away from in-person voting do not favor the continued strong
existence of open town meetings in Vermont. The findings also indicate that expansion of direct
democracy to other states would not come in the form of open town meetings. However, if direct
democracy were tried in other forms in Vermont and across the country, this research on open
town meetings indicates that positives would result from forms of direct democracy that includes

153
community input and buy-in, educational opportunities, and the public’s ability to amend or
adjust the proposals.
Direct democracy in the form of open town meetings is not likely to expand to other areas
around the country. In fact, there is a real possibility of its disappearance in New England and
Vermont. However, the benefits of this form of direct democracy in Vermont can give us insight
into how direct democracy could be at its best in future electoral environments.
154
THESIS CONCLUSION
Vermont is consistently a “blue” state at the national level. Its delegation is led by
Senator Leahy and Senator Bernie Sanders. Senator Leahy is the longest serving Democrat in the
Senate, and Senator Sanders, while an Independent, is known for his unapologetically left
political positions. On election night especially, and in many other instances, Vermont is not paid
much attention. However, the paucity of Vermont’s electoral votes camouflages fascinating and
unique aspects of the political environment in Vermont.
This thesis has investigated three separate unique aspects of Vermont’s political
environment: the prevalence of split ticket voting, the existence of the most successful third party
in the country, and town-meeting-style, direct democracy. By investigating Vermont, we are able
to understand: Why Vermont has been able to foster these three attributes, whether they fit the
theories and ideals put forward by academics, and how these attributes could be expanded to
other states and the nation.
Split Ticket Voting
The first chapter in this thesis investigated the high rates of split ticket voting in the 2018
Vermont election. Vermont’s high levels of split ticket voting stands in stark contrast to split-
ticket voting across the rest of the country.
Nationally, split-ticket voting has declined significantly in recent years. The 2018
midterms and 2020 elections were no exception to this trend.196 However, decreasing split ticket
196 Phillip Bump, “2020 Saw The Least Split Ticket House Voting In Decades,”; Note: there are many ways to define and investigate split ticket voting. This article specifically investigates split ticket voting between the House races and the Presidential race, whereas the first chapter in this thesis specifically looks at split ticket voting between House and Senate races and statewide races in Vermont.
155
was not universally the case. In both 2018 and 2020, Vermont experienced significant split-ticket
voting in the form of Democratic defection. In 2018 Vermont elected Independent, and self-
proclaimed Democratic Socialist, Senator Bernie Sanders, Democrat Representative Peter
Welch, and Progressive Democrat Lieutenant Governor David Zuckerman, as well as a veto
proof majority for Democrats and Progressives in the Vermont State Legislature. In 2020,
Vermonters elected Democratic President Joe Biden, re-elected Democrat Representative Peter
Welch, and a majority of Democrats and Progressives in the Vermont State Legislature.
However, in both elections, Vermont voters also elected Republican Governor Phil Scott with
substantial margins. In 2018, Governor Scott received 55.2% of the vote and in 2020, he
received 68.5%.
The first chapter of this thesis begins by investigating possible answers to the question:
Why does split ticket voting happen? A review of academic theories on split-ticket voting
demonstrates that scholars hold a wide variety of views concerning possible split-ticket voting
motivations. However, only a few theories are strongly upheld by the results in this chapter. In
interviewing Vermont split-ticket voters, it is clear that Vermont split-ticket voters are voting
sincerely when they select more liberal members of Congress and down-ticket state legislature
races in addition to a Republican governor. They agree with the vast majority of the more liberal-
leaning policies that the legislature was considering in 2018. However, they are also ultimately
concerned about their own bottom line when it comes to the Vermont economy and their state
taxes. In addition, despite Governor Scott’s being a Republican, these split-ticket voters felt
connected to Governor Scott, they believed in him, they disassociated him with other national
Republicans, and were willing to give him the benefit of the doubt.
156
The research in this chapter demonstrates that there is no one straightforward answer
about why voters split their tickets. Instead, voters offer a number of different motivations. In
Vermont, a substantial element of split-ticket voting is derived from the voters’ feelings that they
know their elected representatives. The Vermonters’ sense of community helps them overcome
partisanship to vote across party lines when they think an elected individual is acting in a sincere
and genuine way. This stands in stark contrast to how these split ticket voters spoke about
Republicans, who they did not know personally, at the national level.
Taking a broad analytic approach to what this research has demonstrated: Split ticket
voting in Vermont is largely due to the personal relationships and the community feel that is
prevalent in a state with under 650,000 residents. This allows voters to feel that they personally
know the individuals representing them, and therefore allows them to put aside party label when
voting. Therefore, to increase split ticket voting in other areas of the country, this research
suggests creating smaller voting districts in which candidates could spend more time organizing
door-to-door and getting to know their constituents.
For candidates in districts that favor other parties, but who want to increase split ticket
voting, this research indicates that creating and communicating some issue-based separation
from national political figures could be a boon. Governor Scott has separated himself from
national Republican figures and the national Republican party on certain issues which split ticket
voters frequently point to. That being said, split ticket voters trust that he is honest about
diverging from party line policies because they first feel that they know and like him. Thus, the
first priority for candidates should be creating a sense of community and personal
communication with voters on a personal level.
157
As this country grapples with more polarized partisanship and the villainizing of
opposing parties, working toward solutions that encourage split ticket voting by using more one-
on-one personal communication and issue-based separation from the party line may have
overarching and lasting positive effects nationwide.
The Vermont Progressive Party
The second chapter in this thesis investigated the success of the Vermont Progressive
Party. This party has done something that no modern third party has been able to do: maintain
success as a third party. For years, academics to activists have been calling for this type of
successful third party across the country and within state and local governments. Many justify
their reasoning by pointing to declining satisfaction rates with both of the two parties and
growing numbers of voters who identify as Independents.197
The research in this chapter confirms a number of scholarly theories around third parties:
specifically, both the hurdles and optimal environmental conditions for third parties. Strong local
media, the legitimacy begun by then-Mayor Bernie Sanders’ election, low ballot requirements,
small populations, and the availability of fusion candidacies have helped Vermont Progressives.
Academic work, however, usually treats third parties as either outside of the two-party
system with little or no chance of substantial electoral success, or as part of a realignment where
the third party will ultimately supplant or be taken over by one of the major parties. This research
and the experience of the Vermont Progressive Party demonstrates that there is a lack of
scholarly theories about a third option: limited success in terms of accessing major party status at
the state level, but substantial success at the local level. The Vermont Progressive party has
197 Gallup, “Party Affiliation,” accessed March 23, 2021, https://news.gallup.com/poll/15370/party-affiliation.aspx.
158
achieved a successful realignment in Burlington, but has remained a minor party at the state level
for the last forty years.
Academic work to date has also largely categorized third parties as replete with
ideologues and purists, pointing to this as one of the reasons for lack of electoral success. The
interviews with Progressive activists demonstrate that there is a range of individuals attracted to
the Vermont Progressive Party from pragmatists to idealists and that candidates who fit both of
these characteristics have been able to be successful.
For members of third parties across the country, the Vermont Progressive Party presents
some clear guidance, on how to overcome barriers to gain electoral success and to maintain that
success. Like with split ticket voting, personal relationships, community-building, and on-the-
ground communication with voters help third party candidates break voters out of their
traditional voting patterns, and even out of the binary major party choices. With third parties,
however, there are some added logistical and legislative hurdles that should be addressed in
states outside of Vermont to encourage third-party voting. First and foremost, parties must look
to establish a “proof of concept.” In this political climate, getting small percentages in statewide
or national races are not covered in the media as, or seen by voters as being proof of legitimacy.
Instead, starting small in local districts where personal relationships can be made and then
growing into more prominent political positions is a more plausible option for third party success
outside of Vermont.
To further help third-party legitimacy and name recognition expand, local media should
be encouraged and supported. The Vermont Progressive Party has benefitted by substantial local
media coverage that has legitimized the party in the eyes of many voters. This is something that
other third parties around the country could benefit from as well. In addition, third parties can
159
benefit from low ballot access requirements, fusion candidate options, ranked choice voting, and
potentially following the Vermont Progressive Party’s lead in combining both idealists and
pragmatists within the party ranks.
This research on the Vermont Progressive Party offers a roadmap for ambitious third
parties around the country to emulate as they attempt to break into the two-party system. This
research and the experience of the trail-blazing Vermont Progressive Party demonstrates that,
with key legislation and political environments, a multiparty system is possible in America. As a
result, more Independents may come to feel better represented, and better heard, and may be
galvanized to participate by a party outside of our current two-party system.
Town Meetings and Direct Democracy
Direct democracy in the form of town meetings has existed in New England for longer
than the United States of America has been a country. Throughout the last two hundred years,
both substantial praise and criticism have been leveled at direct democracy in the form of open
town meetings in Vermont and across New England. In many ways, this form of town-meeting
democracy is upheld as an ideal form of government. The reality, however, is much more
complicated.
The research in the third chapter of this thesis investigates town meeting day in Vermont
from the perspective of the individuals who operate and execute town meeting day: town clerks.
The research finds that town clerks today offer examples of both the praise and criticisms and
agree with the underlying sentiments in both. In their world, there is no theoretical ideal, but a
need to deal with both the inevitable issues and benefits of this form of government. Town clerks
believe in the benefits of the direct democracy negotiation, issue education, and community
160
building that come with open town meetings. However, they also acknowledge the detriments of
low participation rates, factions, and peer pressure that can emerge. Clerks who preside over
hybrid systems and Australian ballot systems feel similarly about their systems.
Like split-ticket voting and third-party success, direct democracy’s success is linked to
low populations: small towns mean small town meetings, and more opportunity for communal
education, participation, and floor time. This research suggests that in order to maintain direct
democracy in Vermont and even to expand it to other states, towns, districts, or any voting bloc
would need to have under 500 in-person voters. This small population size would also be, as
clerks and scholars have warned, potentially vulnerable to factions and low turnout. Therefore,
while the creation of a sub-local government that could accommodate town-meeting style direct
democracy in the United States is an interesting concept, this researcher believes it to be
logistically infeasible.
Unlike split ticket voting and third party success, this research indicates that there are few
clear paths forward for expanding town-meeting style direct democracy to other states. The
findings in this research around participation rates at open town meetings, combined with rural
exodus demographic data, and the more recent policies enacted during the coronavirus that are
pulling towns away from in-person voting do not favor the continued strong existence of open
town meetings in Vermont. Similarly, while direct democracy in the form of town meetings has
been lauded as one of the purest forms of democracy in the world, this research seems to indicate
that there is no clear path towards a resurgence of town-meeting style direct democracy at the
national level.
That said, there are other potential avenues for increasing direct democracy including
ballot initiatives. While these initiatives were not studied in this thesis, the research indicates that
161
proponents of these democratic avenues should take heed to encourage voter education and
community buy-in when implementing direct democracy.
Together, these three chapters delve into some of the unique aspects that set Vermont’s
political system and democracy apart. These chapters produce key insights into three frequently
lauded solutions to growing partisanship and political dissatisfaction.
Each of these political attributes, or the underlying theories behind them, are pointed to
by academics, pundits, and the general public as potential solutions to some of the most pressing
political issues in our nation. For instance: split ticket voting is seen as a solution to hyper-
partisanship; third parties are viewed as a solution to the growing discontent with the two major
parties; direct democracy is perceived as a better way to ensure that the average citizen’s wants
and needs are heeded. This research allows those who want to work towards a better democracy
across the country a spark of hope for the potential that could be. Vermont’s experience with
split ticket voting, third parties, and direct democracies demonstrates that other states and the
nation can take tangible steps outlined above to potentially help address some of the ills in our
current system.
It is important to note, however, that Vermont is not a perfect representation of the
United States as a whole. Vermont is one of the smallest states, one of the most rural states, and
one of the whitest states. Split ticket voting, direct democracy, and the success of the Progressive
Party may be due, in party, to some of these features that separate Vermont from other states.
The findings certainly indicate that small community-based politicking supports both split ticket
voting and the Progressive Party indicates that Vermont’s small population size, at least, does
contribute. One could argue that systemic racism in other states may add additional barriers to
162
third parties, against split ticket voting, or direct democracy in various instances. However,
Vermont’s lack of demographic diversity and therefore this researchers inability to contrast and
compare places this outside of the scope of this research.
Research limitations aside, the implications for encouraging third parties and split ticket
voting could shift the way that Americans view their participation in politics. Currently, most
voters currently see their political options as a binary choice between two less-than ideal options.
Creating an environment where a third party, or even a multiparty system can flourish, and
where split ticket voting is more encouraged and prevalent, would shift the current political
paradigm. Voters would no longer face the “spoiler effect” and instead be able to vote for
candidates of various parties that fit with their political ideologies, rather than against one party
or for the lesser of two bad choices. Voting, and splitting tickets, for different candidates and
multiple parties could galvanize voting across the country and reverse the current trend of fewer
people identifying with the parties. In implementing this vision, policies like ranked choice
voting could encourage the idea that every vote matters and that every voter can vote for a party
that voices their true vision for the country.
Shifting from the current binary, hyper-partisan, approach to democracy could also have
positive implications for our lawmakers. Rather than the current oppositional relationship that
exists in our legislatures, splitting tickets and the prevalence of third parties would encourage
cooperation and negotiation when putting together legislation. The goal for legislators could shift
from impeding progress when the opposing party is in power, to finding commonalities with
smaller parties to pass legislation where priorities overlap. Here in Vermont, Democrats and
Progressives work together, Progressives and Republicans have even worked together, and in
some instances, like trying to unseat Bernie as mayor of Burlington, Democrats and Republicans
163
have worked together. Rather than binary options between two parties and issues, encouraging
third parties and split ticket voting could inspire greater coalition building and more negotiation
in our democratic process.
Vermont is not a perfect democracy. There are plenty of issues throughout the state and
the country that have a grasp here. Neither is this research perfect. However, there are elements
of the system in Vermont that demonstrate that better representation and democracy could be
possible here and across the country. As our nation grapples with growing partisanship, this
research into three of Vermont’s unique political attributes has taught us more about the ideals
that we strive for, their complexities, and what may be possible on a national level. Vermont
could show us a path forward to a better democracy.
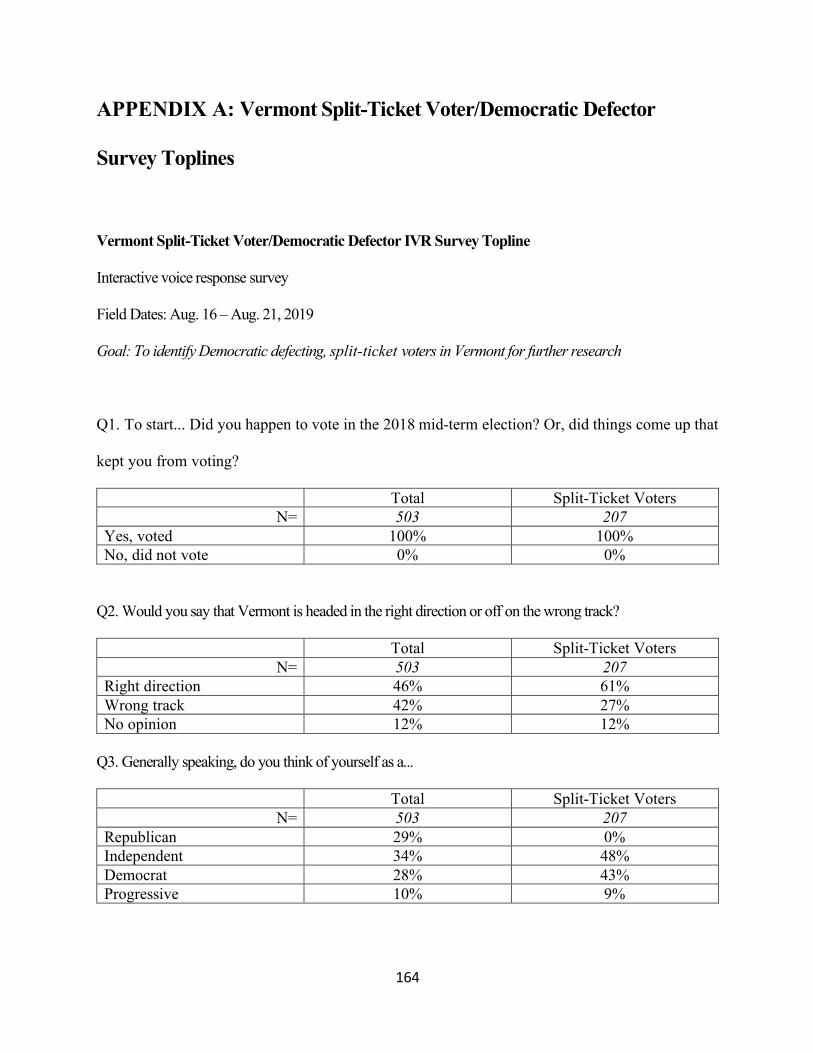
164
APPENDIX A: Vermont Split-Ticket Voter/Democratic Defector
Survey Toplines
Vermont Split-Ticket Voter/Democratic Defector IVR Survey Topline
Interactive voice response survey
Field Dates: Aug. 16 – Aug. 21, 2019
Goal: To identify Democratic defecting, split-ticket voters in Vermont for further research
Q1. To start... Did you happen to vote in the 2018 mid-term election? Or, did things come up that
kept you from voting?
Total Split-Ticket Voters N= 503 207
Yes, voted 100% 100% No, did not vote 0% 0%
Q2. Would you say that Vermont is headed in the right direction or off on the wrong track?
Total Split-Ticket Voters N= 503 207
Right direction 46% 61% Wrong track 42% 27% No opinion 12% 12%
Q3. Generally speaking, do you think of yourself as a...
Total Split-Ticket Voters N= 503 207
Republican 29% 0% Independent 34% 48% Democrat 28% 43% Progressive 10% 9%
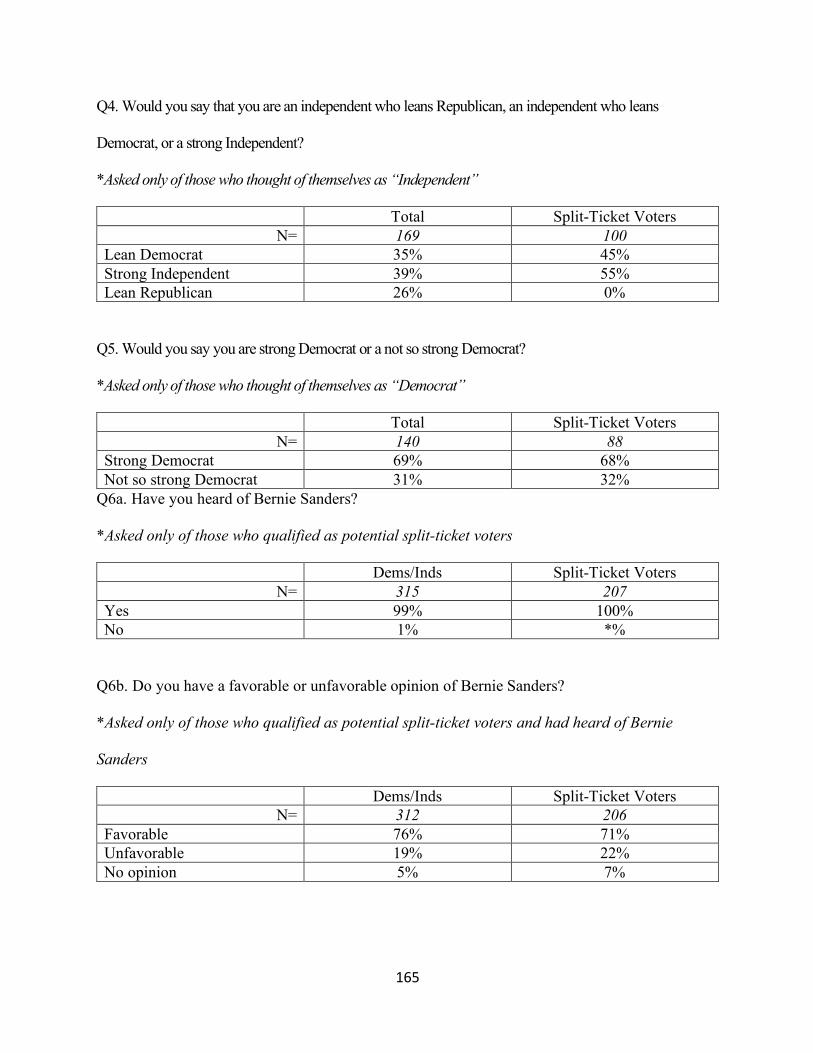
165
Q4. Would you say that you are an independent who leans Republican, an independent who leans
Democrat, or a strong Independent?
*Asked only of those who thought of themselves as “Independent”
Total Split-Ticket Voters N= 169 100
Lean Democrat 35% 45% Strong Independent 39% 55% Lean Republican 26% 0%
Q5. Would you say you are strong Democrat or a not so strong Democrat?
*Asked only of those who thought of themselves as “Democrat”
Total Split-Ticket Voters N= 140 88
Strong Democrat 69% 68% Not so strong Democrat 31% 32%
Q6a. Have you heard of Bernie Sanders?
*Asked only of those who qualified as potential split-ticket voters
Dems/Inds Split-Ticket Voters N= 315 207
Yes 99% 100% No 1% *%
Q6b. Do you have a favorable or unfavorable opinion of Bernie Sanders?
*Asked only of those who qualified as potential split-ticket voters and had heard of Bernie
Sanders
Dems/Inds Split-Ticket Voters N= 312 206
Favorable 76% 71% Unfavorable 19% 22% No opinion 5% 7%
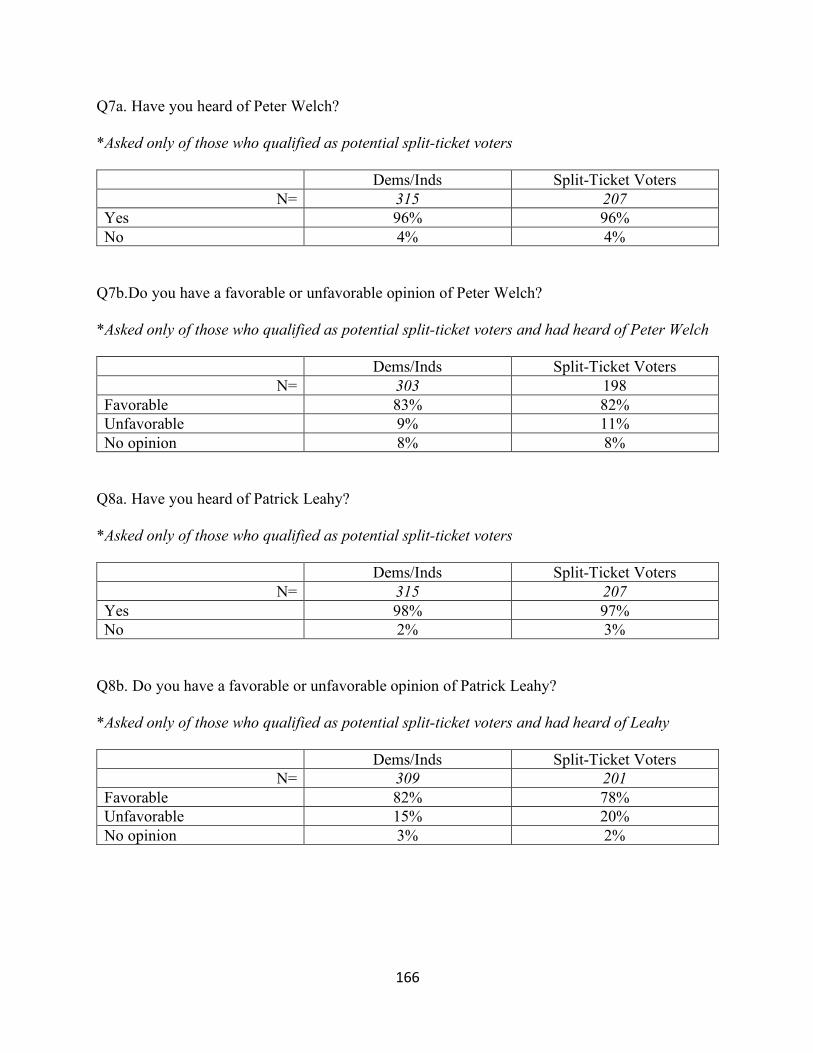
166
Q7a. Have you heard of Peter Welch?
*Asked only of those who qualified as potential split-ticket voters
Dems/Inds Split-Ticket Voters N= 315 207
Yes 96% 96% No 4% 4%
Q7b.Do you have a favorable or unfavorable opinion of Peter Welch?
*Asked only of those who qualified as potential split-ticket voters and had heard of Peter Welch
Dems/Inds Split-Ticket Voters N= 303 198
Favorable 83% 82% Unfavorable 9% 11% No opinion 8% 8%
Q8a. Have you heard of Patrick Leahy?
*Asked only of those who qualified as potential split-ticket voters
Dems/Inds Split-Ticket Voters N= 315 207
Yes 98% 97% No 2% 3%
Q8b. Do you have a favorable or unfavorable opinion of Patrick Leahy?
*Asked only of those who qualified as potential split-ticket voters and had heard of Leahy
Dems/Inds Split-Ticket Voters N= 309 201
Favorable 82% 78% Unfavorable 15% 20% No opinion 3% 2%

167
Q9a. Have you heard of Phil Scott?
*Asked only of those who qualified as potential split-ticket voters
Dems/Inds Split-Ticket Voters N= 315 207
Yes 97% 98% No 3% 2%
Q9b. Do you have a favorable or unfavorable opinion of Phil Scott?
*Asked only of those who qualified as potential split-ticket voters and had heard of Phil Scott
Dems/Inds Split-Ticket Voters N= 307 202
Favorable 50% 77% Unfavorable 34% 12% No opinion 16% 11%
Q10a. Have you heard of David Zuckerman?
*Asked only of those who qualified as potential split-ticket voters
Dems/Inds Split-Ticket Voters N= 315 207
Yes 85% 86% No 15% 14%
Q10b. Do you have a favorable or unfavorable opinion of David Zuckerman?
*Asked only of those who qualified as potential split-ticket voters and had heard of David
Zuckerman
Dems/Inds Split-Ticket Voters N= 269 177
Favorable 59% 49% Unfavorable 21% 28% No opinion 20% 24%
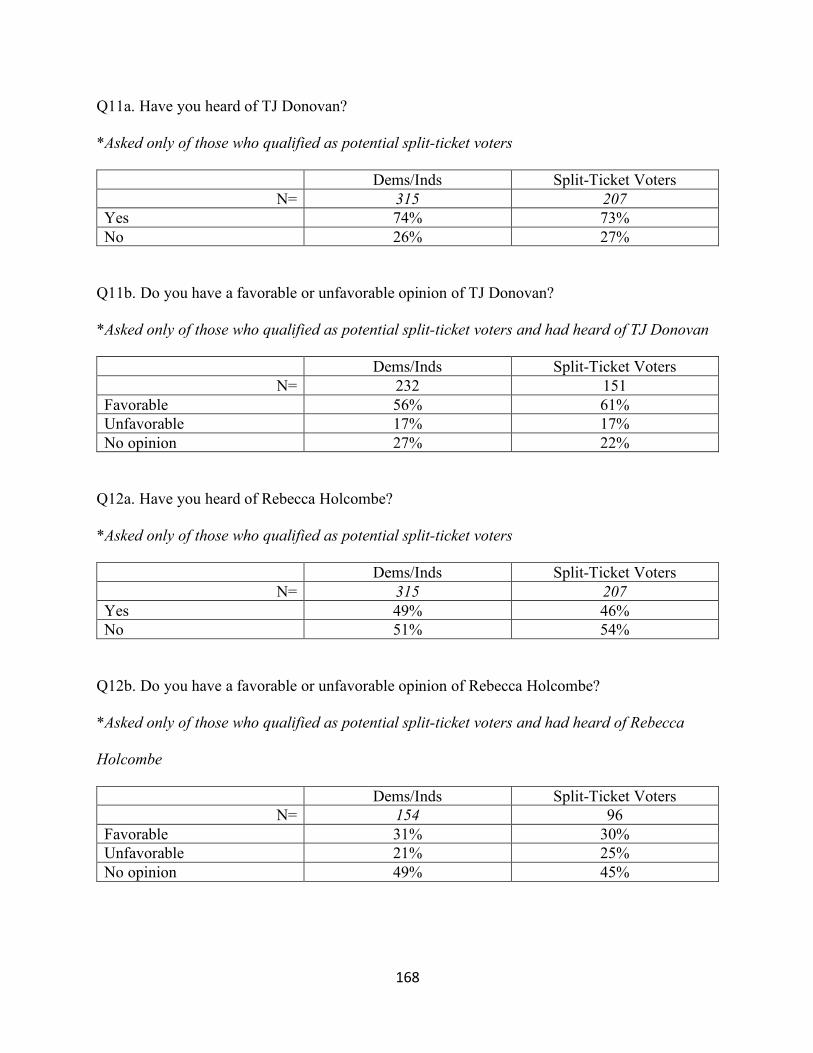
168
Q11a. Have you heard of TJ Donovan?
*Asked only of those who qualified as potential split-ticket voters
Dems/Inds Split-Ticket Voters N= 315 207
Yes 74% 73% No 26% 27%
Q11b. Do you have a favorable or unfavorable opinion of TJ Donovan?
*Asked only of those who qualified as potential split-ticket voters and had heard of TJ Donovan
Dems/Inds Split-Ticket Voters N= 232 151
Favorable 56% 61% Unfavorable 17% 17% No opinion 27% 22%
Q12a. Have you heard of Rebecca Holcombe?
*Asked only of those who qualified as potential split-ticket voters
Dems/Inds Split-Ticket Voters N= 315 207
Yes 49% 46% No 51% 54%
Q12b. Do you have a favorable or unfavorable opinion of Rebecca Holcombe?
*Asked only of those who qualified as potential split-ticket voters and had heard of Rebecca
Holcombe
Dems/Inds Split-Ticket Voters N= 154 96
Favorable 31% 30% Unfavorable 21% 25% No opinion 49% 45%
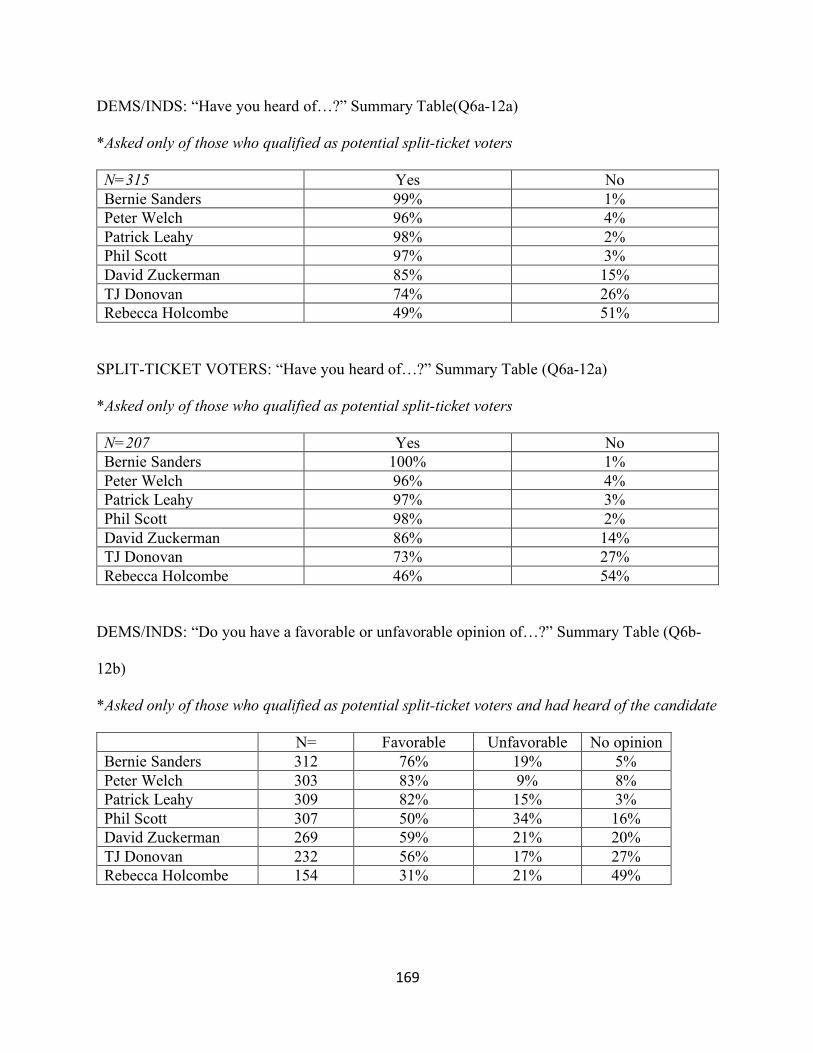
169
DEMS/INDS: “Have you heard of…?” Summary Table(Q6a-12a)
*Asked only of those who qualified as potential split-ticket voters
N=315 Yes No Bernie Sanders 99% 1% Peter Welch 96% 4% Patrick Leahy 98% 2% Phil Scott 97% 3% David Zuckerman 85% 15% TJ Donovan 74% 26% Rebecca Holcombe 49% 51%
SPLIT-TICKET VOTERS: “Have you heard of…?” Summary Table (Q6a-12a)
*Asked only of those who qualified as potential split-ticket voters
N=207 Yes No Bernie Sanders 100% 1% Peter Welch 96% 4% Patrick Leahy 97% 3% Phil Scott 98% 2% David Zuckerman 86% 14% TJ Donovan 73% 27% Rebecca Holcombe 46% 54%
DEMS/INDS: “Do you have a favorable or unfavorable opinion of…?” Summary Table (Q6b-
12b)
*Asked only of those who qualified as potential split-ticket voters and had heard of the candidate
N= Favorable Unfavorable No opinion Bernie Sanders 312 76% 19% 5% Peter Welch 303 83% 9% 8% Patrick Leahy 309 82% 15% 3% Phil Scott 307 50% 34% 16% David Zuckerman 269 59% 21% 20% TJ Donovan 232 56% 17% 27% Rebecca Holcombe 154 31% 21% 49%
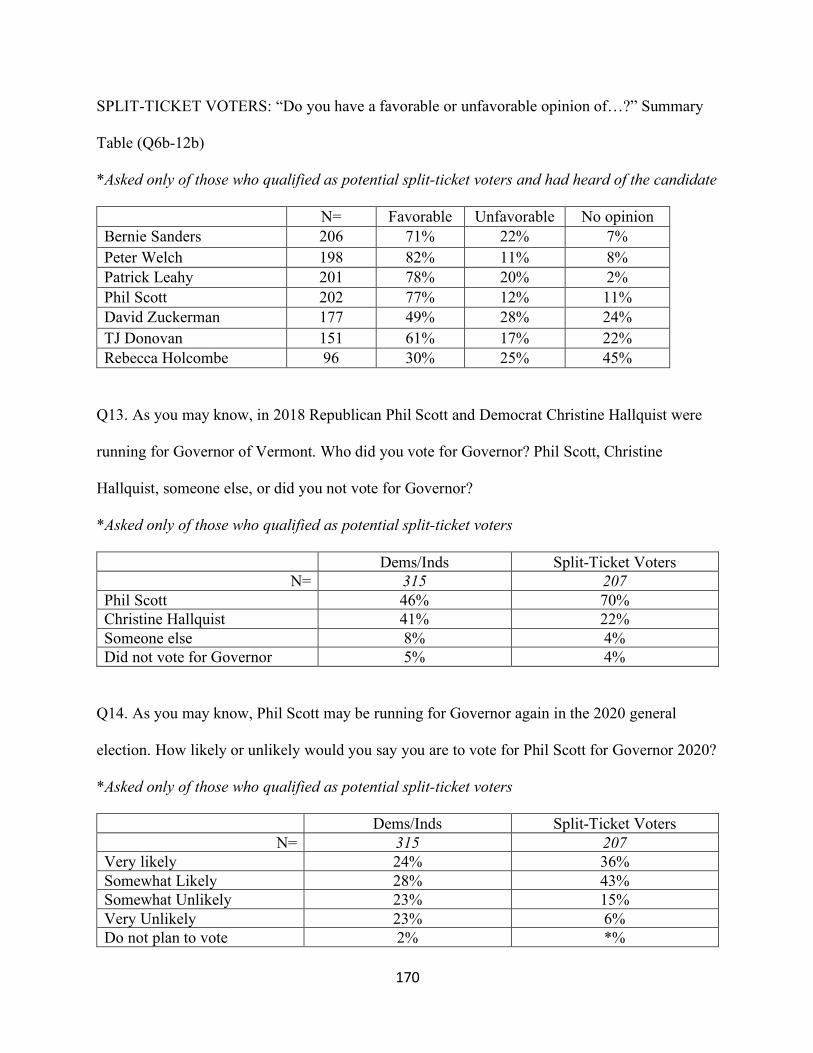
170
SPLIT-TICKET VOTERS: “Do you have a favorable or unfavorable opinion of…?” Summary
Table (Q6b-12b)
*Asked only of those who qualified as potential split-ticket voters and had heard of the candidate
N= Favorable Unfavorable No opinion Bernie Sanders 206 71% 22% 7% Peter Welch 198 82% 11% 8% Patrick Leahy 201 78% 20% 2% Phil Scott 202 77% 12% 11% David Zuckerman 177 49% 28% 24% TJ Donovan 151 61% 17% 22% Rebecca Holcombe 96 30% 25% 45%
Q13. As you may know, in 2018 Republican Phil Scott and Democrat Christine Hallquist were
running for Governor of Vermont. Who did you vote for Governor? Phil Scott, Christine
Hallquist, someone else, or did you not vote for Governor?
*Asked only of those who qualified as potential split-ticket voters
Dems/Inds Split-Ticket Voters N= 315 207
Phil Scott 46% 70% Christine Hallquist 41% 22% Someone else 8% 4% Did not vote for Governor 5% 4%
Q14. As you may know, Phil Scott may be running for Governor again in the 2020 general
election. How likely or unlikely would you say you are to vote for Phil Scott for Governor 2020?
*Asked only of those who qualified as potential split-ticket voters
Dems/Inds Split-Ticket Voters N= 315 207
Very likely 24% 36% Somewhat Likely 28% 43% Somewhat Unlikely 23% 15% Very Unlikely 23% 6% Do not plan to vote 2% *%
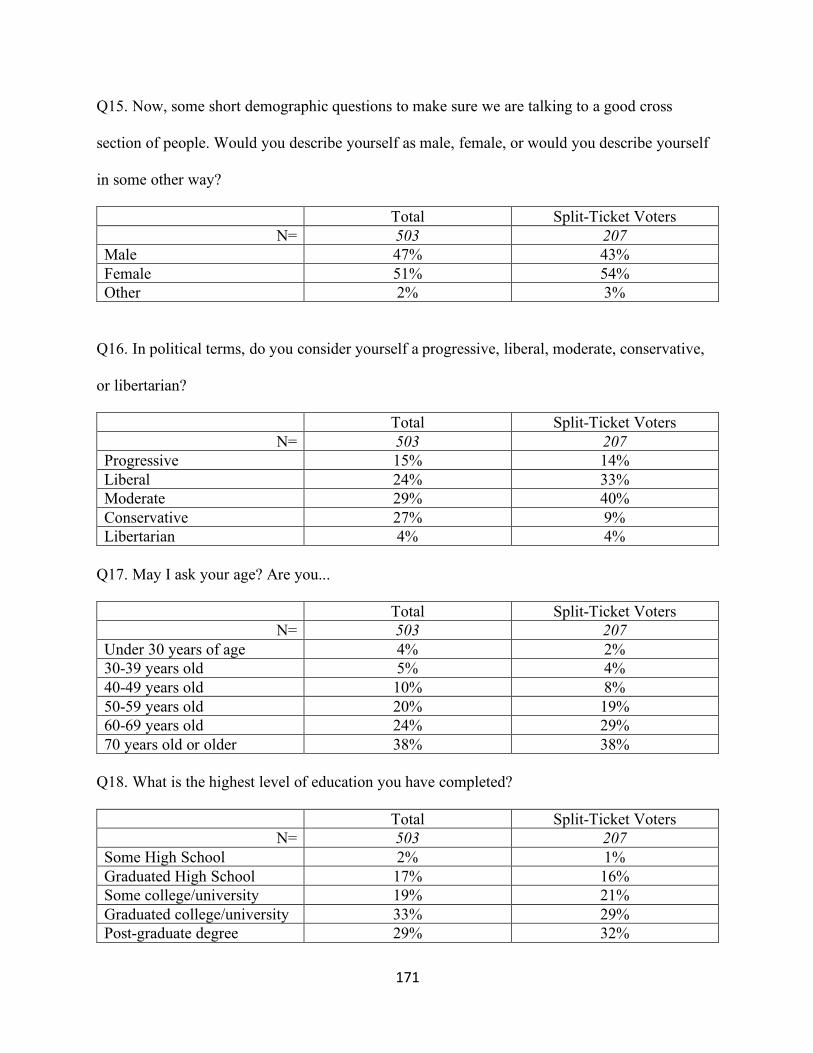
171
Q15. Now, some short demographic questions to make sure we are talking to a good cross
section of people. Would you describe yourself as male, female, or would you describe yourself
in some other way?
Total Split-Ticket Voters N= 503 207
Male 47% 43% Female 51% 54% Other 2% 3%
Q16. In political terms, do you consider yourself a progressive, liberal, moderate, conservative,
or libertarian?
Total Split-Ticket Voters N= 503 207
Progressive 15% 14% Liberal 24% 33% Moderate 29% 40% Conservative 27% 9% Libertarian 4% 4%
Q17. May I ask your age? Are you...
Total Split-Ticket Voters N= 503 207
Under 30 years of age 4% 2% 30-39 years old 5% 4% 40-49 years old 10% 8% 50-59 years old 20% 19% 60-69 years old 24% 29% 70 years old or older 38% 38%
Q18. What is the highest level of education you have completed? Total Split-Ticket Voters
N= 503 207 Some High School 2% 1% Graduated High School 17% 16% Some college/university 19% 21% Graduated college/university 33% 29% Post-graduate degree 29% 32%
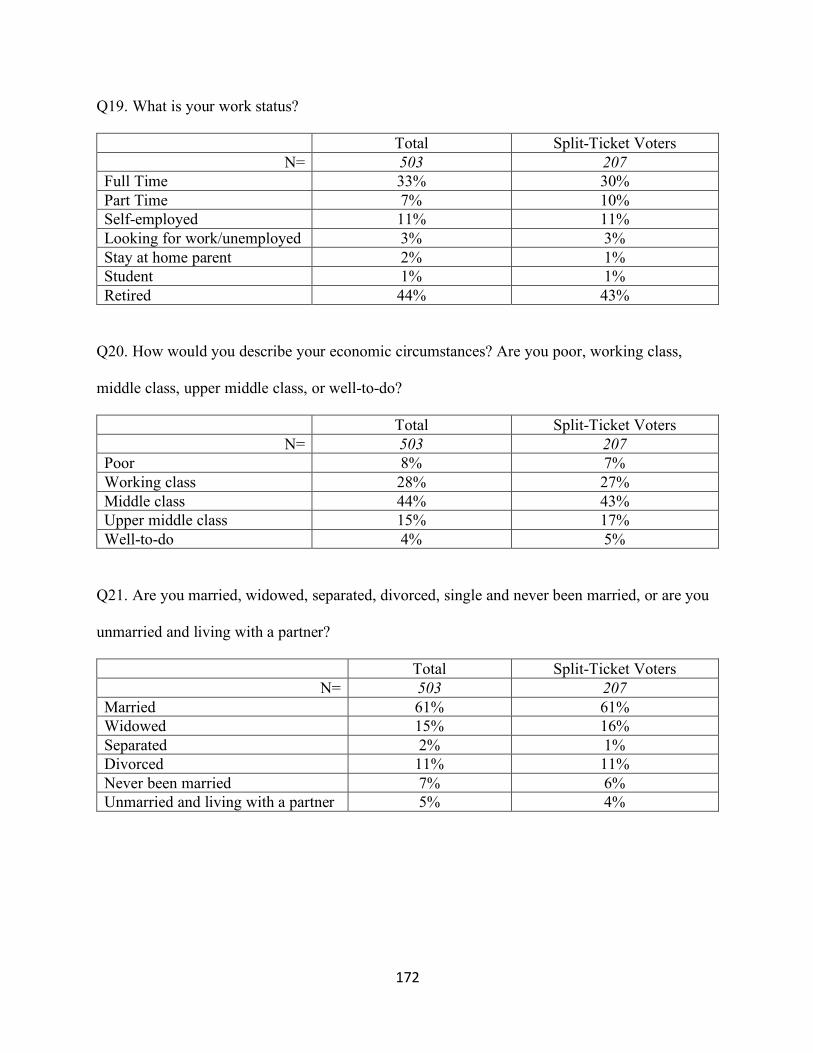
172
Q19. What is your work status?
Total Split-Ticket Voters N= 503 207
Full Time 33% 30% Part Time 7% 10% Self-employed 11% 11% Looking for work/unemployed 3% 3% Stay at home parent 2% 1% Student 1% 1% Retired 44% 43%
Q20. How would you describe your economic circumstances? Are you poor, working class,
middle class, upper middle class, or well-to-do?
Total Split-Ticket Voters N= 503 207
Poor 8% 7% Working class 28% 27% Middle class 44% 43% Upper middle class 15% 17% Well-to-do 4% 5%
Q21. Are you married, widowed, separated, divorced, single and never been married, or are you
unmarried and living with a partner?
Total Split-Ticket Voters N= 503 207
Married 61% 61% Widowed 15% 16% Separated 2% 1% Divorced 11% 11% Never been married 7% 6% Unmarried and living with a partner 5% 4%
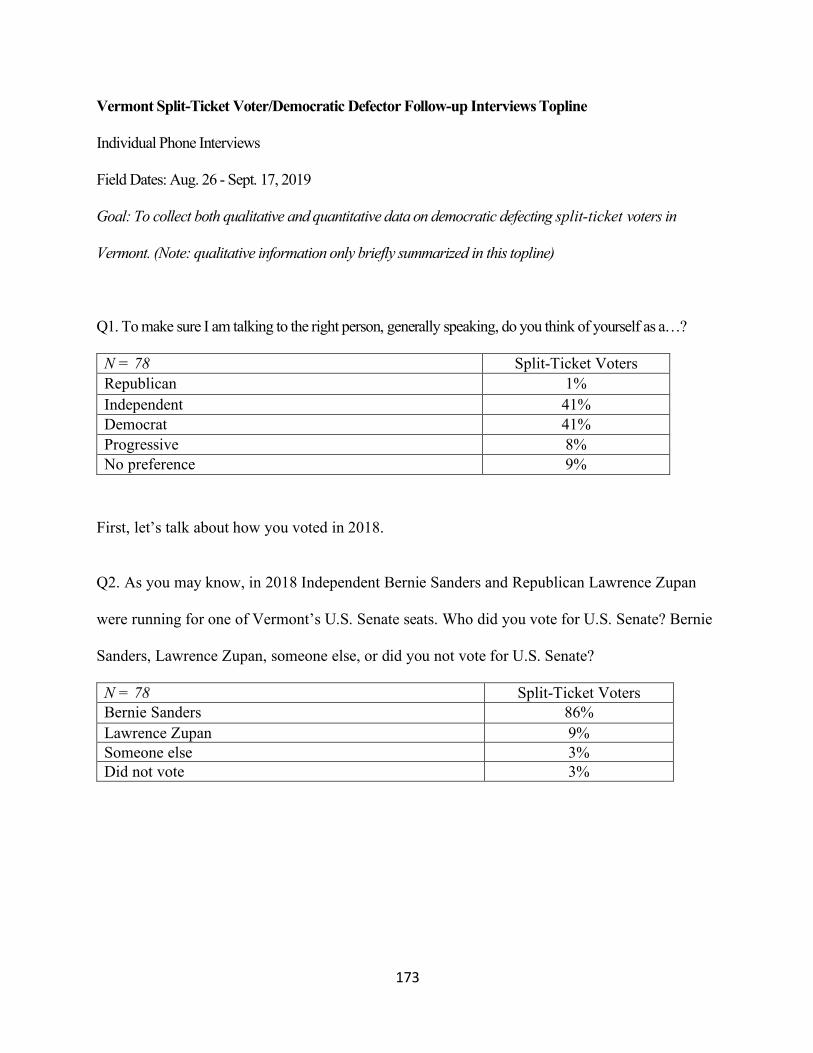
173
Vermont Split-Ticket Voter/Democratic Defector Follow-up Interviews Topline
Individual Phone Interviews
Field Dates: Aug. 26 - Sept. 17, 2019
Goal: To collect both qualitative and quantitative data on democratic defecting split-ticket voters in
Vermont. (Note: qualitative information only briefly summarized in this topline)
Q1. To make sure I am talking to the right person, generally speaking, do you think of yourself as a…?
N = 78 Split-Ticket Voters Republican 1% Independent 41% Democrat 41% Progressive 8% No preference 9%
First, let’s talk about how you voted in 2018.
Q2. As you may know, in 2018 Independent Bernie Sanders and Republican Lawrence Zupan
were running for one of Vermont’s U.S. Senate seats. Who did you vote for U.S. Senate? Bernie
Sanders, Lawrence Zupan, someone else, or did you not vote for U.S. Senate?
N = 78 Split-Ticket Voters Bernie Sanders 86% Lawrence Zupan 9% Someone else 3% Did not vote 3%
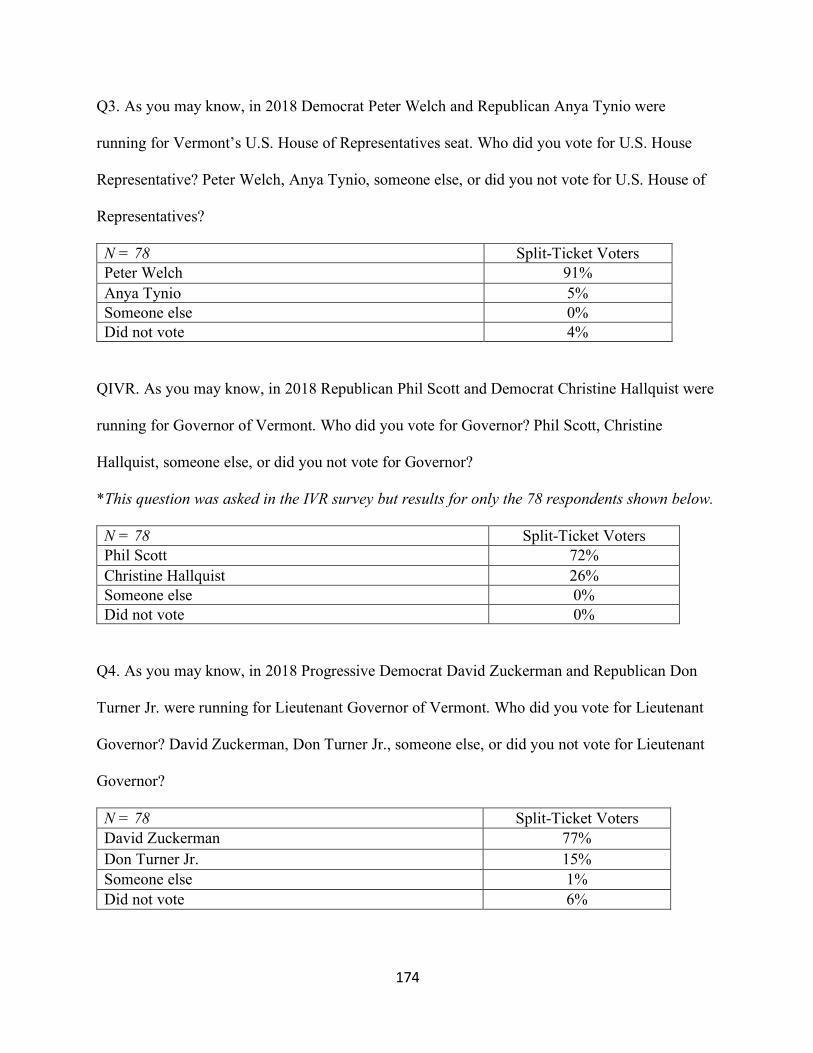
174
Q3. As you may know, in 2018 Democrat Peter Welch and Republican Anya Tynio were
running for Vermont’s U.S. House of Representatives seat. Who did you vote for U.S. House
Representative? Peter Welch, Anya Tynio, someone else, or did you not vote for U.S. House of
Representatives?
N = 78 Split-Ticket Voters Peter Welch 91% Anya Tynio 5% Someone else 0% Did not vote 4%
QIVR. As you may know, in 2018 Republican Phil Scott and Democrat Christine Hallquist were
running for Governor of Vermont. Who did you vote for Governor? Phil Scott, Christine
Hallquist, someone else, or did you not vote for Governor?
*This question was asked in the IVR survey but results for only the 78 respondents shown below.
N = 78 Split-Ticket Voters Phil Scott 72% Christine Hallquist 26% Someone else 0% Did not vote 0%
Q4. As you may know, in 2018 Progressive Democrat David Zuckerman and Republican Don
Turner Jr. were running for Lieutenant Governor of Vermont. Who did you vote for Lieutenant
Governor? David Zuckerman, Don Turner Jr., someone else, or did you not vote for Lieutenant
Governor?
N = 78 Split-Ticket Voters David Zuckerman 77% Don Turner Jr. 15% Someone else 1% Did not vote 6%
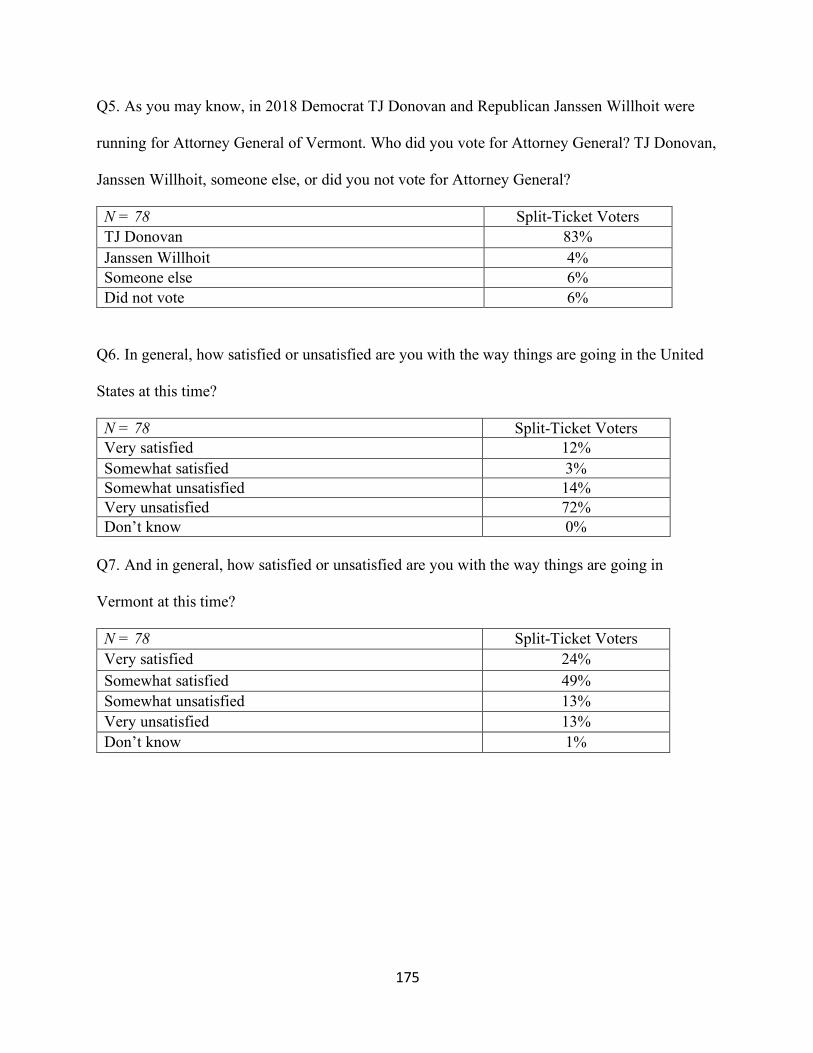
175
Q5. As you may know, in 2018 Democrat TJ Donovan and Republican Janssen Willhoit were
running for Attorney General of Vermont. Who did you vote for Attorney General? TJ Donovan,
Janssen Willhoit, someone else, or did you not vote for Attorney General?
N = 78 Split-Ticket Voters TJ Donovan 83% Janssen Willhoit 4% Someone else 6% Did not vote 6%
Q6. In general, how satisfied or unsatisfied are you with the way things are going in the United
States at this time?
N = 78 Split-Ticket Voters Very satisfied 12% Somewhat satisfied 3% Somewhat unsatisfied 14% Very unsatisfied 72% Don’t know 0%
Q7. And in general, how satisfied or unsatisfied are you with the way things are going in
Vermont at this time?
N = 78 Split-Ticket Voters Very satisfied 24% Somewhat satisfied 49% Somewhat unsatisfied 13% Very unsatisfied 13% Don’t know 1%
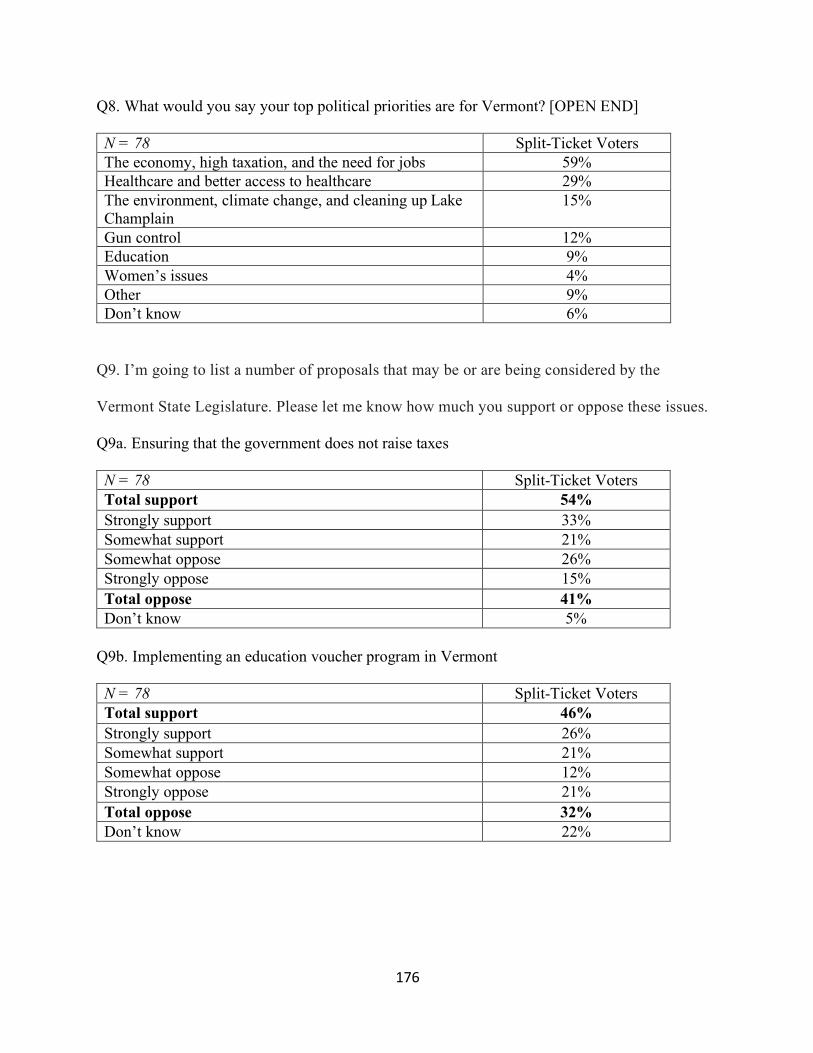
176
Q8. What would you say your top political priorities are for Vermont? [OPEN END]
N = 78 Split-Ticket Voters The economy, high taxation, and the need for jobs 59% Healthcare and better access to healthcare 29% The environment, climate change, and cleaning up Lake Champlain
15%
Gun control 12% Education 9% Women’s issues 4% Other 9% Don’t know 6%
Q9. I’m going to list a number of proposals that may be or are being considered by the
Vermont State Legislature. Please let me know how much you support or oppose these issues.
Q9a. Ensuring that the government does not raise taxes
N = 78 Split-Ticket Voters Total support 54% Strongly support 33% Somewhat support 21% Somewhat oppose 26% Strongly oppose 15% Total oppose 41% Don’t know 5%
Q9b. Implementing an education voucher program in Vermont
N = 78 Split-Ticket Voters Total support 46% Strongly support 26% Somewhat support 21% Somewhat oppose 12% Strongly oppose 21% Total oppose 32% Don’t know 22%
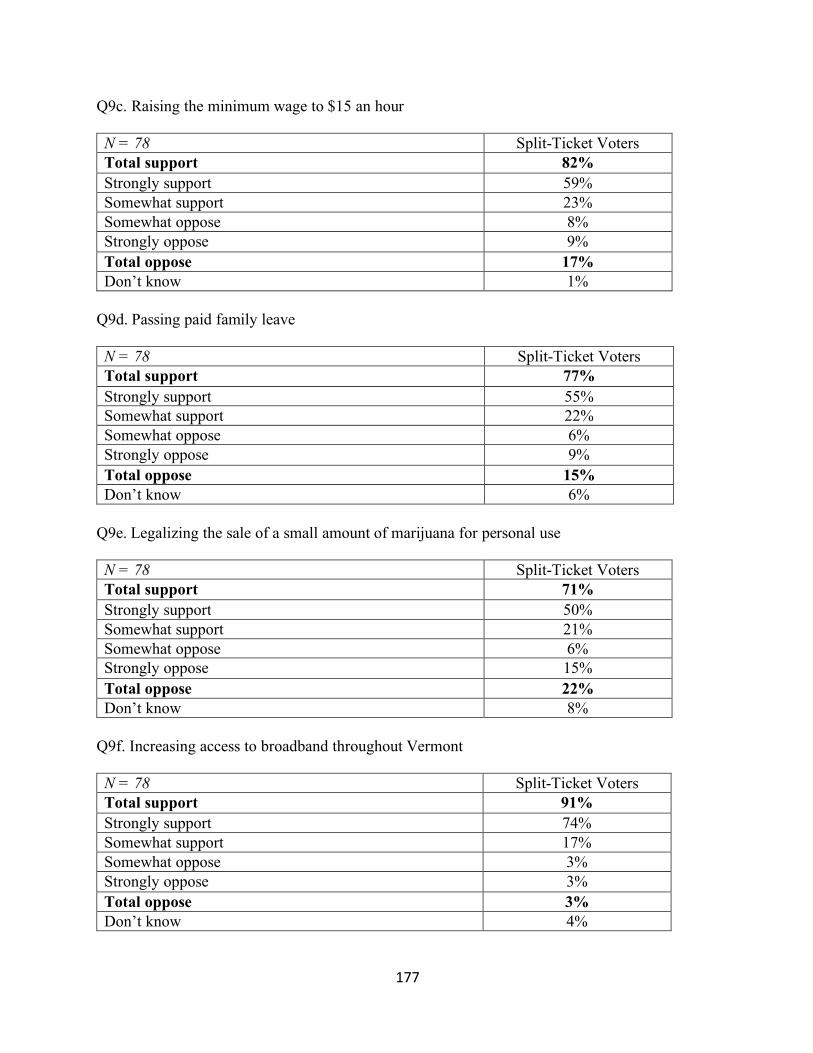
177
Q9c. Raising the minimum wage to $15 an hour
N = 78 Split-Ticket Voters Total support 82% Strongly support 59% Somewhat support 23% Somewhat oppose 8% Strongly oppose 9% Total oppose 17% Don’t know 1%
Q9d. Passing paid family leave
N = 78 Split-Ticket Voters Total support 77% Strongly support 55% Somewhat support 22% Somewhat oppose 6% Strongly oppose 9% Total oppose 15% Don’t know 6%
Q9e. Legalizing the sale of a small amount of marijuana for personal use
N = 78 Split-Ticket Voters Total support 71% Strongly support 50% Somewhat support 21% Somewhat oppose 6% Strongly oppose 15% Total oppose 22% Don’t know 8%
Q9f. Increasing access to broadband throughout Vermont
N = 78 Split-Ticket Voters Total support 91% Strongly support 74% Somewhat support 17% Somewhat oppose 3% Strongly oppose 3% Total oppose 3% Don’t know 4%
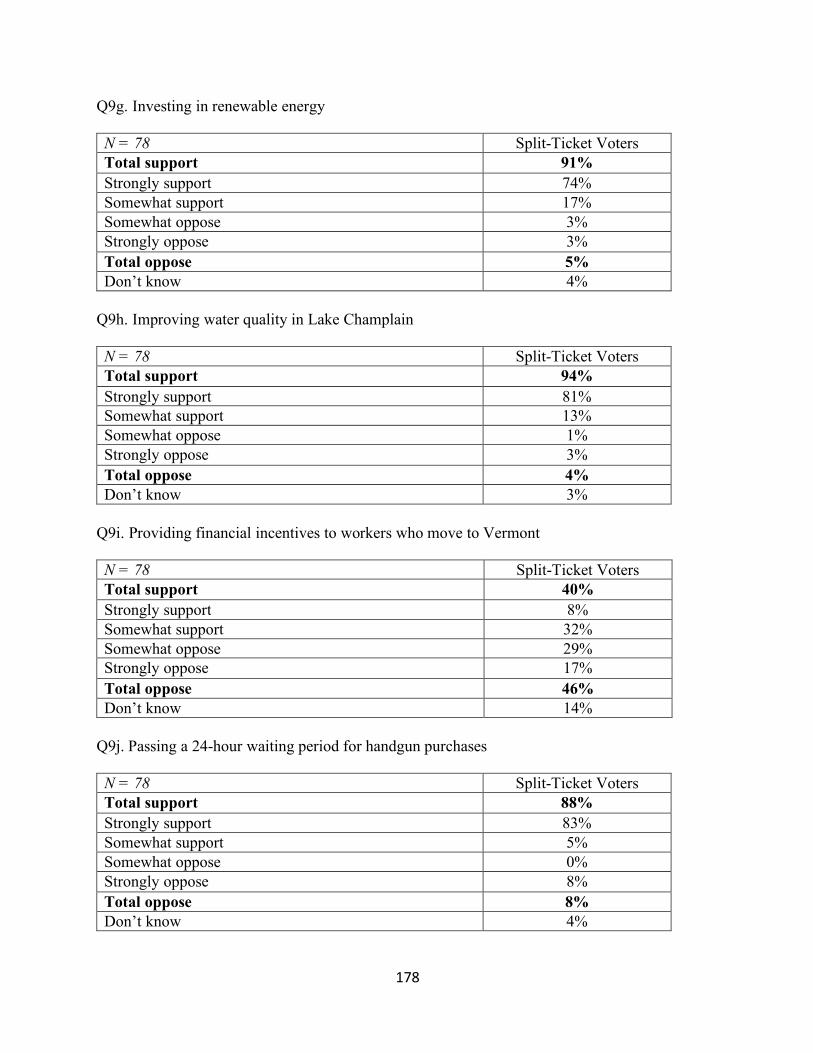
178
Q9g. Investing in renewable energy
N = 78 Split-Ticket Voters Total support 91% Strongly support 74% Somewhat support 17% Somewhat oppose 3% Strongly oppose 3% Total oppose 5% Don’t know 4%
Q9h. Improving water quality in Lake Champlain
N = 78 Split-Ticket Voters Total support 94% Strongly support 81% Somewhat support 13% Somewhat oppose 1% Strongly oppose 3% Total oppose 4% Don’t know 3%
Q9i. Providing financial incentives to workers who move to Vermont
N = 78 Split-Ticket Voters Total support 40% Strongly support 8% Somewhat support 32% Somewhat oppose 29% Strongly oppose 17% Total oppose 46% Don’t know 14%
Q9j. Passing a 24-hour waiting period for handgun purchases
N = 78 Split-Ticket Voters Total support 88% Strongly support 83% Somewhat support 5% Somewhat oppose 0% Strongly oppose 8% Total oppose 8% Don’t know 4%
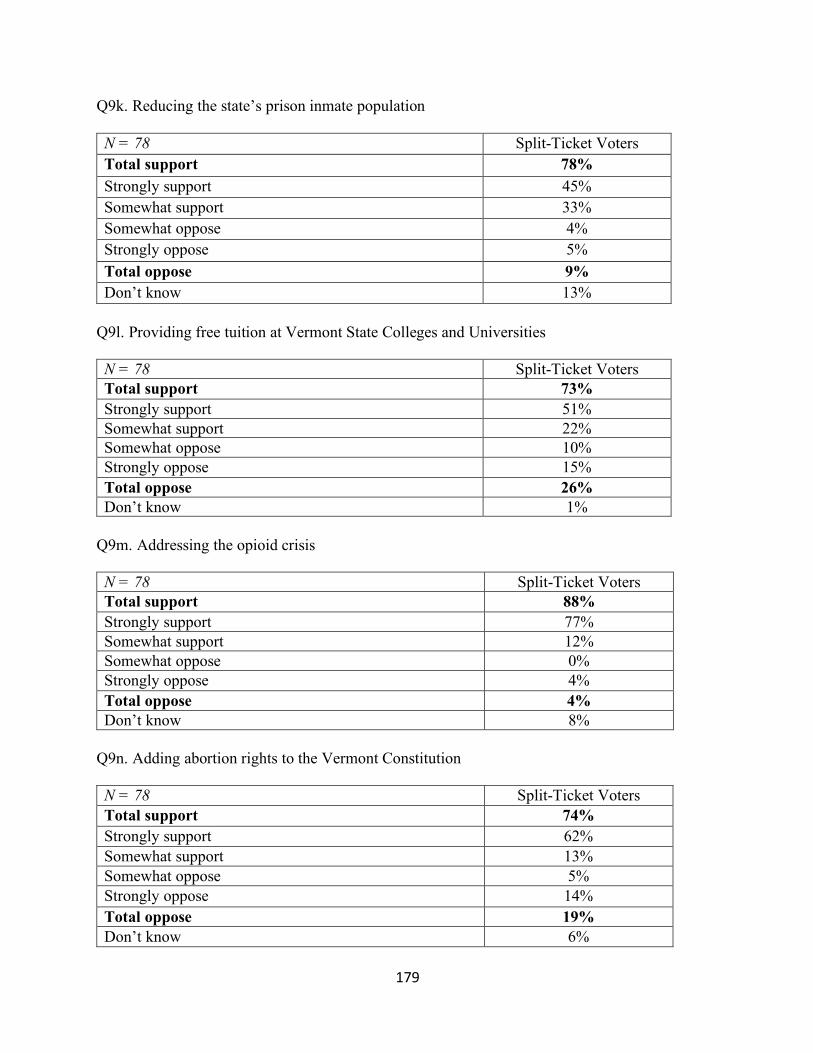
179
Q9k. Reducing the state’s prison inmate population N = 78 Split-Ticket Voters Total support 78% Strongly support 45% Somewhat support 33% Somewhat oppose 4% Strongly oppose 5% Total oppose 9% Don’t know 13%
Q9l. Providing free tuition at Vermont State Colleges and Universities
N = 78 Split-Ticket Voters Total support 73% Strongly support 51% Somewhat support 22% Somewhat oppose 10% Strongly oppose 15% Total oppose 26% Don’t know 1%
Q9m. Addressing the opioid crisis
N = 78 Split-Ticket Voters Total support 88% Strongly support 77% Somewhat support 12% Somewhat oppose 0% Strongly oppose 4% Total oppose 4% Don’t know 8%
Q9n. Adding abortion rights to the Vermont Constitution
N = 78 Split-Ticket Voters Total support 74% Strongly support 62% Somewhat support 13% Somewhat oppose 5% Strongly oppose 14% Total oppose 19% Don’t know 6%
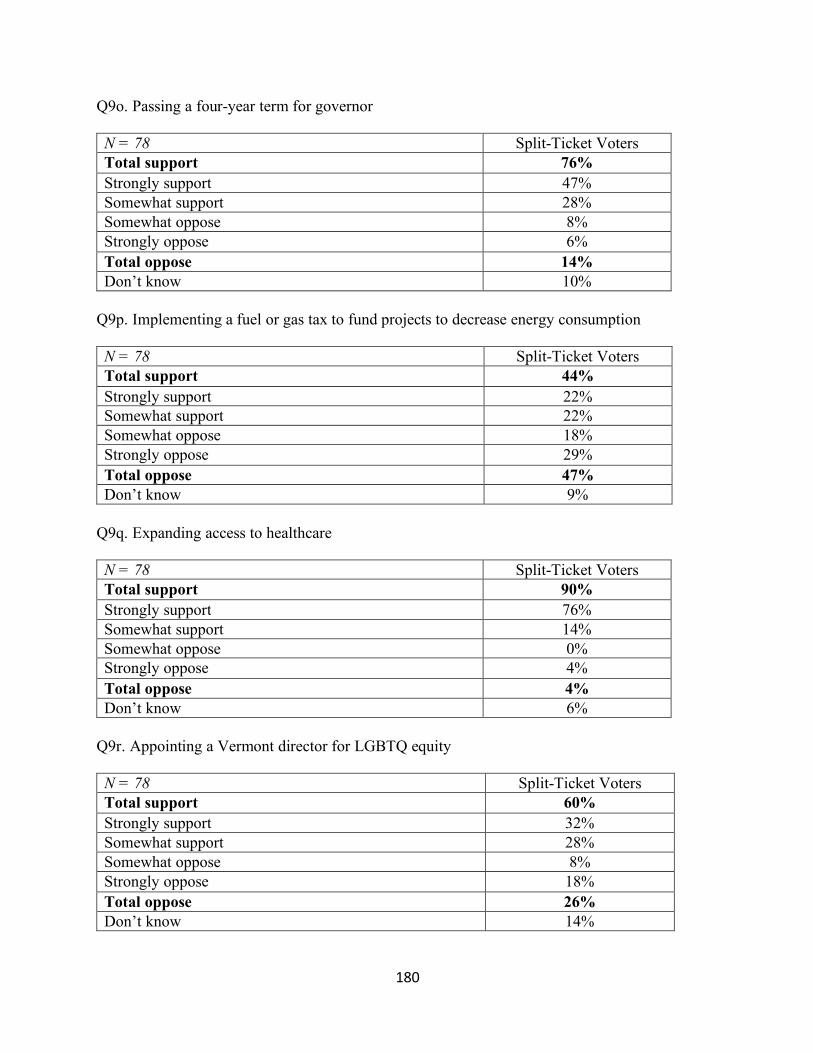
180
Q9o. Passing a four-year term for governor
N = 78 Split-Ticket Voters Total support 76% Strongly support 47% Somewhat support 28% Somewhat oppose 8% Strongly oppose 6% Total oppose 14% Don’t know 10%
Q9p. Implementing a fuel or gas tax to fund projects to decrease energy consumption
N = 78 Split-Ticket Voters Total support 44% Strongly support 22% Somewhat support 22% Somewhat oppose 18% Strongly oppose 29% Total oppose 47% Don’t know 9%
Q9q. Expanding access to healthcare
N = 78 Split-Ticket Voters Total support 90% Strongly support 76% Somewhat support 14% Somewhat oppose 0% Strongly oppose 4% Total oppose 4% Don’t know 6%
Q9r. Appointing a Vermont director for LGBTQ equity
N = 78 Split-Ticket Voters Total support 60% Strongly support 32% Somewhat support 28% Somewhat oppose 8% Strongly oppose 18% Total oppose 26% Don’t know 14%
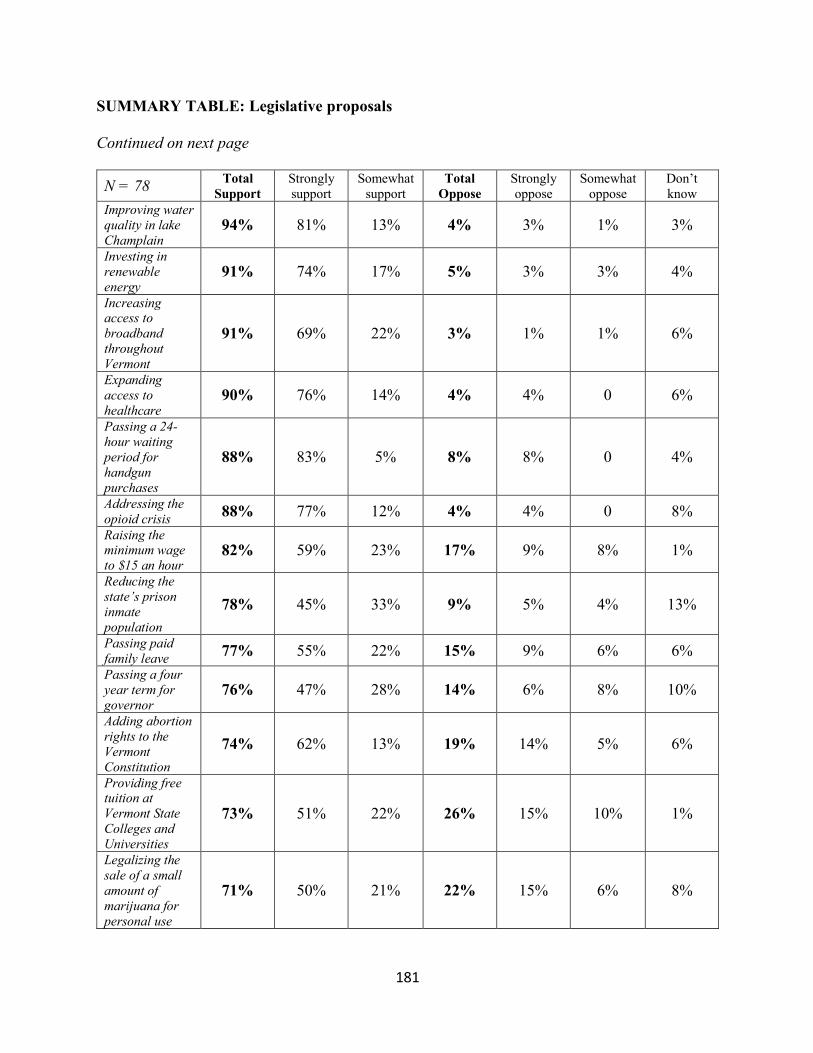
181
SUMMARY TABLE: Legislative proposals
Continued on next page
N = 78 Total Support
Strongly support
Somewhat support
Total Oppose
Strongly oppose
Somewhat oppose
Don’t know
Improving water quality in lake Champlain
94% 81% 13% 4% 3% 1% 3%
Investing in renewable energy
91% 74% 17% 5% 3% 3% 4%
Increasing access to broadband throughout Vermont
91% 69% 22% 3% 1% 1% 6%
Expanding access to healthcare
90% 76% 14% 4% 4% 0 6%
Passing a 24-hour waiting period for handgun purchases
88% 83% 5% 8% 8% 0 4%
Addressing the opioid crisis 88% 77% 12% 4% 4% 0 8% Raising the minimum wage to $15 an hour
82% 59% 23% 17% 9% 8% 1%
Reducing the state’s prison inmate population
78% 45% 33% 9% 5% 4% 13%
Passing paid family leave 77% 55% 22% 15% 9% 6% 6% Passing a four year term for governor
76% 47% 28% 14% 6% 8% 10%
Adding abortion rights to the Vermont Constitution
74% 62% 13% 19% 14% 5% 6%
Providing free tuition at Vermont State Colleges and Universities
73% 51% 22% 26% 15% 10% 1%
Legalizing the sale of a small amount of marijuana for personal use
71% 50% 21% 22% 15% 6% 8%
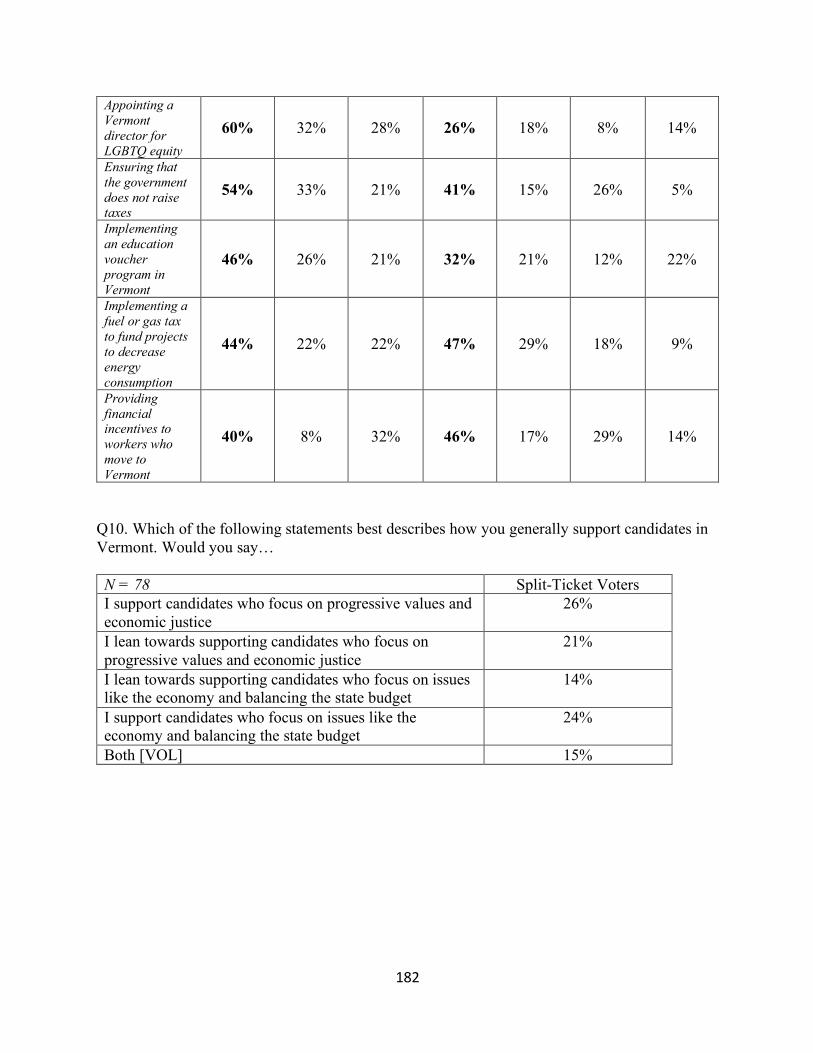
182
Appointing a Vermont director for LGBTQ equity
60% 32% 28% 26% 18% 8% 14%
Ensuring that the government does not raise taxes
54% 33% 21% 41% 15% 26% 5%
Implementing an education voucher program in Vermont
46% 26% 21% 32% 21% 12% 22%
Implementing a fuel or gas tax to fund projects to decrease energy consumption
44% 22% 22% 47% 29% 18% 9%
Providing financial incentives to workers who move to Vermont
40% 8% 32% 46% 17% 29% 14%
Q10. Which of the following statements best describes how you generally support candidates in Vermont. Would you say… N = 78 Split-Ticket Voters I support candidates who focus on progressive values and economic justice
26%
I lean towards supporting candidates who focus on progressive values and economic justice
21%
I lean towards supporting candidates who focus on issues like the economy and balancing the state budget
14%
I support candidates who focus on issues like the economy and balancing the state budget
24%
Both [VOL] 15%
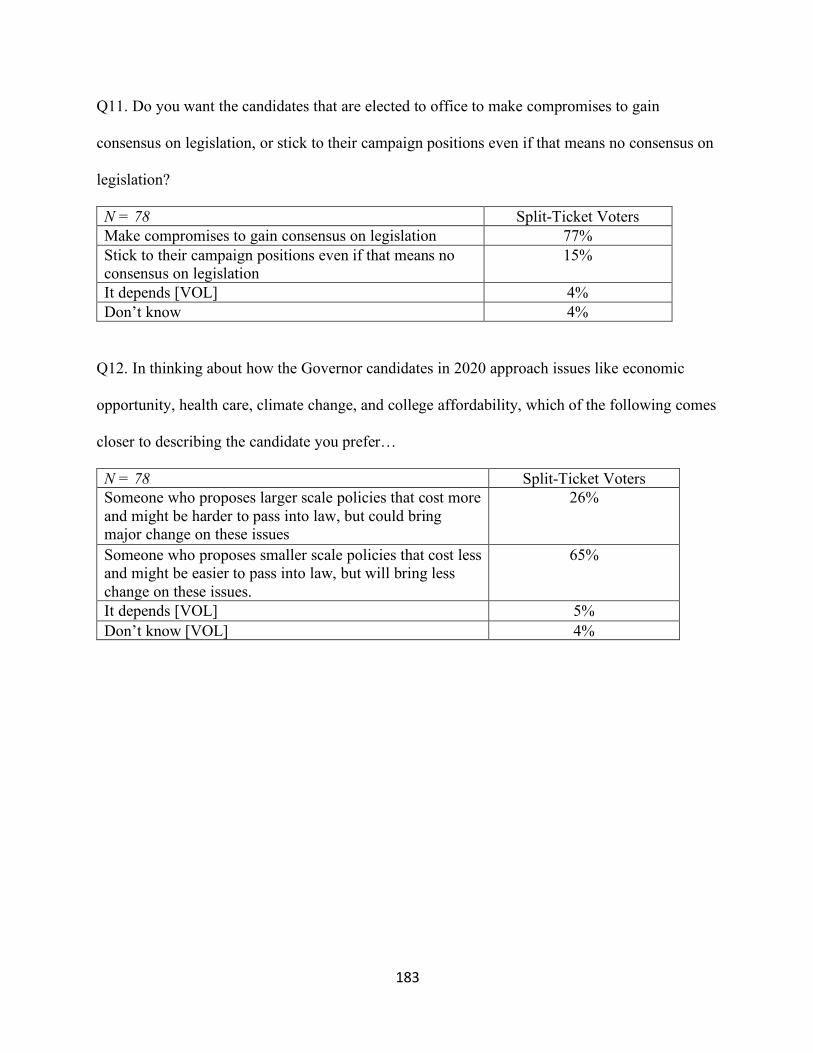
183
Q11. Do you want the candidates that are elected to office to make compromises to gain
consensus on legislation, or stick to their campaign positions even if that means no consensus on
legislation?
N = 78 Split-Ticket Voters Make compromises to gain consensus on legislation 77% Stick to their campaign positions even if that means no consensus on legislation
15%
It depends [VOL] 4% Don’t know 4%
Q12. In thinking about how the Governor candidates in 2020 approach issues like economic
opportunity, health care, climate change, and college affordability, which of the following comes
closer to describing the candidate you prefer…
N = 78 Split-Ticket Voters Someone who proposes larger scale policies that cost more and might be harder to pass into law, but could bring major change on these issues
26%
Someone who proposes smaller scale policies that cost less and might be easier to pass into law, but will bring less change on these issues.
65%
It depends [VOL] 5% Don’t know [VOL] 4%
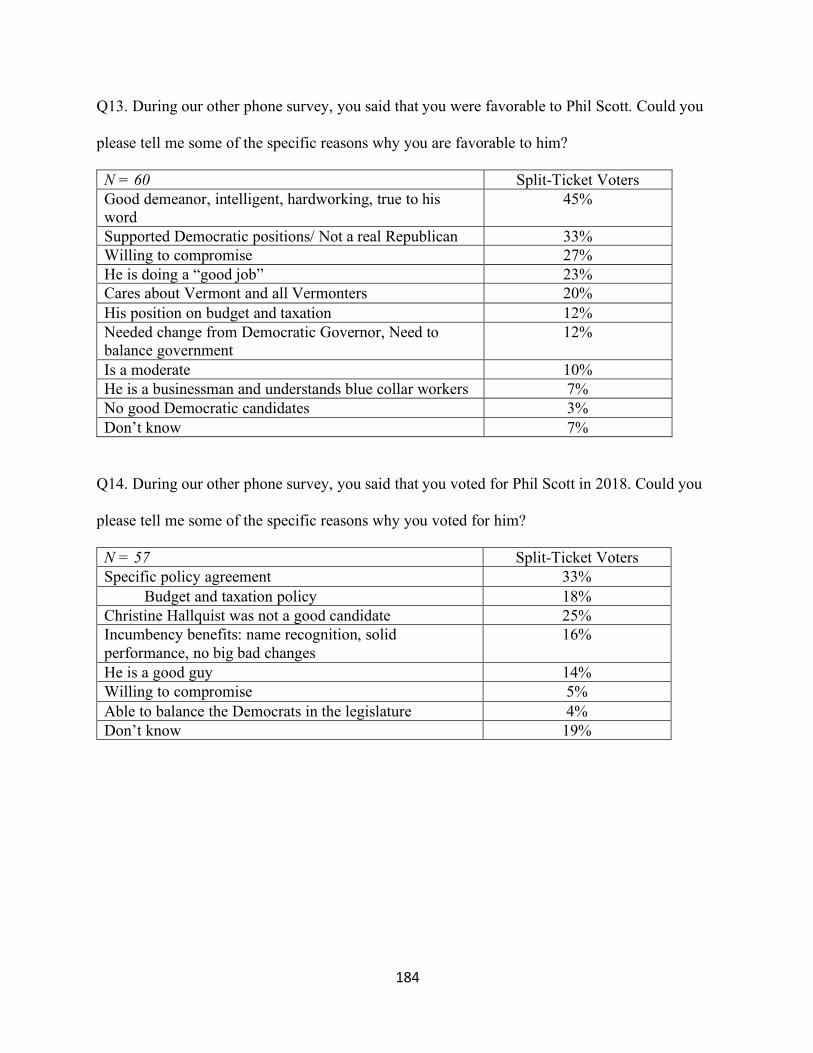
184
Q13. During our other phone survey, you said that you were favorable to Phil Scott. Could you
please tell me some of the specific reasons why you are favorable to him?
N = 60 Split-Ticket Voters Good demeanor, intelligent, hardworking, true to his word
45%
Supported Democratic positions/ Not a real Republican 33% Willing to compromise 27% He is doing a “good job” 23% Cares about Vermont and all Vermonters 20% His position on budget and taxation 12% Needed change from Democratic Governor, Need to balance government
12%
Is a moderate 10% He is a businessman and understands blue collar workers 7% No good Democratic candidates 3% Don’t know 7%
Q14. During our other phone survey, you said that you voted for Phil Scott in 2018. Could you
please tell me some of the specific reasons why you voted for him?
N = 57 Split-Ticket Voters Specific policy agreement 33%
Budget and taxation policy 18% Christine Hallquist was not a good candidate 25% Incumbency benefits: name recognition, solid performance, no big bad changes
16%
He is a good guy 14% Willing to compromise 5% Able to balance the Democrats in the legislature 4% Don’t know 19%
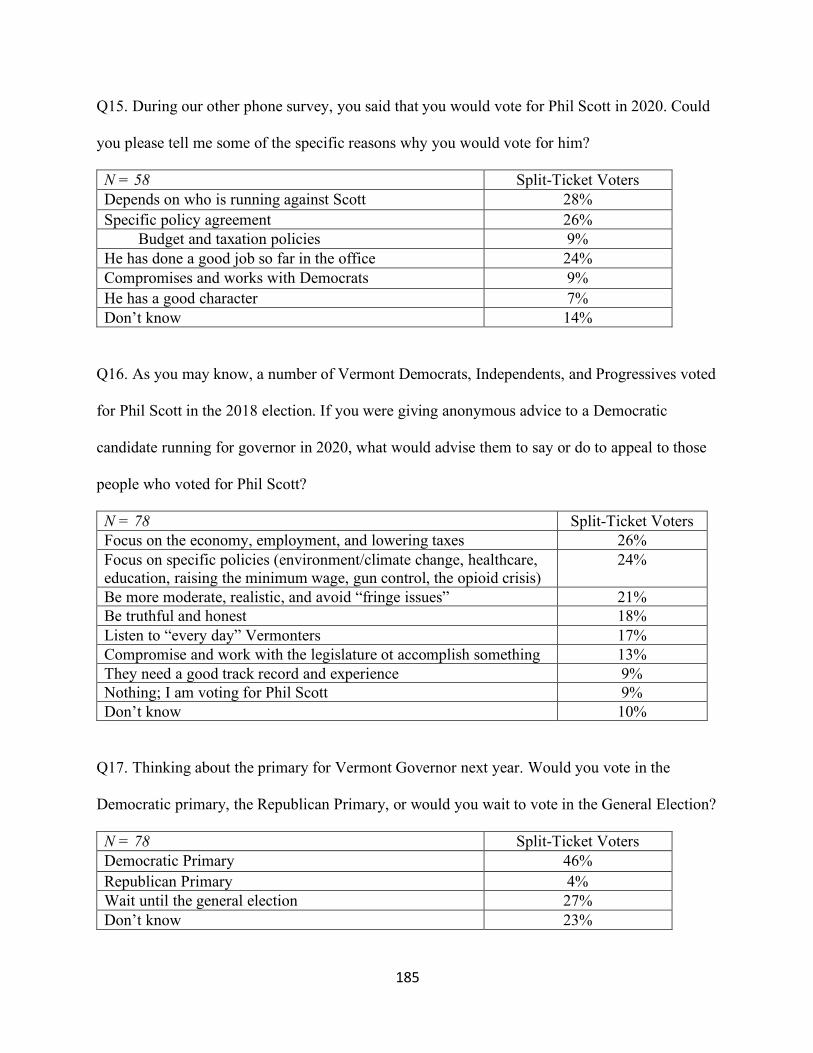
185
Q15. During our other phone survey, you said that you would vote for Phil Scott in 2020. Could
you please tell me some of the specific reasons why you would vote for him?
N = 58 Split-Ticket Voters Depends on who is running against Scott 28% Specific policy agreement 26%
Budget and taxation policies 9% He has done a good job so far in the office 24% Compromises and works with Democrats 9% He has a good character 7% Don’t know 14%
Q16. As you may know, a number of Vermont Democrats, Independents, and Progressives voted
for Phil Scott in the 2018 election. If you were giving anonymous advice to a Democratic
candidate running for governor in 2020, what would advise them to say or do to appeal to those
people who voted for Phil Scott?
N = 78 Split-Ticket Voters Focus on the economy, employment, and lowering taxes 26% Focus on specific policies (environment/climate change, healthcare, education, raising the minimum wage, gun control, the opioid crisis)
24%
Be more moderate, realistic, and avoid “fringe issues” 21% Be truthful and honest 18% Listen to “every day” Vermonters 17% Compromise and work with the legislature ot accomplish something 13% They need a good track record and experience 9% Nothing; I am voting for Phil Scott 9% Don’t know 10%
Q17. Thinking about the primary for Vermont Governor next year. Would you vote in the
Democratic primary, the Republican Primary, or would you wait to vote in the General Election?
N = 78 Split-Ticket Voters Democratic Primary 46% Republican Primary 4% Wait until the general election 27% Don’t know 23%
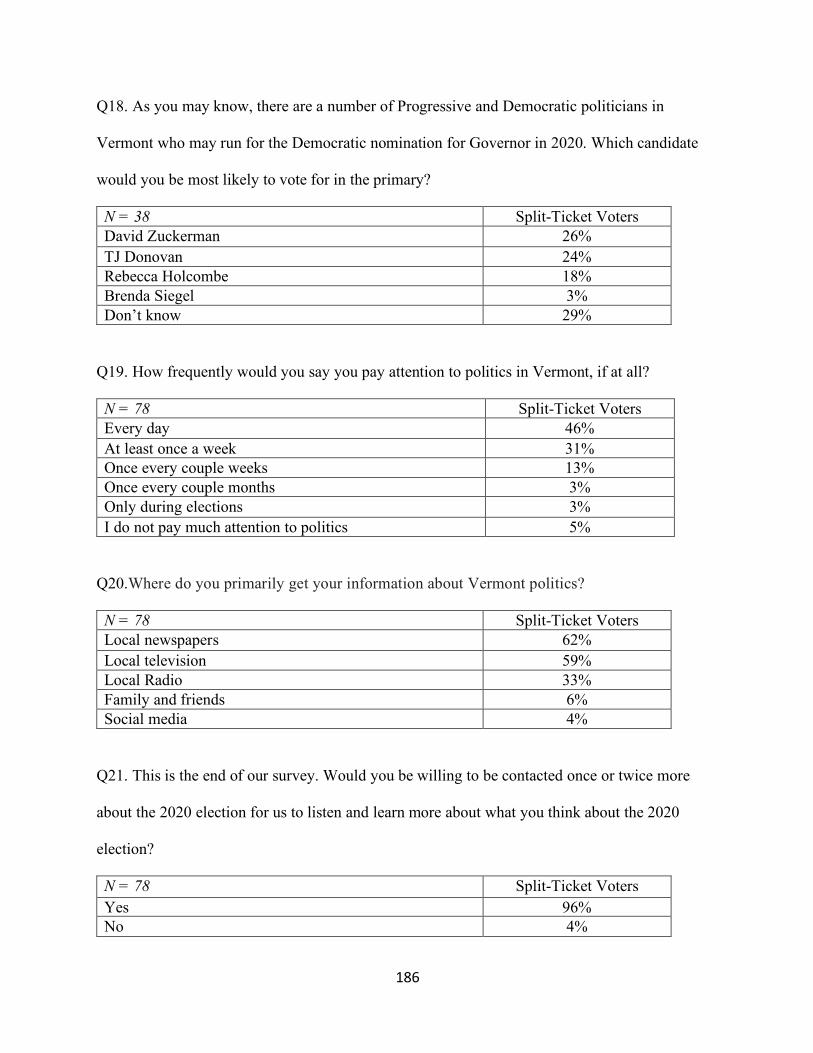
186
Q18. As you may know, there are a number of Progressive and Democratic politicians in
Vermont who may run for the Democratic nomination for Governor in 2020. Which candidate
would you be most likely to vote for in the primary?
N = 38 Split-Ticket Voters David Zuckerman 26% TJ Donovan 24% Rebecca Holcombe 18% Brenda Siegel 3% Don’t know 29%
Q19. How frequently would you say you pay attention to politics in Vermont, if at all?
N = 78 Split-Ticket Voters Every day 46% At least once a week 31% Once every couple weeks 13% Once every couple months 3% Only during elections 3% I do not pay much attention to politics 5%
Q20.Where do you primarily get your information about Vermont politics?
N = 78 Split-Ticket Voters Local newspapers 62% Local television 59% Local Radio 33% Family and friends 6% Social media 4%
Q21. This is the end of our survey. Would you be willing to be contacted once or twice more
about the 2020 election for us to listen and learn more about what you think about the 2020
election?
N = 78 Split-Ticket Voters Yes 96% No 4%
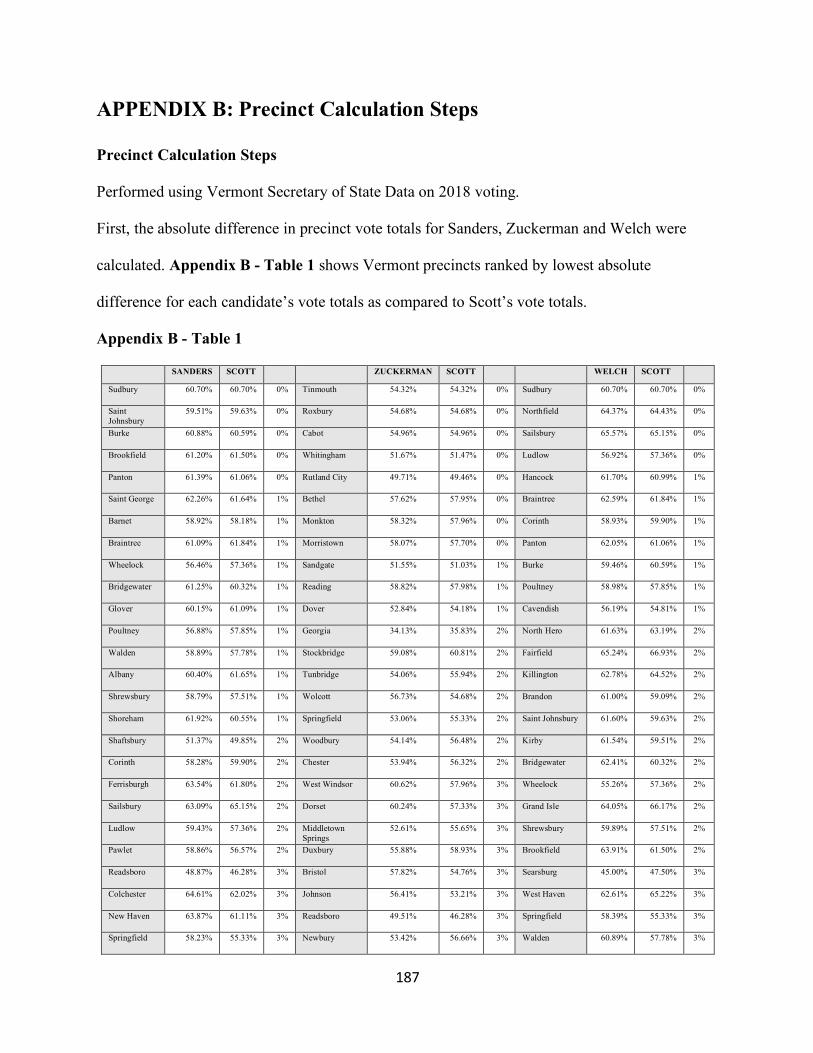
187
APPENDIX B: Precinct Calculation Steps
Precinct Calculation Steps
Performed using Vermont Secretary of State Data on 2018 voting.
First, the absolute difference in precinct vote totals for Sanders, Zuckerman and Welch were
calculated. Appendix B - Table 1 shows Vermont precincts ranked by lowest absolute
difference for each candidate’s vote totals as compared to Scott’s vote totals.
Appendix B - Table 1
SANDERS SCOTT ZUCKERMAN SCOTT WELCH SCOTT
Sudbury 60.70% 60.70% 0% Tinmouth 54.32% 54.32% 0% Sudbury 60.70% 60.70% 0%
Saint Johnsbury
59.51% 59.63% 0% Roxbury 54.68% 54.68% 0% Northfield 64.37% 64.43% 0%
Burke 60.88% 60.59% 0% Cabot 54.96% 54.96% 0% Sailsbury 65.57% 65.15% 0%
Brookfield 61.20% 61.50% 0% Whitingham 51.67% 51.47% 0% Ludlow 56.92% 57.36% 0%
Panton 61.39% 61.06% 0% Rutland City 49.71% 49.46% 0% Hancock 61.70% 60.99% 1%
Saint George 62.26% 61.64% 1% Bethel 57.62% 57.95% 0% Braintree 62.59% 61.84% 1%
Barnet 58.92% 58.18% 1% Monkton 58.32% 57.96% 0% Corinth 58.93% 59.90% 1%
Braintree 61.09% 61.84% 1% Morristown 58.07% 57.70% 0% Panton 62.05% 61.06% 1%
Wheelock 56.46% 57.36% 1% Sandgate 51.55% 51.03% 1% Burke 59.46% 60.59% 1%
Bridgewater 61.25% 60.32% 1% Reading 58.82% 57.98% 1% Poultney 58.98% 57.85% 1%
Glover 60.15% 61.09% 1% Dover 52.84% 54.18% 1% Cavendish 56.19% 54.81% 1%
Poultney 56.88% 57.85% 1% Georgia 34.13% 35.83% 2% North Hero 61.63% 63.19% 2%
Walden 58.89% 57.78% 1% Stockbridge 59.08% 60.81% 2% Fairfield 65.24% 66.93% 2%
Albany 60.40% 61.65% 1% Tunbridge 54.06% 55.94% 2% Killington 62.78% 64.52% 2%
Shrewsbury 58.79% 57.51% 1% Wolcott 56.73% 54.68% 2% Brandon 61.00% 59.09% 2%
Shoreham 61.92% 60.55% 1% Springfield 53.06% 55.33% 2% Saint Johnsbury 61.60% 59.63% 2%
Shaftsbury 51.37% 49.85% 2% Woodbury 54.14% 56.48% 2% Kirby 61.54% 59.51% 2%
Corinth 58.28% 59.90% 2% Chester 53.94% 56.32% 2% Bridgewater 62.41% 60.32% 2%
Ferrisburgh 63.54% 61.80% 2% West Windsor 60.62% 57.96% 3% Wheelock 55.26% 57.36% 2%
Sailsbury 63.09% 65.15% 2% Dorset 60.24% 57.33% 3% Grand Isle 64.05% 66.17% 2%
Ludlow 59.43% 57.36% 2% Middletown Springs
52.61% 55.65% 3% Shrewsbury 59.89% 57.51% 2%
Pawlet 58.86% 56.57% 2% Duxbury 55.88% 58.93% 3% Brookfield 63.91% 61.50% 2%
Readsboro 48.87% 46.28% 3% Bristol 57.82% 54.76% 3% Searsburg 45.00% 47.50% 3%
Colchester 64.61% 62.02% 3% Johnson 56.41% 53.21% 3% West Haven 62.61% 65.22% 3%
New Haven 63.87% 61.11% 3% Readsboro 49.51% 46.28% 3% Springfield 58.39% 55.33% 3%
Springfield 58.23% 55.33% 3% Newbury 53.42% 56.66% 3% Walden 60.89% 57.78% 3%

188
Cavendish 57.90% 54.81% 3% Pownal 50.90% 47.60% 3% Middletown Springs
58.91% 55.65% 3%
Whitingham 54.62% 51.47% 3% Rupert 52.97% 56.37% 3% Pawlet 60.00% 56.57% 3%
Kirby 56.28% 59.51% 3% Jericho 59.38% 55.85% 4% Pittsfield 60.31% 63.74% 3%
North Hero 59.90% 63.19% 3% Cambridge 57.45% 53.82% 4% Proctor 61.27% 64.74% 3%
Waltham 62.36% 59.04% 3% Londonderry 59.00% 55.23% 4% Athens 54.55% 51.05% 4%
Killington 60.87% 64.52% 4% Barnard 57.58% 53.79% 4% Danville 61.45% 65% 4%
Tinmouth 58.02% 54.32% 4% Grafton 60.26% 56.41% 4% Shoreham 64.15% 60.55% 4%
Newark 54.86% 58.75% 4% Pawlet 52.71% 56.57% 4% Glover 64.85% 61.09% 4%
Newbury 60.60% 56.66% 4% Manchester 56.61% 52.63% 4% Ferrisburgh 65.76% 61.80% 4%
Hardwick 62.56% 58.52% 4% Bradford 54.56% 58.75% 4% Albany 57.64% 61.65% 4%
Northfield 60.24% 64.43% 4% Hancock 56.74% 60.99% 4% Fair Haven 54.23% 58.56% 4%
Fletcher 62.48% 58.24% 4% Shaftsbury 54.24% 49.85% 4% New Haven 65.51% 61.11% 4%
Grand Isle 61.65% 66.17% 5% Walden 53.33% 57.78% 4% Saint George 66.04% 61.64% 4%
Pittsfield 59.16% 63.74% 5% Williston 56.52% 61.02% 4% Wallingford 55.70% 60.26% 5%
Strafford 41.12% 36.48% 5% Cavendish 50.17% 54.81% 5% Newbury 61.30% 56.66% 5%
Bakersfield 66.03% 61.29% 5% Barnet 53.51% 58.18% 5% Newark 54.09% 58.75% 5%
Fair Haven 53.61% 58.56% 5% Shrewsbury 52.56% 57.51% 5% Randolph 64.37% 59.62% 5%
West Haven 60% 65.22% 5% Searsburg 42.50% 47.50% 5% Readsboro 51.13% 46.28% 5%
Randolph 64.95% 59.62% 5% Randolph 54.48% 59.62% 5% Stratton 58.54% 63.41% 5%
Williston 66.71% 61.02% 6% Royalton 57.29% 52.12% 5% Barnet 63.10% 58.18% 5%
Bradford 64.45% 58.75% 6% Plymouth 59.02% 53.76% 5% Bakersfield 66.22% 61.29% 5%
Westfield 56.54% 62.31% 6% Sudbury 55.09% 60.70% 6% Westfield 57.31% 62.31% 5%
Woodbury 62.63% 56.48% 6% Pomfret 59.39% 53.70% 6% Chester 61.42% 56.32% 5%
Weathersfield 55.56% 61.84% 6% Orwell 38.25% 32.54% 6% Stamford 49.87% 55.15% 5%
Saint Albans City
66.21% 59.86% 6% West Fairlee 60.56% 54.80% 6% Whitingham 56.78% 51.47% 5%
Stratton 56.91% 63.41% 6% Underhill 60.21% 54.43% 6% Hardwick 63.86% 58.52% 5%
Sandgate 57.73% 51.03% 7% Bridgewater 54.52% 60.32% 6% Plymouth 59.11% 53.76% 5%
Reading 64.71% 57.98% 7% Hyde Park 54.05% 60.15% 6% Hubbardton 56.73% 62.18% 5%
Dover 61.04% 54.18% 7% Windham 63.51% 57.35% 6% Westmore 55.87% 61.45% 6%
Westford 66.49% 59.60% 7% Vergennes 60.54% 54.36% 6% Sandgate 56.70% 51.03% 6%
Stockbridge 67.72% 60.81% 7% Weston 61.43% 55.10% 6% Dover 59.85% 54.18% 6%
Wallingford 53.31% 60.26% 7% Brandon 52.68% 59.09% 6% Tinmouth 60.08% 54.32% 6%
Vernon 53.27% 60.24% 7% Stowe 61.36% 54.95% 6% Colchester 67.95% 62.02% 6%
Athens 58.04% 51.05% 7% Wardsboro 56.48% 50.00% 6% Weathersfield 55.72% 61.84% 6%
Londonderry 62.29% 55.23% 7% Ludlow 50.71% 57.36% 7% Fletcher 64.60% 58.24% 6%
Rupert 63.46% 56.37% 7% Panton 54.13% 61.06% 7% Barton 60.22% 66.85% 7%
Stamford 48.02% 55.15% 7% Corinth 52.76% 59.90% 7% Whiting 65.36% 72.07% 7%
Westmore 54.19% 61.45% 7% Arlington 57.61% 50.46% 7% Grafton 63.14% 56.41% 7%
Whiting 64.80% 72.07% 7% Poultney 50.65% 57.85% 7% Reading 64.71% 57.98% 7%
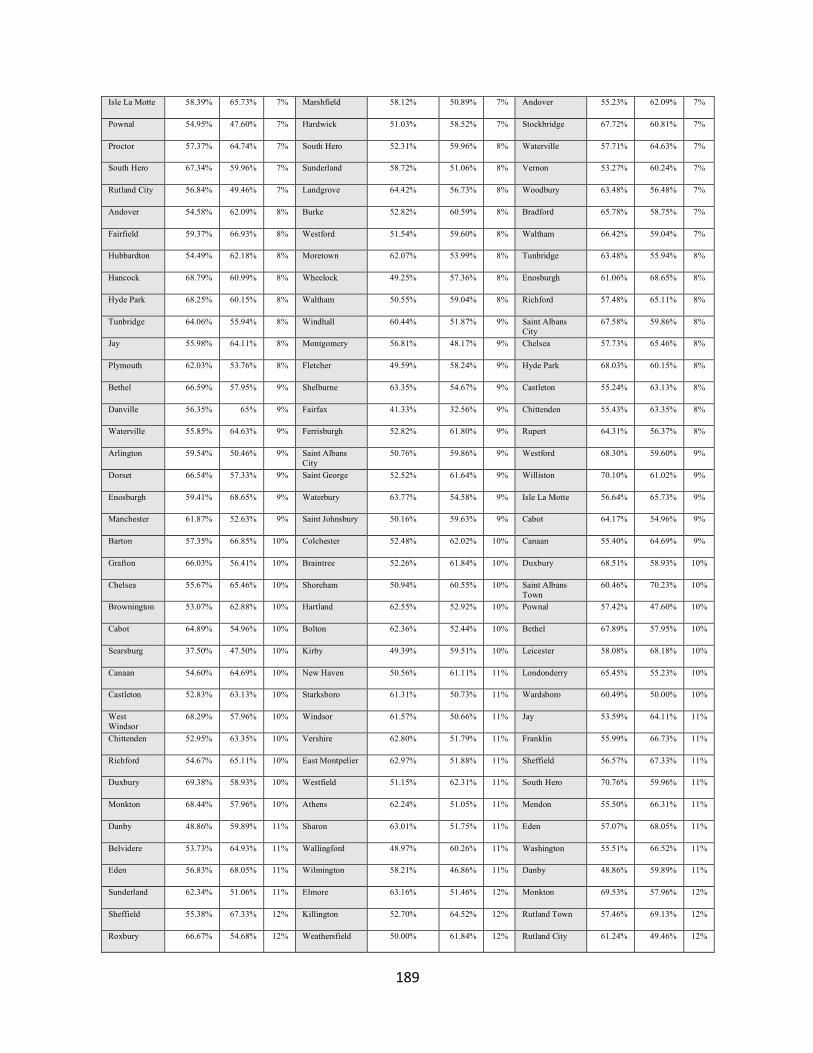
189
Isle La Motte 58.39% 65.73% 7% Marshfield 58.12% 50.89% 7% Andover 55.23% 62.09% 7%
Pownal 54.95% 47.60% 7% Hardwick 51.03% 58.52% 7% Stockbridge 67.72% 60.81% 7%
Proctor 57.37% 64.74% 7% South Hero 52.31% 59.96% 8% Waterville 57.71% 64.63% 7%
South Hero 67.34% 59.96% 7% Sunderland 58.72% 51.06% 8% Vernon 53.27% 60.24% 7%
Rutland City 56.84% 49.46% 7% Landgrove 64.42% 56.73% 8% Woodbury 63.48% 56.48% 7%
Andover 54.58% 62.09% 8% Burke 52.82% 60.59% 8% Bradford 65.78% 58.75% 7%
Fairfield 59.37% 66.93% 8% Westford 51.54% 59.60% 8% Waltham 66.42% 59.04% 7%
Hubbardton 54.49% 62.18% 8% Moretown 62.07% 53.99% 8% Tunbridge 63.48% 55.94% 8%
Hancock 68.79% 60.99% 8% Wheelock 49.25% 57.36% 8% Enosburgh 61.06% 68.65% 8%
Hyde Park 68.25% 60.15% 8% Waltham 50.55% 59.04% 8% Richford 57.48% 65.11% 8%
Tunbridge 64.06% 55.94% 8% Windhall 60.44% 51.87% 9% Saint Albans City
67.58% 59.86% 8%
Jay 55.98% 64.11% 8% Montgomery 56.81% 48.17% 9% Chelsea 57.73% 65.46% 8%
Plymouth 62.03% 53.76% 8% Fletcher 49.59% 58.24% 9% Hyde Park 68.03% 60.15% 8%
Bethel 66.59% 57.95% 9% Shelburne 63.35% 54.67% 9% Castleton 55.24% 63.13% 8%
Danville 56.35% 65% 9% Fairfax 41.33% 32.56% 9% Chittenden 55.43% 63.35% 8%
Waterville 55.85% 64.63% 9% Ferrisburgh 52.82% 61.80% 9% Rupert 64.31% 56.37% 8%
Arlington 59.54% 50.46% 9% Saint Albans City
50.76% 59.86% 9% Westford 68.30% 59.60% 9%
Dorset 66.54% 57.33% 9% Saint George 52.52% 61.64% 9% Williston 70.10% 61.02% 9%
Enosburgh 59.41% 68.65% 9% Waterbury 63.77% 54.58% 9% Isle La Motte 56.64% 65.73% 9%
Manchester 61.87% 52.63% 9% Saint Johnsbury 50.16% 59.63% 9% Cabot 64.17% 54.96% 9%
Barton 57.35% 66.85% 10% Colchester 52.48% 62.02% 10% Canaan 55.40% 64.69% 9%
Grafton 66.03% 56.41% 10% Braintree 52.26% 61.84% 10% Duxbury 68.51% 58.93% 10%
Chelsea 55.67% 65.46% 10% Shoreham 50.94% 60.55% 10% Saint Albans Town
60.46% 70.23% 10%
Brownington 53.07% 62.88% 10% Hartland 62.55% 52.92% 10% Pownal 57.42% 47.60% 10%
Cabot 64.89% 54.96% 10% Bolton 62.36% 52.44% 10% Bethel 67.89% 57.95% 10%
Searsburg 37.50% 47.50% 10% Kirby 49.39% 59.51% 10% Leicester 58.08% 68.18% 10%
Canaan 54.60% 64.69% 10% New Haven 50.56% 61.11% 11% Londonderry 65.45% 55.23% 10%
Castleton 52.83% 63.13% 10% Starksboro 61.31% 50.73% 11% Wardsboro 60.49% 50.00% 10%
West Windsor
68.29% 57.96% 10% Windsor 61.57% 50.66% 11% Jay 53.59% 64.11% 11%
Chittenden 52.95% 63.35% 10% Vershire 62.80% 51.79% 11% Franklin 55.99% 66.73% 11%
Richford 54.67% 65.11% 10% East Montpelier 62.97% 51.88% 11% Sheffield 56.57% 67.33% 11%
Duxbury 69.38% 58.93% 10% Westfield 51.15% 62.31% 11% South Hero 70.76% 59.96% 11%
Monkton 68.44% 57.96% 10% Athens 62.24% 51.05% 11% Mendon 55.50% 66.31% 11%
Danby 48.86% 59.89% 11% Sharon 63.01% 51.75% 11% Eden 57.07% 68.05% 11%
Belvidere 53.73% 64.93% 11% Wallingford 48.97% 60.26% 11% Washington 55.51% 66.52% 11%
Eden 56.83% 68.05% 11% Wilmington 58.21% 46.86% 11% Danby 48.86% 59.89% 11%
Sunderland 62.34% 51.06% 11% Elmore 63.16% 51.46% 12% Monkton 69.53% 57.96% 12%
Sheffield 55.38% 67.33% 12% Killington 52.70% 64.52% 12% Rutland Town 57.46% 69.13% 12%
Roxbury 66.67% 54.68% 12% Weathersfield 50.00% 61.84% 12% Rutland City 61.24% 49.46% 12%
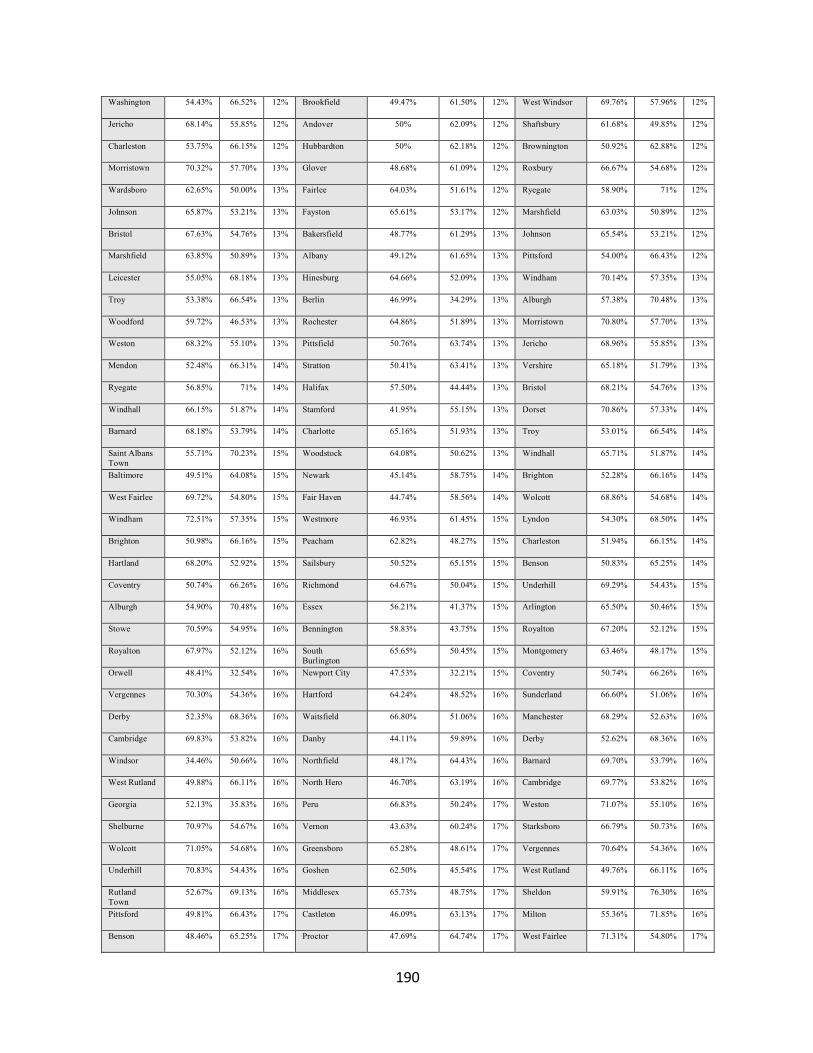
190
Washington 54.43% 66.52% 12% Brookfield 49.47% 61.50% 12% West Windsor 69.76% 57.96% 12%
Jericho 68.14% 55.85% 12% Andover 50% 62.09% 12% Shaftsbury 61.68% 49.85% 12%
Charleston 53.75% 66.15% 12% Hubbardton 50% 62.18% 12% Brownington 50.92% 62.88% 12%
Morristown 70.32% 57.70% 13% Glover 48.68% 61.09% 12% Roxbury 66.67% 54.68% 12%
Wardsboro 62.65% 50.00% 13% Fairlee 64.03% 51.61% 12% Ryegate 58.90% 71% 12%
Johnson 65.87% 53.21% 13% Fayston 65.61% 53.17% 12% Marshfield 63.03% 50.89% 12%
Bristol 67.63% 54.76% 13% Bakersfield 48.77% 61.29% 13% Johnson 65.54% 53.21% 12%
Marshfield 63.85% 50.89% 13% Albany 49.12% 61.65% 13% Pittsford 54.00% 66.43% 12%
Leicester 55.05% 68.18% 13% Hinesburg 64.66% 52.09% 13% Windham 70.14% 57.35% 13%
Troy 53.38% 66.54% 13% Berlin 46.99% 34.29% 13% Alburgh 57.38% 70.48% 13%
Woodford 59.72% 46.53% 13% Rochester 64.86% 51.89% 13% Morristown 70.80% 57.70% 13%
Weston 68.32% 55.10% 13% Pittsfield 50.76% 63.74% 13% Jericho 68.96% 55.85% 13%
Mendon 52.48% 66.31% 14% Stratton 50.41% 63.41% 13% Vershire 65.18% 51.79% 13%
Ryegate 56.85% 71% 14% Halifax 57.50% 44.44% 13% Bristol 68.21% 54.76% 13%
Windhall 66.15% 51.87% 14% Stamford 41.95% 55.15% 13% Dorset 70.86% 57.33% 14%
Barnard 68.18% 53.79% 14% Charlotte 65.16% 51.93% 13% Troy 53.01% 66.54% 14%
Saint Albans Town
55.71% 70.23% 15% Woodstock 64.08% 50.62% 13% Windhall 65.71% 51.87% 14%
Baltimore 49.51% 64.08% 15% Newark 45.14% 58.75% 14% Brighton 52.28% 66.16% 14%
West Fairlee 69.72% 54.80% 15% Fair Haven 44.74% 58.56% 14% Wolcott 68.86% 54.68% 14%
Windham 72.51% 57.35% 15% Westmore 46.93% 61.45% 15% Lyndon 54.30% 68.50% 14%
Brighton 50.98% 66.16% 15% Peacham 62.82% 48.27% 15% Charleston 51.94% 66.15% 14%
Hartland 68.20% 52.92% 15% Sailsbury 50.52% 65.15% 15% Benson 50.83% 65.25% 14%
Coventry 50.74% 66.26% 16% Richmond 64.67% 50.04% 15% Underhill 69.29% 54.43% 15%
Alburgh 54.90% 70.48% 16% Essex 56.21% 41.37% 15% Arlington 65.50% 50.46% 15%
Stowe 70.59% 54.95% 16% Bennington 58.83% 43.75% 15% Royalton 67.20% 52.12% 15%
Royalton 67.97% 52.12% 16% South Burlington
65.65% 50.45% 15% Montgomery 63.46% 48.17% 15%
Orwell 48.41% 32.54% 16% Newport City 47.53% 32.21% 15% Coventry 50.74% 66.26% 16%
Vergennes 70.30% 54.36% 16% Hartford 64.24% 48.52% 16% Sunderland 66.60% 51.06% 16%
Derby 52.35% 68.36% 16% Waitsfield 66.80% 51.06% 16% Manchester 68.29% 52.63% 16%
Cambridge 69.83% 53.82% 16% Danby 44.11% 59.89% 16% Derby 52.62% 68.36% 16%
Windsor 34.46% 50.66% 16% Northfield 48.17% 64.43% 16% Barnard 69.70% 53.79% 16%
West Rutland 49.88% 66.11% 16% North Hero 46.70% 63.19% 16% Cambridge 69.77% 53.82% 16%
Georgia 52.13% 35.83% 16% Peru 66.83% 50.24% 17% Weston 71.07% 55.10% 16%
Shelburne 70.97% 54.67% 16% Vernon 43.63% 60.24% 17% Starksboro 66.79% 50.73% 16%
Wolcott 71.05% 54.68% 16% Greensboro 65.28% 48.61% 17% Vergennes 70.64% 54.36% 16%
Underhill 70.83% 54.43% 16% Goshen 62.50% 45.54% 17% West Rutland 49.76% 66.11% 16%
Rutland Town
52.67% 69.13% 16% Middlesex 65.73% 48.75% 17% Sheldon 59.91% 76.30% 16%
Pittsford 49.81% 66.43% 17% Castleton 46.09% 63.13% 17% Milton 55.36% 71.85% 16%
Benson 48.46% 65.25% 17% Proctor 47.69% 64.74% 17% West Fairlee 71.31% 54.80% 17%
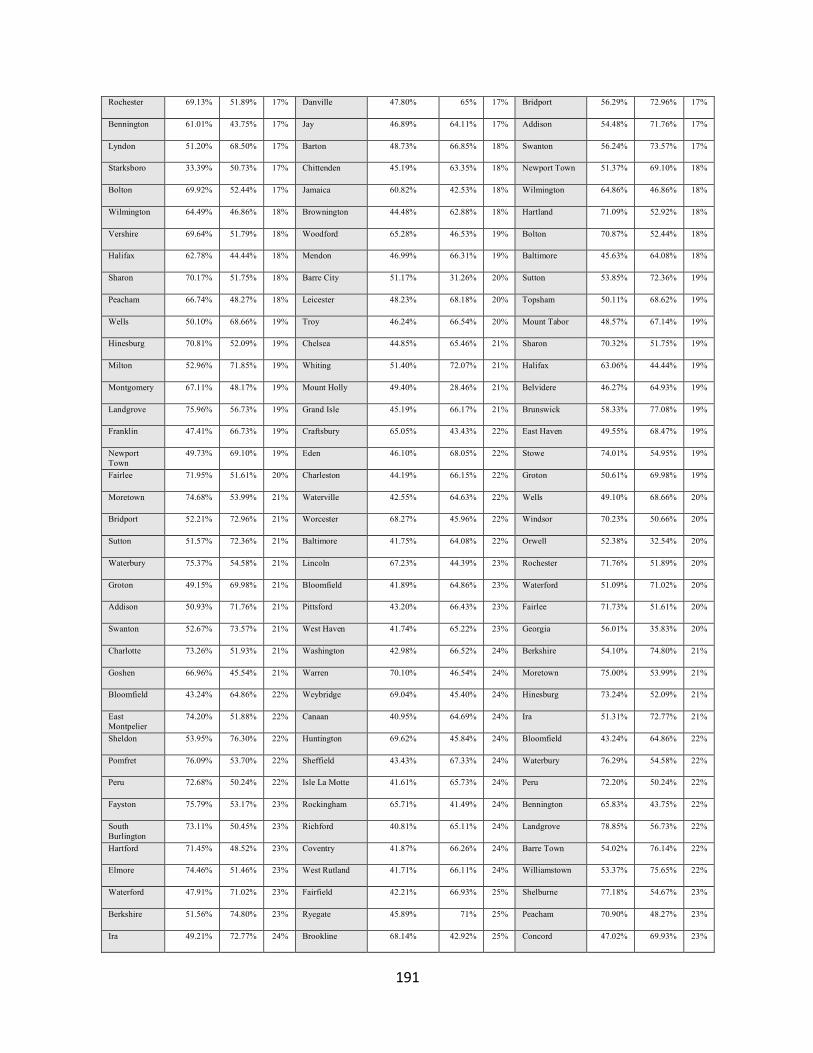
191
Rochester 69.13% 51.89% 17% Danville 47.80% 65% 17% Bridport 56.29% 72.96% 17%
Bennington 61.01% 43.75% 17% Jay 46.89% 64.11% 17% Addison 54.48% 71.76% 17%
Lyndon 51.20% 68.50% 17% Barton 48.73% 66.85% 18% Swanton 56.24% 73.57% 17%
Starksboro 33.39% 50.73% 17% Chittenden 45.19% 63.35% 18% Newport Town 51.37% 69.10% 18%
Bolton 69.92% 52.44% 17% Jamaica 60.82% 42.53% 18% Wilmington 64.86% 46.86% 18%
Wilmington 64.49% 46.86% 18% Brownington 44.48% 62.88% 18% Hartland 71.09% 52.92% 18%
Vershire 69.64% 51.79% 18% Woodford 65.28% 46.53% 19% Bolton 70.87% 52.44% 18%
Halifax 62.78% 44.44% 18% Mendon 46.99% 66.31% 19% Baltimore 45.63% 64.08% 18%
Sharon 70.17% 51.75% 18% Barre City 51.17% 31.26% 20% Sutton 53.85% 72.36% 19%
Peacham 66.74% 48.27% 18% Leicester 48.23% 68.18% 20% Topsham 50.11% 68.62% 19%
Wells 50.10% 68.66% 19% Troy 46.24% 66.54% 20% Mount Tabor 48.57% 67.14% 19%
Hinesburg 70.81% 52.09% 19% Chelsea 44.85% 65.46% 21% Sharon 70.32% 51.75% 19%
Milton 52.96% 71.85% 19% Whiting 51.40% 72.07% 21% Halifax 63.06% 44.44% 19%
Montgomery 67.11% 48.17% 19% Mount Holly 49.40% 28.46% 21% Belvidere 46.27% 64.93% 19%
Landgrove 75.96% 56.73% 19% Grand Isle 45.19% 66.17% 21% Brunswick 58.33% 77.08% 19%
Franklin 47.41% 66.73% 19% Craftsbury 65.05% 43.43% 22% East Haven 49.55% 68.47% 19%
Newport Town
49.73% 69.10% 19% Eden 46.10% 68.05% 22% Stowe 74.01% 54.95% 19%
Fairlee 71.95% 51.61% 20% Charleston 44.19% 66.15% 22% Groton 50.61% 69.98% 19%
Moretown 74.68% 53.99% 21% Waterville 42.55% 64.63% 22% Wells 49.10% 68.66% 20%
Bridport 52.21% 72.96% 21% Worcester 68.27% 45.96% 22% Windsor 70.23% 50.66% 20%
Sutton 51.57% 72.36% 21% Baltimore 41.75% 64.08% 22% Orwell 52.38% 32.54% 20%
Waterbury 75.37% 54.58% 21% Lincoln 67.23% 44.39% 23% Rochester 71.76% 51.89% 20%
Groton 49.15% 69.98% 21% Bloomfield 41.89% 64.86% 23% Waterford 51.09% 71.02% 20%
Addison 50.93% 71.76% 21% Pittsford 43.20% 66.43% 23% Fairlee 71.73% 51.61% 20%
Swanton 52.67% 73.57% 21% West Haven 41.74% 65.22% 23% Georgia 56.01% 35.83% 20%
Charlotte 73.26% 51.93% 21% Washington 42.98% 66.52% 24% Berkshire 54.10% 74.80% 21%
Goshen 66.96% 45.54% 21% Warren 70.10% 46.54% 24% Moretown 75.00% 53.99% 21%
Bloomfield 43.24% 64.86% 22% Weybridge 69.04% 45.40% 24% Hinesburg 73.24% 52.09% 21%
East Montpelier
74.20% 51.88% 22% Canaan 40.95% 64.69% 24% Ira 51.31% 72.77% 21%
Sheldon 53.95% 76.30% 22% Huntington 69.62% 45.84% 24% Bloomfield 43.24% 64.86% 22%
Pomfret 76.09% 53.70% 22% Sheffield 43.43% 67.33% 24% Waterbury 76.29% 54.58% 22%
Peru 72.68% 50.24% 22% Isle La Motte 41.61% 65.73% 24% Peru 72.20% 50.24% 22%
Fayston 75.79% 53.17% 23% Rockingham 65.71% 41.49% 24% Bennington 65.83% 43.75% 22%
South Burlington
73.11% 50.45% 23% Richford 40.81% 65.11% 24% Landgrove 78.85% 56.73% 22%
Hartford 71.45% 48.52% 23% Coventry 41.87% 66.26% 24% Barre Town 54.02% 76.14% 22%
Elmore 74.46% 51.46% 23% West Rutland 41.71% 66.11% 24% Williamstown 53.37% 75.65% 22%
Waterford 47.91% 71.02% 23% Fairfield 42.21% 66.93% 25% Shelburne 77.18% 54.67% 23%
Berkshire 51.56% 74.80% 23% Ryegate 45.89% 71% 25% Peacham 70.90% 48.27% 23%
Ira 49.21% 72.77% 24% Brookline 68.14% 42.92% 25% Concord 47.02% 69.93% 23%
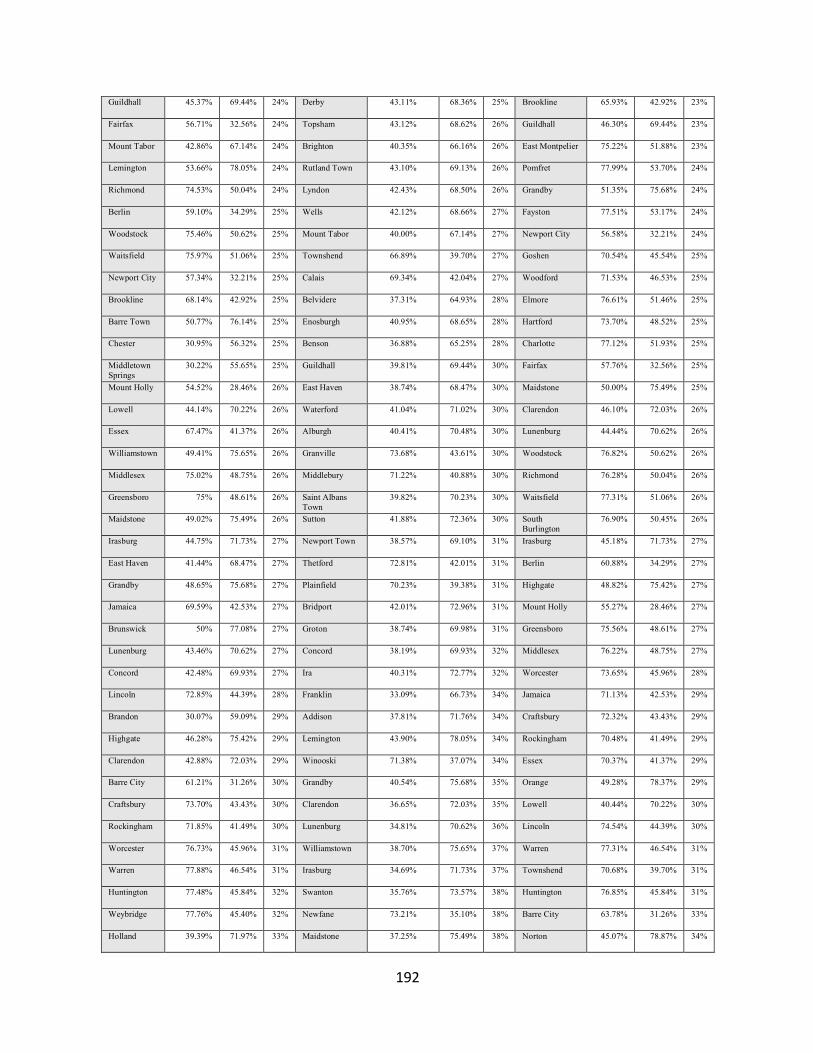
192
Guildhall 45.37% 69.44% 24% Derby 43.11% 68.36% 25% Brookline 65.93% 42.92% 23%
Fairfax 56.71% 32.56% 24% Topsham 43.12% 68.62% 26% Guildhall 46.30% 69.44% 23%
Mount Tabor 42.86% 67.14% 24% Brighton 40.35% 66.16% 26% East Montpelier 75.22% 51.88% 23%
Lemington 53.66% 78.05% 24% Rutland Town 43.10% 69.13% 26% Pomfret 77.99% 53.70% 24%
Richmond 74.53% 50.04% 24% Lyndon 42.43% 68.50% 26% Grandby 51.35% 75.68% 24%
Berlin 59.10% 34.29% 25% Wells 42.12% 68.66% 27% Fayston 77.51% 53.17% 24%
Woodstock 75.46% 50.62% 25% Mount Tabor 40.00% 67.14% 27% Newport City 56.58% 32.21% 24%
Waitsfield 75.97% 51.06% 25% Townshend 66.89% 39.70% 27% Goshen 70.54% 45.54% 25%
Newport City 57.34% 32.21% 25% Calais 69.34% 42.04% 27% Woodford 71.53% 46.53% 25%
Brookline 68.14% 42.92% 25% Belvidere 37.31% 64.93% 28% Elmore 76.61% 51.46% 25%
Barre Town 50.77% 76.14% 25% Enosburgh 40.95% 68.65% 28% Hartford 73.70% 48.52% 25%
Chester 30.95% 56.32% 25% Benson 36.88% 65.25% 28% Charlotte 77.12% 51.93% 25%
Middletown Springs
30.22% 55.65% 25% Guildhall 39.81% 69.44% 30% Fairfax 57.76% 32.56% 25%
Mount Holly 54.52% 28.46% 26% East Haven 38.74% 68.47% 30% Maidstone 50.00% 75.49% 25%
Lowell 44.14% 70.22% 26% Waterford 41.04% 71.02% 30% Clarendon 46.10% 72.03% 26%
Essex 67.47% 41.37% 26% Alburgh 40.41% 70.48% 30% Lunenburg 44.44% 70.62% 26%
Williamstown 49.41% 75.65% 26% Granville 73.68% 43.61% 30% Woodstock 76.82% 50.62% 26%
Middlesex 75.02% 48.75% 26% Middlebury 71.22% 40.88% 30% Richmond 76.28% 50.04% 26%
Greensboro 75% 48.61% 26% Saint Albans Town
39.82% 70.23% 30% Waitsfield 77.31% 51.06% 26%
Maidstone 49.02% 75.49% 26% Sutton 41.88% 72.36% 30% South Burlington
76.90% 50.45% 26%
Irasburg 44.75% 71.73% 27% Newport Town 38.57% 69.10% 31% Irasburg 45.18% 71.73% 27%
East Haven 41.44% 68.47% 27% Thetford 72.81% 42.01% 31% Berlin 60.88% 34.29% 27%
Grandby 48.65% 75.68% 27% Plainfield 70.23% 39.38% 31% Highgate 48.82% 75.42% 27%
Jamaica 69.59% 42.53% 27% Bridport 42.01% 72.96% 31% Mount Holly 55.27% 28.46% 27%
Brunswick 50% 77.08% 27% Groton 38.74% 69.98% 31% Greensboro 75.56% 48.61% 27%
Lunenburg 43.46% 70.62% 27% Concord 38.19% 69.93% 32% Middlesex 76.22% 48.75% 27%
Concord 42.48% 69.93% 27% Ira 40.31% 72.77% 32% Worcester 73.65% 45.96% 28%
Lincoln 72.85% 44.39% 28% Franklin 33.09% 66.73% 34% Jamaica 71.13% 42.53% 29%
Brandon 30.07% 59.09% 29% Addison 37.81% 71.76% 34% Craftsbury 72.32% 43.43% 29%
Highgate 46.28% 75.42% 29% Lemington 43.90% 78.05% 34% Rockingham 70.48% 41.49% 29%
Clarendon 42.88% 72.03% 29% Winooski 71.38% 37.07% 34% Essex 70.37% 41.37% 29%
Barre City 61.21% 31.26% 30% Grandby 40.54% 75.68% 35% Orange 49.28% 78.37% 29%
Craftsbury 73.70% 43.43% 30% Clarendon 36.65% 72.03% 35% Lowell 40.44% 70.22% 30%
Rockingham 71.85% 41.49% 30% Lunenburg 34.81% 70.62% 36% Lincoln 74.54% 44.39% 30%
Worcester 76.73% 45.96% 31% Williamstown 38.70% 75.65% 37% Warren 77.31% 46.54% 31%
Warren 77.88% 46.54% 31% Irasburg 34.69% 71.73% 37% Townshend 70.68% 39.70% 31%
Huntington 77.48% 45.84% 32% Swanton 35.76% 73.57% 38% Huntington 76.85% 45.84% 31%
Weybridge 77.76% 45.40% 32% Newfane 73.21% 35.10% 38% Barre City 63.78% 31.26% 33%
Holland 39.39% 71.97% 33% Maidstone 37.25% 75.49% 38% Norton 45.07% 78.87% 34%
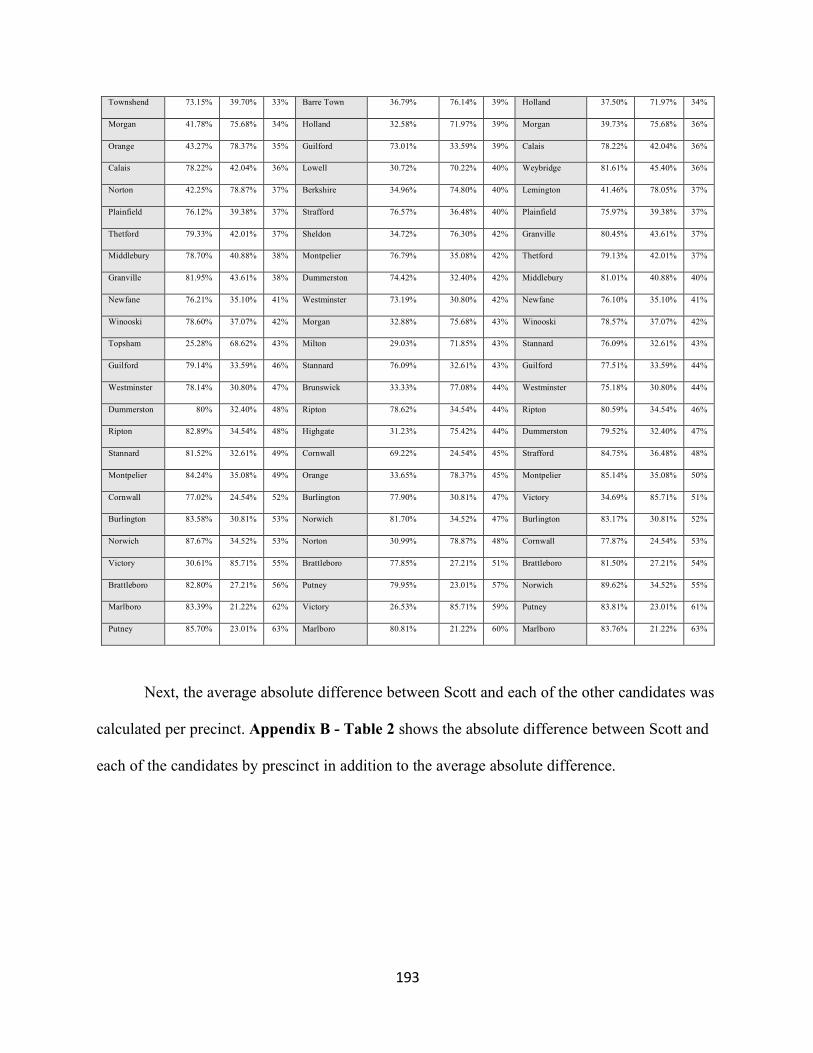
193
Next, the average absolute difference between Scott and each of the other candidates was
calculated per precinct. Appendix B - Table 2 shows the absolute difference between Scott and
each of the candidates by prescinct in addition to the average absolute difference.
Townshend 73.15% 39.70% 33% Barre Town 36.79% 76.14% 39% Holland 37.50% 71.97% 34%
Morgan 41.78% 75.68% 34% Holland 32.58% 71.97% 39% Morgan 39.73% 75.68% 36%
Orange 43.27% 78.37% 35% Guilford 73.01% 33.59% 39% Calais 78.22% 42.04% 36%
Calais 78.22% 42.04% 36% Lowell 30.72% 70.22% 40% Weybridge 81.61% 45.40% 36%
Norton 42.25% 78.87% 37% Berkshire 34.96% 74.80% 40% Lemington 41.46% 78.05% 37%
Plainfield 76.12% 39.38% 37% Strafford 76.57% 36.48% 40% Plainfield 75.97% 39.38% 37%
Thetford 79.33% 42.01% 37% Sheldon 34.72% 76.30% 42% Granville 80.45% 43.61% 37%
Middlebury 78.70% 40.88% 38% Montpelier 76.79% 35.08% 42% Thetford 79.13% 42.01% 37%
Granville 81.95% 43.61% 38% Dummerston 74.42% 32.40% 42% Middlebury 81.01% 40.88% 40%
Newfane 76.21% 35.10% 41% Westminster 73.19% 30.80% 42% Newfane 76.10% 35.10% 41%
Winooski 78.60% 37.07% 42% Morgan 32.88% 75.68% 43% Winooski 78.57% 37.07% 42%
Topsham 25.28% 68.62% 43% Milton 29.03% 71.85% 43% Stannard 76.09% 32.61% 43%
Guilford 79.14% 33.59% 46% Stannard 76.09% 32.61% 43% Guilford 77.51% 33.59% 44%
Westminster 78.14% 30.80% 47% Brunswick 33.33% 77.08% 44% Westminster 75.18% 30.80% 44%
Dummerston 80% 32.40% 48% Ripton 78.62% 34.54% 44% Ripton 80.59% 34.54% 46%
Ripton 82.89% 34.54% 48% Highgate 31.23% 75.42% 44% Dummerston 79.52% 32.40% 47%
Stannard 81.52% 32.61% 49% Cornwall 69.22% 24.54% 45% Strafford 84.75% 36.48% 48%
Montpelier 84.24% 35.08% 49% Orange 33.65% 78.37% 45% Montpelier 85.14% 35.08% 50%
Cornwall 77.02% 24.54% 52% Burlington 77.90% 30.81% 47% Victory 34.69% 85.71% 51%
Burlington 83.58% 30.81% 53% Norwich 81.70% 34.52% 47% Burlington 83.17% 30.81% 52%
Norwich 87.67% 34.52% 53% Norton 30.99% 78.87% 48% Cornwall 77.87% 24.54% 53%
Victory 30.61% 85.71% 55% Brattleboro 77.85% 27.21% 51% Brattleboro 81.50% 27.21% 54%
Brattleboro 82.80% 27.21% 56% Putney 79.95% 23.01% 57% Norwich 89.62% 34.52% 55%
Marlboro 83.39% 21.22% 62% Victory 26.53% 85.71% 59% Putney 83.81% 23.01% 61%
Putney 85.70% 23.01% 63% Marlboro 80.81% 21.22% 60% Marlboro 83.76% 21.22% 63%
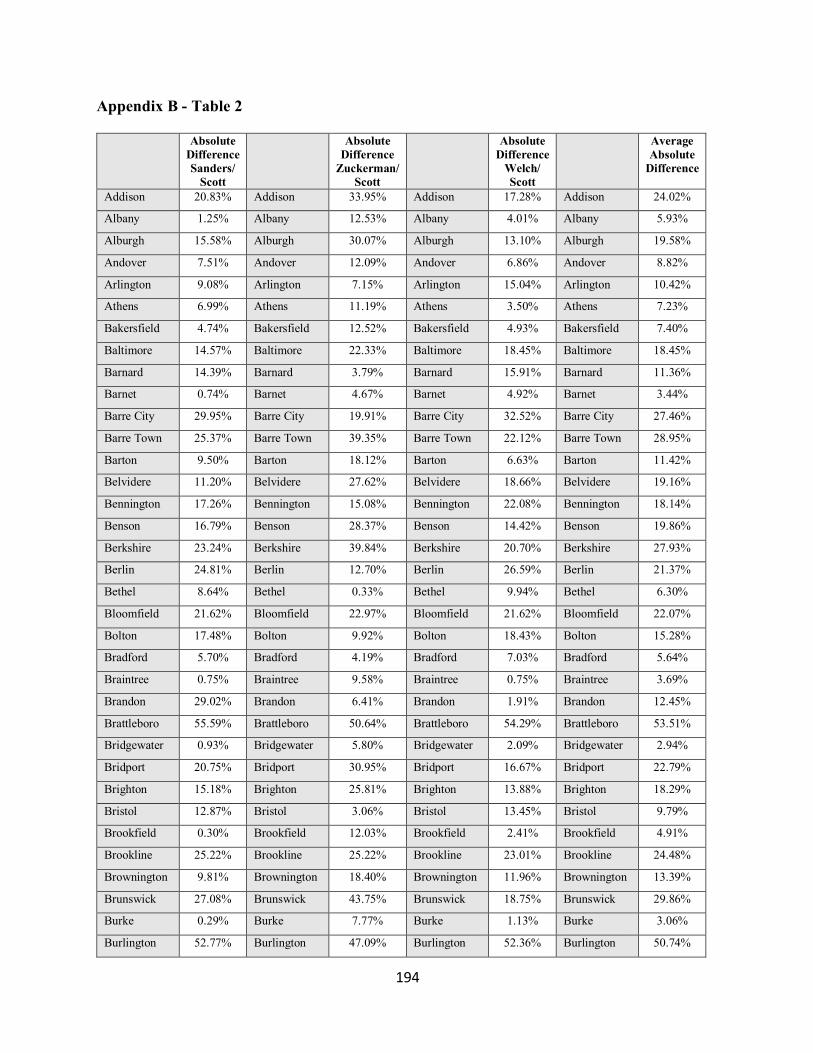
194
Appendix B - Table 2
Absolute Difference Sanders/
Scott
Absolute Difference
Zuckerman/ Scott
Absolute Difference
Welch/ Scott
Average Absolute
Difference
Addison 20.83% Addison 33.95% Addison 17.28% Addison 24.02%
Albany 1.25% Albany 12.53% Albany 4.01% Albany 5.93%
Alburgh 15.58% Alburgh 30.07% Alburgh 13.10% Alburgh 19.58%
Andover 7.51% Andover 12.09% Andover 6.86% Andover 8.82%
Arlington 9.08% Arlington 7.15% Arlington 15.04% Arlington 10.42%
Athens 6.99% Athens 11.19% Athens 3.50% Athens 7.23%
Bakersfield 4.74% Bakersfield 12.52% Bakersfield 4.93% Bakersfield 7.40%
Baltimore 14.57% Baltimore 22.33% Baltimore 18.45% Baltimore 18.45%
Barnard 14.39% Barnard 3.79% Barnard 15.91% Barnard 11.36%
Barnet 0.74% Barnet 4.67% Barnet 4.92% Barnet 3.44%
Barre City 29.95% Barre City 19.91% Barre City 32.52% Barre City 27.46%
Barre Town 25.37% Barre Town 39.35% Barre Town 22.12% Barre Town 28.95%
Barton 9.50% Barton 18.12% Barton 6.63% Barton 11.42%
Belvidere 11.20% Belvidere 27.62% Belvidere 18.66% Belvidere 19.16%
Bennington 17.26% Bennington 15.08% Bennington 22.08% Bennington 18.14%
Benson 16.79% Benson 28.37% Benson 14.42% Benson 19.86%
Berkshire 23.24% Berkshire 39.84% Berkshire 20.70% Berkshire 27.93%
Berlin 24.81% Berlin 12.70% Berlin 26.59% Berlin 21.37%
Bethel 8.64% Bethel 0.33% Bethel 9.94% Bethel 6.30%
Bloomfield 21.62% Bloomfield 22.97% Bloomfield 21.62% Bloomfield 22.07%
Bolton 17.48% Bolton 9.92% Bolton 18.43% Bolton 15.28%
Bradford 5.70% Bradford 4.19% Bradford 7.03% Bradford 5.64%
Braintree 0.75% Braintree 9.58% Braintree 0.75% Braintree 3.69%
Brandon 29.02% Brandon 6.41% Brandon 1.91% Brandon 12.45%
Brattleboro 55.59% Brattleboro 50.64% Brattleboro 54.29% Brattleboro 53.51%
Bridgewater 0.93% Bridgewater 5.80% Bridgewater 2.09% Bridgewater 2.94%
Bridport 20.75% Bridport 30.95% Bridport 16.67% Bridport 22.79%
Brighton 15.18% Brighton 25.81% Brighton 13.88% Brighton 18.29%
Bristol 12.87% Bristol 3.06% Bristol 13.45% Bristol 9.79%
Brookfield 0.30% Brookfield 12.03% Brookfield 2.41% Brookfield 4.91%
Brookline 25.22% Brookline 25.22% Brookline 23.01% Brookline 24.48%
Brownington 9.81% Brownington 18.40% Brownington 11.96% Brownington 13.39%
Brunswick 27.08% Brunswick 43.75% Brunswick 18.75% Brunswick 29.86%
Burke 0.29% Burke 7.77% Burke 1.13% Burke 3.06%
Burlington 52.77% Burlington 47.09% Burlington 52.36% Burlington 50.74%
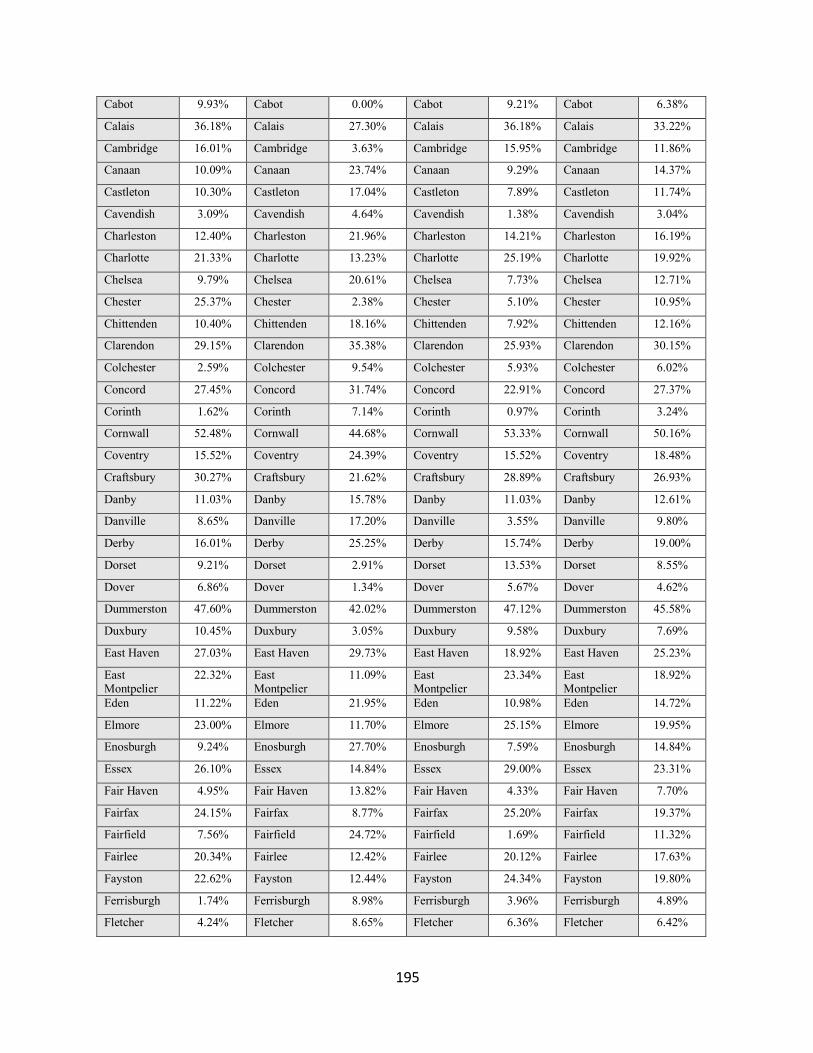
195
Cabot 9.93% Cabot 0.00% Cabot 9.21% Cabot 6.38%
Calais 36.18% Calais 27.30% Calais 36.18% Calais 33.22%
Cambridge 16.01% Cambridge 3.63% Cambridge 15.95% Cambridge 11.86%
Canaan 10.09% Canaan 23.74% Canaan 9.29% Canaan 14.37%
Castleton 10.30% Castleton 17.04% Castleton 7.89% Castleton 11.74%
Cavendish 3.09% Cavendish 4.64% Cavendish 1.38% Cavendish 3.04%
Charleston 12.40% Charleston 21.96% Charleston 14.21% Charleston 16.19%
Charlotte 21.33% Charlotte 13.23% Charlotte 25.19% Charlotte 19.92%
Chelsea 9.79% Chelsea 20.61% Chelsea 7.73% Chelsea 12.71%
Chester 25.37% Chester 2.38% Chester 5.10% Chester 10.95%
Chittenden 10.40% Chittenden 18.16% Chittenden 7.92% Chittenden 12.16%
Clarendon 29.15% Clarendon 35.38% Clarendon 25.93% Clarendon 30.15%
Colchester 2.59% Colchester 9.54% Colchester 5.93% Colchester 6.02%
Concord 27.45% Concord 31.74% Concord 22.91% Concord 27.37%
Corinth 1.62% Corinth 7.14% Corinth 0.97% Corinth 3.24%
Cornwall 52.48% Cornwall 44.68% Cornwall 53.33% Cornwall 50.16%
Coventry 15.52% Coventry 24.39% Coventry 15.52% Coventry 18.48%
Craftsbury 30.27% Craftsbury 21.62% Craftsbury 28.89% Craftsbury 26.93%
Danby 11.03% Danby 15.78% Danby 11.03% Danby 12.61%
Danville 8.65% Danville 17.20% Danville 3.55% Danville 9.80%
Derby 16.01% Derby 25.25% Derby 15.74% Derby 19.00%
Dorset 9.21% Dorset 2.91% Dorset 13.53% Dorset 8.55%
Dover 6.86% Dover 1.34% Dover 5.67% Dover 4.62%
Dummerston 47.60% Dummerston 42.02% Dummerston 47.12% Dummerston 45.58%
Duxbury 10.45% Duxbury 3.05% Duxbury 9.58% Duxbury 7.69%
East Haven 27.03% East Haven 29.73% East Haven 18.92% East Haven 25.23%
East Montpelier
22.32% East Montpelier
11.09% East Montpelier
23.34% East Montpelier
18.92%
Eden 11.22% Eden 21.95% Eden 10.98% Eden 14.72%
Elmore 23.00% Elmore 11.70% Elmore 25.15% Elmore 19.95%
Enosburgh 9.24% Enosburgh 27.70% Enosburgh 7.59% Enosburgh 14.84%
Essex 26.10% Essex 14.84% Essex 29.00% Essex 23.31%
Fair Haven 4.95% Fair Haven 13.82% Fair Haven 4.33% Fair Haven 7.70%
Fairfax 24.15% Fairfax 8.77% Fairfax 25.20% Fairfax 19.37%
Fairfield 7.56% Fairfield 24.72% Fairfield 1.69% Fairfield 11.32%
Fairlee 20.34% Fairlee 12.42% Fairlee 20.12% Fairlee 17.63%
Fayston 22.62% Fayston 12.44% Fayston 24.34% Fayston 19.80%
Ferrisburgh 1.74% Ferrisburgh 8.98% Ferrisburgh 3.96% Ferrisburgh 4.89%
Fletcher 4.24% Fletcher 8.65% Fletcher 6.36% Fletcher 6.42%
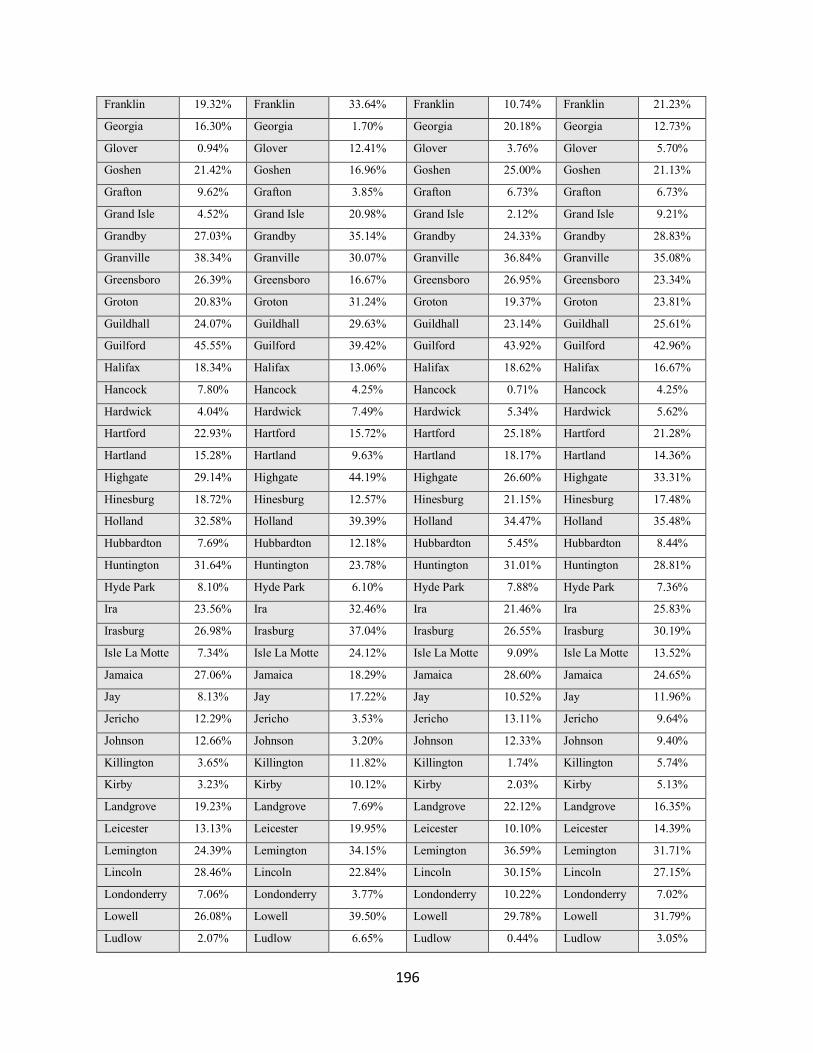
196
Franklin 19.32% Franklin 33.64% Franklin 10.74% Franklin 21.23%
Georgia 16.30% Georgia 1.70% Georgia 20.18% Georgia 12.73%
Glover 0.94% Glover 12.41% Glover 3.76% Glover 5.70%
Goshen 21.42% Goshen 16.96% Goshen 25.00% Goshen 21.13%
Grafton 9.62% Grafton 3.85% Grafton 6.73% Grafton 6.73%
Grand Isle 4.52% Grand Isle 20.98% Grand Isle 2.12% Grand Isle 9.21%
Grandby 27.03% Grandby 35.14% Grandby 24.33% Grandby 28.83%
Granville 38.34% Granville 30.07% Granville 36.84% Granville 35.08%
Greensboro 26.39% Greensboro 16.67% Greensboro 26.95% Greensboro 23.34%
Groton 20.83% Groton 31.24% Groton 19.37% Groton 23.81%
Guildhall 24.07% Guildhall 29.63% Guildhall 23.14% Guildhall 25.61%
Guilford 45.55% Guilford 39.42% Guilford 43.92% Guilford 42.96%
Halifax 18.34% Halifax 13.06% Halifax 18.62% Halifax 16.67%
Hancock 7.80% Hancock 4.25% Hancock 0.71% Hancock 4.25%
Hardwick 4.04% Hardwick 7.49% Hardwick 5.34% Hardwick 5.62%
Hartford 22.93% Hartford 15.72% Hartford 25.18% Hartford 21.28%
Hartland 15.28% Hartland 9.63% Hartland 18.17% Hartland 14.36%
Highgate 29.14% Highgate 44.19% Highgate 26.60% Highgate 33.31%
Hinesburg 18.72% Hinesburg 12.57% Hinesburg 21.15% Hinesburg 17.48%
Holland 32.58% Holland 39.39% Holland 34.47% Holland 35.48%
Hubbardton 7.69% Hubbardton 12.18% Hubbardton 5.45% Hubbardton 8.44%
Huntington 31.64% Huntington 23.78% Huntington 31.01% Huntington 28.81%
Hyde Park 8.10% Hyde Park 6.10% Hyde Park 7.88% Hyde Park 7.36%
Ira 23.56% Ira 32.46% Ira 21.46% Ira 25.83%
Irasburg 26.98% Irasburg 37.04% Irasburg 26.55% Irasburg 30.19%
Isle La Motte 7.34% Isle La Motte 24.12% Isle La Motte 9.09% Isle La Motte 13.52%
Jamaica 27.06% Jamaica 18.29% Jamaica 28.60% Jamaica 24.65%
Jay 8.13% Jay 17.22% Jay 10.52% Jay 11.96%
Jericho 12.29% Jericho 3.53% Jericho 13.11% Jericho 9.64%
Johnson 12.66% Johnson 3.20% Johnson 12.33% Johnson 9.40%
Killington 3.65% Killington 11.82% Killington 1.74% Killington 5.74%
Kirby 3.23% Kirby 10.12% Kirby 2.03% Kirby 5.13%
Landgrove 19.23% Landgrove 7.69% Landgrove 22.12% Landgrove 16.35%
Leicester 13.13% Leicester 19.95% Leicester 10.10% Leicester 14.39%
Lemington 24.39% Lemington 34.15% Lemington 36.59% Lemington 31.71%
Lincoln 28.46% Lincoln 22.84% Lincoln 30.15% Lincoln 27.15%
Londonderry 7.06% Londonderry 3.77% Londonderry 10.22% Londonderry 7.02%
Lowell 26.08% Lowell 39.50% Lowell 29.78% Lowell 31.79%
Ludlow 2.07% Ludlow 6.65% Ludlow 0.44% Ludlow 3.05%
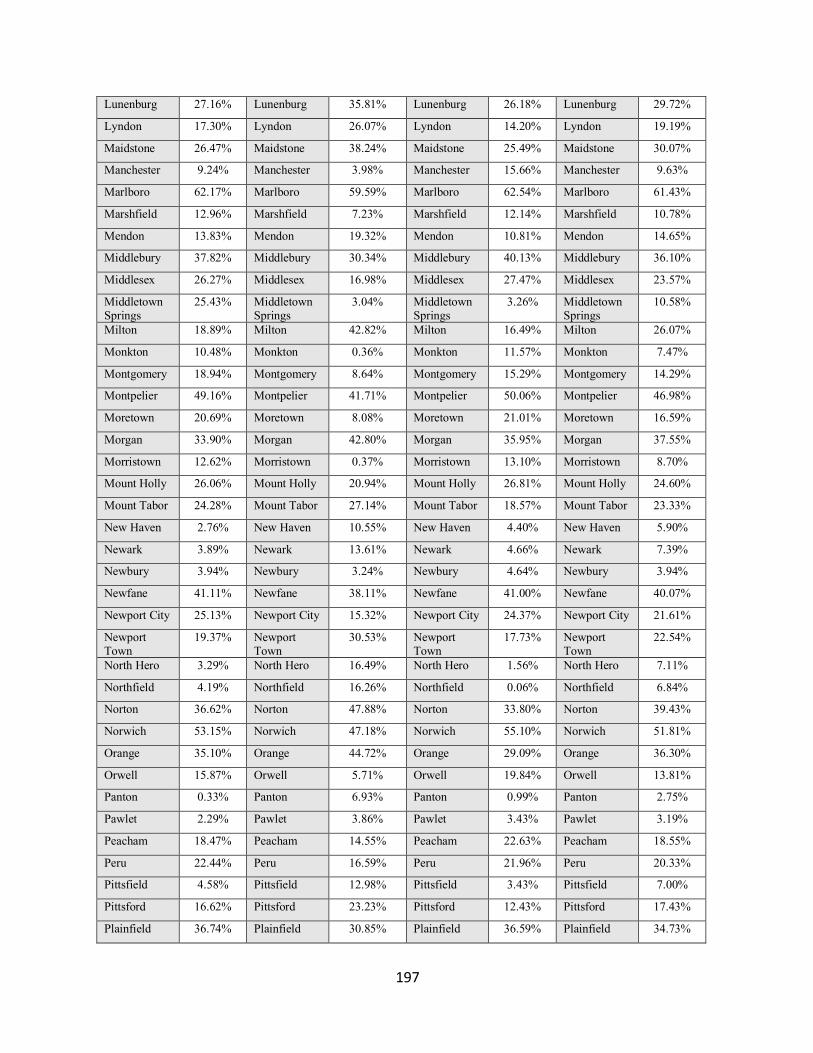
197
Lunenburg 27.16% Lunenburg 35.81% Lunenburg 26.18% Lunenburg 29.72%
Lyndon 17.30% Lyndon 26.07% Lyndon 14.20% Lyndon 19.19%
Maidstone 26.47% Maidstone 38.24% Maidstone 25.49% Maidstone 30.07%
Manchester 9.24% Manchester 3.98% Manchester 15.66% Manchester 9.63%
Marlboro 62.17% Marlboro 59.59% Marlboro 62.54% Marlboro 61.43%
Marshfield 12.96% Marshfield 7.23% Marshfield 12.14% Marshfield 10.78%
Mendon 13.83% Mendon 19.32% Mendon 10.81% Mendon 14.65%
Middlebury 37.82% Middlebury 30.34% Middlebury 40.13% Middlebury 36.10%
Middlesex 26.27% Middlesex 16.98% Middlesex 27.47% Middlesex 23.57%
Middletown Springs
25.43% Middletown Springs
3.04% Middletown Springs
3.26% Middletown Springs
10.58%
Milton 18.89% Milton 42.82% Milton 16.49% Milton 26.07%
Monkton 10.48% Monkton 0.36% Monkton 11.57% Monkton 7.47%
Montgomery 18.94% Montgomery 8.64% Montgomery 15.29% Montgomery 14.29%
Montpelier 49.16% Montpelier 41.71% Montpelier 50.06% Montpelier 46.98%
Moretown 20.69% Moretown 8.08% Moretown 21.01% Moretown 16.59%
Morgan 33.90% Morgan 42.80% Morgan 35.95% Morgan 37.55%
Morristown 12.62% Morristown 0.37% Morristown 13.10% Morristown 8.70%
Mount Holly 26.06% Mount Holly 20.94% Mount Holly 26.81% Mount Holly 24.60%
Mount Tabor 24.28% Mount Tabor 27.14% Mount Tabor 18.57% Mount Tabor 23.33%
New Haven 2.76% New Haven 10.55% New Haven 4.40% New Haven 5.90%
Newark 3.89% Newark 13.61% Newark 4.66% Newark 7.39%
Newbury 3.94% Newbury 3.24% Newbury 4.64% Newbury 3.94%
Newfane 41.11% Newfane 38.11% Newfane 41.00% Newfane 40.07%
Newport City 25.13% Newport City 15.32% Newport City 24.37% Newport City 21.61%
Newport Town
19.37% Newport Town
30.53% Newport Town
17.73% Newport Town
22.54%
North Hero 3.29% North Hero 16.49% North Hero 1.56% North Hero 7.11%
Northfield 4.19% Northfield 16.26% Northfield 0.06% Northfield 6.84%
Norton 36.62% Norton 47.88% Norton 33.80% Norton 39.43%
Norwich 53.15% Norwich 47.18% Norwich 55.10% Norwich 51.81%
Orange 35.10% Orange 44.72% Orange 29.09% Orange 36.30%
Orwell 15.87% Orwell 5.71% Orwell 19.84% Orwell 13.81%
Panton 0.33% Panton 6.93% Panton 0.99% Panton 2.75%
Pawlet 2.29% Pawlet 3.86% Pawlet 3.43% Pawlet 3.19%
Peacham 18.47% Peacham 14.55% Peacham 22.63% Peacham 18.55%
Peru 22.44% Peru 16.59% Peru 21.96% Peru 20.33%
Pittsfield 4.58% Pittsfield 12.98% Pittsfield 3.43% Pittsfield 7.00%
Pittsford 16.62% Pittsford 23.23% Pittsford 12.43% Pittsford 17.43%
Plainfield 36.74% Plainfield 30.85% Plainfield 36.59% Plainfield 34.73%
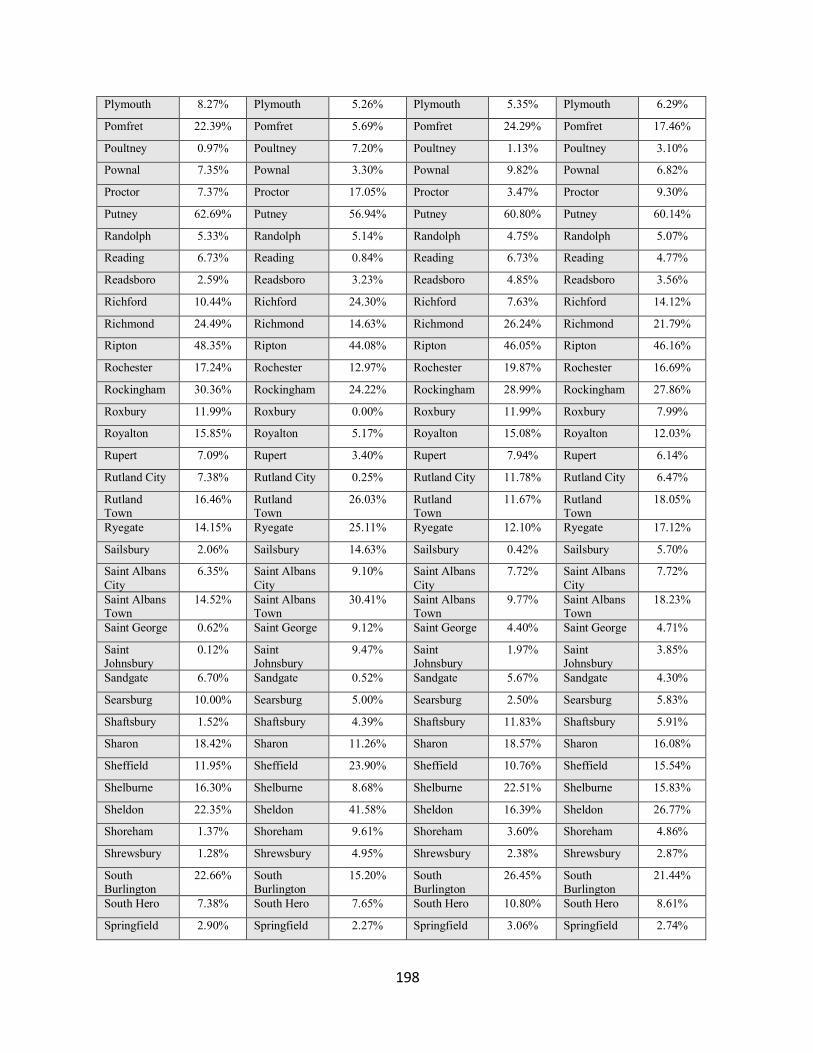
198
Plymouth 8.27% Plymouth 5.26% Plymouth 5.35% Plymouth 6.29%
Pomfret 22.39% Pomfret 5.69% Pomfret 24.29% Pomfret 17.46%
Poultney 0.97% Poultney 7.20% Poultney 1.13% Poultney 3.10%
Pownal 7.35% Pownal 3.30% Pownal 9.82% Pownal 6.82%
Proctor 7.37% Proctor 17.05% Proctor 3.47% Proctor 9.30%
Putney 62.69% Putney 56.94% Putney 60.80% Putney 60.14%
Randolph 5.33% Randolph 5.14% Randolph 4.75% Randolph 5.07%
Reading 6.73% Reading 0.84% Reading 6.73% Reading 4.77%
Readsboro 2.59% Readsboro 3.23% Readsboro 4.85% Readsboro 3.56%
Richford 10.44% Richford 24.30% Richford 7.63% Richford 14.12%
Richmond 24.49% Richmond 14.63% Richmond 26.24% Richmond 21.79%
Ripton 48.35% Ripton 44.08% Ripton 46.05% Ripton 46.16%
Rochester 17.24% Rochester 12.97% Rochester 19.87% Rochester 16.69%
Rockingham 30.36% Rockingham 24.22% Rockingham 28.99% Rockingham 27.86%
Roxbury 11.99% Roxbury 0.00% Roxbury 11.99% Roxbury 7.99%
Royalton 15.85% Royalton 5.17% Royalton 15.08% Royalton 12.03%
Rupert 7.09% Rupert 3.40% Rupert 7.94% Rupert 6.14%
Rutland City 7.38% Rutland City 0.25% Rutland City 11.78% Rutland City 6.47%
Rutland Town
16.46% Rutland Town
26.03% Rutland Town
11.67% Rutland Town
18.05%
Ryegate 14.15% Ryegate 25.11% Ryegate 12.10% Ryegate 17.12%
Sailsbury 2.06% Sailsbury 14.63% Sailsbury 0.42% Sailsbury 5.70%
Saint Albans City
6.35% Saint Albans City
9.10% Saint Albans City
7.72% Saint Albans City
7.72%
Saint Albans Town
14.52% Saint Albans Town
30.41% Saint Albans Town
9.77% Saint Albans Town
18.23%
Saint George 0.62% Saint George 9.12% Saint George 4.40% Saint George 4.71%
Saint Johnsbury
0.12% Saint Johnsbury
9.47% Saint Johnsbury
1.97% Saint Johnsbury
3.85%
Sandgate 6.70% Sandgate 0.52% Sandgate 5.67% Sandgate 4.30%
Searsburg 10.00% Searsburg 5.00% Searsburg 2.50% Searsburg 5.83%
Shaftsbury 1.52% Shaftsbury 4.39% Shaftsbury 11.83% Shaftsbury 5.91%
Sharon 18.42% Sharon 11.26% Sharon 18.57% Sharon 16.08%
Sheffield 11.95% Sheffield 23.90% Sheffield 10.76% Sheffield 15.54%
Shelburne 16.30% Shelburne 8.68% Shelburne 22.51% Shelburne 15.83%
Sheldon 22.35% Sheldon 41.58% Sheldon 16.39% Sheldon 26.77%
Shoreham 1.37% Shoreham 9.61% Shoreham 3.60% Shoreham 4.86%
Shrewsbury 1.28% Shrewsbury 4.95% Shrewsbury 2.38% Shrewsbury 2.87%
South Burlington
22.66% South Burlington
15.20% South Burlington
26.45% South Burlington
21.44%
South Hero 7.38% South Hero 7.65% South Hero 10.80% South Hero 8.61%
Springfield 2.90% Springfield 2.27% Springfield 3.06% Springfield 2.74%
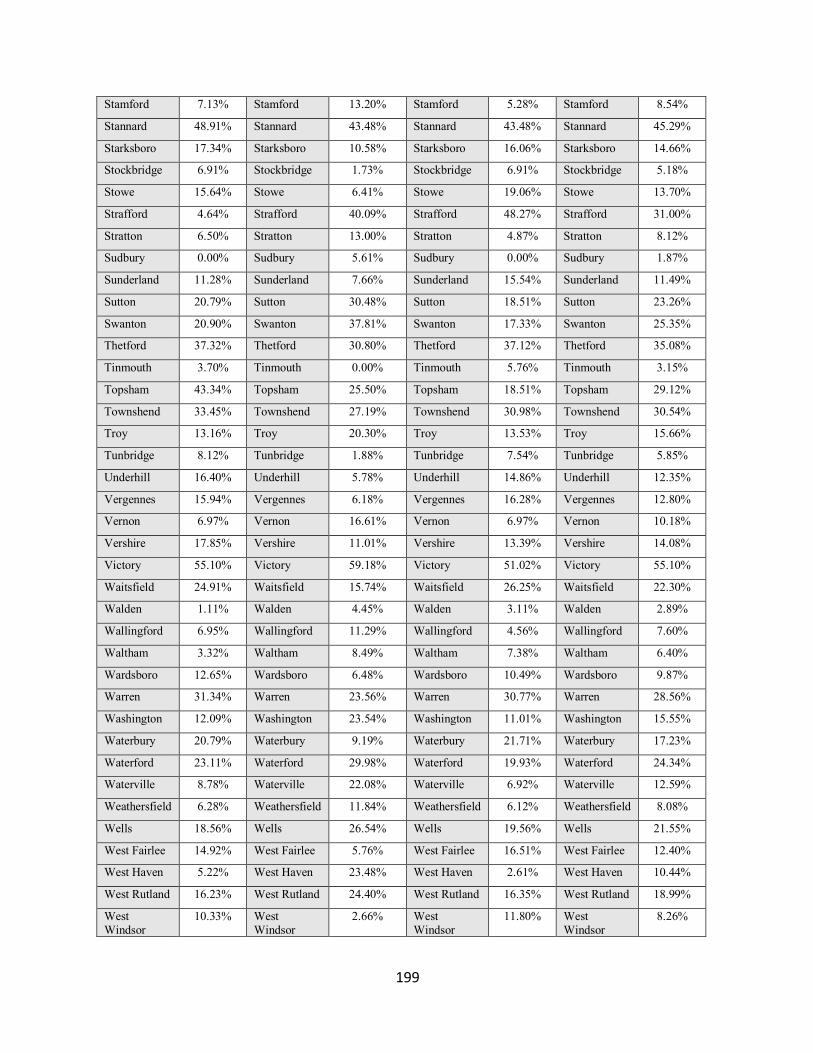
199
Stamford 7.13% Stamford 13.20% Stamford 5.28% Stamford 8.54%
Stannard 48.91% Stannard 43.48% Stannard 43.48% Stannard 45.29%
Starksboro 17.34% Starksboro 10.58% Starksboro 16.06% Starksboro 14.66%
Stockbridge 6.91% Stockbridge 1.73% Stockbridge 6.91% Stockbridge 5.18%
Stowe 15.64% Stowe 6.41% Stowe 19.06% Stowe 13.70%
Strafford 4.64% Strafford 40.09% Strafford 48.27% Strafford 31.00%
Stratton 6.50% Stratton 13.00% Stratton 4.87% Stratton 8.12%
Sudbury 0.00% Sudbury 5.61% Sudbury 0.00% Sudbury 1.87%
Sunderland 11.28% Sunderland 7.66% Sunderland 15.54% Sunderland 11.49%
Sutton 20.79% Sutton 30.48% Sutton 18.51% Sutton 23.26%
Swanton 20.90% Swanton 37.81% Swanton 17.33% Swanton 25.35%
Thetford 37.32% Thetford 30.80% Thetford 37.12% Thetford 35.08%
Tinmouth 3.70% Tinmouth 0.00% Tinmouth 5.76% Tinmouth 3.15%
Topsham 43.34% Topsham 25.50% Topsham 18.51% Topsham 29.12%
Townshend 33.45% Townshend 27.19% Townshend 30.98% Townshend 30.54%
Troy 13.16% Troy 20.30% Troy 13.53% Troy 15.66%
Tunbridge 8.12% Tunbridge 1.88% Tunbridge 7.54% Tunbridge 5.85%
Underhill 16.40% Underhill 5.78% Underhill 14.86% Underhill 12.35%
Vergennes 15.94% Vergennes 6.18% Vergennes 16.28% Vergennes 12.80%
Vernon 6.97% Vernon 16.61% Vernon 6.97% Vernon 10.18%
Vershire 17.85% Vershire 11.01% Vershire 13.39% Vershire 14.08%
Victory 55.10% Victory 59.18% Victory 51.02% Victory 55.10%
Waitsfield 24.91% Waitsfield 15.74% Waitsfield 26.25% Waitsfield 22.30%
Walden 1.11% Walden 4.45% Walden 3.11% Walden 2.89%
Wallingford 6.95% Wallingford 11.29% Wallingford 4.56% Wallingford 7.60%
Waltham 3.32% Waltham 8.49% Waltham 7.38% Waltham 6.40%
Wardsboro 12.65% Wardsboro 6.48% Wardsboro 10.49% Wardsboro 9.87%
Warren 31.34% Warren 23.56% Warren 30.77% Warren 28.56%
Washington 12.09% Washington 23.54% Washington 11.01% Washington 15.55%
Waterbury 20.79% Waterbury 9.19% Waterbury 21.71% Waterbury 17.23%
Waterford 23.11% Waterford 29.98% Waterford 19.93% Waterford 24.34%
Waterville 8.78% Waterville 22.08% Waterville 6.92% Waterville 12.59%
Weathersfield 6.28% Weathersfield 11.84% Weathersfield 6.12% Weathersfield 8.08%
Wells 18.56% Wells 26.54% Wells 19.56% Wells 21.55%
West Fairlee 14.92% West Fairlee 5.76% West Fairlee 16.51% West Fairlee 12.40%
West Haven 5.22% West Haven 23.48% West Haven 2.61% West Haven 10.44%
West Rutland 16.23% West Rutland 24.40% West Rutland 16.35% West Rutland 18.99%
West Windsor
10.33% West Windsor
2.66% West Windsor
11.80% West Windsor
8.26%
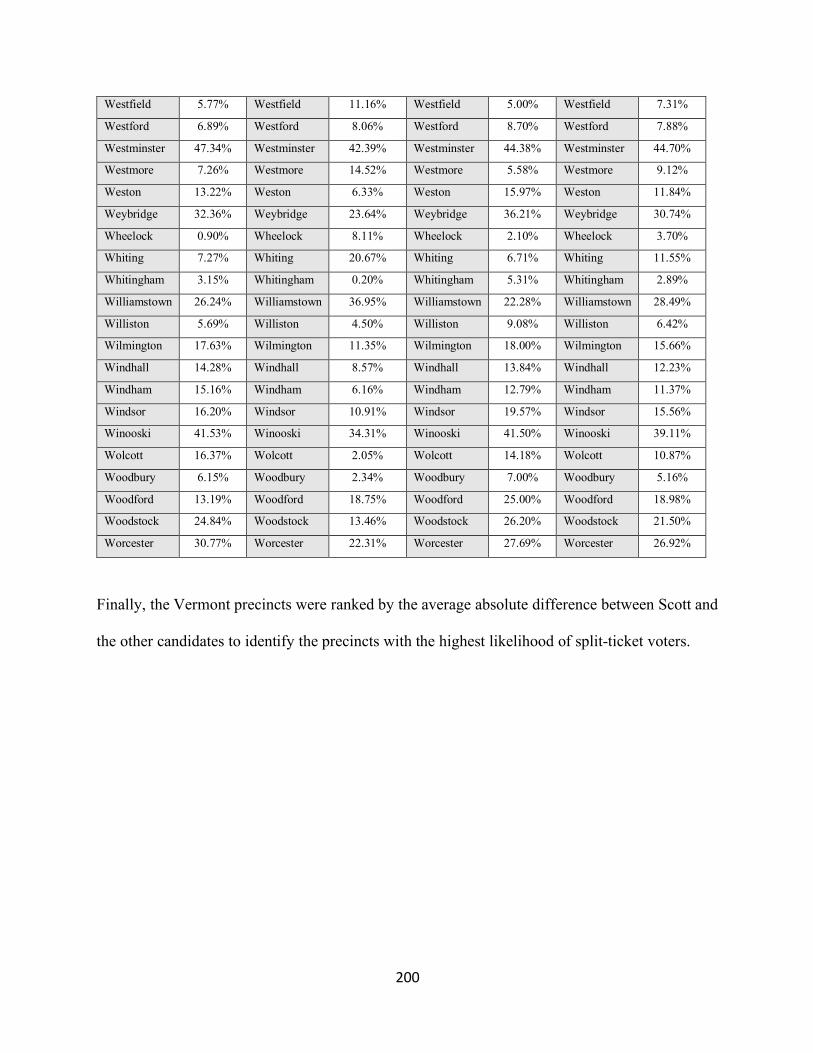
200
Westfield 5.77% Westfield 11.16% Westfield 5.00% Westfield 7.31%
Westford 6.89% Westford 8.06% Westford 8.70% Westford 7.88%
Westminster 47.34% Westminster 42.39% Westminster 44.38% Westminster 44.70%
Westmore 7.26% Westmore 14.52% Westmore 5.58% Westmore 9.12%
Weston 13.22% Weston 6.33% Weston 15.97% Weston 11.84%
Weybridge 32.36% Weybridge 23.64% Weybridge 36.21% Weybridge 30.74%
Wheelock 0.90% Wheelock 8.11% Wheelock 2.10% Wheelock 3.70%
Whiting 7.27% Whiting 20.67% Whiting 6.71% Whiting 11.55%
Whitingham 3.15% Whitingham 0.20% Whitingham 5.31% Whitingham 2.89%
Williamstown 26.24% Williamstown 36.95% Williamstown 22.28% Williamstown 28.49%
Williston 5.69% Williston 4.50% Williston 9.08% Williston 6.42%
Wilmington 17.63% Wilmington 11.35% Wilmington 18.00% Wilmington 15.66%
Windhall 14.28% Windhall 8.57% Windhall 13.84% Windhall 12.23%
Windham 15.16% Windham 6.16% Windham 12.79% Windham 11.37%
Windsor 16.20% Windsor 10.91% Windsor 19.57% Windsor 15.56%
Winooski 41.53% Winooski 34.31% Winooski 41.50% Winooski 39.11%
Wolcott 16.37% Wolcott 2.05% Wolcott 14.18% Wolcott 10.87%
Woodbury 6.15% Woodbury 2.34% Woodbury 7.00% Woodbury 5.16%
Woodford 13.19% Woodford 18.75% Woodford 25.00% Woodford 18.98%
Woodstock 24.84% Woodstock 13.46% Woodstock 26.20% Woodstock 21.50%
Worcester 30.77% Worcester 22.31% Worcester 27.69% Worcester 26.92%
Finally, the Vermont precincts were ranked by the average absolute difference between Scott and
the other candidates to identify the precincts with the highest likelihood of split-ticket voters.
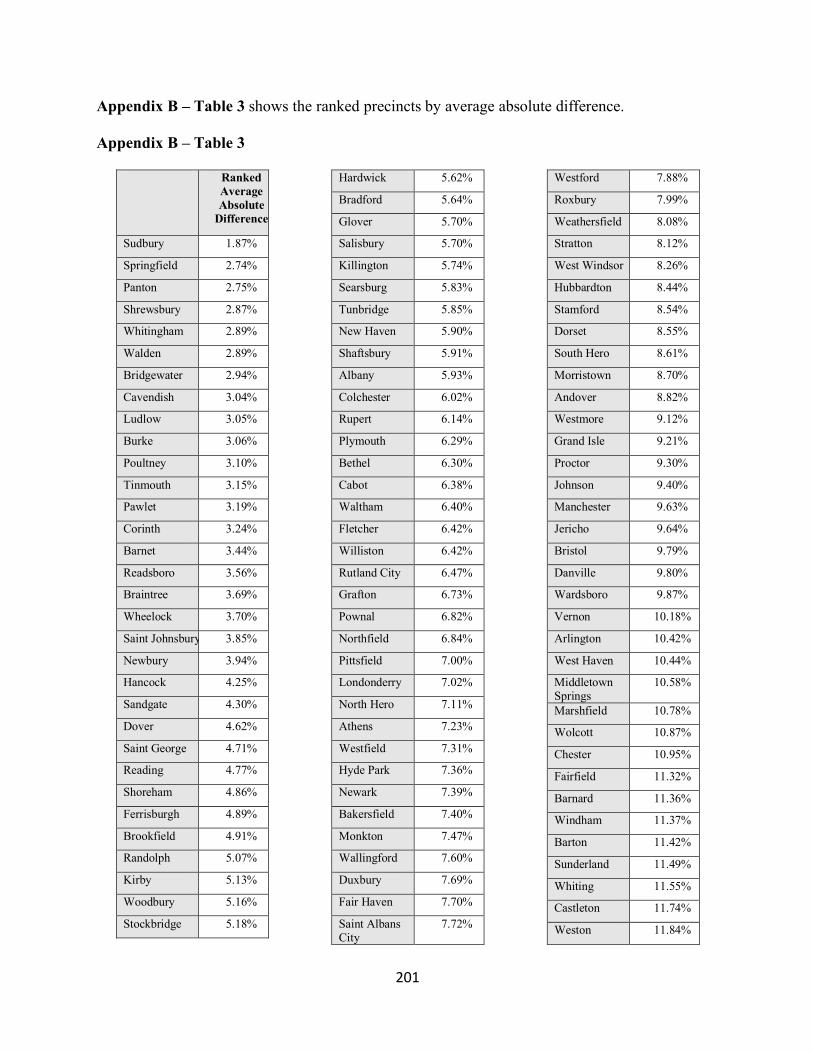
201
Appendix B – Table 3 shows the ranked precincts by average absolute difference.
Appendix B – Table 3
Ranked Average Absolute
Difference
Sudbury 1.87%
Springfield 2.74%
Panton 2.75%
Shrewsbury 2.87%
Whitingham 2.89%
Walden 2.89%
Bridgewater 2.94%
Cavendish 3.04%
Ludlow 3.05%
Burke 3.06%
Poultney 3.10%
Tinmouth 3.15%
Pawlet 3.19%
Corinth 3.24%
Barnet 3.44%
Readsboro 3.56%
Braintree 3.69%
Wheelock 3.70%
Saint Johnsbury 3.85%
Newbury 3.94%
Hancock 4.25%
Sandgate 4.30%
Dover 4.62%
Saint George 4.71%
Reading 4.77%
Shoreham 4.86%
Ferrisburgh 4.89%
Brookfield 4.91%
Randolph 5.07%
Kirby 5.13%
Woodbury 5.16%
Stockbridge 5.18%
Hardwick 5.62%
Bradford 5.64%
Glover 5.70%
Salisbury 5.70%
Killington 5.74%
Searsburg 5.83%
Tunbridge 5.85%
New Haven 5.90%
Shaftsbury 5.91%
Albany 5.93%
Colchester 6.02%
Rupert 6.14%
Plymouth 6.29%
Bethel 6.30%
Cabot 6.38%
Waltham 6.40%
Fletcher 6.42%
Williston 6.42%
Rutland City 6.47%
Grafton 6.73%
Pownal 6.82%
Northfield 6.84%
Pittsfield 7.00%
Londonderry 7.02%
North Hero 7.11%
Athens 7.23%
Westfield 7.31%
Hyde Park 7.36%
Newark 7.39%
Bakersfield 7.40%
Monkton 7.47%
Wallingford 7.60%
Duxbury 7.69%
Fair Haven 7.70%
Saint Albans City
7.72%
Westford 7.88%
Roxbury 7.99%
Weathersfield 8.08%
Stratton 8.12%
West Windsor 8.26%
Hubbardton 8.44%
Stamford 8.54%
Dorset 8.55%
South Hero 8.61%
Morristown 8.70%
Andover 8.82%
Westmore 9.12%
Grand Isle 9.21%
Proctor 9.30%
Johnson 9.40%
Manchester 9.63%
Jericho 9.64%
Bristol 9.79%
Danville 9.80%
Wardsboro 9.87%
Vernon 10.18%
Arlington 10.42%
West Haven 10.44%
Middletown Springs
10.58%
Marshfield 10.78%
Wolcott 10.87%
Chester 10.95%
Fairfield 11.32%
Barnard 11.36%
Windham 11.37%
Barton 11.42%
Sunderland 11.49%
Whiting 11.55%
Castleton 11.74%
Weston 11.84%
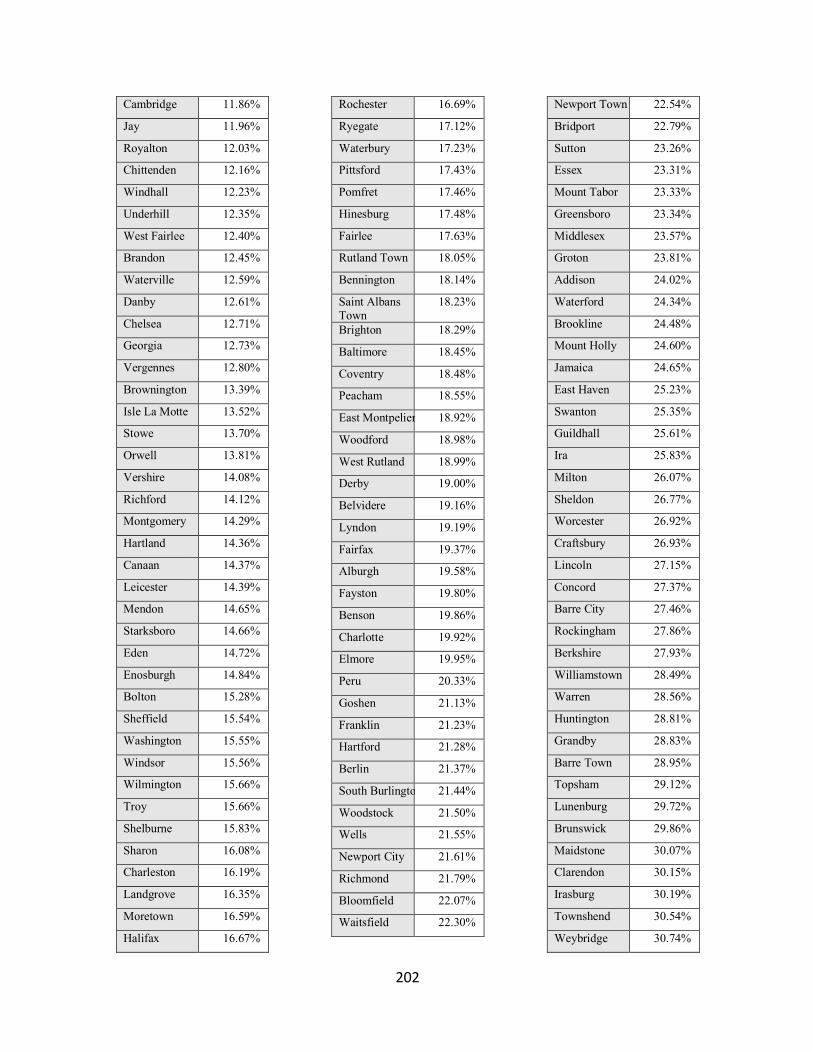
202
Cambridge 11.86%
Jay 11.96%
Royalton 12.03%
Chittenden 12.16%
Windhall 12.23%
Underhill 12.35%
West Fairlee 12.40%
Brandon 12.45%
Waterville 12.59%
Danby 12.61%
Chelsea 12.71%
Georgia 12.73%
Vergennes 12.80%
Brownington 13.39%
Isle La Motte 13.52%
Stowe 13.70%
Orwell 13.81%
Vershire 14.08%
Richford 14.12%
Montgomery 14.29%
Hartland 14.36%
Canaan 14.37%
Leicester 14.39%
Mendon 14.65%
Starksboro 14.66%
Eden 14.72%
Enosburgh 14.84%
Bolton 15.28%
Sheffield 15.54%
Washington 15.55%
Windsor 15.56%
Wilmington 15.66%
Troy 15.66%
Shelburne 15.83%
Sharon 16.08%
Charleston 16.19%
Landgrove 16.35%
Moretown 16.59%
Halifax 16.67%
Rochester 16.69%
Ryegate 17.12%
Waterbury 17.23%
Pittsford 17.43%
Pomfret 17.46%
Hinesburg 17.48%
Fairlee 17.63%
Rutland Town 18.05%
Bennington 18.14%
Saint Albans Town
18.23%
Brighton 18.29%
Baltimore 18.45%
Coventry 18.48%
Peacham 18.55%
East Montpelier 18.92%
Woodford 18.98%
West Rutland 18.99%
Derby 19.00%
Belvidere 19.16%
Lyndon 19.19%
Fairfax 19.37%
Alburgh 19.58%
Fayston 19.80%
Benson 19.86%
Charlotte 19.92%
Elmore 19.95%
Peru 20.33%
Goshen 21.13%
Franklin 21.23%
Hartford 21.28%
Berlin 21.37%
South Burlington 21.44%
Woodstock 21.50%
Wells 21.55%
Newport City 21.61%
Richmond 21.79%
Bloomfield 22.07%
Waitsfield 22.30%
Newport Town 22.54%
Bridport 22.79%
Sutton 23.26%
Essex 23.31%
Mount Tabor 23.33%
Greensboro 23.34%
Middlesex 23.57%
Groton 23.81%
Addison 24.02%
Waterford 24.34%
Brookline 24.48%
Mount Holly 24.60%
Jamaica 24.65%
East Haven 25.23%
Swanton 25.35%
Guildhall 25.61%
Ira 25.83%
Milton 26.07%
Sheldon 26.77%
Worcester 26.92%
Craftsbury 26.93%
Lincoln 27.15%
Concord 27.37%
Barre City 27.46%
Rockingham 27.86%
Berkshire 27.93%
Williamstown 28.49%
Warren 28.56%
Huntington 28.81%
Grandby 28.83%
Barre Town 28.95%
Topsham 29.12%
Lunenburg 29.72%
Brunswick 29.86%
Maidstone 30.07%
Clarendon 30.15%
Irasburg 30.19%
Townshend 30.54%
Weybridge 30.74%
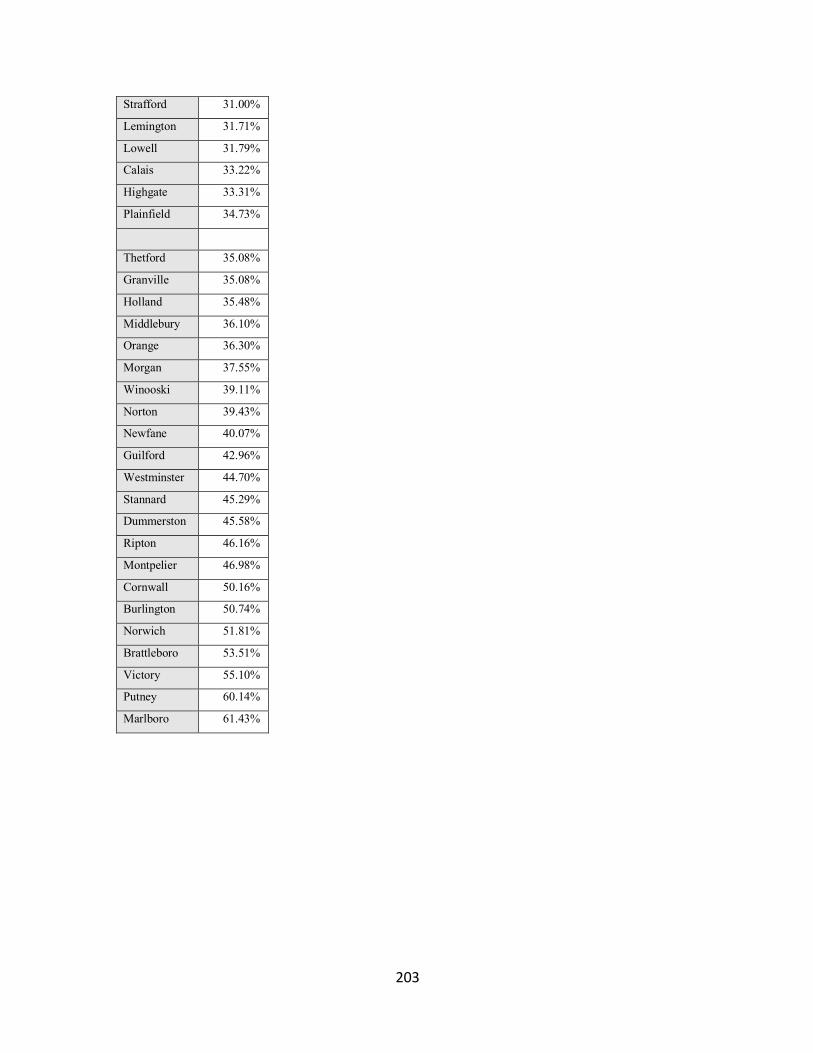
203
Strafford 31.00%
Lemington 31.71%
Lowell 31.79%
Calais 33.22%
Highgate 33.31%
Plainfield 34.73%
Thetford 35.08%
Granville 35.08%
Holland 35.48%
Middlebury 36.10%
Orange 36.30%
Morgan 37.55%
Winooski 39.11%
Norton 39.43%
Newfane 40.07%
Guilford 42.96%
Westminster 44.70%
Stannard 45.29%
Dummerston 45.58%
Ripton 46.16%
Montpelier 46.98%
Cornwall 50.16%
Burlington 50.74%
Norwich 51.81%
Brattleboro 53.51%
Victory 55.10%
Putney 60.14%
Marlboro 61.43%
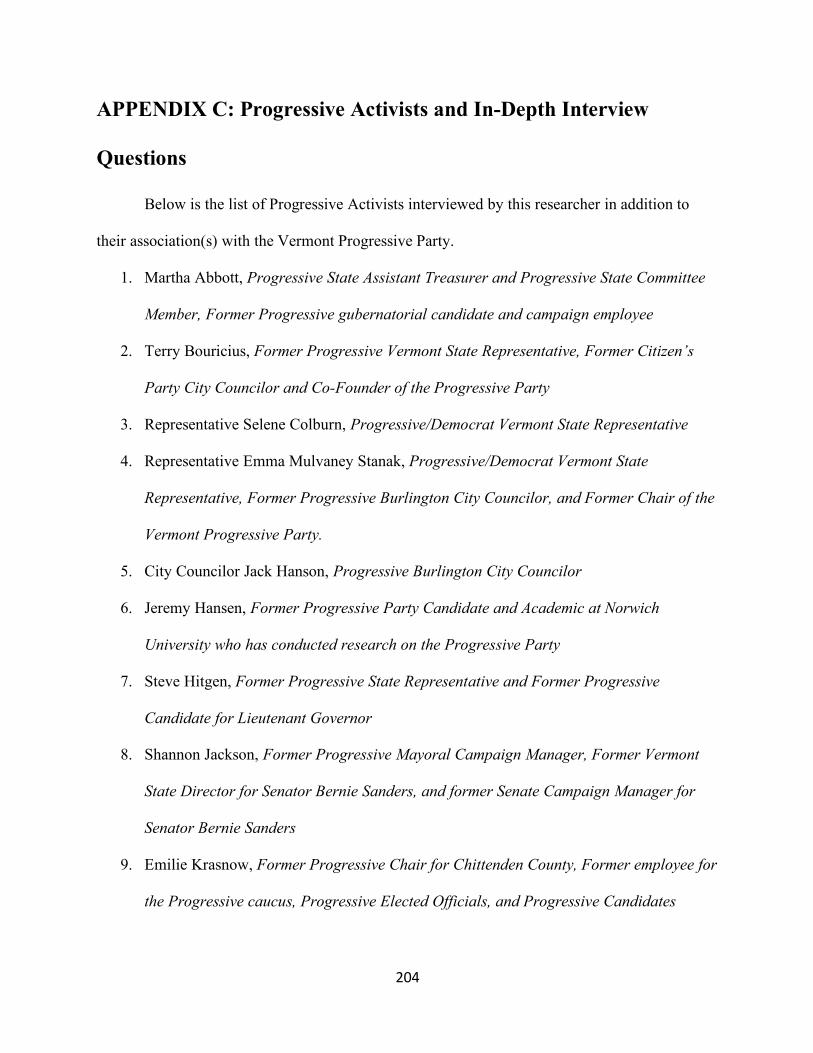
204
APPENDIX C: Progressive Activists and In-Depth Interview
Questions
Below is the list of Progressive Activists interviewed by this researcher in addition to
their association(s) with the Vermont Progressive Party.
1. Martha Abbott, Progressive State Assistant Treasurer and Progressive State Committee
Member, Former Progressive gubernatorial candidate and campaign employee
2. Terry Bouricius, Former Progressive Vermont State Representative, Former Citizen’s
Party City Councilor and Co-Founder of the Progressive Party
3. Representative Selene Colburn, Progressive/Democrat Vermont State Representative
4. Representative Emma Mulvaney Stanak, Progressive/Democrat Vermont State
Representative, Former Progressive Burlington City Councilor, and Former Chair of the
Vermont Progressive Party.
5. City Councilor Jack Hanson, Progressive Burlington City Councilor
6. Jeremy Hansen, Former Progressive Party Candidate and Academic at Norwich
University who has conducted research on the Progressive Party
7. Steve Hitgen, Former Progressive State Representative and Former Progressive
Candidate for Lieutenant Governor
8. Shannon Jackson, Former Progressive Mayoral Campaign Manager, Former Vermont
State Director for Senator Bernie Sanders, and former Senate Campaign Manager for
Senator Bernie Sanders
9. Emilie Krasnow, Former Progressive Chair for Chittenden County, Former employee for
the Progressive caucus, Progressive Elected Officials, and Progressive Candidates
205
10. Erhard Mahnke, Progressive State Committee Member and Former Progressive State
Senate Candidate
11. Carter Neubieser, Co-Campaign Manager for Progressive Party Mayoral Campaign,
Former Progressive Burlington City Council Candidate
12. Senator Chris Pearson, Progressive/Democrat State Senator, Former Progressive Party
Employee, and Former Progressive Campaign Manager
13. Senator Anthony Pollina, Progressive/Democrat Vermont State Senator and Former
Progressive Candidate for Governor
14. Megan Polyte, Former Progressive Party Gubernatorial Campaign Manager, Former
State Vice Chair for the Progressive Party
15. Barbara Prine, Progressive State Committee Member and Progressive Party Activist
16. Joshua Wronski, Executive Director of The Progressive Party
17. Representative Tanya Vyhovski, Progressive/Democrat Vermont State Representative,
and Progressive State Committee Member
18. Former Lieutenant Governor David Zuckerman, Progressive/Democrat Vermont
Lieutenant Governor, Former Progressive/Democrat State Senator and Former
Progressive Member of the Vermont House of Representatives
Each of the interviewees was asked the following series of questions:
1. Why are you a Progressive party activist? What makes you so supportive of the
Progressive Party? What makes the Progressive Party special? What are some things
you feel best about how the Progressive Party has contributed to life in Vermont?
2. Tell me some of the reasons you first got involved with the Vermont Progressive Party?
206
3. What makes it different from the Vermont Democratic Party?
4. One of the reasons I am doing this research is that the Vermont Progressive Party is the
most successful third party in the country. Why do you think that is true? Why do you
think this party is more successful than other third parties around the country?
5. What do you think the future of the Progressive Party looks like? What are some key
decisions that the Party will make in the next number of years?
6. In your opinion, are Fusion candidates good for the Progressive Party or do they dilute
the Progressive Party? Do you think the Progressive Party can truly be seen as distinct
outside of Burlington in light of fusion candidates?
7. Is there anything you would like to share about yourself and the Progressive Party? What
did I miss with my questions? What would you like to make sure I understand and know
before we end the interview?
Follow up questions were asked if interviewees were unclear or if the researcher wanted more
information than was provided by the interviewee.
207
APPENDIX D: Public Opinion Survey Findings on Progressives
To complement the in-depth interviews, survey data from two Vermont sources was
collected and analyzed for similarities with the qualitative data described in the chapter above.
Through connections with the Vermont Democratic Party and with the 2020 Zuckerman
for VT campaign, this researcher was able to acquire two public opinion polls that give some
insight into the Vermont Progressive Party’s members, voters, and the Vermont public’s opinion
of the party relative to the Democratic and Republican Parties.
The first poll was funded by the Vermont Democratic Party and fielded in May of
2019. The survey was conducted online with 795 Vermont Voters. The second poll was
conducted online by the Zuckerman for VT campaign of 1009 likely Vermont voters in
October of 2020. Below is an analysis of the two surveys’ findings of Vermont voters’ feelings
toward the Progressive Party and their party identification. Relevant demographic trends are
identified.
Issue Priorities Matches Party Identification
Public opinion polling done on voters in Vermont reinforces the activists’ stated
attraction to the Progressive Party. In the public opinion poll conducted by the Zuckerman
campaign, the poll asked voters to select issues that were the most important issues for them. The
results demonstrated Progressive voters feel attracted to the same issues that had been mentioned
by the Progressive Party activists.
Specifically, similar to the Progressive activists’ support for climate activism,
Progressives across Vermont are much more likely than those who identify with other parties to
say that climate change is one of their top issues. Three quarters of Progressives say climate
208
change is their top issue, compared to 53% of Democrats, 24% of Independents, and 3% of
Republicans.
Progressives across Vermont are also much more likely to think that issues around social
justice and healthcare are important: Progressives are more likely to say healthcare is one of their
top issues (60%) than Democrats (53%). Progressives are also slightly more likely to say that
reproductive rights are one of their top issues (28%) than Democrats (23%).
Unfortunately, the Zuckerman for Vermont campaign did not ask any specific questions
that were able to directly test the economic arguments that the Progressive activists mentioned –
like corporate contributions or the wealth gap. The economic issues asked by the survey
included: taxes, unemployment/jobs, and the stock market. However, we can look at the
importance of taxation as tangentially related to comfort with the wealth gap and see that the
results support the Progressive argument against an economic system that favors the wealthy:
Progressives were much less likely to say that taxes (6%) were an important issue than
Democrats (15%), Independents (29%), and Republicans (49%).
This researcher hypothesizes that if there had been options on the survey that specifically
mentioned corporate contributions or corporate influence on elections, the wealth gap, labor
rights, or the political status quo that benefits the wealthy over the working class, we would have
seen a spike in Progressives indicating they believed that issue to be of high importance.
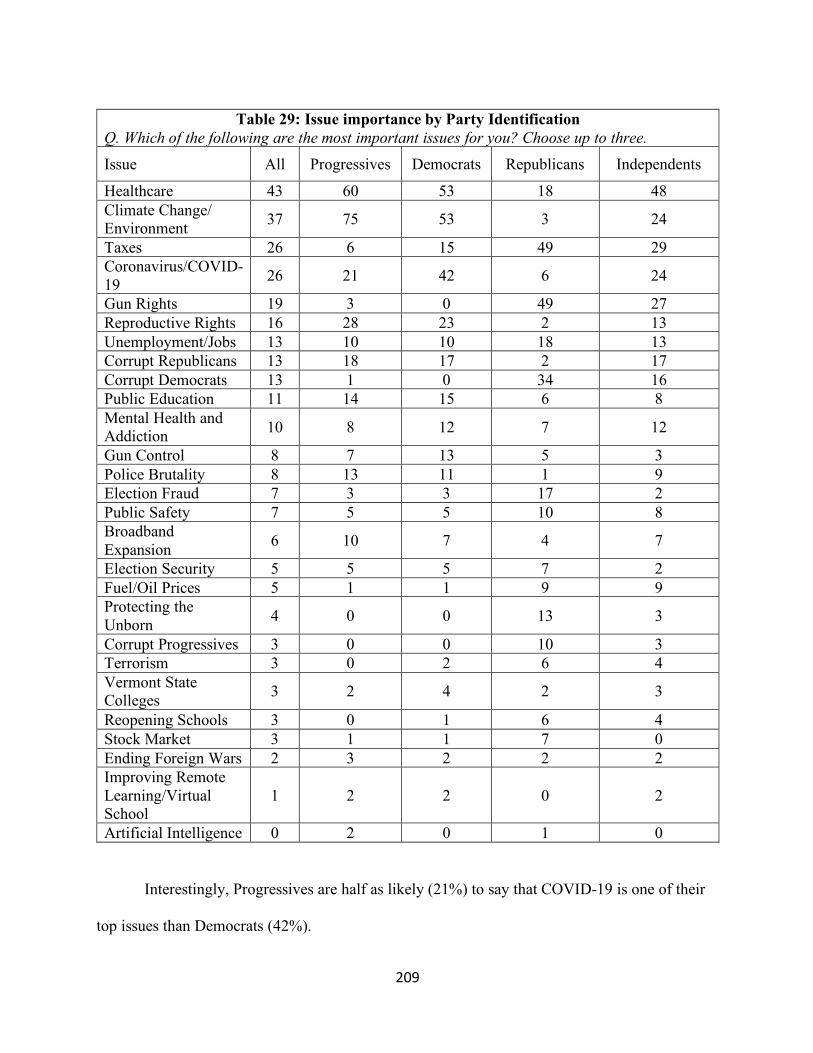
209
Interestingly, Progressives are half as likely (21%) to say that COVID-19 is one of their
top issues than Democrats (42%).
Table 29: Issue importance by Party Identification Q. Which of the following are the most important issues for you? Choose up to three. Issue All Progressives Democrats Republicans Independents
Healthcare 43 60 53 18 48 Climate Change/ Environment 37 75 53 3 24
Taxes 26 6 15 49 29 Coronavirus/COVID-19 26 21 42 6 24
Gun Rights 19 3 0 49 27 Reproductive Rights 16 28 23 2 13 Unemployment/Jobs 13 10 10 18 13 Corrupt Republicans 13 18 17 2 17 Corrupt Democrats 13 1 0 34 16 Public Education 11 14 15 6 8 Mental Health and Addiction 10 8 12 7 12
Gun Control 8 7 13 5 3 Police Brutality 8 13 11 1 9 Election Fraud 7 3 3 17 2 Public Safety 7 5 5 10 8 Broadband Expansion 6 10 7 4 7
Election Security 5 5 5 7 2 Fuel/Oil Prices 5 1 1 9 9 Protecting the Unborn 4 0 0 13 3
Corrupt Progressives 3 0 0 10 3 Terrorism 3 0 2 6 4 Vermont State Colleges 3 2 4 2 3
Reopening Schools 3 0 1 6 4 Stock Market 3 1 1 7 0 Ending Foreign Wars 2 3 2 2 2 Improving Remote Learning/Virtual School
1 2 2 0 2
Artificial Intelligence 0 2 0 1 0
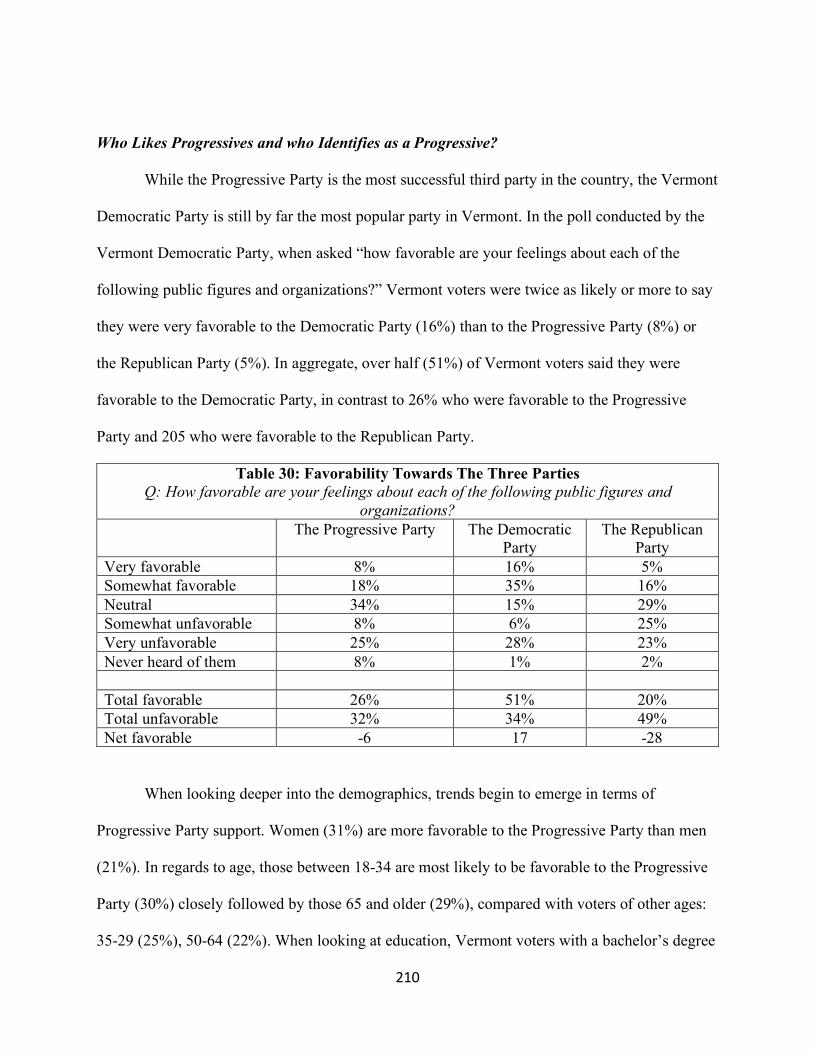
210
Who Likes Progressives and who Identifies as a Progressive?
While the Progressive Party is the most successful third party in the country, the Vermont
Democratic Party is still by far the most popular party in Vermont. In the poll conducted by the
Vermont Democratic Party, when asked “how favorable are your feelings about each of the
following public figures and organizations?” Vermont voters were twice as likely or more to say
they were very favorable to the Democratic Party (16%) than to the Progressive Party (8%) or
the Republican Party (5%). In aggregate, over half (51%) of Vermont voters said they were
favorable to the Democratic Party, in contrast to 26% who were favorable to the Progressive
Party and 205 who were favorable to the Republican Party.
Table 30: Favorability Towards The Three Parties Q: How favorable are your feelings about each of the following public figures and
organizations? The Progressive Party The Democratic
Party The Republican
Party Very favorable 8% 16% 5% Somewhat favorable 18% 35% 16% Neutral 34% 15% 29% Somewhat unfavorable 8% 6% 25% Very unfavorable 25% 28% 23% Never heard of them 8% 1% 2% Total favorable 26% 51% 20% Total unfavorable 32% 34% 49% Net favorable -6 17 -28
When looking deeper into the demographics, trends begin to emerge in terms of
Progressive Party support. Women (31%) are more favorable to the Progressive Party than men
(21%). In regards to age, those between 18-34 are most likely to be favorable to the Progressive
Party (30%) closely followed by those 65 and older (29%), compared with voters of other ages:
35-29 (25%), 50-64 (22%). When looking at education, Vermont voters with a bachelor’s degree
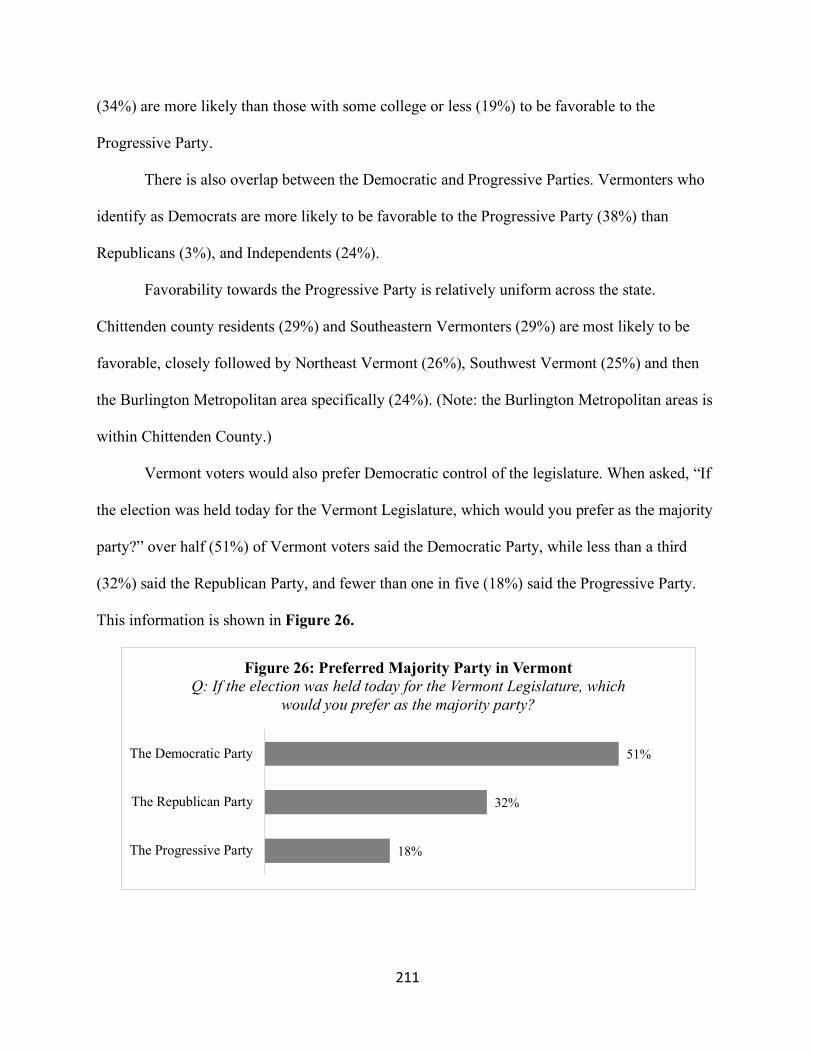
211
(34%) are more likely than those with some college or less (19%) to be favorable to the
Progressive Party.
There is also overlap between the Democratic and Progressive Parties. Vermonters who
identify as Democrats are more likely to be favorable to the Progressive Party (38%) than
Republicans (3%), and Independents (24%).
Favorability towards the Progressive Party is relatively uniform across the state.
Chittenden county residents (29%) and Southeastern Vermonters (29%) are most likely to be
favorable, closely followed by Northeast Vermont (26%), Southwest Vermont (25%) and then
the Burlington Metropolitan area specifically (24%). (Note: the Burlington Metropolitan areas is
within Chittenden County.)
Vermont voters would also prefer Democratic control of the legislature. When asked, “If
the election was held today for the Vermont Legislature, which would you prefer as the majority
party?” over half (51%) of Vermont voters said the Democratic Party, while less than a third
(32%) said the Republican Party, and fewer than one in five (18%) said the Progressive Party.
This information is shown in Figure 26.
18%
32%
51%
The Progressive Party
The Republican Party
The Democratic Party
Figure 26: Preferred Majority Party in VermontQ: If the election was held today for the Vermont Legislature, which
would you prefer as the majority party?
212
Independents (27%), those aged 18-34 (25%), and voters in Southeast Vermont (24%) are
the groups most likely to say they would prefer the Progressive Party as the majority party.
Party Identification
In Vermont, parties do not require party registration to vote in the primary. In addition,
many Progressives strategically use the Democratic primary to run as “fusion candidates” and
coordinate write-ins for the Progressive primary (because election law requires that candidates
can have their name only one ballot198) thereby distorting Vermont Secretary of State data on
party identification. For instance, in the 2020 election, Lieutenant Governor David Zuckerman’s
campaign recruited around 300 Progressive voters for a write-in campaign for the Progressive
nomination while he also competed in the Democratic primary election.199
As a result of this political system and situation, public opinion polls give us one of the
best insights into party identification in Vermont.
According to the Vermont Democratic Party poll, four-in-ten Vermont voters identify as
a member of the Democratic Party, while 36% identify as an independent, 22% identify as a
member of the Republican Party, and only 3% identify as a member of the Progressive Party.
198 Vermont General Assembly, “Vermont Statutes Online, Title 17: Elections, Chapter 049: Nominations, Subchapter 001: Primary Elections, (17 V.S.A. § 2353),” accessed December 17, 2020, https://legislature.vermont.gov/statutes/section/17/049/02353. 199 Colin Meyn, “Zuckerman wins Progressive nomination; Ericson eyes a recount,” VT Digger, August 17, 2020, https://vtdigger.org/2020/08/17/zuckerman-wins-progressive-nomination-ericson-eyes-a-recount/.
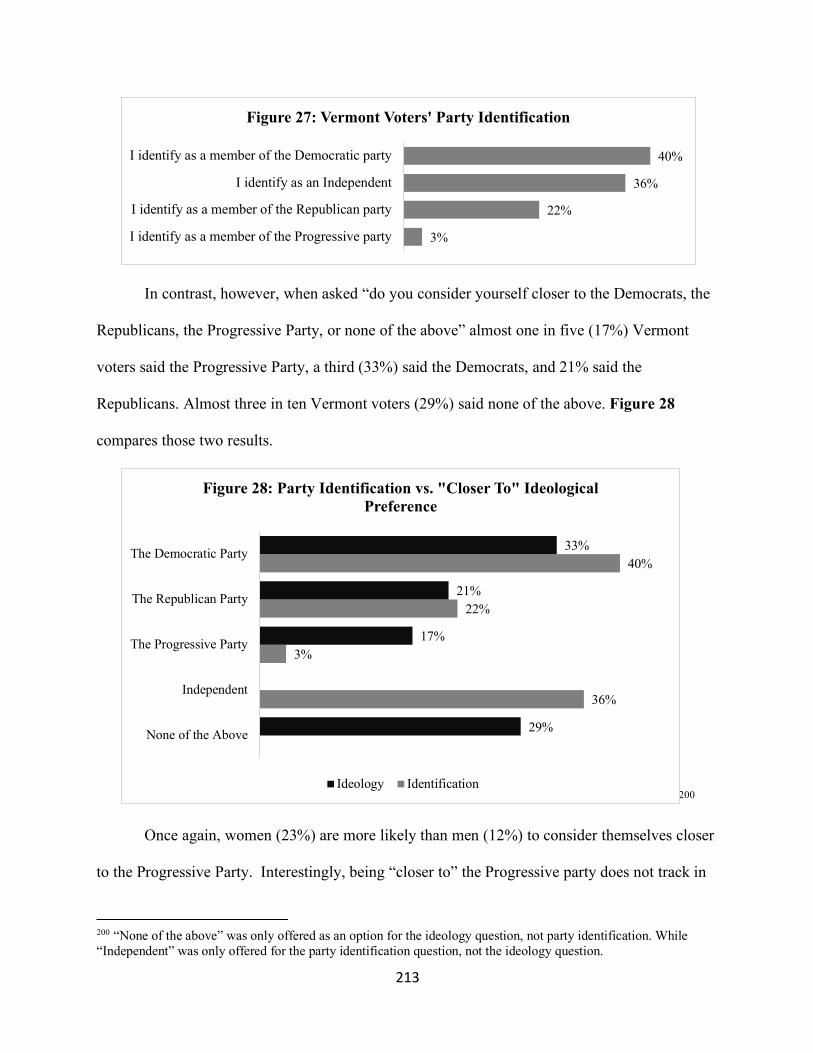
213
In contrast, however, when asked “do you consider yourself closer to the Democrats, the
Republicans, the Progressive Party, or none of the above” almost one in five (17%) Vermont
voters said the Progressive Party, a third (33%) said the Democrats, and 21% said the
Republicans. Almost three in ten Vermont voters (29%) said none of the above. Figure 28
compares those two results.
200
Once again, women (23%) are more likely than men (12%) to consider themselves closer
to the Progressive Party. Interestingly, being “closer to” the Progressive party does not track in
200 “None of the above” was only offered as an option for the ideology question, not party identification. While “Independent” was only offered for the party identification question, not the ideology question.
3%
22%
36%
40%
I identify as a member of the Progressive party
I identify as a member of the Republican party
I identify as an Independent
I identify as a member of the Democratic party
Figure 27: Vermont Voters' Party Identification
36%
3%
22%
40%
29%
17%
21%
33%
None of the Above
Independent
The Progressive Party
The Republican Party
The Democratic Party
Figure 28: Party Identification vs. "Closer To" Ideological Preference
Ideology Identification
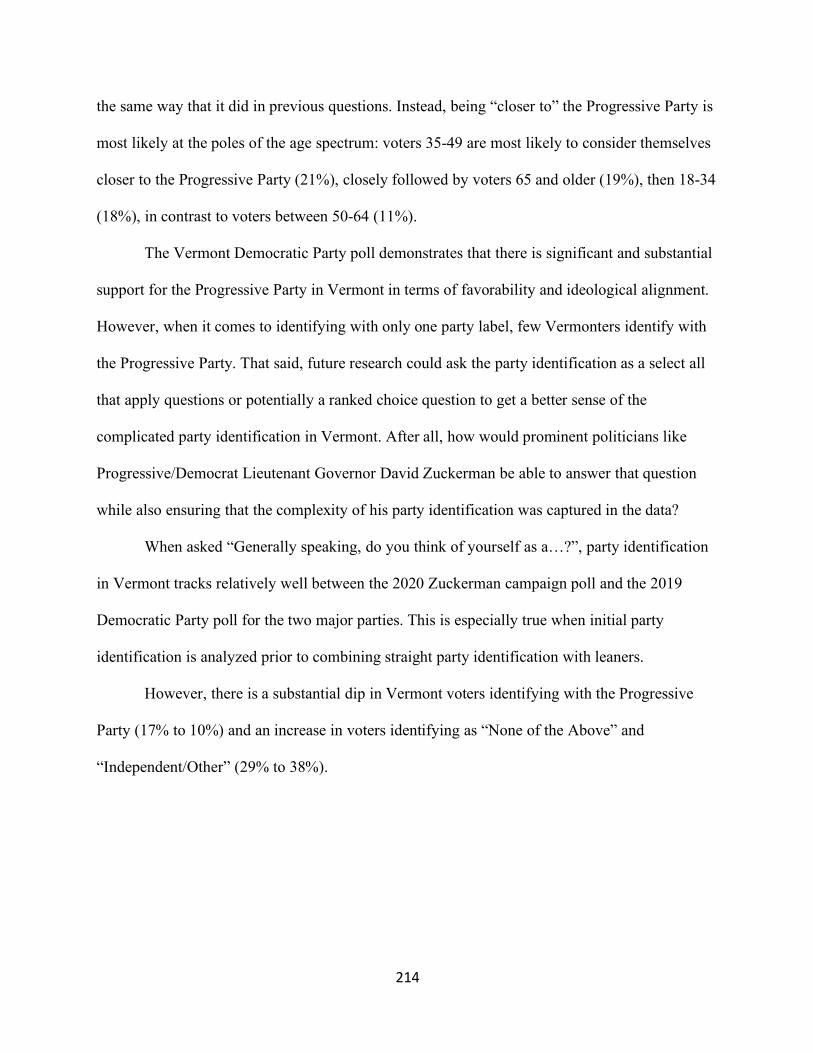
214
the same way that it did in previous questions. Instead, being “closer to” the Progressive Party is
most likely at the poles of the age spectrum: voters 35-49 are most likely to consider themselves
closer to the Progressive Party (21%), closely followed by voters 65 and older (19%), then 18-34
(18%), in contrast to voters between 50-64 (11%).
The Vermont Democratic Party poll demonstrates that there is significant and substantial
support for the Progressive Party in Vermont in terms of favorability and ideological alignment.
However, when it comes to identifying with only one party label, few Vermonters identify with
the Progressive Party. That said, future research could ask the party identification as a select all
that apply questions or potentially a ranked choice question to get a better sense of the
complicated party identification in Vermont. After all, how would prominent politicians like
Progressive/Democrat Lieutenant Governor David Zuckerman be able to answer that question
while also ensuring that the complexity of his party identification was captured in the data?
When asked “Generally speaking, do you think of yourself as a…?”, party identification
in Vermont tracks relatively well between the 2020 Zuckerman campaign poll and the 2019
Democratic Party poll for the two major parties. This is especially true when initial party
identification is analyzed prior to combining straight party identification with leaners.
However, there is a substantial dip in Vermont voters identifying with the Progressive
Party (17% to 10%) and an increase in voters identifying as “None of the Above” and
“Independent/Other” (29% to 38%).
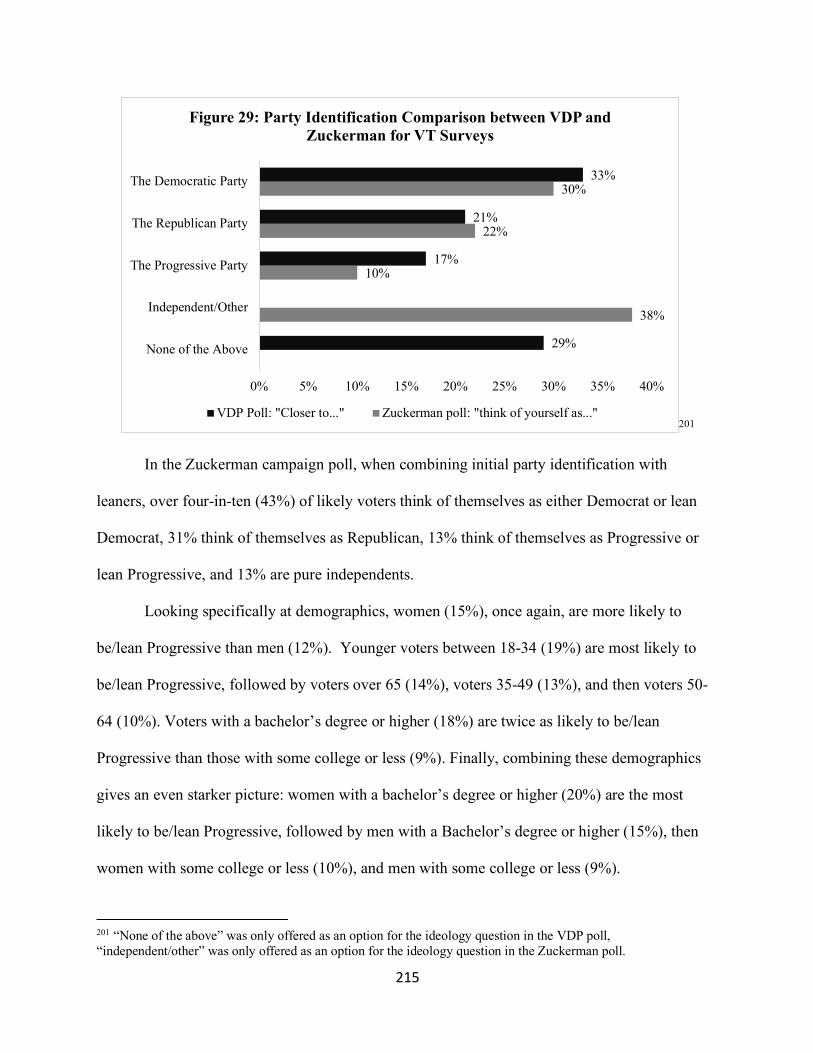
215
201
In the Zuckerman campaign poll, when combining initial party identification with
leaners, over four-in-ten (43%) of likely voters think of themselves as either Democrat or lean
Democrat, 31% think of themselves as Republican, 13% think of themselves as Progressive or
lean Progressive, and 13% are pure independents.
Looking specifically at demographics, women (15%), once again, are more likely to
be/lean Progressive than men (12%). Younger voters between 18-34 (19%) are most likely to
be/lean Progressive, followed by voters over 65 (14%), voters 35-49 (13%), and then voters 50-
64 (10%). Voters with a bachelor’s degree or higher (18%) are twice as likely to be/lean
Progressive than those with some college or less (9%). Finally, combining these demographics
gives an even starker picture: women with a bachelor’s degree or higher (20%) are the most
likely to be/lean Progressive, followed by men with a Bachelor’s degree or higher (15%), then
women with some college or less (10%), and men with some college or less (9%).
201 “None of the above” was only offered as an option for the ideology question in the VDP poll, “independent/other” was only offered as an option for the ideology question in the Zuckerman poll.
38%
10%
22%
30%
29%
17%
21%
33%
0% 5% 10% 15% 20% 25% 30% 35% 40%
None of the Above
Independent/Other
The Progressive Party
The Republican Party
The Democratic Party
Figure 29: Party Identification Comparison between VDP and Zuckerman for VT Surveys
VDP Poll: "Closer to..." Zuckerman poll: "think of yourself as..."
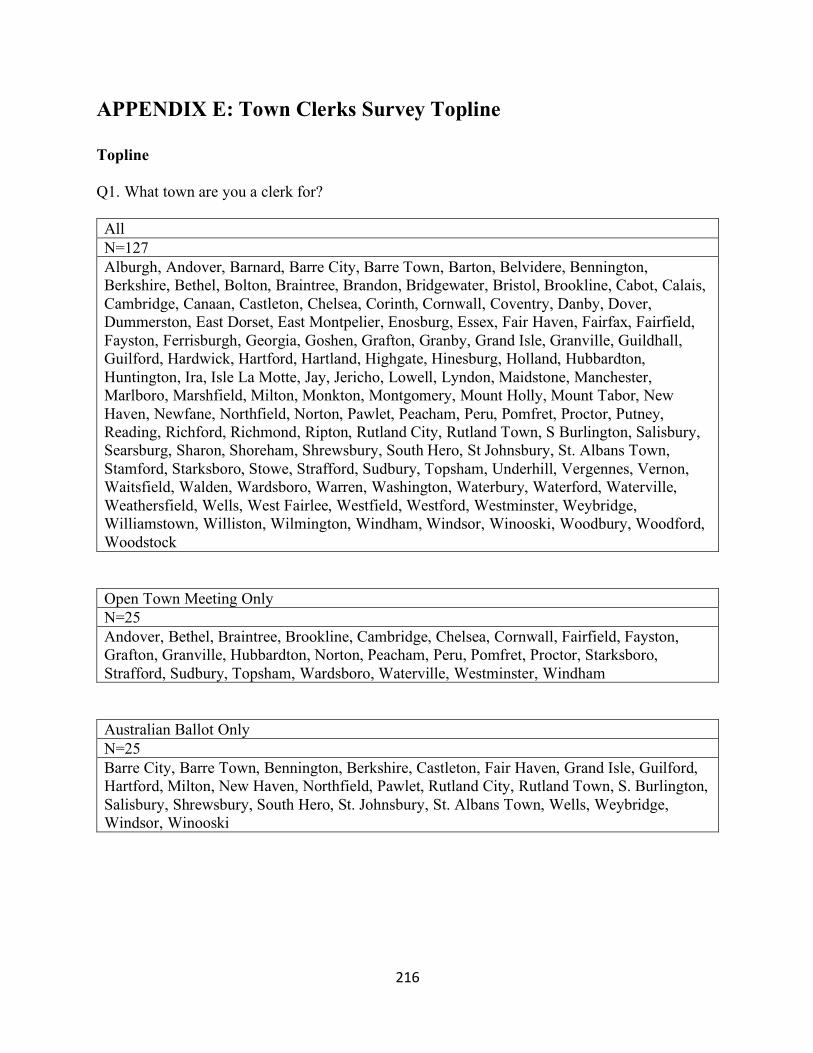
216
APPENDIX E: Town Clerks Survey Topline
Topline
Q1. What town are you a clerk for?
All N=127 Alburgh, Andover, Barnard, Barre City, Barre Town, Barton, Belvidere, Bennington, Berkshire, Bethel, Bolton, Braintree, Brandon, Bridgewater, Bristol, Brookline, Cabot, Calais, Cambridge, Canaan, Castleton, Chelsea, Corinth, Cornwall, Coventry, Danby, Dover, Dummerston, East Dorset, East Montpelier, Enosburg, Essex, Fair Haven, Fairfax, Fairfield, Fayston, Ferrisburgh, Georgia, Goshen, Grafton, Granby, Grand Isle, Granville, Guildhall, Guilford, Hardwick, Hartford, Hartland, Highgate, Hinesburg, Holland, Hubbardton, Huntington, Ira, Isle La Motte, Jay, Jericho, Lowell, Lyndon, Maidstone, Manchester, Marlboro, Marshfield, Milton, Monkton, Montgomery, Mount Holly, Mount Tabor, New Haven, Newfane, Northfield, Norton, Pawlet, Peacham, Peru, Pomfret, Proctor, Putney, Reading, Richford, Richmond, Ripton, Rutland City, Rutland Town, S Burlington, Salisbury, Searsburg, Sharon, Shoreham, Shrewsbury, South Hero, St Johnsbury, St. Albans Town, Stamford, Starksboro, Stowe, Strafford, Sudbury, Topsham, Underhill, Vergennes, Vernon, Waitsfield, Walden, Wardsboro, Warren, Washington, Waterbury, Waterford, Waterville, Weathersfield, Wells, West Fairlee, Westfield, Westford, Westminster, Weybridge, Williamstown, Williston, Wilmington, Windham, Windsor, Winooski, Woodbury, Woodford, Woodstock
Open Town Meeting Only N=25 Andover, Bethel, Braintree, Brookline, Cambridge, Chelsea, Cornwall, Fairfield, Fayston, Grafton, Granville, Hubbardton, Norton, Peacham, Peru, Pomfret, Proctor, Starksboro, Strafford, Sudbury, Topsham, Wardsboro, Waterville, Westminster, Windham
Australian Ballot Only N=25 Barre City, Barre Town, Bennington, Berkshire, Castleton, Fair Haven, Grand Isle, Guilford, Hartford, Milton, New Haven, Northfield, Pawlet, Rutland City, Rutland Town, S. Burlington, Salisbury, Shrewsbury, South Hero, St. Johnsbury, St. Albans Town, Wells, Weybridge, Windsor, Winooski
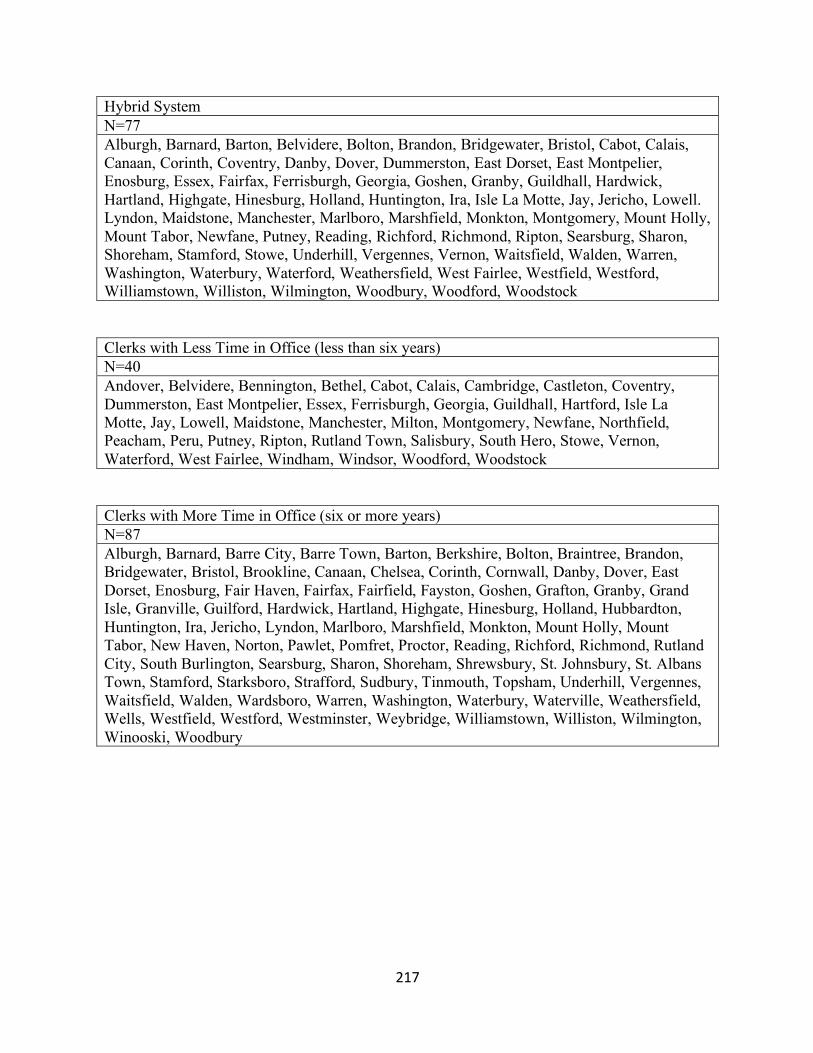
217
Hybrid System N=77 Alburgh, Barnard, Barton, Belvidere, Bolton, Brandon, Bridgewater, Bristol, Cabot, Calais, Canaan, Corinth, Coventry, Danby, Dover, Dummerston, East Dorset, East Montpelier, Enosburg, Essex, Fairfax, Ferrisburgh, Georgia, Goshen, Granby, Guildhall, Hardwick, Hartland, Highgate, Hinesburg, Holland, Huntington, Ira, Isle La Motte, Jay, Jericho, Lowell. Lyndon, Maidstone, Manchester, Marlboro, Marshfield, Monkton, Montgomery, Mount Holly, Mount Tabor, Newfane, Putney, Reading, Richford, Richmond, Ripton, Searsburg, Sharon, Shoreham, Stamford, Stowe, Underhill, Vergennes, Vernon, Waitsfield, Walden, Warren, Washington, Waterbury, Waterford, Weathersfield, West Fairlee, Westfield, Westford, Williamstown, Williston, Wilmington, Woodbury, Woodford, Woodstock
Clerks with Less Time in Office (less than six years) N=40 Andover, Belvidere, Bennington, Bethel, Cabot, Calais, Cambridge, Castleton, Coventry, Dummerston, East Montpelier, Essex, Ferrisburgh, Georgia, Guildhall, Hartford, Isle La Motte, Jay, Lowell, Maidstone, Manchester, Milton, Montgomery, Newfane, Northfield, Peacham, Peru, Putney, Ripton, Rutland Town, Salisbury, South Hero, Stowe, Vernon, Waterford, West Fairlee, Windham, Windsor, Woodford, Woodstock
Clerks with More Time in Office (six or more years) N=87 Alburgh, Barnard, Barre City, Barre Town, Barton, Berkshire, Bolton, Braintree, Brandon, Bridgewater, Bristol, Brookline, Canaan, Chelsea, Corinth, Cornwall, Danby, Dover, East Dorset, Enosburg, Fair Haven, Fairfax, Fairfield, Fayston, Goshen, Grafton, Granby, Grand Isle, Granville, Guilford, Hardwick, Hartland, Highgate, Hinesburg, Holland, Hubbardton, Huntington, Ira, Jericho, Lyndon, Marlboro, Marshfield, Monkton, Mount Holly, Mount Tabor, New Haven, Norton, Pawlet, Pomfret, Proctor, Reading, Richford, Richmond, Rutland City, South Burlington, Searsburg, Sharon, Shoreham, Shrewsbury, St. Johnsbury, St. Albans Town, Stamford, Starksboro, Strafford, Sudbury, Tinmouth, Topsham, Underhill, Vergennes, Waitsfield, Walden, Wardsboro, Warren, Washington, Waterbury, Waterville, Weathersfield, Wells, Westfield, Westford, Westminster, Weybridge, Williamstown, Williston, Wilmington, Winooski, Woodbury
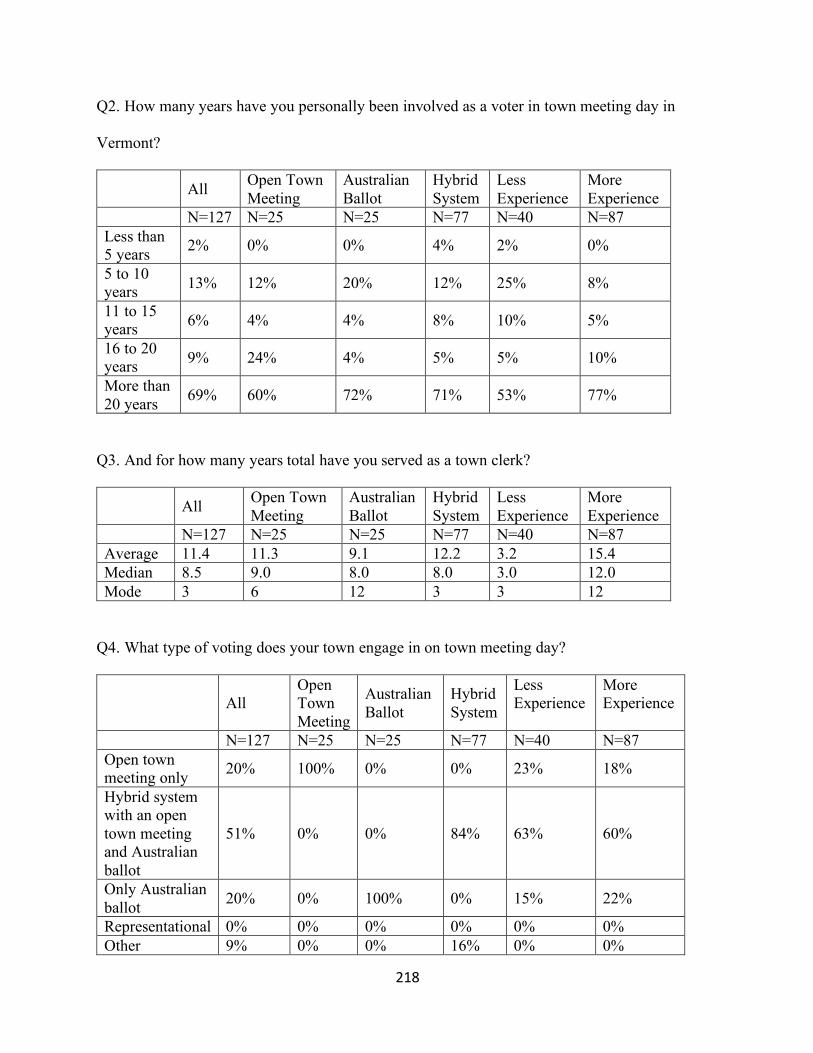
218
Q2. How many years have you personally been involved as a voter in town meeting day in
Vermont?
All Open Town Meeting
Australian Ballot
Hybrid System
Less Experience
More Experience
N=127 N=25 N=25 N=77 N=40 N=87 Less than 5 years 2% 0% 0% 4% 2% 0%
5 to 10 years 13% 12% 20% 12% 25% 8%
11 to 15 years 6% 4% 4% 8% 10% 5%
16 to 20 years 9% 24% 4% 5% 5% 10%
More than 20 years 69% 60% 72% 71% 53% 77%
Q3. And for how many years total have you served as a town clerk?
All Open Town Meeting
Australian Ballot
Hybrid System
Less Experience
More Experience
N=127 N=25 N=25 N=77 N=40 N=87 Average 11.4 11.3 9.1 12.2 3.2 15.4 Median 8.5 9.0 8.0 8.0 3.0 12.0 Mode 3 6 12 3 3 12
Q4. What type of voting does your town engage in on town meeting day?
All Open Town Meeting
Australian Ballot
Hybrid System
Less Experience
More Experience
N=127 N=25 N=25 N=77 N=40 N=87 Open town meeting only 20% 100% 0% 0% 23% 18%
Hybrid system with an open town meeting and Australian ballot
51% 0% 0% 84% 63% 60%
Only Australian ballot 20% 0% 100% 0% 15% 22%
Representational 0% 0% 0% 0% 0% 0% Other 9% 0% 0% 16% 0% 0%
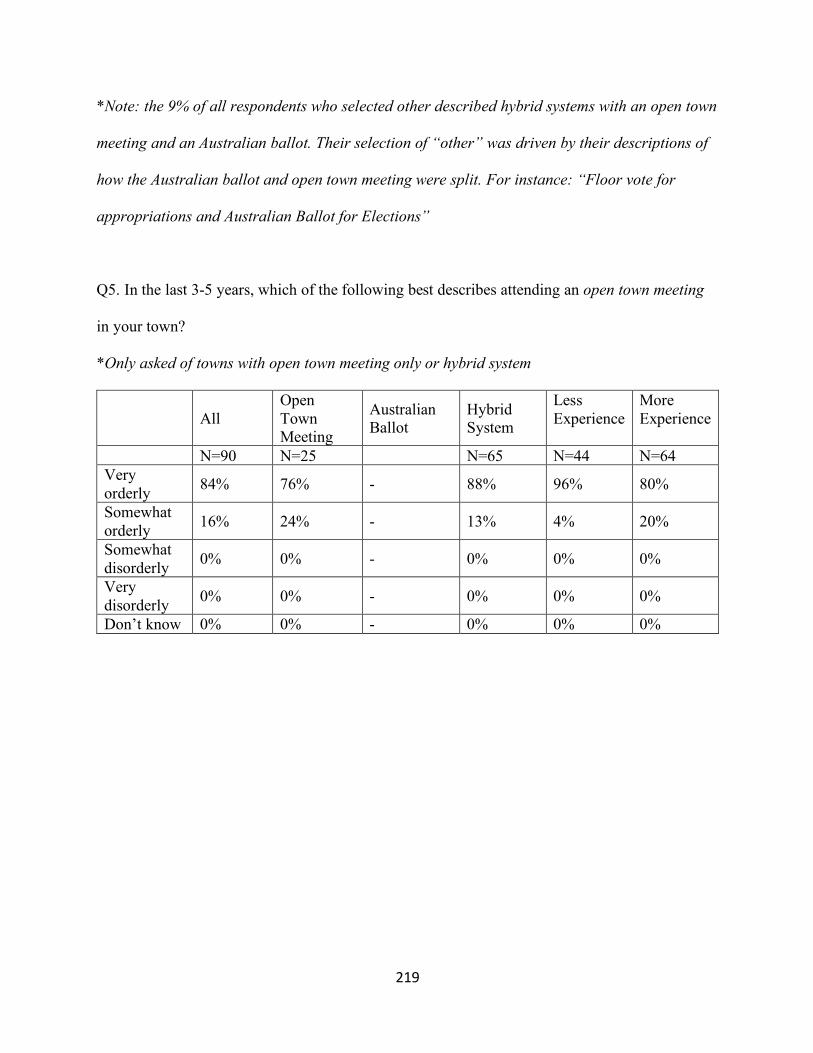
219
*Note: the 9% of all respondents who selected other described hybrid systems with an open town
meeting and an Australian ballot. Their selection of “other” was driven by their descriptions of
how the Australian ballot and open town meeting were split. For instance: “Floor vote for
appropriations and Australian Ballot for Elections”
Q5. In the last 3-5 years, which of the following best describes attending an open town meeting
in your town?
*Only asked of towns with open town meeting only or hybrid system
All
Open Town Meeting
Australian Ballot
Hybrid System
Less Experience
More Experience
N=90 N=25 N=65 N=44 N=64 Very orderly 84% 76% - 88% 96% 80%
Somewhat orderly 16% 24% - 13% 4% 20%
Somewhat disorderly 0% 0% - 0% 0% 0%
Very disorderly 0% 0% - 0% 0% 0%
Don’t know 0% 0% - 0% 0% 0%
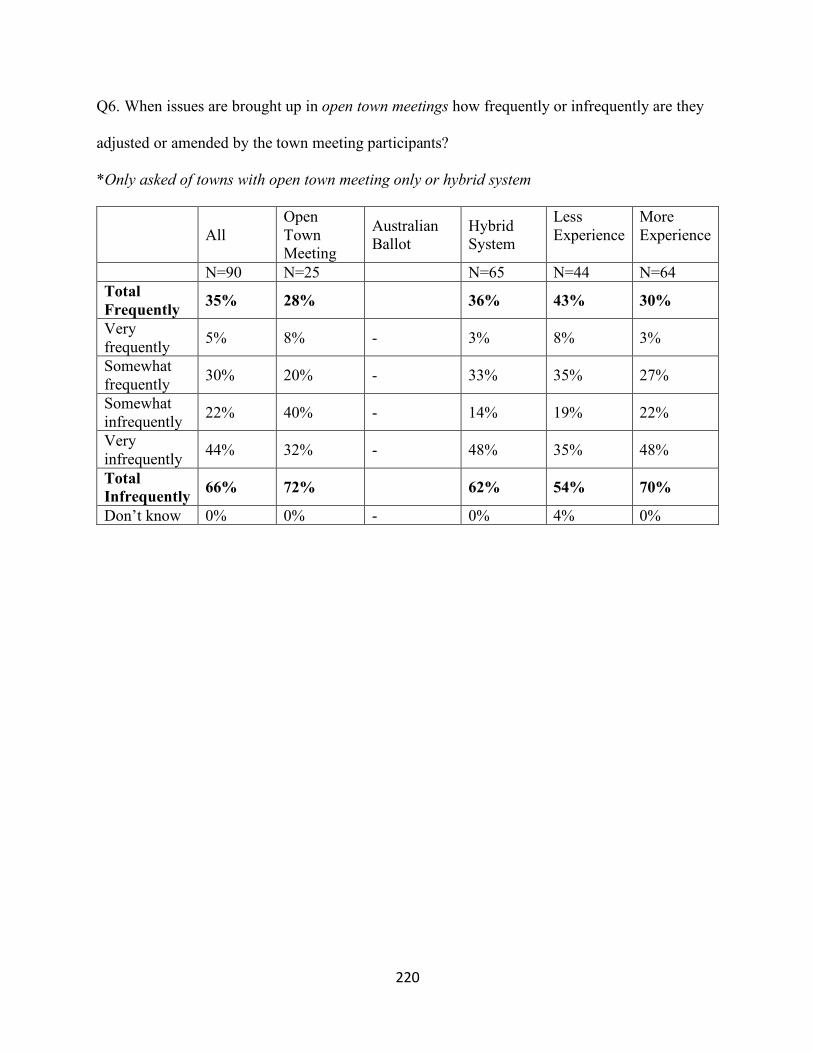
220
Q6. When issues are brought up in open town meetings how frequently or infrequently are they
adjusted or amended by the town meeting participants?
*Only asked of towns with open town meeting only or hybrid system
All
Open Town Meeting
Australian Ballot
Hybrid System
Less Experience
More Experience
N=90 N=25 N=65 N=44 N=64 Total Frequently 35% 28% 36% 43% 30%
Very frequently 5% 8% - 3% 8% 3%
Somewhat frequently 30% 20% - 33% 35% 27%
Somewhat infrequently 22% 40% - 14% 19% 22%
Very infrequently 44% 32% - 48% 35% 48%
Total Infrequently 66% 72% 62% 54% 70%
Don’t know 0% 0% - 0% 4% 0%
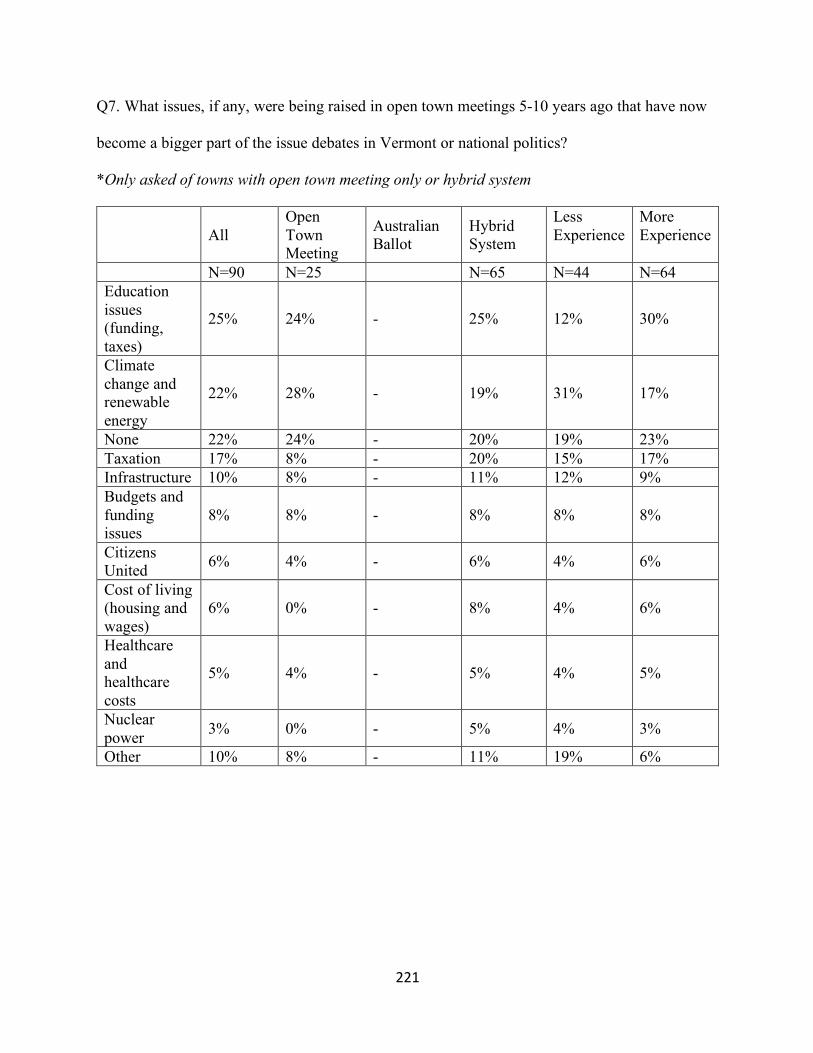
221
Q7. What issues, if any, were being raised in open town meetings 5-10 years ago that have now
become a bigger part of the issue debates in Vermont or national politics?
*Only asked of towns with open town meeting only or hybrid system
All
Open Town Meeting
Australian Ballot
Hybrid System
Less Experience
More Experience
N=90 N=25 N=65 N=44 N=64 Education issues (funding, taxes)
25% 24% - 25% 12% 30%
Climate change and renewable energy
22% 28% - 19% 31% 17%
None 22% 24% - 20% 19% 23% Taxation 17% 8% - 20% 15% 17% Infrastructure 10% 8% - 11% 12% 9% Budgets and funding issues
8% 8% - 8% 8% 8%
Citizens United 6% 4% - 6% 4% 6%
Cost of living (housing and wages)
6% 0% - 8% 4% 6%
Healthcare and healthcare costs
5% 4% - 5% 4% 5%
Nuclear power 3% 0% - 5% 4% 3%
Other 10% 8% - 11% 19% 6%
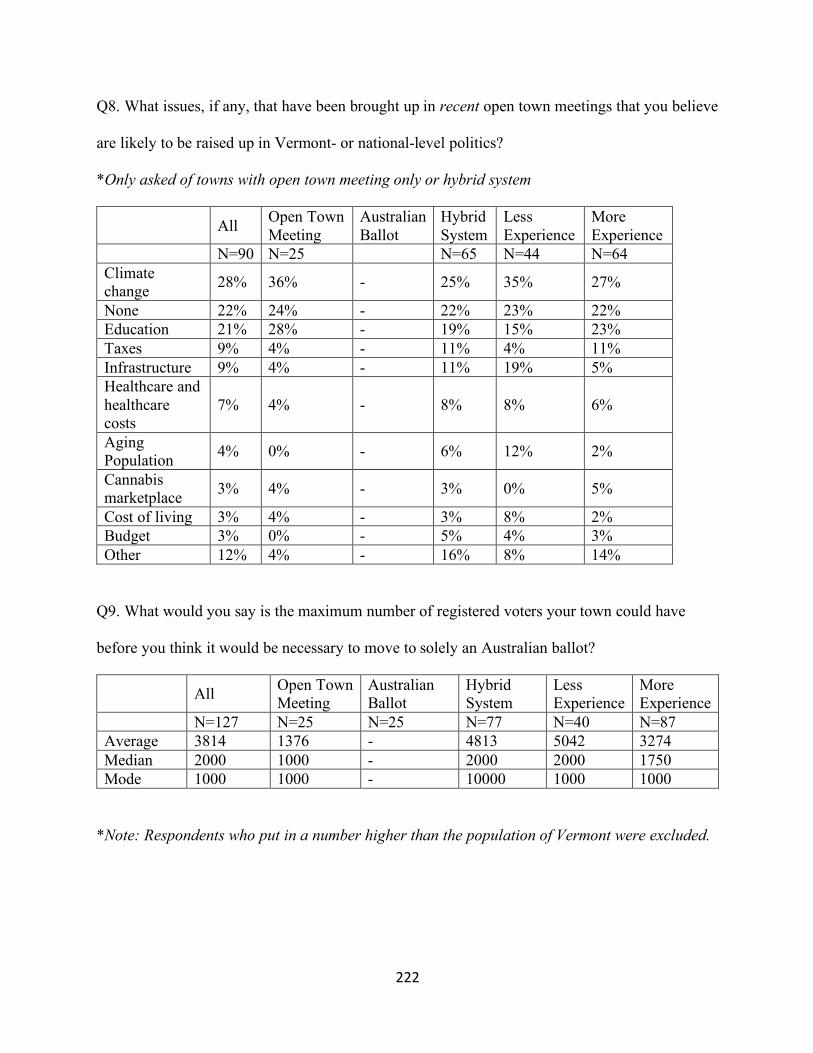
222
Q8. What issues, if any, that have been brought up in recent open town meetings that you believe
are likely to be raised up in Vermont- or national-level politics?
*Only asked of towns with open town meeting only or hybrid system
All Open Town Meeting
Australian Ballot
Hybrid System
Less Experience
More Experience
N=90 N=25 N=65 N=44 N=64 Climate change 28% 36% - 25% 35% 27%
None 22% 24% - 22% 23% 22% Education 21% 28% - 19% 15% 23% Taxes 9% 4% - 11% 4% 11% Infrastructure 9% 4% - 11% 19% 5% Healthcare and healthcare costs
7% 4% - 8% 8% 6%
Aging Population 4% 0% - 6% 12% 2%
Cannabis marketplace 3% 4% - 3% 0% 5%
Cost of living 3% 4% - 3% 8% 2% Budget 3% 0% - 5% 4% 3% Other 12% 4% - 16% 8% 14%
Q9. What would you say is the maximum number of registered voters your town could have
before you think it would be necessary to move to solely an Australian ballot?
All Open Town Meeting
Australian Ballot
Hybrid System
Less Experience
More Experience
N=127 N=25 N=25 N=77 N=40 N=87 Average 3814 1376 - 4813 5042 3274 Median 2000 1000 - 2000 2000 1750 Mode 1000 1000 - 10000 1000 1000
*Note: Respondents who put in a number higher than the population of Vermont were excluded.
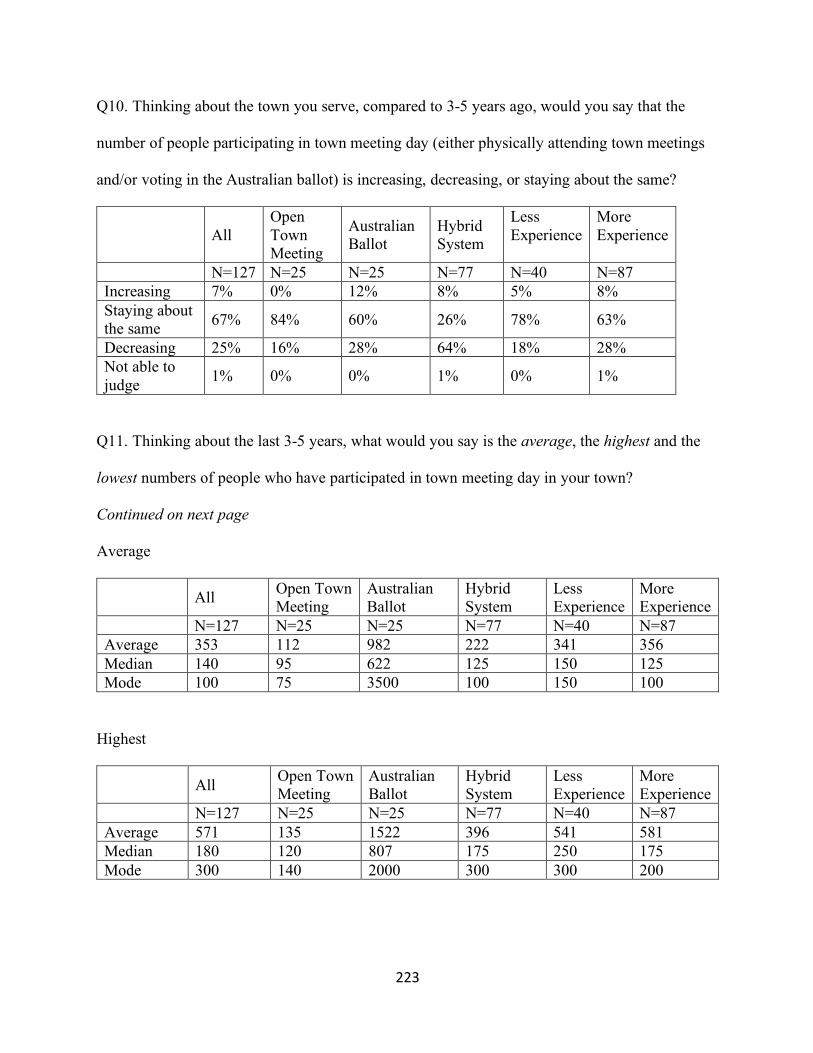
223
Q10. Thinking about the town you serve, compared to 3-5 years ago, would you say that the
number of people participating in town meeting day (either physically attending town meetings
and/or voting in the Australian ballot) is increasing, decreasing, or staying about the same?
All
Open Town Meeting
Australian Ballot
Hybrid System
Less Experience
More Experience
N=127 N=25 N=25 N=77 N=40 N=87 Increasing 7% 0% 12% 8% 5% 8% Staying about the same 67% 84% 60% 26% 78% 63%
Decreasing 25% 16% 28% 64% 18% 28% Not able to judge 1% 0% 0% 1% 0% 1%
Q11. Thinking about the last 3-5 years, what would you say is the average, the highest and the
lowest numbers of people who have participated in town meeting day in your town?
Continued on next page
Average
All Open Town Meeting
Australian Ballot
Hybrid System
Less Experience
More Experience
N=127 N=25 N=25 N=77 N=40 N=87 Average 353 112 982 222 341 356 Median 140 95 622 125 150 125 Mode 100 75 3500 100 150 100
Highest
All Open Town Meeting
Australian Ballot
Hybrid System
Less Experience
More Experience
N=127 N=25 N=25 N=77 N=40 N=87 Average 571 135 1522 396 541 581 Median 180 120 807 175 250 175 Mode 300 140 2000 300 300 200
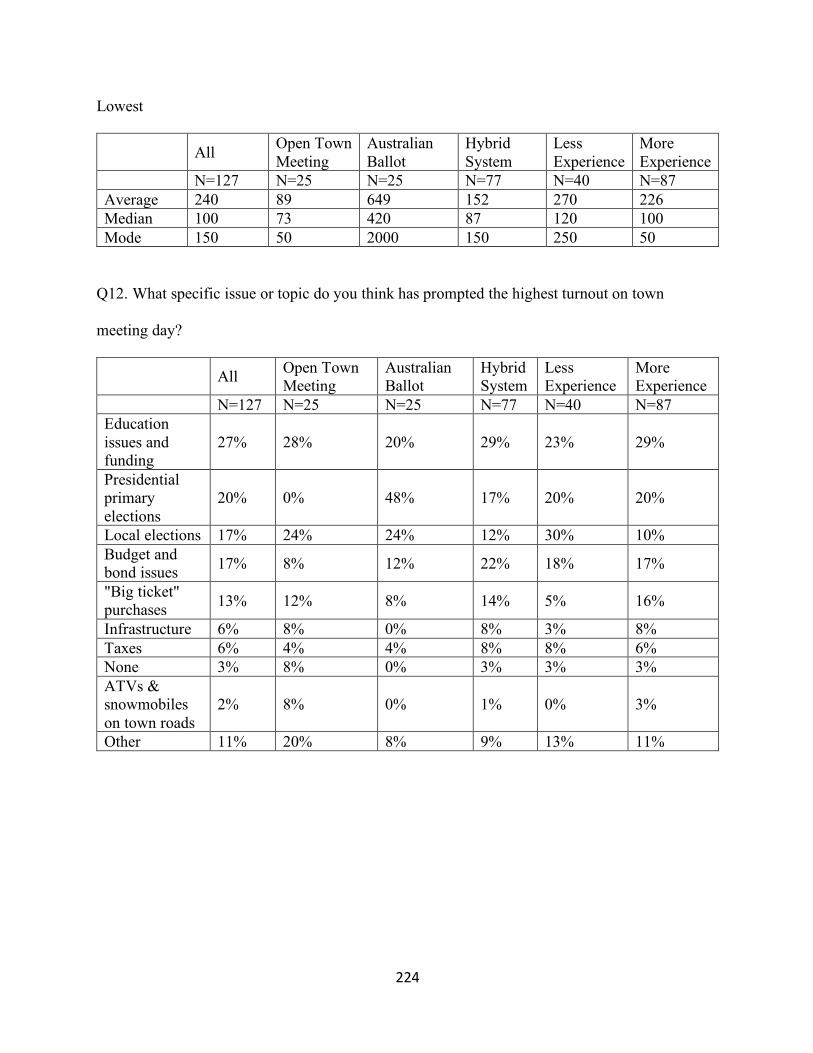
224
Lowest
All Open Town Meeting
Australian Ballot
Hybrid System
Less Experience
More Experience
N=127 N=25 N=25 N=77 N=40 N=87 Average 240 89 649 152 270 226 Median 100 73 420 87 120 100 Mode 150 50 2000 150 250 50
Q12. What specific issue or topic do you think has prompted the highest turnout on town
meeting day?
All Open Town Meeting
Australian Ballot
Hybrid System
Less Experience
More Experience
N=127 N=25 N=25 N=77 N=40 N=87 Education issues and funding
27% 28% 20% 29% 23% 29%
Presidential primary elections
20% 0% 48% 17% 20% 20%
Local elections 17% 24% 24% 12% 30% 10% Budget and bond issues 17% 8% 12% 22% 18% 17%
"Big ticket" purchases 13% 12% 8% 14% 5% 16%
Infrastructure 6% 8% 0% 8% 3% 8% Taxes 6% 4% 4% 8% 8% 6% None 3% 8% 0% 3% 3% 3% ATVs & snowmobiles on town roads
2% 8% 0% 1% 0% 3%
Other 11% 20% 8% 9% 13% 11%
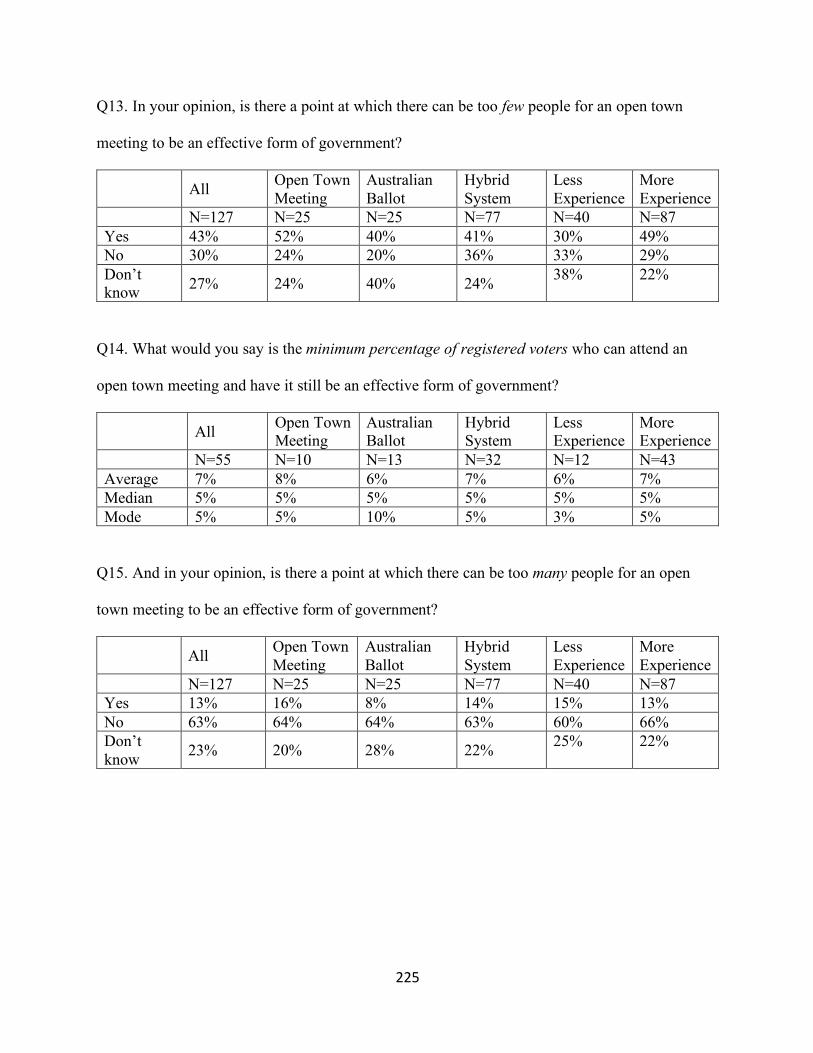
225
Q13. In your opinion, is there a point at which there can be too few people for an open town
meeting to be an effective form of government?
All Open Town Meeting
Australian Ballot
Hybrid System
Less Experience
More Experience
N=127 N=25 N=25 N=77 N=40 N=87 Yes 43% 52% 40% 41% 30% 49% No 30% 24% 20% 36% 33% 29% Don’t know 27% 24% 40% 24% 38% 22%
Q14. What would you say is the minimum percentage of registered voters who can attend an
open town meeting and have it still be an effective form of government?
All Open Town Meeting
Australian Ballot
Hybrid System
Less Experience
More Experience
N=55 N=10 N=13 N=32 N=12 N=43 Average 7% 8% 6% 7% 6% 7% Median 5% 5% 5% 5% 5% 5% Mode 5% 5% 10% 5% 3% 5%
Q15. And in your opinion, is there a point at which there can be too many people for an open
town meeting to be an effective form of government?
All Open Town Meeting
Australian Ballot
Hybrid System
Less Experience
More Experience
N=127 N=25 N=25 N=77 N=40 N=87 Yes 13% 16% 8% 14% 15% 13% No 63% 64% 64% 63% 60% 66% Don’t know 23% 20% 28% 22% 25% 22%
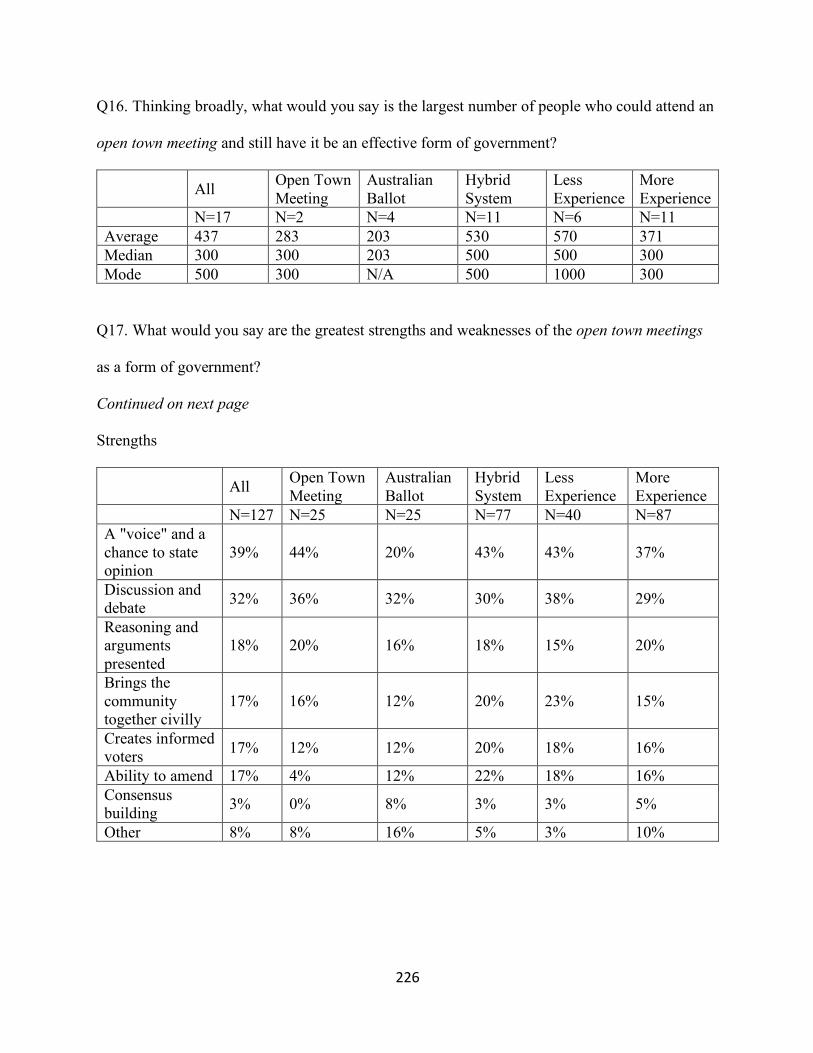
226
Q16. Thinking broadly, what would you say is the largest number of people who could attend an
open town meeting and still have it be an effective form of government?
All Open Town Meeting
Australian Ballot
Hybrid System
Less Experience
More Experience
N=17 N=2 N=4 N=11 N=6 N=11 Average 437 283 203 530 570 371 Median 300 300 203 500 500 300 Mode 500 300 N/A 500 1000 300
Q17. What would you say are the greatest strengths and weaknesses of the open town meetings
as a form of government?
Continued on next page
Strengths
All Open Town Meeting
Australian Ballot
Hybrid System
Less Experience
More Experience
N=127 N=25 N=25 N=77 N=40 N=87 A "voice" and a chance to state opinion
39% 44% 20% 43% 43% 37%
Discussion and debate 32% 36% 32% 30% 38% 29%
Reasoning and arguments presented
18% 20% 16% 18% 15% 20%
Brings the community together civilly
17% 16% 12% 20% 23% 15%
Creates informed voters 17% 12% 12% 20% 18% 16%
Ability to amend 17% 4% 12% 22% 18% 16% Consensus building 3% 0% 8% 3% 3% 5%
Other 8% 8% 16% 5% 3% 10%
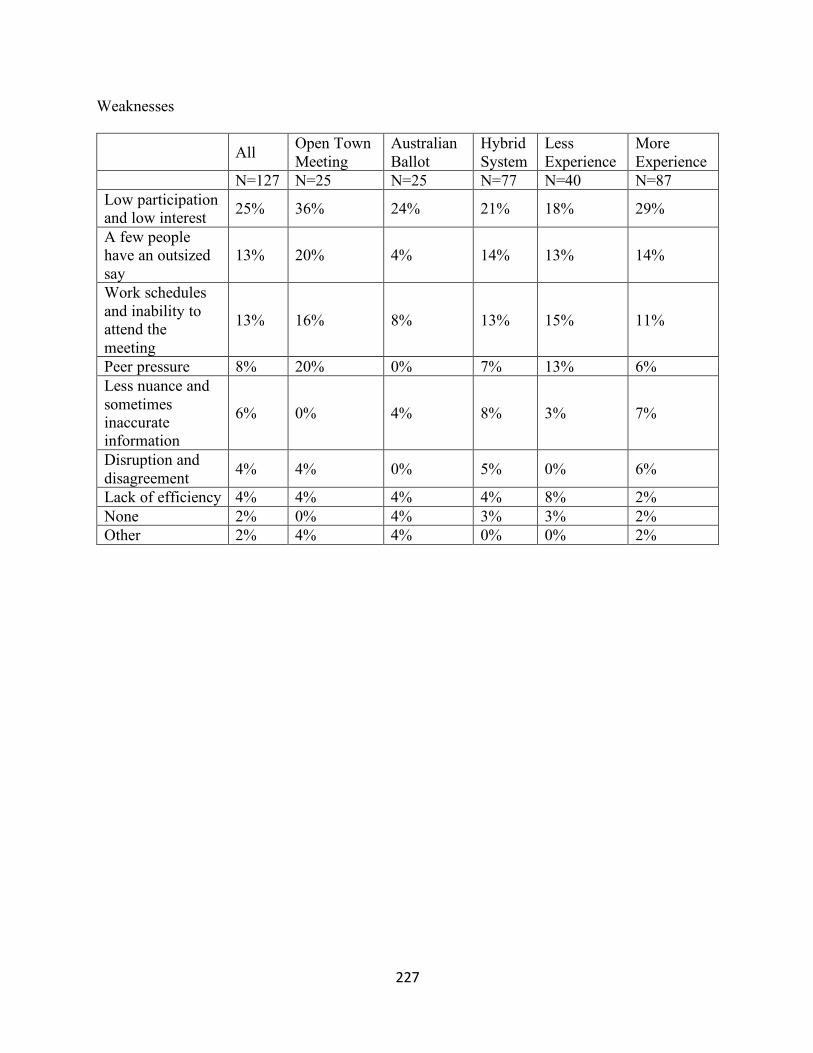
227
Weaknesses
All Open Town Meeting
Australian Ballot
Hybrid System
Less Experience
More Experience
N=127 N=25 N=25 N=77 N=40 N=87 Low participation and low interest 25% 36% 24% 21% 18% 29%
A few people have an outsized say
13% 20% 4% 14% 13% 14%
Work schedules and inability to attend the meeting
13% 16% 8% 13% 15% 11%
Peer pressure 8% 20% 0% 7% 13% 6% Less nuance and sometimes inaccurate information
6% 0% 4% 8% 3% 7%
Disruption and disagreement 4% 4% 0% 5% 0% 6%
Lack of efficiency 4% 4% 4% 4% 8% 2% None 2% 0% 4% 3% 3% 2% Other 2% 4% 4% 0% 0% 2%
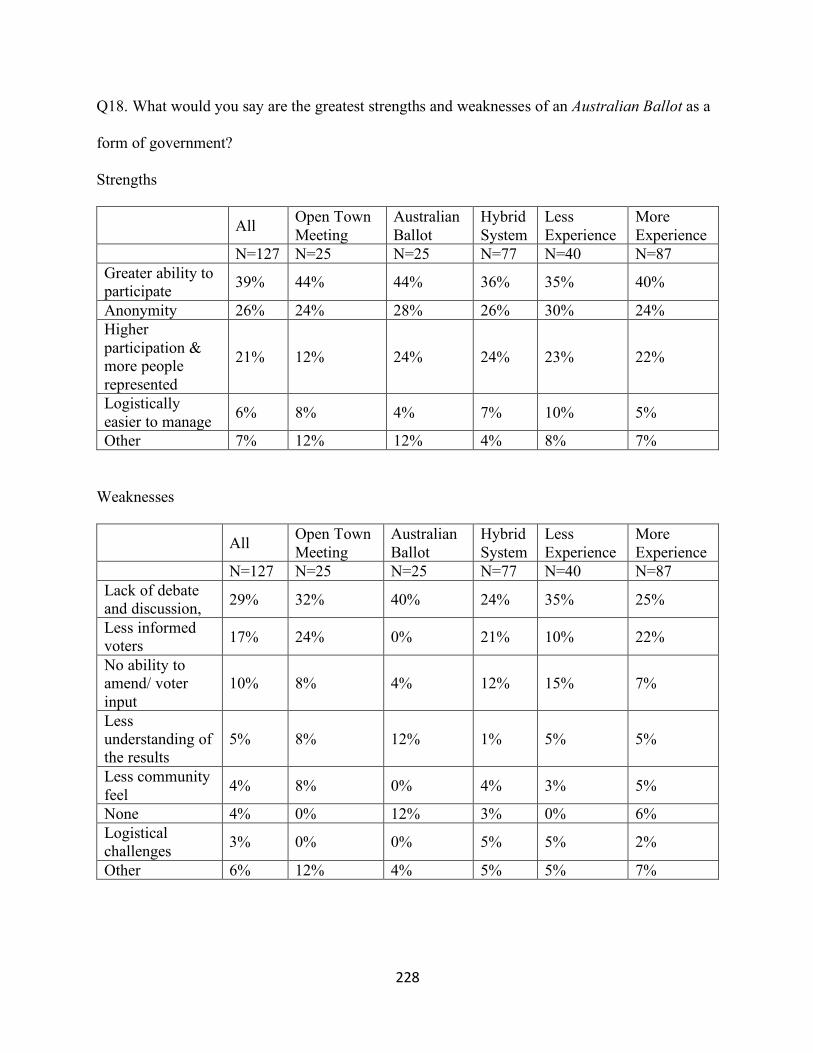
228
Q18. What would you say are the greatest strengths and weaknesses of an Australian Ballot as a
form of government?
Strengths
All Open Town Meeting
Australian Ballot
Hybrid System
Less Experience
More Experience
N=127 N=25 N=25 N=77 N=40 N=87 Greater ability to participate 39% 44% 44% 36% 35% 40%
Anonymity 26% 24% 28% 26% 30% 24% Higher participation & more people represented
21% 12% 24% 24% 23% 22%
Logistically easier to manage 6% 8% 4% 7% 10% 5%
Other 7% 12% 12% 4% 8% 7%
Weaknesses
All Open Town Meeting
Australian Ballot
Hybrid System
Less Experience
More Experience
N=127 N=25 N=25 N=77 N=40 N=87 Lack of debate and discussion, 29% 32% 40% 24% 35% 25%
Less informed voters 17% 24% 0% 21% 10% 22%
No ability to amend/ voter input
10% 8% 4% 12% 15% 7%
Less understanding of the results
5% 8% 12% 1% 5% 5%
Less community feel 4% 8% 0% 4% 3% 5%
None 4% 0% 12% 3% 0% 6% Logistical challenges 3% 0% 0% 5% 5% 2%
Other 6% 12% 4% 5% 5% 7%
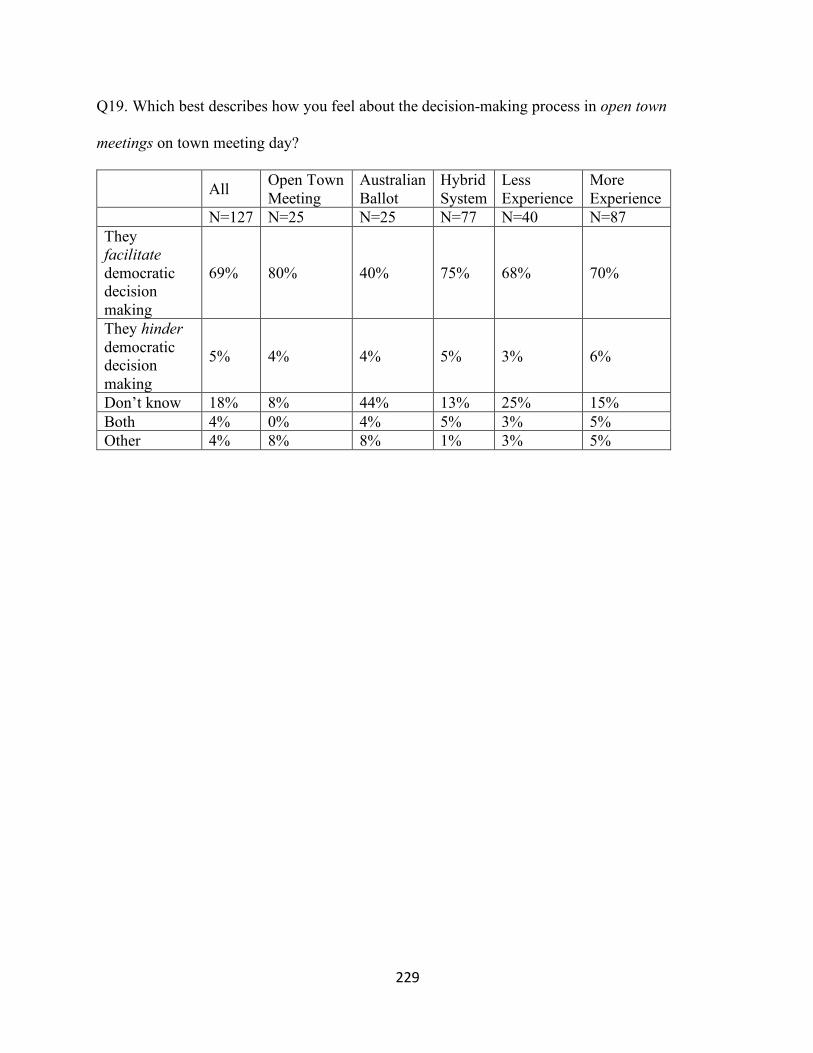
229
Q19. Which best describes how you feel about the decision-making process in open town
meetings on town meeting day?
All Open Town Meeting
Australian Ballot
Hybrid System
Less Experience
More Experience
N=127 N=25 N=25 N=77 N=40 N=87 They facilitate democratic decision making
69% 80% 40% 75% 68% 70%
They hinder democratic decision making
5% 4% 4% 5% 3% 6%
Don’t know 18% 8% 44% 13% 25% 15% Both 4% 0% 4% 5% 3% 5% Other 4% 8% 8% 1% 3% 5%
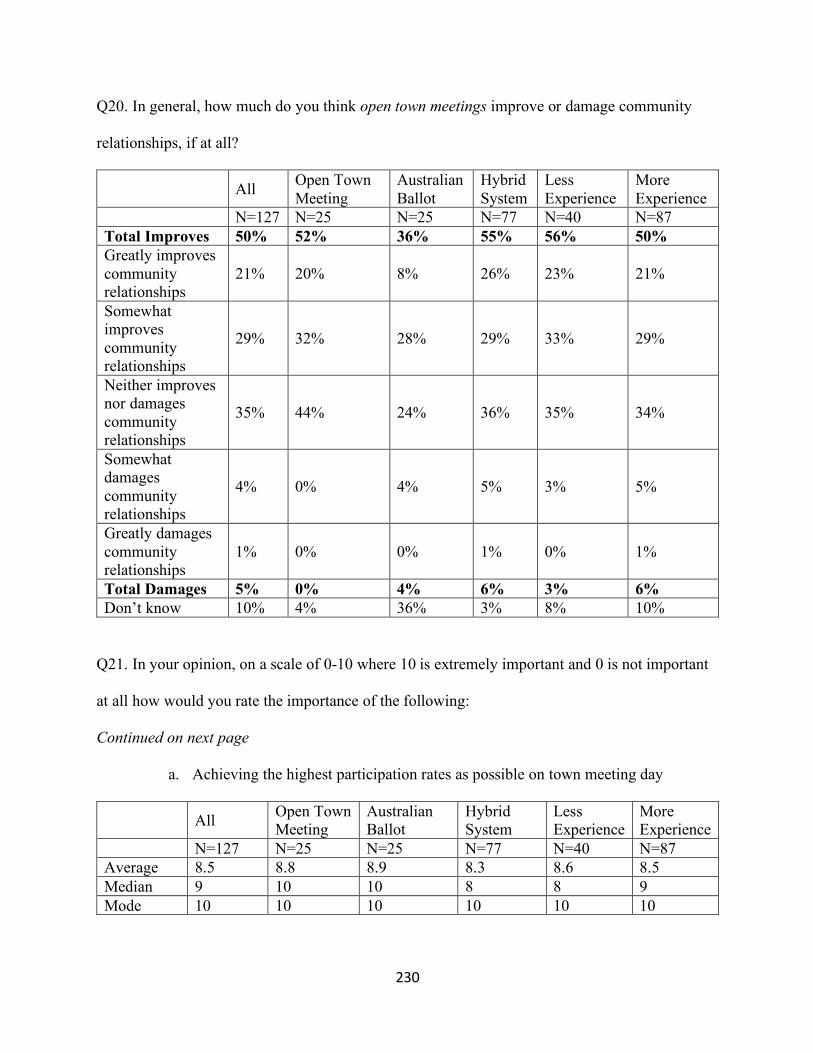
230
Q20. In general, how much do you think open town meetings improve or damage community
relationships, if at all?
All Open Town Meeting
Australian Ballot
Hybrid System
Less Experience
More Experience
N=127 N=25 N=25 N=77 N=40 N=87 Total Improves 50% 52% 36% 55% 56% 50% Greatly improves community relationships
21% 20% 8% 26% 23% 21%
Somewhat improves community relationships
29% 32% 28% 29% 33% 29%
Neither improves nor damages community relationships
35% 44% 24% 36% 35% 34%
Somewhat damages community relationships
4% 0% 4% 5% 3% 5%
Greatly damages community relationships
1% 0% 0% 1% 0% 1%
Total Damages 5% 0% 4% 6% 3% 6% Don’t know 10% 4% 36% 3% 8% 10%
Q21. In your opinion, on a scale of 0-10 where 10 is extremely important and 0 is not important
at all how would you rate the importance of the following:
Continued on next page
a. Achieving the highest participation rates as possible on town meeting day
All Open Town Meeting
Australian Ballot
Hybrid System
Less Experience
More Experience
N=127 N=25 N=25 N=77 N=40 N=87 Average 8.5 8.8 8.9 8.3 8.6 8.5 Median 9 10 10 8 8 9 Mode 10 10 10 10 10 10
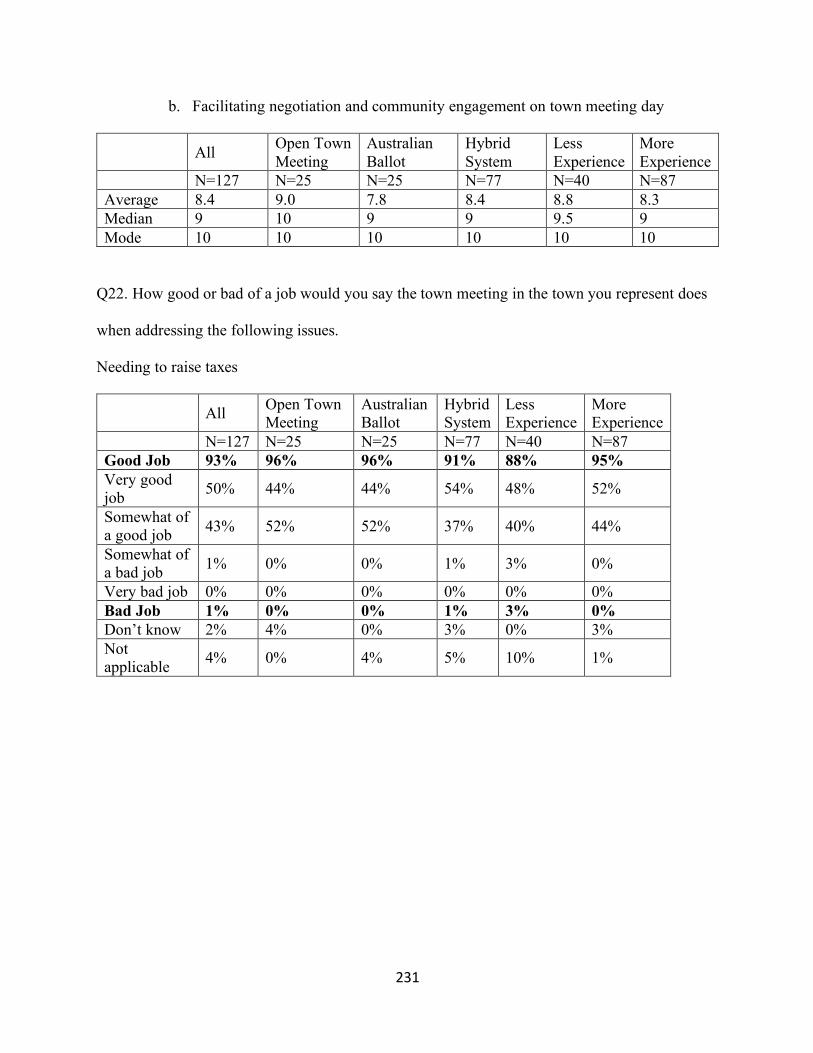
231
b. Facilitating negotiation and community engagement on town meeting day
All Open Town Meeting
Australian Ballot
Hybrid System
Less Experience
More Experience
N=127 N=25 N=25 N=77 N=40 N=87 Average 8.4 9.0 7.8 8.4 8.8 8.3 Median 9 10 9 9 9.5 9 Mode 10 10 10 10 10 10
Q22. How good or bad of a job would you say the town meeting in the town you represent does
when addressing the following issues.
Needing to raise taxes
All Open Town Meeting
Australian Ballot
Hybrid System
Less Experience
More Experience
N=127 N=25 N=25 N=77 N=40 N=87 Good Job 93% 96% 96% 91% 88% 95% Very good job 50% 44% 44% 54% 48% 52%
Somewhat of a good job 43% 52% 52% 37% 40% 44%
Somewhat of a bad job 1% 0% 0% 1% 3% 0%
Very bad job 0% 0% 0% 0% 0% 0% Bad Job 1% 0% 0% 1% 3% 0% Don’t know 2% 4% 0% 3% 0% 3% Not applicable 4% 0% 4% 5% 10% 1%
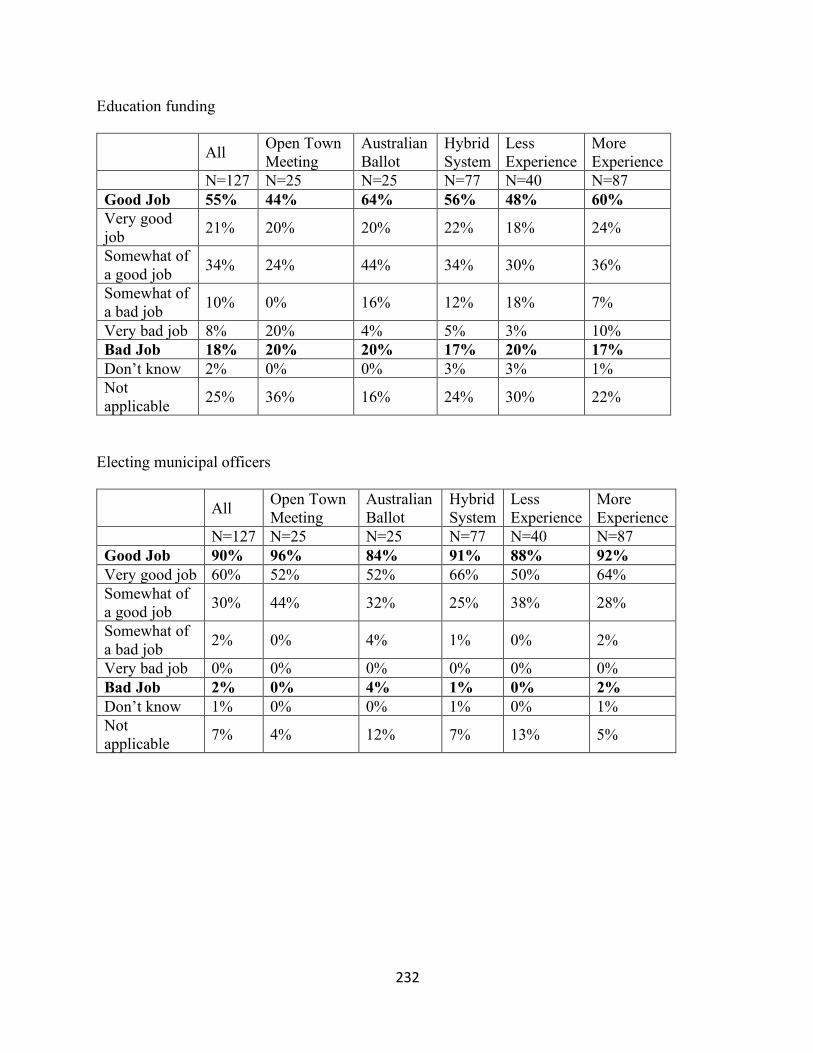
232
Education funding
All Open Town Meeting
Australian Ballot
Hybrid System
Less Experience
More Experience
N=127 N=25 N=25 N=77 N=40 N=87 Good Job 55% 44% 64% 56% 48% 60% Very good job 21% 20% 20% 22% 18% 24%
Somewhat of a good job 34% 24% 44% 34% 30% 36%
Somewhat of a bad job 10% 0% 16% 12% 18% 7%
Very bad job 8% 20% 4% 5% 3% 10% Bad Job 18% 20% 20% 17% 20% 17% Don’t know 2% 0% 0% 3% 3% 1% Not applicable 25% 36% 16% 24% 30% 22%
Electing municipal officers
All Open Town Meeting
Australian Ballot
Hybrid System
Less Experience
More Experience
N=127 N=25 N=25 N=77 N=40 N=87 Good Job 90% 96% 84% 91% 88% 92% Very good job 60% 52% 52% 66% 50% 64% Somewhat of a good job 30% 44% 32% 25% 38% 28%
Somewhat of a bad job 2% 0% 4% 1% 0% 2%
Very bad job 0% 0% 0% 0% 0% 0% Bad Job 2% 0% 4% 1% 0% 2% Don’t know 1% 0% 0% 1% 0% 1% Not applicable 7% 4% 12% 7% 13% 5%
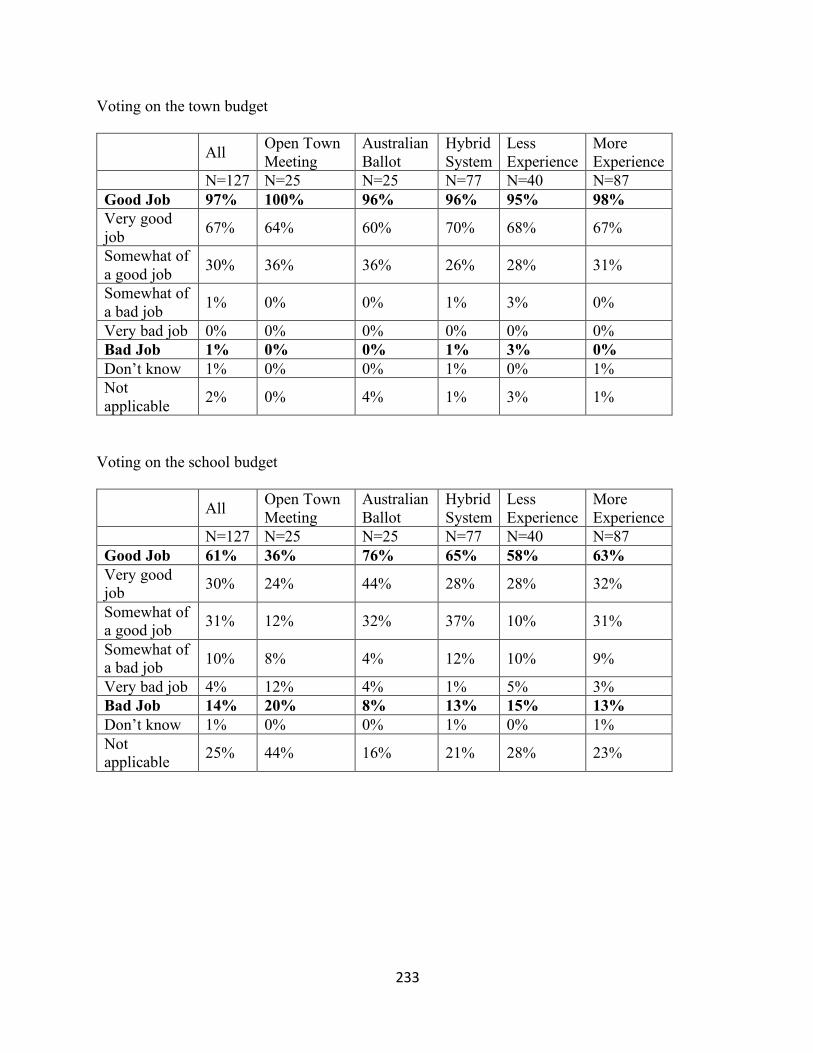
233
Voting on the town budget
All Open Town Meeting
Australian Ballot
Hybrid System
Less Experience
More Experience
N=127 N=25 N=25 N=77 N=40 N=87 Good Job 97% 100% 96% 96% 95% 98% Very good job 67% 64% 60% 70% 68% 67%
Somewhat of a good job 30% 36% 36% 26% 28% 31%
Somewhat of a bad job 1% 0% 0% 1% 3% 0%
Very bad job 0% 0% 0% 0% 0% 0% Bad Job 1% 0% 0% 1% 3% 0% Don’t know 1% 0% 0% 1% 0% 1% Not applicable 2% 0% 4% 1% 3% 1%
Voting on the school budget
All Open Town Meeting
Australian Ballot
Hybrid System
Less Experience
More Experience
N=127 N=25 N=25 N=77 N=40 N=87 Good Job 61% 36% 76% 65% 58% 63% Very good job 30% 24% 44% 28% 28% 32%
Somewhat of a good job 31% 12% 32% 37% 10% 31%
Somewhat of a bad job 10% 8% 4% 12% 10% 9%
Very bad job 4% 12% 4% 1% 5% 3% Bad Job 14% 20% 8% 13% 15% 13% Don’t know 1% 0% 0% 1% 0% 1% Not applicable 25% 44% 16% 21% 28% 23%
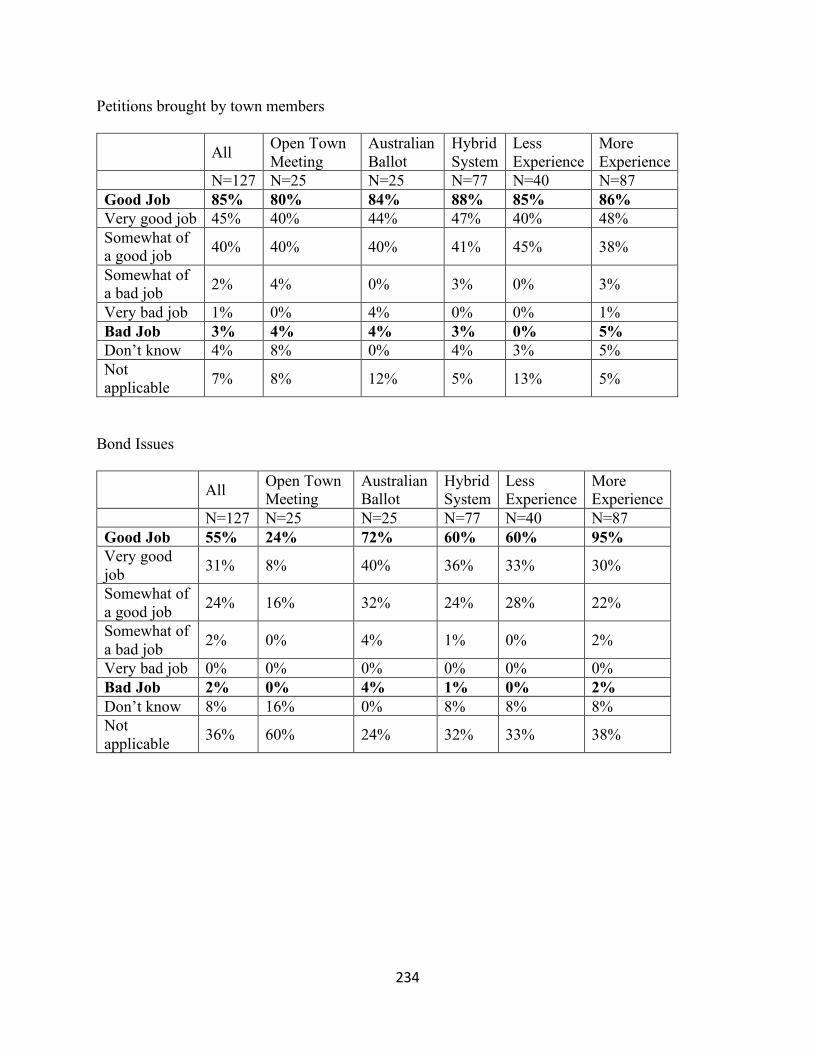
234
Petitions brought by town members
All Open Town Meeting
Australian Ballot
Hybrid System
Less Experience
More Experience
N=127 N=25 N=25 N=77 N=40 N=87 Good Job 85% 80% 84% 88% 85% 86% Very good job 45% 40% 44% 47% 40% 48% Somewhat of a good job 40% 40% 40% 41% 45% 38%
Somewhat of a bad job 2% 4% 0% 3% 0% 3%
Very bad job 1% 0% 4% 0% 0% 1% Bad Job 3% 4% 4% 3% 0% 5% Don’t know 4% 8% 0% 4% 3% 5% Not applicable 7% 8% 12% 5% 13% 5%
Bond Issues
All Open Town Meeting
Australian Ballot
Hybrid System
Less Experience
More Experience
N=127 N=25 N=25 N=77 N=40 N=87 Good Job 55% 24% 72% 60% 60% 95% Very good job 31% 8% 40% 36% 33% 30%
Somewhat of a good job 24% 16% 32% 24% 28% 22%
Somewhat of a bad job 2% 0% 4% 1% 0% 2%
Very bad job 0% 0% 0% 0% 0% 0% Bad Job 2% 0% 4% 1% 0% 2% Don’t know 8% 16% 0% 8% 8% 8% Not applicable 36% 60% 24% 32% 33% 38%
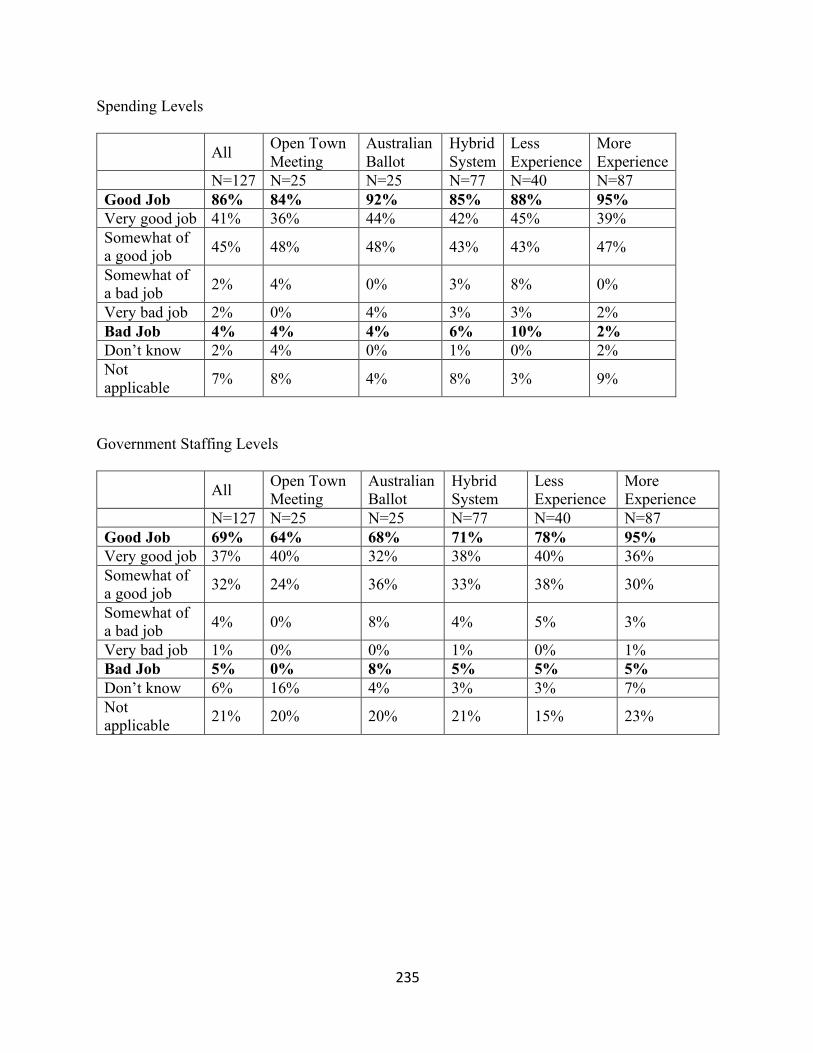
235
Spending Levels
All Open Town Meeting
Australian Ballot
Hybrid System
Less Experience
More Experience
N=127 N=25 N=25 N=77 N=40 N=87 Good Job 86% 84% 92% 85% 88% 95% Very good job 41% 36% 44% 42% 45% 39% Somewhat of a good job 45% 48% 48% 43% 43% 47%
Somewhat of a bad job 2% 4% 0% 3% 8% 0%
Very bad job 2% 0% 4% 3% 3% 2% Bad Job 4% 4% 4% 6% 10% 2% Don’t know 2% 4% 0% 1% 0% 2% Not applicable 7% 8% 4% 8% 3% 9%
Government Staffing Levels
All Open Town Meeting
Australian Ballot
Hybrid System
Less Experience
More Experience
N=127 N=25 N=25 N=77 N=40 N=87 Good Job 69% 64% 68% 71% 78% 95% Very good job 37% 40% 32% 38% 40% 36% Somewhat of a good job 32% 24% 36% 33% 38% 30%
Somewhat of a bad job 4% 0% 8% 4% 5% 3%
Very bad job 1% 0% 0% 1% 0% 1% Bad Job 5% 0% 8% 5% 5% 5% Don’t know 6% 16% 4% 3% 3% 7% Not applicable 21% 20% 20% 21% 15% 23%
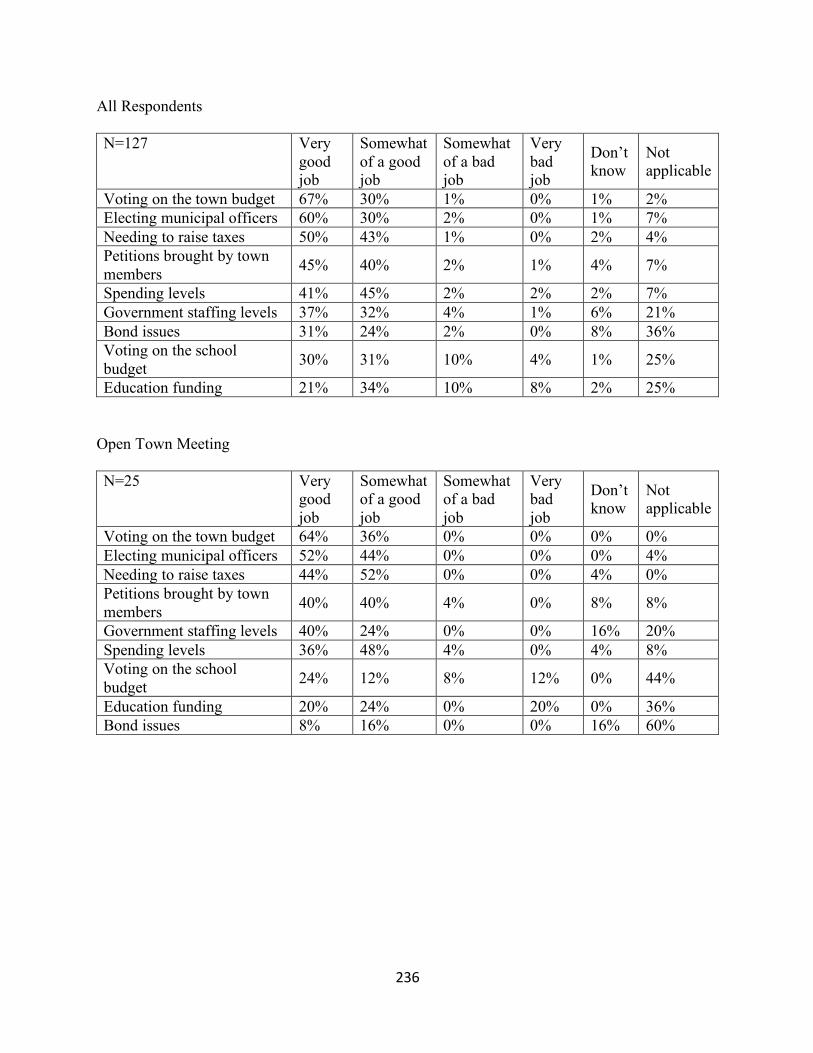
236
All Respondents
N=127 Very good job
Somewhat of a good job
Somewhat of a bad job
Very bad job
Don’t know
Not applicable
Voting on the town budget 67% 30% 1% 0% 1% 2% Electing municipal officers 60% 30% 2% 0% 1% 7% Needing to raise taxes 50% 43% 1% 0% 2% 4% Petitions brought by town members 45% 40% 2% 1% 4% 7%
Spending levels 41% 45% 2% 2% 2% 7% Government staffing levels 37% 32% 4% 1% 6% 21% Bond issues 31% 24% 2% 0% 8% 36% Voting on the school budget 30% 31% 10% 4% 1% 25%
Education funding 21% 34% 10% 8% 2% 25%
Open Town Meeting
N=25 Very good job
Somewhat of a good job
Somewhat of a bad job
Very bad job
Don’t know
Not applicable
Voting on the town budget 64% 36% 0% 0% 0% 0% Electing municipal officers 52% 44% 0% 0% 0% 4% Needing to raise taxes 44% 52% 0% 0% 4% 0% Petitions brought by town members 40% 40% 4% 0% 8% 8%
Government staffing levels 40% 24% 0% 0% 16% 20% Spending levels 36% 48% 4% 0% 4% 8% Voting on the school budget 24% 12% 8% 12% 0% 44%
Education funding 20% 24% 0% 20% 0% 36% Bond issues 8% 16% 0% 0% 16% 60%
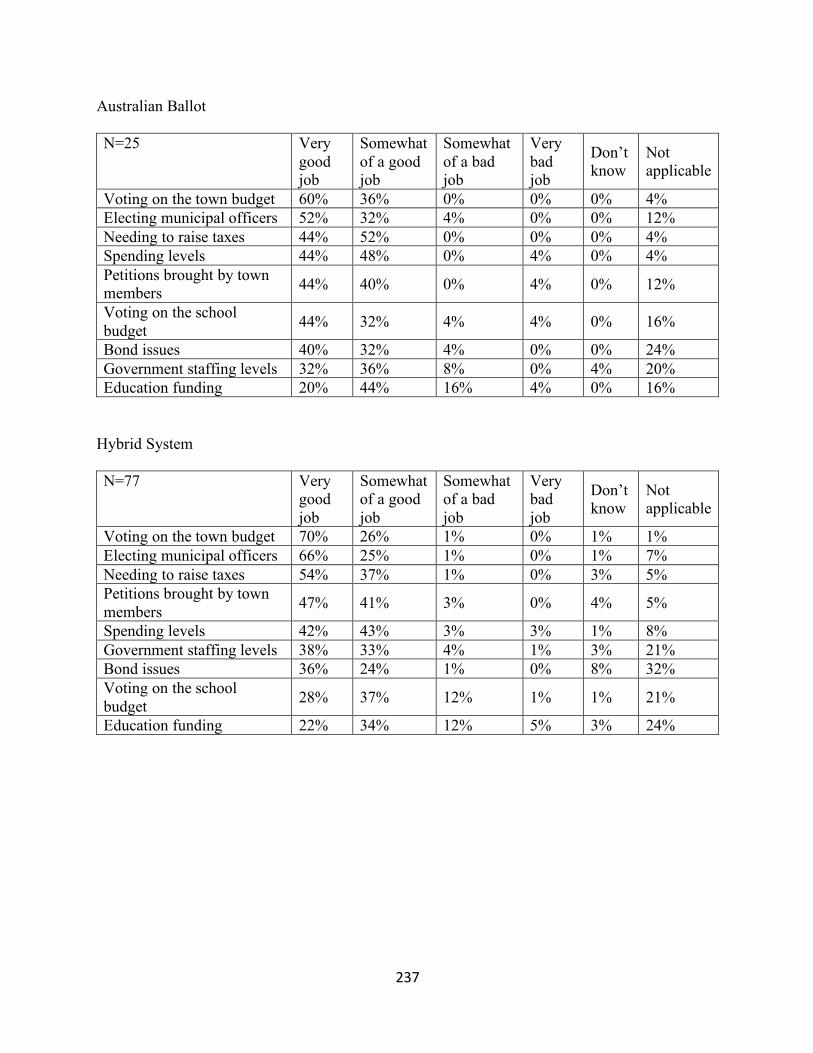
237
Australian Ballot
N=25 Very good job
Somewhat of a good job
Somewhat of a bad job
Very bad job
Don’t know
Not applicable
Voting on the town budget 60% 36% 0% 0% 0% 4% Electing municipal officers 52% 32% 4% 0% 0% 12% Needing to raise taxes 44% 52% 0% 0% 0% 4% Spending levels 44% 48% 0% 4% 0% 4% Petitions brought by town members 44% 40% 0% 4% 0% 12%
Voting on the school budget 44% 32% 4% 4% 0% 16%
Bond issues 40% 32% 4% 0% 0% 24% Government staffing levels 32% 36% 8% 0% 4% 20% Education funding 20% 44% 16% 4% 0% 16%
Hybrid System
N=77 Very good job
Somewhat of a good job
Somewhat of a bad job
Very bad job
Don’t know
Not applicable
Voting on the town budget 70% 26% 1% 0% 1% 1% Electing municipal officers 66% 25% 1% 0% 1% 7% Needing to raise taxes 54% 37% 1% 0% 3% 5% Petitions brought by town members 47% 41% 3% 0% 4% 5%
Spending levels 42% 43% 3% 3% 1% 8% Government staffing levels 38% 33% 4% 1% 3% 21% Bond issues 36% 24% 1% 0% 8% 32% Voting on the school budget 28% 37% 12% 1% 1% 21%
Education funding 22% 34% 12% 5% 3% 24%
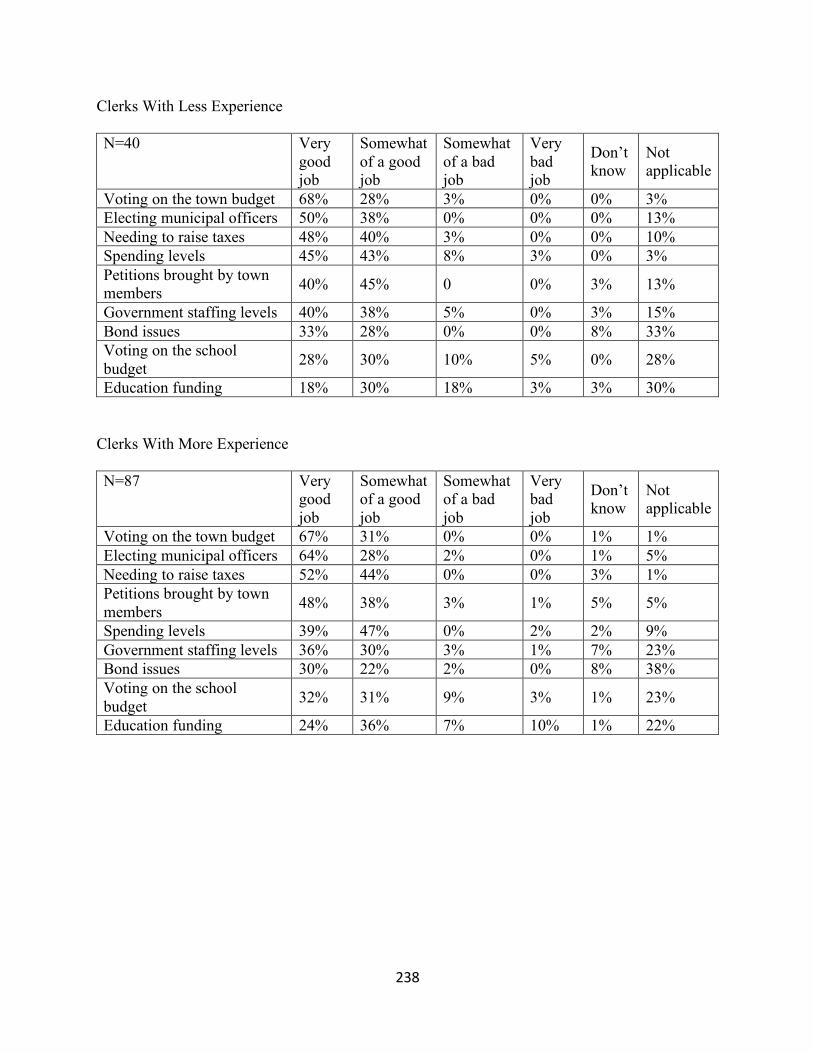
238
Clerks With Less Experience
N=40 Very good job
Somewhat of a good job
Somewhat of a bad job
Very bad job
Don’t know
Not applicable
Voting on the town budget 68% 28% 3% 0% 0% 3% Electing municipal officers 50% 38% 0% 0% 0% 13% Needing to raise taxes 48% 40% 3% 0% 0% 10% Spending levels 45% 43% 8% 3% 0% 3% Petitions brought by town members 40% 45% 0 0% 3% 13%
Government staffing levels 40% 38% 5% 0% 3% 15% Bond issues 33% 28% 0% 0% 8% 33% Voting on the school budget 28% 30% 10% 5% 0% 28%
Education funding 18% 30% 18% 3% 3% 30%
Clerks With More Experience
N=87 Very good job
Somewhat of a good job
Somewhat of a bad job
Very bad job
Don’t know
Not applicable
Voting on the town budget 67% 31% 0% 0% 1% 1% Electing municipal officers 64% 28% 2% 0% 1% 5% Needing to raise taxes 52% 44% 0% 0% 3% 1% Petitions brought by town members 48% 38% 3% 1% 5% 5%
Spending levels 39% 47% 0% 2% 2% 9% Government staffing levels 36% 30% 3% 1% 7% 23% Bond issues 30% 22% 2% 0% 8% 38% Voting on the school budget 32% 31% 9% 3% 1% 23%
Education funding 24% 36% 7% 10% 1% 22%
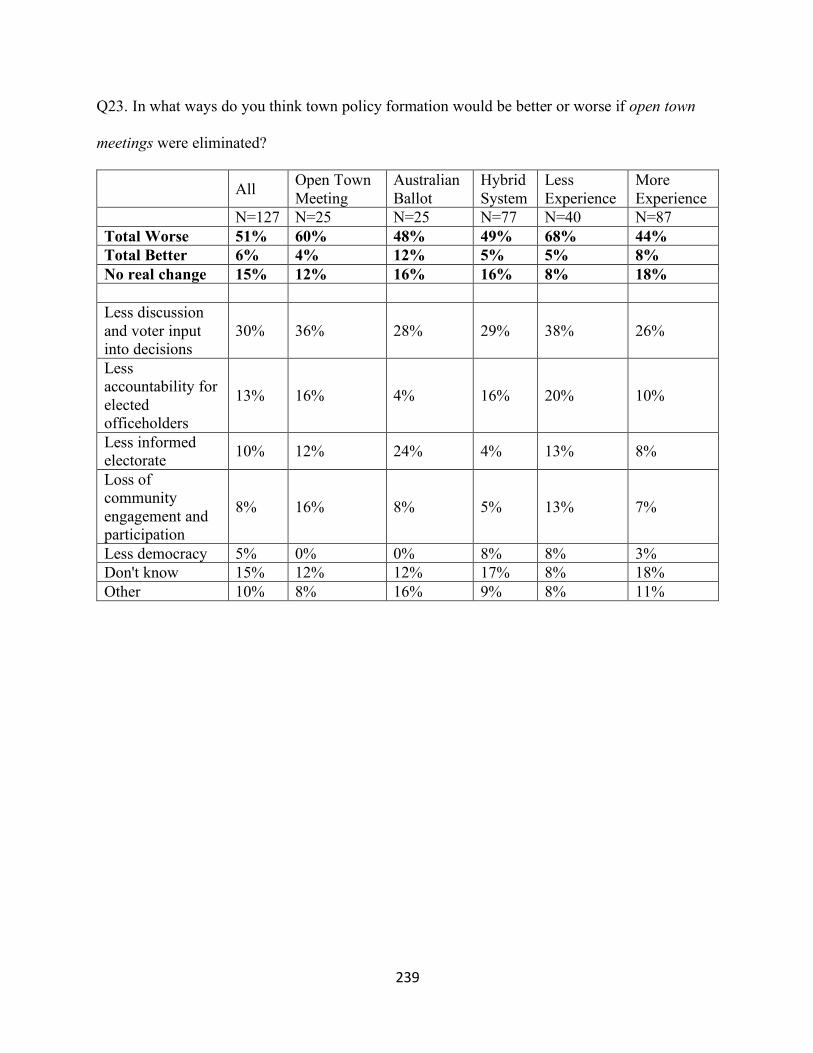
239
Q23. In what ways do you think town policy formation would be better or worse if open town
meetings were eliminated?
All Open Town Meeting
Australian Ballot
Hybrid System
Less Experience
More Experience
N=127 N=25 N=25 N=77 N=40 N=87 Total Worse 51% 60% 48% 49% 68% 44% Total Better 6% 4% 12% 5% 5% 8% No real change 15% 12% 16% 16% 8% 18% Less discussion and voter input into decisions
30% 36% 28% 29% 38% 26%
Less accountability for elected officeholders
13% 16% 4% 16% 20% 10%
Less informed electorate 10% 12% 24% 4% 13% 8%
Loss of community engagement and participation
8% 16% 8% 5% 13% 7%
Less democracy 5% 0% 0% 8% 8% 3% Don't know 15% 12% 12% 17% 8% 18% Other 10% 8% 16% 9% 8% 11%
240
BIBLIOGRAPHY Alesina, Alberto, and Howard Rosenthal. “A Theory of Divided Government.” Econometrica, Vol. 64, No. 6 (Nov., 1996): 1311-1341. Amato, Theresa. Grand Illusion: The Myth of Voter Choice in a Two-Party Tyranny. New York: The New Press, 2009. Ansolabehere, Stephen, and Alan Gerber. “Incumbency Advantage and the Persistence of Legislative Majorities.” Legislative Studies Quarterly, Vol. 22, No. 2 (May, 1997): 161-178. Armitage, Christopher, and Mark Conner. “Attitudinal Ambivalence: A Test of Three Key Hypotheses.” Personality and Social Psychology Bulletin, Vol. 26, Issue 11, (2000): 14-21. Bailey, Michael and Elliot Fullmer. “Balancing in the U.S. States, 1978-2009.” State Politics & Policy Quarterly, Vol. 11, No. 2 (June 2011): 148-166. Basinger, Scott, and Howard Lavine. “Ambivalence, Information, and Electoral Choice.” The American Political Science Review, Vol. 99, No. 2 (May, 2005). Beck, Paul, Lawrence Baum, Aage Clausen, and Charles Smith, Jr. “Patterns and Sources of Ticket Splitting in Subpresidential Voting.” American Political Science Review, Vol. 86, No. 4 (December 1992). Bennet, James. Not Invited to the Party: How the Demopublicans Have Rigged the System and Left Independents Out in the Cold. New York: Springer, 2009. Bibby, John, and Sandy Maisel. Two Parties – or More?: The American Party System, 2nd ed. Boulder: Westview Press, 2003. Bidgood, Jess. “Christine Hallquist, a Transgender Woman, Wins Vermont Governor’s Primary.” The New York Times, August 4, 2018. https://www.nytimes.com/2018/08/14/us/politics/christine-hallquist-vermont.html. Blumberg, Stephen, Nadarajasundaram Ganesh, Julian Luke, and Gilbert Gonzales. “Wireless Substitution: State-level Estimates from the National Health Interview Survey, 2012.” National Health Statistics Reports, No. 70, (December 18, 2013). https://www.cdc.gov/nchs/data/nhsr/nhsr070.pdf . Ballotpedia. “Current independent and third-party federal and state officeholders.” Accessed May 3, 2021. https://ballotpedia.org/Current_independent_and_third-party_federal_and_state_officeholders. Ballotpedia. “State government trifectas.” Accessed May 3, 2021. https://ballotpedia.org/State_government_trifectas.
241
Ballotpedia. “Veto-proof state legislatures and opposing party governors in the 2018 elections.” Accessed October 18, 2019. https://ballotpedia.org/Veto-proof_state_legislatures_and_opposing_party_governors_in_the_2018_elections. Born, Richard. “Split-Ticket Voters, Divided Government, and Fiorina's Policy-Balancing Model.” Legislative Studies Quarterly, Vol. 19, No. 1 (February 1994). Born, Richard. “Policy Balancing Models and the Split-ticket Voter, 1972-1996.” American Politics Quarterly, Vol. 28 No.2, (April 2000): 131-162. Born, Richard. “Congressional Incumbency and the Rise of Split-Ticket Voting.” Legislative Studies Quarterly, Vol. 25, No. 3 (August 2000): 365-387. Bouriches, Terry. Building Progressive Politics: The Vermont Story. Madison: Center for a New Democracy, 1993. Bowden, John. “62 percent say third political party is needed in US.” The Hill, February 15, 2021. https://thehill.com/blogs/blog-briefing-room/news/538889-62-percent-say-third-political-party-is-needed-in-us?fbclid=IwAR2R40EU3pHgMw8CBOysr6HbZOzqTSdrugkw7pge6IIIBZCD8meobucXmzg. Bradley, Pat. “Clavelle Endorses Weinberger.” WAMC Northeast Public Radio, January 14, 2021. https://www.wamc.org/post/clavelle-endorses-weinberger. Brunell, Thomas, and Bernard Grofman. “Testing sincere versus strategic split-ticket voting at the aggregate level: Evidence from split house–president outcomes, 1900–2004.” Electoral Studies, Vol. 28, Issue 1, (March 2009): 62-69. Bryce, James. The American Commonwealth, 2nd ed. rev. London: Macmillan and Company, 1891. Bump, Phillip. “2020 Saw The Least Split Ticket House Voting In Decades.” The Washington Post, February 19, 2021. https://www.washingtonpost.com/politics/2021/02/19/2020-saw-least-split-ticket-house-voting-decades/. Burden, Barry, and David Kimball. “A New Approach to the Study of Ticket Splitting.” The American Political Science Review, Vol. 92, No. 3 (Sept. 19, 1998). Burnham, Walter Dean. Critical Elections and the Mainsprings of American Politics. New York: W. W. Norton & Company Inc., 1970. Calcagno, Peter and Edward Lopez. “Divided we vote.” Springer Science+Business Media, LLC (December 2010).
242
Camerato, Tim. “Vermont bill may mean mail-in, drive-by voting for Town Meeting.” Valley News, March 26, 2020. https://www.vnews.com/Vermont-Makes-Town-Meeting-Changes-33551810. Campbell, Angus, and Warren Miller. “The Motivational Basis of Straight and Split-ticket Voting.” The American Political Science Review, Vol. 51, No. 2 (Jun., 1957). Carmichael, Stokely and Charles Hamilton. Black Power: The Politics of Liberation in America. New York: Vintage, 1967. Carsey, Thomas, and Geoffrey C. Layman. “Policy Balancing and Preferences for Party Control of Government.” Political Research Quarterly, Vol. 57, No. 4 (Dec., 2004): 541-550. Chester, Eric. True Mission: Socialists and the Labor Party Question in the U.S.. Sterling: Pluto Press, 2004. Chressanthis, George. “Third party voting and the rational voter model: Empirical evidence from recent presidential elections.” Public Choice, 65 (1990): 189-193. The City of Burlington. “City Council.” Accessed February 18, 2020. https://www.burlingtonvt.gov/CityCouncil. Clark, Susan and Frank Bryan. All Those In Favor: Rediscovering the Secrets of Town Meeting and Community. Burlington: RavenMark Inc., 2005. Cook, Edward Jr. The Fathers of The Towns: Leadership and Community Structure in Eighteenth-Century New England. Baltimore: The Johns Hopkins University Press, 1976. Cowart, Andrew. “A Cautionary Note on Aggregate Indicators of Split-ticket Voting.” Political Methodology, Vol. 1, No. 1 (Winter 1974): 109-130. Darr, Joshua, Matthew Hitt, and Johanna Dunaway. “Newspaper Closures Polarize Voting Behavior.” Journal of Communication (2018): 1007-1028. Davis, Nicholas. “The Role of Indifference in Split-Ticket Voting.” Political Behavior. 37(1) (2014): 67-86. https://link.springer.com/article/10.1007/s11109-013-9266-9. Davis, Nicholas, and Lilliana Mason. “Sorting and the Split-Ticket: Evidence from Presidential and Subpresidential Elections.” Political Behavior. 38(2) (2015): 337-354. https://link.springer.com/article/10.1007/s11109-015-9315-7. DeSantis, Victor, and David Hill. “Citizen Participation in Local Politics: Evidence from New England Town Meetings.” State & Local Government Review, Vol. 36, No. 3 (Autumn, 2004): 166-173.
243
Dobbs, Taylor. “Another Vermont Pol Promises Broadband. Could It Work This Time?.” Seven Days, July 25, 2018. https://www.sevendaysvt.com/vermont/another-vermont-pol-promises-broadband-could-it-work-this-time/Content?oid=18421305. Drutman, Lee. Breaking The Two Party Doom Loop. New York: Oxford University Press, 2020. Elletson, Grace. “‘Ideologue’ vs. ‘bridge builder’: What kind of Progressives are Pine and Tracy?.” VT Digger, November 25, 2020. https://vtdigger.org/2020/11/25/ideologue-vs-bridge-builder-what-kind-of-progressives-are-pine-and-tracy/. Elletson, Grace. “Burlington Mayor Miro Weinberger narrowly wins fourth term.” VT Digger, March 2, 2021. https://vtdigger.org/2021/03/02/burlington-mayor-miro-weinberger-narrowly-wins-fourth-term/. Emerson, Ralph Waldo. The Complete Works of Ralph Waldo Emerson. Seattle: Pacific Publishing Studio, 2018. Eten, Harry. “Latest House results confirm 2018 wasn't a blue wave. It was a blue tsunami.” CNN, December 6, 2018. https://www.cnn.com/2018/12/06/politics/latest-house-vote-blue-wave/index.html. Fairfield, John. Town Government in Massachusetts (1620 –1930). Cambridge: Harvard University Press, 1930. Feinman, Ronald L. "Philip La Follette: The Second Son." Reviews in American History 11, no. 3 (1983): 409-13. Accessed May 4, 2021. doi:10.2307/2702475. Feld, Scott, and Bernard Grofman. “Incumbency Advantage, Voter Loyalty, and the Benefit of the Doubt.” Journal of Theoretical Politics, 3(2) (1991). Fiorina, Morris. Divided Government. Needleman Heights: Allyn & Bacon, 1992. Ford, Paul. The Writings of Thomas Jefferson, vol. 4. New York: G.P Putnam’s Sons, 1894. Forgette, Richard, and Glen Platt. “Voting for the Person, Not the Party: Party Defection, Issue Voting, and Process Sophistication.” Social Science Quarterly, Vol. 80, No. 2, (June 1999). Fung, Archon. Empowering Participation. Princeton: Princeton University Press, 2004. Gallup. “Party Affiliation.” Accessed March 23, 2021. https://news.gallup.com/poll/15370/party-affiliation.aspx. Garand, James, and Marci Glascock Lichtl. “Explaining Divided Government in the United States: Testing an Intentional Model of Split-ticket Voting.” British Journal of Political Science, Vol. 30, No. 1 (Jan., 2000).
244
Geer, John, Amy Carter, James McHenry, Ryan Teten, and Jennifer Hoef. “Experimenting With the Balancing Hypothesis.” Political Psychology, Vol. 25, Issue 1, (Mar. 2004): 49-63. Gillespie, David. Politics at the Periphery: Third Parties in Two-Party America. Columbia: University of South Carolina Press, 1993. Gillespie, David. Challengers to Duopoly. Columbia: University of South Carolina Press, 2012. Gitelson, Alan. “An Analysis of Split-Ticket Voting Patterns At the Microanalytic Level.” Political Methodology, Vol. 5, No. 4 (1978): 445-459. Green, John, and Rick Farmer, eds. The State of the Parties: The Changing Role of Contemporary American Parties, 4th ed. Lantham: Rowman & Littlefield, 2003. Grofman, Bernard, William Koetzle, Michael McDonald, and Thomas Brunell. “A New Look at Split-Ticket Outcomes for House and president: A Comparative Midpoints Model.” The Journal of Politics, Vol. 62, No. 1 (February 2000): 34-50. Guma, Greg. The People’s Republic: Vermont and the Sanders Revolution. Shelburne: The New England Press, 1989. Gustafson, S.M. “Democracy and Discussion: Albion Tourgée on Race and the Town Meeting Ideal.” J19: The Journal of Nineteenth-Century Americanists, Volume 5(2) (2017): 389-396 Gutmann, Amy, and Dennis Thompson. Why Deliberative Democracy?. Princeton: Princeton University Press, 2004. Hanna, Jason and Davidson, Lawrence. “Vermont governor signs sweeping gun control measures.” CNN, April 11, 2018. https://www.cnn.com/2018/04/11/us/vermont-gun-control. Hayes, Michael. “Biden, Republicans each have a good reason to compromise (Commentary).” Syracuse.com, February 2, 2021. https://www.syracuse.com/opinion/2021/02/biden-republicans-each-have-good-reason-to-compromise-commentary.html. Hawkins, Howie, ed. Independent Politics: The Green Party Strategy Debate. Chicago: Haymarket Books, 2006. Hendrickson, Clara. “Local journalism in crisis: Why America must revive its local newsroom.” Brookings Institution, November 12, 2019. https://www.brookings.edu/research/local-journalism-in-crisis-why-america-must-revive-its-local-newsrooms/. Herrnson, Paul and John Green, eds. Multiparty Politics in America, 2nd ed. Lantham: Rowman & Littlefield Publishers Inc., 2002. Hicks, John. “The Third Party Tradition in American Politics.” The Mississippi Valley Historical Review, 20(1) (1933): 3-28. http://www.jstor.org/stable/1902325.
245
Jacobson, Gary. The Electoral Origins of Divided Government. Boulder: Westview Press, Inc., 1990. Jenkins, Shannon, Douglas Roscoe, and David Borges. “Voters in Representative Town Meetings.” New England Journal of Political Science, 9, no. 2, (September 2016): 134-163. https://c62a1cd8-e60b-4682-b2c5-a937642d5637.filesusr.com/ugd/7d6421_32bc900557c046f88fc938aa571fdc79.pdf. Karp, Jeffrey, and Marshall Garland. “Ideological Ambiguity and Split-ticket Voting.” Political Research Quarterly, Vol. 60, No. 4, (December 2007). Keeter, Scott, Nick Hatley, Courtney Kennedy, and Arnold Lau. “What Low Response Rates Mean for Telephone Surveys.” Pew Research Center: Methods, May 15, 2017. https://www.pewresearch.org/methods/2017/05/15/what-low-response-rates-mean-for-telephone-surveys/. Lacy, Dean, Emmerson Niou, Phillip Paolino, and Robert Rein. “Measuring Preferences for Divided Government: Some Americans Want Divided Government and Vote to Create It.” Political Behavior, Vol. 41, Issue 1, (March 2019): 79-103. Lamdin, Courtney. “Can Max Tracy Ride the City’s Progressive Wave to Become Burlington’s Next Mayor?.” Seven Days, February 3, 2021. https://www.sevendaysvt.com/vermont/can-max-tracy-ride-the-citys-progressive-wave-to-become-burlingtons-next-mayor/Content?oid=32242023. Lancaster, Lane. Government in Rural America. Westport: Greenwood Press Publishers, 1952. LaPlante, John. “What Killed the Town Meeting…” The Nation, February1, 1958. Lasswell, Harold. Psychopathology and Politics. Chicago: University of Chicago Press, 1930. Lewis-Beck, Michael and Richard Nadeau. “Split-ticket Voting: The Effects of Cognitive Madisonianism.” The Journal of Politics, Vol. 66 No. I, (February 2004): 97-112. Madison, James. “Federalist 10.” Congress.gov Resources, 1787. https://www.congress.gov/resources/display/content/The+Federalist+Papers#TheFederalistPapers-10. Madison, James. “Federalist 58”. Congress.gov Resources, 1788. https://www.congress.gov/resources/display/content/The+Federalist+Papers#TheFederalistPapers-58. Mansbridge, Jane. Beyond Adversary Democracy. New York: Basic Books, Inc., Publishers, 1980.
246
Mattei, Franco and John Howes. “Competing Explanations of Split-Ticket Voting in American National Elections.” American Politics Quarterly, Vol. 28, No. 3, (July 2000): 379-407 Martin, Jonathan. Empowering Progressive Third Parties in the United States: Defeating Duopoly, Advancing Democracy. New York: Routledge, 2016. McAllister, Ian, and Robert Darcy. “Sources of Split-ticket Voting in the 1988 American Elections.” Political Studies, XL, (1992): 695-712. McEvoy, Jemima. “Vermont Gov. Scott Joins Republicans Who Won’t Vote Trump – But Not Ready To Endorse Biden, Either.” Forbes, August 21, 2020. https://www.forbes.com/sites/jemimamcevoy/2020/08/21/vermont-gov-scott-joins-republicans-who-wont-vote-trump-but-not-ready-to-endorse-biden-either/?sh=1ed0cc22564b. Mellman, Mark. “Mellman: How well does Congress represent America.” The Hill, April 23, 2019. https://thehill.com/opinion/campaign/440326-mellman-how-well-does-congress-represent-america. Mercer, Andrew, Arnold Lau, and Courtney Kennedy. “For Weighting Online Opt-In Samples, What Matters Most?” Pew Research Center: Methods, January 26, 2018. https://www.pewresearch.org/methods/2018/01/26/for-weighting-online-opt-in-samples-what-matters-most/. Meyn, Colin. “Zuckerman wins Progressive nomination; Ericson eyes a recount.” VT Digger, August 17, 2020. https://vtdigger.org/2020/08/17/zuckerman-wins-progressive-nomination-ericson-eyes-a-recount/. Moore, Ashley. “Vote-by-Mail.” Alliance for A Better Vermont, February 24, 2021. https://www.abettervermont.org/2021-blog/universal-vote-by-mail. Mulligan, Kenneth. “Partisan Ambivalence, Split-Ticket Voting, and Divided Government.” Political Psychology, Vol 32, No. 3, (2011). National Center for Health Statistics. “National Health Interview Survey Early Release Program.” Released August, 2015. https://www.cdc.gov/nchs/data/nhis/earlyrelease/wireless_state_201608.pdf National Conference of State Legislatures. “State Partisan Composition.” Last Modified August 8, 2019. http://www.ncsl.org/research/about-state-legislatures/partisan-composition.aspx. NBC News. “Vermont Governor Election Results.” Last Modified December 27, 2021. https://www.nbcnews.com/politics/2020-elections/vermont-governor-results. Norton, Kit. “Final Reading: Progs lay out ambitious agenda.” VTDigger, February 10, 2021. https://vtdigger.org/2021/02/10/final-reading-progs-lay-out-an-ambitious-agenda/.
247
Nuquist, Andrew. Town Government in Vermont. Essex Junction: Essex Publishing Company, Inc., 1964. O’Connell, Tom. “Minnesota Farmer-Labor Party, 1924-1944.” Mnopedia, April 23, 2021. https://www.mnopedia.org/minnesota-farmer-labor-party-1924-1944. O’Connor, Kevin. “Majority of Vermont’s floor-meeting towns turn to ballots for March 2.” VT Digger, February 24, 2021. https://vtdigger.org/2021/02/24/majority-of-vermonts-floor-meeting-towns-turn-to-ballots-for-march-2/?fbclid=IwAR0v6JCGdgylCPBFTJrCGW7vw_gsR0rq04ZXXrdHCCzLadegzVUNH_vWHkE. Office of the Vermont Secretary of State. “Official Report of the Canvassing Committee United States and Vermont Statewide Offices: General Election, November 6 2018.” Accessed October 24, 2018. https://sos.vermont.gov/media/awufmkui/2018generalofficialresults.pdf. Office of the Vermont Secretary of State. “A Citizen’s Guide to Vermont Town Meeting.” Last modified 2018. https://sos.vermont.gov/media/uomghd2h/citizen-guide-text-2.pdf . Office of the Vermont Secretary of State. “Guide to Vermont’s Town Clerks, Treasurers & County Clerks.” Last modified, March 22, 2021. https://sos.vermont.gov/media/8d88cbe434ced0e/2020townclerkguide.pdf Padover, Saul ed. Democracy by Thomas Jefferson. New York: Greenwood Press, Publishers, 1939. Petenko, Erin. “As Vermonters leave small towns, Burlington region grows.” VT Digger, October 3, 2019. https://vtdigger.org/2019/10/03/as-vermonters-leave-small-towns-they-flock-to-burlington-region/ Piven, Frances. Challenging Authority: How Ordinary People Change America. New York: Rowman & Littlefield Publishers, Inc., 2006. Pomper, Gerald. Elections in America: Control and Influence in Democratic Politics. New York: Dodd, Mead & Company, 1968. Pontusson, Jonas. Inequality and Prosperity: Social Europe vs. Liberal America. Ithaca: Cornell University Press, 2005. Reynolds, David. Democracy Unbound: Progressive Challenges to the Two Party System. Boston: South End Press, 1997. Riker, William. “The Two-Party System and Duverger's Law: An Essay on the History of Political Science.” The American Political Science Review, 76(4), (1982): 753-766
248
Ring, Wislong. “Vermont’s Republican governor: Trump shouldn’t be in office.” AP, February 7, 2020. https://apnews.com/article/vermont-donald-trump-trump-impeachment-vt-state-wire-politics-4bd062c6be264be69c130d03137a515f Robinson, Donald. Town Meeting: Practicing Democracy in Rural New England. Amherst: University of Massachusetts Press, 2011. Rosenstone, Steven, Roy Behr, and Edward Lazarus. Third Parties in America, 2nd ed. Princeton: Princeton University Press, 1984 Sanders, Bernard. Our Revolution. New York: Thomas Dunne Books, 2016. Sanders, Bernard. Outsider in the White House. New York: Verso, 2015. Schraufnagel, Scot. Third Party Blues: The Truth and Consequences of Two-Party Dominance. New York: Routledge, 2011. Siddiqui, Sabrina. “The Democratic blue wave was real.” The Guardian, November 17, 2018. https://www.theguardian.com/us-news/2018/nov/16/the-democratic-blue-wave-was-real. Sifry, Micah. Spoiling for a Fight. New York: Routledge, 2002 Skelley, Geoffrey. “Split-Ticket Voting Hit A New Low In 2018 Senate And Governor Races.” FiveThirtyEight, November 19, 2019. https://fivethirtyeight.com/features/split-ticket-voting-hit-a-new-low-in-2018-senate-and-governor-races/ Skelley, Geoffrey. “Why Only 16 Districts Voted for A Republican And A Democrat in 2020.” FiveThirtyEight, February 24, 2021. https://fivethirtyeight.com/features/why-only-16-districts-voted-for-a-republican-and-a-democrat-in-2020/ Snider, Clyde. Local Government in Rural America. Westport: Greenwood Press Publishers, 1957. Sundquist, James. Dynamics of the Party System: Alignment and Realignment of Political Parties in the United States, Revised Edition. Washington, D.C.: The Brookings Institution, 1983. Tam Cho, Wendy, and Brian Gaines. The Limits of Economical Inference: The Case of Split-Ticket Voting. American Journal of Political Science, Vol. 48, No. 1, (January 2004): 152-171 Tamas, Bernard. The Demise and Rebirth of American Third Parties. New York: Routledge, 2018. Thornton, Judd. “Getting Lost on the Way to the Party: Ambivalence, Indifference, and Defection with Evidence from Two Presidential Elections.” Social Science Quarterly, v. 95, issue 1, (March 2014): 184-201.
249
Tocqueville, Alexis de. Democracy In America. New York: G. Dearborn & Co., 1838. Townsend, Rebecca. “Town Meeting as a Communication Event: Democracy's Act Sequence.” Research on Language and Social Interaction, Volume 42:1 (2009). United States Census. “City and Town Population Totals: 2010-2019.” Accessed May 4, 2021. https://www.census.gov/data/tables/time-series/demo/popest/2010s-total-cities-and-towns.html Vermont General Assembly. “Bills Released for Introduction But Not Yet Introduced.” Accessed October 20, 2019. https://legislature.vermont.gov/bill/released/2020. Vermont General Assembly. “Legislators: All Senators.” Accessed February 18, 2021. https://legislature.vermont.gov/people/all/2022/Senate. Vermont General Assembly. “Vermont Statutes Online, Title 17: Elections, Chapter 049: Nominations, Subchapter 001: Primary Elections, (17 V.S.A. § 2353).” Accessed December 17, 2020. https://legislature.vermont.gov/statutes/section/17/049/02353. The Vermont Progressive Party. “Our Platform.” Accessed December 15, 2020. https://www.progressiveparty.org/platform. Vermont General Assembly. “Vermont House Membership by Party.” Accessed February 18, 2020. https://legislature.vermont.gov/house/clerk-of-the-house/legislative-statistics/membership-by-party/. Vermont League of Cities & Towns. “Town Meeting Help, 2019.” Last modified 2019. https://www.vlct.org/town-meeting-2019-help. Vermont Official State Website. “Office of Governor Phil Scott.” Accessed October 12, 2019. https://governor.vermont.gov/. The Vermont Progressive Party. “Elected Progressives.” Accessed February 18, 2021. https://www.progressiveparty.org/elected-progressives. Vermont Secretary of State. “How Does Your Town Vote?.” Accessed December 10, 2019. http://storymaps.stone-env.net/howdoesyourtownvote/. Walters, John. “Two-Biters Bites Again.” The Vermont Political Observer, November 10, 2016. https://thevpo.org/2016/11/10/two-biter-bites-again/. Walters, John. “Two Bites of the Apple.” The Vermont Political Observer, October 27, 2016. https://thevpo.org/2016/10/27/two-bites-of-the-apple/.
250
Washington, George. “Transcript of George Washington’s Farewell Address.” OurDocuments.gov, 1796. https://www.ourdocuments.gov/doc.php?flash=false&doc=15&page=transcript Wolf, Z. Byron and Joyce Tseng. “The 2018 blue wave, in 3 charts.” CNN, November 18, 2018. https://www.cnn.com/2018/11/28/politics/blue-wave-2018/index.html. Yglesias, Matthew. “Democrats’ blue wave was much larger than early takes suggested.” Vox, November 13, 2018. https://www.vox.com/policy-and-politics/2018/11/13/18082490/blue-wave. Yoo, Sung-jin. “Two Types of Neutrality: Ambivalence versus Indifference and Political Participation.” Journal of Politics, Vol. 72 Issue 1, (January 2010): 163-177 Zimmerman, Joseph. The New England Town Meeting: Democracy in Action. Westport: Praeger Publishers, 1999.
251
CURRICULUM VITA
Colleen R. Jackson was born July 13, 1990 in San Francisco. She spent her childhood in
Strasburg, France and Sydney and Canberra, Australia and returned to the United States for her
undergraduate education. Jackson graduated Summa Cum Laude from Villanova University in
2013. She then entered the work force as a market researcher for The Glover Park Group and
simultaneously earned a Graduate Certificate in Survey Design and Data Analysis from George
Washington University. Jackson has continued her education in research through on-the-job
learning as the Research Director for the Sanders Institute and overseeing polling as the Deputy
Campaign Manager for Former Lt. Governor David Zuckerman’s gubernatorial campaign.