Embed Size (px)
Citation preview
�����������������
Citation: van Schalkwyk, P.D.;
Engelbrecht, J.A.A.; Booysen, M.J.
Thermal Stratification and
Temperature Variation in Horizontal
Electric Water Heaters:
A Characterisation Platform. Energies
2022, 15, 2840. https://doi.org/
10.3390/en15082840
Academic Editors: John Gardner
and Antonio Rosato
Received: 24 February 2022
Accepted: 1 April 2022
Published: 13 April 2022
Publisher’s Note: MDPI stays neutral
with regard to jurisdictional claims in
published maps and institutional affil-
iations.
Copyright: © 2022 by the authors.
Licensee MDPI, Basel, Switzerland.
This article is an open access article
distributed under the terms and
conditions of the Creative Commons
Attribution (CC BY) license (https://
creativecommons.org/licenses/by/
4.0/).
energies
Article
Thermal Stratification and Temperature Variation in HorizontalElectric Water Heaters: A Characterisation Platform †
Pieter D. van Schalkwyk , Jacobus A. A. Engelbrecht and Marthinus J. Booysen *
Electrical and Electronic Engineering, Stellenbosch University, Stellenbosch 7600, South Africa;[email protected] (P.D.v.S.); [email protected] (J.A.A.E.)* Correspondance: [email protected]† This paper is an extended version of our paper published in 2021 IEEE International Conference on Electrical,
Computer and Energy Technologies (ICECET), Cape Town, South Africa, 9–10 December 2021; pp. 1–7.
Abstract: Electric water heaters, which have the capacity to act as thermal energy storage, are wellsuited to demand management strategies in smart grid applications. However, finding the balancebetween managing power load, reducing thermal energy losses, user’s convenience, and bacterialgrowth control, requires accurate modelling of the internal thermal dynamics of the tank, includingstratification. As a black box, this unknown is dependent on a multitude of environmental factors(e.g., ambient temperature and inlet temperature), water draw patterns, scheduling, set temperaturesand orientation of the vessel. The latter affects the stratification and temperature variation insidethe tank, and therefore has a direct bearing on the balancing act of demand management. Althoughthis has been assessed inside vertically oriented tanks, what happens inside the horizontal variety—ubiquitous in developing countries—is currently left to the guesswork. In this paper, we presentthe development of an embedded hardware and software platform with which the temperaturevariations inside a horizontal water heater can be characterised under numerous environmental andusage conditions. The importance of doing so is highlighted by the preliminary results, which clearlyshow the expected substantial temperature variation along the vertical axis, but also show interestingphenomena along the longitudinal and transverse axes, for both static (no water draw) and dynamic(with water draw) conditions. We conclude by highlighting potential for further research.
Keywords: thermal stratification; electric water heaters; thermostat control; energy characterisation,energy usage
1. Introduction and Background
Domestic electric water heaters (DEWHs) are considered to be one of the largestenergy-consuming devices in a typical domestic household. In first-world regions, suchas Australia, the European Union and USA, water heating makes up 23%, 14% and 18%of the total residential load, respectively [1]. In South Africa, it can contribute to anythingin a range of 30% to 35% of a household’s total energy consumption, and accounts forapproximately 7% of South Africa’s total grid load [2–4].
It is no secret that electrical energy is a scarce commodity, especially in many develop-ing countries that struggle to meet the ever-increasing energy demands. In Sub-SaharanAfrica, approximately 600 million people still live without access to electricity, which ismore than in any other part of the world [5].
Electric water heaters (EWHs) can be used for grid stabilisation purposes using de-mand side management (DSM) for peak shaving and energy saving [6]. There are at least5.4 million of these heaters in the country [3], making them ideal candidates for demandresponse (DR) [7]. This provides the opportunity for struggling electricity generators, suchas South Africa’s parastatal utility Eskom, to implement large-scale DSM techniques, suchas ripple control, to control and limit the load on the electrical grid.
Energies 2022, 15, 2840. https://doi.org/10.3390/en15082840 https://www.mdpi.com/journal/energies
Energies 2022, 15, 2840 2 of 20
Xu et al. stated on DSM and DR strategies that “any reliable strategies aimed atcontrolling the demand from aggregated power usage of multiple water heaters should bebased on accurate and representative energy models, which require a thorough and com-prehensive understanding of the thermal behaviour for each individual water heater” [7].An accurate model of the EWH is needed to simulate its thermal behaviour and powerusage. These are often termed “thermal” models because they primarily simulate theelectrical energy supplied to the heater and the amount of energy extracted from theheater (exergy). The objective of using such models is firstly to simulate grid demandbased on individual (usually statistical) hot water draws, and secondly, to allow cen-tralised demand management to reduce the load on the grid without (a) sacrificing indi-vidual EWH energy savings, (b) increasing cold events experienced by the EWH user, and(c) prevent bacterial growth due to low temperatures in the tank [3,8]. From this, the loadon the grid can be simulated and optimised when a network of these devices is connected.The scale of these simulations necessitates the implementation of thermal models that arecomputationally inexpensive.
One significant phenomenon that contributes to variations in energy consumption inan EWH is thermal stratification. It can be described as the vertical separation of waterregions due to density differences. Since the density of water is relatively sensitive totemperature changes, lower density regions would tend to rise above regions that havehigher densities. This means that water regions with higher temperatures (lower density)would rise to the top, while lower temperatures (higher density) would tend to rest at thebottom of the tank. This phenomenon is also known as the buoyancy effect and also occursnaturally in most large bodies of water, such as dams and rivers. The thermal stratificationof the EWH device is an important factor to be considered when characterising the energyconsumption of these devices [9–12].
There are many models and experimental data in the literature that aim to characteriseEWH devices. Most are designed for vertically oriented tanks, and not many for horizontaltanks. EWHs are mounted horizontally in many developing countries, which makes itimportant to also focus on models representing horizontal tank orientation.
2. Related Work
Models from the literature can be classified by the working principles that governthe model. Most are physics-based (white-box models), but more data-driven and grey-box models are being developed to improve general model accuracy and computationalefficiency for large-scale control in smart grid applications. Furthermore, they can alsobe classified based on whether they support the characterisation of stratification. A fewmodels and experimental contributions are discussed in this section.
2.1. Physics-Based Models
Diao et al. [6] presented a one- and two-node transitioning, physics-based model forvertical EWHs. It incorporates two other models; the one-node (or single mass) modelfrom Dolan et al. [13], and the two-node (or two-mass) model from Kondoh et al. [14].The one-node model assumes that the entire body of water inside the tank is at a uniformtemperature, whereas the two-node model divides the whole tank volume into two separateisothermal volumes—the upper, warm epilimnion and the lower, colder hypolimnion [15].These are separated by a layer known as the thermocline. The transitioning model changesfrom the one-node model to the two-node model when a large water withdrawal eventoccurs and predicts the vertical position of the thermocline. This is to model to some degreethe effect of thermal stratification. Engelbrecht et al. [16] incorporated a similar one- andtwo-node transitioning model that was used in the development of optimal scheduled andheating control strategies.
Nel et al. [17] developed a computationally inexpensive model for a horizontal EWHthat can be used for mobile and DR applications. The one-to-two-node transitioningmodel from [6] was extended by Nel et al. to accommodate a horizontally-oriented tank.
Energies 2022, 15, 2840 3 of 20
In addition, the standing losses are also calculated and the model is validated using900 h of experimental data, including energy measurements; all of which were neglectedin [6,13,14]. The results for energy usage estimation show an estimation error of 2% and 5%for schedule control and thermostat control, respectively [17].
Xu et al. [7] developed a partial differential equation (PDE) model in an effort tosimulate the transient behaviour of a vertical EWH at different tank regions. The modelwas validated using 250 hours of experimental data captured with a setup equipped withsix digital sensors; four evenly positioned inside the tank (from top to bottom) and twoat the inlet and outlet. In addition, the usage water flow rate and ambient temperaturewere also measured. The simulated temperature values were in good agreement with themeasured temperature values; however, the computational complexity of the model wassignificantly higher than the one-to-two-node transition model presented by Diao et al. [6].
2.2. Stratification Measurement and Analyses
Leeuwner et al. [15] evaluated the accuracy of the model presented by Nel et al.in [17] which uses a two-node approximation for the thermal stratification of the water. Itwas compared with measured nodal temperatures and energy usage after recreating thesame experimental sequence as in the original experiment by Nel et al. [17]. The resultsof the study indicate that the energy usage estimation of the model is seemingly accurate,but it underestimates the effect of thermal stratification in the tank—both in transient andsteady-state conditions [15]. The upper node temperature was hotter, and the lower nodetemperature cooler than the simulated results. One concern that arises from this conclusionis, again, that the lower region of the EWH might be a conducive region for the growth ofa pathogen termed Legionella.
Farooq et al. [12] developed a grey-box model of a low pressure electric boiler (similarto a vertically-oriented EWH) to predict the temperature dynamics within the tank for staticand dynamic scenarios. Measurements of the internal temperatures were captured at8 different equally-spaced locations in a vertical tank. The volume of the tank was300 L and a 3-kW element was used to heat up the water. In their results, they con-cluded that during static heating, all layers within the tank heat up with a constant rate(even the bottom layers of the tank) and that during water consumption, the layers cooldown in an orderly fashion from the bottom to the top as the colder water moves up in thetank [12]. Their model accurately predicted the temperature dynamics of the tank duringa static heating scenario and for a water consumption scenario.
Fernandez-Seara et al. [11,18] wrote a two-part article series on experimental analysesof static and dynamic modes in vertical domestic electric hot water storage tanks witha featured focus on the degree of stratification in the tank. Eleven temperature sensors wereinstalled along the height of the tank to a probe depth of 20 cm.
The aim of the static mode analyses, as seen in [11], was to determine the internalthermal behaviour of a 150-L vertical EWH during static heating and static cooling modesand how it affects the efficiency of the system. The control parameters for the analyseswere heating power, inlet water temperature and operating pressure. The results show thatthere is a clear indication of thermal stratification present. The temperature differencesbetween the measured layers at the lower region of the tank increase with an increase ofthermal power injection and/or an increase of operating pressure during a static heatingmode. For static cooling, the results show that the lower regions of the tank heat up slightlydue to thermal diffusion with the hotter epilimnion region. In addition, they observed thatthe entire cooling process occurs faster at an operating pressure equal to the water linepressure as compared to atmospheric pressure.
The second part of Fernandez-Seara et al. [18] investigated the degree of stratificationof the same tank used in [11] for a dynamic mode of operation. They introduced six differentinlet-outlet port configurations and three different water flow rates as control parameters.Their results show the upward movement of the thermocline region as a function ofdimensionless time and vertical position of the tank. It is clear from the results that
Energies 2022, 15, 2840 4 of 20
inlet-outlet configurations have a significant influence on the profile development of thethermocline as a function of time during a dynamic mode. In addition, it can be seen thatthe rate at which the thermocline region moves upward is relatively constant betweendimensionless times of 0.2 and 0.8 for lower water flow rates.
Chandra et al. [9] and Castell et al. [10] provided comprehensive reviews of strati-fication analysis techniques and the utilisation of useful dimensionless numbers to helpcharacterise the degree of stratification in EWH tanks. It is clear that the exergy efficiencyof the tank is directly proportional to the degree of stratification in the tank. If the hot waterinside the tank mixes with the colder regions, the available energy at the outlet of the tankis lower, thus decreasing the exergy efficiency and creating thermodynamic irreversibilities.This is corroborated by results obtained by Fernandez-Seara et al. [18]. The inlet-outlet portconfiguration that yielded the highest degree of stratification had the highest dischargingexergy efficiency for all flow rates used. This confirms that the degree of stratification isdirectly proportional to exergy efficiency and should be a variable to optimise. This is alsoobserved in the numerical CFD results obtained in Abdelhak et al. [19].
Castell et al. [10] used and compared multiple numerical parameters to evaluate theefficiency and the degree of stratification of a vertically-oriented thermal energy storagetank. They state that the flow rate and the working temperature are the dominant factorsthat affect the stratification within a tank. Although the MIX number is considered tobe good metric for characterising stratification, it is too sensitive to small temperaturechanges in the working temperature. As an improvement, they found that the Richardsonnumber in combination with the Peclet number was a good metric by which to classify thethermal stratification.
Chandra et al. [9] provided a detailed review of thermal stratification within DEWHtanks. They state that the thermal performance of any thermal energy storage (TES) deviceis optimised when the degree of stratification is high. In other words, when there isa distinct thermal boundary, known as the thermocline, separating the hot water regionfrom the cold water region in the tank. A well-stratified tank has the potential to deliverhigher exergy at its load side and has improved degrees of utilisation [9]. This is supportedby the work done by Rosen et al. [20] and by the converse observation that when hot andcold regions are mixed, the available exergy at the load side of the tank decreases owing tothe high thermal energy at load side diffusing to the colder regions of the tank.
2.3. Computational Fluid Dynamic (CFD) Models
Thermal modelling tools, such as ‘TRNSYS’ and ‘ANSYS Fluent’ are used in manyareas of research and industry. For example, Yildiz et al. [1] used TRNSYS to simulate thethermal stratification in a vertical EWH tank using 6 different isothermal zones. Their studyused a dataset consisting of energy measurements from 410 different households located inAustralia. This was used to investigate the potential of storing excess photovoltaic (PV)generation in EWH devices. The results show that 48% of hot water draw in a typicalAustralian household can be provided by excess PV generation.
Abdelhak et al. [19] developed CFD models for a vertical and horizontal domestichot water storage tank for dynamic modes of operation. The numerical results of theCFD model were validated using the measured results from Fernandez-Seara et al. [18].However, for the horizontal tank, the vertical model was merely rotated and used tocompare the two orientations. The results show that the discharge efficiency of the tank ina horizontal orientation is lower than that of the vertical orientation and that the degree ofstratification is also lower in the horizontal orientation. This appears to show that verticaltanks are typically more efficient than horizontal tanks in dynamic modes of operation.
Stone et al. [8] developed a CFD model of a horizontal EWH to simulate the temper-ature stratification and velocity fields that influence the motion and growth of residentmicrobes [8]. The results from the model clearly show that the lower region of the tankremain at temperatures below 45 ◦C creating opportune growth regions for Legionella(expanded on in Section 2.4 below). The physical measurements obtained and shown in
Energies 2022, 15, 2840 5 of 20
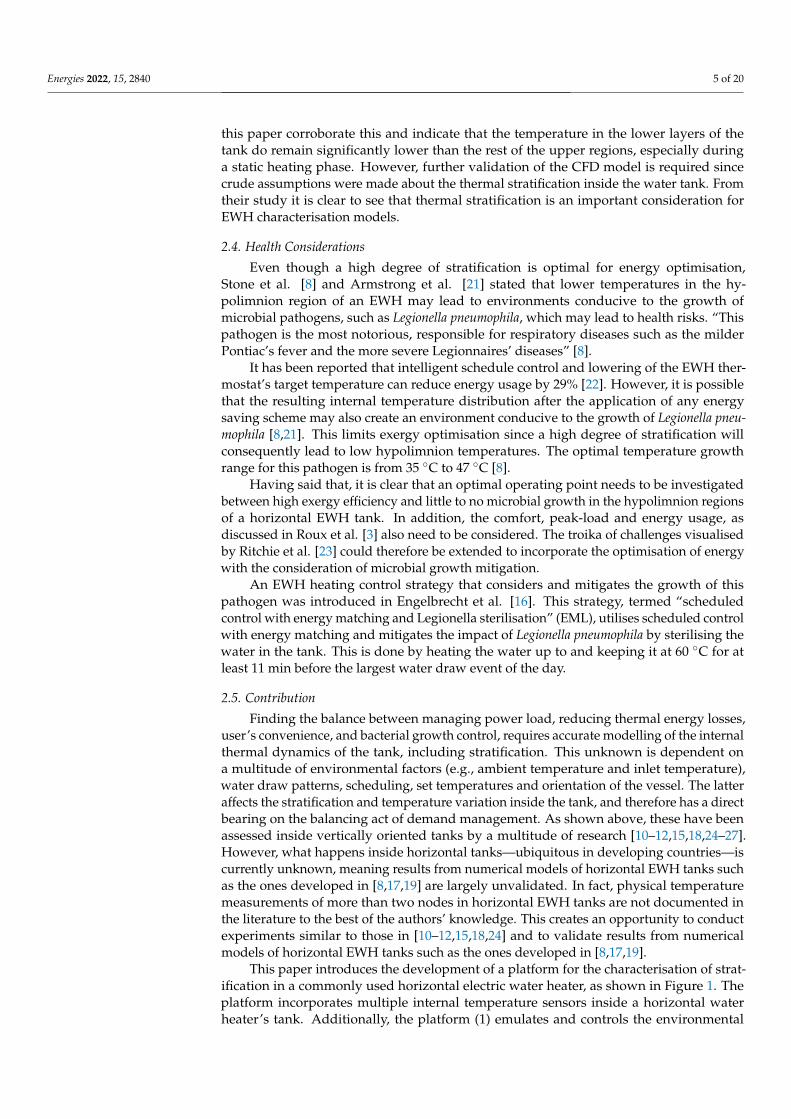
this paper corroborate this and indicate that the temperature in the lower layers of thetank do remain significantly lower than the rest of the upper regions, especially duringa static heating phase. However, further validation of the CFD model is required sincecrude assumptions were made about the thermal stratification inside the water tank. Fromtheir study it is clear to see that thermal stratification is an important consideration forEWH characterisation models.
2.4. Health Considerations
Even though a high degree of stratification is optimal for energy optimisation,Stone et al. [8] and Armstrong et al. [21] stated that lower temperatures in the hy-polimnion region of an EWH may lead to environments conducive to the growth ofmicrobial pathogens, such as Legionella pneumophila, which may lead to health risks. “Thispathogen is the most notorious, responsible for respiratory diseases such as the milderPontiac’s fever and the more severe Legionnaires’ diseases” [8].
It has been reported that intelligent schedule control and lowering of the EWH ther-mostat’s target temperature can reduce energy usage by 29% [22]. However, it is possiblethat the resulting internal temperature distribution after the application of any energysaving scheme may also create an environment conducive to the growth of Legionella pneu-mophila [8,21]. This limits exergy optimisation since a high degree of stratification willconsequently lead to low hypolimnion temperatures. The optimal temperature growthrange for this pathogen is from 35 ◦C to 47 ◦C [8].
Having said that, it is clear that an optimal operating point needs to be investigatedbetween high exergy efficiency and little to no microbial growth in the hypolimnion regionsof a horizontal EWH tank. In addition, the comfort, peak-load and energy usage, asdiscussed in Roux et al. [3] also need to be considered. The troika of challenges visualisedby Ritchie et al. [23] could therefore be extended to incorporate the optimisation of energywith the consideration of microbial growth mitigation.
An EWH heating control strategy that considers and mitigates the growth of thispathogen was introduced in Engelbrecht et al. [16]. This strategy, termed “scheduledcontrol with energy matching and Legionella sterilisation” (EML), utilises scheduled controlwith energy matching and mitigates the impact of Legionella pneumophila by sterilising thewater in the tank. This is done by heating the water up to and keeping it at 60 ◦C for atleast 11 min before the largest water draw event of the day.
2.5. Contribution
Finding the balance between managing power load, reducing thermal energy losses,user’s convenience, and bacterial growth control, requires accurate modelling of the internalthermal dynamics of the tank, including stratification. This unknown is dependent ona multitude of environmental factors (e.g., ambient temperature and inlet temperature),water draw patterns, scheduling, set temperatures and orientation of the vessel. The latteraffects the stratification and temperature variation inside the tank, and therefore has a directbearing on the balancing act of demand management. As shown above, these have beenassessed inside vertically oriented tanks by a multitude of research [10–12,15,18,24–27].However, what happens inside horizontal tanks—ubiquitous in developing countries—iscurrently unknown, meaning results from numerical models of horizontal EWH tanks suchas the ones developed in [8,17,19] are largely unvalidated. In fact, physical temperaturemeasurements of more than two nodes in horizontal EWH tanks are not documented inthe literature to the best of the authors’ knowledge. This creates an opportunity to conductexperiments similar to those in [10–12,15,18,24] and to validate results from numericalmodels of horizontal EWH tanks such as the ones developed in [8,17,19].
This paper introduces the development of a platform for the characterisation of strat-ification in a commonly used horizontal electric water heater, as shown in Figure 1. Theplatform incorporates multiple internal temperature sensors inside a horizontal waterheater’s tank. Additionally, the platform (1) emulates and controls the environmental
Energies 2022, 15, 2840 6 of 20
conditions, such as ambient temperature and inlet water temperature, (2) emulates theelectrical control (e.g., by the utility in DSM applications or the user in energy-saving ef-forts) and measures the resulting electric energy usage, (3) emulates the thermostat controlwith an electronically controlled thermostat, and (4) emulates the user with schedule-,volume-, and flow-rate-controlled water draw. We present preliminary results from staticand dynamic test conditions, showing for the first time what happens inside a horizontalwater heater. The experimental data acquired from the presented platform can be used tofurther develop and train new machine learning models and/or develop state estimation(grey-box) models for horizontal EWH characterisation.
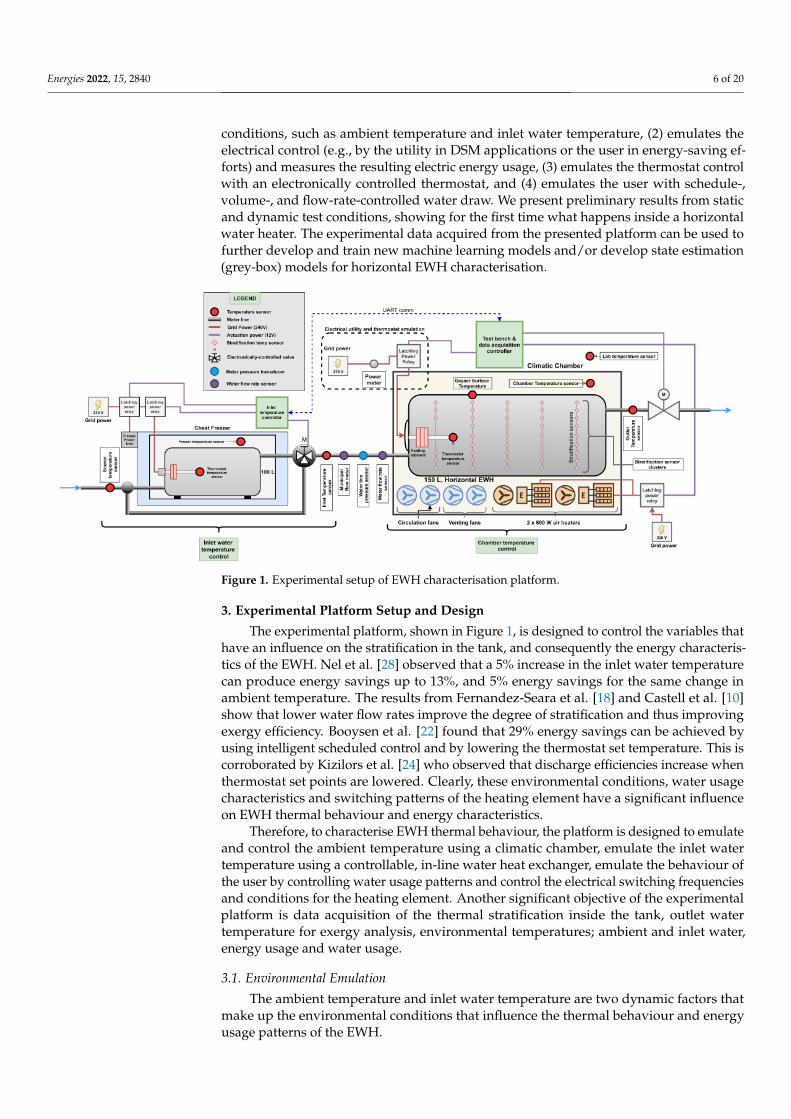
Figure 1. Experimental setup of EWH characterisation platform.
3. Experimental Platform Setup and Design
The experimental platform, shown in Figure 1, is designed to control the variables thathave an influence on the stratification in the tank, and consequently the energy characteris-tics of the EWH. Nel et al. [28] observed that a 5% increase in the inlet water temperaturecan produce energy savings up to 13%, and 5% energy savings for the same change inambient temperature. The results from Fernandez-Seara et al. [18] and Castell et al. [10]show that lower water flow rates improve the degree of stratification and thus improvingexergy efficiency. Booysen et al. [22] found that 29% energy savings can be achieved byusing intelligent scheduled control and by lowering the thermostat set temperature. This iscorroborated by Kizilors et al. [24] who observed that discharge efficiencies increase whenthermostat set points are lowered. Clearly, these environmental conditions, water usagecharacteristics and switching patterns of the heating element have a significant influenceon EWH thermal behaviour and energy characteristics.
Therefore, to characterise EWH thermal behaviour, the platform is designed to emulateand control the ambient temperature using a climatic chamber, emulate the inlet watertemperature using a controllable, in-line water heat exchanger, emulate the behaviour ofthe user by controlling water usage patterns and control the electrical switching frequenciesand conditions for the heating element. Another significant objective of the experimentalplatform is data acquisition of the thermal stratification inside the tank, outlet watertemperature for exergy analysis, environmental temperatures; ambient and inlet water,energy usage and water usage.
3.1. Environmental Emulation
The ambient temperature and inlet water temperature are two dynamic factors thatmake up the environmental conditions that influence the thermal behaviour and energyusage patterns of the EWH.
Energies 2022, 15, 2840 7 of 20
The ambient temperature is controlled using a custom climatic regulation chamberequipped with two 500-W air heaters, circulation fans and venting fans. These actuatorswork together to regulate a user-defined chamber temperature. The platform has the abilityto thermally emulate ambient temperatures up to 50 ◦C.
The temperature of the inlet water is regulated using a servo-controlled, three-portmixer valve. One of the inlet ports to the mixer is connected to a separate 100-L EWH devicethat is placed inside a standard chest freezer. The insulation of this tank is completelyremoved to decrease the thermal resistance between the chest freezer cavity and the waterinside the tank. Therefore, if cold water is required for the experiment, the element of thetank will remain off and the chest freezer will switch on and cool the water inside the tank.Conversely, if warm water is required, the heating element of the tank switches on andheats up the water while the chest freezer is off. The second inlet port of the mixer valveis connected to the municipal water supply. A PI (proportional/integral) control systemis used to regulate the temperature at the outlet port of the mixer valve. The temperatureset point used in this case is the desired inlet water temperature to the main 150-L EWHdevice under test.
3.2. User Emulation
The water usage patterns of the household user(s) have a substantial influence on thethermal behaviour of the EWH. Many studies focus on the development of stochastic waterusage prediction algorithms, such as Heidari et al. [29] and Ritchie et al. [30]. A way toimprove the accuracy of these models is to generate more water usage profiles and thecorresponding EWH energy response from the platform developed in this study.
This is accomplished by regulating the volumes, frequencies, flow rates and timesof water usage events with an actuator (an electric ball valve) and two sensors: a digitalflow meter that produces a digital pulse after sensing a specific volume of passing waterand an outlet temperature sensor. The pulses of the flow meter are accumulated usingan interrupt service routine (ISR) on the controller. This accumulation is sampled andprocessed every second. The resolution of the volumetric flow sensor used is ±2.5 mL,2.5 mL/pulse and the associated error is 2.5 mL/s.
The position of the electric ball valve is at the outlet of the tank to ensure that the EWHtank is pressurised to the regulated water line pressure when it is closed. In this setup, thewater pressure is regulated to 100 kPa using a standard pressure regulator valve.
3.3. Electrical Utility and Thermostat Emulation
Most electric water heaters utilise a standard thermostat that controls the electricalinput to the heating element based on a sensed temperature and a user-defined set tempera-ture. If the sensed temperature within the tank is below the set temperature, the thermostatwill deliver electrical energy to the heating element, causing the water to heat up. Theheating element will remain on and only switch off when the sensed temperature of thewater has reached the desired set temperature with a small hysteresis band.
The literature has shown that the thermostat set point has a significant influence onthe EWH energy characteristics [22] and the thermal stratification [10]. The experimentalplatform therefore incorporates the use of an electronically controlled thermostat. A customdigital controller receives the sensed temperature from the thermostat and determines thestate of the heating element based on the desired set temperature defined in the software.This allows for dynamic set point changes during an experiment and can be utilised bydifferent heating control strategies.
The emulation of the electrical utility is also important. In South Africa, there arerolling blackouts, a severe DM strategy, that cause many EWH units to be without electricityfor up to 4 h. A possible objective could be to observe the effects of these blackouts onthe energy and stratification characteristics of the EWH. This is done by introducingan emulated power availability schedule in the controller.
Energies 2022, 15, 2840 8 of 20
Therefore, the platform’s controller does two software checks for changing the state ofthe heating element. The power availability schedule is checked to see if power is availablefrom the emulated electrical utility and the sensed thermostat temperature is compared tothe desired set temperature. This means that the heating element of the EWH could be offeven when the sensed temperature is below the set temperature. This happens when thereis no power available based on the emulated utility availability schedule.
In the event of a possible controller fault and for safety reasons, the thermostat hasa hardware cut-off temperature of 90 ◦C. This ensures that the temperature within thesensing region of the thermostat never exceeds this temperature.
In addition to this, a safety protocol is established to prevent the mid-region of thetank to exceed a temperature limit of 5% above the EWHs current set point temperaturein the case of a faulty thermistor reading. This is done by implementing the temperaturereading of a few of the mid-region DS18B20 sensors in the EWHs element actuating logic.
3.4. Data Acquisition and Sensor Selection
An important objective of the platform is to sample experimental data that can aidin thermal and energy characterisation of the horizontal EWH. For this, the followingmeasurements need to be taken: thermal stratification inside the tank using multipleinternal temperature sensors, outlet water temperature for exergy analysis, environmentaltemperatures: ambient and inlet water, energy usage and volumetric flow rate of water.
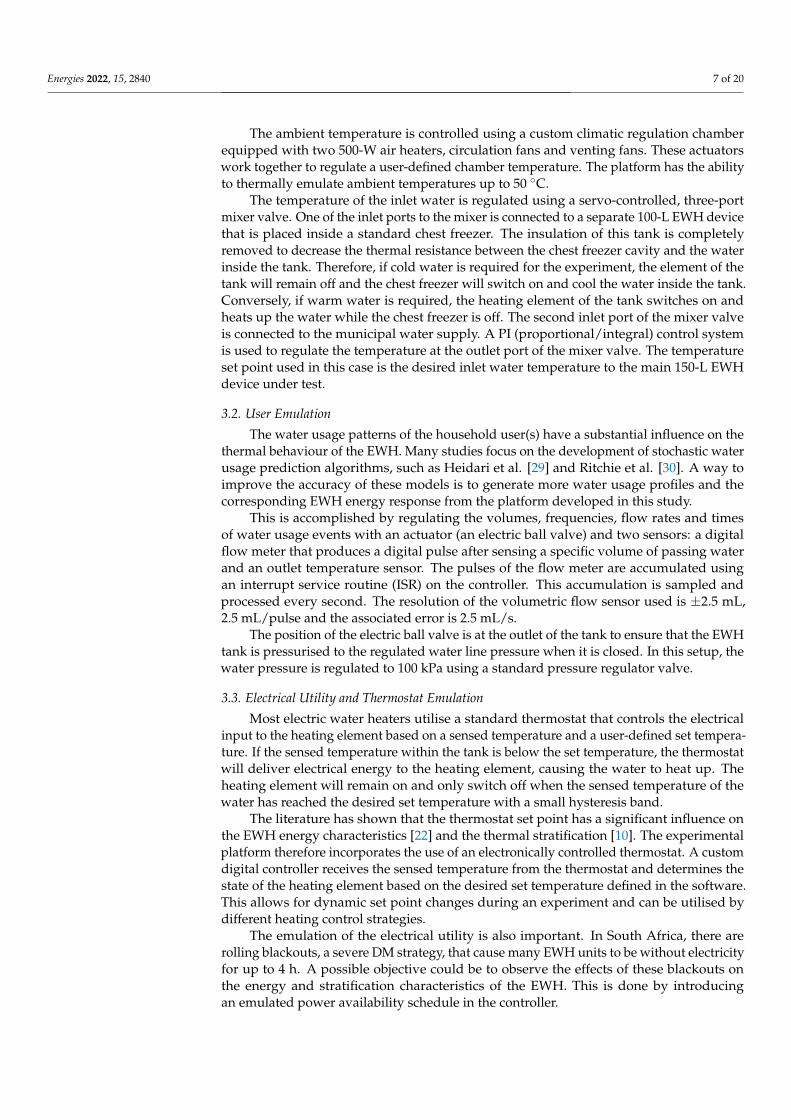
In most studies, a uni-directional thermal stratification measurement strategy is usedfor vertical EWH experiments. However, the positional arrangement of the temperaturesensors in this system allows for the measurement of vertical temperature variation andhorizontal-radial temperature variation. In addition, the temperature variation along thelength of the tank is also measurable. The three-dimensional sensor arrangement can beseen in Figure 2. This arrangement allows for the measurement of stratification in multipleregions of the horizontal tank. Thus, the thermal variation inside the tank can be measuredin a three-dimensional space.
Figure 2. Reference diagram for sensor busses and locations. There are five vertically oriented sensor“regions” along the longitudinal axis of the tank, (from Bus 0 at the outlet to Bus 4 at the inlet). Eachregion has nine sensors forming “layers” from top to bottom, labelled sensors 0 to 8. There are alsofour horizontally oriented sensor buses measuring transversal distribution on the “sides”, namelyBus 5 and 7L (left) and Bus 6 and Bus 7R (right). The reference notation for a specific sensor is writtenas Bx,y where x is the bus number and y is the sensor position on bus x.
Energies 2022, 15, 2840 9 of 20
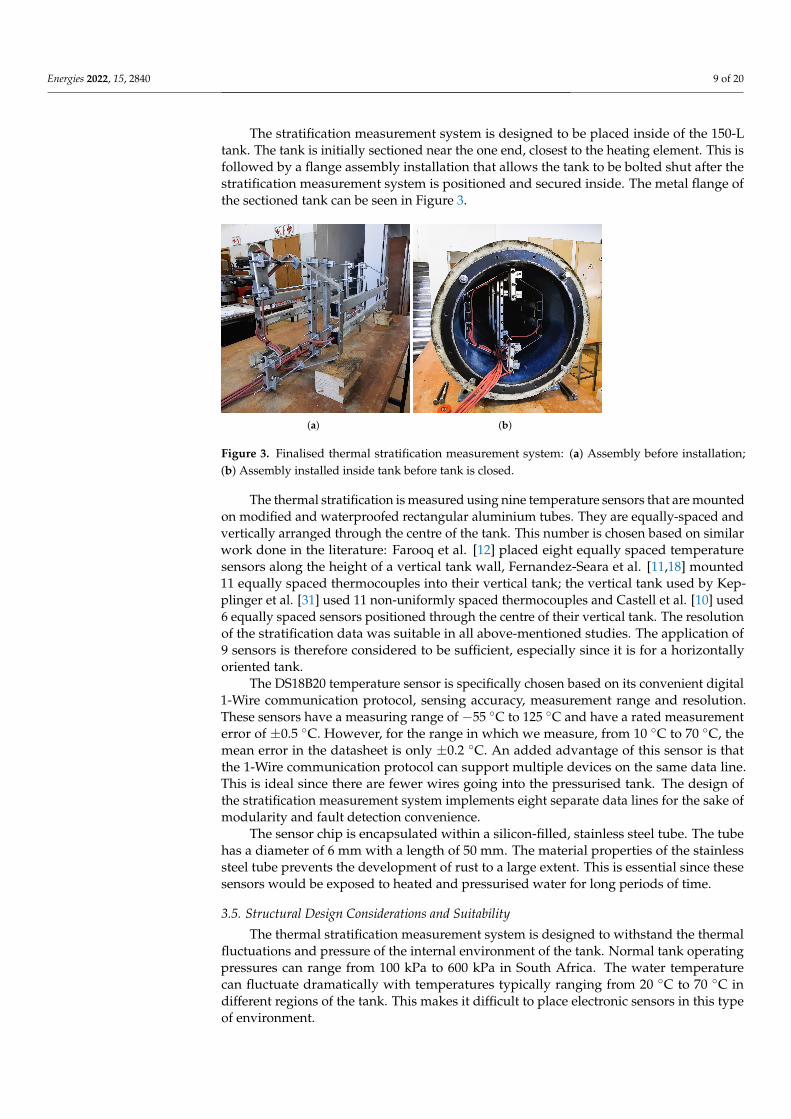
The stratification measurement system is designed to be placed inside of the 150-Ltank. The tank is initially sectioned near the one end, closest to the heating element. This isfollowed by a flange assembly installation that allows the tank to be bolted shut after thestratification measurement system is positioned and secured inside. The metal flange ofthe sectioned tank can be seen in Figure 3.
(a) (b)
Figure 3. Finalised thermal stratification measurement system: (a) Assembly before installation;(b) Assembly installed inside tank before tank is closed.
The thermal stratification is measured using nine temperature sensors that are mountedon modified and waterproofed rectangular aluminium tubes. They are equally-spaced andvertically arranged through the centre of the tank. This number is chosen based on similarwork done in the literature: Farooq et al. [12] placed eight equally spaced temperaturesensors along the height of a vertical tank wall, Fernandez-Seara et al. [11,18] mounted11 equally spaced thermocouples into their vertical tank; the vertical tank used by Kep-plinger et al. [31] used 11 non-uniformly spaced thermocouples and Castell et al. [10] used6 equally spaced sensors positioned through the centre of their vertical tank. The resolutionof the stratification data was suitable in all above-mentioned studies. The application of9 sensors is therefore considered to be sufficient, especially since it is for a horizontallyoriented tank.
The DS18B20 temperature sensor is specifically chosen based on its convenient digital1-Wire communication protocol, sensing accuracy, measurement range and resolution.These sensors have a measuring range of −55 ◦C to 125 ◦C and have a rated measurementerror of ±0.5 ◦C. However, for the range in which we measure, from 10 ◦C to 70 ◦C, themean error in the datasheet is only ±0.2 ◦C. An added advantage of this sensor is thatthe 1-Wire communication protocol can support multiple devices on the same data line.This is ideal since there are fewer wires going into the pressurised tank. The design ofthe stratification measurement system implements eight separate data lines for the sake ofmodularity and fault detection convenience.
The sensor chip is encapsulated within a silicon-filled, stainless steel tube. The tubehas a diameter of 6 mm with a length of 50 mm. The material properties of the stainlesssteel tube prevents the development of rust to a large extent. This is essential since thesesensors would be exposed to heated and pressurised water for long periods of time.
3.5. Structural Design Considerations and Suitability
The thermal stratification measurement system is designed to withstand the thermalfluctuations and pressure of the internal environment of the tank. Normal tank operatingpressures can range from 100 kPa to 600 kPa in South Africa. The water temperaturecan fluctuate dramatically with temperatures typically ranging from 20 ◦C to 70 ◦C indifferent regions of the tank. This makes it difficult to place electronic sensors in this typeof environment.
Energies 2022, 15, 2840 10 of 20
The support frame material is selected to be aluminium since it is light-weight,corrosion-resistant in water and has suitable thermal properties, such as high thermalconductivity and lower specific heat capacity than that of water. The thermal conductivityand specific heat capacity of water are typically 0.598 W/mK and 4200 J/kgK, respectively.In contrast, the same properties of aluminium are typically 239 W/mK and 900 J/kgK,respectively. The thermal conductivity property is a parameter used to quantify how wella material conducts heat and affects the rate at which heat is transferred. This parameter,along with the exposed surface area, has a direct influence on the transient thermal responsetime of the material. This relationship is described by Fourier’s law of heat conductionshown in Equation (1),
Qcond = −kAsdTdx
(1)
where Qcond is the rate of heat transfer through the material, k is the thermal conductivityof the material, As is the exposed surface area subjected to the heat transfer and dT
dx is thetemperature differential through the material in the x-dimension.
The aim of the frame is to provide rigid support for the sensors without influencingthe true thermal response of the water inside the tank. Energy transfer between the waterand the support frame material is inevitable. However, the aluminium frame does not actas a thermal reservoir which would cause slow thermal transients. The ability for waterto store thermal energy is far greater than that of aluminium and conversely means thatthe aluminium tubes gain and lose thermal energy much faster than that of water. Thepresence of the aluminium thus has no significant impact on the slower thermal responseof the body of water.
3.6. Digital System Control
A custom controller for the system is designed to incorporate the use of an “over-the-counter” microcontroller such as an Arduino Due. This device is responsible for the controlof the experimental platform. The controller is responsible for the control of environmentalemulation, user behaviour emulation, electrical utility emulation and EWH thermostatcontrol. It is also responsible for the data acquisition of the platform.
The data sampling parameters are configured and sent to the controller prior tothe experiment. These parameters include sampling frequency, duration of experiment,set ambient air temperature, set geyser thermostat temperature and the set water inlettemperature. In addition, there is also the option of providing two types of schedules forEWH heating element power availability and water usage patterns. After the controllerreceives the experiment parameters, it then starts to set up the EWH environment, such asthe set ambient air temperature if required. Once the environment is ready, the experimentstarts and the time-stamped data are recorded to an SD card and streamed to a computervia a serial port.
The physical and finalised version of the stratification measurement system is shownin Figure 3. Each temperature bus module is connected to a three-core silicone cablethat runs to the outside of the tank. For this to be possible, the existing anode rod hadto be removed for the wires to have an entry point. Figure 3 shows how the cables arepositioned in the tank. It was important to minimise the disturbance of typical flow into thetank; therefore, the cables and the sensor busses were positioned appropriately to provideenough space from the inlet water diffuser.
3.7. Sensor Referencing and Geometry Considerations
A referencing convention is established to make sense of the recorded data from thetest station. There are 67 temperature sensors in total that are positioned at specific locationsinside of the tank. Figure 2 shows the naming convention and sensor referencing notationfor the sensors used for temperature variation measurement within the tank.
Most documented experimental stratification data from the literature are captured andanalysed for vertically oriented tanks [9–12,18–20,31]. In these cases, the cross-sectional
Energies 2022, 15, 2840 11 of 20
area as a function of height of the tank remains constant. This means that, assumingthat the installed sensors are equally spaced, the volume of the water measured for eachsensor node will be the same. This is not the case for a horizontally oriented tank sincethe cross-sectional area as a function of vertical height varies in a sinusoidal manner. Thevolume of water measured by the central node on the vertical plane (sensor position 4 onall sensor busses) is the largest as compared to the top and bottom layer volumes, whichare equal and are the smallest.
This influences the way the average temperature of the tank along the vertical planeis calculated. Since the nodal volumes for each vertically positioned sensor are different,a weighted average calculation is more appropriate when the average temperature isrequired for analyses. Each nodal temperature that is measured in the vertical plane of thetank is multiplied by the volume of the measured region and divided by the total volumeto act as a contribution factor. These 9 weighted values are added together to obtain theoverall weighted average of the temperature in the tank at a specific point in time. Theweighted average expression used is shown below in Equation (2).
Tmean,vertical =1
Vtotal
8
∑j=0
Vj Tj (2)
where Vj and Tj are the nodal volume and measured temperature at sensor j, respectively.For the physical design shown in Figure 2, the nodal volumes for each sensed region
in the vertical plane is tabulated below in Table 1. It is important to note that when thesevolumes are used to calculate the weighted average of the vertical temperature variationin the tank, the assumption is made that the longitudinal and transverse temperaturevariation along the length, and along the horizontal radius of the tank is negligible and canbe ignored. The volumetric-weighted temperature average is determined and visualised inSection 4 for each longitudinal position in the tank.
Table 1. Volumes (based on design geometry) for each layer from sensor 0 at the top to sensor 8 atthe bottom.
Layer Volume
V0 9.42 LV1 15.69 LV2 18.84 LV3 20.51 LV4 21.08 LV5 20.51 LV6 18.84 LV7 15.69 LV8 9.42 L
4. Results
The test station is evaluated through its ability to (1) sample data of three-dimensionalthermal variation in the EWH tank for static and dynamic modes of operation and theassociated energy consumption, (2) emulate a user-defined environment which includesa set temperature for emulated ambient temperature and inlet water temperature, and(3) follow a predefined water usage and electrical availability schedule.
4.1. Static Heating and Cooling (No Water Draw)
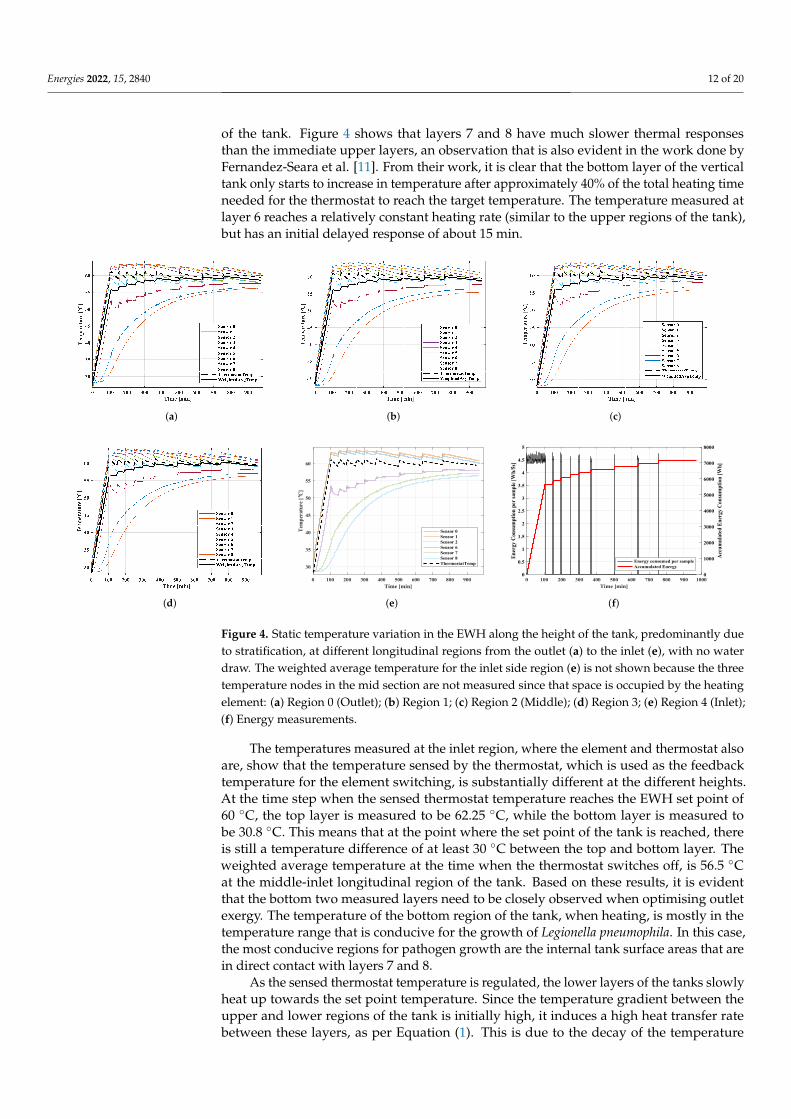
The EWH was subjected to a thermostatically controlled heating process, with a 60 ◦Cset point and an initial bulk temperature of 28 ◦C. The measured thermostat temperatureand weighted temperature average are shown in Figure 4. During the initial heating process,most of the upper layers in the tank exhibited a constant heating rate of approximately0.31 ◦C/min, while the bottom three layers had a slower thermal response during theheating process. This is true for every longitudinal position measured along the length
Energies 2022, 15, 2840 12 of 20
of the tank. Figure 4 shows that layers 7 and 8 have much slower thermal responsesthan the immediate upper layers, an observation that is also evident in the work done byFernandez-Seara et al. [11]. From their work, it is clear that the bottom layer of the verticaltank only starts to increase in temperature after approximately 40% of the total heating timeneeded for the thermostat to reach the target temperature. The temperature measured atlayer 6 reaches a relatively constant heating rate (similar to the upper regions of the tank),but has an initial delayed response of about 15 min.
(a) (b) (c)
(d)
0 100 200 300 400 500 600 700 800 900Time [min]
30
35
40
45
50
55
60
Tem
pera
ture
[°C
]
Sensor 0Sensor 1Sensor 2Sensor 6Sensor 7Sensor 8ThermostatTemp
(e)
0 100 200 300 400 500 600 700 800 900 1000Time [min]
0
0.5
1
1.5
2
2.5
3
3.5
4
4.5
5
Ene
rgy
Con
sum
ptio
n pe
r sa
mpl
e [W
h/5s
]
0
1000
2000
3000
4000
5000
6000
7000
8000
Acc
umul
ated
Ene
rgy
Con
sum
ptio
n [W
h]
Energy consumed per sampleAccumulated Energy
(f)
Figure 4. Static temperature variation in the EWH along the height of the tank, predominantly dueto stratification, at different longitudinal regions from the outlet (a) to the inlet (e), with no waterdraw. The weighted average temperature for the inlet side region (e) is not shown because the threetemperature nodes in the mid section are not measured since that space is occupied by the heatingelement: (a) Region 0 (Outlet); (b) Region 1; (c) Region 2 (Middle); (d) Region 3; (e) Region 4 (Inlet);(f) Energy measurements.
The temperatures measured at the inlet region, where the element and thermostat alsoare, show that the temperature sensed by the thermostat, which is used as the feedbacktemperature for the element switching, is substantially different at the different heights.At the time step when the sensed thermostat temperature reaches the EWH set point of60 ◦C, the top layer is measured to be 62.25 ◦C, while the bottom layer is measured tobe 30.8 ◦C. This means that at the point where the set point of the tank is reached, thereis still a temperature difference of at least 30 ◦C between the top and bottom layer. Theweighted average temperature at the time when the thermostat switches off, is 56.5 ◦Cat the middle-inlet longitudinal region of the tank. Based on these results, it is evidentthat the bottom two measured layers need to be closely observed when optimising outletexergy. The temperature of the bottom region of the tank, when heating, is mostly in thetemperature range that is conducive for the growth of Legionella pneumophila. In this case,the most conducive regions for pathogen growth are the internal tank surface areas that arein direct contact with layers 7 and 8.
As the sensed thermostat temperature is regulated, the lower layers of the tanks slowlyheat up towards the set point temperature. Since the temperature gradient between theupper and lower regions of the tank is initially high, it induces a high heat transfer ratebetween these layers, as per Equation (1). This is due to the decay of the temperature
Energies 2022, 15, 2840 13 of 20
gradient between the upper and the lower regions of the tank. Consequently, thermalenergy is lost from the top layers (and equivalently gained by the bottom layers) faster atthe start of the temperature regulation phase. This is evident when analysing the switchingfrequency of the thermostat in Figure 4, which was more than double between 100 and250 min than that observed from 500 and 750 min.
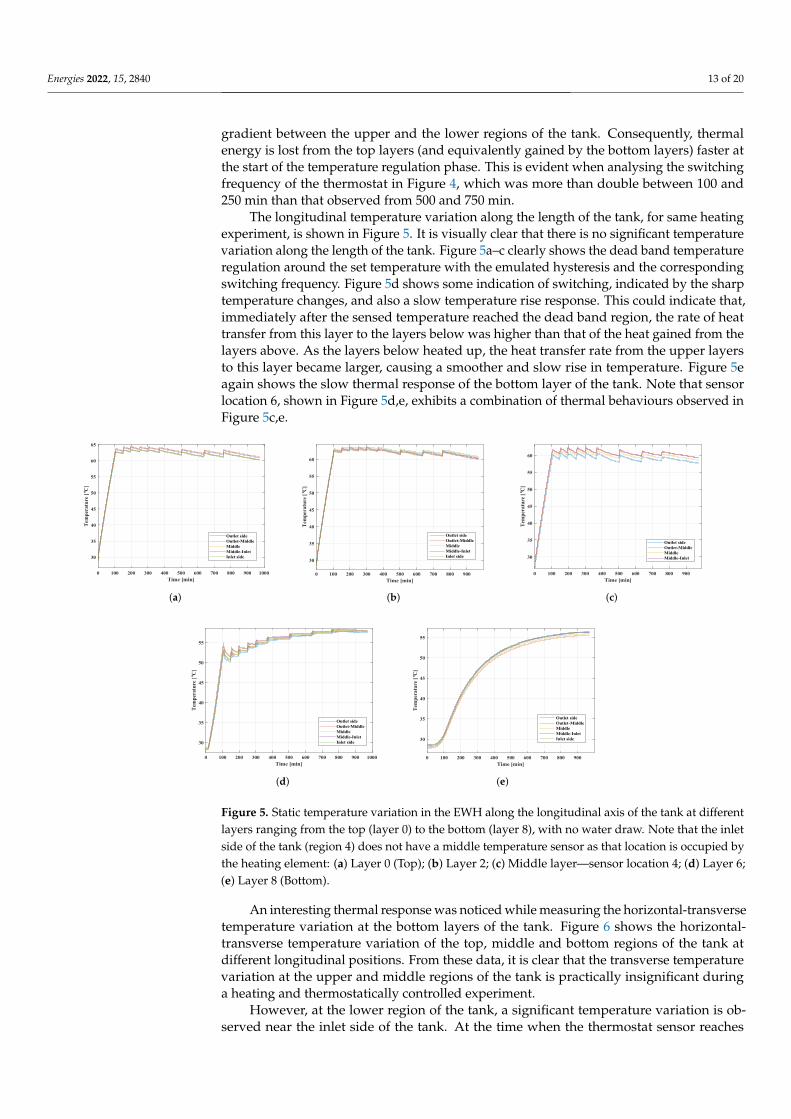
The longitudinal temperature variation along the length of the tank, for same heatingexperiment, is shown in Figure 5. It is visually clear that there is no significant temperaturevariation along the length of the tank. Figure 5a–c clearly shows the dead band temperatureregulation around the set temperature with the emulated hysteresis and the correspondingswitching frequency. Figure 5d shows some indication of switching, indicated by the sharptemperature changes, and also a slow temperature rise response. This could indicate that,immediately after the sensed temperature reached the dead band region, the rate of heattransfer from this layer to the layers below was higher than that of the heat gained from thelayers above. As the layers below heated up, the heat transfer rate from the upper layersto this layer became larger, causing a smoother and slow rise in temperature. Figure 5eagain shows the slow thermal response of the bottom layer of the tank. Note that sensorlocation 6, shown in Figure 5d,e, exhibits a combination of thermal behaviours observed inFigure 5c,e.
0 100 200 300 400 500 600 700 800 900 1000Time [min]
30
35
40
45
50
55
60
65
Tem
pera
ture
[°C
]
Outlet sideOutlet-MiddleMiddleMiddle-InletInlet side
(a)
0 100 200 300 400 500 600 700 800 900Time [min]
30
35
40
45
50
55
60
Tem
pera
ture
[°C
]
Outlet sideOutlet-MiddleMiddleMiddle-InletInlet side
(b)
0 100 200 300 400 500 600 700 800 900Time [min]
30
35
40
45
50
55
60
Tem
pera
ture
[°C
]
Outlet sideOutlet-MiddleMiddleMiddle-Inlet
(c)
0 100 200 300 400 500 600 700 800 900 1000Time [min]
30
35
40
45
50
55
Tem
pera
ture
[°C
]
Outlet sideOutlet-MiddleMiddleMiddle-InletInlet side
(d)
0 100 200 300 400 500 600 700 800 900Time [min]
30
35
40
45
50
55
Tem
pera
ture
[°C
]
Outlet sideOutlet-MiddleMiddleMiddle-InletInlet side
(e)
Figure 5. Static temperature variation in the EWH along the longitudinal axis of the tank at differentlayers ranging from the top (layer 0) to the bottom (layer 8), with no water draw. Note that the inletside of the tank (region 4) does not have a middle temperature sensor as that location is occupied bythe heating element: (a) Layer 0 (Top); (b) Layer 2; (c) Middle layer—sensor location 4; (d) Layer 6;(e) Layer 8 (Bottom).
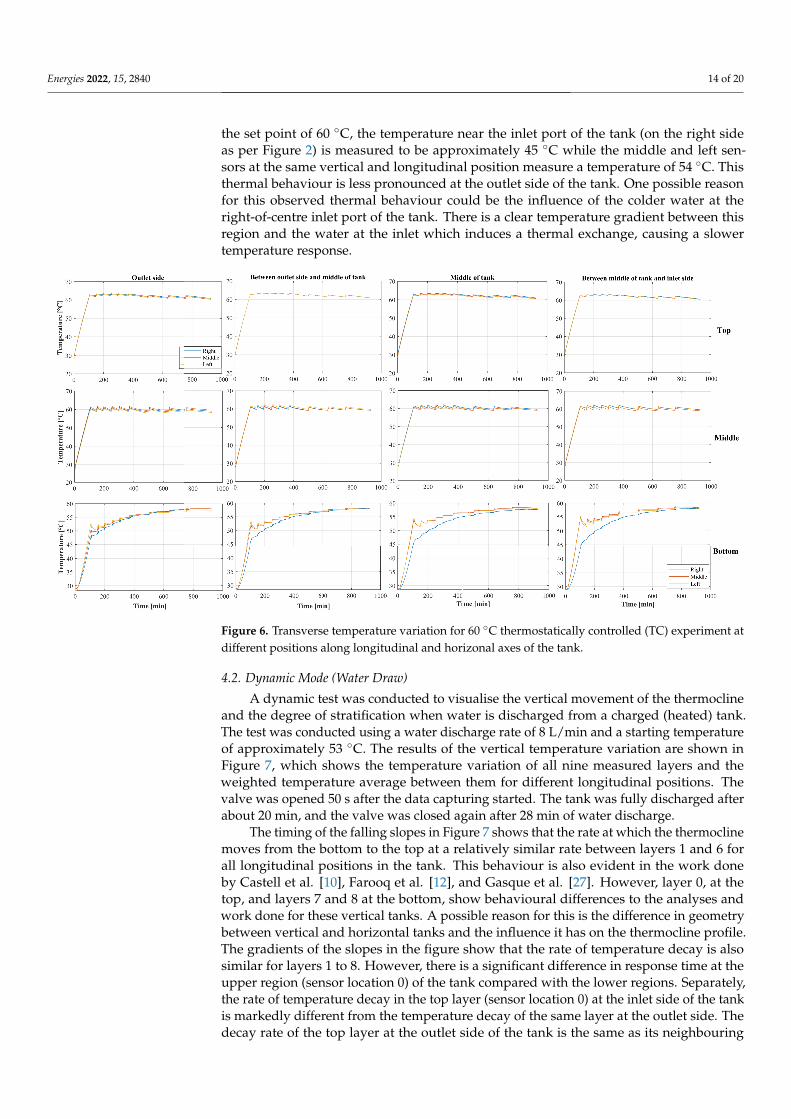
An interesting thermal response was noticed while measuring the horizontal-transversetemperature variation at the bottom layers of the tank. Figure 6 shows the horizontal-transverse temperature variation of the top, middle and bottom regions of the tank atdifferent longitudinal positions. From these data, it is clear that the transverse temperaturevariation at the upper and middle regions of the tank is practically insignificant duringa heating and thermostatically controlled experiment.
However, at the lower region of the tank, a significant temperature variation is ob-served near the inlet side of the tank. At the time when the thermostat sensor reaches
Energies 2022, 15, 2840 14 of 20
the set point of 60 ◦C, the temperature near the inlet port of the tank (on the right sideas per Figure 2) is measured to be approximately 45 ◦C while the middle and left sen-sors at the same vertical and longitudinal position measure a temperature of 54 ◦C. Thisthermal behaviour is less pronounced at the outlet side of the tank. One possible reasonfor this observed thermal behaviour could be the influence of the colder water at theright-of-centre inlet port of the tank. There is a clear temperature gradient between thisregion and the water at the inlet which induces a thermal exchange, causing a slowertemperature response.
������������� ��� �����������������
��� ���������������������� � ��� �� ����!�� � ��� �� ����!��"��#� ����� ����������������� �
Figure 6. Transverse temperature variation for 60 ◦C thermostatically controlled (TC) experiment atdifferent positions along longitudinal and horizonal axes of the tank.
4.2. Dynamic Mode (Water Draw)
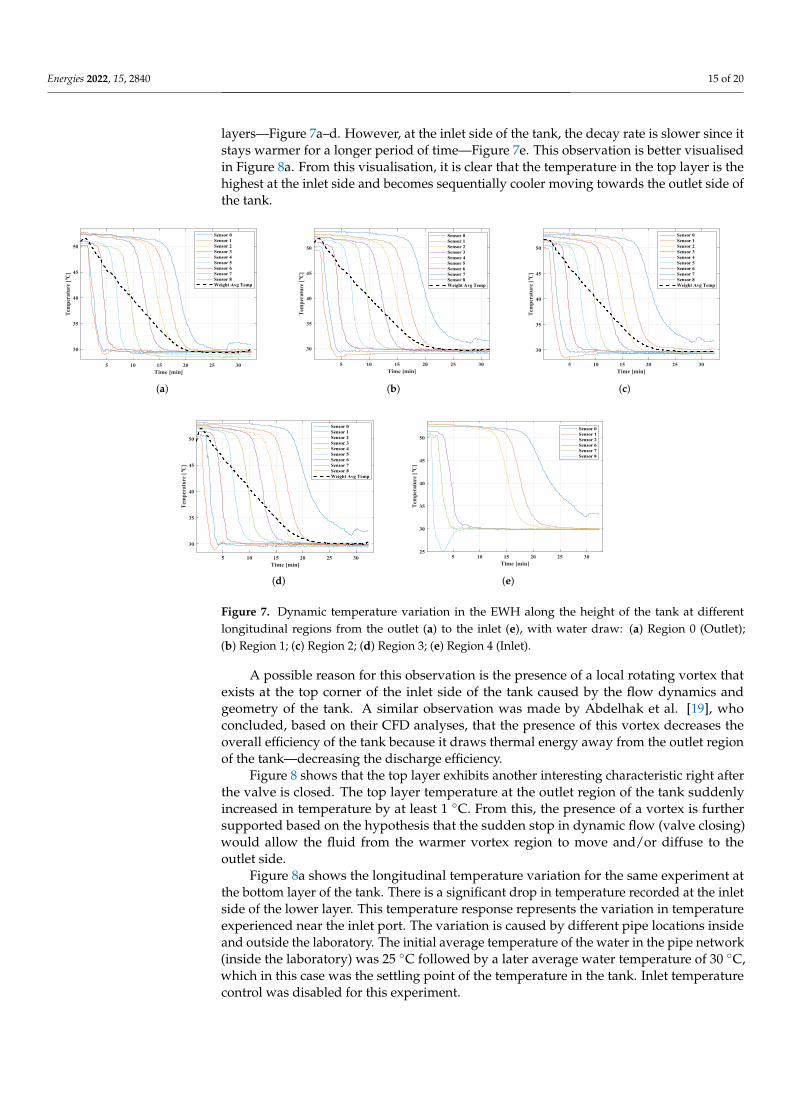
A dynamic test was conducted to visualise the vertical movement of the thermoclineand the degree of stratification when water is discharged from a charged (heated) tank.The test was conducted using a water discharge rate of 8 L/min and a starting temperatureof approximately 53 ◦C. The results of the vertical temperature variation are shown inFigure 7, which shows the temperature variation of all nine measured layers and theweighted temperature average between them for different longitudinal positions. Thevalve was opened 50 s after the data capturing started. The tank was fully discharged afterabout 20 min, and the valve was closed again after 28 min of water discharge.
The timing of the falling slopes in Figure 7 shows that the rate at which the thermoclinemoves from the bottom to the top at a relatively similar rate between layers 1 and 6 forall longitudinal positions in the tank. This behaviour is also evident in the work doneby Castell et al. [10], Farooq et al. [12], and Gasque et al. [27]. However, layer 0, at thetop, and layers 7 and 8 at the bottom, show behavioural differences to the analyses andwork done for these vertical tanks. A possible reason for this is the difference in geometrybetween vertical and horizontal tanks and the influence it has on the thermocline profile.The gradients of the slopes in the figure show that the rate of temperature decay is alsosimilar for layers 1 to 8. However, there is a significant difference in response time at theupper region (sensor location 0) of the tank compared with the lower regions. Separately,the rate of temperature decay in the top layer (sensor location 0) at the inlet side of the tankis markedly different from the temperature decay of the same layer at the outlet side. Thedecay rate of the top layer at the outlet side of the tank is the same as its neighbouring
Energies 2022, 15, 2840 15 of 20
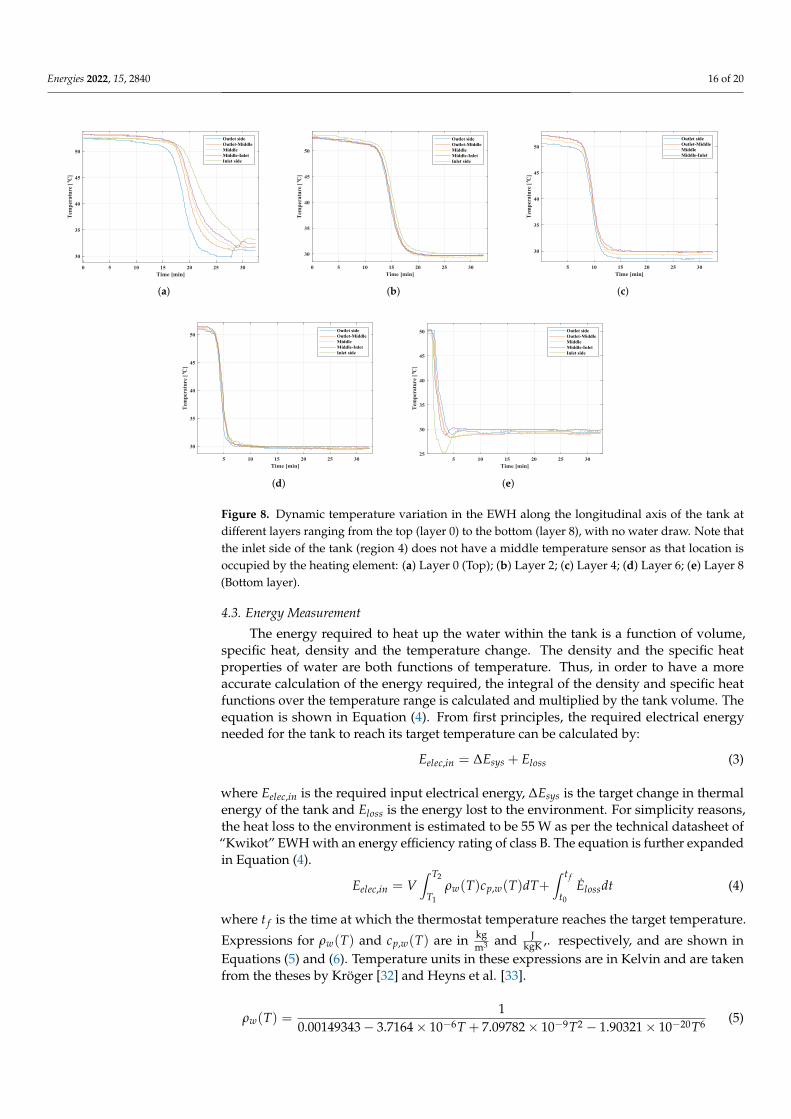
layers—Figure 7a–d. However, at the inlet side of the tank, the decay rate is slower since itstays warmer for a longer period of time—Figure 7e. This observation is better visualisedin Figure 8a. From this visualisation, it is clear that the temperature in the top layer is thehighest at the inlet side and becomes sequentially cooler moving towards the outlet side ofthe tank.
5 10 15 20 25 30Time [min]
30
35
40
45
50
Tem
pera
ture
[°C
]
Sensor 0Sensor 1Sensor 2Sensor 3Sensor 4Sensor 5Sensor 6Sensor 7Sensor 8Weight Avg Temp
(a)
5 10 15 20 25 30Time [min]
30
35
40
45
50
Tem
pera
ture
[°C
]
Sensor 0Sensor 1Sensor 2Sensor 3Sensor 4Sensor 5Sensor 6Sensor 7Sensor 8Weight Avg Temp
(b)
5 10 15 20 25 30Time [min]
30
35
40
45
50
Tem
pera
ture
[°C
]
Sensor 0Sensor 1Sensor 2Sensor 3Sensor 4Sensor 5Sensor 6Sensor 7Sensor 8Weight Avg Temp
(c)
5 10 15 20 25 30Time [min]
30
35
40
45
50
Tem
pera
ture
[°C
]
Sensor 0Sensor 1Sensor 2Sensor 3Sensor 4Sensor 5Sensor 6Sensor 7Sensor 8Weight Avg Temp
(d)
5 10 15 20 25 30Time [min]
25
30
35
40
45
50
Tem
pera
ture
[°C
]
Sensor 0Sensor 1Sensor 2Sensor 6Sensor 7Sensor 8
(e)
Figure 7. Dynamic temperature variation in the EWH along the height of the tank at differentlongitudinal regions from the outlet (a) to the inlet (e), with water draw: (a) Region 0 (Outlet);(b) Region 1; (c) Region 2; (d) Region 3; (e) Region 4 (Inlet).
A possible reason for this observation is the presence of a local rotating vortex thatexists at the top corner of the inlet side of the tank caused by the flow dynamics andgeometry of the tank. A similar observation was made by Abdelhak et al. [19], whoconcluded, based on their CFD analyses, that the presence of this vortex decreases theoverall efficiency of the tank because it draws thermal energy away from the outlet regionof the tank—decreasing the discharge efficiency.
Figure 8 shows that the top layer exhibits another interesting characteristic right afterthe valve is closed. The top layer temperature at the outlet region of the tank suddenlyincreased in temperature by at least 1 ◦C. From this, the presence of a vortex is furthersupported based on the hypothesis that the sudden stop in dynamic flow (valve closing)would allow the fluid from the warmer vortex region to move and/or diffuse to theoutlet side.
Figure 8a shows the longitudinal temperature variation for the same experiment atthe bottom layer of the tank. There is a significant drop in temperature recorded at the inletside of the lower layer. This temperature response represents the variation in temperatureexperienced near the inlet port. The variation is caused by different pipe locations insideand outside the laboratory. The initial average temperature of the water in the pipe network(inside the laboratory) was 25 ◦C followed by a later average water temperature of 30 ◦C,which in this case was the settling point of the temperature in the tank. Inlet temperaturecontrol was disabled for this experiment.
Energies 2022, 15, 2840 16 of 20
0 5 10 15 20 25 30Time [min]
30
35
40
45
50
Tem
pera
ture
[°C
]
Outlet sideOutlet-MiddleMiddleMiddle-InletInlet side
(a)
0 5 10 15 20 25 30Time [min]
30
35
40
45
50
Tem
pera
ture
[°C
]
Outlet sideOutlet-MiddleMiddleMiddle-InletInlet side
(b)
5 10 15 20 25 30Time [min]
30
35
40
45
50
Tem
pera
ture
[°C
]
Outlet sideOutlet-MiddleMiddleMiddle-Inlet
(c)
5 10 15 20 25 30Time [min]
30
35
40
45
50
Tem
pera
ture
[°C
]
Outlet sideOutlet-MiddleMiddleMiddle-InletInlet side
(d)
5 10 15 20 25 30Time [min]
25
30
35
40
45
50
Tem
pera
ture
[°C
]
Outlet sideOutlet-MiddleMiddleMiddle-InletInlet side
(e)
Figure 8. Dynamic temperature variation in the EWH along the longitudinal axis of the tank atdifferent layers ranging from the top (layer 0) to the bottom (layer 8), with no water draw. Note thatthe inlet side of the tank (region 4) does not have a middle temperature sensor as that location isoccupied by the heating element: (a) Layer 0 (Top); (b) Layer 2; (c) Layer 4; (d) Layer 6; (e) Layer 8(Bottom layer).
4.3. Energy Measurement
The energy required to heat up the water within the tank is a function of volume,specific heat, density and the temperature change. The density and the specific heatproperties of water are both functions of temperature. Thus, in order to have a moreaccurate calculation of the energy required, the integral of the density and specific heatfunctions over the temperature range is calculated and multiplied by the tank volume. Theequation is shown in Equation (4). From first principles, the required electrical energyneeded for the tank to reach its target temperature can be calculated by:
Eelec,in = ∆Esys + Eloss (3)
where Eelec,in is the required input electrical energy, ∆Esys is the target change in thermalenergy of the tank and Eloss is the energy lost to the environment. For simplicity reasons,the heat loss to the environment is estimated to be 55 W as per the technical datasheet of“Kwikot” EWH with an energy efficiency rating of class B. The equation is further expandedin Equation (4).
Eelec,in = V∫ T2
T1
ρw(T)cp,w(T)dT+∫ t f
t0
Elossdt (4)
where t f is the time at which the thermostat temperature reaches the target temperature.
Expressions for ρw(T) and cp,w(T) are in kgm3 and J
kgK ,. respectively, and are shown inEquations (5) and (6). Temperature units in these expressions are in Kelvin and are takenfrom the theses by Kröger [32] and Heyns et al. [33].
ρw(T) =1
0.00149343 − 3.7164 × 10⁻⁶T + 7.09782 × 10⁻⁹T2 − 1.90321 × 10⁻²⁰T6 (5)
Energies 2022, 15, 2840 17 of 20
cp,w(T) = 8155.9 − 20.80627T + 0.0511283T2 − 2.17582 × 10⁻¹³T6 (6)
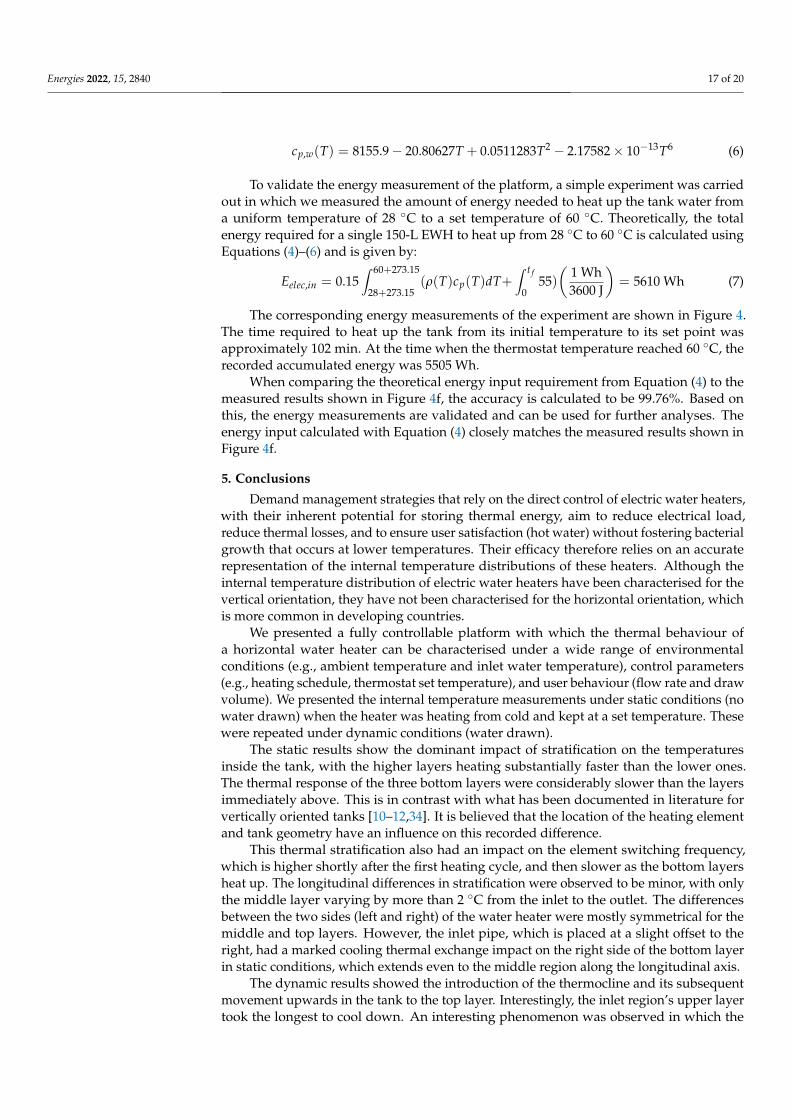
To validate the energy measurement of the platform, a simple experiment was carriedout in which we measured the amount of energy needed to heat up the tank water froma uniform temperature of 28 ◦C to a set temperature of 60 ◦C. Theoretically, the totalenergy required for a single 150-L EWH to heat up from 28 ◦C to 60 ◦C is calculated usingEquations (4)–(6) and is given by:
Eelec,in = 0.15∫ 60+273.15
28+273.15(ρ(T)cp(T)dT+
∫ t f
055)(
1 Wh3600 J
)= 5610 Wh (7)
The corresponding energy measurements of the experiment are shown in Figure 4.The time required to heat up the tank from its initial temperature to its set point wasapproximately 102 min. At the time when the thermostat temperature reached 60 ◦C, therecorded accumulated energy was 5505 Wh.
When comparing the theoretical energy input requirement from Equation (4) to themeasured results shown in Figure 4f, the accuracy is calculated to be 99.76%. Based onthis, the energy measurements are validated and can be used for further analyses. Theenergy input calculated with Equation (4) closely matches the measured results shown inFigure 4f.
5. Conclusions
Demand management strategies that rely on the direct control of electric water heaters,with their inherent potential for storing thermal energy, aim to reduce electrical load,reduce thermal losses, and to ensure user satisfaction (hot water) without fostering bacterialgrowth that occurs at lower temperatures. Their efficacy therefore relies on an accuraterepresentation of the internal temperature distributions of these heaters. Although theinternal temperature distribution of electric water heaters have been characterised for thevertical orientation, they have not been characterised for the horizontal orientation, whichis more common in developing countries.
We presented a fully controllable platform with which the thermal behaviour ofa horizontal water heater can be characterised under a wide range of environmentalconditions (e.g., ambient temperature and inlet water temperature), control parameters(e.g., heating schedule, thermostat set temperature), and user behaviour (flow rate and drawvolume). We presented the internal temperature measurements under static conditions (nowater drawn) when the heater was heating from cold and kept at a set temperature. Thesewere repeated under dynamic conditions (water drawn).
The static results show the dominant impact of stratification on the temperaturesinside the tank, with the higher layers heating substantially faster than the lower ones.The thermal response of the three bottom layers were considerably slower than the layersimmediately above. This is in contrast with what has been documented in literature forvertically oriented tanks [10–12,34]. It is believed that the location of the heating elementand tank geometry have an influence on this recorded difference.
This thermal stratification also had an impact on the element switching frequency,which is higher shortly after the first heating cycle, and then slower as the bottom layersheat up. The longitudinal differences in stratification were observed to be minor, with onlythe middle layer varying by more than 2 ◦C from the inlet to the outlet. The differencesbetween the two sides (left and right) of the water heater were mostly symmetrical for themiddle and top layers. However, the inlet pipe, which is placed at a slight offset to theright, had a marked cooling thermal exchange impact on the right side of the bottom layerin static conditions, which extends even to the middle region along the longitudinal axis.
The dynamic results showed the introduction of the thermocline and its subsequentmovement upwards in the tank to the top layer. Interestingly, the inlet region’s upper layertook the longest to cool down. An interesting phenomenon was observed in which the
Energies 2022, 15, 2840 18 of 20
temperature at the outlet rose for a few minutes after valve was closed. We believe thismay be a thermal exchange from the trapped heat in the fluid-driven vortex at the top layer,near the inlet side of the tank.
We have shown that there is more going on inside a horizontal water heater thanwhat could be explained by considering vertical water heaters. We have shown that thereexist interesting phenomena in the longitudinal and traversal axes, for both static anddynamic conditions. Finally, we have shown results that highlight the slight differences inthermocline dynamics between horizontal- and vertical tanks, specifically at the top andbottom layers, owing to different layer volumes and tank geometry. However, explainingthese fully will require further work. Two examples of open questions are: the extent andexact mechanism by which a potential vortex affects the temperatures at the outlet, andthe energy transfer characteristics between the inlet pipe coupling and the warm water inits vicinity.
Author Contributions: Conceptualization, P.D.v.S., J.A.A.E. and M.J.B. ; methodology, P.D.v.S.,J.A.A.E. and M.J.B.; software, P.D.v.S.; validation, P.D.v.S., J.A.A.E. and M.J.B., formal analysis, P.D.v.S.,J.A.A.E. and M.J.B.; investigation, P.D.v.S.; resources, M.J.B.; data curation, P.D.v.S.; writing—originaldraft preparation, P.D.v.S.; writing—review and editing, J.A.A.E. and M.J.B.; visualization, P.D.v.S.,J.A.A.E. and M.J.B.; supervision, J.A.A.E. and M.J.B.; project administration, M.J.B.; funding acquisi-tion, M.J.B. All authors have read and agreed to the published version of the manuscript.
Funding: This research received no external funding.
Data Availability Statement: Not applicable.
Acknowledgments: We thank the following organisations for funding: MTN South Africa (S003061)and Eskom (TESP:2020).
Conflicts of Interest: The authors declare no conflict of interest.
Nomenclature
∆t Sampling period V Volumecp Specific heat capacity of water V Volumetric flow rateE Energy Str Stratification numbert Time ∆z Vertical distance between centre of layersQ Heat transfer rate Eloss Environmental heat lossk Thermal conductivity j Layer numberα Thermal diffusivity y Distance from bottom of tank to centre
of layerρw Density of water Pe Peclet numberAs Surface area H Height of tankT Temperature r Radius of tankT Rate of change of temperature g Gravitational acceleration constantJ Number of layers (nodes) β Coefficient of thermal expansion
References1. Yildiz, B.; Bilbao, J.I.; Roberts, M.; Heslop, S.; Dore, J.; Bruce, A.; MacGill, I.; Egan, R.J.; Sproul, A.B. Analysis of electricity
consumption and thermal storage of domestic electric water heating systems to utilize excess PV generation. Energy 2021,235, 121325. [CrossRef]
2. Tejero-Gómez, J.A.; Bayod-Rújula, A.A. Energy management system design oriented for energy cost optimization in electricwater heaters. Energy Build. 2021, 243, 111012. [CrossRef]
3. Roux, M.; Apperley, M.; Booysen, M.J. Comfort, peak load and energy: Centralised control of water heaters for demand-drivenprioritisation. Energy Sustain. Dev. 2018, 44, 78–86. [CrossRef]
4. Hohne, P.A.; Kusakana, K.; Numbi, B.P. A review of water heating technologies: An application to the South African context.Energy Rep. 2019, 5, 1–19. [CrossRef]
5. International Energy Agency. World Energy Outlook 2018; International Energy Agency: Paris, France, 2018; p. 661. [CrossRef]
Energies 2022, 15, 2840 19 of 20
6. Diao, R.; Lu, S.; Elizondo, M.; Mayhorn, E.; Zhang, Y.; Samaan, N. Electric water heater modeling and control strategies fordemand response. In Proceedings of the 2012 IEEE Power and Energy Society General Meeting, San Diego, CA, USA, 22–26 July2012; pp. 1–8. [CrossRef]
7. Xu, Z.; Diao, R.; Lu, S.; Lian, J.; Zhang, Y. Modeling of Electric Water Heaters for Demand Response: A Baseline PDE Model.IEEE Trans. Smart Grid 2014, 5, 2203–2210. [CrossRef]
8. Stone, W.; Louw, T.; Gakingo, G.; Nieuwoudt, M.; Booysen, M.J. A potential source of undiagnosed Legionellosis: Legionellagrowth in domestic water heating systems in South Africa. Energy Sustain. Dev. 2019, 48, 130–138. [CrossRef]
9. Chandra, Y.P.; Matuska, T. Stratification analysis of domestic hot water storage tanks: A comprehensive review. Energy Build.2019, 187, 110–131. [CrossRef]
10. Castell, A.; Medrano, M.; Solé, C.; Cabeza, L.F. Dimensionless numbers used to characterize stratification in water tanks fordischarging at low flow rates. Renew. Energy 2010, 35, 2192–2199. [CrossRef]
11. Fernández-Seara, J.; Uhía, F.J.; Sieres, J. Experimental analysis of a domestic electric hot water storage tank. Part I: Static mode ofoperation. Appl. Therm. Eng. 2007, 27, 129–136. [CrossRef]
12. Farooq, A.A.; Afram, A.; Schulz, N.; Janabi-Sharifi, F. Grey-box modeling of a low pressure electric boiler for domestic hot watersystem. Appl. Therm. Eng. 2015, 84, 257–267. [CrossRef]
13. Dolan, P.S.; Nehrir, M.H.; Gerez, V. Development of a Monte Carlo based aggregate model for residential electric water heaterloads. Electr. Power Syst. Res. 1996, 36, 29–35. [CrossRef]
14. Kondoh, J.; Lu, N.; Hammerstrom, D.J. An Evaluation of the Water Heater Load Potential for Providing Regulation Service. IEEETrans. Power Syst. 2011, 26, 1309–1316. [CrossRef]
15. Leeuwner, L.L.; Booysen, M.J.; Visagie, L. Evaluation of the energy model of a horizontally-mounted electric water heater throughinternal temperature measurement. In Proceedings of the 2017 IEEE Innovative Smart Grid Technologies—Asia (ISGT-Asia),Auckland, New Zealand, 4–7 December 2017.
16. Engelbrecht, J.A.A.; Ritchie, M.J.; Booysen, M.J. Optimal schedule and temperature control of stratified water heaters. EnergySustain. Dev. 2021, 62, 67–81. [CrossRef]
17. Nel, P.J.C.; Booysen, M.J.; van der Merwe, B. A Computationally Inexpensive Energy Model for Horizontal Electric Water HeatersWith Scheduling. IEEE Trans. Smart Grid 2018, 9, 48–56. [CrossRef]
18. Fernández-Seara, J.; Uhı, F.J.; Sieres, J. Experimental analysis of a domestic electric hot water storage tank. Part II: Dynamic modeof operation. Appl. Therm. Eng. 2007, 27, 137–144. [CrossRef]
19. Abdelhak, O.; Mhiri, H.; Bournot, P. CFD analysis of thermal stratification in domestic hot water storage tank during dynamicmode. Build. Simul. 2015, 8, 421–429. [CrossRef]
20. Rosen, M.A. The exergy of stratified thermal energy storages. Sol. Energy 2001, 71, 173–185. [CrossRef]21. Armstrong, P.; Ager, D.; Thompson, I.; McCulloch, M. Domestic hot water storage: Balancing thermal and sanitary performance.
Energy Policy 2014, 68, 334–339. [CrossRef]22. Booysen, M.J.; Cloete, A.H. Sustainability through intelligent scheduling of electric water heaters in a smart grid. In Pro-
ceedings of the 2016 IEEE 14th Intl Conf on Dependable, Autonomic and Secure Computing, 14th Intl Conf on PervasiveIntelligence and Computing, 2nd Intl Conf on Big Data Intelligence and Computing and Cyber Science and TechnologyCongress(DASC/PiCom/DataCom/CyberSciTech), Auckland, New Zealand, 8–12 August 2016, pp. 848–855. [CrossRef]
23. Ritchie, M.J.; Engelbrecht, J.A.A.; Booysen, M.J. Centrally Adapted Optimal Control of Multiple Electric Water Heaters. Energies2022, 15, 1521. [CrossRef]
24. Kizilors, C.; Aydin, D. Effect of thermostat position and its set-point temperature on the performance of a domestic electric waterheater. Int. J. -Low-Carbon Technol. 2021, 15, 373–381. [CrossRef]
25. Baeten, B.; Confrey, T.; Pecceu, S.; Rogiers, F.; Helsen, L. A validated model for mixing and buoyancy in stratified hot waterstorage tanks for use in building energy simulations. Appl. Energy 2016, 172, 217–229. [CrossRef]
26. González-Altozano, P.; Gasque, M.; Ibáñez, F.; Gutiérrez-Colomer, R.P. New methodology for the characterisation of thermalperformance in a hot water storage tank during charging. Appl. Therm. Eng. 2015, 84, 196–205. [CrossRef]
27. Gasque, M.; Ibáñez, F.; González-Altozano, P. Minimum number of experimental data for the thermal characterization of a hotwater storage tank. Energies 2021, 14, 4741. [CrossRef]
28. Nel, P.J.C.; Booysen, M.J.; van der Merwe, B. Saving on household electric water heating: What works best and by how much? InProceedings of the 2017 IEEE Innovative Smart Grid Technologies—Asia (ISGT-Asia), Auckland, New Zealand, 4–7 December2017; pp. 1–6. [CrossRef]
29. Heidari, A.; Olsen, N.; Mermod, P.; Alahi, A.; Khovalyg, D. Adaptive hot water production based on Supervised Learning.Sustain. Cities Soc. 2021, 66, 102625. [CrossRef]
30. Ritchie, M.J.; Engelbrecht, J.A.A.; Booysen, M.J. A probabilistic hot water usage model and simulator for use in residential energymanagement. Energy Build. 2021, 235. [CrossRef]
31. Kepplinger, P.; Huber, G.; Preißinger, M.; Petrasch, J. State estimation of resistive domestic hot water heaters in arbitrary operationmodes for demand side management. Therm. Sci. Eng. Prog. 2019, 9, 94–109. [CrossRef]
32. Kröger, D.G. Air-Cooled Heat Exchangers and Cooling Towers Thermal-flow Performance Evaluation and Design. Ph.D. Thesis,Stellenbosch University, Stellenbosch, South Africa, 2004.

Energies 2022, 15, 2840 20 of 20
33. Heyns, J.A.; Kröger, D.G. Performance Characteristics of an Air-Cooled Steam Condenser Incorporating a Hybrid (Dry/Wet)Dephlegmator. Ph.D. Thesis, Stellenbosch University, Stellenbosch, South Africa, 2008.
34. Van Schalkwyk, P.D.; Engelbrecht, J.A.A.; Booysen, M.J. Inside and out: A platform to characterise stratification in horizontalelectric water heaters. In Proceedings of the 2021 International Conference on Electrical, Computer and Energy Technologies(ICECET), Cape Town, South Africa, 9–10 December 2021; pp. 1–7. [CrossRef]