Embed Size (px)
Citation preview

To Downsize or Not
To Downsize or not to Downsize – What does the Empirical Evidence Suggest?
Abstract
There has been much written about the effects of downsizing on the financial health and the market valuation of companies that engage in this practice. But this literature is fragmented, focusing on various aspects of companies, various reasons for downsizing, and various financial and market outcome measures. The present study was conducted to try and address some of this fragmentation by comparing those companies that downsized in 2008, while financially healthy or not, with those companies that did not downsize. The impact of the downsizing event was assessed by using various financial measures as well as a measure of company market valuation over the short-term (2009-2011) and long-term (2009-2014). Findings indicate that across all financial measures, except Return on Equity, downsizing makes no difference to the financial health of a company either in the short term (up to 3 years after the downsizing) or in the long-term (up to 6 years after the downsizing). And with regards to Return on Equity, downsizing companies immediately after the downsizing were more inefficient in their use of equity. A theory is proposed to explain the persistence of the use of downsizing in the face of evidence that suggests it is not effective in addressing financial and market difficulties. The hope is that this work will better inform, not only scholars, but also senior leaders faced with a decision to downsize or not to downsize.
Michael S. Carriger, M.S., D.Mgt.Sacred Heart University
Welch College of Business
Keywords: downsizing, financial health, impact of downsizing, proactive downsizing, reactive downsizing
1

To Downsize or Not
A CEO is faced with a saturated market, falling sales, declining revenue, little
strategic direction, and a parent company clamoring for its return on budgeted revenue.
What does the CEO do? The CEO of this actual company (identifying details withheld to
protect the anonymity of the company) does the unthinkable, at least at this company, he
downsizes in order to cut costs and make the return to the parent company. After
shedding 7% of his workforce, the CEO addresses the remaining employees. He tells
them how hard this decision was to make. The company has never laid off workers
before. He tells them that this was not a “downsizing” but a “rightsizing”. That this was
necessary in order to adjust the company to new market demands. He tells them that this
was a one time event precipitated by change in the market place and financial demands.
He tells them that this “rightsizing” will put the company back on the track to success.
One year later the market is still saturated, sales continue to decline, revenue is still
stagnant, and the parent is still clamoring for its return. So, the CEO downsizes again.
He gives the remaining employees a slightly different message this time. He
underestimated how much “rightsizing” was necessary. This additional “rightsizing” will
fix the problem. But he doesn’t mention that this is a one-time event, as it obviously
isn’t. Over the course of the next three years … four more lay offs … or “rightsizings”.
Obviously, the downsizing did not solve this company’s problems. Yet it
disrupted countless employees lives, both employees downsized and employees
remaining with the company, as well as the community surrounding this company.
Although there has been quite a bit written about the effects of downsizing on the
financial health and the market valuation of companies, this literature is fragmented,
focusing on various aspects of companies, various reasons for downsizing, and various
2

To Downsize or Not
financial and market outcome measures. Additionally, this work has appeared to have
little to no practical impact on the corporate practice of downsizing. One might ask, why
another study on the financial impact of downsizing on corporations. The hope is that a
single, comprehensive, and empirically grounded view of the impact of downsizing could
consolidate opinion about downsizing and impact actual management decisions to:
downsize or not. That is what this paper provides, a brief review of the available research
literature on the impact of downsizing on the ongoing financial health and market
valuation of companies and an analysis of a comprehensive data set looking at the short-
and long-term impact of downsizing on the financial health and market valuation of
companies that were initially financially struggling or financially healthy. The objective
is to show that despite the significant human impact of downsizing, the downsizing
actually does not significantly improve the downsizing company’s financial health or
market valuation.
Literature Review
A review of the research literature on the impact of downsizing suggests that this
literature can be divided into two categories. One set of research, primarily published in
the management literature, has looked at the impact of downsizing on a company’s
financial health. A second set, primarily published in the finance literature, has looked at
the impact of downsizing on a company’s market valuation. In both cases it is clear that
the downsizing did not significantly improve the financial health or market valuation of
the downsizing companies.
Management Literature
3

To Downsize or Not
With regards to the management literature, Demeuse and colleagues (DeMeuse,
Vanderheiden, & Bergman, 1994; DeMeuse, Bergmann, Vanderheiden & Roraff, 2004;
DeMeuse & Dai, 2013) conducted three studies. In all three studies the authors focused
on the impact of downsizing on the subsequent financial performance of the companies
that downsized. They employed financial outcome measures such as profit margin,
return on assets, return on equity, asset turnover, and market-to-book ratio (DeMeuse, et.
al., 1994; DeMeuse, et. als., 2004) and return on assets, profit margin, revenue growth,
and market capitalization (DeMeuse & Dai, 2013). They followed the companys’
financial progress for 3 years (DeMeuse, et. al., 1994), 4 years (DeMeuse & Dai, 2013)
and 12 years (DeMeuse, et. al., 2004) after the downsizing event. These authors found
that downsizing lead to worse financial performance (DeMeuse, et. al., 1994) two years
after downsizing, with improvement in the third year (DeMeuse, et. al., 2004). They
found that companies engaging in smaller scale downsizing performed better, and
companies engaging in less frequent downsizing performed better (DeMeuse, et. al.,
2004). And they found that non-downsizing companies out performed downsizing
companies, but that this difference diminished over time (DeMeuse & Dai, 2013).
Casio and colleagues (Cascio, Young, & Morris, 1997), looking at return on
assets and return on common stock up to 2 years after a downsizing event, also found that
downsizing did not lead to higher returns, however, downsizing plus asset restructuring
did. Ballester and colleagues (Ballester, Livnat, & Sinha, 1999) considered return on
sales and return on common stock in companies one year after downsizing and found that
downsizing lead to improved stock position but poorer financial performance. Chalos
and Chen (2002), looking at the reasons for downsizing, compared those companies that
4

To Downsize or Not
downsized in reaction to poor financial performance (reactive downsizers) with those
companies that downsized in anticipation of market changes (proactive downsizers) for
three years after the downsizing and found that proactive downsizing was more
successful than reactive downsizing in terms of ongoing financial performance, however,
financial performance did not always correspond with market reaction. Guthrie and
Datta (2008), investigating solely return on assets, though also considering moderator
variables such as industry conditions and human resources policies and procedures, one
year after a downsizing event, found that downsizing had a negative effect on financial
performance, but that industry context moderates the effect. Brauer (2010), again
looking at return on assets, but also considering characteristics of the downsizing process,
one year after a downsizing event, found that smaller layoffs were less damaging than
larger layoffs to the ongoing financial health of the companies and that industry sector
and economic conditions, as well as how the downsizing was communicated, moderated
the effect.
Finally, Datta, Guthrie, Basuil, and Pandey (2010) conducted a narrative review
of the literature including 91 studies conducted between 1984 and 2008, 20 of the studies
focused on the market valuation of the downsizing companies, 19 of the studies focused
on the financial returns of the downsizing companies. The authors found that on average
downsizing announcements had a negative impact on stock price; but that downsizing
had a mixed impact on financial performance. Only two of the studies looked at long-
term impact on stock returns. Most studies used static, cross-sectional rather than
longitudinal design. And studies gave little consideration to alternatives to downsizing as
an approach to address the companies’ issues.
5

To Downsize or Not
In summary, the management literature on downsizing suggests that downsizing
has an overall negative impact on the ongoing financial health of the organization
engaging in such a practice. This effect may be greater for those companies downsizing
in response to previous poor financial performance, may or may not have the same
negative impact on the market valuation of the company, and may dissipate over time.
Additionally, other variables, such as the size and frequency of downsizing, as well as
industry conditions, and the way in which the downsizing was communicated might
moderate these negative financial impacts. However, this group of studies focused
primarily on the short-term impact of downsizing (1 to 3 years after the downsizing
event, with the except of the DeMesue, et. al., 2004 study), only occasionally considered
the reasons for the downsizing (reacting to poor financial performance or proactively
responding to anticipated changes in the market), and only looked at a relatively small set
of financial outcome measures and only occasionally considered the impact on market
valuation. The present study builds on this literature by considering longitudinally the
short-term (1 to 3 years) and long-term (1 to 6 years) impact of downsizing on a wide
range of financial measures of profitability, debt, efficiency, and revenue.
Finance Literature
With regards to the finance literature, Worrell and colleagues (Worrell, Davidson,
& Sharma, 1991), Lee (1997), Brookman and colleagues (Brookman, Chang, & Rennie,
2007), Cagle and colleagues (Cagle, Sen, & Pawlukiewicz, 2009), and Bordeman and
colleagues (Bordeman, Kannan, & Pinheiro, unpublished) looked at the impact of
downsizing announcements on the return on common stock anywhere from 3 (Bordeman,
et. al., unpublished) to 180 (Worrell, et. al., 1991) days after the announcement. Worrell
6

To Downsize or Not
and colleagues (Worrell, et. al., 1991) found a general negative market reaction to a
downsizing announcement, especially if the downsizing were reactive, large, and
permanent. Lee (1997) similarly found a negative market reaction to a downsizing
announcement in both US and Japanese companies, especially if the downsizing were
reactive, frequent, large, and permanent. Cagle and colleagues (Cagle, et. al., 2009)
found that the industry in which the downsizing occurred moderated the market reaction
to the downsizing, with the banking industry receiving a generally positive reaction to
downsizing (irrespective of size, reason, or corporate governance) and the securities
industry receiving a general negative reaction. Bordeman and colleagues (Bordeman, et.
al., unpublished) found the market reaction to a downsizing announcement was more
negative when the downsizing company was in a strong competitive environment. On
the other hand, Brookman and colleagues (Brookman, et. al., 2007) found that CEOs
announcing downsizing received more total pay the year after the downsizing than did
other CEOs and that downsizing increased shareholder value.
Gombola and Tsetsekos (1992), Chen and colleagues (Chen, Mehrota, Sivakumar,
& Yu, 2001), Hiller and colleagues (Hiller, Marshall, McColgan, & Werema, 2007) and
Marshall and colleagues (Marshall, McColgan, & McLeish, 2012) considered the impact
of downsizing on stock price, as well as a number of other financial measures from a few
days up to three years after the downsizing event. Gombola and Tsetsekos (1992) found
that downsizing do to plant closing had a negative impact on, not only the financial
performance of a company but also, the company’s stock performance. Chen and
colleagues (Chen, et. al., 2001) found that, in the companies they studied, operating
performance declined leading up to a downsizing event and then improved after the
7

To Downsize or Not
downsizing, however, the downsizing announcement led to a negative market response
(especially if the downsizing was reactive). Hiller and colleagues (Hiller, et. al., 2007)
found that in those companies in which poor operating performance preceded the
downsizing, downsizing had a significant negative impact on stock prices, but
downsizing increased productivity and corporate focus. On the other hand, Marshall
(Marshall, et. al., 2012) found a positive market reaction to downsizing when it occurred
in a good economy but poor reaction in a bad economy, irrespective of the stated reasons
for the downsizing.
Finally, Capelle-Blancard and Couder (2008) conducted a meta-analysis of 41
studies conducted between 1990 and 2006, looking at the market reaction to a downsizing
announcement. The authors found that a downsizing announcement had a negative
impact on stock price, especially if the downsizing was proactive.
In summary, the finance literature on downsizing suggests that downsizing leads
to a negative market reaction both in terms of return on common stock and stock price.
This negative reaction was particularly prominent when the downsizing was reactive (to
previous and current financial struggles), large, frequent, and permanent. This negative
reaction was observed in both the US and Japanese markets. And, the industry and the
competitive environment in which the company existed moderated this negative reaction.
However, some studies found that a downsizing announcement lead to a positive market
reaction, especially if the downsizing occurred in a good economy, and lead to an
increase in productivity and corporate focus. This group of studies focused primarily on
the very short-term impact of the downsizing announcement (within days of the
announcement) on return on common stock and stock price rather than the impact of the
8

To Downsize or Not
actual downsizing event itself and typically did not compare the impact of the downsizing
on both the market valuation and financial performance of the companies studied. The
present study additionally builds on this literature by adding measure of market valuation
(stock equity) to the wide range of financial measures, thus comparing the impact of
downsizing on both the financial health and market valuation of corporations
longitudinally in the short-term (1 to 3 years) and in the long-term (1 to 6 years) after
downsizing.
[Insert Table 9 about here]
It is puzzling why companies would continue to employee downsizing as a
strategy when the empirical literature suggests that downsizing is not effective in
addressing the financial health or market valuation of the company. Theoretically, Tsai,
Wu, Wang, & Huang (2006) suggest that the use of Institutional Theory may account for
the reasons companies downsize in the face of evidence that downsizing will not help.
The authors (Tsai, et. al., 2006) leveraging McKinley’s work on the social cognitive
interpretation of downsizing suggest that the urge to downsize might be driven by
economic, institution, and social cognitive factors even though financial health and
market valuation may not be impacted. McKinley and collegues (McKinley, Zhao, &
Rust, 2000) originally concluded that theoretically “the typical downsizing decision is
likely to be informed by a mixture of future performance expectations, conformity
to institutional rules defining downsizing as legitimate and effective, and the
sociocognitive dynamics that underlie the origins of those rules.” (p. 238).
By longitudinally comparing those companies, currently in the Fortune 500 who
were also in the Fortune 500 in 2008, that downsized in 2008 while financially healthy or
9

To Downsize or Not
while financially unhealthy, with those companies that did not downsize in 2008, under
both financial health or non-health, this study hopes to show that downsizing has no
significant effect and, given the significant human impact downsizing causes, should be
considered counterproductive. The index year of 2008 was selected for analysis as this
represented the beginning of the financial crisis in the US and increased the likelihood of
finding companies in poor financial health and that downsized. Rather than employing
an event methodology, which is currently popular in the downsizing literature, a
combination of repeated measures analysis of variance and partial correlation, controlling
for downsizing, was used to get a broader longitudinal assessment over not only the short
term (1 to 3 years after downsizing) but also the long term (1 to 6 years after the
downsizing). Finally, the impact of the downsizing event was assessed using a wide
range of financial outcome measures as well as a measure of market valuation. The hope
is that this brief review of the effects of downsizing on financial performance and market
valuation and the comprehensive study reported here will better inform scholars and
practitioners, as well as senior leaders who find themselves in a position to have to decide
whether: to downsize or not to downsize.
[Insert Graphic 1 about here]
Methods
Those members of the 2014 Fortune 500 that were also on the Fortune 500 in
2008 were identified as the initial subjects for this research. This consisted of 482
companies. Of these, 68 companies were excluded from analysis do to missing data,
leaving a total subject pool of 414 companies. Missing data included primarily employee
10

To Downsize or Not
headcount for the years 2008 and/or 2009 such that the companies could not be
categorized as downsizing or not in 2008.
The 414 companies were categorized as downsizers or non-downsizers in the year
2008 based on percent change in headcount in that year. Those companies that showed a
percent decrease in headcount of 5% or more were categorized as downsizers. All others
were categorized as non-downsizers. This method of categorizing companies as
downsizers or not was chosen specifically because this was the approach taken by
previous studies on downsizing in the management literature.
Similarly, the 414 companies were categorized as financially healthy or unhealthy
in the year 2008 based on percent change in cash flow from operations. Cash flow from
operations is a measure of how well a company can generate cash flow from it’s normal
operations in order to maintain those operations and grow. Those companies that showed
a percent decrease in cash flow from operations of 5% or more were categorized as
financially unhealthy. All others were categorized as financially healthy. The 5% cut-off
was chosen to parallel the approach to categorizing downsizing.
Thus four groups were created for analysis: financially healthy companies that
downsized, financially unhealthy companies that downsized, financially healthy
companies that did not downsize, and financially unhealthy companies that did not
downsize.
[Insert Table 10 about here]
For the financially healthy companies that downsized, the average change in cash
flow from operations was 1087.08% and the average change in employee headcount was
-11.75% from 2008 to 2009. For the financially unhealthy companies that downsized, the
11

To Downsize or Not
average change in cash flow from operations was -230.27% and the average change in
employee headcount was -12.39% from 2008 to 2009. For the financially healthy
companies that did not downsize, the average change in cash flow from operations was
131.55% and the average change in employee headcount was 5.14% from 2008 to 2009.
Finally, for the financially unhealthy companies that did not downsize, the average
change in cash flow from operations was -105.61% and the average change in employee
headcount was 15.30% from 2008 to 2009. The average percent change in cash flow
from operations showed a trend toward differing among the four groups overall (F =
2.120, p = 0.097). The average percent change in employee headcount differed
significantly among the four groups (F = 12.323, p = 0.000).
Data on each of the 414 companies was extracted from the Mergent Online ™
database for the period 2008 through 2014. Number of Employees and Cash flow from
Operations were extracted in order to categorize the companies in 2008 as downsizers or
not and as financially healthy or not. Financial performance measures that were extracted
from the database included: Profitability Measures - Return on Equity (ROE – a
profitability ratio which measures the efficient use of equity or income per dollar of
equity (Block and Hirt, 2005)), Return on Assets (ROA – a profitability ratio which
measures the efficient use of assets or income per dollar of assets (Block and Hirt,
2005)), Return on Investment (ROI – a profitability ratio which measures the efficient use
of investment, or income per dollar of investment (long-term commitment) (Block and
Hirt, 2005)), Earnings Before Interest, Taxes, Depreciation, and Amortization (EBITDA
– measures the operating income of the company before deductions for financial charges,
taxes, and costs of assets (Block and Hirt, 2005)); Debt Measures - Current Ratio
12
To Downsize or Not
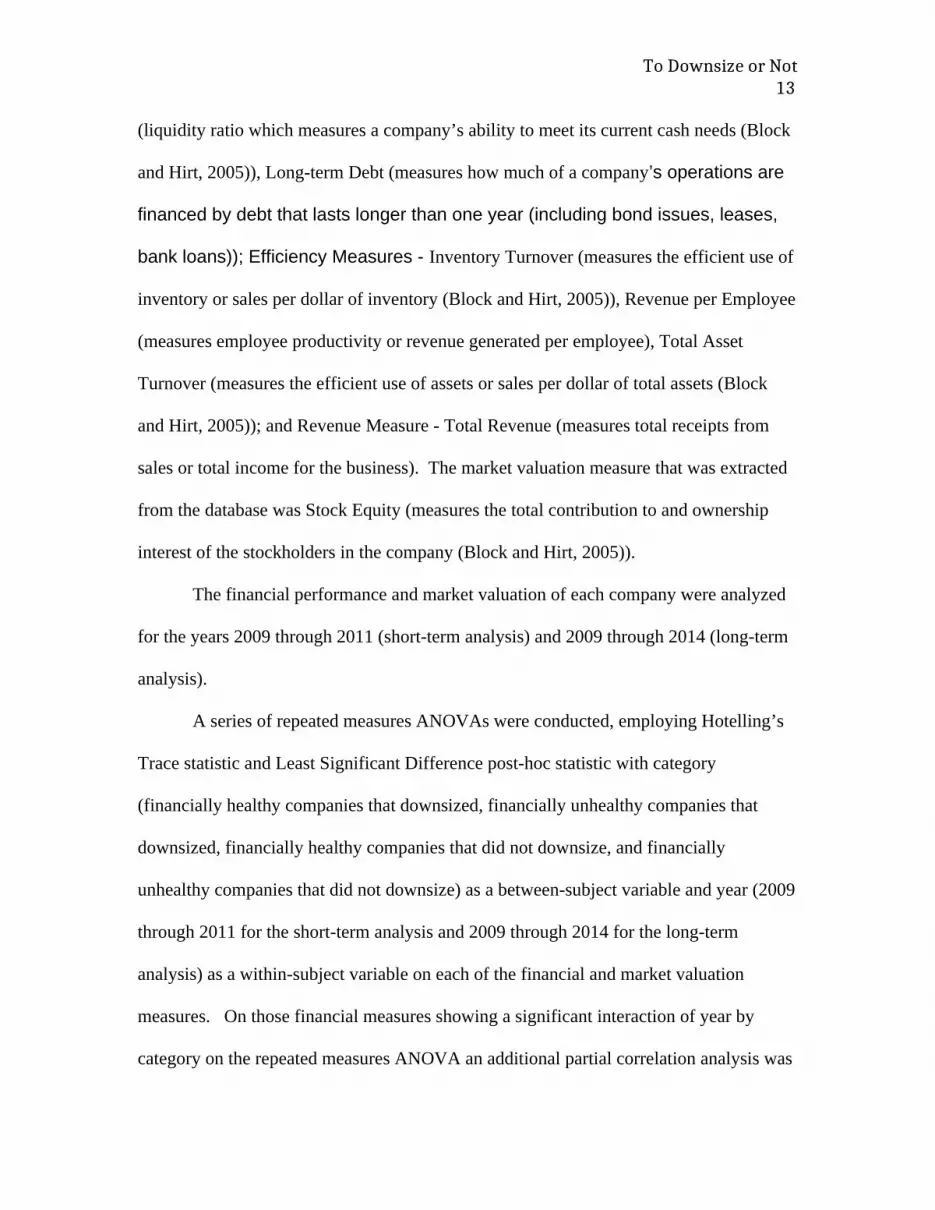
(liquidity ratio which measures a company’s ability to meet its current cash needs (Block
and Hirt, 2005)), Long-term Debt (measures how much of a company’s operations are
financed by debt that lasts longer than one year (including bond issues, leases,
bank loans)); Efficiency Measures - Inventory Turnover (measures the efficient use of
inventory or sales per dollar of inventory (Block and Hirt, 2005)), Revenue per Employee
(measures employee productivity or revenue generated per employee), Total Asset
Turnover (measures the efficient use of assets or sales per dollar of total assets (Block
and Hirt, 2005)); and Revenue Measure - Total Revenue (measures total receipts from
sales or total income for the business). The market valuation measure that was extracted
from the database was Stock Equity (measures the total contribution to and ownership
interest of the stockholders in the company (Block and Hirt, 2005)).
The financial performance and market valuation of each company were analyzed
for the years 2009 through 2011 (short-term analysis) and 2009 through 2014 (long-term
analysis).
A series of repeated measures ANOVAs were conducted, employing Hotelling’s
Trace statistic and Least Significant Difference post-hoc statistic with category
(financially healthy companies that downsized, financially unhealthy companies that
downsized, financially healthy companies that did not downsize, and financially
unhealthy companies that did not downsize) as a between-subject variable and year (2009
through 2011 for the short-term analysis and 2009 through 2014 for the long-term
analysis) as a within-subject variable on each of the financial and market valuation
measures. On those financial measures showing a significant interaction of year by
category on the repeated measures ANOVA an additional partial correlation analysis was
13

To Downsize or Not
conducted, holding categories constant, to assess whether the financial differences existed
independent of category.
This method of using a repeated measures ANOVA and partial correlation
analysis was specifically chosen over the more recently employed event methodology in
order to allow for a longitudinal study of the impact of downsizing over time. In order to
address the concern that factors other than downsizing might emerge over time that
confound the relationship between downsizing and outcome measures, a partial
correlation analysis was added to the repeated measures ANOVA analysis, controlling for
or partialing out the effect of downsizing, on the year-by-year correlations of the outcome
measures. If the significance of the correlations disappear, that would signal that
downsizing was the main contributor to the year-by-year correlation. Therefore, the
combination of repeated measures ANOVA and partial correlation analysis allows for a
longitudinal study but inversely controlling for the effect of other confounding variables.
No additional control variables, other than financial health of the company, were
used in the analysis. As the data sample was drawn from the Fortune 500, the sample
was statistically large, and the Fortune 500 by definition is homogeneous in terms of size
(large) of company and success (successful) of company, the use of additional control
variables was deemed unnecessary. Further, since the index year of 2008 was
specifically chosen to capitalize on the difficult economic period, to increase the
likelihood of finding companies in financial distress and/or that downsized, controlling
for economic conditions was also deemed unnecessary.
Results
14

To Downsize or Not
To verify the effectiveness of the categorization process of identifying downsizing
and non-downsizing as well as financially healthy and financially unhealthy companies,
repeated measures ANVOAs on number of employees and cash flow from operations
were conducted separately. With regards to number of employees, the ANOVA yielded a
significant main effect for year (F = 15.195, p = 0.000), indicating that overall the
number of employees grew each year from 2008 to 2011. Additionally, a significant
interaction between year and category of company was found (F = 6.497, p = 0.000),
indicating that although the non-downsizing companies showed a steady increase in
number of employees, the downsizing companies, regardless of financial health, showed
an initial decline in number of employees, followed by a stablization from 2008 to 2011.
A long-term analysis, looking at the years 2008 through 2014, replicated the above
analysis yielding a significant main effect for year (F = 5.370, p = 0.000) and year by
category interaction (F = 3.221, p = 0.000).
[insert figure 1 about here]
With regards to cash flow from operations, the ANOVA yielded a significant
main effect for year (F = 8.438, p = 0.000), indicating that overall cash flow from
operations steadily increased to 2011. A long-term analysis, looking at the years 2008
through 2014, replicated the above analysis yielding a significant main effect for year (F
= 2.340, p = 0.037) but additionally a year by category interaction (F = 3.605, p = 0.000),
indicating that the financially unhealthy companies initially significantly declined then
steadily increased whereas the financially healthy companies showed a steady increase.
[insert figure 2 about here]
Financial Outcome Measures
15

To Downsize or Not
In order to investigate the impact of downsizing on the ongoing financial strength
of organizations, a series of separate repeated measures ANOVAs were conducted on
various financial measures with category of company (financially unhealthy downsizers,
financially healthy downsizers, financially unhealthy non-downsizers, and financially
healthy non-downsizers) as a between-subject variable and year (2009 through 2011 for
the short-term analysis and 2009 through 2014 for the long-term analysis) as a within
subject variable.
Profitability Measures
With regards to return on equity (ROE), the ANOVA yielded a significant main
effect for year (F = 4.447, p = 0.012) and for category of company (F = 3.302, p = 0.025),
as well as a year by category of company interaction (F = 2.063, p = 0.055). Companies
that downsized whether financially healthy or not showed more inefficient use of equity
than did companies that did not downsize in the short term. The downsizing companies
that were financially healthy initially recovered the efficient use of equity more quickly
than did the downsizing companies that were financially unhealthy initially. The result
washed out though when submitted to a long-term analysis. The long-term analysis
revealed a significant main effect for year (F = 6.451, p = 0.000), indicating a steady
increase in ROE from 2009 through 2014. But no year by category interaction, indicating
that by 2014 all companies regardless of financial health or downsizing showed
increasing ROE. The result was partially supported by a partial correlation analysis.
Partial, year-by-year correlations, holding category of company constant showed that the
significant year-by-year correlation faded between 2009 and 2010, between 2009 and
2012, and between 2009 and 2014. All other year-by-year partial correlations from 2010
16

To Downsize or Not
through 2014 were significant at the 0.05 level or greater. This indicated that category of
company had an effect on the year-by-year relationship of this financial variable one year
after downsizing but not beyond that.
[insert figure 3 about here]
[insert table 1 about here]
With regards to return on assets (ROA), the ANOVA yielded a significant main
effect for year (F = 34.364, p = 0.000) and for category of company (F = 6.568, p =
0.000), as well as a year by category of company interaction (F = 3.178, p = 0.004). This
indicated that all companies, whether financially healthy or not or downsizers or not,
showed a steady increase in ROA through 2011, with downsizing companies increasing
more. Financially healthy companies did better overall than did financially unhealthy
companies, regardless of downsizing. And downsizing companies did worse than did
non-downsizing companies regardless of financial health with the financially unhealthy
downsizers doing worst overall. The result washed out again when submitted to a long-
term analysis. The long-term analysis revealed a significant main effect for year (F =
8.921, p = 0.000), indicating a steady increase in ROA from 2009 through 2014. But no
year by category interaction, indicating that by 2014 all companies regardless of financial
health or downsizing showed increasing ROA. The short-term analysis was also not
supported by the partial correlation analysis. Partial, year-by-year correlations, holding
category of company constant showed that category of company had no effect on the
year-by-year relationship of this financial variable after downsizing.
[insert figure 4 about here]
[insert table 2 about here]
17

To Downsize or Not
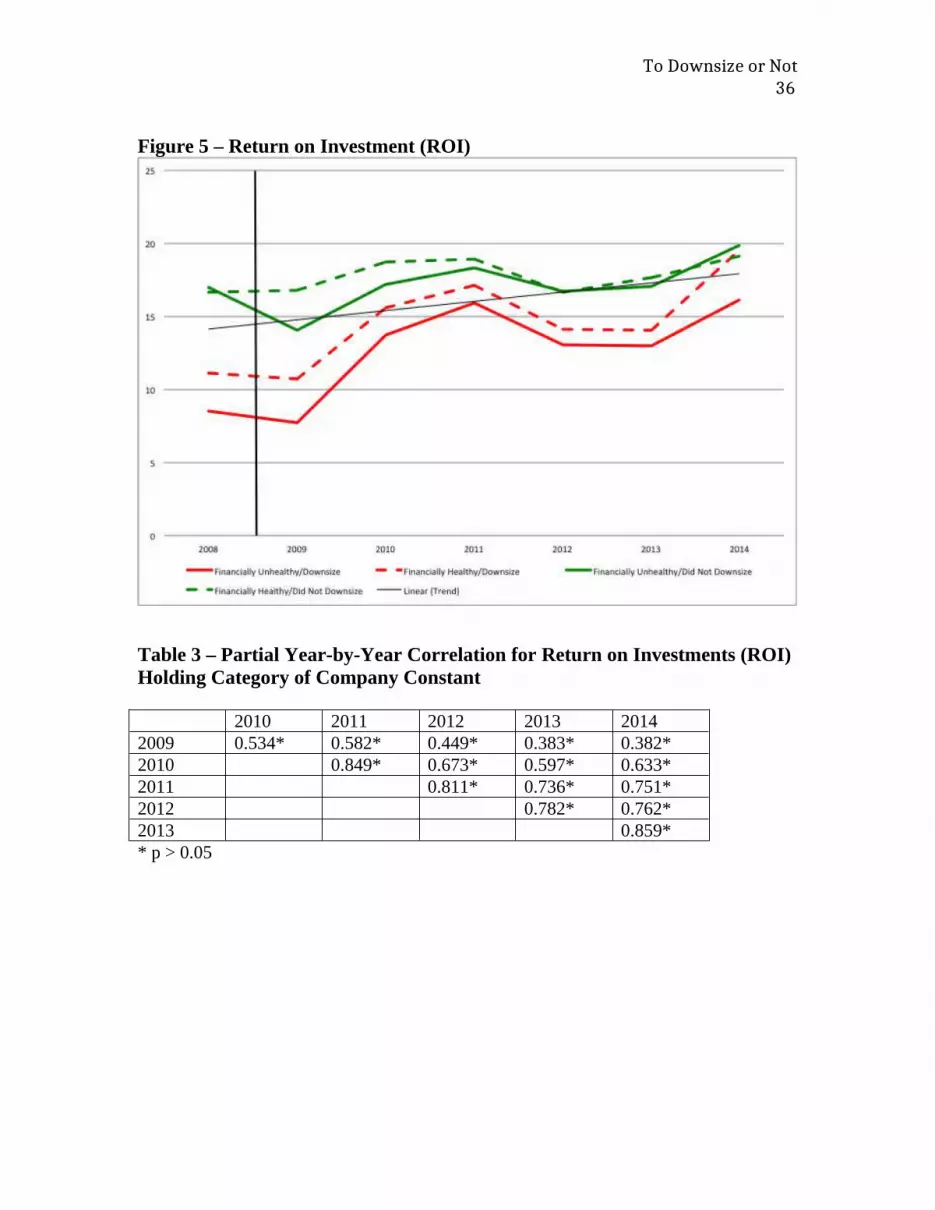
With regards to return on investment (ROI), the ANOVA yielded a significant
main effect for year (F = 37.373, p = 0.000) and for category of company (F = 5.427, p =
0.001), as well as a year by category of company interaction (F = 2.976, p = 0.007). This
indicated that all companies, whether financially healthy or not or downsizers or not,
showed a steady increase in ROI through 2011, with downsizing companies increasing
more. Financially healthy companies did better overall than did financially unhealthy
companies, regardless of downsizing. And downsizing companies did worse than did
non-downsizing companies regardless of financial health, again, with the financially
unhealthy downsizers doing worst overall. This result washed out as well when
submitted to a long-term analysis. The long-term analysis revealed a significant main
effect for year (F = 8.552, p = 0.000), indicating a steady increase in ROI from 2009
through 2014. But no year by category interaction, indicating that by 2014 all companies
regardless of financial health or downsizing showed increasing ROI. The short-term
analysis was also not supported by the partial correlation analysis. Partial, year-by-year
correlations, holding category of company constant showed that category of company had
no effect on the year-by-year relationship of this financial variable after downsizing.
[insert figure 5 about here]
[insert table 3 about here]
With regards to earnings before interest, taxes, depreciation, and amortization
(EBITDA), the ANOVA yielded a significant main effect for year (F = 7.274, p = 0.001)
but not for category of company nor a year by category of company interaction. The
result was replicated when submitted to a long-term analysis. The long-term analysis
revealed a significant main effect for year (F = 4.455, p = 0.001).
18

To Downsize or Not
[insert figure 6 about here]
Debt Measures
With regards to current ratio, the ANOVA yielded a significant main effect for
year (F = 3.918, p = 0.021) but not for category of company nor a year by category of
company interaction. The long-term analysis revealed no significant main effects or
interaction.
[insert figure 7 about here]
With regards to long-term debt, the ANOVA yielded a significant year by
category of company interaction effect (F = 2.091, p = 0.002) but no main effect for year
or for category of company. This indicated that, between 2009 and 2011, financially
unhealthy downsizers decreased long-term debt, financially healthy downsizers
maintained long-term debt, and regardless of financial health non-downsizers increased
long-term debt. The result changed however when submitted to a long-term analysis.
The long-term analysis revealed a significant main effect for year (F = 5.834, p = 0.000),
indicating that long-term debt trended up a bit when looked at from 2009 through 2014.
However, again, this shifting result was not supported by the partial correlation analysis.
Partial, year-by-year correlations, holding category of company constant showed that
category of company had no effect on the year-by-year relationship of this financial
variable after downsizing.
[insert figure 11 about here]
[insert table 6 about here]
Efficiency Measures
19

To Downsize or Not
With regards to inventory turnover, the ANOVA yielded a significant main effect
for year (F = 13.085, p = 0.000) but not for category of company nor a year by category
of company interaction. The long-term analysis revealed a significant main effect for
year (F = 2.383, p = 0.044).
[insert figure 8 about here]
With regards to revenue per employee, the ANOVA yielded a significant main
effect for year (F = 6.153, p = 0.002) and for category of company (F = 3.248, p = 0.022),
as well as a year by category of company interaction (F = 2.275, p = 0.035). This
indicated that companies that downsized, whether financially healthy or not, showed a
steady increase in revenue per employee through 2011 with the financially unhealthy
downsizers increasing more. However, financially unhealthy companies that nonetheless
did not downsize in 2008 showed a very high growth in revenue per employee. The
result washed out though when submitted to a long-term analysis. The long-term analysis
revealed a significant main effect for year (F = 2.864, p = 0.018), indicating a steady
decline in revenue per employee from 2009 through 2014. But no year by category
interaction, indicating that by 2014 all companies regardless of financial healthy or
downsizing showed decreasing revenue per employee. The short-term analysis was also
not supported by the partial correlation analysis. Partial, year-by-year correlations,
holding category of company constant showed that category of company had no effect on
the year-by-year relationship of this financial variable after downsizing.
[insert figure 9 about here]
[insert table 4 about here]
20

To Downsize or Not
With regards to total asset turnover, the ANOVA yielded a significant main effect
for year (F = 9.836, p = 0.000) but not for category of company nor a year by category of
company interaction. The result changed however when submitted to a long-term
analysis. The long-term analysis revealed a significant main effect for year (F = 2.653, p
= 0.027), indicating a steady increase in total asset turnover from 2009 through 2014.
But the long-term analysis also revealed a year by category interaction (F = 2.035, p =
0.013), indicating that by 2014 all the financially healthy companies whether they
downsized or not showed a large increase in total asset turnover, with financially healthy
downsizers increasing the most. However, the shifting result was not supported by the
partial correlation analysis. Partial, year-by-year correlations, holding category of
company constant showed that category of company had no effect on the year-by-year
relationship of this financial variable after downsizing.
[insert figure 10 about here]
[insert table 5 about here]
Revenue Measure
With regards to total revenue, the ANOVA yielded a significant main effect for
year (F = 20.205, p = 0.000) but not for category of company nor a year by category of
company interaction. The long-term analysis revealed a significant main effect for year
(F = 4.118, p = 0.002).
[insert figure 12 about here]
Market Valuation Measure
Finally, with regards to stock equity, the ANOVA yielded a significant main
effect for year (F = 25.671, p = 0.000) but not for category of company nor a year by
21

To Downsize or Not
category of company interaction. The result changed however when submitted to a long-
term analysis. The long-term analysis revealed a significant main effect for year (F =
7.621, p = 0.000), indicating a steady increase in stock equity from 2009 through 2014.
But the long-term analysis also revealed a trend toward a main effect for category of
company (F = 2.345, p = 0.077), indicating that by 2014 the financially unhealthy
companies that did not downsize had the highest stock equity of all companies, trending
up as all other companies began to fall. However, this shifting result was not supported
by the partial correlation analysis. Partial, year-by-year correlations, holding category of
company constant showed that category of company had no effect on the year-by-year
relationship of this financial variable after downsizing.
[insert figure 13 about here]
[insert table 7 about here]
Table 8 summarizes the results found here.
[insert table 8 about here]
Discussion
Given the disruptive nature of downsizing on many individuals’ lives from the
employees affected (Datta, Guthrie, Basuil & Pandey, 2010), to those that remain in the
downsizing company (Mishra & Speitzer, 1998; Trevor & Nyberg, 2008, Datta, Guthrie,
Basuil & Pandey, 2010), to the larger community within which the downsizing company
is situated (Gombola & Tsetsekos, 1992; Atanassov & Kim, 2009, Datta, Guthrie, Basuil
& Pandey, 2010), one would expect that downsizing would at least meet the financial and
market needs of the company. One would at least expect that the downsizing company,
22

To Downsize or Not
through downsizing, would return from the event financially stronger, continuing to
provide employment, service to customers, and a presence in the community. But the
present research indicates this is not the case. It is not the case that downsizing had an
appreciable impact, positive or negative, on the financial or market condition of the
company that downsized.
Companies that downsized, regardless of financial health preceding the
downsizing, on average, began to rebuild their employee headcount almost immediately.
Within three years of the downsizing the downsized companies, on average, re-built their
employee headcount almost to pre-downsizing levels.
In terms of profitability (profitability ratios – ROE, ROA, and ROI), downsizing
companies did no better, and actually worse in the short-term, than non-downsizing
companies, regardless of the financial health of the companies. The minimal differences
among downsizing and non-downsizing companies observed, washed out in the long run,
over 6 years post-downsizing. Downsizing also had no impact on other measures of
profitability or revenue (EBITDA, Total Revenue) either immediately after the
downsizing (within 3 years) or over the long-term (up to 6 years post-downsizing).
In terms of the companies’ liabilities and ability to meet these liabilities (current
ratio and long-term debt), companies that were suffering financial ill-health and then
downsized did decrease their long-term debt, on average, over 3 years. Downsizing did
not make any difference in a company’s ability to immediately meet its current liabilities,
3 years after the downsizing, or meet its current liabilities for the 6 years after
downsizing. All other companies (financially healthy companies that nonetheless
downsized or non-downsizing companies regardless of financial health) increased their
23

To Downsize or Not
long-term debt over 3 years. Interestingly, those financially unhealthy, downsizing
companies that decreased their long-term debt over the 3 years subsequent to the
downsizing, re-built that debt over the long term, over 6 years.
In terms of efficiency, management efficient (inventory turnover), employee
efficiency (revenue per employee), or asset use efficiency (asset turnover), downsizing
had no impact. On the contrary, those companies that were financially unhealthy but did
not downsize used their employees more efficiently in the short-term, over the next 3
years, but not in the long term, over the entire 6 years, than did financially healthy
companies.
Finally, in terms of market valuation (stock equity), downsizing made no
immediate difference in terms of stockholder investment in the company. However, 5 to
6 years post-downsizing, it was the initially unhealthy companies that nonetheless did not
downsize that showed an increase in stock equity, with all other companies falling. It is
unclear whether this long-term impact was related to the downsizing event and was
simply delayed do to delays in flow of information and decision making by the market or
wholly unrelated to the downsizing and attributed to some other yet undetermined aspect
of the companies 6 years later. The later explanation is more likely given the long-term
changes in stock equity uncovered by the analysis were not supported by partial
correlations.
In summary, downsizing companies replaced their downsized workers almost
immediate. Downsizing did not help profitability either in the short-term or in the long-
term. Downsizing did not help companies meet their current liabilities either in the short-
term or the long-term. Though, downsizing did help companies decrease long-term debt
24

To Downsize or Not
in the short-term. Downsizing did not impact efficiency of either management,
employees, or use of assets. In fact, financially unhealthy companies that nonetheless did
not downsize exhibited an increase in employee efficiency, at least in the short term.
Finally, the market seemed to respond negatively to downsizing in the long-term, only
possibly responding positively to companies that found themselves in financial unhealthy
but nonetheless did not downsize.
These results may not be surprising as the downsizing may be seen as applying a
short-term fix to an otherwise long-term problem. Simply decreasing headcount, while
immediately impacting cost or debt, does not address the underlying financial, market,
industry, and/or strategic issues that, whether explicitly acknowledged or not, led to the
downsizing decision. It is analogous to placing a Band-Aid on an otherwise deeper, more
fundamental wound. Often referred to in medicine, the theory of a “Band-Aid solution”
may explain the ineffectiveness of the downsizing effort. A “Band-Aid solution” in
medical terms is “… any partial or ‘cosmetic’ solution to a problem, often referring to a
treatment that falls far short of that demanded by the disease being treated” (Band-Aid
Solution, n.d.). In this case, downsizing is the partial or cosmetic solution to an
underlying financial, market, industry, or strategic “disease”, falling short of treating the
“disease”.
Limitations and Future Research
Although seemly robust, the findings here do suffer from a few limitations. All
companies included in this data set were on the Fortune 500 list in 2014 and were found
to also have been on the Fortune 500 list in 2008. Therefore, all companies included in
25

To Downsize or Not
this data set, whether suffering from financial ill-health or not, and whether downsizing
or not, were by definition larger, successful companies. And one would expect the
companies to have succeeded from 2008 through 2014. It is unclear from this data, what
impact downsizing might have on non-Fortune 500 companies over the same time span.
Additionally, although used in a number of pervious studies, the measure of
downsizing was somewhat arbitrary, defined as a decrease in employee headcount by 5%.
Would the results look different if a different percent decrease in employee headcount
were used? Some pervious studies have looked at the differences between companies
with relatively small and relatively large downsizing events (DeMeuse, et. al., 2004;
Brauer, 2010) and the size of the decrease in employee headcount does seem to make a
difference. Perhaps using a different percent decrease in employee headcount to define
downsizing would have led to different results here. Or, perhaps looking at absolute size
of headcount change would have led to different results here.
Additionally, like the measure of downsizing, the measure of financial health,
defined as a decrease in cash flow from operations by 5%, may have been artificial.
Alternative percent decreases in cash flow from operations might have been used, or
other financial measures might have been used to determine financial health of these
companies. Typically, studies comparing financially healthy downsizers with financially
unhealthy downsizers look to the companies’ stated reasons for the downsizing as
reported to the SEC and categorize those companies downsizing in response to financial
trouble as reactive downsizers and those companies downsizing in response to market or
industry conditions, merger or acquisition, or consolidation as proactive downsizers
(Worrell, et. al, 1991; Lee, 1997; Chalos & Chen, 2002; Chen, et. al., 2001; Capelle-
26
To Downsize or Not
Blancard & Couder, 2008; Brauer, 2010; Marshall, et. al., 2012). Perhaps using a
different approach to determining financial health would have lead to different results
here.
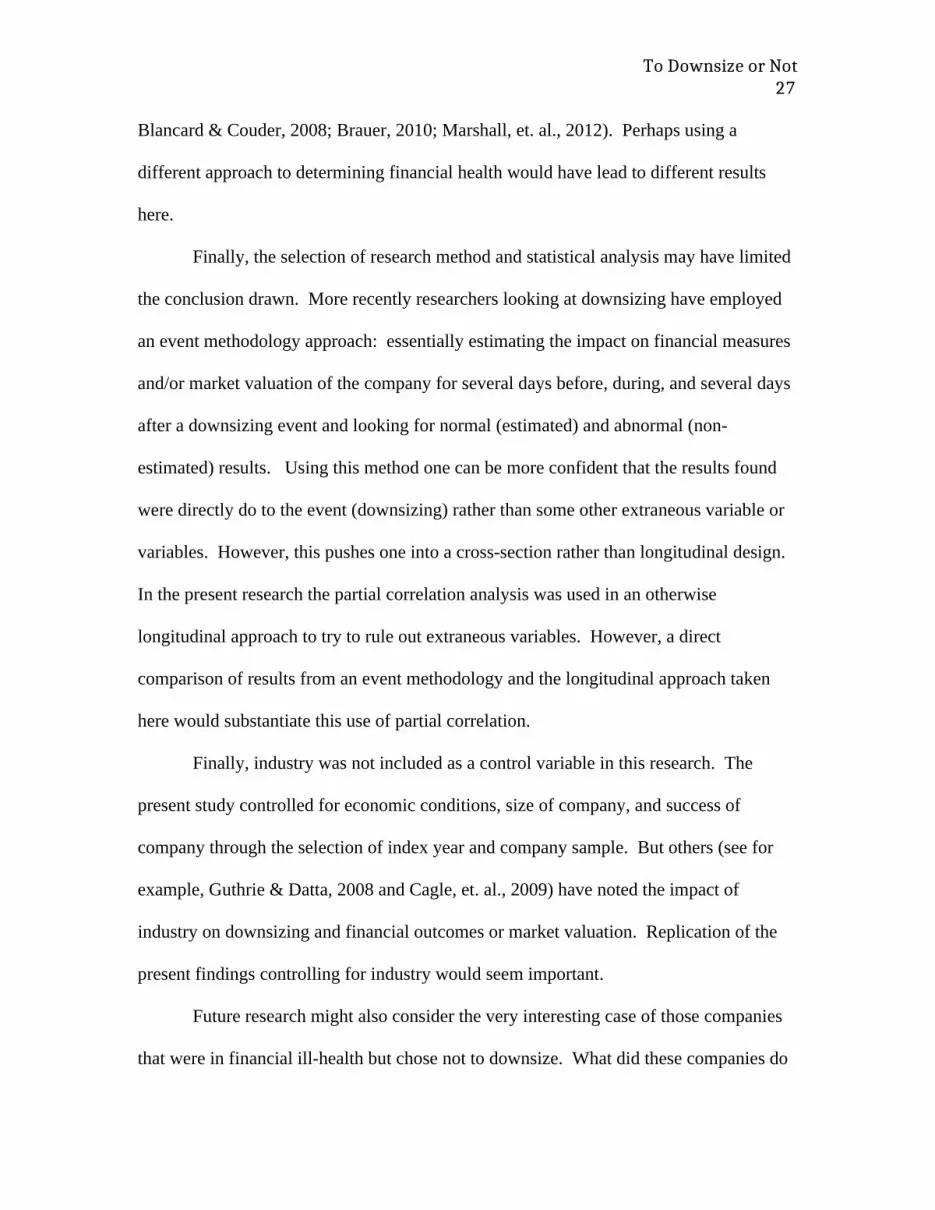
Finally, the selection of research method and statistical analysis may have limited
the conclusion drawn. More recently researchers looking at downsizing have employed
an event methodology approach: essentially estimating the impact on financial measures
and/or market valuation of the company for several days before, during, and several days
after a downsizing event and looking for normal (estimated) and abnormal (non-
estimated) results. Using this method one can be more confident that the results found
were directly do to the event (downsizing) rather than some other extraneous variable or
variables. However, this pushes one into a cross-section rather than longitudinal design.
In the present research the partial correlation analysis was used in an otherwise
longitudinal approach to try to rule out extraneous variables. However, a direct
comparison of results from an event methodology and the longitudinal approach taken
here would substantiate this use of partial correlation.
Finally, industry was not included as a control variable in this research. The
present study controlled for economic conditions, size of company, and success of
company through the selection of index year and company sample. But others (see for
example, Guthrie & Datta, 2008 and Cagle, et. al., 2009) have noted the impact of
industry on downsizing and financial outcomes or market valuation. Replication of the
present findings controlling for industry would seem important.
Future research might also consider the very interesting case of those companies
that were in financial ill-health but chose not to downsize. What did these companies do
27

To Downsize or Not
as an alternative to downsizing? Additionally, future research could look at the ways in
which the downsizing event is handled and the impact this has on the various
stakeholders in the company as well as the financial and market health of the company.
DeWitt (1998) as well as Trevor and Nyberg (2008) looked at various approaches to
downsizing. Could the practices used to announce and execute the downsizing impact
the effect the downsizing event has on the financial and market health of the
organizations? Could those companies that downsized in the present study show more
positive impact on financial and market health if the downsizing was handled in a
particular way?
Finally, previous studies have considered the size and frequency of downsizing.
However, future research might look at the direct relationship between any change in
headcount (positive or negative), regardless of whether labeled as downsizing, and
financial outcomes. Similarly, future research might look at the direct relationship
between the frequency of headcount change (positive or negative), regardless of whether
these are labeled downsizing, and financial outcomes.
Conclusion
Given the present findings, taking into consideration the limitations of the present
study and future directions for research, what can a senior leader presented with a
potential downsizing event decide? Very simply: don’t downsize. The research here
indicates downsizing will not help. It will be a “Band-Aid” solution, a partial or cosmetic
solution that does not address the underlying financial, market, industry, or strategic
problem that lead to the downsizing decision in the first place. And given the rather
significant impact downsizing can have on various stakeholders, to downsize would seem
28

To Downsize or Not
to be not only counter-productive but perhaps also unethical. So, when in doubt, don’t
downsize.
29

To Downsize or Not
References
Atanassov, J. & Kim, E. H. (2009). Labor and corporate governance: International evidence from restructuring decisions. Journal of Finance, 64 (1), 341-374.
Ballester, M.; Livnat, J.; & Sinha, N. (1999). Corporate reorganizations: Changes in the intensity of labor and capital expenditures. Journal of Business Finance & Accounting, 26 (9), 1205-1238.
Block, S. B. & Hirt, G. A. (2005). Foundations of Financial Management (Eleventh Edition). McGraw Hill: Boston, MA.
Band-Aid Solution. (n.d.) Segen's Medical Dictionary. (2011). Retrieved October 14 2015 from http://medical-dictionary.thefreedictionary.com/Band-Aid+Solution
Bordeman, A.; Kannan, B.; & Pinheiro, R. (2014). Intra-industry contagion effects of layoff announcements, Unpublished Manuscript.
Brauer, M. (2010). The implications of magnitude, timing, & realization of workforce downsizing on firm profitability. Academy of Management Annual Meetings Proceedings, 1-6.
Brookman, J. T.; Chang, S.; & Rennie, C. G. (2007). CEO equity portfolio incentives and layoff decisions. Journal of Financial Research, 30 (2), 259-281.
Cagle, J. A. B.; Sen, A.; & Pawlukiewicz, J. E. (2009). Journal of Economics and Finance, 33 (1), 100-110.
Capelle-Blanchard, G. & Couderc, N. (2007). How do shareholders respond to layoff announcements? A meta-analysis. Unpublished Manuscript.
Cascio, W. F.; Young, C. E.; & Morris, J. R. (1997). Financial consequences of employment-change decisions in major U.S. corporations. Academy of Management Journal, 40 (5), 1175-1189.
Chalos, P. & Chen, C. J. P. (2002). Employee downsizing strategies: Market reaction and post announcement financial performance. Journal of Business Finance & Accounting, 29 (5), 847-870.
Chen, P.; Mehrotra, V.; Sivakumar, R.; & Yu, W. W. (2001). Layoffs, shareholders’ wealth, and corporate performance. Journal of Empirical Finance, 8 (2), 171-199.
Datta, D. K.; Guthrie, J. P.; Basuil, D.; & Pandey, A. (2010). Causes and effects of employee downsizing: A review and synthesis. Journal of Management, 36 (1), 281-348.
30

To Downsize or Not
DeMeuse, K. P.; Bergmann, T. J.; Vanderheiden, P. A.; & Roraff, C. E. (2004). New evidence regarding organizational downsizing and a firm’s financial performance: A long-term analysis. Journal of Managerial Issues, 16 (2), 155-176.
DeMeuse, K. P. & Dai, G. (2013). Organizational downsizing: Its effects on financial performance over time. Journal of Managerial Issues, 25 (4), 324-344.
DeMeuse, K.P.; Vanderheiden, P. A.; & Bergmann, T. J. (1994). Announced layoffs: Their effect on corporate financial performance. Human Resource Management, 33 (4), 509-530.
Dewitt, R. (1998). Firm, industry, and strategy influences on choice of downsizing approach. Strategic Management Journal, 19 (1), 59-79.
Gombola, M. J. & Tsetsekos, G. P. (1992). The information content of plant closing announcements: Evidence from financial profiles and the stock price reaction. Financial Management, 21 (2), 31-40.
Guthrie, J. P. & Datta, D. K. (2008). Dumb and dumber: The impact of downsizing on firm performance as moderated by industry conditions. Organizational Science, 19 (1), 108-123.
Hillier, D.; Marshall, A.; McColgan, P.; & Werema, S. (2007). Employee layoffs, shareholder wealth and firm performance: Evidence from the UK. Journal of Business Finance & Accounting, 34 (3), 467-494.
Lee, P. M. (1997). A comparative analysis of layoff announcements and stock price reactions in the United States and Japan. Strategic Management Journal, 18 (1), 879-894.
Marshall, A. & McColgan, P. (2012). Why do stock prices decline in response to employee layoffs? UK evidence from the 2008 global financial crisis. Journal of Financial Research, 35 (3), 375-396.
Mckinley, W., Zhao, J., & Rust, K. G. (2000). A sociocognitive interpretation of organizational downsizing. Academy of Management Review, 25 (1), 227-243.
Mishra, A. K. & Spreitzer, G. M. (1998). Explaining how survivors respond to downsizing: The roles of trust, empowerment, justice, and work redesign. Academy of Management Review, 23 (3), 567-588.
Trevor, C. O. & Nyberg, A. J. (2008). Keeping your headcount when all about you are losing theirs: downsizing, voluntary turnover rates, and the moderating role of HR practices. Academy of Management Journal, 51 (2), 259-276.
31

To Downsize or Not
Tsai, P. C., & Yen, Y. (2015). Development of institutional downsizing theory: evidence from the MNC downsizing strategy and HRM practices in Taiwan. Total Quality Management & Business Excellence, 26 (3/4), 248-262.
Worrell, D. L.; Davidson, W. N.: & Sharma, V. M. (1991). Layoff announcements and stockholder wealth. Academy of Management Journal, 34 (3), 662-678
32

To Downsize or Not
Figure 1 – Number of Employees
Figure 2 – Cash Flow
33

To Downsize or Not
Figure 3 – Return on Equity (ROE)
Table 1 – Partial Year-by-Year Correlation for Return on Equity (ROE) Holding Category of Company Constant
2010 2011 2012 2013 20142009 0.081 0.368* 0.179 0.208* 0.1802010 0.734* 0.447* 0.439* 0.435*2011 0.643* 0.643* 0.599*2012 0.522* 0.566*2013 0.790** p > 0.05
34

To Downsize or Not
Figure 4 – Return on Assets (ROA)
Table 2 – Partial Year-by-Year Correlation for Return on Assets (ROA) Holding Category of Company Constant
2010 2011 2012 2013 20142009 0.410* 0.523* 0.305* 0.337* 0.280*2010 0.781* 0.552* 0.576* 0.633*2011 0.593* 0.647* 0.649*2012 0.677* 0.683*2013 0.830** p > 0.05
35
To Downsize or Not
Figure 5 – Return on Investment (ROI)
Table 3 – Partial Year-by-Year Correlation for Return on Investments (ROI) Holding Category of Company Constant
2010 2011 2012 2013 20142009 0.534* 0.582* 0.449* 0.383* 0.382*2010 0.849* 0.673* 0.597* 0.633*2011 0.811* 0.736* 0.751*2012 0.782* 0.762*2013 0.859** p > 0.05
36

To Downsize or Not
Figure 6 – Earnings before Interest, Taxes, Depreciation, Amortization
Figure 7 – Current Ratio
37

To Downsize or Not
Figure 8 – Inventory Turnover
38

To Downsize or Not
Figure 9 – Revenue per Employee
Table 4 – Partial Year-by-Year Correlation for Revenue per Employee Holding Category of Company Constant
2010 2011 2012 2013 20142009 1.000* 1.000* 0.999* 0.994* 0.997*2010 0.999* 0.999* 0.996* 0.981*2011 1.000* 0.994* 0.976*2012 0.995* 0.997*2013 0.993** p > 0.05
39

To Downsize or Not
Figure 10 – Total Asset Turnover
Table 5 – Partial Year-by-Year Correlation for Total Asset Turnover Holding Category of Company Constant
2010 2011 2012 2013 20142009 0.986* 0.992* 0.975* 0.899* 0.826*2010 0.996* 0.994* 0.952* 0.899*2011 0.993* 0.939* 0.877*2012 0.971* 0.924*2013 0.983** p > 0.05
40

To Downsize or Not
Figure 11 – Long Term Debt
Table 6 – Partial Year-by-Year Correlation for Long-Term Debt Holding Category of Company Constant
2010 2011 2012 2013 20142009 0.993* 0.966* 0.942* 0.918* 0.873*2010 0.982* 0.963* 0.939* 0.899*2011 0.974* 0.947* 0.917*2012 0.973* 0.942*2013 0.970** p > 0.05
41

To Downsize or Not
Figure 12 – Total Revenue
42

To Downsize or Not
Figure 13 – Stock Equity
Table 7 – Partial Year-by-Year Correlation for Stock Equity Holding Category of Company Constant
2010 2011 2012 2013 20142009 0.987* 0.944* 0.845* 0.848* 0.858*2010 0.980* 0.912* 0.913* 0.917*2011 0.970* 0.967* 0.967*2012 0.996* 0.987*2013 0.994** p > 0.05
43

To Downsize or Not
Table 8 – Summary of Results
Measure Short-Term Effect
Long-Term Effect
Supported by Partial Correlation
ROE Yes No YesROA Yes No NoROI Yes No NoEBITDA No No NoCurrent Ratio No No NoLong-Term Debt Yes No NoInventory Turnover No No NoRevenue Per Employee Yes No NoAsset Turnover No Yes NoTotal Revenue No No NoStock Equity No Yes No
44

To Downsize or Not
Table 9 – Summary of Literature Review
45

To Downsize or Not
Table 10 – Sample Size by Category of Company
46

To Downsize or Not
Graphic 1 – Research Model
47


