Embed Size (px)
Citation preview
CSIRO PUBLISHING
www.publish.csiro.au/journals/mfr Marine and Freshwater Research, 2010, 61, 253–262
Towards better management of Australia’s shark fishery:genetic analyses reveal unexpected ratios of crypticblacktip species Carcharhinus tilstoni and C. limbatus
J. R. OvendenA,C, J. A. T. MorganA, T. KashiwagiA, D. BroderickA and J. SaliniB
AMolecular Fisheries Laboratory, Queensland Primary Industries and Fisheries,PO Box 6097, St Lucia, QLD 4069, Australia.
BCSIRO Marine Laboratories, Cleveland, QLD 4163, Australia.CCorresponding author. Email: [email protected]
Abstract. The common blacktip shark (Carcharhinus limbatus) and the Australian blacktip shark (C. tilstoni) aremorphologically similar species that co-occur in subtropical and tropical Australia. In striking contrast to what has beenpreviously reported, we demonstrate that the common blacktip shark is not rare in northern Australia but occurs inapproximately equal frequencies with the Australian blacktip shark. Management of shark resources in northern Australianeeds to take account of this new information. Species identification was performed using nucleotide sequences of thecontrol, NADH dehydrogenase subunit 4 (ND4) and cytochrome oxidase I (COI) regions in the mitochondrial genome.The proportion of overall genetic variation (FST) between the two species was small (0.042, P < 0.01) based on allelefrequencies at five microsatellite loci. We confirm that a third blacktip species (C. amblyrhynchoides, graceful shark)is closely related to C. tilstoni and C. limbatus and can be distinguished from them on the basis of mtDNA sequencesfrom two gene regions. The Australian blacktip shark (C. tilstoni) was not encountered among 20 samples from centralIndonesia that were later confirmed to be common blacktip and graceful sharks. Fisheries regulators urgently need newinformation on life history, population structure and morphological characters for species identification of blacktip sharkspecies in Australia.
Additional keywords: blacktip shark, COI, control region, cytochrome oxidase I, fisheries, Indonesia, NADHdehydrogenase subunit 4, ND4, species identification.
Introduction
Species are the basic unit for the sustainable management andconservation of biodiversity (Lindenmayer and Burgman 2005;King 2007). Species taxonomy is important because it shapespublic recognition of biodiversity (Lindenmayer and Burgman2005), which drives the processes of ecosystem and biologi-cal resource management in the public and private sector. Infisheries science, species are largely distinguished morphologi-cally with the expectation of taxonomic congruence across otherdata types. DNA-based data can be used to test morpholog-ically defined species and can provide new tools for speciesidentification.
There are 322 chondrichthyan species currently recognisedin Australia (182 sharks, 125 rays and 15 chimaeras or ghost-sharks), which represents about one-third of worldwide chon-drichthyan biodiversity. Endemicity in Australia is high (51%)(Last and Stevens 2009). Whaler sharks (genus Carcharhinus)are a worldwide assemblage of over 30 commercially impor-tant species that have largely coastal distributions (Compagnoet al. 2005). Twenty-one species occur in Australian waters, pre-dominantly in the tropical north, and two species (Carcharhinusfitzroyensis and C. tilstoni) are endemic to Australia (Last andStevens 2009).
The Australian blacktip shark (C. tilstoni) was described byWhitley (1950) and co-occurs in northern Australia with thecommon blacktip shark (C. limbatus). Carcharhinus tilstoni isendemic to northern Australia and C. limbatus is found in sub-tropical and tropical waters worldwide (Last and Stevens 2009).There are no known external morphological characters for dis-tinguishing the species (Compagno et al. 2005), but amongspecimens examined to date, C. tilstoni has 84–91 pre-caudalvertebrae while C. limbatus has 94–101 (Last and Stevens2009). Phylogenetic analyses by Lavery (1992) using allozymecharacters and by Ward et al. (2008) using DNA charactersgrouped C. tilstoni and C. limbatus with the graceful shark(C. amblyrhynchoides).
Blacktip (C. tilstoni and C. limbatus) and other shark speciessupport a commercial fishery across northern Australia. Car-charhinus limbatus is also part of the elasmobranch fishery insouth-eastern Asia (White et al. 2006). Like most marine preda-tory species, sharks are vulnerable to overexploitation. Theyhave naturally low abundance, fecundity that is orders of mag-nitude below most marine finfish species and a susceptibilityto capture by gill-nets and long-lines (Last and Stevens 2009).State and national authorities manage the exploitation of black-tip sharks in northern Australia to ensure that the stock sizes
© CSIRO 2010 10.1071/MF09151 1323-1650/10/020253
254 Marine and Freshwater Research J. R. Ovenden et al.
Australia
Darwin
Java Bali
PapuaNew Guinea
Townsville *
East Timor
Indonesia
Irian Jaya
* Broome
Timor Sea
Arafura SeaTorres Strait
Coral SeaGulf ofCarpentaria
Northern Territory QueenslandWestern Australia
1000 km
105
!25
!20
!15
!10
!5
0
110 115 120 125 130 135 140 145
N
E
S
W
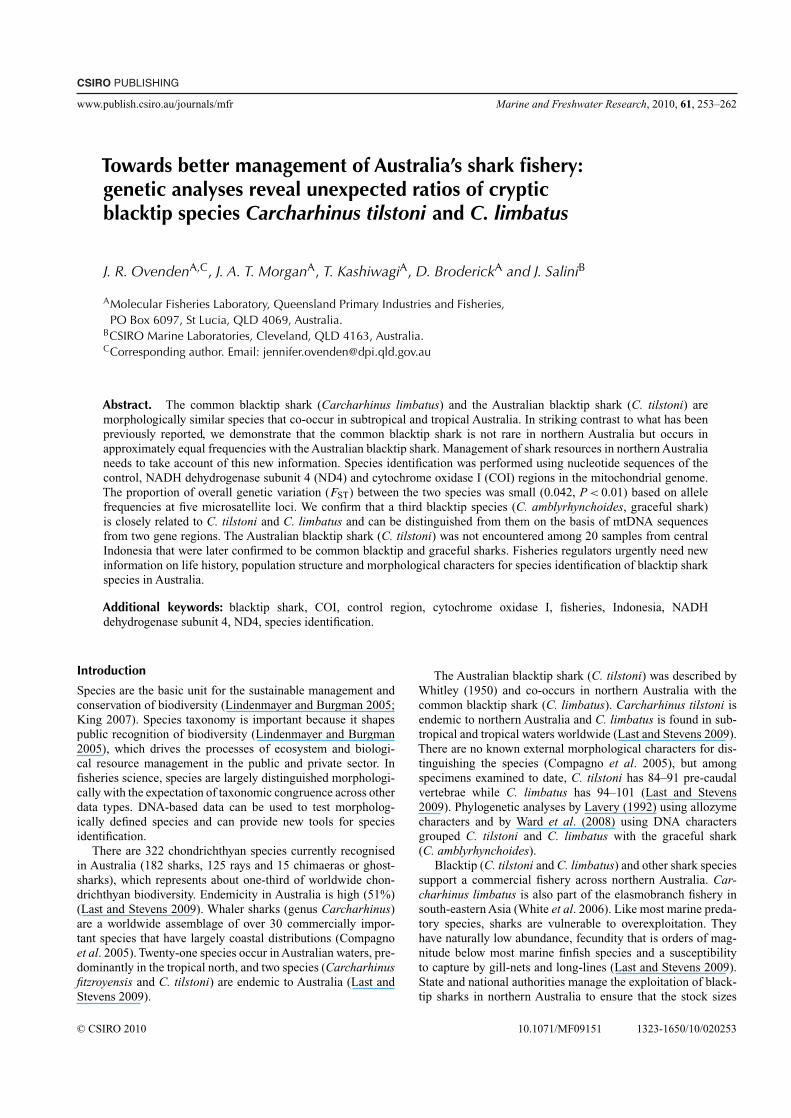
Fig. 1. Collection locations for Carcharhinus tilstoni, C. limbatus and C. amblyrhynchoides from Western Australia, Northern Territory, Queenslandand Indonesia.
remain at sustainable levels (Salini et al. 2006). Carcharhinuslimbatus is believed to be relatively rare in northern Australia.It was reported as occurring in a 1 : 300 ratio with C. tilstoni(Stevens and Wiley 1986) based on 987 C. tilstoni and 20C. limbatus samples collected from northern Australian watersin 1982 to 1985 for an allozyme genetic study (Lavery andShaklee 1991). Last and Stevens (2009) stated that C. limbatusis a minor component of the commercial harvest in northernAustralia.
The present study arose from a population genetic analysisof Australian blacktip sharks, where samples were taken alongthe northern Australian coastline under the assumption that themajority of blacktip shark would be C. tilstoni. However, pilotanalyses showed the presence of an additional species, which wasidentified as C. limbatus. Using these blacktip shark samples, wetest the assumption that C. limbatus is rare in northern Australiausing mitochondrial DNA (mtDNA) nucleotide sequence forspecies identification. Distinctiveness of each species was testedby phylogenetic analysis of mtDNA sequence data in compar-ison to Australian and Indonesian samples of C. limbatus andC. amblyrhynchoides, and appropriate outgroups. Furthermore,as evolutionary theory predicts that interspecific divergencegenerally should exceed intraspecific divergence, the propor-tion of overall genetic variation due to species-level distinc-tion between C. tilstoni and C. limbatus was estimated usingmicrosatellite loci and compared with intraspecific divergence
in a co-occurring species (C. sorrah) from a previous study(Ovenden et al. 2009).
Materials and methodsSample collectionTo assist the development of DNA-based species-identificationmethods, reference tissue samples were taken from four C.limbatus individuals and four C. tilstoni individuals from thenorth-western Australian coast. Species identification was con-firmed in the field by pre-caudal vertebral counts made byR. Pillans and J. Stevens (CSIRO). Counts for C. limbatus rangedfrom 97 to 100 and were within the accepted range for thisspecies. Counts for C. tilstoni samples were 80 to 85, slightlybelow the recorded range of 84 to 91 (Last and Stevens 2009).Populations from the west, north and east coasts of Australia(Fig. 1) were sampled to test species composition over a broadspatial scale. Observers and fisheries biologists collected tis-sue samples from blacktip sharks that they presumed to beC. tilstoni. Pre-caudal vertebral counts were not performed toconfirm species identification, except on reference samples.
Carcharhinus amblyrhynchoides and C. limbatus sampleswere collected from Indonesian markets (Fig. 1) for compari-son with Australian samples. The provenance of the Indonesiansamples was within 300 km of markets based on interviewswith vendors. Approximately 200 mg of white muscle tissue
Carcharhinus limbatus is abundant in northern Australia Marine and Freshwater Research 255
excluding skin was dissected from all specimens and preservedin 1 mL of a 20% dimethyl sulfoxide solution (DMSO) in 5 MNaCl. Samples were stored at room temperature in the field and−70◦C in the laboratory.
Genomic DNA extractionFrom each sample, 10–50 mg of tissue was digested in 500 µLof a suspension of 10% Chelex-100 (w/v; Biorad LaboratoriesInc, Sydney, Australia) in TE buffer (5 mM Tris-Cl pH 8.0 with0.5 mM EDTA). Proteinase K (100 ng) was added and the tissuewas digested to completion at 55◦C for at least 1 h on a shakingplatform. The mixture was boiled for 5 min then centrifuged at13 000 g at room temperature for 5 min to precipitate the Chelexresin and cellular debris. The supernatant was removed to a freshtube for subsequent manipulation and storage. A small numberof samples were extracted with kits (Wizard, Promega, Madison,WI, USA; DNeasy, Qiagen, Valencia, CA, USA).
Mitochondrial DNATo find species-specific DNA markers, the 5′ end of the controlregion (CR) was amplified and sequenced from 284 blacktip andgraceful shark samples. The amplification primers were GWF(CTG CCC TTG GCT CCC AAA GC) and GWR (CTT AGCATC TTC AGT GCC AT) (Pardini et al. 2001). The internalreverse primer CaR (GGG AAT AGC GAT TTG CTT CA) wasdesigned to obtain a reverse sequence. The NADH dehydroge-nase subunit 4 (ND4) region was amplified and sequenced fora subset of 29 samples, which were selected to represent theeight reference samples plus each of the C. tilstoni and C. lim-batus control region haplotypes and to maximise geographicspread. ND4 primers were ND4 (CAC CTA TGA CTA CCAAAA GCT CAT GTA GAA GC) (Arevalo et al. 1994) andH12293-LEU (TTG CAC CAA GAG TTT TTG GTT CCTAAGACC) (Inoue et al. 2001). Cytochrome oxidase subunit I (COI)was also sequenced for the same subset of 29 samples betweenprimers FishF1 (TCA ACC AAC CAC AAA GAC ATT GGCAC) and FishR1 (TAG ACT TCT GGG TGG CCA AAG AATCA) (Ward et al. 2005).
Amplification reactions for the control region (50 µL reactionvolume) contained 1× PCR buffer (Qiagen), 200 µM of eachdeoxynucleotide triphosphate (dNTP), 1 µM of each primer,2.5 mM of MgCl2, 4 U of Taq DNA polymerase (Qiagen) and10–100 ng of genomic DNA template. Cycling was performedas follows: 90 s at 94◦C followed by 35 cycles of 5 s at 94◦C, 30 sat 55◦C and 30 s at 72◦C with a final extension of 72◦C for 5 min(Ovenden et al. 2009).Amplifications of the ND4 and COI region(20 µL) contained 1× PCR buffer (Qiagen), 200 µM of eachdNTP, 0.5 µM of each primer, 1.5 mM of MgCl2, 1.2 U of TaqDNA polymerase (Qiagen) and 10–100 ng of genomic DNA tem-plate. The cycling conditions were 5 min at 95◦C followed by 30cycles of 15 s at 95◦C, 30 s at 55◦C and 1 min at 72◦C with a finalextension of 72◦C for 7 min. Cycling was performed in a PTC200DNA Engine (MJ Research, Waltham, MA, USA). PCR prod-ucts were viewed on a 1.5% agarose Tris-acetate-EDTA (TAE)gel stained with GelRed (Biotium Inc., Hayward, CA, USA).
In preparation for sequencing, PCR products were con-centrated and desalted using either a QIAquick PCR cleanupkit (Qiagen) or Exosap-it (USB Corporation, Cleveland, OH,
USA). Approximately 20 ng of DNA was used in standardABI Dye Terminator sequencing reactions and capillary gelseparated on an ABI3130XL (Applied Biosystems, Mulgrave,Australia) sequencer. Sequence data was edited and aligned withSequencher ver. 4.7 (Gene Codes, Ann Arbor, MI, USA) andClustalX (Thompson et al. 1997). Identical mtDNA sequenceswere described as haplotypes. Haplotype sequences for C. lim-batus were compared with mtDNA control region haplotypesassigned by Keeney and Heist (2006) using GenBank accessionnumbers AY208861–73 and AY766123–46.
Phylogenetic analysis of mitochondrial DNA sequences wasused to examine the pattern of similarity, which would testfor species distinctiveness. Sequences were concatenated forphylogenetic analysis following a partition homogeneity testin PAUP* ver. 4.0b10 (Swofford 2002) using only informativesites and 1000 replicates (P = 0.013). A significance thresh-old of 0.01 was used to test for gene congruence as partitionhomogeneity tests are considered to be conservative (Cun-ningham 1997). C. dussumieri was included in the alignmentas an outgroup. Phylogenetic analyses were carried out usingPAUP* ver. 4.0b10 (Swofford 2002). Trees were generated usingmaximum parsimony (P), maximum likelihood (L) and dis-tance matrix analyses (D). Before constructing L and D trees,a model of nucleotide substitution was determined using theAkaike Information Criterion in Modeltest (ver. 3.7, Posadaand Crandall 1998). A Tamura–Nei model with among-siteheterogeneity was selected (summarised as TrN+G) for the1902 bases of combined mtDNA control region, COI andND4 sequences. Model settings used were Lset Base = (0.29150.2434 0.1316), Nst = 6, Rmat = (1.0000 9.8378 1.0000 1.000021.4936), Rates = gamma, Shape = 0.1910 and Pinvar = 0.Unweighted trees were found using heuristic searches with ran-dom sequence addition and tree-bisection-reconnection (TBR)branch swapping.
For the parsimony analysis, gaps were treated as missingdata. Other settings used were Mulpars, Maxtrees set to 1000(P) or 200 (D and L) and heuristic search repetitions set to1000 (P) or one (D and L). These settings vary for the dif-ferent methods of analysis because distance and likelihood-based analyses are more computationally demanding. Supportfor nodes was assessed using bootstrap resampling (1000 repli-cates for P and D) and Bayesian analysis (B 400 000 generations).Bayesian analyses, using posterior probabilities, were completedin MrBayes (Huelsenbeck and Ronquist 2001). A general time-reversible + gamma distribution (GTR+G) substitution modelwas used for the Bayesian analysis because this was the bestapproximation of the TrN+G model, which was not availablewithin the software package (TrN is a restriction of the GTRmodel). Four chains were run for 500 000 generations and thefinal 400 000 trees were used to construct the consensus tree.The burn-in was 100 000. Control region haplotypes were placedin statistical parsimony networks using TCS software (Clementet al. 2000) with parsimony limits of 95%.
Microsatellite lociMolecular divergence between and within C. tilstoni and C. lim-batus was estimated using microsatellite loci. Allele frequenciesfor five dinucleotide microsatellite loci (Cli12, CS02, CS06,
256 Marine and Freshwater Research J. R. Ovenden et al.
CT05 and LS24) were estimated for each species. Loci weresourced from Ovenden et al. (2006), Keeney and Heist (2003)and Feldheim et al. (2001). Amplifications followed Ovendenet al. (2006). Forward primers had an M13 extension (GAG CGGATA ACA ATT TCA CAC AGG) at the 5′ end, which allowed theamplicons to be labelled with fluorescent tags (Schuelke 2000).A final extension at 72◦C for 30 min was used to ensure completeaddition of adenine to the amplicons for consistent allele callingduring genotyping. All loci were amplified in separate reactionsand then combined for fragment separation according to labelcolour and fragment size.
Microsatellite fragment separation and scoring were per-formed using capillary electrophoresis on a MegaBACE 1500(GE Health Care, Chalfont, UK). The running conditionsincluded a sample injection voltage of 3 KV, sample injectiontime of 45 s and run voltage of 10 KV with a run time of 75 min.All other parameters were according to the manufacturer’sspecifications.
Allele scoring was confirmed by calculating the size in basepairs of microsatellite amplicons to two decimal places. Ampli-cons were allocated to a ‘bin’ that represented the mean allelesize. Scoring of microsatellite alleles was verified by graphi-cal representation of allele size measured to two decimal placesagainst bin size. As expected for dinucleotide loci, alleles wereconsistently two base pairs apart and there were clear cut-offpoints between successive allele sizes.
Hardy–Weinberg equilibrium, genotypic linkage disequi-librium and microsatellite allelic distribution across loci forC. tilstoni and C. limbatus were tested using Genepop-on-the-web (Raymond and Rousset 1995). The number of alleles perlocus and expected and observed heterozygosity were used tocharacterise the genetic diversity of microsatellite loci. The stan-dard FST approach (Weir and Cockerham 1984) was used toinvestigate the degree of genetic subdivision between speciesfrom microsatellite allelic frequencies, with missing data han-dled by interpolation. Non-parametric bootstrapping of FSTvalues was implemented to estimate P-values over 999 randompermutations of the dataset. These calculations were performedin GenAlEx ver. 6.1 (Peakall and Smouse 2006).
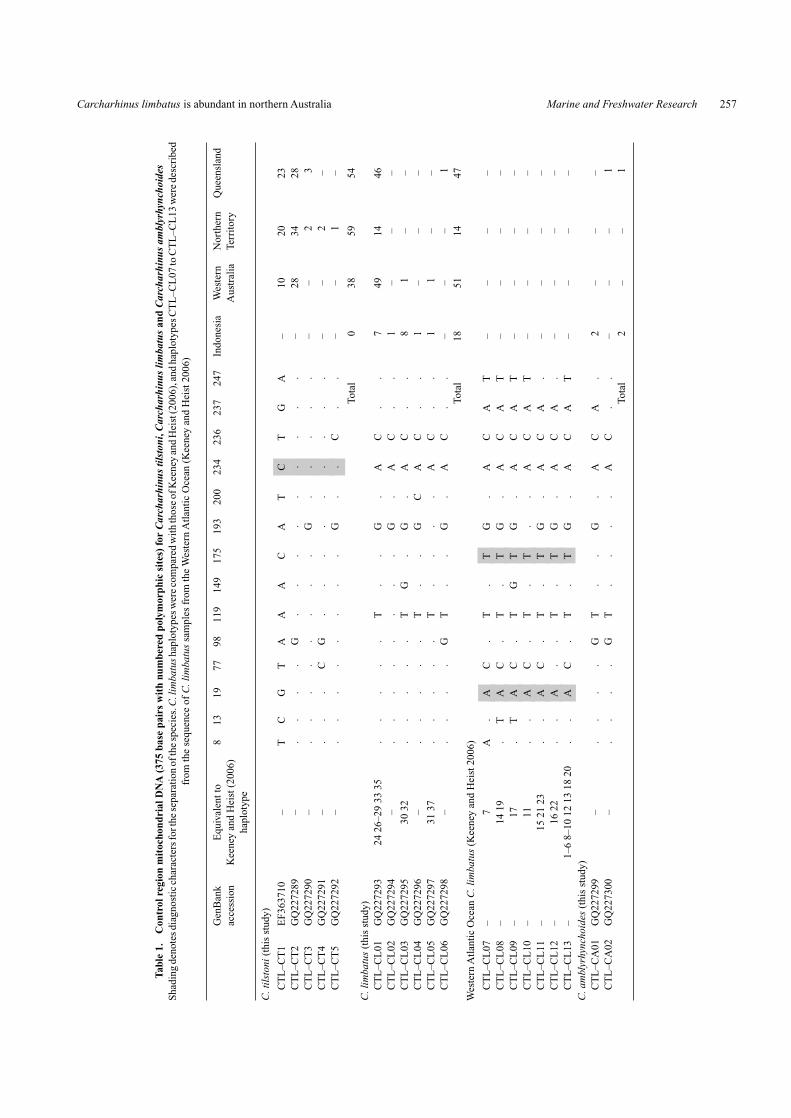
ResultsMitochondrial DNAMtDNA control region sequence differences were provision-ally used to identify blacktip shark samples as either C. tilstonior C. limbatus. Sequences were aligned and trimmed to 375base pairs. Sequences from reference C. tilstoni (n = 4) andC. limbatus (n = 4) were characterised by a fixed nucleotidedifference at position 234; C. tilstoni had a ‘C’ at this posi-tion, whereas C. limbatus haplotypes were ‘A’. Single nucleotidepolymorphisms did not distinguish C. limbatus samples fromC. amblyrhynchoides (Table 1).
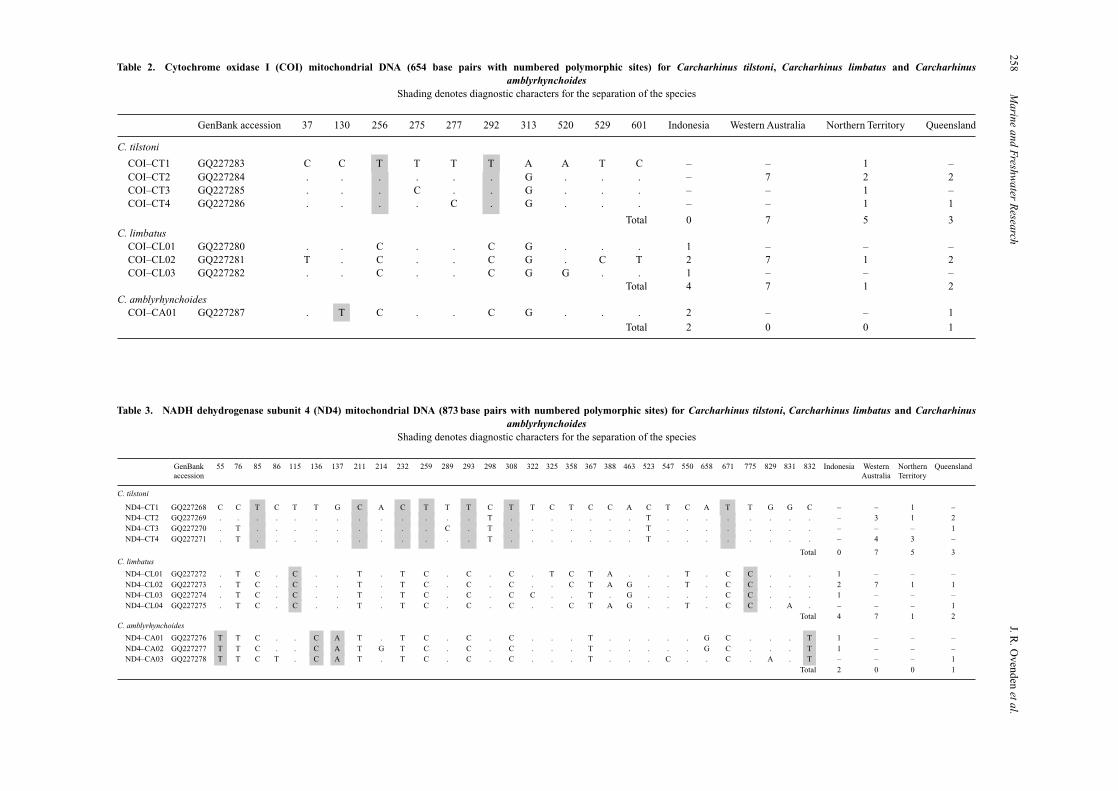
Additional sequencing of mtDNA COI and ND4 genes iden-tified a further two (COI, Table 2) and 10 (ND4, Table 3) fixednucleotide differences separating C. tilstoni from C. limbatussamples, confirming the provisional identifications from controlregion sequence. Fixed differences were also found to distinguishC. amblyrhynchoides from C. tilstoni and C. limbatus samples inCOI (one fixed difference at position 130) and ND4 (four fixed
differences at positions 55, 136, 137 and 832) gene regions.Haplotype and nucleotide diversities for gene regions are notpresented because they are not based on a random populationsample.
To test the expectation from the literature that C. limbatuswas rare in Australian waters, the numbers of C. limbatus and C.tilstoni samples taken from Australian collection locations werecalculated. In Western Australia, sampling was skewed towardsC. limbatus; 51 samples were collected compared with 38 for C.tilstoni. In the Northern Territory, C. tilstoni samples (59) weremore common than those of C. limbatus (14), while in Queens-land the proportions of the two species were roughly equal (C.tilstoni, 54; C. limbatus, 47). No C. tilstoni individuals werefound among the 20 blacktip shark samples (C. limbatus and C.amblyrhynchoides) analysed from Indonesia.
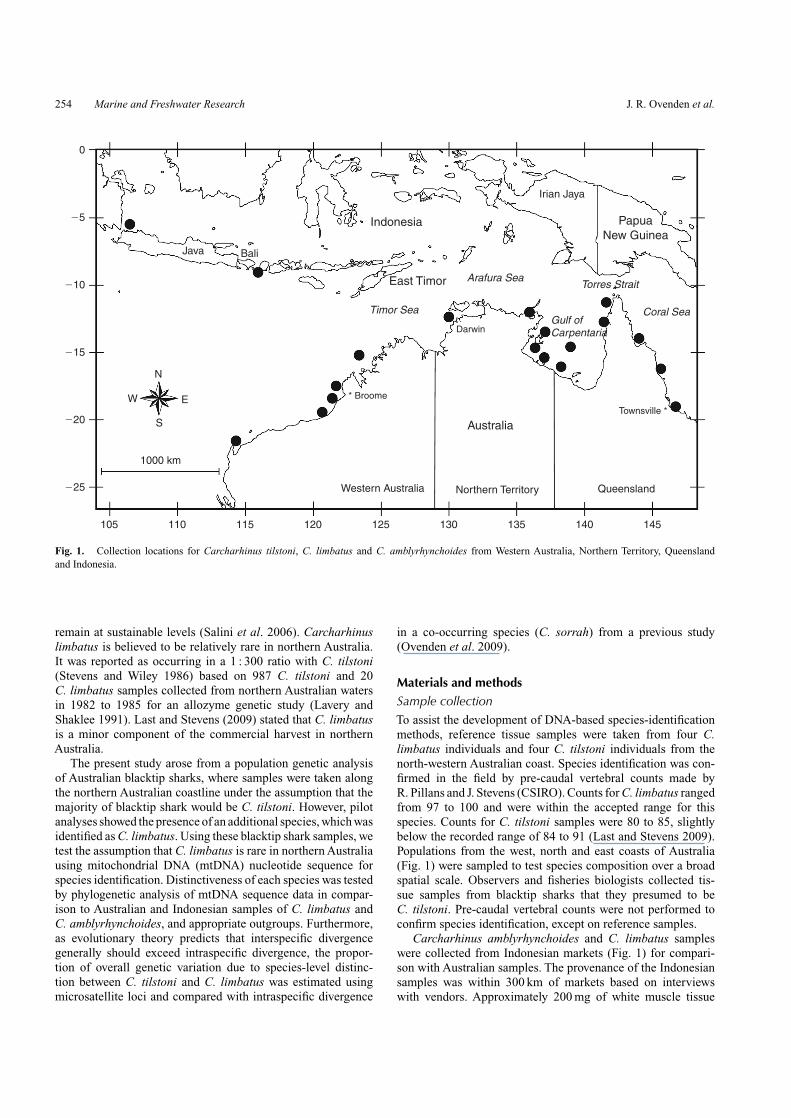
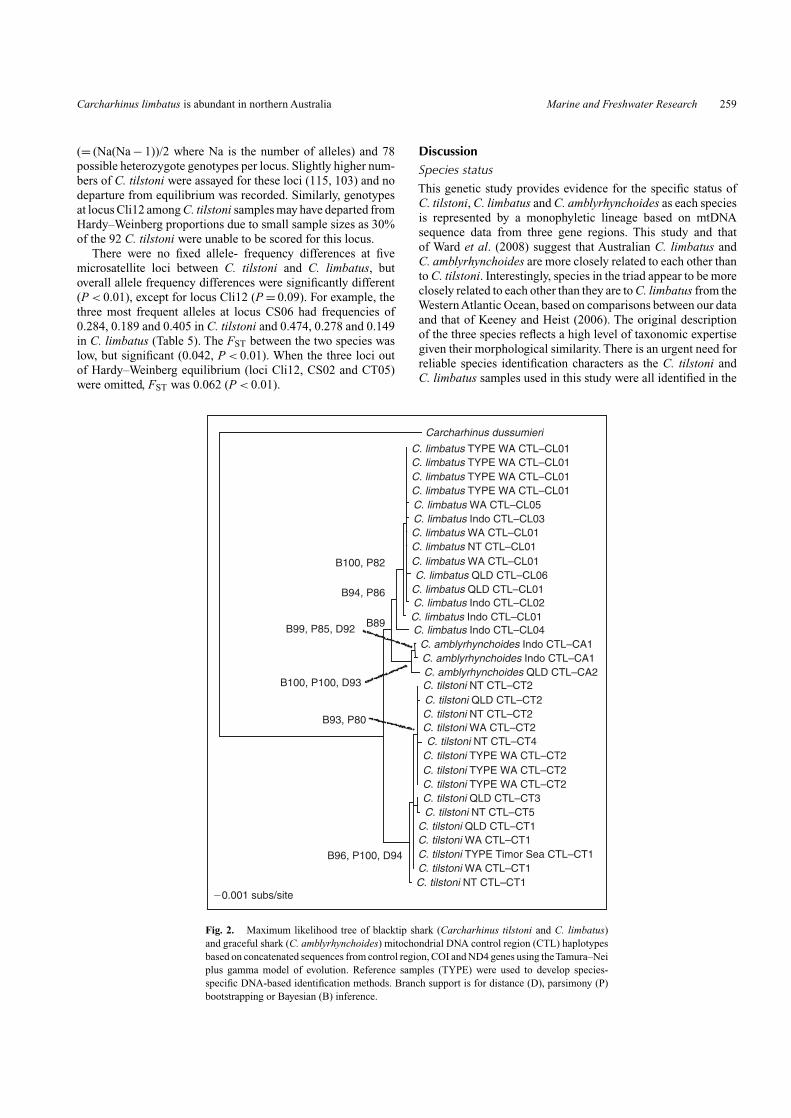
Distance and parsimony bootstrapping and Bayesian anal-yses strongly supported C. amblyrhynchoides and C. tilstonievolutionary lineages; however, support for the C. limbatus lin-eage was lacking for the distance-based comparison (Fig. 2).Likelihood-based phylogenetic analysis of the concatenatedmtDNA sequences found a single tree with a –Ln likelihoodscore of 3498.34, which placed C. amblyrhynchoides sister toC. limbatus (Fig. 2). Parsimony analysis found six trees of 190steps, which placed C. amblyrhynchoides as either sister to C.limbatus or basal to the two blacktip species. Distance analysisreached maximum trees (200) with a minimum evolution scoreof 0.14603. All distance trees placed C. amblyrhynchoides basalto the two blacktip species.
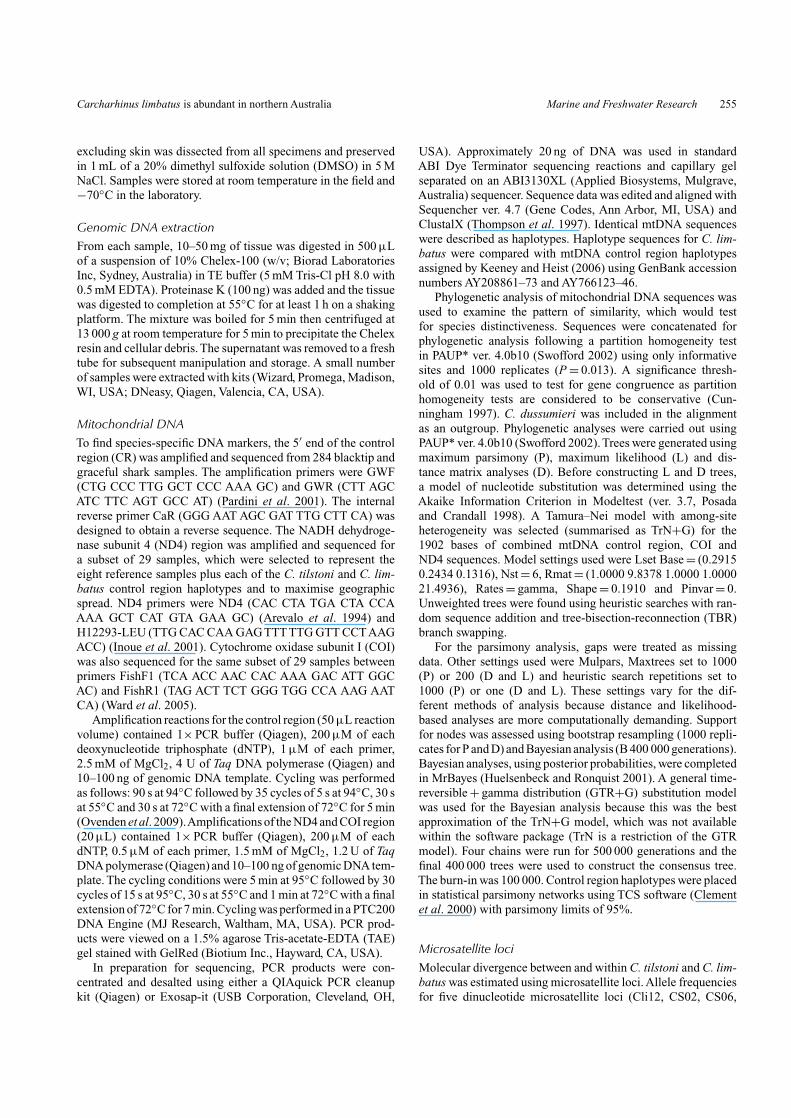
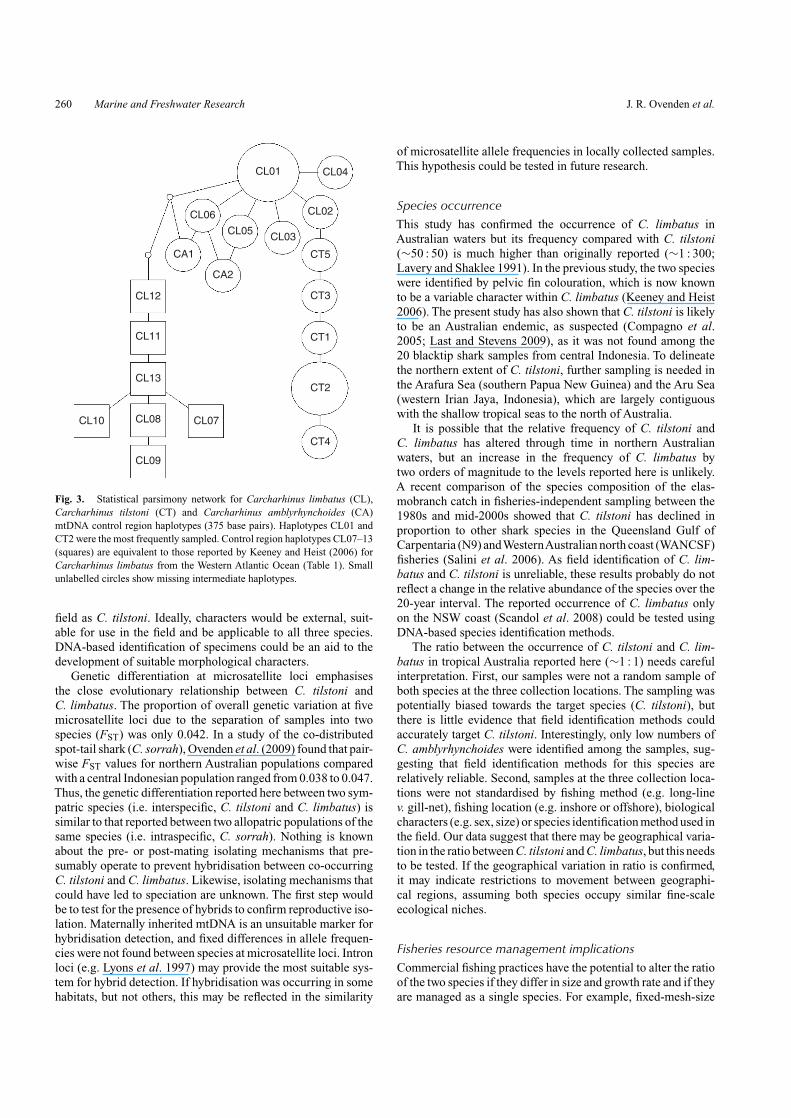
A statistical parsimony network (Fig. 3) of mtDNA controlregion haplotypes emphasised the close relationship betweenC. tilstoni, C. limbatus and C. amblyrhynchoides. Haplotype CT5(C. tilstoni) was connected by one mutational step to the C. lim-batus haplotype (CL02). Remaining CT haplotypes (CT1–4)were connected to CT5 in a linear string separated by one muta-tional step. The position of the two C. amblyrhynchoides haplo-types (CA1, 2) was ambiguous, but their character states weremore similar to C. limbatus than to C. tilstoni haplotypes. Threeof the CL control region haplotypes (CL01, 03 and 06) were iden-tical to C. limbatus haplotypes sampled from the Indo-Pacificregion and Indian Ocean by Keeney and Heist (2006) (Table 1).Western Atlantic Ocean C. limbatus control region haplotypes(Keeney and Heist 2006) were most similar to haplotype CL01(three mutational steps) and haplotype CA1 (three steps).
Microsatellite lociAllele frequencies from five microsatellite loci highlighted thegenetic similarity between C. tilstoni and C. limbatus. Therewas no evidence for linkage disequilibrium in microsatellitegenotype proportions. The observed compared with expectedproportion of heterozygotes departed from Hardy–Weinbergequilibrium at loci CS02 and CT05 among C. limbatus sam-ples, and at locus Cli12 in C. tilstoni samples (Table 4). For lociCS02 and CT05 among C. limbatus samples, there were fewerheterozygotes observed than expected. The frequencies of thisnumber of genotypes may have been poorly estimated by the97 (CS02) and 98 (CT05) C. limbatus individuals assayed inthis study. At these loci, there were 18 (CS02) and 13 (CT05)alleles scored for C. limbatus, giving respective totals of 153
Carcharhinus limbatus is abundant in northern Australia Marine and Freshwater Research 257
Tabl
e1.
Con
trol
regi
onm
itoc
hond
rial
DN
A(3
75ba
sepa
irs
wit
hnu
mbe
red
poly
mor
phic
site
s)fo
rC
arch
arhi
nus
tilst
oni,
Car
char
hinu
slim
batu
san
dC
arch
arhi
nus
ambl
yrhy
ncho
ides
Shad
ing
deno
tesd
iagn
ostic
char
acte
rsfo
rthe
sepa
ratio
nof
the
spec
ies.
C.l
imba
tush
aplo
type
swer
eco
mpa
red
with
thos
eof
Kee
ney
and
Hei
st(2
006)
,and
hapl
otyp
esC
TL
–CL
07to
CT
L–C
L13
wer
ede
scri
bed
from
the
sequ
ence
ofC
.lim
batu
ssa
mpl
esfr
omth
eW
este
rnA
tlant
icO
cean
(Kee
ney
and
Hei
st20
06)
Gen
Ban
kE
quiv
alen
tto
813
1977
9811
914
917
519
320
023
423
623
724
7In
done
sia
Wes
tern
Nor
ther
nQ
ueen
slan
dac
cess
ion
Kee
ney
and
Hei
st(2
006)
Aus
tral
iaTe
rrito
ryha
plot
ype
C.t
ilsto
ni(t
his
stud
y)
CT
L–C
T1
EF3
6371
0–
TC
GT
AA
AC
AT
CT
GA
–10
2023
CT
L–C
T2
GQ
2272
89–
..
..
G.
..
..
..
..
–28
3428
CT
L–C
T3
GQ
2272
90–
..
..
..
..
G.
..
..
––
23
CT
L–C
T4
GQ
2272
91–
..
.C
G.
..
..
..
..
––
2–
CT
L–C
T5
GQ
2272
92–
..
..
..
..
G.
.C
..
––
1–
Tota
l0
3859
54C
.lim
batu
s(t
his
stud
y)C
TL
–CL
01G
Q22
7293
2426
–29
3335
..
..
.T
..
G.
AC
..
749
1446
CT
L–C
L02
GQ
2272
94–
..
..
..
..
G.
AC
..
1–
––
CT
L–C
L03
GQ
2272
9530
32.
..
..
TG
.G
.A
C.
.8
1–
–C
TL
–CL
04G
Q22
7296
–.
..
..
T.
.G
CA
C.
.1
––
–C
TL
–CL
05G
Q22
7297
3137
..
..
.T
..
..
AC
..
11
––
CT
L–C
L06
GQ
2272
98–
..
..
GT
..
G.
AC
..
––
–1
Tota
l18
5114
47W
este
rnA
tlant
icO
cean
C.l
imba
tus
(Kee
ney
and
Hei
st20
06)
CT
L–C
L07
–7
A.
AC
.T
.T
G.
AC
AT
––
––
CT
L–C
L08
–14
19.
TA
C.
T.
TG
.A
CA
T–
––
–C
TL
–CL
09–
17.
TA
C.
TG
TG
.A
CA
T–
––
–C
TL
–CL
10–
11.
.A
C.
T.
T.
.A
CA
T–
––
–C
TL
–CL
11–
1521
23.
.A
C.
T.
TG
.A
CA
.–
––
–C
TL
–CL
12–
1622
..
A.
.T
.T
G.
AC
A.
––
––
CT
L–C
L13
–1–
68–
1012
1318
20.
.A
C.
T.
TG
.A
CA
T–
––
–C
.am
blyr
hync
hoid
es(t
his
stud
y)C
TL
–CA
01G
Q22
7299
–.
..
.G
T.
.G
.A
CA
.2
––
–C
TL
–CA
02G
Q22
7300
–.
..
.G
T.
..
.A
C.
.–
––
1To
tal
2–
–1
258M
arineand
Freshwater
Research
J.R.O
vendenetal.
Table 2. Cytochrome oxidase I (COI) mitochondrial DNA (654 base pairs with numbered polymorphic sites) for Carcharhinus tilstoni, Carcharhinus limbatus and Carcharhinusamblyrhynchoides
Shading denotes diagnostic characters for the separation of the species
GenBank accession 37 130 256 275 277 292 313 520 529 601 Indonesia Western Australia Northern Territory Queensland
C. tilstoni
COI–CT1 GQ227283 C C T T T T A A T C – – 1 –COI–CT2 GQ227284 . . . . . . G . . . – 7 2 2COI–CT3 GQ227285 . . . C . . G . . . – – 1 –COI–CT4 GQ227286 . . . . C . G . . . – – 1 1
Total 0 7 5 3C. limbatus
COI–CL01 GQ227280 . . C . . C G . . . 1 – – –COI–CL02 GQ227281 T . C . . C G . C T 2 7 1 2COI–CL03 GQ227282 . . C . . C G G . . 1 – – –
Total 4 7 1 2C. amblyrhynchoides
COI–CA01 GQ227287 . T C . . C G . . . 2 – – 1Total 2 0 0 1
Table 3. NADH dehydrogenase subunit 4 (ND4) mitochondrial DNA (873 base pairs with numbered polymorphic sites) for Carcharhinus tilstoni, Carcharhinus limbatus and Carcharhinusamblyrhynchoides
Shading denotes diagnostic characters for the separation of the species
GenBank 55 76 85 86 115 136 137 211 214 232 259 289 293 298 308 322 325 358 367 388 463 523 547 550 658 671 775 829 831 832 Indonesia Western Northern Queenslandaccession Australia Territory
C. tilstoni
ND4–CT1 GQ227268 C C T C T T G C A C T T T C T T C T C C A C T C A T T G G C – – 1 –ND4–CT2 GQ227269 . . . . . . . . . . . . . T . . . . . . . T . . . . . . . . – 3 1 2ND4–CT3 GQ227270 . T . . . . . . . . . C . T . . . . . . . T . . . . . . . . – – – 1ND4–CT4 GQ227271 . T . . . . . . . . . . . T . . . . . . . T . . . . . . . . – 4 3 –
Total 0 7 5 3C. limbatus
ND4–CL01 GQ227272 . T C . C . . T . T C . C . C . T C T A . . . T . C C . . . 1 – – –ND4–CL02 GQ227273 . T C . C . . T . T C . C . C . . C T A G . . T . C C . . . 2 7 1 1ND4–CL03 GQ227274 . T C . C . . T . T C . C . C C . . T . G . . . . C C . . . 1 – – –ND4–CL04 GQ227275 . T C . C . . T . T C . C . C . . C T A G . . T . C C . A . – – – 1
Total 4 7 1 2C. amblyrhynchoides
ND4–CA01 GQ227276 T T C . . C A T . T C . C . C . . . T . . . . . G C . . . T 1 – – –ND4–CA02 GQ227277 T T C . . C A T G T C . C . C . . . T . . . . . G C . . . T 1 – – –ND4–CA03 GQ227278 T T C T . C A T . T C . C . C . . . T . . . C . . C . A . T – – – 1
Total 2 0 0 1
Carcharhinus limbatus is abundant in northern Australia Marine and Freshwater Research 259
(= (Na(Na − 1))/2 where Na is the number of alleles) and 78possible heterozygote genotypes per locus. Slightly higher num-bers of C. tilstoni were assayed for these loci (115, 103) and nodeparture from equilibrium was recorded. Similarly, genotypesat locus Cli12 among C. tilstoni samples may have departed fromHardy–Weinberg proportions due to small sample sizes as 30%of the 92 C. tilstoni were unable to be scored for this locus.
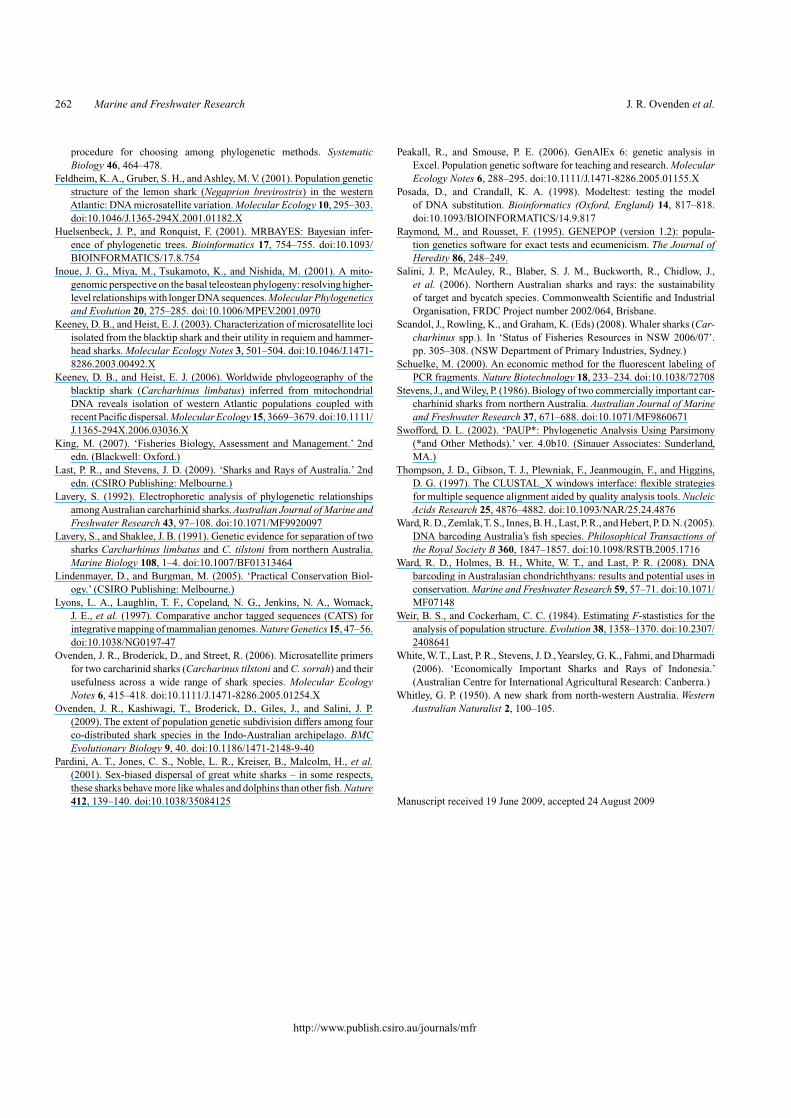
There were no fixed allele- frequency differences at fivemicrosatellite loci between C. tilstoni and C. limbatus, butoverall allele frequency differences were significantly different(P < 0.01), except for locus Cli12 (P = 0.09). For example, thethree most frequent alleles at locus CS06 had frequencies of0.284, 0.189 and 0.405 in C. tilstoni and 0.474, 0.278 and 0.149in C. limbatus (Table 5). The FST between the two species waslow, but significant (0.042, P < 0.01). When the three loci outof Hardy–Weinberg equilibrium (loci Cli12, CS02 and CT05)were omitted, FST was 0.062 (P < 0.01).
Carcharhinus dussumieri C. limbatus TYPE WA CTL–CL01C. limbatus TYPE WA CTL–CL01 C. limbatus TYPE WA CTL–CL01C. limbatus TYPE WA CTL–CL01C. limbatus WA CTL–CL05C. limbatus Indo CTL–CL03C. limbatus WA CTL–CL01C. limbatus NT CTL–CL01C. limbatus WA CTL–CL01C. limbatus QLD CTL–CL06
C. limbatus QLD CTL–CL01C. limbatus Indo CTL–CL02C. limbatus Indo CTL–CL01C. limbatus Indo CTL–CL04
C. amblyrhynchoides Indo CTL–CA1C. amblyrhynchoides Indo CTL–CA1C. amblyrhynchoides QLD CTL–CA2C. tilstoni NT CTL–CT2C. tilstoni QLD CTL–CT2C. tilstoni NT CTL–CT2C. tilstoni WA CTL–CT2C. tilstoni NT CTL–CT4
C. tilstoni TYPE WA CTL–CT2C. tilstoni TYPE WA CTL–CT2C. tilstoni TYPE WA CTL–CT2C. tilstoni QLD CTL–CT3C. tilstoni NT CTL–CT5
C. tilstoni QLD CTL–CT1C. tilstoni WA CTL–CT1C. tilstoni TYPE Timor Sea CTL–CT1C. tilstoni WA CTL–CT1C. tilstoni NT CTL–CT1
!0.001 subs/site
B96, P100, D94
B93, P80
B100, P100, D93
B89
B94, P86
B99, P85, D92
B100, P82
Fig. 2. Maximum likelihood tree of blacktip shark (Carcharhinus tilstoni and C. limbatus)and graceful shark (C. amblyrhynchoides) mitochondrial DNA control region (CTL) haplotypesbased on concatenated sequences from control region, COI and ND4 genes using theTamura–Neiplus gamma model of evolution. Reference samples (TYPE) were used to develop species-specific DNA-based identification methods. Branch support is for distance (D), parsimony (P)bootstrapping or Bayesian (B) inference.
DiscussionSpecies statusThis genetic study provides evidence for the specific status ofC. tilstoni, C. limbatus and C. amblyrhynchoides as each speciesis represented by a monophyletic lineage based on mtDNAsequence data from three gene regions. This study and thatof Ward et al. (2008) suggest that Australian C. limbatus andC. amblyrhynchoides are more closely related to each other thanto C. tilstoni. Interestingly, species in the triad appear to be moreclosely related to each other than they are to C. limbatus from theWestern Atlantic Ocean, based on comparisons between our dataand that of Keeney and Heist (2006). The original descriptionof the three species reflects a high level of taxonomic expertisegiven their morphological similarity. There is an urgent need forreliable species identification characters as the C. tilstoni andC. limbatus samples used in this study were all identified in the
260 Marine and Freshwater Research J. R. Ovenden et al.
CA2
CA1
CL03
CT5
CL02
CL04
CT3
CT1
CT2
CT4
CL05CL06
CL12
CL11
CL13
CL08
CL09
CL10 CL07
CL01
Fig. 3. Statistical parsimony network for Carcharhinus limbatus (CL),Carcharhinus tilstoni (CT) and Carcharhinus amblyrhynchoides (CA)mtDNA control region haplotypes (375 base pairs). Haplotypes CL01 andCT2 were the most frequently sampled. Control region haplotypes CL07–13(squares) are equivalent to those reported by Keeney and Heist (2006) forCarcharhinus limbatus from the Western Atlantic Ocean (Table 1). Smallunlabelled circles show missing intermediate haplotypes.
field as C. tilstoni. Ideally, characters would be external, suit-able for use in the field and be applicable to all three species.DNA-based identification of specimens could be an aid to thedevelopment of suitable morphological characters.
Genetic differentiation at microsatellite loci emphasisesthe close evolutionary relationship between C. tilstoni andC. limbatus. The proportion of overall genetic variation at fivemicrosatellite loci due to the separation of samples into twospecies (FST) was only 0.042. In a study of the co-distributedspot-tail shark (C. sorrah), Ovenden et al. (2009) found that pair-wise FST values for northern Australian populations comparedwith a central Indonesian population ranged from 0.038 to 0.047.Thus, the genetic differentiation reported here between two sym-patric species (i.e. interspecific, C. tilstoni and C. limbatus) issimilar to that reported between two allopatric populations of thesame species (i.e. intraspecific, C. sorrah). Nothing is knownabout the pre- or post-mating isolating mechanisms that pre-sumably operate to prevent hybridisation between co-occurringC. tilstoni and C. limbatus. Likewise, isolating mechanisms thatcould have led to speciation are unknown. The first step wouldbe to test for the presence of hybrids to confirm reproductive iso-lation. Maternally inherited mtDNA is an unsuitable marker forhybridisation detection, and fixed differences in allele frequen-cies were not found between species at microsatellite loci. Intronloci (e.g. Lyons et al. 1997) may provide the most suitable sys-tem for hybrid detection. If hybridisation was occurring in somehabitats, but not others, this may be reflected in the similarity
of microsatellite allele frequencies in locally collected samples.This hypothesis could be tested in future research.
Species occurrenceThis study has confirmed the occurrence of C. limbatus inAustralian waters but its frequency compared with C. tilstoni(∼50 : 50) is much higher than originally reported (∼1 : 300;Lavery and Shaklee 1991). In the previous study, the two specieswere identified by pelvic fin colouration, which is now knownto be a variable character within C. limbatus (Keeney and Heist2006). The present study has also shown that C. tilstoni is likelyto be an Australian endemic, as suspected (Compagno et al.2005; Last and Stevens 2009), as it was not found among the20 blacktip shark samples from central Indonesia. To delineatethe northern extent of C. tilstoni, further sampling is needed inthe Arafura Sea (southern Papua New Guinea) and the Aru Sea(western Irian Jaya, Indonesia), which are largely contiguouswith the shallow tropical seas to the north of Australia.
It is possible that the relative frequency of C. tilstoni andC. limbatus has altered through time in northern Australianwaters, but an increase in the frequency of C. limbatus bytwo orders of magnitude to the levels reported here is unlikely.A recent comparison of the species composition of the elas-mobranch catch in fisheries-independent sampling between the1980s and mid-2000s showed that C. tilstoni has declined inproportion to other shark species in the Queensland Gulf ofCarpentaria (N9) andWesternAustralian north coast (WANCSF)fisheries (Salini et al. 2006). As field identification of C. lim-batus and C. tilstoni is unreliable, these results probably do notreflect a change in the relative abundance of the species over the20-year interval. The reported occurrence of C. limbatus onlyon the NSW coast (Scandol et al. 2008) could be tested usingDNA-based species identification methods.
The ratio between the occurrence of C. tilstoni and C. lim-batus in tropical Australia reported here (∼1 : 1) needs carefulinterpretation. First, our samples were not a random sample ofboth species at the three collection locations. The sampling waspotentially biased towards the target species (C. tilstoni), butthere is little evidence that field identification methods couldaccurately target C. tilstoni. Interestingly, only low numbers ofC. amblyrhynchoides were identified among the samples, sug-gesting that field identification methods for this species arerelatively reliable. Second, samples at the three collection loca-tions were not standardised by fishing method (e.g. long-linev. gill-net), fishing location (e.g. inshore or offshore), biologicalcharacters (e.g. sex, size) or species identification method used inthe field. Our data suggest that there may be geographical varia-tion in the ratio between C. tilstoni and C. limbatus, but this needsto be tested. If the geographical variation in ratio is confirmed,it may indicate restrictions to movement between geographi-cal regions, assuming both species occupy similar fine-scaleecological niches.
Fisheries resource management implicationsCommercial fishing practices have the potential to alter the ratioof the two species if they differ in size and growth rate and if theyare managed as a single species. For example, fixed-mesh-size
Carcharhinus limbatus is abundant in northern Australia Marine and Freshwater Research 261
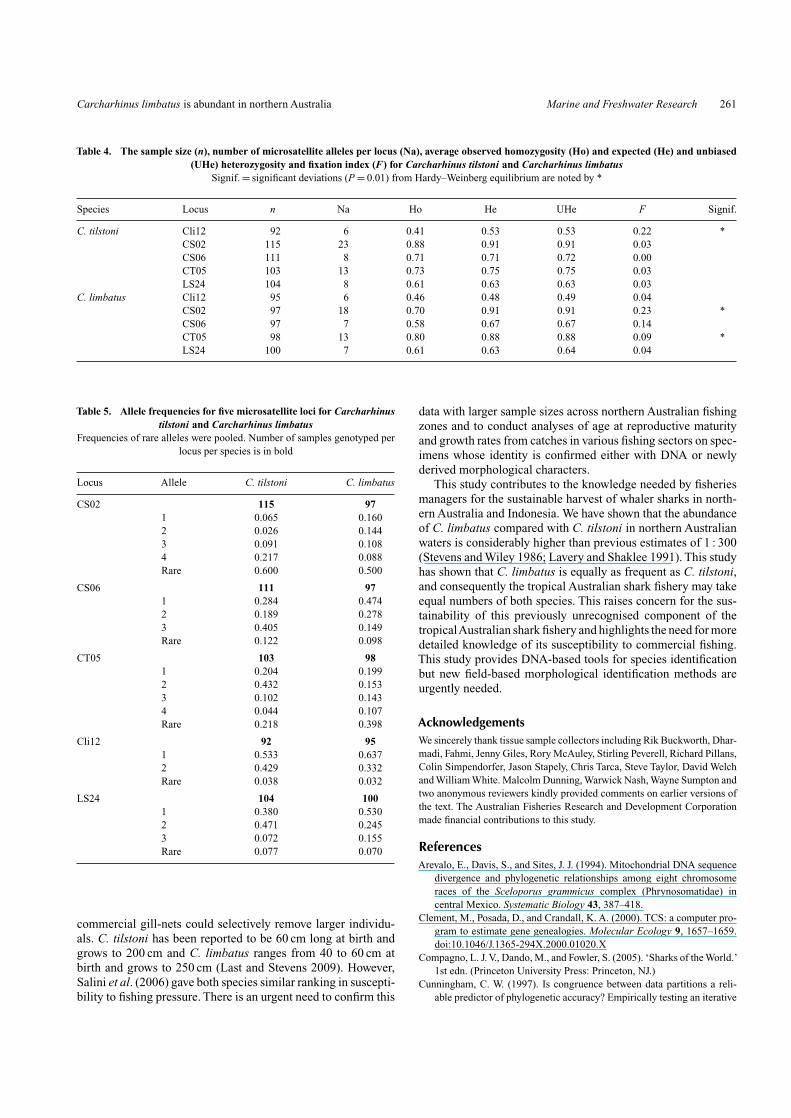
Table 4. The sample size (n), number of microsatellite alleles per locus (Na), average observed homozygosity (Ho) and expected (He) and unbiased(UHe) heterozygosity and fixation index (F) for Carcharhinus tilstoni and Carcharhinus limbatus
Signif. = significant deviations (P = 0.01) from Hardy–Weinberg equilibrium are noted by *
Species Locus n Na Ho He UHe F Signif.
C. tilstoni Cli12 92 6 0.41 0.53 0.53 0.22 *CS02 115 23 0.88 0.91 0.91 0.03CS06 111 8 0.71 0.71 0.72 0.00CT05 103 13 0.73 0.75 0.75 0.03LS24 104 8 0.61 0.63 0.63 0.03
C. limbatus Cli12 95 6 0.46 0.48 0.49 0.04CS02 97 18 0.70 0.91 0.91 0.23 *CS06 97 7 0.58 0.67 0.67 0.14CT05 98 13 0.80 0.88 0.88 0.09 *LS24 100 7 0.61 0.63 0.64 0.04
Table 5. Allele frequencies for five microsatellite loci for Carcharhinustilstoni and Carcharhinus limbatus
Frequencies of rare alleles were pooled. Number of samples genotyped perlocus per species is in bold
Locus Allele C. tilstoni C. limbatus
CS02 115 971 0.065 0.1602 0.026 0.1443 0.091 0.1084 0.217 0.088Rare 0.600 0.500
CS06 111 971 0.284 0.4742 0.189 0.2783 0.405 0.149Rare 0.122 0.098
CT05 103 981 0.204 0.1992 0.432 0.1533 0.102 0.1434 0.044 0.107Rare 0.218 0.398
Cli12 92 951 0.533 0.6372 0.429 0.332Rare 0.038 0.032
LS24 104 1001 0.380 0.5302 0.471 0.2453 0.072 0.155Rare 0.077 0.070
commercial gill-nets could selectively remove larger individu-als. C. tilstoni has been reported to be 60 cm long at birth andgrows to 200 cm and C. limbatus ranges from 40 to 60 cm atbirth and grows to 250 cm (Last and Stevens 2009). However,Salini et al. (2006) gave both species similar ranking in suscepti-bility to fishing pressure. There is an urgent need to confirm this
data with larger sample sizes across northern Australian fishingzones and to conduct analyses of age at reproductive maturityand growth rates from catches in various fishing sectors on spec-imens whose identity is confirmed either with DNA or newlyderived morphological characters.
This study contributes to the knowledge needed by fisheriesmanagers for the sustainable harvest of whaler sharks in north-ern Australia and Indonesia. We have shown that the abundanceof C. limbatus compared with C. tilstoni in northern Australianwaters is considerably higher than previous estimates of 1 : 300(Stevens and Wiley 1986; Lavery and Shaklee 1991). This studyhas shown that C. limbatus is equally as frequent as C. tilstoni,and consequently the tropical Australian shark fishery may takeequal numbers of both species. This raises concern for the sus-tainability of this previously unrecognised component of thetropicalAustralian shark fishery and highlights the need for moredetailed knowledge of its susceptibility to commercial fishing.This study provides DNA-based tools for species identificationbut new field-based morphological identification methods areurgently needed.
AcknowledgementsWe sincerely thank tissue sample collectors including Rik Buckworth, Dhar-madi, Fahmi, Jenny Giles, Rory McAuley, Stirling Peverell, Richard Pillans,Colin Simpendorfer, Jason Stapely, Chris Tarca, Steve Taylor, David Welchand William White. Malcolm Dunning, Warwick Nash, Wayne Sumpton andtwo anonymous reviewers kindly provided comments on earlier versions ofthe text. The Australian Fisheries Research and Development Corporationmade financial contributions to this study.
ReferencesArevalo, E., Davis, S., and Sites, J. J. (1994). Mitochondrial DNA sequence
divergence and phylogenetic relationships among eight chromosomeraces of the Sceloporus grammicus complex (Phrynosomatidae) incentral Mexico. Systematic Biology 43, 387–418.
Clement, M., Posada, D., and Crandall, K. A. (2000). TCS: a computer pro-gram to estimate gene genealogies. Molecular Ecology 9, 1657–1659.doi:10.1046/J.1365-294X.2000.01020.X
Compagno, L. J. V., Dando, M., and Fowler, S. (2005). ‘Sharks of the World.’1st edn. (Princeton University Press: Princeton, NJ.)
Cunningham, C. W. (1997). Is congruence between data partitions a reli-able predictor of phylogenetic accuracy? Empirically testing an iterative
262 Marine and Freshwater Research J. R. Ovenden et al.
procedure for choosing among phylogenetic methods. SystematicBiology 46, 464–478.
Feldheim, K. A., Gruber, S. H., and Ashley, M. V. (2001). Population geneticstructure of the lemon shark (Negaprion brevirostris) in the westernAtlantic: DNA microsatellite variation. Molecular Ecology 10, 295–303.doi:10.1046/J.1365-294X.2001.01182.X
Huelsenbeck, J. P., and Ronquist, F. (2001). MRBAYES: Bayesian infer-ence of phylogenetic trees. Bioinformatics 17, 754–755. doi:10.1093/BIOINFORMATICS/17.8.754
Inoue, J. G., Miya, M., Tsukamoto, K., and Nishida, M. (2001). A mito-genomic perspective on the basal teleostean phylogeny: resolving higher-level relationships with longer DNA sequences. Molecular Phylogeneticsand Evolution 20, 275–285. doi:10.1006/MPEV.2001.0970
Keeney, D. B., and Heist, E. J. (2003). Characterization of microsatellite lociisolated from the blacktip shark and their utility in requiem and hammer-head sharks. Molecular Ecology Notes 3, 501–504. doi:10.1046/J.1471-8286.2003.00492.X
Keeney, D. B., and Heist, E. J. (2006). Worldwide phylogeography of theblacktip shark (Carcharhinus limbatus) inferred from mitochondrialDNA reveals isolation of western Atlantic populations coupled withrecent Pacific dispersal. Molecular Ecology 15, 3669–3679. doi:10.1111/J.1365-294X.2006.03036.X
King, M. (2007). ‘Fisheries Biology, Assessment and Management.’ 2ndedn. (Blackwell: Oxford.)
Last, P. R., and Stevens, J. D. (2009). ‘Sharks and Rays of Australia.’ 2ndedn. (CSIRO Publishing: Melbourne.)
Lavery, S. (1992). Electrophoretic analysis of phylogenetic relationshipsamong Australian carcharhinid sharks.Australian Journal of Marine andFreshwater Research 43, 97–108. doi:10.1071/MF9920097
Lavery, S., and Shaklee, J. B. (1991). Genetic evidence for separation of twosharks Carcharhinus limbatus and C. tilstoni from northern Australia.Marine Biology 108, 1–4. doi:10.1007/BF01313464
Lindenmayer, D., and Burgman, M. (2005). ‘Practical Conservation Biol-ogy.’ (CSIRO Publishing: Melbourne.)
Lyons, L. A., Laughlin, T. F., Copeland, N. G., Jenkins, N. A., Womack,J. E., et al. (1997). Comparative anchor tagged sequences (CATS) forintegrative mapping of mammalian genomes. Nature Genetics 15, 47–56.doi:10.1038/NG0197-47
Ovenden, J. R., Broderick, D., and Street, R. (2006). Microsatellite primersfor two carcharinid sharks (Carcharinus tilstoni and C. sorrah) and theirusefulness across a wide range of shark species. Molecular EcologyNotes 6, 415–418. doi:10.1111/J.1471-8286.2005.01254.X
Ovenden, J. R., Kashiwagi, T., Broderick, D., Giles, J., and Salini, J. P.(2009). The extent of population genetic subdivision differs among fourco-distributed shark species in the Indo-Australian archipelago. BMCEvolutionary Biology 9, 40. doi:10.1186/1471-2148-9-40
Pardini, A. T., Jones, C. S., Noble, L. R., Kreiser, B., Malcolm, H., et al.(2001). Sex-biased dispersal of great white sharks – in some respects,these sharks behave more like whales and dolphins than other fish. Nature412, 139–140. doi:10.1038/35084125
http://www.publish.csiro.au/journals/mfr
Peakall, R., and Smouse, P. E. (2006). GenAlEx 6: genetic analysis inExcel. Population genetic software for teaching and research. MolecularEcology Notes 6, 288–295. doi:10.1111/J.1471-8286.2005.01155.X
Posada, D., and Crandall, K. A. (1998). Modeltest: testing the modelof DNA substitution. Bioinformatics (Oxford, England) 14, 817–818.doi:10.1093/BIOINFORMATICS/14.9.817
Raymond, M., and Rousset, F. (1995). GENEPOP (version 1.2): popula-tion genetics software for exact tests and ecumenicism. The Journal ofHeredity 86, 248–249.
Salini, J. P., McAuley, R., Blaber, S. J. M., Buckworth, R., Chidlow, J.,et al. (2006). Northern Australian sharks and rays: the sustainabilityof target and bycatch species. Commonwealth Scientific and IndustrialOrganisation, FRDC Project number 2002/064, Brisbane.
Scandol, J., Rowling, K., and Graham, K. (Eds) (2008). Whaler sharks (Car-charhinus spp.). In ‘Status of Fisheries Resources in NSW 2006/07’.pp. 305–308. (NSW Department of Primary Industries, Sydney.)
Schuelke, M. (2000). An economic method for the fluorescent labeling ofPCR fragments. Nature Biotechnology 18, 233–234. doi:10.1038/72708
Stevens, J., and Wiley, P. (1986). Biology of two commercially important car-charhinid sharks from northern Australia. Australian Journal of Marineand Freshwater Research 37, 671–688. doi:10.1071/MF9860671
Swofford, D. L. (2002). ‘PAUP*: Phylogenetic Analysis Using Parsimony(*and Other Methods).’ ver. 4.0b10. (Sinauer Associates: Sunderland,MA.)
Thompson, J. D., Gibson, T. J., Plewniak, F., Jeanmougin, F., and Higgins,D. G. (1997). The CLUSTAL_X windows interface: flexible strategiesfor multiple sequence alignment aided by quality analysis tools. NucleicAcids Research 25, 4876–4882. doi:10.1093/NAR/25.24.4876
Ward, R. D., Zemlak,T. S., Innes, B. H., Last, P. R., and Hebert, P. D. N. (2005).DNA barcoding Australia’s fish species. Philosophical Transactions ofthe Royal Society B 360, 1847–1857. doi:10.1098/RSTB.2005.1716
Ward, R. D., Holmes, B. H., White, W. T., and Last, P. R. (2008). DNAbarcoding in Australasian chondrichthyans: results and potential uses inconservation. Marine and Freshwater Research 59, 57–71. doi:10.1071/MF07148
Weir, B. S., and Cockerham, C. C. (1984). Estimating F-stastistics for theanalysis of population structure. Evolution 38, 1358–1370. doi:10.2307/2408641
White, W. T., Last, P. R., Stevens, J. D.,Yearsley, G. K., Fahmi, and Dharmadi(2006). ‘Economically Important Sharks and Rays of Indonesia.’(Australian Centre for International Agricultural Research: Canberra.)
Whitley, G. P. (1950). A new shark from north-western Australia. WesternAustralian Naturalist 2, 100–105.
Manuscript received 19 June 2009, accepted 24 August 2009