Embed Size (px)
Citation preview
Screen Australia Drama Report Production of feature films, TV and online drama in Australia in 2020/21
2
© Screen Australia 2021 ISSN 2653-3251
The text in this report is released subject to a Creative Commons BY licence (Licence). This means, in summary, that you may reproduce, transmit and distribute the text, provided that you do not do so for commercial purposes, and provided that you attribute the text as extracted from Screen Australia’s Drama Report 2020/21. You must not alter, transform or build upon the text in this report. Your rights under the Licence are in addition to any fair dealing rights which you have under the Copyright Act 1968 (Cth). For further terms of the Licence, please see http://creativecommons.org/licenses/by-nc-nd/3.0/Screen Australia is grateful to all those who contributed data to the compilation of this report. The data provided has been drawn from a number of sources. While Screen Australia has undertaken all reasonable measures to ensure its accuracy, we cannot accept responsibility for inaccuracies and omissions.Cover: BlueyInside Cover: Wyrmwood: Apocalypse
3
The Drama Report 2020/21 | Screen Australia
Contents
ABOUT THE REPORT 4
KEY TERMS 5
OVERVIEW 6
ALL DRAMA PRODUCTION 8
AUSTRALIAN FEATURE SLATE 10
Feature budget ranges 11
Sources of finance for Australian features 12
AUSTRALIAN GENERAL TV DRAMA SLATE 15
AUSTRALIAN CHILDREN’S TV DRAMA SLATE 20
AUSTRALIAN ONLINE DRAMA SLATE 22
SPECIAL REPORT: AUSTRALIAN SVOD DRAMA 24
SOURCES OF FINANCE FOR AUSTRALIAN TV AND ONLINE DRAMA 26
TV/ONLINE DRAMA FINANCE BY FIRST RELEASE PLATFORM 28
FOREIGN PRODUCTION 29
DRAMA PRODUCTION BY LOCATION 30
THE IMPACT OF COVID-19 32
PDV SERVICES – FEATURES, TV DRAMA AND ONLINE PRODUCTION 33
Total PDV expenditure 34
PDV expenditure by state 34
Focus on foreign PDV-only expenditure 35
PDV showcases 37
TITLES IN THE 2020/21 SLATE 40
METHODOLOGY 46
4
ABOUT THE REPORTThis year marks the thirty-first edition of the Drama Report. First produced by the Australian Film Commission and, since 2008, Screen Australia, it initially covered feature films and TV drama including mini-series, telemovies and series/serials. New technology saw the emergence of online dramas and from 2016/17, as the number of titles grew, a separate category was created to accommodate them. In light of the ongoing changes experienced by the screen industry, Screen Australia is considering the future format of the report to ensure it remains as relevant as possible to the marketplace.The 2019/20 report attempted to capture COVID-19’s initial impact on drama production – though research can never fully measure the full personal or economic costs of such an event. This report continues that work by revising data where necessary for 2019/20, presenting data for 2020/21, and surveying the industry on the ongoing impact of the pandemic. The 2019/20 and 2020/21 data should be jointly considered when assessing the impact of COVID-19 on the sector. The 2019/20 financial year ended with most titles yet to resume work, and the industry still adjusting to the initial shock of the pandemic. 2020/21 was a very different year. Generally speaking, the industry worked through a wide range of significant challenges to recommence drama production.The pandemic continues to impact the development, production, and release of drama throughout Australia – but work has resumed, and continues. Several broad factors affected the industry through 2020/21:• Australia had fewer COVID-19 cases
than most other countries, enhancing the industry’s ability to produce content safely, and generating increased interest from foreign producers.
• Production was guided by the Australian Screen Production Industry COVID-Safe Guidelines, created by a collaboration between industry and government agencies, and published in late May 2020.
• Many Australian projects were assisted, to varying degrees, with pandemic-related costs by additional funding from Screen Australia, as well as state and territory government agencies.
• The Australian Government allocated an additional $400 million in funding for the
Location Incentive, extending the program until 2026/27. The Location Incentive works in partnership with the Location Offset to attract major screen productions to Australia.
• The Australian Government announced the $50 million Temporary Interruption Fund (TIF) in late June 2020. TIF assists new, Australian productions that would have been unable to start work due to production insurance exclusions relating to COVID-19, to commence production.
• Due to the effect of COVID-19 on the production pipeline, in April 2020, the Australian Communications and Media Authority (ACMA) announced it would provide temporary relief to commercial free-to-air and subscription TV broadcasters that did not comply with Australian drama obligations related to 2020.
• From January 2021, following the Australian Government’s announced changes in September 2020 and a Direction to the ACMA, the ACMA’s new Australian Content and Children’s Television Standards came into effect. The Standards require commercial free-to-air broadcasters to broadcast 250 points of Australian content per year, which may include commissioned first release drama (including children’s drama), and acquired feature films, as well as documentary programs and other children’s programs. In its media reform green paper, the Government has also signalled potential reforms to obligations for subscription television broadcasters, SVOD and AVOD services, and national broadcasters.
In responding to changes brought by COVID-19, and the broader evolution of the screen industry, the 2020/21 report includes two new sections:• insights into the impact of COVID-19 on the
production of Australian drama and work on foreign PDV projects (page 32)
• a special report on Australian SVOD drama production (page 24).
The report incorporates data gathered through surveys and publicly available sources to give a comprehensive view of drama production activity in Australia. Where data is not available, including for projects that are yet to be finalised at the time of survey, some estimations have been used. Results should therefore be considered indicative at a point in time, and should not be viewed as a precise measurement. Data is presented for the past five years, 2016/17 to 2020/21. Data for previous years is available on the Screen Australia website. Foreign titles are included if they are entirely or substantially shot in Australia, or have PDV work carried out in Australia without shooting here. See page 5 for definitions of ‘Australian’, ‘domestic’, ‘Co-production’ and ‘foreign’.Feature films and TV dramas represent about 30% of all audiovisual production spend in Australia (excluding online productions).1 Other areas of activity include documentaries, web-series, light entertainment, commercials, music videos, corporate videos, and TV productions such as sport, news and current affairs. See the statistics section of the Screen Australia website for details, screenaustralia.gov.au/fact-finders/production-trends, and the relevant archives for pre-2013/14 data.1Australian Bureau of Statistics (ABS), Film, Television and Digital Games, 2015/16, (cat. no. 8679.0).
5
The Drama Report 2020/21 | Screen Australia
KEY TERMSDrama includes: Features: a film made for cinema that is at least 60 minutes. TV drama: a ‘drama’ program according to the Broadcasting Services (Australian Content and Children’s Television) Standards 2020 (Cth).2 Includes series/serials, mini-series and telemovies. Online drama: encompasses single episode or series programs with total durations of 30 minutes or more, that have their first Australian release online. General drama: drama made for adult, teen and/or family audiences. It does not include Children’s drama, which is made specifically for child audiences.
Total budgets: reports on how much it actually costs to make projects. It is reported for all projects that started shooting during the financial year, with the full budget allocated to the date principal photography started; budgets are not apportioned across the duration of the project.
Total spend/expenditure: reports on how much of the total budgets were spent in Australia. This measure is particularly relevant for Co-productions and foreign productions. Again, all expenditure is allocated to the date principal photography or PDV work in Australia began rather than to the actual date of spending. Note: this is not the same as ‘qualifying Australian production expenditure’ (QAPE) for the purpose of the Producer Offset. Some expenditure in Australia is not QAPE, and QAPE can include some expenditure on Australian elements outside of Australia. QAPE is not reported here.
Australian productions include: ‘Domestic productions’: Projects other than Co-productions under Australian creative control (i.e. where the key elements are predominantly Australian and the project was originated and developed by Australians). This includes projects under Australian creative control that are 100% foreign-financed. ‘Co-productions’ are Official Co-productions (i.e. projects made pursuant to an agreement between the Australian Government and the government of another country). As Official Co-productions don’t have to pass the ‘significant Australian content’ test to be eligible for the Producer Offset, and may be classified as ‘Australian’ for the purposes of Australian content obligations applying to broadcasters, the report mainly focuses on domestic and Co-production projects as a combined ‘Australian’ slate.
‘Foreign productions’ are defined as those under foreign creative control, originated and developed by non-Australians. This includes foreign projects with an Australian production company operating in a service capacity. A test of creative control and key roles is applied for projects with Australian elements.
‘In-house productions’ are projects by Australian TV networks, where no independent production company is credited as producer or co-producer.
‘PDV’ (post, digital and visual effects) refers to those activities that create audio and visual elements for film or TV drama other than by principal photography, pick ups or physical elements such as sets and props, and includes animation. It also refers to the manipulation of
those elements and includes sound and visual editing, digital effects, creation of computer-generated images (CGI), film laboratory work and duplication services. As such, it includes a variety of activities that not only take place after the shoot but also during the earlier stages of a project’s overall production.
The following abbreviations are used throughout the report: Subscription video-on-demand (SVOD), Broadcaster video-on-demand (BVOD), Advertising or Ad-based video-on-demand (AVOD) and Transactional video-on-demand (TVOD).
See also Methodology on page 46.2See section 8 of Broadcasting Services (Australian Content and Children’s Television) Standards 2020 (Cth).
COVID-19 has affected production schedules in various ways since March 2020:
• Several titles entered production during 2019/20, and were then interrupted by the initial COVID-19 outbreak. As per the existing methodology for this report, budgets and spend for these titles are allocated to the 2019/20 financial year, regardless of when they resumed production. Some of this data was estimated for the 2019/20 Drama Report, and has been revised where possible.
• Titles that planned to enter production in 2019/20 and were postponed, have been allocated to the 2020/21 financial year if they entered production during 2020/21.
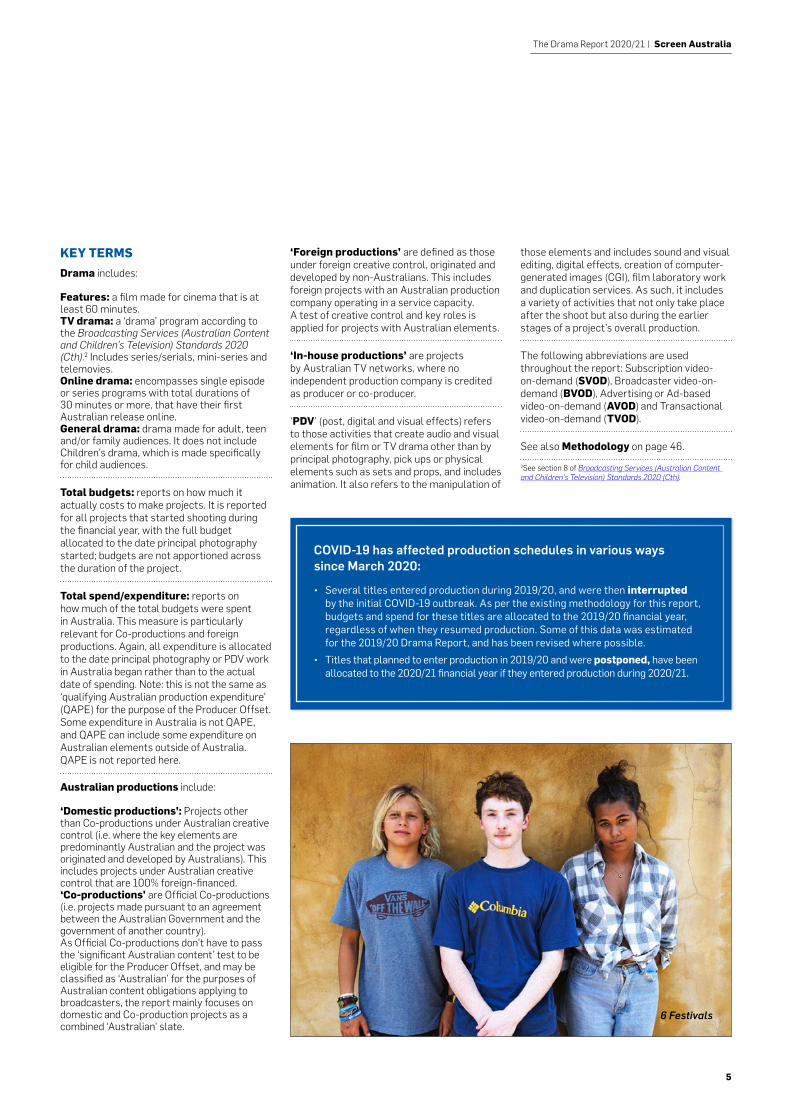
6 Festivals
6
Overview
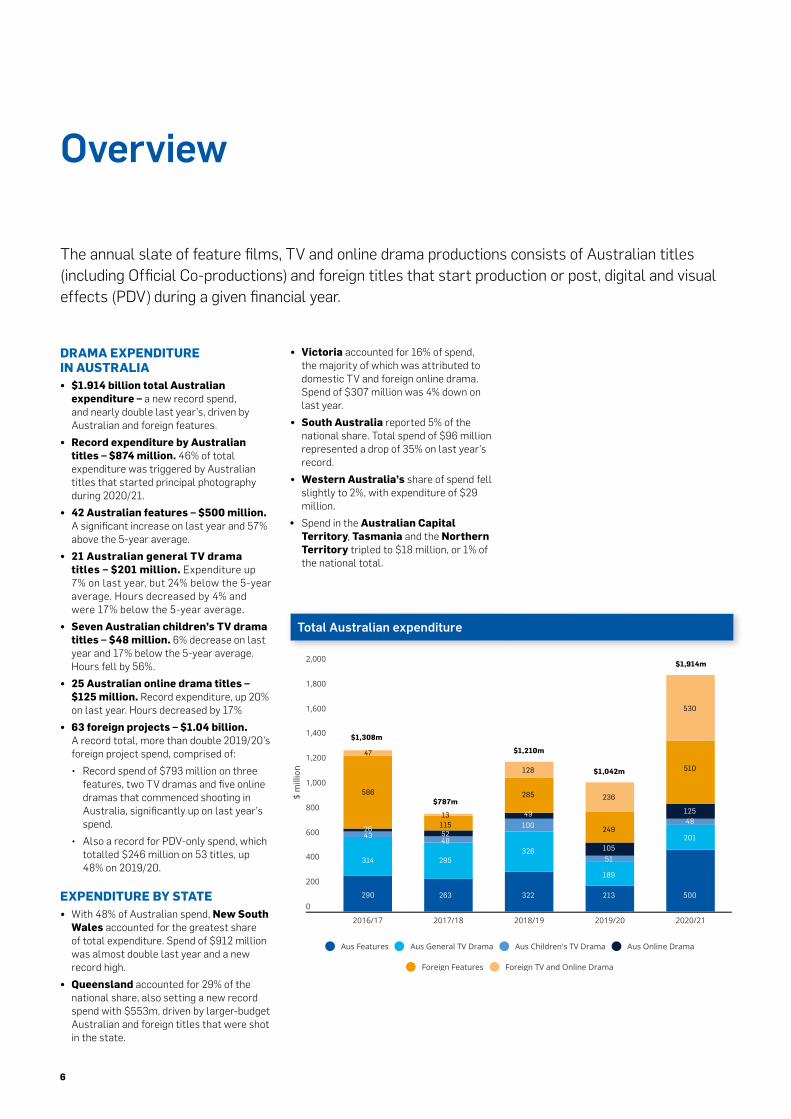
DRAMA EXPENDITURE IN AUSTRALIA• $1.914 billion total Australian
expenditure – a new record spend, and nearly double last year’s, driven by Australian and foreign features.
• Record expenditure by Australian titles – $874 million. 46% of total expenditure was triggered by Australian titles that started principal photography during 2020/21.
• 42 Australian features – $500 million. A significant increase on last year and 57% above the 5-year average.
• 21 Australian general TV drama titles – $201 million. Expenditure up 7% on last year, but 24% below the 5-year average. Hours decreased by 4% and were 17% below the 5-year average.
• Seven Australian children’s TV drama titles – $48 million. 6% decrease on last year and 17% below the 5-year average. Hours fell by 56%.
• 25 Australian online drama titles – $125 million. Record expenditure, up 20% on last year. Hours decreased by 17%
• 63 foreign projects – $1.04 billion. A record total, more than double 2019/20’s foreign project spend, comprised of:• Record spend of $793 million on three
features, two TV dramas and five online dramas that commenced shooting in Australia, significantly up on last year’s spend.
• Also a record for PDV-only spend, which totalled $246 million on 53 titles, up 48% on 2019/20.
EXPENDITURE BY STATE• With 48% of Australian spend, New South
Wales accounted for the greatest share of total expenditure. Spend of $912 million was almost double last year and a new record high.
• Queensland accounted for 29% of the national share, also setting a new record spend with $553m, driven by larger-budget Australian and foreign titles that were shot in the state.
The annual slate of feature films, TV and online drama productions consists of Australian titles (including Official Co-productions) and foreign titles that start production or post, digital and visual effects (PDV) during a given financial year.
Total Australian expenditureTOTAL AUSTRALIAN EXPENDITURE
2,000
1,800
1,600
1,400
1,200
1,000
800
600
400
200
0
2016/17 2017/18 2018/19 2019/20 2020/21
$ m
illio
n
Aus Features Aus General TV Drama Aus Children's TV Drama Aus Online Drama
Foreign Features Foreign TV and Online Drama
$1,308m
$787m
$1,210m47
131155249
295
263
586
2643
314
290
128
285
49100
326
322
$1,914m
530
510
12548
201
500
$1,042m
236
249
10551
189
213
• Victoria accounted for 16% of spend, the majority of which was attributed to domestic TV and foreign online drama. Spend of $307 million was 4% down on last year.
• South Australia reported 5% of the national share. Total spend of $96 million represented a drop of 35% on last year’s record.
• Western Australia’s share of spend fell slightly to 2%, with expenditure of $29 million.
• Spend in the Australian Capital Territory, Tasmania and the Northern Territory tripled to $18 million, or 1% of the national total.
7
The Drama Report 2020/21 | Screen Australia
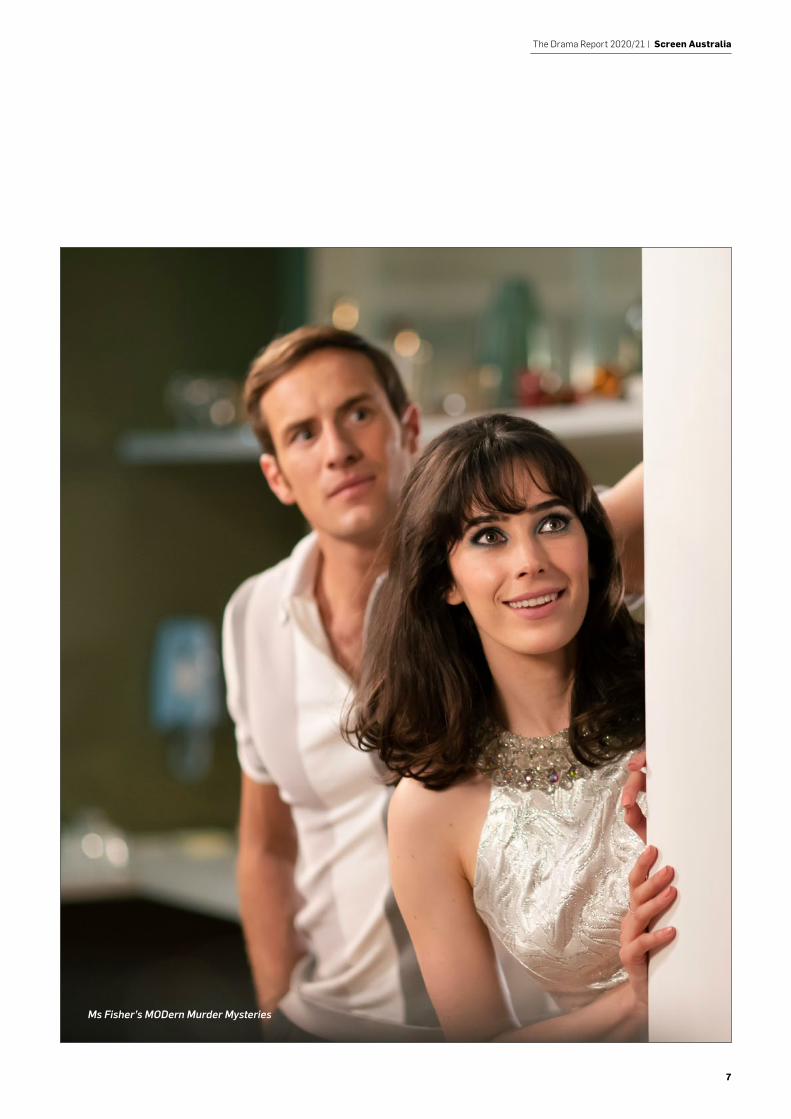
Ms Fisher’s MODern Murder Mysteries
8
All drama production
Australian1 Foreign2 Total
No. titles Spend $m No. titles Spend $m No. titles Spend $m
Features
2016/17 52 290 26 586 78 876
2017/18 44 263 29 115 73 378
2018/19 45 322 28 285 73 607
2019/20 25 213 22 249 47 461
2020/21 42 500 22 510 64 1009
5-yr av 42 317 25 349 67 666
General TV drama
2016/17 44 314 7 44 51 358
2017/18 36 295 2 4 38 299
2018/19 36 326 6 112 42 438
2019/20 19 189 3 1 22 189
2020/21 21 201 2 106 23 308
5-yr av 31 265 4 53 35 318
Children’s TV drama
2016/17 12 43 1 4 13 47
2017/18 10 49 0 0 10 49
2018/19 16 100 0 0 16 100
2019/20 14 51 4 10 18 61
2020/21 7 48 4 12 11 61
5-yr av 12 58 2 5 14 64
Online drama
2016/17 29 26 0 0 29 26
2017/18 22 52 2 9 24 62
2018/19 31 49 7 15 38 64
2019/20 25 105 15 225 40 330
2020/21 25 125 35 411 60 536
5-yr av 26 71 12 132 38 204
Total annual drama slate3
2016/17 137 674 34 634 171 1308
2017/18 112 659 33 128 145 787
2018/19 128 797 41 413 169 1210
2019/20 83 557 44 485 127 1042
2020/21 95 874 63 1040 158 1914
5-yr av 111 712 43 540 154 1252
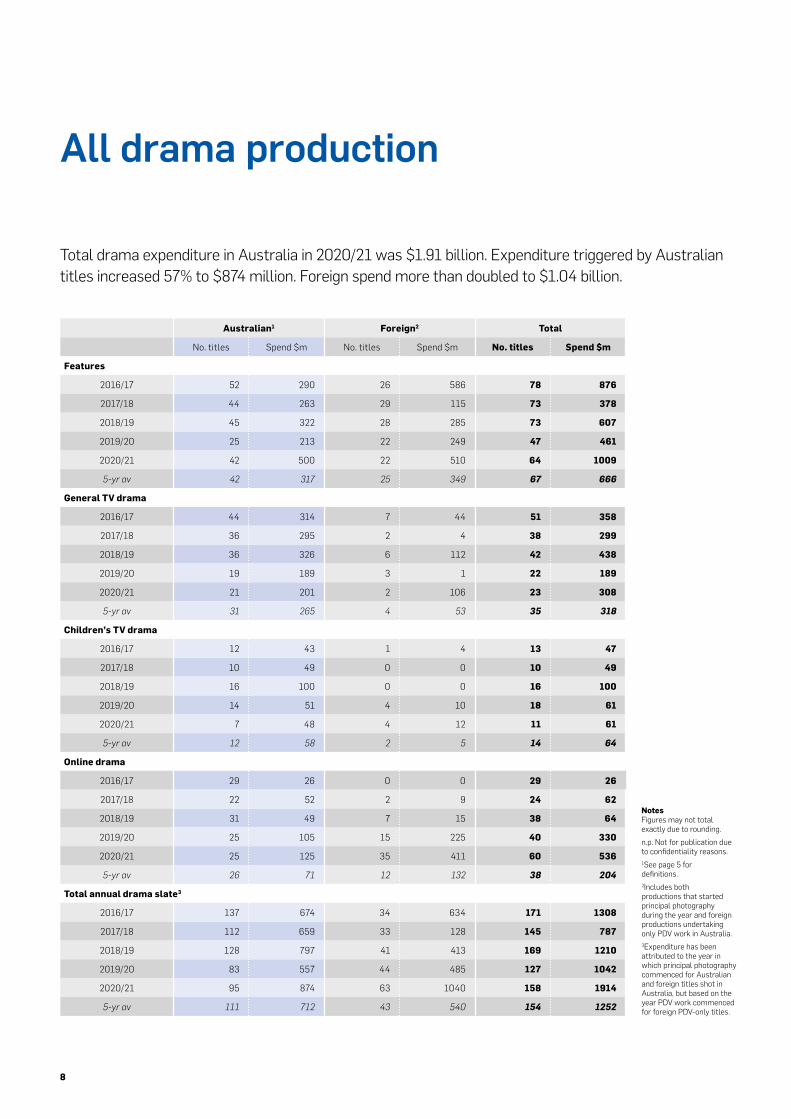
Total drama expenditure in Australia in 2020/21 was $1.91 billion. Expenditure triggered by Australian titles increased 57% to $874 million. Foreign spend more than doubled to $1.04 billion.
NotesFigures may not total exactly due to rounding.n.p. Not for publication due to confidentiality reasons. 1See page 5 for definitions. 2Includes both productions that started principal photography during the year and foreign productions undertaking only PDV work in Australia.3Expenditure has been attributed to the year in which principal photography commenced for Australian and foreign titles shot in Australia, but based on the year PDV work commenced for foreign PDV-only titles.
9
The Drama Report 2020/21 | Screen Australia
TV AND ONLINE DRAMA SPEND ($M)
1,000
900
800
700
600
500
400
300
200
100
0
2016/17 2017/18 2018/19 2019/20 2020/21
384
47
396 475
128
344
236
375
530
$ m
illio
n
Australian Foreign
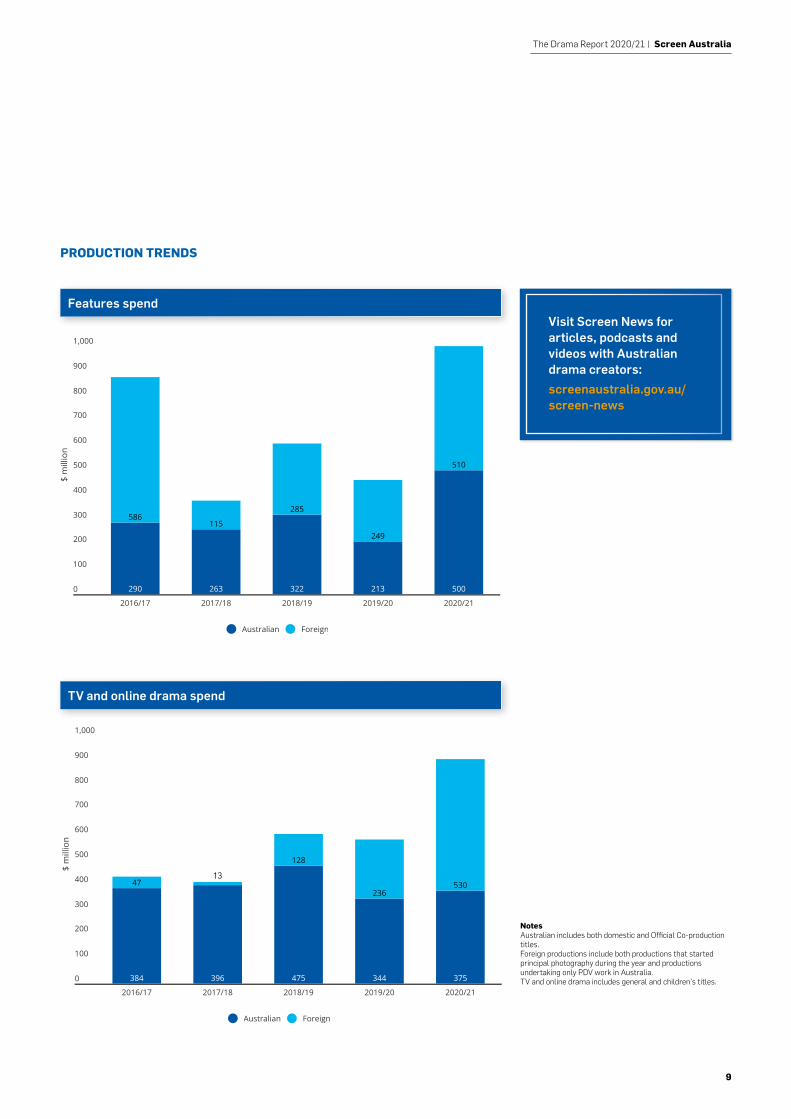
PRODUCTION TRENDS
NotesAustralian includes both domestic and Official Co-production titles.Foreign productions include both productions that started principal photography during the year and productions undertaking only PDV work in Australia.TV and online drama includes general and children’s titles.
TV and online drama spend
Features spend
13
Visit Screen News for articles, podcasts and videos with Australian drama creators: screenaustralia.gov.au/screen-news
PRODUCTION TRENDSFEATURES SPEND ($M)
1,000
900
800
700
600
500
400
300
200
100
0
2016/17 2017/18 2018/19 2019/20 2020/21
290
586
263
115
322
285
213
249
500
510
$ m
illio
n
Australian Foreign
10
Australian feature slate
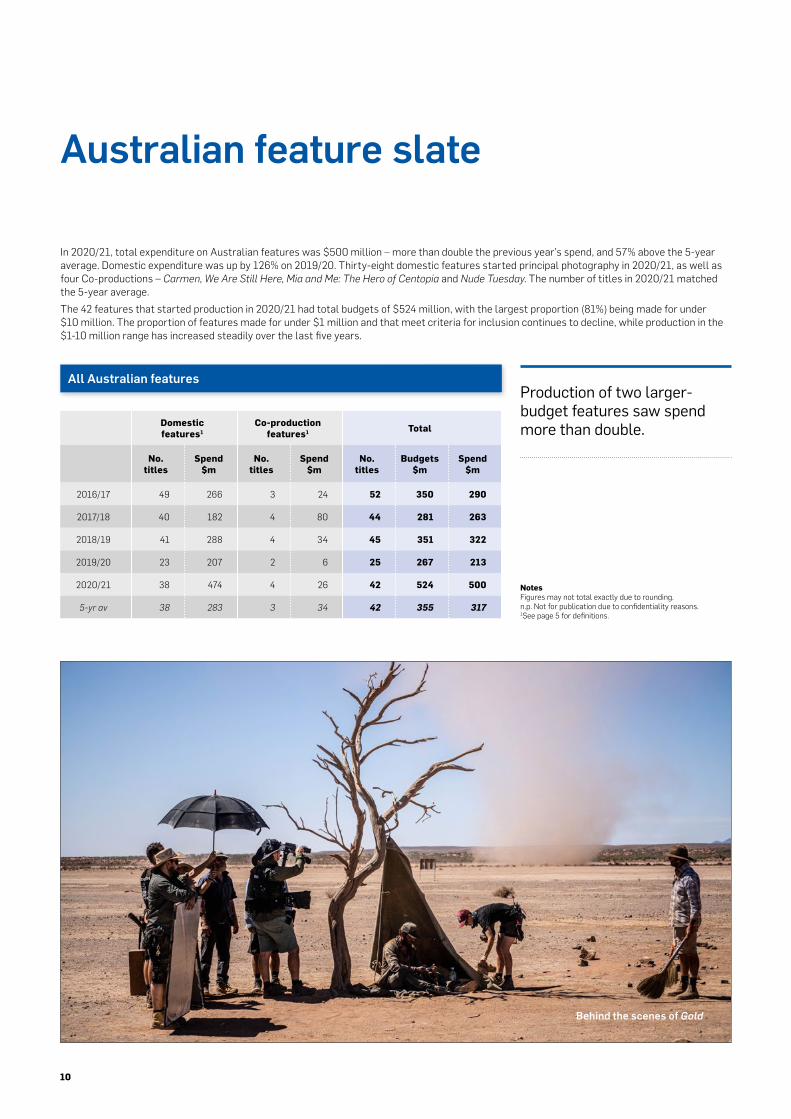
In 2020/21, total expenditure on Australian features was $500 million – more than double the previous year’s spend, and 57% above the 5-year average. Domestic expenditure was up by 126% on 2019/20. Thirty-eight domestic features started principal photography in 2020/21, as well as four Co-productions – Carmen, We Are Still Here, Mia and Me: The Hero of Centopia and Nude Tuesday. The number of titles in 2020/21 matched the 5-year average. The 42 features that started production in 2020/21 had total budgets of $524 million, with the largest proportion (81%) being made for under $10 million. The proportion of features made for under $1 million and that meet criteria for inclusion continues to decline, while production in the $1-10 million range has increased steadily over the last five years.
Domestic features1
Co-production features1 Total
No. titles
Spend $m
No. titles
Spend $m
No. titles
Budgets $m
Spend $m
2016/17 49 266 3 24 52 350 290
2017/18 40 182 4 80 44 281 263
2018/19 41 288 4 34 45 351 322
2019/20 23 207 2 6 25 267 213
2020/21 38 474 4 26 42 524 500
5-yr av 38 283 3 34 42 355 317
All Australian features
Notes Figures may not total exactly due to rounding.n.p. Not for publication due to confidentiality reasons.1See page 5 for definitions.
Production of two larger-budget features saw spend more than double.
Behind the scenes of Gold
11
The Drama Report 2020/21 | Screen Australia
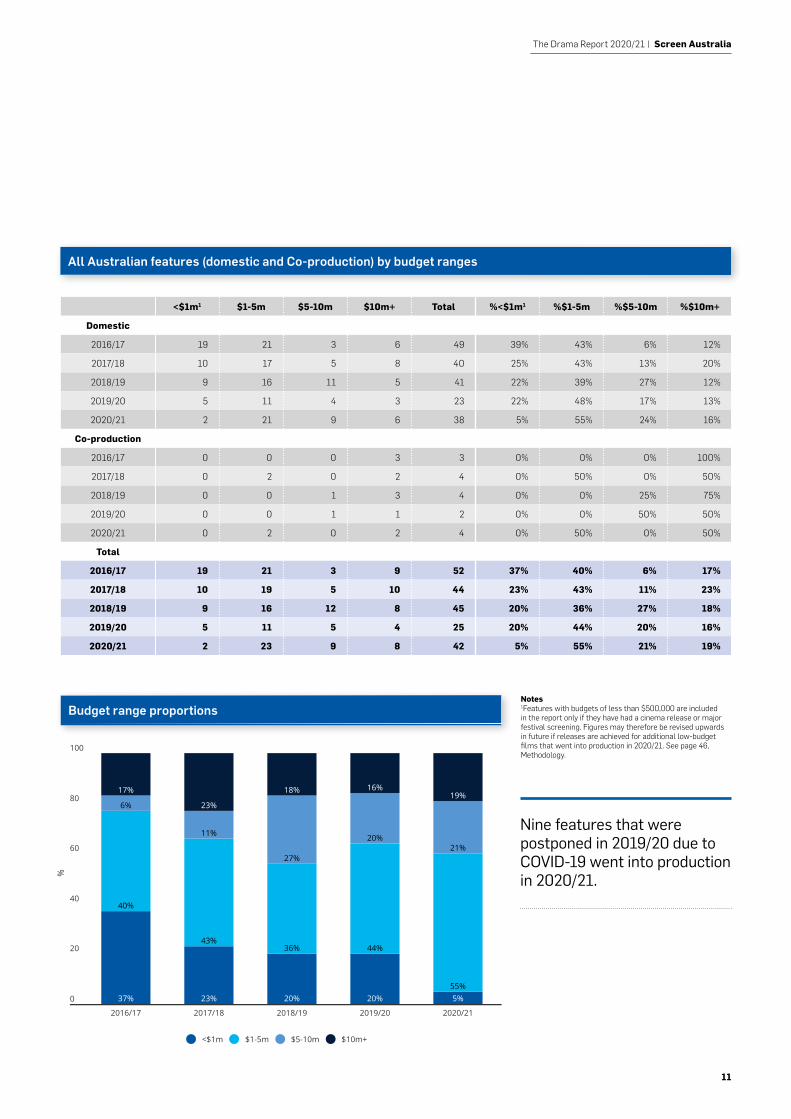
All Australian features (domestic and Co-production) by budget ranges
Budget range proportions
<$1m1 $1-5m $5-10m $10m+ Total %<$1m1 %$1-5m %$5-10m %$10m+
Domestic
2016/17 19 21 3 6 49 39% 43% 6% 12%
2017/18 10 17 5 8 40 25% 43% 13% 20%
2018/19 9 16 11 5 41 22% 39% 27% 12%
2019/20 5 11 4 3 23 22% 48% 17% 13%
2020/21 2 21 9 6 38 5% 55% 24% 16%
Co-production
2016/17 0 0 0 3 3 0% 0% 0% 100%
2017/18 0 2 0 2 4 0% 50% 0% 50%
2018/19 0 0 1 3 4 0% 0% 25% 75%
2019/20 0 0 1 1 2 0% 0% 50% 50%
2020/21 0 2 0 2 4 0% 50% 0% 50%
Total
2016/17 19 21 3 9 52 37% 40% 6% 17%
2017/18 10 19 5 10 44 23% 43% 11% 23%
2018/19 9 16 12 8 45 20% 36% 27% 18%
2019/20 5 11 5 4 25 20% 44% 20% 16%
2020/21 2 23 9 8 42 5% 55% 21% 19%
Notes 1Features with budgets of less than $500,000 are included in the report only if they have had a cinema release or major festival screening. Figures may therefore be revised upwards in future if releases are achieved for additional low-budget films that went into production in 2020/21. See page 46, Methodology.
BUDGET RANGE PROPORTIONS
100
80
60
40
20
0
2016/17 2017/18 2018/19 2019/20 2020/21
37%
40%
6%
17%
23%
43%
11%
23%
20%
36%
27%
18%
20%
44%
20%
16%
5%55%
21%
19%
%
<$1m $1-5m $5-10m $10m+
Nine features that were postponed in 2019/20 due to COVID-19 went into production in 2020/21.
12
Contributions to the annual Australian feature slate (domestic and Co-production)
No. of titles Amount $m % of total finance
Australian direct government sources (does not include the Producer Offset)1
2016/17 28 29 8%
2017/18 32 45 16%
2018/19 32 47 14%
2019/20 14 12 5%
2020/21 35 39 8%
5-yr av 28 35 10%
Australian Producer Offset2
2016/17 n.p. 102 29%
2017/18 n.p. 93 33%
2018/19 n.p. 112 32%
2019/20 n.p. 75 28%
2020/21 n.p. 178 34%
5-yr av 35 112 32%
Australian private investors
2016/17 34 25 7%
2017/18 26 21 7%
2018/19 25 14 4%
2019/20 15 9 3%
2020/21 20 23 4%
5-yr av 24 18 5%
Australian screen industry3
2016/17 37 32 9%
2017/18 39 39 14%
2018/19 40 49 14%
2019/20 19 24 9%
2020/21 38 39 8%
5-yr av 35 36 10%
Foreign investors
2016/17 25 163 47%
2017/18 25 84 30%
2018/19 19 128 37%
2019/20 17 147 55%
2020/21 31 245 47%
5-yr av 23 153 43%
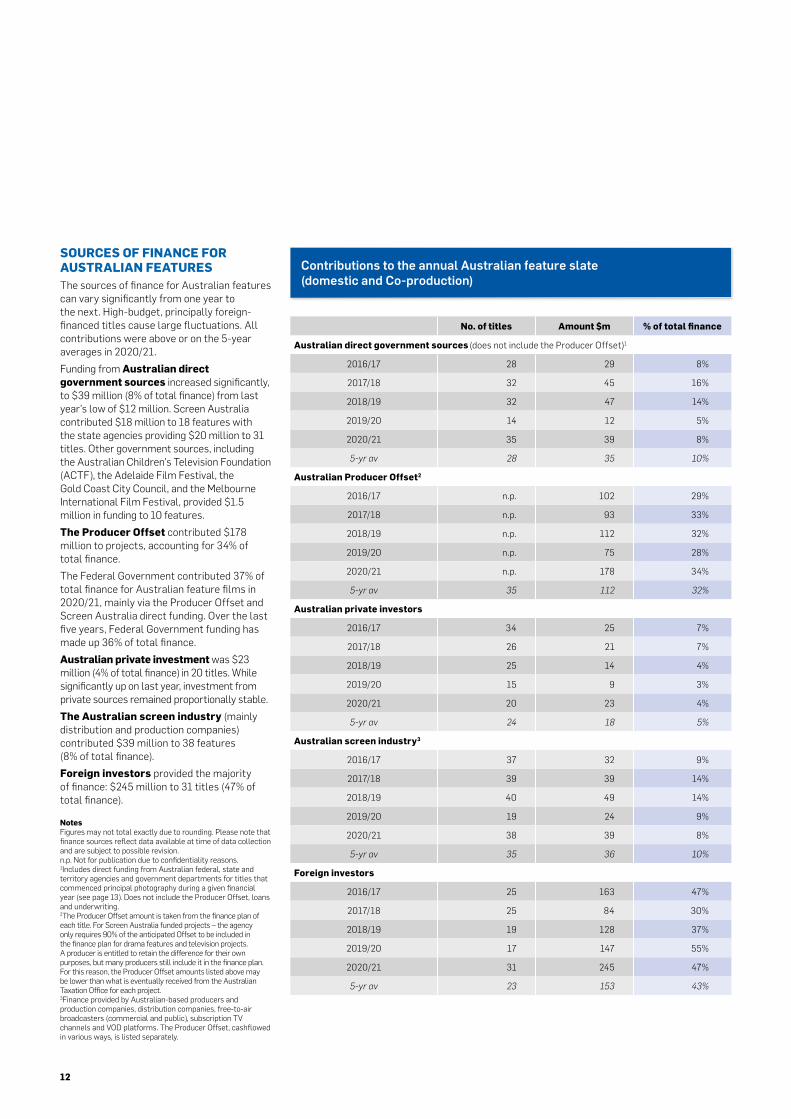
SOURCES OF FINANCE FOR AUSTRALIAN FEATURESThe sources of finance for Australian features can vary significantly from one year to the next. High-budget, principally foreign-financed titles cause large fluctuations. All contributions were above or on the 5-year averages in 2020/21.Funding from Australian direct government sources increased significantly, to $39 million (8% of total finance) from last year’s low of $12 million. Screen Australia contributed $18 million to 18 features with the state agencies providing $20 million to 31 titles. Other government sources, including the Australian Children’s Television Foundation (ACTF), the Adelaide Film Festival, the Gold Coast City Council, and the Melbourne International Film Festival, provided $1.5 million in funding to 10 features.The Producer Offset contributed $178 million to projects, accounting for 34% of total finance.The Federal Government contributed 37% of total finance for Australian feature films in 2020/21, mainly via the Producer Offset and Screen Australia direct funding. Over the last five years, Federal Government funding has made up 36% of total finance.Australian private investment was $23 million (4% of total finance) in 20 titles. While significantly up on last year, investment from private sources remained proportionally stable.The Australian screen industry (mainly distribution and production companies) contributed $39 million to 38 features (8% of total finance).Foreign investors provided the majority of finance: $245 million to 31 titles (47% of total finance).
NotesFigures may not total exactly due to rounding. Please note that finance sources reflect data available at time of data collection and are subject to possible revision.n.p. Not for publication due to confidentiality reasons.1Includes direct funding from Australian federal, state and territory agencies and government departments for titles that commenced principal photography during a given financial year (see page 13). Does not include the Producer Offset, loans and underwriting.2The Producer Offset amount is taken from the finance plan of each title. For Screen Australia funded projects – the agency only requires 90% of the anticipated Offset to be included in the finance plan for drama features and television projects. A producer is entitled to retain the difference for their own purposes, but many producers still include it in the finance plan. For this reason, the Producer Offset amounts listed above may be lower than what is eventually received from the Australian Taxation Office for each project.3Finance provided by Australian-based producers and production companies, distribution companies, free-to-air broadcasters (commercial and public), subscription TV channels and VOD platforms. The Producer Offset, cashflowed in various ways, is listed separately.
13
The Drama Report 2020/21 | Screen Australia
Foreign nance ($m)
2016/17
2017/18
2018/19
2019/20
2020/21
0 50 100 150 200 250 300
158
73
115
138 9
230 15
Distributors, broadcasters, producers and production companies
Private, government and other
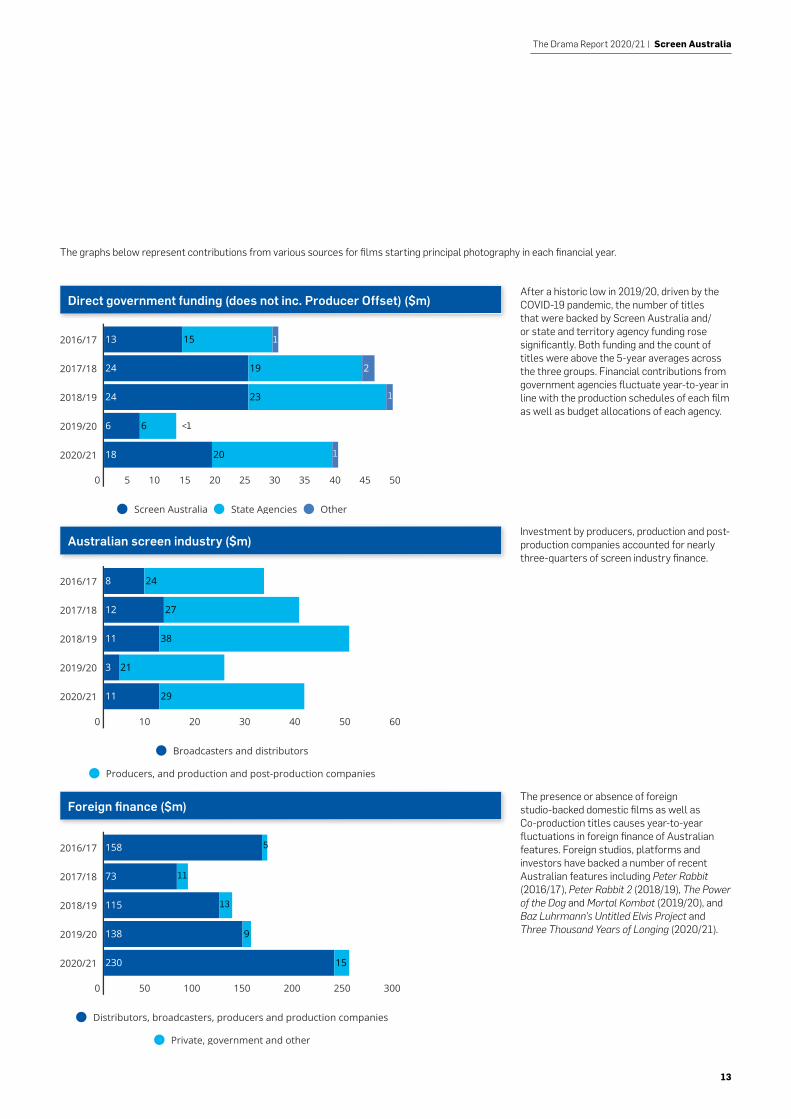
After a historic low in 2019/20, driven by the COVID-19 pandemic, the number of titles that were backed by Screen Australia and/or state and territory agency funding rose significantly. Both funding and the count of titles were above the 5-year averages across the three groups. Financial contributions from government agencies fluctuate year-to-year in line with the production schedules of each film as well as budget allocations of each agency.
Investment by producers, production and post-production companies accounted for nearly three-quarters of screen industry finance.
The presence or absence of foreign studio-backed domestic films as well as Co-production titles causes year-to-year fluctuations in foreign finance of Australian features. Foreign studios, platforms and investors have backed a number of recent Australian features including Peter Rabbit (2016/17), Peter Rabbit 2 (2018/19), The Power of the Dog and Mortal Kombat (2019/20), and Baz Luhrmann’s Untitled Elvis Project and Three Thousand Years of Longing (2020/21).
The graphs below represent contributions from various sources for films starting principal photography in each financial year.
Direct government funding (does not inc. Producer Offset) ($m)
Australian screen industry ($m)
Foreign finance ($m)
Direct Government funding (does not inc. ProducerOset) $m
2016/17
2017/18
2018/19
2019/20
2020/21
0 5 10 15 20 25 30 35 40 45 50
13 15
24 19 2
24 23
6 6
18 20
Screen Australia State Agencies Other
1
1
1
5
11
13
1<1
Australian screen industry ($m)
2016/17
2017/18
2018/19
2019/20
2020/21
0 10 20 30 40 50 60
8 24
12 27
11 38
3 21
11 29
Broadcasters and distributors
Producers, and production and post-production companies
14
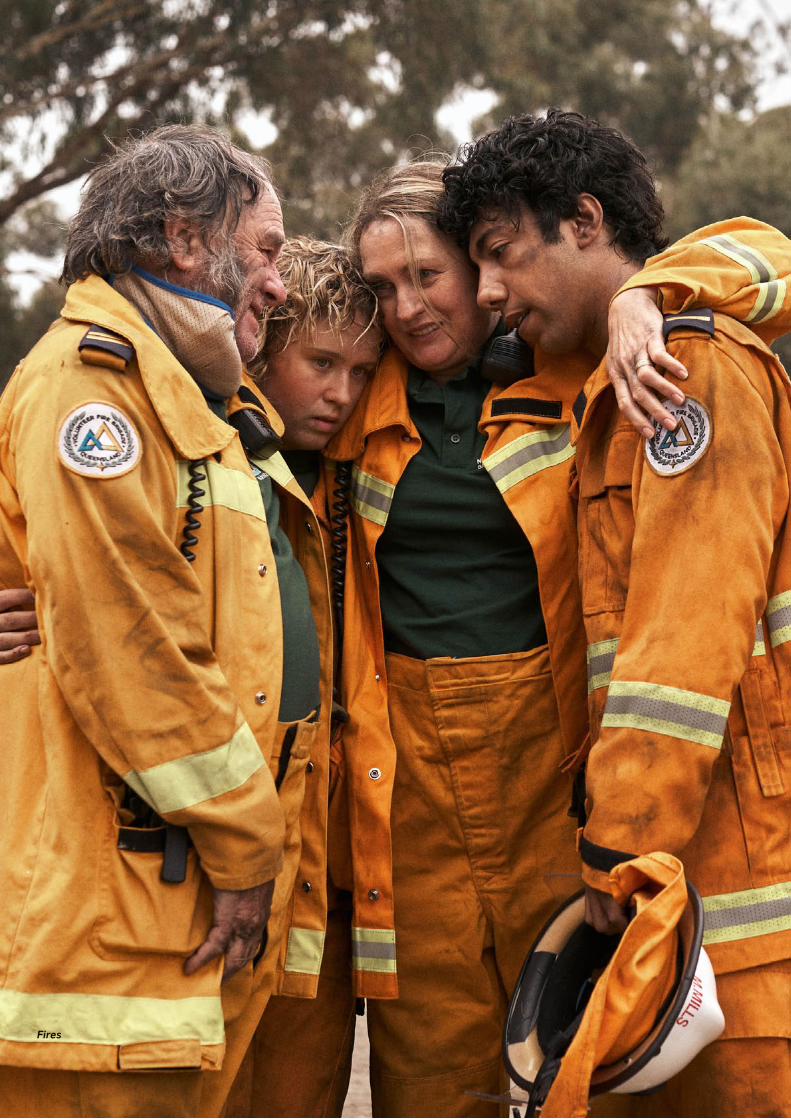
Fires
15
The Drama Report 2020/21 | Screen Australia
Australian general TV drama slate
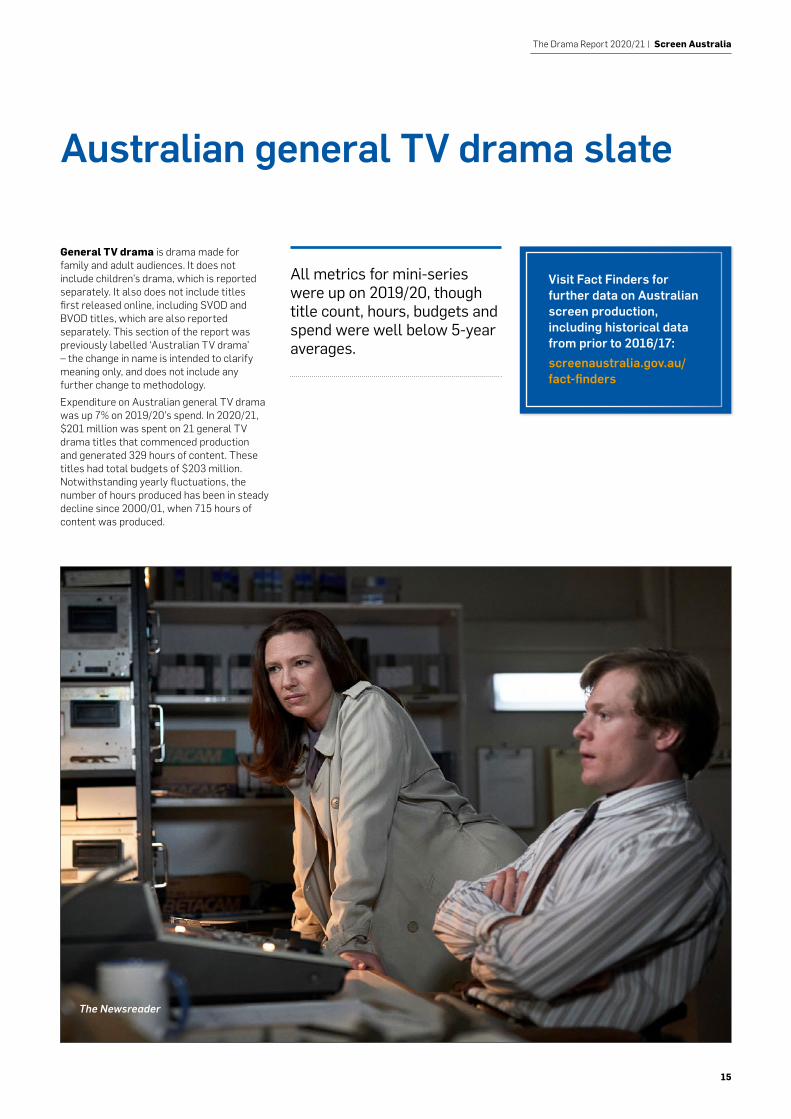
General TV drama is drama made for family and adult audiences. It does not include children’s drama, which is reported separately. It also does not include titles first released online, including SVOD and BVOD titles, which are also reported separately. This section of the report was previously labelled ‘Australian TV drama’ – the change in name is intended to clarify meaning only, and does not include any further change to methodology. Expenditure on Australian general TV drama was up 7% on 2019/20’s spend. In 2020/21, $201 million was spent on 21 general TV drama titles that commenced production and generated 329 hours of content. These titles had total budgets of $203 million. Notwithstanding yearly fluctuations, the number of hours produced has been in steady decline since 2000/01, when 715 hours of content was produced.
All metrics for mini-series were up on 2019/20, though title count, hours, budgets and spend were well below 5-year averages.
The Newsreader
Visit Fact Finders for further data on Australian screen production, including historical data from prior to 2016/17: screenaustralia.gov.au/fact-finders
16
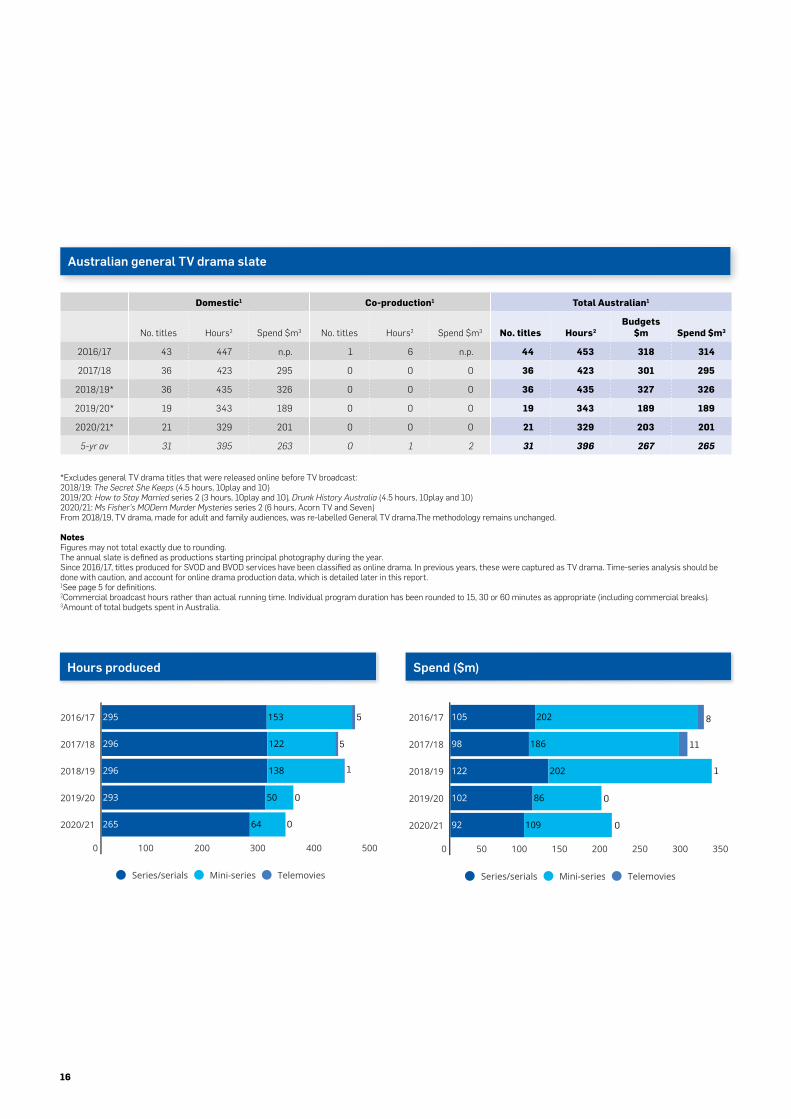
Domestic1 Co-production1 Total Australian1
No. titles Hours2 Spend $m3 No. titles Hours2 Spend $m3 No. titles Hours2Budgets
$m Spend $m3
2016/17 43 447 n.p. 1 6 n.p. 44 453 318 314
2017/18 36 423 295 0 0 0 36 423 301 295
2018/19* 36 435 326 0 0 0 36 435 327 326
2019/20* 19 343 189 0 0 0 19 343 189 189
2020/21* 21 329 201 0 0 0 21 329 203 201
5-yr av 31 395 263 0 1 2 31 396 267 265
*Excludes general TV drama titles that were released online before TV broadcast:2018/19: The Secret She Keeps (4.5 hours, 10play and 10) 2019/20: How to Stay Married series 2 (3 hours, 10play and 10), Drunk History Australia (4.5 hours, 10play and 10) 2020/21: Ms Fisher’s MODern Murder Mysteries series 2 (6 hours, Acorn TV and Seven)From 2018/19, TV drama, made for adult and family audiences, was re-labelled General TV drama.The methodology remains unchanged.
NotesFigures may not total exactly due to rounding. The annual slate is defined as productions starting principal photography during the year.Since 2016/17, titles produced for SVOD and BVOD services have been classified as online drama. In previous years, these were captured as TV drama. Time-series analysis should be done with caution, and account for online drama production data, which is detailed later in this report. 1See page 5 for definitions.2Commercial broadcast hours rather than actual running time. Individual program duration has been rounded to 15, 30 or 60 minutes as appropriate (including commercial breaks).3Amount of total budgets spent in Australia.
Australian general TV drama slate
Hours produced Spend ($m)AUSTRALIAN TV DRAMA: HOURS PRODUCED
2016/17
2017/18
2018/19
2019/20
2020/21
0 100 200 300 400 500
295 153
296 122
296 138
293 50
265 64
Series/serials Mini-series Telemovies
AUSTRALIAN TV DRAMA: SPEND $M
2016/17
2017/18
2018/19
2019/20
2020/21
0 50 100 150 200 250 300 350
105 202
98 186
122 202
102 86
92 109
Series/serials Mini-series Telemovies
11
85
5
1 1
0
0
0
0
17
The Drama Report 2020/21 | Screen Australia
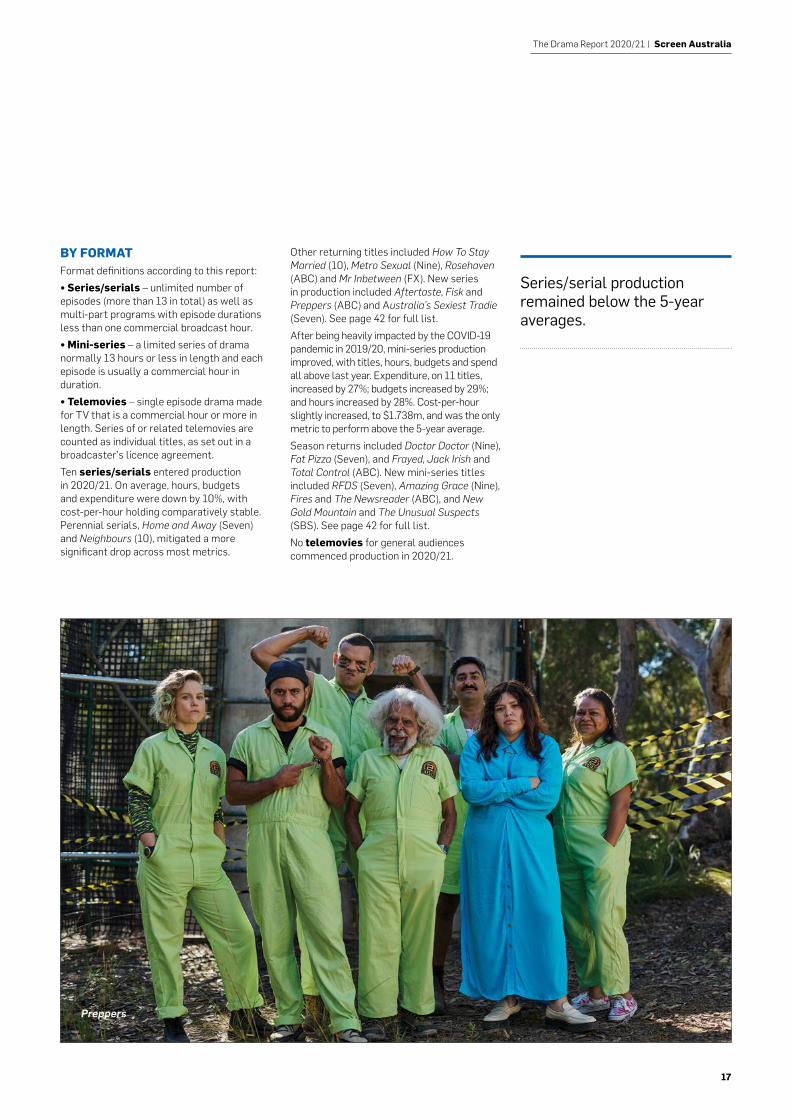
BY FORMATFormat definitions according to this report:• Series/serials – unlimited number of episodes (more than 13 in total) as well as multi-part programs with episode durations less than one commercial broadcast hour.• Mini-series – a limited series of drama normally 13 hours or less in length and each episode is usually a commercial hour in duration.• Telemovies – single episode drama made for TV that is a commercial hour or more in length. Series of or related telemovies are counted as individual titles, as set out in a broadcaster’s licence agreement. Ten series/serials entered production in 2020/21. On average, hours, budgets and expenditure were down by 10%, with cost-per-hour holding comparatively stable. Perennial serials, Home and Away (Seven) and Neighbours (10), mitigated a more significant drop across most metrics.
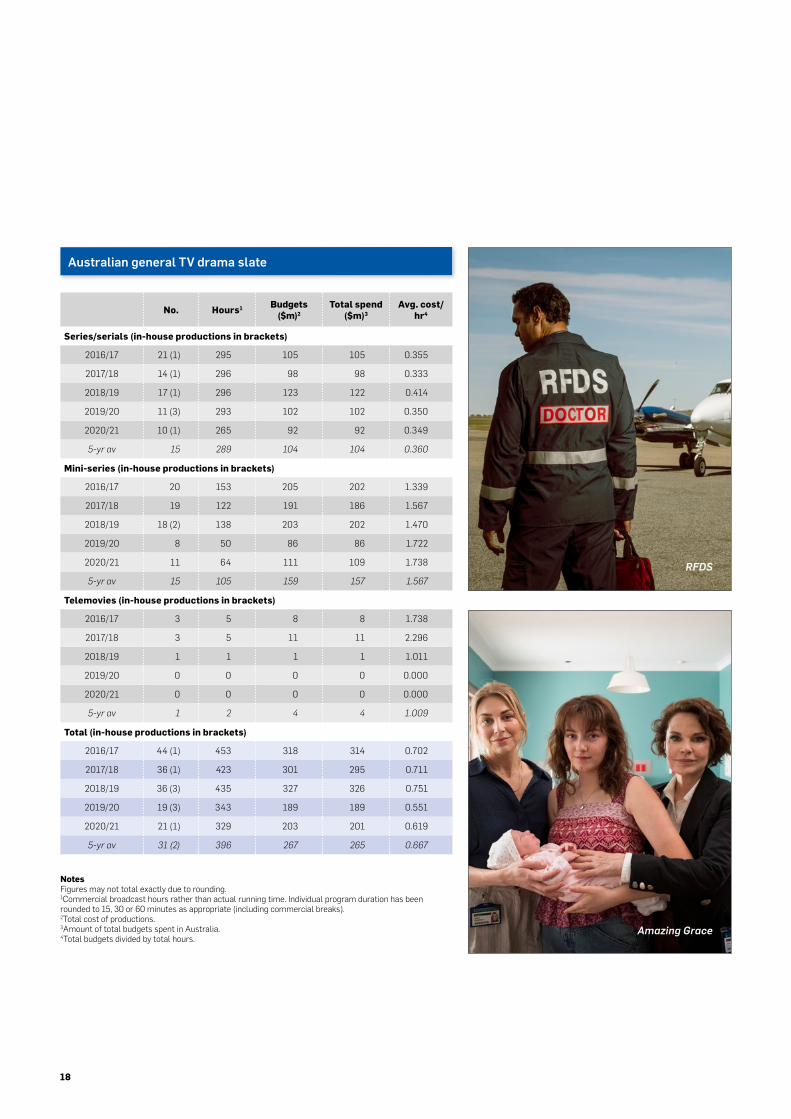
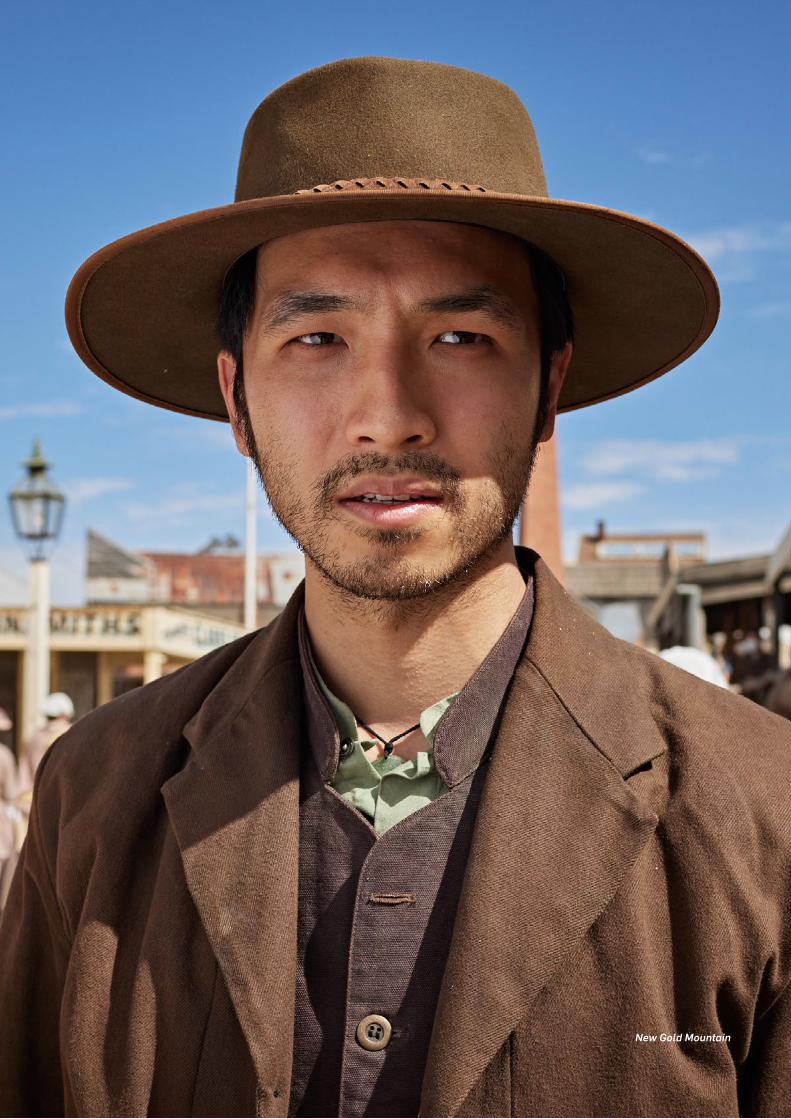
Other returning titles included How To Stay Married (10), Metro Sexual (Nine), Rosehaven (ABC) and Mr Inbetween (FX). New series in production included Aftertaste, Fisk and Preppers (ABC) and Australia’s Sexiest Tradie (Seven). See page 42 for full list.After being heavily impacted by the COVID-19 pandemic in 2019/20, mini-series production improved, with titles, hours, budgets and spend all above last year. Expenditure, on 11 titles, increased by 27%; budgets increased by 29%; and hours increased by 28%. Cost-per-hour slightly increased, to $1.738m, and was the only metric to perform above the 5-year average.Season returns included Doctor Doctor (Nine), Fat Pizza (Seven), and Frayed, Jack Irish and Total Control (ABC). New mini-series titles included RFDS (Seven), Amazing Grace (Nine), Fires and The Newsreader (ABC), and New Gold Mountain and The Unusual Suspects (SBS). See page 42 for full list.No telemovies for general audiences commenced production in 2020/21.
Five Bedrooms
Series/serial production remained below the 5-year averages.
Preppers
18
No. Hours1 Budgets
($m)2Total spend
($m)3Avg. cost/
hr4
Series/serials (in-house productions in brackets)
2016/17 21 (1) 295 105 105 0.355
2017/18 14 (1) 296 98 98 0.333
2018/19 17 (1) 296 123 122 0.414
2019/20 11 (3) 293 102 102 0.350
2020/21 10 (1) 265 92 92 0.349
5-yr av 15 289 104 104 0.360
Mini-series (in-house productions in brackets)
2016/17 20 153 205 202 1.339
2017/18 19 122 191 186 1.567
2018/19 18 (2) 138 203 202 1.470
2019/20 8 50 86 86 1.722
2020/21 11 64 111 109 1.738
5-yr av 15 105 159 157 1.567
Telemovies (in-house productions in brackets)
2016/17 3 5 8 8 1.738
2017/18 3 5 11 11 2.296
2018/19 1 1 1 1 1.011
2019/20 0 0 0 0 0.000
2020/21 0 0 0 0 0.000
5-yr av 1 2 4 4 1.009
Total (in-house productions in brackets)
2016/17 44 (1) 453 318 314 0.702
2017/18 36 (1) 423 301 295 0.711
2018/19 36 (3) 435 327 326 0.751
2019/20 19 (3) 343 189 189 0.551
2020/21 21 (1) 329 203 201 0.619
5-yr av 31 (2) 396 267 265 0.667
NotesFigures may not total exactly due to rounding.1Commercial broadcast hours rather than actual running time. Individual program duration has been rounded to 15, 30 or 60 minutes as appropriate (including commercial breaks).2Total cost of productions.3Amount of total budgets spent in Australia.4Total budgets divided by total hours.
Australian general TV drama slate
Amazing Grace
RFDS
19
The Drama Report 2020/21 | Screen Australia
BlueyNew Gold Mountain
20
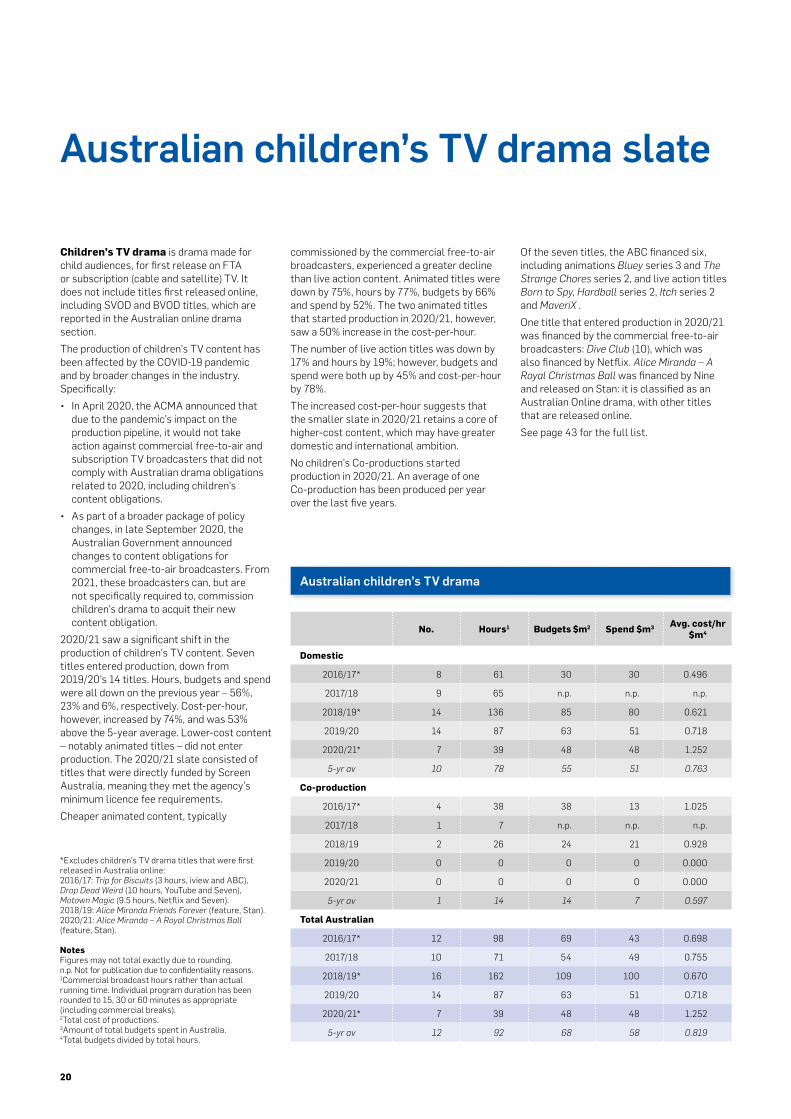
Children’s TV drama is drama made for child audiences, for first release on FTA or subscription (cable and satellite) TV. It does not include titles first released online, including SVOD and BVOD titles, which are reported in the Australian online drama section.The production of children’s TV content has been affected by the COVID-19 pandemic and by broader changes in the industry. Specifically:• In April 2020, the ACMA announced that
due to the pandemic’s impact on the production pipeline, it would not take action against commercial free-to-air and subscription TV broadcasters that did not comply with Australian drama obligations related to 2020, including children’s content obligations.
• As part of a broader package of policy changes, in late September 2020, the Australian Government announced changes to content obligations for commercial free-to-air broadcasters. From 2021, these broadcasters can, but are not specifically required to, commission children’s drama to acquit their new content obligation.
2020/21 saw a significant shift in the production of children’s TV content. Seven titles entered production, down from 2019/20’s 14 titles. Hours, budgets and spend were all down on the previous year – 56%, 23% and 6%, respectively. Cost-per-hour, however, increased by 74%, and was 53% above the 5-year average. Lower-cost content – notably animated titles – did not enter production. The 2020/21 slate consisted of titles that were directly funded by Screen Australia, meaning they met the agency’s minimum licence fee requirements. Cheaper animated content, typically
Australian children’s TV drama slate
*Excludes children’s TV drama titles that were first released in Australia online:2016/17: Trip for Biscuits (3 hours, iview and ABC), Drop Dead Weird (10 hours, YouTube and Seven), Motown Magic (9.5 hours, Netflix and Seven).2018/19: Alice Miranda Friends Forever (feature, Stan). 2020/21: Alice Miranda – A Royal Christmas Ball (feature, Stan).
NotesFigures may not total exactly due to rounding. n.p. Not for publication due to confidentiality reasons.1Commercial broadcast hours rather than actual running time. Individual program duration has been rounded to 15, 30 or 60 minutes as appropriate (including commercial breaks).2Total cost of productions.3Amount of total budgets spent in Australia.4Total budgets divided by total hours.
No. Hours1 Budgets $m2 Spend $m3 Avg. cost/hr $m4
Domestic
2016/17* 8 61 30 30 0.496
2017/18 9 65 n.p. n.p. n.p.
2018/19* 14 136 85 80 0.621
2019/20 14 87 63 51 0.718
2020/21* 7 39 48 48 1.252
5-yr av 10 78 55 51 0.763
Co-production
2016/17* 4 38 38 13 1.025
2017/18 1 7 n.p. n.p. n.p.
2018/19 2 26 24 21 0.928
2019/20 0 0 0 0 0.000
2020/21 0 0 0 0 0.000
5-yr av 1 14 14 7 0.597
Total Australian
2016/17* 12 98 69 43 0.698
2017/18 10 71 54 49 0.755
2018/19* 16 162 109 100 0.670
2019/20 14 87 63 51 0.718
2020/21* 7 39 48 48 1.252
5-yr av 12 92 68 58 0.819
Australian children’s TV drama
commissioned by the commercial free-to-air broadcasters, experienced a greater decline than live action content. Animated titles were down by 75%, hours by 77%, budgets by 66% and spend by 52%. The two animated titles that started production in 2020/21, however, saw a 50% increase in the cost-per-hour.The number of live action titles was down by 17% and hours by 19%; however, budgets and spend were both up by 45% and cost-per-hour by 78%.The increased cost-per-hour suggests that the smaller slate in 2020/21 retains a core of higher-cost content, which may have greater domestic and international ambition.No children’s Co-productions started production in 2020/21. An average of one Co-production has been produced per year over the last five years.
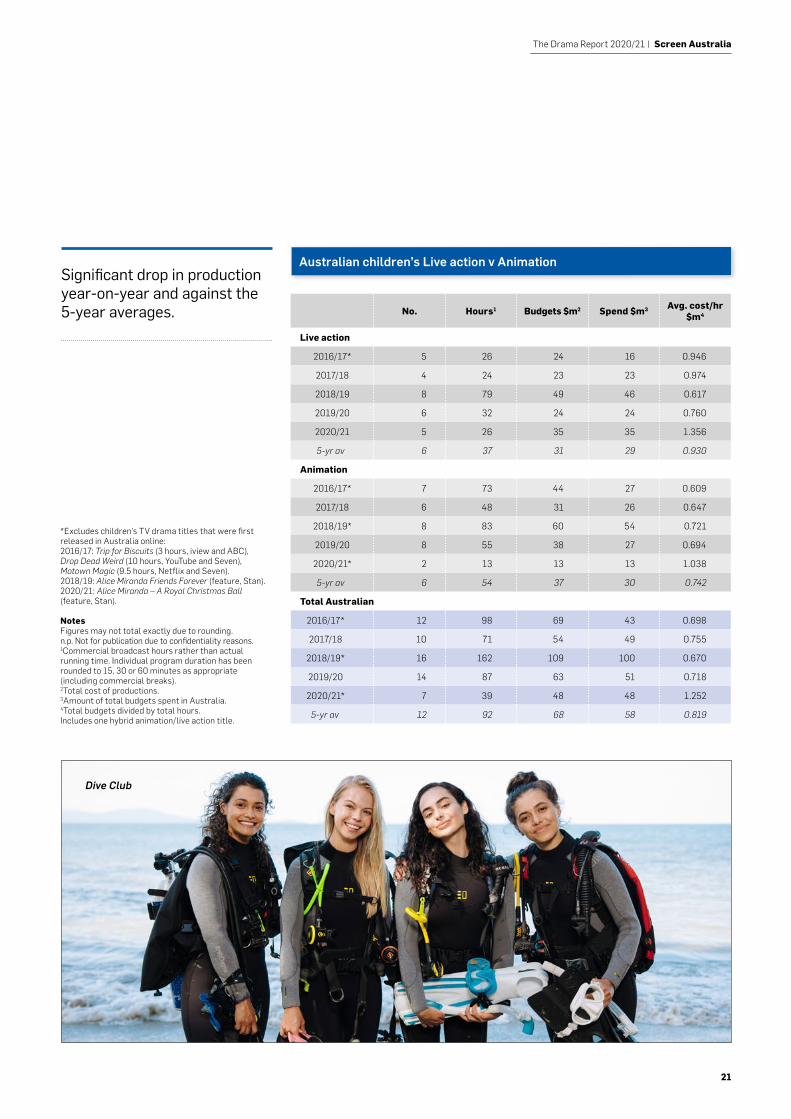
Of the seven titles, the ABC financed six, including animations Bluey series 3 and The Strange Chores series 2, and live action titles Born to Spy, Hardball series 2, Itch series 2 and MaveriX .One title that entered production in 2020/21 was financed by the commercial free-to-air broadcasters: Dive Club (10), which was also financed by Netflix. Alice Miranda – A Royal Christmas Ball was financed by Nine and released on Stan: it is classified as an Australian Online drama, with other titles that are released online.See page 43 for the full list.
21
The Drama Report 2020/21 | Screen Australia
*Excludes children’s TV drama titles that were first released in Australia online:2016/17: Trip for Biscuits (3 hours, iview and ABC), Drop Dead Weird (10 hours, YouTube and Seven), Motown Magic (9.5 hours, Netflix and Seven).2018/19: Alice Miranda Friends Forever (feature, Stan). 2020/21: Alice Miranda – A Royal Christmas Ball (feature, Stan).
NotesFigures may not total exactly due to rounding. n.p. Not for publication due to confidentiality reasons.1Commercial broadcast hours rather than actual running time. Individual program duration has been rounded to 15, 30 or 60 minutes as appropriate (including commercial breaks).2Total cost of productions.3Amount of total budgets spent in Australia.4Total budgets divided by total hours.Includes one hybrid animation/live action title.
No. Hours1 Budgets $m2 Spend $m3 Avg. cost/hr $m4
Live action
2016/17* 5 26 24 16 0.946
2017/18 4 24 23 23 0.974
2018/19 8 79 49 46 0.617
2019/20 6 32 24 24 0.760
2020/21 5 26 35 35 1.356
5-yr av 6 37 31 29 0.930
Animation
2016/17* 7 73 44 27 0.609
2017/18 6 48 31 26 0.647
2018/19* 8 83 60 54 0.721
2019/20 8 55 38 27 0.694
2020/21* 2 13 13 13 1.038
5-yr av 6 54 37 30 0.742
Total Australian
2016/17* 12 98 69 43 0.698
2017/18 10 71 54 49 0.755
2018/19* 16 162 109 100 0.670
2019/20 14 87 63 51 0.718
2020/21* 7 39 48 48 1.252
5-yr av 12 92 68 58 0.819
Australian children’s Live action v AnimationSignificant drop in production year-on-year and against the 5-year averages.
New Gold Mountain
Dive Club
22
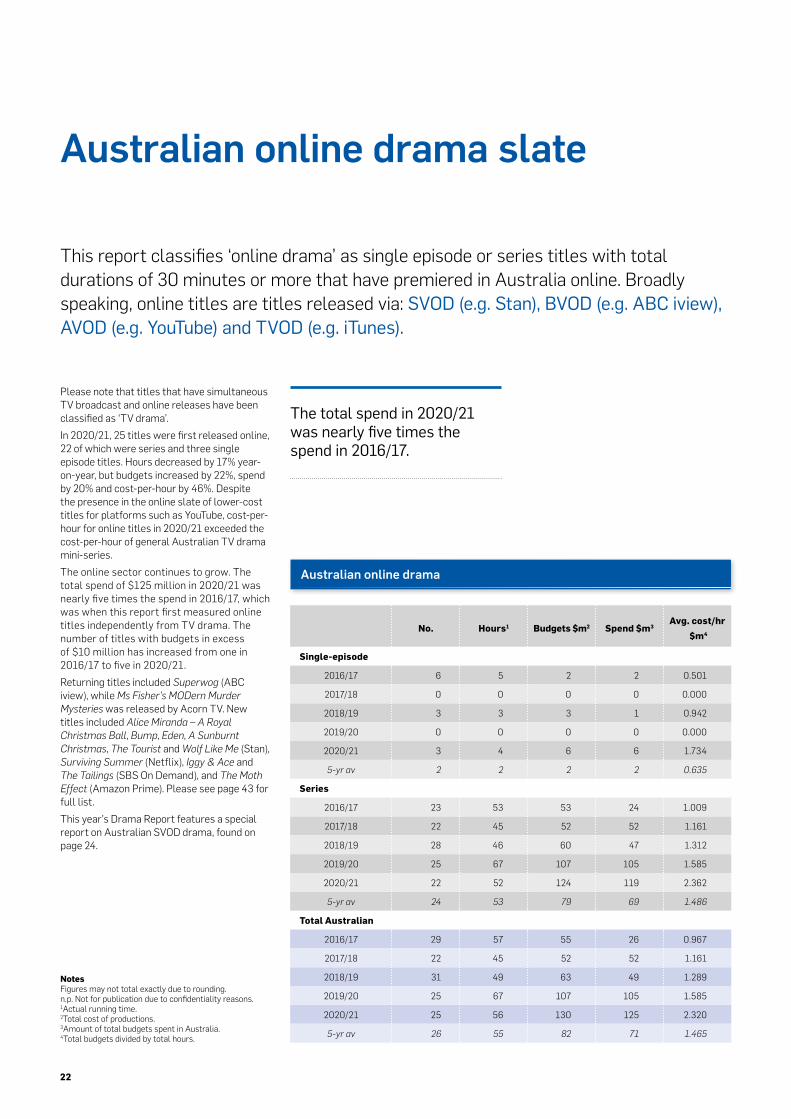
Australian online drama slate
Please note that titles that have simultaneous TV broadcast and online releases have been classified as ‘TV drama’. In 2020/21, 25 titles were first released online, 22 of which were series and three single episode titles. Hours decreased by 17% year-on-year, but budgets increased by 22%, spend by 20% and cost-per-hour by 46%. Despite the presence in the online slate of lower-cost titles for platforms such as YouTube, cost-per-hour for online titles in 2020/21 exceeded the cost-per-hour of general Australian TV drama mini-series. The online sector continues to grow. The total spend of $125 million in 2020/21 was nearly five times the spend in 2016/17, which was when this report first measured online titles independently from TV drama. The number of titles with budgets in excess of $10 million has increased from one in 2016/17 to five in 2020/21.Returning titles included Superwog (ABC iview), while Ms Fisher’s MODern Murder Mysteries was released by Acorn TV. New titles included Alice Miranda – A Royal Christmas Ball, Bump, Eden, A Sunburnt Christmas, The Tourist and Wolf Like Me (Stan), Surviving Summer (Netflix), Iggy & Ace and The Tailings (SBS On Demand), and The Moth Effect (Amazon Prime). Please see page 43 for full list.This year’s Drama Report features a special report on Australian SVOD drama, found on page 24.
This report classifies ‘online drama’ as single episode or series titles with total durations of 30 minutes or more that have premiered in Australia online. Broadly speaking, online titles are titles released via: SVOD (e.g. Stan), BVOD (e.g. ABC iview), AVOD (e.g. YouTube) and TVOD (e.g. iTunes).
NotesFigures may not total exactly due to rounding. n.p. Not for publication due to confidentiality reasons.1Actual running time.2Total cost of productions.3Amount of total budgets spent in Australia.4Total budgets divided by total hours.
No. Hours1 Budgets $m2 Spend $m3Avg. cost/hr
$m4
Single-episode
2016/17 6 5 2 2 0.501
2017/18 0 0 0 0 0.000
2018/19 3 3 3 1 0.942
2019/20 0 0 0 0 0.000
2020/21 3 4 6 6 1.734
5-yr av 2 2 2 2 0.635
Series
2016/17 23 53 53 24 1.009
2017/18 22 45 52 52 1.161
2018/19 28 46 60 47 1.312
2019/20 25 67 107 105 1.585
2020/21 22 52 124 119 2.362
5-yr av 24 53 79 69 1.486
Total Australian
2016/17 29 57 55 26 0.967
2017/18 22 45 52 52 1.161
2018/19 31 49 63 49 1.289
2019/20 25 67 107 105 1.585
2020/21 25 56 130 125 2.320
5-yr av 26 55 82 71 1.465
Australian online drama
The total spend in 2020/21 was nearly five times the spend in 2016/17.
23
The Drama Report 2020/21 | Screen Australia
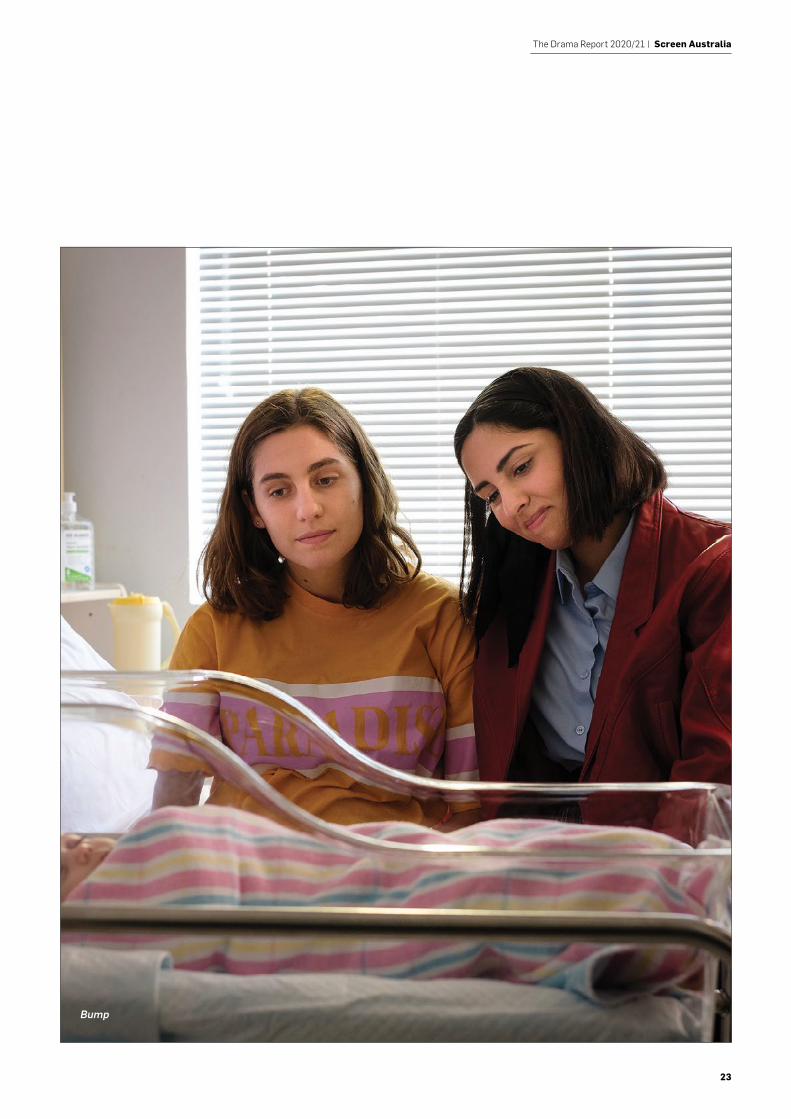
Bump
24
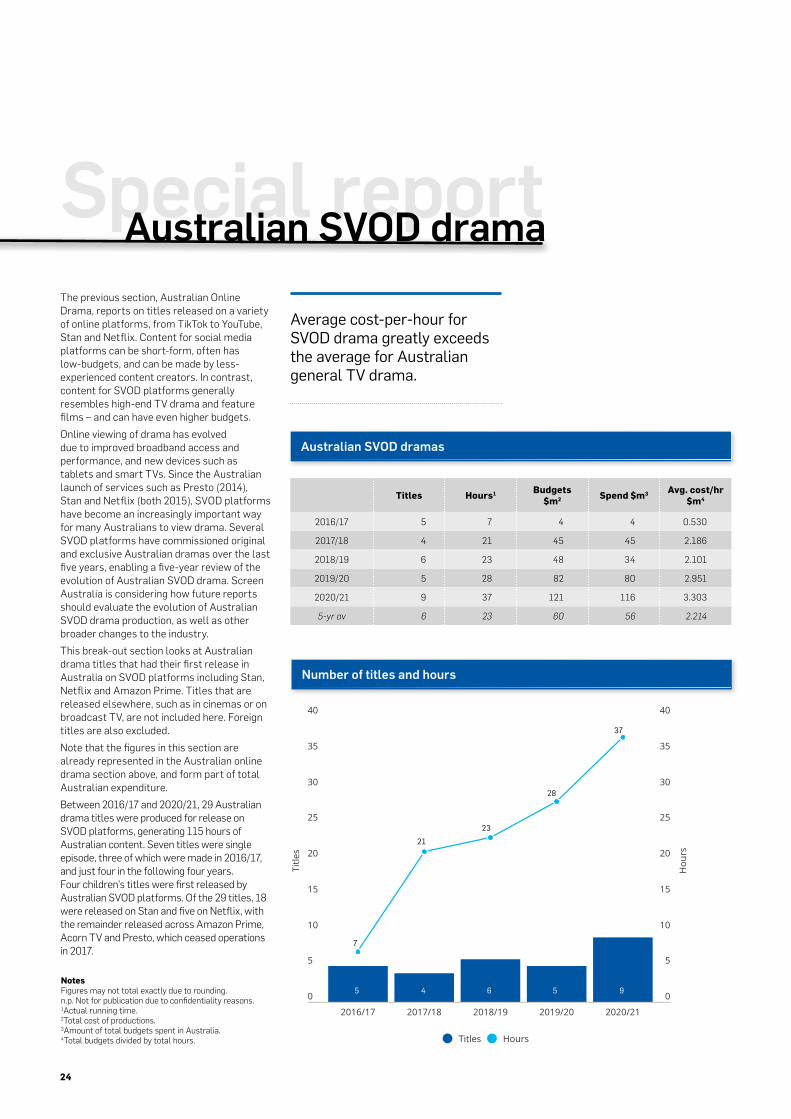
Average cost-per-hour for SVOD drama greatly exceeds the average for Australian general TV drama.
The previous section, Australian Online Drama, reports on titles released on a variety of online platforms, from TikTok to YouTube, Stan and Netflix. Content for social media platforms can be short-form, often has low-budgets, and can be made by less-experienced content creators. In contrast, content for SVOD platforms generally resembles high-end TV drama and feature films – and can have even higher budgets.Online viewing of drama has evolved due to improved broadband access and performance, and new devices such as tablets and smart TVs. Since the Australian launch of services such as Presto (2014), Stan and Netflix (both 2015), SVOD platforms have become an increasingly important way for many Australians to view drama. Several SVOD platforms have commissioned original and exclusive Australian dramas over the last five years, enabling a five-year review of the evolution of Australian SVOD drama. Screen Australia is considering how future reports should evaluate the evolution of Australian SVOD drama production, as well as other broader changes to the industry. This break-out section looks at Australian drama titles that had their first release in Australia on SVOD platforms including Stan, Netflix and Amazon Prime. Titles that are released elsewhere, such as in cinemas or on broadcast TV, are not included here. Foreign titles are also excluded.Note that the figures in this section are already represented in the Australian online drama section above, and form part of total Australian expenditure.Between 2016/17 and 2020/21, 29 Australian drama titles were produced for release on SVOD platforms, generating 115 hours of Australian content. Seven titles were single episode, three of which were made in 2016/17, and just four in the following four years. Four children’s titles were first released by Australian SVOD platforms. Of the 29 titles, 18 were released on Stan and five on Netflix, with the remainder released across Amazon Prime, Acorn TV and Presto, which ceased operations in 2017.
Titles Hours1 Budgets $m2 Spend $m3 Avg. cost/hr
$m4
2016/17 5 7 4 4 0.530
2017/18 4 21 45 45 2.186
2018/19 6 23 48 34 2.101
2019/20 5 28 82 80 2.951
2020/21 9 37 121 116 3.303
5-yr av 6 23 60 56 2.214
Australian SVOD dramas
0
5
10
15
20
25
30
35
40
0
5
10
15
20
25
30
35
40
2016/17 2017/18 2018/19 2019/20 2020/21
Title
s
Hou
rs
Titles Hours
Number of titles and hours
7
2123
28
37
4 6 5 95
5
Special reportAustralian SVOD drama
NotesFigures may not total exactly due to rounding. n.p. Not for publication due to confidentiality reasons.1Actual running time.2Total cost of productions.3Amount of total budgets spent in Australia.4Total budgets divided by total hours.
25
The Drama Report 2020/21 | Screen Australia
AUSTRALIAN SVOD DRAMABUDGETS AND AUSTRALIAN SPEND ($M)
0
20
40
60
80
100
120
140
0
20
40
60
80
100
120
140
2016/17 2017/18 2018/19 2019/20 2020/21
Budg
ets
($m
)
Spen
d ($
m)
Budgets ($m) Spend ($m)
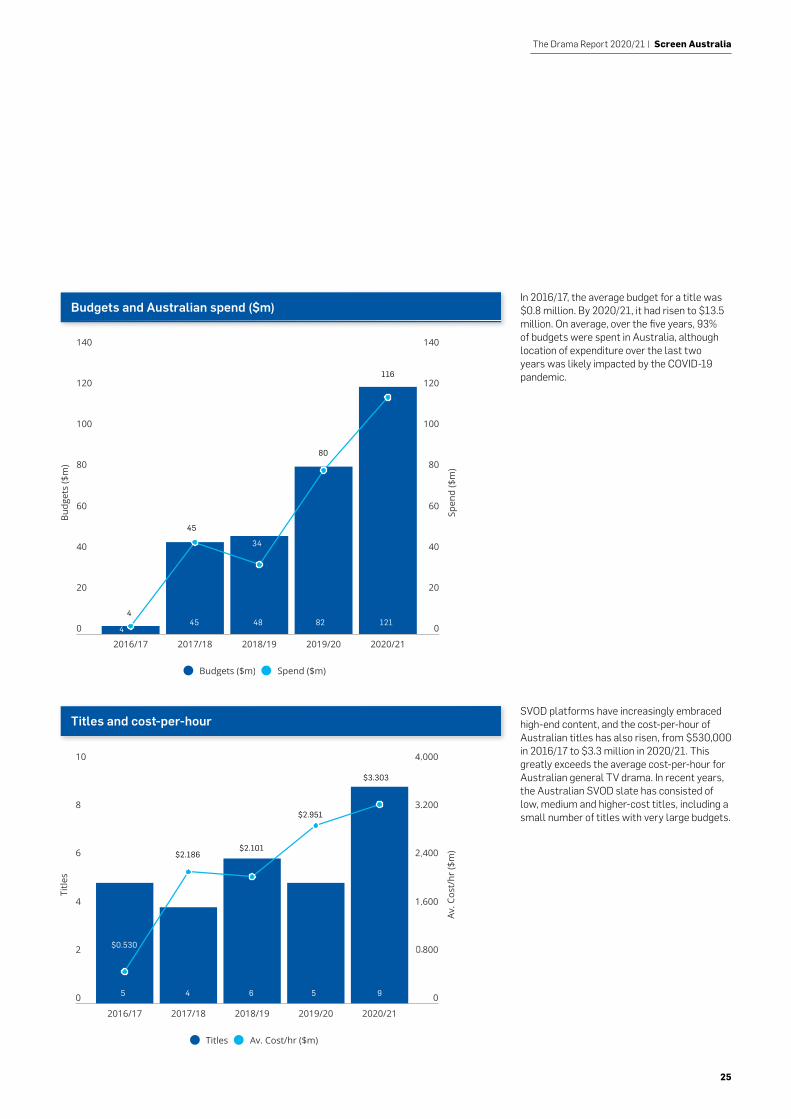
Budgets and Australian spend ($m)In 2016/17, the average budget for a title was $0.8 million. By 2020/21, it had risen to $13.5 million. On average, over the five years, 93% of budgets were spent in Australia, although location of expenditure over the last two years was likely impacted by the COVID-19 pandemic.
0
2
4
6
8
10
0
800
1,600
2,400
3,200
4,000
2016/17 2017/18 2018/19 2019/20 2020/21
Title
s
Av. C
ost/
hr ($
m)
Titles Av. Cost/hr ($m)
Titles and cost-per-hourSVOD platforms have increasingly embraced high-end content, and the cost-per-hour of Australian titles has also risen, from $530,000 in 2016/17 to $3.3 million in 2020/21. This greatly exceeds the average cost-per-hour for Australian general TV drama. In recent years, the Australian SVOD slate has consisted of low, medium and higher-cost titles, including a small number of titles with very large budgets.
4 6 5 95
$0.530
$2.186$2.101
$2.951
$3.303
4
45
34
80
116
45 48 82 1214
26
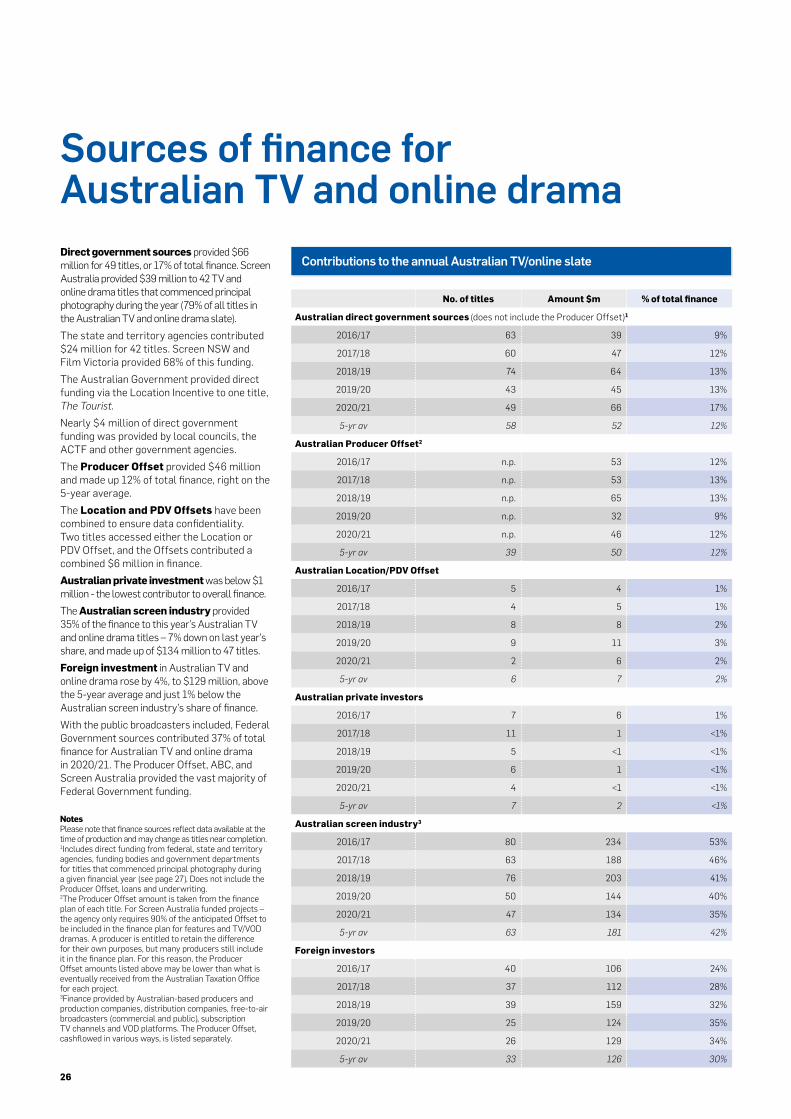
Direct government sources provided $66 million for 49 titles, or 17% of total finance. Screen Australia provided $39 million to 42 TV and online drama titles that commenced principal photography during the year (79% of all titles in the Australian TV and online drama slate).The state and territory agencies contributed $24 million for 42 titles. Screen NSW and Film Victoria provided 68% of this funding. The Australian Government provided direct funding via the Location Incentive to one title, The Tourist. Nearly $4 million of direct government funding was provided by local councils, the ACTF and other government agencies.The Producer Offset provided $46 million and made up 12% of total finance, right on the 5-year average.The Location and PDV Offsets have been combined to ensure data confidentiality. Two titles accessed either the Location or PDV Offset, and the Offsets contributed a combined $6 million in finance. Australian private investment was below $1 million - the lowest contributor to overall finance. The Australian screen industry provided 35% of the finance to this year’s Australian TV and online drama titles – 7% down on last year’s share, and made up of $134 million to 47 titles. Foreign investment in Australian TV and online drama rose by 4%, to $129 million, above the 5-year average and just 1% below the Australian screen industry’s share of finance.With the public broadcasters included, Federal Government sources contributed 37% of total finance for Australian TV and online drama in 2020/21. The Producer Offset, ABC, and Screen Australia provided the vast majority of Federal Government funding.
No. of titles Amount $m % of total finance
Australian direct government sources (does not include the Producer Offset)1
2016/17 63 39 9%
2017/18 60 47 12%
2018/19 74 64 13%
2019/20 43 45 13%
2020/21 49 66 17%
5-yr av 58 52 12%
Australian Producer Offset2
2016/17 n.p. 53 12%
2017/18 n.p. 53 13%
2018/19 n.p. 65 13%
2019/20 n.p. 32 9%
2020/21 n.p. 46 12%
5-yr av 39 50 12%
Australian Location/PDV Offset
2016/17 5 4 1%
2017/18 4 5 1%
2018/19 8 8 2%
2019/20 9 11 3%
2020/21 2 6 2%
5-yr av 6 7 2%
Australian private investors
2016/17 7 6 1%
2017/18 11 1 <1%
2018/19 5 <1 <1%
2019/20 6 1 <1%
2020/21 4 <1 <1%
5-yr av 7 2 <1%
Australian screen industry3
2016/17 80 234 53%
2017/18 63 188 46%
2018/19 76 203 41%
2019/20 50 144 40%
2020/21 47 134 35%
5-yr av 63 181 42%
Foreign investors
2016/17 40 106 24%
2017/18 37 112 28%
2018/19 39 159 32%
2019/20 25 124 35%
2020/21 26 129 34%
5-yr av 33 126 30%
Notes Please note that finance sources reflect data available at the time of production and may change as titles near completion. 1Includes direct funding from federal, state and territory agencies, funding bodies and government departments for titles that commenced principal photography during a given financial year (see page 27). Does not include the Producer Offset, loans and underwriting.2The Producer Offset amount is taken from the finance plan of each title. For Screen Australia funded projects – the agency only requires 90% of the anticipated Offset to be included in the finance plan for features and TV/VOD dramas. A producer is entitled to retain the difference for their own purposes, but many producers still include it in the finance plan. For this reason, the Producer Offset amounts listed above may be lower than what is eventually received from the Australian Taxation Office for each project.3Finance provided by Australian-based producers and production companies, distribution companies, free-to-air broadcasters (commercial and public), subscription TV channels and VOD platforms. The Producer Offset, cashflowed in various ways, is listed separately.
Contributions to the annual Australian TV/online slate
Sources of finance for Australian TV and online drama
27
The Drama Report 2020/21 | Screen Australia
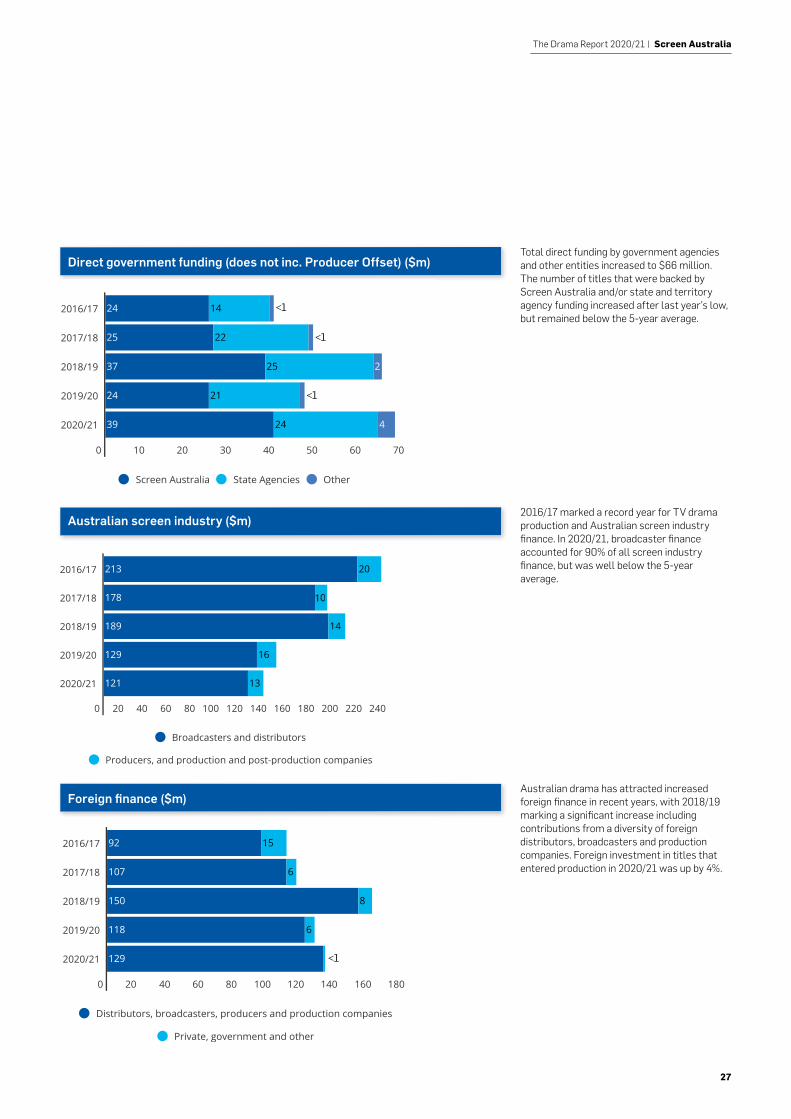
Total direct funding by government agencies and other entities increased to $66 million. The number of titles that were backed by Screen Australia and/or state and territory agency funding increased after last year’s low, but remained below the 5-year average.
2016/17 marked a record year for TV drama production and Australian screen industry finance. In 2020/21, broadcaster finance accounted for 90% of all screen industry finance, but was well below the 5-year average.
Australian drama has attracted increased foreign finance in recent years, with 2018/19 marking a significant increase including contributions from a diversity of foreign distributors, broadcasters and production companies. Foreign investment in titles that entered production in 2020/21 was up by 4%.
Direct government funding (does not inc. Producer Offset) ($m)
Australian screen industry ($m)
Foreign finance ($m)
Australian screen industry ($m)
2016/17
2017/18
2018/19
2019/20
2020/21
0 20 40 60 80 100 120 140 160 180 200 220 240
213 20
178
189 14
129 16
121 13
Broadcasters and distributors
Producers, and production and post-production companies
Foreign nance ($m)
2016/17
2017/18
2018/19
2019/20
2020/21
0 20 40 60 80 100 120 140 160 180
92 15
107 6
150 8
118 6
129
Distributors, broadcasters, producers and production companies
Private, government and other
Direct Government funding (does not inc. ProducerOset) $m
2016/17
2017/18
2018/19
2019/20
2020/21
0 10 20 30 40 50 60 70
24 14
25 22
37 25 2
24 21
39 24 4
Screen Australia State Agencies Other
<1
<1
<1
<1
28
TV/online drama finance by first release platform
No. of titles Investment $m* Hours Budgets $m
ABC (includes iview)
2016/17 34 55 120 130
2017/18 23 53 112 144
2018/19 28 52 128 157
2019/20 16 36 103 111
2020/21 17 43 77 118
5-yr av 24 48 108 132
SBS/NITV (includes SBS On Demand)
2016/17 3 6 11 14
2017/18 6 8 20 21
2018/19 4 5 12 16
2019/20 2 2 6 7
2020/21 4 6 10 17
5-yr av 4 5 12 15
Public broadcasters (ABC and SBS/NITV)
2016/17 37 62 131 143
2017/18 29 61 132 165
2018/19 32 58 140 173
2019/20 18 37 109 119
2020/21 21 49 87 134
5-yr av 27 53 120 147
Commercial free-to-air broadcasters (includes on-demand platforms)
2016/17 23 98 396 211
2017/18 16 73 330 135
2018/19 25 107 434 211
2019/20 17 60 323 126
2020/21 11 54 282 109
5-yr av 18 78 353 158
Subscription TV broadcasters
2016/17 7 50 58 75
2017/18 5 31 33 50
2018/19 3 12 22 33
2019/20 2 17 11 24
2020/21 0 0 0 0
5-yr av 3 22 25 36
Australian and foreign online streaming services**
2016/17 8 4 13 11
2017/18 5 29 22 46
2018/19 9 19 25 49
2019/20 6 46 30 84
2020/21 9 30 37 121
5-yr av 7 26 25 62
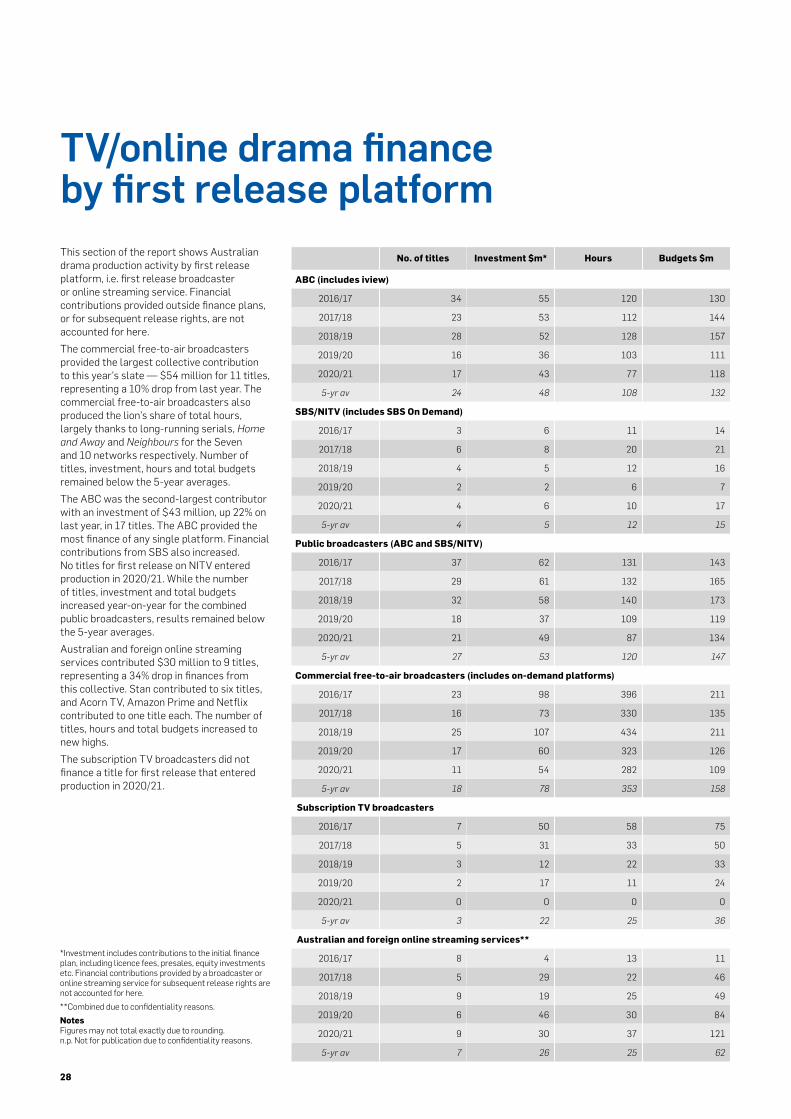
This section of the report shows Australian drama production activity by first release platform, i.e. first release broadcaster or online streaming service. Financial contributions provided outside finance plans, or for subsequent release rights, are not accounted for here.The commercial free-to-air broadcasters provided the largest collective contribution to this year’s slate — $54 million for 11 titles, representing a 10% drop from last year. The commercial free-to-air broadcasters also produced the lion’s share of total hours, largely thanks to long-running serials, Home and Away and Neighbours for the Seven and 10 networks respectively. Number of titles, investment, hours and total budgets remained below the 5-year averages. The ABC was the second-largest contributor with an investment of $43 million, up 22% on last year, in 17 titles. The ABC provided the most finance of any single platform. Financial contributions from SBS also increased. No titles for first release on NITV entered production in 2020/21. While the number of titles, investment and total budgets increased year-on-year for the combined public broadcasters, results remained below the 5-year averages. Australian and foreign online streaming services contributed $30 million to 9 titles, representing a 34% drop in finances from this collective. Stan contributed to six titles, and Acorn TV, Amazon Prime and Netflix contributed to one title each. The number of titles, hours and total budgets increased to new highs. The subscription TV broadcasters did not finance a title for first release that entered production in 2020/21.
*Investment includes contributions to the initial finance plan, including licence fees, presales, equity investments etc. Financial contributions provided by a broadcaster or online streaming service for subsequent release rights are not accounted for here.**Combined due to confidentiality reasons.Notes Figures may not total exactly due to rounding. n.p. Not for publication due to confidentiality reasons.
29
The Drama Report 2020/21 | Screen Australia
Foreign production
Notes: Figures may not total exactly due to rounding.n.p. Not for publication due to confidentiality reasons.1Amount of total budgets spent in Australia.2Combined due to confidentiality reasons.
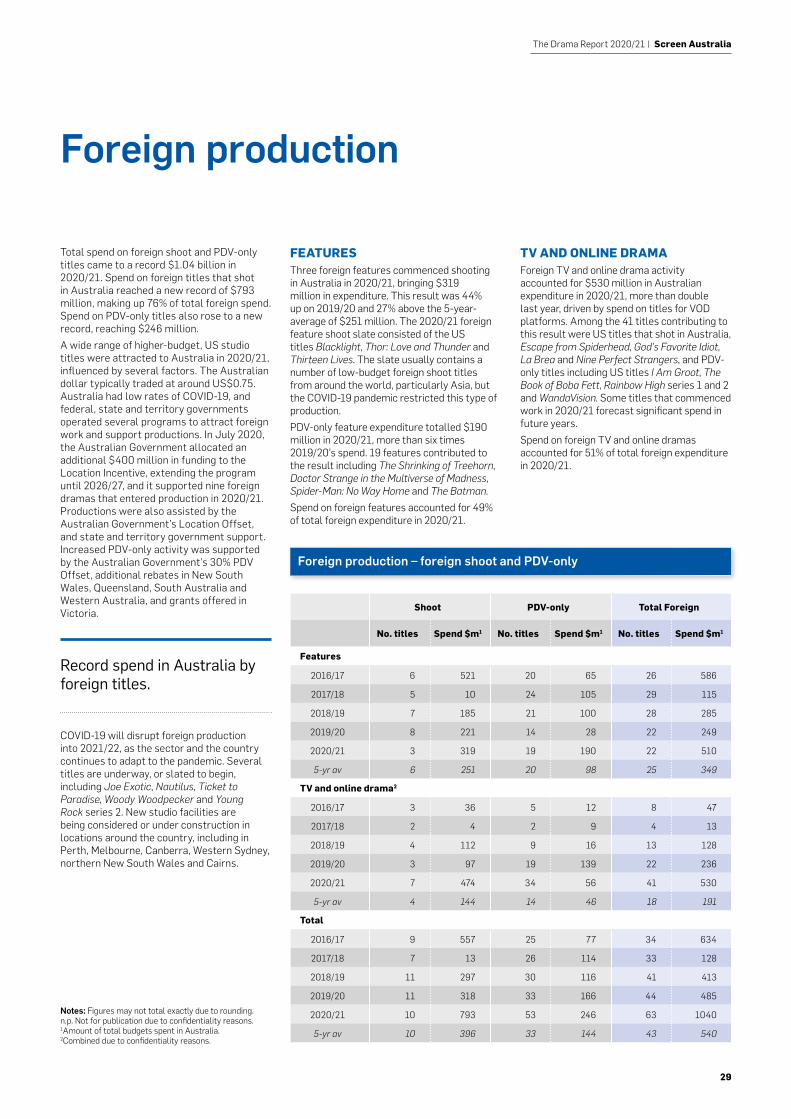
Total spend on foreign shoot and PDV-only titles came to a record $1.04 billion in 2020/21. Spend on foreign titles that shot in Australia reached a new record of $793 million, making up 76% of total foreign spend. Spend on PDV-only titles also rose to a new record, reaching $246 million.A wide range of higher-budget, US studio titles were attracted to Australia in 2020/21, influenced by several factors. The Australian dollar typically traded at around US$0.75. Australia had low rates of COVID-19, and federal, state and territory governments operated several programs to attract foreign work and support productions. In July 2020, the Australian Government allocated an additional $400 million in funding to the Location Incentive, extending the program until 2026/27, and it supported nine foreign dramas that entered production in 2020/21. Productions were also assisted by the Australian Government’s Location Offset, and state and territory government support. Increased PDV-only activity was supported by the Australian Government’s 30% PDV Offset, additional rebates in New South Wales, Queensland, South Australia and Western Australia, and grants offered in Victoria.
COVID-19 will disrupt foreign production into 2021/22, as the sector and the country continues to adapt to the pandemic. Several titles are underway, or slated to begin, including Joe Exotic, Nautilus, Ticket to Paradise, Woody Woodpecker and Young Rock series 2. New studio facilities are being considered or under construction in locations around the country, including in Perth, Melbourne, Canberra, Western Sydney, northern New South Wales and Cairns.
Shoot PDV-only Total Foreign
No. titles Spend $m1 No. titles Spend $m1 No. titles Spend $m1
Features
2016/17 6 521 20 65 26 586
2017/18 5 10 24 105 29 115
2018/19 7 185 21 100 28 285
2019/20 8 221 14 28 22 249
2020/21 3 319 19 190 22 510
5-yr av 6 251 20 98 25 349
TV and online drama2
2016/17 3 36 5 12 8 47
2017/18 2 4 2 9 4 13
2018/19 4 112 9 16 13 128
2019/20 3 97 19 139 22 236
2020/21 7 474 34 56 41 530
5-yr av 4 144 14 46 18 191
Total
2016/17 9 557 25 77 34 634
2017/18 7 13 26 114 33 128
2018/19 11 297 30 116 41 413
2019/20 11 318 33 166 44 485
2020/21 10 793 53 246 63 1040
5-yr av 10 396 33 144 43 540
TV AND ONLINE DRAMAForeign TV and online drama activity accounted for $530 million in Australian expenditure in 2020/21, more than double last year, driven by spend on titles for VOD platforms. Among the 41 titles contributing to this result were US titles that shot in Australia, Escape from Spiderhead, God’s Favorite Idiot, La Brea and Nine Perfect Strangers, and PDV-only titles including US titles I Am Groot, The Book of Boba Fett, Rainbow High series 1 and 2 and WandaVision. Some titles that commenced work in 2020/21 forecast significant spend in future years. Spend on foreign TV and online dramas accounted for 51% of total foreign expenditure in 2020/21.
Foreign production – foreign shoot and PDV-only
FEATURESThree foreign features commenced shooting in Australia in 2020/21, bringing $319 million in expenditure. This result was 44% up on 2019/20 and 27% above the 5-year-average of $251 million. The 2020/21 foreign feature shoot slate consisted of the US titles Blacklight, Thor: Love and Thunder and Thirteen Lives. The slate usually contains a number of low-budget foreign shoot titles from around the world, particularly Asia, but the COVID-19 pandemic restricted this type of production.PDV-only feature expenditure totalled $190 million in 2020/21, more than six times 2019/20’s spend. 19 features contributed to the result including The Shrinking of Treehorn, Doctor Strange in the Multiverse of Madness, Spider-Man: No Way Home and The Batman.Spend on foreign features accounted for 49% of total foreign expenditure in 2020/21.
Record spend in Australia by foreign titles.
30
NSW QLD VIC
Shoot PDV Total Shoot PDV Total Shoot PDV Total
$m
2016/17 328 144 472 416 13 429 239 88 327
2017/18 173 106 280 103 19 122 185 68 252
2018/19 237 148 385 269 31 300 233 119 352
2019/20 298 179 477 47 10 57 234 86 320
2020/21 643 268 912 484 69 553 211 95 307
%
2016/17 32% 53% 36% 40% 5% 33% 23% 32% 25%
2017/18 32% 44% 36% 19% 8% 16% 34% 28% 32%
2018/19 28% 40% 32% 32% 8% 25% 28% 32% 29%
2019/20 42% 53% 46% 7% 3% 5% 33% 26% 31%
2020/21 45% 57% 48% 34% 15% 29% 15% 20% 16%
SA WA Tas/NT/ACT
Shoot PDV Total Shoot PDV Total Shoot PDV Total
$m
2016/17 22 25 47 7 3 10 22 1 23
2017/18 41 44 85 33 4 37 11 <1 11
2018/19 44 66 110 33 3 35 26 1 28
2019/20 90 58 148 32 2 34 5 1 6
2020/21 59 37 96 24 5 29 18 0 18
%
2016/17 2% 9% 4% 1% 1% 1% 2% <1% 2%
2017/18 8% 18% 11% 6% 2% 5% 2% <1% 1%
2018/19 5% 18% 9% 4% 1% 3% 3% <1% 2%
2019/20 13% 17% 14% 5% 1% 3% 1% <1% 1%
2020/21 4% 8% 5% 2% 1% 2% 1% 0% 1%
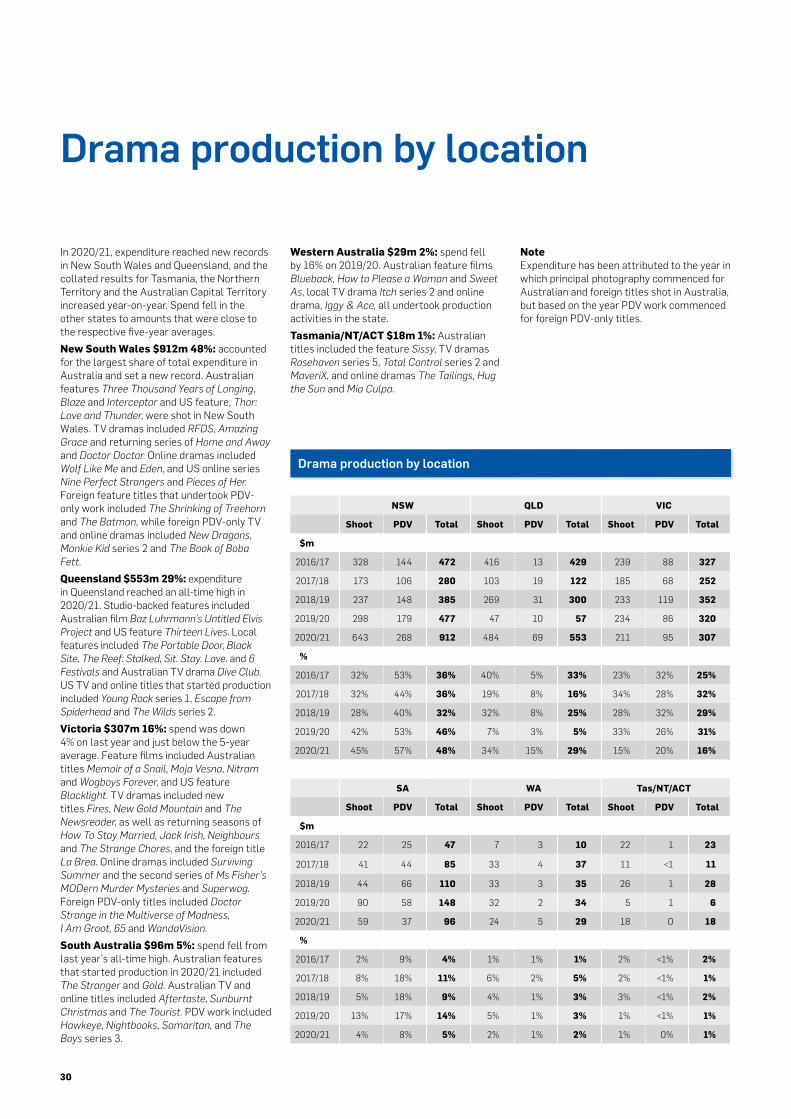
Drama production by location
In 2020/21, expenditure reached new records in New South Wales and Queensland, and the collated results for Tasmania, the Northern Territory and the Australian Capital Territory increased year-on-year. Spend fell in the other states to amounts that were close to the respective five-year averages.New South Wales $912m 48%: accounted for the largest share of total expenditure in Australia and set a new record. Australian features Three Thousand Years of Longing, Blaze and Interceptor and US feature, Thor: Love and Thunder, were shot in New South Wales. TV dramas included RFDS, Amazing Grace and returning series of Home and Away and Doctor Doctor. Online dramas included Wolf Like Me and Eden, and US online series Nine Perfect Strangers and Pieces of Her. Foreign feature titles that undertook PDV-only work included The Shrinking of Treehorn and The Batman, while foreign PDV-only TV and online dramas included New Dragons, Monkie Kid series 2 and The Book of Boba Fett.Queensland $553m 29%: expenditure in Queensland reached an all-time high in 2020/21. Studio-backed features included Australian film Baz Luhrmann’s Untitled Elvis Project and US feature Thirteen Lives. Local features included The Portable Door, Black Site, The Reef: Stalked, Sit. Stay. Love. and 6 Festivals and Australian TV drama Dive Club. US TV and online titles that started production included Young Rock series 1, Escape from Spiderhead and The Wilds series 2.Victoria $307m 16%: spend was down 4% on last year and just below the 5-year average. Feature films included Australian titles Memoir of a Snail, Moja Vesna, Nitram and Wogboys Forever, and US feature Blacklight. TV dramas included new titles Fires, New Gold Mountain and The Newsreader, as well as returning seasons of How To Stay Married, Jack Irish, Neighbours and The Strange Chores, and the foreign title La Brea. Online dramas included Surviving Summer and the second series of Ms Fisher’s MODern Murder Mysteries and Superwog. Foreign PDV-only titles included Doctor Strange in the Multiverse of Madness, I Am Groot, 65 and WandaVision.South Australia $96m 5%: spend fell from last year’s all-time high. Australian features that started production in 2020/21 included The Stranger and Gold. Australian TV and online titles included Aftertaste, Sunburnt Christmas and The Tourist. PDV work included Hawkeye, Nightbooks, Samaritan, and The Boys series 3.
Western Australia $29m 2%: spend fell by 16% on 2019/20. Australian feature films Blueback, How to Please a Woman and Sweet As, local TV drama Itch series 2 and online drama, Iggy & Ace, all undertook production activities in the state.Tasmania/NT/ACT $18m 1%: Australian titles included the feature Sissy, TV dramas Rosehaven series 5, Total Control series 2 and MaveriX, and online dramas The Tailings, Hug the Sun and Mia Culpa.
Note Expenditure has been attributed to the year in which principal photography commenced for Australian and foreign titles shot in Australia, but based on the year PDV work commenced for foreign PDV-only titles.
Drama production by location
31
The Drama Report 2020/21 | Screen Australia
Blacklight (Photo by Ben King)
DRAMA REPORT 2020/21 DRAMA PRODUCTION BY LOCATION: EXPENDITURE BY STATE ($M)
1,000
900
800
700
600
500
400
300
200
100
0
NSW QLD VIC SA WA TAS/NT/ACT
Spen
d ($
m)
2016/17 2017/18 2018/19 2019/20 2020/21
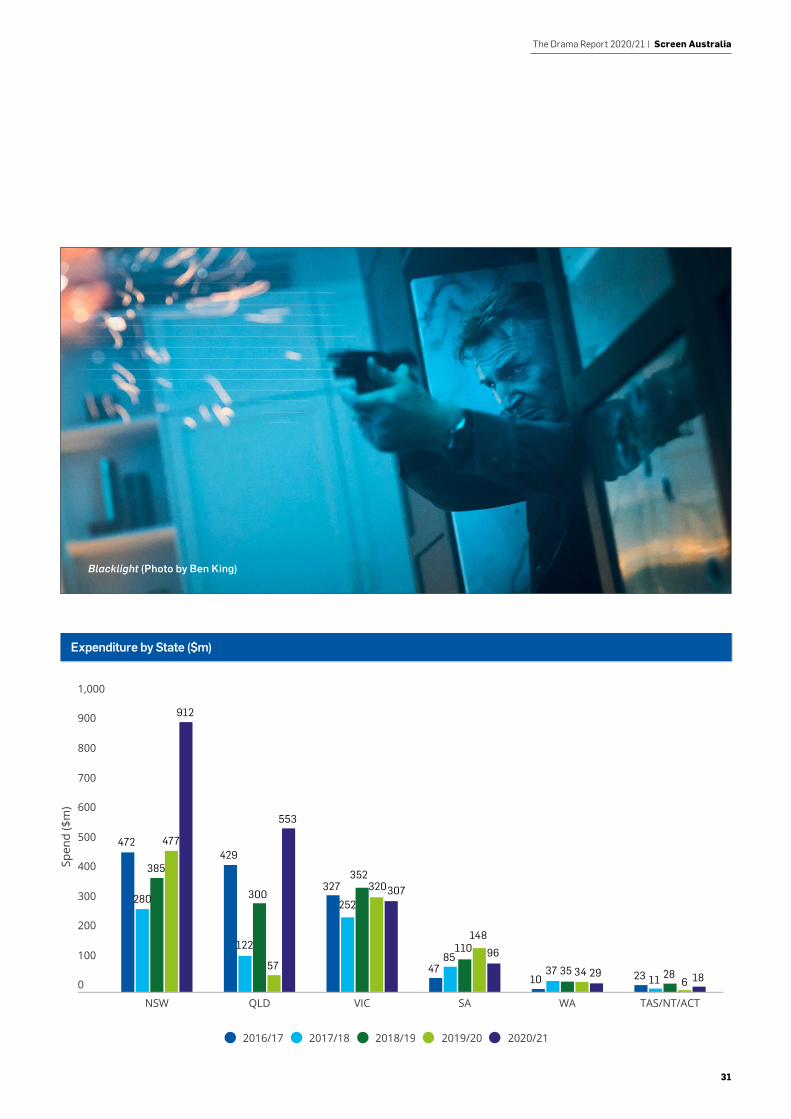
Expenditure by State ($m)
472
280
385
477
912
429
122
300
57
553
327252
352320307
4710 23 11 28
6 1837 35 34 2985
110148
96
32
The impact of COVID-19
The COVID-19 pandemic halted large-scale production in March 2020, with activity resuming in some locations from May 2020. Production throughout the 2020/21 financial year was constrained by a range of factors, including a notable outbreak of COVID-19 in Victoria in the second half of calendar year 2020. However, most productions were able to adapt to the challenging circumstances and begin, or in some cases resume, work. According to current data, 27 titles planned to enter production in 2019/20, but postponed production due to COVID-19. Of those 27:• twenty-three started production in
2020/21 (and are included in the 2020/21 data throughout this report)
• three low-cost titles are scheduled to enter production in 2021/22
• one title is yet to enter production, and is on hold.
From the more than 120 surveys sent out to producers for this report, 86 provided data and/or anecdotal evidence to describe how the COVID-19 pandemic impacted individual projects as well as, more broadly, production businesses.Seventy-four respondents reported additional budget costs totalling $17.9 million to cover COVID-related costs, or an average of $242,406 for each title. Costs ranged from $300 to $1.7 million.Apart from COVID-19 personal protective equipment, ongoing testing and COVID-19 Safety Supervisors, industry-specific costs and impacts included:• rescheduling to accommodate loss of
locations and changing dates• delays while actors and crew quarantined• revisions to scripts and schedules to
accommodate casting and location changes, and to ensure adherence to strict COVID-19 protocols
• catering companies providing individually packaged meals to all cast and crew
• increased workload for producers so that they could keep productions fluid and able to respond to ever-changing circumstances
• providing adequate equipment and conditions for remote working
• disrupted finances, particularly for feature films, and difficulty in obtaining necessary insurances.
Producers also reported heightened stress among casts and crews due to the ever-present threat of sudden and unexpected
changes. However, they also described people working collaboratively to find creative solutions, and a determination to keep working.A number of feature film producers expressed concern COVID-19 would lower box office returns, with some releases already impacted, including via important festivals which were either cancelled or shifted online.Several larger-budget US productions took advantage of Australia’s more favourable conditions to shoot in the country, creating additional spend, employment and other benefits. Some Australian producers reported that this influx of foreign production created greater demand for Australian crew, and facilities such as studios, increasing some costs. COVID-19 cases began to rise again following the end of the 2020/21 financial year, leading to impacts on the 2021/22 production slate that are not measured here.
THE PDV INDUSTRYCOVID-19 caused significant disruption to the PDV industry in 2020/21. While overall PDV spend was very strong, it was unevenly distributed across the sector and throughout the year. Twenty companies provided COVID-specific insights for this report, including large PDV companies, mixed production and post-production businesses, and small businesses, including some that specialise in areas of sound or animation. Fourteen companies stated the pandemic had a negative impact, with eight describing a ‘very negative’ impact. Companies described financial impacts ranging from $50,000 to a sole trader or small business, to more than $10 million for a larger company. The median average impact was $1 million. Specific impacts included:• As global production halted and was
disrupted, work and income was lost. Some productions reduced PDV work, while others cancelled work entirely. Some companies experienced periods with little or no work, particularly towards the end of 2020, and had to reduce staffing levels and other costs.
• As work returned and Australian production surged, foreign and interstate recruitment was complicated by border closures, quarantine and lockdown requirements. Companies reported significant skill and labour shortages, and
some companies declined work worth several million dollars due to a lack of capacity at critical times.
• Working from home posed several challenges. Expensive equipment and software was required, slow internet connections created large inefficiencies, and teams lost the benefits of working in the office. Companies also mentioned benefits from working from home, such as better work and life balance, and the ability to recruit and work across multiple states and countries.
• Specific tasks such as in-person foley recording, and sound work on productions based in other countries, could not be completed.
Three companies reported negligible impact from COVID-19. Two of those companies cited similar difficulties regarding remote work, training and pipeline, but reported little additional cost. One reported that animation work was barely affected.Three companies stated the pandemic had somewhat or very positive impacts. Two reported that clients and companies had been forced to embrace the benefits of remote work and workflows. One company reported that the shift to working from home significantly reduced operational costs, and resulted in better business practices and higher profitability. Another cited business relationships with foreign companies and productions that began out of necessity, but had continued into new work.
33
The Drama Report 2020/21 | Screen Australia
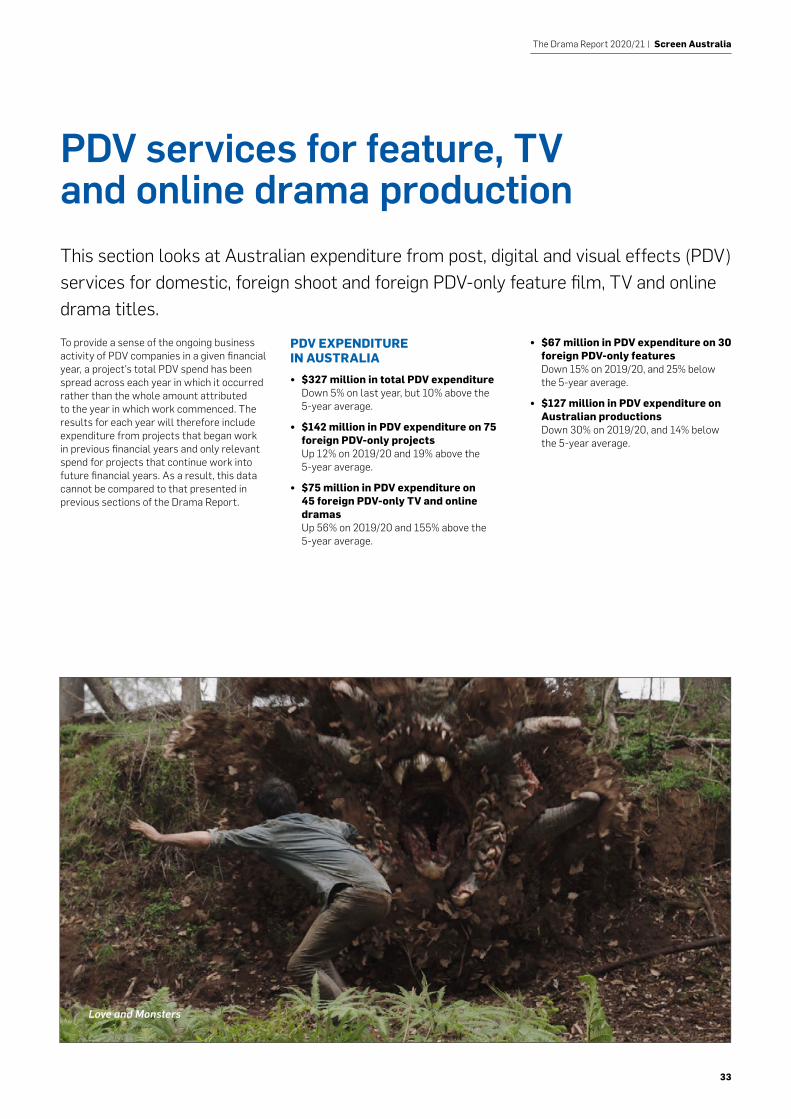
PDV services for feature, TV and online drama productionThis section looks at Australian expenditure from post, digital and visual effects (PDV) services for domestic, foreign shoot and foreign PDV-only feature film, TV and online drama titles.To provide a sense of the ongoing business activity of PDV companies in a given financial year, a project’s total PDV spend has been spread across each year in which it occurred rather than the whole amount attributed to the year in which work commenced. The results for each year will therefore include expenditure from projects that began work in previous financial years and only relevant spend for projects that continue work into future financial years. As a result, this data cannot be compared to that presented in previous sections of the Drama Report.
Love and Monsters
PDV EXPENDITURE IN AUSTRALIA• $327 million in total PDV expenditure
Down 5% on last year, but 10% above the 5-year average.
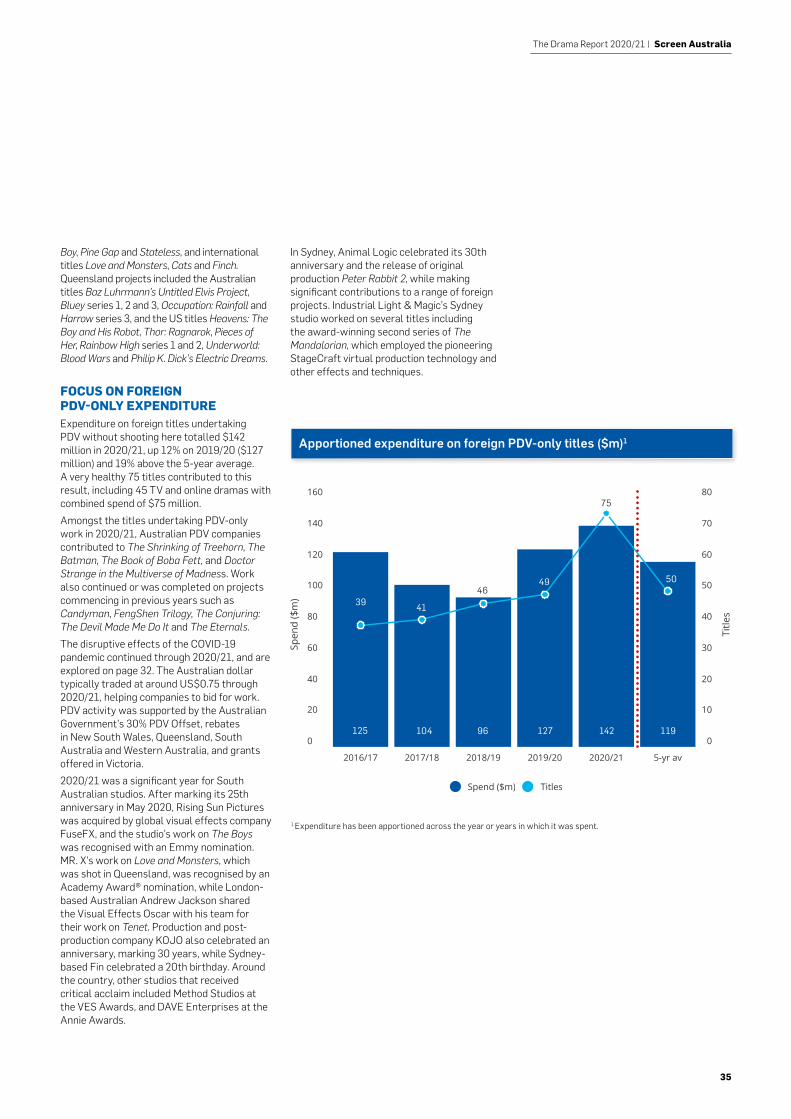
• $142 million in PDV expenditure on 75 foreign PDV-only projects Up 12% on 2019/20 and 19% above the 5-year average.
• $75 million in PDV expenditure on 45 foreign PDV-only TV and online dramas Up 56% on 2019/20 and 155% above the 5-year average.
• $67 million in PDV expenditure on 30 foreign PDV-only features Down 15% on 2019/20, and 25% below the 5-year average.
• $127 million in PDV expenditure on Australian productions Down 30% on 2019/20, and 14% below the 5-year average.
34
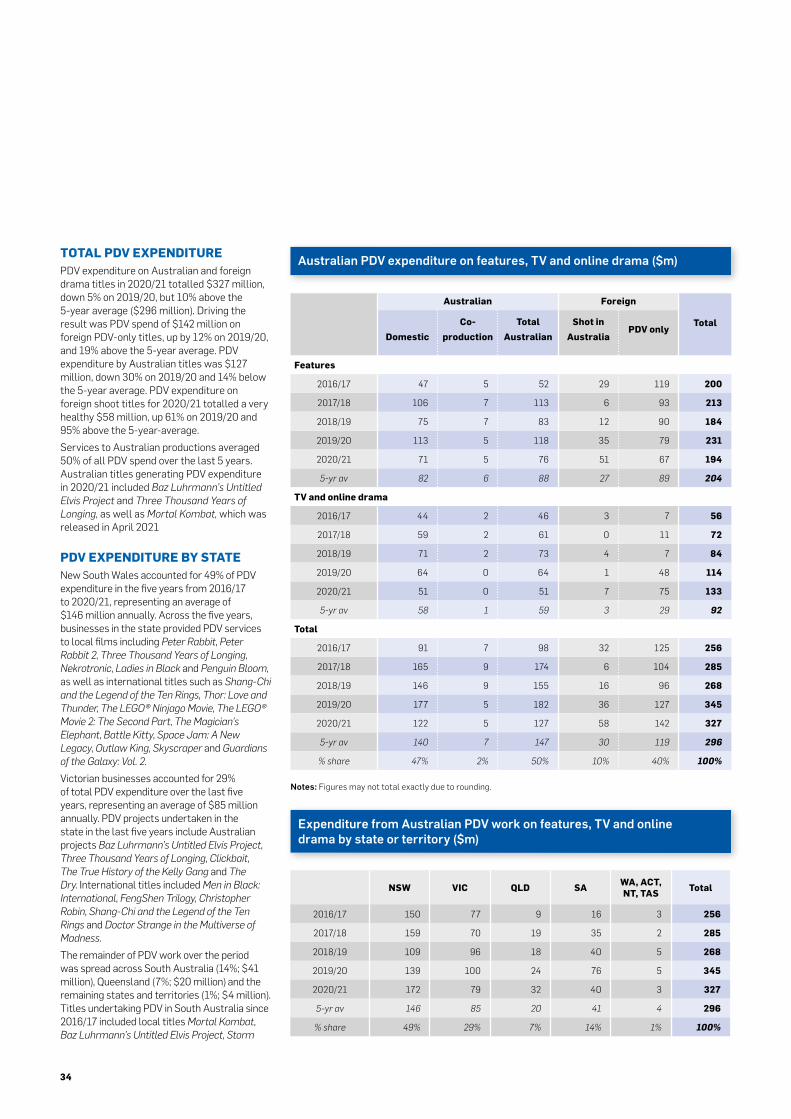
TOTAL PDV EXPENDITUREPDV expenditure on Australian and foreign drama titles in 2020/21 totalled $327 million, down 5% on 2019/20, but 10% above the 5-year average ($296 million). Driving the result was PDV spend of $142 million on foreign PDV-only titles, up by 12% on 2019/20, and 19% above the 5-year average. PDV expenditure by Australian titles was $127 million, down 30% on 2019/20 and 14% below the 5-year average. PDV expenditure on foreign shoot titles for 2020/21 totalled a very healthy $58 million, up 61% on 2019/20 and 95% above the 5-year-average. Services to Australian productions averaged 50% of all PDV spend over the last 5 years. Australian titles generating PDV expenditure in 2020/21 included Baz Luhrmann’s Untitled Elvis Project and Three Thousand Years of Longing, as well as Mortal Kombat, which was released in April 2021
PDV EXPENDITURE BY STATENew South Wales accounted for 49% of PDV expenditure in the five years from 2016/17 to 2020/21, representing an average of $146 million annually. Across the five years, businesses in the state provided PDV services to local films including Peter Rabbit, Peter Rabbit 2, Three Thousand Years of Longing, Nekrotronic, Ladies in Black and Penguin Bloom, as well as international titles such as Shang-Chi and the Legend of the Ten Rings, Thor: Love and Thunder, The LEGO® Ninjago Movie, The LEGO® Movie 2: The Second Part, The Magician’s Elephant, Battle Kitty, Space Jam: A New Legacy, Outlaw King, Skyscraper and Guardians of the Galaxy: Vol. 2. Victorian businesses accounted for 29% of total PDV expenditure over the last five years, representing an average of $85 million annually. PDV projects undertaken in the state in the last five years include Australian projects Baz Luhrmann’s Untitled Elvis Project, Three Thousand Years of Longing, Clickbait, The True History of the Kelly Gang and The Dry. International titles included Men in Black: International, FengShen Trilogy, Christopher Robin, Shang-Chi and the Legend of the Ten Rings and Doctor Strange in the Multiverse of Madness.The remainder of PDV work over the period was spread across South Australia (14%; $41 million), Queensland (7%; $20 million) and the remaining states and territories (1%; $4 million). Titles undertaking PDV in South Australia since 2016/17 included local titles Mortal Kombat, Baz Luhrmann’s Untitled Elvis Project, Storm
Australian Foreign
TotalDomestic
Co-production
TotalAustralian
Shot inAustralia
PDV only
Features
2016/17 47 5 52 29 119 200
2017/18 106 7 113 6 93 213
2018/19 75 7 83 12 90 184
2019/20 113 5 118 35 79 231
2020/21 71 5 76 51 67 194
5-yr av 82 6 88 27 89 204
TV and online drama
2016/17 44 2 46 3 7 56
2017/18 59 2 61 0 11 72
2018/19 71 2 73 4 7 84
2019/20 64 0 64 1 48 114
2020/21 51 0 51 7 75 133
5-yr av 58 1 59 3 29 92
Total
2016/17 91 7 98 32 125 256
2017/18 165 9 174 6 104 285
2018/19 146 9 155 16 96 268
2019/20 177 5 182 36 127 345
2020/21 122 5 127 58 142 327
5-yr av 140 7 147 30 119 296
% share 47% 2% 50% 10% 40% 100%
NSW VIC QLD SA WA, ACT, NT, TAS Total
2016/17 150 77 9 16 3 256
2017/18 159 70 19 35 2 285
2018/19 109 96 18 40 5 268
2019/20 139 100 24 76 5 345
2020/21 172 79 32 40 3 327
5-yr av 146 85 20 41 4 296
% share 49% 29% 7% 14% 1% 100%
Notes: Figures may not total exactly due to rounding.
Australian PDV expenditure on features, TV and online drama ($m)
Expenditure from Australian PDV work on features, TV and online drama by state or territory ($m)
35
The Drama Report 2020/21 | Screen Australia
0
20
40
60
80
100
120
140
160
0
10
20
30
40
50
60
70
80
2016/17 2017/18 2018/19 2019/20 2020/21 5-yr av
Spen
d ($
m)
Title
s
Spend ($m) Titles
14296 127125
39 41
104
4649
75
1 Expenditure has been apportioned across the year or years in which it was spent.
Apportioned expenditure on foreign PDV-only titles ($m)1
Boy, Pine Gap and Stateless, and international titles Love and Monsters, Cats and Finch. Queensland projects included the Australian titles Baz Luhrmann’s Untitled Elvis Project, Bluey series 1, 2 and 3, Occupation: Rainfall and Harrow series 3, and the US titles Heavens: The Boy and His Robot, Thor: Ragnarok, Pieces of Her, Rainbow High series 1 and 2, Underworld: Blood Wars and Philip K. Dick’s Electric Dreams.
FOCUS ON FOREIGN PDV-ONLY EXPENDITUREExpenditure on foreign titles undertaking PDV without shooting here totalled $142 million in 2020/21, up 12% on 2019/20 ($127 million) and 19% above the 5-year average. A very healthy 75 titles contributed to this result, including 45 TV and online dramas with combined spend of $75 million.Amongst the titles undertaking PDV-only work in 2020/21, Australian PDV companies contributed to The Shrinking of Treehorn, The Batman, The Book of Boba Fett, and Doctor Strange in the Multiverse of Madness. Work also continued or was completed on projects commencing in previous years such as Candyman, FengShen Trilogy, The Conjuring: The Devil Made Me Do It and The Eternals.The disruptive effects of the COVID-19 pandemic continued through 2020/21, and are explored on page 32. The Australian dollar typically traded at around US$0.75 through 2020/21, helping companies to bid for work. PDV activity was supported by the Australian Government’s 30% PDV Offset, rebates in New South Wales, Queensland, South Australia and Western Australia, and grants offered in Victoria.2020/21 was a significant year for South Australian studios. After marking its 25th anniversary in May 2020, Rising Sun Pictures was acquired by global visual effects company FuseFX, and the studio’s work on The Boys was recognised with an Emmy nomination. MR. X’s work on Love and Monsters, which was shot in Queensland, was recognised by an Academy Award® nomination, while London-based Australian Andrew Jackson shared the Visual Effects Oscar with his team for their work on Tenet. Production and post-production company KOJO also celebrated an anniversary, marking 30 years, while Sydney-based Fin celebrated a 20th birthday. Around the country, other studios that received critical acclaim included Method Studios at the VES Awards, and DAVE Enterprises at the Annie Awards.
In Sydney, Animal Logic celebrated its 30th anniversary and the release of original production Peter Rabbit 2, while making significant contributions to a range of foreign projects. Industrial Light & Magic’s Sydney studio worked on several titles including the award-winning second series of The Mandalorian, which employed the pioneering StageCraft virtual production technology and other effects and techniques.
50
119
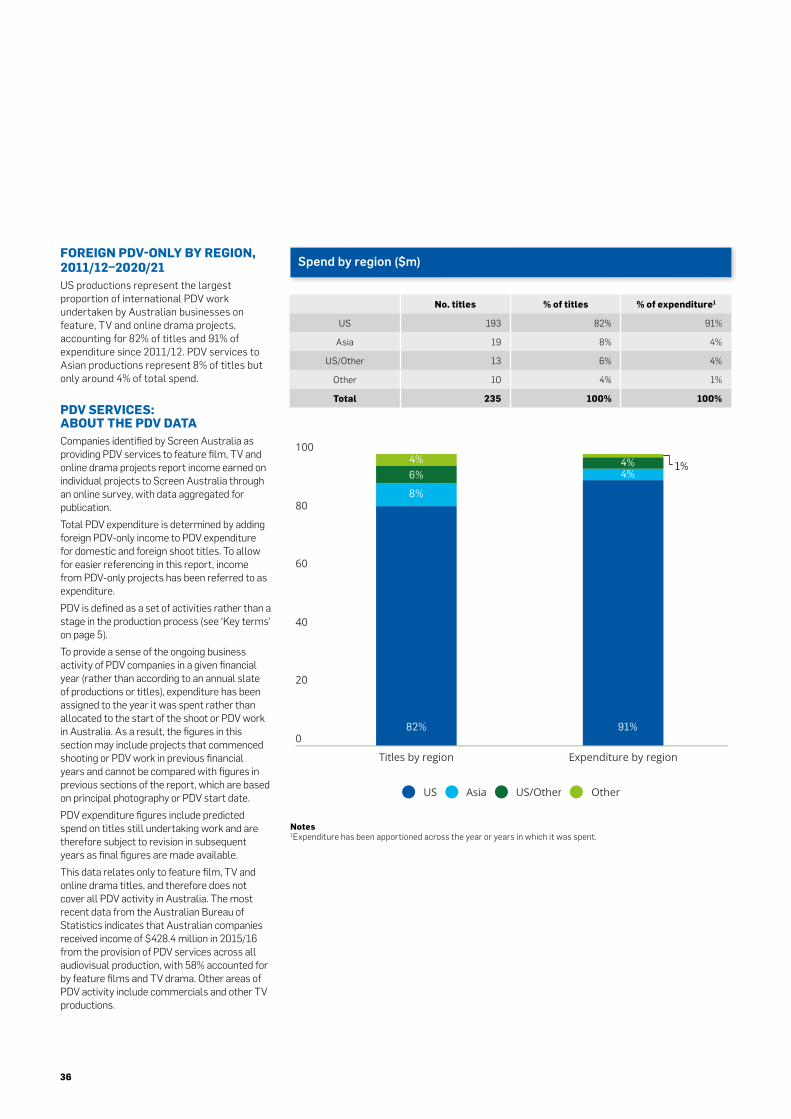
36
FOREIGN PDV-ONLY BY REGION, 2011/12–2020/21US productions represent the largest proportion of international PDV work undertaken by Australian businesses on feature, TV and online drama projects, accounting for 82% of titles and 91% of expenditure since 2011/12. PDV services to Asian productions represent 8% of titles but only around 4% of total spend.
PDV SERVICES: ABOUT THE PDV DATACompanies identified by Screen Australia as providing PDV services to feature film, TV and online drama projects report income earned on individual projects to Screen Australia through an online survey, with data aggregated for publication. Total PDV expenditure is determined by adding foreign PDV-only income to PDV expenditure for domestic and foreign shoot titles. To allow for easier referencing in this report, income from PDV-only projects has been referred to as expenditure.PDV is defined as a set of activities rather than a stage in the production process (see ‘Key terms’ on page 5). To provide a sense of the ongoing business activity of PDV companies in a given financial year (rather than according to an annual slate of productions or titles), expenditure has been assigned to the year it was spent rather than allocated to the start of the shoot or PDV work in Australia. As a result, the figures in this section may include projects that commenced shooting or PDV work in previous financial years and cannot be compared with figures in previous sections of the report, which are based on principal photography or PDV start date.PDV expenditure figures include predicted spend on titles still undertaking work and are therefore subject to revision in subsequent years as final figures are made available. This data relates only to feature film, TV and online drama titles, and therefore does not cover all PDV activity in Australia. The most recent data from the Australian Bureau of Statistics indicates that Australian companies received income of $428.4 million in 2015/16 from the provision of PDV services across all audiovisual production, with 58% accounted for by feature films and TV drama. Other areas of PDV activity include commercials and other TV productions.
Spend by region ($m)
No. titles % of titles % of expenditure1
US 193 82% 91%
Asia 19 8% 4%
US/Other 13 6% 4%
Other 10 4% 1%
Total 235 100% 100%
Notes 1Expenditure has been apportioned across the year or years in which it was spent.
82% 91%
100
80
60
40
20
0
Titles by region Expenditure by region
US Asia US/Other Other
4%4% 1%
8%
6% 4%
82% 91%
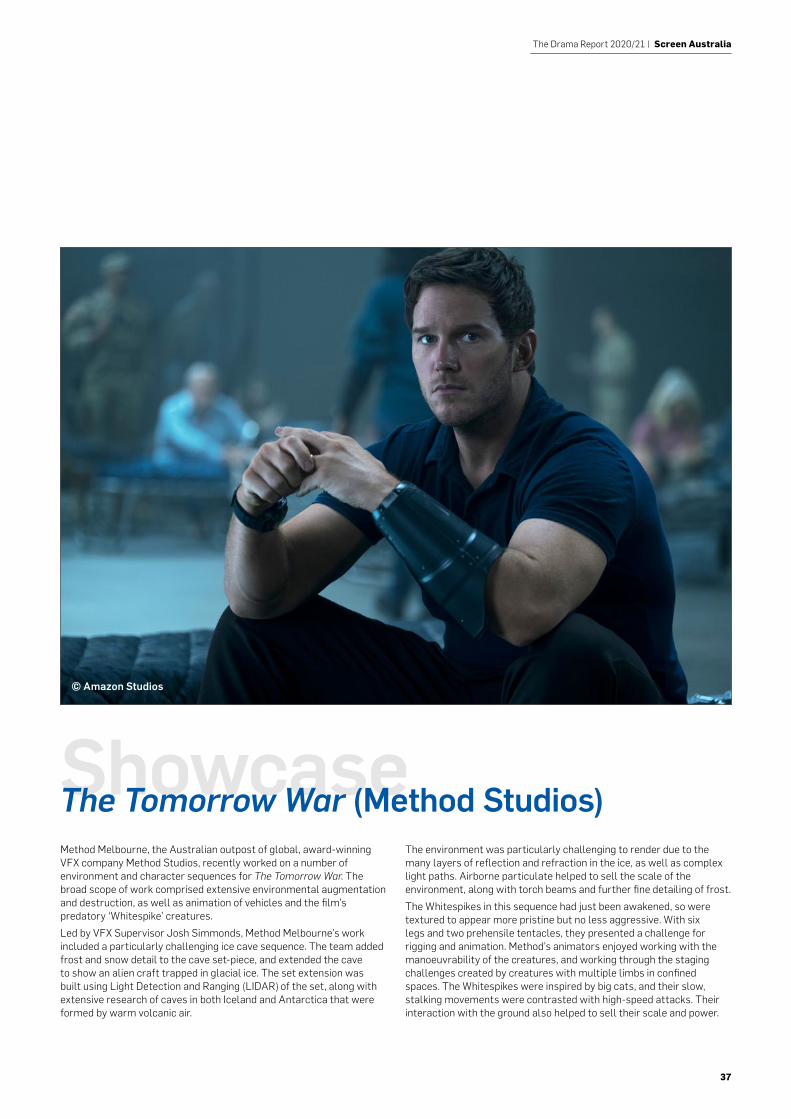
37
The Drama Report 2020/21 | Screen Australia
Method Melbourne, the Australian outpost of global, award-winning VFX company Method Studios, recently worked on a number of environment and character sequences for The Tomorrow War. The broad scope of work comprised extensive environmental augmentation and destruction, as well as animation of vehicles and the film’s predatory ‘Whitespike’ creatures.Led by VFX Supervisor Josh Simmonds, Method Melbourne’s work included a particularly challenging ice cave sequence. The team added frost and snow detail to the cave set-piece, and extended the cave to show an alien craft trapped in glacial ice. The set extension was built using Light Detection and Ranging (LIDAR) of the set, along with extensive research of caves in both Iceland and Antarctica that were formed by warm volcanic air.
The environment was particularly challenging to render due to the many layers of reflection and refraction in the ice, as well as complex light paths. Airborne particulate helped to sell the scale of the environment, along with torch beams and further fine detailing of frost.The Whitespikes in this sequence had just been awakened, so were textured to appear more pristine but no less aggressive. With six legs and two prehensile tentacles, they presented a challenge for rigging and animation. Method’s animators enjoyed working with the manoeuvrability of the creatures, and working through the staging challenges created by creatures with multiple limbs in confined spaces. The Whitespikes were inspired by big cats, and their slow, stalking movements were contrasted with high-speed attacks. Their interaction with the ground also helped to sell their scale and power.
ShowcaseThe Tomorrow War (Method Studios)
© Amazon Studios
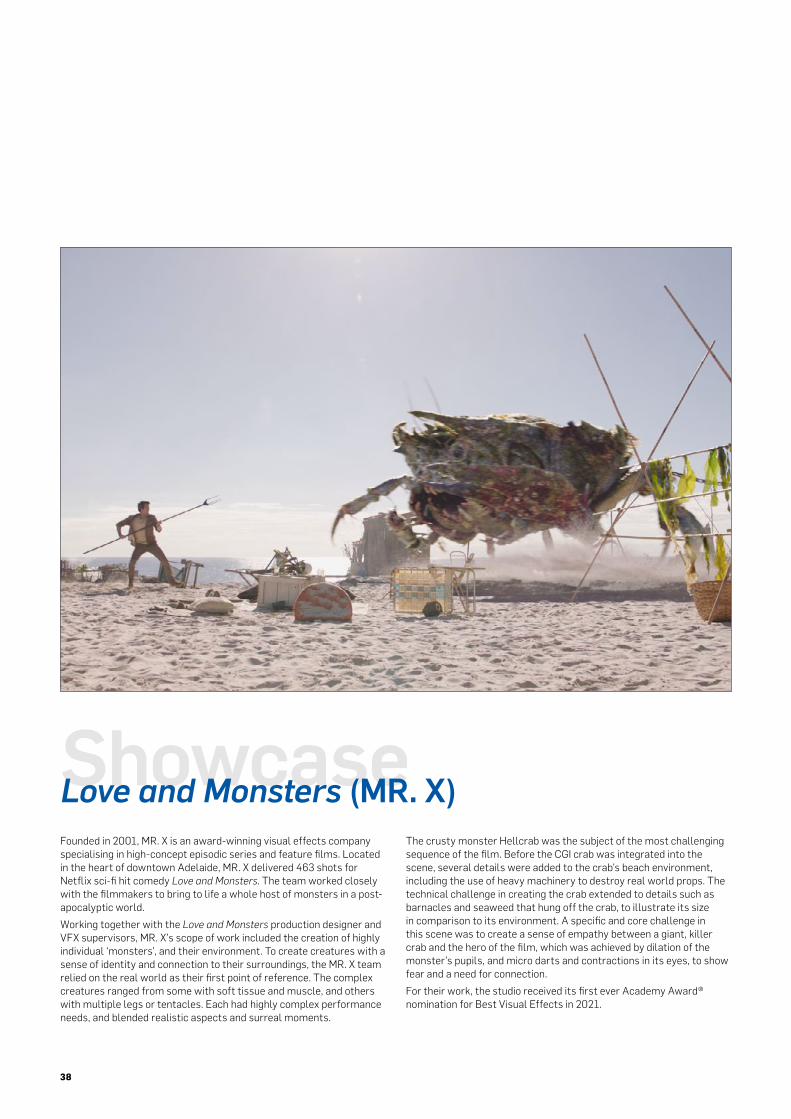
38
Founded in 2001, MR. X is an award-winning visual effects company specialising in high-concept episodic series and feature films. Located in the heart of downtown Adelaide, MR. X delivered 463 shots for Netflix sci-fi hit comedy Love and Monsters. The team worked closely with the filmmakers to bring to life a whole host of monsters in a post-apocalyptic world.Working together with the Love and Monsters production designer and VFX supervisors, MR. X’s scope of work included the creation of highly individual ‘monsters’, and their environment. To create creatures with a sense of identity and connection to their surroundings, the MR. X team relied on the real world as their first point of reference. The complex creatures ranged from some with soft tissue and muscle, and others with multiple legs or tentacles. Each had highly complex performance needs, and blended realistic aspects and surreal moments.
ShowcaseLove and Monsters (MR. X)The crusty monster Hellcrab was the subject of the most challenging sequence of the film. Before the CGI crab was integrated into the scene, several details were added to the crab’s beach environment, including the use of heavy machinery to destroy real world props. The technical challenge in creating the crab extended to details such as barnacles and seaweed that hung off the crab, to illustrate its size in comparison to its environment. A specific and core challenge in this scene was to create a sense of empathy between a giant, killer crab and the hero of the film, which was achieved by dilation of the monster’s pupils, and micro darts and contractions in its eyes, to show fear and a need for connection.For their work, the studio received its first ever Academy Award® nomination for Best Visual Effects in 2021.
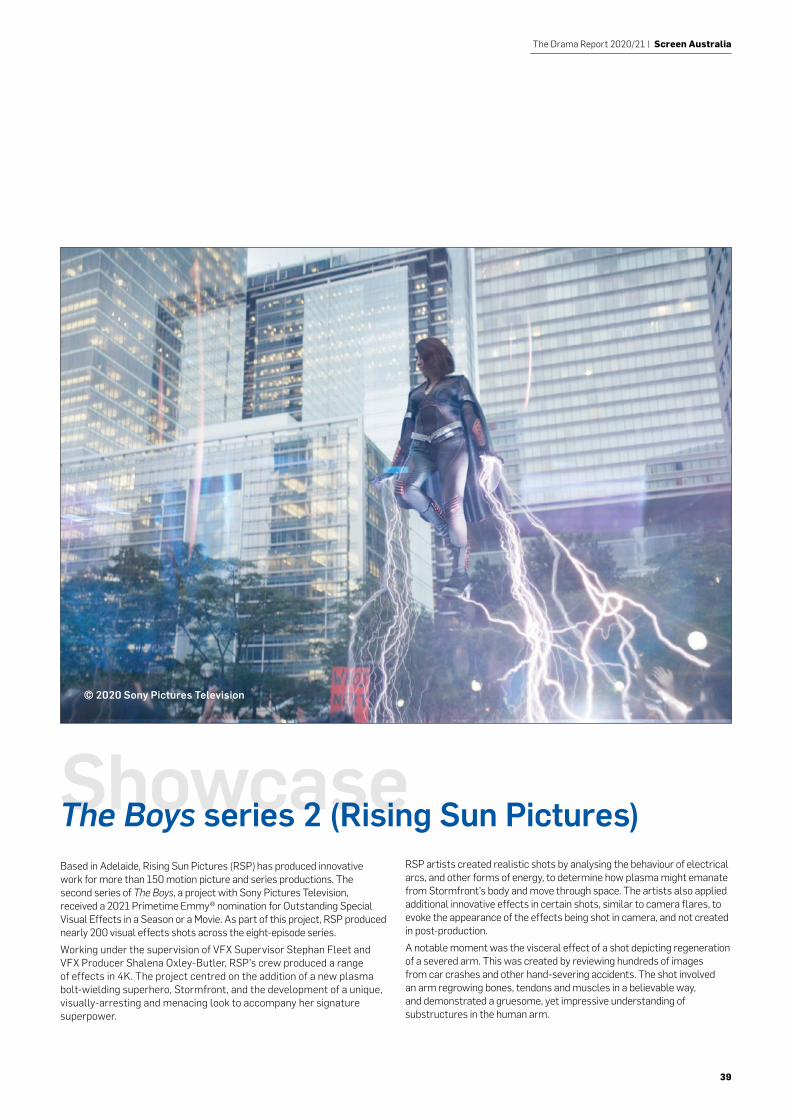
39
The Drama Report 2020/21 | Screen Australia
Based in Adelaide, Rising Sun Pictures (RSP) has produced innovative work for more than 150 motion picture and series productions. The second series of The Boys, a project with Sony Pictures Television, received a 2021 Primetime Emmy® nomination for Outstanding Special Visual Effects in a Season or a Movie. As part of this project, RSP produced nearly 200 visual effects shots across the eight-episode series. Working under the supervision of VFX Supervisor Stephan Fleet and VFX Producer Shalena Oxley-Butler, RSP’s crew produced a range of effects in 4K. The project centred on the addition of a new plasma bolt-wielding superhero, Stormfront, and the development of a unique, visually-arresting and menacing look to accompany her signature superpower.
ShowcaseThe Boys series 2 (Rising Sun Pictures)RSP artists created realistic shots by analysing the behaviour of electrical arcs, and other forms of energy, to determine how plasma might emanate from Stormfront’s body and move through space. The artists also applied additional innovative effects in certain shots, similar to camera flares, to evoke the appearance of the effects being shot in camera, and not created in post-production.A notable moment was the visceral effect of a shot depicting regeneration of a severed arm. This was created by reviewing hundreds of images from car crashes and other hand-severing accidents. The shot involved an arm regrowing bones, tendons and muscles in a believable way, and demonstrated a gruesome, yet impressive understanding of substructures in the human arm.
© 2020 Sony Pictures Television
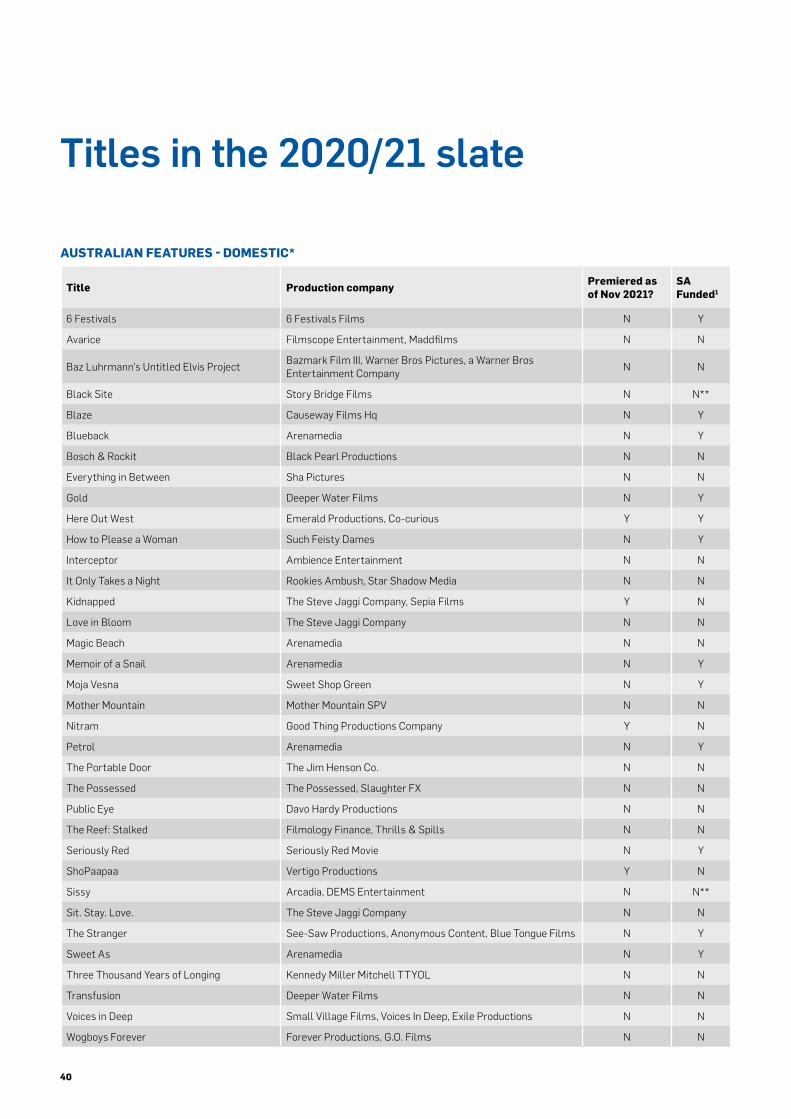
40
Titles in the 2020/21 slate
AUSTRALIAN FEATURES - DOMESTIC*
Title Production company Premiered as of Nov 2021?
SA Funded1
6 Festivals 6 Festivals Films N Y
Avarice Filmscope Entertainment, Maddfilms N N
Baz Luhrmann's Untitled Elvis Project Bazmark Film III, Warner Bros Pictures, a Warner Bros Entertainment Company N N
Black Site Story Bridge Films N N**
Blaze Causeway Films Hq N Y
Blueback Arenamedia N Y
Bosch & Rockit Black Pearl Productions N N
Everything in Between Sha Pictures N N
Gold Deeper Water Films N Y
Here Out West Emerald Productions, Co-curious Y Y
How to Please a Woman Such Feisty Dames N Y
Interceptor Ambience Entertainment N N
It Only Takes a Night Rookies Ambush, Star Shadow Media N N
Kidnapped The Steve Jaggi Company, Sepia Films Y N
Love in Bloom The Steve Jaggi Company N N
Magic Beach Arenamedia N N
Memoir of a Snail Arenamedia N Y
Moja Vesna Sweet Shop Green N Y
Mother Mountain Mother Mountain SPV N N
Nitram Good Thing Productions Company Y N
Petrol Arenamedia N Y
The Portable Door The Jim Henson Co. N N
The Possessed The Possessed, Slaughter FX N N
Public Eye Davo Hardy Productions N N
The Reef: Stalked Filmology Finance, Thrills & Spills N N
Seriously Red Seriously Red Movie N Y
ShoPaapaa Vertigo Productions Y N
Sissy Arcadia, DEMS Entertainment N N**
Sit. Stay. Love. The Steve Jaggi Company N N
The Stranger See-Saw Productions, Anonymous Content, Blue Tongue Films N Y
Sweet As Arenamedia N Y
Three Thousand Years of Longing Kennedy Miller Mitchell TTYOL N N
Transfusion Deeper Water Films N N
Voices in Deep Small Village Films, Voices In Deep, Exile Productions N N
Wogboys Forever Forever Productions, G.O. Films N N
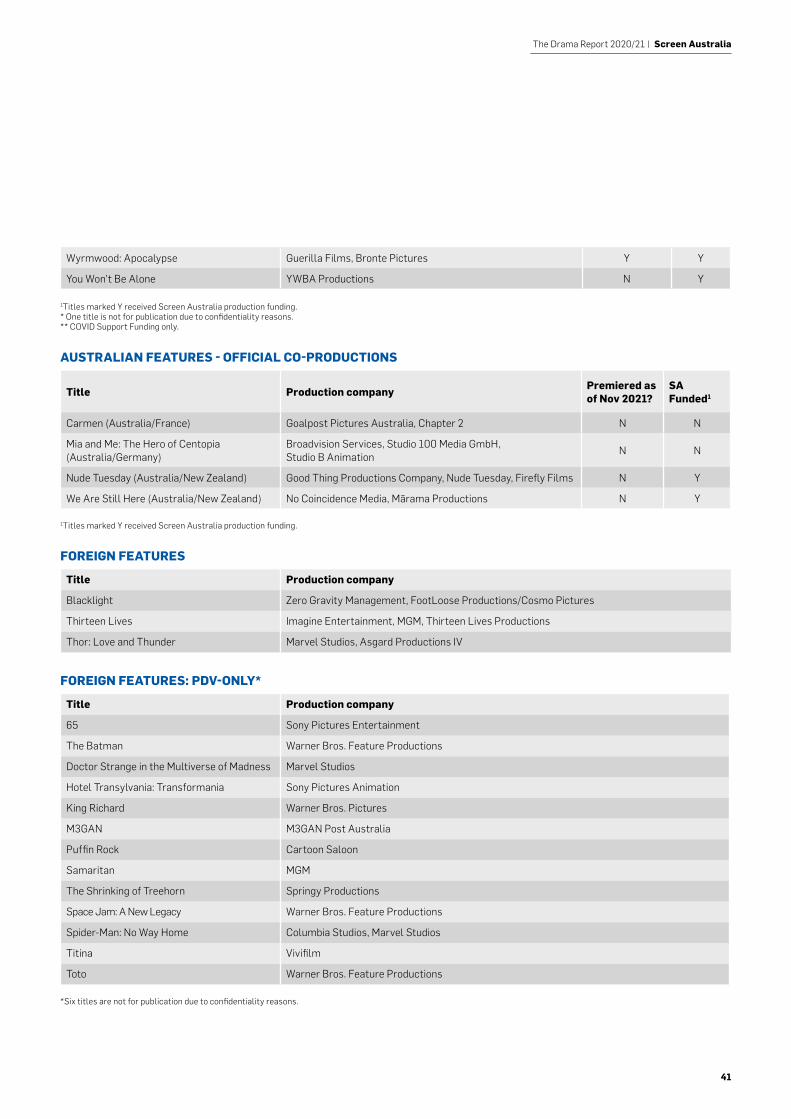
41
The Drama Report 2020/21 | Screen Australia
FOREIGN FEATURES: PDV-ONLY*
Title Production company
65 Sony Pictures Entertainment
The Batman Warner Bros. Feature Productions
Doctor Strange in the Multiverse of Madness Marvel Studios
Hotel Transylvania: Transformania Sony Pictures Animation
King Richard Warner Bros. Pictures
M3GAN M3GAN Post Australia
Puffin Rock Cartoon Saloon
Samaritan MGM
The Shrinking of Treehorn Springy Productions
Space Jam: A New Legacy Warner Bros. Feature Productions
Spider-Man: No Way Home Columbia Studios, Marvel Studios
Titina Vivifilm
Toto Warner Bros. Feature Productions
AUSTRALIAN FEATURES - OFFICIAL CO-PRODUCTIONS
Title Production company Premiered as of Nov 2021?
SA Funded1
Carmen (Australia/France) Goalpost Pictures Australia, Chapter 2 N N
Mia and Me: The Hero of Centopia (Australia/Germany)
Broadvision Services, Studio 100 Media GmbH, Studio B Animation N N
Nude Tuesday (Australia/New Zealand) Good Thing Productions Company, Nude Tuesday, Firefly Films N Y
We Are Still Here (Australia/New Zealand) No Coincidence Media, Mãrama Productions N Y
FOREIGN FEATURES
Title Production company
Blacklight Zero Gravity Management, FootLoose Productions/Cosmo Pictures
Thirteen Lives Imagine Entertainment, MGM, Thirteen Lives Productions
Thor: Love and Thunder Marvel Studios, Asgard Productions IV
1Titles marked Y received Screen Australia production funding.
*Six titles are not for publication due to confidentiality reasons.
Wyrmwood: Apocalypse Guerilla Films, Bronte Pictures Y Y
You Won't Be Alone YWBA Productions N Y
1Titles marked Y received Screen Australia production funding. * One title is not for publication due to confidentiality reasons. ** COVID Support Funding only.
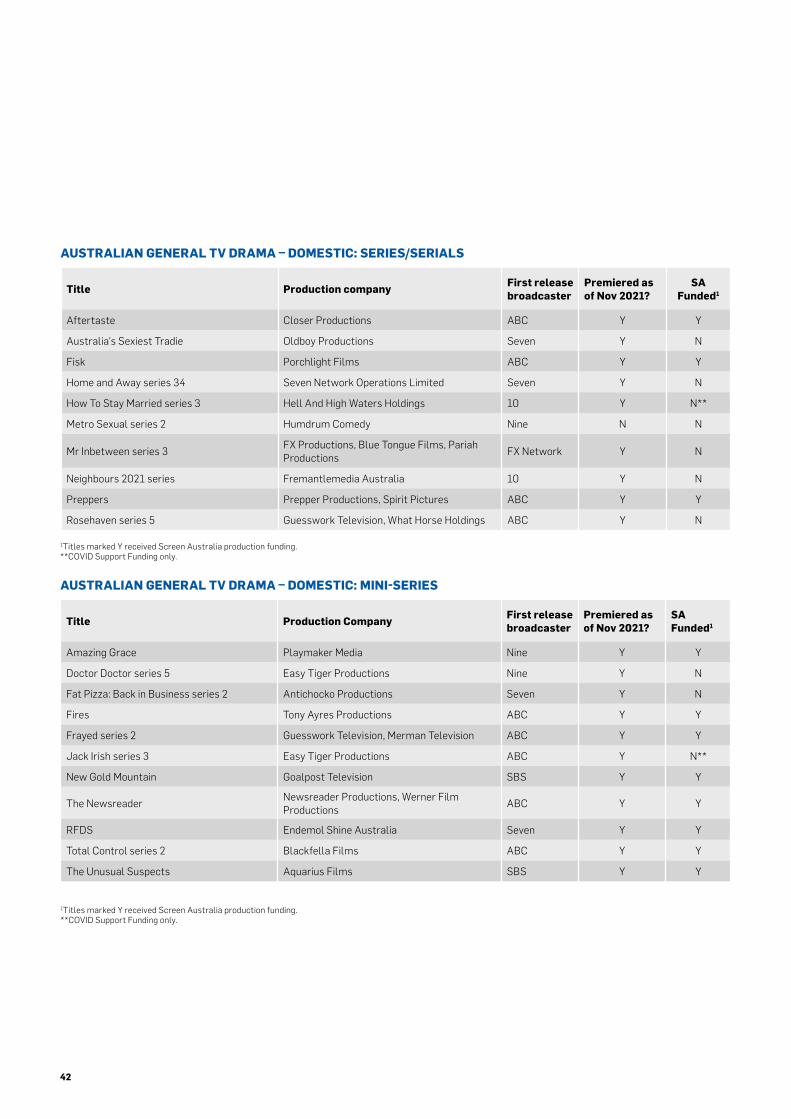
42
AUSTRALIAN GENERAL TV DRAMA – DOMESTIC: SERIES/SERIALS
Title Production company First release broadcaster
Premiered as of Nov 2021?
SA Funded1
Aftertaste Closer Productions ABC Y Y
Australia's Sexiest Tradie Oldboy Productions Seven Y N
Fisk Porchlight Films ABC Y Y
Home and Away series 34 Seven Network Operations Limited Seven Y N
How To Stay Married series 3 Hell And High Waters Holdings 10 Y N**
Metro Sexual series 2 Humdrum Comedy Nine N N
Mr Inbetween series 3 FX Productions, Blue Tongue Films, Pariah Productions FX Network Y N
Neighbours 2021 series Fremantlemedia Australia 10 Y N
Preppers Prepper Productions, Spirit Pictures ABC Y Y
Rosehaven series 5 Guesswork Television, What Horse Holdings ABC Y N
AUSTRALIAN GENERAL TV DRAMA – DOMESTIC: MINI-SERIES
Title Production Company First release broadcaster
Premiered as of Nov 2021?
SA Funded1
Amazing Grace Playmaker Media Nine Y Y
Doctor Doctor series 5 Easy Tiger Productions Nine Y N
Fat Pizza: Back in Business series 2 Antichocko Productions Seven Y N
Fires Tony Ayres Productions ABC Y Y
Frayed series 2 Guesswork Television, Merman Television ABC Y Y
Jack Irish series 3 Easy Tiger Productions ABC Y N**
New Gold Mountain Goalpost Television SBS Y Y
The Newsreader Newsreader Productions, Werner Film Productions ABC Y Y
RFDS Endemol Shine Australia Seven Y Y
Total Control series 2 Blackfella Films ABC Y Y
The Unusual Suspects Aquarius Films SBS Y Y
1Titles marked Y received Screen Australia production funding. **COVID Support Funding only.
1Titles marked Y received Screen Australia production funding. **COVID Support Funding only.
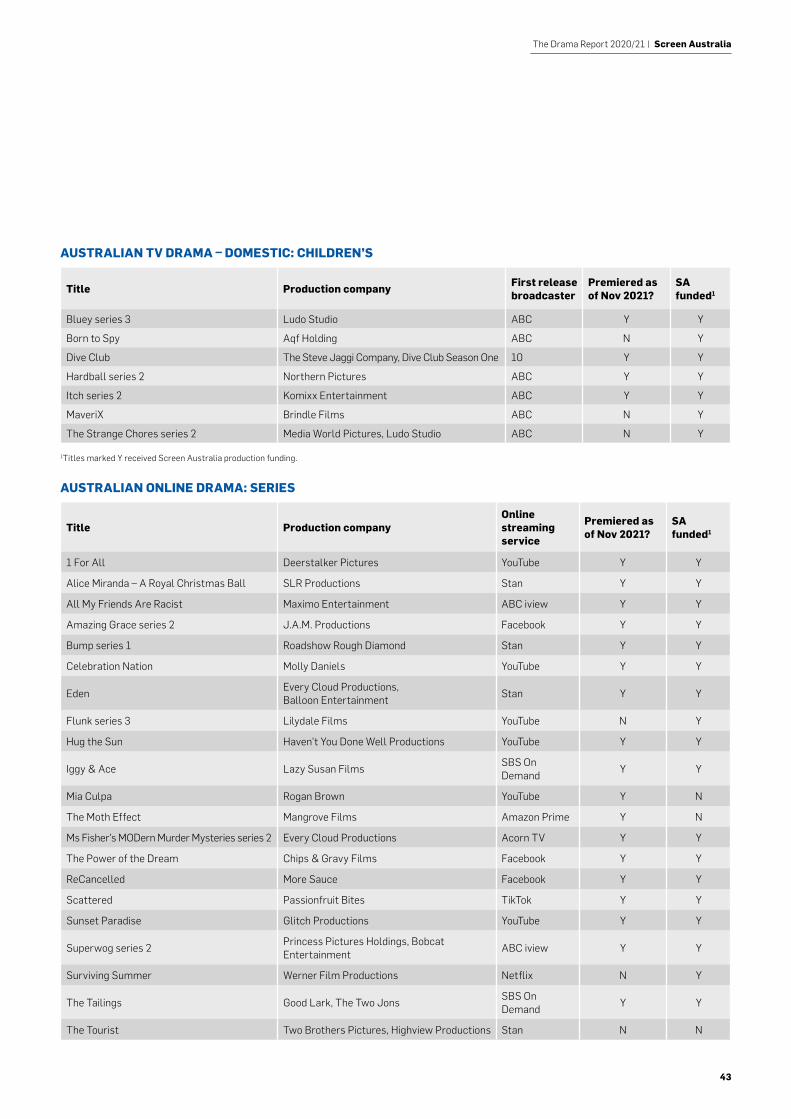
43
The Drama Report 2020/21 | Screen Australia
AUSTRALIAN ONLINE DRAMA: SERIES
Title Production companyOnline streaming service
Premiered as of Nov 2021?
SA funded1
1 For All Deerstalker Pictures YouTube Y Y
Alice Miranda – A Royal Christmas Ball SLR Productions Stan Y Y
All My Friends Are Racist Maximo Entertainment ABC iview Y Y
Amazing Grace series 2 J.A.M. Productions Facebook Y Y
Bump series 1 Roadshow Rough Diamond Stan Y Y
Celebration Nation Molly Daniels YouTube Y Y
Eden Every Cloud Productions, Balloon Entertainment Stan Y Y
Flunk series 3 Lilydale Films YouTube N Y
Hug the Sun Haven’t You Done Well Productions YouTube Y Y
Iggy & Ace Lazy Susan Films SBS On Demand Y Y
Mia Culpa Rogan Brown YouTube Y N
The Moth Effect Mangrove Films Amazon Prime Y N
Ms Fisher's MODern Murder Mysteries series 2 Every Cloud Productions Acorn TV Y Y
The Power of the Dream Chips & Gravy Films Facebook Y Y
ReCancelled More Sauce Facebook Y Y
Scattered Passionfruit Bites TikTok Y Y
Sunset Paradise Glitch Productions YouTube Y Y
Superwog series 2 Princess Pictures Holdings, Bobcat Entertainment ABC iview Y Y
Surviving Summer Werner Film Productions Netflix N Y
The Tailings Good Lark, The Two Jons SBS On Demand Y Y
The Tourist Two Brothers Pictures, Highview Productions Stan N N
AUSTRALIAN TV DRAMA – DOMESTIC: CHILDREN’S
Title Production company First release broadcaster
Premiered as of Nov 2021?
SA funded1
Bluey series 3 Ludo Studio ABC Y Y
Born to Spy Aqf Holding ABC N Y
Dive Club The Steve Jaggi Company, Dive Club Season One 10 Y Y
Hardball series 2 Northern Pictures ABC Y Y
Itch series 2 Komixx Entertainment ABC Y Y
MaveriX Brindle Films ABC N Y
The Strange Chores series 2 Media World Pictures, Ludo Studio ABC N Y
1Titles marked Y received Screen Australia production funding.
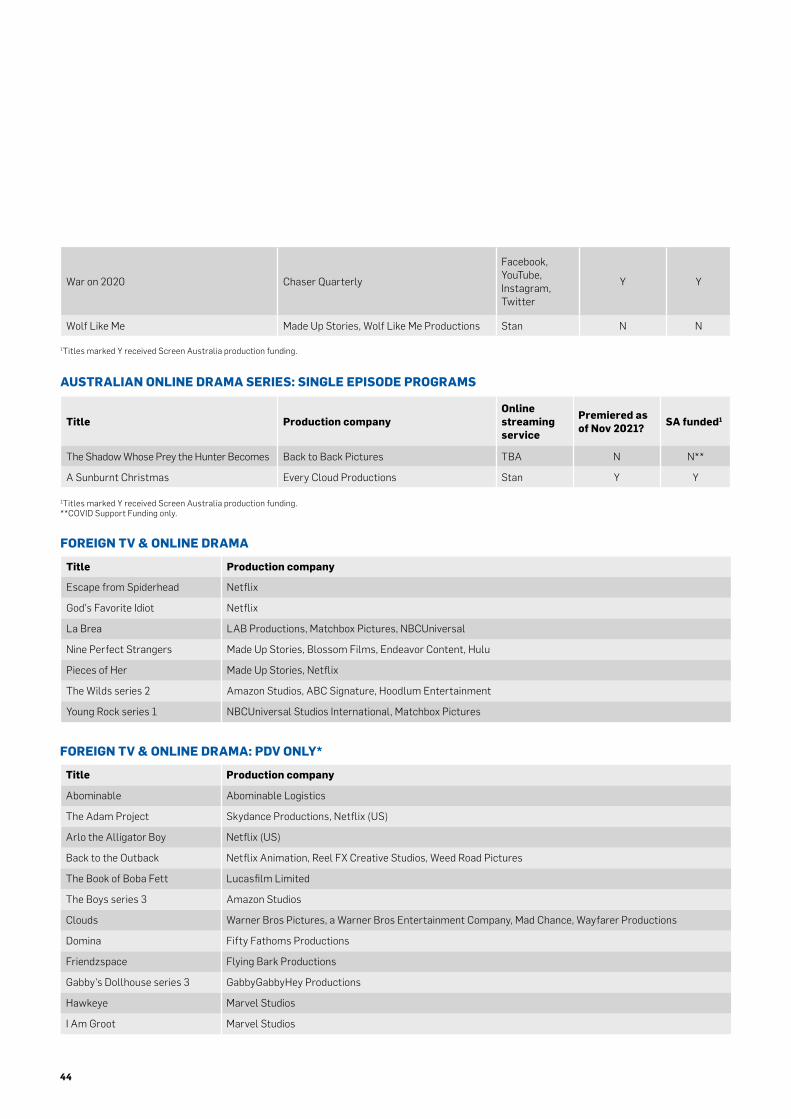
44
AUSTRALIAN ONLINE DRAMA SERIES: SINGLE EPISODE PROGRAMS
Title Production companyOnline streaming service
Premiered as of Nov 2021? SA funded1
The Shadow Whose Prey the Hunter Becomes Back to Back Pictures TBA N N**
A Sunburnt Christmas Every Cloud Productions Stan Y Y
FOREIGN TV & ONLINE DRAMA
Title Production company
Escape from Spiderhead Netflix
God's Favorite Idiot Netflix
La Brea LAB Productions, Matchbox Pictures, NBCUniversal
Nine Perfect Strangers Made Up Stories, Blossom Films, Endeavor Content, Hulu
Pieces of Her Made Up Stories, Netflix
The Wilds series 2 Amazon Studios, ABC Signature, Hoodlum Entertainment
Young Rock series 1 NBCUniversal Studios International, Matchbox Pictures
War on 2020 Chaser Quarterly
Facebook, YouTube, Instagram, Twitter
Y Y
Wolf Like Me Made Up Stories, Wolf Like Me Productions Stan N N
1Titles marked Y received Screen Australia production funding.
1Titles marked Y received Screen Australia production funding. **COVID Support Funding only.
FOREIGN TV & ONLINE DRAMA: PDV ONLY*
Title Production company
Abominable Abominable Logistics
The Adam Project Skydance Productions, Netflix (US)
Arlo the Alligator Boy Netflix (US)
Back to the Outback Netflix Animation, Reel FX Creative Studios, Weed Road Pictures
The Book of Boba Fett Lucasfilm Limited
The Boys series 3 Amazon Studios
Clouds Warner Bros Pictures, a Warner Bros Entertainment Company, Mad Chance, Wayfarer Productions
Domina Fifty Fathoms Productions
Friendzspace Flying Bark Productions
Gabby's Dollhouse series 3 GabbyGabbyHey Productions
Hawkeye Marvel Studios
I Am Groot Marvel Studios
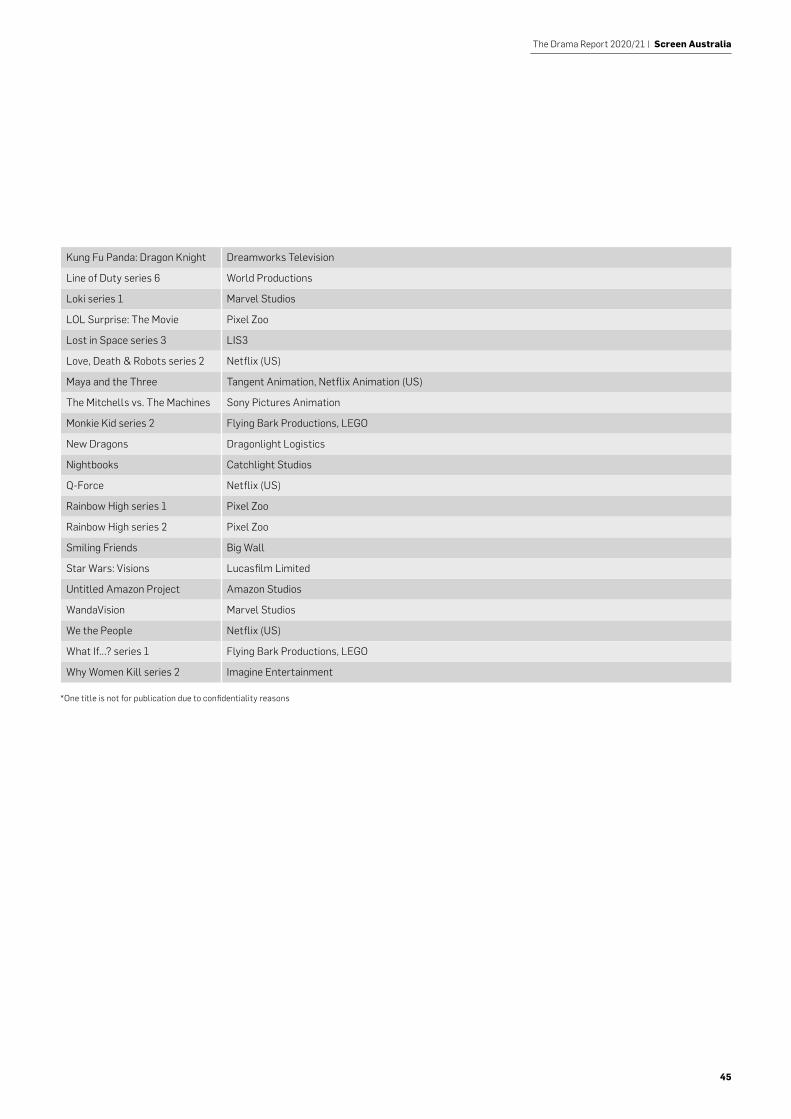
45
The Drama Report 2020/21 | Screen Australia
*One title is not for publication due to confidentiality reasons
Kung Fu Panda: Dragon Knight Dreamworks Television
Line of Duty series 6 World Productions
Loki series 1 Marvel Studios
LOL Surprise: The Movie Pixel Zoo
Lost in Space series 3 LIS3
Love, Death & Robots series 2 Netflix (US)
Maya and the Three Tangent Animation, Netflix Animation (US)
The Mitchells vs. The Machines Sony Pictures Animation
Monkie Kid series 2 Flying Bark Productions, LEGO
New Dragons Dragonlight Logistics
Nightbooks Catchlight Studios
Q-Force Netflix (US)
Rainbow High series 1 Pixel Zoo
Rainbow High series 2 Pixel Zoo
Smiling Friends Big Wall
Star Wars: Visions Lucasfilm Limited
Untitled Amazon Project Amazon Studios
WandaVision Marvel Studios
We the People Netflix (US)
What If…? series 1 Flying Bark Productions, LEGO
Why Women Kill series 2 Imagine Entertainment
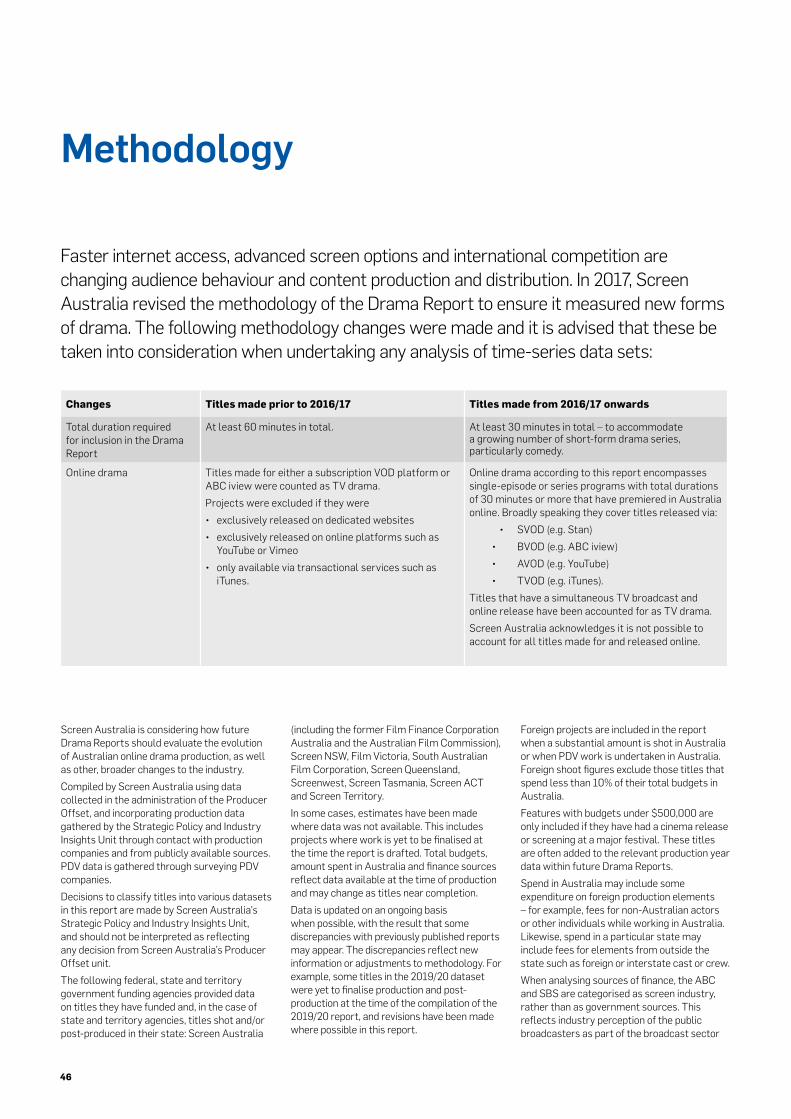
46
Changes Titles made prior to 2016/17 Titles made from 2016/17 onwards
Total duration required for inclusion in the Drama Report
At least 60 minutes in total. At least 30 minutes in total – to accommodate a growing number of short-form drama series, particularly comedy.
Online drama Titles made for either a subscription VOD platform or ABC iview were counted as TV drama.Projects were excluded if they were • exclusively released on dedicated websites • exclusively released on online platforms such as
YouTube or Vimeo • only available via transactional services such as
iTunes.
Online drama according to this report encompasses single-episode or series programs with total durations of 30 minutes or more that have premiered in Australia online. Broadly speaking they cover titles released via:
• SVOD (e.g. Stan) • BVOD (e.g. ABC iview) • AVOD (e.g. YouTube) • TVOD (e.g. iTunes).
Titles that have a simultaneous TV broadcast and online release have been accounted for as TV drama.Screen Australia acknowledges it is not possible to account for all titles made for and released online.
Methodology
Faster internet access, advanced screen options and international competition are changing audience behaviour and content production and distribution. In 2017, Screen Australia revised the methodology of the Drama Report to ensure it measured new forms of drama. The following methodology changes were made and it is advised that these be taken into consideration when undertaking any analysis of time-series data sets:
Screen Australia is considering how future Drama Reports should evaluate the evolution of Australian online drama production, as well as other, broader changes to the industry.Compiled by Screen Australia using data collected in the administration of the Producer Offset, and incorporating production data gathered by the Strategic Policy and Industry Insights Unit through contact with production companies and from publicly available sources. PDV data is gathered through surveying PDV companies.Decisions to classify titles into various datasets in this report are made by Screen Australia’s Strategic Policy and Industry Insights Unit, and should not be interpreted as reflecting any decision from Screen Australia’s Producer Offset unit. The following federal, state and territory government funding agencies provided data on titles they have funded and, in the case of state and territory agencies, titles shot and/or post-produced in their state: Screen Australia
(including the former Film Finance Corporation Australia and the Australian Film Commission), Screen NSW, Film Victoria, South Australian Film Corporation, Screen Queensland, Screenwest, Screen Tasmania, Screen ACT and Screen Territory.In some cases, estimates have been made where data was not available. This includes projects where work is yet to be finalised at the time the report is drafted. Total budgets, amount spent in Australia and finance sources reflect data available at the time of production and may change as titles near completion.Data is updated on an ongoing basis when possible, with the result that some discrepancies with previously published reports may appear. The discrepancies reflect new information or adjustments to methodology. For example, some titles in the 2019/20 dataset were yet to finalise production and post-production at the time of the compilation of the 2019/20 report, and revisions have been made where possible in this report.
Foreign projects are included in the report when a substantial amount is shot in Australia or when PDV work is undertaken in Australia. Foreign shoot figures exclude those titles that spend less than 10% of their total budgets in Australia.Features with budgets under $500,000 are only included if they have had a cinema release or screening at a major festival. These titles are often added to the relevant production year data within future Drama Reports.Spend in Australia may include some expenditure on foreign production elements – for example, fees for non-Australian actors or other individuals while working in Australia. Likewise, spend in a particular state may include fees for elements from outside the state such as foreign or interstate cast or crew. When analysing sources of finance, the ABC and SBS are categorised as screen industry, rather than as government sources. This reflects industry perception of the public broadcasters as part of the broadcast sector
47
The Drama Report 2020/21 | Screen Australia
rather than government screen agencies. In addition to the federal, state and territory screen agencies, government sources may include direct finance from other government agencies and departments, including the Australian Children’s Television Foundation and the Adelaide and Melbourne Film Festival Funds. Funding figures from government agencies may not correlate with the figures in this report because this report includes projects according to the start date of principal photography rather than contract dates. Data in this report regarding contributions to drama by content platforms may not correlate with expenditure reported by the ACMA in the Program Expenditure Information (PEI), Subscription TV’s New Eligible Drama Expenditure or Spending by Subscription Video On Demand Providers reports. This report analyses finance sources in place at the start of production. The PEI reports expenditure by the commercial free-to-air broadcasters on screened programs during the year, and includes amortisation costs for programs purchased in previous years and programs purchased after completion. For subscription TV, the ACMA reports annual expenditure by drama channels on ‘eligible Australian drama’, including licence fees, production expenses and limited pre-production costs. Expenditure on features may be apportioned across financial years. Data on spend by SVOD providers reports expenditure in a given financial year, including on acquisitions of older content, and also can include spend on non-drama programs such as documentaries, light entertainment and reality television. ACMA data can include expenditure on New Zealand programs. Sketch comedy programs are included in line with ACMA’s definition of TV drama under the Australian Content and Children’s Television Standards. In categorising titles as either mini-series or series, Screen Australia has followed the definitions set out in Division 10BA of the Income Tax Assessment Act 1936. Series of, or related, telemovies are counted as individual titles, as set out in a broadcaster’s licence agreement. Figures may not total exactly due to rounding.Release strategies for titles reflect information available to Screen Australia at the time of publication. Feature film premiere information in title lists includes festival releases.Screen Australia funded titles reflect information as at November 2021. Hardball series 2

48