Embed Size (px)
Citation preview

Trp42 rotamers report reduced flexibility when theinhibitor acetyl-pepstatin is bound to HIV-1 protease
BEÁTA ULLRICH,1 MONIQUE LABERGE,1 FERENC TÖLGYESI,1 ZOLTÁN SZELTNER,2
LÁSZLÓ POLGÁR,2 and JUDIT FIDY1
1Institute of Biophysics and Radiation Biology, Semmelweis University, P.O.B. 263 H-1444 Budapest, Hungary2Institute of Enzymology, Biological Research Centre, Hungarian Academy of Sciences, P.O.B. 7, H-1518 Budapest, Hungary
~Received January 25, 2000;Final Revision August 15, 2000;Accepted August 24, 2000!
Abstract
The Q7K0L33I0L63I HIV-1 protease mutant was expressed inEscherichia coliand the effect of binding a substrate-analog inhibitor, acetyl-pepstatin, was investigated by fluorescence spectroscopy and molecular dynamics. The dimericenzyme has four intrinsic tryptophans, located at positions 6 and 42 in each monomer. Fluorescence spectra andacrylamide quenching experiments show two differently accessible Trp populations in the apoenzyme withkq1 5 6.853109 M21 s21 andkq2 5 1.883 109 M21 s21, that merge into one in the complex withkq 5 1.783 109 M21 s21.
500 ps trajectory analysis of Trpx10x2 rotameric interconversions suggest a model to account for the observed Trpfluorescence. In the simulations, Trp60Trp6B rotameric interconversions do not occur on this timescale for both HIVforms. In the apoenzyme simulations, however, both Trp42s and Trp42Bs are flipping betweenx10x2 states; in thecomplexed form, no such interconverions occur. A detailed investigation of the local Trp environments sampled duringthe molecular dynamics simulation suggests that one of the apoenzyme Trp42B rotameric interconversions would allowindole-quencher contact, such as with nearby Tyr59. This could account for the short lifetime component. The modelthus interprets the experimental data on the basis of the conformational fluctuations of Trp42s alone. It suggests that therotameric interconversions of these Trps, located relatively far from the active site and at the very start of the flap region,becomes restrained when the apoenzyme binds the inhibitor. The model is thus consistent with associating componentsof the fluorescence decay in HIV-1 protease to ground state conformational heterogeneity.
Keywords: 500 ps molecular dynamics; acrylamide quenching; dihedral trajectories; dynamics influenced by inhibitor;ground state heterogeneity; Trp fluorescence; Trp rotamers
HIV-1 protease the homodimeric aspartyl-protease encoded in theviral genome of the HIV-1 virus is essential for the proper matu-ration of the virus. It cleaves the polyprotein products of thegagand pol viral genes~Kohl et al., 1988!, making the release ofenzyme proteins including the protease itself possible~Seelmeieret al., 1988!. Inactivation of the enzyme by mutation or chemicalinhibition causes the production of immature, noninfectious viralparticles~Seelmeier et al., 1988!. Use of the enzyme was proposedas a target in anti-AIDS drug design, and thus the effect of bindingvarious inhibitors on protease structure and activity is currently thefocus of intensive research~Fitzgerald et al., 1990; Wlodawer &Erickson, 1993; Pargellis et al., 1994; Polgár et al., 1994; Yamazakiet al., 1994; Nicholson et al., 1995; Wlodawer & Vondrasek, 1998;Trylska et al., 1999!. Four such inhibitors, i.e., saquinavir, indi-navir, ritonavir, and nelfinavir, were recently introduced to clinicalapplications~Flexner, 1998!, as a result of structure assisted drug
design~Wlodawer & Vondrasek, 1998!. While a great amount ofeffort has been invested toward practical applications~e.g., deter-mination of inhibitor binding constants, description of the activesite triad!, little has been contributed to the detailed understandingof the structural consequences of inhibitor binding at the level ofthe whole protein molecule. To obtain information about the struc-ture of the enzyme in solution, NMR spectroscopy has been usedfor several years, but no results have been published about theapoenzyme itself, the studies being limited to the protease complexwith various inhibitors~Yamazaki et al., 1994; Wang et al., 1996a,1996b!. The lack of comparative studies is probably due to the factthat the apoenzyme is known to undergo autoproteolysis~Roséet al., 1993; Mildner et al., 1994!. In the present study, we focusedour interest on complex formation with acetyl-pepstatin and usedthe Q7K0L33I0L63I HIV-1 mutant, known to be resistant to auto-proteolysis~Mildner et al., 1994!. Highly sensitive fluorescencespectroscopic methods allowed us to perform the studies in solu-tions of low concentration.
There are three available crystal structures for HIV-1 protease,determined at various resolutions: thea-carbon backbone structure
Reprint requests to: Judit Fidy, Institute of Biophysics and RadiationBiology, Semmelweis University, P.O.B. 263 H-1444 Budapest, Hungary;e-mail: [email protected].
Protein Science~2000!, 9:2232–2245. Cambridge University Press. Printed in the USA.Copyright © 2000 The Protein Society
2232
of the NY5 isolate at 3.0 Å~Navia et al., 1989!, the syntheticstructure replacing two cysteines by ABAs at 2.8 Å~Wlodaweret al., 1989!, and the 2.7 Å structure of the native protease~Lapattoet al., 1989!. The coordinates of several protease complexes withpeptide or nonpeptide inhibitors have also been deposited at theProtein Data Bank~PDB!, including the 2.0 Å resolution structureof HIV-1 complexed to acetyl-pepstatin~Fitzgerald et al., 1990!, aswell as that of the Q7K0L33I0L63I mutant complexed to theGlu-Asp-Leu tripeptide~2 Å, Louis et al., 1998!.
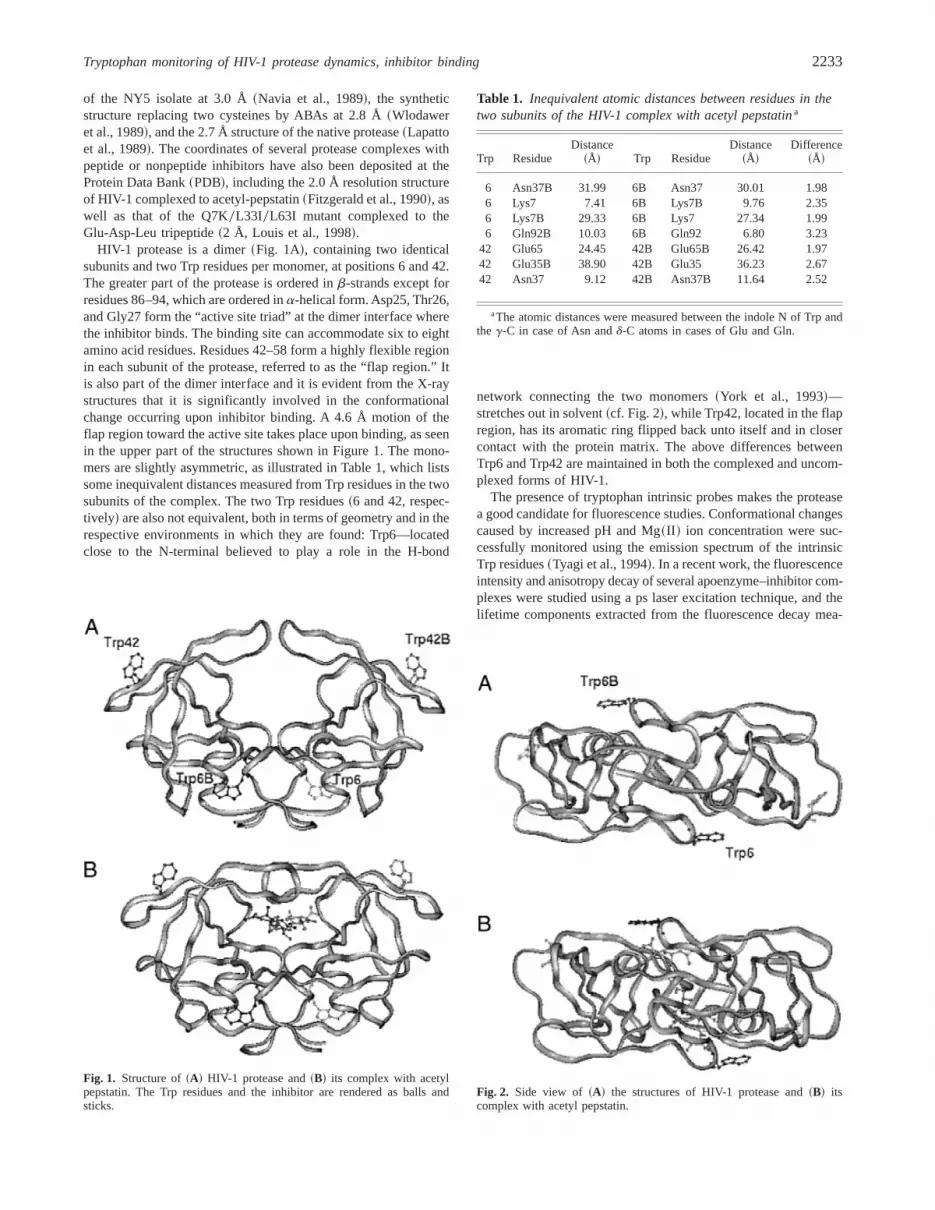
HIV-1 protease is a dimer~Fig. 1A!, containing two identicalsubunits and two Trp residues per monomer, at positions 6 and 42.The greater part of the protease is ordered inb-strands except forresidues 86–94, which are ordered ina-helical form. Asp25, Thr26,and Gly27 form the “active site triad” at the dimer interface wherethe inhibitor binds. The binding site can accommodate six to eightamino acid residues. Residues 42–58 form a highly flexible regionin each subunit of the protease, referred to as the “flap region.” Itis also part of the dimer interface and it is evident from the X-raystructures that it is significantly involved in the conformationalchange occurring upon inhibitor binding. A 4.6 Å motion of theflap region toward the active site takes place upon binding, as seenin the upper part of the structures shown in Figure 1. The mono-mers are slightly asymmetric, as illustrated in Table 1, which listssome inequivalent distances measured from Trp residues in the twosubunits of the complex. The two Trp residues~6 and 42, respec-tively! are also not equivalent, both in terms of geometry and in therespective environments in which they are found: Trp6—locatedclose to the N-terminal believed to play a role in the H-bond
network connecting the two monomers~York et al., 1993!—stretches out in solvent~cf. Fig. 2!, while Trp42, located in the flapregion, has its aromatic ring flipped back unto itself and in closercontact with the protein matrix. The above differences betweenTrp6 and Trp42 are maintained in both the complexed and uncom-plexed forms of HIV-1.
The presence of tryptophan intrinsic probes makes the proteasea good candidate for fluorescence studies. Conformational changescaused by increased pH and Mg~II ! ion concentration were suc-cessfully monitored using the emission spectrum of the intrinsicTrp residues~Tyagi et al., 1994!. In a recent work, the fluorescenceintensity and anisotropy decay of several apoenzyme–inhibitor com-plexes were studied using a ps laser excitation technique, and thelifetime components extracted from the fluorescence decay mea-
Fig. 1. Structure of~A! HIV-1 protease and~B! its complex with acetylpepstatin. The Trp residues and the inhibitor are rendered as balls andsticks.
Table 1. Inequivalent atomic distances between residues in thetwo subunits of the HIV-1 complex with acetyl pepstatina
Trp ResidueDistance
~Å! Trp ResidueDistance
~Å!Difference
~Å!
6 Asn37B 31.99 6B Asn37 30.01 1.986 Lys7 7.41 6B Lys7B 9.76 2.356 Lys7B 29.33 6B Lys7 27.34 1.996 Gln92B 10.03 6B Gln92 6.80 3.23
42 Glu65 24.45 42B Glu65B 26.42 1.9742 Glu35B 38.90 42B Glu35 36.23 2.6742 Asn37 9.12 42B Asn37B 11.64 2.52
aThe atomic distances were measured between the indole N of Trp andthe g-C in case of Asn andd-C atoms in cases of Glu and Gln.
Fig. 2. Side view of ~A! the structures of HIV-1 protease and~B! itscomplex with acetyl pepstatin.
Tryptophan monitoring of HIV-1 protease dynamics, inhibitor binding 2233

surements were identified based on simulations of the dynamicbehavior of the two types of Trp residues present in the structure~Kungl et al., 1998; Ringhofer et al., 1999!. The complex with theinhibitor acetyl-pepstatin has not been studied previously.
In this work, we compare the structure of the Q7K0L33I0L63Imutant HIV1-protease and its complex with acetyl-pepstatin. Wepresent models for the structure of the mutant apoenzyme obtainedfrom the three-dimensional~3D! structural data available for itscomplex with a small tripeptide inhibitor. We describe the dynamicbehavior of the Trp residues during the course of comparative500 ps molecular dynamics simulations~MDS! and propose amodel to interpret the ns-experimental fluorescence data on thebasis of Trp42B rotamer states exploring different local environ-ments. We compare their respective accessibility to potentialquencher groups and discuss the different local environments ofTrp6s and Trp42s.
Results
Fluorescence spectroscopy and excited state lifetime
The corrected and normalized fluorescence excitation and emis-sion spectra of the apoenzyme at room temperature are shown inFigure 3A. Complex formation does not influence the fluorescenceemission spectra significantly, thus it is not shown in the figure.Figure 3B shows the fluorescence excitation spectra of the enzyme
and that of the complex overlaid. This shows a significant differ-ence in the blue side of the excitation maximum where the con-tribution of theLa R
1A transition is known to predominate~Callis,1997; Valeur & Weber, 1977!.
In Figure 4A, the fluorescence decay of the apoenzyme is shownat room temperature, as registered by the ns-flashlamp system,with excitation at 295 nm and emission at 340 nm. The decaycurves could not be well fitted with one exponential, but the sumof two exponentials resulted in acceptable chi-squared values~cf. weighted residuals in the figure!. In the case of the complex~Fig. 4B!, the two exponential fit did not improve the quality of thefit significantly. The data~average values of several independentexperimental series! are shown in Table 2. For the apoenzyme,typical values from the two-component fit were:t1 5 2.73 ns~19.2%! and t2 5 5.7 ns ~80.8%!, ^t& 5 5.13 ns and for thecomplex:t1 5 3.1 ns ~21.7%! and t2 5 5.9 ns ~78.3%!, ^t& 55.29 ns.
Fluorescence quenching studies
Effect on the spectra
Fluorescence quenching studies using acrylamide as a quencherwere performed to test if the two discrete lifetime components ofthe fluorescence decay can be identified as the contribution of two
Fig. 3. A: Fluorescence excitation~lem 5 340 nm! and emission~excita-tion lex 5 295 nm! spectra of the apoenzyme.B: Superposed excitationspectra of apoenzyme and complex~dashed line!.
Fig. 4. Fluorescence decay of~A! the apoenzyme and~B! the complex.Decays were collected at 295 nm of excitation wavelength and 340 nm ofemission wavelength. Results of two-exponential fits for the presenteddecays were:t1 5 2.7 ns,f1 5 19.7%,t2 5 5.6 ns,f2 5 80.3%,~apoen-zyme!, t1 5 3.36 ns,f1 5 19.9%,t2 5 5.84 ns,f2 5 80.1%.
2234 B. Ullrich et al.

differently accessible Trps of the protein. We selected acrylamideas quencher because it only has a very slight effect on the enzymeactivity of HIV-1 protease~3–5% decrease at a 0.3 M acrylamideconcentration!. Similar concentrations of iodide as quencher dras-tically lowered the enzyme activity.
The fluorescence intensity at a constant emission wavelength~lex5 295 nm,lem5 340 nm! as well as emission spectra~lex5295 nm! were measured as described in Materials and methods.The intensity plot, shown in Figure 5, shows a downward curva-ture in the case of the apoenzyme. The same experiment in the caseof the complex leads to an upward-curving intensity plot~cf. Fig. 5!.A Lehrer plot analysis~not shown! was also performed, based onthe most simple model, i.e., that the emission occurs from one
accessible and one inaccessible Trp, using the linearized form ofthe Stern–Volmer equation~Lehrer, 1971!:
I0
D I5
1
fa KD @Q#1
1
fa~1!
wherefa is the fraction of the initial fluorescence that is accessibleto the quencher andDI is the difference between the intensity offluorescence in the absence of quencher~I0! and the intensity atvarious quencher concentrations. The linear fit toI00DI plotted asa function of@Q# ~not shown! yielded 86% for the contribution ofthe accessible Trps in the apoenzyme and around 100% for thecomplex~i.e., they-intercept was close to 1!.
The downward curvature of the Stern–Volmer plot in the case ofthe apoenzyme agrees well with the multicomponent feature of thelifetime data. It indicates that there are Trps in the protein withdistinct accessibility for quenching~Eftink & Ghiron, 1981!. Theinset of Figure 5 shows that quenching leads to a blue shift in theemission spectrum of the apoenzyme. This result is not only in-dicative of the presence of distinct Trps, but also shows that theTrps with red shifted spectra are more effectively quenched.
In the case of the complex, no significant spectral change couldbe observed upon quenching~cf. Fig. 5, inset!. Thus, the Trps inthis conformation are not significantly different in their accessi-bility for quenching. The upward curvature observed in the inten-sity plot of the quenching experiment is probably indicative of theoccurrence of both dynamic and static processes, but a similareffect arising from a significant contribution of the transient termof the Smoluchowski equation~Eftink & Ghiron, 1981! during thequenching process cannot be excluded either.
Effect on the fluorescence decay
Figure 6A shows a Stern–Volmer plot based on an evaluationusing two lifetime components for the case of the apoenzyme. It isseen that both lifetime components can be fitted to linear plots,yielding significantly distinctkq bimolecular quenching constants.The values are listed in Table 3. The conclusion from the quench-ing studies for the apoenzyme is that the data can be well inter-preted by assuming the existence of two types of Trp populations.The population with shorter lifetime is more effectively quenchedby a collisional mechanism, and this population has emission spec-tra red shifted relative to that of longer lifetime.
In the case of the complex, the decay curves could not be so wellfitted by two lifetimes~as mentioned above!. The Stern–Volmerplots based on two lifetime components did not lead to straightlines ~not shown!, but a downward curvature could be observed.As the intensity plot and the spectral data shown in Figure 5 wereindicative of similar Trp behavior in the quenching experiment, weevaluated the lifetime data by using the mean lifetime in the Stern–Volmer plot as shown in Figure 6B. The data points are from threeindependent experiments; they can be well fitted by a straight line.The bimolecular quenching constant is given in Table 3; it issomewhat smaller than that of the Trps with longer lifetime com-ponents in the apoenzyme.
Trp dynamics by computer simulations
Figures 7 and 8 plot the variation of thex1 andx2 Trp dihedralangles for the 500 ps time course of the distance-dependent di-electric simulations acquired after a 100 ps equilibration. All Trp
Table 2. Van der Waal contact with protein quencher groupsby the different Trp rotamers sampled during 500 pssimulation time
ApoHIV-1 Complex
vdWcontact
vdWcontact
Trp6 x1 g2 N g2 Nx2 2908 N 2908 N
Trp6B x1 g2 N g2 Nx2 2908 N 2908 N
Trp42 x1 g1 N g1 Nx2 9002908 N 908 N
Trp42B x1 g10g2 Y g1 Nx2 9002908 Y 908 N
Fig. 5. Intensity Stern–Volmer plots of the apoenzyme~n! and the com-plex ~C!. Inset: Fluorescence emission spectra of~A! the apoenzyme and~B! the complex at 0 M~solid line! and 0.35 M~dashed line! acrylamideconcentrations, excitation wavelength5 295 nm.
Tryptophan monitoring of HIV-1 protease dynamics, inhibitor binding 2235

residues are seen to adopt thex10x2 geometries of stereochemi-cally favored staggered rotamers, i.e., g1, g2, or 908 or 2908~cf. Materials and methods!. The distribution of rotamer popula-tions is also listed in Table 2. We note here that Trp does not adoptthe third possiblex1 rotamer, i.e.,t 5 1808; this is not surprisingas this rotamer has been shown to be indicative ofa-helical struc-ture~Willis et al., 1994!, which does not occur in this region of theprotease.
The most dynamically active Trp is Trp42B, which switchesbetween two possiblex10x2 rotamers, but only in the apoenzyme~cf. bottom left graphs in Figs. 7, 8!. In the complex, it adopts onlyonex10x2 conformation~cf. bottom right graphs in Figs. 7, 8!. Asfor Trp42, it adopts the g1 geometry in both the apoenzyme andthe complex, and both 90802908 conformations in the apoenzyme.We note here that this type of dynamic behavior was observed inboth explicitly solvated and distance-dependent dielectric simula-
tions for the length of available and comparable trajectory time~cf. Materials and methods!. In the motion of Trp6 and Trp6B, thetrajectories did not show significant differences, both in the apo-enzyme and in the complex. These residues kept fluctuating aboutthe same average geometry, i.e., that of the g1 for thex1, and 908for the x2 dihedral case.
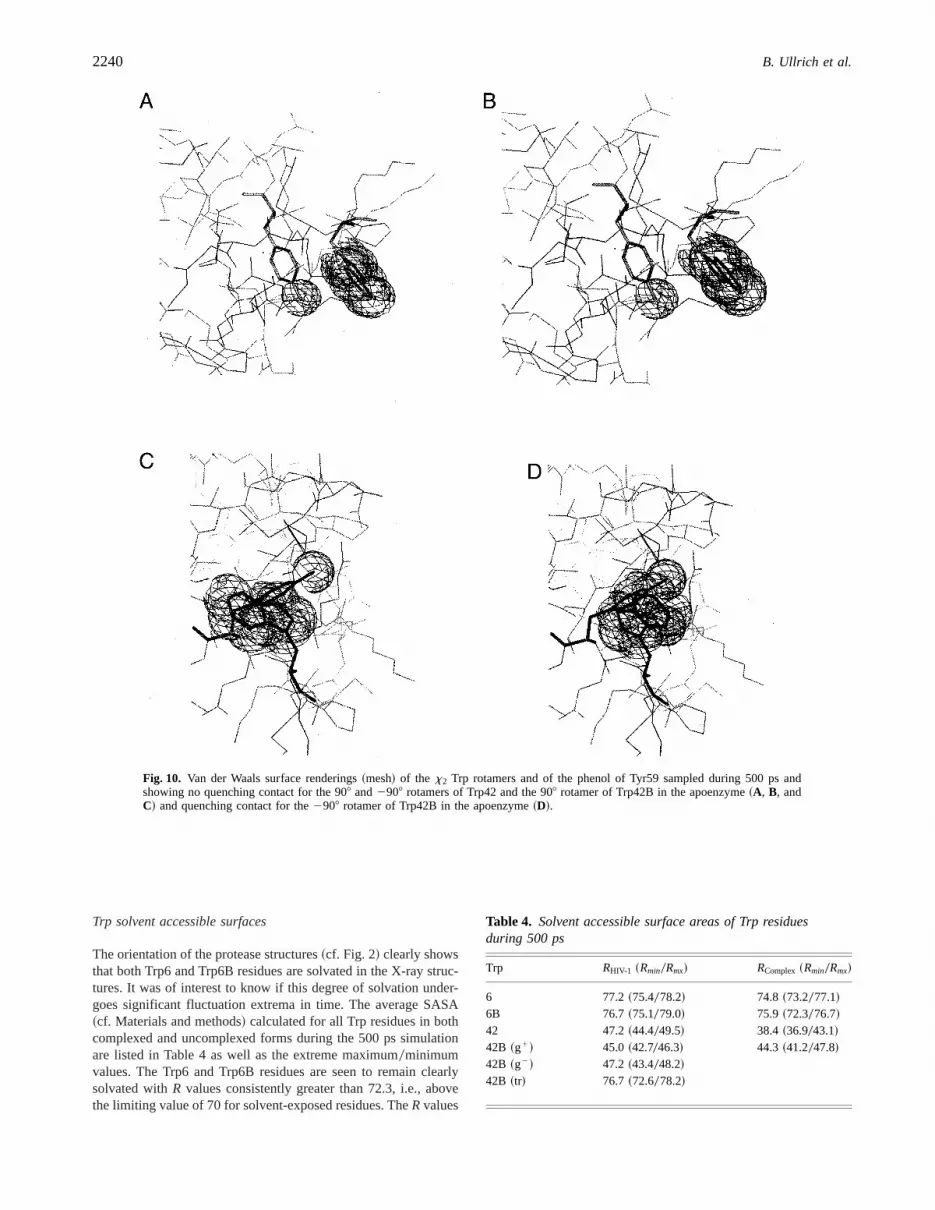
To illustrate how the rotamer conformations sampled by the Trpresidues during the time course of the trajectories report on thelocal protein environment, we display graphically~Figs. 9, 10! theproximity of the Trp indoles to a protein matrix quencher group,i.e., the phenol group of Tyr59~Chen & Barkley, 1998!. For clari-ty’s sake, we only display the van der Waals surfaces of the stron-gest quencher present in the respective environments of the Trpresidues. Specifically, Figure 9 compares—for both apoenzymeand complex—the quenching environment of Trp42 and Trp42B inthex1 rotamer conformations extracted from the MDS and showsthat, in its “flipping” motion between two rotamers, Trp42Bg2 inthe apoenzyme is the only species which comes into effective vander Waals contact with the quencher. Figure 10 compares thex2
interconversions. In the case of the apoenzyme Trp42, the 908 and2908 rotamer interconversion does not bring the indole closer tothe quencher~Fig. 10A,B!. However, in the case of Trp42B~Fig. 10C,D!, interconversion again results in van der Waals over-lap of the2908 rotamer with the quencher group~Fig. 10D!.
Thus, the dynamics are suggestive of two different Trp42 pop-ulations: one that would make van der Waals contact with a quench-ing group, consisting of the2908 and g2 rotamers of Trp42Bexposed to quencher in the apoenzyme, and another population,not exposed to Tyr59, that would consist of Trp42 in both apoen-zyme and complex and of the 908 and g1 rotamers of Trp42B inthe complex.
The same analysis was performed for all other known quenchergroups of indole present within probable van der Waals overlapdistance, i.e., the sulfhydryl group of Cys~no contact!; the amidegroups of Asn37, Asn37B, Asn88~no contact!, and of Gln58, 92B~no contact!; theE-amino group of Lys43, Lys55, and Lys55B~nocontact!. Special attention was paid to Lys7, which replaces Gln7in the mutant protease. ItsE-amino group, also reported as anindole fluorescence quencher in this pH-range~Tran & Beddard,1985!, was observed to be dynamically quite active during the timecourse of the simulations, in some instances approaching Trp6 asclose as 2.8 Å with van der Waals overlap of the residues. In thesimulations, no other Lys residue was seen to approach a Trpindole so closely~e.g., Lys55, Lys55B, Lys43, Lys43B!. The quench-ing mechanism of lysine in proteins is not yet known, but studiesperformed on model peptides~Chen & Barkley, 1998! have pro-posed an excited-state proton transfer mechanism. If this is the
Fig. 6. Stern–Volmer plots fort1 ~n! andt2 ~d! discrete lifetime compo-nents of~A! the apoenzyme and~B! for ^t& data of the complex. Excitationwavelength5 295 nm; emission wavelength5 340 nm.
Table 3. Fluorescence decay parameters of apoenzyme and complex obtainedfrom a double exponential fita
Apoenzyme Complex
ti
~ns!Contribution
~%!kq
~M21 s21!ti
~ns!Contribution
~%!^t&~ns!
kq
~M21 s21!
2.76 0.16 19.2 6.853 109 3.16 0.36 21.7 5.29 1.783 109
5.76 0.05 80.8 1.883 109 5.96 0.14 78.3
aThe decays were collected atlex 5 295 nm andlem 5 340 nm.
2236 B. Ullrich et al.

case, in addition to proximity, very stringent geometry orientationswould also be required, so as to have the lysine make contact witheither C2, C4, or C7 on the indole ring. No such overlap could beextracted from the MDS runs.
Possible peptide bond quenching was also investigated. In modelpeptide studies, effective quenching requires at least two amides~Chen et al., 1996!, and such close overlap was not observed withbackbone peptide bond segments in the immediate vicinity of the
Fig. 7. Variation of thex1 dihedral angles of all four Trp residues~6, 6B, 42, and 42B! present in HIV-1 protease~left side! and inthe complex~right side! during a 500 ps simulation. A dihedral of 608 corresponds to the g1 rotamer and one of2608 to the g2 rotamer.x1 is defined as the N-CA-CB-CG dihedral angle. AP symbol refers to the results obtained for the complex with acetyl-pepstatininhibitor.
Tryptophan monitoring of HIV-1 protease dynamics, inhibitor binding 2237

Trps. However, recent work by Engelborgh’s group shows that, inproteins, very effective quenching can occur by electron transferfrom Trp’s indole CE3 atom to Trp’s own peptide bond—carbonylcarbon. Quenching can occur via a “through bond” mechanism;
that is, the electron can travel along the covalent bond networklinking the carbonyl C to the indole CE3 or via a “through space”pathway~Sillen et al., 2000!. These quenching mechanisms, how-ever, require specific orientations for the interacting orbitals. We
Fig. 8. Variation of thex2 dihedral angles of all four Trp residues~6, 6B, 42, and 42B! present in HIV-1 protease~left side! and inthe complex~right side! during a 500 ps simulation.x1 is defined as the CA-CB-CG-CD2 dihedral angle. AP symbol refers to theresults obtained for the complex with acetyl-pepstatin inhibitor.
2238 B. Ullrich et al.

analyzed the trajectories to monitor the distance of the Trp indoleCE3 atoms to the nearest peptide bond carbonyl C-atoms. Thisyielded distances that came within efficient quenching distance forthe Trp42s but not for the Trp6s~;4.5 Å, cf. Sillen et al., 2000!.
However, even if the analysis resulted in showing that the distancerequirement could be met, we could not investigate the orbital ori-entation requirement and could therefore not rigorously elaboratethe details of a possible peptide bond additional quenching possibility.
Fig. 9. Van der Waals surface renderings~mesh! of thex1 Trp rotamers and of the phenol of Tyr59 sampled during 500 ps and showingno quenching contact for a, b, c, and d~respectively, Trp42g1 and Trp42Bg1 in the complex, Trp42g1 and B42g1 in the apoprotease!,and quenching overlap for e~Trp42Bg2 in apo!.
Tryptophan monitoring of HIV-1 protease dynamics, inhibitor binding 2239
Trp solvent accessible surfaces
The orientation of the protease structures~cf. Fig. 2! clearly showsthat both Trp6 and Trp6B residues are solvated in the X-ray struc-tures. It was of interest to know if this degree of solvation under-goes significant fluctuation extrema in time. The average SASA~cf. Materials and methods! calculated for all Trp residues in bothcomplexed and uncomplexed forms during the 500 ps simulationare listed in Table 4 as well as the extreme maximum0minimumvalues. The Trp6 and Trp6B residues are seen to remain clearlysolvated withR values consistently greater than 72.3, i.e., abovethe limiting value of 70 for solvent-exposed residues. TheRvalues
Fig. 10. Van der Waals surface renderings~mesh! of the x2 Trp rotamers and of the phenol of Tyr59 sampled during 500 ps andshowing no quenching contact for the 908 and2908 rotamers of Trp42 and the 908 rotamer of Trp42B in the apoenzyme~A, B, andC! and quenching contact for the2908 rotamer of Trp42B in the apoenzyme~D!.
Table 4. Solvent accessible surface areas of Trp residuesduring 500 ps
Trp RHIV-1 ~Rmin0Rmx! RComplex ~Rmin0Rmx!
6 77.2~75.4078.2! 74.8 ~73.2077.1!6B 76.7~75.1079.0! 75.9 ~72.3076.7!42 47.2~44.4049.5! 38.4 ~36.9043.1!42B ~g1! 45.0 ~42.7046.3! 44.3 ~41.2047.8!42B ~g2! 47.2 ~43.4048.2!42B ~tr! 76.7 ~72.6078.2!
2240 B. Ullrich et al.

of the Trp42 and of the Trp42B rotamers are also indicative ofsolvent exposure, but to a much lesser extent than the Trp6s withR values'40 ~cf. R value for buried Trp is,20!. They can thusbe considered as partially buried or with one plane of the indolering exposed to the protein matrix and the other to solvent. Itshould be noted that, in view of the simulations, as Trp42B flipsfrom the g1 to the g2 conformations, it also becomes fully solvent-exposed~42B“tr” in Table 4!.
Discussion
Identification of the Trp fluorescence lifetime components
In the ns range, the fluorescence decay of the apoenzyme could bewell fitted with two exponentials, namely 2.7 and 5.7 ns, with amuch higher contribution from the longer component~cf. Table 2!.The lifetime values are comparable to those reported by Kunglet al.~1998! for native HIV-1 protease. Those values were 2.06 and4.46 ns, respectively. Besides the significant difference in the longlifetime, their respective contribution was also different, leading toan average lifetime of 2.23 ns. The cited study, however, is verydifferent from ours, both in experimental methods and in studiedsamples~e.g., different pH, buffer, and wild-type enzyme!. Theauthors used a frequency-doubled laser excitation source, and ananalysis based on the maximum entropy method~MEM !. Thepulse shape shown in Figure 4 of their paper has a width of about1 ns. It is evident that their method leads to a better signal0noiseratio and thus it allows for MEM analysis even for lifetime distri-butions centered around values in the ps range. The intrinsic timeresolution of the experiment, however, does not improve much.The fact is that it would be hard to perform a precise comparativeanalysis of the two sets of results, even if the sample conditionshad been identical.
In our quenching experiments, the validity of a heterogeneoussource of emission is supported by the downward curvature of theStern–Volmer intensity plot~Fig. 5!, indicative of two populationsnot equally accessible to acrylamide. The dynamic collisionalquenching constantskq could reliably be determined for the twolifetime components, and they were very different~kq values forthe apoenzyme: 6.853 109 M21 s21 for t1 and 1.883 109 M21 s21
for t2!. The short component is quenched with much higher effi-ciency by collision, and the spectra~cf. Fig. 5, inset! show that theaccessible Trp residues in the system have moderately red-shiftedemission~from 336 to 340 nm!. From this, one has to conclude thatthe Trps of longer lifetime are in a relatively hydrophobic envi-ronment. As for the two quenching probabilities, one needs toconsider especially the higherkq value that is approaching thelimiting value given for indole acrylamide quenching in water as7 3 109 M21 s21 ~Eftink & Ghiron, 1976!. In the protein litera-ture, however, one can find similar data: Bismuto and Irace~1994!report bimolecular quenching constants of even 8.93 109 and2.33 109 M21 s21 for the acrylamide quenching of apomyoglobinTrps. More recently, a value of 6.43 109 M21 s21 was reportedfor the long component associated with a Trp nearly fully exposedto solvent in the smooth muscle myosin motor domain with theessential light chain~Yengo et al., 1999!. Thus, we conclude thatour values agree well with other reported data.
In the complex form, the two component fit of the fluorescencedecay curves is somewhat questionable; the Stern–Volmer analysisof the quenching results also suggests that the two lifetime com-ponents have no real physical meaning. The same analysis, based
on the mean lifetime~i.e., 5.29 ns!, however, shows a linear de-pendence. There is also no spectral change due to the presence ofthe quencher. All these facts lead us to conclude that the proba-bility of collisional quenching is very similar for all the Trps in thedimeric protein and that all have about the same fluorescencedecay time. Thus, the binding of the inhibitor somewhat decreasesthe long lifetime component of the apoenzyme and significantlyincreases the short component.
The MDS trajectories suggest a model in which inhibitor bind-ing would only affect the motion of Trp42B. In the trajectories,this Trp becomes very similar to that of Trp42 in the complex.Since Trp42 and Trp6 are located in very different environments~cf. Table 4!, it is hard to imagine that they would form onepopulation in the complex with respect to collisional quenchingand fluorescence lifetime. Thus, a possible interpretation of ourdata would be that the contribution of Trp6 and Trp6B to theoverall fluorescence decay is negligible on the ns timescale. In thisinterpretation, the effect of inhibitor binding would be based solelyon the Trp42 rotamers with corresponding assignments that the 2.7and 5.7 ns lifetimes characterize different rotameric states of Trp42in the apoenzyme. In one of the monomers, this Trp~i.e., Trp42B!would be switching between twox1 andx2 rotamer states that arenot equally perturbed by the presence of nearby Tyr59. In the othermonomer, no such flipping between rotamer states would occur,i.e., Trp42 would never be brought into contact with Tyr59. Uponcomplex formation, the previously interconverting Trp42B wouldstop its flipping, thus becoming similar to the other one. Experi-mentally, this interpretation is supported by the small magnitude ofthe red-shift in the emission spectra of the acrylamide quenchingexperiments~4 nm! resulting in a 340 nm maximum for the redpopulation, difficult to associate with fully solvated Trp6s, forwhich we would expect an emission maximum around 348 nm~Lakowicz, 1983!. The two populations assigned to the Trp42Brotamers in the apoenzyme would then consist of one rotamerpopulation~the blue one! more exposed to the hydrophobic resi-dues of the protein matrix~Try59B, Leu38B! and the other one, therotamer population, less exposed to these after the flip~the redone!.
Local Trp environment features related to dynamics thatsupport the assignment of Trp fluorescence lifetimes
Known quenchers of Trp fluorescence in model compounds andproteins include the side chains of Lys, Gln, Asn, protonated andunprotonated His, protonated Glu and Asp, Tyr, Cys, and cystine,as well as the peptide bond itself~Vos & Engelborghs, 1994; Chenet al., 1996; Hennecke et al., 1997; Chen & Barkley, 1998; Sillenet al., 2000!. We now discuss the possible reasons as to why thelifetime of Trp42B could be shorter than that of Trp42, and how toaccount for Trp6 and Trp6B.
The Trp42s
The MDS trajectories support the interpretation of two Trp42 pop-ulations, in that they identify two groups of Trp42 in terms of theirdifferent accessibility to quenching by Tyr59~cf. Figs. 7–10!, whichwe now discuss. The first Trp42 population consists of Trps that donot come into close contact with this tyrosine during the timecourse of the simulations, and it consists in the apoenzyme of theg1 and 908 rotamers of Trp42 and can thus be identified as thelong-term component of the decay; the second population consist-
Tryptophan monitoring of HIV-1 protease dynamics, inhibitor binding 2241

ing of Trp42B that flips between rotamers thus approaching Tyr59within effective quenching distance. This type of Trp can be iden-tified as the source of the shorter lifetime component. The contri-bution of each component to the total decay, i.e., 80% for the longand 20% for the short lifetime components, agrees well with thisconcept. Out of the four Trp42 rotamers in the apoenzyme, threewould be in a conformation that never comes into close contactwith Tyr59 while the fourth would be spending time between twostates, one that overlaps with Tyr59 and one that does not, with thetransition between conformers being fully solvent-accessible. Thenumber of Trps accessible for quenching~i.e., of shorter lifetimes!should be less than;25% of the total. This agrees with our results.In the complex, Trp42B rotamers would no longer come withinquenching distance of Tyr59, and they would become similar to thefirst population.
A note of functional interest here is that the timescale of rotamerinterconversion occurs in our trajectories within the timescale ofHIV-protease flap opening, as simulated by activated MDS to bepossible within;140 ps~Collins et al., 1995!, which leads us tospeculate as to whether there could be a possible correlation be-tween Trp42B rotamer interconversion and flap opening. This issupported by recent preliminary anisotropy data~J. Fidy, B. Ulrich,M. Laberge, F. Tolgyesi, L. Polgar, Z. Szeltner, J. Gallay, & M.Vincent, unpubl. data! obtained by synchrotron radiation~LURE,Orsay! and evaluated by MEM analysis. These results showed thepresence of sub-ns rotational correlation time constants besides a;15 ns component attributed to rotation of the whole protein~Eftink, 1983!. Similar results were recently published on a slightlydifferent HIV-1 protease system with better resolution in the sub-nsrange~Ringhofer et al., 1999!. In our preliminary anisotropy ex-periments, a 10–100 ps broad unresolved envelope ofu-values wasseen in the sub-ns range and we inspected the trajectories fordynamic evidence other than the Trp42 rotamer interconversion.We inspected backbone “wobble” rotational motion, defined bychanges along the CA-CB-CD axis and associated with the Rama-chandranc and f angles of the peptide segment near the Trps.Significant “wobble” motion could only be extracted for the back-bone region that includes the Trp42s. In the literature, Trp-associatedbackbone motion has been assigned to the 200 ps or ns rotationalcorrelation time regime, as for example in the case of the Tetrepressor, also a homodimer of some;207 residues~Vergani et al.,2000!.
At this point, we speculate that the unresolved ps-timescaleanisotropy decay, which our preliminary results yield, encompassthe Trp42 rotamer interconversion at the;50ps “end” of the broadrange as well as the above-mentioned backbone “wobble,” ob-served only in the peptide region including the Trp42s. Theseobservations, i.e., evidence for backbone “wobble” in the Trp42region, its timescale, the timescale of thex10x2 rotameric inter-conversions of these Trps would seem to support such a Trp420flap opening correlation, and consequently the assignment of thefluorescence lifetime components.
The Trp6s
Unlike the Trp42s, located in the flap region of the protease, whichopens by as much as;7 Å during the inhibitor binding event~Wlodawer & Erickson, 1993!, the Trp6s in both apoenzyme andcomplex are not located in a dynamically active region of theprotease. In our model, based on the simulations, the backbone“wobble” motion is insignificant for this region: during the course
of the MDS, the Trp6s do not sample different conformations anddo not come within contact distance of protein quencher groups.Moreover, their CE3 atoms do not come within efficient peptidecarbonyl C quenching distance, i.e.,dCE3-C , 4.5 Å. It could bestill reasonable to assume that they are even more active than theTrp42s, simply because there is no apparent steric hindrance to themobility of their indoles. As such, their interconversion could thenvery well occur on a faster timescale. Inspection of our trajectories,however, could not yield support for this interpretation. The sim-ulations show that wat423~retained from the initial X-ray struc-ture! simultaneously H-bonds to the NH of adjacent Lys7 and toNH of Trp6. Trp42s do not H-bond with solvent. This tethering ofTrp6 to the protein surface would be sufficient to hinder the rota-tion of Trp6 indoles, by providing a rotational barrier of the orderof ;5 kcal mol21. A similar effect has been modeled for the Trp ofphospholipase A to account for experimental anisotropy decaysindicative of hindered rotation and it could be seen in the trajec-tories only with explicit -H simulations, which is also the approachwe used. This confers a slightly dipolar character to the indole andallows realistic simulation of H-bonding patterns~Axelsen et al.,1991!.
These considerations allow us to possibly account for Trp6s inthe model suggested by the simulations, i.e., they would be unableto sample rotameric states with lifetimes distinguishable by theirdifferent local environments. In this interpretation, they could beassigned a sub-ns lifetime, with possible quenching either by sol-vent~Chen & Barkley, 1998! or as a result of efficient nonradiativepathways such as energy transfer or electron transfer. For the latterassignment, we need to postulate the presence of possible electronacceptors in their immediate vicinity. If we compare the respectiveenvironments of Trp6s and Trp42s within a 7 Åsphere, we note thefollowing arrangements: for the Trp42s, of eight residues presentin the sphere, three are basic~Lys41B, Lys43B, Arg57B! and twoare hydrophobic~Tyr59B, Leu38B!. It is of interest to note also thepresence of three so-called “conformationally important residues,”i.e., Pro44B, Gly40B, and Pro39B, highly flexible and undoubt-edly required for the flap opening mechanism. In contrast, the fiveresidues facing the Trp6s are: one basic~Lys7! and four polarresidues~Thr4B, Gln92, Asn88, and Thr91!. This availability ofpolar groups in the vicinity of the two Trp6s would meet therequirement for the presence of electron acceptors. Reorientationalrelaxation of any of these residues as a result of the much higherdipole moment of indole in the excited state~Callis, 1997! wouldyield a sub-ns lifetime for the Trp6s~cf. Hudson et al., 1999 for adiscussion of Trp quenching by Gln in bacteriophage T4 lyso-syme!. However, for such a quenching mechanism to be operative,there is a contact requirement, such as, for example, an H-bondbetween Trp6 and one of the neighbor Gln or Thr that we do notobserve in the 500 ps trajectories. However, we should point outthat the length of our simulations is not adequate to fully describethe concerted motions involved in the observed Trp fluorescenceprocesses. The limitations of MDS as applied to systems of the sizeof proteins are essentially twofold: crude approximations have tobe made concerning the interaction potentials and only narrowtime windows can be covered. As such, the statistically probableenergy fluctuations of the system cannot be adequately sampled~Axelsen et al., 1991!.
The other possible Trp6 quenching mechanism could be Förster-type energy transfer. Unfortunately, our present data does not al-low the accurate calculation of the proposed energy transferefficiency because we are lacking the distinct Trp6 overlap inte-
2242 B. Ullrich et al.

grals. However, inspection of the static X-ray structure shows thatthe Trp6s are separated by a distance of 25 Å with face-to-faceorientation of the indoles~cf. Fig. 2!. Using this distance andliterature data for a three-Trp protein~De Beuckeleer et al., 1999!,we can roughly estimate the transfer efficiency. Supposing anR0
value of 11–12 Å, the efficiency at a distance of 25 Å wouldamount to some;20%, which does not account for a strong quench-ing effect.
Conclusions
The effect of binding the inhibitor
The present study proposes a model in which the partially solvent-exposed Trp42 in HIV-1 protease, located far from the active sitefor substrate binding, and also far from the tip of the flap region tofeel drastic—and immediately local—structural changes, wouldstill able to report on the conformational effects caused by thebinding of the inhibitor acetyl pepstatin. The model suggests thatthe conformational fluctuations of both Trp42s become restrictedupon binding the inhibitor. It is worth mentioning the special ef-forts required to use the apoenzyme as a reference system forwhich no reliable structural data were available previously becauseof the protease autoproteolysis problem. This difficulty was care-fully handled in the present work. Also, this work supports thevalidity of investigating the role of Trp rotamer states in a proteasesystem using a combined molecular dynamics simulations andexperimental approach. As such, the study supports models oftryptophan fluorescence based on ground state conformational het-erogeneity~Engh et al., 1986; Hutnik & Szabo, 1989; Ross et al.,1992!. Furthermore, our interpretation of the lack of Trp6 contri-bution to the 1–10 ns-timescale fluorescence suggests that the studyof quenching processes in some cases definitely requires the use offemtosecond techniques. Finally, in spite of the arduous processinvolved in trying to account for the proposed non-ns lifetimes ofthe Trp6s, we believe that we have presented a plausible model forthe occurrence of Trp42 rotameric states. The rotational barrierseen in the MDS for the Trp6s is also perhaps suggestive of theattention required to understand quenching mechanisms that arenot collisional, i.e., those operating through space~Silva & Pren-dergast, 1996!.
Materials and methods
Sample preparation
HIV-1 protease was expressed inEscherichia coli1458, and pu-rified from inclusion bodies as described previously~Polgár et al.,1994!. The enzyme contains three mutation sites at positions 7~Gln r Lys!, 33 ~Leu r Ile!, and 63~Leu r Ile!. This mutantform of the enzyme is resistant against autodegradation; its kineticproperties and inhibition profiles by a variety of inhibitors, how-ever, were very similar, if not identical with the wild-type enzyme~Mildner et al., 1994!. The high similarity of the kinetic propertiesof the wild-type enzyme and that of the mutant form suggests thatthe structure of the protein is not changed very much by mutation.The final concentration of the enzyme was 10.6–12.5mM in 50 mMphosphate buffer containing 50 mM disodium-hydrogen-phosphate,1 mM EDTA, 2 mM DTE, 0.1 M NaCl, 10 v0v% glycerol, and0.1% PEG 2000, pH5 7.5, and was used without further dilution.
The concentration of the enzyme was determined from the opticaldensity~E280 5 25,500 M21 cm21! with a Cary 4E~Varian, Aus-tralia! UV-VIS spectrophotometer. Aliquots of the concentratedenzyme were stored at2708C. The enzyme activity was controlledbefore the experiments by fluorescence spectroscopy making useof the fluorogenic substrate 2-aminobenzoyl-Thr-Ile-Nle-Phe~NO2!-Gln-Arg ~Szeltner & Polgár, 1996!.
Acetyl-pepstatin@Ac-Val-Val-Sta-Ala-Sta#, obtained from SigmaChemicals~St. Louis, Missouri! and dissolved in DMSO, was usedas inhibitor. Aliquots of 0.5 or 1.0 mM stock solutions were addedto the protein solution; the protein:inhibitor molar ratio was about1:2; the resultant DMSO content was 4%. The measurements startedafter 40 min of incubation at room temperature.
Fluorescence measurements
The experiments were carried out using an Edinburgh AnalyticalInstrumentsCD900 luminometer, fitted with a HamamatsuR955PMT as detector. The instrument is equipped with a 75 W xenonlamp for fluorescence spectroscopy; in fluorescence lifetime stud-ies, anF900type flashlamp~40 kHz, 1.5 ns pulse width! was usedwith a high purity H2 gas~10 ppm impurity! filling. The individualintensity decay curves were determined using a time-correlatedsingle photon counting method; data were collected over a timeperiod of 10 lifetimes. The excitation wavelength was 295 nm, andemission was typically measured at 340 nm. Both excitation andemission wavelengths were selected by grating monochromators.The decay curves were analysed by iterative reconvolution usingdiscrete exponentials.
Evaluations based on fluorescence intensity data were correctedfor the absorption of acrylamide and for protein self-absorption inthe 1 mL cuvettes used according to the following formula:
Icorr 5 Iobs10~OD295051OD340! ~2!
where Icorr is the corrected fluorescence intensity,Iobs is the ob-served fluorescence intensity,OD295 and OD340 are the opticaldensities of the sample at 295 nm and at 340 nm, respectively, thevolume of cuvettes was 1 mL.
Quenching of fluorescence
Trp accessibility to small solutes was determined using acrilamide,an efficient quencher of Trp fluorescence and selective for surfaceresidues~Eftink & Ghiron, 1981!. Five or ten microliter aliquots of1, 2.5, and 5 M stock solutions of electrophoretic grade acrylamide~Aldrich Chemical Co., Milwaukee, Wisconsin! in 50 mM phos-phate buffer~pH: 7.5! were used as quencher up to a concentrationof 0.35 M.
Bimolecular collisional quenching constants~kq! were deter-mined from the equation based on thet fluorescence lifetime~Equation 3!.
t0
t2 1 5 kqt0 @Q# ~3!
wherekqt0 5 KD, the dynamic quenching constant.Mean lifetime ~^t&! values were obtained from the results of
two-component exponential fits according to the formula
^t& 5 f1t1 1 f2t2 ~4!
Tryptophan monitoring of HIV-1 protease dynamics, inhibitor binding 2243

wheref1 andf2 are the fractional contributions oft1 andt2 lifetimecomponents to the total emission, respectively.
Computational methods
The starting coordinates for HIV-1 protease complexed to acetyl-pepstatin~pdb5hvp.ent, 2.0 Å, Fitzgerald et al., 1990! were re-trieved from the Brookhaven Protein Data Bank~Bernstein et al.,1977!. Residues were replaced as required so as to generate theQ7K0L33I0L63I mutant and the structure was subjected to energyminimization using theDiscover-3module of theInsightII soft-ware package~MSI, San Diego California! on a SGI R10000workstation, with the ESFF force field. Missing hydrogens wereadded subject to van der Waals constraints and consistent with theionization state of chargedR groups at the experimental pH, i.e.,7.5. To remove artifacts due to the addition of explicit hydrogens,energy minimization was performed using a conjugate gradientalgorithm until the average~root-mean-square! energy derivativereached 0.1 kcal mol21 A21. The HIV-1 protease structure withoutinhibitor was modeled in two different ways, the first using the2.7 Å structure~pdb3phv.ent, Lapatto et al., 1989! and the secondusing the available coordinates of the Q7K0L33I0L63I mutant~pdb1a30.ent, 2.0 Å, Louis et al., 1998!. The mutant is bound tothe Glu-Asp-Leu tripeptide, which was removed prior to generat-ing the fully opened flap structure of the unbound protease. Flapopening was achieved by template forcing the atomic coordinatesof the mutant structure of residues 1 to 25 and 65 to 99 in eachmonomer to the coordinates of the “fully flap-opened” 3phv struc-ture and minimizing as described above, following essentially theapproach described by Collins et al.~1995! in their simulation ofthe protease’s flap opening. The stereochemical quality of all struc-tures was verified and corrected using the program PROCHECK3.4 ~Laskowski et al., 1993; Rullman, 1996!, which compares agiven structure to well-refined structures at the same resolution,thus providing an indication of residue reliability in terms of idealbond lengths and angles, backbonef andw torsion angles, and Cachirality. It was felt that special care had to be paid in generatingoptimal apoenzyme structures, since our objective was to run dy-namics on both complexed and uncomplexed proteases while en-suring that any observed differences in Trp dynamics betweenthem would not be due to structural artefacts and0or poor contactsin the apoenzyme. The apo-HIV protease retained for the simula-tions were the higher resolution mutated proteases, as PROCHECKconsistently returned better stereochemical parameters for thesestructures. The solvent accessible surface areas~SASA! of theresidues—defined as the surface generated by a sphere of theradius of a water molecule of 1.4 Å rolled around the residue~Lee& Richards, 1971!—was calculated using FANTOM~Fracz-kiewicz & Braun, 1998!. The areas are expressed as ratios of theindole surface area to the random coil value of Trp, defined as theTrp SASA in the tripeptide Gly-Trp-Gly in an ensemble of 30random conformations. Trp is considered solvent-exposed ifR .50% and buried ifR , 20%.
The molecular dynamics simulations were first run with solv-ated structures. To generate bulk solvent, the structures wereexplicitly solvated in PBC cell of water molecules~6888 wa-ters!, also retaining the water molecules of the X-ray structure.A dielectric constant of 1 was used throughout the simulations.First the 3D solvent cell was equilibrated, holding the proteincoordinates fixed, then the entire solvated system was subjectedto energy minimization.
NVT simulations were carried out at a constant temperature of300 K using a leapfrog algorithm with a time step of 1 fs. 200 pstrajectories were acquired, and the initial equilibration 100 ps weredisregarded in the analysis. Nonbond interactions were taken intoaccount using the cell multipole method~Schmidt & Lee, 1991! aspreviously described~Laberge et al., 1998!.
As explicitly solvated, dynamics are quite CPU-time consum-ing; longer 600 ps trajectories were then acquired using the distance-dependent dielectric approximation~Mehler & Solmajer, 1991!.As the trajectories of comparable timescales~i.e., 100 ps! yieldedthe same results as the explicitly solvated runs with respect to Trpdihedral angles, we acquired the longer time simulations with thedd-E approach, thus considered satisfactory.
The Trp indole motion was analyzed by following the variationsof the Trpx1 andx2 dihedral angles. These angles are defined asfollows: x1 5 N-CA-CB-CG andx2 5 CA-CB-CG-CD2~IUPAC-IUB Commission on Biochemical Nomenclature, 1970!, and weuse them as indicators of indole rotation about the CA-CB andCB-CG bonds, respectively~see also Figs. 7, 8!. The stereochem-ically favored rotamers of thex1 conformation are the staggeredforms, possible whenx1 5 60, 260, and 1808; these rotamers arecalled the g1, g2, and t rotamers, respectively. Similarly, the fa-voredx2 rotamers are the 908 and2908 forms ~Szabo & Rayner,1980; Willis et al., 1994!.
Acknowledgments
The authors thank A. Demchenko~Palladin Institute of Biochemistry, Kiev!for valuable suggestions and for reading the manuscript and also W. Braun~UTMB Galveston, Texas! for a copy of his FANTOM program and R.A.Laskowski~UC London, GB! for PROCHECK. The authors also thank J.Gallay and M. Vincent for use of the fluorescence decay facilities at LURE,Orsay ~France!. M.L. gratefully acknowledges support from Hungarianpostdoctoral grant MKM FKFP 119101997~J.F.!. B.U. thanks for supportfrom the PhD program no. 11 of the Semmelweis University, Budapest.The technical assistance of Mrs. R. Markács is greatly appreciated.
References
Axelsen PH, Gratton E, Prendergast FG. 1991. Experimentally verufying mo-lecular dynamics simulations through fluorescence anisotropy measure-ments.Biochemistry 30:1173–1179.
Bernstein FC, Koetzle TF, Williams GJB, Meyer EF Jr, Brice MD, Rodgers JR,Kennard O, Shimanouchi T, Tasumi M. 1977. The Protein Data Bank: Acomputer-based archival file for macromolecular structures. J Mol Biol112:535–549.
Bismuto E, Irace G. 1994. Unfolding pathway of apomyoglobin. Simultaneouscharacterization of acidic conformational states by frequency domain fluo-rometry.J Mol Biol 241:103–109.
Callis PR. 1997. La and Lb transitions of tryptophan: Applications of theory andexperimental observations to fluorescence of proteins.Methods Enzymol278:113–150.
Chen Y, Barkley MD. 1998. Toward understanding tryptophan fluorescence inproteins.Biochemistry 37:9976–9982.
Chen Y, Liu B, Yu HT, Barkley MD. 1996. The peptide bond quenches indolefluorescence.J Am Chem Soc 118:9271–9278.
Collins JR, Burt SK, Erickson JW. 1995. Flap opening in HIV-1 protease sim-ulated by “activated” molecular dynamics.Struct Biol 2:334–338.
De Beuckeleer K, Volckaert G, Engelborghs Y. 1999. Time resolved fluores-cence and phosphorescence properties of the individual tryptophan residuesof Barnase: Evidence for protein-protein interactions.Proteins Struct FunctGenet 36:42–53.
Eftink M. 1983. Quenching-resolved emisson anisotropy studies with single andmultitryptophan-containing proteins.Biophys J 43:323–334.
Eftink MR, Ghiron CA. 1976. Fluorescence quenching of indole and modelmicelle systems.J Phys Chem 80:486–493.
Eftink MR, Ghiron CA. 1981. Fluorescence quenching studies with proteins.Anal Biochem 114:199–227.
2244 B. Ullrich et al.

Engh RA, Chen LXQ, Fleming GR. 1986. Conformational dynamics of tryp-tophan: A proposal for the origin of the non-exponential fluorescence decay.Chem Phys Lett 126:365–372.
Fitzgerald PMD, McKeever BM, VanMiddlesworth JF, Springer JP, HeimbachJC, Leu ChT, Herber WK, Dixon RAF, Darke PL. 1990. Crystallographicanalysis of a complex between human immunodeficiency virus type 1 pro-tease and acetyl-pepstatin at 2.0 Å resolution.J Biol Chem 265:14209–14219.
Flexner C. 1998. HIV-protease inhibitors.New Eng J Med 338:1281–92.Fraczkiewicz R, Braun W. 1998. A new efficient algorithm for calculating
solvent accessible surface areas of macromolecules.J Comp Chem 19:319–333.
Hennecke J, Sillen A, Huber-Wunderlich M, Engelborghs Y, Glockshuber R.1997. Quenching of tryptophan fluorescence by the active-site disulfidebridge in the DsbA protein fromE. coli. Biochemistry 36:6391–6400.
Hutnik CM, Szabo AG. 1989. Confirmation that multiexponential fluorescencedecay behavior of holoazurin originates from conformational heterogeneity.Biochemistry 28:3923–3934.
Kohl NE, Emini EA, Schleif WA, Davis LJ, Heimbach JC, Dixon RAF, ScolnickEM, Sigal IS. 1988. Active human immunodeficiency virus protease isrequired for viral infectivity.Proc Natl Acad Sci USA 85:4686–4690.
Kungl AJ, Visser NV, van Hoek A, Visser AJWG, Billich A, Schilk A, GstachH, Auer M. 1998. Time-resolved fluorescence anisotropy of HIV-1 proteaseinhibitor complexes correlates with inhibitory activity.Biochemistry 37:2778–2786.
Laberge M, Vreugdenhill AJ, Vanderkooi J, Butler IS. 1998. Microperoxidase-11: Molecular dynamics and q-band excited resonance raman of the oxi-dized, reduced and carbonyl forms.J Biomol Struct Funct 15:1039–1050.
Lakowicz JR. 1983.Principles of fluorescence spectroscopy. New York: Ple-num. p 264.
Lapatto R, Blundell T, Hemmings A, Overington J, Wilderspin A, Wood S,Merson JR, Whittle PJ, Danley DE, Geohegan KF, et al. 1989. X-ray analy-sis of HIV-1 proteinase at 2.7-Å resolution confirms homology among ret-roviral enzymes.Nature 342:299–302.
Laskowski RA, MacArthur MW, Moss DS, Thornthon JM. 1993. PROCHECK:A program to check the stereochemical quality of protein structures.J ApplCrystallogr 26:283–291.
Lee B, Richards FM. 1971. The interpretation of protein structures: Estimationof static accessibility.J Mol Biol 55:379–400.
Lehrer SS. 1971. Solute perturbation of protein fluorescence. The quenching ofthe tryptophyl fluorescence of model compounds and of lysozyme by iodideion. Biochemistry 10:3254–3263.
Louis JM, Dyda F, Nashed NT, Kimmel AR, Davies DR. 1998. Hydrophilicpeptides derived from the transframe region of gag-pol inhibit the HIV-1protease.Biochemistry 37:2105–2113.
Mehler EL, Solmajer T. 1991. Electrostatic effects in proteins: comparison ofdielectric and charge models.Protein Eng 4:903–910.
Mildner AM, Rothrock DJ, Leone JW, Bannow CA, Lull JM, Reardon IM,Sarcich JL, Howe WJ, Tomich C-SC, Smith CW, et al. 1994. The HIV-1protease as enzyme and substrate: Mutagenesis of autolysis sites and gen-eration of a stable mutant with retained kinetic properties.Biochemistry33:9405–9413.
Navia MA, Fitzgerald PMD, McKeever BM, Leu ChT, Heimbach JC, HerberWK, Sigal IS, Darke PL, Springer JP. 1989. Three-dimensional structure ofaspartyl-protease from human immunodeficiency virus HIV-1.Nature337:615–620.
Nicholson LK, Yamazaki T, Torchia DA, Grzesiek S, Bax A, Stahl SJ, KaufmanJD, Wingfield PT, Lam PYS, Jadhav PK, et al. 1995. Flexibility and func-tion in HIV-1 protease.Struct Biol 2:274–280.
Pargellis ChA, Morelock MM, Graham ET, Kinkade P, Pav S, Lubbe K, Lama-rre D, Anderson PC. 1994. Determination of kinetic rate constants for thebinding of inhibitors to HIV-1 protease and for the association and disso-ciation of active homodimer.Biochemistry 33:12527–12534.
Polgár L, Szeltner Z, Boros I. 1994. Substrate-dependent mechanisms in thecatalysis of human immunodeficiency virus protease.Biochemistry 33:9351–9357.
Ringhofer S, Kallen J, Dutzler R, Billich A, Visser AJWG, Scholz D, Stein-hauser O, Schreiber H, Auer M, Kungl AJ. 1999. X-ray structure and con-formational dynamics of the HIV-I protease in complex with the inhibitorSDZ283-910: Agreement of time-resolved spectroscopy and molecular dy-namics simulations.J Mol Biol 286:1147–1159.
Rosé JK, Salto R, Craik CS. 1993. Regulation of autoproteolysis of the HIV-1and HIV-2 proteases with engineered amino acid substitutions.J Biol Chem268:11939–11945.
Ross JBA, Wyssbrod HR, Porter RA, Schwartz GP, Michaels CA, Laws WR.1992. Correlation of tryptophan fluorescence intensity decay parameterswith 1H NMR-determined rotamer conformations:@Tryptophan2#Oxytoxin.Biochemistry 31:1585–1594.
Rullman JAC. 1996. AQUA, Computer program. Department of NMR Spec-troscopy, Bijvoet Center for Biomolecular Research, Utrecht University,The Netherlands.
Schmidt KE, Lee MA. 1991. Implementing the fast multipole method in threedimensions.J Stat Phys 63:1223–1237.
Seelmeier S, Schmidt H, Turk V, von der Helm K. 1988. Human immunodefi-ciency virus has an aspartic-type protease that can be inhibited by pepstatinA. Proc Natl Acad Sci USA 85:6612–6616.
Sillen A, Diaz JF, Engelborghs Y. 2000. A step toward the prediction of thefluorescence lifetimes of tryptophan residues in proteins based on structuraland spectral data.Protein Sci 9:158–169.
Silva ND, Prendergast FG. 1996. Tryptophan dynamics of the FK506 bindingprotein: Time-resolved fluorescence and simulations.Biophys J 70:1122–1137.
Szabo AG, Rayner DM. 1980. Fluorescence decay of tryptophan conformers inaqueous solution.J Am Chem Soc 102:554–563.
Szeltner Z, Polgár L. 1996. Conformational stability and catalytic activity ofHIV-1 protease are both enhanced at high salt concentration.J Biol Chem271:5458–5463.
Tran CD, Beddard GS. 1985. Studies of the fluorescence from tryptophan inmelittin. Eur Biophys J 13:59–64.
Trylska J, Antosiewicz J, Geller M, Hodge CN, Klabe RM, Head MS, GilsonMK. 1999. Thermodynamic linkage between the binding of protons andinhibitors to HIV-1 protease.Protein Sci 8:180–195.
Tyagi SC, Simon SR, Carter CA. 1994. Effect of pH and non physiological saltconcentrations on human immunodeficiency virus HIV-1 protease dimer-ization.Biochem Cell Biol 72:175–181.
Valeur B, Weber G. 1977. Resolution of the fluorescence excitation spectrum ofindole into the 1La and 1Lb excitation bands.Photochem Photobiol 25:441–444.
Vergani B, Kintrup M, Hillen W, Lami H, Piemont E, Bombarda E, Alberti P,Doglia SM, Chabbert M. 2000. Backbone dynamics of Tet repressor a80a9loop. Biochemistry 39:2759–2768.
Vos R, Engelborghs Y. 1994. A fluorescence study of tryptophan-histidine in-teraction in the peptide anantin and in solution.Photochem Photobiol60:24–32.
Wang YX, Freedberg DI, Grzesiek S, Torchia DA, Wingfield PT, Kaufman JD,Stahl SJ, Chang ChH, Hodge NC. 1996a. Mapping hydration water mol-ecules in the HIV-1 protease0DMP323 complex in solution by NMR-spectroscopy.Biochemistry 35:12694–12704.
Wang YX, Freedberg DI, Yamazaki,T, Wingfield PT, Stahl SJ, Kaufman JD,Kiso Y, Torchia DA. 1996b. Solution NMR evidence that the HIV-1 proteasecatalytic aspartyl groups have different ionization states in the complexformed with the asymmetric drug KNI-272.Biochemistry 35:9945–9950.
Willis KJ, Neugebauer W, Sikorska M, Szabo AG. 1994. Probinga-helicalsecondary structure at a specific site in model peptides via restriction oftryptophan side-chain rotamer conformation.Biophys J 66:1623–1630.
Wlodawer A, Erickson JW. 1993. Structure-based inhibitors of HIV-1 protease.Annu Rev Biochem 62:543–585.
Wlodawer A, Miller M, Jaskolski M, Sathyanarayana KB, Baldwin E, Weber TI,Selk ML, Clawson L, Schneider J, Kent HBS. 1989. Conserved folding inretroviral proteases: Crystal structure of a synthetic HIV-1 protease.Science245:616–621.
Wlodawer A, Vondrasek J. 1998. Inhibitors of HIV-1 protease: A major successof structure-assisted drug design.Annu Rev Biophys Biomol Struct 27:249–284.
Yamazaki T, Nicholson LK, Torchia DA, Stahl SJ, Kaufman JD, Wingfield PT,Domaille PJ, Campbell-Burk S. 1994. Secondary structure and signal as-signments of human-immunodeficiency-virus-1 protease complexed to anovel, structure-based inhibitor.Eur J Biochem 219:707–712.
Yengo CM, Chrin L, Rovner AS, Berger CL. 1999. Intrinsic tryptophanfluorescence identifies specific conformational changes at the actomyosininterface upon action binding and ADP release.Biochemistry 38:14515–14523.
York DM, Darden TA, Pedersen LG, Anderson MW. 1993. Molecular-dynamicsimulation of HIV-1 protease in a crystalline environment and in solution.Biochemistry 32:1443–1453.
Tryptophan monitoring of HIV-1 protease dynamics, inhibitor binding 2245


