Embed Size (px)
Citation preview

Us
RD
a
ARR1A
KUHRHM
1
cahpcirsctrc
oupmAi
1d
Separation and Purification Technology 76 (2010) 44–51
Contents lists available at ScienceDirect
Separation and Purification Technology
journa l homepage: www.e lsev ier .com/ locate /seppur
ltrapurification of hydrogen peroxide solution from ionic metals impurities toemiconductor grade by reverse osmosis
. Abejón, A. Garea ∗, A. Irabienepartamento de Ingeniería Química y Química Inorgánica, Universidad de Cantabria, Avda. Los Castros s/n, 39005 Santander, Cantabria, Spain
r t i c l e i n f o
rticle history:eceived 21 June 2010eceived in revised form0 September 2010ccepted 15 September 2010
eywords:ltrapurification
a b s t r a c t
The present research is centred upon the application of reverse osmosis to the ultrapurification of aqueoushydrogen peroxide (35%, w/w). Semiconductor Equipment and Materials International (SEMI) organi-zation develops the globally most respected standards to establish the quality requirements for thechemicals used in this sector; one of these standards, SEMI C30 is proposed for hydrogen peroxide.Electronic grade hydrogen peroxide accounts for sub-ppm metallic impurity levels (sub-ppb concentra-tions are required for the most exigent grades), so various elements present as impurities in technicalgrade hydrogen peroxide exceed the fixed limits. A preliminary experimental study was carried out
ydrogen peroxideeverse osmosisigh-purity chemicalsetallic ion traces
with a laboratory-scale facility (flat-sheet membrane unit) with 6 different commercial reverse osmo-sis membranes in order to choose the most appropriate one for hydrogen peroxide ultrapurification. BEmembrane (manufactured by Woongjin Chemical) was selected for further viability study because of itshigher permeate flux (1.95 × 10⁻⁵ m3/m2 s at 40 bar) and metal rejections values (ranging from 0.825 forB to 0.961 for Cu). The Kedem–Katchalsky model resulted as the most representative for characterizingthe selected membrane behaviour as it achieved a percentage of overall variation explained upper than
94%.. Introduction
Hydrogen peroxide is considered a key chemical for the semi-onductor industry. The preparation of semiconductor materialsnd the manufacture of printed circuit boards employ aqueousydrogen peroxide solutions for cleaning silicon wafers, removinghotoresists or etching copper on printed circuit boards. Most usualleaning baths for silicon wafer surface cleaning (SC1, SC2 or SPM)nclude hydrogen peroxide in their formulations [1]. The said bathsemove particulate, organic and metallic pollutants from siliconurface, avoiding electric inoperativeness and decreased minorityarrier lifetime caused by pollution [2]. In order to avoid contamina-ion because of the bath itself, extremely high levels of purity areequired for all the components, so strict control about impurityoncentration in these chemicals becomes necessary.
Semiconductor Equipment and Materials International (SEMI)rganization is the global industry association serving the man-facturing supply chains for the microelectronic, display and
hotovoltaic industries. This organization facilitates the develop-ent of the globally most respected technical standards in this field.mong all the topics regulated, some refer to process chemicals andndicate the requirements to be fulfilled in order to be accepted as
∗ Corresponding author.E-mail address: [email protected] (A. Garea).
383-5866/$ – see front matter © 2010 Elsevier B.V. All rights reserved.oi:10.1016/j.seppur.2010.09.018
© 2010 Elsevier B.V. All rights reserved.
electronic chemicals. For the particular case of hydrogen perox-ide, the SEMI C30 document is applicable [3], where six differentelectronic grades are defined in function of the allowed maximumpollutant concentration, as can be seen in Table 1.
Although typically commercialized grades of aqueous hydrogenperoxide solutions have been treated by traditional purificationtechniques (L-L extraction, adsorption, membrane technologies,distillation...) for lowering impurity levels [4], hydrogen perox-ide for use in electronics demands very low content of pollutants.Hence, ultrapurification processes are needed to achieve electronicgrade requirements from standard grade product.
While technical viability of hydrogen peroxide ultrapurifica-tion is well solved as commercialization of the different electronicgrades demonstrates, scientific papers hinting process fundamen-tals cannot be found. Therefore, patents become the only availablebibliographic source.
As result of the bibliographical review over the last twentyyears, more than 25 patents relative to purification of hydrogenperoxide have been found. According to the noticed references,distillation, adsorption, ion exchange and membranes technologiesare the most relevant techniques when electronic grade chemical
is desired.Whichever technology is selected, prevention measures to avoidas much as possible contamination from environment and mate-rials are essentials for successful results. The use of cleanroomis a solution for the maintenance of low levels of environmental

R. Abejón et al. / Separation and Purification Technology 76 (2010) 44–51 45
Nomenclature
A solvent permeability coefficient in the SD model(m/s bar)
A′ solvent permeability coefficient in the SDI model(kg/m2 s bar)
CF solute feed concentration (mol/m3)CP solute permeate concentration (mol/m3)CR solute reject concentration (mol/m3)(CS)ln logarithmic average solute concentration across the
membrane (mol/m3)JS flux of the solute due to the gradient of chemical
potential (mol/m2 s)JV permeate volume flux (m/s)JW flux of the solvent due to the gradient of chemical
potential (m/s)K1 membrane transport coefficient in SD model (m/s)K2 membrane transport coefficient in SDI model
(kg/m2 s)K3 coupling coefficient due to the membrane imperfec-
tions (kg/m2 s bar)KA dissociation constant (mol/l)LP hydraulic permeability coefficient (m/s bar)NS total solute flux (kg/m2 s)NW total solvent flux (kg/m2 s)ph local hydraulic permeability in the membrane (m2/s
bar)PM local solute permeability (m/s)R rejection coefficientR gas constant (bar m3/K mol)T temperature (K)xF hydrogen peroxide feed concentration (mol/l)xP hydrogen peroxide permeate concentration (mol/l)XP solute mass fraction on the permeateXS solute mass fraction on the upstream side of the
membraneXW solvent mass fraction on the upstream side of the
membrane
Greek symbolsˇ =JV (1 − �)/PM, Spiegler–Kedem parameter�P pressure difference across the membrane (bar)�x total membrane thickness (m)�� osmotic pressure difference across the membrane
(bar)�Cs difference between the concentration of solute on
either side of the membrane (mol/m3)� stoichiometric coefficient� reflection coefficient
pmo
itefis
g
Table 1Concentration and impurity limits for electronic grade hydrogen peroxide accordingto SEMI standards.
Grade [H2O2] [Most exigent anion] [Most exigent cation]
1 30–32% <2 ppm <10 ppb2 30–32% <200 ppb <5 ppb3 30–32% <200 ppb <1 ppb
ω coefficient of solute permeability (mol/m2 s bar)ω′ modified coefficient of solute permeability (m/s)
ollutants. On the other hand, selection of adequate equipmentaterials is crucial in order to minimize contamination and risk
f accidents [5].The employment of distillation for purifying hydrogen perox-
de is oriented to organic pollutant diminution in greater extensionhan to inorganic impurities [6–8]. Requirements for the least strictlectronic grades can be satisfied if metal concentrations in the
eed solution do not exceed the low ppm level. The requirement ofnert columns made of fluorinated polymers (poor heat conductors)tresses the energy intensiveness of this technique.Very different adsorbents have been tested with aqueous hydro-en peroxide solutions: stannic oxide [9], �-zirconium phosphate
4 30–32% <30 ppb <100 ppt5 30–32% <30 ppb <10 pptVLSI 30–32% or 34–36% <500 ppb <10 ppt
[10] and various non-ionic resins [11,12]. Both organic and inor-ganic pollutants can be removed from the chemical, but attainedmaximum efficiencies (below 80%) are not comparable with resultsreachable by ion exchange or membranes technologies (above99%). Exhausted adsorbents imply waste production, either directlywhen substituted with fresh adsorbent or indirectly when regen-erated. Besides, in the latter case, toxic and hazardous chemicalscould be needed as regenerants.
Ion exchange is the most mentioned ultrapurification technol-ogy, covering a wide range of conditions [13–18]. Multiple-passprocesses are common when strictest electronic grades are desired.Special caution should be recommended when ion exchange resinscontacts with hydrogen peroxide solutions, since hydroxyl groupsas functional moieties in anionic resins or cationic resins highlycharged with transition metallic ions can catalyze violently hydro-gen peroxide decomposition. Again, regeneration of exhaustedresins implies waste streams and employment of hazardous chem-icals (strong acids and bases).
Membrane technologies appear as adequate options for ultra-purifying aqueous hydrogen peroxide. Reverse osmosis is expectedto be the most appropriate membrane technique for elimination ofmetallic traces and other impurities [19–22] and ultrafiltration hasalso reported its potentiality when employed jointly with chelatingchemicals [23]. These chelating agents sequester metallic ions fromfeed solution and keep these pollutants away from permeate, sincenon-permeant chelators must be chosen. Polyamides, polypiperaz-inamides, polyacronitriles, polysulphones and fluoropolymers arerecommended materials for the membranes, although all examplesillustrating patents resort to polyamide membranes.
Among all the ultrapurification alternatives, reverse osmosisemerges as the most desirable technology according to environ-mentally friendly criteria. Auxiliary chemicals are not needed andvirtual zero waste generation is achieved (only damaged mem-branes become residue when replaced after lifetime), since theretentate stream can be recirculated or commercialized as non-electronic grade for other industrial uses. In addition, a greatpercentage of the energy supplied for increasing the pressure ofthe feed stream can be recovered from the retentate by differentsystems [24].
Taking into account the lack of published papers concerning tothe fundamentals of membrane technologies applied to the ultra-purification of aqueous hydrogen peroxide, the present work isfocused on this objective with the study of reverse osmosis to thefurther purification of industrial grade hydrogen peroxide solutionsin order to achieve electronic specifications. The ionic metal impu-rities rejections and permeate flux were evaluated, paying specialattention to the assessment of the permeation parameters of themembranes.
2. Experimental
2.1. Chemicals
Interox ST-35 hydrogen peroxide H2O2 was kindly sup-plied by Solvay Química Torrelavega as raw material for the

46 R. Abejón et al. / Separation and Purification Technology 76 (2010) 44–51
Table 2Main characteristics of the flat-sheet membranes from the supplier.
Designation Manufacturer Material Permeate flow (m3/m2 day) Rejection (%)
AD GE Osmonics Polyamide 0.61 99.5CE GE Osmonics Cellulose acetate 0.96 97
upnaopPAwIii
2
CmflaburpfttodIT
Eqwgeulos
ft
Fr
BE Woongjin Chemical PolyamideCRM Woongjin Chemical PolyamideSW30HR Filmtec PolyamideUTC 80 B Toray Polyamide
ltrapurification process. It is an aqueous 35% (w/w) hydrogeneroxide solution without any type of stabilizers. Prelimi-ary membrane characterization was performed with ultrapurend doped water. Ultrapure water (18.2 M� cm resistivity) wasbtained by a Milli-Q Element (Millipore). Doped water was pre-ared by adding both sodium chloride NaCl (PA-ACS-ISO fromanreac) as sodium source and aluminium chloride anhydrouslCl3 (98% PS from Panreac) as aluminium source to ultrapureater in order to achieve metal concentrations similar to those in
nterox ST-35 hydrogen peroxide. Na and Al were selected for dop-ng the water because these components are the major impuritiesn Interox ST-35 technical grade hydrogen peroxide.
.2. Installation and reverse osmosis membranes
A lab-scale cross-flow flat-sheet configuration test unit SEPAF II from Osmonics was purchased for reverse osmosis experi-ents. The membrane cell can accommodate any 19 cm × 14 cm
at-sheet membranes, resulting 140 cm2 of effective membranerea. Diverse commercially available polymeric flat sheet RO mem-ranes from different manufacturers were preselected for thisltrapurification study. After revision of the patents which employeverse osmosis [19–22], it was clear that polyamide was thereferred membrane material, so manufacturers were contactedor request of their most appropriate polyamide membrane forhe present application. It was also suggested by a manufacturero include a cellulose acetate membrane among the preselectednes because of its lower susceptibility to degradation by oxi-izing agents such as chlorine, hydrogen peroxide or ozone.
nformation about the preselected membranes is summarized inable 2.
The membrane cell was fed by a Hydra-Cell G-03 (Wannerngineering) diaphragm pump equipped with digital variable fre-uency drive to adjust flowrate. Materials of all the componentsere chosen to maximize compatibility with concentrated hydro-
en peroxide. HP PFA tubing was selected for all the installationxcept for the tube joining the pump and the cell (which workednder pressure), where a PTFE tube enhanced with braided stain-
ess steel has been preferred; and the feed tank, which is madef polyethylene (PE). A simple scheme of the entire installation is
howed in Fig. 1.To minimize as possible the contamination by metals comingrom the laboratory environment, the most critical components ofhe ultrapurification system were located under cleanroom condi-
ig. 1. General schematic of the experimental installation for ultrapurification byeverse osmosis.
1.12 99.50.92 99.50.66 99.70.57 99.75
tions. A Bio-48-M vertical laminar flow cabinet (Faster) guaranteedISO Class 5 atmosphere.
2.3. Reverse osmosis experiments
Different tests were carried out with ultrapure and doped watersand aqueous hydrogen peroxide. The feed tank (220 l max. vol-ume) was filled with 180 l of the corresponding fluid and a constantfeed flow of 3.4 l/min was maintained (corresponding to a cross-flow velocity of 0.5 m/s in the membrane cell, value representativefor cross-flow velocities in spiral-wound elements in full-scale ROplants [25]). The different applied pressures were adjusted by thehigh-pressure concentrate control valve supplied with the mem-brane cell. The experiments were performed at room temperature(temperature control was not needed as the temperature rise ofthe chemical in the feed tank during the operation time was neg-ligible taking into account the large volume of this tank) and intotal recycling mode; that is, with permeate and retentate streamsbeing continuously recycled to the reservoir vessel, which assuredconstant characteristics in the feed stream during the whole exper-iment.
As a first step prior to the experiments, membranes were put inultrapure water to soak at least 12 h before the start of the exper-iments. Then, each membrane is flushed with the feed liquid for5 h at a feed pressure of 40 bar to ensure compaction of the mem-branes. In the experiments, the applied pressure in the system wasvaried between 10 and 40 bar. After 15 min of operation undereach pressure, time enough for reaching steady state conditions,the permeate flux was measured and, for the cases of doped waterand hydrogen peroxide, samples for determinating metal concen-trations were taken. Triplicate flux measures and samples wereperformed with 10 min intervals among them. All samples wereanalyzed by inductively coupled plasma mass spectrometry (ICP-MS) with an Agilent 7500ce ICP-MS system for the most exigentSEMI Grade defined metals. A special sample introduction system(ESI Upgrade Kit) made of PFA for resistance to hydrogen peroxidewas necessary. Determination of hydrogen peroxide concentrationwas carried out also for triplicate following the procedure of thesupplier [26].
3. Results and discussion
3.1. Characterization of technical grade hydrogen peroxide
The characterization of technical grade H2O2 35% (w/w) by ICP-MS for the 21 metals required in SEMI C30 most exigent grade isshowed in Table 3. It can be observed a broad range of concentra-tions of impurities, ranging from more than 20,000 ppb of Na toconcentrations below 1 ppb [27].
The technical grade H2O2 exceeds the fixed limits of the less
stringent electronic grade (Grade 1) for 3 metals: Na (1000 ppb),Al (1000 ppb) and Fe (100 ppb). When compared with a moredemanding grade as Grade 3, the number of elements that fail thespecifications (1 ppb for all the metals) increase to 13: B, Na, Mg,Al, K, Ca, Ti, Cr, Mn, Fe, Ni, Cu and Zn.
R. Abejón et al. / Separation and Purification Technology 76 (2010) 44–51 47
Table 3Characterization of technical grade H2O2 by ICP-MS.
Concentration (ppb) Element Concentration (ppb) Element Concentration (ppb)
Li <1 Ti 72 Zn 13B 6 V <1 As <1Na 20895 Cr 48 Cd <1
3 Sn <1161 Sb <1
24 Ba <12 Pb <1
3
macdAiciL
CwBcdmp
1omfblsiialT
R
wt
Fw
Table 4Mean membrane solvent permeability values from ultrapure and doped waterexperiments and comparison with literature References.
Membrane Solvent permeability, Lp (m/s bar)
AD 2.86 ± 0.31 × 10⁻⁷
SW30HR 3.11 ± 0.01 × 10⁻⁷
UTC 80 B 3.83 ± 0.06 × 10⁻⁷
CE 5.04 ± 0.06 × 10⁻⁷
CRM 5.64 ± 0.34 × 10⁻⁷
BE 8.29 ± 0.71 × 10⁻⁷
Other referenced membranesUTC 80 AB [29] 2.33 × 10⁻⁷
ultrapure and doped with sodium and aluminium water, BE wasconsidered as the most promising membrane for hydrogen perox-ide ultrapurification, as showed the highest values for both solventpermeability and rejection coefficients [33].
Mg 17 MnAl 1067 FeK 36 NiCa 89 Cu
.2. Membranes performance with ultrapure and doped water
The preselected membranes were used in preliminary experi-ents with ultrapure and doped water in order to compare them
nd choose the most appropriate one for the ultrapurification pro-ess. Ultrapure water experiments were useful to establish theependence of the permeate flux (Jv) on the applied pressure (�P).s it is showed in Fig. 2 the water fluxes increased with increas-
ng pressures, obtaining a linear relationship with high correlationoefficients. The linear evolution of fluxes shows that Darcy’s laws verified. The slope of this straight line is the solvent permeabilityp which is defined as Jv divided by �P [28].
Both membranes manufactured by Woongjin Chemical (BE andRM) stood out from the rest when their permeate productionsere compared. The other polyamide based membranes (UTC 80, AD and SW30HR) showed a very similar LP value, but it was notomparable with that of the BE membrane, as it was more thanouble. The cellulose acetate membrane CE permeability was inter-ediate between Woongjin Chemical membranes and the rest of
olyamide membranes.When experiments with doped water (15,000 ppb of Na and
,400 ppb of Al) were carried out, the same linear relationship wasbserved and slopes could be calculated. The values of solvent per-eability obtained for ultrapure and doped water are quite similar
or both matrixes as shown in Table 4 (this coincidence betweenoth values was expected as osmotic pressure related to these low
evels of solute concentrations can be considered negligible), whereome information about the solvent permeability values reportedn the literature for other flat-sheet reverse osmosis membraness also included [29–32]. The experiments with doped water werelso suitable for the determination of the efficiency of the prese-ected membranes for metal removal at low ppm concentrations.heir rejection coefficients (R) were defined by the equation:
= CF − CP
CF(1)
here CF and CP represent the metal concentrations measured inhe feed and permeate streams, respectively. These coefficients for
0,00E+00
1,00E-05
2,00E-05
3,00E-05
4,00E-05
50403020100ΔP (bar)
J v (m
/s)
CRMBEUTC 80 BCEADSW30HR
ig. 2. Determination of the solvent permeability of the membranes for ultrapureater.
UTC 80 AB [30] 2.62 × 10⁻⁷
LFC1 [31] 8.20 × 10⁻⁷
TFC-HR [32] 9.72 × 10⁻⁷
Na and Al were determined in the doped water experiments per-formed with the membranes and the results obtained are plot inFig. 3.
BE membrane reached the greatest values of rejection coeffi-cients: 0.992 and 0.999 for sodium and aluminium respectively.CRM membrane performance was very close to BE (0.990 and0.998). As occurred with permeabilities, Woongjin Chemical mem-branes obtained rejection coefficients were higher than those ofthe other three polyamide membranes. These three membranesshowed again a very similar behaviour except for the UTC 80 Blower values for aluminium. CE was the least effective membranefor sodium removal but exceeded UTC 80 B for aluminium.
As a conclusion of the preliminary experiments carried out with
0,92
0,94
0,96
0,98
1,00
50403020100
RA
l
AD
SW30HR
BE
UTC
CE
CRM
0,820,850,880,910,94
0,971,00a
b
50403020100ΔP (bar)
ΔP (bar)
RN
a
AD
SW30HR
BE
UTC
CE
CRM
Fig. 3. Influence of the operating pressure on sodium (a) and aluminium (b) rejectioncoefficients for doped ultrapure water.

4 rification Technology 76 (2010) 44–51
3
3
toppt
••
•
•
(
x
wpibotosiw
ihhptuHbv2alic
Fs
y = 4.92E-07xR2 = 0.999
y = 8.79E-07xR2 = 0.992
0,00E+00
5,00E-06
1,00E-05
1,50E-05
2,00E-05
2,50E-05
3,00E-05
3,50E-05
4,00E-05
50403020100ΔP (bar)
J v (m
/s)
PeroxideUPW
8 R. Abejón et al. / Separation and Pu
.3. Ultrapurification of commercial grade hydrogen peroxide
.3.1. Permeation of hydrogen peroxideThe ion exclusion model can be considered for a first approxima-
ion to assess the permeation of hydrogen peroxide through reversesmosis membranes. This model has been applied for estimatingermeation of weakly dissociated compounds in ultrapurificationrocesses by membranes technology [34]. The following assump-ions are made in its derivation:
All ions are excluded by the membrane (double layer effect).All species in molecular form permeate the membrane com-pletely.Perfect mixing conditions prevail on the retentate and permeatesides of the membrane.Concentration polarization is ignored.
The final equation for estimating the permeate concentrationxP) from the feed concentration (xF) is:
P = xF −√
KA · xF −√
KA(xF −√
KA · xF) (2)
here KA is the dissociation constant (KA = 1.78 × 10⁻¹² M for thearticular case of hydrogen peroxide). When the feed concentration
s 35% (w/w) (corresponding to xF = 10.3 M), the rejection coefficientecame negligible (R < 10−6). This means no theoretical dilutionf aqueous hydrogen peroxide solutions when forced to permeatehrough reverse osmosis membranes. Experimental determinationf hydrogen peroxide concentration in both feed and permeatetreams confirmed the hypothesis as showed in Fig. 4, so the valid-ty of reverse osmosis for aqueous hydrogen peroxide solutions
ithout dilution or concentration effects was asserted.The variation of the experimental permeate flux, Jv, with the
ncrease in the applied pressure for both ultrapure water and 35%ydrogen peroxide is showed in Fig. 5. The linear relationship withigh correlation coefficient was also observed for the hydrogeneroxide case and a LP value of 4.92 × 10⁻⁷ was calculated fromhe slope, which entailed a decrease of 44% in comparison withltrapure water. The LP parameter can be interpreted based on theagen–Poiseuille flow and an inversely proportional relationshipetween LP and the viscosity of the solution is obtained [35]. Thealues of viscosity of ultrapure water and 35% hydrogen peroxide at0 ◦C are 1.00 and 1.11 mPa s respectively [4], so a decrease of only
bout 10% can be explained in terms of viscosity variation of theiquid phase. Complex chemical interactions deserving of furthernvestigation between 35% hydrogen peroxide and the membraneould explain the drop of permeate production.34,0
34,5
35,0
35,5
36,0
36,5
37,0
Perm (34 bar)Perm (24 bar)Perm (20 bar)Feed
H 2O2 c
once
ntra
tion
(%)
ig. 4. Hydrogen peroxide concentration on feed and BE membrane permeatetreams (maximum, medium and minimum values are plotted)
Fig. 5. Comparison of BE membrane solvent permeability for ultrapure water (UPW)and 35% H2O2 (Peroxide).
Experimental tests were designed to investigate the ability ofthe selected membrane to withstand the highly oxidative environ-ment of H2O2. Fresh samples of the BE membrane (without previousexposition to H2O2 and designed as Membrane2 and Membrane3)were subjected to 8-hours lasting experiments during several con-secutive days until total operation times of at least 64 hours werecompleted. The applied pressure was maintained at 40 bar exceptfor the characterization intervals when the influence of this opera-tion variable upon permeate flux and metal rejections was studied(8 regularly spaced over time characterization intervals of 2 hourseach were fixed).
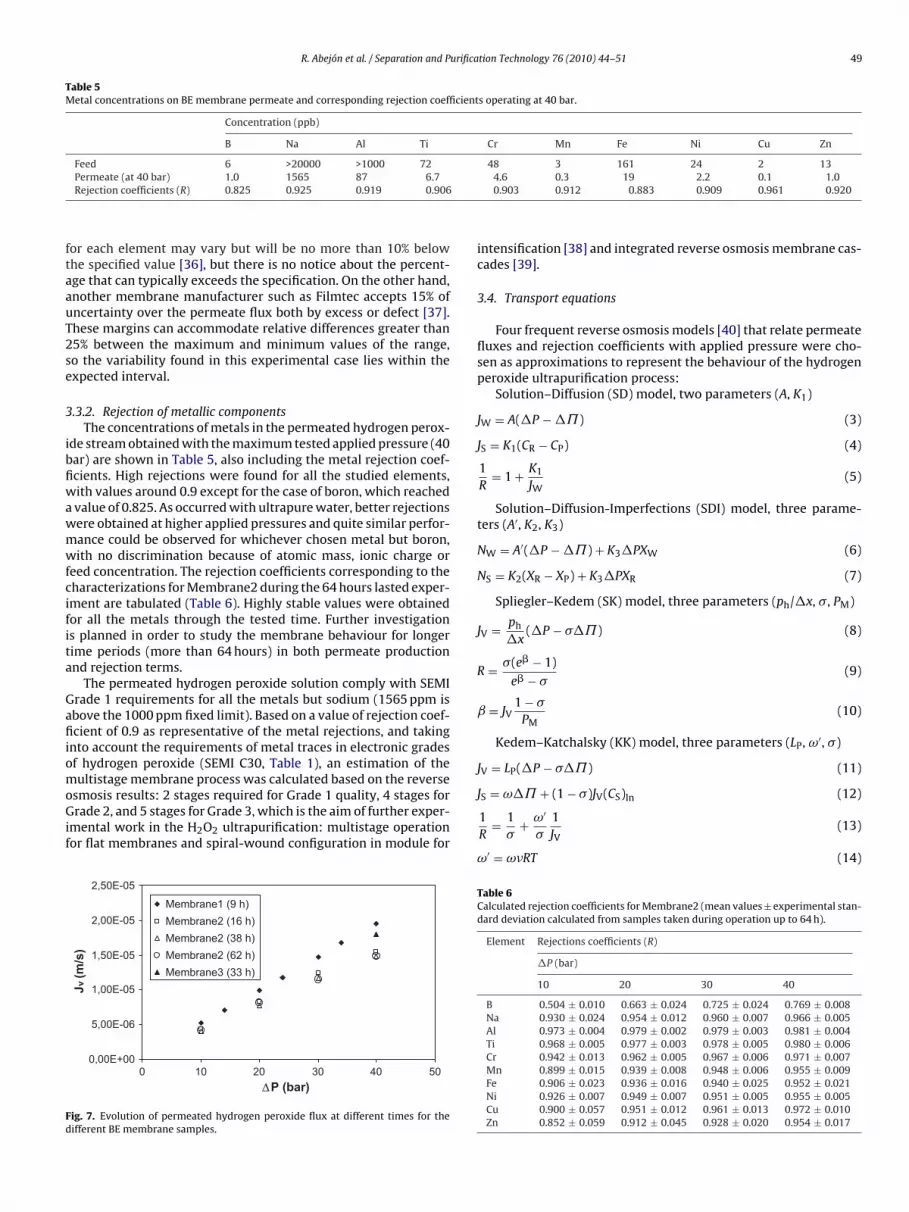
The evolution of the Membrane2 permeate production throughthe test when operating at 40 bar is shown in Fig. 6 and a very stablebehaviour can be observed. The influence of applied pressure uponpermeate flux of the different membrane samples is depicted inFig. 7: the results of 3 characterization intervals for Membrane2and a single result for Membrane3 were chosen for representing theperformance during the experiment. The permeate flux maintainedagain a constant performance, as proved by the superposition ofthe data from different intervals. An assessed standard deviationof 3.17% for the Membrane2 permeability coefficient LP confirmedthe flux stability.
When compared with the sample used during the preliminaryexperiments (designed as Membrane1 in Fig. 7), the Membranes2 and 3 were noted for its slightly lower permeate flux. In termsof LP values, this difference is below 5% in the case of Membrane3(LP = 4.68 × 10⁻⁷ m/s bar) and is lesser than 22% for Membrane2
(LP = 3.86 × 10⁻⁷ m/s bar) and the discrepancy can be explainedby the intrinsic variability among samples of the reverse osmosismembranes. Woongjin Chemical, the manufacturer of BE mem-brane, informs about this small uncertainty as permeate flow rate0,00E+00
5,00E-06
1,00E-05
1,50E-05
2,00E-05
706050403020100Time (h)
Jv (m
/s)
Fig. 6. Measured permeate fluxes through the hydrogen peroxide ultrapurificationprocess by Membrane2 sample at 40 bar.
R. Abejón et al. / Separation and Purification Technology 76 (2010) 44–51 49
Table 5Metal concentrations on BE membrane permeate and corresponding rejection coefficients operating at 40 bar.
Concentration (ppb)
B Na Al Ti Cr Mn Fe Ni Cu Zn
Feed 6 >20000 >1000 72 48 3 161 24 2 13
ftaauT2se
3
ibfiwawmwfcifita
GafiiomoGif
Fd
Permeate (at 40 bar) 1.0 1565 87 6.7Rejection coefficients (R) 0.825 0.925 0.919 0.906
or each element may vary but will be no more than 10% belowhe specified value [36], but there is no notice about the percent-ge that can typically exceeds the specification. On the other hand,nother membrane manufacturer such as Filmtec accepts 15% ofncertainty over the permeate flux both by excess or defect [37].hese margins can accommodate relative differences greater than5% between the maximum and minimum values of the range,o the variability found in this experimental case lies within thexpected interval.
.3.2. Rejection of metallic componentsThe concentrations of metals in the permeated hydrogen perox-
de stream obtained with the maximum tested applied pressure (40ar) are shown in Table 5, also including the metal rejection coef-cients. High rejections were found for all the studied elements,ith values around 0.9 except for the case of boron, which reachedvalue of 0.825. As occurred with ultrapure water, better rejectionsere obtained at higher applied pressures and quite similar perfor-ance could be observed for whichever chosen metal but boron,ith no discrimination because of atomic mass, ionic charge or
eed concentration. The rejection coefficients corresponding to theharacterizations for Membrane2 during the 64 hours lasted exper-ment are tabulated (Table 6). Highly stable values were obtainedor all the metals through the tested time. Further investigations planned in order to study the membrane behaviour for longerime periods (more than 64 hours) in both permeate productionnd rejection terms.
The permeated hydrogen peroxide solution comply with SEMIrade 1 requirements for all the metals but sodium (1565 ppm isbove the 1000 ppm fixed limit). Based on a value of rejection coef-cient of 0.9 as representative of the metal rejections, and taking
nto account the requirements of metal traces in electronic gradesf hydrogen peroxide (SEMI C30, Table 1), an estimation of the
ultistage membrane process was calculated based on the reversesmosis results: 2 stages required for Grade 1 quality, 4 stages forrade 2, and 5 stages for Grade 3, which is the aim of further exper-
mental work in the H2O2 ultrapurification: multistage operationor flat membranes and spiral-wound configuration in module for
0,00E+00
5,00E-06
1,00E-05
1,50E-05
2,00E-05
2,50E-05
50403020100ΔP (bar)
J v (m
/s)
Membrane1 (9 h)Membrane2 (16 h)Membrane2 (38 h) Membrane2 (62 h)Membrane3 (33 h)
ig. 7. Evolution of permeated hydrogen peroxide flux at different times for theifferent BE membrane samples.
4.6 0.3 19 2.2 0.1 1.00.903 0.912 0.883 0.909 0.961 0.920
intensification [38] and integrated reverse osmosis membrane cas-cades [39].
3.4. Transport equations
Four frequent reverse osmosis models [40] that relate permeatefluxes and rejection coefficients with applied pressure were cho-sen as approximations to represent the behaviour of the hydrogenperoxide ultrapurification process:
Solution–Diffusion (SD) model, two parameters (A, K1)
JW = A(�P − �˘) (3)
JS = K1(CR − CP) (4)
1R
= 1 + K1
JW(5)
Solution–Diffusion-Imperfections (SDI) model, three parame-ters (A′, K2, K3)
NW = A′(�P − �˘) + K3�PXW (6)
NS = K2(XR − XP) + K3�PXR (7)
Spliegler–Kedem (SK) model, three parameters (ph/�x, �, PM)
JV = ph
�x(�P − ��˘) (8)
R = �(e� − 1)e� − �
(9)
ˇ = JV1 − �
PM(10)
Kedem–Katchalsky (KK) model, three parameters (LP, ω′, �)
JV = LP(�P − ��˘) (11)
JS = ω�˘ + (1 − �)JV(CS)ln (12)
1R
= 1�
+ ω′
�
1JV
(13)
ω′ = ω�RT (14)
Table 6Calculated rejection coefficients for Membrane2 (mean values ± experimental stan-dard deviation calculated from samples taken during operation up to 64 h).
Element Rejections coefficients (R)
�P (bar)
10 20 30 40
B 0.504 ± 0.010 0.663 ± 0.024 0.725 ± 0.024 0.769 ± 0.008Na 0.930 ± 0.024 0.954 ± 0.012 0.960 ± 0.007 0.966 ± 0.005Al 0.973 ± 0.004 0.979 ± 0.002 0.979 ± 0.003 0.981 ± 0.004Ti 0.968 ± 0.005 0.977 ± 0.003 0.978 ± 0.005 0.980 ± 0.006Cr 0.942 ± 0.013 0.962 ± 0.005 0.967 ± 0.006 0.971 ± 0.007Mn 0.899 ± 0.015 0.939 ± 0.008 0.948 ± 0.006 0.955 ± 0.009Fe 0.906 ± 0.023 0.936 ± 0.016 0.940 ± 0.025 0.952 ± 0.021Ni 0.926 ± 0.007 0.949 ± 0.007 0.951 ± 0.005 0.955 ± 0.005Cu 0.900 ± 0.057 0.951 ± 0.012 0.961 ± 0.013 0.972 ± 0.010Zn 0.852 ± 0.059 0.912 ± 0.045 0.928 ± 0.020 0.954 ± 0.017

50 R. Abejón et al. / Separation and Purification Technology 76 (2010) 44–51
Table 7Evaluation of the fitting of the experimental data by the proposed osmosis reversemodels.
Model SD SDI KK SK
Percentage of overall variation explained (%) 79.0 88.8 94.4 94.1
0,4
0,5
0,6
0,7
0,8
0,9
1,0
50403020100ΔP (bar)
R
B mod
B exp
Na modNa exp
Al mod
Al expFe mod
Fe exp
Fo
aearsvadowama
mcpsemorabo
Table 9Percentage contribution of the diffusive term to the total solute fluxes.
�P Diffusive contribution to total solute flux (%)Element
B Na Al Ti Cr Mn Fe Ni Cu Zn
10 100 59 62 68 75 100 83 65 100 9214 100 52 55 62 71 100 80 59 100 9020 100 45 48 55 66 100 76 52 100 8924 100 41 44 52 63 100 74 49 100 88
RO system under study, the contribution of both terms has been cal-
TA
ig. 8. Kedem–Katchalsky model applied to the experimental rejection coefficientsf the main metallic impurities.
With the experimentally obtained values for permeate flux (JV)nd metal rejections (R) as functions of the applied pressure, thestimation of the parameters in these models was performed bysoftware tool (Aspen Custom Modeler). The osmotic pressure
elated term in the equations describing the solvent flux was con-idered as negligible (as suggested by the agreement between thealues of solvent permeability for ultrapure and doped water) forll the models. The agreement of the models to the experimentalata was quantified as the percentage of variation explained for theverall system. As reported in Table 7, best results were obtainedith the Kedem–Katchalsky model, which obtained parameters
re summarized in Table 8. In the pressure operation range, theodel adequately describes the experimental data permeate flux
nd metal rejections (see Fig. 8).Related to the transport parameters in the Kedem–Katchalsky
odel, Eqs. (11)–(14), three practical parameters are required toharacterize each membrane + solution system: LP, is the hydraulicermeability of the membrane; ω, is called the solute mobility (orolute permeability); and �, the reflection coefficient. The param-ters LP and ω depend strongly on the thickness of the selectiveembrane and correlations between the practical parameters in
rder to compare different membranes are valid only when the
esults are normalized to layers of the same thickness. Moreover, �nd ω depend strongly on the nature of each solute and they maye used to relate the ability of the separation respect to the soluter solutes (also expressed in the values of rejection coefficients, R).able 8ssessment of the Kedem-Katchalsky model parameters: transports coefficients ω′ , � and
B Na Al Ti Cr
Hydrogen peroxideω′ (m/s) 5.58 × 10⁻⁶ 2.60 × 10⁻⁷ 3.38 × 10⁻⁷ 5.11 × 10⁻⁷ 7.19 × 1� 1.000 0.926 0.920 0.917 0.925LP (m/s bar) 4.92 × 10⁻⁷
Percentage of overall variation explained (%) = 94.4
Doped ultrapure waterω′ (m/s) 1.36 × 10⁻⁷ 3.15 × 10⁻⁸
� 0.995 1.000LP (m/s bar) 7.79 × 10⁻⁷
Percentage of overall variation explained (%) = 89.4
30 100 36 39 47 58 100 71 43 100 8534 100 34 37 45 55 100 69 40 100 8440 100 32 35 43 53 100 68 38 100 85
The physical meaning of ω can be clearly seen by applying Eq.(12) to a situation in which Jv is zero or no net volume flux. Keepingin mind the van’t Hoff equation for the osmotic pressure of an idealsolution (� = �RTCS) and setting Jv equal to zero in Eq. (12) gives
(Js)Jv=0 = �ωRT�CS (15)
where �CS is the difference between the concentration of soluteon either side of the membrane.
Comparing Eq. (15) with Fick’s law of diffusion, it is seen that ωgives a measure of the diffusion mobility of each solute across themembrane.
Eq. (13), which relates the rejection coefficient of each solute, R,to the transport parameters can be rearranged as
R = �JvJv + ω′ (16)
showing that the rejection increases with increasing solution fluxand reaches a limiting value � at infinitely high Jv. As the diffusiveflux of the solutes can be neglected in the range of high Jv (operationat high pressures), the reflection coefficient � is a characteristic ofthe convective transport of the each solute; a value of 1 meansthat no transport by convection takes place at all. This may be thecase for ideal RO membranes where the membranes have densestructure and no pores are available for convective transport.
As can be seen in Eq. (12), also expressed as follows
JS = ω′�CS + (1 − �)JV(CS)ln (17)
the flux of each solute across the membrane is the sum of diffu-sive and convective terms: a concentration difference on both sidesof the membrane causes diffusive transport, and solute transportby convection takes place because of an applied pressure gradientacross the membrane.
In order to quantify these convective and diffusive terms [41] forthe case of the metal components present in the hydrogen peroxide
culated from the experimental data and the transport parameters;and it is shown in Table 9 as the percentage of solute flux due todiffusion for each metal and pressure related to the total solute fluxJs. At low pressures, when Jv is low, the first term of the solute flux
LP for both hydrogen peroxide solution and doped ultrapure water.
Mn Fe Ni Cu Zn
0−7 2.50 × 10⁻⁶ 1.40 × 10⁻⁶ 4.03 × 10⁻⁷ 1.17 × 10⁻⁶ 1.53 × 10⁻⁶
1.000 0.928 0.920 1.000 0.964

urifica
(t
eatCtfttb
tiKf
4
tdptf
resv
A
o0Mfmg
R
[
[
[
[
[
[
[
[
[
[
[
[
[
[
[
[
[
[
[
[
[
[
[
[
[
[
[
[
[
[
R. Abejón et al. / Separation and P
diffusive term) is dominant, while at high pressures the seconderm (convective) increases to be dominant.
The obtained results of the contribution of the diffusive term toach total solute flux (Table 9), show that the elements B, Mn and Cure controlled totally by diffusive transport (in concordance withhe value of the parameter � = 1 obtained for these components).omponents as Zn, Fe, and Cr show diffusional contributions higherhan 50% to their total flux in the range of pressure operation, whileor the rest of the components: Na, Al, Ti and Ni, the convectiveransport contributes significantly (values of diffusive term lowerhan 50%) when the system operates at pressures higher than 20ar.
Related to the application of the selected transport modelhrough the membrane lifetime, satisfactory results were obtainedn terms of percentage of overall variation explained by theedem–Katchalsky model as a mean value of 93.4% was obtained
or the different characterization intervals of the experiment.
. Conclusions
Commercially available RO polyamide membrane BE (manufac-ured by Woongjin Chemical) has been successfully applied to theiminution of metallic contents of 35% Technical Grade hydrogeneroxide in the pressure range between 10 and 40 bar for exposi-ion time up to 64 h. Rejection coefficients above 0.9 were obtainedor most metals.
The Kedem–Katchalsky model can be considered suitable forepresenting the performance of the reverse osmosis process whenmployed in the ultrapurification of aqueous hydrogen peroxideolutions from technical to electronic grade, as 94.4% of the overallariation of the system was explained by the proposed model.
cknowledgements
This research has been financially supported by the Ministryf Science and Innovation of Spain (MICINN) through CTM2006-0317 Project. R. Abejón acknowledges also the assistance ofICINN for the award of a FPI grant (BES-2008-003622). We grate-
ully thank Dow Filmtec and Woongjin Chemicals for the suppliedembranes and Solvay Torrelavega for the industrial grade hydro-
en peroxide.
eferences
[1] E.D. Olson, C.A. Reaux, W.C. Ma, J.W. Butterbaugh, Alternatives to standard wetcleans, Semicond. Int. 23 (2000) 70–75.
[2] J. Atsumi, S. Ohtsuka, S. Munehira, K. Kajiyama, Metallic contamination on Siwafers from cleaning solutions, Proc. Electrochem. Soc. 90 (1990) 59–66.
[3] Semiconductor Equipment and Material International Association (SEMI®),Specifications and Guidelines for Hydrogen Peroxide, SEMI Document C30-1101, 2001.
[4] G. Goor, J. Glenneberg, S. Jacobi, Hydrogen peroxide, in: Ullmann’s Encyclopediaof Industrial Chemistry, Electronic Release, Wiley-VCH, Weinheim, 2007.
[5] J. Mackenzie, Hydrogen peroxide without accidents, Chem. Eng. 97 (1990)84–90.
[6] L. Signori, K. Glinos, Process for obtaining purified aqueous hydrogen peroxidesolutions, US Patent 5296104 (1994).
[7] Y. Inaba, Y. Ueno, M. Watanabe, Y. Nishida, Process for preparing high purityhydrogen peroxide aqueous solution, US Patent 5670028 (1997).
[8] P. Johnsson, T. Mattila, K. Saari, Process for preparing a substantially pure aque-ous solution of hydrogen peroxide, US Patent 5705040 (1998).
[9] G.W. Morris, N.D. Feasey, Purification of hydrogen peroxide, US Patent 5262058(1993).
10] J.L. Manganaro, D. Gibilisco, J.R. Reed, T. Frianeza-Kullberg, Process for removingiron from hydrogen peroxide, US Patent 5266298 (1993).
[
[
tion Technology 76 (2010) 44–51 51
11] H. Honig, S. Geigel, Method for purifying hydrogen peroxide for microelectron-ics uses, US Patent 5232680 (1993).
12] Y. Nishide, Y. Minamikawa, J. Kokubu, Method of producing purified aqueoussolution of hydrogen peroxide, US Patent 5851505 (1998).
13] Y. Minamikawa, S. Murakami, M. Hattori, Process for producing a purified aque-ous hydrogen peroxide solution, US Patent 5733521 (1998).
14] H. Ledon, M. Carre, D. Demay, C. Devos, S. Jeanin, Process for the preparationof an ultra pure hydrogen peroxide solution by the ion exchange by sequence:anionic-cationic-anionic-cationic, US Patent 5961947 (1999).
15] N. Saito, M. Izumi, Method of purifying aqueous solution of hydrogen peroxide,US Patent 6054109 (2000).
16] M.D. Havlicek, J.G. Hoffman, W. Yuan, Integrated method of preconditioning aresin for hydrogen peroxide purification and purifying hydrogen peroxide, USPatent 6537516 B2 (2003).
17] F. Tanaka, S. Sugawara, T. Adachi, K. Mine, Process for producing a purifiedaqueous hydrogen peroxide solution, US Patent 6896867 (2005).
18] D. Oeter, C. Dusemund, E. Neumann, K. Freissler, M. Hostalek, Method for thepurification of hydrogen peroxide solutions, US Patent 6939527 B2 (2005).
19] J.H. Boughton, R.A. Butz, H.C.T. Cheng, J.R. Dennis, B.T. Hannon, J.H. Weigel,Manufacture of high purity hydrogen peroxide by using reverse osmosis, USPatent 4879043 (1989).
20] A. Morisaki, Y. Sawaguri, Y. Matsuda, Apparatus and method for removingimpurities from aqueous hydrogen peroxide, US Patent 5906738 (1999).
21] U.P. Bianchi, U. Leone, M. Lucci, Process for the industrial production of highpurity hydrogen peroxide, US Patent 6333018 B2 (2001).
22] R. Owen, J. Bosse, M. Sell, Process for the purification of aqueous peroxygensolutions, solutions obtainable thereby and their use, WO Patent 2005/033005A1 (2005).
23] J.M. Dhalluin, J.J. Wawrzyniak, H. Ledon, Process for the purification of hydrogenperoxide, US Patent 6113798 A (2000).
24] M. Farinas, Osmosis inversa: fundamentos, tecnología y aplicaciones, McGraw-Hill, Madrid, 1999.
25] GE Water & Process Technologies, SEPA CF II Membrane Element Cell instruc-tion manual, 2004.
26] Solvay Chemicals Incorporation, Determination of hydrogen peroxide concen-tration (20% to 70%). Technical Data Sheet, 2008.
27] R. Abejón, A. Garea, A. Irabien, Use of reverse osmosis for ultrapurification ofhydrogen peroxide to semiconductor grade, in: II International Green ProcessEngineering Congress and European Process Intensification Conference (GPE-EPIC 2009), 2009.
28] F.J. Benítez, J.L. Acero, A.I. Leal, Application of microfiltration and ultrafiltrationprocesses to cork processing wastewaters and assessment of the membranefouling, Sep. Purif. Technol. 50 (2006) 354–364.
29] H. Koseoglu, M. Kitis, The recovery of silver from mining wastewaters usinghybrid cyanidation and high-pressure membrane process, Miner. Eng. 22(2009) 440–444.
30] H. Koseoglu, N. Kabay, M. Yüksel, S. Sarp, Ö. Arar, M. Kitis, Boron removal fromseawater using high rejection SWRO membranes - impact of pH, feed concen-tration, pressure and cross-flow velocity, Desalination 227 (2008) 253–263.
31] Y.N Kwon, J.O. Leckie, Hypochlorite degradation of crosslinked polyamidemembranes II. Changes in hydrogen bonding behavior and performance, J.Membr. Sci. 282 (2006) 456–464.
32] P. Xu, J.E. Drewes, Viability of nanofiltration and ultra-low pressure reverseosmosis membranes for multi-beneficial use of methane produced water, Sep.Purif. Technol. 52 (2006) 67–76.
33] R. Abejón, A. Garea, A. Irabien, Reverse osmosis for the ultrapurification ofaqueous hydrogen peroxide to electronic grade, EUROMEMBRANE 2009.
34] A. Kulkarni, D. Mukherjee, D. Mukherjee, W.N. Gill, Reprocessing hydrofluoricacid etching solutions by reverse osmosis, Chem. Eng. Commun. 129 (1994)(1994) 53–68.
35] T. Tsuru, M. Miyawaki, T. Yoshioka, M. Asaeda, Reverse osmosis of nonaque-ous solutions through porous silica-zirconia membranes, AIChE J. 52 (2006)522–531.
36] Woongjin Chemical Company, Model RE 4040-BE Product Specification Sheet,Specification Sheet Rev. 2411112 04/15/07 (2007).
37] Filmtec, FILMTEC SW30HR-380 High Rejection Seawater RO Element, Form N◦
609-00390-1008.38] E. Bringas, M.F. San Román, J.A. Irabien, I. Ortiz, An overview of the mathe-
matical modelling of liquid membrane separation processes in hollow fibrecontactors, J. Chem. Technol. Biotechnol. 84 (2009) 1583–1614.
39] A. Caus, L. Braeken, K. Boussu, B. Van der Bruggen, The use of integrated coun-tercurrent nanofiltration cascades for advanced separations, J. Chem. Technol.Biotechnol. 84 (2009) 391–398.
40] M. Soltanieh, W.N. Gill, Review of reverse osmosis membranes and transportmodels, Chem. Eng. Commun. 12 (1981) 279–363.
41] M. Pontié, H. Dach, J. Leparc, M. Hafsi, A. Lhassan, Novel approach combiningphysico-chemical characterizations and mass transfer modelling of nanofil-tration and low pressure reverse osmosis membranes for brackish waterdesalination intensification, Desalination 221 (2008) 174–191.


![Elastic response of [111]-tunnelling impurities](https://img.pdfslide.net/doc/110x75/6344c9f138eecfb33a063ffe/elastic-response-of-111-tunnelling-impurities.jpg)


