Embed Size (px)
Citation preview
University of Zimbabwe
Business ReviewVolume 1, No. 1 September 2013 ISSN 1819-2971
UZBReview
UZBR Tel.: +263-4-303211 Ext. 13000Faculty of Commerce Email: [email protected]. Box MP 167 Website: www.uzbr.co.zwMount PleasantHarare
University of Zimbabwe Business ReviewVolume 1, No. 1, September 2013, ISSN 1819-2971
EDITOR-IN-CHIEFProf. I. Chaneta
DEPUTY EDITOR-IN-CHIEFDr. N. Kaseke
EDITORIAL BOARD MEMBERSDr. T. Munyanyiwa University of Zimbabwe
Dr. D. Madzikanda University of Zimbabwe
Dr. W. Mkumbuzi University of Zimbabwe
Mr. J. Mutambwa University of Zimbabwe
Mr. A. Mhizha University of Zimbabwe
Mr. Ndamba University of Zimbabwe
EDITORIAL ADVISORY BOARDDr. P. Joubert University of Swaziland
Prof. S.G. Hosking Nelson Mandela MetropolitanUniversity
Mr. G. Mandebvu University of Zimbabwe
The University of Zimbabwe Business Review (UZBR) is a quarterly refereed research journal of the Faculty ofCommerce, University of Zimbabwe. The aim of UZBR is to facilitate the publication and dissemination of researchin management, accounting, economics and related fields.
Submissions and correspondence to:
The Editor-in-ChiefUniversity of Zimbabwe Business ReviewFaculty of CommerceP. O. Box MP 167Mount PleasantHarareZimbabwe
Tel: 263-4-303211 ext 13018Email: [email protected]
Contents
Survival strategies of small firms located in a Marshallian Industrial District:A case study of Zimbabwe’s furniture manufacturing industry
Godfrey Muponda ............................................................................................................. 1
Marketing managers’ perceptions of the applicability of Ashridge missionmodel to organisations in Zimbabwe
Noel Muzondo, Frank Gwavuya, Judias P Sai, Nyasha Kaseke ....................................... 13
Service-delivery of non-governmental organizations in Zimbabwe:Challenges and stategies
Alice Zinyemba, Ranga Zinyemba .................................................................................... 22
Deposit-attracting strategies in the financial sector in a multi-currency setting:The case of commercial banks in Zimbabwe
Vinicent Machona, Nyasha Kaseke ................................................................................... 32
Environmental reporting: An evaluation of the Zimbabwe StockExchange-listed companies annual reports — 2008
Rodney Ndamba ................................................................................................................ 45
Organisations’ social sesponsibilityIsaac Chaneta ..................................................................................................................... 55

Survival strategies of small firms located in a Marshallian Industrial District
University of Zimbabwe Business Review, Volume 1, No. 1, 2013 1
Survival strategies of small firms located in a Marshallian Industrial
District: A case study of Zimbabwe’s furniture manufacturing industry
Godfrey MupondaDepartment of Business Studies, University of Zimbabwe
ABSTRACTThe growth and survival strategies of Zimbabwe’s small firms located in geographical clustershave been largely shaped by historical developments in the ‘informal sector’. In spite of theplethora of problems that they face, these firms make a significant contribution toemployment creation and income generation. Four factors are responsible for the success ofthese firms: territorial specificity; competitive strategy; flexible specialization and co-operativecompetition. It is recommended that policy interventions be instituted to attract more capitalinto the clusters, eliminate “cluster isolation” (access to markets and new technology) andincrease the technological capabilities of the firms in the clusters.
Key words: Marshallian Industrial District; Sectoral specificity; territorial specificity; Flexible specialization; co-operative competition
1. EMERGENCE OF SMALL-FIRM CLUSTERS IN ZIMBABWEIn recent years, clusters of small businesses have emerged in various parts of Zimbabwe as a coping mechanismfor various challenges emanating from a decade-long economic meltdown that lasted until the middle of2008.
Various studies on small-firm clusters in other countries have shown that small-scale enterprises operatingin isolation may face a disadvantage in the form of limitations in scope and scale (Uzor, 2004). However,firms operating as part of a group in geographical proximity may compensate for these disadvantages throughtheir interaction with each other and with other agencies, such as traders, or other organizations (McCormick,1997; Nadvi, 2001; Van Dijk and Rabellotti, 1997; Visser, 2004). It has been observed that a relatively highdensity of similar activities in a geographical area translates into a relatively large local demand for certaingoods and services thereby increasing supply (Bhalla, 2005; Visser, 2004 p 64).
The business clusters in other countries have evolved from mere clusters into Marshallian Industrial Districts(Pedersern, Sverrisson and van Dijk, 1994). These are clusters that are characterised by the sectoral specificityand spatial concentration of small firms (Kelley, 2004; Nadvi, 2001). Sectoral specificity or sectoral specialisationrefers to the existence of firms engaged in a distinct industrial activity. Spatial concentration refers to thelocation of firms in the same geographic area in close proximity to each other (McCormick , 1997; Oyelaran-Oyeyinka and McCormick , 2003; Schmitz , 2002). The firms within the locality will be competing with oneanother and against other large and medium-scale enterprises outside the district (Rabellotti, 1997, p8).
In Africa, empirical evidence on the phenomenon of small firms operating as business clusters has beengathered in Kenya by McCormick (1998), where they are referred to as jua kali sites, a Swahili term for smallbusinesses operating in the “hot sun”. Furuya, Futakuchi and Sakurayi (2006), in their study of rice milerclusters in Ghana, also make reference to the existence of such clusters in other parts of the world such asBrazil (Sinos Valley), India (Turuppur and Ludhiana), Kenya (Ziwani), Mexico (Guadalajara), Pakistan(Sialkot) and Italy (North-east and Central Italy). The small-firm clusters in Zimbabwe appear to have thesame characteristics as those found in other countries.
In Zimbabwe, the growth and survival strategies of small firms located in geographical clusters have beenlargely shaped by the past developments in the ‘informal sector’ (Bell, 2002; Chirisa, 2009; Kapoor, 1997;Government of Zimbabwe, 2004; Pearson, and Hungwe, 1997). Though not much is known about the exactsize of the ‘informal sector’ in Zimbabwe today, a study by the Confederation of Zimbabwe Industries (CZI)
G. Muponda
2 University of Zimbabwe Business Review, Volume 1, No. 1, 2013
found that in November 2000, at least 1.7 million people were making their living from the ‘informalsector’. Tibaijuka (2005) also reported that by 2004 the ‘informal sector’ was contributing 40% of totalemployment in Zimbabwe and by that year the ‘informal economy’ had effectively become the mainstay forthe majority of Zimbabweans. The ILO also reported in June, 2005 that 3 to 4 million Zimbabweans earnedtheir living through informal sector employment, supporting another 5 million people, while the formalsector employed about 1.3 million people.
Small firms in Zimbabwe have had to face a plethora of problems emanating from two challenges in therecent history of the country.
The first and foremost challenge is that the firms are operating in a sea of poverty and low-incomes (Mhone,2002). This results in a low demand for products and intense competition for customers. The Confederationof Zimbabwe Industries (CZI) reported that from 2006 to 2009 more than thirteen thousand employeeswere formally retrenched in the manufacturing sector with the approval of the Ministry of Labour. Thegrowth rate of unemployment during this three-year period alone was 130 per cent per year (Mpemba,2010). In June 2007 (CZI) reported that 80 percent of the labour force in Zimbabwe was unemployed (CZI,2007). CZI also reported that in 2008 the manufacturing sector was producing 30 per cent of what it used toproduce in 2003 and more than 75 per cent of firms in the manufacturing sector were operating at less than50 per cent capacity utilisation, with only 4 per cent operating above 75 per cent, indicating very high levelsof unemployment for the whole economy (CZI, 2008).
The Labour Force Survey carried out by the Zimbabwe Central Statistical Office (CSO) in 2004 found thatthose between the age groups of 15 and 24 years were the most affected by unemployment, taking up to 57per cent of the unemployed. It was also found that the largest single group of the ‘economically inactive’population consisted of students (37 per cent) (Fashoyin, 2008:27).
The second challenge is that between 2006 and 2008 Zimbabwe experienced unprecedented inflation levelsfor a country not at war, as shown in the Table 1 below:
Table 1: Inflation rates in Zimbabwe (2006-2008)
Month / Year Inflation Rate (%)
April, 2006 1,000
October, 2007 10,000
January, 2008 100,000
June, 2008 1,000,000
Source: Fashoyin (2008:19)
By June, 2008 the Reserve Bank of Zimbabwe (RBZ) had lost control of the growth rate of the broad moneysupply and therefore control over the inflation rate and reported in its monthly bulletin that the moneysupply growth was way out of its targeted level of 500 per cent per year set in December 2007 and was nowat the rate of 64 118 per cent (Fashoyin, 2008:19). These high inflation rates eroded the buying power ofconsumers for small firms and had long-lasting negative impacts on the firms, the most critical of whichwas the inability to capitalise their businesses (Kanji, 2005).
2. PURPOSE OF THE STUDYThe purpose of this study was to assess the size and significance of small-firm industrial districts in Zimbabweand to determine the success factors and survival strategies of the firms in these districts. It is has beensuggested that small firms operating in spatial proximity to each other or in ‘industrial districts’ have uniquecharacteristics that differentiate them from other small firms operating in isolation (Morris and Barnes,
Survival strategies of small firms located in a Marshallian Industrial District
University of Zimbabwe Business Review, Volume 1, No. 1, 2013 3
2003; Oyelaran-Oyeyinka and McCormick, 2006). The significance of this study is that it will contribute toour understanding of the characteristics of small-firm industrial districts in the context of a developingcountry.
3. PROPOSITIONThe proposition behind the study was that the secret behind the apparent dynamism in the industrialdistricts is the competitive strategies that they follow, given the nature of their markets.
4. RESEARCH QUESTIONSThe study answers the following questions.
1. What is the size of the industry and what markets are the firms serving?
2. What products are the firms producing and selling and how are they producing and selling their products?
3. What competitive strategies are the firms in the district using and are these strategies working?
5. METHODOLOGY5.1 Population and delimitationThe study commenced with a general survey of the small-firm furniture manufacturing industry in Zimbabwe,with the purpose of ascertaining the size and location of the industrial districts in which the firms arelocated. The areas covered in the survey are the seven major cities of Zimbabwe: Harare, Chitungwiza,Bulawayo, Mutare, Masvingo, Marondera and Gweru. The study then used the Glenview Industrial Districtwhich is located in Harare, and is commonly known as The Complex as the main study area since it is by farthe largest district, with a population of over 1 300 firms.
5.2 SampleA stratified random sample of firms engaged in either wood furniture or steel furniture manufacturing wastaken from the main study area of Glenview Industrial District. The sample size was determined usingYamane’s (Yamane, 1967) formula which is the one that is recommended for stratified random samples(Israel, 2002; Ross, 2002):
n = N
1 + N(e)2
Where: e is the sampling error, precision level, and N is the population size.
Using a 95 per cent confidence level and a precision level of ±5 per cent, the sample used in the studyconsisted of 306 firms, obtained as shown below:
n = 1 300
1 + 1 300(0.05)2
= 306 firms.
The firms that are engaged in wood furniture manufacturing make up about 70 per cent of the total populationand the other 30 per cent consists of those involved in steel furniture making. The sample was thereforeproportionally divided into two strata consisting of 214 wood furniture making firms (70 per cent) and 92steel furniture making firms (30 per cent). The firms from these strata were selected using a simple randomsampling method. A register of firms kept by the Management Committee responsible for the generalmanagement of the Glenview Industrial District was used as the sampling frame.
G. Muponda
4 University of Zimbabwe Business Review, Volume 1, No. 1, 2013
5.3 Data collection methods and instrumentsThe primary data collection instrument for this study was a questionnaire that was administered to the 306firms from both strata. This was complemented with data collected through in-depth interviews with fortyowner-managers, ten input suppliers, five service providers and officials from the local authority and theMinistry of Small and Medium Scale Enterprises Development. Personal observations were also used as adata collection method. Further, the study also used data from secondary sources, such as official data fromthe Central Statistical Office, City of Harare and the Ministry of Small and Medium Enterprises Development.The purpose of this data was to establish the nature of the institutional environment in which the firms areoperating.
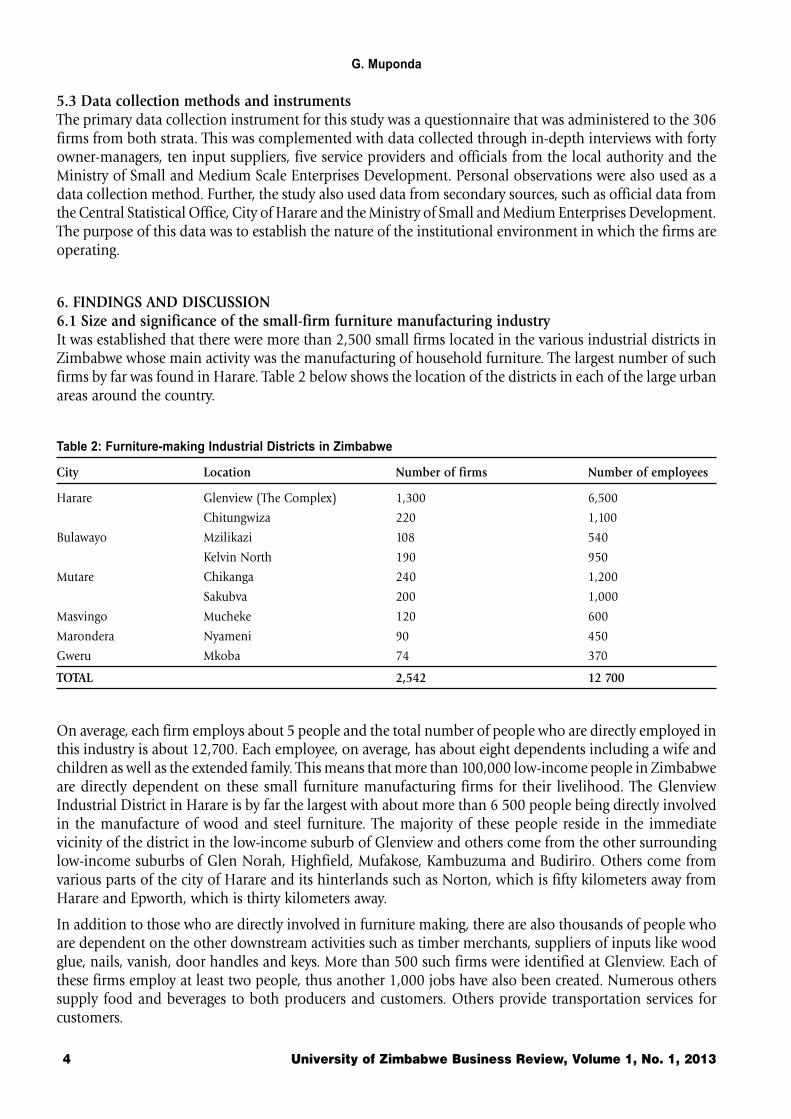
6. FINDINGS AND DISCUSSION6.1 Size and significance of the small-firm furniture manufacturing industryIt was established that there were more than 2,500 small firms located in the various industrial districts inZimbabwe whose main activity was the manufacturing of household furniture. The largest number of suchfirms by far was found in Harare. Table 2 below shows the location of the districts in each of the large urbanareas around the country.
Table 2: Furniture-making Industrial Districts in Zimbabwe
City Location Number of firms Number of employees
Harare Glenview (The Complex) 1,300 6,500
Chitungwiza 220 1,100
Bulawayo Mzilikazi 108 540
Kelvin North 190 950
Mutare Chikanga 240 1,200
Sakubva 200 1,000
Masvingo Mucheke 120 600
Marondera Nyameni 90 450
Gweru Mkoba 74 370
TOTAL 2,542 12 700
On average, each firm employs about 5 people and the total number of people who are directly employed inthis industry is about 12,700. Each employee, on average, has about eight dependents including a wife andchildren as well as the extended family. This means that more than 100,000 low-income people in Zimbabweare directly dependent on these small furniture manufacturing firms for their livelihood. The GlenviewIndustrial District in Harare is by far the largest with about more than 6 500 people being directly involvedin the manufacture of wood and steel furniture. The majority of these people reside in the immediatevicinity of the district in the low-income suburb of Glenview and others come from the other surroundinglow-income suburbs of Glen Norah, Highfield, Mufakose, Kambuzuma and Budiriro. Others come fromvarious parts of the city of Harare and its hinterlands such as Norton, which is fifty kilometers away fromHarare and Epworth, which is thirty kilometers away.
In addition to those who are directly involved in furniture making, there are also thousands of people whoare dependent on the other downstream activities such as timber merchants, suppliers of inputs like woodglue, nails, vanish, door handles and keys. More than 500 such firms were identified at Glenview. Each ofthese firms employ at least two people, thus another 1,000 jobs have also been created. Numerous otherssupply food and beverages to both producers and customers. Others provide transportation services forcustomers.
Survival strategies of small firms located in a Marshallian Industrial District
University of Zimbabwe Business Review, Volume 1, No. 1, 2013 5
The industry also makes a significant contribution to National Income. The average income per each employee,including owner-managers is about $350 per month. Thus, at least $4.4 million of income is being generatedannually directly from the industry.
6.2 Success factors and survival strategies.The success and survival of small firms operating within the industrial district can be attributed to thefollowing four factors: competitive strategy, territorial specificity, flexible specialization and co-operativecompetition.
6.2.1 Competitive strategy.The first key to the success of the firms located in the industrial district is that the firms within the districthave successfully combined both low-cost and product differentiation strategies, unlike the conventionalwisdom which suggests that this is not possible (Strickland, 2003; Porter, 2004).
The market for the firms’ products is divided into two distinct segments: low-income consumers and middle-income consumers. Harare’s residential areas have historically been categorized into three types. There isthe spatially populated (‘low-density’) high-income areas, wherein reside the more affluent section of thepopulation. There are the middle-income areas, wherein reside the not-so-affluent, but not necessarily poorresidents. There are the densely populated (‘high-density’) low-income areas, in which the small-firmindustrial districts are located. The ‘high-density’ suburbs are the townships that were originally built in thepre-independence period to house the black population but after independence, the better-off familiesmoved to the ‘low-density’ suburbs, previously the exclusive preserve of the white population. However, inrecent years, a sizeable number of the middle-income people have also found their way into the ‘high-density’, low-income areas. Thus, the industrial district, being located in or close to the ‘high-density’ suburbs,has access to both the middle-income market and the low-income market.
Because of its geographical location, the industrial district is highly visible and accessible to its markets. Itslocation provides convenience to both the customers and the employees, with little or no transportationcosts. For example, the cost of transporting goods to any destination from the district ranges from $10,00 to$20,00 per trip. The market is however, not limited to the immediate locality of the district but also spreadsto other low-income suburbs in the city, far from the district itself. The market share of the Glenview IndustrialDistrict is about 60 percent of the total furniture market in Harare.
Though the district is dedicated to the industry of household furniture, the product range is very wide andincludes the following products:
• Wardrobes
• Sofa sets
• Room dividers
• Kitchen table and chairs
• Dining room table and chairs
• Coffee table sets
• Base bed and mattresses
• Chest of drawers
Within each product type there is also a wide range of sub-types that are distinguished either by the numberof pieces or the ‘district brand name’. In the case of sofa sets, for example, at least five brand names can beidentified, as shown in Table 4 below.
G. Muponda
6 University of Zimbabwe Business Review, Volume 1, No. 1, 2013
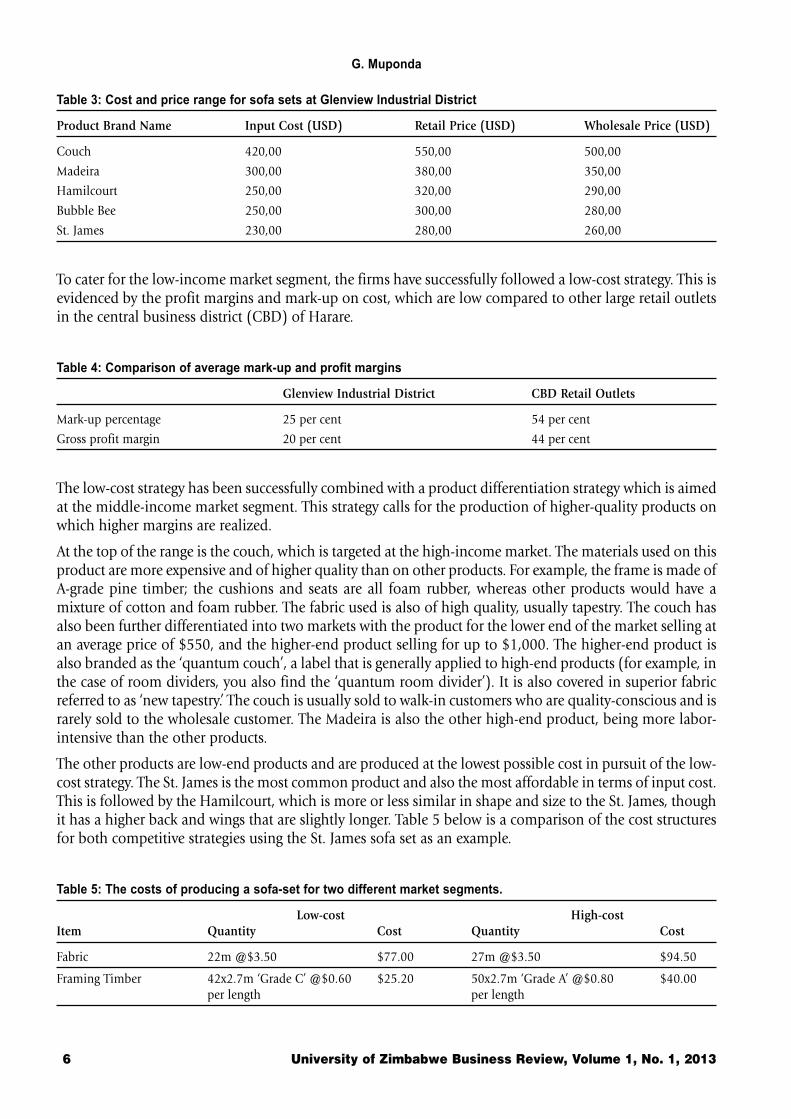
Table 3: Cost and price range for sofa sets at Glenview Industrial District
Product Brand Name Input Cost (USD) Retail Price (USD) Wholesale Price (USD)
Couch 420,00 550,00 500,00
Madeira 300,00 380,00 350,00
Hamilcourt 250,00 320,00 290,00
Bubble Bee 250,00 300,00 280,00
St. James 230,00 280,00 260,00
To cater for the low-income market segment, the firms have successfully followed a low-cost strategy. This isevidenced by the profit margins and mark-up on cost, which are low compared to other large retail outletsin the central business district (CBD) of Harare.
Table 4: Comparison of average mark-up and profit margins
Glenview Industrial District CBD Retail Outlets
Mark-up percentage 25 per cent 54 per cent
Gross profit margin 20 per cent 44 per cent
The low-cost strategy has been successfully combined with a product differentiation strategy which is aimedat the middle-income market segment. This strategy calls for the production of higher-quality products onwhich higher margins are realized.
At the top of the range is the couch, which is targeted at the high-income market. The materials used on thisproduct are more expensive and of higher quality than on other products. For example, the frame is made ofA-grade pine timber; the cushions and seats are all foam rubber, whereas other products would have amixture of cotton and foam rubber. The fabric used is also of high quality, usually tapestry. The couch hasalso been further differentiated into two markets with the product for the lower end of the market selling atan average price of $550, and the higher-end product selling for up to $1,000. The higher-end product isalso branded as the ‘quantum couch’, a label that is generally applied to high-end products (for example, inthe case of room dividers, you also find the ‘quantum room divider’). It is also covered in superior fabricreferred to as ‘new tapestry.’ The couch is usually sold to walk-in customers who are quality-conscious and israrely sold to the wholesale customer. The Madeira is also the other high-end product, being more labor-intensive than the other products.
The other products are low-end products and are produced at the lowest possible cost in pursuit of the low-cost strategy. The St. James is the most common product and also the most affordable in terms of input cost.This is followed by the Hamilcourt, which is more or less similar in shape and size to the St. James, thoughit has a higher back and wings that are slightly longer. Table 5 below is a comparison of the cost structuresfor both competitive strategies using the St. James sofa set as an example.
Table 5: The costs of producing a sofa-set for two different market segments.
Low-cost High-costItem Quantity Cost Quantity Cost
Fabric 22m @$3.50 $77.00 27m @$3.50 $94.50
Framing Timber 42x2.7m ‘Grade C’ @$0.60 $25.20 50x2.7m ‘Grade A’ @$0.80 $40.00per length per length
Survival strategies of small firms located in a Marshallian Industrial District
University of Zimbabwe Business Review, Volume 1, No. 1, 2013 7
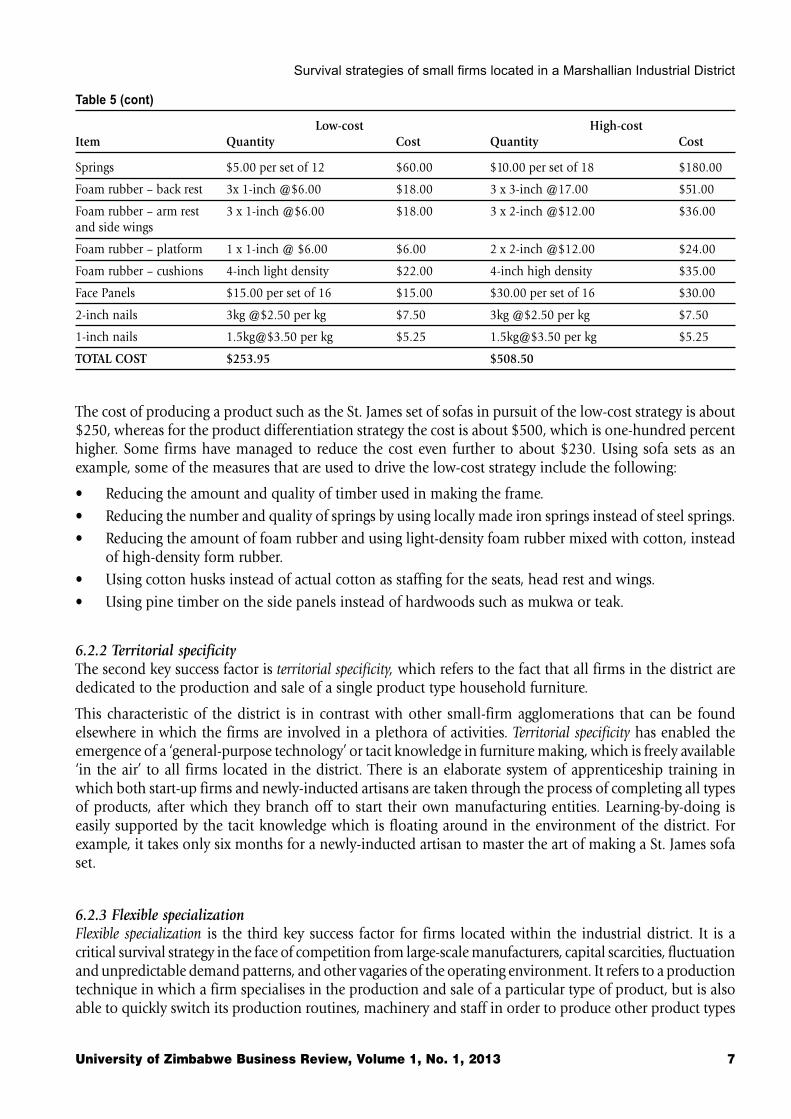
Table 5 (cont)
Low-cost High-costItem Quantity Cost Quantity Cost
Springs $5.00 per set of 12 $60.00 $10.00 per set of 18 $180.00
Foam rubber – back rest 3x 1-inch @$6.00 $18.00 3 x 3-inch @17.00 $51.00
Foam rubber – arm rest 3 x 1-inch @$6.00 $18.00 3 x 2-inch @$12.00 $36.00and side wings
Foam rubber – platform 1 x 1-inch @ $6.00 $6.00 2 x 2-inch @$12.00 $24.00
Foam rubber – cushions 4-inch light density $22.00 4-inch high density $35.00
Face Panels $15.00 per set of 16 $15.00 $30.00 per set of 16 $30.00
2-inch nails 3kg @$2.50 per kg $7.50 3kg @$2.50 per kg $7.50
1-inch nails 1.5kg@$3.50 per kg $5.25 1.5kg@$3.50 per kg $5.25
TOTAL COST $253.95 $508.50
The cost of producing a product such as the St. James set of sofas in pursuit of the low-cost strategy is about$250, whereas for the product differentiation strategy the cost is about $500, which is one-hundred percenthigher. Some firms have managed to reduce the cost even further to about $230. Using sofa sets as anexample, some of the measures that are used to drive the low-cost strategy include the following:
• Reducing the amount and quality of timber used in making the frame.
• Reducing the number and quality of springs by using locally made iron springs instead of steel springs.
• Reducing the amount of foam rubber and using light-density foam rubber mixed with cotton, insteadof high-density form rubber.
• Using cotton husks instead of actual cotton as staffing for the seats, head rest and wings.
• Using pine timber on the side panels instead of hardwoods such as mukwa or teak.
6.2.2 Territorial specificityThe second key success factor is territorial specificity, which refers to the fact that all firms in the district arededicated to the production and sale of a single product type household furniture.
This characteristic of the district is in contrast with other small-firm agglomerations that can be foundelsewhere in which the firms are involved in a plethora of activities. Territorial specificity has enabled theemergence of a ‘general-purpose technology’ or tacit knowledge in furniture making, which is freely available‘in the air’ to all firms located in the district. There is an elaborate system of apprenticeship training inwhich both start-up firms and newly-inducted artisans are taken through the process of completing all typesof products, after which they branch off to start their own manufacturing entities. Learning-by-doing iseasily supported by the tacit knowledge which is floating around in the environment of the district. Forexample, it takes only six months for a newly-inducted artisan to master the art of making a St. James sofaset.
6.2.3 Flexible specializationFlexible specialization is the third key success factor for firms located within the industrial district. It is acritical survival strategy in the face of competition from large-scale manufacturers, capital scarcities, fluctuationand unpredictable demand patterns, and other vagaries of the operating environment. It refers to a productiontechnique in which a firm specialises in the production and sale of a particular type of product, but is alsoable to quickly switch its production routines, machinery and staff in order to produce other product types
G. Muponda
8 University of Zimbabwe Business Review, Volume 1, No. 1, 2013
when the need arises. The concept also applies at the level of the artisan employed by the firm. The artisanis multi-skilled and is capable of operating all types of plant and machinery within the production unit andcan make all types of products when required to do so. However, the artisan usually specializes in oneproduct or product type or one piece of plant or machinery. The concept can even be taken further to theproduct level, whereby you find artisans within the production entity specialising in certain parts of theproduct conversion process.
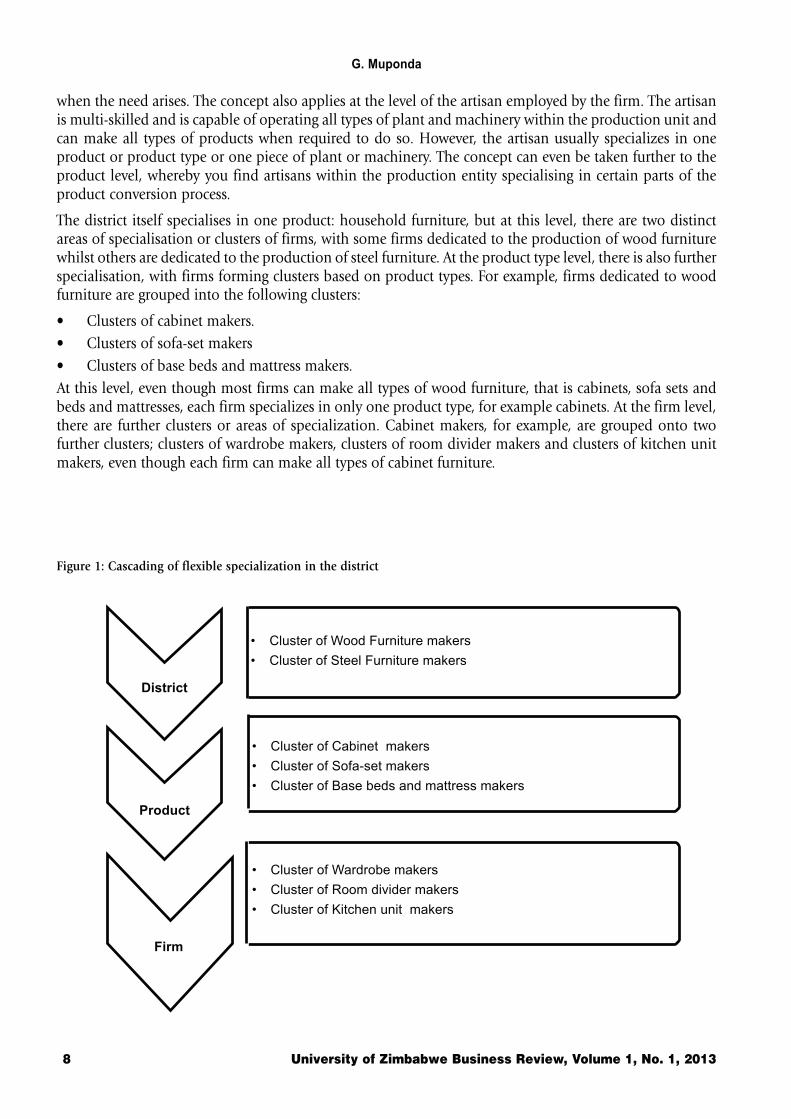
The district itself specialises in one product: household furniture, but at this level, there are two distinctareas of specialisation or clusters of firms, with some firms dedicated to the production of wood furniturewhilst others are dedicated to the production of steel furniture. At the product type level, there is also furtherspecialisation, with firms forming clusters based on product types. For example, firms dedicated to woodfurniture are grouped into the following clusters:
• Clusters of cabinet makers.
• Clusters of sofa-set makers
• Clusters of base beds and mattress makers.
At this level, even though most firms can make all types of wood furniture, that is cabinets, sofa sets andbeds and mattresses, each firm specializes in only one product type, for example cabinets. At the firm level,there are further clusters or areas of specialization. Cabinet makers, for example, are grouped onto twofurther clusters; clusters of wardrobe makers, clusters of room divider makers and clusters of kitchen unitmakers, even though each firm can make all types of cabinet furniture.
Figure 1: Cascading of flexible specialization in the district
• Cluster of Wood Furniture makers
• Cluster of Steel Furniture makers
• Cluster of Cabinet makers
• Cluster of Sofa-set makers
• Cluster of Base beds and mattress makers
• Cluster of Wardrobe makers
• Cluster of Room divider makers
• Cluster of Kitchen unit makers
District
Product
Firm
Survival strategies of small firms located in a Marshallian Industrial District
University of Zimbabwe Business Review, Volume 1, No. 1, 2013 9
The district is arranged into a spiral of clusters and flexible specialisation is found at every level of activity,cascading downwards as shown in Figure 1 above. Throughout the whole spiral, at each cluster level, thereare two distinct competitive strategies: low-cost and product differentiation, with firms within each clusterconcentrating on either the high-end market or the low-end market of the cluster. In the sofa sets cluster, forexample, some firms specialise in the high-end market (couch and Madeira sets) whilst others specialise inthe low-end market (St. James and Hamilcourt). Whilst the firm has the skills and competencies to make alltypes of cabinets or sofa sets, it dedicates itself to only one or two types, honing its skills in that particularproduct type. The firm only deviates from its ‘normal’ activity say from cabinet making to sofa making, orfrom wardrobes to room dividers, on the specific request of a customer. Thus, the firms are highly flexible intheir technological capabilities with regards to all product types and categories.
Within each production unit there is further flexible specialisation or division of labour. Though the artisanspossess the skills and knowledge to make the whole product, each artisan only makes one or two parts ofthe whole. In the transformation process for a sofa set, for example, some artisans are dedicated to makingthe frames, others specialise in cutting, designing the fabric and staffing the frame. This productionarrangement is used only when a large order has been received and lead times for delivery are short. In slackperiods such as when there is low demand for the product or a shortage of inputs, the artisans revert back tomaking the whole product, such as a set of St. James sofas, or a whole room divider, charging a commissionof about ten percent to the firm.
The artisans in each production entity assume different roles and relationships with the entity, dependingon the business environment at a particular that time. During times of slack demand or shortage of materials,they become independent commission workers. During these times they may even hire out their labour toother ‘competing firms’. At other times, for example when the firm receives a large order with a short leadtime, or when demand is generally high (for example during the tobacco selling season, when tobaccofarmers bring their tobacco to the auction floors), they become full-time employees, receiving a wage. Someartisans within the district do not in fact have any permanent relationships with any particular productionentity, but they roam within the district offering their services to all the entities. They are a distinct pool ofskilled artisans, with technological capabilities for all product types and categories. This flexibility in theemployment relationship results in a cross-pollination of innovation and technological capabilities as theartisans carry new product designs and ideas from one firm to another.
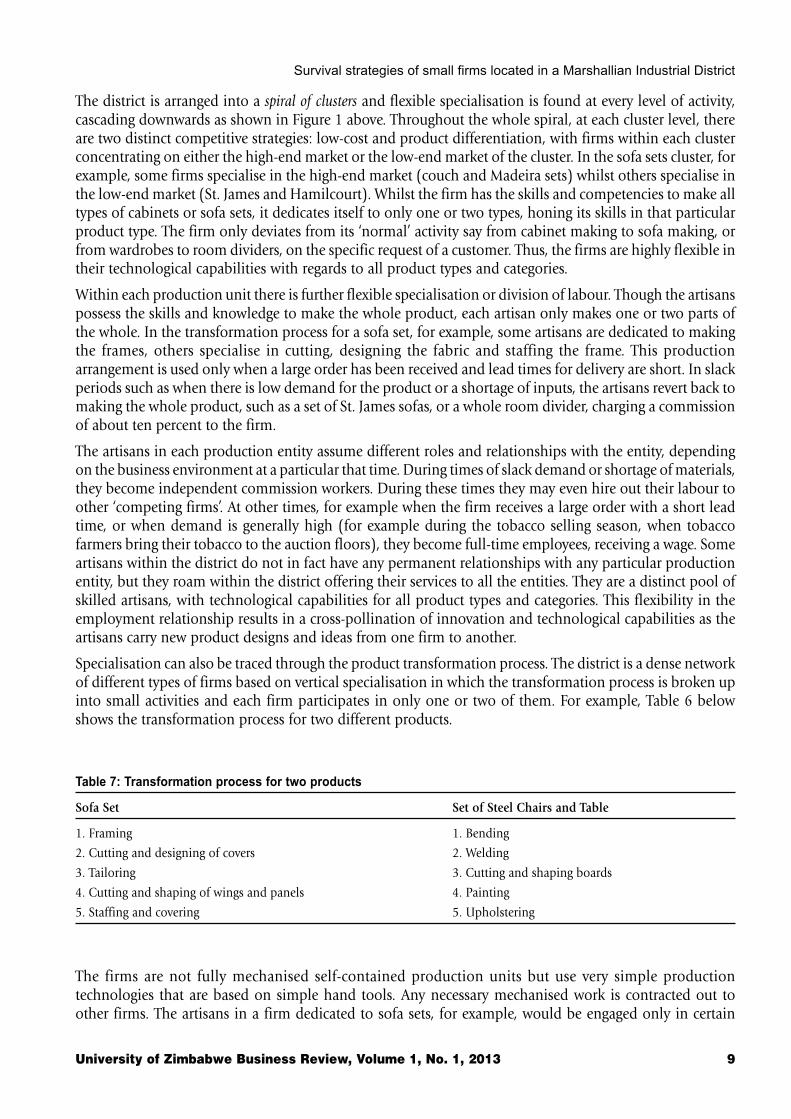
Specialisation can also be traced through the product transformation process. The district is a dense networkof different types of firms based on vertical specialisation in which the transformation process is broken upinto small activities and each firm participates in only one or two of them. For example, Table 6 belowshows the transformation process for two different products.
Table 7: Transformation process for two products
Sofa Set Set of Steel Chairs and Table
1. Framing 1. Bending
2. Cutting and designing of covers 2. Welding
3. Tailoring 3. Cutting and shaping boards
4. Cutting and shaping of wings and panels 4. Painting
5. Staffing and covering 5. Upholstering
The firms are not fully mechanised self-contained production units but use very simple productiontechnologies that are based on simple hand tools. Any necessary mechanised work is contracted out toother firms. The artisans in a firm dedicated to sofa sets, for example, would be engaged only in certain
G. Muponda
10 University of Zimbabwe Business Review, Volume 1, No. 1, 2013
stages of the transformation process, such as the design and construction of the wooden frame, cutting anddesigning of the fabric for the covers as well as staffing and covering the frame. The tailoring of the fabric iscontracted out to other entities which are dedicated to this part of the process and have invested in industrialsewing machines. Within the Glenview Industrial District there are more than one-hundred tailoring firms.The cutting and shaping of wings and panels is also done by other entities that have invested in the requiredplant and machinery such as lathe machines, rip saws, compressors, surface planes and spindle molders.These entities make the various types of wings, panels and other parts for stock and sell them to the productionunits. Thus, there is no need for large capital investment within the production unit itself. The productionunit invests only in light hand tools, such as hand saws, hummers and small planes.
In addition to the firms that are involved in the actual transformation process, there are hundreds of otherentities providing supporting services such as the transportation of goods for customers and the provisionof food and beverages to the inhabitants of the district. More than 500 hundred other entities supply therequired inputs such as timber, cotton, wood glue, nails, vanish, paint, and foam rubber at low cost and insmall quantities, which reduces the need for financing inventory on the part of the production units. Theseentities are also a source of information for the production entities as they bring feedback from customersand suppliers. Most of these suppliers, such as timber merchants and sellers of cotton, are former carpentersthemselves, who have branched out to these other activities, thus have an intricate knowledge of the industryitself.
6.2.4 Co-operative competitionThe fourth success factor is co-operative competition. Though there is intense competition among the firms,they also collaborate and support each other. Each firm has a display area and a sales team which is deployedto the sales area where they fiercely compete for customers. However, when you go to the production area,you find a different situation. Some customers may wander throughout the district and unintentionallyfind themselves within the production area. The firms therefore make strenuous efforts to attract thesecustomers. However, each production area has a cluster of firms in that particular neigbourhood that alsocompete among themselves and each cluster is in competition with the other clusters. Once a customerwalks up to a particular cluster or firm, there is an unwritten rule that says that the others should not try tolure this customer away from the chosen cluster or firm. They in fact try to support the chosen firm, forexample, if that firm does not have all the products requested by the customer, only then do they come in toassist.
The artisans within each cluster or firm are free to hire out their labour to other firms within the cluster oreven to an outside cluster for a fee, which is normally about 10 percent of the cost of the item produced.Thus if a firm receives a large order, other artisans from other firms hire out their labour to this firm toenable it to fulfill the order timeously. In this way, the artisans also exchange knowledge and skill throughcross pollination of ideas. In certain cases, a wholesale customer may request a very large order whichrequires the combined efforts of all firms from different clusters in that neighborhood. In this instance allthe firms work together in order to meet the customer’s requirements.
The firm itself has very little investment in plant and machinery. All work that requires plant and machineryis contracted out to other firms that have invested in these capital items. The most critical capital items thatare required in the industry are:
• Lathe machine
• Spindle molder
• Surface plane
• Thickness plane
• Rip saw
• Compressor
• Industrial sewing machine
Survival strategies of small firms located in a Marshallian Industrial District
University of Zimbabwe Business Review, Volume 1, No. 1, 2013 11
Most of these items of plant and machinery are not imported or bought from established manufacturers,but are made by other artisans in and around the district, having been fabricated and fashioned from ancombination of blades, pulleys, electric motors and work-benches.
The production unit itself does not have a very large capital base but invests in the very simple hand-heldequipment that is required for finishing products, such as hand saw, hammer and small wood planes. Inorder to minimise costs and maximise production efficiencies, each of these firms specialises in the making,shaping, or molding of particular items, for example wings and armrests for sofa sets, or panels for wardrobedoors, or legs for base beds. A firm that specialises in the molding of panels or shaping of base bed legswould employ up to five artisans, who daily work on the several machines, such as spindle molders. In thecase of panels, the artisans within the production unit design the required shapes and take them up to thespecialist in that area for cutting and shaping. Once this is done, the firm’s artisans put in the finishingtouches of smoothening and vanishing. These items can be made on order or they are made for stock. Eachfirm would then buy the ready-made items as required. In times of slack business, however, an artisan canmake some of the required shapes, such as frames using hand held tools instead of hiring out the work tothe owner of a rip saw, or thickness plane.
The firms in the district form a dense network of interrelationships with horizontal co-operation betweenotherwise competing firms. This is further evidenced by the existence of joint sub-contracting, joint purchasing,or marketing of products. For example, there are more than two-hundred timber merchants and cottonmerchants located at the district. These merchants are organised into ‘syndicates’ for the purpose of jointlybuying cotton lint from ginneries and timber from the forestry plantations.
7. CONCLUSIONSThe study came to the following conclusions:
7.1 The contribution of small cluster-located firms to employment creation and income generation is verysignificant. Thus, the growth of such firms in Zimbabwe should be encouraged and nurtured.
7.2 Zimbabwe’s small-firm clusters are unique in that they have successfully combined a low-cost competitivestrategy with a product differentiation strategy by producing a wide range of products in convenientlocations and at a reasonable price to consumers in different market segments. Three factors have beenresponsible for the success of the firms in the cluster: territorial specificity; flexible specialisation andco-operative competition.
Territorial specificity has enabled the cluster itself to hone its capabilities to the production of a singleproduct type. Flexible specialisation at the cluster, product and firm level have enabled the artisans togenerate and share tacit knowledge.
8. RECOMMENDATIONSFrom the conclusions above, the following recommendations are made:
8.1 The firms are “isolated” technologically because all the knowledge that is being shared among them isknowledge that is being acquired within the confines of the cluster. Initiatives are therefore required tolink the firms in the cluster with other firms and institutions outside so that the firms gain new knowledgefrom outside the cluster environment.
8.2 The spirit of co-operative competition among the firms implies that any initiatives that are meant toimprove the competencies of the firms in the cluster should not be directed at individual firms but atgroups of firms in the cluster. Funding initiatives should not be directed at particular firms but atdistinct groups of firms such as the cluster of cabinet-makers or sofa-set-makers. Training initiativesshould also be aimed at the epistemic community of “independent” artisans rather than at artisansbelonging to a particular firm.
G. Muponda
12 University of Zimbabwe Business Review, Volume 1, No. 1, 2013
8. REFERENCESAlila, P. and Pedersen, P. (2001) Negotiating Social Space: East African Micro Enterprises. Africa World Press: Asmara.
Altenburg, T. and Meyer-Stamer, J. (2009). How to promote clusters: Policy experiences in Latin America. World Develoment. Vol.27, pp 1693-1713.
Bhalla, A. S. (2009). Innovations and Small producers in Developing Countries. Greenwood Press, London
Bell, M. (2002). Knowledge systems and technological dynamism in industrial clusters in developing countries. WorldDevelopment.Vol. 27 pp 22-55
Bojar, E, Bojar, M and Zminda, T. (2008).The cluster as a factor attracting direct investment in less developed regions. The Journalof the Romanian Science Association .Lublin University of Technology, Summer : Vol. 2 – pp. 55-67.
Chirisa, I. (2009). The geography of informal sector operations: a perspective of urban Zimbabwe. Journal of Geography andRegional Planning, 2(4), 066-079.
Confederation of Zimbabwe Industries (CZI) (2009).Annual Report, 2009, Harare.
Fashoyin, T. (2008).Employment, unemployment and informality in Zimbabwe..Report.Geneva: International LabourOrganisation (ILO) Policy Integration and Statistics Department.
Government of Zimbabwe, National Consultative Forum. (2004). Report on the Policy Implementation Workshop for SMEs. Harare.
Humphrey, J. and Schmitz, H. (2005) Principles for promoting clusters and networks of SMEs. Report UNIDO, Small andMedium Enterprises Branch.
Kapoor, K. (1997). Empowering Small Enterprises in Zimbabwe. World Bank Discussion Paper Number 379.Washington DC:World Bank.
Kanji, N. (2005). Gender, poverty and economic adjustment in Harare, Zimbabwe.Environment and Urbanizatiobn, 7(37).
Kelley, D. B (2004). Global Entrepreneurship Monitor.Universiadaddel. Desarrollo. Madrid
McCormick, D. (1998). Enterprise clusters in Africa : on the way to industrialization? Nairobi Institute of Development StudiesDiscussion Paper Number 366
Mhone, G. (2002). The impact of structural adjustment on the urban informal sector in Zimbabwe.Harare: Africa Regional policyStudies (SAPES).
Mpemba, G. (2010). Retrenchment Procedures Handbook and Reports on Court Cases on Retrenchment. Harare:NCS Labour Relationsand Training Consultants.
Nadvi, K. (2001). Collective efficiency and collective failure : the response of the Sialkot Surgical Instruments cluster to GlobalQuality pressures. World Development.9 : Vol. 27
Pearson, R. and Hungwe, G. (1997).UNDP Microfinance Assessment Report for Zimbabwe.United Nations Development Program.
Pedersern, P. O., Sverrisson, A. and van Dijk, M. P. (1994). Flexible Specialization : the dynamics of small-scale industries in the South.Intermediate Technology Publications, London.
Oyelaran-Oyeyinka, B. and McCormick, D. (2003). Industrial clusters and innovation systems in
Africa : Institutions, markets and policy. United Nations University Press.
Reserve Bank of Zimbabwe.(2004). Monetary Policy Statement: April, 2004. Harare: Government of Zimbabwe.
Schmitz, H. (2002). Collective efficiency and increasing returns. Journal of Economicsi.Vol. 23. – pp 122-178.
Tibaijuka, A. K. (2005) Report on the Fact Finding Mission to Zimbabwe to assess the scope and impact of Operation Murambatsvina bythe UN Special Envoy on Human settlement Issues in Zimbabwe.United Nations.
Uzor, O. O. (2004).Small and medium scale enterprise development in the South-Eastern Region of Nigeria.Discussion PaperNumber 86.Institute for World Economics and International Management, University of Bremen.
Visser, E. (2004). The significance of spacial clustering : external economies in the Peruvian small-scale clothing industry. In P.van Dijik Van & and R. Rabellotti. Entreprise clusters in developing countries (pp33-45). New Delhi: Sage Publications.
Van Dijk, P. and Rabellotti, R. (1997). Enterprise Clusters and Networks in Developing Countries.McGrow-Hill. London.
Marketing managers’ perceptions of the applicability of Ashridge mission model to organisations in Zimbabwe
University of Zimbabwe Business Review, Volume 1, No. 1, 2013 13
Marketing managers’ perceptions of the applicability of Ashridge
mission model to organisations in Zimbabwe
Noel Muzondo1, Frank Gwavuya1, Judias P Sai3, Nyasha Kaseke4
1Department of Business Studies, University of Zimbabwe2Department of Business Studies, University of Zimbabwe
3Department of Tourism, Leisure and Hospitality Studies, University of Zimbabwe4Graduate School of Management, University of Zimbabwe
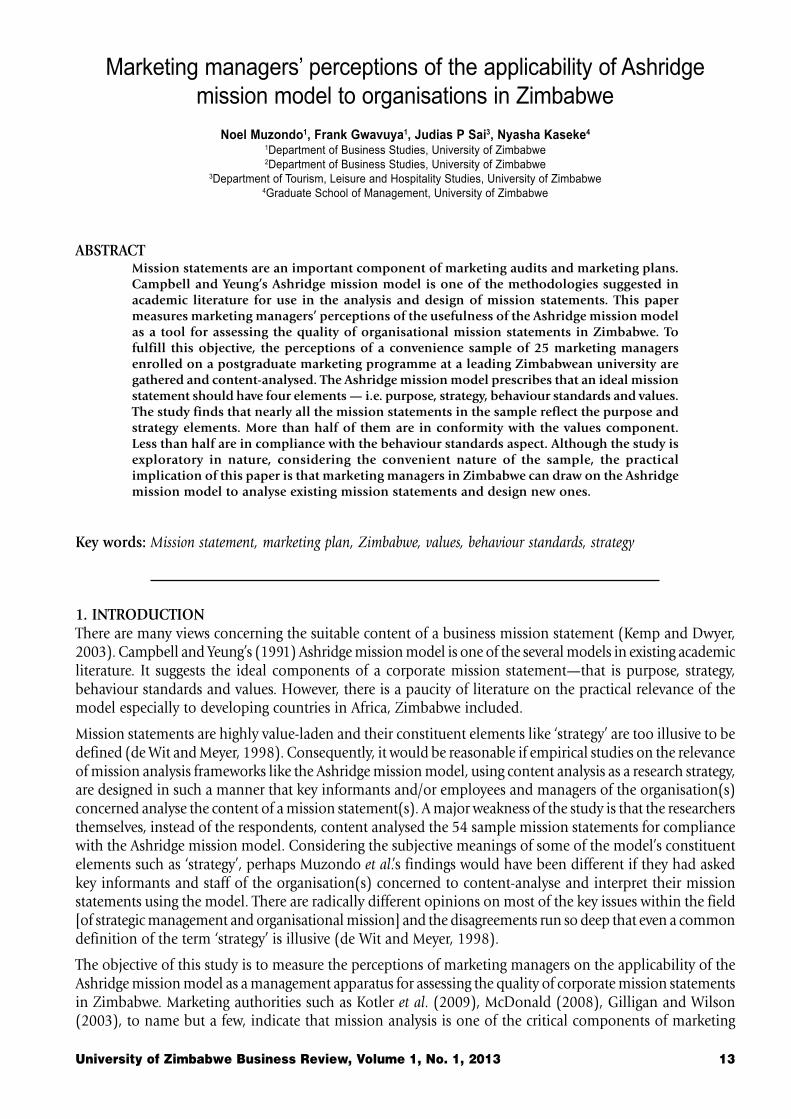
ABSTRACTMission statements are an important component of marketing audits and marketing plans.Campbell and Yeung’s Ashridge mission model is one of the methodologies suggested inacademic literature for use in the analysis and design of mission statements. This papermeasures marketing managers’ perceptions of the usefulness of the Ashridge mission modelas a tool for assessing the quality of organisational mission statements in Zimbabwe. Tofulfill this objective, the perceptions of a convenience sample of 25 marketing managersenrolled on a postgraduate marketing programme at a leading Zimbabwean university aregathered and content-analysed. The Ashridge mission model prescribes that an ideal missionstatement should have four elements — i.e. purpose, strategy, behaviour standards and values.The study finds that nearly all the mission statements in the sample reflect the purpose andstrategy elements. More than half of them are in conformity with the values component.Less than half are in compliance with the behaviour standards aspect. Although the study isexploratory in nature, considering the convenient nature of the sample, the practicalimplication of this paper is that marketing managers in Zimbabwe can draw on the Ashridgemission model to analyse existing mission statements and design new ones.
Key words: Mission statement, marketing plan, Zimbabwe, values, behaviour standards, strategy
1. INTRODUCTIONThere are many views concerning the suitable content of a business mission statement (Kemp and Dwyer,2003). Campbell and Yeung’s (1991) Ashridge mission model is one of the several models in existing academicliterature. It suggests the ideal components of a corporate mission statement—that is purpose, strategy,behaviour standards and values. However, there is a paucity of literature on the practical relevance of themodel especially to developing countries in Africa, Zimbabwe included.
Mission statements are highly value-laden and their constituent elements like ‘strategy’ are too illusive to bedefined (de Wit and Meyer, 1998). Consequently, it would be reasonable if empirical studies on the relevanceof mission analysis frameworks like the Ashridge mission model, using content analysis as a research strategy,are designed in such a manner that key informants and/or employees and managers of the organisation(s)concerned analyse the content of a mission statement(s). A major weakness of the study is that the researchersthemselves, instead of the respondents, content analysed the 54 sample mission statements for compliancewith the Ashridge mission model. Considering the subjective meanings of some of the model’s constituentelements such as ‘strategy’, perhaps Muzondo et al.’s findings would have been different if they had askedkey informants and staff of the organisation(s) concerned to content-analyse and interpret their missionstatements using the model. There are radically different opinions on most of the key issues within the field[of strategic management and organisational mission] and the disagreements run so deep that even a commondefinition of the term ‘strategy’ is illusive (de Wit and Meyer, 1998).
The objective of this study is to measure the perceptions of marketing managers on the applicability of theAshridge mission model as a management apparatus for assessing the quality of corporate mission statementsin Zimbabwe. Marketing authorities such as Kotler et al. (2009), McDonald (2008), Gilligan and Wilson(2003), to name but a few, indicate that mission analysis is one of the critical components of marketing
N. Muzondo et al.
14 University of Zimbabwe Business Review, Volume 1, No. 1, 2013
audits1 and marketing plans2 . Despite the critical role played by mission statements in corporate strategy,many textbooks on strategic management and marketing only dedicate about half a page to a few pages tomission statement analysis (Muzondo, 2012). Hence there is a paucity of published literature on the practicalrelevance of the Ashridge mission model to organisations in developing countries especially those in Africa(Muzondo et al., 2013).
This paper contributes to the body of knowledge on mission statement analysis from an African strategicmarketing standpoint. Diversity in management practices around the world has been recognised inmanagement literature in the United States of America for more than 30 years but it has taken much longerfor American academics to accept that not only practices but the validity of theories may stop at nationalborders (Hofstede, 1993). The usefulness of management frameworks developed in one country may notbe applicable to other countries. The Ashridge mission model was developed in the United Kingdom and itsusefulness in Zimbabwe cannot be assumed.
2. LITERATURE REVIEWThe Ashridge mission model suggests four elements of mission—purpose, strategy, behaviour standardsand values. A strong mission exists when the four elements of mission link tightly, resonating and reinforcingeach other (Campbell and Yeung, 1991).
A number of authors such as Wheelen and Hunger (2002) and Johnson and Scholes (2002) agree thatpurpose is one of the fundamental components of a good mission statement. Some strategic managementgurus, in fact, admit that the definition of mission is hinged on the purpose element. For example, Johnsonand Scholes (2002) state that a mission is a general expression of the overall purpose of the organisation,which ideally, is in line with the values and expectations of major stakeholders and is concerned with thescope and boundaries of the organisation. Purpose answers the critical question why the company exists(Campbell and Yeung, 1991; de Wit and Meyer, 1998). For instance, “[a]n organisation exists to accomplishsomething: to make cars, lend money, provide a night’s lodgings, and so on” (Kotler et al., 2009:42). Toachieve purpose in competition with other organisations, there is need for strategy.
Strategy provides the commercial logic for the company (Campbell and Yeung, 1991). Strategy describeshow an organisation sets out to achieve its purpose and/or goals in competition with other organisations.The strategy component of mission is also acknowledged in a number of other mission statement analysisframeworks (e.g. Piercy and Morgan, 1994; Sidhu, 2003; Abell, 1980; Wheelen and Hunger, 2002).
Nonetheless, purpose and strategy are only empty intellectual thoughts unless they can be converted intoaction, policy and behaviour standards or guidelines that help people to decide what to do on a day-to-daybasis (Campbell and Yeung, 1991). Behaviour standards are the policies and behaviour patterns that underpinthe distinctive competence and the value system (ibid). The importance of behaviour to organisations is alsoacknowledged in corporate identity and corporate image literature (Check-Teck and Lowe, 1999; Melewarand Karaosmanoglu, 2006; Stuart, 1999; Abratt, 1989). This brings us to the last element of the Ashridgemission model—values.
Values are beliefs and moral principles that lie behind the company’s culture (Campbell and Yeung, 1991).Values give meaning to the norms and behaviour standards in the company that act as the ‘right brain’ of theorganisation (ibid).
While all four components of mission prescribed by the Ashridge mission model are important, Muzondo(2012) believes that purpose and strategy are more important than values and behaviour standards. He
1 A marketing audit is a comprehensive, systematic, independent, and periodic examination of a company’s or business unit’s marketingenvironment, objectives, strategies, and activities, with a view to determining problem areas and opportunities and recommending a planof action to improve the company’s marketing performance (Armstrong and Kotler, 2009).
2 A marketing plan is a written document that summarises what the marketer has learned about the market place and indicates how the firmplans to reach its marketing objectives (Kotler et al., 2009).
Marketing managers’ perceptions of the applicability of Ashridge mission model to organisations in Zimbabwe
University of Zimbabwe Business Review, Volume 1, No. 1, 2013 15
regards purpose and strategy as the hardware elements of mission and he gives them symbolically moreweight in guiding mission analysis and design than values and behaviour standards, which he terms softwareelements. In his conceptual paper, Muzondo (2012) developed and suggested five propositions on the qualityof mission statements which were informed by his hardware and software constructs of mission elements.The propositions were based on a five-point scale ranging from Excellent to Very poor. This means that amission statement is: (1) Excellent if it complies with all four components of mission as propounded by theAshridge mission model, (2) Good if it is consistent with all two hardware elements only or the hardwarecomponents plus any one software element, (3) Average if it is compliant with one hardware element onlyor a hardware component plus any one or all two software elements, (4) Poor if it conforms to all twosoftware elements only, and (5) Very poor if it is compliant with none of the four components of the model.
In a follow up empirical paper, Muzondo et al. (2013) refined and tested the five propositions using contentanalysis data from a systematic random sample of 54 mission statements drawn from organisations thathad provided one-year internships to business studies students in a leading Zimbabwean university. Theirstudy found that only seven of the 54 corporate mission statements in the sample were excellent, 51 weregood, 53 were average and none was poor or very poor because there was no mission statement which conformedto one or all two software elements only without being compliant to at least one hardware element. However,the weakness in Muzondo et al.’s paper is that it is the researchers themselves instead of respondents, whocontent analysed the sample mission statements. Given the qualitative and value laden nature of missionstatements, perhaps the results may have varied if key informants and staff of the concerned organisationshad instead content analysed the mission statements.
3. METHODOLOGY3.1 Population and sampleThe population for this study was marketing managers who are students in taught postgraduate marketingdegree programmes offered in Zimbabwean universities. There are at least four universities in Zimbabweoffering postgraduate marketing programmes. Marketing managers review corporate mission statementswhen carrying out marketing audits and designing marketing plans. Primary data to fulfill the study’s objectivewere gathered from a convenience sample of 25 marketing managers enrolled on a postgraduate marketingdegree offered by one of the four universities. The unit of analysis was an assignment on the application ofthe Ashridge mission model to organisational mission statements in Zimbabwe. This assignment was givento students of a postgraduate programme in one of the stated universities as part of their continuousassessment on a core course called strategic marketing which was taught by one of the authors. In fact, therewere 32 students enrolled on the programme at the time the assignment was given out but six of themdropped out before submitting the assignment. Of the remaining 26 managers (meaning there were 26assignments in all) the researchers withdrew one assignment from the unit of analysis because of sometechnicalities. This left the study with a total 25 assignments that were based on 23 corporate missionstatements because two organisations in the sample had two marketing managers who were enrolled on theprogramme.
3.2 Data gathering procedure and analysisThe data were gathered from a secondary source, that is, copies of a written assignment in response to aquestion given by one of the authors to his strategic marketing students to gauge their appreciation ofCampbell and Yeung’s (1991) Ashridge mission model and its practical relevance to their respectiveorganisational mission statements. Before giving out the assignment, the first researcher or author delivereda lecture on marketing planning to the students. The lecture explored how marketing managers can applythe Ashridge mission model as a methodology for analysing an existing corporate mission statement andguiding the crafting of a new one. Mission statement analysis is a fundamental step in the marketing auditand the marketing planning processes. At the conclusion of the lecture, one of the authors referred thestudents to de Wit and Meyer’s (1998) textbook – Strategy: Process, Content, Context – which has the full textof the original article on the Ashridge mission model, originally published in Longrange Planning.
N. Muzondo et al.
16 University of Zimbabwe Business Review, Volume 1, No. 1, 2013
The students were given a three-week deadline to write and submit the assignment. After marking andgiving feedback on the assignment, one of the authors requested and was granted permission by the studentsto retain copies of their assignment so that together with his colleague researchers, they could draw on themto write this scientific article. The researchers content analysed the assignments to determine the extent towhich the students agreed or disagreed that their corporate mission statements complied with the Ashridgemission model.
Content analysis is an attempt to quantify qualitative data by noting, for example, frequencies of events,words, and actions and others (Lancaster, 2005). It entails analysing the contents of documentary materialssuch as books, magazines, newspapers and of all other verbal materials which can be either spoken orprinted (Kothari, 2004). The purpose of content analysis is to describe the content of your respondents’comments systematically and classifying the various meanings expressed in the material you have recorded(Adams et al., 2007). However, it is not the only way in which you could analyse the data you have obtained.You may find yourself presenting information in the form of a connected narrative (in a study following thecase study method, for example), or in a series of verbatim quotations taken from the interviews (ibid).
The researchers adopted the four elements of an ideal mission statement as prescribed in the Ashridgemission model – purpose, strategy, behaviour standards and values – as codes for analysing the data fromthe assignments and for presenting and discussing the study’s findings. The students had also analysed theirrespective corporate mission statements using the same codes.
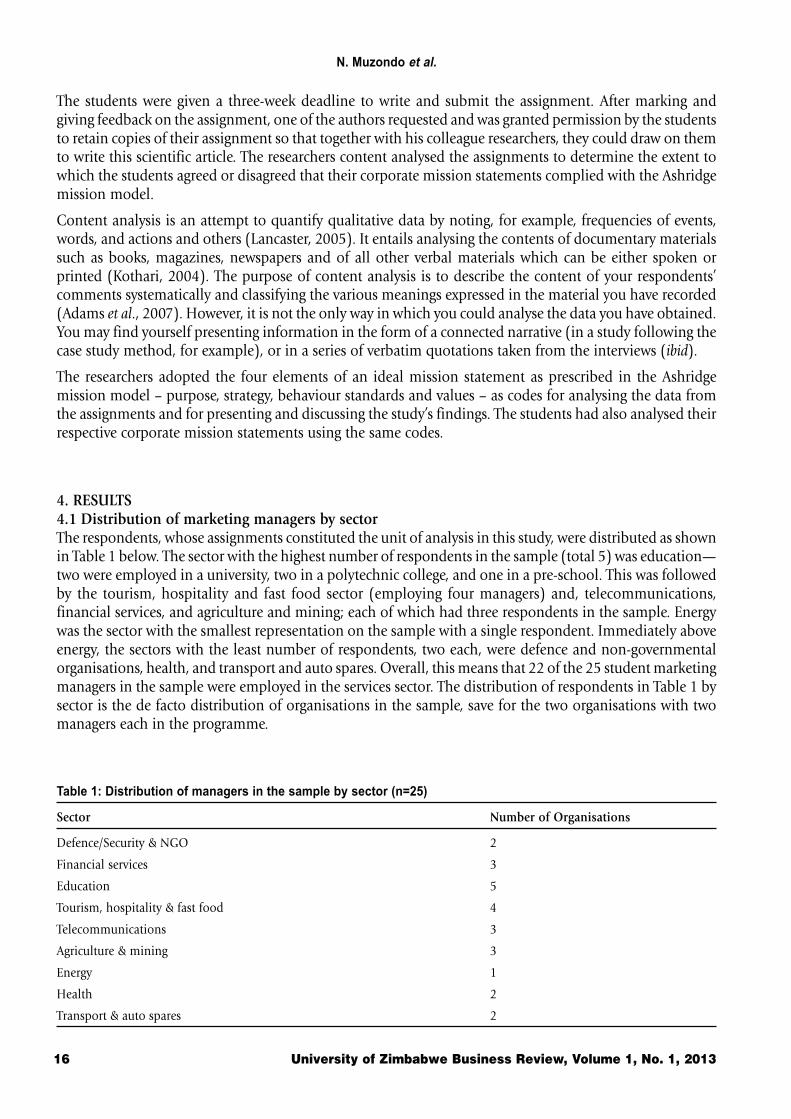
4. RESULTS4.1 Distribution of marketing managers by sectorThe respondents, whose assignments constituted the unit of analysis in this study, were distributed as shownin Table 1 below. The sector with the highest number of respondents in the sample (total 5) was education—two were employed in a university, two in a polytechnic college, and one in a pre-school. This was followedby the tourism, hospitality and fast food sector (employing four managers) and, telecommunications,financial services, and agriculture and mining; each of which had three respondents in the sample. Energywas the sector with the smallest representation on the sample with a single respondent. Immediately aboveenergy, the sectors with the least number of respondents, two each, were defence and non-governmentalorganisations, health, and transport and auto spares. Overall, this means that 22 of the 25 student marketingmanagers in the sample were employed in the services sector. The distribution of respondents in Table 1 bysector is the de facto distribution of organisations in the sample, save for the two organisations with twomanagers each in the programme.
Table 1: Distribution of managers in the sample by sector (n=25)
Sector Number of Organisations
Defence/Security & NGO 2
Financial services 3
Education 5
Tourism, hospitality & fast food 4
Telecommunications 3
Agriculture & mining 3
Energy 1
Health 2
Transport & auto spares 2
Marketing managers’ perceptions of the applicability of Ashridge mission model to organisations in Zimbabwe
University of Zimbabwe Business Review, Volume 1, No. 1, 2013 17
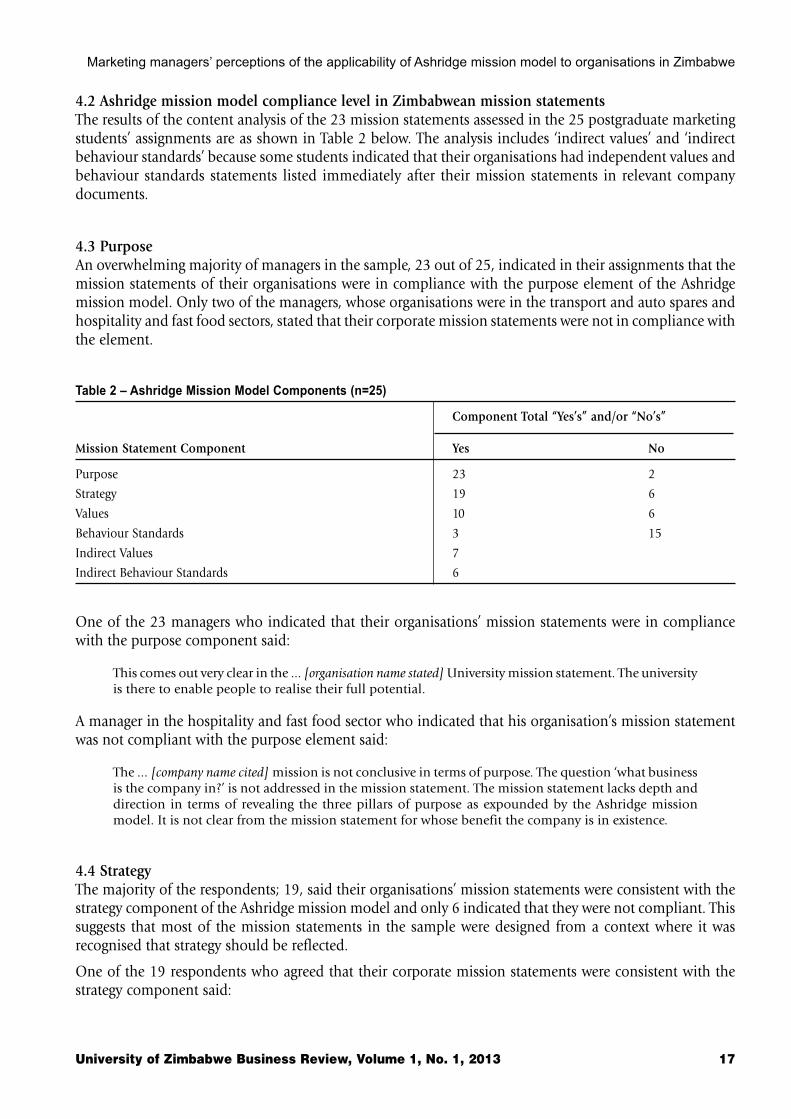
4.2 Ashridge mission model compliance level in Zimbabwean mission statementsThe results of the content analysis of the 23 mission statements assessed in the 25 postgraduate marketingstudents’ assignments are as shown in Table 2 below. The analysis includes ‘indirect values’ and ‘indirectbehaviour standards’ because some students indicated that their organisations had independent values andbehaviour standards statements listed immediately after their mission statements in relevant companydocuments.
4.3 PurposeAn overwhelming majority of managers in the sample, 23 out of 25, indicated in their assignments that themission statements of their organisations were in compliance with the purpose element of the Ashridgemission model. Only two of the managers, whose organisations were in the transport and auto spares andhospitality and fast food sectors, stated that their corporate mission statements were not in compliance withthe element.
Table 2 – Ashridge Mission Model Components (n=25)
Component Total “Yes’s” and/or “No’s”
Mission Statement Component Yes No
Purpose 23 2
Strategy 19 6
Values 10 6
Behaviour Standards 3 15
Indirect Values 7
Indirect Behaviour Standards 6
One of the 23 managers who indicated that their organisations’ mission statements were in compliancewith the purpose component said:
This comes out very clear in the ... [organisation name stated] University mission statement. The universityis there to enable people to realise their full potential.
A manager in the hospitality and fast food sector who indicated that his organisation’s mission statementwas not compliant with the purpose element said:
The ... [company name cited] mission is not conclusive in terms of purpose. The question ‘what businessis the company in?’ is not addressed in the mission statement. The mission statement lacks depth anddirection in terms of revealing the three pillars of purpose as expounded by the Ashridge missionmodel. It is not clear from the mission statement for whose benefit the company is in existence.
4.4 StrategyThe majority of the respondents; 19, said their organisations’ mission statements were consistent with thestrategy component of the Ashridge mission model and only 6 indicated that they were not compliant. Thissuggests that most of the mission statements in the sample were designed from a context where it wasrecognised that strategy should be reflected.
One of the 19 respondents who agreed that their corporate mission statements were consistent with thestrategy component said:
N. Muzondo et al.
18 University of Zimbabwe Business Review, Volume 1, No. 1, 2013
The mission statement of my organisation is ‘to be the leading supplier of world class medical, surgical,dental and laboratory products that meet our customers’ needs at affordable prices. The inclusion ofthe phrase ‘affordable prices’ shows that strategy is reflected in the mission statement. My conclusionis that the organisation’s mission statement is compliant with the strategy element of the model.
Among the six managers who acknowledged that their corporate mission statements were not consistentwith the model’s strategy element, one said:
The mission statement of ... [company name given] fails glaringly to define the business domain inwhich the company is operating. Generally, the strategy of the company is not clearly expressed in themission statement.
The manager, from the fast food chain also stated that the mission statement needed to have included atleast a phrase that reflected the strategy. The phrases that he suggested are ‘the market the company competesin’, ‘the position the company holds in industry’, and ‘distinctive competences or competitive advantagesthat the company has or plans to create’.
4.5 ValuesOnly 10 of the managers in the sample agreed that the mission statements of their organisations weredirectly compliant with the values aspect of the Ashridge mission model while six affirmatively stated thatthey were not compliant. However, a further seven respondents from the sample stated that their organisationswere indirectly compliant with the values aspect. That is because they acknowledged that the corporatedocuments where mission statements of their respective organisations were captured also included a valuesstatement which was stated immediately after the mission. Overall, 17 of the organisations in the samplecan be said to be in compliance with the values aspect of the model.
Among the 10 managers who categorically admitted that the values element was directly reflected in theircorporate mission statements, one of them stated:
The mission statement of ... [company name provided] expresses specific values that the organisationbelieves in, though in the [corporate] mission statement these values are captured as principles.
The mission statement of the very organisation reads:
At ... [company name stated] we believe that in order for us to be happy in this life, we need to base ourlives on certain principles that, when developed in our character, will lead to happiness and success.The principles that we want to develop and stand for at ... [company name stated] are: integrity, respectand development of the individual, customer focus, quality, and responsible citizenship.
Apparently, the organisation with the mission statement above is the only one in the sample whose missionstatement neither reflects the purpose nor strategy element, contrary to the prescription of Campbell andYeung’s (1991) Ashridge mission model. It is the mission statement of a leading Zimbabwean fast foodchain.
Among the six respondents in the sample who indicated that their corporate mission statements did notreflect the values component is a manager who said:
Our company’s mission statement is completely silent on values and this is inconsistent with theAshridge mission model which postulates that the [mission] statement should, indeed, identify thevalues that link with the organisation’s purpose and act as beliefs that employees feel proud of...Thesilence on values is perhaps not surprising given the absence of clarity on strategy in the [organisation’s]mission statement.
Marketing managers’ perceptions of the applicability of Ashridge mission model to organisations in Zimbabwe
University of Zimbabwe Business Review, Volume 1, No. 1, 2013 19
4.6 Behaviour standardsFifteen out of 25 managers in the sample (a majority) affirmatively stated that the mission statements oftheir organisations were not in conformity with the behaviour standards element of the Ashridge missionmodel. At the same time, only three managers categorically agreed that the corporate mission statementswere consistent with the framework’s behaviour standards prescription. A further six managers suggestedthat their organisational mission statements were indirectly consistent with the behaviour standardscomponent as their organisations had a behaviour standard statement coming after the mission statement.This means that nine respondents only agreed that their organisations’ ‘missioning’ effort acknowledges theimportance of behaviour standards while 15 seem to suggest that this element is not critical. Only onemanager in the sample did not indicate whether his organisation’s mission statement was consistent withthe behaviour standards element. Overall, this means that the behaviour standards component was theleast reflected component of the Ashridge mission model in mission statements of the organisations in thesample.
A manager among those who categorically stated that their mission statements were inconsistent with thebehaviour standards element said:
...’s [company name supplied] mission statement lacks the component of behaviour standards. However,the company expects its employees to behave in a certain way but it has not captured that in its missionstatement. For instance, the organisation always supplies genuine products and regards the safety of itsclients as crucially important. It educates customers on safety issues regarding the use of its products.This could be viewed as part of behaviour standards. However, the company mission statement has noword or phrase that includes these things.
Another student in the cluster of respondents whose corporate mission statement did not include thebehaviour standards component said:
My company’s mission statement does not describe the critical behavioural standards that serve asbeacons of the strategy and the values—and this is not surprising given that the strategy and values arenot given in the first place. Consequently, ...’s [company name stated] employees cannot judge whetherthey have behaved correctly or otherwise as there is no guidance on behaviour standards from themission statement.”
A respondent from a mining company among the students who agreed that their corporate mission statementswere consistent with the behaviour standards component of the Ashridge mission model said:
...’s [company name supplied] mission statement describes important behavioural standards that serve asbeacons of strategy and values. These include utilizing resources responsibly, conducting business inan environmentally responsible manner, safeguarding the health and safety of all stakeholders,continuously improving all systems and expression of commitment by staff.
The behavioural standards are described in such a way that individual employees can judge if theyhave behaved correctly or not. These behavioural standards have also been translated into policies andbehavioural guidelines. The company’s Seven Cardinal Rules on Safety as well as consistent Safety,Health and Environment (SHE) inductions, for example, were derived from the need to safeguardstakeholders’ safety and health as well as conducting business in an environmentally responsiblemanner.”
5. DISCUSSION AND IMPLICATIONS5.1 DiscussionThis study assessed marketing managers’ perceptions of the application of the Ashridge mission model as amanagerial tool for analysing the quality of corporate mission statements in Zimbabwe. Data to fulfill thestudy’s objective were gathered from a convenience sample of 25 postgraduate marketing students in a
N. Muzondo et al.
20 University of Zimbabwe Business Review, Volume 1, No. 1, 2013
leading university in the country. The students are employed in marketing management jobs. Nearly allmission statements in the sample were in compliance with the purpose, strategy and values elements of theAshridge mission model. But only fewer than half of the mission statements were in conformity with themodel’s behaviour standards component. This is a worrying revelation because Campbell and Yeung (1991)suggest that behaviour standards encompass the behaviour patterns that underpin the competence andvalue system of the organisation.
In addition, there were no excellent mission statements in the sample as none of them reflect all fouressential elements of an ideal mission statement as prescribed in the Ashridge mission model. However, themajority of mission statements reflect either the two hardware components or one of them. These are;purpose and/or strategy, and at least one of the software components namely; values and behaviour standards.As such, the quality of mission statements in the sample ranges from ‘good’ to ‘average’. Only one of the 23mission statements, belonging to a leading fast food chain in the country, can be rated as poor because it isin compliance with the values aspect of the Ashridge mission model only and no other element. All missionstatements in the sample also reflected at least one component of the model hence there was no ‘very poor’mission statement. Overall, the content of the majority of mission statements in the sample reflect theprescription of Campbell and Yeung’s (1991) Ashridge mission model. While the organisations’ internalstakeholders may not have been aware of the model at the time the mission statements were crafted, the factthat they reflect the tool suggest that the model is useful for marketing planners as a starting point inmission analysis and designing.
5.2 ConclusionAlthough based on perceptions of a small and convenience sample of postgraduate marketing students inone of the leading universities in Zimbabwe, the findings of this study, seem to prove that the Ashridgemission model is being applied to design corporate mission statements in the country because the majorityof mission statements in the sample are consistent with the purpose, strategy and values components of themodel. Consequently, marketing managers in the country can apply the model to analyse and designorganisational mission statements. Nonetheless, given the convenience nature of the sample, it is fundamentalthat any future investigations on the relevance of the Ashridge mission model are based on large andprobability samples of respondents if the results are to be generalised.
6. REFERENCESAbell, D.F. (1980) Defining the Business: The Starting Point of Strategic Planning, Prentice Hall, Englewood Cliffs, NJ.
Abratt, R. (1989) “A new approach to corporate image management process”, Journal of Marketing Management, Vol. 5, No. 1,pp. 63-76.
Adams, J., Khan, H.T.A., Raeside, R. and White, D. (2007) Research Methods for Graduate Business and Social Science Students,Response Books/Sage Publications, Singapore & New Delhi.
Armstrong, G. and Kotler, P. (2009) Marketing: An Introduction, Nineth Edition, Pearson Prentice Hall, Englewood Cliffs, NJ.
Campbell, A. and Yeung, S. (1991) “Creating a Sense of Mission”, Longrange Planning, Vol. 24, No. 4, pp. 10-20.
Check-Teck, F. and Lowe, A. (1999) “Modelling for corporate identity studies: case of identity as communications strategy”,Corporate Communications: An International Journal, Vol. 4, No. 2, pp. 89-92.
de Wit, B. and Meyer, R. (1998) Strategy: Process, Content, Context, Second Edition, Thompson Learning, London.
Gilligan, C. and Wilson, R.M.S. (2003) Strategic Marketing Planning, Butterworth-Heinemann, Oxford.
Hofstede, G. (1993) ‘Cultural Constraints in Management Theories’, Academy of Management Executive, Vol. 7, No. 1, in de Wit,B. and Meyer, R. (1998) Strategy: Process, Content, Context, Second Edition, Thompson Learning, pp. 51-63.
Johnson, G. and Scholes, K. (2002) Exploring Corporate Strategy, Sixth Edition, Prentice Hall of India, New Delhi.
Kemp, S. and Dwyer, L. (2003) “Mission statements of international airlines: A content Analysis”, Tourism Management, 24, pp.635–653.
Kothari, C.R. (2004) Research Methodology: Methods and Techniques, Second Edition, New Age International, New Delhi.
Marketing managers’ perceptions of the applicability of Ashridge mission model to organisations in Zimbabwe
University of Zimbabwe Business Review, Volume 1, No. 1, 2013 21
Kotler, P., Keller, K.L., Koshy, A. and Jha, M. (2009) Marketing Management, 13th Edition, Pearson, New Delhi.
Lancaster, G. (2005) Research Methods in Management: A Concise Introduction to Research in Management and Business Consultancy,Elsevier Butterworth-Heinemann, Oxford.
McDonald, M. (2008) Malcolm McDonald on Marketing Planning: Understanding Marketing Plans and Strategy, Kogan Page, London& Philadelphia.
Melewar, T.C. and Karaosmanoglu, E. (2006) “Seven dimensions of corporate identity: A categorization from the practitioners’perspectives”, European Journal of Marketing, Vol. 40, No. 7/8, pp. 846-869.
Muzondo, N. (2012) “Mission analysis and the Ashridge mission model: An operational conceptual framework”, UniversalJournal of Management and Social Sciences, Vol. 2, No. 5, pp. 57-68.
Muzondo, N., Kaseke, N., Mandebvu, G. and Mhizha, A. (2013) “A content analysis of Zimbabwean mission statements: Howuseful is the Ashridge mission model?”, African Journal of Social Sciences, Vol. 3, No.1, pp. 97-110.
Piercy, N. and Morgan, N.A. (1994) “Mission analysis: An operational approach”, Journal of General Management, Vol. 19, No.3,pp. 1-19.
Sidhu, J. (2003) “Mission statements: It is time to shelve them?” European Management Journal, Vol. 21, No. 4, pp. 439-446,August.
Stuart, H. (1999) “Exploring the corporate identity/corporate image interface: An empirical study of accounting firms”, JournalCommunication Management, Vol. 2, No. 4, pp. 357-371.
Wheelen, T.L. and Hunger, J.D. (2002) Concepts in Strategic Management and Business Policy, Eighth Edition, Pearson Education,Singapore & New Delhi.
A. Zinyemba & R. Zinyemba
22 University of Zimbabwe Business Review, Volume 1, No. 1, 2013
Service-delivery of non-governmental organizations in Zimbabwe:
Challenges and stategies
Alice Zinyemba1, Ranga Zinyemba2
1Department of Business Studies, University of Zimbabwe2Catholic University in Zimbabwe
ABSTRACTNon-governmental organizations (NGO)s operating in Zimbabwe face a number oforganizational and management challenges that impact negatively on the delivery of theirservices. Those NGOs that seem to be doing well have adequate human capital with thenecessary skills and competencies to perform. They have a flat structure that encouragesteam work and minimises delays in decision making. Successful NGOs allow for creativityand innovation, especially when the projects are being implemented at grass roots level.They have effective boards that ensure good governance through the use of properadministrative and management policies and procedures that govern their work. They arefinancially well resourced. The challenges that face many NGOs in Zimbabwe are the lack offinancial resources, inexperienced manpower, political interference and involvement, lackof planning and prioritisation of programmes and poor coordination of activities in thefield. NGOs in Zimbabwe could improve delivery of their services by coordinating andnetworking with other NGOs in the same field.
Key words: Non-governmental organisation, effective, management, challenges, service delivery
1. INTRODUCTIONThere are various definitions of what an NGO is. What appears common to the definitions is the fact thatNGOs are non profit, voluntary, citizen based organisations that operate independently of government.Some NGOs are primarily concerned with developmental projects while others concern themselves withpromoting a cause or advocacy (Chawarika, 2011; Turkish weekly, 2013). The functions of NGOs varyimmensely, ranging from service delivery to human rights and relief groups. The umbrella body for NGOsoperating in Zimbabwe is the National Association of Non-governmental Organisations (NANGO). Thereare more than 1 000 NGOs operating under NANGO (www.ngo.org/ngoinfo/define.html, 2013).
There are many organisational and management challenges that hinder effective delivery of service by NGOs.These NGOs also experience challenges that are external to them which also affect their service delivery.
1.1 Importance of the studyThis study is important in that it sheds light on the areas of weaknesses for NGOs and how NGOs canimprove their service delivery by addressing the internal organisational and management challenges identifiedin the study.
The study also benefits government and policy makers as it provides insights into how they can facilitate theeffective service delivery of NGOs.
Funding partners will also benefit from the study because it highlights an area that needs to be addressed bythem.
Beneficiaries of projects will benefit from the study when service delivery by NGOs is improved.
Service-delivery of NGOs in Zimbabwe: Challenges and strategies
University of Zimbabwe Business Review, Volume 1, No. 1, 2013 23
2. PROBLEM INVESTIGATEDEffective delivery of service by NGOs operating in Zimbabwe is influenced by a number of internal andexternal organisational and management factors. A research was carried out in April – May 2013 to investigatethe challenges facing the management of NGOs in Zimbabwe and the strategies that could be used tomitigate those challenges.
3. PURPOSE /OBJECTIVESThe purpose of this article is to present the findings of the study carried out to identify the challenges ofmanaging NGOs in Zimbabwe and the strategies that could be used to mitigate those challenges.
4. RESEARCH METHODOLOGYThe study to investigate and identify the challenges faced by NGOs in Zimbabwe and the strategies thatcould be used to meet those challenges was carried out using the following method:
A questionnaire was designed and sent to 15 NGOs operating in both rural and urban areas of Zimbabwe.The NGOs were randomly selected. This was not a representative sample of all the NGOs operating inZimbabwe. It was an indicative sample that provided an insight into the challenges facing the managementof NGOs and the strategies that could be used to improve their effectiveness. Seven (7) NGOs out of the 15that were selected responded to the questionnaire.
The questionnaire was administered to directors, programme officers and field staff. The questionnairesolicited for qualitative responses to the following questions:
a. nature and core business of the NGO;
b. number of years that the NGO has been in operation;
c. the number of people employed;
d. what was going well with how the NGO was managed;
e. what was not going well with how the NGO was managed;
f. what hindered the effectiveness of the NGO in its service delivery;
g. what changes were needed to improve service delivery by NGO; and
h. recommendations to improve service delivery of NGOs in Zimbabwe in general.
Responses to the questions were analysed and grouped into the following categories;
• characteristics of NGO that responded to the questionnaire;
• factors promoting effective delivery of serve by NGOs;
• factors negatively impacting on service delivery by NGOs; and
• recommendations and strategies for improving service delivery by NGOs.
5. FINDINGSThe findings from the study are presented below. The findings were then analysed in the light of experiencesof other NGOs in the region.
5.1 Characteristics of NGOs that responded to the questionnaireCharacteristics of NGOs that responded to the questionnaire are summarised in table 1.
The table summarises the core business of each NGO that responded to the questionnaire, the area ofoperation, the number of people employed by the NGO and the number of years that the NGO has been inoperation. The actual names of the NGOs are not revealed for confidentiality purposes. They are representedby numbers 1–7.
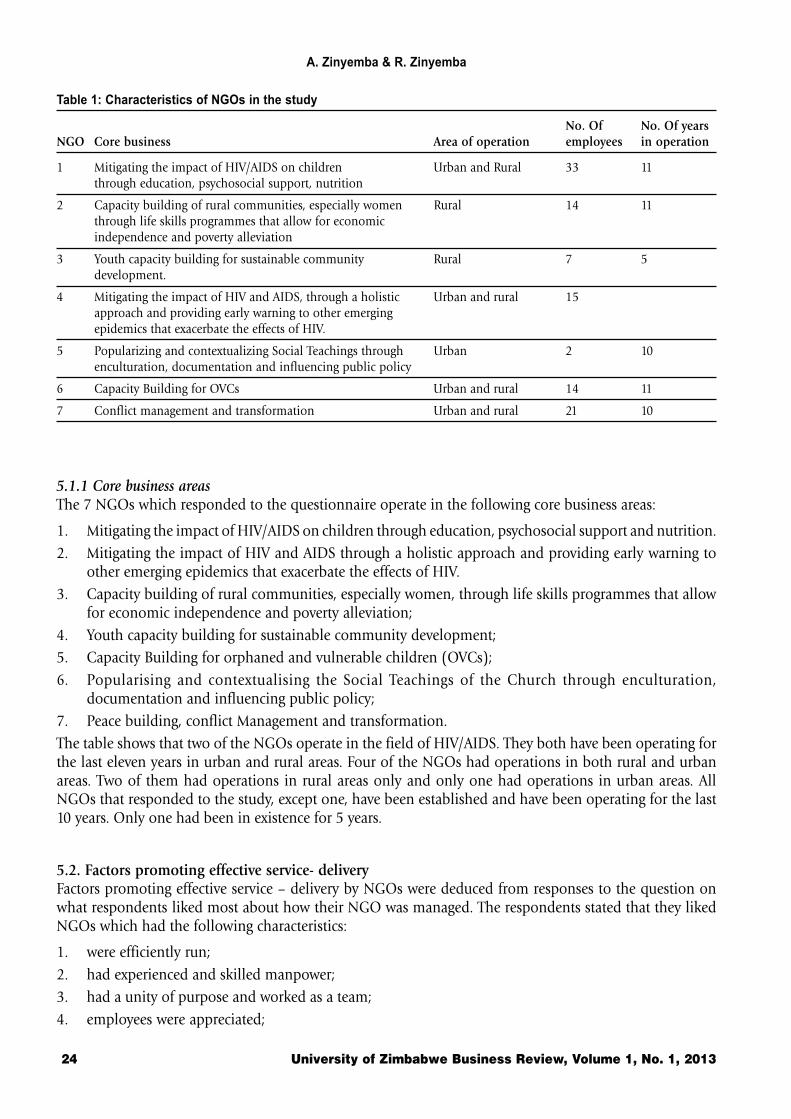
A. Zinyemba & R. Zinyemba
24 University of Zimbabwe Business Review, Volume 1, No. 1, 2013
Table 1: Characteristics of NGOs in the study
No. Of No. Of yearsNGO Core business Area of operation employees in operation
1 Mitigating the impact of HIV/AIDS on children Urban and Rural 33 11through education, psychosocial support, nutrition
2 Capacity building of rural communities, especially women Rural 14 11through life skills programmes that allow for economicindependence and poverty alleviation
3 Youth capacity building for sustainable community Rural 7 5development.
4 Mitigating the impact of HIV and AIDS, through a holistic Urban and rural 15approach and providing early warning to other emergingepidemics that exacerbate the effects of HIV.
5 Popularizing and contextualizing Social Teachings through Urban 2 10enculturation, documentation and influencing public policy
6 Capacity Building for OVCs Urban and rural 14 11
7 Conflict management and transformation Urban and rural 21 10
5.1.1 Core business areasThe 7 NGOs which responded to the questionnaire operate in the following core business areas:
1. Mitigating the impact of HIV/AIDS on children through education, psychosocial support and nutrition.
2. Mitigating the impact of HIV and AIDS through a holistic approach and providing early warning toother emerging epidemics that exacerbate the effects of HIV.
3. Capacity building of rural communities, especially women, through life skills programmes that allowfor economic independence and poverty alleviation;
4. Youth capacity building for sustainable community development;
5. Capacity Building for orphaned and vulnerable children (OVCs);
6. Popularising and contextualising the Social Teachings of the Church through enculturation,documentation and influencing public policy;
7. Peace building, conflict Management and transformation.
The table shows that two of the NGOs operate in the field of HIV/AIDS. They both have been operating forthe last eleven years in urban and rural areas. Four of the NGOs had operations in both rural and urbanareas. Two of them had operations in rural areas only and only one had operations in urban areas. AllNGOs that responded to the study, except one, have been established and have been operating for the last10 years. Only one had been in existence for 5 years.
5.2. Factors promoting effective service- deliveryFactors promoting effective service – delivery by NGOs were deduced from responses to the question onwhat respondents liked most about how their NGO was managed. The respondents stated that they likedNGOs which had the following characteristics:
1. were efficiently run;
2. had experienced and skilled manpower;
3. had a unity of purpose and worked as a team;
4. employees were appreciated;
Service-delivery of NGOs in Zimbabwe: Challenges and strategies
University of Zimbabwe Business Review, Volume 1, No. 1, 2013 25
5. management encouraged creativity and innovation at all levels;
6. the organization was a learning one, and practised participatory methodologies in programming andmanagement;
7. the NGO had a management structure and a board responsible for policy, board members withexperienced individuals who had knowledge of community mobilization and use of participatorymethodologies in programming;
8. there was wide consultation before a decision was made and everyone was involved;
9. board members rotated as directors on a 4 - year term and this allowed for injection of fresh ideas andnew energies into the organization;
10. the organization had both financial and programmatic management systems and policies in place;
11. management had an open door policy and everyone was free to approach management on any issue;
12. the NGO had a flat structure that was not bureaucratic and had quick decision - making;
5.3 Factors negatively impacting on service delivery of NGOsResponses to the question about what respondents liked least about how their NGO was managed providedinsight into what factors hindered their service delivery. The findings revealed that the NGOs:
1. gave priority to bigger funded projects than to smaller ones which engaged in core business;
2. lacked effective planning at lower levels;
3. lacked consistency in the application of policies;
4. had limited resources to support full implementation of projects as per demand;
5. lacked documentation of experiences and lessons learnt;
6. lacked enough resources for training of staff; and
7. experienced interference from founding members.
6 DISCUSSION ON FINDINGS6.1 ChallengesThe above reasons which respondents regarded as contributing to ineffective delivery of service by theirspecific NGOs can be said to contribute to the ineffective delivery of service by NGOs in general. In analysingthe responses to why some NGOs were not meeting their objectives, the study identified the followingchallenges:
6.1.1 Lack of sufficient time to plan and to fundraiseThe NGOs did not leave enough time to do operational planning as it is key to implementing programmeson the ground. NGOs have programmes which are funded by different donors and each donor requests areport on the progress being made on the projects that they fund. Funding agencies insist on reports beingsubmitted before any funding is provided for future projects. This means that all projects must be implementedand funds utilized before deadlines for implementation expire. NGOs fall into the trap of being pre- occupiedwith report writing and implementation of projects at the expense of planning and fundraising.
6.1.2 Late disbursement of fundsImplementation of projects depends on the availability of funds. NGOs experience delays in the disbursementof funds to start implementing the projects on the ground. Project implementation in rural areas is alsoseasonal. During the rainy season, people in the farming communities do not avail themselves to projectsuntil much later, when they wait for harvesting time. This means that the projects are hurriedly implementedin order to meet the deadlines.
A. Zinyemba & R. Zinyemba
26 University of Zimbabwe Business Review, Volume 1, No. 1, 2013
6.1.3 Funding constraintsEffective service delivery is hampered by financial constrains. Late disbursement of funds to implementprojects as noted above often results in projects being implemented hurriedly. Prescriptive donor funding isanother major challenge. Funding partners usually provide support towards projects without financial supportfor administrative and personnel requirements that are needed for effective project implementation.
Funding partners sometimes have generic and predetermined policy guidelines which may not match thepriorities of recipient organisations and their beneficiaries. This means that those projects which may notbe regarded as priority by funding partners may not receive funding even if they are beneficiary to thecommunity.
6.1.4 Political instability and interferenceThe operating environment, especially in some of the rural areas, in the last few years after 2008, does notallow for smooth implementation of activities because of political instability. Those organisations thatteach communities to ask real questions are viewed as bad and having an agenda for regime change. Staffpersonal security is of concern because of political instability. Politicians also interfere with the work ofNGOs and have an influence on which NGOs can operate in their area and on what kind of projects.Permission for an NGO to operate in an area has to be sought from both the government, traditional andlocal leadership of an area.
6.1.5 Bureaucracy within government departmentsImplementation of projects often requires approval of government. Delays are often experienced when anNGO needs certain approvals, for example, in obtaining work permits for technical experts or in gettingMemorandum of Understanding (MoUs) signed.
6.1.6 Lack of skilled personnelNGOs experience difficulties in attracting and retaining well qualified and experienced staff. Staff is usuallyemployed on contracts which are tied to a project. At the end of the project a contract might or might not berenewed. A lot depends on the availability of continued funding for a particular project. NGOs are alsoconstrained in financial resources for the capacity building of staff. Funding partners tend to support projectimplementation more than staff training. Most NGOs therefore tend to be thin on the ground. The limitedstaff is therefore over-stretched as they have to cover large areas and spending long working hours in thefield. This often results in staff burn out and poor service delivery by the NGOs.
6.2 StrategiesFactors that promote effective management of NGOs in their efforts to meet their objectives can be deducedfrom responses provided by the participants in the study to the question on what they liked most abouthow their NGO was managed. The factors can be grouped into several categories, namely human capital,teamwork, board and governance, and organizational structure. The following are the strategies that wereidentified:
6.2.1 Human capitalAn effective NGO has adequate, experienced and skilled manpower. There are enough personnel to do thework for which the NGO was created. The staff has skills to fundraise and to implement the projects. Theydevelop strategic plans which are guided by the organisation’s vision and mission.
Service-delivery of NGOs in Zimbabwe: Challenges and strategies
University of Zimbabwe Business Review, Volume 1, No. 1, 2013 27
6.2.2 Team workTeam work is one of the factors that contribute to the effective management of NGOs. There is a unity ofpurpose among staff and the programmes are well integrated and coordinated. Everybody understands thepurpose and objectives of the NGO. Roles are clearly defined and understood by all. Management is accessibleto all through the practice of open door policy.
6.2.3 Creativity and innovationAn effective NGO allows creativity and innovation at all levels. Creativity is called for at all levels especiallywhen funds are limited and when donors place limitations and prescriptions on how the funds should beutilised. The situation calls for creativity and doing things differently while at the same time, meeting donorand beneficiaries’ expectations.
6.2.4 Organisational structure and governanceEffective NGOs have a management structure that is flat. A flat structure is less bureaucratic and allows forquick decision – making. The board of directors is responsible and makes policies that promote goodgovernance. Board members are experienced and they freely share their expertise with the organisation.Appointment of new members to the board periodically, allows for fresh ideas and new energies beinginjected into the organisation. Management systems and policies are in place to guide the operations of theNGO. Good governance ensures relevance of programmes and this promotes integrity and confidence inthe eyes of both the donors and beneficiaries. There is consistency in application and implementation ofpolicies. Corporate governance is a matter of concern for NGOs (Moore sand Stewart, 1998).
6.2.5 Resources and sustainabilityAn effective NGO is well resourced and financially sound. This requires the existence of competencies inwriting bankable project proposals that can attract funding. Resources also include the availability of vehiclesand equipment such as computers.
7. CHALLENGES IN RELATION TO REGIONAL EXPERIENCESThis section analyses the findings of the research on challenges facing the management of NGOs in light ofthe experiences of other countries in the region.
This study categorises the issues that hinder effective management of NGOs and their service delivery, asexperienced by the 7 NGOs that participated in the research into 4 areas namely:
• capacity issues;
• resources issues;
• management issues;
• external issues and
• governance issues
7.1 Capacity issuesAttracting and retaining good quality staff is a challenge for most NGOs. NGO funding is usually tied toprojects. Personnel are employed to implement projects which have a life span. This means that personnelare employed on short - term contracts with no guarantee for continued employment. Funding partnersusually do not support administrative and personnel costs. This is why most NGOs have a small staffestablishment. The staff become overstretched by working long hours to complete their tasks and to meetdeadlines.
A. Zinyemba & R. Zinyemba
28 University of Zimbabwe Business Review, Volume 1, No. 1, 2013
Capacity is also to do with skills and competencies required to implement projects. Most staff appear tohave basic computer skills. They lack skills for information management and documentation. NGOs do notseem to have enough finances to train staff. Limited resources are allocated to staff training.
Lack of capacity to fundraise for projects is another major issue that affects effective delivery of service byNGOs. There is also a tendency to focus exclusively on implementing existing projects to the detriment ofraising funds for new projects. This is coupled with the issue that project proposal writing is in itself a skillthat is acquired and one needs to develop those skills.
7.2 Resources IssuesResearch has shown that NGOs in general, and in Zimbabwe in particular, depend on some source offoreign funding (Chawarika, 2011). However, funding partners usually provide support for projects withoutsupport for administrative and personnel requirements. This means that funding is not usually flexible. Asa result, some areas and projects which may be in demand but are not supported by donors, may sufferfrom lack of funding. Donors have their own priority areas that they support. There is also a challenge interms of sustainability if and when the funding ceases.
There are situations where donor funding is available for certain objectives which may not be the same forwhich the NGO was created. At times NGOs end up implementing those projects which receive fundingeven at the expense of their mission objectives. Funding partners usually provide support towards the projectswithout support for administrative and personnel requirements. Such concerns as staff salaries and stafftraining usually suffer from lack of funding.
Late disbursement of funds is a major concern for NGOs that participated in the study. It takes time forfunds to be released by funding agencies and this affects projects’ start up, making it necessary that projectsbe quickly implemented before the expiry of the project life-time. As a result, activities are hurriedly done inorder to meet the project dead - lines.
7.3 External issuesOne of the major external issues affecting the management and effectiveness of NGO s is political interferenceand involvement. Zimbabwean laws that have impacted negatively on NGOs include the Public Order andSecurity Act (POSA) and Access to Information and Protection of Privacy Act (AIPPA) among others. Theyplace limitations on freedom of association, assembly and information (Raftopolous, 2000). These limitationshave resulted in the curtailment of NGO activities in Zimbabwe.
Political polarisation and instability in Zimbabwe make the operations and management of projects difficult.Organisations that operate at the grassroots level, especially in the area of human rights are sometimesviewed as supporting the opposition and are therefore not tolerated by the government. NGOs’ staff personalsecurity is sometimes at risk. Political interference and instability render the management and implementationof NGO projects difficult, especially for those NGOs in the area of human rights which are viewed withdistrust and seen as advancing the interests of foreign governments. They are viewed by the ZimbabweGovernment as unsympathetic to Zimbabwe. It has been noted that some NGOs in Zimbabwe deliberatelydo not involve themselves in lobbying and advocacy activities for fear of being misunderstood as drivers ofanti-government agendas (Chawarika, 2011).
Some NGOs appear to have strong political ties to the point of seeming to be extensions of political parties,especially when staff members subsequently run for councillorship or party positions in the areas wherethey have been operating. This situation compromises the perceived objectivity of such NGOs inimplementing development projects or in carrying out relief programmes such as food aid.
Service-delivery of NGOs in Zimbabwe: Challenges and strategies
University of Zimbabwe Business Review, Volume 1, No. 1, 2013 29
7.4 Government bureaucracyGovernment bureaucracy often results in delayed implementation of projects. This happens when decisionsby government departments or local authorities take too long or when approval to operate in a certain areatakes long to be granted. The implementation period may be shortened and quality of implementation iscompromised as a result of such delays.
7.5 Internal management issuesManagement of some NGOs seem to put a lot of emphasis on implementation of projects and writing ofdonor reports, such that little time is left for strategic and operational planning. This often results in prioritiesnot being clear and donor agencies taking advantage of that situation with the result that funds get redirectedto other priorities which suit the donors.
The lack of intensive documentation of experiences and lessons learnt often leads to valuable experiencesnot being documented and lost.
Failure by NGO staff to observe protocol at the grassroots community level often leads to none acceptanceof some projects at implementation stage even if they are funded.
Governance is another issue affecting effective management of NGOs. NGOs are often started by an individualor group of individuals or a family and operate as trusts. When the NGO has grown and is supposed to berun by a board, experience has shown that the founding members often have problems in letting go andthere is mixed accountability. As a result, separation of family funds and project funds becomes unclear.
Poor networking with other NGOs operating in the same field or in the same areas of operation oftenresults in duplication of efforts and double dipping by the recipients. Double dipping occurs whenbeneficiaries receive aid such as food or money from different NGOs for the same cause. This emanatesfrom a situation where there is poor coordination of the work of NGOs and the need to compare registers ofbeneficiaries. The same people end up receiving aid while others do not. It becomes difficult to measure theimpact and effectiveness of the services offered by NGOs working in the same geographical area and in thesame core business and working with the same beneficiaries.
These findings reflect some of the findings that have also been identified in other studies in the region(www.turkishweekly.net/article/159/organizational-problems-of-non-governmental-organisations.2013).Some of the findings from a regional workshop held in Kenya on challenges and opportunities for regionalNGOs revealed the challenges summarized below:
1. There is a high dependency on donor funding and most NGOs suffer from a lack of sufficient funds torun projects.
2. Good governance was compromised by founders of NGOs who often regarded the NGO as their “baby”and had problems in letting go.
3. Lack of strategic planning and establishment of priorities often left NGOs at the mercy of donors whodictated how funds should be utilized.
4. There was a duplication of efforts and “double dipping” at the community level because of poornetworking and coordination of activities among NGOs.
5. Lack of capacity to fundraise for projects.6. Some NGOs experienced inadequate capacity in technical areas and leadership and management of
organisations.7. Interference from local politicians and civic leaders often makes the operations of NGOs at the local
level difficult.
8. RECOMMENDATIONS FROM THE STUDYRespondents from the seven NGOs in the study made a number of suggestions to improve the effectivemanagement of their NGOs in particular and other NGOs in general. The following is a summary ofrecommendations that were commonly identified:
A. Zinyemba & R. Zinyemba
30 University of Zimbabwe Business Review, Volume 1, No. 1, 2013
8.1 Collaboration and networking with other NGOSIn order to avoid duplication of efforts and “double dipping” by beneficiaries, it is important that NGOsworking in the same field and operating in the same geographic areas collaborate and integrate their activities.Collaboration implies sharing of information and maintaining a coordinated register of beneficiariesespecially when it comes to food aid distribution and other social services offered by NGOs.
Networking would be made much easier in situations where NGOs create platforms for sharing information.
8.2 SustainabilityThe question of sustainability is of paramount importance especially to donors. The more sustainable projectsare, the less dependent they will be on donor funding. By their very nature, it is difficult for NGOs to be selfsufficient. Since donors are not keen on spending money on administrative support but on actual programmesthat benefit the identified beneficiaries, it is recommended that NGOs be able to generate income thatcould be used to finance administrative support. This means that NGOs should engage in income generatingactivities for that purpose.
8.3 Maintaining strategic focusThere is a tendency by some NGOs to bend backwards and implement projects which are funded eventhough they may not be of priority to the NGO’s mission. This has tarnished the image of NGOs with theNGO work being regarded as “commercialising” their services. The NGO work is seen by some as more of amoney spinning venture than providing much needed social services. This situation is created when anNGO lacks adequate financial resources to run programmes that are guided by their mission. This negativeimage can easily be removed by planning and prioritising programmes and embarking on fundraising ingood time.
8.4 Resource mobilizationRelated to maintaining a strategic focus is the need to mobilise resources. Resource mobilisation needs to bedone in good time and not left until the situation is dire. Resource mobilisation requires good proposalwriting skills, networking and the ability to maintain good relations with donor agencies. Board memberscan also help with resource mobilisation since it should be within their interest that the organisation is wellresourced.
8.5 DocumentationA piece of evidence that shows the impact and effectiveness of an NGO’s services is the documentation of itsexperiences and programmes. This requires good documentation and writing skills. Documentation can bein the form of reports, books, documentary films etc. The documentaries can be used in the field duringsensitisation exercises, training, lobbying and other campaigns.
8.6 Capacity building for staffCapacity building of staff and management in NGOs is necessary for the effective delivery of project activitiesand services. Management skills such as teamwork, strategic planning, report and proposal writing andtraining in how to fund raise are important. Project planning, implementation, monitoring and evaluationare important especially for field staff. Constant on - the - job training for staff and management to enablethem to respond to the ever changing environment is necessary.
Service-delivery of NGOs in Zimbabwe: Challenges and strategies
University of Zimbabwe Business Review, Volume 1, No. 1, 2013 31
8.7 Good governanceGood governance is key to the effective management of NGOs. Good governance implies the existence ofpolicies and procedures which must be adhered to and implemented. The implementation of policies andprocedures encourages proper management of resources and programmes. Policies such as Human resourcespolicy and administration procedures, supply and purchasing policy, transport policy, etc. encouragetransparency and professionalism. However there should be consistency in the application of those policiesand procedures. It is the responsibility of the Board to ensure that key policies and procedures are establishedand implemented by Management.
9. CONCLUSIONNGOs operating in Zimbabwe face a number of internal and external challenges that hinder theirmanagement. Effective management and delivery of project activities and service by NGOs in Zimbabwerequire a stable political environment for them to flourish and realise their objectives. Collaboration andnetworking with other NGOs in the field operating in the same area is necessary. It is important for NGOsnot to compromise their objectives by engaging in good strategic planning and prioritisation of programmes.Resource mobilisation should be an on-going activity to ensure that NGOs are well resourced and notcompromised. Although it may be difficult for an NGO to be self-sufficient, sustainability of programmescould be ensured if NGOs also embark on income generating activities to meet administrative costs ofimplementing programmes. Documentation of experiences is an important way to show the effectivenessand impact of an NGO’s programmes.
10. REFERENCESChawarika, B. 2011. Challenges faced NGOs in the political harsh climate of Zimbabwe: Analysing the effects of sustainability and
promotion of human rights: A dissertation.
Moore, M. and Stewart, S. 1998. “Corporate governance for NGOs?” in Development in Practice, Volume 8, Number 3.
Raftopolous, B. 2000. NGOs, the State and Politics in Zimbabwe, Harare: SAPES.
www.turkishweekly.net/article/159/organizational- problems-of-non-governmental-organizations (accessed 5/9/2013).
www.ngo.org/ngoinfo/define.html (accessed 10 May 2013).
www.penkenya.org/.../challenges%20 and %20 opportunities facing NGOs (Accessed 1/6/2013).
V. Machona & N. Kaseke
32 University of Zimbabwe Business Review, Volume 1, No. 1, 2013
Deposit-attracting strategies in the financial sector in a multi-currency
setting: The case of commercial banks in Zimbabwe
Vinicent Machona1, Nyasha Kaseke1
1Graduate School of Management, University of Zimbabwe
ABSTRACTBanks in Zimbabwe are facing challenges in attracting deposits from customers due to severalreasons. The banking sector has implemented a wide range of strategies in a bid to attractdeposits. These strategies can be broadly classified as promotional, distribution and customerrelationship management. The study used the whole population of banks in Zimbabwe. Thestudy reveals that only a few of the strategies implemented seem to work while the rest areineffective. The study concludes that banks are not exhaustively using distribution strategiesand CRM strategies. The study recommends that banks should get into strategic allianceswith local or international partners and introduce information technology frameworks andprocesses in order to secure customer information and funds.
Key Words: Deposits, Distribution Strategies, Promotional Strategies, Customer Relationship ManagementStrategies.
1. INTRODUCTIONModern economic systems depend on reliable flow of financing through the financial intermediaries (Collins,2008). The financial system is like the pump of the economy (Collins, 2008). A breakdown in the systemaffects all other economic units. During the global financial crisis between 2007 and 2009, this essentialand complex system of finance experienced a sequence of critical failures (Hawkins, 2011).
Following the global financial crisis, most commercial banks in developing countries were affected negativelyby the crisis. In Zimbabwe, due to the contagion effect, most commercial banks were affected due tointernational linkage. The global financial crisis coincided with the hyperinflation and the introduction ofthe multi-currency era in Zimbabwe. Hyperinflation wiped out depositors’ funds as well as the capital of thecommercial banks. This compelled banks to go back to the drawing board to design strategies they coulduse in such an environment. For Zimbabwe, the problem was compounded by the introduction of themulti-currency system in February 2009. This ushered in a radically new environment, which created bothopportunities and challenges for the banking sector. The introduction of the multi-currency meant thatbanks had to devise strategies to attract depositors since their deposits had been buried after the death of theZimbabwean dollar. The management problem for most of the commercial banks was therefore to deviseeffective strategies to attract depositors.
1.1 Backgound of the Banking Sector in ZimbabweZimbabwe had a sophisticated banking and financial market with commercial banks that were mostlyforeign owned by 1980 (Makoni, 2010). The country had a Central Bank inherited from the Central Bank ofRhodesia and Nyasaland at the winding up of the Federation. The government of Zimbabwe did not interferewith the banking industry. There was neither nationalisation of foreign owned banks nor restrictive legislativeinterference, despite the socialistic national ideology (Makoni, 2010).
After 1987 the government, at the behest of multilateral lenders, embarked on an Economic and StructuralAdjustment Programme (ESAP). As part of this programme, the Reserve Bank of Zimbabwe (RBZ) startedadvocating financial reforms through liberalisation and deregulation (Makoni, 2010). It contended that theoligopoly in banking and lack of competition deprived the sector of choice and quality in service, innovationand efficiency. Consequently, as early as 1994, the Reserve Bank of Zimbabwe (RBZ) Annual Report indicates
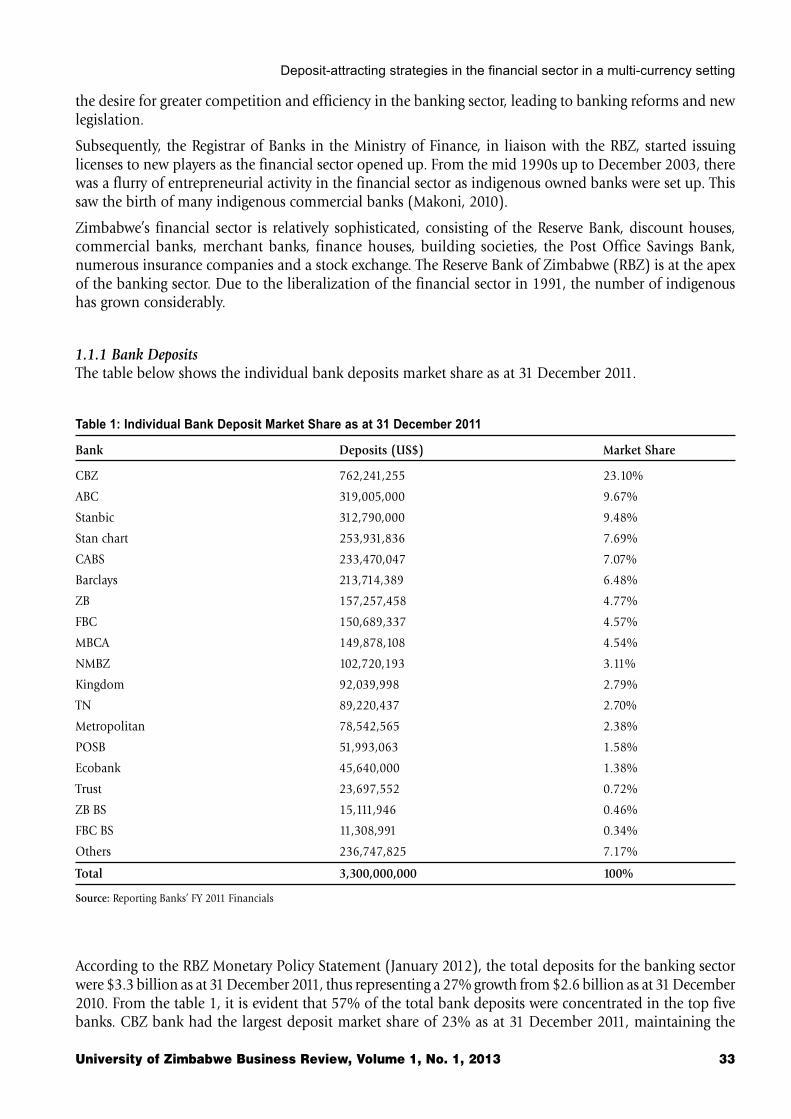
Deposit-attracting strategies in the financial sector in a multi-currency setting
University of Zimbabwe Business Review, Volume 1, No. 1, 2013 33
the desire for greater competition and efficiency in the banking sector, leading to banking reforms and newlegislation.
Subsequently, the Registrar of Banks in the Ministry of Finance, in liaison with the RBZ, started issuinglicenses to new players as the financial sector opened up. From the mid 1990s up to December 2003, therewas a flurry of entrepreneurial activity in the financial sector as indigenous owned banks were set up. Thissaw the birth of many indigenous commercial banks (Makoni, 2010).
Zimbabwe’s financial sector is relatively sophisticated, consisting of the Reserve Bank, discount houses,commercial banks, merchant banks, finance houses, building societies, the Post Office Savings Bank,numerous insurance companies and a stock exchange. The Reserve Bank of Zimbabwe (RBZ) is at the apexof the banking sector. Due to the liberalization of the financial sector in 1991, the number of indigenoushas grown considerably.
1.1.1 Bank DepositsThe table below shows the individual bank deposits market share as at 31 December 2011.
Table 1: Individual Bank Deposit Market Share as at 31 December 2011
Bank Deposits (US$) Market Share
CBZ 762,241,255 23.10%
ABC 319,005,000 9.67%
Stanbic 312,790,000 9.48%
Stan chart 253,931,836 7.69%
CABS 233,470,047 7.07%
Barclays 213,714,389 6.48%
ZB 157,257,458 4.77%
FBC 150,689,337 4.57%
MBCA 149,878,108 4.54%
NMBZ 102,720,193 3.11%
Kingdom 92,039,998 2.79%
TN 89,220,437 2.70%
Metropolitan 78,542,565 2.38%
POSB 51,993,063 1.58%
Ecobank 45,640,000 1.38%
Trust 23,697,552 0.72%
ZB BS 15,111,946 0.46%
FBC BS 11,308,991 0.34%
Others 236,747,825 7.17%
Total 3,300,000,000 100%
Source: Reporting Banks’ FY 2011 Financials
According to the RBZ Monetary Policy Statement (January 2012), the total deposits for the banking sectorwere $3.3 billion as at 31 December 2011, thus representing a 27% growth from $2.6 billion as at 31 December2010. From the table 1, it is evident that 57% of the total bank deposits were concentrated in the top fivebanks. CBZ bank had the largest deposit market share of 23% as at 31 December 2011, maintaining the
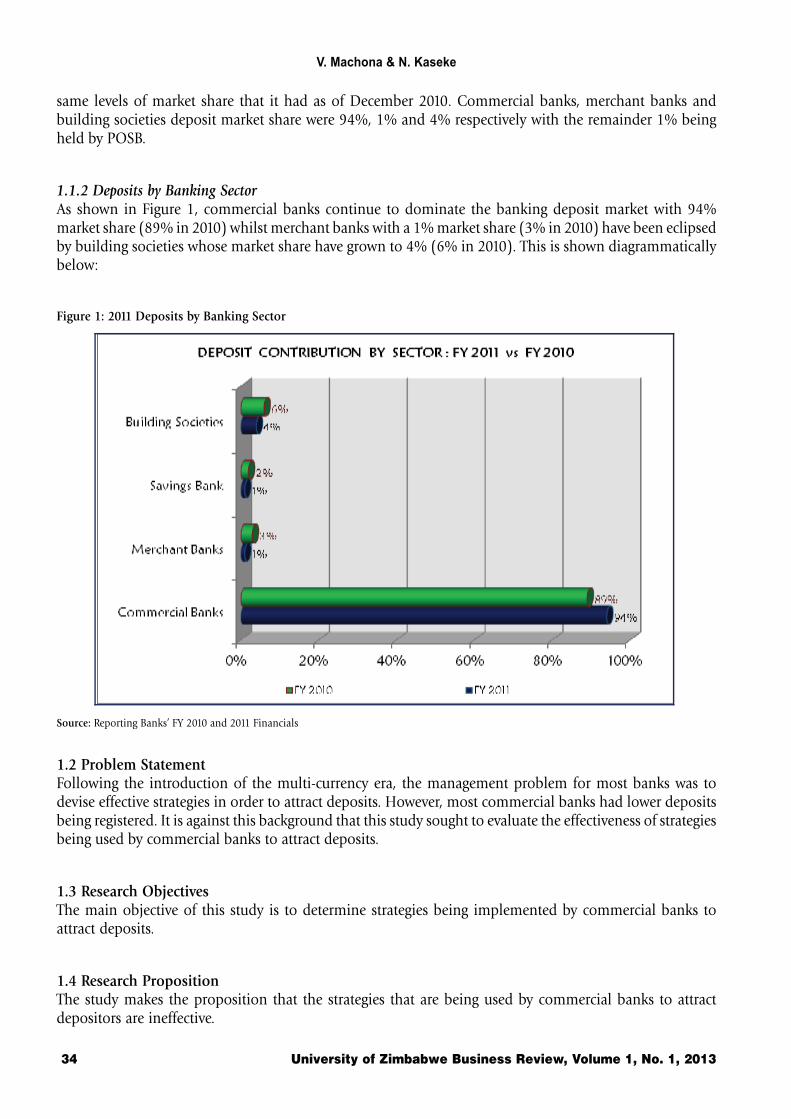
V. Machona & N. Kaseke
34 University of Zimbabwe Business Review, Volume 1, No. 1, 2013
same levels of market share that it had as of December 2010. Commercial banks, merchant banks andbuilding societies deposit market share were 94%, 1% and 4% respectively with the remainder 1% beingheld by POSB.
1.1.2 Deposits by Banking SectorAs shown in Figure 1, commercial banks continue to dominate the banking deposit market with 94%market share (89% in 2010) whilst merchant banks with a 1% market share (3% in 2010) have been eclipsedby building societies whose market share have grown to 4% (6% in 2010). This is shown diagrammaticallybelow:
Figure 1: 2011 Deposits by Banking Sector
Source: Reporting Banks’ FY 2010 and 2011 Financials
1.2 Problem StatementFollowing the introduction of the multi-currency era, the management problem for most banks was todevise effective strategies in order to attract deposits. However, most commercial banks had lower depositsbeing registered. It is against this background that this study sought to evaluate the effectiveness of strategiesbeing used by commercial banks to attract deposits.
1.3 Research ObjectivesThe main objective of this study is to determine strategies being implemented by commercial banks toattract deposits.
1.4 Research PropositionThe study makes the proposition that the strategies that are being used by commercial banks to attractdepositors are ineffective.
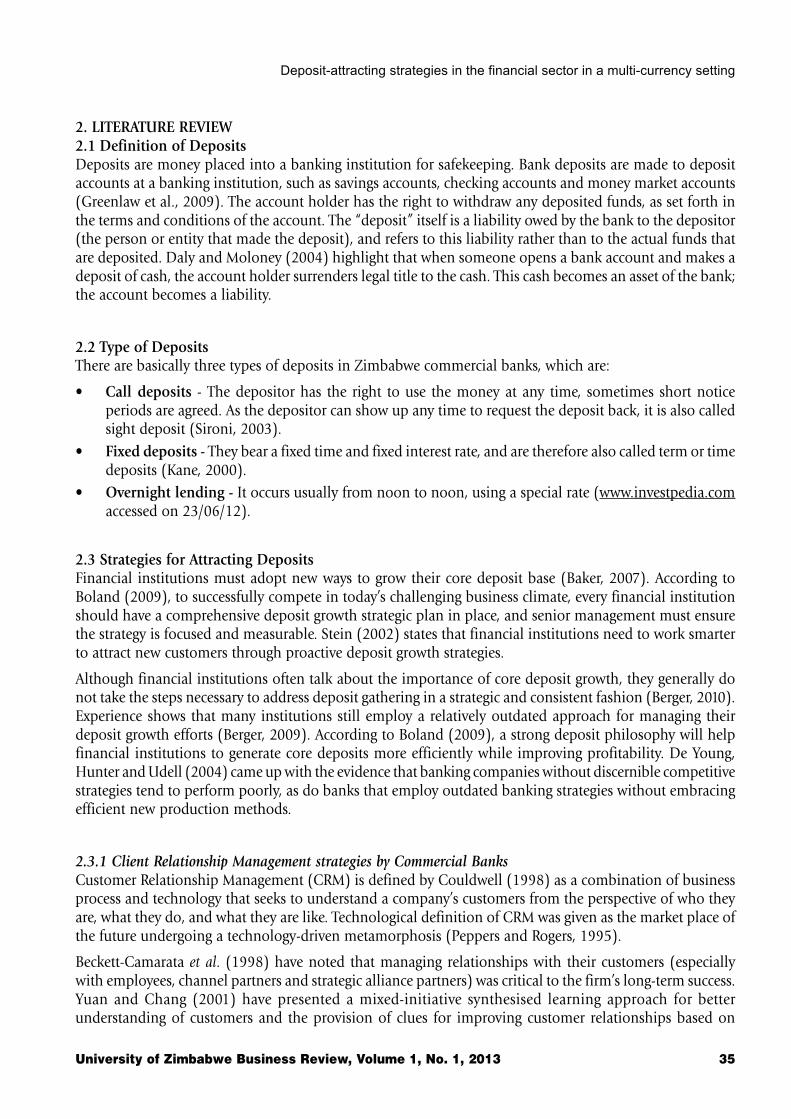
Deposit-attracting strategies in the financial sector in a multi-currency setting
University of Zimbabwe Business Review, Volume 1, No. 1, 2013 35
2. LITERATURE REVIEW2.1 Definition of DepositsDeposits are money placed into a banking institution for safekeeping. Bank deposits are made to depositaccounts at a banking institution, such as savings accounts, checking accounts and money market accounts(Greenlaw et al., 2009). The account holder has the right to withdraw any deposited funds, as set forth inthe terms and conditions of the account. The “deposit” itself is a liability owed by the bank to the depositor(the person or entity that made the deposit), and refers to this liability rather than to the actual funds thatare deposited. Daly and Moloney (2004) highlight that when someone opens a bank account and makes adeposit of cash, the account holder surrenders legal title to the cash. This cash becomes an asset of the bank;the account becomes a liability.
2.2 Type of DepositsThere are basically three types of deposits in Zimbabwe commercial banks, which are:
• Call deposits - The depositor has the right to use the money at any time, sometimes short noticeperiods are agreed. As the depositor can show up any time to request the deposit back, it is also calledsight deposit (Sironi, 2003).
• Fixed deposits - They bear a fixed time and fixed interest rate, and are therefore also called term or timedeposits (Kane, 2000).
• Overnight lending - It occurs usually from noon to noon, using a special rate (www.investpedia.comaccessed on 23/06/12).
2.3 Strategies for Attracting DepositsFinancial institutions must adopt new ways to grow their core deposit base (Baker, 2007). According toBoland (2009), to successfully compete in today’s challenging business climate, every financial institutionshould have a comprehensive deposit growth strategic plan in place, and senior management must ensurethe strategy is focused and measurable. Stein (2002) states that financial institutions need to work smarterto attract new customers through proactive deposit growth strategies.
Although financial institutions often talk about the importance of core deposit growth, they generally donot take the steps necessary to address deposit gathering in a strategic and consistent fashion (Berger, 2010).Experience shows that many institutions still employ a relatively outdated approach for managing theirdeposit growth efforts (Berger, 2009). According to Boland (2009), a strong deposit philosophy will helpfinancial institutions to generate core deposits more efficiently while improving profitability. De Young,Hunter and Udell (2004) came up with the evidence that banking companies without discernible competitivestrategies tend to perform poorly, as do banks that employ outdated banking strategies without embracingefficient new production methods.
2.3.1 Client Relationship Management strategies by Commercial BanksCustomer Relationship Management (CRM) is defined by Couldwell (1998) as a combination of businessprocess and technology that seeks to understand a company’s customers from the perspective of who theyare, what they do, and what they are like. Technological definition of CRM was given as the market place ofthe future undergoing a technology-driven metamorphosis (Peppers and Rogers, 1995).
Beckett-Camarata et al. (1998) have noted that managing relationships with their customers (especiallywith employees, channel partners and strategic alliance partners) was critical to the firm’s long-term success.Yuan and Chang (2001) have presented a mixed-initiative synthesised learning approach for betterunderstanding of customers and the provision of clues for improving customer relationships based on
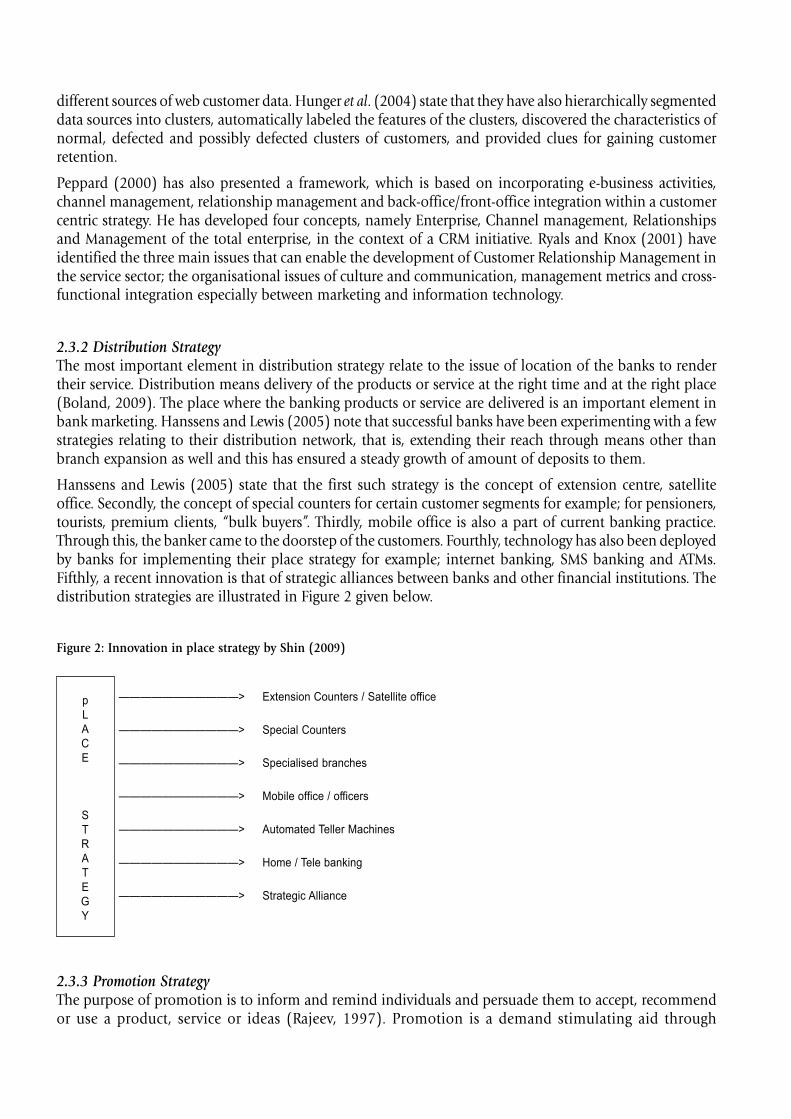
different sources of web customer data. Hunger et al. (2004) state that they have also hierarchically segmenteddata sources into clusters, automatically labeled the features of the clusters, discovered the characteristics ofnormal, defected and possibly defected clusters of customers, and provided clues for gaining customerretention.
Peppard (2000) has also presented a framework, which is based on incorporating e-business activities,channel management, relationship management and back-office/front-office integration within a customercentric strategy. He has developed four concepts, namely Enterprise, Channel management, Relationshipsand Management of the total enterprise, in the context of a CRM initiative. Ryals and Knox (2001) haveidentified the three main issues that can enable the development of Customer Relationship Management inthe service sector; the organisational issues of culture and communication, management metrics and cross-functional integration especially between marketing and information technology.
2.3.2 Distribution StrategyThe most important element in distribution strategy relate to the issue of location of the banks to rendertheir service. Distribution means delivery of the products or service at the right time and at the right place(Boland, 2009). The place where the banking products or service are delivered is an important element inbank marketing. Hanssens and Lewis (2005) note that successful banks have been experimenting with a fewstrategies relating to their distribution network, that is, extending their reach through means other thanbranch expansion as well and this has ensured a steady growth of amount of deposits to them.
Hanssens and Lewis (2005) state that the first such strategy is the concept of extension centre, satelliteoffice. Secondly, the concept of special counters for certain customer segments for example; for pensioners,tourists, premium clients, “bulk buyers”. Thirdly, mobile office is also a part of current banking practice.Through this, the banker came to the doorstep of the customers. Fourthly, technology has also been deployedby banks for implementing their place strategy for example; internet banking, SMS banking and ATMs.Fifthly, a recent innovation is that of strategic alliances between banks and other financial institutions. Thedistribution strategies are illustrated in Figure 2 given below.
Figure 2: Innovation in place strategy by Shin (2009)
p
L
A
C
E
S
T
R
A
T
E
G
Y
———————————> Extension Counters / Satellite office
———————————> Special Counters
———————————> Specialised branches
———————————> Mobile office / officers
———————————> Automated Teller Machines
———————————> Home / Tele banking
———————————> Strategic Alliance
2.3.3 Promotion StrategyThe purpose of promotion is to inform and remind individuals and persuade them to accept, recommendor use a product, service or ideas (Rajeev, 1997). Promotion is a demand stimulating aid through
Deposit-attracting strategies in the financial sector in a multi-currency setting
University of Zimbabwe Business Review, Volume 1, No. 1, 2013 37
communication. Any marketing promotion campaign has two objectives, which are: to inform the prospectivecustomer and to persuade him or her. Due to the inherent intangible nature of services, the customer ofbanking service relies more on subjective impressions rather than concrete evidence (Greenlaw et al., 2008).When a bank comes out with a new product, it makes its target customer segment aware of it only throughmarketing promotion. It may be done in various forms like press advertisements, sales campaigns, word ofmouth, personal interaction and direct mailing. Turning one into a customer may be enough if the productis unique or in great demand, but this may not always be the case. According to Raveendran (1998) thesecond fundamental objective of a promotion campaign is to persuade the customer to buy the product inpreference to other similar products available in the market and this can only be accomplished effectivelyby the use of a variety of strategies rather than sticking to using only one or two.
Brunner et al (2004) state that the promotional effort for banking services consists of both personal andimpersonal devices. Personal device is purely subjective in nature and it differs from person to person.Impersonal promotion can be through advertising, publicity and sales promotion. Personal selling is theresponsibility of the bank staff. Impersonal selling should be done by the respective banks and theirassociation (Kuruppuswami, 1986). The bank must try to understand the real needs and aspirations of thesociety and provide such product or services which will satisfy their assets. According to Haldane (2009) themarketing strategy should be designed to suit not only the present market but also the potential futuremarket.
3. RESEARCH METHODOLOGYThe research adopted phenomenological philosophy. This was the basic plan which guided the data collectionand analysis phases of the research project. The population comprised of the commercial banks’ management,general staff and their clients. The population size is about 13 commercial banks and over a million customersspread countrywide. The commercial banks are Kingdom bank, TN, Commercial Bank of Zimbabwe, Z.B.,First Banking Corporation, National Merchant Bank of Zimbabwe, MBCA., BANC ABC, Barclays, Stanbic,Standard Chartered, Metropolitan and Ecobank.
The study used the Krajcie and Morgan (1970) statistical proven model to determine the research samplesize from the total population outlined in the target population. A total of 100 questionnaires were sent tothe bank employees, management and customers. There are thirteen commercial banks in Zimbabwe andhence each of the banking institutions received the questionnaires. Within management and staff strata,questionnaires were randomly distributed to them as they reported for work at the reception. Customerswere randomly selected in the banking halls whilst much significance was given to corporate clients as theyhad a closer relationship with banks as compared to walk-in customers.
4. RESEARCH FINDINGS4.1 Promotional StrategiesFigure 3 shows how respondents rate the promotional strategies used by commercial banks to attract deposits.
According to the results from the study, the majority of respondents believed that the most popularpromotional strategies used by commercial banks were press adverts, with 55% respondents, and word ofmouth with 51% of the respondents. These are the most traditional forms of promotional strategies. On theother hand, 66% of the respondents had the view that internet was not being effectively used by banks as astrategy to attract deposit and 65% of the respondents believed that banks were not conducting enoughsales campaigns to attract deposits. These results from the study show that the promotional strategiesemployed by banks are not effective enough to attract more deposits as they are leaving out some otherpotential customers from their catchment area and this shows that there are some lost depositors.
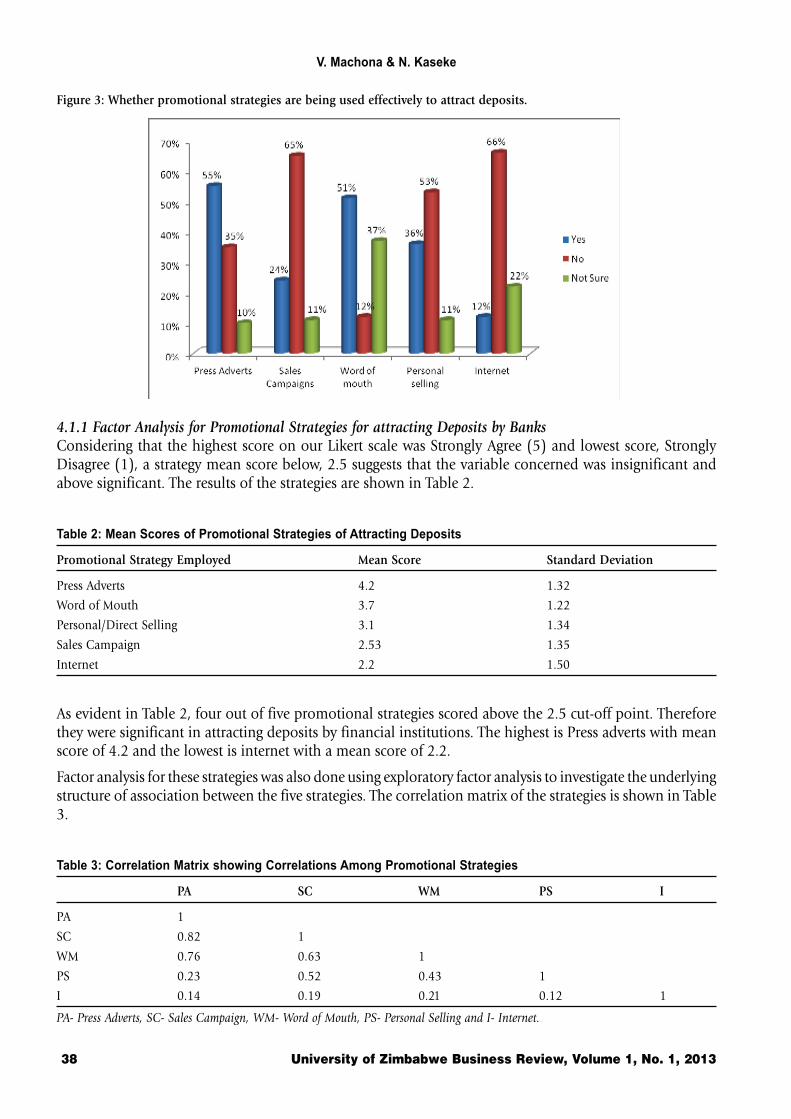
V. Machona & N. Kaseke
38 University of Zimbabwe Business Review, Volume 1, No. 1, 2013
4.1.1 Factor Analysis for Promotional Strategies for attracting Deposits by BanksConsidering that the highest score on our Likert scale was Strongly Agree (5) and lowest score, StronglyDisagree (1), a strategy mean score below, 2.5 suggests that the variable concerned was insignificant andabove significant. The results of the strategies are shown in Table 2.
Table 2: Mean Scores of Promotional Strategies of Attracting Deposits
Promotional Strategy Employed Mean Score Standard Deviation
Press Adverts 4.2 1.32
Word of Mouth 3.7 1.22
Personal/Direct Selling 3.1 1.34
Sales Campaign 2.53 1.35
Internet 2.2 1.50
As evident in Table 2, four out of five promotional strategies scored above the 2.5 cut-off point. Thereforethey were significant in attracting deposits by financial institutions. The highest is Press adverts with meanscore of 4.2 and the lowest is internet with a mean score of 2.2.
Factor analysis for these strategies was also done using exploratory factor analysis to investigate the underlyingstructure of association between the five strategies. The correlation matrix of the strategies is shown in Table3.
Table 3: Correlation Matrix showing Correlations Among Promotional Strategies
PA SC WM PS I
PA 1
SC 0.82 1
WM 0.76 0.63 1
PS 0.23 0.52 0.43 1
I 0.14 0.19 0.21 0.12 1
PA- Press Adverts, SC- Sales Campaign, WM- Word of Mouth, PS- Personal Selling and I- Internet.
Figure 3: Whether promotional strategies are being used effectively to attract deposits.
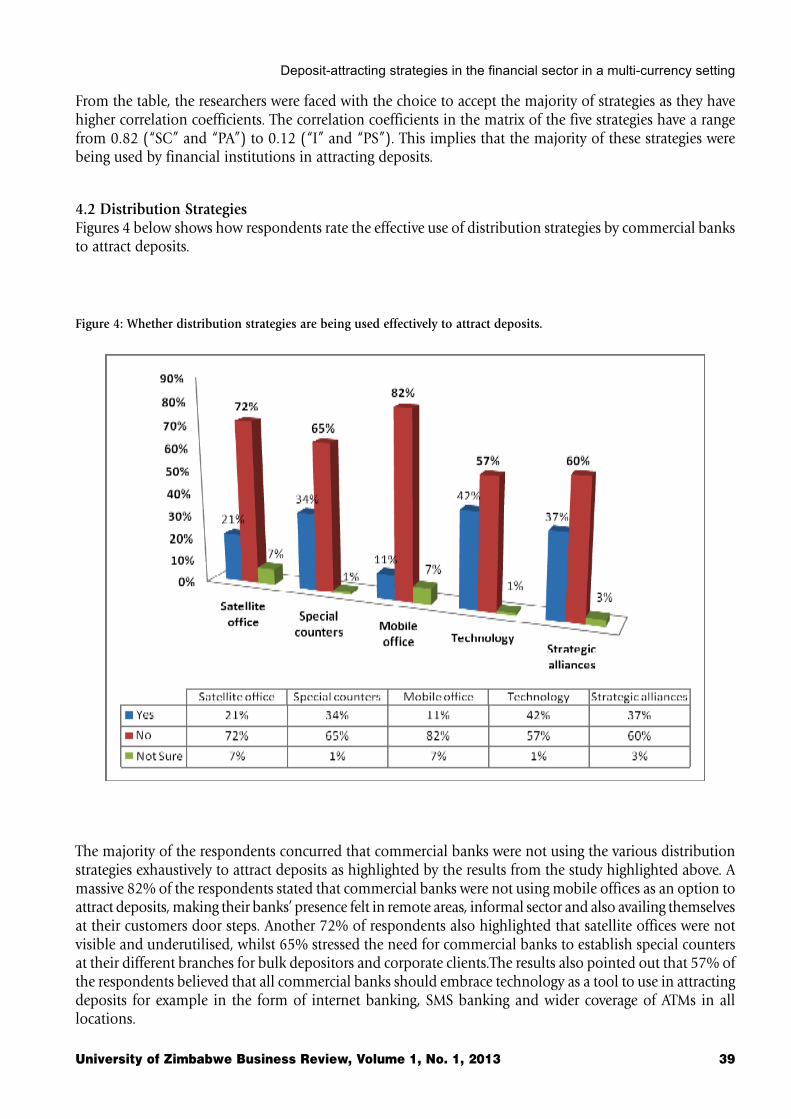
Deposit-attracting strategies in the financial sector in a multi-currency setting
University of Zimbabwe Business Review, Volume 1, No. 1, 2013 39
From the table, the researchers were faced with the choice to accept the majority of strategies as they havehigher correlation coefficients. The correlation coefficients in the matrix of the five strategies have a rangefrom 0.82 (“SC” and “PA”) to 0.12 (“I” and “PS”). This implies that the majority of these strategies werebeing used by financial institutions in attracting deposits.
4.2 Distribution StrategiesFigures 4 below shows how respondents rate the effective use of distribution strategies by commercial banksto attract deposits.
Figure 4: Whether distribution strategies are being used effectively to attract deposits.
The majority of the respondents concurred that commercial banks were not using the various distributionstrategies exhaustively to attract deposits as highlighted by the results from the study highlighted above. Amassive 82% of the respondents stated that commercial banks were not using mobile offices as an option toattract deposits, making their banks’ presence felt in remote areas, informal sector and also availing themselvesat their customers door steps. Another 72% of respondents also highlighted that satellite offices were notvisible and underutilised, whilst 65% stressed the need for commercial banks to establish special countersat their different branches for bulk depositors and corporate clients.The results also pointed out that 57% ofthe respondents believed that all commercial banks should embrace technology as a tool to use in attractingdeposits for example in the form of internet banking, SMS banking and wider coverage of ATMs in alllocations.
V. Machona & N. Kaseke
40 University of Zimbabwe Business Review, Volume 1, No. 1, 2013
4.2.1 Factor Analysis for Distribution Strategies for attracting Deposits by Banks
Table 4: Mean Scores of Distribution Strategies of Attracting Deposits
Distribution Strategy Employed Mean Score Standard Deviation
Technology (Mobile & Internet Banking) 3.89 0.82
Strategic Alliances 3.22 1.42
Special Counters 2.78 1.64
Satellite Offices 2.21 1.50
Mobile Offices 1.84 1.65
Table 4 shows that, three out of five distribution strategies scored above the 2.5 cut-off point. Therefore theywere significant in attracting deposits for financial institutions. The highest is Technology (mobile bankingand Internet banking) with mean score of 3.89 and the lowest is mobile offices with a mean score of 1.84.
The correlation matrix of the distribution strategies is shown in Table 5.
Table 5: Correlation Matrix showing Correlations Among Distribution Strategies
T SA SCo SO MO
T 1
SA 0.80 1
SCo 0.67 0.72 1
SO 0.32 0.63 0.64 1
MO 0.18 0.22 0.39 0.33 1
T- Technology, SA- Strategic Alliance, SCo- Special Counters, SO- Satellite Offices, MO- Mobile Offices.
From the table, the researchers were faced with the choice to accept the majority of distribution strategies asthey have higher correlation coefficients. The correlation coefficients in the matrix of the five distributionstrategies have a range from 0.80 (“SA” and “T”) to 0.18 (“MO” and “T”). This implies that the majority ofthese distribution strategies were being used by financial institutions in attracting deposits.
4.3 Customer Relationship Management StrategiesTable 6 below shows how respondents rate the effective use of customer relationship management strategiesby commercial banks to attract deposits.
Table 6: Use of customer relationship management strategies by banks to attract deposits.
Brick & Toll free Mobile salesWebsites Call centers Mortar stores numbers force staff Advertising
No 67% 89% 14% 70% 77% 35%
Yes 30% 8% 80% 28% 21% 55%
Not Sure 3% 3% 6% 2% 2% 10%
Results from the study show that the customer relationship management strategy mainly employed bybanks was the brick and mortar stores which are the physical bank buildings or branch complex as 80% ofthe respondents had that view. A distant second place customer relationship management strategy used by
Deposit-attracting strategies in the financial sector in a multi-currency setting
University of Zimbabwe Business Review, Volume 1, No. 1, 2013 41
banks was advertising with 55% of the respondents believing so. However, the majority of respondentsbelieve that there has been insufficient use of customer relationship management strategies by most, if notall, commercial banks to attract deposits. The findings show that 89% of the respondents believe thatcommercial banks are not using call centers as a strategy to attract deposits, whilst 70% had the view thattoll free numbers were being underutilised by banks as a tool to attract deposits as they build a relationshipwith clients in the form of connectivity and communication link that could easily turn into businesstransactions and deposits.
A further 77% of respondents concurred that the employment of mobile sales force staff would be beneficialto commercial banks’ fortunes in attracting deposits. This could have immensely contributed to the depletingof the amount of deposits received by commercial banks.
4.3.1 Factor Analysis for CRM Strategies for attracting Deposits by Banks
Table 7: Mean Scores of CRM Strategies of Attracting Deposits
CRM Strategy Employed Mean Score Standard Deviation
Brick and Mortar Stores 3.9 1.12
Advertising 2.7 1.43
Use of Websites 2.2 1.67
Toll free Numbers 2.1 1.55
Mobile Sales Force Staff 1.8 1.30
Call Centers 1.4 1.86
As evident in Table 7, two out of six CRM strategies scored above the 2.5 cut-off point, so these two wereonly significant in attracting deposits by banks. The highest is Brick and Mortar Stores with mean score of3.9 and the lowest is Call Centers with a mean score of 1.4.
Factor analysis for these strategies was also done using exploratory factor analysis to investigate the underlyingstructure of association between the five strategies. The correlation matrix of the strategies is shown in Table8.
Table 8: Correlation Matrix showing Correlations Among CRM Strategies
BMS AD WEB TFN MSFS CC
BMS 1
AD 0.67 1
WEB 0.28 0.36 1
TFN 0.32 0.25 0.34 1
MSFS 0.41 0.21 0.12 0.23 1
CC 0.08 0.05 0.17 0.06 0.09 1
BMS- Brick and Mortar Stores, AD- Advertising, WEB- Website, TFN- Toll Free Numbers, MSFS- Mobile Sales Force Staff and CC-Call Centres.
From the table, the researchers were faced with the choice to reject the majority of strategies as they havelower correlation coefficients. The correlation coefficients in the matrix of the six strategies have a rangefrom 0.67 (“AD” and “BMS”) to 0.05 (“CC” and “AD”). This implies that the majority of these strategieswere ineffective in attracting deposits by banks.
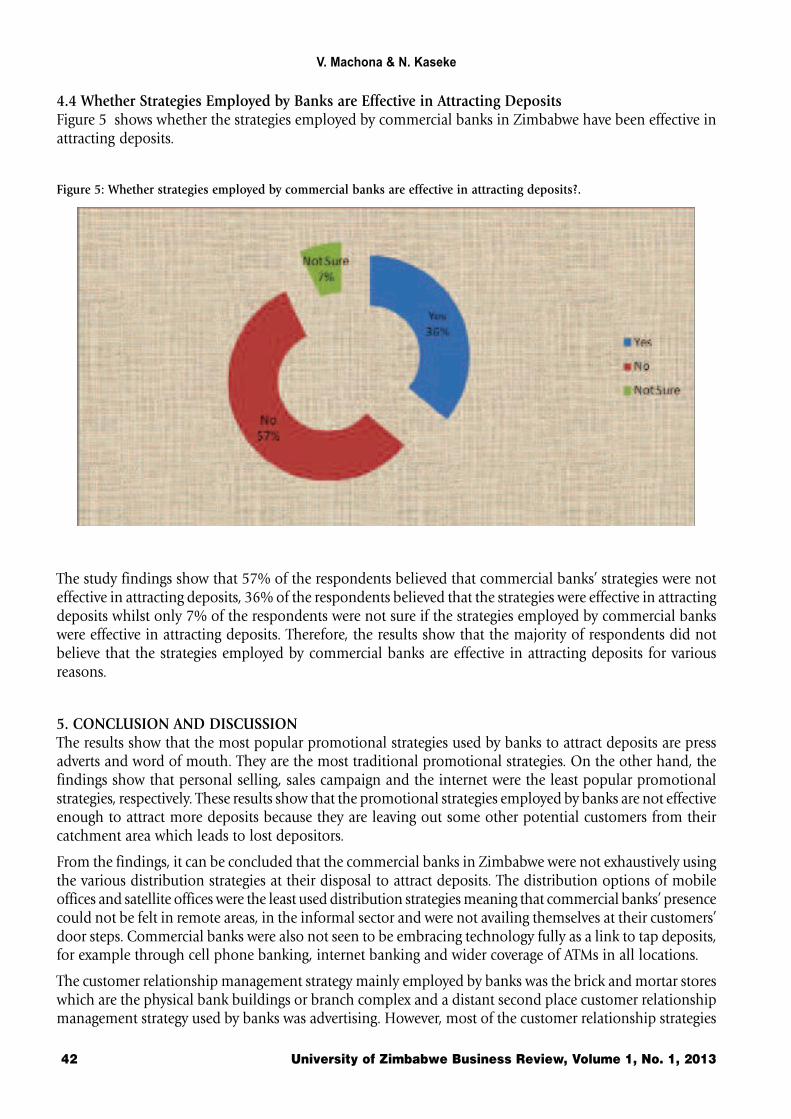
V. Machona & N. Kaseke
42 University of Zimbabwe Business Review, Volume 1, No. 1, 2013
4.4 Whether Strategies Employed by Banks are Effective in Attracting DepositsFigure 5 shows whether the strategies employed by commercial banks in Zimbabwe have been effective inattracting deposits.
Figure 5: Whether strategies employed by commercial banks are effective in attracting deposits?.
The study findings show that 57% of the respondents believed that commercial banks’ strategies were noteffective in attracting deposits, 36% of the respondents believed that the strategies were effective in attractingdeposits whilst only 7% of the respondents were not sure if the strategies employed by commercial bankswere effective in attracting deposits. Therefore, the results show that the majority of respondents did notbelieve that the strategies employed by commercial banks are effective in attracting deposits for variousreasons.
5. CONCLUSION AND DISCUSSIONThe results show that the most popular promotional strategies used by banks to attract deposits are pressadverts and word of mouth. They are the most traditional promotional strategies. On the other hand, thefindings show that personal selling, sales campaign and the internet were the least popular promotionalstrategies, respectively. These results show that the promotional strategies employed by banks are not effectiveenough to attract more deposits because they are leaving out some other potential customers from theircatchment area which leads to lost depositors.
From the findings, it can be concluded that the commercial banks in Zimbabwe were not exhaustively usingthe various distribution strategies at their disposal to attract deposits. The distribution options of mobileoffices and satellite offices were the least used distribution strategies meaning that commercial banks’ presencecould not be felt in remote areas, in the informal sector and were not availing themselves at their customers’door steps. Commercial banks were also not seen to be embracing technology fully as a link to tap deposits,for example through cell phone banking, internet banking and wider coverage of ATMs in all locations.
The customer relationship management strategy mainly employed by banks was the brick and mortar storeswhich are the physical bank buildings or branch complex and a distant second place customer relationshipmanagement strategy used by banks was advertising. However, most of the customer relationship strategies
Deposit-attracting strategies in the financial sector in a multi-currency setting
University of Zimbabwe Business Review, Volume 1, No. 1, 2013 43
were not being effeciently utilised as seen from the study findings as some of the banks do not use them atall. The strategies being underutilised are; call centres, toll free numbers, mobile sales force staff and websiteswhich would have built a stronger customer relationship bases for the banks with the clients throughconnectivity and communication link that could easily turn into business transactions and deposits.
6. RECOMMENDATIONSCommercial banks should enter into strategic alliances with either international players or strategic partnerslocally to gain a competitive advantage and enhance economies of scale. Some banks have entered intopartnerships with other companies like network providers with some establishing departments targetingnew markets like insurance. As a result the term bancasurance is still fairly new in Zimbabwe. Unfortunately,the majority of the banks in the industry have not yet utilised these opportunities.
In the financial sector, it should be compulsory to have established CRM programmes and strategies. Accordingto Mihelis et al. (2001) this would help the banks provide better customer service, make call centers moreefficient, cross sell products more effectively, help sales staff close deals faster, simplify marketing and salesprocesses, discover new customers, and increase deposits. It does not happen by simply buying softwareand installing it.
Information technology and process frameworks should be developed to secure customer information,funds and also to maximise fully and exhaustively all financial technological opportunities like internetbanking and cell phone banking. Banks should make sure that their information technology should be upto date with international standards in the financial sector through continuous training of staff and systemupgrades.
Commercial banks should improve product targeting to the right segments so as to establish greater flexibilityand responsiveness to market changes through opening mobile branches, special counters for bulk depositorsand corporate clients, setting up more satellite offices in peripheral areas like resettlement areas, rural areasand border posts where a few banks are found and most of them are not being commercial banks.
7. REFERENCESBaker, D. (2007), The Shape of War to Come, Stein and Day, New York.
Bankers Association of Zimbabwe annual report (2010).
Banks’ Financials Report For The Year 2010.
Banks’ Financials Report For The Year 2011.
Beckett-Camarata, E.J., Camarata, M.R. & Barker, R.T., (1998), Integrating Internal and External Customer Relationships ThroughRelationship Management: A Strategic Response to a Changing Global Environment, Journal of Business Research, 41, 71-81.
Berger, A. (2010). To What Extent Will the Banking Industry be Globalized? A Study of Bank Nationality and Reach in 20European Nations.
Boland, V. (2009). “Modern dilemma for world’s oldest bank”. \o “Financial Times”Financial Times.
Brunner, A. D.; Decressin, Jörg; Hardy, Daniel C. L.; Kudela, Beata (2004). Germany’s Three-Pillar Banking System: Cross-CountryPerspectives in Europe.
Collins (2008), “Financial Intermediation and Delegated Monitoring”, Review of Economic Studies, Vol. 51, No. 3, pp. 393-414.
Couldwell, C., (1998), A Data Day Battle, Computing, 21 May, 64–66.
DeYoung, R., and Tara R., (2004), “Noninterest income and financial performance at U.S. commercial banks,” Financial Review,Vol. 39, No. 1, pp. 101–127.
Greenlaw, D., Hatzius, J., Kashyap, A.K. & Shin, H. S. (2008), “Leveraged Losses: Lessons from the Mortgage Market Meltdown”,US Monetary Policy Forum Report, No. 2, Rosenberg Institute, Brandeis International Business School and Initiative onGlobal Markets, University of Chicago Graduate School of Business.
Haldane, A. (2009), “Rethinking the Financial Network”, speech to Financial Student Association, Amsterdam, April.
Hawkins, R. (2011), Banking Theory and Law and Practice, Atlanta USA.
V. Machona & N. Kaseke
44 University of Zimbabwe Business Review, Volume 1, No. 1, 2013
Hunger, J. D., Wheele, J. and Thomas, L. (2004), Essential of Strategic Management, Prentice Hall of India, New Dehli.
Kane, E.J. (2000), “Incentives for Banking Megamergers: What Motives Might Regulators Infer from Event-Study Evidence?”,Journal of Money, Credit, and Banking, Vol. 32, No. 3, pp. 671-701.
Krejcie, R.V. and Morgan, D.W. (1970). Determining sample size for research activities.
Educational and Psychological Measurement. Vol. 30, pp. 607-610.
Kuruppuswami, S. (1986) A new look at Bank Marketing, The Banker, November 1 986, pp. 19.
Makoni, W. (2010), “Insiders and Outsiders: The Choice between Informed and Arm’s-Length Debt”, Journal of Finance, Vol. 47,No. 4, pp. 1367-1400.
Peppard, J., (2000), Customer Relationship Management (CRM) in Financial Services, European Management Journal, Vol. 18, No. 3,pp. 312–327.
Peppers, D., and Rogers, M., (1995), A New Marketing Paradigm, Planning Review, 23(2), 14–18.
Rajeev, K. S. (1997). Marketing of Banking Services, Macmillan India Ltd. New Delhi, 1997. p.7.
Raveendran, M. Manager, 10B, IBA Bulletin, August 1998, p.14.
Reserve Bank of Zimbabwe Monetary Policy Statement (1994)
Reserve Bank of Zimbabwe Monetary Policy Statement (2009)
Reserve Bank of Zimbabwe Monetary Policy Statement (2010)
Reserve Bank of Zimbabwe Monetary Policy Statement (2011)
Reserve Bank of Zimbabwe Monetary Policy Statement (2012)
Ryals, L., and Knox, S., (2001), Cross-Functional Issues in the Implementation of Relationship Marketing Through Customer RelationshipManagement, European Management Journal, Vol. 19, No. 5, pp. 534–542.
Shin, H. S. (2009), “Securitisation and Financial Stability”, Economic Journal, Vol.119, No. 536, pp. 309-332.
Sironi, A. (2003), “Testing for Market Discipline in the European Banking Industry: Evidence from Subordinated Debt Issues”,Journal of Money, Credit, and Banking, Vol. 35, No. 3, pp. 443-472.
www.investpedia.com (accessed on 23/06/12).
Yuan, S.T., and Chang, W.L., (2001), Mixed-Initiative Synthesized Learning Approach For Web-Based CRM, Expert Systems withApplications, 20, 187-200.
Environmental reporting: An evaluation of the ZSE-listed companies annual reports — 2008
University of Zimbabwe Business Review, Volume 1, No. 1, 2013 45
Environmental reporting: An evaluation of the Zimbabwe Stock
Exchange-listed companies annual reports — 2008
Rodney NdambaDepartment of Accountancy, University of Zimbabwe
ABSTRACTEnvironmental Reporting continues to receive attention in emerging economies and financialmarkets, including Africa. This paper presents results of a research on the Zimbabwe StockExchange (ZSE) listed companies’ annual reports for 2008 in an attempt to establish thelevel of disclosure and perceptions on environmental reporting in Zimbabwe. The researchapplies content analysis and survey strategies. The results provide empirical evidence forpotential policy influence on corporate reporting culture within the Zimbabwe Stock Exchangelisted companies. The findings of this research provide a basis for future studies addressinglegitimacy of environmental reporting in Zimbabwe.
Key words: Environmental Reporting, Sustainability Reporting, Corporate Disclosure, Zimbabwe Stock Exchange
1. INTRODUCTIONEnvironmental Reporting has developed in recent years to the extent of being part of corporate disclosure inannual reports. Though perceived as less prominent among environmental stakeholders, the accountingprofession has taken keen interest in this kind of reporting (Gray and Bebbington, 2001). However, most ofthe developments in the field of environmental reporting have been led by developed nations like Denmark,Sweden, Norway, United Kingdom, Germany, Canada and Australia. African countries have lagged behinddespite suffering from environmental disasters (UN-Economic Commission for Africa, 2002). In SouthernAfrica, Environmental Reporting is an emerging subject which has received limited attention except in SouthAfrica (De Villiers and Barnard, 2000; De Villiers and Antonites, 2003).
This paper presents results of a research aimed at establishing the level of environmental reporting at theZimbabwe Stock Exchange. It will also attempt to establish whether the level of disclosure could be associatedwith any perceptions and other factors. The research employed a questionnaire on perceptions of auditingfirms and economic sector bodies while content analysis strategy was applied to annual reports — 2008review. Annual reports remain a vehicle for environmental performance disclosures (Brown and Deegan,1998). This research provides a basis for policy influence on environmental reporting in Zimbabwe.
The significance of this research is to draw attention to environmental reporting consideration in stockexchange listing rules, particularly on mining companies. Economies in Southern Africa are mainly supportedby mining activities which have some environmental impact. However, some of the impact has been associatedwith multinational corporations which take advantage of poor environmental management and regulatorypolicies in the region. This observation is also noted by Hawkins (2006) on a growing trend of businessventures being moved to less regulated regions such as Asia, Africa and Latin America.
Environmental reporting is not mandatory in many financial markets in Southern Africa with the exceptionof South Africa which has a more developed financial market. In South Africa, environmental reporting iscovered under King III Code of Corporate Governance which promotes sustainability reporting (economic,social, environmental and governance) (Institute of Directors Southern Africa, 2009). As for the ZimbabweStock Exchange (ZSE), environmental reporting is not mandatory. The ZSE is among the oldest stock exchangesin Southern Africa established in 1896 but has received limited research attention. As such, this researchdedicates its evaluation on the full listing while limiting the subject to environmental reporting.
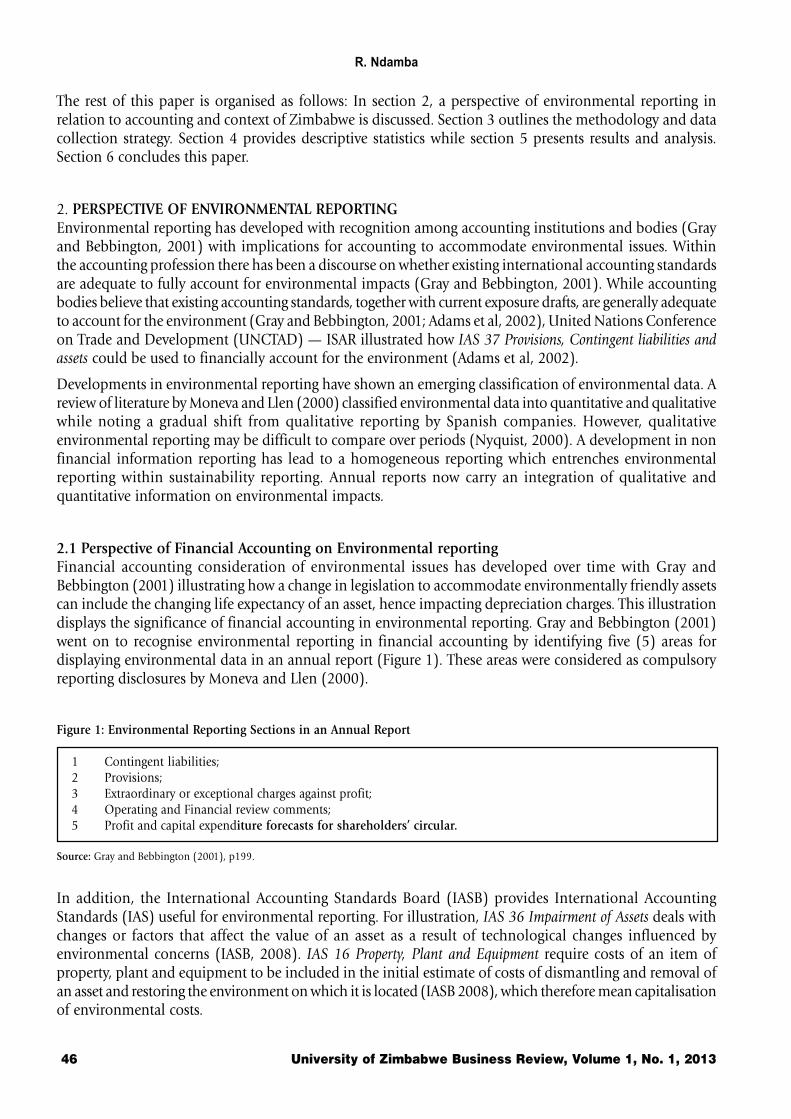
R. Ndamba
46 University of Zimbabwe Business Review, Volume 1, No. 1, 2013
The rest of this paper is organised as follows: In section 2, a perspective of environmental reporting inrelation to accounting and context of Zimbabwe is discussed. Section 3 outlines the methodology and datacollection strategy. Section 4 provides descriptive statistics while section 5 presents results and analysis.Section 6 concludes this paper.
2. PERSPECTIVE OF ENVIRONMENTAL REPORTINGEnvironmental reporting has developed with recognition among accounting institutions and bodies (Grayand Bebbington, 2001) with implications for accounting to accommodate environmental issues. Withinthe accounting profession there has been a discourse on whether existing international accounting standardsare adequate to fully account for environmental impacts (Gray and Bebbington, 2001). While accountingbodies believe that existing accounting standards, together with current exposure drafts, are generally adequateto account for the environment (Gray and Bebbington, 2001; Adams et al, 2002), United Nations Conferenceon Trade and Development (UNCTAD) — ISAR illustrated how IAS 37 Provisions, Contingent liabilities andassets could be used to financially account for the environment (Adams et al, 2002).
Developments in environmental reporting have shown an emerging classification of environmental data. Areview of literature by Moneva and Llen (2000) classified environmental data into quantitative and qualitativewhile noting a gradual shift from qualitative reporting by Spanish companies. However, qualitativeenvironmental reporting may be difficult to compare over periods (Nyquist, 2000). A development in nonfinancial information reporting has lead to a homogeneous reporting which entrenches environmentalreporting within sustainability reporting. Annual reports now carry an integration of qualitative andquantitative information on environmental impacts.
2.1 Perspective of Financial Accounting on Environmental reportingFinancial accounting consideration of environmental issues has developed over time with Gray andBebbington (2001) illustrating how a change in legislation to accommodate environmentally friendly assetscan include the changing life expectancy of an asset, hence impacting depreciation charges. This illustrationdisplays the significance of financial accounting in environmental reporting. Gray and Bebbington (2001)went on to recognise environmental reporting in financial accounting by identifying five (5) areas fordisplaying environmental data in an annual report (Figure 1). These areas were considered as compulsoryreporting disclosures by Moneva and Llen (2000).
Figure 1: Environmental Reporting Sections in an Annual Report
1 Contingent liabilities;2 Provisions;3 Extraordinary or exceptional charges against profit;4 Operating and Financial review comments;5 Profit and capital expenditure forecasts for shareholders’ circular.
Source: Gray and Bebbington (2001), p199.
In addition, the International Accounting Standards Board (IASB) provides International AccountingStandards (IAS) useful for environmental reporting. For illustration, IAS 36 Impairment of Assets deals withchanges or factors that affect the value of an asset as a result of technological changes influenced byenvironmental concerns (IASB, 2008). IAS 16 Property, Plant and Equipment require costs of an item ofproperty, plant and equipment to be included in the initial estimate of costs of dismantling and removal ofan asset and restoring the environment on which it is located (IASB 2008), which therefore mean capitalisationof environmental costs.
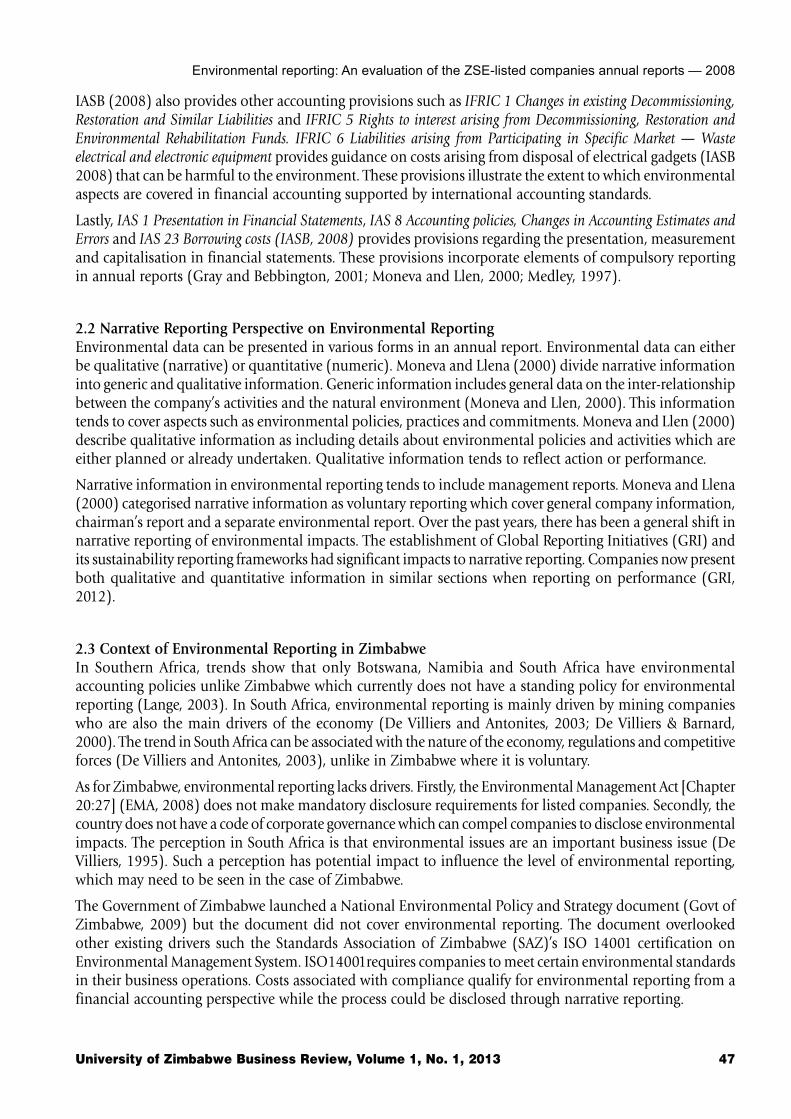
Environmental reporting: An evaluation of the ZSE-listed companies annual reports — 2008
University of Zimbabwe Business Review, Volume 1, No. 1, 2013 47
IASB (2008) also provides other accounting provisions such as IFRIC 1 Changes in existing Decommissioning,Restoration and Similar Liabilities and IFRIC 5 Rights to interest arising from Decommissioning, Restoration andEnvironmental Rehabilitation Funds. IFRIC 6 Liabilities arising from Participating in Specific Market — Wasteelectrical and electronic equipment provides guidance on costs arising from disposal of electrical gadgets (IASB2008) that can be harmful to the environment. These provisions illustrate the extent to which environmentalaspects are covered in financial accounting supported by international accounting standards.
Lastly, IAS 1 Presentation in Financial Statements, IAS 8 Accounting policies, Changes in Accounting Estimates andErrors and IAS 23 Borrowing costs (IASB, 2008) provides provisions regarding the presentation, measurementand capitalisation in financial statements. These provisions incorporate elements of compulsory reportingin annual reports (Gray and Bebbington, 2001; Moneva and Llen, 2000; Medley, 1997).
2.2 Narrative Reporting Perspective on Environmental ReportingEnvironmental data can be presented in various forms in an annual report. Environmental data can eitherbe qualitative (narrative) or quantitative (numeric). Moneva and Llena (2000) divide narrative informationinto generic and qualitative information. Generic information includes general data on the inter-relationshipbetween the company’s activities and the natural environment (Moneva and Llen, 2000). This informationtends to cover aspects such as environmental policies, practices and commitments. Moneva and Llen (2000)describe qualitative information as including details about environmental policies and activities which areeither planned or already undertaken. Qualitative information tends to reflect action or performance.
Narrative information in environmental reporting tends to include management reports. Moneva and Llena(2000) categorised narrative information as voluntary reporting which cover general company information,chairman’s report and a separate environmental report. Over the past years, there has been a general shift innarrative reporting of environmental impacts. The establishment of Global Reporting Initiatives (GRI) andits sustainability reporting frameworks had significant impacts to narrative reporting. Companies now presentboth qualitative and quantitative information in similar sections when reporting on performance (GRI,2012).
2.3 Context of Environmental Reporting in ZimbabweIn Southern Africa, trends show that only Botswana, Namibia and South Africa have environmentalaccounting policies unlike Zimbabwe which currently does not have a standing policy for environmentalreporting (Lange, 2003). In South Africa, environmental reporting is mainly driven by mining companieswho are also the main drivers of the economy (De Villiers and Antonites, 2003; De Villiers & Barnard,2000). The trend in South Africa can be associated with the nature of the economy, regulations and competitiveforces (De Villiers and Antonites, 2003), unlike in Zimbabwe where it is voluntary.
As for Zimbabwe, environmental reporting lacks drivers. Firstly, the Environmental Management Act [Chapter20:27] (EMA, 2008) does not make mandatory disclosure requirements for listed companies. Secondly, thecountry does not have a code of corporate governance which can compel companies to disclose environmentalimpacts. The perception in South Africa is that environmental issues are an important business issue (DeVilliers, 1995). Such a perception has potential impact to influence the level of environmental reporting,which may need to be seen in the case of Zimbabwe.
The Government of Zimbabwe launched a National Environmental Policy and Strategy document (Govt ofZimbabwe, 2009) but the document did not cover environmental reporting. The document overlookedother existing drivers such the Standards Association of Zimbabwe (SAZ)’s ISO 14001 certification onEnvironmental Management System. ISO14001requires companies to meet certain environmental standardsin their business operations. Costs associated with compliance qualify for environmental reporting from afinancial accounting perspective while the process could be disclosed through narrative reporting.
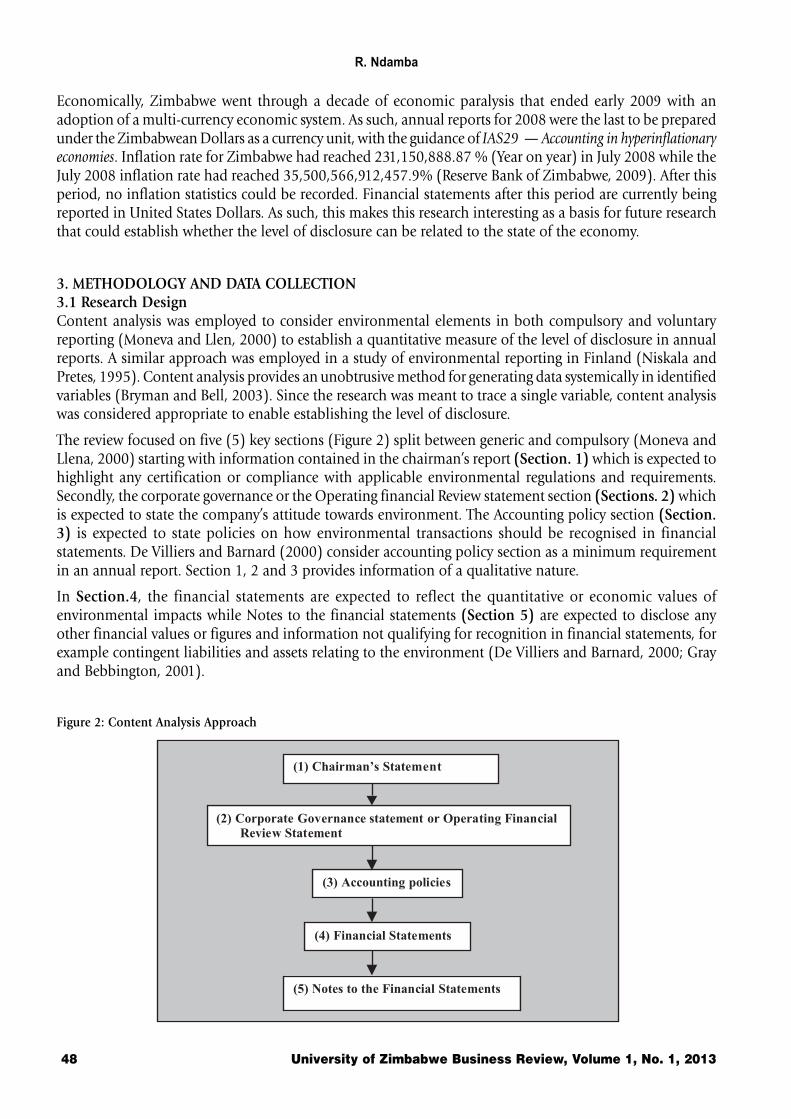
R. Ndamba
48 University of Zimbabwe Business Review, Volume 1, No. 1, 2013
(1) Chairman’s Statement
(2) Corporate Governance statement or Operating Financial
Review Statement
(3) Accounting policies
(4) Financial Statements
(5) Notes to the Financial Statements
Economically, Zimbabwe went through a decade of economic paralysis that ended early 2009 with anadoption of a multi-currency economic system. As such, annual reports for 2008 were the last to be preparedunder the Zimbabwean Dollars as a currency unit, with the guidance of IAS29 — Accounting in hyperinflationaryeconomies. Inflation rate for Zimbabwe had reached 231,150,888.87 % (Year on year) in July 2008 while theJuly 2008 inflation rate had reached 35,500,566,912,457.9% (Reserve Bank of Zimbabwe, 2009). After thisperiod, no inflation statistics could be recorded. Financial statements after this period are currently beingreported in United States Dollars. As such, this makes this research interesting as a basis for future researchthat could establish whether the level of disclosure can be related to the state of the economy.
3. METHODOLOGY AND DATA COLLECTION3.1 Research DesignContent analysis was employed to consider environmental elements in both compulsory and voluntaryreporting (Moneva and Llen, 2000) to establish a quantitative measure of the level of disclosure in annualreports. A similar approach was employed in a study of environmental reporting in Finland (Niskala andPretes, 1995). Content analysis provides an unobtrusive method for generating data systemically in identifiedvariables (Bryman and Bell, 2003). Since the research was meant to trace a single variable, content analysiswas considered appropriate to enable establishing the level of disclosure.
The review focused on five (5) key sections (Figure 2) split between generic and compulsory (Moneva andLlena, 2000) starting with information contained in the chairman’s report (Section. 1) which is expected tohighlight any certification or compliance with applicable environmental regulations and requirements.Secondly, the corporate governance or the Operating financial Review statement section (Sections. 2) whichis expected to state the company’s attitude towards environment. The Accounting policy section (Section.3) is expected to state policies on how environmental transactions should be recognised in financialstatements. De Villiers and Barnard (2000) consider accounting policy section as a minimum requirementin an annual report. Section 1, 2 and 3 provides information of a qualitative nature.
In Section.4, the financial statements are expected to reflect the quantitative or economic values ofenvironmental impacts while Notes to the financial statements (Section 5) are expected to disclose anyother financial values or figures and information not qualifying for recognition in financial statements, forexample contingent liabilities and assets relating to the environment (De Villiers and Barnard, 2000; Grayand Bebbington, 2001).
Figure 2: Content Analysis Approach
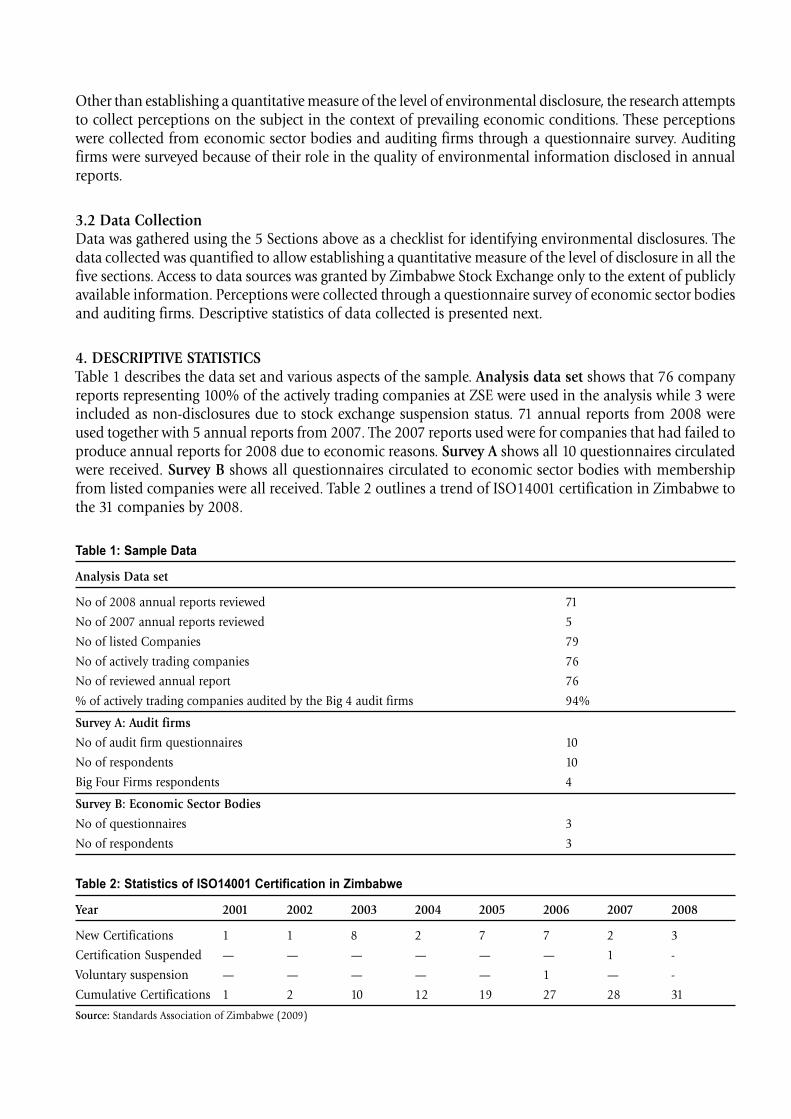
Other than establishing a quantitative measure of the level of environmental disclosure, the research attemptsto collect perceptions on the subject in the context of prevailing economic conditions. These perceptionswere collected from economic sector bodies and auditing firms through a questionnaire survey. Auditingfirms were surveyed because of their role in the quality of environmental information disclosed in annualreports.
3.2 Data CollectionData was gathered using the 5 Sections above as a checklist for identifying environmental disclosures. Thedata collected was quantified to allow establishing a quantitative measure of the level of disclosure in all thefive sections. Access to data sources was granted by Zimbabwe Stock Exchange only to the extent of publiclyavailable information. Perceptions were collected through a questionnaire survey of economic sector bodiesand auditing firms. Descriptive statistics of data collected is presented next.
4. DESCRIPTIVE STATISTICSTable 1 describes the data set and various aspects of the sample. Analysis data set shows that 76 companyreports representing 100% of the actively trading companies at ZSE were used in the analysis while 3 wereincluded as non-disclosures due to stock exchange suspension status. 71 annual reports from 2008 wereused together with 5 annual reports from 2007. The 2007 reports used were for companies that had failed toproduce annual reports for 2008 due to economic reasons. Survey A shows all 10 questionnaires circulatedwere received. Survey B shows all questionnaires circulated to economic sector bodies with membershipfrom listed companies were all received. Table 2 outlines a trend of ISO14001 certification in Zimbabwe tothe 31 companies by 2008.
Table 1: Sample Data
Analysis Data set
No of 2008 annual reports reviewed 71
No of 2007 annual reports reviewed 5
No of listed Companies 79
No of actively trading companies 76
No of reviewed annual report 76
% of actively trading companies audited by the Big 4 audit firms 94%
Survey A: Audit firms
No of audit firm questionnaires 10
No of respondents 10
Big Four Firms respondents 4
Survey B: Economic Sector Bodies
No of questionnaires 3
No of respondents 3
Table 2: Statistics of ISO14001 Certification in Zimbabwe
Year 2001 2002 2003 2004 2005 2006 2007 2008
New Certifications 1 1 8 2 7 7 2 3
Certification Suspended — — — — — — 1 -
Voluntary suspension — — — — — 1 — -
Cumulative Certifications 1 2 10 12 19 27 28 31
Source: Standards Association of Zimbabwe (2009)
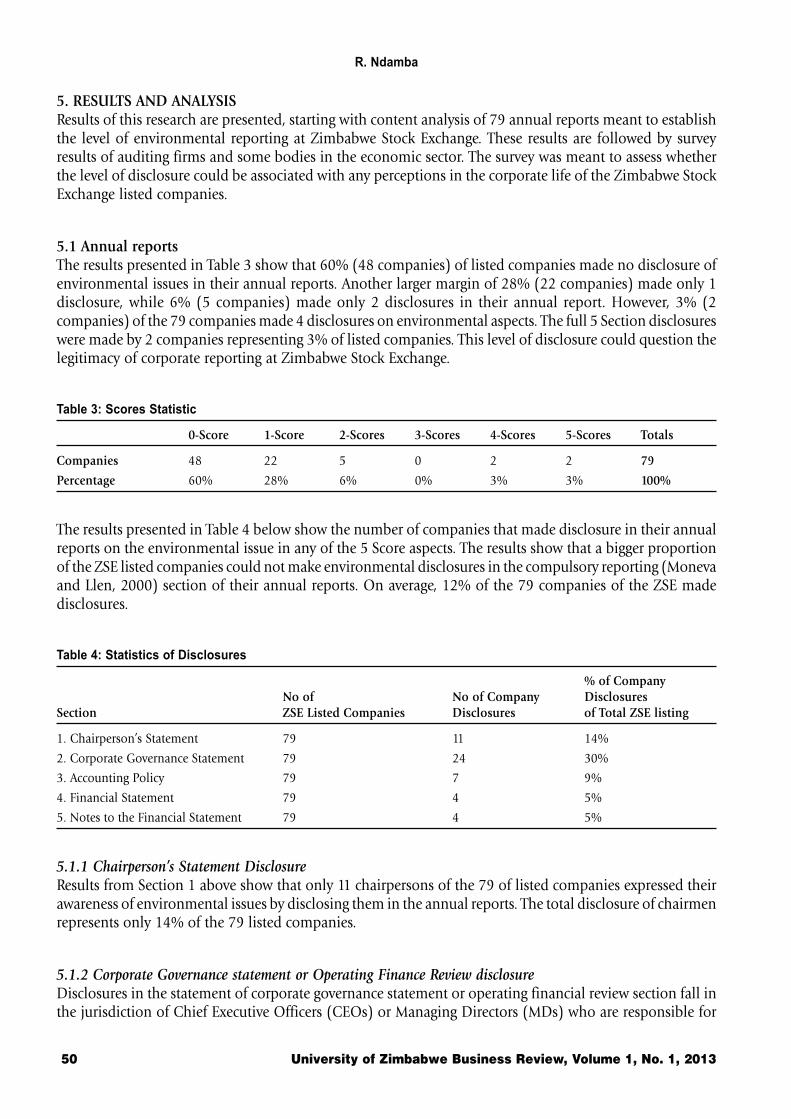
R. Ndamba
50 University of Zimbabwe Business Review, Volume 1, No. 1, 2013
5. RESULTS AND ANALYSISResults of this research are presented, starting with content analysis of 79 annual reports meant to establishthe level of environmental reporting at Zimbabwe Stock Exchange. These results are followed by surveyresults of auditing firms and some bodies in the economic sector. The survey was meant to assess whetherthe level of disclosure could be associated with any perceptions in the corporate life of the Zimbabwe StockExchange listed companies.
5.1 Annual reportsThe results presented in Table 3 show that 60% (48 companies) of listed companies made no disclosure ofenvironmental issues in their annual reports. Another larger margin of 28% (22 companies) made only 1disclosure, while 6% (5 companies) made only 2 disclosures in their annual report. However, 3% (2companies) of the 79 companies made 4 disclosures on environmental aspects. The full 5 Section disclosureswere made by 2 companies representing 3% of listed companies. This level of disclosure could question thelegitimacy of corporate reporting at Zimbabwe Stock Exchange.
Table 3: Scores Statistic
0-Score 1-Score 2-Scores 3-Scores 4-Scores 5-Scores Totals
Companies 48 22 5 0 2 2 79
Percentage 60% 28% 6% 0% 3% 3% 100%
The results presented in Table 4 below show the number of companies that made disclosure in their annualreports on the environmental issue in any of the 5 Score aspects. The results show that a bigger proportionof the ZSE listed companies could not make environmental disclosures in the compulsory reporting (Monevaand Llen, 2000) section of their annual reports. On average, 12% of the 79 companies of the ZSE madedisclosures.
Table 4: Statistics of Disclosures
% of CompanyNo of No of Company Disclosures
Section ZSE Listed Companies Disclosures of Total ZSE listing
1. Chairperson’s Statement 79 11 14%
2. Corporate Governance Statement 79 24 30%
3. Accounting Policy 79 7 9%
4. Financial Statement 79 4 5%
5. Notes to the Financial Statement 79 4 5%
5.1.1 Chairperson’s Statement DisclosureResults from Section 1 above show that only 11 chairpersons of the 79 of listed companies expressed theirawareness of environmental issues by disclosing them in the annual reports. The total disclosure of chairmenrepresents only 14% of the 79 listed companies.
5.1.2 Corporate Governance statement or Operating Finance Review disclosureDisclosures in the statement of corporate governance statement or operating financial review section fall inthe jurisdiction of Chief Executive Officers (CEOs) or Managing Directors (MDs) who are responsible for
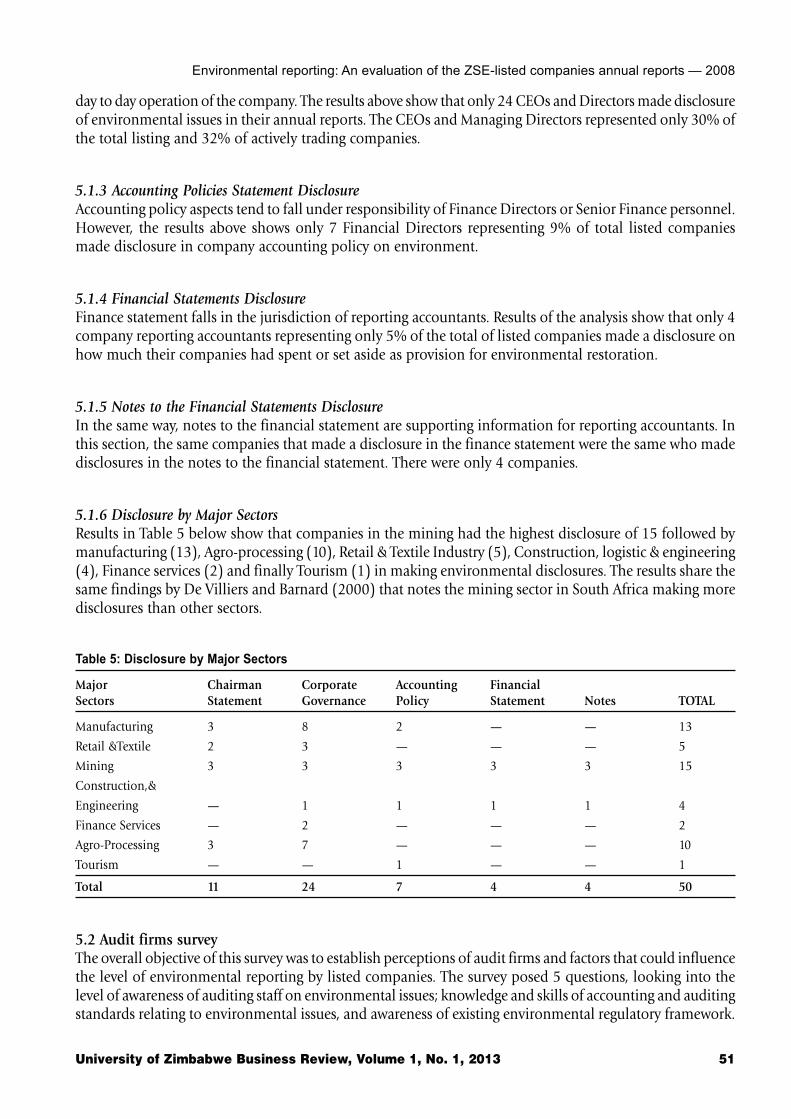
Environmental reporting: An evaluation of the ZSE-listed companies annual reports — 2008
University of Zimbabwe Business Review, Volume 1, No. 1, 2013 51
day to day operation of the company. The results above show that only 24 CEOs and Directors made disclosureof environmental issues in their annual reports. The CEOs and Managing Directors represented only 30% ofthe total listing and 32% of actively trading companies.
5.1.3 Accounting Policies Statement DisclosureAccounting policy aspects tend to fall under responsibility of Finance Directors or Senior Finance personnel.However, the results above shows only 7 Financial Directors representing 9% of total listed companiesmade disclosure in company accounting policy on environment.
5.1.4 Financial Statements DisclosureFinance statement falls in the jurisdiction of reporting accountants. Results of the analysis show that only 4company reporting accountants representing only 5% of the total of listed companies made a disclosure onhow much their companies had spent or set aside as provision for environmental restoration.
5.1.5 Notes to the Financial Statements DisclosureIn the same way, notes to the financial statement are supporting information for reporting accountants. Inthis section, the same companies that made a disclosure in the finance statement were the same who madedisclosures in the notes to the financial statement. There were only 4 companies.
5.1.6 Disclosure by Major SectorsResults in Table 5 below show that companies in the mining had the highest disclosure of 15 followed bymanufacturing (13), Agro-processing (10), Retail & Textile Industry (5), Construction, logistic & engineering(4), Finance services (2) and finally Tourism (1) in making environmental disclosures. The results share thesame findings by De Villiers and Barnard (2000) that notes the mining sector in South Africa making moredisclosures than other sectors.
Table 5: Disclosure by Major Sectors
Major Chairman Corporate Accounting FinancialSectors Statement Governance Policy Statement Notes TOTAL
Manufacturing 3 8 2 — — 13
Retail &Textile 2 3 — — — 5
Mining 3 3 3 3 3 15
Construction,&
Engineering — 1 1 1 1 4
Finance Services — 2 — — — 2
Agro-Processing 3 7 — — — 10
Tourism — — 1 — — 1
Total 11 24 7 4 4 50
5.2 Audit firms surveyThe overall objective of this survey was to establish perceptions of audit firms and factors that could influencethe level of environmental reporting by listed companies. The survey posed 5 questions, looking into thelevel of awareness of auditing staff on environmental issues; knowledge and skills of accounting and auditingstandards relating to environmental issues, and awareness of existing environmental regulatory framework.
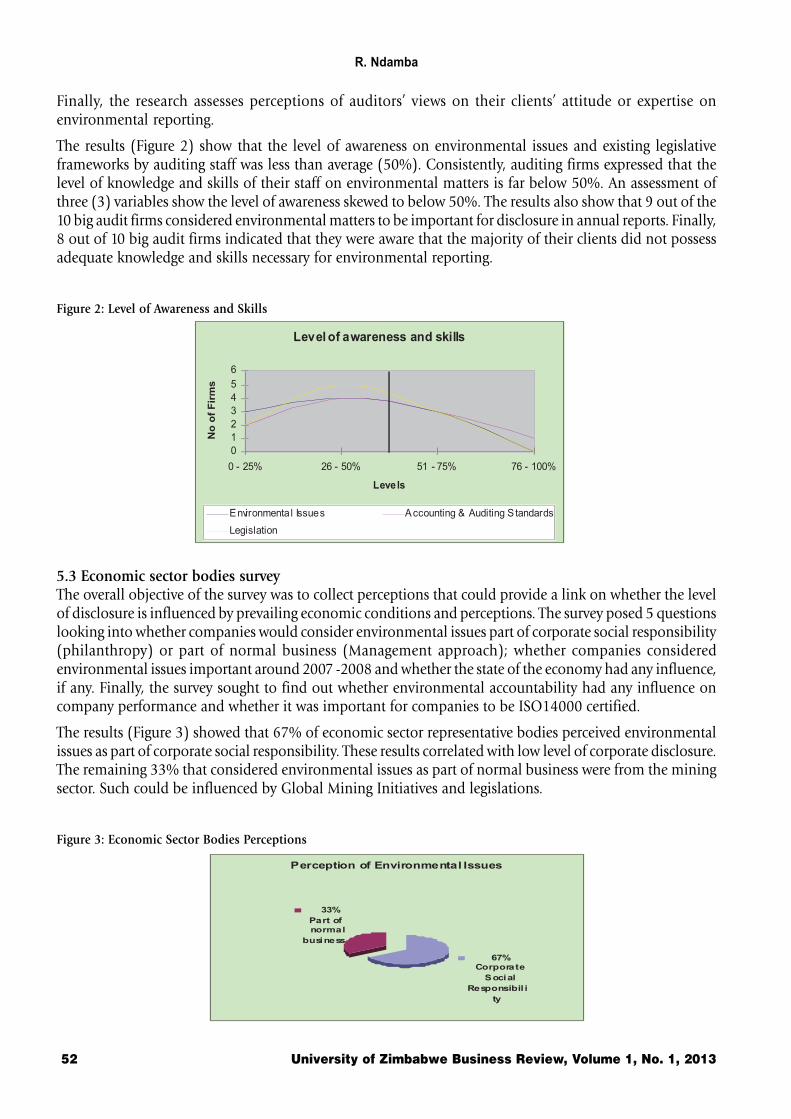
R. Ndamba
52 University of Zimbabwe Business Review, Volume 1, No. 1, 2013
Finally, the research assesses perceptions of auditors’ views on their clients’ attitude or expertise onenvironmental reporting.
The results (Figure 2) show that the level of awareness on environmental issues and existing legislativeframeworks by auditing staff was less than average (50%). Consistently, auditing firms expressed that thelevel of knowledge and skills of their staff on environmental matters is far below 50%. An assessment ofthree (3) variables show the level of awareness skewed to below 50%. The results also show that 9 out of the10 big audit firms considered environmental matters to be important for disclosure in annual reports. Finally,8 out of 10 big audit firms indicated that they were aware that the majority of their clients did not possessadequate knowledge and skills necessary for environmental reporting.
Figure 2: Level of Awareness and Skills
Level of awareness and skills
0
1
2
3
4
5
6
0 - 25% 26 - 50% 51 - 75% 76 - 100%
Levels
No
of
Fir
ms
Environmenta l Issues Accounting & Auditing S tandards
Legislation
5.3 Economic sector bodies surveyThe overall objective of the survey was to collect perceptions that could provide a link on whether the levelof disclosure is influenced by prevailing economic conditions and perceptions. The survey posed 5 questionslooking into whether companies would consider environmental issues part of corporate social responsibility(philanthropy) or part of normal business (Management approach); whether companies consideredenvironmental issues important around 2007 -2008 and whether the state of the economy had any influence,if any. Finally, the survey sought to find out whether environmental accountability had any influence oncompany performance and whether it was important for companies to be ISO14000 certified.
The results (Figure 3) showed that 67% of economic sector representative bodies perceived environmentalissues as part of corporate social responsibility. These results correlated with low level of corporate disclosure.The remaining 33% that considered environmental issues as part of normal business were from the miningsector. Such could be influenced by Global Mining Initiatives and legislations.
Figure 3: Economic Sector Bodies Perceptions
Perception of Environmental Issues
67% Corporate
Social
Responsibil i
ty
33%
Part of normal
business
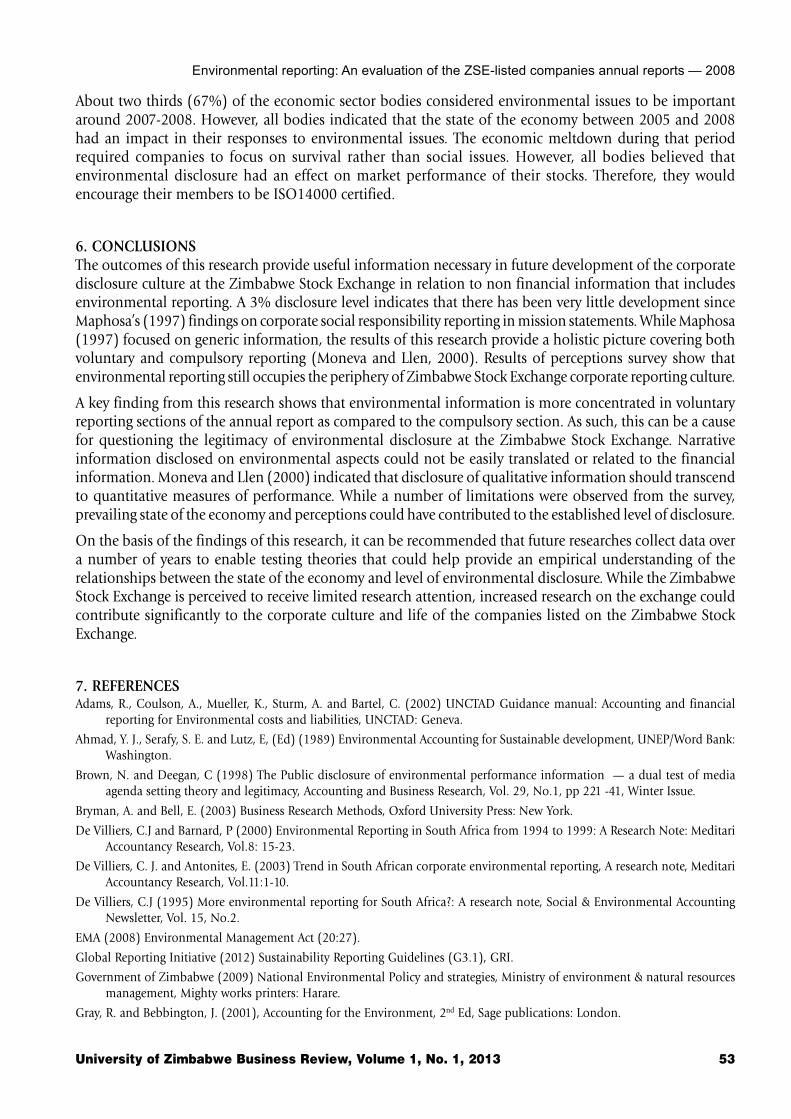
Environmental reporting: An evaluation of the ZSE-listed companies annual reports — 2008
University of Zimbabwe Business Review, Volume 1, No. 1, 2013 53
About two thirds (67%) of the economic sector bodies considered environmental issues to be importantaround 2007-2008. However, all bodies indicated that the state of the economy between 2005 and 2008had an impact in their responses to environmental issues. The economic meltdown during that periodrequired companies to focus on survival rather than social issues. However, all bodies believed thatenvironmental disclosure had an effect on market performance of their stocks. Therefore, they wouldencourage their members to be ISO14000 certified.
6. CONCLUSIONSThe outcomes of this research provide useful information necessary in future development of the corporatedisclosure culture at the Zimbabwe Stock Exchange in relation to non financial information that includesenvironmental reporting. A 3% disclosure level indicates that there has been very little development sinceMaphosa’s (1997) findings on corporate social responsibility reporting in mission statements. While Maphosa(1997) focused on generic information, the results of this research provide a holistic picture covering bothvoluntary and compulsory reporting (Moneva and Llen, 2000). Results of perceptions survey show thatenvironmental reporting still occupies the periphery of Zimbabwe Stock Exchange corporate reporting culture.
A key finding from this research shows that environmental information is more concentrated in voluntaryreporting sections of the annual report as compared to the compulsory section. As such, this can be a causefor questioning the legitimacy of environmental disclosure at the Zimbabwe Stock Exchange. Narrativeinformation disclosed on environmental aspects could not be easily translated or related to the financialinformation. Moneva and Llen (2000) indicated that disclosure of qualitative information should transcendto quantitative measures of performance. While a number of limitations were observed from the survey,prevailing state of the economy and perceptions could have contributed to the established level of disclosure.
On the basis of the findings of this research, it can be recommended that future researches collect data overa number of years to enable testing theories that could help provide an empirical understanding of therelationships between the state of the economy and level of environmental disclosure. While the ZimbabweStock Exchange is perceived to receive limited research attention, increased research on the exchange couldcontribute significantly to the corporate culture and life of the companies listed on the Zimbabwe StockExchange.
7. REFERENCESAdams, R., Coulson, A., Mueller, K., Sturm, A. and Bartel, C. (2002) UNCTAD Guidance manual: Accounting and financial
reporting for Environmental costs and liabilities, UNCTAD: Geneva.
Ahmad, Y. J., Serafy, S. E. and Lutz, E, (Ed) (1989) Environmental Accounting for Sustainable development, UNEP/Word Bank:Washington.
Brown, N. and Deegan, C (1998) The Public disclosure of environmental performance information — a dual test of mediaagenda setting theory and legitimacy, Accounting and Business Research, Vol. 29, No.1, pp 221 -41, Winter Issue.
Bryman, A. and Bell, E. (2003) Business Research Methods, Oxford University Press: New York.
De Villiers, C.J and Barnard, P (2000) Environmental Reporting in South Africa from 1994 to 1999: A Research Note: MeditariAccountancy Research, Vol.8: 15-23.
De Villiers, C. J. and Antonites, E. (2003) Trend in South African corporate environmental reporting, A research note, MeditariAccountancy Research, Vol.11:1-10.
De Villiers, C.J (1995) More environmental reporting for South Africa?: A research note, Social & Environmental AccountingNewsletter, Vol. 15, No.2.
EMA (2008) Environmental Management Act (20:27).
Global Reporting Initiative (2012) Sustainability Reporting Guidelines (G3.1), GRI.
Government of Zimbabwe (2009) National Environmental Policy and strategies, Ministry of environment & natural resourcesmanagement, Mighty works printers: Harare.
Gray, R. and Bebbington, J. (2001), Accounting for the Environment, 2nd Ed, Sage publications: London.
R. Ndamba
54 University of Zimbabwe Business Review, Volume 1, No. 1, 2013
Hawkins, D. E. (2006) Corporate Social Responsibility: Balancing tomorrow’s sustainability and today’s profitability, PalgraveMacmillan: New York.
International Accounting Standard Board (2008) International Financial Reporting Standards (IFRS) 2008, IASCF: London.
Institute of Directors Southern Africa (2009) King Report on Governance for South: IOD Southern Africa: Johannesburg.
Lange, G M. (2003) Policy Applications of Environmental Accounting, World Bank: Washington DC.
Maphosa, F. (1997) Corporate Social Responsibility in Zimbabwe: A content analysis of mission statements and annual reports:Zambezia, XXIV (ii).
Medley, P (1997) Environmental Accounting — What does it mean to professional accountants, Accounting, Auditing &Accountability Journal, Vol.10, No.4, pp 594-600 .
Moneva, J. M and Llena, F. (2000) Environmental disclosures in the annual reports of large companies in Spain: EuropeanAccounting Review, 9:1, pp 7-29.
Niskala, M. and Pretes, M. (1995) Environmental Reporting in Finland: A note on the use of annual reports, Accounting,organisation and society, Vol. 2, No.6, pp. 457-466.
Nyquist, S. (2000) Accounting theory and financial environmental reports, Eco-management and Auditing Journal, Dec, Vol7,Issue 4, page 178-185.
Reserve Bank of Zimbabwe (2009), Inflation Data, RBZ.
Standards Association of Zimbabwe (2009), ISO14001 Register, SAZ.
United Nations — Economic Commission for Africa — Southern Africa (2002) Economic Impacts of Environmental Degradationin Southern Africa, ECA/SRDC/SA Publication: Zambia .
BIBLIOGRAPHYInternational Federation of Accountants (2005) Environmental Management Accounting, IFAC: New York.
Institute of Chartered Accountants England & Wales (2004) Sustainability: Role of Accountants, ICAEW: London.
King, M and Lessidrenska, T. (2009) Transient Caretakers: Making life on earth sustainable, Pan Macmillian: Johannesburg.
McChlery, S (2000) accounting for the environment, ACCA Student Newsletter, ACCA: London.
Piasecki, B.W, Fletcher, K. A. and Mendelson, F. J. (1999) Environmental Management and Business Strategy: Leadership Skillfor the 21st Century, Wiley & Sons: New York.
Robbins, T. P. (2001) Greening the Corporation: Management strategy and the environmental challenge, Earth Scan publication:London.
The Accounting for sustainability team (2008) The Accounting for sustainability, Beacon Press: London.
Zadek, S., Raynard, P., Forstater, M. and Oelschlaegel, J. (2004) The Future of Sustainability Assurance, ACCA Research no 86,Certified Accountant Education Trust: London.
Organisations’ social responsibility
University of Zimbabwe Business Review, Volume 1, No. 1, 2013 55
Organisations’ social responsibility
Isaac ChanetaFaculty of Commerce, University of Zimbabwe
ABSTRACTFor a long time organisations have acknowledged their responsibility towards the communityand the environment in which they operate. Responsibility does not end with the productionof goods or the rendering of service of a high quality as required by the community, butextend into the social field. In the Middle Ages, Popes gave generously of their personalfortunes. Social responsibility is a social norm. This norm holds that any social institution,including the smallest family unit and the largest corporation responsible for the behaviourof its members, may be held accountable for their misdeeds. It is implicitly stated that anorganisation’s responsibility extends far beyond the internal maintenance of its humanresources to the external work environment as well. An organization fulfills its socialresponsibility when it meets economic and legal obligations. A socially responsiveorganisation acts the way it does because of its desire to satisfy some expressed social need.Social responsiveness is guided by social norms.
Key Words: social norm, labour accountability, fringe benefits, incentives, retention of labour.
1. INTRODUCTIONThe social responsibility of an organisation is becoming even more important today. It would also appearthat organisations are expected to be involved in real social problems of the community to show that theydo not only want to use the community for personal gain, but that they want to give something back to thecommunity to ensure a better dispensation for both parties (Pincus, 1992). Today, however, organisationspursue multiple goals with emphasis on social awareness, social care and social commitment. Socialresponsibility is at present so important that the sources of an organisation may depend, to a large extent,on the social commitment.
According to Thompson, Strickland and Gamble (2010), the notion that corporate executives should balancethe interest of all stakeholders (shareholders, suppliers, communities in which they operate and society atlarge) is very important for the survival of every organisation. Social responsibility is at present so importantthat the resources of an organisation may depend to a large extent, on the social commitment.
2. STATEMENT OF THE PROBLEMBalancing the shareholder’s expectations of maximum returns against other priorities is one of thefundamental problems confronting corporate management. The shareholder must receive a good returnbut the legitimate concerns of other constituencies (customers, employees, communities, suppliers andsociety at large) also must have the appropriate attention. Managers believe that by giving enlightenedconsideration to balancing the legitimate claims of all its constituents, a corporation best serves the interestof its shareholders.
3. RESEARCH OBJECTIVESWhy does an organisation become involved in social responsibility programmes? The organisation’s objectivesin applying social responsibility are:
• to create a good public image;
• to maintain a sound relationship with employees;
• to maintain a good relationship with the community; and
• to create a friendly relationship with commerce and shareholders.
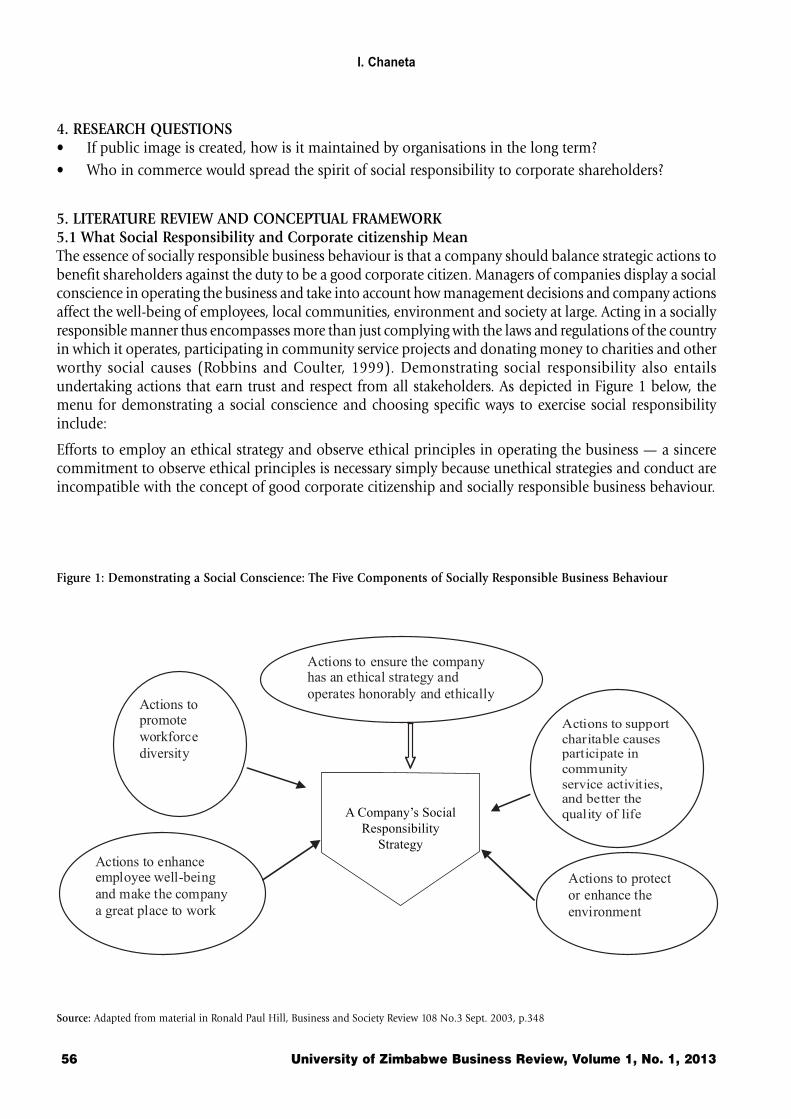
I. Chaneta
56 University of Zimbabwe Business Review, Volume 1, No. 1, 2013
4. RESEARCH QUESTIONS• If public image is created, how is it maintained by organisations in the long term?
• Who in commerce would spread the spirit of social responsibility to corporate shareholders?
5. LITERATURE REVIEW AND CONCEPTUAL FRAMEWORK5.1 What Social Responsibility and Corporate citizenship MeanThe essence of socially responsible business behaviour is that a company should balance strategic actions tobenefit shareholders against the duty to be a good corporate citizen. Managers of companies display a socialconscience in operating the business and take into account how management decisions and company actionsaffect the well-being of employees, local communities, environment and society at large. Acting in a sociallyresponsible manner thus encompasses more than just complying with the laws and regulations of the countryin which it operates, participating in community service projects and donating money to charities and otherworthy social causes (Robbins and Coulter, 1999). Demonstrating social responsibility also entailsundertaking actions that earn trust and respect from all stakeholders. As depicted in Figure 1 below, themenu for demonstrating a social conscience and choosing specific ways to exercise social responsibilityinclude:
Efforts to employ an ethical strategy and observe ethical principles in operating the business — a sincerecommitment to observe ethical principles is necessary simply because unethical strategies and conduct areincompatible with the concept of good corporate citizenship and socially responsible business behaviour.
Figure 1: Demonstrating a Social Conscience: The Five Components of Socially Responsible Business Behaviour
Source: Adapted from material in Ronald Paul Hill, Business and Society Review 108 No.3 Sept. 2003, p.348
A Company’s Social
Responsibility
Strategy
Actions to ensure the company has an ethical strategy and
operates honorably and ethically Actions to promote
workforce
diversity
Actions to support
charitable causes
participate in
community service activities,
and better the
Actions to enhance employee well-being
and make the company
a great place to work
Actions to protect
or enhance the
environment
Actions to support
charitable causes participate in
community
service activities, and better the
quality of life
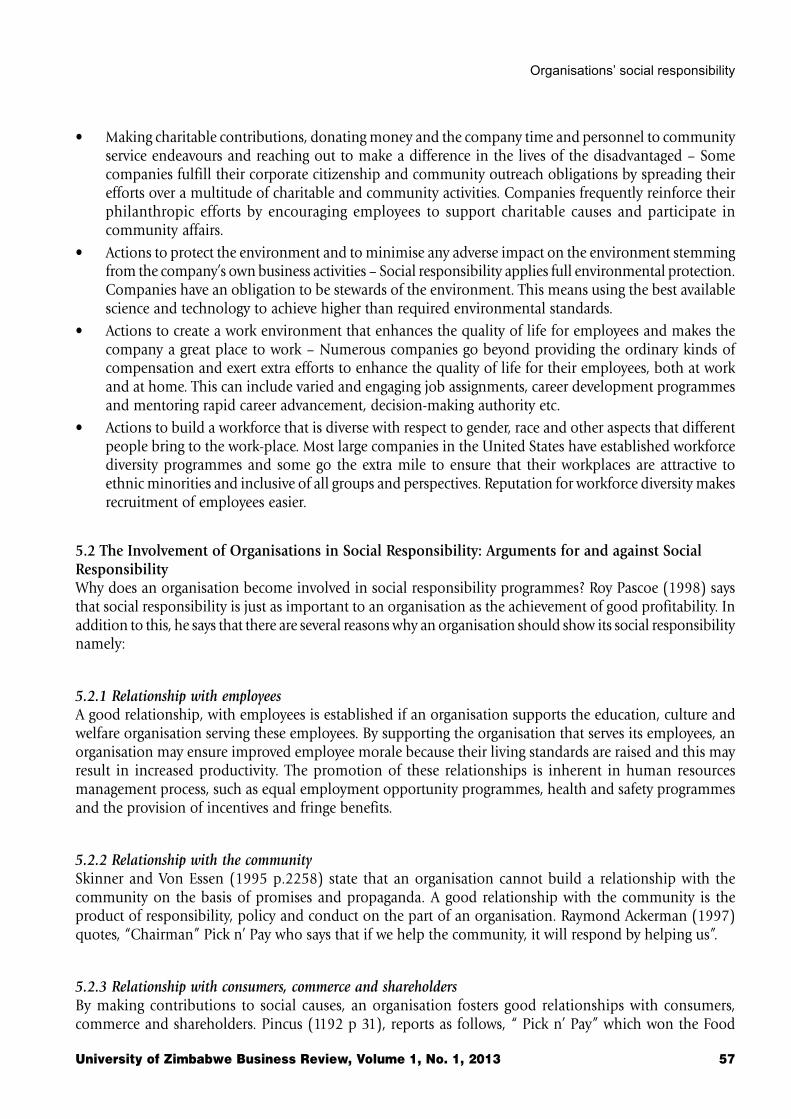
Organisations’ social responsibility
University of Zimbabwe Business Review, Volume 1, No. 1, 2013 57
• Making charitable contributions, donating money and the company time and personnel to communityservice endeavours and reaching out to make a difference in the lives of the disadvantaged – Somecompanies fulfill their corporate citizenship and community outreach obligations by spreading theirefforts over a multitude of charitable and community activities. Companies frequently reinforce theirphilanthropic efforts by encouraging employees to support charitable causes and participate incommunity affairs.
• Actions to protect the environment and to minimise any adverse impact on the environment stemmingfrom the company’s own business activities – Social responsibility applies full environmental protection.Companies have an obligation to be stewards of the environment. This means using the best availablescience and technology to achieve higher than required environmental standards.
• Actions to create a work environment that enhances the quality of life for employees and makes thecompany a great place to work – Numerous companies go beyond providing the ordinary kinds ofcompensation and exert extra efforts to enhance the quality of life for their employees, both at workand at home. This can include varied and engaging job assignments, career development programmesand mentoring rapid career advancement, decision-making authority etc.
• Actions to build a workforce that is diverse with respect to gender, race and other aspects that differentpeople bring to the work-place. Most large companies in the United States have established workforcediversity programmes and some go the extra mile to ensure that their workplaces are attractive toethnic minorities and inclusive of all groups and perspectives. Reputation for workforce diversity makesrecruitment of employees easier.
5.2 The Involvement of Organisations in Social Responsibility: Arguments for and against SocialResponsibilityWhy does an organisation become involved in social responsibility programmes? Roy Pascoe (1998) saysthat social responsibility is just as important to an organisation as the achievement of good profitability. Inaddition to this, he says that there are several reasons why an organisation should show its social responsibilitynamely:
5.2.1 Relationship with employeesA good relationship, with employees is established if an organisation supports the education, culture andwelfare organisation serving these employees. By supporting the organisation that serves its employees, anorganisation may ensure improved employee morale because their living standards are raised and this mayresult in increased productivity. The promotion of these relationships is inherent in human resourcesmanagement process, such as equal employment opportunity programmes, health and safety programmesand the provision of incentives and fringe benefits.
5.2.2 Relationship with the communitySkinner and Von Essen (1995 p.2258) state that an organisation cannot build a relationship with thecommunity on the basis of promises and propaganda. A good relationship with the community is theproduct of responsibility, policy and conduct on the part of an organisation. Raymond Ackerman (1997)quotes, “Chairman” Pick n’ Pay who says that if we help the community, it will respond by helping us”.
5.2.3 Relationship with consumers, commerce and shareholdersBy making contributions to social causes, an organisation fosters good relationships with consumers,commerce and shareholders. Pincus (1192 p 31), reports as follows, “ Pick n’ Pay” which won the Food
I. Chaneta
58 University of Zimbabwe Business Review, Volume 1, No. 1, 2013
Marketing Institute International Hall of Fame Award for Social Responsibility in 1984, was founded onconsumerism with a strong base of social responsibility”. He says that, after all, consumers, commerce andshareholders are the groups who provide the financial resources that enable organisations to become involvedin social responsibility programmes.
5.2.4 Public ImageCompanies seem to enhance their public image to get increased sales, better employees, access to financingand other benefits. Because, the public considers social goals important, business can create a favourablepublic image by pursuing social goals.
5.2.5 Better EnvironmentEnvironment can help solve difficult social problems, helping create a better quality of life and a moredesirable community in which to attract and keep skilled employees (Mabey, Salaman and Story, 1998).
5.2.6 Possession of ResourcesSutcliffe and Callins (1994) state that business firms have the financial resources, technical expertise andmanagerial talent to support public and charitable projects that need assistance.
5.2.7 Superiority of Prevention over CuresSocial problems must be addressed one at a time. Business should act before these problems become seriousand costly to correct, taking managers’ energies away from accomplishing their goals of producing goodsand services (Newton, Leckie and Pettman, 1979).
5.2.8 Dilution of purposeThe pursuit of social goals dilutes business’s primary purpose i.e. economic productivity. Society may sufferif both economic and social goals are poorly accomplished.
5.2.9 CostsMany socially responsible actions do not cover their costs. Someone has to pay those costs. Business mustabsorb the costs or pass them on to the consumers through higher prices.
5.2.10 Too Much powerBusiness is already one of the most powerful sectors of our society. If it pursues social goals, it will have evenmore power. Society has given business enough power.
5.2.11 Lack of AccountabilityPolitical representatives pursue social goals and are held accountable for their actions. Such is not the casewith business leaders. There are no direct lines of social accountability from the business sector to thepublic.
6. RESEARCH METHODOLOGYMethodology is defined in two major ways. In one form, the methodology is identical to a research modelemployed by a researcher in a particular project including basic knowledge related to the subject and research

Organisations’ social responsibility
University of Zimbabwe Business Review, Volume 1, No. 1, 2013 59
methods and the framework employed in a particular context (Lathor, 1992). In this sense, every investigationhas a distinct approach and every researcher employs his/her approach which might vary from study tostudy. Another definition relates to the nature of approach to a theoretical and more abstract context andperceives it in conjunction with distinctive one-dimensional and mutually exclusive theoretical principles(Westhuizen and Ahrahams, 2002).
Here, an approach offers the research principles which are related closely to a distinct paradigm translatedclearly and accurately down to guidelines on acceptable research practices. The approach is determined notby research model but rather by principles of research entailed in a paradigm. The approaches that resultfrom this definition are the qualitative and the quantitative approaches. As this study applies qualitativeapproach, it is discussed below:
7. QUALITATIVE APPROACHThe study which is under review is a qualitative or case study one. Denzin and Lincoln (1994) definequalitative research as a multi-method in focus, involving an interpretive and naturalistic approach to itssubject matter. Creswell (1994) defines qualitative research as an inquiry process of understanding, basedon distinct methodological traditions of inquiry that explore a social or human problem. Qualitative researchis invariably conducted in the field. For this reason, it is sometimes referred to as field research (Dooley,1992). Guba and Lincold (1992) say that qualitative research is sometimes referred to as case study research.
This means that the qualitative researchers study things in their natural settings attempting to make sense ofor interpret phenomena in terms of the meanings people bring them. Qualitative research involves the useand collection of a variety of empirical materials – case study, personal experience, introspective, life story,interview, observational, historical, interactional and usual texts that describe routine and problematicmoments and meaning in individuals’ lives.
8. SOURCES OF DATA AND SAMPLING METHODThe study employed two sources of data collection and these are primary and secondary sources. Secondarysources included relevant academic journals, text books and publications by employment agencies. Theprimary sources involved the use of well-structured questionnaires administered on 240 randomly selectedrespondents from civil service, manufacturing companies and Harare City Council. By the nature of theirworking conditions, application of social responsibility for the good of the workforce in the sectors referredabove is a necessity. The data collected were analysed with the aid of qualitative methods which include theuse of tables and frequency distribution. The respondents expressed need for assistance in the form of feesfor children, adequate retirement packages and accommodation.
9. DISCUSSIONSocial responsibility of an organisation is becoming even more important today. It would also appear thatorganisations are expected to become involved in real social problems of the community within which theyfunction. Therefore, organisations are becoming increasingly involved in the community to show that theydo not only want to use the community for personal gain, but that they want to give something back to thecommunity to ensure dispensation for both parties.
Today however, organisations pursue multiple goals with emphasis on social awareness, social care andsocial commitment. Social responsibility is at present so important that the success of an organisation maydepend to a large extent on its social commitment.
9.1 Importance of Social ResponsibilityCronje et al. (1990 p 389) maintain that the social responsibility of business is increasingly coming to thefore. Nowadays, the public expects an organisation to become closely involved in the real social problems
I. Chaneta
60 University of Zimbabwe Business Review, Volume 1, No. 1, 2013
of the community within which it operates. One of the tasks of management is to initiate programmes tobring the corporate sense of social responsibility to the attention of the external public. Management shouldalso keep a watchful eye on any activities that might be construed by external groups as irresponsible becausethese may give rise to resentment.
Robbins and Coulter (1999 p 146) state that it is a business firm’s obligation (beyond that required by lawand economics) to pursue long-term goals that are good for the society. A business fulfills social obligationwhen it meets economic and legal responsibilities. Following an approach of social obligation, a firm pursuessocial goals only to the extent that the community contributes to its economic goals. Social responsibilityadds an ethical imperativeness to do those things that make society better and not to do those that couldmake it worse. A socially responsible organisation goes beyond what it must do by law or chooses to do anything because it makes economic sense to doing what it can to help improve society because that is the rightor ethical thing to do. Social responsibility requires business to determine what is right or wrong and tomake ethical decisions and engage ethical business activities. A socially responsible organisation does whatis right because it has an obligation to act that way. A company that meets pollution control standardsestablished by the government or does not discriminate against employees over the age of forty in promotiondecisions, is meeting its social obligation. When it provides on site child-care facilities for employees, it isbeing socially responsible (Robbins & Coulter, 1999).
9.2 ConclusionThe conclusion to be drawn from all that is that long-term profitability cannot be attained if an organisationdoes not act in a socially responsible way. Social responsibility adds on ethical imperatives to those thingsthat make society better and not to do those things that could make it worse. A socially responsibleorganization acts the way it does because of its desire to satisfy some expressed social need in the form ofdecent accommodation and welfare assistance, especially during the retirement period. Social responsibilityis not confined solely to matters affecting the external environment. The internal environment and the well-being of workers and their working conditions are no less important. Cronje et al (1999) are of the opinionthat the support of such services by an organisation fosters good moral and allows for higher standard ofliving for its staff which can also lead to higher productivity. When it becomes known that an organisationhas the welfare of its employees at heart, this creates a spirit of good will and commitment and the organisationthen, does not need to scrape the labour market barrel to get and keep good workers.
10. REFERENCESAmaeshi, K. et al (2007) Reconstructing the Corporate Social Responsibility Business Ethics: An European
Review.
Cronje et al (1999) Re-Assessing Human Resource Management, London, Sage 1-15.
Denzin and Lincoln (1994) Corporate Social Responsibility, Perspective Firms, Journal of Business Review, 26pg7-40.
Fig, D. (2005) Manufacturing Amnesia: Corporate Social Responsibility in S.A. International Affair Journal.Vol. 81 pg 599-610.
Grief, A. (2003) Institutions and Impersonal Exchange: Economic Olin Working Papers No. 284.
Guba and Lincoln (1992) Universalising Social Responsibility, Business and Society Review, Vol. 11 1-19.
Jones, M. T. (1999) The Institutional Determinants of Social Responsibility. Journal of Business Ethics: Vol.20, pg 163.
Lathor C. (1992) Boundaries of Strategic Corporate Social Responsibility, Journal of Business Ethics, Vol. 7 pg57-72.
Mahey, C, Salaman, G. and Story, J. (1998) Human Resource Management: A Strategic Introduction. BlackwellPublishers Inc.
Organisations’ social responsibility
University of Zimbabwe Business Review, Volume 1, No. 1, 2013 61
Maignan, I. (2001) Consumers Perception of Corporate Social Responsibility: Journal of Business Ethics, Vol.30 pg 57-72.
Moon, J. (2002) Corporate Social Responsibility: An Overview of International Directory, pg 3-14 London.
Pincus, J. (1992) New Wave Management, Employment and Society, Vol. 3, No. 3 pg 379-402.
Raymond A. (1997) The Practice of Management, New York, Harper.
Robbins and Coulter (1999) Management, Prentice Hall International, Inc.
Roy, P. (1998) Development in the Management of Human Resource, Oxford: Blackwell.
Skinner and Von Essen (1995) The Management of Innovation, London: Tauistock.
Sutcliffe, P. and Collins, R. (1994) Glossary of Australia Industrial Relations Terms, University of Sydneyand ACSM.
Thompson, A. A. Strickland, A. and Gambe, J. (2010) Crafting and Executing Strategy: The Quest forCompetitive Advantage, McGraw-Hill Irwin.
Windsor, D. (2001) The Future of Corporate Social Responsibility. The International Journal of OrganisationalAnalysis, Vol. 9 pg 225-256.
Westhuizen and Abrahams (2002) Research Paradigms in Cognitive Education, Vista University.
University of Zimbabwe Business Review, Volume 1, No. 1, 2012
62
Guidelines for Authors
1. NATURE OF MANUSCRIPTS ARTICLESManuscripts articles may be empirical studies, case, survey, experiment, or theoretical studies which,review, advance or synthesize existing theory.
2. MANUSCRIPT GUIDELINESEvery paper should address the following:
i) Abstractii) Introductioniii) Purpose/objectives of the articleiv) Hypothesis/problem investigatedv) Methodologyvi) Results/Findingsvii) Conclusion and recommendationsviii) References.
3. SUBMISSION GUIDELINES• The journal welcomes submissions in all areas related to Business, Management, Economics and
Commerce.
• Manuscripts must be in English prepared on standard A4 size paper setting. It must be prepared in 12-point Times New Roman.
• The Manuscript must be original; it must not have been published before, nor have been submitted forpublication to another journal at the same time.
• Each manuscript requires an abstract with a length of 10 - 15 lines in 12 point font Times New Romanand Italic, followed by 5-7 keywords.
• Two hard copies of type-written manuscripts in MS Word format should be submitted to the Editor onthe address provided below and an electronic copy by E-mail to [email protected].
• Authors should leave the standard margin for each — top, bottom, left and right MS Word Margin.
• The list of References must be presented using the Harvard Style of referencing and should be givenin alphabetical order (see reference notes provided below).
• Papers without references will not be reviewed.
• The sections of the paper must be clearly marked. The numeration for the main sections and subsectionsshould be given decimals e.g 1, 1.1, 1.1.1, e.t.c. IN BOLD).
• All foot notes should be given at the bottom of the page and should be numbered.
• The length of the article must be between 4 500 and 12 000 words including, summaries, tables,graphs, footnotes and references).
• Tables and figures should be shown inside the document and should be numbered continuously andshowing the title, e.g. Table 1: Age Distribution of Respondents.
• Research Papers/Review Articles will be published in the Journal after a double blind peer-reviewprocess.
• The Editor reserves the right to make changes, in conjuction with the editorial team and in accordancewith accepted standards.
• Once the paper is accepted, the authors) will be required to send a signed copy of the Copyright Formby E-mail to [email protected]. It is mandatory for all the authors to sign the CopyrightForm.
University of Zimbabwe Business Review, Volume 1, No. 1, 2012
63
4. REVIEW PROCESS
1. Each manuscript will be primarily examined by the editor, and then forwarded to two referees forblind review. The research paper shall be published subject to recommendations of referees. Thereview process may take up to a week or one month (maximum two months in extra ordinarycircumstances). If the reviewers disagree in terms of their opinions, the manuscript is sent to the thirdreviewer for further review of the manuscript.
2. The authors shall be informed about the selection/rejection of the article/paper by e-mail only. However,the journal shall publish the article/papers of the authors who completed the formalities in due timementioned in the selection letter. The rejected papers shall not be returned.
3. In case of acceptance of the article and completion of publication formalities by the authors), theEditor reserves the right to make amendments in the final draft of the research paper to suit thejournal’s set standards.
5. GUIDE TO REFERENCING
a. Citing Sources
Martin’s (1998) clarion call for executives in a crisis is . . .
Beer et al. (1993: 3) emphasize the need to diagnose business problems . . .
b. End-Text Reference
Books
Peters, T.J. and Waterman, R. H. (1995). In Search of Excellence: Lessons from America’s Best-runCompanies, London: HarperCollins Business.
Articles in Journals
Collins, D. J. and Montgomery C. A. (1995). ‘Competing on resources: strategy in the 1990s’, in HarvardBusiness Review, 73, (iv): 118-28.
Articles in Books
1. Beer, M., Eisenstat, R. A. and Spector, B. (1993). ‘Why change programmes don’t produce change’, inMabey, C. and Mayon-White, B. (eds.) Managing Change, London: Paul Chapman Publishing Ltd.
DISCLAIMER
The accountability of the research matter articulated in this journal is entirely of the author(s) concerned. The views expressed
in the research papers/articles in this journal do not essentially correspond to the views of the publisher/editor. The publisher/
editor of the journal is not liable for errors or any consequences arising from the exercise of information contained in it.
All rights of reproduction are reserved in respect of all papers, articles, illustrations etc. published in UZBR. All material published
in this journal is protected covering all exclusive rights to reproduce the material. No material published in UZBR may be
reproduced or stored on microfilm or in electronic optical or magnetic form without the written permission from and authorization
of the publisher.
The publisher of UZBR will not be responsible for statements made by authors in any article published in this journal. Under no
circumstances will the publisher be liable for any loss or damage caused by reliance on advice opinion or information obtained
either explicitly or implied through the contents of this publication.


