Embed Size (px)
Citation preview
UCC Library and UCC researchers have made this item openly available.Please let us know how this has helped you. Thanks!
Title Three-dimensional outcomes of twin-block appliance treatment and theinfluence of the postured wax bite
Author(s) Salloum, Erfan
Publication date 2015
Original citation Salloum, E. 2015. Three-dimensional outcomes of twin-block appliancetreatment and the influence of the postured wax bite. PhD Thesis,University College Cork.
Type of publication Doctoral thesis
Rights © 2015, Erfan Salloum.http://creativecommons.org/licenses/by-nc-nd/3.0/
Embargo information No embargo required
Item downloadedfrom
http://hdl.handle.net/10468/2861
Downloaded on 2022-02-12T03:34:25Z
i
Three-Dimensional Outcomes of Twin-Block Appliance
Treatment and the Influence of the Postured Wax Bite
Dr. Erfan Salloum DDS, MFDS RCSI
Thesis submitted to University College Cork in partial fulfilment of the
requirements for the DClinDent (Orthodontics)
National University of Ireland, Cork
June 2015
Postgraduate Orthodontic Unit
Cork University Dental School and Hospital
National University of Ireland, Cork
Supervisor Prof DT Millett
ii
TABLE OF CONTENTS
TABLE OF CONTENTS ..........................................................................................................ii
LIST OF TABLES .................................................................................................................... v
LIST OF FIGURES ................................................................................................................ vii
ABSTRACT ............................................................................................................................. ix
ACKNOWLEDGEMENTS .................................................................................................... xii
DECLARATION ................................................................................................................... xiii
CHAPTER ONE .......................................................................................................................... 1
INTRODUCTION ........................................................................................................................ 1
1. Introduction ......................................................................................................................... 2
CHAPTER TWO ......................................................................................................................... 4
LITERATURE REVIEW ................................................................................................................ 4
2. Literature review .................................................................................................................. 5
2.1 Search Strategy .............................................................................................................. 5
2.2 Overview ........................................................................................................................ 6
2.3 The FAs ........................................................................................................................... 6
2.3.1 Background ............................................................................................................. 6
2.3.2 Mode of action ........................................................................................................ 7
2.4 The TBA ........................................................................................................................ 13
2.4.1 Background ........................................................................................................... 13
2.4.2 Mode of action ...................................................................................................... 14
2.4.3 Designs of the TBA for Class II division 1 treatment ............................................. 26
2.4.4 Techniques for bite registration ........................................................................... 28
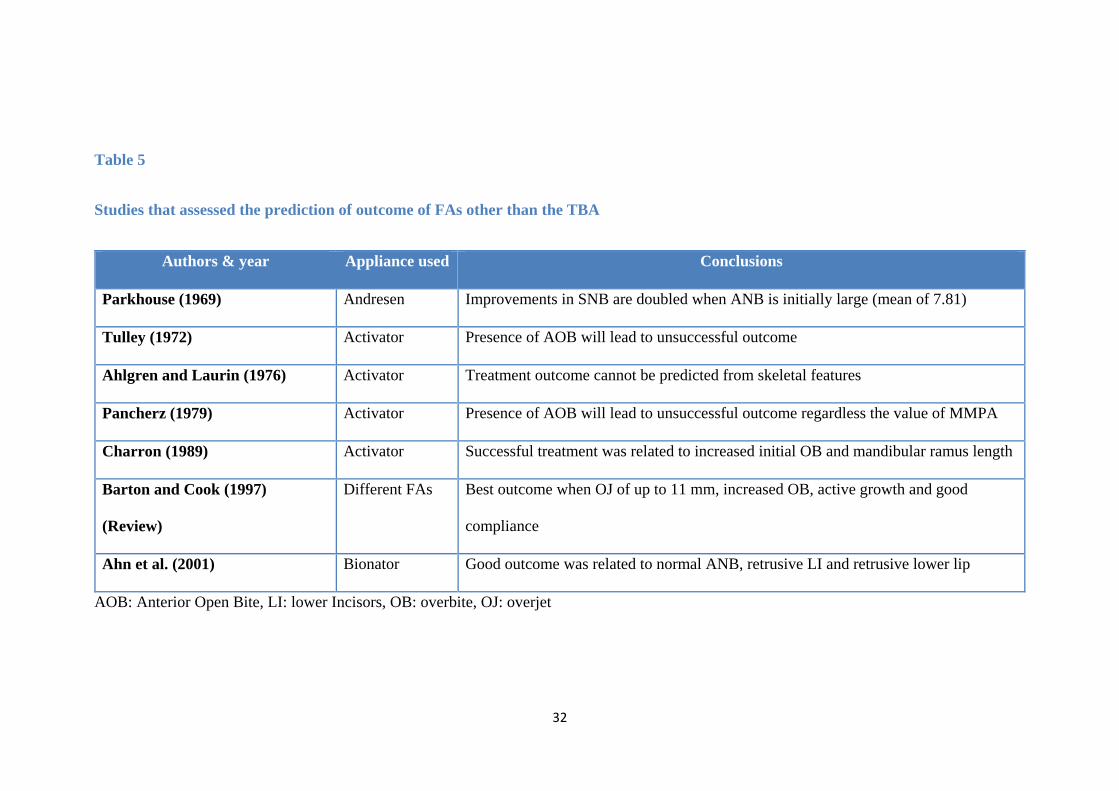
2.5 The prediction of treatment outcome with FAs .......................................................... 30
2.5.1 Studies of FAs ........................................................................................................ 30
2.5.2 Studies of TBA ....................................................................................................... 33
2.6 Three Dimensional imaging in Orthodontics ............................................................... 36
2.6.1 Background ........................................................................................................... 36
2.6.2 2D imaging ............................................................................................................ 37
2.6.3 3D imaging ............................................................................................................ 37
2.7 Facial expression .......................................................................................................... 48
iii
CHAPTER THREE ..................................................................................................................... 50
AIMS AND NULL HYPOTHESIS ................................................................................................ 50
3. Aims and null hypotheses .................................................................................................. 51
3.1 Aims .............................................................................................................................. 51
3.2 Null hypotheses ........................................................................................................... 51
CHAPTER FOUR ...................................................................................................................... 52
PATICIPANTS AND METHODS ................................................................................................ 52
4. Participants and Methods .................................................................................................. 53
4.1 Study Design ................................................................................................................. 53
4.2 Sample .................................................................................................................... 53
4.3 Data Collection ....................................................................................................... 54
4.4 The DI3D imaging system ....................................................................................... 58
4.4.1 Equipment and facility .......................................................................................... 58
4.4.2 The Hardware ................................................................................................. 59
4.4.3 The Software ......................................................................................................... 60
4.4.4 Calibration ............................................................................................................. 61
4.4.5 Scanning protocol ................................................................................................. 62
4.4.6 Landmarks ............................................................................................................. 63
4.5 Statistical analysis .................................................................................................. 67
CHAPTER FIVE ........................................................................................................................ 68
RESULTS ................................................................................................................................. 68
5. Results ................................................................................................................................ 69
5.1 Initial recruitment ........................................................................................................ 69
5.2 Final sample ................................................................................................................. 69
5.3 Error study for the reliability of soft tissue landmarking ............................................. 70
5.4 Results of 3D analyses .................................................................................................. 71
5.4.1 Facial profile volumetric and landmark changes .................................................. 71
5.4.2 Estimation of treatment outcome from the PWB ................................................ 80
5.4.3 The association of 3D facial parameters with successful TBA treatment as measured by reduction in the overjet ........................................................................... 87
5.4.4 Facial expression changes after treatment with the TBA (T1-T3) ......................... 87
CHAPTER SIX ........................................................................................................................... 99
DISCUSSION ............................................................................................................................ 99
6. Discussion ......................................................................................................................... 100
iv
6.1 Study design ............................................................................................................... 100
6.2 Sample size and characteristics ................................................................................. 100
6.3 Standardisation protocol ........................................................................................... 102
6.4 Landmarking error study ............................................................................................ 102
6.5 The 3D analyses ......................................................................................................... 103
6.5.1 Soft tissue volumetric and landmark changes .................................................... 103
6.5.2 The estimation of the TBA treatment on the soft tissue profile outcome using the PWB .............................................................................................................................. 104
6.5.3 Soft tissue landmark variables associated with successful TBA treatment outcome ..................................................................................................................................... 105
6.5.4 Facial expression changes ................................................................................... 106
6.6 Strengths of the study ................................................................................................ 106
6.7 Weaknesses of the study ........................................................................................... 107
6.8 Future research .......................................................................................................... 107
CHAPTER SEVEN ................................................................................................................... 109
CONCLUSIONS ...................................................................................................................... 109
7. Conclusions ...................................................................................................................... 110
CHAPTER EIGHT .................................................................................................................... 113
REFERENCES ......................................................................................................................... 113
8. References ....................................................................................................................... 114
CHAPTER NINE ..................................................................................................................... 130
APPENDICES ......................................................................................................................... 130
9. Appendices ....................................................................................................................... 131
9.1 Appendix A ................................................................................................................. 131
9.2 Appendix B ................................................................................................................. 132
v
LIST OF TABLES
CHAPTER TWO
Table 1 Electronic data base search strategy…………………………. 5
Table 2 Systematic reviews published evaluating the mode of action
of FAs………………………………………………………………….
9
Table 3 Controlled studies and systematic reviews published on
skeletal and dental effects of the TBA………………………………...
16
Table 4 Studies and systematic reviews published on soft tissues
effects of the TBA……………………………………………………..
22
Table 5 Studies that assessed the prediction of outcome of FAs other
than the TBA…………………………………………………………
32
Table 6 Studies that have assessed the prediction of outcome with the
TBA……………………………………………………………………
34
Table 7 Summary of the radiographic based imaging methods
reported in the literature……………………………………………….
39
Table 8 Summary of Vision based 3D imaging methods reported in
the literature…………………………………………………………..
41
Table 9 Other 3D imaging techniques reported in the literature…… 43
Table 10 Different stereophotogrammetry systems reported in the
literature……………………………………………………………….
45
CHAPTER FIVE
Table 11 Final sample characteristics of subjects who completed
TBA treatment…………………………………………………………
70
vi
Table 12 3D Soft tissue volumetric changes from T1 to T2 and from
T1 to T3 for the final sample………………………………………….
72
Table 13 Type 3 tests of fixed effects for 3D volumetric changes for
the final sample……………………………………………………….
73
Table 14 3D soft tissue linear changes from T1 to T3 for the upper
and lower facial landmarks in the final sample who completed TBA
treatment………………………………………………………………
75
Table 15 Summary statistics of the lower facial profile landmarks by
gender and overall from T1 to T3 in the final sample that completed
TBA treatment………………………………………………………..
77
Table 16 Lower facial profile landmarks with test of fixed effects for
each point…………………………………………………………….
78
Table 17 The correlation between different facial parameters with
overjet difference from T1 to T3 and overjet at T3…………………..
89
Table 18 Correlation of lower soft tissue facial profile landmarks
with the overjet difference from T1 to T3…………………………….
90
Table 19 3D landmarks changes from T1-T3 for the rest position in
subjects who completed TBA treatment………………………………
91
Table 20 3D landmark changes from T1 to T3 for natural smile in
subjects who completed TBA treatment………………………………
93
Table 21 3D landmark changes from T1 to T3 for the maximal smile
in subjects who completed TBA treatment……………………………
96
vii
LIST OF FIGURES
CHAPTER FOUR
Figure 1 A 4 mm “Projet Bite” that was used in the study to take a
wax-bite registration…………………………………………………..
55
Figure 2 The softened wax wafer adapted to fit over the “Projet Bite”
gauge…………………………………………………………………...
55
Figure 3 The TBA design that was standardized for all the subjects
and used in the study…………………………………………………..
57
Figure 4 The PWB used during 3D facial scans showing excess wax
and plastic trimmed……………………………………………………
57
Figure 5 The imaging room where all 3D images were taken……….. 59
Figure 6 The hardware components of the DI3D
stereophotogrammetry system used in the study……............................
60
Figure 7 The DI3D view software showing volumetric changes in
soft tissues position on a 3D model…………………………………..
61
Figure 8 Illustration of the matt placement to a pre-set distance from
the camera configuration for accurate
calibration……………………………………………………
62
Figure 9 3D image of a patient included in the study showing the
landmarks used……………………………………………………….
66
viii
CHAPTER FIVE
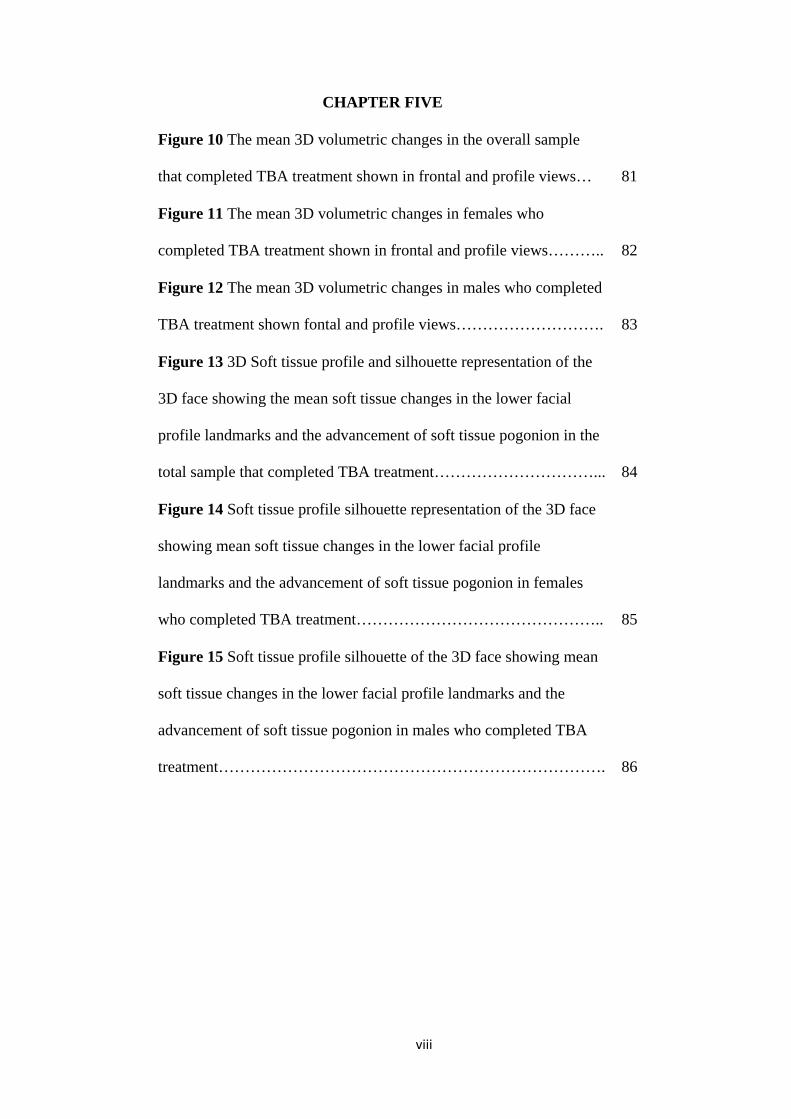
Figure 10 The mean 3D volumetric changes in the overall sample
that completed TBA treatment shown in frontal and profile views…
81
Figure 11 The mean 3D volumetric changes in females who
completed TBA treatment shown in frontal and profile views………..
82
Figure 12 The mean 3D volumetric changes in males who completed
TBA treatment shown fontal and profile views……………………….
83
Figure 13 3D Soft tissue profile and silhouette representation of the
3D face showing the mean soft tissue changes in the lower facial
profile landmarks and the advancement of soft tissue pogonion in the
total sample that completed TBA treatment…………………………...
84
Figure 14 Soft tissue profile silhouette representation of the 3D face
showing mean soft tissue changes in the lower facial profile
landmarks and the advancement of soft tissue pogonion in females
who completed TBA treatment………………………………………..
85
Figure 15 Soft tissue profile silhouette of the 3D face showing mean
soft tissue changes in the lower facial profile landmarks and the
advancement of soft tissue pogonion in males who completed TBA
treatment……………………………………………………………….
86
ix
ABSTRACT
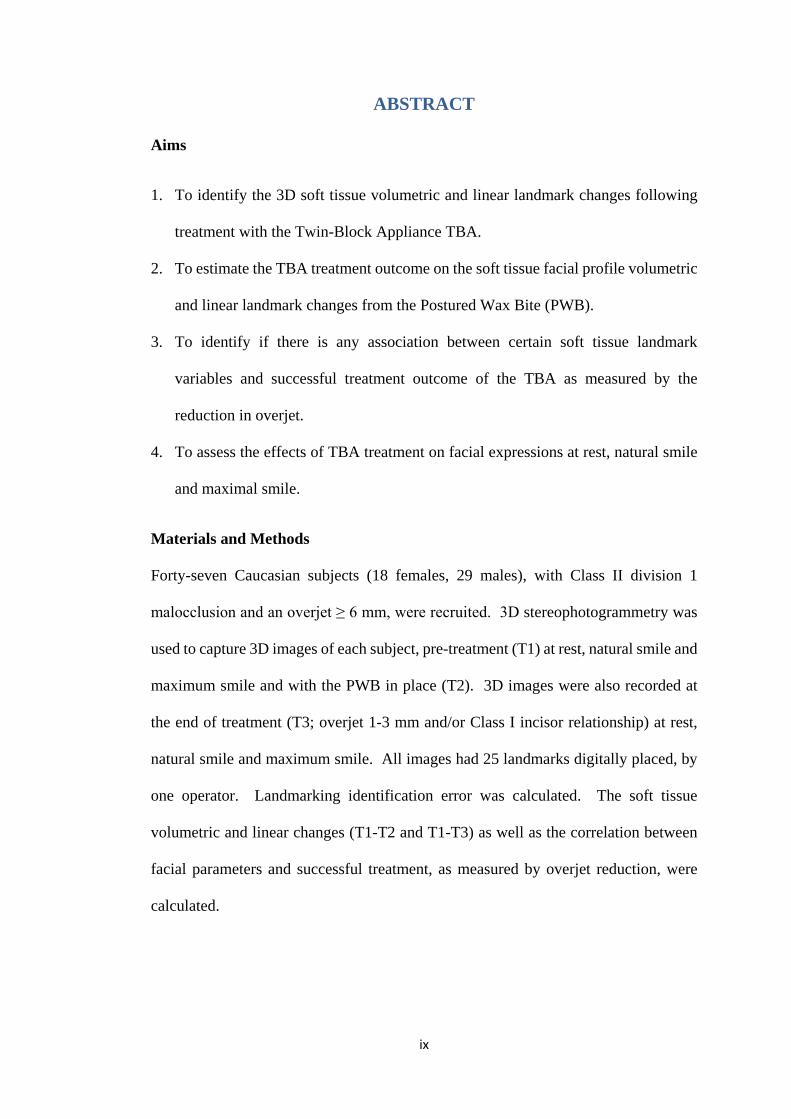
Aims
1. To identify the 3D soft tissue volumetric and linear landmark changes following
treatment with the Twin-Block Appliance TBA.
2. To estimate the TBA treatment outcome on the soft tissue facial profile volumetric
and linear landmark changes from the Postured Wax Bite (PWB).
3. To identify if there is any association between certain soft tissue landmark
variables and successful treatment outcome of the TBA as measured by the
reduction in overjet.
4. To assess the effects of TBA treatment on facial expressions at rest, natural smile
and maximal smile.
Materials and Methods
Forty-seven Caucasian subjects (18 females, 29 males), with Class II division 1
malocclusion and an overjet ≥ 6 mm, were recruited. 3D stereophotogrammetry was
used to capture 3D images of each subject, pre-treatment (T1) at rest, natural smile and
maximum smile and with the PWB in place (T2). 3D images were also recorded at
the end of treatment (T3; overjet 1-3 mm and/or Class I incisor relationship) at rest,
natural smile and maximum smile. All images had 25 landmarks digitally placed, by
one operator. Landmarking identification error was calculated. The soft tissue
volumetric and linear changes (T1-T2 and T1-T3) as well as the correlation between
facial parameters and successful treatment, as measured by overjet reduction, were
calculated.
x
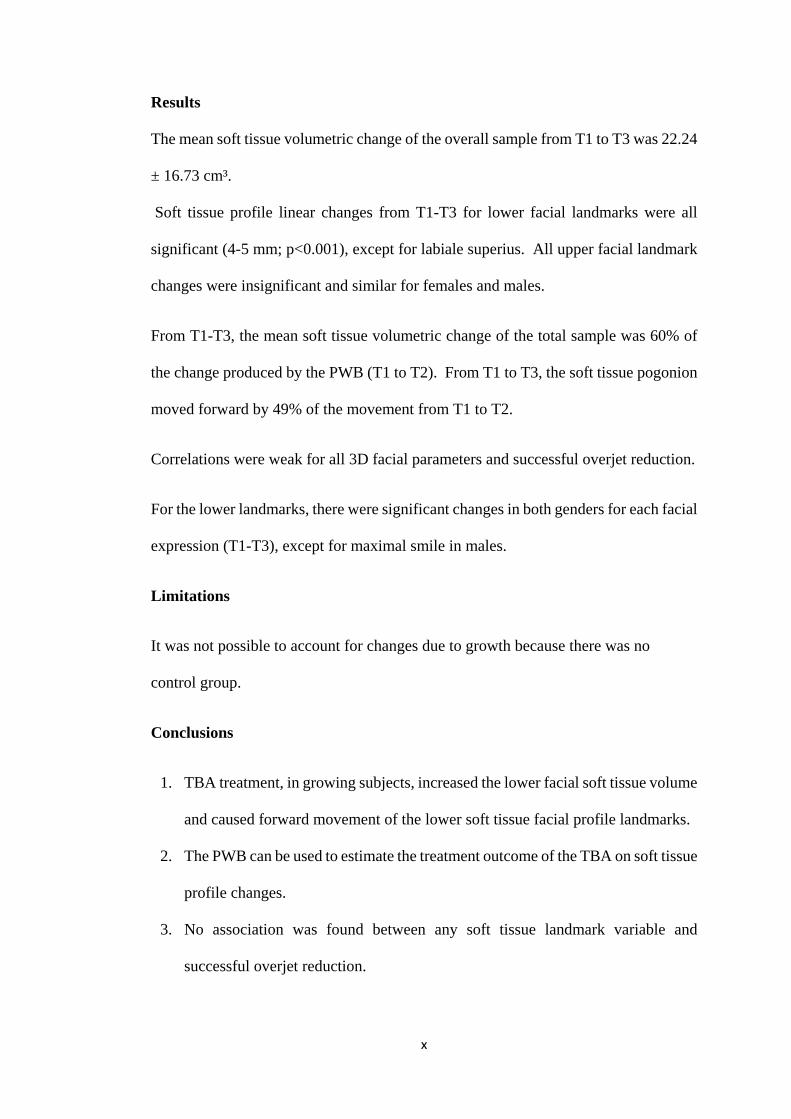
Results
The mean soft tissue volumetric change of the overall sample from T1 to T3 was 22.24
± 16.73 cm³.
Soft tissue profile linear changes from T1-T3 for lower facial landmarks were all
significant (4-5 mm; p<0.001), except for labiale superius. All upper facial landmark
changes were insignificant and similar for females and males.
From T1-T3, the mean soft tissue volumetric change of the total sample was 60% of
the change produced by the PWB (T1 to T2). From T1 to T3, the soft tissue pogonion
moved forward by 49% of the movement from T1 to T2.
Correlations were weak for all 3D facial parameters and successful overjet reduction.
For the lower landmarks, there were significant changes in both genders for each facial
expression (T1-T3), except for maximal smile in males.
Limitations
It was not possible to account for changes due to growth because there was no
control group.
Conclusions
1. TBA treatment, in growing subjects, increased the lower facial soft tissue volume
and caused forward movement of the lower soft tissue facial profile landmarks.
2. The PWB can be used to estimate the treatment outcome of the TBA on soft tissue
profile changes.
3. No association was found between any soft tissue landmark variable and
successful overjet reduction.

xi
4. TBA treatment had no effect on the upper facial landmarks for each facial
expression but it changed the lower facial expressions significantly except for
maximal smile in males.
xii
ACKNOWLEDGEMENTS
I owe a special debt of gratitude to my supervisor Professor Declan Millett for his
invaluable assistance, guidance and constructive comments throughout this project.
I would also like to thank Ms Niamh Kelly for her great help and considerable technical
support with scanning, software manipulation and landmarking the figures used in this
project.
I would also like to thank Dr M. Cronin for his advice and statistical input and to Dr
G. McIntyre for his critical appraisal.
I want to thank Dr P McDermott and Dr D Field for being great teachers and of course
massive thank you to my fellow orthodontic postgraduates Dr Siobhan McMorrow and
Dr Lamis Koshak for their encouragement, laughter over the past three years and
helping me in the sample collection process.
I also want to express my appreciation to the great help from all the orthodontic nurses,
the dental hygienist and our orthodontic secretary Ms Anne Marie Leahy.
Most of all and on a more personal note, I want to thank my mother and father for their
non-stop support, encouragement throughout my life and having faith in me. To them
I dedicate this project.
xiii
DECLARATION
I hereby declare that the work described in thesis, except where
otherwise mentioned, is my own and has not been submitted
previously as a requirement for a degree or a diploma at the this
or any other institution.
E. Salloum

1
CHAPTER ONE
INTRODUCTION
2
1. Introduction
Class II division 1 malocclusion, with prominent upper incisor teeth and increased
overjet, is associated with poor profile aesthetics (O'Brien et al., 2009), bullying
(Seehra, 2013), and an increased risk of incisor trauma (Petti, 2015).
Growth modification treatment, using Functional Appliances (FAs), specifically the
Twin-Block appliance (TBA), is the most common orthodontic treatment for Class II
division 1 malocclusion in growing patients (Chadwick et al., 1998). Several studies
have assessed the skeletal and dentoalveolar effects of FAs (Illing et al., 1998; Jena et
al., 2006; Saikoski 2014), but there is insufficient information with regard to their
effects on the soft tissue and facial profile (Flores-Mir and Major, 2006a; Baysal and
Uysal, 2013).
Obtaining high quality evidence regarding soft tissue facial profile changes produced
by FA treatment is important, as lay perception of successful outcome is influenced by
the improvement of facial aesthetics and soft tissue appearance (O’Brien et al., 2009,
Satterzadeh et al., 2010).
The effects of FAs have been extensively investigated using two-dimensional (2D)
lateral cephalometry (Tumer and Gultan, 1999; Sidlauskas, 2005). The face, however,
is a three-dimensional (3D) structure; therefore, an accurate assessment can only be
performed using 3D evaluation (Hajeer et al., 2004). The application of 3D technology
in the dental field continues to evolve and its clinical application has been proven to
be both accurate and reliable (Benington et al., 2010).
3
The effect of Twin Block appliance (TBA) treatment on soft tissue volumetric and
linear landmark changes has not been evaluated. The influence of the PWB on
estimating the treatment outcome of the TBA has also not been assessed.
It would also appear that the effect of FAs on facial expressions has not been reported
before. There is evidence to show that orthodontic treatment may alter the facial
morphology by changing the soft tissue contours (Kau et al., 2006), and may, therefore,
influence facial expression post-treatment.

4
CHAPTER TWO
LITERATURE REVIEW
5
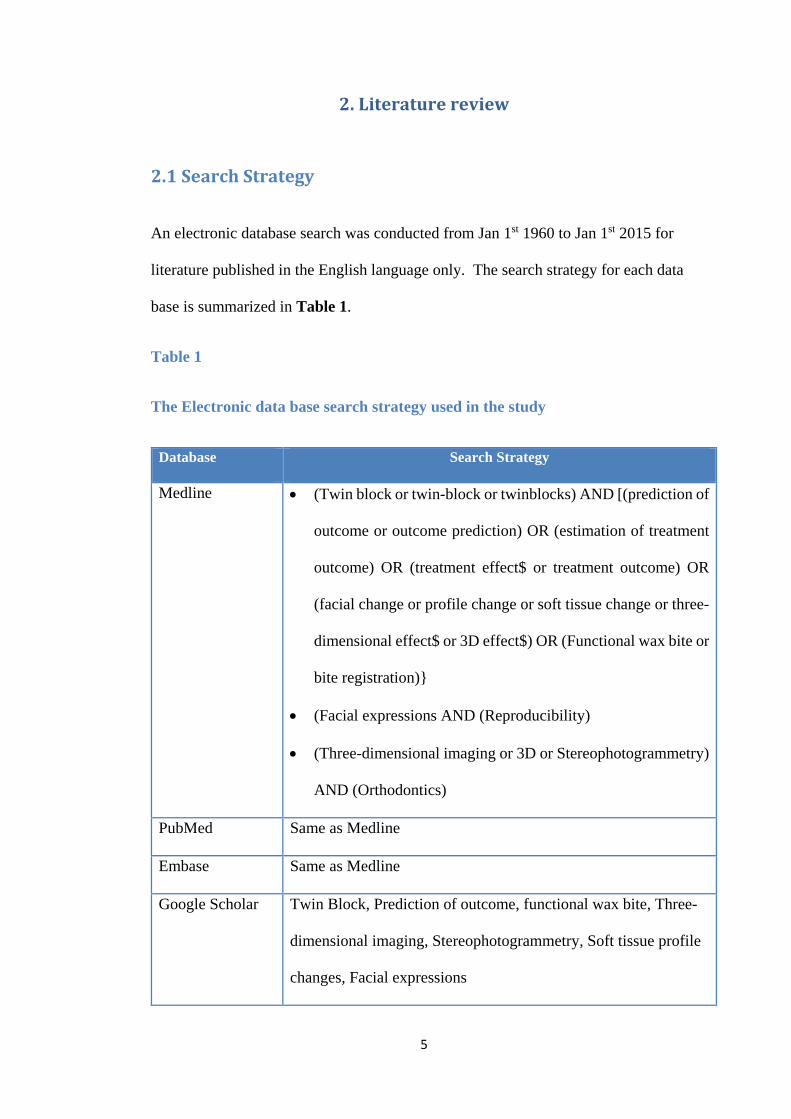
2. Literature review
2.1 Search Strategy
An electronic database search was conducted from Jan 1st 1960 to Jan 1st 2015 for
literature published in the English language only. The search strategy for each data
base is summarized in Table 1.
Table 1
The Electronic data base search strategy used in the study
Database Search Strategy
Medline • (Twin block or twin-block or twinblocks) AND [(prediction of
outcome or outcome prediction) OR (estimation of treatment
outcome) OR (treatment effect$ or treatment outcome) OR
(facial change or profile change or soft tissue change or three-
dimensional effect$ or 3D effect$) OR (Functional wax bite or
bite registration)}
• (Facial expressions AND (Reproducibility)
• (Three-dimensional imaging or 3D or Stereophotogrammetry)
AND (Orthodontics)
PubMed Same as Medline
Embase Same as Medline
Google Scholar Twin Block, Prediction of outcome, functional wax bite, Three-
dimensional imaging, Stereophotogrammetry, Soft tissue profile
changes, Facial expressions
6
Cochrane Library Same as Google Scholar
2.2 Overview
Since this project is using a specific type of FA which is the TBA, the literature review
will briefly discuss FAs, their classifications, types and mode of action. The TBA will
be discussed in more detail with regard to different designs, effectiveness and bite
registration techniques. Treatment prediction of outcome will be discussed for both
FAs, in general, and the TBA, specifically. Then, a summary of 3D imaging in
orthodontics will be presented, followed by a review of studies on facial expressions,
evaluated by 3D methodology.
2.3 The FAs
2.3.1 Background
Historically, the use of removable orthodontic appliances including FAs (also known
as myofunctional appliances) was very common among European orthodontists,
especially from 1925 to 1965 as fixed appliance systems were unknown in Europe
(Proffit et al., 2006). The first ever FA was the Monobloc which was developed by
Robin in the early 1900s. Then the Activator appliance was developed by the
Norwegian orthodontist, Andresen, in 1920 and it was the first FA to be widely
accepted. In the 1960s-1970s there was a major increase in the use of FAs among
North American orthodontists. This was the result of the influence of Faculty members
with European backgrounds, and the emergence of animal studies that showed
significant mandibular growth and skeletal change when the mandible was held in a
postured position (Proffit et al., 2006).
7
FAs have been classified into various categories for better understanding of their
applications. Yet, there is no single universally accepted classification (Ireland et al.,
2003). Vig et al. (1986) classified FAs based on their component parts:
• Passive tooth-borne
• Active tooth-borne
• Tissue-borne
• Hybrid.
Graber et al. (1984) classified FAs based on the degree of soft tissue stretch they induce
when in place:
• Myotonic: forces that move teeth are generated from the elastic recoil within the
stretched tissues
• Myodynamic: forces that move teeth are generated from the stimulation of the
masticatory muscles as a result of wearing the FA.
FAs can also be classified as fixed, or removable or whether they are used to treat
Class II or Class III malocclusion (Ireland et al., 2003; Mitchell, 2013).
2.3.2 Mode of action
All FAs utilize the forces generated by the orofacial soft tissues in order to move teeth.
The soft tissue stretch, generated by posturing the lower jaw away from the rest
position, is believed to cause tooth movement and facial growth modification (Mills,
1991). This is based on the concept of ‘bite jumping’ that was first introduced by
Norman Kingsley in North America (Kingsley, 1880). However, there is still
considerable controversy surrounding the mode of action of FAs (Aelbers and
Dermaut, 1996). According to the lateral pterygoid hypothesis, the postural and
8
functional activities of the superior and inferior heads of the lateral pterygoid muscle
increase after the insertion of a FA. This muscle hyperactivity augments condylar
growth (Mills and McCulloch, 2000). Several animal studies have supported the actual
increase in mandibular length (McNamara Jr, 1973; Xiong et al., 2004).
On the other hand, there are opponents to the muscular hyperactivity and lateral
pterygoid theories. Yamin-Lacouture et al. (1997) have tested this hypothesis on non-
human primates using inserted electromyographic (EMG) electrodes and found that
FAs are associated with a decrease in the postural activity of the masseter, digastric as
well as the superior and inferior heads of the lateral pterygoid muscles.
Seven systematic reviews have been published evaluating the mode of action of FAs
(Chen et al., 2002; Cozza et al., 2006; Flores-Mir and Major, 2006b; Marsico et al.,
2011; Koretsi et al., 2014; Perinetti et al., 2015). Three have focused only on
dentoalveolar and skeletal effects (Chen et al., 2002; Cozza et al., 2006; Marsico et al.,
2011), two included evaluation of soft tissue as well as dentoskeletal effects (Koretsi
et al., 2014; Perinetti et al., 2015) and one focused only on soft tissue effects (Flores-
Mir and Major, 2006b). Their findings are summarized in Table 2. Some of these
reviews have included the TBA in conjunction with other FAs. Studies specifically
on the TBA only will be discussed in Section 2.4.
The systematic review by Chen et al. (2002) covered the literature from 1966 to 1999
and identified 17 RCTs of which six were selected for final analysis. Only
dentoalveolar changes were reported. One study included in this systematic review
used the TBA (Illing et al., 1998), and the remaining five used the Bass, Bionator and
Frankel appliances. There was a considerable amount of methodological variation and
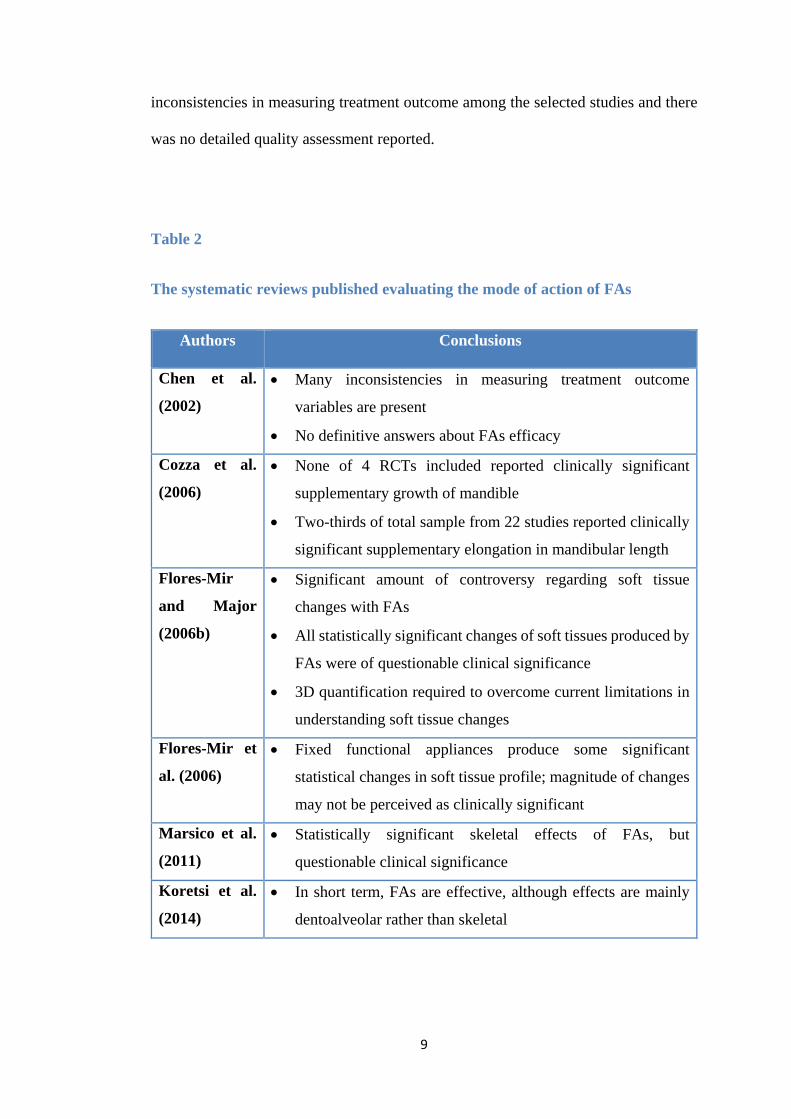
9
inconsistencies in measuring treatment outcome among the selected studies and there
was no detailed quality assessment reported.
Table 2
The systematic reviews published evaluating the mode of action of FAs
Authors Conclusions
Chen et al.
(2002)
• Many inconsistencies in measuring treatment outcome
variables are present
• No definitive answers about FAs efficacy
Cozza et al.
(2006)
• None of 4 RCTs included reported clinically significant
supplementary growth of mandible
• Two-thirds of total sample from 22 studies reported clinically
significant supplementary elongation in mandibular length
Flores-Mir
and Major
(2006b)
• Significant amount of controversy regarding soft tissue
changes with FAs
• All statistically significant changes of soft tissues produced by
FAs were of questionable clinical significance
• 3D quantification required to overcome current limitations in
understanding soft tissue changes
Flores-Mir et
al. (2006)
• Fixed functional appliances produce some significant
statistical changes in soft tissue profile; magnitude of changes
may not be perceived as clinically significant
Marsico et al.
(2011)
• Statistically significant skeletal effects of FAs, but
questionable clinical significance
Koretsi et al.
(2014)
• In short term, FAs are effective, although effects are mainly
dentoalveolar rather than skeletal
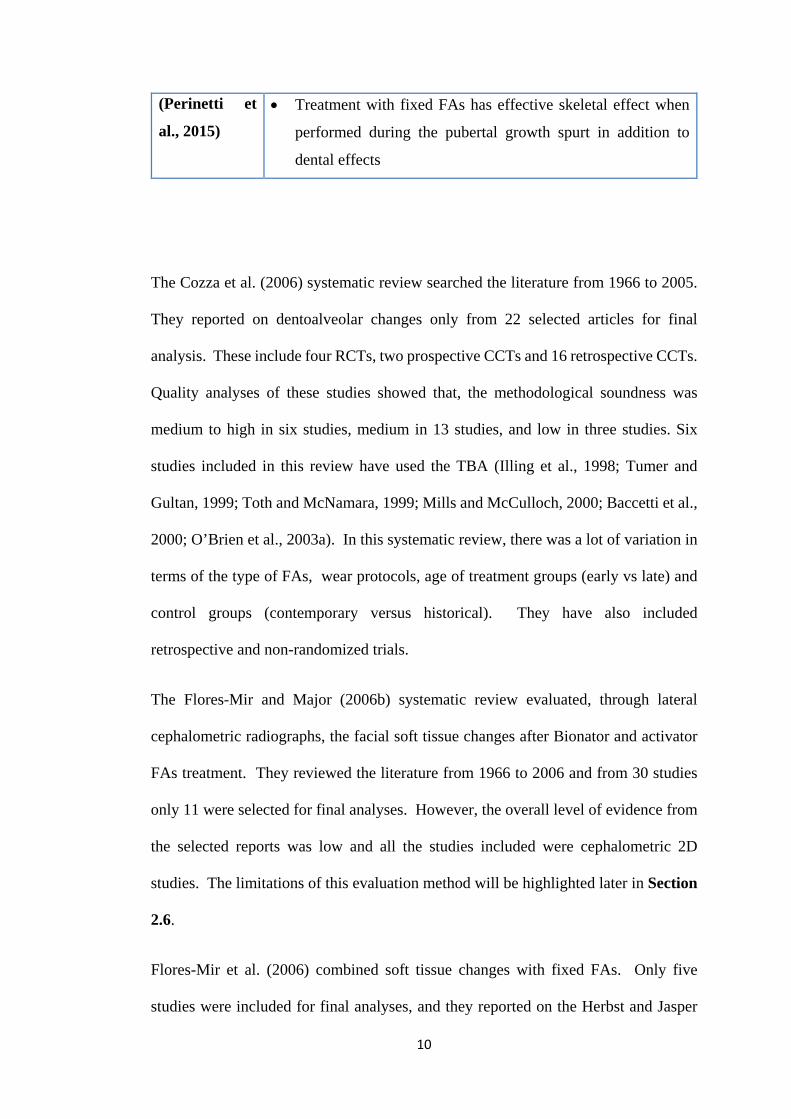
10
(Perinetti et
al., 2015)
• Treatment with fixed FAs has effective skeletal effect when
performed during the pubertal growth spurt in addition to
dental effects
The Cozza et al. (2006) systematic review searched the literature from 1966 to 2005.
They reported on dentoalveolar changes only from 22 selected articles for final
analysis. These include four RCTs, two prospective CCTs and 16 retrospective CCTs.
Quality analyses of these studies showed that, the methodological soundness was
medium to high in six studies, medium in 13 studies, and low in three studies. Six
studies included in this review have used the TBA (Illing et al., 1998; Tumer and
Gultan, 1999; Toth and McNamara, 1999; Mills and McCulloch, 2000; Baccetti et al.,
2000; O’Brien et al., 2003a). In this systematic review, there was a lot of variation in
terms of the type of FAs, wear protocols, age of treatment groups (early vs late) and
control groups (contemporary versus historical). They have also included
retrospective and non-randomized trials.
The Flores-Mir and Major (2006b) systematic review evaluated, through lateral
cephalometric radiographs, the facial soft tissue changes after Bionator and activator
FAs treatment. They reviewed the literature from 1966 to 2006 and from 30 studies
only 11 were selected for final analyses. However, the overall level of evidence from
the selected reports was low and all the studies included were cephalometric 2D
studies. The limitations of this evaluation method will be highlighted later in Section
2.6.
Flores-Mir et al. (2006) combined soft tissue changes with fixed FAs. Only five
studies were included for final analyses, and they reported on the Herbst and Jasper
11
jumper appliances. The level of evidence for the included studies was low; therefore,
the conclusions of this systematic review should be interpreted with caution. The
authors also highlighted the need of 3D studies to quantify soft tissue changes to
overcome the limited understanding in this field.
The systematic review and meta-analyses by Marsico et al. (2011) reviewed the
literature to September 2009. They reported on dentoskeletal changes only and
selected four RCTs for final analyses. This was based on the Cochrane guidelines for
assessing the quality of trials included. All RCTs reported on the anatomic condylion
with only one RCT reported on the TBA (O’Brien et al., 2003a); three reported on the
Activator, Harvold, Frankel and the Bionator appliances. They excluded studies
reported on articulare or studies that considered angular measurements because they
do not evaluate effective mandibular growth. They also identified the great variability
between the studies in terms of measuring outcomes, type of cephalometric analysis
and reference points.
The meta-analysis by Koretsi et al. (2014) appraised the literature up to October 2013
and included 17 studies for final analyses, seven RCTs and 10 prospective CCTs. As
only trials that reported on cephalometric angular measurements were included,
several good quality trials were excluded. Interestingly, of the seven included RCTs,
five were judged as being of high risk of bias, one was considered as being unclear
and one at low risk of bias.
The most recent systematic review and meta-analysis by Perinetti et al. (2015)
evaluated the action of fixed FAs only. This included 12 controlled studies
(prospective and retrospective), eight of which were on pubertal patients and four were
on post-pubertal patients. Only one study was of high quality, six of medium, and four
12
of medium to high quality. This was the first review to use the growth phase as the
main selection criterion, which allowed a direct comparison between pubertal and
post-pubertal patients. This review had the following limitations: inclusion of
retrospective studies, inclusion of studies with an historical control sample, difference
in fixed FA treatment lengths, difference in cephalometric magnification between the
studies and pooling of slightly different parameters expressing the mandibular length.
Although there is plenty of high quality evidence regarding the topic of FA treatment
of Class II malocclusion, the methodology of the RCTs conducted is far from perfect;
hence the conclusions of these RCTs and the systematic reviews based on them should
be dealt with critically. These possible flaws were highlighted in a personal view point
article by Meikle (2005) and these are:
• It is not clear what is being measured, as so many variables among and in between
these RCTs are present, such as: compliance, magnitude and timing of growth,
the skill of the clinician and the appliance ability in altering the pattern of
maxillary and/or mandibular growth.
• The validity of mandibular growth measurements in the reported RCTs is
questionable since it was undertaken on lateral head films. Cephalometric
measurements and analysis techniques are always associated with a variety of
errors; in addition they do not take into consideration the condylar growth and
growth rotations described by Bjork. For example, the Pancherz analysis used in
several RCTs tends to underestimate mandibular growth as a result of treatment.
• There is a well-documented variability and unpredictability in the pattern of
dentofacial growth between individuals. Focusing on the mean and average
values in RCTs tends to obscure the variability of an individual response which
is very important in real clinical practice. That is why many orthodontists are
13
sceptical about the RCTs findings as in many cases they do not reflect their
clinical experience.
2.4 The TBA
This project assessed the TBA in a prospective clinical trial. Therefore, this part of
the literature review will discuss the TBA in more detail in terms of history, mode of
action, different designs and bite registration techniques.
2.4.1 Background
The TBA was first introduced by Dr William Clark. It was developed from the
Pierre Robin mono-block and the double plate of Schwarz (Clark, 1982). It consists
of upper and lower bite blocks interlocking causing a functional mandibular
posturing. Although it is mainly used to correct Class II division 1 malocclusion, a
reversed TBA design may be used for treatment of Class III malocclusion (Clark,
1982).
In the UK, a survey conducted by Chadwick et al. (1998), showed that the TBA is the
most commonly used appliance to treat Class II division 1 malocclusion in growing
patients. Significant improvement in the patient’s face was noticed when the appliance
was worn full time (Clark, 1988). Its unique design allowed full time wear including
eating, leading to it being regarded as the most ‘patient friendly’ of all the functional
appliances (Clark, 2010).
Another reason for the popularity of the TBA is the available evidence showing that
the TBA is more effective in modifying dentofacial growth and overjet reduction than
14
headgear and other passive FAs such as the Andresen activator and its variants
(Meikle, 2005). The treatment success rate with the TBA has been reported to be high;
100% (Toth and McNamara, 1999; Mills and McCulloch, 2000), 93% (Chintakanon
et al., 2000), 80-90% (Illing et al., 1998; Harradine and Gale, 2000; Banks et al.,
2004a) and 66% (O’Brien et al., 2003b).
2.4.2 Mode of action
A clinical study by Chintakanon et al. (2000) investigated the function of protrusive
muscles, using a non-invasive approach, to test whether these muscles were
responsible for mandibular repositioning after treatment with the TBA. Their findings
did not support the lateral pterygoid hypothesis mentioned previously. There was also
no evidence to support the increased mandibular protrusive function after treatment
with the TBA, which was in agreement with the findings of Yamin-Lacouture et al.
(1997).
In general, the TBA corrects Class II division 1 malocclusion by means of
dentoskeletal and soft tissues changes. Those effects were reported in several studies
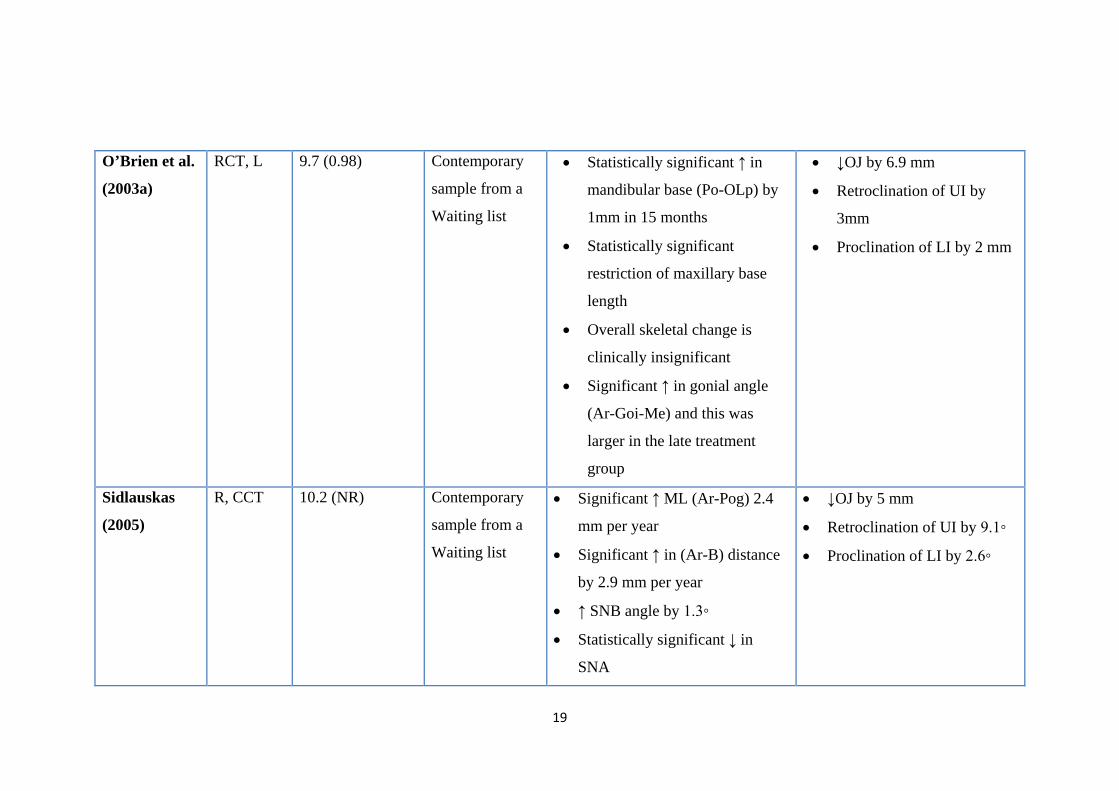
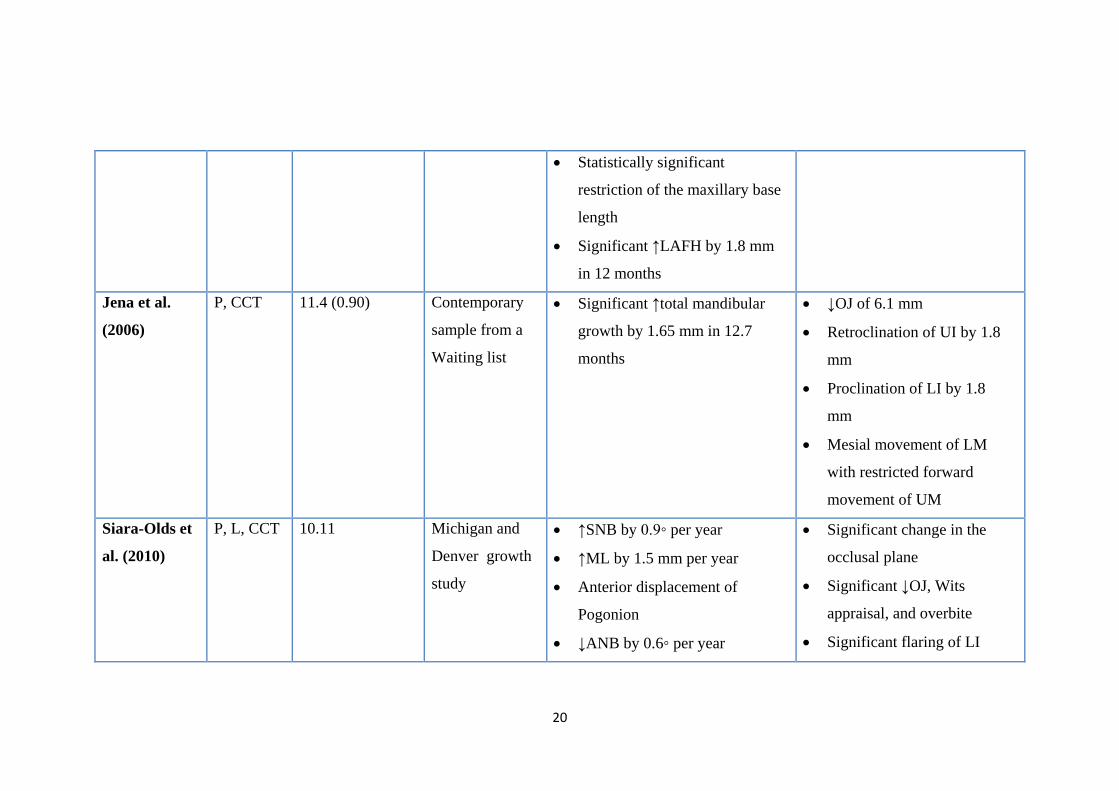
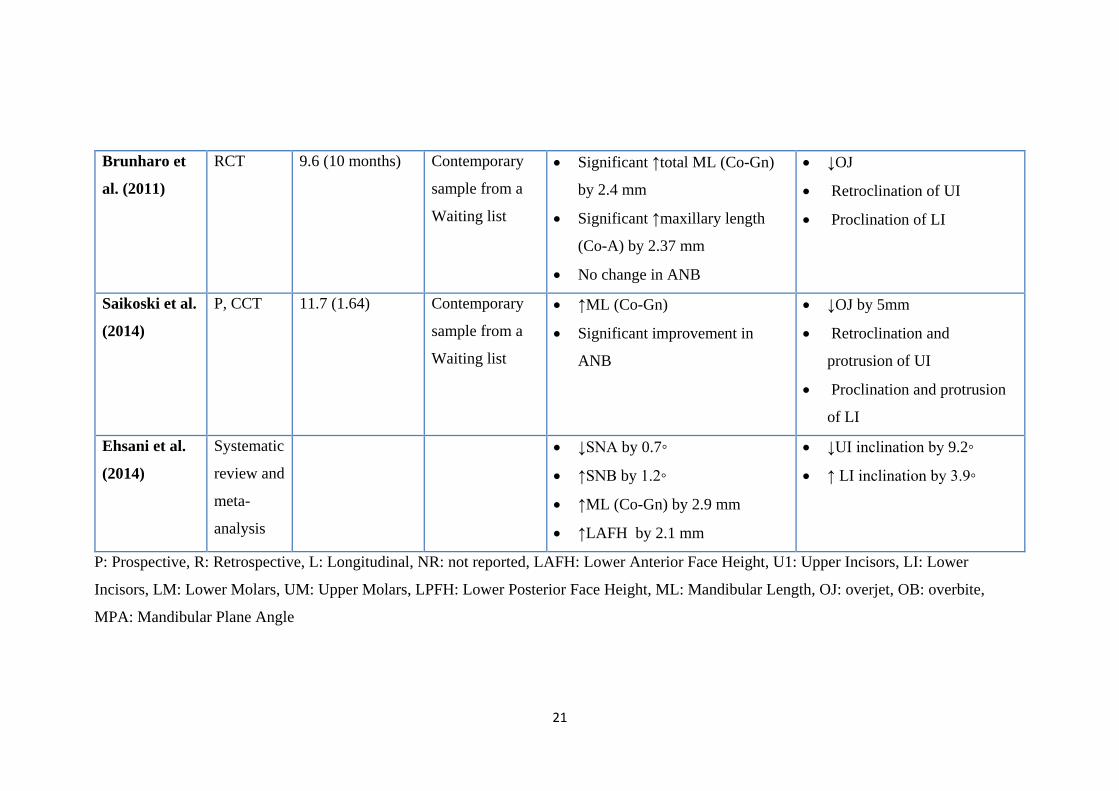
which are summarized in Tables 3 and 4.
Although the studies given in Tables 3 and 4 are ranked high on the hierarchy of
evidence, there are several limitations in their design:
• A wide variation in the methodology, study design and reporting on the same
topic (type of appliances, designs, wear protocols, duration of treatment, defining
successful outcomes, cephalometric analysis and landmarking)
• The retrospective nature of many
15
• The concentration on 2D cephalometric outcomes
• The inclusion of very young (early) treatment groups
• The use of historical control samples in some studies for ethical reasons
• Lack of consensus on what is considered a clinically significant change.
The meta-analysis by Ehsani et al. (2014) was the only systematic review published to
evaluate dentoskeletal effects of the TBA exclusively. In this review only 4 skeletal
variables (SNA, SNB, Co-Gn and LAFH) and 2 dental variables (UI-ANSPNS and Li-
GoGn) presented data that could be combined in a meta-analysis and all the reported
effects were in the short- term. The authors could not report on soft tissue changes
because the data were not adequate to be combined in a meta-analysis.

16
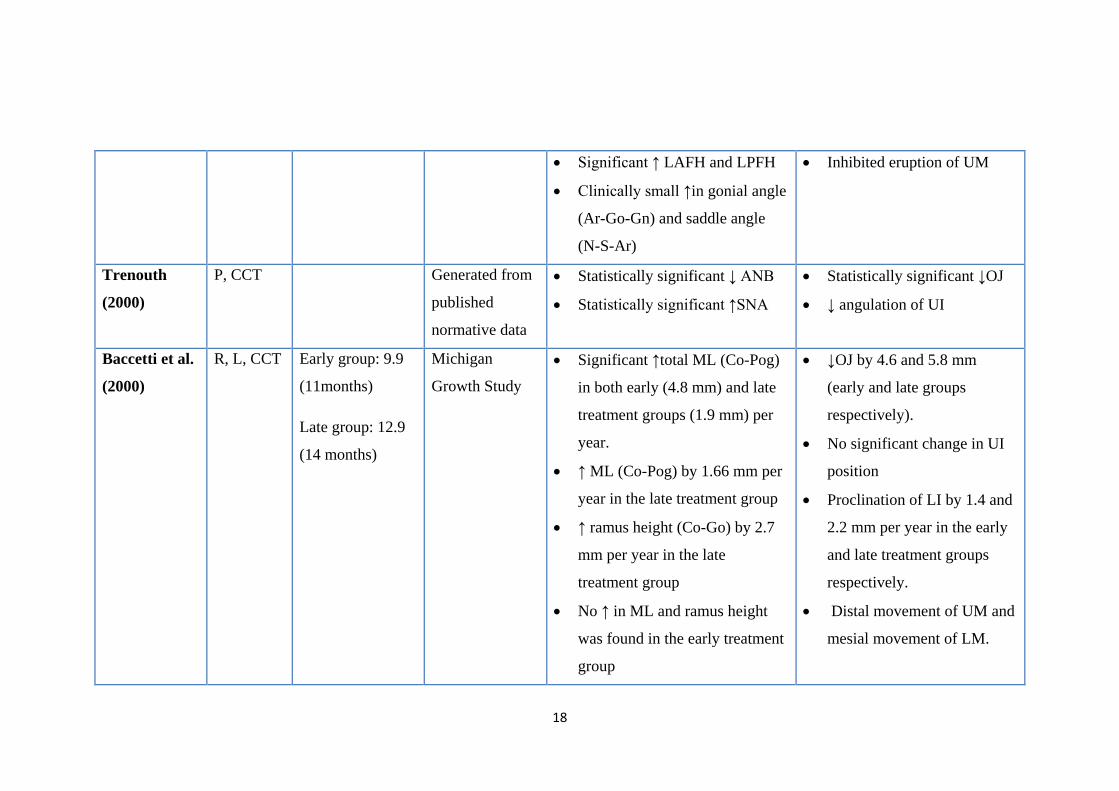
Table 3
The controlled studies and systematic reviews published on skeletal and dental effects of the TBA
Authors &
year
Study
design
Mean age at
start of
treatment (SD)
Control (All
matched for
age and sex)
Skeletal effects Dental effects
Illing et al.
(1998)
P, L, CCT 11.5 (1.5) Contemporary
sample from a
waiting list
• Significant ↑in ML (Ar-Gn) by
2.2 mm in 9 months
• ↑ SNB by 1◦
• Forward movement in Pogonion
• Significant ↑in LAFH by 3 mm
in 9 months
• ↓OJ by 6.4 mm
• Retroclination of UI by 7.2◦
• Proclination of LI by 3 mm
relative to A-Pog line
Lund and
Sandler
(1998)
P, CCT 12.4 (NR) Contemporary
sample from a
waiting list
• Significant ↑in ML (Ar-Pog) by
2.3 mm per year
• ↑ SNB angle by 1.5◦
• ↑in the LAFH by 1.5 mm
• ↓in the OJ of 7.5 mm
• Retroclination of UI by 10.8◦
• Prolination of LI by 7.9◦
• Mesial movement in LM
• No distal movement in UM
• Slight extrusion of UM
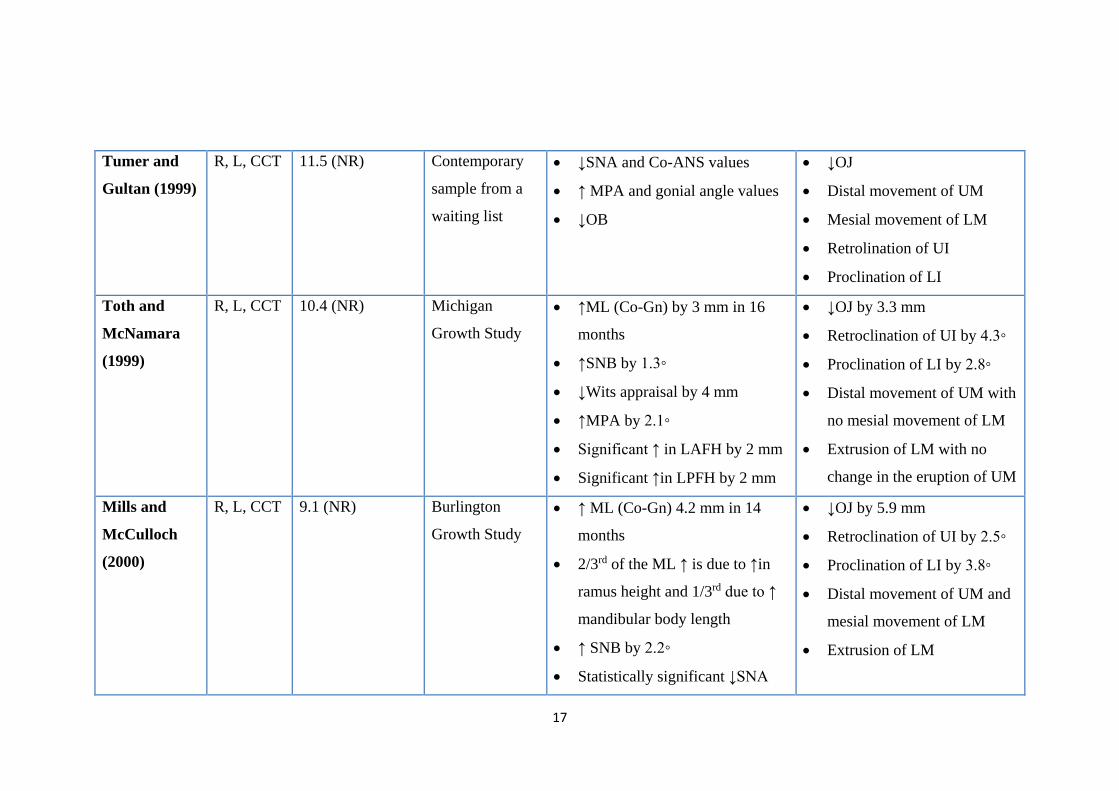
17
Tumer and
Gultan (1999)
R, L, CCT 11.5 (NR) Contemporary
sample from a
waiting list
• ↓SNA and Co-ANS values
• ↑ MPA and gonial angle values
• ↓OB
• ↓OJ
• Distal movement of UM
• Mesial movement of LM
• Retrolination of UI
• Proclination of LI
Toth and
McNamara
(1999)
R, L, CCT 10.4 (NR) Michigan
Growth Study
• ↑ML (Co-Gn) by 3 mm in 16
months
• ↑SNB by 1.3◦
• ↓Wits appraisal by 4 mm
• ↑MPA by 2.1◦
• Significant ↑ in LAFH by 2 mm
• Significant ↑in LPFH by 2 mm
• ↓OJ by 3.3 mm
• Retroclination of UI by 4.3◦
• Proclination of LI by 2.8◦
• Distal movement of UM with
no mesial movement of LM
• Extrusion of LM with no
change in the eruption of UM
Mills and
McCulloch
(2000)
R, L, CCT 9.1 (NR) Burlington
Growth Study
• ↑ ML (Co-Gn) 4.2 mm in 14
months
• 2/3rd of the ML ↑ is due to ↑in
ramus height and 1/3rd due to ↑
mandibular body length
• ↑ SNB by 2.2◦
• Statistically significant ↓SNA
• ↓OJ by 5.9 mm
• Retroclination of UI by 2.5◦
• Proclination of LI by 3.8◦
• Distal movement of UM and
mesial movement of LM
• Extrusion of LM
18
• Significant ↑ LAFH and LPFH
• Clinically small ↑in gonial angle
(Ar-Go-Gn) and saddle angle
(N-S-Ar)
• Inhibited eruption of UM
Trenouth
(2000)
P, CCT Generated from
published
normative data
• Statistically significant ↓ ANB
• Statistically significant ↑SNA
• Statistically significant ↓OJ
• ↓ angulation of UI
Baccetti et al.
(2000)
R, L, CCT Early group: 9.9
(11months)
Late group: 12.9
(14 months)
Michigan
Growth Study
• Significant ↑total ML (Co-Pog)
in both early (4.8 mm) and late
treatment groups (1.9 mm) per
year.
• ↑ ML (Co-Pog) by 1.66 mm per
year in the late treatment group
• ↑ ramus height (Co-Go) by 2.7
mm per year in the late
treatment group
• No ↑ in ML and ramus height
was found in the early treatment
group
• ↓OJ by 4.6 and 5.8 mm
(early and late groups
respectively).
• No significant change in UI
position
• Proclination of LI by 1.4 and
2.2 mm per year in the early
and late treatment groups
respectively.
• Distal movement of UM and
mesial movement of LM.
19
O’Brien et al.
(2003a)
RCT, L 9.7 (0.98) Contemporary
sample from a
Waiting list
• Statistically significant ↑ in
mandibular base (Po-OLp) by
1mm in 15 months
• Statistically significant
restriction of maxillary base
length
• Overall skeletal change is
clinically insignificant
• Significant ↑ in gonial angle
(Ar-Goi-Me) and this was
larger in the late treatment
group
• ↓OJ by 6.9 mm
• Retroclination of UI by
3mm
• Proclination of LI by 2 mm
Sidlauskas
(2005)
R, CCT 10.2 (NR) Contemporary
sample from a
Waiting list
• Significant ↑ ML (Ar-Pog) 2.4
mm per year
• Significant ↑ in (Ar-B) distance
by 2.9 mm per year
• ↑ SNB angle by 1.3◦
• Statistically significant ↓ in
SNA
• ↓OJ by 5 mm
• Retroclination of UI by 9.1◦
• Proclination of LI by 2.6◦
20
• Statistically significant
restriction of the maxillary base
length
• Significant ↑LAFH by 1.8 mm
in 12 months
Jena et al.
(2006)
P, CCT 11.4 (0.90) Contemporary
sample from a
Waiting list
• Significant ↑total mandibular
growth by 1.65 mm in 12.7
months
• ↓OJ of 6.1 mm
• Retroclination of UI by 1.8
mm
• Proclination of LI by 1.8
mm
• Mesial movement of LM
with restricted forward
movement of UM
Siara-Olds et
al. (2010)
P, L, CCT 10.11 Michigan and
Denver growth
study
• ↑SNB by 0.9◦ per year
• ↑ML by 1.5 mm per year
• Anterior displacement of
Pogonion
• ↓ANB by 0.6◦ per year
• Significant change in the
occlusal plane
• Significant ↓OJ, Wits
appraisal, and overbite
• Significant flaring of LI
21
Brunharo et
al. (2011)
RCT 9.6 (10 months) Contemporary
sample from a
Waiting list
• Significant ↑total ML (Co-Gn)
by 2.4 mm
• Significant ↑maxillary length
(Co-A) by 2.37 mm
• No change in ANB
• ↓OJ
• Retroclination of UI
• Proclination of LI
Saikoski et al.
(2014)
P, CCT 11.7 (1.64) Contemporary
sample from a
Waiting list
• ↑ML (Co-Gn)
• Significant improvement in
ANB
• ↓OJ by 5mm
• Retroclination and
protrusion of UI
• Proclination and protrusion
of LI
Ehsani et al.
(2014)
Systematic
review and
meta-
analysis
• ↓SNA by 0.7◦
• ↑SNB by 1.2◦
• ↑ML (Co-Gn) by 2.9 mm
• ↑LAFH by 2.1 mm
• ↓UI inclination by 9.2◦
• ↑ LI inclination by 3.9◦
P: Prospective, R: Retrospective, L: Longitudinal, NR: not reported, LAFH: Lower Anterior Face Height, U1: Upper Incisors, LI: Lower
Incisors, LM: Lower Molars, UM: Upper Molars, LPFH: Lower Posterior Face Height, ML: Mandibular Length, OJ: overjet, OB: overbite,
MPA: Mandibular Plane Angle
22
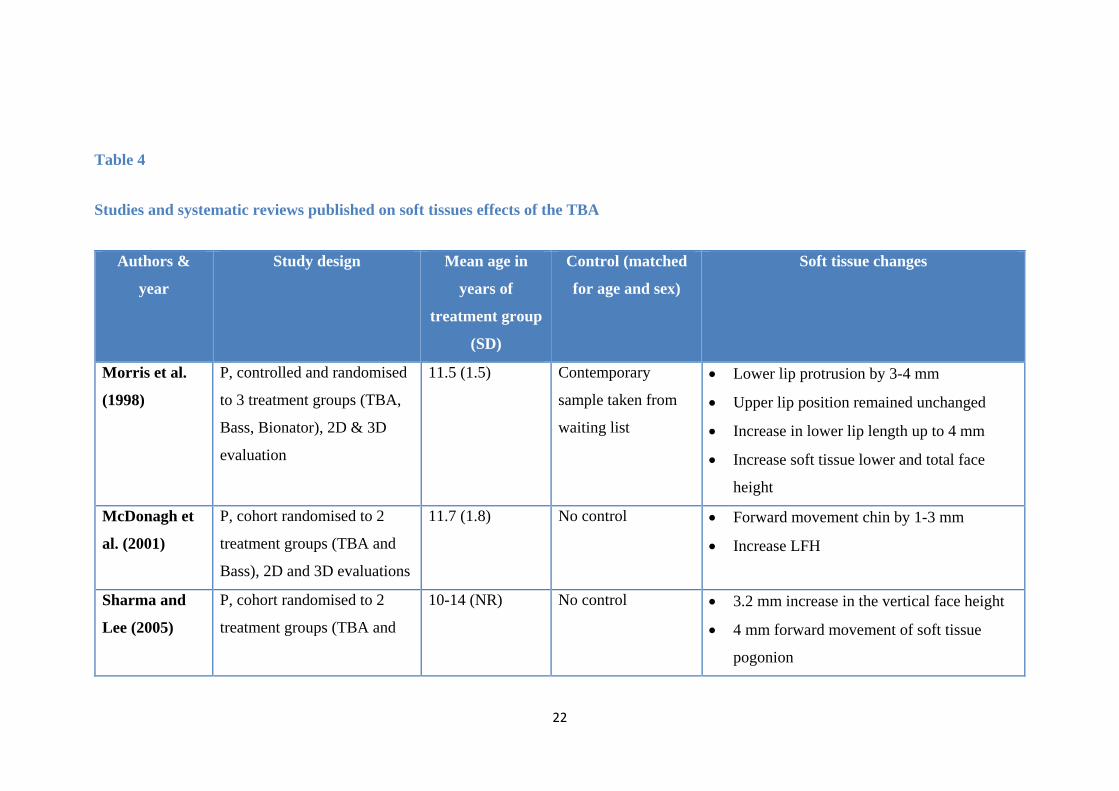
Table 4
Studies and systematic reviews published on soft tissues effects of the TBA
Authors &
year
Study design Mean age in
years of
treatment group
(SD)
Control (matched
for age and sex)
Soft tissue changes
Morris et al.
(1998)
P, controlled and randomised
to 3 treatment groups (TBA,
Bass, Bionator), 2D & 3D
evaluation
11.5 (1.5) Contemporary
sample taken from
waiting list
• Lower lip protrusion by 3-4 mm
• Upper lip position remained unchanged
• Increase in lower lip length up to 4 mm
• Increase soft tissue lower and total face
height
McDonagh et
al. (2001)
P, cohort randomised to 2
treatment groups (TBA and
Bass), 2D and 3D evaluations
11.7 (1.8) No control • Forward movement chin by 1-3 mm
• Increase LFH
Sharma and
Lee (2005)
P, cohort randomised to 2
treatment groups (TBA and
10-14 (NR) No control • 3.2 mm increase in the vertical face height
• 4 mm forward movement of soft tissue
pogonion
23
mini-TBA), 2D and 3D
evaluations
Luo and Fang
(2005)
P, CCT, 3D evaluation 11-12 (NR) Contemporary
sample taken from
waiting list
• No significant change in facial angle
• No significant change in nose position
• No significant change in lower lip
• No significant change in soft tissue menton
• More retruded position of labrale superius
relative to aesthetic line (-1.9 mm)
Flores-Mir
and Major
(2006a)
Systematic review anges in facial angle, nose, lower lip and soft
ue menton are not of clinically significant and
evaluation studies are highly recommended
Quintão et al.
(2006)
P, CCT, 2D evaluation 9.5 (0.8) Contemporary
sample taken from
waiting list
• Significant upper lip retraction
• Anterior displacement of soft tissue
pogonion
• Flattening of the facial profile
Lee et al.
(2007)
P, Randomised to 2 treatment
groups, 2D and 3D
evaluations
10-14 No control • 4 mm increase in the LFH
• 3-4 mm forward movement of soft tissue
pogonion
24
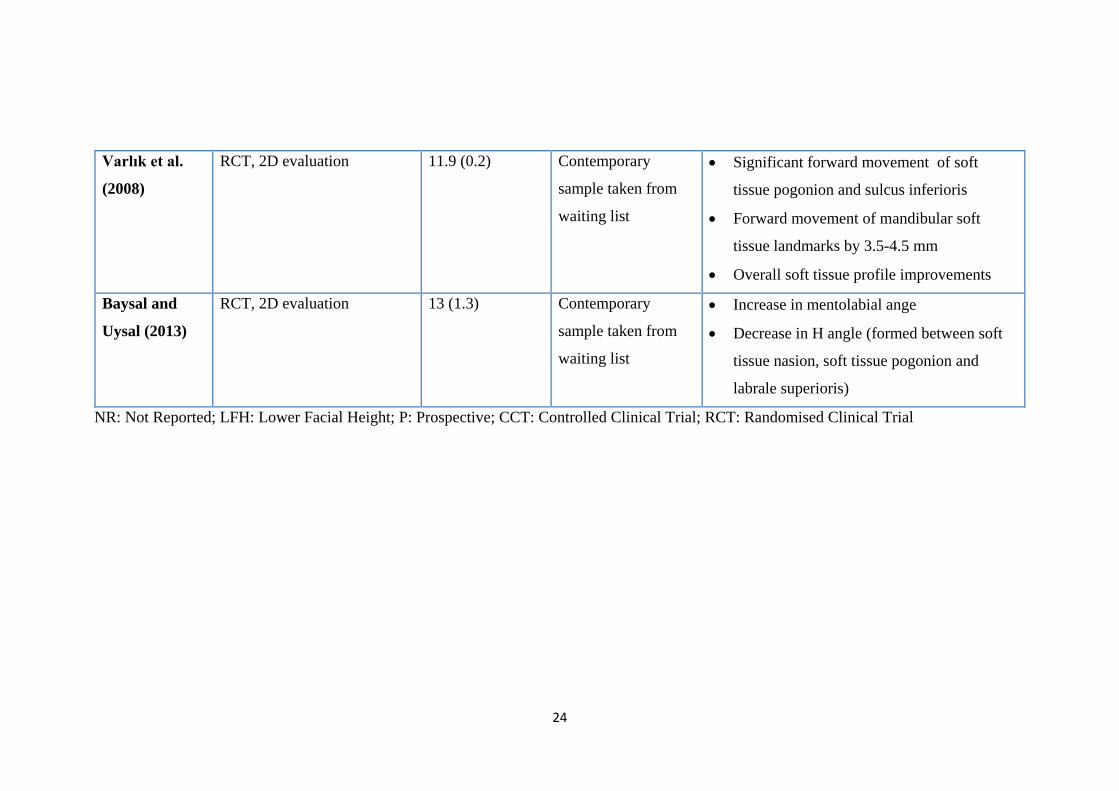
Varlık et al.
(2008)
RCT, 2D evaluation 11.9 (0.2) Contemporary
sample taken from
waiting list
• Significant forward movement of soft
tissue pogonion and sulcus inferioris
• Forward movement of mandibular soft
tissue landmarks by 3.5-4.5 mm
• Overall soft tissue profile improvements
Baysal and
Uysal (2013)
RCT, 2D evaluation 13 (1.3) Contemporary
sample taken from
waiting list
• Increase in mentolabial ange
• Decrease in H angle (formed between soft
tissue nasion, soft tissue pogonion and
labrale superioris)
NR: Not Reported; LFH: Lower Facial Height; P: Prospective; CCT: Controlled Clinical Trial; RCT: Randomised Clinical Trial
25
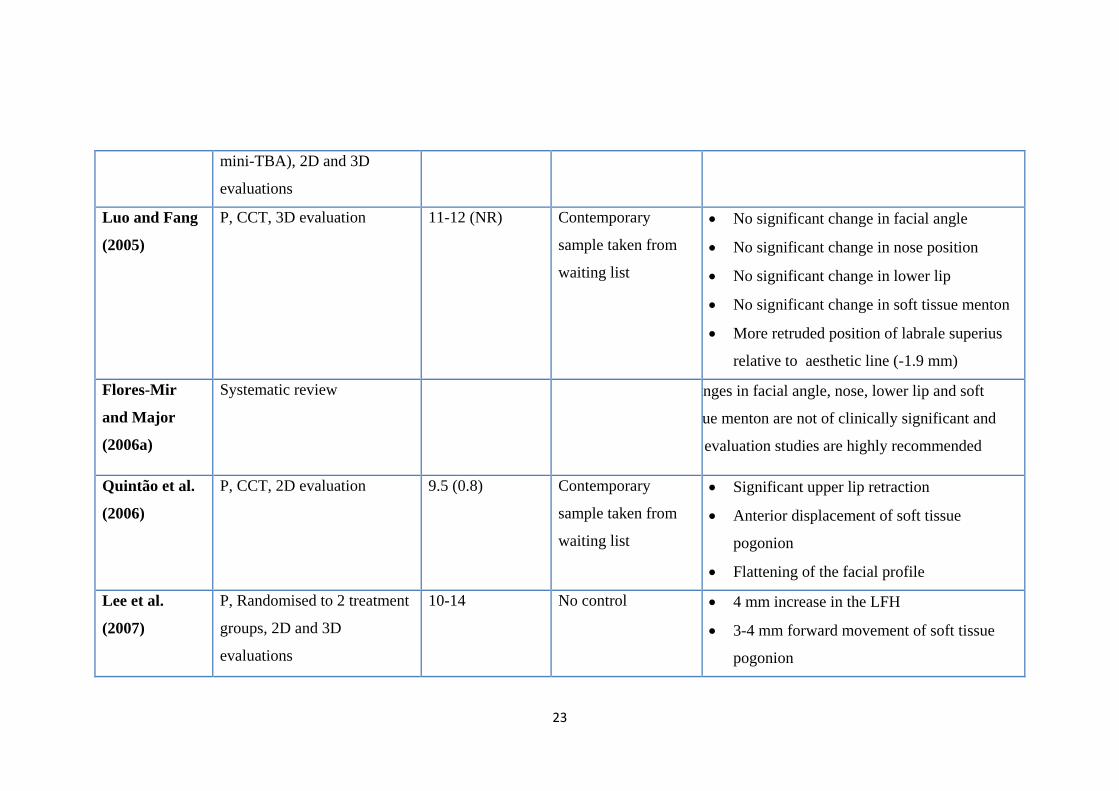
The systematic review by Flores-Mir and Major (2006a) only included studies with
control groups in their final analysis (Morris et al., 1998; Luo and Fang, 2005).
Although the two studies which were not included (Singh, 2002; Singh and Clark,
2003) found significant soft tissue profile improvements after TBA treatment, their
findings should be interpreted with caution; the lack of a control will overestimate the
TBA treatment effects as no distinction can be drawn between the TBA effects and
normal growth changes. Subsequent controlled studies published on the same topic
after this systematic review all showed significant improvement in soft tissue profile
after TBA treatment (Quintão et al., 2006; Varlık et al., 2008; Baysal and Uysal, 2013),
but they had the following short-comings:
• The sample in the Quintão et al. (2006) study had both treatment and control
groups in their pre-pubertal growth period
• The treatment group and control group in the Varlık et al. (2008) study were not
matched for age, and the post-treatment observation period was short
• The study of Baysal and Uysal (2013) had overcome the short-comings of the
two previous studies by having both treatment and control groups around the
pubertal growth period, but the post-treatment observation period was still short.
From the previous discussion, it can be concluded that the dentoskeletal mode of action
of TBA is well established in the literature. However, the evidence is still fluctuating
between supporting and rejecting the clinical significance of any soft tissue changes
with the TBA (Table 4).
26
2.4.3 Designs of the TBA for Class II division 1 treatment
The original TBA described by Clark (1982) had a slightly different design than the
one commonly used nowadays. The upper appliance had two 0.7 mm Adams’ clasps,
each one usually spanning two buccal teeth. These Adams’ clasps incorporated a
spring coil tube to apply extra-oral traction. The upper block also incorporated a
midline expansion device and a labial bow extending from the mesial of the upper first
permanent molars. A lingual bow occasionally was incorporated to the upper block
design when controlling upper incisor angulation, as required. In the mixed dentition,
Clark (1982) suggested to use 0.7 mm ‘C’ clasps on the lateral incisors in addition to
the Adams’ claps on the first permanent molars.
In the lower appliance, depending on what teeth had erupted, Clark (1982) suggested
interdental clasps spanning two teeth at the incisor and premolar region. A reversed
U-loop was used lingual to the lower incisors to allow inter-maxillary traction. A
Concorde face-bow was fitted to the coil spring tube on the upper appliance. This tube
has a midline labial hook of 1.5 mm wire for application of inter-maxillary traction.
The articulation between the upper and lower appliance was achieved by inter-locking
of the bite blocks at a 45 degree angle; later this was changed to 70 degrees to maintain
a better postured position. The inter-occlusal separation in the premolar region was 4-
6 mm (Clark, 1982; Clark, 2010).
The TBA was subjected to various design modifications in order to minimise the
dentoalveolar effects and enhance skeletal changes. The modifications described are
as follow:
27
• TBA without a labial bow: although the labial bow was incorporated in the TBA
original design by Clark, later he suggested that the labial bow should not be used
because the retroclination of the maxillary incisors reduced the potential skeletal
changes (Clark and Baker, 1995). A recent randomised controlled clinical trial
compared two designs of TBA with and without a labial bow. This showed that
the labial bow has no influence on skeletal or dentoalveolar changes or on the
amount and rate of overjet reduction (Yaqoob et al., 2012). Therefore, many
clinicians have omitted this component from the contemporary TBA design.
• TBA with Southend clasps: Trenouth (1989) introduced the concept of
incorporating two Southend clasps, one on the upper incisors and one on the
lower incisors. Subsequently, Trenouth omitted the maxillary labial bow and in
a RCT he compared two designs of the TBA with or without Southend clasps
(Trenouth and Desmond, 2012). The findings showed more skeletal correction
and less tipping of the teeth when Southend clasps were used on the maxillary
and mandibular incisors.
• TBA with upper incisor torqueing spurs: Harradine and Gale (2000) compared
two designs of the TBA, one with an upper labial bow and one with upper incisor
torqueing spurs; they concluded that using torqueing spurs substantially reduced
upper incisor retroclination and extrusion with slightly more favourable lower
jaw growth.
• TBA in conjunction with headgear traction: Parkin et al. (2001) have found
that headgear addition has effectively controlled the maxillary growth in the
vertical and sagittal dimensions and resulted in more skeletal Class II correction.
• Mini TBA: In order to avoid some of the undesirable effects of the TBA such as
lower incisor proclination, increase in facial height and limited mandibular
28
growth, a modified version of the TBA, named the ‘’mini-block’’ appliance, was
developed by Gill and Lee (2005). This appliance used a posterior bite block of
reduced vertical height, included the option of incremental advancement of the
mandible and incorporated upper incisors torqueing springs. However, a
prospective clinical trial has shown that progressive mandibular advancement
was not associated with greater mandibular skeletal change (Gill and Lee, 2005).
• TBA combined with fixed appliances: As part of the evolution of the functional
orthopaedic appliances, Clark (2011) developed a protocol to integrate functional
appliance therapy with the fixed appliance at any stage of treatment by bonding
pre-formed blocks directly to the teeth. This approach should eliminate any
problem of patient compliance.
• TBA modified for Class II division 2 malocclusion: in two case reports, Dyer
et al. (2001) introduced a modification of the TBA for Class II division 2
malocclusion cases. Two designs were described; with anterior screw section or
with anterior double cantilever spring, to provide active labial segment
proclination, which eliminated the need of pre-functional phase of treatment.
2.4.4 Techniques for bite registration
Taking a PWB for the TBA fabrication is of great importance, as it will directly affect
the effectiveness and the accuracy of the appliance (Shah and Sandler, 2009). In this
section various bite registration techniques will be reviewed.
Clark (1988) suggested that the amount of posture depends on the ease with which the
patient can posture forward. This usually should reduce the overjet by 5-7 mm on the
initial activation with 3-5 mm inter-occlusal clearance at the premolar region. Bite
registration should also address any midline discrepancy caused by functional
29
displacement. More recently, Clark (2010) advocated the use of the “Projet Bite”
gauge to an edge-to-edge incisal position. Depending on how deep the bite is; two
“Projet Bite” options are available. For deep bite cases, the blue “Projet Bite” with 2
mm incisal clearance and 5-6 mm clearance in the pre-molar area is advised, whereas
in cases with reduced overbite, the white project bite with 4 mm incisal-clearance and
5 mm clearance at the premolar region should be used. Keeping the incisal clearance
to a maximum of 5 mm is very important for patient comfort and good compliance.
Thin blocks, which lead to minimal incisal and premolar clearance, are also incorrect
as these allow the patient to retract the mandible to its rest position and result in
reducing the efficiency of the appliance.
Shah and Sandler (2009) have stated that the ideal wax bite should provide at least 7-
8 mm clearance in the premolar region, as this will encourage the patient to bite in the
desired postured position. However, in Clark’s opinion this will be uncomfortable for
the patient and compliance might be affected (Clark, 2010).
Some clinicians have advocated the concept of activating the bite in small stages rather
than taking the bite to the incisal edge-to-edge position in a single activation. Reasons
given to justify this include: improved compliance with less tension applied on the
muscles, improved speaking, improved patient general comfort and maintenance of
the appliance in a correct position during sleeping. Banks et al. (2004b) disproved
previous claims when they investigated the effect of incremental versus maximum bite
advancement on treatment effectiveness using the TBA and found no difference
between either.
30
2.5 The prediction of treatment outcome with FAs
One of the aims of this project is to quantify the volumetric facial profile changes
produced by the PWB, to assess its ability to estimate the TBA treatment outcome on
soft tissue profile. Several previous studies attempted to predict the outcome of growth
modification with FAs. This section will highlight this topic in more detail, starting
off with FAs in general and then in relation to the TBA, specifically.
In total, seven FAs studies and five TBA studies have tried to predict treatment
outcome. All used dental and skeletal landmarks to assist in predicting treatment
outcomes. Following an extensive literature review on the topic, one study was found
on Obstructive Sleep Apnoea (OSA) (Vanderveken et al., 2011) which aimed to
predict treatment outcome by using a wax bite taken in the maximal protruded position
of the mandible. This used a special registration fork, similar to the wax bite taken
during bite registration for the TBA. The wax bite was inserted again in the patient’s
mouth during the ‘’drug induced sleep endoscopy procedure’’ to allow the
investigation of the upper airway collapse at least for 5 consecutive minutes; images
and a video were then recorded. If the upper airway collapse was completely resolved
using the bite simulation approach, the patient was considered to be suitable for
mandibular repositioning appliance treatment. This method was found to be very
reliable and reproducible in predicting the outcome of OSA.
2.5.1 Studies of FAs
Patient compliance (Bishara and Ziaja, 1989) and the presence of active growth (Hagg
and Taranger, 1982; McNamara Jr et al., 1982) have been the most commonly reported
factors to predict treatment outcome with FAs. However, clinical experience showed
31
that even when compliance and growth were not an issue, there was a wide individual
variation when treating similar malocclusions in terms of treatment success (Vargervik
and Harvold, 1985). Ultimately this was explained by the possible differences in
certain morphological features between patients (Bondevik, 1991).
All studies of FAs, to identify morphological features that could affect and predict
treatment success, were 2D cephalometric and they are summarized in Table 5. There
was a considerable amount of variation in the methodology among all these studies
and, therefore, Barton and Cook (1997) have highlighted the need for further
investigations.
Ahn et al. (2001) aimed to predict successful treatment outcome of the Bionator
appliance. This was the only FA study to look at soft tissue predictor landmarks. Their
sample comprised of 40 patients divided equally into two groups; ‘good treatment
result’ and ‘poor treatment result’ based on Angle Class I molar relationship, overbite,
overjet, the relation of the lips to Rickett’s aesthetic line and the mount of relapse 2 to
5 years after treatment.
32
Table 5
Studies that assessed the prediction of outcome of FAs other than the TBA
Authors & year Appliance used Conclusions
Parkhouse (1969) Andresen Improvements in SNB are doubled when ANB is initially large (mean of 7.81)
Tulley (1972) Activator Presence of AOB will lead to unsuccessful outcome
Ahlgren and Laurin (1976) Activator Treatment outcome cannot be predicted from skeletal features
Pancherz (1979) Activator Presence of AOB will lead to unsuccessful outcome regardless the value of MMPA
Charron (1989) Activator Successful treatment was related to increased initial OB and mandibular ramus length
Barton and Cook (1997)
(Review)
Different FAs Best outcome when OJ of up to 11 mm, increased OB, active growth and good
compliance
Ahn et al. (2001) Bionator Good outcome was related to normal ANB, retrusive LI and retrusive lower lip
AOB: Anterior Open Bite, LI: lower Incisors, OB: overbite, OJ: overjet
33
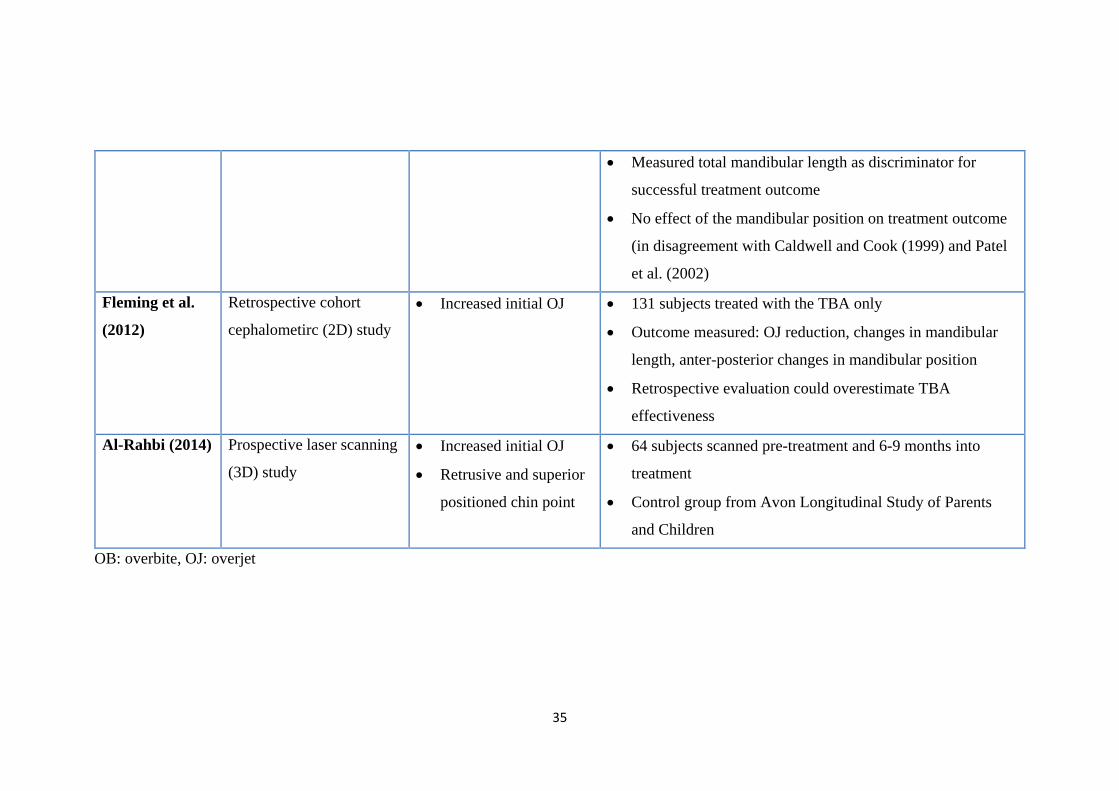
2.5.2 Studies of TBA
All studies that have reported on prediction of treatment outcome with the TBA were
based on cephalometric 2D evaluation except for one (Al-Rahbi, 2014) which was
based on 3D laser scanning. Only two TBA studies looked at soft tissue predictor
landmarks (Patel et al., 2002; Al-Rahbi, 2014); the others assessed dentoskeletal
variables only. The findings of all these studies are summarized in Table 6 with a
brief commentary on each one of them.
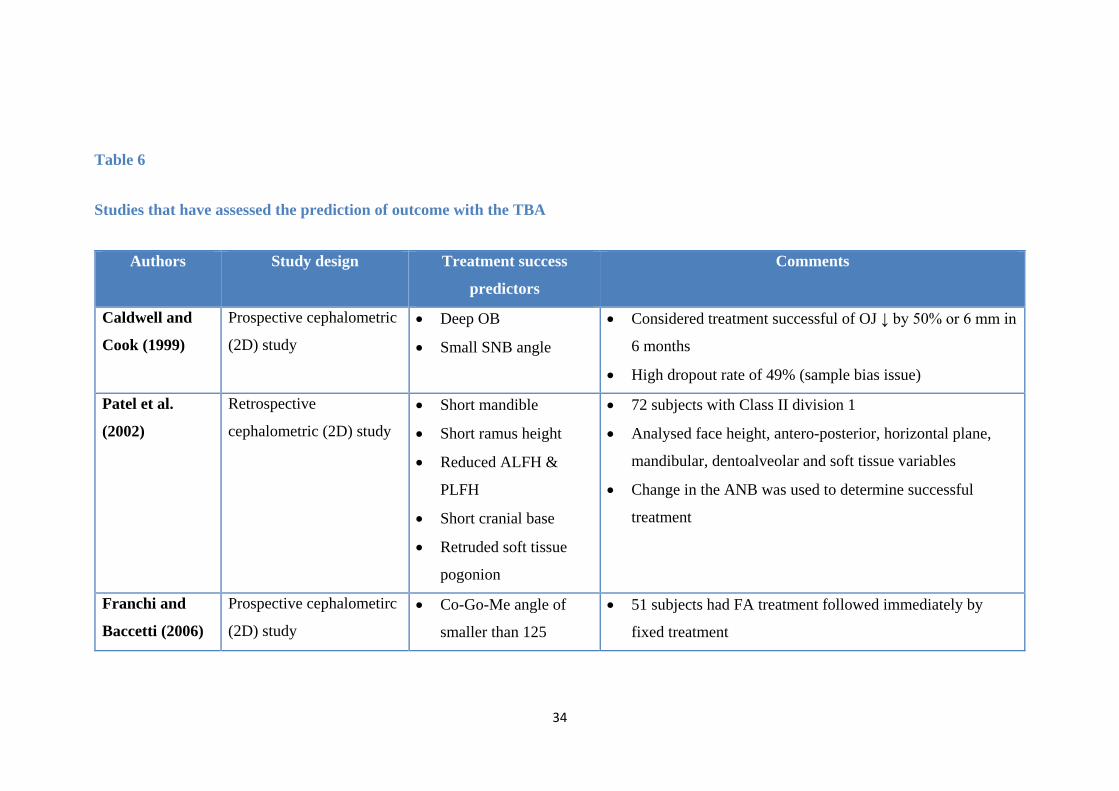
34
Table 6
Studies that have assessed the prediction of outcome with the TBA
Authors Study design Treatment success
predictors
Comments
Caldwell and
Cook (1999)
Prospective cephalometric
(2D) study
• Deep OB
• Small SNB angle
• Considered treatment successful of OJ ↓ by 50% or 6 mm in
6 months
• High dropout rate of 49% (sample bias issue)
Patel et al.
(2002)
Retrospective
cephalometric (2D) study
• Short mandible
• Short ramus height
• Reduced ALFH &
PLFH
• Short cranial base
• Retruded soft tissue
pogonion
• 72 subjects with Class II division 1
• Analysed face height, antero-posterior, horizontal plane,
mandibular, dentoalveolar and soft tissue variables
• Change in the ANB was used to determine successful
treatment
Franchi and
Baccetti (2006)
Prospective cephalometirc
(2D) study
• Co-Go-Me angle of
smaller than 125
• 51 subjects had FA treatment followed immediately by
fixed treatment
35
• Measured total mandibular length as discriminator for
successful treatment outcome
• No effect of the mandibular position on treatment outcome
(in disagreement with Caldwell and Cook (1999) and Patel
et al. (2002)
Fleming et al.
(2012)
Retrospective cohort
cephalometirc (2D) study
• Increased initial OJ • 131 subjects treated with the TBA only
• Outcome measured: OJ reduction, changes in mandibular
length, anter-posterior changes in mandibular position
• Retrospective evaluation could overestimate TBA
effectiveness
Al-Rahbi (2014) Prospective laser scanning
(3D) study
• Increased initial OJ
• Retrusive and superior
positioned chin point
• 64 subjects scanned pre-treatment and 6-9 months into
treatment
• Control group from Avon Longitudinal Study of Parents
and Children
OB: overbite, OJ: overjet
36
2.6 Three Dimensional imaging in Orthodontics
The vast majority of FAs and TBAs studies have used 2D cephalometric assessment.
In this project, the evaluation of treatment change was based solely on 3D
stereophotogrammetry using the DI3D surface capturing system. This section will
give a brief background of 2D and 3D imaging in orthodontics; 3D imaging methods
for soft tissue structures including stereophotogrammetry and the DI3D system will be
discussed in more detail.
2.6.1 Background
Craniofacial anthropometry techniques have been widely used for profile assessment,
treatment planning, identifying clinical features, quantifying treatment outcomes, and
in assessing longitudinal changes (Farkas and Deutsch, 1996). These direct measures
are easy to do, cheap, reliable and extensive normative databases exist for comparison
and reference (Farkas, 1994; Wong et al., 2008). Nevertheless, they have some
limitations (Wong et al., 2008) such as:
• They require training on live subjects
• Performing measurements is time-consuming
• Good patient compliance is necessary as subjects need to remain still while taking
the measurements.
Since the introduction of radiographic cephalometry by Broadbent and Hofrath in
1931, the use of traditional anthropologic methods receded and lateral cephalograms
became the method of choice for facial and soft tissue profile assessments (Bourne et
al., 2001). Clinical experience with 2D cephalometry identified several shortcomings
in the use of this method for soft tissue profile assessment (Hillesund et al., 1978; Illing
37
et al., 1998; McDonagh et al., 2001; Bourne et al., 2001; Adams et al., 2004; Incrapera
et al., 2010). These include:
• Ethical issues associated with radiation exposure
• Inaccuracies associated with magnification and head positioning
• The unrealistic 2-dimensional representation of a 3-dimensional structure
• Problems in landmark identification
• Variation in lip position during exposure which affects lip thickness evaluation.
2.6.2 2D imaging
The use of sophisticated digital cameras and 2D photography offers quick and easy
capture of facial images, permanent storage and the ability to repeat measurements, all
in the absence of ionising radiation exposure (de Menezes et al., 2009). Although 2D
photography has offered additional advantages over 2D cephalometry, it remains a
two-dimensional representation of a 3D object and accuracy is affected by projection,
distortion and pose (Ghoddousi et al., 2007; Wong et al., 2008)
2.6.3 3D imaging
In the last two decades 3D imaging has developed to overcome the limitations of 2D
imaging. Soon after its marketing, 3D imaging technology was applied to various
aspects of orthodontics (Hajeer et al., 2004). It is now used in the assessment of facial
deformities and the outcome of surgical or/and orthodontic intervention because it
allows the clinician to manipulate the 3D models in any direction which gives valuable
and comprehensive information about the soft tissues, without the need for patient
recall. Moreover, treatment outcome can be assessed by comparing before and after

38
treatment 3D models and analysing landmark displacement. 3D imaging is also used
as a communication tool for ‘Tele-orthodontics’. It has become a promising
application in the dental inter-disciplinary team work, as it provides the ability to share
the patient 3D records over distance between colleagues which provides much more
real-time accurate information for treatment planning. Hajeer et al. (2002) and Hajeer
et al. (2004) classified 3D imaging techniques as radiographic-based, visual-based and
other methods. These are summarized in Tables 7-9.
39
Table 7
A summary of the radiographic based imaging methods reported in the literature
Radiographic based methods Drawbacks and limitations
3D cephalometry: Coordinates data from two biorthogonal head
films such as lateral and antero-posterior radiographs (Savara,
1965; Grayson et al., 1988)
• Radiation exposure
• Poor definition of soft tissue
• Time-consuming procedure
• Difficulties locating same landmarks on 2 different radiographs
• Poor soft tissue contour assessment
Morphoanalysis: Involves taking 3D records using photographs,
radiographs and study casts • Time-consuming
• Expensive equipment
• Not practical for routine use
3D CT scanning: More common in medical field • High radiation dosage
• Poor facial soft tissue resolution due to slice spacing
• Image distortion due to artefacts produced by intra oral metal objects
Cone beam CT: Less radiation scatter with maintained ability to
produce high quality 3D models of skeletal and soft tissues. Smaller
and less expensive than conventional CT (Mah et al., 2003)
• Unable to map-out muscle structure and attachments
• Unable to produce colour and skin texture of scanned object
40
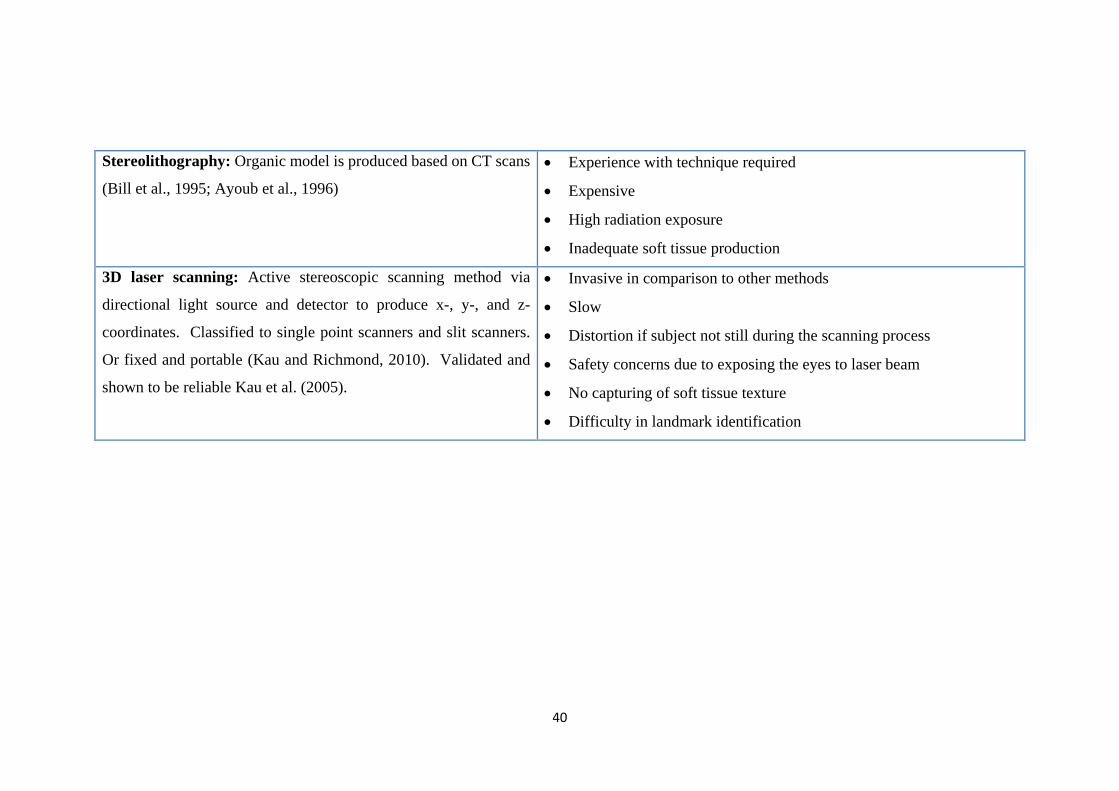
Stereolithography: Organic model is produced based on CT scans
(Bill et al., 1995; Ayoub et al., 1996) • Experience with technique required
• Expensive
• High radiation exposure
• Inadequate soft tissue production
3D laser scanning: Active stereoscopic scanning method via
directional light source and detector to produce x-, y-, and z-
coordinates. Classified to single point scanners and slit scanners.
Or fixed and portable (Kau and Richmond, 2010). Validated and
shown to be reliable Kau et al. (2005).
• Invasive in comparison to other methods
• Slow
• Distortion if subject not still during the scanning process
• Safety concerns due to exposing the eyes to laser beam
• No capturing of soft tissue texture
• Difficulty in landmark identification
41
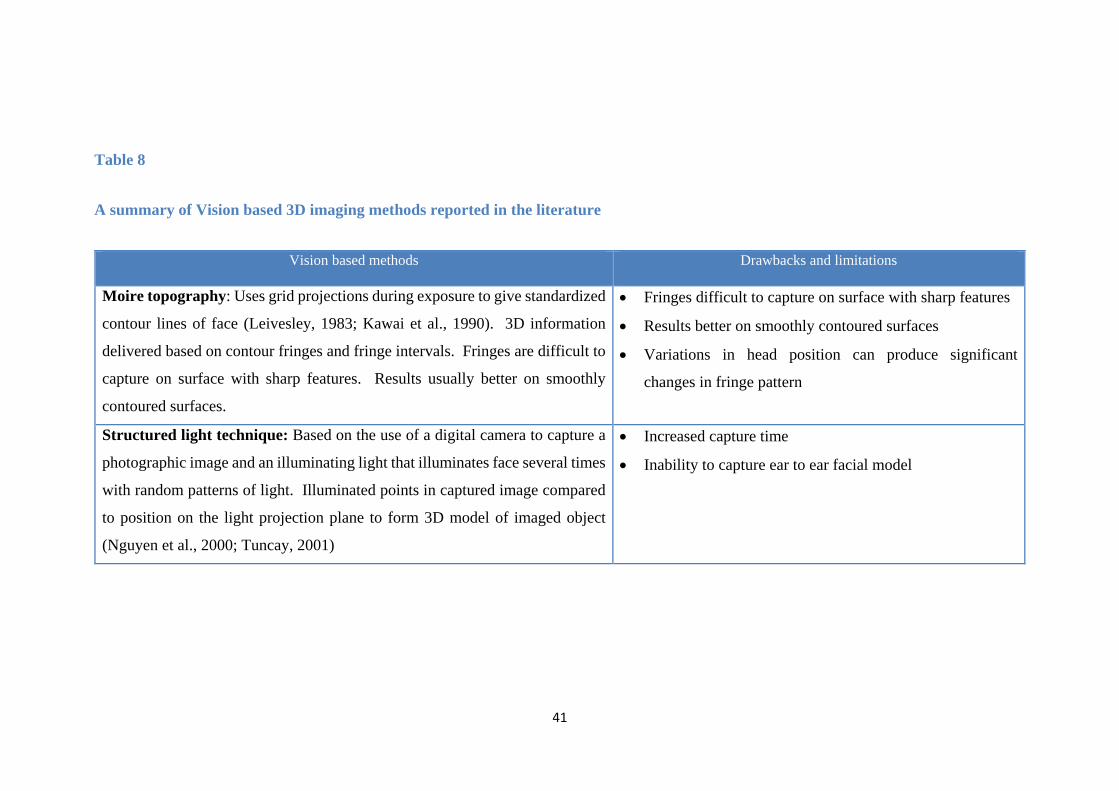
Table 8
A summary of Vision based 3D imaging methods reported in the literature
Vision based methods Drawbacks and limitations
Moire topography: Uses grid projections during exposure to give standardized
contour lines of face (Leivesley, 1983; Kawai et al., 1990). 3D information
delivered based on contour fringes and fringe intervals. Fringes are difficult to
capture on surface with sharp features. Results usually better on smoothly
contoured surfaces.
• Fringes difficult to capture on surface with sharp features
• Results better on smoothly contoured surfaces
• Variations in head position can produce significant
changes in fringe pattern
Structured light technique: Based on the use of a digital camera to capture a
photographic image and an illuminating light that illuminates face several times
with random patterns of light. Illuminated points in captured image compared
to position on the light projection plane to form 3D model of imaged object
(Nguyen et al., 2000; Tuncay, 2001)
• Increased capture time
• Inability to capture ear to ear facial model
42
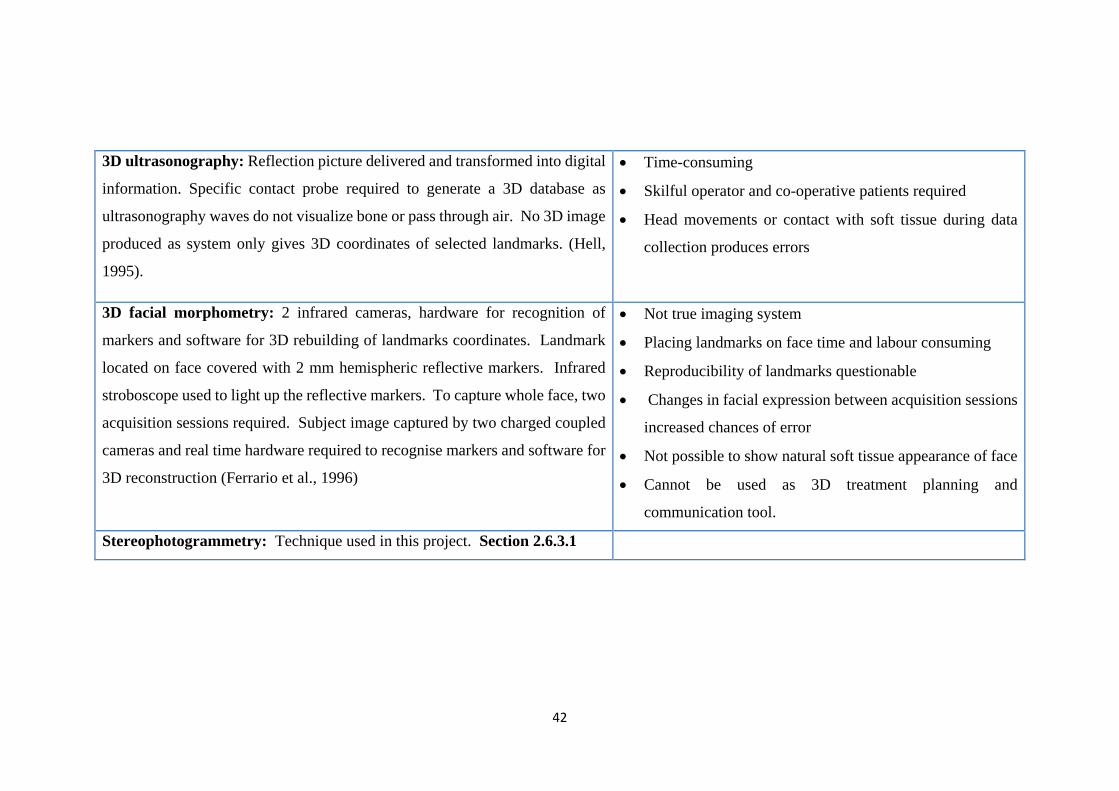
3D ultrasonography: Reflection picture delivered and transformed into digital
information. Specific contact probe required to generate a 3D database as
ultrasonography waves do not visualize bone or pass through air. No 3D image
produced as system only gives 3D coordinates of selected landmarks. (Hell,
1995).
• Time-consuming
• Skilful operator and co-operative patients required
• Head movements or contact with soft tissue during data
collection produces errors
3D facial morphometry: 2 infrared cameras, hardware for recognition of
markers and software for 3D rebuilding of landmarks coordinates. Landmark
located on face covered with 2 mm hemispheric reflective markers. Infrared
stroboscope used to light up the reflective markers. To capture whole face, two
acquisition sessions required. Subject image captured by two charged coupled
cameras and real time hardware required to recognise markers and software for
3D reconstruction (Ferrario et al., 1996)
• Not true imaging system
• Placing landmarks on face time and labour consuming
• Reproducibility of landmarks questionable
• Changes in facial expression between acquisition sessions
increased chances of error
• Not possible to show natural soft tissue appearance of face
• Cannot be used as 3D treatment planning and
communication tool.
Stereophotogrammetry: Technique used in this project. Section 2.6.3.1
43
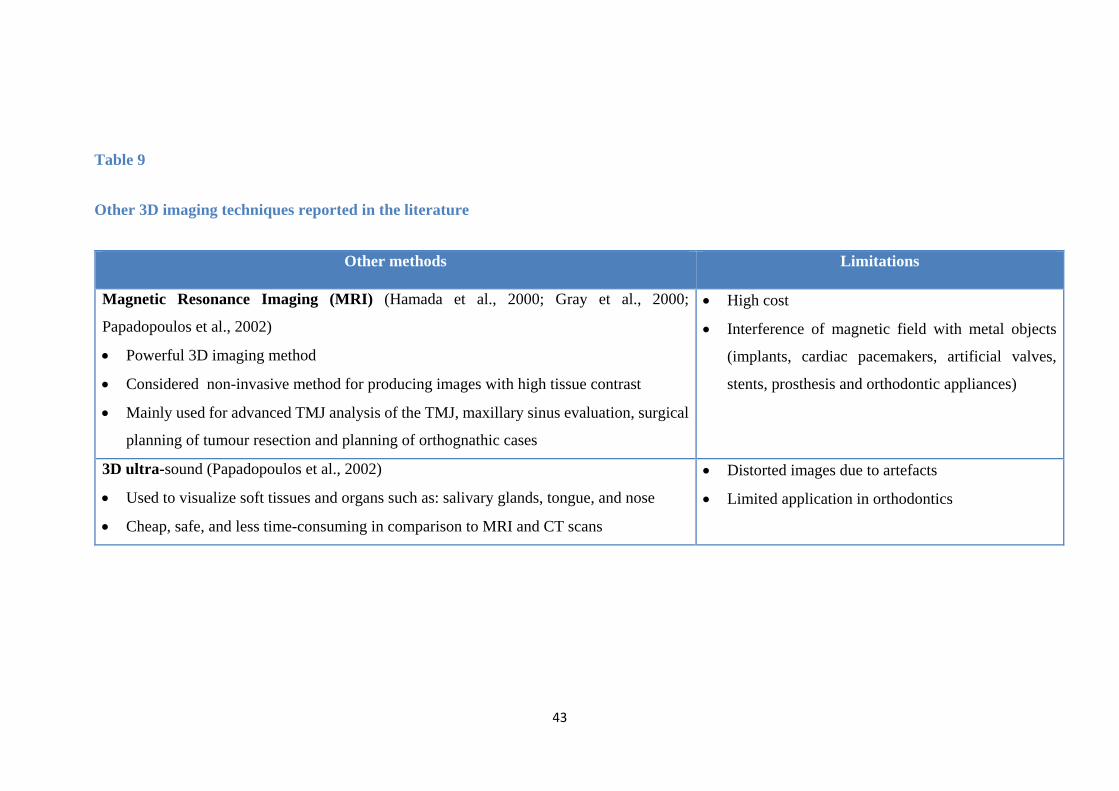
Table 9
Other 3D imaging techniques reported in the literature
Other methods Limitations
Magnetic Resonance Imaging (MRI) (Hamada et al., 2000; Gray et al., 2000;
Papadopoulos et al., 2002)
• Powerful 3D imaging method
• Considered non-invasive method for producing images with high tissue contrast
• Mainly used for advanced TMJ analysis of the TMJ, maxillary sinus evaluation, surgical
planning of tumour resection and planning of orthognathic cases
• High cost
• Interference of magnetic field with metal objects
(implants, cardiac pacemakers, artificial valves,
stents, prosthesis and orthodontic appliances)
3D ultra-sound (Papadopoulos et al., 2002)
• Used to visualize soft tissues and organs such as: salivary glands, tongue, and nose
• Cheap, safe, and less time-consuming in comparison to MRI and CT scans
• Distorted images due to artefacts
• Limited application in orthodontics
44
2.6.3.1 Stereophotogrammetry 3D imaging technique
It is defined as “the science or art of obtaining reliable measurements by means of
photographs” (American Society of Photogrammetry, 1966). It was first used in 1944
and was applied by Thalmann-Degan who recorded facial changes as a result of
orthodontic treatment (Burke and Beard, 1967). Stereophotogrammetry is based on
digital cameras, in addition to algorithms that analyse the digital images taken to
produce a 3D model. It offers all the features of 3D imaging discussed previously, in
the absence of ionizing radiation and great scanning accuracy. Stereophotogrammetry
has also been widely applied in the medical field to capture 3D information other than
from the facial region with a great level of accuracy. For example,
stereophotogrammetry has been assessed for accuracy and reproducibility in breast
imaging. It was shown that stereophotogrammetry plays an important role in breast
morphology assessment and offered several advantages over other more invasive and
expensive 3D imaging methods (Catherwood et al., 2011). Several
stereophotogrammetry systems have evolved over the years; these are summarized in
Table 10.
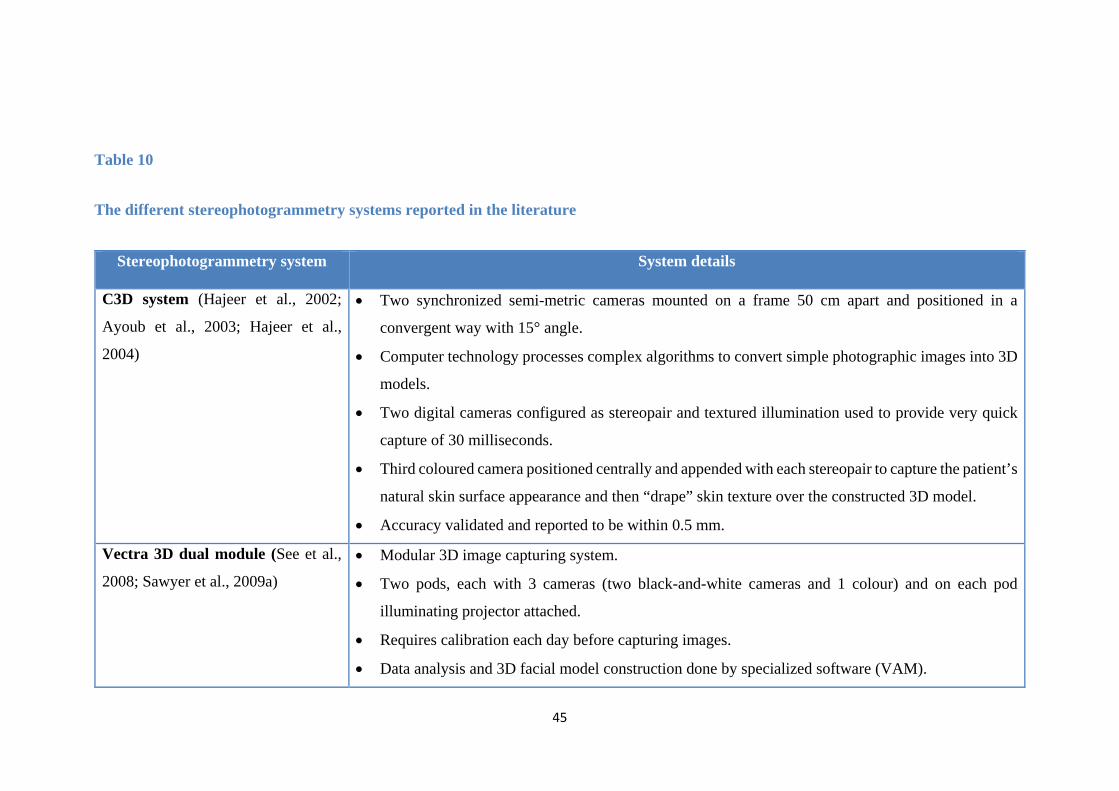
45
Table 10
The different stereophotogrammetry systems reported in the literature
Stereophotogrammetry system System details
C3D system (Hajeer et al., 2002;
Ayoub et al., 2003; Hajeer et al.,
2004)
• Two synchronized semi-metric cameras mounted on a frame 50 cm apart and positioned in a
convergent way with 15° angle.
• Computer technology processes complex algorithms to convert simple photographic images into 3D
models.
• Two digital cameras configured as stereopair and textured illumination used to provide very quick
capture of 30 milliseconds.
• Third coloured camera positioned centrally and appended with each stereopair to capture the patient’s
natural skin surface appearance and then “drape” skin texture over the constructed 3D model.
• Accuracy validated and reported to be within 0.5 mm.
Vectra 3D dual module (See et al.,
2008; Sawyer et al., 2009a) • Modular 3D image capturing system.
• Two pods, each with 3 cameras (two black-and-white cameras and 1 colour) and on each pod
illuminating projector attached.
• Requires calibration each day before capturing images.
• Data analysis and 3D facial model construction done by specialized software (VAM).
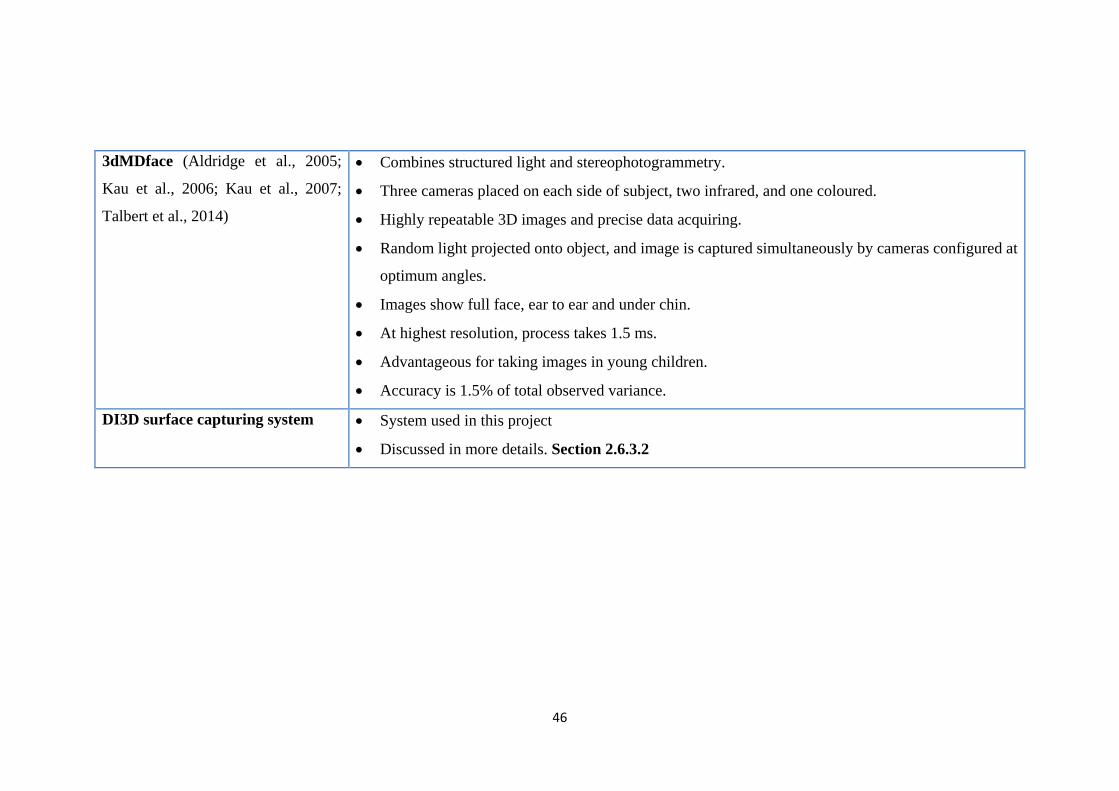
46
3dMDface (Aldridge et al., 2005;
Kau et al., 2006; Kau et al., 2007;
Talbert et al., 2014)
• Combines structured light and stereophotogrammetry.
• Three cameras placed on each side of subject, two infrared, and one coloured.
• Highly repeatable 3D images and precise data acquiring.
• Random light projected onto object, and image is captured simultaneously by cameras configured at
optimum angles.
• Images show full face, ear to ear and under chin.
• At highest resolution, process takes 1.5 ms.
• Advantageous for taking images in young children.
• Accuracy is 1.5% of total observed variance.
DI3D surface capturing system • System used in this project
• Discussed in more details. Section 2.6.3.2
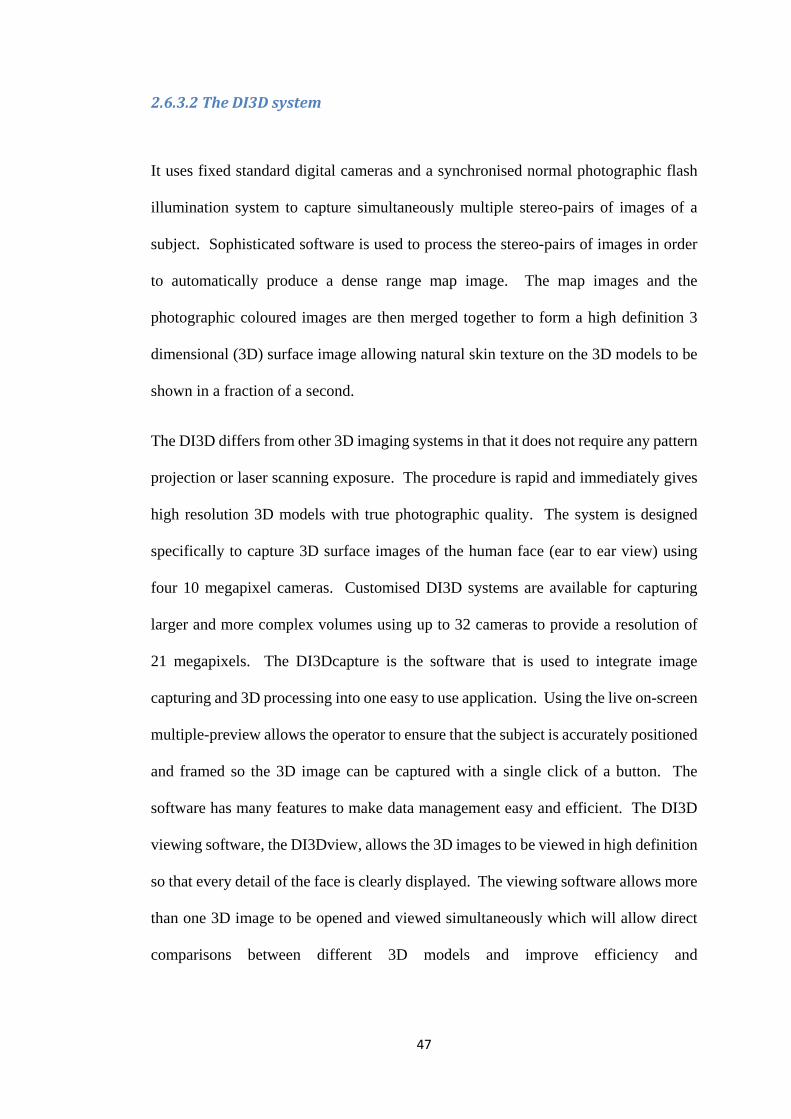
47
2.6.3.2 The DI3D system
It uses fixed standard digital cameras and a synchronised normal photographic flash
illumination system to capture simultaneously multiple stereo-pairs of images of a
subject. Sophisticated software is used to process the stereo-pairs of images in order
to automatically produce a dense range map image. The map images and the
photographic coloured images are then merged together to form a high definition 3
dimensional (3D) surface image allowing natural skin texture on the 3D models to be
shown in a fraction of a second.
The DI3D differs from other 3D imaging systems in that it does not require any pattern
projection or laser scanning exposure. The procedure is rapid and immediately gives
high resolution 3D models with true photographic quality. The system is designed
specifically to capture 3D surface images of the human face (ear to ear view) using
four 10 megapixel cameras. Customised DI3D systems are available for capturing
larger and more complex volumes using up to 32 cameras to provide a resolution of
21 megapixels. The DI3Dcapture is the software that is used to integrate image
capturing and 3D processing into one easy to use application. Using the live on-screen
multiple-preview allows the operator to ensure that the subject is accurately positioned
and framed so the 3D image can be captured with a single click of a button. The
software has many features to make data management easy and efficient. The DI3D
viewing software, the DI3Dview, allows the 3D images to be viewed in high definition
so that every detail of the face is clearly displayed. The viewing software allows more
than one 3D image to be opened and viewed simultaneously which will allow direct
comparisons between different 3D models and improve efficiency and
48
communication. The DI3D was technically validated for accuracy and reliability with
an acceptable range of error of 0.2 mm (Khambay et al., 2008; Winder et al., 2008).
2.7 Facial expression
The effect of FAs treatment on facial expressions and facial expression reproducibility
has not been reported previously in the orthodontic literature. In this project, only the
changes of facial expression at rest, natural smile and maximal smile will be evaluated
from before to after TBA treatment.
Studying facial expressions have benefited from the advancements in 3D imaging.
Traditionally conventional photographs were used to study facial expressions with the
disadvantage of assessing a 3D object by 2D means, giving no account to the antero-
posterior changes (Ackerman et al., 1998). Direct measurements on patients have been
used to allow 3D assessment, for example Burres (1985) studied facial expressions on
30 patients with integrated electromyography. In this technique, subjects were
required to hold each expression for 30 seconds, which may have led to loss of
accuracy due to fatigue.
Other investigations have used video recording as a method to assess facial
expressions. Wood et al. (1994) analysed the variability in two facial expressions from
day to day using a video microscope. A very well conducted study by Johnston et al.
(2003), overcame the methodological limitations of previous investigations. They used
stereophotogrammetry imaging technology and looked at five facial expressions in the
lower half of the face. Their findings showed high inter-session reproducibility and
minimal variation in expression reproducibility between sessions. Interestingly,
female subjects showed significantly more accurate reproduction of maximal smile;
49
however, this did not reach statistical significance. Their hierarchy of facial expression
reproducibility showed the rest position to be significantly more reproducible than
natural smile, maximal smile, cheek puff and lip purse.
In a recent study, Sawyer et al. (2009b) evaluated the reproducibility of nine facial
expressions in normal white subjects using stereophotogrammetry. Subjects were
asked to perform maximal or widest facial expressions in response to spoken and
visual cues provided in the following order: resting facial position, raised eyebrows,
close eyes as in sleep, close eyes as tight as possible, smile as wide as possible with
lips open, purse the lips, lower teeth showing by platysma muscle contraction and blow
out the cheeks. Twenty-five landmarks were positioned on the facial scans as
described by Farkas (1994). The 3D images were captured three times in three different
sessions: the initial capture, 15 minutes after the initial capture and 1 month after the
initial capture
The results showed high reproducibility of facial expressions within a 10 to 20 minute
period. In a period of one month apart, there were some significant differences in the
reproducibility of facial expression but the authors considered it as clinically
insignificant. In agreement with the findings of Johnston et al. (2003), the male
subjects showed less reproducibility of facial expressions in comparison to females.
The authors also found stereophotogrammetry technology to be very promising and
useful in evaluating facial motion and expressions.

50
CHAPTER THREE
AIMS AND NULL HYPOTHESIS
51
3. Aims and null hypotheses
3.1 Aims
1. To identify the 3D soft tissue volumetric and linear landmark changes following
treatment with the TBA
2. To estimate the TBA treatment outcome on the soft tissue facial profile volumetric
and linear landmark changes from the PWB
3. To identify if there is any association between certain soft tissue landmark
variables and successful treatment outcome of the TBA as measured by the
reduction in overjet
4. To assess the effects of TBA treatment on facial expressions at rest, natural smile
and maximal smile.
3.2 Null hypotheses
1. The TBA treatment has no effect on the 3D soft tissue volumetric and linear
landmark changes.
2. The PWB has no effect on the soft tissue volumetric and linear landmark changes
and it cannot be used to estimate the TBA treatment outcome on the soft tissue
profile.
3. There is no association between any soft tissue landmark variable and successful
overjet reduction following treatment with the TBA.
4. Treatment with the TBA has no effect on the facial expressions at rest, natural
smile and maximal smile.

52
CHAPTER FOUR
PATICIPANTS AND METHODS
53
4. Participants and Methods
4.1 Study Design
A 3D prospective cohort study was carried out in the Postgraduate Orthodontic Unit
at Cork University Dental School & Hospital, Ireland. Ethical approval was obtained
from the Clinical Research Ethics Committee of Cork Teaching Hospitals, University
College Cork. (Appendix A)
4.2 Sample
The anticipated number of subjects for this study was 46 subjects (23 boys, 23 girls),
based on the sample size reported in previous studies with similar design (Section 6.2)
to detect a clinically meaningful difference in soft tissue change of 1 mm at p < 0.05.
The Inclusion criteria for treatment were the following:
• Patients with Class II division 1 malocclusion
• Overjet ≥ 6 mm
• Growing patients > 9 and <15 years
• Patients treated with the TBA
• Patients with high or low Frankfort/Mandibular planes angle.
Patients were excluded from the study if any of the following was present:
• Poor oral hygiene
• No active growth
• Craniofacial anomaly or metabolic disorder
• Poor compliance.
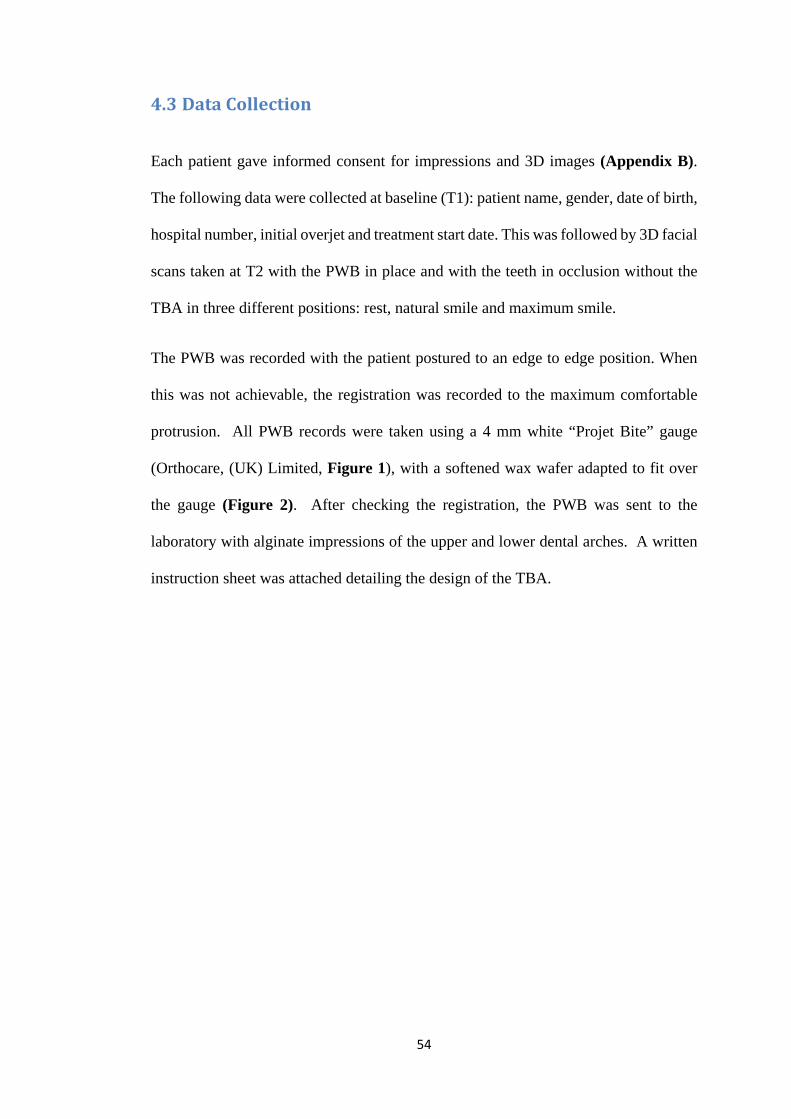
54
4.3 Data Collection
Each patient gave informed consent for impressions and 3D images (Appendix B).
The following data were collected at baseline (T1): patient name, gender, date of birth,
hospital number, initial overjet and treatment start date. This was followed by 3D facial
scans taken at T2 with the PWB in place and with the teeth in occlusion without the
TBA in three different positions: rest, natural smile and maximum smile.
The PWB was recorded with the patient postured to an edge to edge position. When
this was not achievable, the registration was recorded to the maximum comfortable
protrusion. All PWB records were taken using a 4 mm white “Projet Bite” gauge
(Orthocare, (UK) Limited, Figure 1), with a softened wax wafer adapted to fit over
the gauge (Figure 2). After checking the registration, the PWB was sent to the
laboratory with alginate impressions of the upper and lower dental arches. A written
instruction sheet was attached detailing the design of the TBA.
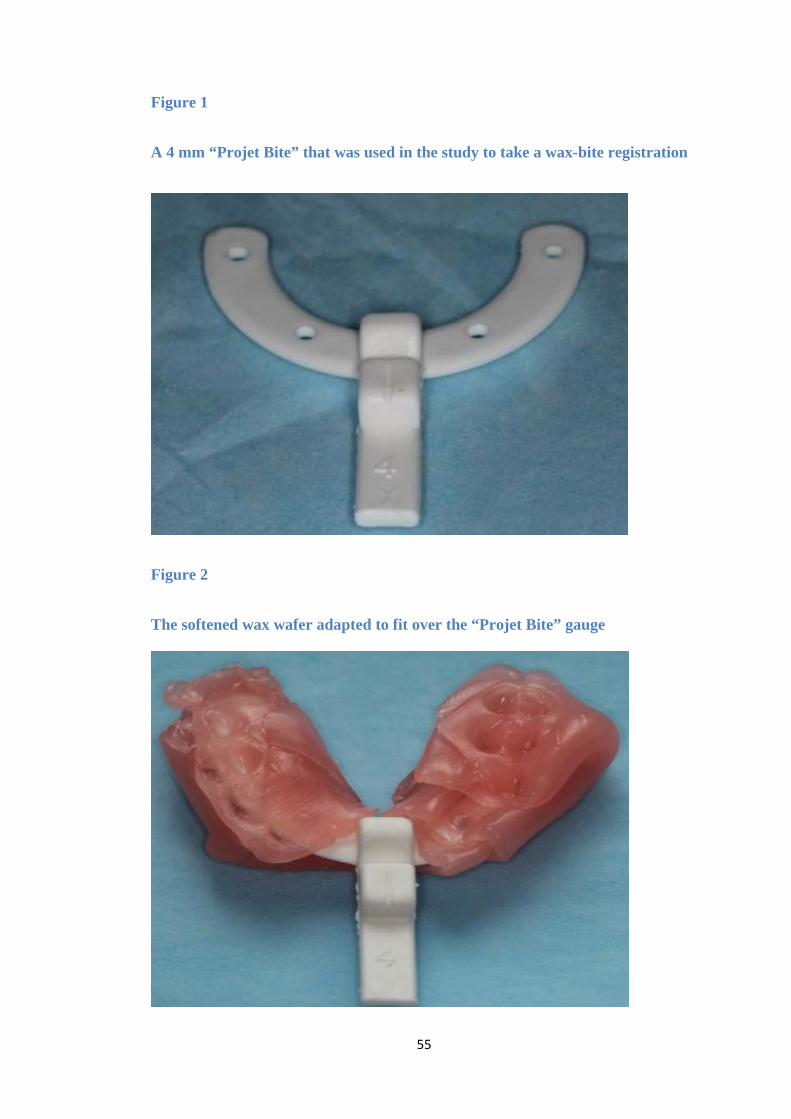
55
Figure 1
A 4 mm “Projet Bite” that was used in the study to take a wax-bite registration
Figure 2
The softened wax wafer adapted to fit over the “Projet Bite” gauge
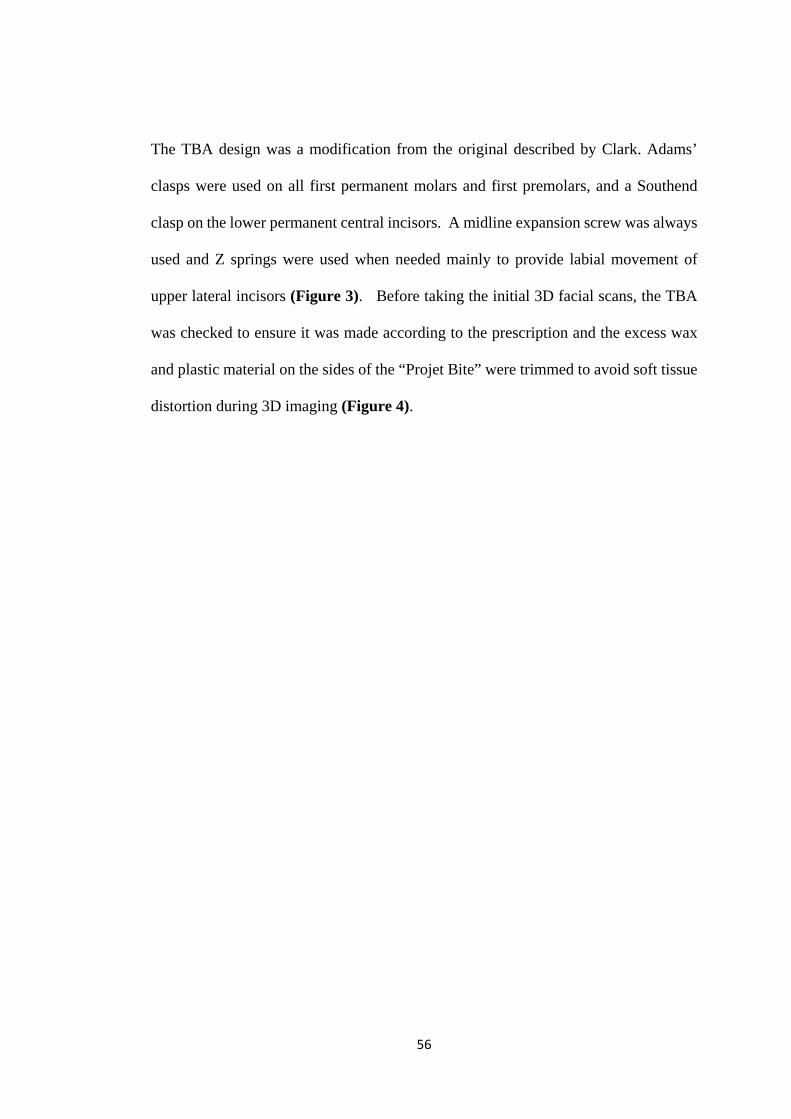
56
The TBA design was a modification from the original described by Clark. Adams’
clasps were used on all first permanent molars and first premolars, and a Southend
clasp on the lower permanent central incisors. A midline expansion screw was always
used and Z springs were used when needed mainly to provide labial movement of
upper lateral incisors (Figure 3). Before taking the initial 3D facial scans, the TBA
was checked to ensure it was made according to the prescription and the excess wax
and plastic material on the sides of the “Projet Bite” were trimmed to avoid soft tissue
distortion during 3D imaging (Figure 4).
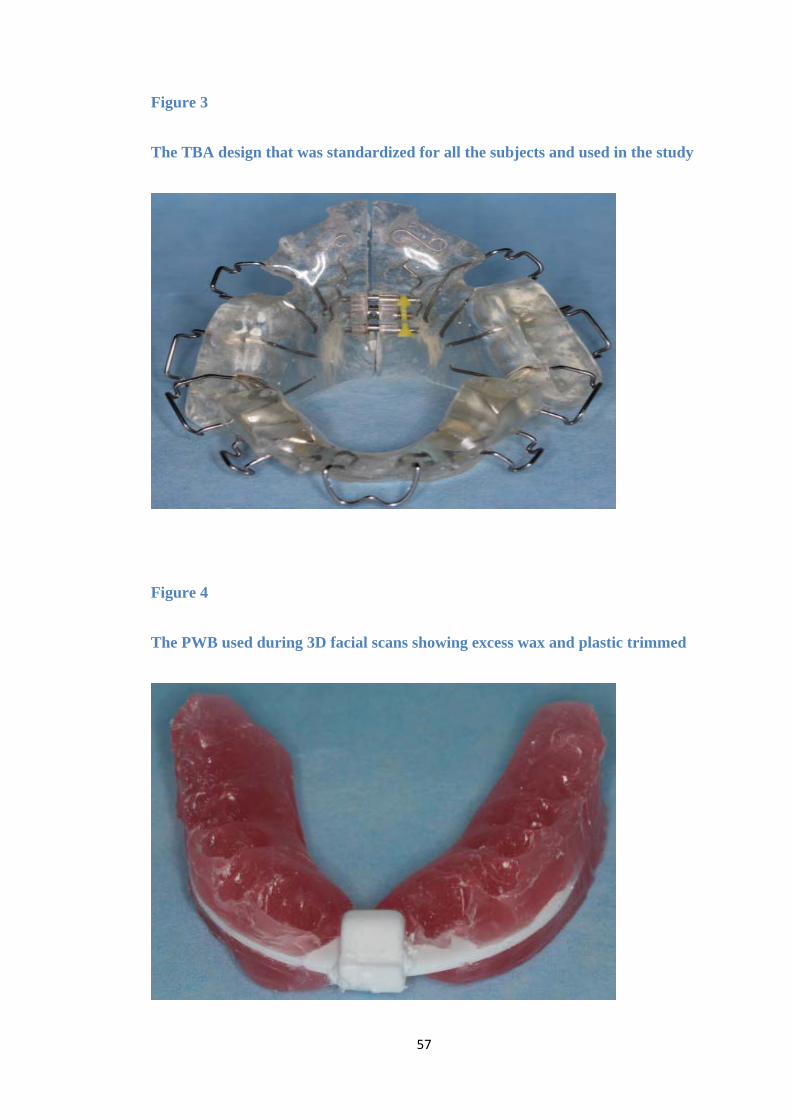
57
Figure 3
The TBA design that was standardized for all the subjects and used in the study
Figure 4
The PWB used during 3D facial scans showing excess wax and plastic trimmed
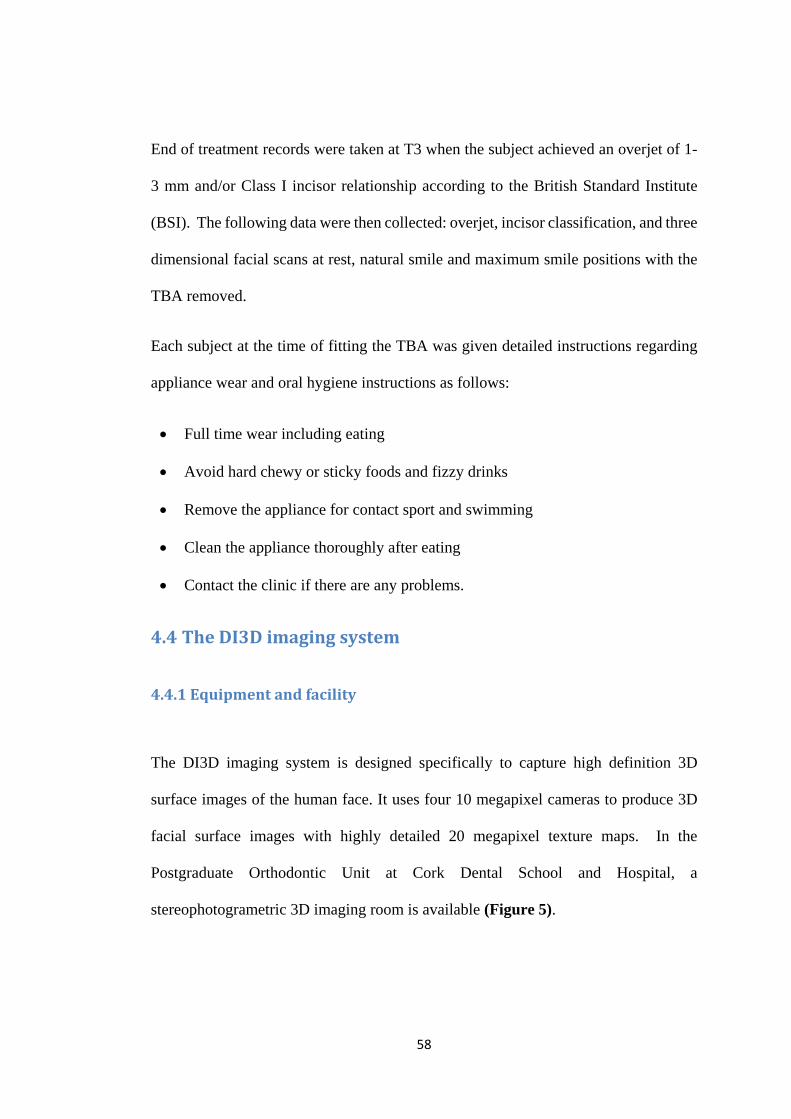
58
End of treatment records were taken at T3 when the subject achieved an overjet of 1-
3 mm and/or Class I incisor relationship according to the British Standard Institute
(BSI). The following data were then collected: overjet, incisor classification, and three
dimensional facial scans at rest, natural smile and maximum smile positions with the
TBA removed.
Each subject at the time of fitting the TBA was given detailed instructions regarding
appliance wear and oral hygiene instructions as follows:
• Full time wear including eating
• Avoid hard chewy or sticky foods and fizzy drinks
• Remove the appliance for contact sport and swimming
• Clean the appliance thoroughly after eating
• Contact the clinic if there are any problems.
4.4 The DI3D imaging system
4.4.1 Equipment and facility
The DI3D imaging system is designed specifically to capture high definition 3D
surface images of the human face. It uses four 10 megapixel cameras to produce 3D
facial surface images with highly detailed 20 megapixel texture maps. In the
Postgraduate Orthodontic Unit at Cork Dental School and Hospital, a
stereophotogrametric 3D imaging room is available (Figure 5).
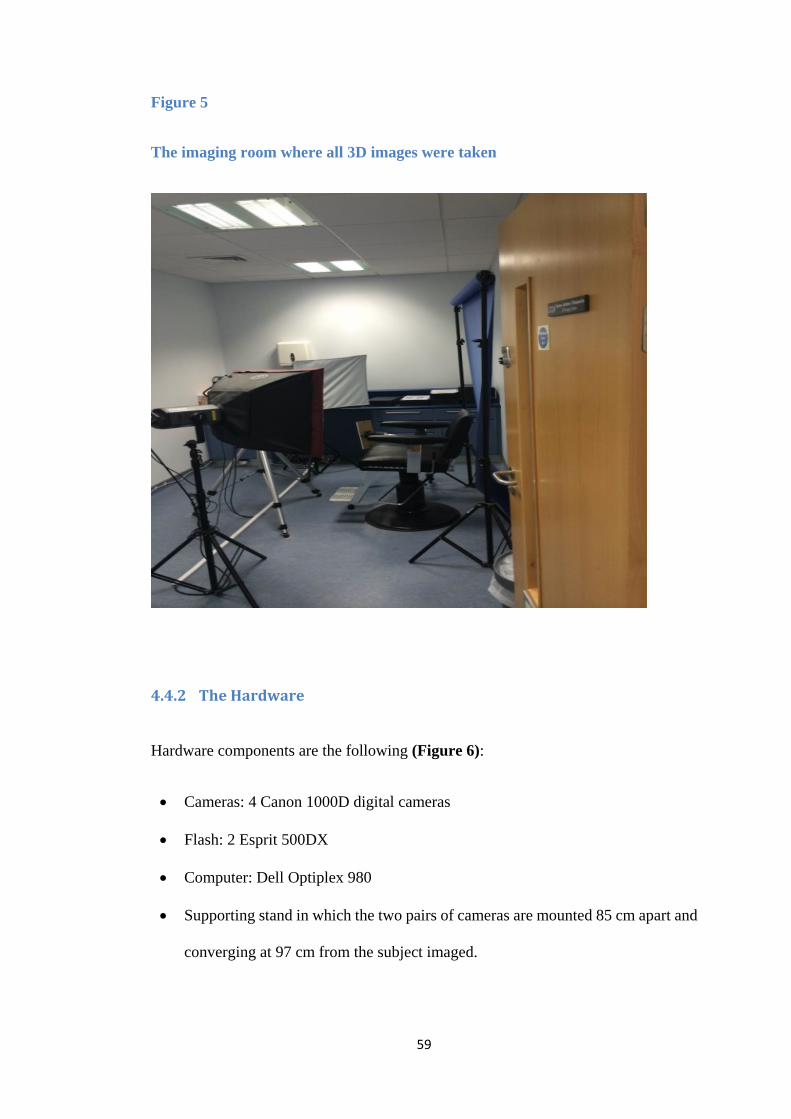
59
Figure 5
The imaging room where all 3D images were taken
4.4.2 The Hardware
Hardware components are the following (Figure 6):
• Cameras: 4 Canon 1000D digital cameras
• Flash: 2 Esprit 500DX
• Computer: Dell Optiplex 980
• Supporting stand in which the two pairs of cameras are mounted 85 cm apart and
converging at 97 cm from the subject imaged.
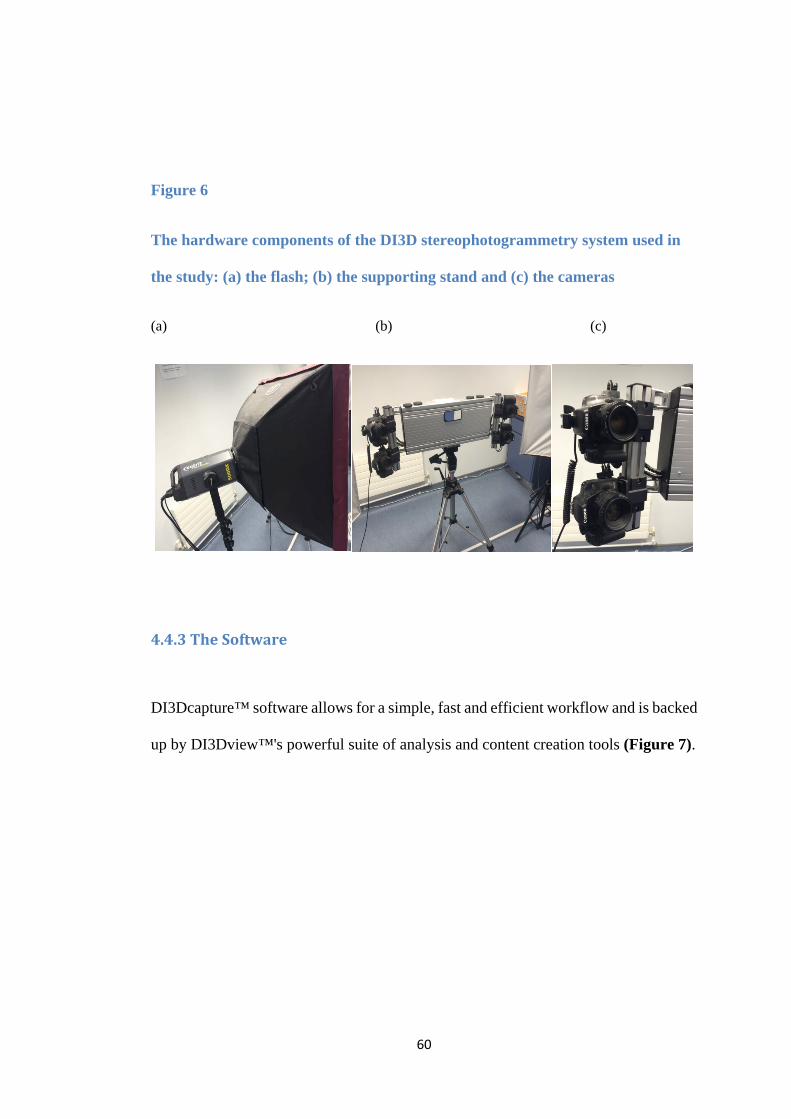
60
Figure 6
The hardware components of the DI3D stereophotogrammetry system used in
the study: (a) the flash; (b) the supporting stand and (c) the cameras
(a) (b) (c)
4.4.3 The Software
DI3Dcapture™ software allows for a simple, fast and efficient workflow and is backed
up by DI3Dview™'s powerful suite of analysis and content creation tools (Figure 7).
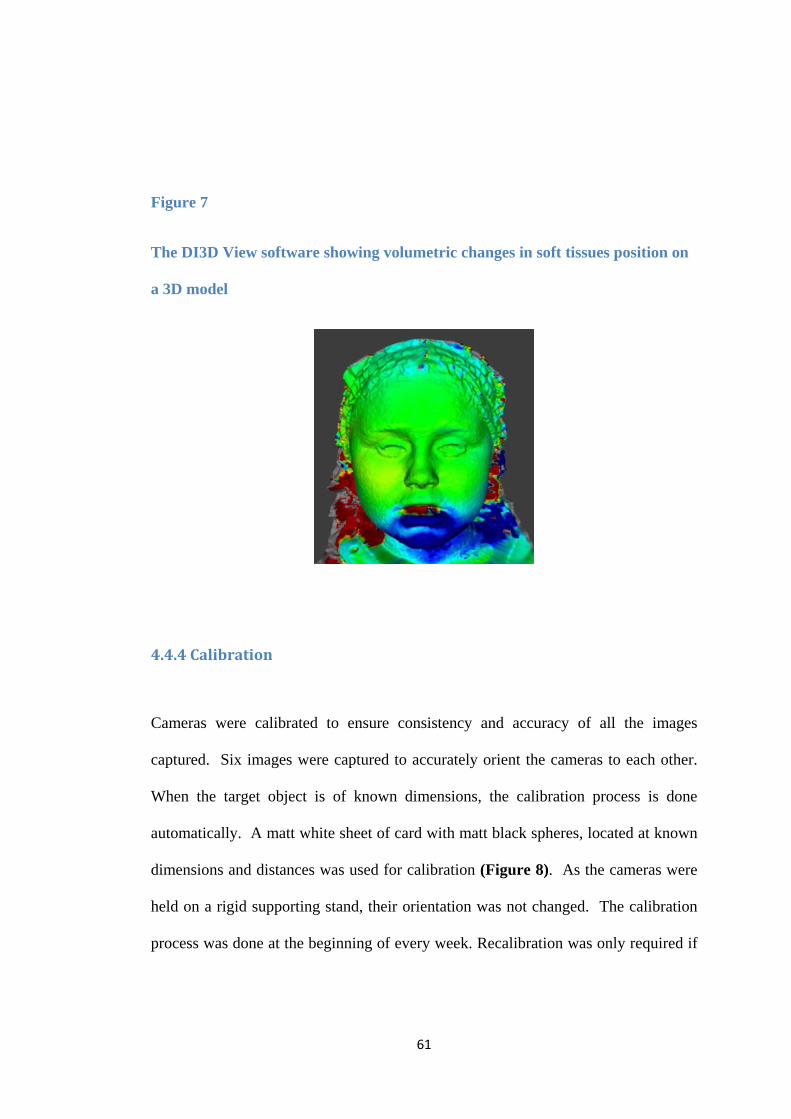
61
Figure 7
The DI3D View software showing volumetric changes in soft tissues position on
a 3D model
4.4.4 Calibration
Cameras were calibrated to ensure consistency and accuracy of all the images
captured. Six images were captured to accurately orient the cameras to each other.
When the target object is of known dimensions, the calibration process is done
automatically. A matt white sheet of card with matt black spheres, located at known
dimensions and distances was used for calibration (Figure 8). As the cameras were
held on a rigid supporting stand, their orientation was not changed. The calibration
process was done at the beginning of every week. Recalibration was only required if
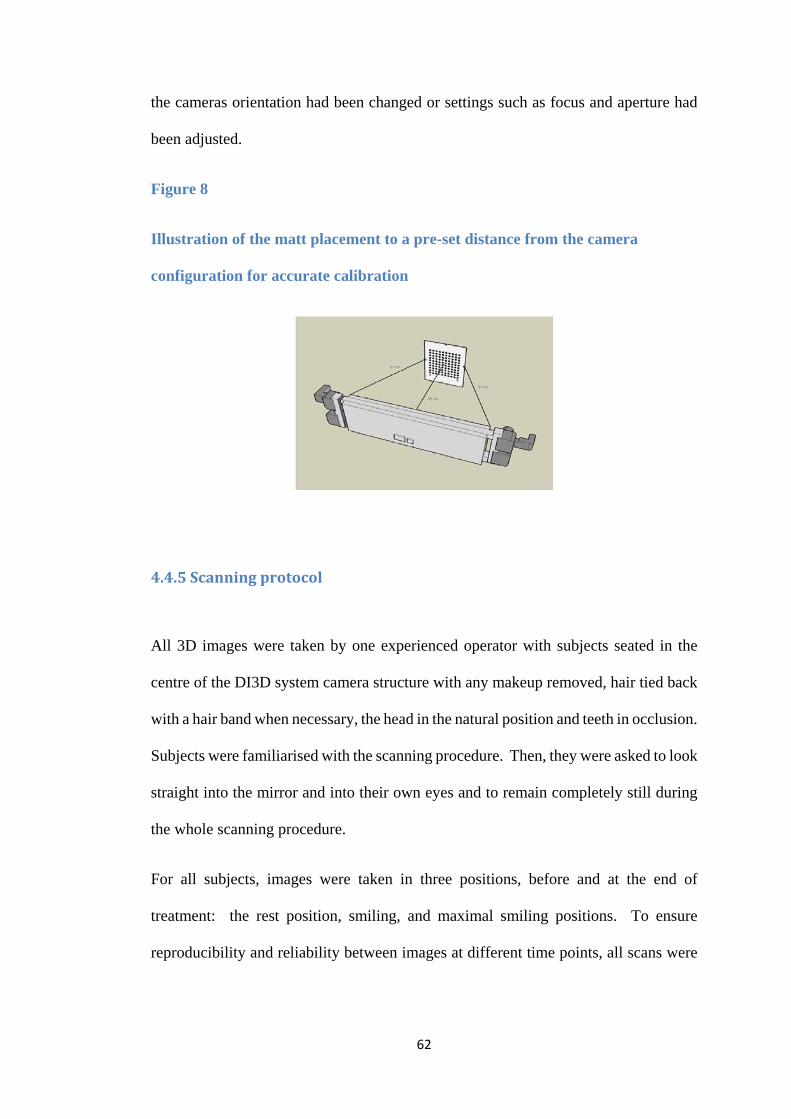
62
the cameras orientation had been changed or settings such as focus and aperture had
been adjusted.
Figure 8
Illustration of the matt placement to a pre-set distance from the camera
configuration for accurate calibration
4.4.5 Scanning protocol
All 3D images were taken by one experienced operator with subjects seated in the
centre of the DI3D system camera structure with any makeup removed, hair tied back
with a hair band when necessary, the head in the natural position and teeth in occlusion.
Subjects were familiarised with the scanning procedure. Then, they were asked to look
straight into the mirror and into their own eyes and to remain completely still during
the whole scanning procedure.
For all subjects, images were taken in three positions, before and at the end of
treatment: the rest position, smiling, and maximal smiling positions. To ensure
reproducibility and reliability between images at different time points, all scans were
63
performed based on the technique described by Zachrisson (1998). For rest position,
all subjects were asked to:
• Say Mississippi
• Swallow and say “N”
For natural smile, the subjects were asked to smile and say “cheese”. For maximum
smile subjects were asked to show “the biggest smile they can make”.
3D models were created by the computer software 1-2 minutes after the scanning
procedure. The images were viewed and checked to ensure they were of the required
standard while the subject was in the imaging room. In the absence of errors, the
images were named and saved in the appropriate study file.
4.4.6 Landmarks
A single operator landmarked all the 3D models taken before and after treatment. Ten
percent of images were re-landmarked one month after the initial landmarking by the
same operator to check for error and reliability. The facial landmarks used were the
ones suggested by Farkas (1994) and Sawyer et al. (2009b). All points and their
definitions are given below and shown in Figure 9.
1. Glabella (g): the most prominent midline point between eyebrows.
2. Nasion (n): the point in the midline of both nasal root and nasofrontal suture.
3. Right exocanthion (exR): the outer most point on the commissure of the eye
fissure on the right.
4. Mid pupil right (mpR): the centre point of the right pupil.
5. Orbitale right (oR): the lowest point on the lower margin of the right orbit.

64
6. Endocanthion right (enR): the inner most point on the commissure of the eye
fissure on the right.
7. Endocathion left (enL): the inner most point on the commissure of the eye fissure
on the left.
8. Mid pupil left (mpL): the centre point of the left pupil.
9. Orbitale left: (oL) the lowest point on the lower margin of the left orbit.
10. Exocanthion left (exL): the outer most point on the commissure of the eye fissure
on the left.
11. Pronasale (prn): the most protruded point of the apex nasi identified in the lateral
view of the rest position of the head.
12. Subnasale (sn): the midpoint of the angle where the lower nasal septum and the
lips meet (the base of Columella).
13. Alar curvature right (acR): the most lateral point in the curved base line of the
right ala.
14. Alar curvature left (acL): the most lateral point in the curved base line of the left
ala.
15. Alare right (aR): the marking level at the midportion of the right alae.
16. Alare left (aL): the marking level at the midportion of the left alae.
17. Cheilion right (chR): the outermost point of the right lip commissure.
18. Christa philltri right (cphR): point on the right elevated margin of the philtrum
just above the vermillion line.
19. Labiale superius (Ls): the midpoint on the upper vermilion border.
20. Christa philltri left (cphL): point on the left elevated margin of the philtrum just
above the vermillion line.
21. Cheilion left (chL): the outermost point of the left lip commissure.

65
22. Labiale inferius (li): the lower border of the lower lip.
23. Lower lip right (llR): located midway between cheilion right and labiale inferius.
24. Lower lip left (llL): located midway between cheilion left and labiale inferius.
25. Sublabiale (sl): the lower border of the lower lip or the upper border of the chin.
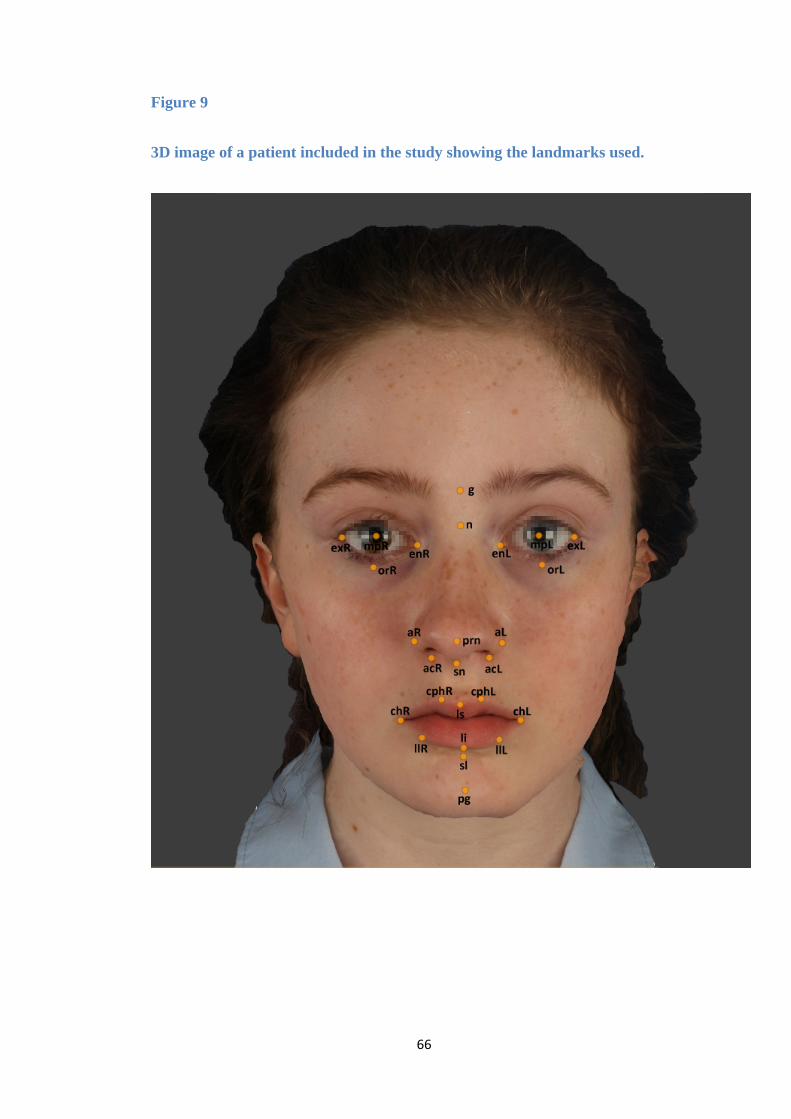
66
Figure 9
3D image of a patient included in the study showing the landmarks used.
67
4.5 Statistical analysis
All parameters were compared and analysed using linear mixed effect models. Gender
and time-point were included as fixed effects. The interaction between these was also
included. Age and length of treatment were included as covariates. The patient was
included as a random effect. A variance components covariance matrix was applied.
The adequacies of the models were assessed using residual analyses and
transformations were applied if required. Correlations were evaluated using Pearson’s
correlation coefficient. The level of significance was 5%. Analyses were performed in
SAS® (Version 9.4).

68
CHAPTER FIVE
RESULTS
69
5. Results
In this chapter, the timeline of the initial sample recruitment and the characteristics of
the final sample will be given first, followed by the results of the landmarking error
study and the findings of the 3D analyses.
5.1 Initial recruitment
All patients who were prescribed a TBA after December 2012 were recruited to the
study. The data collection process continued up until September 2014. All TBAs were
fitted within 1-2 weeks of the impressions and the PWB being taken. Patients who
required TBA replacement or re-activation were re-scanned and kept in the study as
long as the overjet at the time of repair or replacement was over 6 mm. A total of 58
patients with a mean age of 13.19 ± 1.26 years were fitted with the TBA. These
comprised 33 males (mean age 13.25 ±1.35 years) and 25 females (mean age 13.11 ±
1.16 years).
5.2 Final sample
Eleven patients (19%) did not complete the TBA treatment. Data on 47 subjects (18
females and 29 males) who completed the study were analysed at T3. The
characteristics of the final sample are summarized in Table 11. There were no
differences between the female and male treatment groups in terms of the following
variables:
• Pre-treatment overjet (p=0.5464)
• Pre-treatment age (p=0.5243)
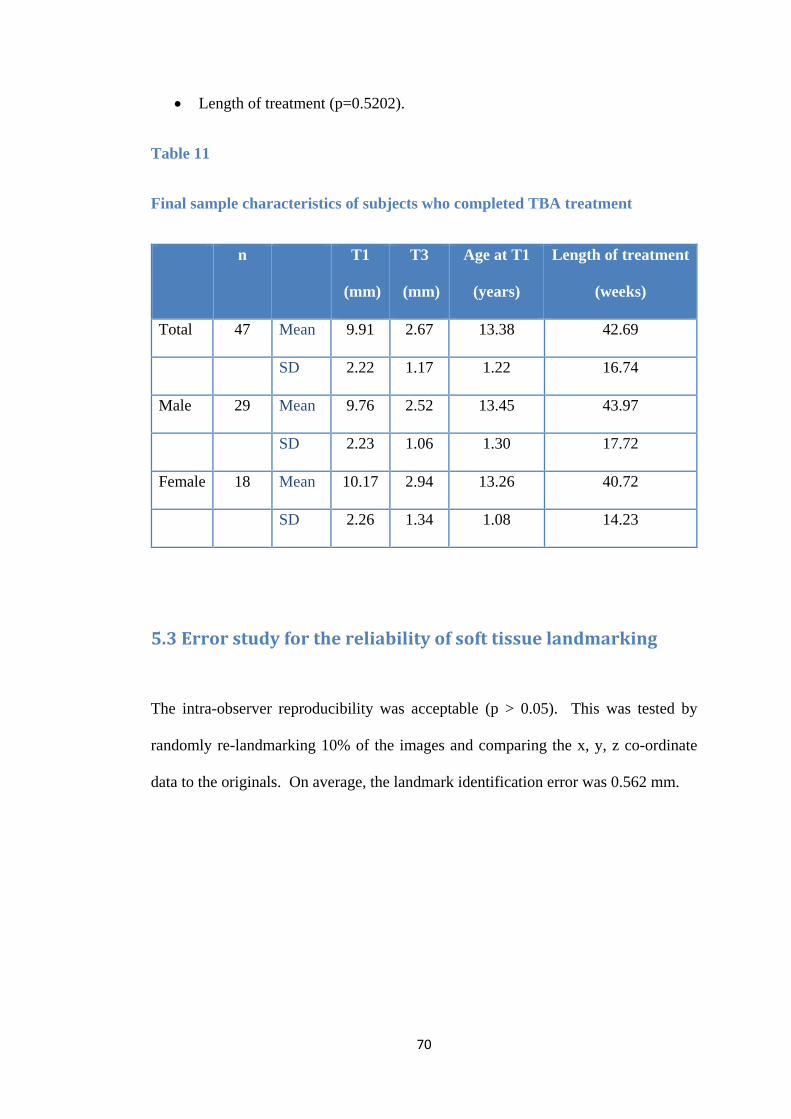
70
• Length of treatment (p=0.5202).
Table 11
Final sample characteristics of subjects who completed TBA treatment
n T1
(mm)
T3
(mm)
Age at T1
(years)
Length of treatment
(weeks)
Total 47 Mean 9.91 2.67 13.38 42.69
SD 2.22 1.17 1.22 16.74
Male 29 Mean 9.76 2.52 13.45 43.97
SD 2.23 1.06 1.30 17.72
Female 18 Mean 10.17 2.94 13.26 40.72
SD 2.26 1.34 1.08 14.23
5.3 Error study for the reliability of soft tissue landmarking
The intra-observer reproducibility was acceptable (p > 0.05). This was tested by
randomly re-landmarking 10% of the images and comparing the x, y, z co-ordinate
data to the originals. On average, the landmark identification error was 0.562 mm.
71
5.4 Results of 3D analyses
5.4.1 Facial profile volumetric and landmark changes
5.4.1.1 Volumetric changes
3D soft tissue volumetric changes from T1 to T2 and from T1 to T3 with the supporting
statistical analyses are given in Tables 12 and 13 respectively. The mean soft tissue
volumetric change of the overall sample from T1 to T2 (37.12±15.24 cm³) and from
T1 to T3 (22.24±16.73) was statistically significant (p < 0.0001). From T1 to T2, the
volumetric change for females (34.46 ± 14.35 cm³) was marginally less than for males
(38.78 ± 15.79 cm³). From T1 to T3 the mean volumetric soft tissue changes in
females (13.35 ± 13.88 cm³) were 48% less than in males (27.75 ± 16.13 cm³);
p=0.0114 .
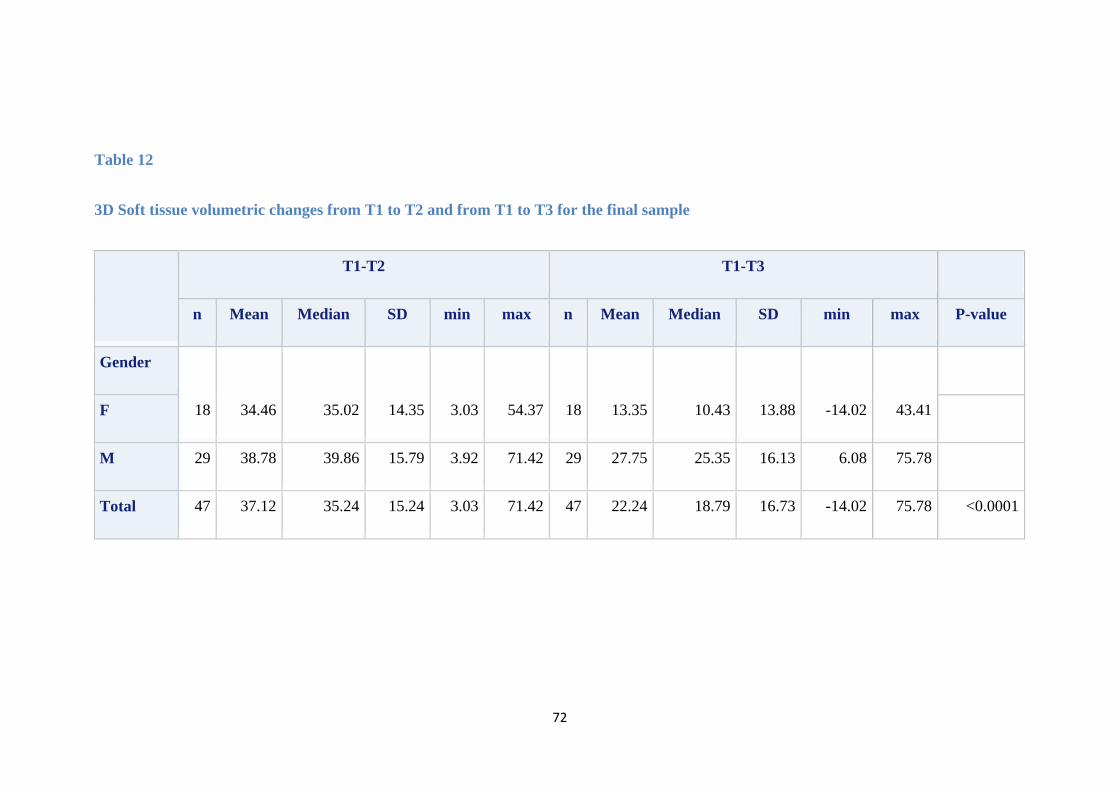
72
Table 12
3D Soft tissue volumetric changes from T1 to T2 and from T1 to T3 for the final sample
T1-T2 T1-T3
n Mean Median SD min max n Mean Median SD min max P-value
Gender
18 34.46 35.02 14.35 3.03 54.37 18 13.35 10.43 13.88 -14.02 43.41
F
M 29 38.78 39.86 15.79 3.92 71.42 29 27.75 25.35 16.13 6.08 75.78
Total 47 37.12 35.24 15.24 3.03 71.42 47 22.24 18.79 16.73 -14.02 75.78 <0.0001
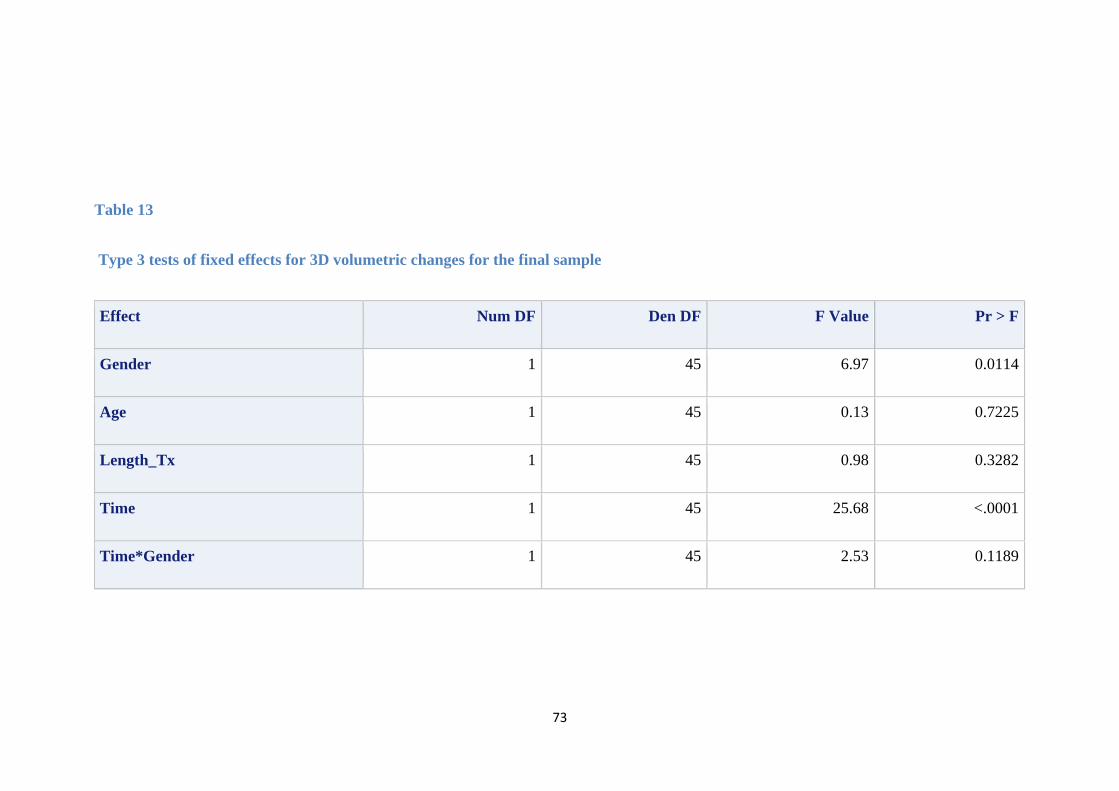
73
Table 13
Type 3 tests of fixed effects for 3D volumetric changes for the final sample
Effect Num DF Den DF F Value Pr > F
Gender 1 45 6.97 0.0114
Age 1 45 0.13 0.7225
Length_Tx 1 45 0.98 0.3282
Time 1 45 25.68 <.0001
Time*Gender 1 45 2.53 0.1189
74
5.4.1.2 Soft tissue linear landmark changes from T1 to T3
3D soft tissue linear changes from T1 to T3 for the upper and lower facial landmarks
are summarized in Table 14. All upper facial landmark linear changes were
insignificant (p > 0.05) and similar for females and males.
Soft tissue profile linear changes for lower facial landmarks were all significant (p <
0.0001) except for labiale superius (p = 0.825) with no difference between female and
male subjects. Table 15 summarizes the changes in the lower soft tissue profile points
namely labiale superius, labiale inferius, sublabiale and pogonion The supporting
statistical analyses are given in Table 16.
The mean overall linear change in labiale superius position from T1 to T3 (2.19 ± 1.54
mm) was not significant (p = 0.8259) and was similar for females (2.28 ± 1.16 mm)
and males (2.13 ± 1.75 mm).
For the remaining lower facial profile points, the mean linear change from T1 to T3
was in the range of 4-5 mm for both females and males in the order of sublabiale >
labiale inferius > pogonion in terms of the magnitude of change (Table 15).
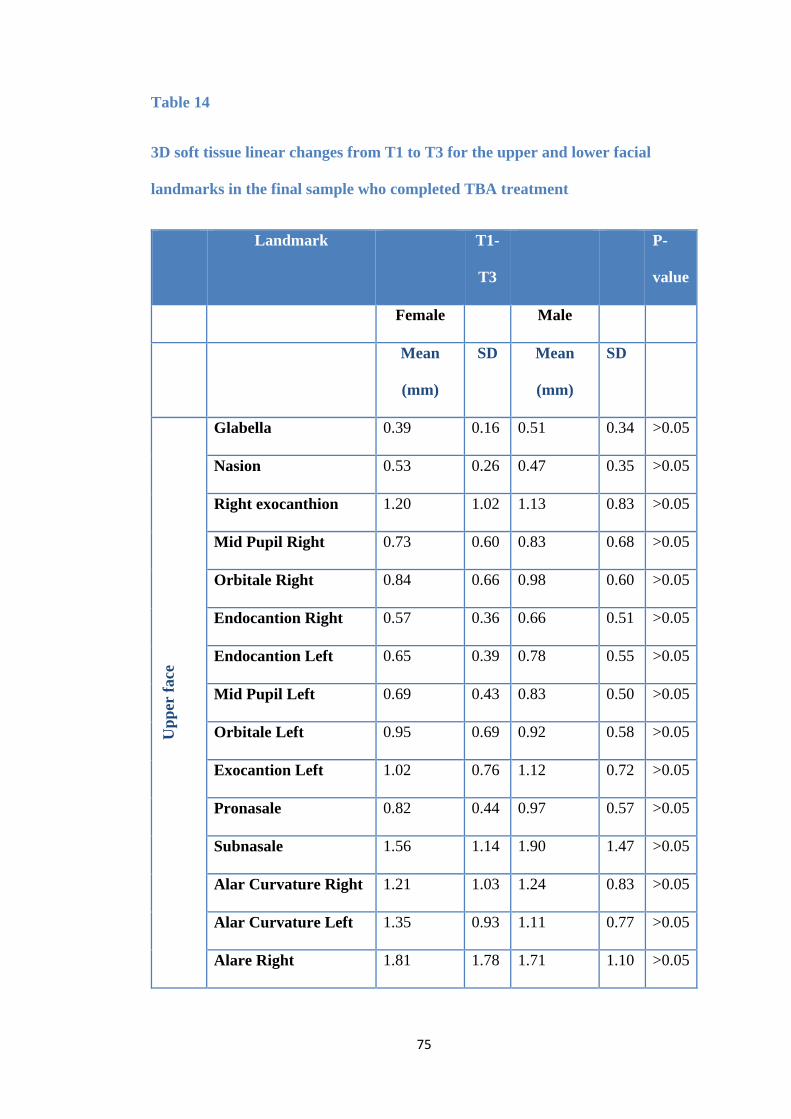
75
Table 14
3D soft tissue linear changes from T1 to T3 for the upper and lower facial
landmarks in the final sample who completed TBA treatment
Landmark T1-
T3
P-
value
Female Male
Mean
(mm)
SD Mean
(mm)
SD
Upp
er fa
ce
Glabella 0.39 0.16 0.51 0.34 >0.05
Nasion 0.53 0.26 0.47 0.35 >0.05
Right exocanthion 1.20 1.02 1.13 0.83 >0.05
Mid Pupil Right 0.73 0.60 0.83 0.68 >0.05
Orbitale Right 0.84 0.66 0.98 0.60 >0.05
Endocantion Right 0.57 0.36 0.66 0.51 >0.05
Endocantion Left 0.65 0.39 0.78 0.55 >0.05
Mid Pupil Left 0.69 0.43 0.83 0.50 >0.05
Orbitale Left 0.95 0.69 0.92 0.58 >0.05
Exocantion Left 1.02 0.76 1.12 0.72 >0.05
Pronasale 0.82 0.44 0.97 0.57 >0.05
Subnasale 1.56 1.14 1.90 1.47 >0.05
Alar Curvature Right 1.21 1.03 1.24 0.83 >0.05
Alar Curvature Left 1.35 0.93 1.11 0.77 >0.05
Alare Right 1.81 1.78 1.71 1.10 >0.05
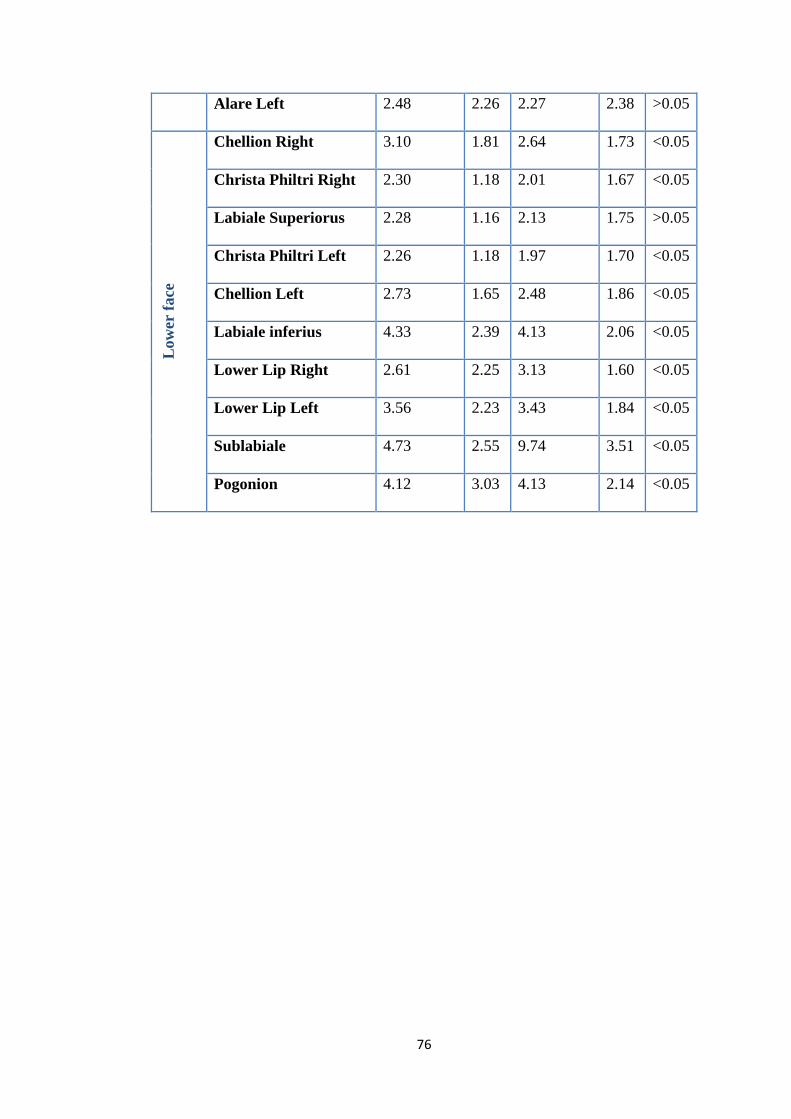
76
Alare Left 2.48 2.26 2.27 2.38 >0.05
Low
er fa
ce
Chellion Right 3.10 1.81 2.64 1.73 <0.05
Christa Philtri Right 2.30 1.18 2.01 1.67 <0.05
Labiale Superiorus 2.28 1.16 2.13 1.75 >0.05
Christa Philtri Left 2.26 1.18 1.97 1.70 <0.05
Chellion Left 2.73 1.65 2.48 1.86 <0.05
Labiale inferius 4.33 2.39 4.13 2.06 <0.05
Lower Lip Right 2.61 2.25 3.13 1.60 <0.05
Lower Lip Left 3.56 2.23 3.43 1.84 <0.05
Sublabiale 4.73 2.55 9.74 3.51 <0.05
Pogonion 4.12 3.03 4.13 2.14 <0.05
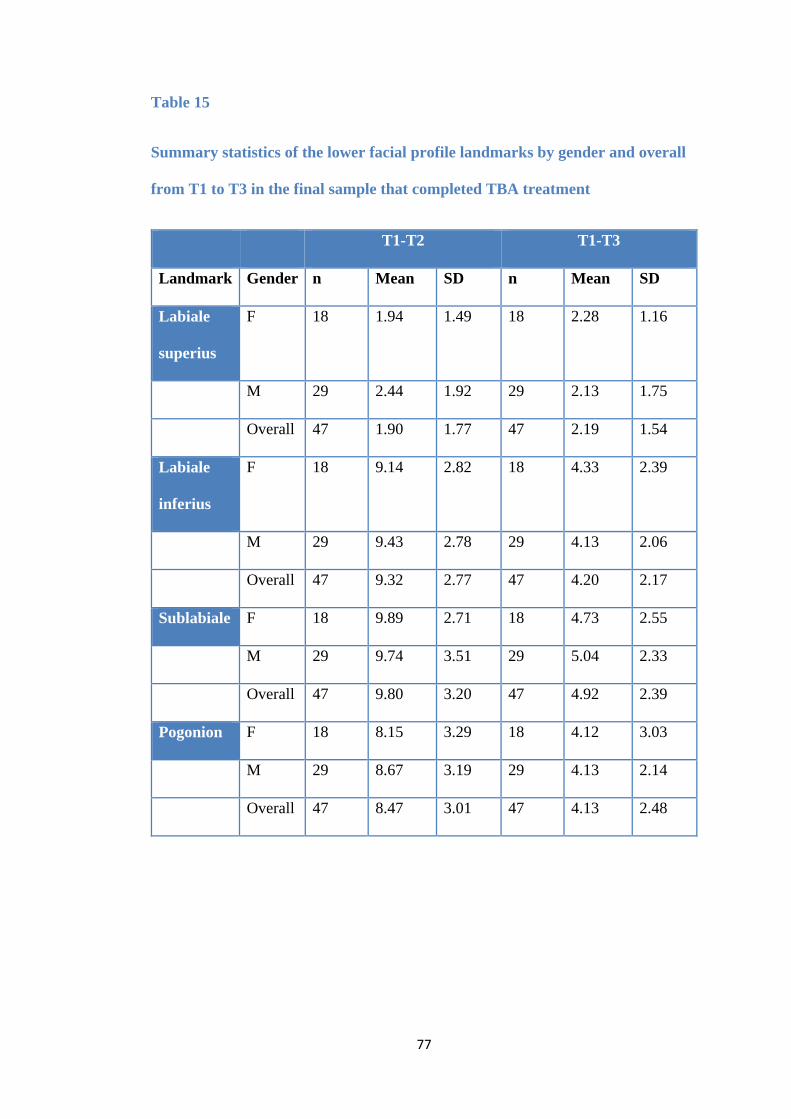
77
Table 15
Summary statistics of the lower facial profile landmarks by gender and overall
from T1 to T3 in the final sample that completed TBA treatment
T1-T2 T1-T3
Landmark Gender n Mean SD n Mean SD
Labiale
superius
F 18 1.94 1.49 18 2.28 1.16
M 29 2.44 1.92 29 2.13 1.75
Overall 47 1.90 1.77 47 2.19 1.54
Labiale
inferius
F 18 9.14 2.82 18 4.33 2.39
M 29 9.43 2.78 29 4.13 2.06
Overall 47 9.32 2.77 47 4.20 2.17
Sublabiale F 18 9.89 2.71 18 4.73 2.55
M 29 9.74 3.51 29 5.04 2.33
Overall 47 9.80 3.20 47 4.92 2.39
Pogonion F 18 8.15 3.29 18 4.12 3.03
M 29 8.67 3.19 29 4.13 2.14
Overall 47 8.47 3.01 47 4.13 2.48
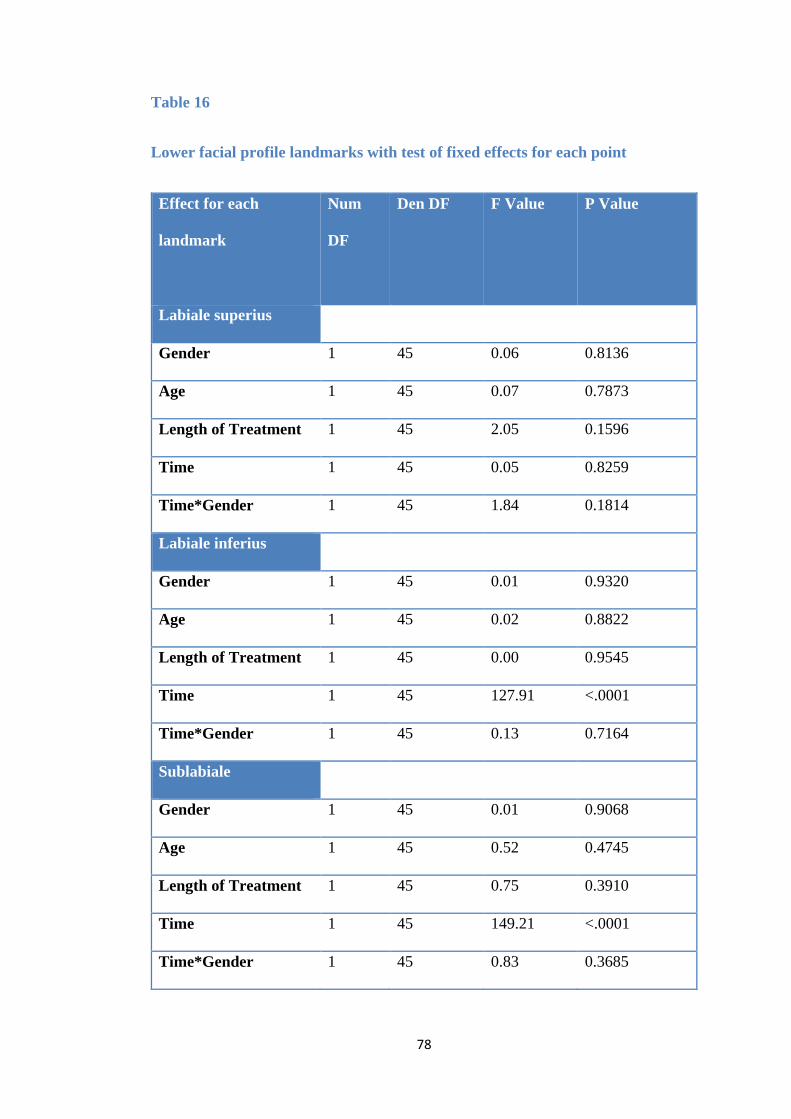
78
Table 16
Lower facial profile landmarks with test of fixed effects for each point
Effect for each
landmark
Num
DF
Den DF
F Value
P Value
Labiale superius
Gender 1 45 0.06 0.8136
Age 1 45 0.07 0.7873
Length of Treatment 1 45 2.05 0.1596
Time 1 45 0.05 0.8259
Time*Gender 1 45 1.84 0.1814
Labiale inferius
Gender 1 45 0.01 0.9320
Age 1 45 0.02 0.8822
Length of Treatment 1 45 0.00 0.9545
Time 1 45 127.91 <.0001
Time*Gender 1 45 0.13 0.7164
Sublabiale
Gender 1 45 0.01 0.9068
Age 1 45 0.52 0.4745
Length of Treatment 1 45 0.75 0.3910
Time 1 45 149.21 <.0001
Time*Gender 1 45 0.83 0.3685

79
Pogonion
Gender 1 45 0.21 0.6517
Age 1 45 0.15 0.7002
Length of Treatment 1 45 0.54 0.4673
Time 1 45 104.75 <.0001
Time*Gender 1 45 0.05 0.8274
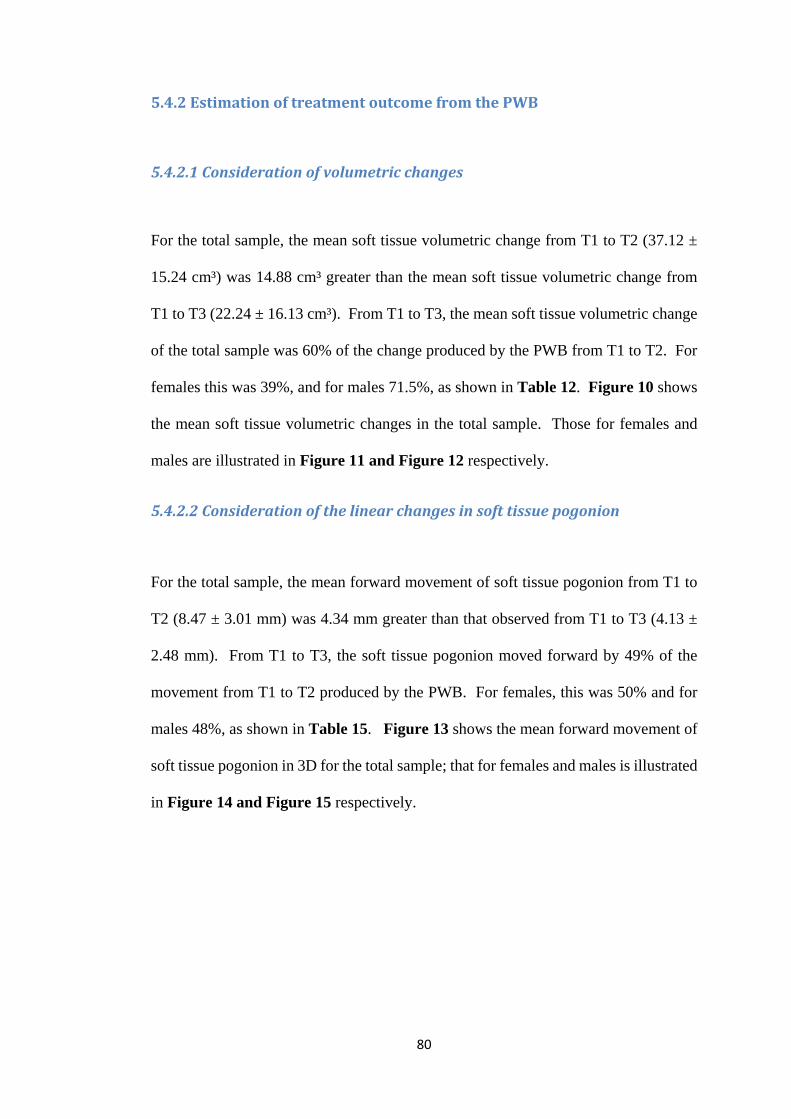
80
5.4.2 Estimation of treatment outcome from the PWB
5.4.2.1 Consideration of volumetric changes
For the total sample, the mean soft tissue volumetric change from T1 to T2 (37.12 ±
15.24 cm³) was 14.88 cm³ greater than the mean soft tissue volumetric change from
T1 to T3 (22.24 ± 16.13 cm³). From T1 to T3, the mean soft tissue volumetric change
of the total sample was 60% of the change produced by the PWB from T1 to T2. For
females this was 39%, and for males 71.5%, as shown in Table 12. Figure 10 shows
the mean soft tissue volumetric changes in the total sample. Those for females and
males are illustrated in Figure 11 and Figure 12 respectively.
5.4.2.2 Consideration of the linear changes in soft tissue pogonion
For the total sample, the mean forward movement of soft tissue pogonion from T1 to
T2 (8.47 ± 3.01 mm) was 4.34 mm greater than that observed from T1 to T3 (4.13 ±
2.48 mm). From T1 to T3, the soft tissue pogonion moved forward by 49% of the
movement from T1 to T2 produced by the PWB. For females, this was 50% and for
males 48%, as shown in Table 15. Figure 13 shows the mean forward movement of
soft tissue pogonion in 3D for the total sample; that for females and males is illustrated
in Figure 14 and Figure 15 respectively.
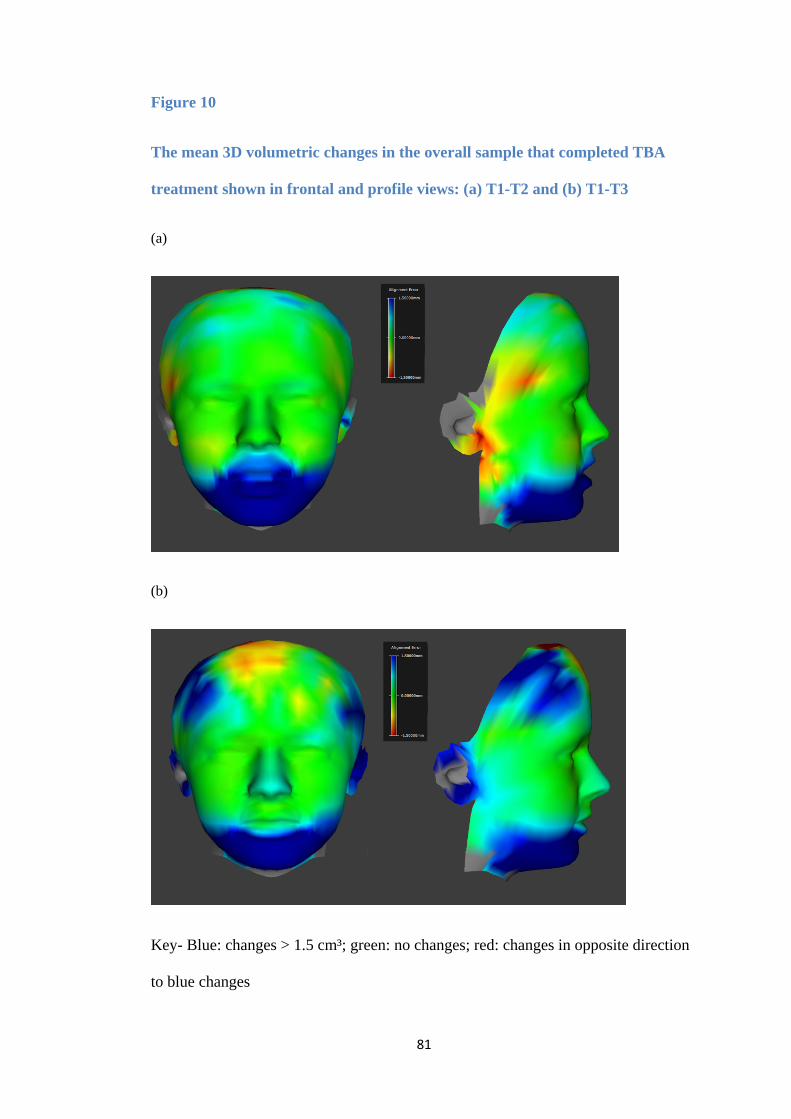
81
Figure 10
The mean 3D volumetric changes in the overall sample that completed TBA
treatment shown in frontal and profile views: (a) T1-T2 and (b) T1-T3
(a)
(b)
Key- Blue: changes > 1.5 cm³; green: no changes; red: changes in opposite direction
to blue changes
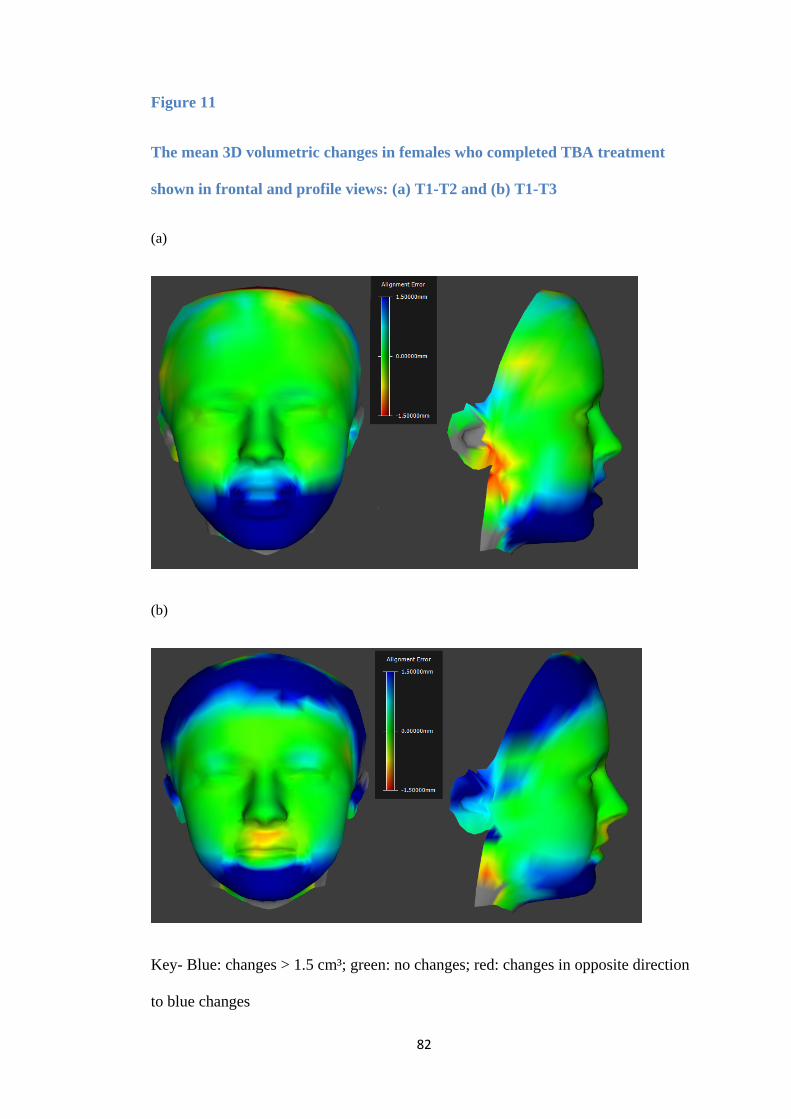
82
Figure 11
The mean 3D volumetric changes in females who completed TBA treatment
shown in frontal and profile views: (a) T1-T2 and (b) T1-T3
(a)
(b)
Key- Blue: changes > 1.5 cm³; green: no changes; red: changes in opposite direction
to blue changes
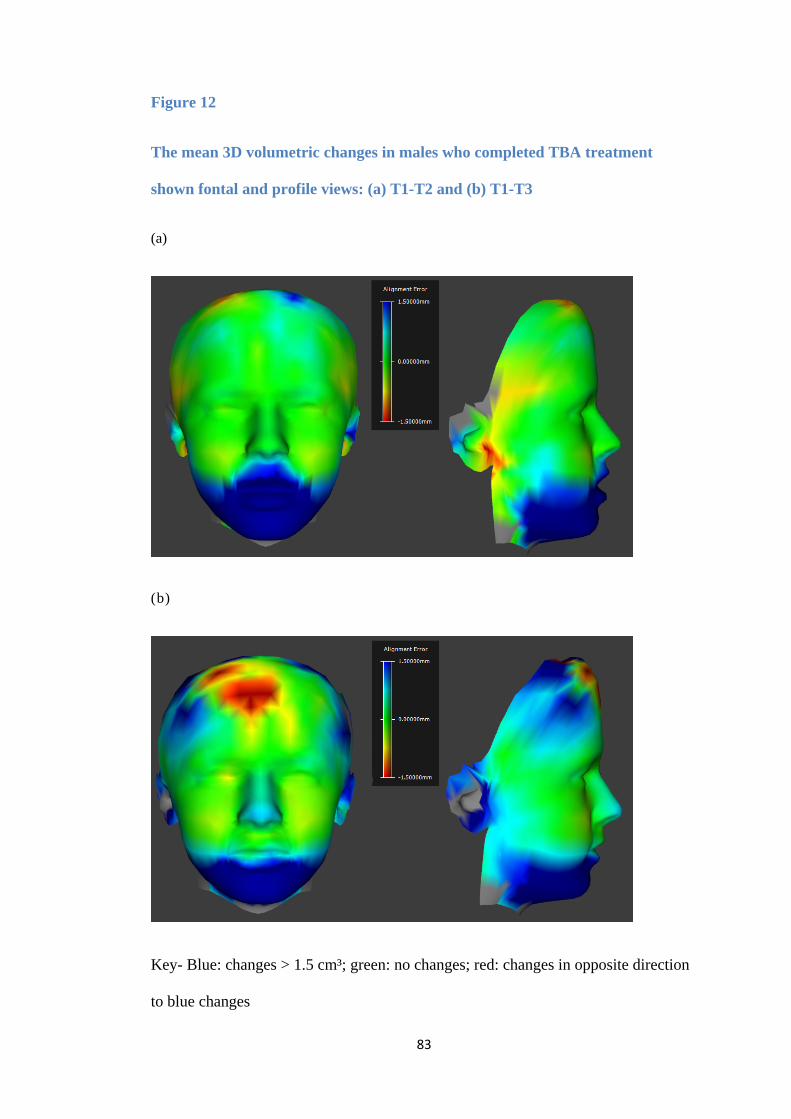
83
Figure 12
The mean 3D volumetric changes in males who completed TBA treatment
shown fontal and profile views: (a) T1-T2 and (b) T1-T3
(a)
(b)
Key- Blue: changes > 1.5 cm³; green: no changes; red: changes in opposite direction
to blue changes
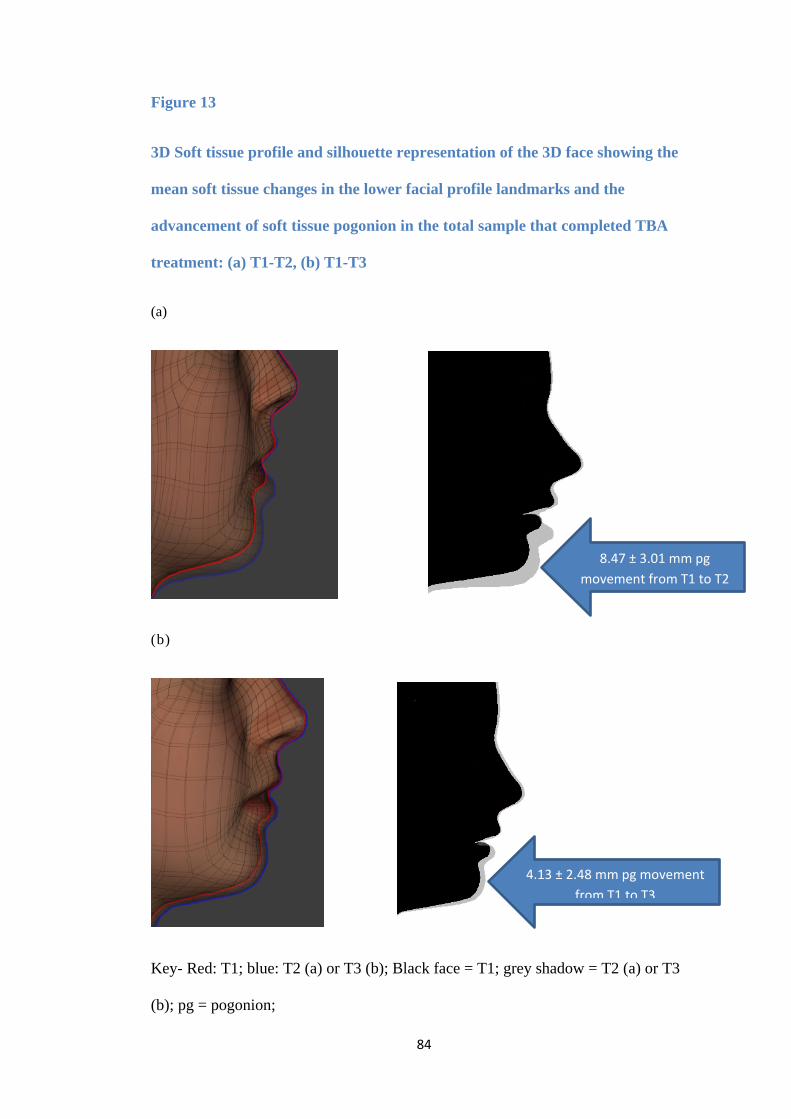
84
Figure 13
3D Soft tissue profile and silhouette representation of the 3D face showing the
mean soft tissue changes in the lower facial profile landmarks and the
advancement of soft tissue pogonion in the total sample that completed TBA
treatment: (a) T1-T2, (b) T1-T3
(a)
(b)
Key- Red: T1; blue: T2 (a) or T3 (b); Black face = T1; grey shadow = T2 (a) or T3
(b); pg = pogonion;
4.13 ± 2.48 mm pg movement from T1 to T3
8.47 ± 3.01 mm pg movement from T1 to T2
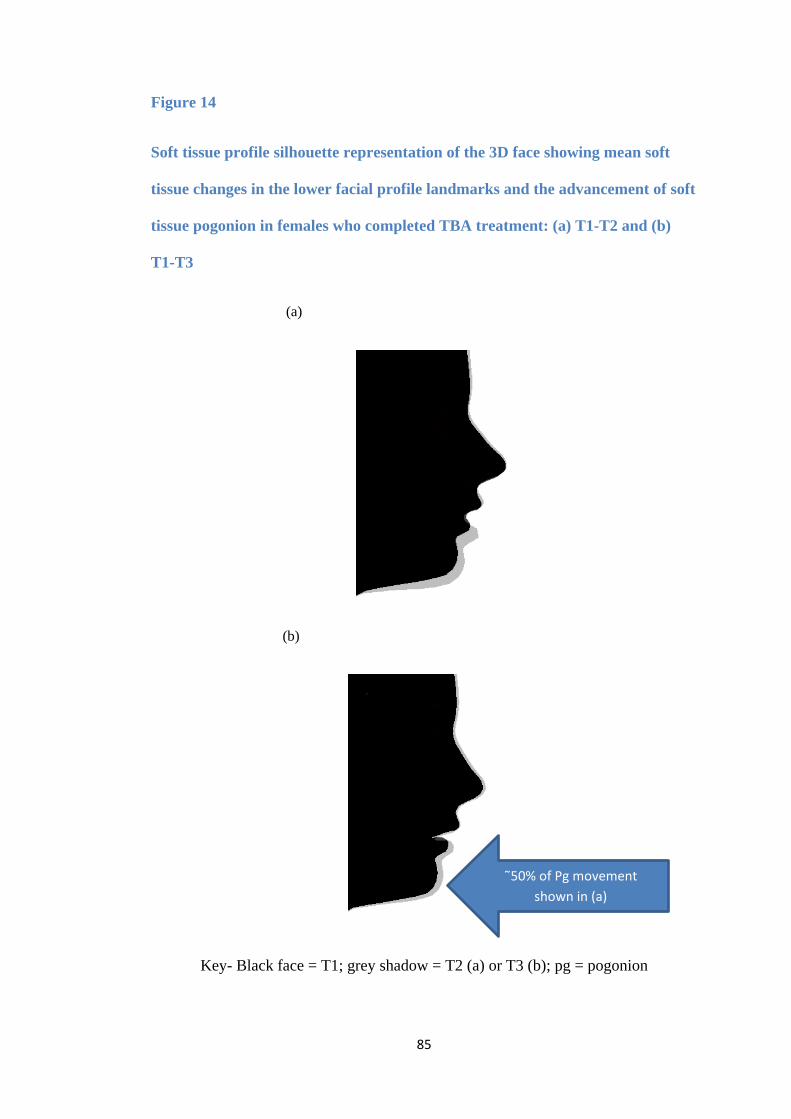
85
Figure 14
Soft tissue profile silhouette representation of the 3D face showing mean soft
tissue changes in the lower facial profile landmarks and the advancement of soft
tissue pogonion in females who completed TBA treatment: (a) T1-T2 and (b)
T1-T3
(a)
(b)
Key- Black face = T1; grey shadow = T2 (a) or T3 (b); pg = pogonion
˜50% of Pg movement shown in (a)
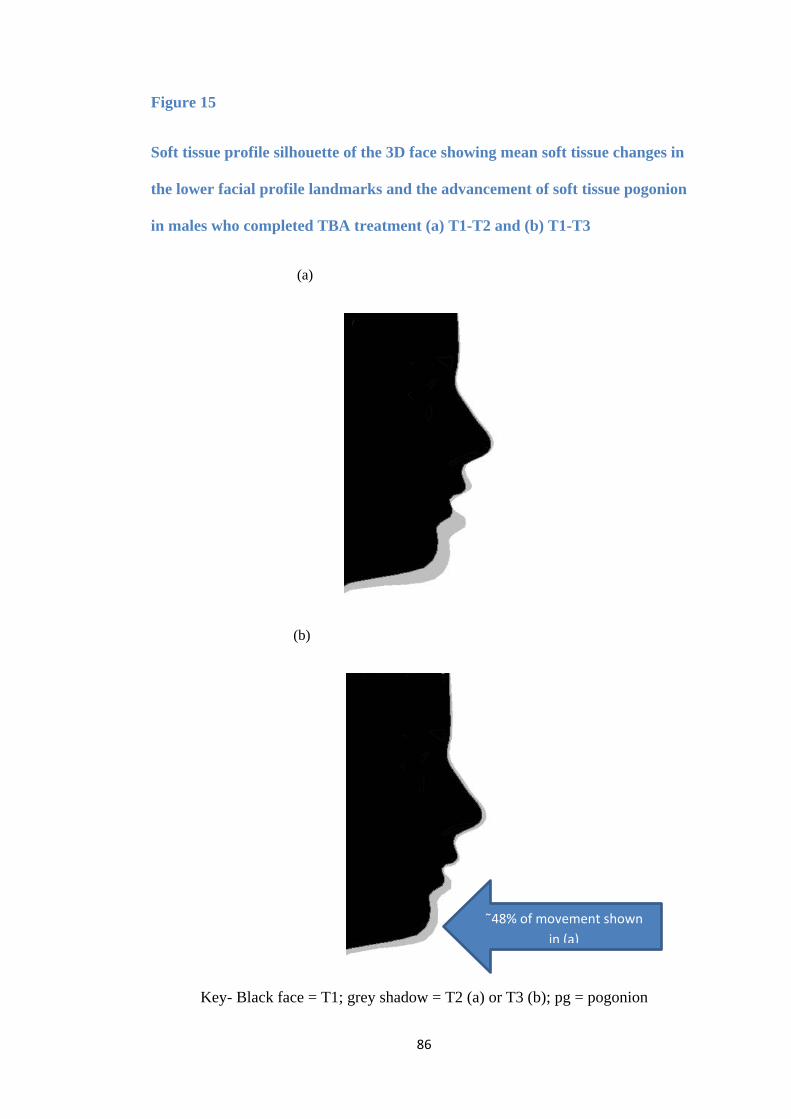
86
Figure 15
Soft tissue profile silhouette of the 3D face showing mean soft tissue changes in
the lower facial profile landmarks and the advancement of soft tissue pogonion
in males who completed TBA treatment (a) T1-T2 and (b) T1-T3
(a)
(b)
Key- Black face = T1; grey shadow = T2 (a) or T3 (b); pg = pogonion
˜48% of movement shown in (a)
87
5.4.3 The association of 3D facial parameters with successful TBA treatment as measured by reduction in the overjet
This was evaluated by studying the correlation between the facial parameters given in
Table 17 with the overjet reduction from T1 to T3 and the amount of overjet at T3.
Correlation was weak for all the soft tissue parameters studied. The correlation of
lower soft tissue facial profile landmarks with the overjet difference from T1 to T3
was analysed for females and males and presented in Table 18. All correlations were
weak for all the landmarks studied showing that successful TBA treatment outcome as
measured by the overjet reduction cannot be reliably associated with any facial or
lower soft tissue profile parameter.
5.4.4 Facial expression changes after treatment with the TBA (T1-T3)
5.4.4.1 At rest
For both male and female subjects, the facial expressions at rest were stable for all
upper landmarks except for subnasale, alare left and alare right. In contrast, all lower
landmarks showed significant changes from T1 to T3 (Table 19). These changes were
not significantly different for females and males (p-values > 0.05).
5.4.4.2 At natural smile
For females, all upper landmarks were stable, except for subnasale and all lower
landmarks showed significant changes. For males, all upper landmarks were also
88
stable; all lower landmarks showed significant changes except for sublabiale and
pogonion (Table 20).
5.4.3.3 At maximal smile
In females, all upper landmarks were stable except for subnasale, alare right and alare
left which showed some changes. For the lower landmarks, four points were stable
(labiale superius, christa philtre left, labiale inferius and pogonion) and all others
showed significant changes. In males, all upper and lower landmarks were stable and
did not change significantly (Table 21).
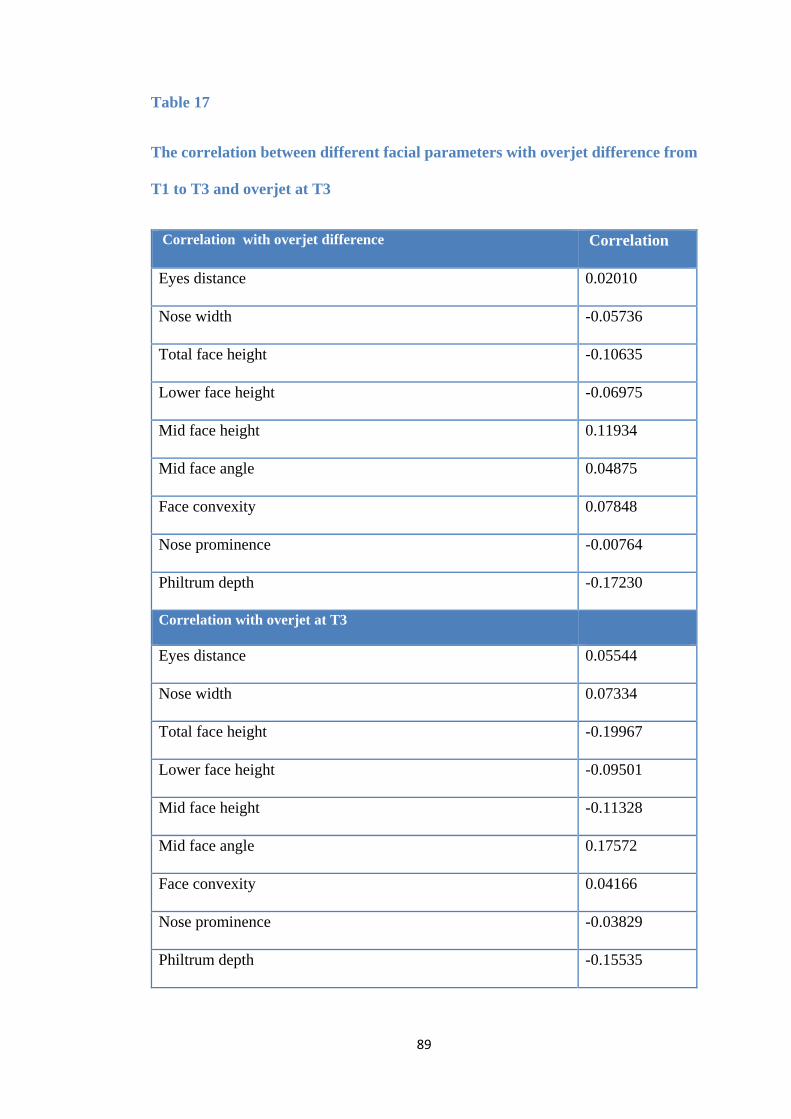
89
Table 17
The correlation between different facial parameters with overjet difference from
T1 to T3 and overjet at T3
Correlation with overjet difference Correlation
Eyes distance 0.02010
Nose width -0.05736
Total face height -0.10635
Lower face height -0.06975
Mid face height 0.11934
Mid face angle 0.04875
Face convexity 0.07848
Nose prominence -0.00764
Philtrum depth -0.17230
Correlation with overjet at T3
Eyes distance 0.05544
Nose width 0.07334
Total face height -0.19967
Lower face height -0.09501
Mid face height -0.11328
Mid face angle 0.17572
Face convexity 0.04166
Nose prominence -0.03829
Philtrum depth -0.15535
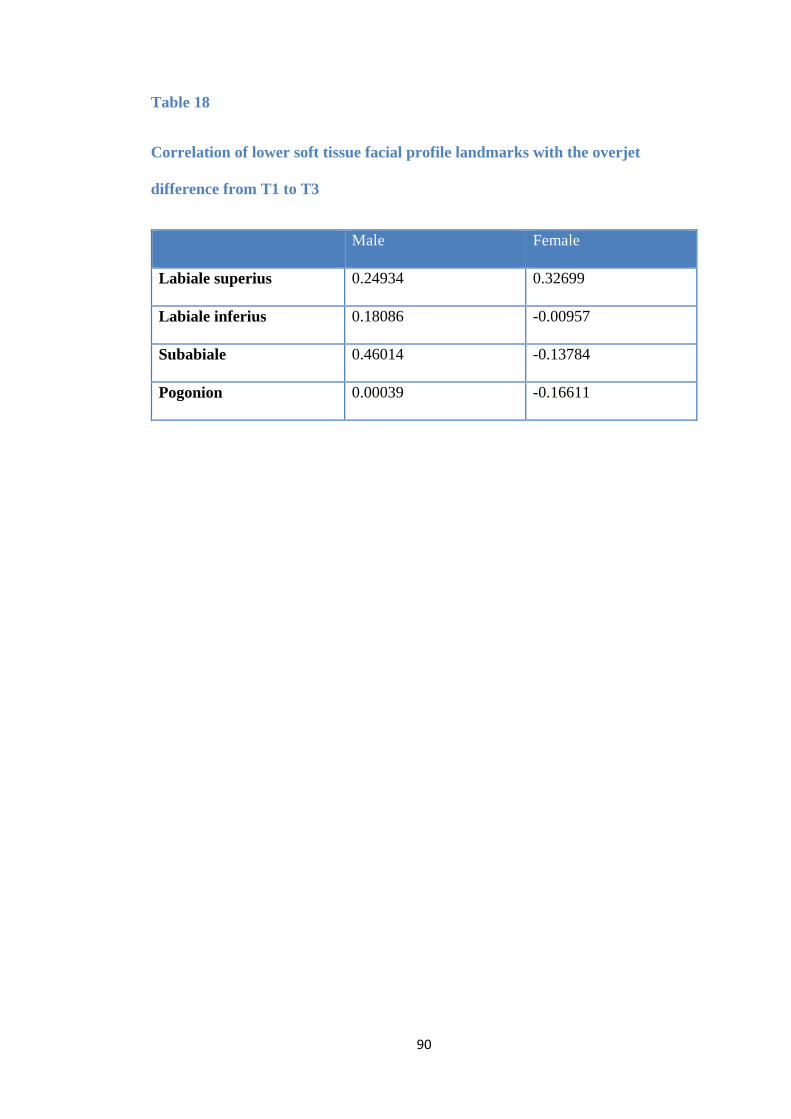
90
Table 18
Correlation of lower soft tissue facial profile landmarks with the overjet
difference from T1 to T3
Male Female
Labiale superius 0.24934 0.32699
Labiale inferius 0.18086 -0.00957
Subabiale 0.46014 -0.13784
Pogonion 0.00039 -0.16611
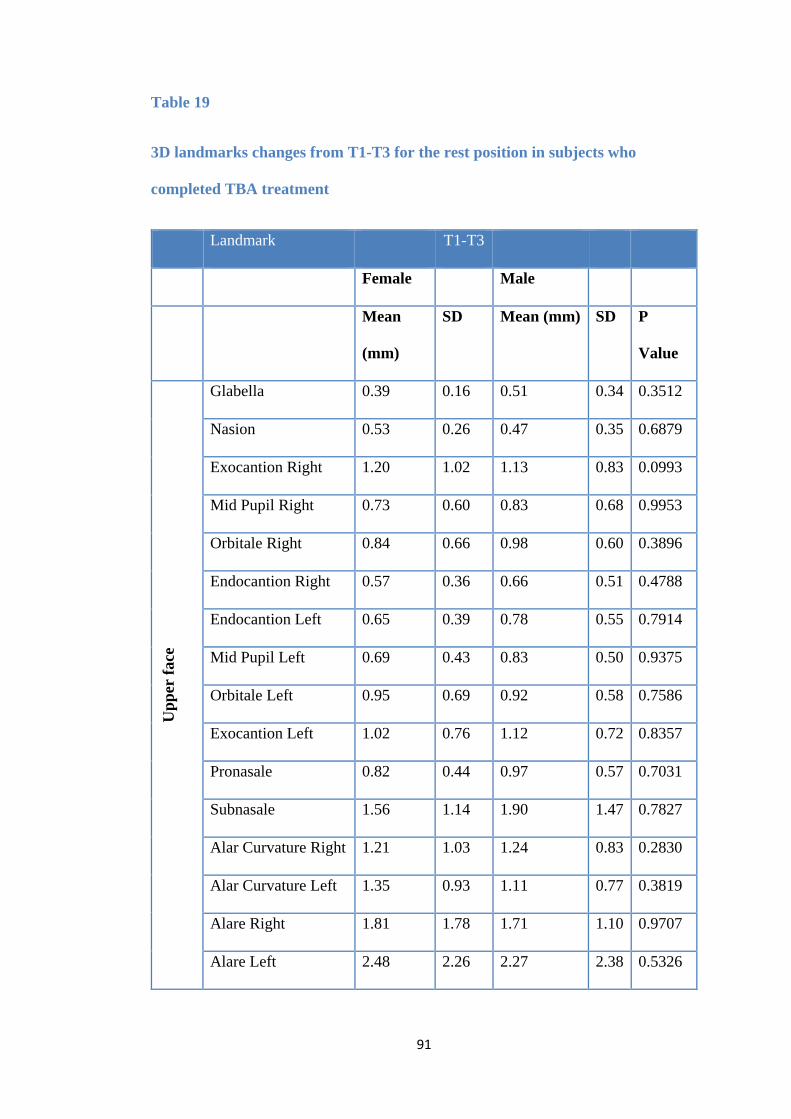
91
Table 19
3D landmarks changes from T1-T3 for the rest position in subjects who
completed TBA treatment
Landmark T1-T3
Female Male
Mean
(mm)
SD Mean (mm) SD P
Value
Upp
er fa
ce
Glabella 0.39 0.16 0.51 0.34 0.3512
Nasion 0.53 0.26 0.47 0.35 0.6879
Exocantion Right 1.20 1.02 1.13 0.83 0.0993
Mid Pupil Right 0.73 0.60 0.83 0.68 0.9953
Orbitale Right 0.84 0.66 0.98 0.60 0.3896
Endocantion Right 0.57 0.36 0.66 0.51 0.4788
Endocantion Left 0.65 0.39 0.78 0.55 0.7914
Mid Pupil Left 0.69 0.43 0.83 0.50 0.9375
Orbitale Left 0.95 0.69 0.92 0.58 0.7586
Exocantion Left 1.02 0.76 1.12 0.72 0.8357
Pronasale 0.82 0.44 0.97 0.57 0.7031
Subnasale 1.56 1.14 1.90 1.47 0.7827
Alar Curvature Right 1.21 1.03 1.24 0.83 0.2830
Alar Curvature Left 1.35 0.93 1.11 0.77 0.3819
Alare Right 1.81 1.78 1.71 1.10 0.9707
Alare Left 2.48 2.26 2.27 2.38 0.5326
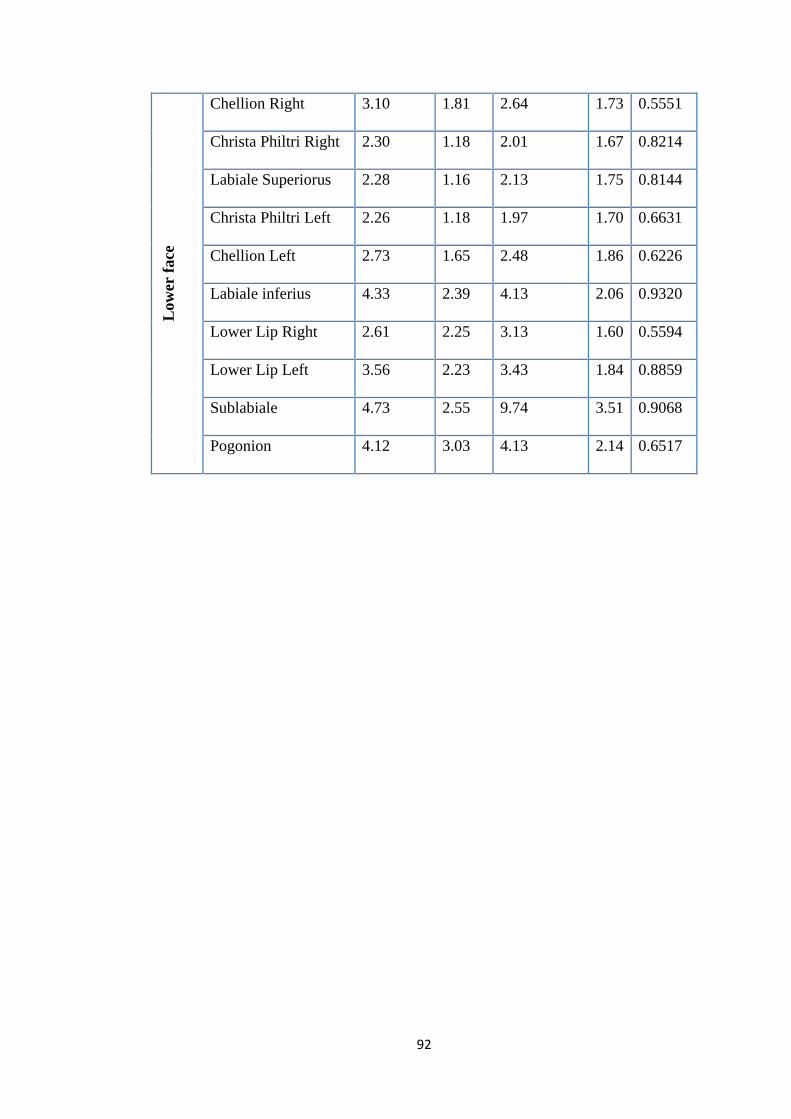
92
Low
er fa
ce
Chellion Right 3.10 1.81 2.64 1.73 0.5551
Christa Philtri Right 2.30 1.18 2.01 1.67 0.8214
Labiale Superiorus 2.28 1.16 2.13 1.75 0.8144
Christa Philtri Left 2.26 1.18 1.97 1.70 0.6631
Chellion Left 2.73 1.65 2.48 1.86 0.6226
Labiale inferius 4.33 2.39 4.13 2.06 0.9320
Lower Lip Right 2.61 2.25 3.13 1.60 0.5594
Lower Lip Left 3.56 2.23 3.43 1.84 0.8859
Sublabiale 4.73 2.55 9.74 3.51 0.9068
Pogonion 4.12 3.03 4.13 2.14 0.6517

93
Table 20
3D landmark changes from T1 to T3 for natural smile in subjects who completed TBA treatment
Landmark Smile T1 T3
Female Male Female Male
Mean
(mm)
SD Mean
(mm)
SD Mean
(mm)
SD Mean
(mm)
SD P Value
Upp
er fa
ce
Glabella 0.36 0.16 0.44 0.30 0.39 0.16 0.51 0.34 0.3512
Nasion 0.33 0.20 0.34 0.27 0.36 0.18 0.44 0.29 0.9957
Exocantion Right 1.61 1.56 1.71 1.12 2.19 1.55 2.20 1.42 0.6791
Mid Pupil Right 0.84 0.82 0.79 0.50 0.79 0.82 1.24 1.07 0.2046
Orbitale Right 0.83 0.84 0.77 0.53 1.36 1.00 1.02 0.89 0.7795
Endocantion Right 0.71 0.48 0.83 0.53 1.16 0.96 1.15 1.14 0.8805
Endocantion Left 0.68 0.52 0.84 0.53 0.88 0.58 1.20 0.90 0.2724
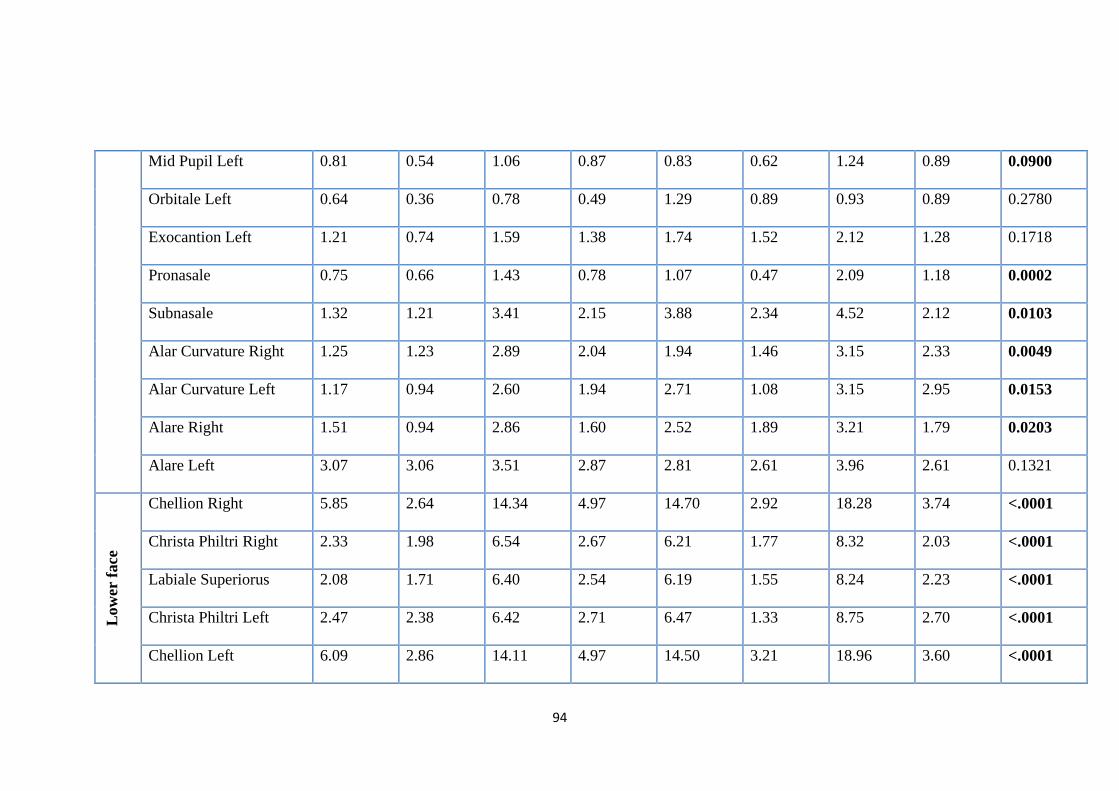
94
Mid Pupil Left 0.81 0.54 1.06 0.87 0.83 0.62 1.24 0.89 0.0900
Orbitale Left 0.64 0.36 0.78 0.49 1.29 0.89 0.93 0.89 0.2780
Exocantion Left 1.21 0.74 1.59 1.38 1.74 1.52 2.12 1.28 0.1718
Pronasale 0.75 0.66 1.43 0.78 1.07 0.47 2.09 1.18 0.0002
Subnasale 1.32 1.21 3.41 2.15 3.88 2.34 4.52 2.12 0.0103
Alar Curvature Right 1.25 1.23 2.89 2.04 1.94 1.46 3.15 2.33 0.0049
Alar Curvature Left 1.17 0.94 2.60 1.94 2.71 1.08 3.15 2.95 0.0153
Alare Right 1.51 0.94 2.86 1.60 2.52 1.89 3.21 1.79 0.0203
Alare Left 3.07 3.06 3.51 2.87 2.81 2.61 3.96 2.61 0.1321
Low
er fa
ce
Chellion Right 5.85 2.64 14.34 4.97 14.70 2.92 18.28 3.74 <.0001
Christa Philtri Right 2.33 1.98 6.54 2.67 6.21 1.77 8.32 2.03 <.0001
Labiale Superiorus 2.08 1.71 6.40 2.54 6.19 1.55 8.24 2.23 <.0001
Christa Philtri Left 2.47 2.38 6.42 2.71 6.47 1.33 8.75 2.70 <.0001
Chellion Left 6.09 2.86 14.11 4.97 14.50 3.21 18.96 3.60 <.0001
95
Labiale inferius 8.64 2.78 6.84 2.60 6.58 2.43 8.16 3.15 0.6719
Lower Lip Right 7.36 2.37 12.24 4.66 11.29 3.80 15.65 4.09 <.0001
Lower Lip Left 7.26 2.67 11.72 4.93 11.91 3.65 15.54 4.03 0.0004
Sublabiale 9.42 2.78 5.32 2.39 5.15 1.95 6.33 3.14 0.0246
Pogonion 7.82 2.88 4.94 2.44 3.96 2.82 5.99 2.98 0.7772
96
Table 21
3D landmark changes from T1 to T3 for the maximal smile in subjects who completed TBA treatment
Landmark Max Smile T1 T3
Female Male Female Male
Mean
(mm)
SD Mean
(mm)
SD Mean
(mm)
SD Mean
(mm)
SD P Value
Upp
er fa
ce
Glabella 0.54 0.19 0.83 0.91 0.90 1.48 0.83 0.57 0.4687
Nasion 0.55 0.18 0.97 1.27 0.79 1.00 0.72 0.52 0.3627
Exocantion Right 2.32 1.40 2.16 1.38 2.55 1.30 2.65 1.65 0.7564
Mid Pupil Right 1.04 0.78 1.52 0.98 1.57 1.35 1.66 1.10 0.0811
Orbitale Right 1.05 0.52 1.40 1.12 1.56 1.40 1.51 1.13 0.3832
Endocantion Right 1.25 0.56 1.22 0.70 1.63 1.08 1.35 1.12 0.1227
Endocantion Left 1.07 0.67 1.17 0.89 1.28 0.75 1.53 0.99 0.7878
97
Mid Pupil Left 1.19 0.67 1.54 1.17 1.52 1.12 1.61 1.13 0.7598
Orbitale Left 1.89 3.74 1.32 1.21 1.43 0.91 1.41 1.09 0.6951
Exocantion Left 2.48 3.70 2.00 1.26 2.01 0.99 2.53 1.48 0.5814
Pronasale 1.17 0.53 1.78 1.15 1.52 1.41 2.16 1.22 0.0202
Subnasale 2.81 1.86 3.80 2.38 4.43 3.01 4.50 2.54 0.2963
Alar Curvature Right 2.18 1.35 2.90 1.81 2.11 1.59 2.76 1.81 0.1631
Alar Curvature Left 1.93 1.28 2.84 1.72 2.32 1.13 2.97 2.43 0.1644
Alare Right 2.63 1.75 3.73 1.85 4.41 3.93 3.30 1.53 0.2200
Alare Left 5.45 4.13 4.51 2.75 3.66 2.72 4.08 2.38 0.9173
Low
er fa
ce
Chellion Right 12.42 4.91 17.44 4.16 15.34 3.45 17.48 4.85 0.0018
Christa Philtri Right 5.50 1.92 7.94 2.08 6.58 1.92 7.95 2.58 0.0004
Labiale Superiorus 5.60 2.08 7.95 2.10 6.54 1.95 7.76 2.28 0.0008
Christa Philtri Left 5.91 2.36 8.13 2.34 6.86 2.31 8.28 2.75 0.0052
Chellion Left 12.69 4.33 17.50 2.99 14.71 3.60 17.03 4.62 0.0005
98
Labiale inferius 6.52 3.63 8.53 2.80 6.56 2.48 8.26 3.18 0.0158
Lower Lip Right 10.13 3.86 15.03 4.79 11.47 2.98 15.26 4.61 <.0001
Lower Lip Left 10.28 3.01 14.44 2.92 11.26 3.08 14.46 4.88 0.0002
Sublabiale 4.24 2.48 5.96 3.07 5.50 2.08 6.09 3.48 0.1762
Pogonion 4.32 2.46 5.53 2.88 4.71 2.11 5.95 3.74 0.1393

99
CHAPTER SIX
DISCUSSION
100
6. Discussion
This would appear to be the first study to report the soft tissue 3D volumetric changes
following the TBA treatment; it is also the first study to estimate treatment outcome
of the TBA on the soft tissue profile using the PWB, and the first study to report on
changes of facial expression following TBA treatment. The association between soft
tissue parameters and successful treatment with the TBA as well as linear soft tissue
landmark changes following TBA treatment have all been reported previously in the
orthodontic literature. This chapter will discuss the study design and its findings in
more detail.
6.1 Study design
This was a prospective observational cohort study assessing the effects of the PWB
and the TBA on volumetric and linear soft tissue profile changes. The method of
evaluation was by 3D imaging, using the DI3D stereophotogrammetry system.
Previous prospective 3D cohort studies, similar to our study design, were undertaken
by Morris et al. (1998), McDonagh et al. (2001), Sharma and Lee (2005) and Lee et
al. (2007). However, they differed from our study in the following aspects: they
randomised subjects into more than one FA treatment group (one group at least
included TBA); they used a 2D evaluation method (lateral cephalometry) in addition
to 3D evaluation; their reported findings were only for the total sample (not gender
specific) and the study by Morris et al. (1998) compared treatment groups with
untreated controls.
6.2 Sample size and characteristics
101
The sample size was firstly estimated based on the following:
• Previous prospective studies on prediction of treatment outcome of the TBA
(Caldwell and Cook, 1999; Franchi and Baccetti, 2006; Al-Rahbi, 2014) and
studies that have reported on 3D facial profile changes (Morris et al., 1998;
McDonagh et al., 2001; Sharma and Lee, 2005; Lee et al., 2007).
• Reported dropouts due to poor compliance with TBA therapy, and this was in the
range of 20% (Banks et al., 2004a) up to 34% (O’Brien et al., 2003b).
• p < 0.05, this was in order to detect a clinically meaningful change of 1 mm in
any point’s position as by Johnston et al. (2003), Gwilliam et al. (2006) and Titiz
et al. (2012)
The sample size of studies mentioned in Section 6.1 ranged from 20-70 subjects. Our
final sample was 47 subjects which is exactly the same as the sample size in the study
by Morris et al. (1998). Our final sample comprised of 18 females and 29 males. The
reason for this gender imbalance is that during the initial sample recruitment, we had
less female subjects (25) in comparison to males (33), and the dropout rate was more
among female (7) than male subjects (4).
The dropout rate in this study (19%) was within the range of the previously reported
dropout rates associated with the TBA (O’Brien et al., 2003b; Banks et al., 2004a).
Eleven patients were lost due to:
• Poor compliance (3 patients)
• Unfavourable growth (4 patients)
• Change of treatment plan (2 patients)
• Failure to attend (2 patients).
102
The analysis of our final sample characteristics showed no difference between the
female and male treatment groups in terms of age at the start of treatment, initial
overjet and length of treatment. This was very important as it shows that, the effects
of gender difference on growth (age) and other variables (overjet and length of
treatment) were not significant and allowed the results for male and female subjects to
be combined.
6.3 Standardisation protocol
Attempts were made to minimize potential confounders on the treatment outcome.
This included the following:
• The bite registration technique was standardised by using the white “Projet Bite”
gauge for all treatment subjects (Section 4.3)
• The TBA design and treatment protocol were standardised for all subjects
(Section 4.3)
• The 3D scanning procedure was strictly standardised for all subjects (Section
4.4.5)
• Landmarking 3D models and data analyses were done by the same experienced
operator for all the subjects.
6.4 Landmarking error study
The reproducibility of all the previous landmarks used in this study have been
validated in studies by Farkas (1994) and Hajeer et al. (2002). The intra-observer
landmark identification error we observed was 0.562 mm. It has been reported
103
previously that the intra-observer reproducibility in landmarking 3D facial scans can
improve with frequency (Gwilliam et al., 2006).
Some previous studies have reported a landmarking error as low as 0.1 mm (Khambay
et al., 2008). However in that study the landmarking was done and assessed for
reproducibility on a plaster model, not on an actual 3D facial image; therefore, the
findings cannot be compared to ours. Campbell et al. (2012) have reported an error of
0.57 mm which was similar to our findings.
6.5 The 3D analyses
The statistical analyses of the data for each aim of this study, took account of all the
potential confounders such as the age, gender and length of treatment. This is
important as it was previously shown by Weeden et al. (2001) that the magnitude of
soft tissue and facial expression changes between females and males is different.
Later, Johnston et al. (2003) showed that reproducibility of facial expressions was also
different between genders.
6.5.1 Soft tissue volumetric and landmark changes
The findings of this study showed an increase in the volumetric and linear forward
movement of soft tissue landmarks mainly in the lower facial region produced by the
PWB and to a lesser extent post-TBA treatment. Although previous studies (Morris
et al., 1998; McDonagh et al., 2001; Sharma and Lee, 2005; Lee et al., 2007) have all
used colour mapping to make comparisons, they only reported on linear changes. Our
results showed a significant increase in the lower face soft tissue volume (37.12 ±
104
15.24 cm³) and in the forward displacement of soft tissue pogonion for females (4.12
± 3.03 mm) and males (4.13 ± 2.14 mm). This forward movement of soft tissue
pogonion was similar to the forward movement reported by Morris et al. (1998),
McDonagh et al. (2001), Sharma and Lee (2005) and Lee et al. (2007) which ranged
around 3-4 mm.
6.5.2 The estimation of the TBA treatment on the soft tissue profile outcome using the PWB
The soft tissue volumetric and linear advancement effects of the PWB were more than
those produced by the end of TBA treatment (Sections 5.4.1.1 and 5.4.1.2). The
clinical application of this finding may be to use the PWB as a guide, to estimate the
treatment outcome of the TBA on the soft tissue profile. This could be done clinically
by showing the patient and the parent the facial profile while the PWB is in place, then
explaining to them that the expected change in soft tissue profile after TBA treatment
should be around 70% in males or 40% in females of that produced by the PWB; the
expected final position of the soft tissue chin should be around 4 mm behind its
position observed with the PWB. Another possible way of illustrating this is to use
computer software such as Dolphin® to simulate the predicted changes. Digital
simulation will give the patient and the parent a more real time representation of the
expected changes with the TBA which could be useful during the informed consent
process.
There are no previous volumetric data available from the orthodontic literature to allow
comparison with our findings. They are, however, In broad agreement with the
findings of Vanderveken et al. (2011) who aimed to predict the treatment outcome of
105
OSA using a postured wax bite; we found that the PWB could also be used to estimate
TBA treatment outcome on the soft tissue profile (Section 2.5).
6.5.3 Soft tissue landmark variables associated with successful TBA treatment outcome
The findings of this study did not show a correlation between soft tissue variables and
successful treatment outcome as measured by the reduction in overjet. This was in
disagreement with the findings of Patel et al. (2002) and Al-Rahbi (2014) who both
reported that a retrusive soft tissue pogonion is associated with more skeletal change
and successful treatment as measured by the reduction in ANB and overjet reduction
respectively.
The reason for our findings being different to previous studies may be due to:
• Subjects in both of those studies were treated with the TBA to a pre-set length of
time (around 9 months); treatment was stopped at that stage regardless of a full
overjet reduction and then data were analysed. In our study, treatment was
continued until a normal overjet was achieved in all subjects; therefore, it is much
less likely to find a correlation between certain soft tissue variables and
successful overjet reduction.
• During our analyses the 3D data which involves three planes of space (x, y, z co-
ordinates), were compared to 2D data in the horizontal plane (overjet reduction).
Comparison of change in the x-co-ordinate data only with the overjet change may
have yielded a different result.
106
6.5.4 Facial expression changes
The assessment of changes in facial expressions from before to after TBA treatment
has not been reported previously in the orthodontic literature. In our study, this was
assessed for the upper and lower facial landmarks. The TBA is not expected to alter
upper facial expression landmarks because its mode of action is mainly directed toward
the lower facial region. If any changes of facial expression for the upper facial region
were observed, they would be most likely related to growth. Our findings showed that
TBA treatment had no effect on any of the upper facial landmarks at rest, natural smile
and maximal smile. In contrast, all the lower landmarks showed significant changes
for all facial expressions in both genders; this was with the exception of maximal smile
in male subjects where no significant changes were observed. The changes in the
lower facial expressions might have occured as a result of the forward displacement of
the mandible following growth and TBA treatment, and the subsequent changes in soft
tissues associated with these. The reason for not finding any facial expression changes
at maximal smile for male subjects, maybe due to, the different soft tissue tonicity and
maturation in males in comparison to females (Weeden et al., 2001).
Facial expression changes were measured by comparing soft tissue landmark changes
from T1 to T3 for each facial expression. For a change to be considered significant
the difference in points position from T1 to T3 must be > 1.5 mm (Johnston et al.,
2003; Gwilliam et al., 2006; Titiz et al., 2012).
6.6 Strengths of the study
• It is a prospective 3D study that investigated several new aspects in relation to
TBA treatment.
107
• The study used non-invasive 3D technology which has been validated for
accuracy.
• The sample size was considered adequate and within the range of previously
reported studies with a similar design.
• All patients were of the same ethnic background (all Caucasians) and the
treatment protocol, TBA design, bite registration technique and 3D imaging were
standardized.
• An error study was performed to check for intra-operator reliability and accuracy
during landmarking.
• All the findings were reported for the total sample as well as for each gender.
6.7 Weaknesses of the study
• It was not possible to account for changes due to growth because there was no
control group.
• The TBA was prescribed to patients based on the chronological age only.
Perhaps the pubertal growth spurt in some patients did not coincide with the
chronological age which might have affected the amount of soft tissue change in
those patients.
6.8 Future research
The ideal study should be conducted with a similar design, but adding a control group
to account for changes induced by natural growth. The reproducibility of facial
expressions before and after TBA treatment could also be assessed by taking 3D
images at two time points, 10-15 minutes apart, before and after TBA treatment.

108
Future studies can also use different types of functional appliances or have more than
one treatment groups to compare and contrast the effects of different FAs on soft tissue
changes.
A 3D comparison of TBA treatment outcome using different types of bite registration
techniques could also be conducted such as; project bite versus traditional use of thick
wax wafer or single advancement technique versus incremental advancement.

109
CHAPTER SEVEN
CONCLUSIONS
110
7. Conclusions
The aims and null hypotheses of this thesis were given in Chapter 3. The conclusions
together with the impact of the results on the null hypotheses are given below.
Aim 1: To identify 3D soft tissue volumetric and linear landmark changes following
treatment with the TBA
Conclusions
• TBA treatment, in growing subjects, increased the lower facial soft tissue
volume and this increase was slightly more for males.
• TBA treatment, in growing patients, caused forward movement of the lower
soft tissue facial profile landmarks (labiale inferius, sublabiale and pogonion)
and this was similar for females and males.
Null hypothesis 1: The TBA treatment has no effect on the 3D soft tissue volumetric
and linear landmark changes.
The null hypothesis is rejected.
Aim 2: To estimate the TBA treatment outcome on the soft tissue volumetric and linear
landmark changes from the Postured Wax Bite (PWB).
Conclusions:
• The estimated mean volumetric change in the soft tissues following a TBA
treatment was 60% of the mean volumetric change produced by the PWB (for
females ~ 40% and for males ~ 70%).
111
• The estimated change, for the lower facial profile (the chin and the lower lip),
following a TBA treatment was 4 mm behind the change produced by the PWB
(similar for females and males).
• The PWB is an easy, cheap and non-invasive tool that can be used to estimate
TBA treatment outcome on the soft tissues.
Null hypothesis 2: The PWB has no effect on the soft tissue volumetric and linear
landmark changes and it cannot be used to estimate the TBA treatment outcome on the
soft tissue profile.
The null hypothesis is rejected.
Aim 3: To identify if there is any association between certain soft tissue landmark
variables and successful treatment outcome of the TBA as measured by the reduction
in overjet.
Conclusion:
• No association was found between any soft tissue landmark variable and
successful overjet reduction after treatment with the TBA.
Null hypothesis 3: There is no association between any soft tissue landmark variable
and successful overjet reduction following treatment with the TBA
The null hypothesis is accepted
Aim 4: To assess the effects of TBA treatment on facial expressions at rest, natural
smile and maximal smile.
Conclusions
112
• TBA treatment had no effect on the upper facial landmarks for each facial
expression.
• TBA treatment changed the facial expressions for the lower landmarks except for
maximum smile in males.
Null hypothesis 4: Treatment with the TBA has no effect on the facial expressions
at rest, natural smile and maximal smile
The null hypothesis is accepted for the upper landmarks and rejected for the lower
landmarks except for maximum smile in males.

113
CHAPTER EIGHT
REFERENCES
114
8. References
ACKERMAN, J., ACKERMAN, M., BRENSINGER, C. & LANDIS, J. 1998. A
morphometric analysis of the posed smile. Clinical Orthodontics and
Research, 1, 2-11.
ADAMS, G. L., GANSKY, S. A., MILLER, A. J., HARRELL JR, W. E. &
HATCHER, D. C. 2004. Comparison between traditional 2-dimensional
cephalometry and a 3-dimensional approach on human dry skulls. American
Journal of Orthodontics and Dentofacial Orthopedics, 126, 397-409.
AELBERS, C. & DERMAUT, L. 1996. Orthopedics in orthodontics: Part I, fiction
or reality a—review of the literature. American Journal of Orthodontics and
Dentofacial Orthopedics, 110, 513-519.
AHLGREN, J. & LAURIN, C. 1976. Late results of activator-treatment: a
cephalometric study. British Journal of Orthodontics, 3, 181-187.
AHN, S.-J., KIM, J.-T. & NAHM, D.-S. 2001. Cephalometric markers to consider in
the treatment of Class II Division 1 malocclusion with the bionator. American
Journal of Orthodontics and Dentofacial Orthopedics, 119, 578-586.
AL-RAHBI, A. 2014. Prediction of favourable Twin Block appliance outcomes
using three-dimensional laser scanning (unpublished Masters thesis , Cardiff
University, 2014).
ALDRIDGE, K., BOYADJIEV, S. A., CAPONE, G. T., DELEON, V. B. &
RICHTSMEIER, J. T. 2005. Precision and error of three-dimensional
phenotypic measures acquired from 3dMD photogrammetric images.
American Journal Medical Genetics Part A, 138A, 247-53.
AMERICAN SOCIETY OF PHOTOGRAMMETRY, T. M. M. 1966. Manual of
photogrammetry. Editor-in-chief Morris M. Thompson, associate editors
115
Robert C. Eller, William A. Radlinski [and] Julius L. Speert, Falls Church,
Va.
AYOUB, A., GARRAHY, A., HOOD, C., WHITE, J., BOCK, M., SIEBERT, J. P.,
SPENCER, R. & RAY, A. 2003. Validation of a vision-based, three-
dimensional facial imaging system. Cleft Palate Craniofacial Journal, 40,
523-9.
AYOUB, A. F., WRAY, D., MOOS, K. F., SIEBERT, P., JIN, J., NIBLETT, T. B.,
URQUHART, C. & MOWFORTH, R. 1996. Three-dimensional modeling for
modern diagnosis and planning in maxillofacial surgery. International
Journal Adult Orthodontic Orthognathic Surgery, 11, 225-33.
BACCETTI, T., FRANCHI, L., TOTH, L. R. & MCNAMARA JR, J. A. 2000.
Treatment timing for Twin-block therapy. American Journal of Orthodontics
and Dentofacial Orthopedics, 118, 159-170.
BANKS, P., WRIGHT, J. & O'BRIEN, K. 2004a. Incremental versus maximum bite
advancement during twin-block therapy: a randomized controlled clinical
trial. American Journal of Orthodontics and Dentofacial Orthopedics, 126,
583-588.
BANKS, P., WRIGHT, J. & O'BRIEN, K. 2004b. Incremental versus maximum bite
advancement during twin-block therapy: a randomized controlled clinical
trial. American Journal of Orthodontics and Dentofacial Orthopedics, 126,
583-8.
BARTON, S. & COOK, P. A. 1997. Predicting functional appliance treatment
outcome in Class II malocclusions–a review. American Journal of
Orthodontics and Dentofacial Orthopedics, 112, 282-286.
BAYSAL, A. & UYSAL, T. 2013. Soft tissue effects of Twin Block and Herbst
appliances in patients with Class II division 1 mandibular retrognathy.
European Journal Orthodontics, 35, 71-81.
116
BENINGTON, P.C.M, KHAMBAY, B.S., AYOUB, A.F. 2010. An overview of
three-dimensional imaging in dentistry. Dental Update, 37, 494-508.
BILL, J. S., REUTHER, J. F., DITTMANN, W., KUBLER, N., MEIER, J. L.,
PISTNER, H. & WITTENBERG, G. 1995. Stereolithography in oral and
maxillofacial operation planning. International Journal Oral Maxillofacial
Surgery, 24, 98-103.
BISHARA, S. E. & ZIAJA, R. R. 1989. Functional appliances: a review. American
Journal of Orthodontics and Dentofacial Orthopedics, 95, 250-258.
BONDEVIK, O. 1991. How effective is the combined activator-headgear treatment?
The European Journal of Orthodontics, 13, 482-485.
BOURNE, C. O., KERR, W. J. & AYOUB, A. F. 2001. Development of a three-
dimensional imaging system for analysis of facial change. Clinical
Orthodontic Research, 4, 105-111.
BRUNHARO, I. H. V. P., QUINTÃO, C. A., ALMEIDA, M. A. D. O., MOTTA, A.
& BARRETO, S. Y. N. 2011. Alterações dentoesqueléticas decorrentes do
tratamento com aparelho ortopédico funcional Twin Block em pacientes
portadores de má oclusão de Classe II esquelética. Dental Press Journal of
Orthodontics, 16, 1-8.
BURKE, P. & BEARD, L. 1967. Stereophotogrammetry of the face: a preliminary
investigation into the accuracy of a simplified system evolved for contour
mapping by photography. American Journal of Orthodontics, 53, 769-782.
BURRES, S. A. 1985. Facial biomechanics: the standards of normal. The
Laryngoscope, 95, 708-714.
CALDWELL, S. & COOK, P. 1999. Predicting the outcome of twin block functional
appliance treatment: a prospective study. European Journal of Orthodontics,
21, 533.
117
CAMPBELL, C. M., MILLETT, D. T., O'CALLAGHAN, A., MARSH, A.,
MCINTYRE, G. T. & CRONIN, M. 2012. The effect of increased overjet on
the magnitude and reproducibility of smiling in adult females. European
Journal Orthodontics, 34, 640-5.
CATHERWOOD, T., MCCAUGHAN, E., GREER, E., SPENCE, R. A.,
MCINTOSH, S. A. & WINDER, R. J. 2011. Validation of a passive
stereophotogrammetry system for imaging of the breast: a geometric analysis.
Medical Engineering & Physics, 33, 900-5.
CHADWICK, S., BANKS, P. & WRIGHT, J. 1998. The use of myofunctional
appliances in the UK: a survey of British orthodontists. Dental Update, 25,
302.
CHARRON, C. 1989. Recherche defilements pronostiques quant a l’effecacite de
l’Activateur en occlusion de classe II d’Angle. Orthodontie Française, 60,
685-693.
CHEN, J. Y., WILL, L. A. & NIEDERMAN, R. 2002. Analysis of efficacy of
functional appliances on mandibular growth. American Journal of
Orthodontics and Dentofacial Orthopedics, 122, 470-476.
CHINTAKANON, K., TURKER, K. S., SAMPSON, W., WILKINSON, T. &
TOWNSEND, G. 2000. Effects of twin-block therapy on protrusive muscle
functions. American Journal of Orthodontics and Dentofacial Orthopedics,
118, 392-6.
CLARK, W. 1988. The twin block technique A functional orthopedic appliance
system. American Journal of Orthodontics and Dentofacial Orthopedics, 93,
1-18.
CLARK, W. 2010. Design and management of Twin Blocks: reflections after 30
years of clinical use. Journal of Orthodontics, 37, 209-16.
118
CLARK, W. J. 1982. The twin block traction technique. The European Journal of
Orthodontics, 4, 129-138.
CLARK, W. J. 2011. New Horizons In Orthodontics. Journal of Orthodontics, 38,
150; discussion 150-1.
CLARK, W. J. & BAKER, G. G. 1995. Twin block functional therapy: applications
in dentofacial orthopaedics, Mosby-Wolfe.
COZZA, P., BACCETTI, T., FRANCHI, L., DE TOFFOL, L. & MCNAMARA JR,
J. A. 2006. Mandibular changes produced by functional appliances in Class II
malocclusion: a systematic review. American Journal of Orthodontics and
Dentofacial Orthopedics, 129, 599. e1-599. e12.
DE MENEZES, M., ROSATI, R., ALLIEVI, C. & SFORZA, C. 2009. A
photographic system for the three-dimensional study of facial morphology.
Angle Orthodontist, 79, 1070-7.
DYER, F. M., MCKEOWN, H. F. & SANDLER, P. J. 2001. The modified twin
block appliance in the treatment of Class II division 2 malocclusions. Journal
of Orthodontics, 28, 271-80.
EHSANI, S., NEBBE, B., NORMANDO, D., LAGRAVERE, M. O. & FLORES-
MIR, C. 2014. Short-term treatment effects produced by the Twin-block
appliance: a systematic review and meta-analysis. European Journal of
Orthodontics.
FARKAS, L. 1994. Anthropometry of the head and face. 1994. Raven Press, New
York.
FARKAS, L. G. & DEUTSCH, C. K. 1996. Anthropometric determination of
craniofacial morphology. American Journal Medical Genetics, 65, 1-4.
119
FERRARIO, V. F., SFORZA, C., POGGIO, C. E. & SERRAO, G. 1996. Facial
three-dimensional morphometry. American Journal of Orthodontics and
Dentofacial Orthopedics, 109, 86-93.
FLEMING, P. S., QURESHI, U., PANDIS, N., DIBIASE, A. & LEE, R. T. 2012. An
investigation of cephalometric and morphological predictors of successful
twin block therapy. Australian Orthodontic Journal, 28, 190-6.
FLORES-MIR, C., MAJOR, M. P. & MAJOR, P. W. 2006. Soft tissue changes with
fixed functional appliances in Class II division 1: a systematic review. Angle
Orthodontist, 76, 712-720.
FLORES-MIR, C. & MAJOR, P. W. 2006a. Cephalometric facial soft tissue changes
with the twin block appliance in Class II division 1 malocclusion patients. A
systematic review. Angle Orthodontist, 76, 876-81.
FLORES-MIR, C. & MAJOR, P. W. 2006b. A systematic review of cephalometric
facial soft tissue changes with the Activator and Bionator appliances in Class
II division 1 subjects. The European Journal of Orthodontics, 28, 586-593.
FRANCHI, L. & BACCETTI, T. 2006. Prediction of individual mandibular changes
induced by functional jaw orthopedics followed by fixed appliances in Class
II patients. The Angle Orthodontist, 76, 950-954.
GHODDOUSI, H., EDLER, R., HAERS, P., WERTHEIM, D. & GREENHILL, D.
2007. Comparison of three methods of facial measurement. International
Journal of Oral and Maxillofacial Surgery, 36, 250-8.
GILL, D. S. & LEE, R. T. 2005. Prospective clinical trial comparing the effects of
conventional Twin-block and mini-block appliances: Part 1. Hard tissue
changes. American Journal of Orthodontics and Dentofacial Orthopedics,
127, 465-72; quiz 517.
GRABER, T. M., NEUMANN, B., SCHWARZ, A. M. & GRATZINGER, M. 1984.
Removable orthodontic appliances, Saunders.
120
GRAY, C. F., STAFF, R. T., REDPATH, T. W., NEEDHAM, G. & RENNY, N. M.
2000. Assessment of maxillary sinus volume for the sinus lift operation by
three-dimensional magnetic resonance imaging. Dentomaxillofacial
Radiology, 29, 154-8.
GRAYSON, B., CUTTING, C., BOOKSTEIN, F. L., KIM, H. & MCCARTHY, J.
G. 1988. The three-dimensional cephalogram: theory, technique, and clinical
application. American Journal of Orthodontics and Dentofacial Orthopedics,
94, 327-37.
GWILLIAM, J. R., CUNNINGHAM, S. J. & HUTTON, T. 2006. Reproducibility of
soft tissue landmarks on three-dimensional facial scans. European Journal of
Orthodontics, 28, 408-415.
HAGG, U. & TARANGER, J. 1982. Maturation indicators and the pubertal growth
spurt. American Journal of Orthodontics and Dentofacial Orthopedics, 82,
299-309.
HAJEER, M., MILLETT, D., AYOUB, A. & SIEBERT, J. 2004. Current products
and practices applications of 3D imaging in orthodontics: part I. Journal of
Orthodontics, 31, 62-70.
HAJEER, M. Y., AYOUB, A. F., MILLETT, D., BOCK, M. & SIEBERT, J. 2002.
Three-dimensional imaging in orthognathic surgery: the clinical application
of a new method. International Journal of Adult Orthodontics and
Orthognathic Surgery, 17, 318.
HAMADA, Y., KONDOH, T., NAKAOKA, K. & SETO, K. 2000. Magnetic
resonance imaging findings and clinical symptoms in the temporomandibular
joint in patients with mandibular continuity defects. Journal of Oral and
Maxillofacial Surgery, 58, 487-93; discussion 493-4.
HARRADINE, N. & GALE, D. 2000. The effects of torque control spurs in twin‐
block appliances. Clinical Orthodontics and Research, 3, 202-209.
121
HELL, B. 1995. 3D sonography. International Journal of Oral and Maxillofacial
Surgery, 24, 84-9.
HILLESUND, E., FJELD, D. & ZACHRISSON, B. 1978. Reliability of soft-tissue
profile in cephalometrics. American Journal of Orthodontics and Dentofacial
Orthopedics 74, 537-550.
ILLING, H. M., MORRIS, D. O. & LEE, R. T. 1998. A prospective evaluation of
bass, bionator and twin block appliances. Part I-the hard tissues. European
Journal of Orthodontics, 20, 501-516.
INCRAPERA, A. K., KAU, C. H., ENGLISH, J. D., MCGRORY, K. & SARVER,
D. M. 2010. Soft tissue images from cephalograms compared with those from
a 3D surface acquisition system. Angle Orthodontist, 80, 58-64.
IRELAND, A. J., MCDONALD, F. & IRELAND, A. 2003. The orthodontic patient:
treatment and biomechanics, Oxford University Press.
JENA, A. K., DUGGAL, R. & PARKASH, H. 2006. Skeletal and dentoalveolar
effects of Twin-block and bionator appliances in the treatment of Class II
malocclusion: a comparative study. American Journal of Orthodontics and
Dentofacial Orthopedics, 130, 594-602.
JOHNSTON, D. J., MILLETT, D., AYOUB, A. & BOCK, M. 2003. Are facial
expressions reproducible? Cleft Palate-Craniofacial Journal, 40, 291-296.
KAU, C. H. & RICHMOND, S. 2010. Three-Dimensional Imaging for Orthodontics
and Maxillofacial Surgery, Wiley-Blackwell.
KAU, C. H., RICHMOND, S., INCRAPERA, A., ENGLISH, J. & XIA, J. J. 2007.
Three-dimensional surface acquisition systems for the study of facial
morphology and their application to maxillofacial surgery. International
Journal Medical Robotics, 3, 97-110.
122
KAU, C. H., RICHMOND, S., ZHUROV, A. I., KNOX, J., CHESTNUTT, I.,
HARTLES, F. & PLAYLE, R. 2005. Reliability of measuring facial
morphology with a 3-dimensional laser scanning system. American Journal
of Orthodontics and Dentofacial Orthopedics, 128, 424-30.
KAU, C. H., ZHUROV, A., RICHMOND, S., BIBB, R., SUGAR, A., KNOX, J. &
HARTLES, F. 2006. The 3-dimensional construction of the average 11-year-
old child face: a clinical evaluation and application. Journal of Oral and
Maxillofacial Surgery, 64, 1086-92.
KAWAI, T., NATSUME, N., SHIBATA, H. & YAMAMOTO, T. 1990. Three-
dimensional analysis of facial morphology using moire stripes. Part I.
Method. International Journal of Oral and Maxillofacial Surgery, 19, 356-8.
KHAMBAY, B., NAIRN, N., BELL, A., MILLER, J., BOWMAN, A. & AYOUB,
A. 2008. Validation and reproducibility of a high-resolution three-
dimensional facial imaging system. British Journal of Oral and Maxillofacial
Surgery, 46, 27-32.
KINGSLEY, N. W. 1880. A treatise on oral deformities as a branch of mechanical
surgery, D. Appleton.
KORETSI, V., ZYMPERDIKAS, V. F., PAPAGEORGIOU, S. N. &
PAPADOPOULOS, M. A. 2014. Treatment effects of removable functional
appliances in patients with Class II malocclusion: a systematic review and
meta-analysis. European Journal of Orthodontics.
LEE, R., KYI, C. & MACK, G. 2007. A controlled clinical trial of the effects of the
Twin Block and Dynamax appliances on the hard and soft tissues. European
Journal of Orthodontics, 29, 272-282.
LEIVESLEY, W. D. 1983. The reliability of contour photography for facial
measurements. British Journal of Orthodontics, 10, 34-7.
123
LUND, D. I. & SANDLER, P. J. 1998. The effects of Twin Blocks: a prospective
controlled study. American Journal of Orthodontics and Dentofacial
Orthopedics, 113, 104-10.
LUO, Y. & FANG, G. 2005. [Effect of Twin-block appliance in the treatment of
Class II and division I malocclusion: a cephalometric study in 12 patients].
Shanghai Kou Qiang Yi Xue, 14, 90-3.
MAH, J. K., DANFORTH, R. A., BUMANN, A. & HATCHER, D. 2003. Radiation
absorbed in maxillofacial imaging with a new dental computed tomography
device. Oral Surgery, Oral Medicine, Oral Pathology, Oral Radiology and
Endodontology, 96, 508-13.
MARSICO, E., GATTO, E., BURRASCANO, M., MATARESE, G. &
CORDASCO, G. 2011. Effectiveness of orthodontic treatment with
functional appliances on mandibular growth in the short term. American
Journal of Orthodontics and Dentofacial Orthopedics, 139, 24-36.
MCDONAGH, S., MOSS, J., GOODWIN, P. & LEE, R. 2001. A prospective optical
surface scanning and cephalometric assessment of the effect of functional
appliances on the soft tissues. European Journal of Orthodontics, 23, 115-
126.
MCNAMARA JR, J. A. 1973. Neuromuscular and skeletal adaptations to altered
function in the orofacial region. American Journal of Orthodontics, 64, 578-
606.
MCNAMARA JR, J. A., HINTON, R. J. & HOFFMAN, D. L. 1982. Histologic
analysis of temporomandibular joint adaptation to protrusive function in
young adult rhesus monkeys (Macaca mulatta). American Journal of
Orthodontics, 82, 288-298.
MEIKLE, M. C. 2005. Guest editorial: what do prospective randomized clinical trials
tell us about the treatment of class II malocclusions? A personal viewpoint.
European Journal of Orthodontics, 27, 105-14.
124
MILLS, C. M. & MCCULLOCH, K. J. 2000. Posttreatment changes after successful
correction of Class II malocclusions with the Twin Block appliance.
American Journal of Orthodontics and Dentofacial Orthopedics, 118, 24-33.
MILLS, J. 1991. The effect of functional appliances on the skeletal pattern. Journal
of Orthodontics, 18, 267-275.
MITCHELL, L. 2013. An Introduction to Orthodontics, Oxford University Press.
MORRIS, D. O., ILLING, H. M. & LEE, R. T. 1998. A prospective evaluation of
Bass, Bionator and Twin Block appliances. European Journal of
Orthodontics, 20, 663-684.
NGUYEN, C. X., NISSANOV, J., OZTURK, C., NUVEEN, M. J. & TUNCAY, O.
C. 2000. Three-dimensional imaging of the craniofacial complex. Clinical
Orthodontic Research, 3, 46-50.
O'BRIEN, K., MACFARLANE, T., WRIGHT, J., CONBOY, F., APPELBE, P.,
BIRNIE, D., CHADWICK, S., CONNOLLY, I., HAMMOND, M.,
HARRADINE, N., LEWIS, D., LITTLEWOOD, S., MCDADE, C.,
MITCHELL, L., MURRAY, A., O'NEILL, J., SANDLER, J., READ, M.,
ROBINSON, S., SHAW, I. & TURBILL, E. 2009. Early treatment for Class
II malocclusion and perceived improvements in facial profile. American
Journal of Orthodontics and Dentofacial Orthopedics, 135, 580-5.
O’BRIEN, K., WRIGHT, J., CONBOY, F., SANJIE, Y., MANDALL, N.,
CHADWICK, S., CONNOLLY, I., COOK, P., BIRNIE, D. & HAMMOND,
M. 2003a. Effectiveness of early orthodontic treatment with the Twin-block
appliance: a multicenter, randomized, controlled trial. Part 1: dental and
skeletal effects. American Journal of Orthodontics and Dentofacial
Orthopedics, 124, 234-243.
O’BRIEN, K., WRIGHT, J., CONBOY, F., SANJIE, Y., MANDALL, N.,
CHADWICK, S., CONNOLLY, I., COOK, P., BIRNIE, D. & HAMMOND,
M. 2003b. Effectiveness of treatment for Class II malocclusion with the
125
Herbst or Twin-block appliances: a randomized, controlled trial. American
Journal of Orthodontics and Dentofacial Orthopedics, 124, 128-137.
PANCHERZ, H. 1979. The mandibular plane angle in activator treatment. Angle
Orthodontist, 49, 11-20.
PAPADOPOULOS, M. A., CHRISTOU, P. K., CHRISTOU, P. K., ATHANASIOU,
A. E., BOETTCHER, P., ZEILHOFER, H. F., SADER, R. &
PAPADOPULOS, N. A. 2002. Three-dimensional craniofacial reconstruction
imaging. Oral Surgery, Oral Medicine, Oral Pathology, Oral Radiology and
Endodontology, 93, 382-93.
PARKHOUSE, R. 1969. A cephalometric appraisal of cases of Angle's Class II,
Division I malocclusion treated by the Andresen appliance. Dental
Practitioner and Dental Record, 19, 425.
PARKIN, N. A., MCKEOWN, H. F. & SANDLER, P. J. 2001. Comparison of 2
modifications of the twin-block appliance in matched Class II samples.
American Journal of Orthodontics and Dentofacial Orthopedics, 119, 572-7.
PATEL, H., MOSELEY, H. & NOAR, J. 2002. Cephalometric determinants of
successful functional appliance therapy. Angle Orthodontist, 72, 410-417.
PERINETTI, G., PRIMOZIC, J., FURLANI, G., FRANCHI, L. & CONTARDO, L.
2015. Treatment effects of fixed functional appliances alone or in
combination with multibracket appliances: A systematic review and meta-
analysis. Angle Orthodontist, 85, 480-92.
PETTI, S. 2015. Over two hundred million injuries to anterior teeth attributable to
large overjet: a meta-analysis. Dental Traumatology, 31, 1-8.
PROFFIT, W. R., FIELDS JR, H. W. & SARVER, D. M. 2006. Contemporary
Orthodontics, Elsevier Health Sciences.
126
QUINTÃO, C., HELENA, I., BRUNHARO, V., MENEZES, R. C. & ALMEIDA,
M. A. 2006. Soft tissue facial profile changes following functional appliance
therapy. European Journal of Orthodontics, 28, 35-41.
SAIKOSKI, L. Z., CANCADO, R. H., VALARELLI, F. P. & DE FREITAS, K. M.
2014. Dentoskeletal effects of Class II malocclusion treatment with the Twin
Block appliance in a Brazilian sample: a prospective study. Dental Press
Journal of Orthodontics, 19, 36-45.
SATTARZADEH, A.P., LEE, R.T. 2010. Assessed facial normality after Twin
Block therapy. European Jounal of Orthodontics. 32, 363-70.
SAVARA, B. S. 1965. A method for measuring facial bone growth in three
dimensions. Human Biology, 37, 245-55.
SAWYER, A. R., SEE, M. & NDUKA, C. 2009a. 3D stereophotogrammetry
quantitative lip analysis. Aesthetic Plastic Surgery, 33, 497-504.
SAWYER, A. R., SEE, M. & NDUKA, C. 2009b. Assessment of the reproducibility
of facial expressions with 3-D stereophotogrammetry. Otolaryngology--Head
and Neck Surgery, 140, 76-81.
SEE, M. S., ROBERTS, C. & NDUKA, C. 2008. Age- and gravity-related changes
in facial morphology: 3-dimensional analysis of facial morphology in mother-
daughter pairs. Journal of Oral and Maxillofacial Surgery, 66, 1410-6.
SEEHRA, J., NEWTON, J.T., DIBIASE, A.T. 2013 Interceptive orthodontic
treatment in bullied adolescents and its impact on self esteem and oral-
health-related qualtiy of life. European Journal of Orthodontics, 35, 615-21.
SHAH, A. A. & SANDLER, J. 2009. How to ... take a wax bite for a Twin Block
appliance. Journal of Orthodontics, 36, 10-2.
SHARMA, A. A. & LEE, R. T. 2005. Prospective clinical trial comparing the effects
of conventional Twin-block and mini-block appliances: Part 2. Soft tissue
127
changes. American Journal of Orthodontics and Dentofacial Orthopedics,
127, 473-482.
SIARA-OLDS, N. J., PANGRAZIO-KULBERSH, V., BERGER, J. & BAYIRLI, B.
2010. Long-term dentoskeletal changes with the Bionator, Herbst, Twin
Block, and MARA functional appliances. Angle Orthodontist, 80, 18-29.
SIDLAUSKAS, A. 2005. The effects of the Twin-block appliance treatment on the
skeletal and dentolaveolar changes in Class II Division 1 malocclusion.
Medicina (Kaunas), 41, 392-400.
SINGH, G. 2002. Morphospatial analysis of soft‐tissue profile in patients with Class
II division 1 malocclusion treated using twin block appliances: geometric
morphometrics. Orthodontics & Craniofacial Research, 5, 38-50.
SINGH, G. & CLARK, W. 2003. Soft tissue changes in patients with Class II
division 1 malocclusions treated using Twin Block appliances: finite‐element
scaling analysis. European Journal of Orthodontics, 25, 225-230.
TALBERT, L., KAU, C. H., CHRISTOU, T., VLACHOS, C. & SOUCCAR, N.
2014. A 3D analysis of Caucasian and African American facial morphologies
in a US population. Journal of Orthodontics, 41, 19-29.
TITIZ, I., LAUBINGER, M., KELLER, T., HERTRICH, K. & HIRSCHFELDER,
U. 2012. Repeatability and reproducibility of landmarks--a three-dimensional
computed tomography study. European Journal of Orthodontics, 34, 276-86.
TOTH, L. R. & MCNAMARA, J. A., JR. 1999. Treatment effects produced by the
twin-block appliance and the FR-2 appliance of Frankel compared with an
untreated Class II sample. American Journal of Orthodontics and Dentofacial
Orthopedics, 116, 597-609.
TRENOUTH, M. 1989. A functional appliance system for the correction of class II
relationships. Journal of Orthodontics, 16, 169-176.
128
TRENOUTH, M. J. 2000. Cephalometric evaluation of the Twin-block appliance in
the treatment of Class II Division 1 malocclusion with matched normative
growth data. American Journal of Orthodontics and Dentofacial Orthopedics,
117, 54-9.
TRENOUTH, M. J. & DESMOND, S. 2012. A randomized clinical trial of two
alternative designs of Twin-block appliance. Journal of Orthodontics, 39, 17-
24.
TULLEY, W. 1972. The scope and limitations of treatment with the activator.
American Journal of Orthodontics, 61, 562-577.
TUMER, N. & GULTAN, A. S. 1999. Comparison of the effects of monoblock and
twin-block appliances on the skeletal and dentoalveolar structures. American
Journal of Orthodontics and Dentofacial Orthopedics, 116, 460-8.
TUNCAY, O. C. 2001. Three-dimensional imaging andmotion animation. Seminars
in Orthodontics, 7, 244-250.
VANDERVEKEN, O. M., VROEGOP, A. V., VAN DE HEYNING, P. H. &
BRAEM, M. J. 2011. Drug-induced sleep endoscopy completed with a
simulation bite approach for the prediction of the outcome of treatment of
obstructive sleep apnea with mandibular repositioning appliances. Operative
Techniques in Otolaryngology-Head and Neck Surgery, 22, 175-182.
VARGERVIK, K. & HARVOLD, E. P. 1985. Response to activator treatment in
Class II malocclusions. American Journal of Orthodontics, 88, 242-251.
VARLıK, S. K., GÜLTAN, A. & TÜMER, N. 2008. Comparison of the effects of
Twin Block and activator treatment on the soft tissue profile. European
Journal of Orthodontics, 30, 128-134.
VIG, P. S., ORTH, D. & VIG, K. W. 1986. Hybrid appliances: a component
approach to dentofacial orthopedics. American Journal of Orthodontics and
Dentofacial Orthopedics, 90, 273-285.
129
WEEDEN, J. C., TROTMAN, C. A. & FARAWAY, J. J. 2001. Three dimensional
analysis of facial movement in normal adults: influence of sex and facial
shape. Angle Orthodontist, 71, 132-40.
WINDER, R. J., DARVANN, T. A., MCKNIGHT, W., MAGEE, J. D. &
RAMSAY-BAGGS, P. 2008. Technical validation of the DI3D
stereophotogrammetry surface imaging system. British Journal of Oral and
Maxillofacial Surgery, 46, 33-7.
WONG, J. Y., OH, A. K., OHTA, E., HUNT, A. T., ROGERS, G. F., MULLIKEN,
J. B. & DEUTSCH, C. K. 2008. Validity and reliability of craniofacial
anthropometric measurement of 3D digital photogrammetric images. Cleft
Palate Craniofacial Journal, 45, 232-9.
WOOD, D. A., HUGHES, G. B., SECIC, M. & GOOD, T. L. 1994. Objective
measurement of normal facial movement with video microscaling. Otology &
Neurotology, 15, 61-65.
XIONG, H., HÄGG, U., TANG, G.-H., RABIE, A. B. M. & ROBINSON, W. 2004.
The effect of continuous bite-jumping in adult rats: a morphological study.
Angle Orthodontist, 74, 86-92.
YAMIN-LACOUTURE, C., WOODSIDE, D. G., SECTAKOF, P. A. & SESSLE, B.
J. 1997. The action of three types of functional appliances on the activity of
the masticatory muscles. American Journal of Orthodontics and Dentofacial
Orthopedics, 112, 560-72.
YAQOOB, O., DIBIASE, A. T., FLEMING, P. S. & COBOURNE, M. T. 2012. Use
of the Clark Twin Block functional appliance with and without an upper
labial bow: a randomized controlled trial. Angle Orthodontist, 82, 363-9.
ZACHRISSON, B. U. 1998. Esthetic factors involved in anterior tooth display and
the smile: vertical dimension. Journal of Clinical Orthodontics, 32, 432-445.

130
CHAPTER NINE
APPENDICES
131
9. Appendices
9.1 Appendix A
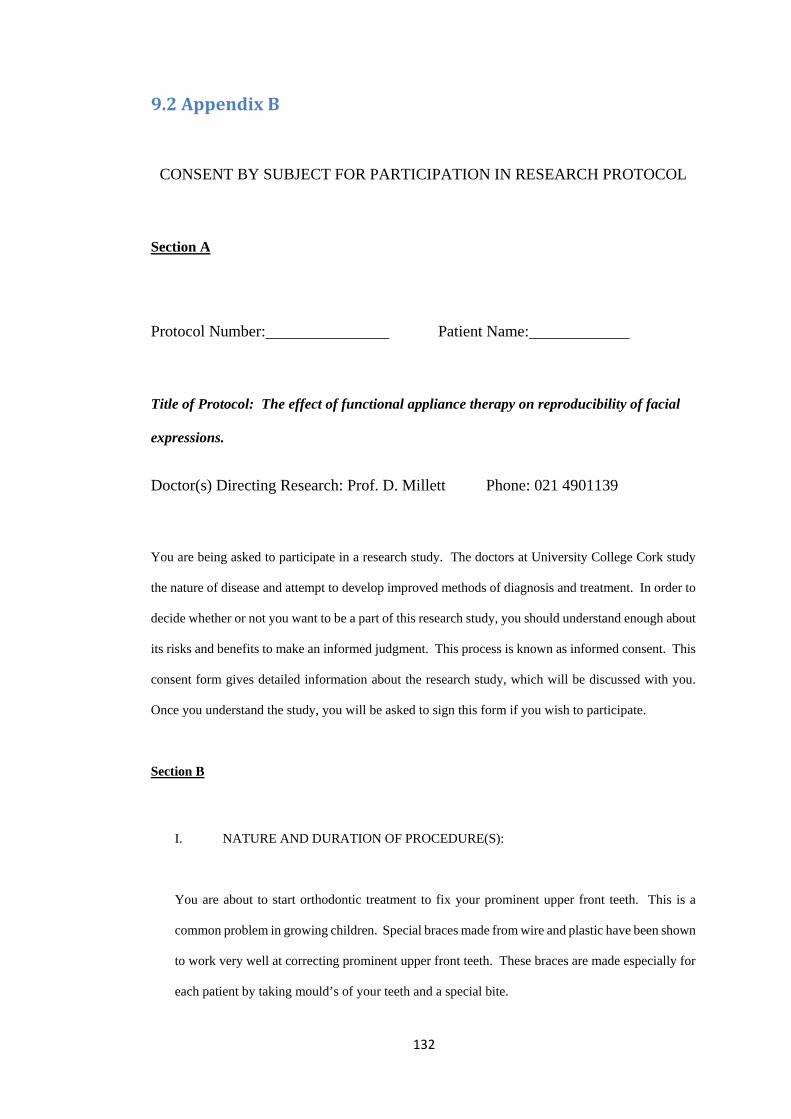
132
9.2 Appendix B
CONSENT BY SUBJECT FOR PARTICIPATION IN RESEARCH PROTOCOL
Section A
Protocol Number: Patient Name:
Title of Protocol: The effect of functional appliance therapy on reproducibility of facial
expressions.
Doctor(s) Directing Research: Prof. D. Millett Phone: 021 4901139
You are being asked to participate in a research study. The doctors at University College Cork study
the nature of disease and attempt to develop improved methods of diagnosis and treatment. In order to
decide whether or not you want to be a part of this research study, you should understand enough about
its risks and benefits to make an informed judgment. This process is known as informed consent. This
consent form gives detailed information about the research study, which will be discussed with you.
Once you understand the study, you will be asked to sign this form if you wish to participate.
Section B
I. NATURE AND DURATION OF PROCEDURE(S):
You are about to start orthodontic treatment to fix your prominent upper front teeth. This is a
common problem in growing children. Special braces made from wire and plastic have been shown
to work very well at correcting prominent upper front teeth. These braces are made especially for
each patient by taking mould’s of your teeth and a special bite.
133
In this study we want to know if the facial expressions that you make before you received your
brace change while you have your brace and after you have finished with your brace. To do this
we will take special pictures called three-dimensional (3D) images. 3D pictures allow us to see
and examine your face on a computer screen from all directions. These pictures allow us to
measure your face very accurately and show the effects of treatment on your face and teeth. Each
time we take 3D pictures of your face, a camera will be used to take pictures of your face doing
the following things:
• At rest
• Making a natural smile
• Making a maximal smile
We will tell you what we want you to do before we take each of the pictures. It will take about 15
minutes each time you get 3D pictures done.
Only those directly involved in the study will have access to your details. All your information
will be confidential. At the end of the study we hope to publish our findings in a scientific journal.
Your name will never be shown in any report or publication.
II. POTENTIAL RISKS AND BENEFITS:
There are no risks associated with having your 3D pictures taken. The information we collect
during the study will help us understand the change in your face and change in your thoughts about
yourself. This will allow us to better plan orthodontic treatment in the future.
III. POSSIBLE ALTERNATIVES:
Treatment may still proceed if you decide not to take part. It is your choice to take part in this
study or not. You can withdraw at any time without giving a reason.
134
Section C AGREEMENT TO CONSENT
The research project and the treatment procedures associated with it have been fully explained
to me. All experimental procedures have been identified and no guarantee has been given about the
possible results. I have had the opportunity to ask questions concerning any and all aspects of the
project and any procedures involved. I am aware that participation is voluntary and that I may withdraw
my consent at any time. I am aware that my decision not to participate or to withdraw will not restrict
my access to health care services normally available to me. Confidentiality of records concerning my
involvement in this project will be maintained in an appropriate manner. When required by law, the
records of this research may be reviewed by government agencies and sponsors of the research.
I understand that the sponsors and investigators have such insurance as is required by law in
the event of injury resulting from this research.
I, the undersigned, hereby consent to participate as a subject in the above described project
conducted at the Cork Teaching Hospitals. I have received a copy of this consent form for my records.
I understand that if I have any questions concerning this research, I can contact the doctor(s) listed
above. If I have further queries concerning my rights in connection with the research, I can contact the
Clinical Research Ethics Committee of the Cork Teaching Hospitals, Lancaster Hall, 6 Little Hanover
Street, Cork.
After reading the entire consent form, if you have no further questions about giving consent,
please sign where indicated.
Doctor:
Signature of Subject
Witness:

135
Signature of Parent or Guardian
Date: Time: AM
(Circle) PM


