Embed Size (px)
Citation preview

Virtual Reconstruction of Modernand Fossil Hominoid Crania:Consequences of Reference
Sample ChoiceSASCHA SENCK,1* FRED L. BOOKSTEIN,2,3 STEFANO BENAZZI,4,5
JOHANN KASTNER,1 AND GERHARD W. WEBER2,6
1Department of Engineering and Enviromental Sciences, University of Applied SciencesUpper Austria, Stelzhamerstrasse 23, 4600 Wels, Austria
2Department of Anthropology, University of Vienna, Althanstrasse 14,1090 Vienna, Austria
3Department of Statistics, University of Washington, Seattle, Washington4Department of Cultural Heritage, University of Bologna, Via degli Ariani 1, 48121
Ravenna, Italy5Department of Human Evolution, Max Planck Institute for Evolutionary Anthropology,
Deutscher Platz 6, Leipzig 04103, Germany6Core Facility for Micro-Computed Tomography, University of Vienna, Althanstrasse 12,
1090 Vienna, Austria
ABSTRACTMost hominin cranial fossils are incomplete and require reconstruc-
tion prior to subsequent analyses. Missing data can be estimated by geo-metric morphometrics using information from complete specimens, forexample, by using thin-plate splines. In this study, we estimate missingdata in several virtually fragmented models of hominoid crania (Homo,Pan, Pongo) and fossil hominins (e.g., Australopithecus africanus, Homoheidelbergensis). The aim is to investigate in which way different referen-ces influence estimations of cranial shape and how this information canbe employed in the reconstruction of fossils. We used a sample of 64three-dimensional digital models of complete human, chimpanzee, andorangutan crania and a set of 758 landmarks and semilandmarks. Thevirtually knocked out neurocranial and facial areas that were recon-structed corresponded to those of a real case found in A.L. 444-2 (A. afar-ensis) cranium. Accuracy of multiple intraspecies and interspeciesreconstructions was computed as the maximum square root of the meansquared difference between the original and the reconstruction (rootmean square). The results show that the uncertainty in reconstructions isa function of both the geometry of the knockout area and the dissimilaritybetween the reference sample and the specimen(s) undergoing reconstruc-tion. We suggest that it is possible to estimate large missing cranial areasif the shape of the reference is similar enough to the shape of the speci-men reconstructed, though caution must be exercised when employingthese reconstructions in subsequent analyses. We provide a potential
Grant sponsors: EU FP6 Marie Curie Actions grant, NationalScience Foundation Hominid Grant 2007; Grant numbers:MRTN-CT-2005-019564, NSF 01-120.
*Correspondence to: Sascha Senck, University of AppliedSciences Upper Austria, Stelzhamerstrasse 23, 4600 Wels, Austria.Fax: 143 (0)50804-944426. E-mail: [email protected]
Received 9 October 2014; Accepted 30 October 2014.
DOI 10.1002/ar.23104Published online 23 January 2015 in Wiley Online Library(wileyonlinelibrary.com).
THE ANATOMICAL RECORD 298:827–841 (2015)
VVC 2015 WILEY PERIODICALS, INC.

guide for the choice of the reference by means of bending energy. AnatRec, 298:827–841, 2015. VC 2015 Wiley Periodicals, Inc.
Key words: virtual reconstruction; geometric morphometrics;reference-based reconstruction; thin-plate spline;fossils
Most hominin cranial fossils are incomplete, whereasmany advanced morphometric and morphological analy-ses require that specimens be complete. Differentapproaches for the imputation of missing data based onthe toolkit of geometric morphometrics (GM) emerged inthe last decade that found application in various fieldssuch as craniomaxillofacial surgery (Benazzi et al., 2011a,2011b; Benazzi and Senck, 2011), bioarchaeology and for-ensic anthropology (Benazzi et al., 2009a,b,c, 2010), andpaleoanthropology (Ponce De Le�on and Zollikofer, 1999;Neubauer et al., 2004; Grine et al., 2010; Benazzi et al.,2011a, 2014; Kranioti et al., 2011; Watson et al., 2011).Reconstructions of incomplete fossil specimens were incor-porated in varying contexts from studies of ontogeny(Gunz et al., 2010) and phylogeny (Gunz et al., 2009a) tobiomechanics (Strait et al., 2009, 2010).
Especially recent biomechanical analyses on primateskulls using finite element analysis (FEA) set highstandards on the integrity and quality of virtual models(Strait et al., 2009; O’Higgins et al., 2011; Weber et al.,2011) making a reconstruction of the fossil skull neces-sary (Benazzi et al., 2011a, 2013, 2014). The geometry ofthe solid model is one of the major input parameters forFEA, and thus, the reconstructed missing area will havea major impact on the distribution of simulated stressesand strains, for example, in modeling the bite force. Thisis because variations in the locations of muscle attach-ment points can substantially influence the bite forceoutput in a FEA. Sellers and Crompton (2004) performeda sensitivity analysis employing a cranial finite elementmodel in which they varied the muscle origin positionsof the three main jaw-closing muscles (temporalis, mass-eter, and pterygoid). They showed that alterations in themuscle insertion points, and hence, the orientation ofmuscle forces highly affect the peak retractive force,that is, the bite force in posterior direction, of the lowerteeth during chewing. The uncertainty of geometry andposition of some reconstructed bones, and consequentlythe attachment areas of the muscles of mastication, willtherefore strongly influence the uncertainty of the bio-mechanics (Sellers and Crompton, 2004; Marinescuet al., 2005; Gr€oning et al., 2012). In general, informa-tion about the uncertainty of any reconstruction has tobe considered, no matter if it is used subsequently inontogenetic, phylogenetic, or biomechanical analyses.
Zollikofer and Ponce de Leon (2005) have suggestedthat fossil reconstructions should use reference samplesdrawn from the same species as the specimen beingreconstructed. Furthermore, the reference sample shouldrepresent the shared ancestral pattern of variationrather than patterns of variation characteristic of thederived taxa. The reason is to avoid biasing the recon-structions toward “preconceived morphologies.” But this
approach is problematic in view of the extremely smallsamples of fossil material available for many of the hom-inin species. In most cases, it is impossible to collect areference sample from the population to which the dam-aged fossil individual belonged. Apart from this, the allo-cation to a particular taxon is often disputed amongexperts. Guidelines are particularly needed for frag-mented fossils for which no reference sample is availablefrom the same species, or for which allocation to a spe-cies is disputed.
One way to deal with the choice of reference is toemploy a statistical reconstruction, utilizing group formconstraints (Weber and Bookstein, 2011), for example, byapplying a multiple multivariate regression. Thisapproach exploits the morphological information presentin a reference group or population (Gunz, 2005).Regression-based methods assume that there is a strongstatistical pattern describing the “integration”—thecovariance—of the features that make up the morpholog-ical pattern. The available morphological informationfrom the damaged specimen is combined with anatomi-cal information from undamaged specimens to estimatemorphology in the missing regions.
Neeser et al. (2009) claimed that “morphological simi-larity appears to be of less importance than large refer-ence samples” which “is likely due to the shared andpresumably evolutionarily conserved pattern of covaria-tion seen across the primate order”. Based on their view,exploiting information from integration patterns for theestimation of missing data can overcome the deficiencyof a small or missing reference sample. Neeser et al.simulated random knockout of points using a dataset of29 anatomical landmarks and concluded that regression-based methods outperform thin-plate splines (TPS)-based estimation when using such a sparse anatomicalrepresentation. But as Gunz et al. (2009) pointed out,the 29 landmarks used in the study of Neeser et al.(2009) do not capture the morphology of the referenceand target specimen in sufficient detail to make reliablepredictions of missing coordinates. The data configura-tion that they used did not incorporate semilandmarksin otherwise neglected regions. In this paper, includingsemilandmarks in the process of missing data estimationdoes allow the reconstruction of relatively large missingareas.
Another disadvantage of using multiple linear regres-sion is that the linear relationship is “overfitted” in thecase when the completed forms are used in the statisti-cal analyses. For this reason, Gunz et al. (2009) recom-mended geometric reconstruction rather thanregression-based methods. Geometric reconstruction isbased on the smoothness properties of the TPS andrequires only a single reference form (template), which
828 SENCK ET AL.

might be the Procrustes mean shape of a species.Recently, Senck et al. (2013) explored the consequencesof the choice of the reference on the outcome of TPSreconstructions in a sample of recent Homo sapiens, sug-gesting that the Procrustes mean shape is a suitable ref-erence form. However, the effects of reference on theoutcome of the TPS reconstruction have not beenexhaustively studied for a larger sample consisting ofseveral species. For example, Gunz et al. (2009) demon-strated reference sample dependency on reconstructedshape features of the supraorbital region in the Homoerectus s.l. specimen KNM-WT 15,000. The authorsshowed that the reconstructed outlines of the orbits andthe glabellar region are slightly but consistently differ-ent depending on the group of the reference specimen.
In contrast to Gunz et al. (2009), we focus on TPS-based reconstructions that involve large cranial areas(�50% of the face and 30% of the neurocranium) insteadof rather restricted anatomical regions such as the gla-bellar area. We describe the resulting deviations inintraspecies (for: H. sapiens, P. troglodytes, P. pygmaeus)and interspecies (for: H. sapiens, H. heidelbergensis, P.troglodytes, P. pygmaeus, and A. africanus) reconstruc-tions when the Procrustes mean shape of the respectivespecies is used as reference. Furthermore, we recon-struct each one specimen of the five different specieswith all the specimens in the sample in order to assessthe maximum square root of the mean squared differ-ence between the original and the reconstruction (aver-age maximum RMS). This allows us to assess theuncertainty during intra- and interspecies reconstruc-tions which is represented by the posterior distribution(expressed in terms of the distance between the originaland the reconstruction) of the multiple reconstructionswith regard to the choice of the reference sample. Sincean “all-purpose” reconstruction is not realistic, thesemultiple reconstructions represent a posterior distribu-tion based on the reference specimens that function asthe prior distribution (Gunz et al., 2009).
Contrary to Neeser et al. (2009), who dealt with meas-ured distances instead of shape coordinates, missingdata in the knockout regions is represented by numerouslandmarks and semilandmarks rather than a restrictedcount of 29 landmarks. The inclusion of semilandmarksallows the consideration of whole surface patches thatwould otherwise have remained unattended. In contrastto Neeser et al. (2009), we also avoid an arbitrary defini-tion of missing areas by randomly knocking out land-marks because data in case of fragmented fossils mightnot be missing at random. For instance, delicate andthinner bones break more easily. From the plethora ofpotential cases where specific cranial areas are missing,we have chosen one concrete and difficult real scenariobecause it is not feasible to simulate all combinations ofpossible sizes, shapes, and locations of potential cranialdefects. The knockout analysis is specifically tailored forthe Australopithecus afarensis specimen A.L. 444-2(Kimbel et al., 2004), characterized by two separate andlarge missing areas in the face and the neurocranium.
We expect that the closer the reference shape is to thetarget shape, the lower the uncertainty will be. This willallow us to discuss which considerations have to beaccounted for when using these reconstructions in subse-quent analyses. Importantly, we introduce a potentialquantitative guide on how to choose the reference for
interspecies reconstructions for those species that wereemployed in our sample. This guideline uses associationsof the bending energy between the template and targetthat we obtained during TPS-based reconstructions.
MATERIALS AND METHODS
Surface Data
The study included computed tomography (CT) scansof 64 dried skulls from Homo sapiens (N 5 25; for sampleinformation refer Senck et al., (2013)), Pan troglodytes(N 5 19; individuals from repositories of the Universityof Vienna (Austria), University of Toulouse (France), andthe Senckenberg Collection (Germany)), and Pongo pyg-maeus (N 5 20; all individuals from the Zoological StateCollection Munich (Germany)]. Sexes are evenly distrib-uted within each species sample. Three CT scans of fos-sils are included: Sts 5 (A. africanus; Broom, 1947) andPetralona (H. heidelbergensis; Kokkoros and Kanellis,1960). The reference samples and fossils are chosenbecause they represent a very broad range of hominoidmorphology, each characterized by its own particularmosaic of ancestral and derived features. The includedfossils Sts 5 and Petralona are all exceptionally well pre-served. Their small missing areas do not affect the pro-cess of reconstruction when simulating the missingareas that are analogous to those missing in A.L. 444-2.
The half-maximum height protocol was used to recon-struct the cranial surface from each CT scan via the soft-ware package Amira 5.2 (Mercury Computer Systems,Chelmsford, MA). The procedure uses the histogram ofthe CT gray values of the respective volume dataset todetermine the appropriate border between materials(here bone and air) based on the half maximum heightvalue (Spoor et al., 1993) for each specimen. This valueis then used as threshold for the generation of therespective surface from CT data.
Landmark and Semilandmark Data
Using the open-source software Edgewarp3D(Bookstein and Green, 2002) and AMIRA 5.3, a 3D-template of 77 anatomical landmarks and 681 semiland-marks was created to capture the geometry of the com-plete ectocranial surface (Table 1, Fig. 1a). As traditionalanatomical landmarks only capture the cranial geometryquite incompletely, we included curve and surface semi-landmarks that add morphological information (Gunz,2005, Gunz and Mitter€ocker, 2013; Fig. 1b). The tem-plate was warped onto each complete specimen (target)cranium by iterative TPS. This procedure aligns thetemplate and target according to homologous anatomicallandmarks present in both models.
A TPS is invariant to position, scale, and rotation ofthe forms and therefore does not require a previousProcrustes fitting step. As part of the digitization pro-cess, semilandmarks were allowed to slide along curvesand surfaces to minimize the bending energy of the TPScomputed between each reference and target specimen.This iterative sliding procedure approximates curves bysets of chords calculated as vectors of two neighboring(semi)landmarks, and surfaces by their triangulations,followed by a projection of the slid semilandmarks to thenearest point on the curve or the surface. Once relaxed(when the bending energy has been minimized),
VIRTUAL RECONSTRUCTION OF HOMINOID CRANIA 829

semilandmarks can be considered as geometricallyhomologous points (e.g., Gunz, 2005; Mitteroecker andGunz, 2009).
Geometric Reconstruction
In each specimen (all 64 extant and 2 fossils), theareas comparable to those missing in A. afarensis A.L.444-2 were “knocked out”, that is, are declared as miss-ing (Fig. 1b,c). In this “knockout” simulation, missingregions in the neurocranium incorporate large portionsof the parietal and sphenoid bone, and the superior partof the temporal squama. In the midsagittal plane,approximately, the middle third of the area betweenbregma and lambda was missing. Bilaterally, the miss-ing area involved both parietal eminences andapproached the coronal suture up to krotaphion (themost posterior extent of the sphenoparietal suture). Thesphenoid bone was almost completely missing. Missingfacial portions included parts of the upper (inferiorsupraorbital margin) and midfacial skeleton (nasal bonesand the maxillary bone excluding the alveolar process of
the maxilla and upper dentition). In total, eight anatom-ical landmarks (2, 12, 13, 14, and 15; see Table 1) and110 semilandmarks in the facial and 137 semilandmarksin the neurocranial region were declared as absent. Twoexperimental setups were tested:
� RefPMS: In the first set-up, missing data were esti-mated by, warping all three extant species’ (Homo,Pan, and Pongo) consensus configurations, that is,Procrustes mean shapes (PMS), to each “knockout”individual, including the hominin fossils Sts 5 andPetralona, resulting in a total of 198 (3 3 66) recon-structions. This simulation sequence is referred to asRefPMS (the REFerence is the species-specificProcrustes mean shape) in the following text.� RefAS: Missing data in the second setup were esti-
mated by warping all the specimens in the sampleonto one chosen “knockout” individual from each of theextant species (referred to as Homo1, Pan1, Pongo1)which results in 189 (63 3 3) reconstructions. Homo1,Pan1, and Pongo1 were excluded from the referencesample to circumvent reconstructing Homo1 withHomo1, Pan1 with Pan1, and Pongo1 with Pongo1which would result in perfect conformity. Additionally,each extant specimen in the sample was warped ontoSts 5 and Petralona (64 3 2 5 128 reconstructions).Results for this set of simulations are summarized inTable 2 and referred to as RefAS (REFerences are Allthe Specimens in the sample).
Warping was performed with the open-source softwareEdgewarp3D (Bookstein and Green, 2002). First, a TPSinterpolation based on 69 out of the 77 anatomical land-marks (total number of anatomical landmarks minus theabsent eight anatomical landmarks) was computed towarp all semilandmarks and absent landmarks from thereference to each “knockout” individual. For the fossils,the number of anatomical landmarks in this step wasreduced (Table 1) because they lacked landmarks even
TABLE 1. LIST OF ANATOMICAL LANDMARKS
No. Paired landmarks No. Paired landmarks No. Unpaired landmarks
1 Frontotemporalea/b 20 P3-Ca (alv) 2 Glabellaa/b
3 Frontomalare-temporalea 21 Canine basea (alv) 7 Nasiona/b
4 Frontomalare-orbitalea 22 C-I2a (alv) 15 Rhinion5 Torus inferiora/b 23 I1-I2a (alv) 24 Prosthiona/b
6 frontal–nasal–maxillary bonea/b 29 Foramen palatinum majusa/b 25 Nasospinalea/b
8 Zygotemporale inferior 31 Maxillary bone–Os palatinuma/b 26 Oralea
9 Zygotemporale superior 32 Sutura sphenozygomatica–Fissura orbitalisa/b
27 Incisiviona/b
10 Jugalea/b 34 Stephaniona/b 28 Sutura palatina mediana &transversaa
11 Zygomaxillarea/b 35 Auricularea/b 30 Staphyliona/b
12 Foramen infraorbitalea/b 38 Postglenoida/b 33 Bregmaa/b
13 Zygoorbitalea/b 39 Foramen ovalea/b 36 Lambdaa/b
14 Sutura nasomaxillaris–Aperturapiriformesa/b
40 Canalis caroticus 37 Iniona/b
16 M2-M3a (alv) 41 Sutura occipitomastoidea–Foramen jugulare
44 Sphenobasiona/b
17 M1-M2a (alv) 42 Condylus occipitalis anteriora/b 45 Basiona/b
18 M1-P4a (alv) 43 Condylus occipitalis posteriora/b 46 Opisthiona/b
19 P4-P3a (alv)
aLandmarks in Petralona (N 568).bLandmarks in Sts5 (N 542).(alv) Digitized on the alveolar process between the teeth.
Fig. 1. Complete landmark template and “knocked out”, that is,missing, areas. (a) Pan specimen (not to scale) showing complete tem-plate with anatomical landmarks (red; N 5 77) and curve and surfacesemilandmarks (yellow: face, N 5 225; green: neurocranium, N 5 456).(b) Homo specimen: Lateral and frontal views of facial (yellow) andneurocranial (green) knockout regions, reflecting those areas absent inthe A. afarensis fossil A.L. 444-2. The description of anatomical land-marks is given in Table 1.
830 SENCK ET AL.

before the knockout procedure. In this way, the referenceand target are aligned according to the anatomical land-marks, while the semilandmarks slide (on curves andsurface, respectively) according to minimum bendingenergy of just the landmarks. Landmarks and semiland-marks on the reference that correspond to the missingarea in the target were manually declared as “fullyrelaxed”, that is, missing, and are estimated accordingto the TPS algorithm.
As mentioned previously, the warping of complete ref-erence forms from the same or a closely related speciesto an incomplete specimen (“knockout” individual) gener-ates a count of reconstructions for each case that corre-sponds to the count of references employed. Results foreach of the reconstruction experiments are expressed inthe form of residuals between the (semi)landmarks ofthe original configuration and the estimated configura-tions. A semilandmark carries only shape informationperpendicular to the tangent line or plane; thus, formissing semilandmarks, only the residual normal to theridge curve or surface was used. For RefPMS, only mini-mum and maximum distances (minimum and maximumvalues for the residuals between the (semi)landmarkstrue and estimated position) were presented. We definethe uncertainty for RefPMS simulations in terms of theabsolute maximum values obtained during the recon-struction of all individuals by the species-specificProcrustes mean shape for the respective region.RefPMS experiments were conducted to explore if theProcrustes mean shape (PMS) is a suitable reference forinterspecies reconstructions. For RefAS (missing datawere estimated by warping all the specimens in the sam-ple onto Homo1, Pan1, and Pongo1 and each of the fos-sils), we define reconstruction accuracy as the squareroot of the mean squared difference between the originaland the reconstruction (root mean square: RMS). Thisvalue has the same units as the data (mm) and permits,in contrast to the Procrustes distance of the reconstruc-tion to the original specimen, the interpretation of theerror in real measurement units. The RMS was com-puted for each estimated (semi)landmark. Additionally,an average residual is calculated for the (semi)landmarkin each individual that shows the highest RMS in each
reconstruction experiment for each region (Visualizationof RMS reconstruction standard deviation), in the follow-ing referred to as the average of the maximum landmarkRMS (Table 2).
Note that all missing data in the facial area and inthe neurocranial area were estimated separately inorder to circumvent an influence of missing data estima-tion in the face by missing neurocranial data and viceversa. Missing facial and neurocranial areas were subdi-vided to allow a more detailed visualization of the differ-ences between the original and the reconstruction. Foran improved visualization of the results, the facialknockout region is subdivided into four areas: (a) supe-rior alveolar process (SAP, 12 (semi)landmarks), (b) ante-rior maxillary surface (AMS, 54 (semi)landmarks), (c)nasal and interorbital area (IORB, 14 (semi)landmarks),and (d) the supraorbital region (SORB, 30 (semi)land-marks). The neurocranial missing area was separatedinto three regions: (a) a sphenoid (SPHE, 26 (semi)land-marks), (b) a parietal (PAR, 108 (semi)landmarks), and(c) a midsagittal area (MID, 3 (semi)landmarks).
Landmarks and semilandmarks were then convertedto shape coordinates by generalized Procrustes analysis(GPA). This involves translating, rescaling, and rotatingthe configurations relative to each other so as to mini-mize the overall sum of squared distances between cor-responding (semi)landmarks. The rescaling adjusts(semi)landmark coordinates so that each configurationhas a unit centroid size (CS; square root of the summedsquared Euclidean distances from all (semi)landmarks totheir centroid) (Rohlf and Slice, 1990). Principal compo-nent analysis (PCA) of the matrix of shape coordinateswas carried out on the original hominoid sample.Reconstructions of both the virtually fragmented fossilsand the “knockout” individuals from each of the extantspecies (Homo1, Pan1, Pongo1; facial and neurocranialareas were combined for the visualization in shapespace) were subsequently projected in the multivariatespace (shape space) of the original hominoid sample sothat we can evaluate the uncertainty, that is, the poste-rior distribution in a Bayesian sense, of the multiplereconstructions in relation to the species’ variability ofthe originals.
TABLE 2. AVERAGE OF THE MAXIMUM LANDMARK RMS FOR THE RESPECTIVE RECONSTRUCTIONSEQUENCE AND ANATOMICAL REGION (in mm)
Facial regions Neurocranial regions
SAP AMS IORB SORB SPHE PAR MID
Homo1 reconstructed by Homo sample 2.24 2.25 7.28 3.18 2.85 2.26 2.59Homo1 reconstructed by Pan sample 2.33 5.10 8.20 2.96 2.91 7.91 1.05Homo1 reconstructed by Pongo sample 3.92 4.91 7.60 2.17 3.85 7.75 1.08Pan1 reconstructed by Pan sample 3.05 1.98 6.86 2.58 2.04 1.65 0.96Pan1 reconstructed by Pongo sample 3.05 3.00 6.53 6.97 2.50 1.65 0.55Pan1 reconstructed by Homo sample 3.38 7.74 19.98 5.42 4.28 4.95 1.84Pongo1 reconstructed by Pongo sample 1.26 1.39 1.89 1.28 1.84 0.83 0.21Pongo1 reconstructed by Pan sample 1.91 1.40 3.27 1.33 1.64 0.81 0.35Pongo1 reconstructed by Homo sample 1.73 3.78 8.12 1.96 3.75 2.44 0.92Petralona reconstructed by Homo sample 3.12 4.08 9.13 4.61 5.14 4.39 1.13Petralona reconstructed by Pan sample 2.90 7.74 16.58 5.56 3.90 5.08 2.04Petralona reconstructed by Pongo sample 5.01 7.65 13.58 5.63 4.08 4.91 2.56Sts 5 reconstructed by Homo sample 2.86 5.35 12.63 2.65 4.27 4.34 0.82Sts 5 reconstructed by Pan sample 2.03 2.23 5.36 3.30 2.79 2.65 0.62Sts 5 reconstructed by Pongo sample 3.16 2.50 4.28 2.75 2.99 2.44 0.64
VIRTUAL RECONSTRUCTION OF HOMINOID CRANIA 831

Visualization of RMS Reconstruction StandardDeviation
We illustrate a peculiarity of the reconstructionstandard error to put its interpretation in perspective.Figure 2 is an exploratory visualization of the spatialpattern generated by the reconstructions. The renderingof this surface was performed by a combination of twotools in "R" software (R Development Core Team), the“interp” command for referring the normal standarddeviation (SD) at each semilandmark to a regular gridon the projection plane, and the “contour” command tosupply the isocontours that make the resulting figurelegible. Rendered thus, the diagram shows a mathemati-cal “surface” as reconstructed inside an oval boundarythat is, in fact, the edge of the parietal region (coloredgreen) in Fig. 1—the margin of the missing calvarialregion. We are viewing it in a convenient “map projec-tion” as if from the left side of this skull as oriented in aFrankfurt plane.
What is represented is not the surface of that recon-structed form, but the derived surface of reconstructionstandard error, in the direction perpendicular to thederived surface itself. This surface is, as it must be,fixed at the value of zero (no uncertainty) all around itsboundary, where the reconstruction leaves all the origi-nal data unchanged (black) and rises to a single well-defined interior maximum (yellow) by gradients that arevery nearly linear in every traversal inwards from theboundary. Note, too, that neighboring contours arenearly parallel everywhere except upon that centraldome. The location of this maximum is eccentric withinthe knockout region as a consequence of the large-scalestructure of integration within the reference sample.This figure justifies our decision to restrict the numeri-cal content of our comparative reports to the singlevalue at the peak of this surface (average of the maxi-mum landmark RMS, see above); an average valuewould be greatly biased by the zero deviations along theboundary.
Bending Energy
Bending energy is a metaphor borrowed for use inmorphometrics from the mechanics of thin metal plates.Any thin-plate spline has a bending energy, the (ideal-ized) physical energy required to bend an infinite, infin-itely thin metal plate into the specified form from aninitially flat configuration. By extension, any deforma-tion of a landmark configuration modeled in this wayhas a bending energy, the sum of the energies of itsthree “plates” (Bookstein and Green, 1993).
While in physics bending energy is a real quantity,measured in appropriate units, there is an alternate for-mula that remains meaningful in morphometrics: bend-ing energy is proportional to the integral of the summedsquared second derivatives of the “vertical” displace-ment—the extent to which it varies from a uniform tilt.While such quantities should not be interpreted asmeasures of dissimilarity (e.g., taxonomic or evolution-ary distance) between two forms, they could help toguide the choice of the reference in general. If a refer-ence of similar form shows a higher accuracy and also asmaller bending energy than a reference whose form dif-fers more from the specimen to be reconstructed, then
we would choose the first as reference to use during theTPS reconstruction. Since the interpretation of the largevariety of correlations using the average RMS of eachregion and the corresponding bending energy is confus-ing, here, we suggest a potential guide for the choice ofthe reference based on the correlations between bendingenergy and Procrustes distance of the reconstruction tothe original specimen as a proxy for accuracy.
RESULTS
Facial Reconstructions
Figure 3 illustrates the minimum and maximum dis-tances for each region in the facial knockout area.Minimum and maximum distances include the valuesobtained during the reconstruction of each individual inthe sample by the species-specific Procrustes meanshape (RefPMS). Minimum distances approach zero inall reconstructions because the surface to be recon-structed is fixed all around its boundary showing thelowest uncertainty. The results for the RefPMS recon-structions show that in missing areas adjacent to pre-served bone the maximum distances between theoriginal and reconstruction are low, for example, for thesuperior alveolar process. By contrast, reconstructions inthe center of the missing area show the highest distan-ces from the original, for example, in the interorbitalarea. If the respective area shows a high morphologicalvariability in the extant samples (e.g., in the nasal orsupraorbital region), maximum deviations for intraspe-cies reconstructions are well above 10 mm, for example,for the reconstructions of Homo specimens with thePMS of the Homo sample. Values above 20 mm can bereached when reconstructing the nasal and interorbitalarea of Homo specimens with the PMS of the Pan orPongo sample. Due to the delicate structure of the nasalbones and a high uncertainty in the nature of preserva-tion at the anatomical landmark rhinion, primarily forPetralona, rhinion was not considered for the fossilspecimens.
The averaged maximum (landmark) RMS only refer toHomo1, Pan1, Pongo1, Petralona, and Sts 5 and are
Fig. 2. Example of the “surface” of root mean square (RMS) recon-struction standard deviation: Sts 5 reconstructed by Pongo sample(20 reconstructions in total). The underlying patch for this surface isthe neurocranial region coded in green color in Fig. 1. White: highreconstruction standard error, Black: no reconstruction standard error.
832 SENCK ET AL.

shown in Table 2. Values for maximum landmark RMSare specified in brackets in the following paragraphs.
The averaged maximum RMS for interspecies recon-struction in the superior alveolar process reached valuesup to 5.01 mm when reconstructing Petralona by Pongo(Table 2). Interspecies reconstruction in this regionshowed the highest accuracy if Pongo1 was recon-structed by Pan and Homo (1.91 mm and 1.73 mm). Inthe anterior maxillary surface, the averaged maximumRMS for interspecies reconstruction reached values upto 7.65 mm when using Pongo as reference for the recon-
struction of Petralona (Table 2). The highest accuracywas achieved by using the Pan sample as reference forthe reconstruction of Pongo1 (1.40 mm), comparable tothe intraspecies reconstruction of Pongo1 (1.39 mm).The averaged maximum RMS in the interorbital andnasal region were the highest observed in the facialregion (Table 2). The lowest averaged maximum RMSfor interspecies reconstructions was found for Pongo1when reconstructed by Pan (3.27 mm). Note that theintraspecies averaged maximum RMS between thereconstructions and the original Homo1 was already
Fig. 3. Reconstructions using the Procrustes mean shape (PMS) as reference (Ref PMS). Minimum andmaximum distances between the original and reconstructed surface of each region in the facial knockoutarea for the (a) superior alveolar process (SAP), (b) anterior maxillary surface (AMS), (c) nasal and interor-bital area (IORB), and (d) supraorbital region (SORB).
VIRTUAL RECONSTRUCTION OF HOMINOID CRANIA 833

7.28 mm, being approximately twice as high. Highestvalues for all combinations of reference and target werealways found at rhinion which is situated in the middleof the missing area and therefore shows the highestdeviation (due to poor preservation of rhinion, it was notconsidered for the fossil specimens). The average maxi-mum RMS in the supraorbital region shows values simi-lar to those in the anterior maxillary surface (Table 2).The highest accuracy in interspecies reconstruction canbe observed when reconstructing Pongo1 using the Pansample as reference (1.33 mm). However, the highestaveraged maximum RMS was found when using Pongoas reference for the reconstruction of Pan1 (6.97 mm),indicating that a reference of similar form does notalways yields the highest accuracy.
Considering the fossils, the reconstruction of Sts 5showed the highest accuracy when using Pan or Pongoas references, depending on the region to reconstruct.Reconstructions of Sts 5 with the Pan or Pongo samplestherefore yield average maximum RMS that are in the
range of intraspecies reconstructions for all the regions(Table 2). For example, reconstructing the area of theanterior maxillary surface, the intraspecies averagemaximum RMS for the Homo1 is 2.25 mm, while thereconstruction of Sts 5 using the Pan sample shows anaverage maximum RMS of 2.23 mm. Estimating missingdata in Petralona always showed a low uncertaintywhen the Homo sample was employed as reference.Nevertheless, values for the average maximum RMS inthe reconstruction of Petralona by Homo are higherthan for the intraspecies reconstruction of Homo1.
Neurocranial Reconstructions
Figure 4 illustrates the minimum and maximum dis-tances for each region in the neurocranial knockoutarea. Minimum distances do not approach zero in allregions because the surface to be reconstructed in themidsagittal line is very small, and hence, the landmarksthat fix the TPS on the boundary are relatively farther
Fig. 4. RefPMS: Minimum and maximum distances between the original and reconstructed surface foreach region in the neurocranial knockout area based on the Procrustes mean shape (PMS). (a) sphenoid(SPHE), (b) parietal (PAR), and (c) midsagittal area (MID).
834 SENCK ET AL.
away. The results of the neurocranial RefPMS recon-structions show that the maximum distance from theoriginal to the reconstruction is higher in the missingsphenoid area than in the parietal area. This is due tothe strong curvature of the outer surface of the greaterwings of the sphenoid bone. The deviation is higher thanin the parietal, although the area of the latter is approx-imately four times larger than of the missing sphenoidarea. By contrast, the deviation from the original is com-parably low for interspecies reconstructions of the parie-tal area, showing maximum distances of less than 8 mmexcept for the reconstruction of Homo specimens by thePMS of Pan and Pongo.
Averaged maximum (landmark) RMS for Homo1,Pan1, Pongo1, Petralona, and Sts 5 are shown in Table2. Lowest average maximum RMS in interspecies recon-structions of the sphenoid area were found in the recon-
struction of Pongo1 by the Pan sample (1.64 mm),showing a similar average maximum RMS than theintraspecies reconstruction of Pongo1 (1.84 mm).Reconstructions involving Homo1 showed the highestaverage maximum RMS (Table 2). As the sphenoid ischaracterized by greatly varying local patterns of curva-ture within each species, it represents a more difficulttopography to reconstruct. Maximum distances in intra-and interspecies reconstruction are comparable to theparietal area, even though the missing area is muchsmaller. In the parietal, interspecies reconstructionreached average maximum RMS up to 7.91 mm whenusing Pan as reference for the reconstruction of Homo1.The highest accuracy was achieved by using Pan as ref-erence for the reconstruction of Pongo1 (0.83 mm), show-ing a very similar average maximum RMS compared tothe reconstruction of Pongo1 with the Pongo sample
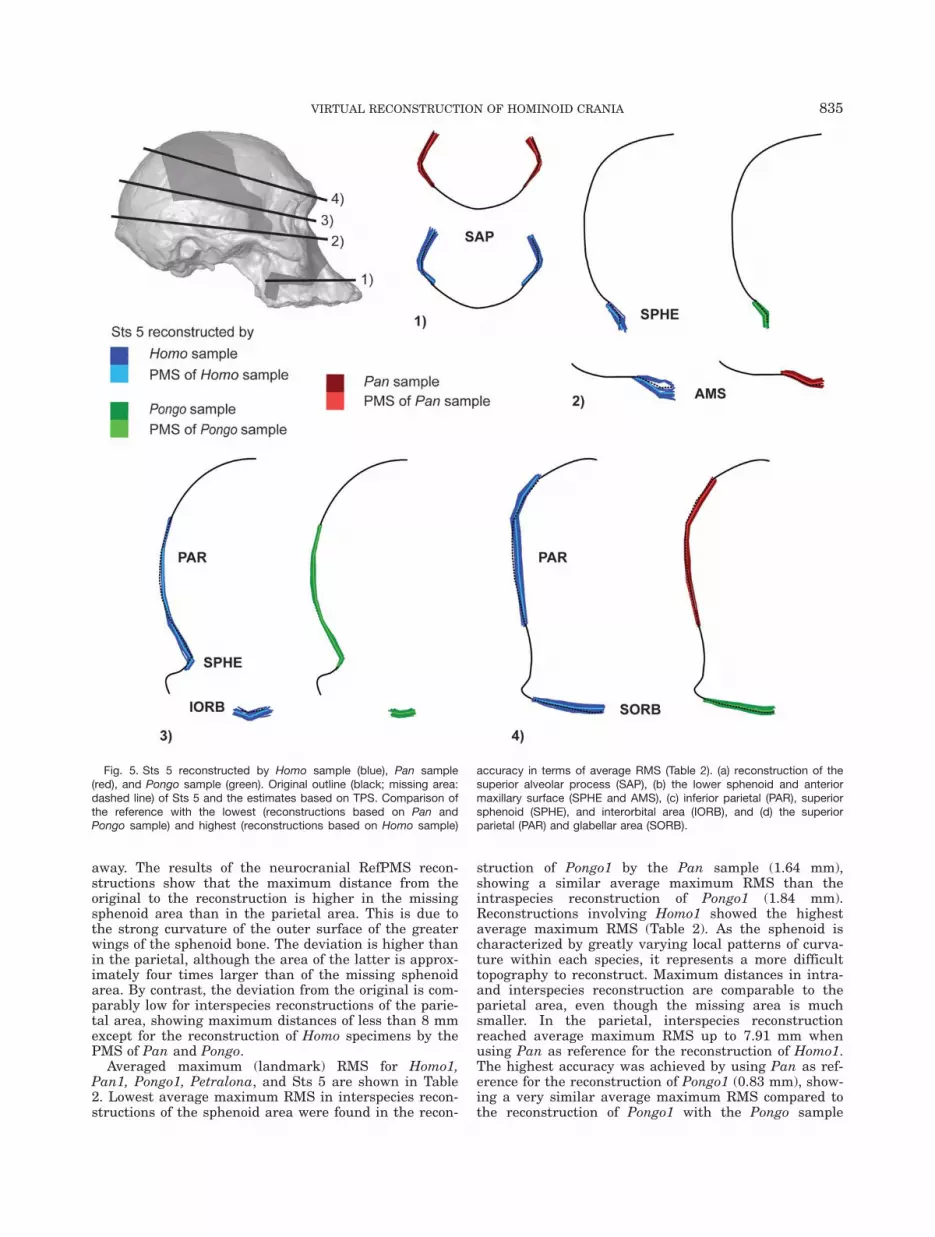
Fig. 5. Sts 5 reconstructed by Homo sample (blue), Pan sample(red), and Pongo sample (green). Original outline (black; missing area:dashed line) of Sts 5 and the estimates based on TPS. Comparison ofthe reference with the lowest (reconstructions based on Pan andPongo sample) and highest (reconstructions based on Homo sample)
accuracy in terms of average RMS (Table 2). (a) reconstruction of thesuperior alveolar process (SAP), (b) the lower sphenoid and anteriormaxillary surface (SPHE and AMS), (c) inferior parietal (PAR), superiorsphenoid (SPHE), and interorbital area (IORB), and (d) the superiorparietal (PAR) and glabellar area (SORB).
VIRTUAL RECONSTRUCTION OF HOMINOID CRANIA 835

itself (0.81 mm). The intraspecies reconstruction of Pan1performed as well as the interspecies reconstruction ofPan1 by Pongo (each 1.65 mm).
Although the midsagittal missing area is rather small,high average maximum RMS were found when usingHomo references for the reconstruction of Homo1(2.59 mm). Using Pan or Pongo as reference in thereconstruction of Homo1 (1.05 mm and 1.08 mm) showedlower average maximum RMS (Table 2). Lowest averagemaximum RMS were observed when reconstructingPan1 with the Pongo sample (0.55 mm) and vice versa(0.35 mm). In contrast to Homo1, estimating missingdata in Petralona using the Homo reference sampleshow a lower average maximum RMS (1.13 mm) exceptfor the sphenoid area for which average maximum RMSof 3.9 mm (taking the Pan sample as reference) and4.08 mm (taking the Pongo sample as reference) werefound.
In contrast to Sts 5, interspecies reconstructions ofPetralona yield average maximum RMS that are higherthan for intraspecies reconstructions. With regard to Sts5, Pan and Pongo samples yielded the highest accuracyin the reconstruction of the three neurocranial regionsshowing average maximum RMS that are comparable tointraspecies reconstructions. For example, reconstruct-ing the parietal area the intraspecies average maximumRMS for the Homo1 is 2.85 mm, while the reconstructionof Sts 5 using the Pan sample shows an average maxi-mum RMS of 2.79 mm.
Visualizing Regional Effects Concerning theChoice of the Reference
Figure 5 shows the interspecies reconstructions of Sts5, displaying the reconstructions with the highest andlowest average maximum RMS for each region (Table 2).
Consequences of the choice of the reference are lessobvious in the area of the superior alveolar process (Fig.5.1, SAP). In contrast, consequences of reference choicewere much more apparent in the lower region of thesphenoid (Fig. 5.2, SPHE), where the variation in thereconstructions of Sts 5 using Homo (blue) is muchhigher than Pongo (green). The same is true in the ante-rior maxillary surface, where Homo shows maximumvalues up to twice those of the Pan sample (Fig. 5.2,AMS). In the lower parietal and upper sphenoid area,the Pongo reference sample showed the highest accuracy(Fig. 5.3, PAR and SPHE), estimating the neurocranialcurvature of Sts 5 much better than the Homo sample.Firstly, the reconstructions of Sts 5 using Homo show amuch higher variation in the sphenoidal region (Table2); secondly, the outline in the center of the missing areais shifted medially in the Homo reconstructions. Usingthe Pongo sample as reference, the uncertainty is alsothe lowest for the interorbital area (Fig. 5.4, IORB). Thedifference in the performance of different references isalso obvious in the parietal, especially in the center ofthe missing area where the deviation from the originalis highest (Fig. 5.4, PAR). The reconstructions of Homoresemble the human neurocranial shape characterizedby a straighter and flatter lateral neurocranial outlinecompared to that of great apes. In contrast, reconstruc-tions of Sts 5 using the Pan sample follow the parietalcurvature of Sts 5 much better, even though this regionis characterized by a huge defect, lacking information ofpreserved proximate morphology that could guide theTPS during missing data estimation. Reconstructions inthe glabellar area using Pongo as reference also exhibita higher accuracy than reconstructions by Homo, thoughneither reference choice is able to reconstruct the promi-nent glabellar area in Sts 5 appropriately (Fig. 5.4,SORB).
Fig. 6. Shape space PCA of original and reconstructed hominoidskulls. The original skulls are identified as small dots, Homo (blue);Pan (red); Pongo (green); the fossil Petralona (black) and Sts 5 (yel-low). 95% confidence ellipsoids (large ellipsoids) have been drawn
around the original Homo, Pan, and Pongo specimens. The smaller95% confidence colored ellipsoids represent the reconstructions ofHomo1, Pan1, Pongo1 and the fossils using the reference samples ofHomo (blue), Pan (red), and Pongo (green).
836 SENCK ET AL.

Visualizing the Variation of theReconstructions
In Fig. 6, the fossil reconstructions (facial and neuro-cranial landmarks combined) of Petralona (black) andSts 5 (yellow) as well as the reconstruction of Homo1(aquamarine blue), Pan1 (dark red), and Pongo1 (darkgreen) are projected in the shape space (PC1: 77.2%,PC2: 13.1%, PC3: 2.8%) spanned by the (semi)landmarksof the three reference species (Homo: blue, Pan: red,Pongo: green). The colors of the 95% ellipsoids corre-spond to the species used as the reference specimen dur-ing reconstruction.
Within this subspace of highest explained Procrustesshape variance, the variation within each group of alter-nate reconstructions is rather low compared to the varia-tion within species. If we merely use information fromthe PCA plot to choose our reference, for example, toreconstruct Sts 5, the decision will be rather difficult tomake at this largest scale precisely because the recon-structions using Pan and Pongo are so widely overlap-ping. As we showed in a detailed look at reconstructedregions (see Figs. 3–5; Table 2), a level of detail notavailable from the preceding diagram, different refer-ence samples show a higher accuracy in differentregions. Since we are missing detailed morphologicalinformation about variation in fossil species, only thissmall-scale inspection of the consequences in applyingdifferent references would permit a conclusion as towhether any choice of reference sample is appropriate atall. Nevertheless, some general guidelines can be drawnfrom our experiments that might be helpful to decidewhen one reference sample might be less inappropriatethan another.
Guiding the Choice of the Reference Sample
We can consider the resulting bending energy of theTPS as a criterion of uncertainty in the process of recon-struction. Figure 7 shows a scatterplot of the bendingenergy values against the Procrustes distance from theoriginal to the corresponding reconstruction, in thisexample for Pan1, for which we find a correlation of0.94. Generally, the highest correlations between eachpair (reconstruction—original) can be found within theextant species (Pearson’s product/moment correlation:rHomo1 5 0.88, rPan1 5 0.94, rPongo1 5 0.91). Correlationsfor the fossil reconstructions are lower (rPetralona 5 0.65,rSts 5 5 0.75). As shown in Fig. 7, if we reconstruct Pan1,some reconstructions based on Pongo specimens show asimilar accuracy as those using Pan specimens. Thegraph shows also that the variability for the reconstruc-tions using Pongo is smaller than for the reconstructionsusing either Pan or Homo.
The high concordances suggest that bending energycan be used to estimate the performance of the recon-struction and thus provides a guideline for choosing anappropriate reference group in this sample for the par-ticular missing area. The drawback of this approach isthat it can only be considered as a useful guide if theregion to be estimated is present at least in one completeindividual of the same species, which is not the case forsome fossils. This is because the bending energy betweentwo individuals has to be assessed on the basis of thecomplete morphology—not merely on the area surround-
ing missing data—to be able to quantify the differencesbetween estimated and actual morphology (e.g., by maxi-mum average RMS). After the computation of the bend-ing energy between two complete specimens (e.g., Pan1and Sts5, Pongo1 and Sts5, and Homo1 and Sts5), thereference that shows the smallest bending energy to the(complete) target can be used for the estimation of miss-ing data in an incomplete specimen of the same species(in our sample Pan for Sts5).
DISCUSSION
In this study, we investigated in detail how the choiceof the reference sample in thin-plate spline (TPS)-basedreconstructions influences the uncertainty in terms ofreconstruction accuracy. Although previous work hasaddressed this topic (e.g., Gunz et al., 2009, Neeseret al., 2009; Senck et al., 2013), a comprehensivedescription of effects resulting from the choice of refer-ence, particularly if drawn from other species, was notyet available. Additionally, we introduced a potentialway to guide the choice of the reference sample in inter-species reconstructions in terms of bending energy.
Not unexpectedly, using reference specimens of simi-lar shape produced the highest accuracy, both for facialand for neurocranial reconstructions. Surprisingly,though, the interspecies reconstructions of Sts 5 withthe Pan or Pongo samples yield average maximum RMSthat are in the range of intraspecies reconstructions forall the regions (Table 2). This also holds for reconstruc-tions of Sts 5 using the Procrustes mean shape (PMS) ofthe respective extant sample, showing maximum devia-tions in the upper range of intraspecies reconstructions(Figs. 3 and 4). Nevertheless, we recommend using allavailable specimens in combination with the PMSduring the reconstruction process to be able to visualizethe full variation of the resulting reconstructions.Furthermore, we observed that a reference sample of
Fig. 7. Correlation between bending energy and the Procrustes dis-tance from Pan1 to each corresponding reconstruction. Pan1 recon-structed by Pan (red), Homo (blue), and Pongo (green).
VIRTUAL RECONSTRUCTION OF HOMINOID CRANIA 837

similar form does not necessarily yield the highest accu-racy, for example, reconstructing the alveolar process ofPongo using Homo as reference sample yields slightlylower maximum average RMS than employing Pan.However, missing data estimation in certain regions thatrepresent derived characters of a taxon cannot be recon-structed reliably using another taxon, for example, theglabellar region in Petralona and Sts5 using extanthominoids.
In our knockout configuration applied here, the result-ing uncertainty, that is, posterior distribution, in neuro-cranial reconstructions is lower than in the face. Thehigher accuracy in neurocranial (interspecies) recon-struction is due to the fact that the TPS is based on thesmoothness properties of the area surrounding theregion to reconstruct (cf. Gunz et al., 2009) and is locallybent according to the surrounding morphology. The TPSis usually explained as a “smoothing” or “interpolation”function. Indeed, it minimizes overall bending of themap in the class of all maps consistent with the givenlandmarks (Bookstein, 1991). But variation in the rela-tive position of any two closely spaced landmarks leadsto large variations in the positions of estimated semi-landmarks (Bookstein and Green, 1993). The effect caneven be more dramatic if we use the spline to predictareas lying outside the convex hull of those landmarksused for the interpolation, or to put it to the extreme, ifwe try to estimate landmarks on the maxilla when onlyoccipital landmarks are present. However, we may findthe case that even “inside” a system of the knockoutarea, the spline will distort the estimated area(Bookstein, 1991; Bookstein and Green, 1993). In thecontext of reconstruction, this effect will be presentwhenever there is considerable variation of curvatureright at the edge of the simulated “knockout region.”This effect was most obvious in the sphenoidal areaowing to different degrees of postorbital constrictionamong species. The degree of constriction is comparablebetween Pan, Pongo, and perhaps also A. africanus, butit is significantly reduced in Homo which leads to anincreased uncertainty of reconstruction in this area.
Reconstructing specimens of similar neurocranialshape, for example, between Pan and Pongo, we find thelowest uncertainties. The homologous neurocranial areamissing in Homo has a relatively larger area than inPan or Pongo, an obvious effect of the size increase andglobularization of the human cranium. Therefore, high-est maximum average RMS could be found when Homowas reconstructed by Pan or Pongo. Because the endo-cranial capacity and neurocranial shape of the greatapes is similar to gracile Australopiths, they are gener-ally more qualified as a reference for a target of similarcranial shape such as Sts 5. Further “knockout” simula-tions will be needed to show if these assumptions alsohold for robust Australopith specimens like A. boisei.
Splines in a missing region are bent according to theoriginal shape of the reference, and according to the pre-served morphology of the specimen under reconstruction(see e.g. the sphenoidal area). For example, the sagittalprofile of Petralona is not much different in size but isquite differently shaped compared to Homo—it is lessglobular, and thus, the reconstruction is worse usingHomo templates than Pan or Pongo. In the lateral miss-ing area, however, the accuracy taking Homo as refer-ence is higher, those from Pan and Pongo worse.
We cannot expect any reference specimen fromanother taxon to deliver good results in all possibleregions. Interspecies reconstructions are a compromisein response to a lack of alternatives.
As mentioned, reconstructions in facial regions gener-ally show a higher uncertainty than in neurocranialregions. The facial topography with its locally dramati-cally changing curvature (e.g., in the nasal region) ismuch more complex. TPS in the face implements themorphology of the missing area from the reference sam-ple into the target, the thin-plate spline being locallybent according to the preserved morphology. If the speci-men to be reconstructed and the reference specimens aresimilar in gross morphology with regard to facial shape(i.e., prognathic vs. orthognathic), the average maximumRMS for interspecies reconstructions are similar toreconstructions within the species, as shown for Pan andPongo.
Why, then, does reconstruction of great apes some-times perform comparably well when taking Homo as areference, for example, in the superior alveolar andsupraorbital area? In our experiments, the answer is asfollows: because both regions lie in the direct vicinity ofpreserved morphology. As shown in Fig. 2, the estima-tion of missing data naturally performs better at theedges than toward the center of the missing area. Thiseffect of large reconstruction errors is obvious in ourinterorbital and nasal knockout regions, which werecharacterized by a complete lack of bone in their neigh-borhood. The distinct features of the human nasal mor-phology additionally add to the higher uncertainty,leading to maximum average RMS up to 8.20 mm(Homo1 reconstructed by Pan) and 7.60 mm (Homo1reconstructed by Pongo).
When reconstructing the great apes with the Homosample, maximum average RMS were up to twice ashigh (19.98 mm). In those cases, a human-shaped nasalroof was introduced into the reconstructions. This ren-ders missing data estimation in this region pointless andillustrates how characteristic features of derived refer-ence taxa can affect reconstructions towards potentially“preconceived morphologies” (Zollikofer and Ponce deLeon, 2005). This confirms results by Gunz et al. (2009)who stated that “the posterior distribution of the recon-structions reflects the shape differences among the refer-ence crania that served as the prior distribution used toimpute the missing data.”
As Fig. 6 showed, the variation in reconstructionsmight prove smaller than any hypothetic intraspeciesvariation of the fossil specimens (if one assumes a simi-lar range of variation as seen in the extant species). Inthe morphometric subspace of the first three PCs, thereconstructions of Homo1, Pan1, Pongo1, Petralona, andSts 5 show only a small posterior distribution, that is,the variability of the reconstructions is smaller than theintraspecies variation. However, it is also worthwhile toemphasize that the variation is small also because thedistance function here, Procrustes distance, is not sensi-tive to restricted local changes like, for example, theintroduction of a H. sapiens nasal roof in the reconstruc-tion of the great apes. If only information from the PCAplot is used to decide which reference species is accepta-ble, for example, to reconstruct Sts 5, the decision willbe extremely vague because the reconstructions usingPan and Pongo are so widely overlapping. Only the
838 SENCK ET AL.

detailed look at the regional uncertainties (see Figs. 3–5;see Table 2) provides a level of detail necessary to eluci-date the pitfalls that can occur during interspeciesreconstructions.
This issue should be carefully considered if thesereconstructions are used in further analyses. For exam-ple, since the geometry of the reconstruction influencesthe estimated muscle attachment points that are essen-tial parameters in biomechanical simulations, the orien-tation of muscle forces and consequently the computeddeformations of the fossil finite element model will beaffected. This is why we argue that the full posterior dis-tribution of any reconstruction has to accompany its vis-ualization, for example, in cases where reconstructionerrors may affect the FEA results in subsequent biome-chanical computations. We also argue that any use of areconstruction later in the data flow of any scientificproject should be accompanied by the maximum of theRMS differences, and also its geometrical representation(as a vector perpendicular to the surface), in order toconvey the actual uncertainty of the hypothetical formclaimed to have been reconstructed. Further analyses,particularly FE modeling experiments, are essential toobtain deeper insights about the effects of minor andmajor morphological changes in skull shape on the dis-tribution of stress and strain (Weber et al., 2011).
Another interesting case with regard to the conse-quences of the reference choice is the reconstruction ofthe supraorbital region. P. troglodytes exhibits a strong,bar-like supraorbital torus separated from the frontalsquama by a transverse depression identified as the sul-cus supra-orbitalis (Shea, 1988). Since Sts 5 is character-ized by the absence of this sulcus intervening betweenthe frontal squama and the forward-jutting supraorbitalelement (Schwartz and Tattersall, 2002), we achieve thehighest accuracy in facial reconstruction using Pongo asit lacks a supraorbital torus as well. However, none ofthe references was able to reconstruct the bulging gla-bellar area of Sts 5 accurately, since none of the referen-ces has this trait. This also applies to the thicksupraorbital tori in Petralona; all the reference speciesfailed to reconstruct the morphology adequately, theHomo sample came closest. The choice of the referenceultimately changed the estimated supraorbital morphol-ogy and the shape variability among the multiple recon-structions reflects the uncertainty that is theconsequence of the reference choice. These findings arein accordance with the findings on reference sampledependency on reconstructed shape features of thesupraorbital region in the Homo erectus s.l. specimenKNM-WT 15000 reported by Gunz et al. (2009).
These findings confirm prior views that morphologicalcharacteristics of the reference specimen(s) will be intro-duced into the reconstructions (e.g., Zollikofer and Poncede Leon, 2005; Gunz et al., 2009). But in which way?Producing multiple reconstructions of several hominoidspecimens we could exemplify the degree to which ana-tomical characteristics of the reference are incorporatedinto the reconstruction. We showed that even for a rela-tively small missing region a high curvature at the edgeof the area, for example, for the sphenoidal “knockout”area, leads to an increased uncertainty of reconstruction.This concerns intra and interspecies reconstructions.Nevertheless, we demonstrated that using TPS largemissing regions can be reconstructed with a relatively
low uncertainty if the surface surrounding the recon-structed region is smooth, the point spacing of the coor-dinates on the nonmissing part is dense, and the shapeof the reference is similar to the specimen to be recon-structed (e.g., for the parietal area). This is contradictsthe findings of Neeser et al. (2009) who stated that“thin-plate splines also show an unexpectedly largeamount of error in estimating landmarks, especially overlarge areas.”. Finally, we showed that for certain regionsa reconstruction is not feasible if the feature is highlyvariable within the species, for example, the nasal roofin Homo or the supraorbital region in Pan. In thoseregions, the shape variability among the multiple recon-structions is high for intraspecies reconstructions andincreases for interspecies reconstructions (Table 2).
Besides illustrating how reconstructions are influ-enced by the choice of different reference samples, wealso show that higher reconstruction accuracy (in termsof smaller Procrustes distance from the original to thereconstruction) is associated with smaller bendingenergy values. This leads to an approach for choosingappropriate reference specimens for the species used inour sample and experimental setup. In our analyses, thebending energy and Procrustes distance show the high-est correlations within the extant species (r> 0.88).Correlations for the fossil reconstructions are lower (rbetween 0.65 and 0.75). These results show that for thereconstruction of a fossil specimen it would of course bebest to select specimens from the same species. As thisis not possible in many cases due to the scarcity of mate-rial, we propose, at least for the fossil species that weincorporated (A. africanus, H. heidelbergensis), to choosefrom another species that shows the lowest averagebending energy vis-a-vis the target (for instance, P. trog-lodytes as reference for A. africanus, H. sapiens for H.heidelbergensis). By estimating missing data in fossilspecimens that have been virtually “damaged,” weshowed that the uncertainty of fossil reconstructions (interms of the reconstruction accuracy) is in certainregions comparable to intraspecies reconstruction ofextant specimens. This information and the high correla-tion between reconstruction accuracy and bendingenergy leads us to the recommendation to use a Pansample for the reconstruction of gracile Australopiths(including A. africanus and the A. afarensis specimenA.L. 444-2), except for the glabellar area (which shouldnot be considered for interspecies reconstruction).
The “knockout” simulations performed in this studyare by no means exhaustive and continuative studiesare needed to explore if these recommendations alsohold for other species (e.g., robust Australopiths) andother missing areas. A future goal is to establish a list ofpotential references for interspecies reconstruction. Thiscould be achieved by establishing a database for a selec-tion of species, in which the morphology of several sub-areas of at least one complete specimen is estimated bydifferent reference samples. For this database, everyspecimen should be reconstructed with every other speci-men, resolving one of the shortcomings of our studydesign - namely the restricted number of reconstructionsdue to the time and effort needed to build this pilotstudy.
This approach is nevertheless problematic for fossilspecies with extremely small sample sizes. A guidelinefor the reconstruction of fragmented fossils which is
VIRTUAL RECONSTRUCTION OF HOMINOID CRANIA 839

based on bending energy can only be useful for taxacomprising a sufficient number of preserved specimens(e.g., A. africanus). Even if there are no complete speci-mens, information from several specimens of the sametaxon could be combined in such a database. For thosetaxa lacking a sufficient number of fossils, this guidelineis unfortunately of no additional help.
Besides selecting the reference cautiously, whichrequires profound knowledge of anatomical and morpho-logical characteristics of the involved species, it is alsoimportant to incorporate as much morphological infor-mation from the specimen to be reconstructed as possi-ble (individual form constraints; see Weber andBookstein, 2011). The accuracy of estimation, especiallywhen employing a reference sample from different spe-cies, depends on the number of missing coordinates, thegeometry of the missing part, its variability in the refer-ence population, and last but not least the point spacingand distribution of the coordinates on the non-missingparts (Senck et al., 2013). In this context, the crucialresource is the presence of semilandmarks that coverthe whole existing morphology appropriately (Gunzet al., 2009). We argue, in contradiction to Neeser et al.(2009) who stated that “morphological similarity appearsto be of less importance than large reference-samples,”that morphological similarity in terms of geometricalcloseness is crucial for the choice of the reference sam-ple, especially when using TPS as a reconstructionmethod. Considering the discussed constraints andguidelines, interspecies reconstruction is able to recon-struct the missing areas in some cases with only a smallerror, as shown for Sts 5.
CONCLUSIONS
Relying throughout the reconstruction process on dataresources comprising many hundreds of landmarks andsemilandmarks, we have shown that TPS-based recon-structions are able to estimate missing data for largecranial defects in both the face and the neurocranium.We showed that the accuracy in interspecies reconstruc-tion lead often to very similar errors and in some casesa higher accuracy than in intraspecies reconstructions,for example, among Pan and Pongo and Pan/Pongo andthe A. africanus specimen Sts 5. We suggest that theaverage maximum RMS, in the form of a geometricalrepresentation should accompany its visualization tokeep track of the uncertainties for subsequent analyses.Finally, we introduced a potential guideline (based onbending energy values) for making the decision of whichreference sample should be chosen for interspeciesreconstructions, if at least one complete fossil specimenof the concerned taxon is available.
ACKNOWLEDGEMENTS
We thank Antonio Rosas Gonz�alez (Museo Nacional deCiencias Naturales, Madrid, Spain), Ottmar Kullmer(Abteilung Pal€aoanthropologie und Quart€arpal€aontologie,Forschungsinstitut Senckenberg, Frankfurt, Germany),Jose Braga (Universit�e Paul Sabatier, Toulouse, France)for access to CT data via NESPOS database (https://www.nespos.org/display/openspace/Home). We thank George D.Koufos from Aristotle University of Thessaloniki, MariaTeschler Nicola from Natural History Museum Vienna
and Francis Thackeray and Stephanie Potze fromTransvaal Museum Pretoria for access to fossils and per-mission to CT scan. We are also grateful to Richard Kraftfor access to the Zoologische Staatssammlung Munich,Germany. We thank Michael Coquerelle and BernhardPlank for general discussion and scientific input. Finally,we are very grateful for the very helpful comments of theeditor and reviewers which helped to improve themanuscript.
LITERATURE CITED
Benazzi S, Bertelli P, Lippi B, Bedini E, Caudana R, Gruppioni G,Mallegni F. 2010. Virtual anthropology and forensic arts: thefacial reconstruction of Ferrante Gonzaga. J Archaeol Sci 37:1572–1578.
Benazzi S, Bookstein FL, Strait DS, Weber GW. 2011a. A new OH5reconstruction with an assessment of its uncertainty. J Hum Evol61:75–88.
Benazzi S, Fantini M, De Crescenzio F, Mallegni G, Mallegni F,Persiani F, Gruppioni G. 2009a. The face of the poet DanteAlighieri reconstructed by virtual modelling and forensic anthro-pology techniques. J Archaeol Sci 36:278–283.
Benazzi S, Fiorenza L, Kozakowski S, Kullmer O. 2011b.Comparing 3D virtual methods for hemimandibular body recon-struction. Anat Rec 294:1116–1125.
Benazzi S, Gruppioni G, Strait DS, Hublin JJ. 2014. Virtual recon-struction of KNM-ER 1813 homo habilis cranium. Am J PhysAnthropol 53:154–160.
Benazzi S, Kullmer O, Schulz D, Gruppioni G, Weber GW. 2013.Individual tooth macrowear pattern guides the reconstruction ofSts 52 (Australopithecus africanus) dental arches. Am J PhysAnthropol 150:324–329.
Benazzi S, Senck S. 2011. Comparing 3-dimensional virtual meth-ods for reconstruction in craniomaxillofacial surgery. J OralMaxillofac Surg 69:1184–1194.
Benazzi S, Stansfield E, Kullmer O, Fiorenza L, Gruppioni G.2009b. Geometric morphometric methods for bone reconstruction:the mandibular condylar process of Pico della Mirandola. AnatRec 292:1088–1097.
Benazzi S, Stansfield E, Milani C, Gruppioni G. 2009c. Geometricmorphometric methods for three-dimensional virtual reconstruc-tion of a fragmented cranium: the case of Angelo Poliziano. Int JLegal Med 123:333–344.
Bookstein FL. 1991. Morphometric tools for landmark data: geome-try and biology. Cambridge: Cambridge University Press.
Bookstein FL, Green WDK. 1993. A feature space for edgels inimages with landmarks. J Math Imaging Vis 3:231–261.
Bookstein FL, Green WK. 2002. Edgewarp 3D. Available at: ftp://brainmap.stat.washington.edu/pub/fred/ewsh3.19.man/.
Broom R. 1947. Discovery of a new skull of the South African ape-man, Plesianthropus. Nature 159:672.
Grine FE, Gunz P, Betti-Nash L, Neubauer S, Morris AG. 2010.Reconstruction of the late Pleistocene human skull from Hofmeyr,South Africa. J Hum Evol 59:1–15.
Gr€oning F, Fagan M, O’Higgins P. 2012. Modeling the human man-dible under masticatory loads: which input variables are impor-tant? Anat Rec 295:853–863.
Gunz P. 2005. Statistical and geometric reconstruction of hominidcrania: reconstructing australopithecine ontogeny. Ph.D. Thesis,University of Vienna, Vienna, Austria.
Gunz P, Bookstein FL, Mitteroecker P, Stadlmayr A, Seidler H,Weber GW. 2009a. Early modern human diversity suggests subdi-vided population structure and a complex out-of-Africa scenario.Proc Natl Acad Sci 106:6094–6098.
Gunz P, Mitteroecker P, Neubauer S, Weber GW, Bookstein FL.2009b. Principles for the virtual reconstruction of hominin crania.J Hum Evol 57:48–62.
840 SENCK ET AL.
Gunz P, Neubauer S, Maureille B, Hublin JJ. 2010. Brain develop-ment after birth differs between Neanderthals and modernhumans. Curr Biol 20:921–922.
Gunz P, Mitteroecker P. 2013. Semilandmarks: a method for quanti-fying curves and surfaces. Hystrix, the Italian Journal ofMammalogy 24. doi:10.4404/hystrix-24.1-6292.
Kimbel W, Rak Y, Johanson D. 2004. The skull of Australopithecusafarensis. Oxford: Oxford University Press.
Kokkoros P, Kanellis A. 1960. D�ecouverte d’un crane d’hommepal�eolithique dans p�eninsule Chalcidique. Anthropologie 64:132–147.
Kranioti EF, Holloway R, Senck S, Ciprut T, Grigorescu D, HarvatiK. 2011. Virtual assessment of the endocranial morphology of theearly modern European fossil calvaria from cioclovina, Romania.Anat Rec 294:1083–1092.
Marinescu R, Daegling DJ, Rapoff AJ. 2005. Finite-element model-ing of the anthropoid mandible: the effects of altered boundaryconditions. Anat Rec Part A 283a:300–309.
Mitteroecker P, Gunz P. 2009. Advances in geometric morphomet-rics. Evol Biol 36:235–247.
Neeser R, Ackermann RR, Gain J. 2009. Comparing the accuracyand precision of three techniques used for estimating missinglandmarks when reconstructing fossil hominin crania. Am J PhysAnthropol 140:1–18.
Neubauer S, Gunz P, Mitteroecker P, Weber GW. 2004. Three-dimensional digital imaging of the partial Australopithecus africa-nus endocranium MLD 37/38. Can Assoc Radiol J 55:271–278.
O’Higgins P, Cobb SN, Fitton LC, Gr€oning F, Phillips R, Liu J,Fagan MJ. 2011. Combining geometric morphometrics and func-tional simulation: an emerging toolkit for virtual functional anal-yses. J Anat 218:3–15.
Ponce De Le�on MS, Zollikofer CPE. 1999. New evidence from LeMoustier 1: computer-assisted reconstruction and morphometry ofthe skull. Anat Rec 254:474–489.
Rohlf FJ, Slice D. 1990. Extensions of the Procrustes method forthe optimal superimposition of landmarks. Syst Biol 39:40–59.
Schwartz JH, Tattersall I. 2002. Craniodental morphology of earlyhominids (Genera Australopithecus, Paranthropus, Orrorin), andoverview. Hoboken, New Jersey: Wiley-Liss.
Sellers WI, Crompton RH. 2004. Using sensitivity analysis to vali-date the predictions of a biomechanical model of bite forces. AnnAnat 186:89–95.
Senck S, Coquerelle M, Weber GW, Benazzi S. 2013. Virtual recon-struction of very large skull defects featuring partly and com-pletely missing midsagittal planes. Anat Rec 296:745–758.
Shea BT. 1988. Phylogeny and skull form in the hominoid primates.In: Schwartz JH, editor. Orang-utan biology. Strasbourg: OxfordUniversity Press.
Spoor F, Zonneveld F, Macho GA. 1993. Linear measurements ofcortical bone and dental enamel by computed tomography: appli-cations and problems. Am J Phys Anthropol 91:4692484.
Strait DS, Grosse IR, Dechow PC, Smith AL, Wang Q, Weber GW,Neubauer S, Slice DE, Chalk J, Richmond BG, Lucas PW,Spencer MA, Schrein C, Wright BW, Byron C, Ross CF. 2010. Thestructural rigidity of the cranium of Australopithecus africanus:implications for diet, dietary adaptations, and the allometry offeeding biomechanics. Anat Rec 293:583–593.
Strait DS, Weber GW, Neubauer S, Chalk J, Richmond BG, LucasPW, Spencer MA, Schrein C, Dechow PC, Ross CF, Grosse IR,Wright BW, Constantino P, Wood BA, Lawn B, Hylander WL,Wang Q, Byron C, Slice DE, Smith AL. 2009. The feeding biome-chanics and dietary ecology of Australopithecus africanus. ProcNatl Acad Sci 106:2124–2129.
Watson PJ, O’Higgins P, Fagan MJ, Dobson CA. 2011. Validation ofa morphometric reconstruction technique applied to a juvenilepelvis. Proceedings of the Institution of Mechanical Engineers,Part H: Proc. Inst Mech Eng H J Eng Med 225:48–57.
Weber GW, Bookstein FL. 2011. Virtual anthropology: a guide to anew interdisciplinary field. Berlin, Heidelberg, New York:Springer.
Weber GW, Bookstein FL, Strait DS. 2011. Virtual anthropologymeets biomechanics. J Biomech 44:1429–1432.
Zollikofer CPE, Ponce de Leon MS. 2005. Virtual reconstruction: aprimer in computer-assisted paleontology and biomedicine.Hoboken, New Jersey: Wiley.
VIRTUAL RECONSTRUCTION OF HOMINOID CRANIA 841


