Embed Size (px)
Citation preview

J. Mol. BioL (1995) 246, 576-584
JMB Visualization of TBP Oligomers Binding and Bending the HIV-1 and Adeno Promoters
Jack D. GriffitW*, Alexander Makhov', Leigh ZaweF and Danny Reinberg 2
%ineberger Comprehensive Cancer Center, University of North Carolina, Chapel Hill NC 27599-7295, U.S.A.
2Department of Biochemistry Robert Wood Johnson Medical School, University of Medicine and Dentistry of New Jersey, NJ 08854, U.S.A.
*Corresponding author
The binding Of the 28 kDa yeast TATA binding protein (yTBP) to the HIV and adeno major late promoters has been examined by electron microscopy (EM). Three different EM preparative methods were employed: direct mounting and shadowcasting of fixed samples, cryofixation and freeze-drying followed by shadowcasting, and negative staining of unfixed samples. Excellent agreement among the three methods was obtained. With ten yTBP monomers/DNA fragment, up to 25% of the DNA molecules contained easily distinguished protein particles at the TATA box and, less frequently, smaller particles were observed. Non-specific binding to DNA ends was common. The mass of the easily distinguished particles measured 63(+5) kDa (cryofixation and shadowcasting) and 48(+6) kDa (negative staining) indicating TBP dimerization. With 22 and 44 yTBP monomers/ DNA, yTBP polymerization produced DNA-protein rods 9 nm wide and 20 to 30 nm long, frequently with two DNA strands exiting one end. Bending analysis revealed that yTBP dimers bend the DNA about the TATA box by 80 to 90 ° . Although these protein ratios are relatively high, the structures formed demonstrate the propensity of yTBP to engage in protein-protein interactions.
Keywords: HIV; adeno; TATA box; TBP; electron microscopy
Introduction The TATA box binding protein (TBP) provides
sequence recognition for the assembly of transcrip- tion-competent complexes at class II promoters, and is found in all eukaryotic cells. In human cells TBP exists in a complex termed TFIID that includes at least seven other proteins. While recombinant TBP is sufficient for mediating basal transcription in conjunction with the full comp- lement of basal factors and RNAPII (Kao et al., 1990; Hoffman et al., 1990; Peterson et al., 1990), response of this machinery to transcriptional activators requires native TFIID (Peterson et al., 1990; Pugh & Tjian, 1990).
Comparison of TBP isolated from plant, yeast and higher eukaryotic cells has shown that it consists of an evolutionarily conserved C-terminal portion and a divergent amino terminus. The conserved C-termi- nal half contains two imperfect repeats each separated by an (x-helical basic region (Kao et al.,
Abbreviations used: TBP, TATA box binding protein; GST; glutathione S transferase; y, yeast; EM, electron microscopy; AdMLP, adenovirus major late promoter; PEG, polyethylene glycol.
1990; Hoffman et al., 1990; Peterson et al., 1990). The carboxyl portion by itself is sufficient for DNA binding and basal transcription activity (Kao et al., 1990; Hoffman et al., 1990; Peterson et al., 1990; Pugh & Tjian, 1990), while the amino-terminal portion is thought to mediate species-specific protein-protein interactions. The human protein is 38 kDa, the yeast TBP is 28 kDa, and the Arabidopsis thaliana TBP, which totally lacks the amino-terminal end, is 24 kDa (Gash et al., 1990).
Unlike most DNA binding proteins, TBP binds predominantly in the minor grove of DNA (Starr & Hawley, 1991; Lee et al., 1991). X-ray diffraction analyses of the Arabidopsis TBP alone (Nikolov et al., 1992), and the Arabidopsis (J. L. Kim et al., 1993) and yeast (Y. Kim et al., 1993) TBPs bound to 14 and 12 bp DNA duplexes, respectively, suggest that the TBP monomer resembles a molecular saddle that straddles the DNA with its two imperfect direct repeats. Modeling of how the DNA arms might project from the TBP monomer predicted that the DNA was bent by 90 ° (J. L. Kim et al., 1993; Y. Kim et al., 1993). Indeed the bending of DNA by TBP had been detected by gel retardation studies (Horikoshi et al., 1992) and methylation interference assays (Lee et al., 1991).
0022-2836/95/100576-09 $08.00/0 © 1995 Academic Press Limited

Visual izat ion o f TBP B ind ing to DNA 5 7 7
Studies employing gel retardation and GST pull down assays have shown that TBP can associate with many different proteins (e.g. see, Kerr et al., 1993; Xu et al., 1993; Merino et al., 1993). A major question, therefore, is how TBP interacts with itself and with other proteins when bound to DNA. One approach, taken here, involves forcing protein-protein inter- actions by using high molar ratios (but none the less involving protein concentrations of only 2 to 16 ~g /ml ) of TBP to the DNA binding site. By characterizing the structures formed under these conditions (which are unlikely to be physiological) the propensi ty of TBP to multimerize on DNA can be examined• If, as shown here, a variety of TBP-DNA structures can be characterized, this knowledge would set the groundwork for future studies in which different TBPs and other proteins could be introduced. For example, if multimeric structures were found with one TBP, but were absent with a TBP containing a shorter amino terminus, then this would help to define the function of this port ion of the molecule• Similarl~; TBP-DNA complexes might then be altered by addition of different proteins that interact with TBP. Here, using highly purified yeast TBP (yTBP), electron microscopy (EM) has been used to describe a series of multimeric structures formed by yTBP on DNA.
.: - , " : : " ~ "-::":::'.~:" ' : : : - : . - i " - , , ' - ; ' , - : ', - , ' - : - . : " . " :. ~. ' - ':'• :. '.a.:::..:::.....::...:.:;.;. ;-,,...;., , . . : ,-...~ ,:: ... -:.... :.: . . . . ' ~ . i - . : :.-.; :, ,:.:• •
' ; - . . * - , ~ ' ~ t ' ~ . . ":.. • " ~, • . d , " : ! . ; . , . . , . o ' , . . ' . • . , : : . . , ' . . • ~, : - ' : ; : ¢ : • ' . , .% . ' , . . . , - , . . - : " . " . . . - . , * ' , : • . • , ; . . , , • , . . . -
.,:! ,... ; . : ; . : . : : . . . ; , : : . . - . . . - , - . . ~ .,,~..~,~, r . ; . , . . . . :,..~:: . . ; , ; - , ' , . . . : ' : : . . , . : , .. . : . ..#" • ~ , . . . . . . . . ' ' . . ' . ,
. ; . , : , . . : " . ' : ' : . : . ' . . : : " . - . . . , . ~ , , , , . - , " . • - ' . , . . . . , , - - _ . ,: ; . : , . ' . . ' .
• , . : . : . . , - , . , , . . , ° ' . ' ; . . - . . . , ~ . ' . . . : • , , . . ~ ; . ' . . - . , . . .
r " . ~ . . . . . . : . " • ° 2 , ' " . " " . "" " - " . . " . " . , ' . ' " " . " " .
, ,~ " . ; :T" . *" . - : . " " . . ' " : ' " ' : : ' . " ' : . . ' " " ;..': " ' ' , . . ' . :~.: ' ; "' : ' ." ' . ' . : - ' ~ ' . ' : . A : . . ' ; . ' . ' , - " ' . . ' " - : " . . \ . " : . . . : - "~." . . . ' . " ." . . .~ :'" %,, :/.~;'"!: ! .;-".'.:.. " . :~ .- ': y " ' . ~.,.." " ' ' , . : , - . - " ' , ".. '~i. ' : . "
; , : . . : , ~ . , . . . . : . . . ...., ° . , , : , . : . . . - , r , , ,oo . , , . . . . .;. : ~ ° , . . , .;,..:,,;: . .~ '~ - ~: - . . . : . . , : : . . . : . . : .~ . : . . . . :-:.-':,*. , . , : : : - : o . . : t ; , . ":,.- , " : . . ' L . " - ' : ' " " . , . ' " ' ! , " ' : - , • ".. " " : . - , - . " - " : " : , ,
• ; . - . . ' , . . . ~ . . . , : . . , . , , ..-... '.:.;.-~,. :%. ; . • : . ': . : . : . - . :.. ,, , -~ . . . . . .
i;:, :;:: '6 :" .'.;: :' ;'. ,, .i,: ~ ,:., ,:~... . : ; , , ~ . /~ ; ; ~ . ' ,
,, " . . , , . ,~, . . . . v : ", , : ,~,. , , . p , , , , , :~
", "'. :"_.,~'. t;._'., e,"
R e s u l t s
V i s u a l i z a t i o n o f y T B P b o u n d t o D N A
D i r e c t m o u n t i n g e l e c t r o n m i c r o s c o p y
yTBP was visualized bound to the HIV-1 and adenovirus major late promoter (AdMLP), TATA elements by "direct mount ing" EM (see Materials and Methods, below)• Highly purified yTBP was incubated with the DNAs in a buffer optimized for in vitro transcription that includes polyethylene glycol (PEG) for 30 minutes at 30°C, then chromatographed to remove the PEG (which covers the carbon suppor t and obscures the DNA), and processed for EM. Protein was titrated from a ratio of 5•4:44 yTBP m o n o m e r s / D N A fragment, equival- ent to 2 to 16 ~tg/ml.
Incubation of either the 390 bp HIV-1 or the 392 bp AdMLP promoter fragment with yTBP at 5.4 or 10.8 yTBP m o n o m e r s / D N A fragment produced fields of DNA fragments as seen by EM, in which up to 25% of the DNAs contained a small protein particle bound near the center of the DNA, the location of the TATA elements in both DNAs (Figure 1). At lower concentrations of TBP, proport ionately fewer DNAs
b..'~ :".-,,i ...i:-.:: :'.,.::":. ~.:.:: .,....!.-:. : ' -"• i 'q i ;'.... : :-~ i"::.? ::, :.: '!"-..: ':-':: ::. .. : ::! !::--i: ::-. :: i !.: :.i::.: '. . . : ;:: ; . / . ' : . . , , , , . c " . ~ , ~ . , ; " • : , ' ~ - ~ ; ' . " . . . , : ' , ' - 1 . - . ' : : . , . . " . : . " - " , d . ' " . . ~ , : .,: , ~ ; . , . ; . . , ' : - ' : "• :.': ~,,.-• . "
" ; . , . ; • . ° . . . . . ~ . . ~ , ; . . ,.- ., • . . . - : . , , . . : , . . " ~ • , - / , , , - . , . . . " . . . . " . . : . - ' . . : . - : . . : . :
~ - . . -. : . " : ; . . : , . ' . ' . . . • . . . ' : .... . " • -., . " . . , : : . , , , " - : ' . . . , ;~ • " . ' o - . o . ' " . " , : • ' ; ' . , . . : . " " " " t ' * , ,- '," • ; ' - . :
.. - . , " , • . : . • . - - . . : " . : ., . . . . . . ; ." • . ° o . - ; - * . . . . . . . . . . : . . ~ . - . . . . - . . . • . - " - ~ . • : ~;
" " ' • ' : : " ' " " ; ' ' : ~ " " ' : ' " " " " • "'"~ • " i : ' : • . ' . v ~ ' . . " - • " , , . . . . " . - . . . • . j r . . • . . : . -
; , . ' . ; , " . ' : . : ' : , ' ' ° ~ , ' - ' ' : : , : . : : . . ' . ' : - . o ' : : - ' - . ' " " " : "
, % , , , . . . , i t . . ~ ' - L ; ' . . . : . . , ~ ' . . " . : ' . . . . • ' . " . - . . , : : " .-.
~"&..~.'"! f4 rO;~
t:..,*.:..-.," "; .~ ;d:.:"~"~,.
, • , ~ :~-,,~-.~,,~ ,,,I~ .,: 4 :- ~ ; ' ; de, . . . . " ~ " , '
...;'.: , " - , % . :':.-:"
~ . - . ~ . - : • ~ , , ~ , . ' . . . • . , .- . . , .,~.....,..,.'.~.
:.,<,.,':,4r.', . . . , - ..:.. ,.: .-:,, ~ " , . , ° ; , ,,-" , . ~ : ' ~ . . ~ , ",.~
o - . ". t , .~
~.. . , - f .. - ? : t , ~. " " A
; a, -. ; . . . . W - o
~ ,.. - t : , : ~ , ~ ;
' , ~ : ~ " . , : , ' , , : ' . ' ~,
° " ; . * , ' * t~ " ' " , ' ,
, , , . , t l % . , , . , ' , • ~ ' ~ • ~ ".
..., ., ~.; :,:....
" "J'~., L, ; :}
': ' ~. ' ~ , i : , '
• q " a ' " *
, I , . . , ° o ,
I , , ,4 e , , , ' .
J , , t . io 0 i , " Q I '
. ' ,Q , , , , i ' ° , . I , ,
Figure 1. Visualization of yTBP bound to DNA at lower protein/DNA ratios. Yeast TBP was incubated with a 392 bp DNA fragment containing the adenovirus major late promoter (AdMLP) at its center. At ratios of 5.4 or 10.8 yTBP monomers/DNA fragment, dimers (see the text) and putative monomers (see arrows in a and b) of yTBP are seen bound at the TATA box. Fields are in a and b, and single higher magnification examples are in c to h. In d and e, arrows point to 74 kDa tetramers of the Escherichia coli SSB protein added as a size marker. Prepared by direct mounting of fixed DNA-yTBP samples onto thin carbon foils, air drying and rotary shadowcasting with tungsten. The bar represents 100 nm (a and b) and 62 nm (c to h).

5 7 8 Visualization of TBP Binding to DNA
..-..." - . -. ~ . ; - : . . . . . . : . . - . . : : . . . . , ; : . * ' ~ - - - - . . , . . . - . . * : . . : . - .,; . - . -
: - . . _ - . - : ; _ . : . : : : : : . : ..:_. : ' ~ : - . . . - . . . : . , .:,--- - . : . - . . : - .
.~--:-. ~, V . : - - -'~4~. G ; . - . : : .v-. ' - .- : - . : . - : :
; . , . , ; . , ~ , ~ . , , '1.. , ~ ~ ' , ~ • • ° o - , ° • . o,
. ' ~ . . ~ : ~ , . . , : ; , ~ , - ¢ ; : . , , ~
".*.~ ~ ; . ~ ! , " ,',-:1'. , , - ~ , . ' . . * * , . . . ' ~ . % - .° .q
. . . , . o . . ~ , . . . . . , ~'
• ~ : . ~ t . ~ * , " - : - " • % . °'15 - ~ " r - " ~ ' l ".~
; • .. ~. . . .~ , ~ ' . . ~ . , ~ ; " ~
' . ' ' " ~ t : ~ ' ; : ' , ' .~' : : : - t ' ,
.'~,, -'~ ." .'-., :'~ ".; ~ " 2 " ; ,
• .~;~.. , - , - . . ' " • ,: ~,~%,~
1 ~ . , . . ; - , " L" ,~ .
o , , ; ' . - } . ~ ~ , , " - . , • / . ~ : . . , . . . , , . -<, , . - ~ , . ' . " ~
. * ' - , , • to "G.; '1_~ ~- ' . , ' , ,
• , , ' , . ~ , • " . . , ~4J ' , ~ , . , - . ~ , . : ' ~ , . , ~ . . ,
, " ~ . t : , ~ - " , - ; ,
~ • ° 0 ~. ~ • , ~ . . . ,
° , - . . . , . , - / - . . . , - , . , , • ;
; ' ~ . : . * y - ; ~ , ' ~ . . . , , { * q
• Jr. - * ~ , • * ,. g " - ~"~ ' - ' " , "'C' % . :
~* ' ,~ .;:'. '~- "S; , ",'~i "
% . . , * 0 . - - ~ ' . ' - , ..~,. ' ,~
• . - * ; ,....,e 3 *
" ~ . ' . , " '*E . , = . , ~ ' , " : ' " . ' - ' t . "-~'L:" ~ t " ~ ' '
. , ..~ ~ * z . " - ~ . , " ; : ' 4 " : - ' . ' ; ~ " ; ! •".,".:o'
' . , . ' , . : . * " '-'-.':. ~ ; / ~ ' ~ • : - " . V " . . - . . , ' ;
. : , ' , . ~ • , . - , t - " ~ . °' ,~ " ; . . . . " ' .
: ::.,.~..'..~ .'.',~: - .~:.;..': .,;. ~. ,. ~ .... , ~,.
. , . , ; ' - , , . . , . . : ; , " ' - . ~ , ~ , - . . ! - , ~ . . "
::(:
• , . - , , - ; - . : ~ , . . ' . . :~. ~ : ~ , ".." . : . , p . . ~,,
• . , , ~ , . ,, ; , - , ' ; ~ . . . ; ~ . . ,
:. "¢ : . , ~ ' , . . . . . , . . , . . . • , i , ' .. , ' ~ £ •
I
, ~ " : . ' ~ . ~ . ' . " ; ¢ ~ ,
, . . . x : . : , ~ ,;~.~,, ~:~
~. r " o ' " "'~* '4 I L . , , ~ :
'-' ' , . ~ ' Y , 4¢ , o ' " %
Figure 2. Visualization of yTBP bound to DNA at higher protein/DNA ratios• The 392 bp AdMLP (a to g) or 390 bp HIV-1 (h) fragments were incubated with yTBP at ratios of 22 (a to g) or 44 (h) yTBP monomers/DNA fragment in the transcription buffer and prepared for EM as for Figure 1. Fields are in a and b and higher magnification examples are in c to h. The bar represents 100 nm (a to c) and 68 nm (d to h).
were bound by protein• The protein particles were easily distinguished and were of a size suggesting that they were dimers. However, in a few cases (see the arrows in Figure 1), very tiny particles just at the limit of detection, which we presume to be protein monomers, were observed. The DNA appeared highly bent about the presumptive dimers when they were located at the TATA box (see below). Dimer-sized particles were frequently present on one or both ends of the DNA fragments, presumably reflecting non-specific bind- ing. In the following, as established below, the easily distinguished particles will be refered to as dimers. The tiny particles will be presumed to be protein monomers.
Most presumptive dimers (other than those at DNA ends) were located at, or near, the center of the DNAs. To confirm this, 141 AdMLP DNA fragments, containing one or more yTBP dimers bound anywhere along the DNA (except at the exact ends), were photographed. The position of the dimers was measured beginning at one arbitrary DNA end. Of 214 dimers analyzed, 82% fell be tween 40% and 60% from one DNA end with the peak lying be tween 50% and 60%. Thus, to this level of resolution, the yTBP dimers were localized at the TATA box as expected.
V isua l i za t i on o f T B P p o l y m e r s on D N A
With 22 yTBP m o n o m e r s / D N A fragment in the incubations, highly compacted structures were seen in abundance (Figure 2). These structures consisted of a large protein knob or rod with two equal length DNA arms exiting close together. In rarer cases (see Figure 2c and g), the propensi ty of the yTBP multimers to hold the DNA side-by-side was apparent even though the TATA box itself was protein-free. With 44 yTBP m o n o m e r s / D N A frag- ment, most of the DNA was fully conlplexed into short, thick, rod-like structures (Figure 2h), and frequently these were present as multi-particle aggregates. The same structures were observed for both the HIV-1 and AdMLP fragments.
Ti t ra t ion o f y T B P on D N A
In low magnification fields, DNAs were scored as: (1) having dimers bound at the center; (2) having dimers bound to one or both ends; (3) being in folded or rod-like forms; (4) being in large aggregates of rods; or (5) being protein-free or only having presumptive monomers bound (>100 molecules for each sample). DNAs with monomers were included in the latter class because their detection was not

Visualization of TBP Binding to DNA 579
100"
8O
40
2O
0 1 0 2 0 3 0 4 0
yTBP monomers/DNA
5'0
Figure 3. Titration of TBP structures on DNA. Complexes of yTBP and the 392 bp AdMLP fragment were formed as described in the legends to Figures 1 and 2. In low magnification fields, >100 DNAs were scored in the groups below; protein-free DNA was also scored to generate the percentage values. DNA with a central yTBP dimer (©); DNA in rod-like structures (@); and DNA present in aggregates of rods (B).
reliable enough to allow an unambiguous scoring. Molecules with a dimer bound at the center were scored as such whether or not one or both ends also had protein bound. At ratios of 5.4 and 10.8 yTBP monomers/DNA fragment, centrally located dimers were present in abundance (Figure 3). This was confirmed in five separate experiments with the AdMLP and HIV-1 fragments and in some (with 10.8 monomers/DNA fragment), the fraction with dimers at the TATA box reached 25% of the total (data not shown). The structures shown in Figure 2 peaked at 22 monomers/DNA fragment and diminished as more and more of the DNA was sequestered into aggregates. DNA molecules with dimers bound at one or both ends closely paralleled the distribution shown for central dimers (not shown). When a 300 bp DNA fragment containing no TATA element was used, no protein binding was observed near the center, but at the highest protein concentrations this DNA was also compacted into aggregates of short DNA-protein rods, most likely due to non-specific protein binding followed by protein polymerization (data not shown).
Cryo-fixation and freeze-drying
Cryo-fixation eliminates the need for chemical fixation (Bortner & Griffith, 1990), but PEG must be avoided as it cannot be removed in the subsequent freeze-drying step and will obscure the DNA. Using direct mounting EM, it was found that a buffer containing 20 mM Hepes (pH 7.5), 10 mM mag- nesium acetate, 40 mM potassium acetate, provided results comparable to the transcription buffer. For cryo-EM, yTBP was complexed with the AdMLP or
HIV DNA in this simpler buffer at 30°C for 30 minutes (10.8 yTBP monomers/DNA fragment). The sample was diluted 20-fold with buffer, applied to the support, plunged into liquid ethane and then freeze-dried and rotary shadowcast (see Materials and Methods, below). DNA with dimers at the TATA box and in rod-like forms were seen and the overall pattern of DNA binding, and frequency of forms, was qualitatively the same as described above (see Figure 5(d) and bending analysis below). Protein monomers bound to the DNA were more difficult to detect due to the higher background interference inherent in this preparative method.
Negative staining
Complexes of yTBP and AdMLP DNA (10.8 yTBP monomers/DNA fragment), were examined by negative staining (see Materials and Methods, below). DNA fragments could frequently be seen with small protein particles bound at their center (Figure 4a to c). The protein particles often had an elongated appearance and were of a size consistent with their being dimers (see below). Occasionall34 smaller proteins were observed. Examination of complexes formed with 22 to 44 yTBP monomers/ DNA fragment revealed compact rod-like forms with DNA arms exiting close together (Figure 4d to f) much like those shown in Figure 2. The diameter of the rods measured 8.9(+1.3)nm (n = 7) and their length, when the DNA was fully covered, was -32 nm. This represents a fourfold compaction of the 133 nm long DNA, twofold beyond its being folded once about its center~
Measurement of the yTBP particle masses
The tiny protein particles bound to the DNA were likely yTBP monomers, since a 28 kDa protein bound to DNA would be just at the limit of detection by these EM methods. To provide an internal size marker, Escherichia coli SSB protein, which exists in solution as a 74 kDa tetramer, was separately fixed with 0.6% (v/v) glutaraldehyde for ten minutes at 21°C, and mixed with (fixed) AdMLP DNA-yTBP complexes prior to preparation by direct mounting. Shown in Figure ld and e are DNAs with a presumptive dimer bound at the center and an SSB tetramer(s) lying adjacent. The presumptive dimers were slightly smaller than the SSB tetramers.
Cryo-EM was applied to preserve the three-di- mensional structure of the yTBP and SSB particles. Complexes of yTBP and the AdMLP DNA (10.8 monomers/DNA fragment) were formed, SSB tetramers added at the end of the incubation, and the samples prepared for EM without chemical fixation. Photographs were taken of an AdMLP DNA whenever it contained a presumptive dimer at its center and when there were several (at least six) SSB tetramers nearby. Using a CCD camera to enlarge the images, and the NIH IMAGE software, the computer cursor was traced around the perimeter of each SSB particle and the yTBP complex at the TATA box to

5 8 0 Visualization of TBP Binding to DNA
(a) (b) (c) - . " , . ~ . . " ' - ' ~ " ~- ' - ' . . ~ , : . . . ' - ' : " . . . "C , ."
., . . . . . - . . . . * ~ , ~ . . . . . . -. . - , . , ~ ,':'• : ; . ; . : .~:: .:~':. ~. ' ~ ' : ~ :.;.b,
: : - : : . - . ;- - :~ . :--~ .~,:': : ~ - ~ ' . . .
"' , "- . . t ~ " ~ ; : :- - . . . 7,, . + , . "2:3 . , , ~ r . ~ ~-.,,~,
. . . . • ~ ~ - . ~ . . , ~ ' . . : ( ! .~.~- - ~ . ~ ' , ~ 1-+"
" ~ " ' " ' ~ r " " t : ~ ; ' . ; i i l ~ : ~ . ~ - ' ,
! , .~ . . '~ , : -~ ' ~ --'.L~-..,.,:'--.'~.$:~ ". ~ , . ; : ~ . ~ : t ~ :~
.... ,.,~.....~,~,~. , . ~ , . ~ ,
"¢ ~"." ;: ~ "- :- ~t "',~" - . ,': "~. :'. Z',;"
(d) (e) (f)
Figure 4. Visualization of TBP bindh~g to DNA by negative staining• Complexes of yTBP and the 392 bp AdMLP fragment were prepared for EM by negative staining with uranyl acetate using 10.8 (a to c) or 22 (d to f) yTBP monomers/DNA fragment• Following a 30 minute incubation at 30°C the sample was adsorbed onto a very thin carbon foil and stained with 1% uranyl acetate, a to c, dimer-sized particles at the TATA box and polymerized oligomers are shown in d to f. The bar represents 0.1 p.m.
measure the projected area of each particle• For each separate field, the area of the yTBP particle (which included the bound DNA) was divided by the average of the nearby SSB particles. This approach was taken to reduce local variations in metal coating• For 22 fields, 20 of the 22 yTBP particle/SSB area ratios fell be tween 0.71 and 1.00 and 16 of the 22 ratios fell be tween 0.80 and 0.99. The mean value was 0.89(+0.07)• Assuming that the SSB tetramers and yTBP complexes are roughly spherical, multipli- cation of the 74 kDA mass of the SSB tetramer by 0.893/2 (to convert to volume ratios) provided an estimate of the mass of the yTBP and included DNA of 63(+5)kDa. This is equivalent to the mass of a yTBP dimer and 12bp of included DNA. The presumptive protein monomers were not analyzed due to the higher background interference in the cryo-electron micrographs.
A similar analysis was carried out on the negatively stained images as shown in Figure 4, using streptavadin (66 kDa) as an internal marker• Analysis, as described above, for 48 yTBP particles yielded a mass of 48(+6) kDa, less than that obtained above, likely due to the inclusion of some particles that may have been monomers• None-the-less the value is consistent with a major class of particles being TBP dimers.
Bending of DNA by yTBP oligomers
The bending of the HIV and AdMLP fragments by yTBP dimers and polymers was analyzed in three different ways• In the first, DNA molecules with no protein bound (from a mock incubation with no yTBP added), with a yTBP dimer at the center, or with a yTBP polymeric complex (as for Figure 2), were photographed at the EM as they were sequentially encountered. The molecules were projected onto separate optically clear acetate sheets and traced using a Marks-A-Lot pen. Each acetate tracing was then overlaid on top of the others and aligned using the following rules• The straightest half of each DNA was chosen as the left arm. The DNAs were aligned at their centers and the left arms then brought into the best possible register• The molecules were oriented so that the right arms, if curved, curved down rather than up. Aligned stacks of tracings were placed on a light table, photographed with a CCD camera, and the contrast inverted• For the protein-free DNA (Figure 5a), this provided a visual representation of its flexibility While few, if an~ DNAs were perfectly straight, very few were bent by more than 90 ° about their centers•
Images (n = 79) of yTBP dimers bound to the AdMLP DNA, as shown in Figure 1 (fixed, direct

Visualization of TBP Binding to DNA 581
mounted), were aligned using the rules given above. Here, much greater bending was apparent (Figure 5b). A major fraction of the molecules was bent by 75 to 80 ° , with lesser numbers being bent by 90 ° or more. Some molecules were relatively unbent, equivalent to the natural curvature of protein-free DNA. When tracings of molecules obtained by cryo-EM preparation were aligned (Figure 5d), similar results were obtained, but overall, more molecules were bent by roughly 90 to 110 °. Molecules (n = 65) onto which yTBP had polymer- ized to form rods, as shown in Figure 2, were also aligned (Figure 5c).
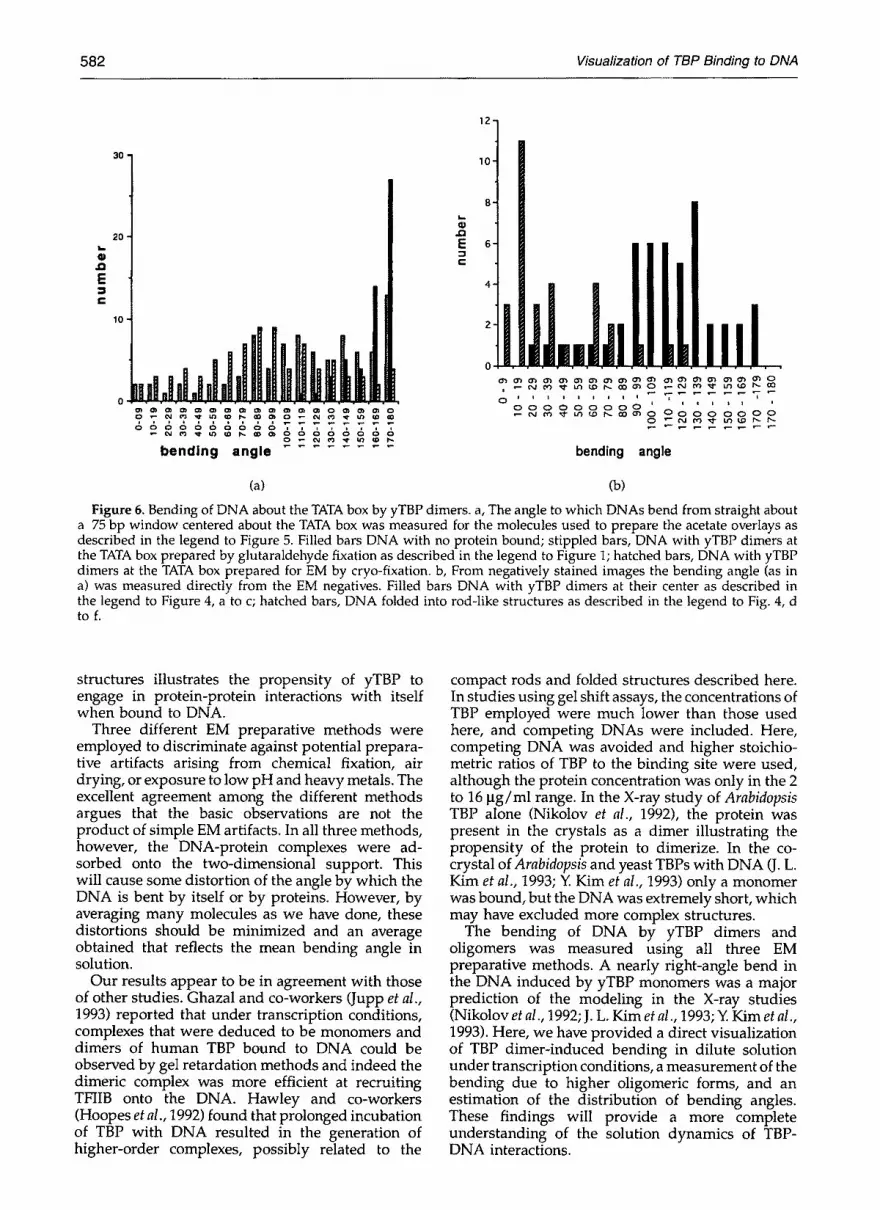
To quantify the bending of the DNAs within a 75 bp window centered about the TATA box, the angle by which moelcules bend from straight was measured on the acetate tracings. For this window, most all of the protein-free DNA curved no more than 20 ° from the straight (Figure 6a). For the DNAs with yTBP dimers bound, a large fraction was bent by 70 to 110 ° from straight with a peak near 90 °. The distribution was very similar whether the complexes had been prepared by direct mounting, or by cryo-EM (Figure 6a), providing strong support for the argument that fixation has not altered the structure of the complexes greatly. From the negatively stained images (Figure 4) measurements were made directly from the EM negatives using a
CCD camera and the NIH IMAGE program. Here, the distribution of bending angles for dimers centered about a broad peak equivalent to bending by 80 ° from the straight; the bending of DNA in the rod-like forms was much more severe, as expected (Figure 6b). For all three preparative methods the distribution of bending angles was broad. This likely reflects three factors: (1) a real distribution of bending angles in solution; (2) alterations in the angle imposed when the three-dimensional structures were adsorbed to a flat surface; and (3) errors incurred in measurement.
Discussion
Electron microscopy has been employed to examine the binding of yeast TBP to two DNAs containing strong class II promoters. With five monomers/DNA fragment, small particles of two sizes were observed bound to the TATA box. The smaller ones were surmized to be yTBP monomers, and the larger ones were demonstrated by mass analysis to be dimers. The DNA was bent about the dimers by 80 to 90 °. With higher amounts of yTBP, protein polymerization from the TATA box created rod-like structures in which the DNA was folded back on itself and was eventually compacted fourfold into DNA-protein rods. The generation of such
Figure 5. Bending of DNA by yTBP: aligned DNA tracings. Images of 57 DNA molecules; a, with no protein bound were projected onto clear acetate sheets and the tracings aligned and overlaid (see the text for details); b, 79 aligned molecules with yTBP dimers bound at their center prepared for EM by fixation and direct mounting as described in the legend to Figure 1; c, 65 DNAs organized into rod-like structures as described in tile legend to Figure 2; d, 75 molecules with central dimers prepared by cryo-EM. The aligned stacks were imaged with a CCD camera and are shown in reverse contrast.
582 Visualization of TBP Binding to DNA
, D
E -1
30
20
lO
o.,unH.Jd.finn,n,UHfi.,fiU,hk Lb,.. 6 6 6 6 6 6 6 6 6 6 ~ T ~ T ~ V V T
bending angle
e~
E e,.
12-
10
8
6
4
2-
0-
0 ~ i i i i ~ i i i i 1 t i ~ i I t i
bending angle
(a) (b)
Figure 6. Bending of DNA about the TATA box by yTBP dimers, a, The angle to which DNAs bend from straight about a 75 bp window centered about the TATA box was measured for the molecules used to prepare the acetate overlays as described in the legend to Figure 5. Filled bars DNA with no protein bound; stippled bars, DNA with yTBP dimers at the TATA box prepared by glutaraldehyde fixation as described in the legend to Figure 1; hatched bars, DNA with yTBP dimers at the TATA box prepared for EM by cryo-fixation, b, From negatively stained images the bending angle (as in a) was measured directly from the EM negatives. Filled bars DNA with yTBP dimers at their center as described in the legend to Figure 4, a to c; hatched bars, DNA folded into rod-like structures as described in the legend to Fig. 4, d to f.
structures illustrates the propensity of yTBP to engage in protein-protein interactions with itself when bound to DNA.
Three different EM preparative methods were employed to discriminate against potential prepara- tive artifacts arising from chemical fixation, air drying, or exposure to low pH and heavy metals. The excellent agreement among the different methods argues that the basic observations are not the product of simple EM artifacts. In all three methods, however, the DNA-protein complexes were ad- sorbed onto the two-dimensional support. This will cause some distortion of the angle by which the DNA is bent by itself or by proteins. However, by averaging many molecules as we have done, these distortions should be minimized and an average obtained that reflects the mean bending angle in solution.
Our results appear to be in agreement with those of other studies. Ghazal and co-workers (Jupp et al., 1993) reported that under transcription conditions, complexes that were deduced to be monomers and dimers of human TBP bound to DNA could be observed by gel retardation methods and indeed the dimeric complex was more efficient at recruiting TF~IB onto the DNA. Hawley and co-workers (Hoopes et al., 1992) found that prolonged incubation of TBP with DNA resulted in the generation of higher-order complexes, possibly related to the
compact rods and folded structures described here. In studies using gel shift assays, the concentrations of TBP employed were much lower than those used here, and competing DNAs were included. Here, competing DNA was avoided and higher stoichio- metric ratios of TBP to the binding site were used, although the protein concentration was only in the 2 to 16 ~tg/ml range. In the X-ray study of Arabidopsis TBP alone (Nikolov et al., 1992), the protein was present in the crystals as a dimer illustrating the propensity of the protein to dimerize. In the co- crystal of Arabidopsis and yeast TBPs with DNA (J. L. Kim et aI., 1993; Y. Kim et al., 1993) only a monomer was bound, but the DNA was extremely short, which may have excluded more complex structures.
The bending of DNA by yTBP dimers and oligomers was measured using all three EM preparative methods. A nearly right-angle bend in the DNA induced by yTBP monomers was a major prediction of the modeling in the X-ray studies (Nikolov et al., 1992; J. L. Kim et al., 1993; Y. Kim et al., 1993). Here, we have provided a direct visualization of TBP dimer-induced bending in dilute solution under transcription conditions, a measurement of the bending due to higher oligomeric forms, and an estimation of the distribution of bending angles. These findings will provide a more complete understanding of the solution dynamics of TBP- DNA interactions.

Visualization of TBP Binding to DNA 583
Ult imately questions related to TBP oligomeriza- tion and D N A bending will have to be examined within the context of the formation of the TFIID complex in vivo. However , since TBP alone is capable of p romot ing the assembly of the general transcription factors into transcription competent complexes, unders tanding the var ie ty of s tructures which TBP can form on D N A provides a valuable step. Further, since relatively high concen- trations of TBP alone are frequently employed in current in vitro transcription experiments, knowl- edge of the structures that form under such conditions is useful. Finally if in future EM exper iments TBPs with different amino acid termini were found to behave differently this would have basic implications on the role of the variable amino te rminus in promot ing and regulating protein- protein interactions.
Materials and Methods
Proteins and DNA
Yeast TBP was prepared as described (Maldonado et al., 1990). The 392 bp DNA fragment containing the adenovirus major late promoter (AdMLP) at its center was prepared by polymerase chain reaction (PCR) amplification using primers located roughly 150bp upstream and downstream of the TATA box. The 3' primer was GGG TGG AGG GGA TAT GG-3' and the 5' primer was CTC TCC CCG CGC GTT-3L The 390 bp HIV-1 DNA fragment was prepared in a similar way using a 3' primer of GAG AGA GAA GTG TTA GAG-3', and a 5' primer of ACA CTG ACT AAA AGG GTC-3'. Amplification used plasmids containing the HIV-1 (HXB-2 strain) and adenovirus promoters. Fifty 100 ~1 synthesis reactions were carried out using Taq DNA polymerase (Gibco/BRL). Following synthesis, the mixture was treated with 1% (w/v) SDS and then chromatographed on Sephacryl S-200 using a Pharmacia FPLC system. Peak fractions were identified by gel electrophoresis and pooled.
DNA binding reactions
DNA binding reactions were either carried out in a transcription buffer containing: 10 mM Tris-HCl (pH 7.9 at 4°C), 0.1 mM EDTA, 10% (w/v) glycerol, 13 mM Hepes, 10 mM ammonium sulfate, 50 mM KC1, 1.7% (w/v) polyethylene glycol, 10 mM MgC12, or in a simpler buffer of 20raM Hepes (pH 7.5), 10mM magnesium acetate, 40 mM potassium acetate. DNA (170 ng in a 50 pl volume) was mixed with yTBP at ratios of 5.4 to 44 yTBP monomers/DNA fragment, equivalent to 100 to 800ng of yTBP per reaction. Incubation was for 30 minutes at 30°C. Following incubation in transcription buffer, the sample was treated with 0.6% (v/v) glutaraldehyde for ten minutes at 21°C, then chromatographed over 2ml Biogel A5M (BioRad Inc.) columns equilibrated in 10 mM Tris-HCI (pH 7.5), 0.1 mM EDTA buffer. The peak fraction containing the DNA-protein complexes was prepared for EM. Incubations for cryo-EM or negative staining were carried out as described above using the simpler buffer without fixation.
Electron microscopy
Direct mounting
Samples were prepared for EM as described (Griffith & Christiansen, 1978). In brief, thin carbon foils supported by 400 mesh copper grids were treated with a glow discharge and the complexes adsorbed for 30 seconds in a buffer containing 2 mM spermidine and 150 mM NaCI. The grids were then washed with sequential washes of water, and graded water/ethanol solutions to 100% ethanol. The samples were air-dried and rotary shadowcast with tungsten at 10 -7 torr.
Cryo EM
Samples (unfixed) were diluted in the simpler DNA binding buffer supplemented with 1 mM spermidine and applied to thin carbon supports for 30 seconds followed by rapid freezing in liquid ethane chilled in liquid nitrogen (Bortner & Griffith, 1990). The samples were slowly freeze-dried at-85°C and rotary shadowcast with tungsten at 5 x 10 -7 torr in a fully cryopumped system.
Negative staining
Negative staining was carried out by diluting samples prepared as described for cryo-EM 20-fold in buffer and applying them, unfixed, to ultrathin carbon supports without spermidine, and then staining with a solution of 1% (w/v) uranyl acetate in water.
Image analysis
Images were recorded on sheet or 35 mm film using a Philips CM12 electron microscope. Images for analysis or publication were captured from the film using a Cohu CCD camera and a Data Translation Quick Capture board in a Macintosh computer. The NIH IMAGE software was used to adjust the contrast in the images for publication, which were transferred to 35 mm film using a GCC film recorder. Dimensions in the negatively stained images were determined using the criteria of Steven et al. (1988). Dimensions were measured by projecting molecule images onto a Summagraphics digitizing tablet coupled to a CompuAdd computer programmed with software devel- oped in this laboratory.
Acknowledgements
This work was supported in part by grants from the NIH (GM31819, GM42342) and the ACS (NP583) to J.D.G. and GM37120 to D.R. who was a recipient of an American Cancer Society Faculty Research Award. L.Z. is supported by an NIH training grant (GM08360).
References
Bortner, C. D. & Griffith, J. (1990). Three-stranded paranemic joints: architecture, topological constraints and movement. J. Mol. Biol. 215, 623-634.
Gash, A., Hoffman, A., Roeder, R. G. & Chua, N.-H. (1990). Arabidopsist thaliana contains two genes for TFIID. Nature (London), 346, 390-394.

584 Visualization of TBP Binding to DNA
Griffith, J. D. & Christiansen, G. (1978). Electron microscopic visualization of chromatin and other DNA protein complexes. Annu. Rev. Biophys. Bioeng. 7, 19-35.
Hoffmann, A., Sinn, E., Yamamoto, T., Wang, J., Roy, A., Horikoshi, M. & Roeder, R. G. (1990). Highly conserved core domain and unique N terminus with presumptive regulatory motifs in a human TATA factor (TFIID). Nature (London), 346, 387-390.
Hoopes, B. C., LeBlanc, J. F. & Hawley, D. K. (1992). Kinetic analysis of yeast TFIID-TATA box complex formation suggests a multi-step pathway. J. Biol. Chem. 267, 11539-11547.
Horikoshi, M., Bertuccioli, C., Takada, R., Wang, J., Yamamoto, T. & Roeder, R. G. (1992). Transcription factor TFIID induces DNA bending upon binding to the TATA element. Proc. Nat. Acad. Sci., U.S.A. 89, 1060-1064.
Jupp, R., Flores, O., Nelson, J. A. & Ghazal, P. (1993). The DNA-binding subunit of human transcription factor IID can interact with the TATA box as a multimer. J. Biol. Chem. 268, 16105-16108.
Kao, C., Lieberman, P. M., Schmidt, M. C., Zhou, Q., Pei, R. & Berk, A. J. (1990). Cloning of a transcriptionally active human TATA binding factor. Science, 248, 1646-1650.
Kerr, L. D., Ransone, L J., Wamsley, P., Schmitt, M. J., Boyer, T. G., Zhou, Q., Berk, A. J. & Verma, I. (1993). Association between proto-oncoprotein Rel and TATA-binding protein mediates transcriptional acti- vation by NF-kB. Nature (London), 365, 412-419.
Kim, J. L., Nikolov, D. B. & Burley, S. K. (1993). Co-crystal of TBP recognizing the minor groove of a TATA element. Nature (London), 365, 520-527.
Kim, Y., Geiger, J. H., Hahn, S. & Sigler, P. B. (1993). Crystal structure of a yeast TBP/TATA-box complex. Nature (London), 365, 512-520.
Lee, D. K., Horikoshi, M. & Roeder, R. G. (1991). Interaction of TFIID in the minor groove of the TATA element. Cell, 67, 1241-1250.
Maldonado, E., Ha, I., Cortes, P., Weiss, L. & Reinberg, D. (1990). Factors involved in specific transcription by mammalian RNA polymerase If: role of transcription factors IIA, IID, and IIB~ during formation of a transcription-competent complex. Mol. Cell. Biol. 10, 6335--6347.
Merino, A., Madden, K. R., Lane, W. S., Champoux, J. J. & Reinberg, D. (1993). DNA topoisomerase I is involved in both repression and activation of transcription. Nature (London), 365, 227-232.
Nikolov, D. B., Hu, S.-H., Lin, J., Gasch, A., Hoffmann, A., Horikoshi, M., Chua, N.-H., Roeder, R. G. & Burley, S. K. (1992). Crystal structure of TFIID TATA-box binding protein. Nature (London), 360, 40--46.
Peterson, M. G., Tanese, N., Pugh, B. F. & Tjian, R. (1990). Functional domains and upstream activation proper- ties of cloned human TATA binding protein. Science, 346, 1625-1630.
Pugh, B. F. & Tjian, R. (1990). Mechanism of transcriptional activation by SPI: evidence for coactivators. Ceil, 61, 1187-1197.
Starr, D. B. & Hawley, D. K. (1991). TFIID binds in the minor groove of the TATA box. Cell, 67, 1231-1240.
Steven, A. C., Trus, B. L., Maizel, J. V., Unser, M., Parry, D. A. D., Wall, J. S., Hainford, J. F. & Studier, F. W. (1988). Molecular substructure of a viral receptor-rec- ognition protein: the gp17 tail fiber of bacteriophage T7. J. Mol. Biol. 200, 351-365.
Xu, X., Prorock, C., Ishikawa, H., Maldonado, E., Ito, Y. & Gelivas, C. (1993). Functional interaction of the v-Rel and c-Rel oncoproteins with the TATA-binding protein and association with transcription factor IIB. Mol. Ceil. Biol. 13, 6733-6641.
Edi ted by I". R i c h m o n d
(Received 1 September 1994; accepted 30 November 1994)


