Embed Size (px)
Citation preview

Whiteness metric for light sources ofarbitrary color temperatures: proposaland application to light-emitting-diodes.
Aurelien David,1,∗ Michael R. Krames1 and Kevin W. Houser2
1 Soraa Inc., 6500 Kaiser Drive, Fremont, CA 94555, USA2 Department of Architectural Engineering, The Pennsylvania State University, University
Park, PA 16802, USA∗[email protected]
Abstract: We study the quantification of whiteness perception underillumination from various light sources. We discuss an existing metric forsources with high correlated color temperature (CCT), CIE whiteness,and propose a procedure to adapt it to sources of any CCT. We illustrateour approach by comparing the ability of different warm-white sources torender whiteness. We show that a careful engineering of the spectrum –facilitated by the flexibility of light-emitting diode sources – is essential torender whiteness.
© 2013 Optical Society of America
OCIS codes: (330.1715) Color, rendering and metamerism; (230.3670) Light-emitting diodes
.
References and links1. E. Ganz, “Whiteness - photometric specification and colorimetric evaluation,” Appl. Opt. 15(9), 2039–2058
(1976).2. P. S. Stensby, “Questions in regard to whiteness evaluation,” Journal of Color Appearance 2(1), 39–42 (1973).3. D. L. MacAdam, “Specification of whiteness,” J. Opt. Soc. Am. 24(7), 188 (1934).4. R. S. Hunter, “Description and measurement of white surfaces,” J. Opt. Soc. Am. 48(9), 597–605 (1958).5. F. Grum, R. F. Witzel, and P. Stensby, “Evaluation of whiteness,” J. Opt. Soc. Am. 64(2), 210–215 (1974).6. E. Ganz, “Whiteness formulas - a selection,” Appl. Opt. 18(7), 1073–1078 (1979).7. E. Ganz, “Whiteness perception - individual-differences and common trends,” Appl. Opt. 18(17), 2963–2970
(1979).8. P. Krais, “On a new black and a new white,” Melliand Textileber 10, 468 (1929).9. A. E. Siegrlst, H. Hefti, H. R. Meyer, and E. Schmidt, “Fluorescent whitening agents 1973-1985,” Review of
Progress in Coloration and Related Topics 17(1), 39–55 (1987).10. J. Schanda (Editor), Colorimetry: Understanding the CIE System (John Wiley and Sons, Hoboken (NY), 2007).11. J. C. Zwinkels and M. Noel, “CIE whiteness assessment of papers: impact of LED illumination,” in “27th Session
of the CIE,” (Sun City, South Africa, 2011).12. “Colorimetry, 3rd edition,” CIE Technical report CIE 15.3:2004 (2004).13. B. D. Jordan and M. A. O’Neill, “The whiteness of paper - colorimetry and visual ranking,” TAPPI Journal 74(5),
93–101 (1991).14. “Paper and board - determination of CIE whiteness, D65/10o (outdoor daylight),” ISO norm 11475:2004(E)
(2004).15. “Paper and board - determination of CIE whiteness, C/2o (indoor illumination conditions),” ISO norm
11476:2010(E) (2010).16. R. Griesser, “Assessment of whiteness and tint of fluorescent substrates with good interinstrument correlation,”
Col. Res. Appl. 19(6), 446–460 (1994).17. R. Griesser, “CIE whiteness and tint : possible improvements,” APPITA Journal 49(2), 105 (1996).18. E. Ganz and R. Griesser, “Whiteness - assessment of tint,” Appl. Opt. 20(8), 1395–1396 (1981).
#186885 - $15.00 USD Received 12 Mar 2013; revised 31 May 2013; accepted 29 Jun 2013; published 5 Jul 2013(C) 2013 OSA 15 July 2013 | Vol. 21, No. 14 | DOI:10.1364/OE.21.016702 | OPTICS EXPRESS 16702

19. H. Hemmendinger and J. Lambert, “The importance of chromaticity in the evaluation of whiteness,” Journal ofthe American Oil Chemists Society 30(4), 163–168 (1953).
20. I. Katayama, K. Masumi, and T. Aoki, “Quantitative evaluation of perceived whiteness under different illumina-tions,” Journal of Light and Visual Environment 31(2), 80–88 (2007).
21. M. Ayama, T. Akatsu, E. Toriumi, K. Mukai, and S. Kanaya, “Whiteness perception under different types offluorescent lamps,” Col. Res. Appl. 28(2), 96–102 (2003).
22. I. Katayama, M. Iiyama, and K. Masumi, “Effect of spectral distribution of an illuminant on perceived whiteness,”Journal of Light and Visual Environment 25(2), 41 (2001).
23. Indeed, ω represents the relative sensitivity of luminance factor Y and blue-shift to whiteness. In our samples thevalue of Y barely depends on the source, only the color shift is significantly different. Therefore a change in ωwould rescale the whiteness values but would not change the relative rankings of whiteness under the differentsources. Regarding ϕ , its value has a very small numerical effect so long as it is close to 0o, as discussed in [1].
24. M. J. Cich, R. I. Aldaz, A. Chakraborty, A. David, M. J. Grundmann, A. Tyagi, M. Zhang, F. M. Steranka, andM. R. Krames, “Bulk GaN based violet light-emitting diodes with high efficiency at very high current density,”Appl. Phys. Lett. 101(22), 223509 (2012).
25. J. Zwinkels, “Surface fluorescence: the only standardized method of measuring luminescence,” in “Standardiza-tion and Quality Assurance in Fluorescence Measurements I,” , vol. 5 of Springer Series on Fluorescence, U.Resch-Genger Editor (Springer Berlin Heidelberg, 2008), pp. 163–192.
26. “Calibration methods and photoluminescent standards for total radiance factor measurements,” CIE Technicalreport CIE 182:2007 (2007).
1. Whiteness enhancement
Whiteness perception is an important part of our visual experience. Together with color render-ing, white rendering determines how natural and pleasant object rendition is. The perceptionof whiteness is a complex sensorial effect. One might expect that a perfect white diffuser withreflectivity R=1 at all wavelengths (a reference white) would be perceived as the whitest possi-ble surface. However, it has long been known that brightness and tint can substantially modifywhiteness perception. Several perceptual studies have established the following trends [1–7]:• total luminance contributes to whiteness (e.g. if two objects have the same color coordinates
(x,y), the brighter object will appear whiter)• objects with a slight blue saturation (toward the dominant wavelength λd = 470 nm) are
perceived as whiter than the reference white, while objects with a yellow saturation (away fromλd = 470 nm) appear less white. Excessive blue saturation diminishes whiteness perception.
• objects with an excessive red or green tint (e.g. with color shifts perpendicular to the satu-ration direction λd = 470 nm) do not appear white.
Therefore, an object can be made to appear whiter than the reference white by having highoverall reflectance and a slight blue saturation. Early on, this was harnessed by dying objectsto reduce their yellow reflectance and induce a slight color shift [3]. As early as 1929 [8], theuse of fluorescent whitening agents [9] (FWAs) was observed to provide a strong enhancementof whiteness in textiles. FWAs are substances which absorb ultra-violet (UV, λ < 380 nm)radiation and violet (V, 380 < λ < 420 nm) light, and re-emit blue-cyan light. By adding FWAsto a material in addition to yellow-absorbing dyes, the color shift can become substantial: ifthe source has significant ultra-violet and violet (UV/V) content, strong blue fluorescence isinduced, yielding a strong impression of whiteness.
Over the decades the use of FWAs has become commonplace in white materials includingplastics, paper, fiber, textiles, detergent and cosmetics [10]; manufacturers spend considerableefforts to assess and increase the whiteness of their products. On the other hand, the potentialof a light source to improve whiteness perception is rarely considered. Whiteness, however, isnot only a material property; it is dependent upon the interaction between a material and itsillumination. Daylight has significant UV/V content, leading to a very pronounced whitenessenhancement in the presence of FWAs. Incandescent warm-white sources contain less UV/V,and will induce a moderate whiteness enhancement. Most existing light-emitting diodes (LEDs)have little to no UV/V content, and thus offer limited prospects for whiteness enhancement – a
#186885 - $15.00 USD Received 12 Mar 2013; revised 31 May 2013; accepted 29 Jun 2013; published 5 Jul 2013(C) 2013 OSA 15 July 2013 | Vol. 21, No. 14 | DOI:10.1364/OE.21.016702 | OPTICS EXPRESS 16703

shortcoming discussed in [11]. However, as will be shown in this article, the spectrum of LEDscan be purposely tailored to affect whiteness perception.
In this article, we discuss the perception of whiteness for various sources. We review CIEwhiteness (a recognized metric to quantify whiteness perception) and propose an approach togeneralize this metric to sources of varying correlated color temperature (CCT). We show, inparticular, how our modified metric can be used to assess the ability of warm-white sources torender whiteness. We discuss how the source’s spectrum can be tailored to enhance whiteness,an approach that is especially relevant to LEDs.
2. CIE whiteness – definition and generalization to other CCTs
2.1. CIE whiteness formula
There has been significant effort to quantify whiteness on a numerical scale. Many formulashave been developed over the years [1, 4–7]. Among these, the formula proposed by the Com-mission Internationale de l’Eclairage (CIE) [12] presents several advantages: it usually showsgood correlation to perceptual studies (within its application range) [13]; it is easy to com-pute; and it is the object of two international norms (ISO 11475−2004 and 11476−2010 foroutdoors and indoors illumination, respectively [14, 15]).
The basis of the CIE whiteness formula is to consider the color shift of an object from areference illuminant. Whiteness and tint are affected by this shift. The general linear form ofsuch an equation is [16, 17]:
W = Y −ω · cos(η +ϕ)/cos(ϕ) · (x− x0)−ω · sin(η +ϕ)/cos(ϕ) · (y− y0) (1)
Y is the Y -tristimulus value of the sample, i.e. its luminance factor (a perfect reflector hasY = 100); ω is the sensitivity of whiteness to saturation (e.g. to a color shift along λd); η is theangle between the x-axis and the direction of λd , i.e. tan(η) = (y0−yd)/(x0−xd); ϕ is a smallangle which represents tint preference (e.g., the fact that maximal whiteness enhancement is notexactly in the direction of λd); (x0,y0) are the coordinates of the reference illuminant; (xd ,yd)are the coordinates the dominant wavelength; and (x,y) are the coordinates of the object underconsideration. All these quantities pertain to a specific color space and the corresponding color-matching functions (CMFs). The values of ω and ϕ are derived from experimental data [6].
In practice, the following values are used for the definition of CIE outdoors whiteness [6](which employs reference illuminant D65 and the CIE 1964 10o standard observer [12]):ω = 1800, ϕ = 16.6o, (x0,y0) = (0.3138,0.3310), (xd ,yd) = (0.1152,0.1090), η = 48.2o. Thisresults in the numerical formula of CIE whiteness [14]:
W = Y +800(x0 − x)+1700(y0 − y) (2)
These values pertain to the so-called outdoors whiteness standard. Another ISO standardwas also later defined for so-called indoors whiteness, employing the CIE 1931 2o standardobserver and illuminant C, resulting in slightly different numerical values of ω , ϕ and η [15].Outdoors whiteness is more sensitive to the presence of FWAs, while indoors whiteness is morerepresentative of common conditions such as office environments.
The value of the coefficients in Eq. (2) is worthy of a few comments. The unity coefficientbefore Y sets an absolute scale for whiteness: for a sample with no tint (x = x0, y = y0), i.e. aperfect gray, whiteness is equal to Y . Therefore, a sample with a spectrally flat reflectance of90% has a whiteness of 90. A luminance difference of 10% is rather easily detected visually,indicating that a 10-point change in whiteness is significant. For tinted samples, the value of ωwas chosen by determining what color shift was perceived as equivalent to a given change in Y ;
#186885 - $15.00 USD Received 12 Mar 2013; revised 31 May 2013; accepted 29 Jun 2013; published 5 Jul 2013(C) 2013 OSA 15 July 2013 | Vol. 21, No. 14 | DOI:10.1364/OE.21.016702 | OPTICS EXPRESS 16704

thus a shift in color coordinates of about 0.005 (in the direction of λd) is perceived as similar toa 10-points increase in reflectance.
Equation (2) favors certain color shifts; however these should not be in a direction inducingexcessive tint as the sample would no longer look white. Sample tint is further defined as [18]:
T =−ζ · sin(η ′) · (x− x0)+ζ · cos(η ′) · (y− y0) (3)
In principle, η ′ ∼ η (tint occurs for color shifts perpendicular to λd). In practice both η ′ andζ were obtained from fitting experimental data, yielding η ′ = 54o, ζ = 1110 and:
T = 900(x0 − x)−650(y0 − y) (4)
Again, these values pertain to outdoors illumination and employ the 10o standard observer.A similar equation, with slightly different coefficients, stands for indoors illumination underthe 2o standard observer.
Figure 1 clarifies the geometry involved in the definition of CIE whiteness. The main direc-tion is along the axis defined by the chromaticity of the illuminant and the spectrum locus at adominant wavelength λd = 470 nm. Shifts (nearly) parallel to this direction (with a small angleϕ) correspond to whiteness. Shifts (nearly) perpendicular to this direction correspond to tint.
ϕ
���� ���� ���� ���� ���� ���� ��������
����
����
����
����
����
����
η
���������
�� �����
���������
�� �����
���
��
�����
��
�����
�
�
Fig. 1. Geometry corresponding to the CIE whiteness formula. The black dot is the whitepoint of the reference illuminant. Tint variations are nearly perpendicular to the dominantwavelength; whiteness variations are nearly parallel to it (the small angle ϕ accounts foraverage tint preference). The dotted box illustrates the limits of the CIE formula (upper andlower bounds for whiteness and tint).
Equation (2) was designed for a relative comparison of different objects illuminated by D65.In the practical application of Eq. (2), experimental measurements of whiteness are frequentlyperformed in colorimeters/spectrophotometers whose light source is not D65 (although it at-tempts to approximate it in the visible range). Depending whether the light source has more orless UV/V content than D65, the measured value of whiteness is larger or smaller than it wouldbe under D65. This effect is usually seen as a metrology problem in the accurate determination
#186885 - $15.00 USD Received 12 Mar 2013; revised 31 May 2013; accepted 29 Jun 2013; published 5 Jul 2013(C) 2013 OSA 15 July 2013 | Vol. 21, No. 14 | DOI:10.1364/OE.21.016702 | OPTICS EXPRESS 16705
of whiteness [16]. However, it also corresponds to a perceptual reality: the perceived white-ness of an object containing FWAs strongly depends on the source’s UV/V spectrum, a worrynoted early in [19]. For instance, the perceived whiteness of a white paper under a 6500 Kfluorescence lamp is much lower than under D65 or daylight due to the lower UV/V output.
Therefore, although Eq. (2) was designed to characterize relative whiteness of two or moresamples under a fixed reference illuminant, it could also be employed to characterize the relativepotential of several light sources to render whiteness for a fixed reference object – providedthat the sources have the same color coordinates (x0,y0) (and hence the same CCT) as D65. Bycomparing the resulting whiteness values, one can predict the relative perceived whiteness ofthe object under these sources.
2.2. Perception of whiteness vs. CCT
As previously mentioned, Eq. (2) was derived following a series of human perception experi-ments. The sources used during these studies were either daylight or artificial sources aimingto replicate D65, hence the choice of the reference illuminant for Eq. (2). One may wonderif the ingredients for perceived whiteness (namely, a shift towards a dominant wavelength of470 nm and no pronounced red or green hue) can be generalized to other CCTs, especially sincechromatic adaptation will adjust an observer’s whiteness perception.
In a study [20], participants were shown a series of Munsell chips close to a neutral white, butwith slight tints in various directions of the color space; they were asked to rank the chips forwhiteness. The study was performed under a variety of CCTs between 3000 K and 6500 K. Par-ticipants systematically ranked blue/purple chips as whiter than a neutral white, and yellow/redchips as less white; the quantitative rankings were similar under all CCTs for all the chips.This suggests that the directions of the color shifts leading to whiteness and tint perception areCCT-independent. A similar study was performed in [21] with comparable results.
In an earlier study [22], participants observed white samples under an source with a colorfilter and were asked if the filter enhanced or reduced perceived whiteness. For a variety ofsources with CCTs ranging from 2800K to 7000K, whiteness was enhanced with a blue filterand reduced with green and yellow filters. The trends were comparable at all CCTs studied.
Besides, it was reported in [13] that human ranking of a set of white papers in an indooroffice environment correlated well with colorimetry measurements performed under a quartz-tungsten-halogen source (CCT≈3000K).
Therefore, experimental data suggest that the color shifts influencing whiteness are similarunder a wide range of CCTs. This result is fortunate: it implies that, while Eq. (2) defineswhiteness under a 6500 K source, objects designed for enhanced whiteness may retain thisproperty at other CCTs – provided the source allows excitation of FWAs.
2.3. Whiteness formula for other CCTs
As discussed in Section 1, it would be desirable to quantify whiteness under any CCT – either tocompare the relative whiteness of objects under a source, or the relative whiteness of an objectunder various sources. Several approaches can be considered.
One approach is to employ chromatic adaptation: the coordinates of samples under a givensource are transformed into D65 illumination, and Eq. (2) is applied. Unfortunately, this doesnot seem to yield sensible results: as shown in [21], the color coordinates of various whiteobjects fall way out of the bounds of application of Eq. (2) after adaptation. For instance, whenthe initial source has a CCT ≈3000 K, all whiteness values obtained by this procedure arenegative – an unsatisfactory and incorrect result, since the corresponding objects are actuallyperceived as white. This failure is likely due to an imperfection in the formulation of the colortransformation and the color spaces, together with Eq. (2)’s high sensitivity to color coordinates.
#186885 - $15.00 USD Received 12 Mar 2013; revised 31 May 2013; accepted 29 Jun 2013; published 5 Jul 2013(C) 2013 OSA 15 July 2013 | Vol. 21, No. 14 | DOI:10.1364/OE.21.016702 | OPTICS EXPRESS 16706

We propose as an alternative to adapt Eq. (2) to the source of interest. This approach is sup-ported by our discussion in 2.2 – namely, the same color shifts have a similar effect on whitenessacross a wide range of CCTs. The quantities defining Eq. (2) can be adapted as follows: (x0,y0)are now the coordinates of the new reference source; η is recomputed accordingly; ω and ϕare assumed to be unchanged for a different CCT. This last assumption is motivated by ourprevious discussion and the lack of additional data for warm-white sources; further perceptionstudies would be required to establish accurate values. Nevertheless, we do not expect that theserefinements would substantively influence relative whiteness rankings. [23]
Figure 2 illustrates the geometry used in generalizing the whiteness equation.
� ��� ��� ��� ��� ��� �� ���
���
���
���
���
���
��
��
���
���������
���
�� ��
�
�
Fig. 2. Geometry for the generalization of the whiteness formula. For any source, the sameconstruction can be applied as for D65, by considering color shifts parallel and perpendic-ular to the λd = 470 nm direction. Here this is illustrated for two sources on the blackbodylocus (dotted line) at 6500 K and 3000 K.
As an example, we propose adaptation to a 3000 K source on the blackbody locus using the2o CMFs. This yields (x0,y0) = (0.4370,0.4041), (xd ,yd) = (0.1241,0.0578), η = 47.9o and:
W = Y +810(x0 − x)+1700(y0 − y) (5)
The numerical values of Eq. (5) are very similar to those in Eq. (2) after rounding, which iscoincidental (the switch from the 10o to the 2o CMFs and the change in CCT from 6500 K to3000 K have compensating effects on the numerical values, as shown in Appendix A).
Likewise, we propose a modification of the tint equation at 3000 K as follows (using η ′ = η ,and keeping the value of ζ ):
T = 820(x0 − x)−740(y0 − y) (6)
A value of zero indicates an absence of tint. T is a sensitive metric: a value of a few pointsindicates an object with a non-white appearance. At 6500 K, the tolerance is −4 < T < 2 [16,
#186885 - $15.00 USD Received 12 Mar 2013; revised 31 May 2013; accepted 29 Jun 2013; published 5 Jul 2013(C) 2013 OSA 15 July 2013 | Vol. 21, No. 14 | DOI:10.1364/OE.21.016702 | OPTICS EXPRESS 16707

18]. This value can be used as a guideline at other CCTs, although additional experimentalwork would be desirable to accurately establish tolerable limits of tint.
Appendix A provides numerical values of the coefficients in the whiteness and tint formulasfor CCTs between 2000 and 7000 K.
3. Applications of the whiteness formula
3.1. Description of samples and sources
As an application example, we consider how various sources render whiteness for a series ofnine calibrated whiteness standards provided by Avian Technologies (FTS series, matte). TheCIE whiteness of the samples, measured by the samples provider, varies between 83 and 140(outdoors whiteness, i.e. D65 illumination). The sample with the lowest whiteness contains noFWA, while the other samples contain an increasing amount of FWA. The FWA employed inthese samples is chosen to closely mimic the typical behavior of a whitened commercial paper.We label these samples as Wxx, where xx is the CIE whiteness.
The light sources we consider have a CCT of 3000 K. They are a blackbody (BB) radiatorrepresentative of an incandescent source; a typical blue-pumped 2-phosphor white-emittingLED (BLED) with a color rendering index (CRI) ≈80; and a series of six violet-pumped 3-phosphor white-emitting LEDs (VLEDs) with varying violet contribution in the spectrum.
Interest in violet-pumped LED systems is motivated by recent demonstrations of very highperformance VLEDs [24] and white sources based on these LEDs. It is expected that the violetcontent in these sources should be able to excite FWAs and contribute to whiteness. The seriesof spectra we consider have a violet leak (e.g. fraction of the spectrum below 430 nm) varyingbetween 1% and 10%, and are color-balanced to be on the blackbody locus at 3000 K. Thesespectra all display excellent CRI (between 90 for the lowest violet leak and 97 for the highviolet leak values) and deep-red rendering R9 (also in the range 90-95). We label the VLEDwith x% violet leak as a x%-VLED.
The BLED spectrum was chosen as representative of commercially available MR-16 lamps.Although its CRI is lower than that of the VLEDs, this is not expected to influence whitenessresults because the CRI difference is due to the absence/presence of deep red content in thespectrum, a fact irrelevant to the fluorescence of FWA-containing objects.
3.2. Optical characterization procedure
In order to compute the color coordinates of a sample under a given source, we first character-ize its (spectral) reflectance and (bispectral) luminescence properties. We employ the double-monochromator method (described in details in [25, 26] and employed in a similar contextin [11]) which we shortly summarize below.
In general, if a sample is illuminated with a beam of wavelength λ and unit intensity, thetotal light leaving the sample (or total spectral radiance) can be written as E(λ ,λ ′) = R(λ )+L(λ ,λ ′), where R is the reflectance and L the luminescence (due to FWAs in our case). If wemeasure E for a variety of λ , we obtain the 2-dimensional matrix E(λ ,λ ′) of the sample’soptical response. In other words, the sample’s response spectrum under a source of spectrum Sis E.S, where S is a column vector. The reflectance R is the diagonal of E. We note that R andL are also called the spectral reflected and bispectral luminescent radiance factors [25].
In practice, E is measured as follows. We use an integrating sphere connected to a spectrom-eter with a CCD-array detector. The relative response of the system versus wavelength has beencalibrated. The sample is placed at the output port of the sphere. A collimated monochromaticbeam at wavelength λ enters the sphere through a small port, and can be displaced laterallyto hit the sample or the wall of the sphere. The beam is first directed to the wall, and the ref-erence spectrum I0 is collected (this signal is peaked around λ , with a total width of ±3 nm).
#186885 - $15.00 USD Received 12 Mar 2013; revised 31 May 2013; accepted 29 Jun 2013; published 5 Jul 2013(C) 2013 OSA 15 July 2013 | Vol. 21, No. 14 | DOI:10.1364/OE.21.016702 | OPTICS EXPRESS 16708

The beam is then directed to the sample, and the resulting spectrum I is collected; we then haveE(λ ′) = I/I0. The part of E which is within ±3 nm of λ is identified as R, while the rest of E (ifpresent) is attributed to luminescence and constitutes L. By repeating the procedure for multiplevalues of λ , we obtain the full matrix E(λ ,λ ′). The total procedure takes a few minutes. Ourprocedure assumes that R and L have the same angular dependence – a safe assumption for thepresent matte samples (see Appendix B for further discussion). For illustration, Fig. 3 displaysthe reflectance R(λ ) and luminescence L(380,λ ′) spectra for samples W115 and W130.
400 450 500 550 600 650 700 7500
0.1
0.2
0.3
0.4
0.5
0.6
0.7
0.8
0.9
1
400 450 500 550 600 650 700 7500
0.1
0.2
0.3
0.4
0.5
0.6
0.7
0.8
0.9
1�
���
���
���
���
�
��� �� ��� ��
�
���
���
���
���
�
��� �� ��� ��
��
��������
λ ���� λ ����
�� ��
��
��������
Fig. 3. Optical properties of a) W115 and b) W130. The shaded areas depict re-flectance/luminescence as a function of excitation wavelength λ . Deep gray: reflectance(R); light gray: FWA absorption (A) e.g. fraction of the light which is absorbed and re-emitted as luminescence L; white: loss. The superimposed red line is the luminescencespectrum L(380,λ ′) at an excitation wavelength λ = 380 nm (amplitude in arbitrary units).
Using this procedure, we characterize each whiteness standard. The various source spectraare then employed to compute the output spectra of the sample. From these we derive thechromaticity coordinates (x,y) and apply Eq. (5). As an example of this procedure, Fig. 4displays the computed output spectra of the W130 sample under several sources.
�
�
��
��
��
��
��� ��� ��� ���
λ ����
����������� �����
Fig. 4. Computed output spectra of the W130 sample illuminated by a BB radiator (black),a BLED (blue) and a 6%-VLED (magenta).
In order to confirm the accuracy of our characterization procedure, we also compare its pre-dictions with direct measurements under illumination by various lamps. The results, presentedin appendix B, show excellent agreement.
#186885 - $15.00 USD Received 12 Mar 2013; revised 31 May 2013; accepted 29 Jun 2013; published 5 Jul 2013(C) 2013 OSA 15 July 2013 | Vol. 21, No. 14 | DOI:10.1364/OE.21.016702 | OPTICS EXPRESS 16709

����
����
����
���� ���� ����
����
��
��
��
��
���
����
� �
���������
���������
�
����
����
����
���� ���� ����
����
��
��
��
��
��
���
����
� �
���������
���������
�
� �
�� ��
��
��
��
��
�
���
��
���
��
���
��
�� �� �� �� � ���
��
�
���
��
���
��
���
��
�� �� �� �� � ���
Fig. 5. Whiteness of two objects under various sources. (a) W115 sample: whiteness un-der illumination by VLEDs, versus violet leak (magenta line). The horizontal lines are thewhiteness under illumination by a BLED and a 3000 K BB radiator, respectively. (b) Cor-responding (x, y) coordinates. The points correspond to the reference white point of thesources (”Ref”), the BLED , the BB radiator and the VLEDs, (label = violet leak value).The dashed lines correspond to tint values of ±3. (c-d) Same as (a-b) for the W130 sample.
3.3. Results
Application of Eq. (5) to the computed spectra yields the whiteness values shown on Fig. 5,for samples W115 and W130. For both samples, the UV tail of the blackbody source inducesfluorescence and increased whiteness. As expected, the VLEDs display increased whitenesswith increased violet leak. The BLED consistently displays a low whiteness (slightly worsethan the 1%-VLED and much worse than the BB radiator). This is expected, as the absence ofany violet component in the spectrum of a BLED will fail to excite the FWAs.
The whiteness variations on Fig. 5 are substantial: they span 20 to 30 points. As discussed inSection 2.1, this corresponds to a significant change in the whiteness perception (equivalent to20-30 points of luminance factor). Overall, the whiteness induced by a BB is well matched byVLEDs with 6-8% violet leak. On the other hand, BLEDs don’t induce enhanced whiteness;the value of ≈85 obtained for both samples corresponds to a distinctly yellow perception.
#186885 - $15.00 USD Received 12 Mar 2013; revised 31 May 2013; accepted 29 Jun 2013; published 5 Jul 2013(C) 2013 OSA 15 July 2013 | Vol. 21, No. 14 | DOI:10.1364/OE.21.016702 | OPTICS EXPRESS 16710

Equally informative are the color coordinates of the objects plotted in Fig. 5b and 5d. Thereis a substantial color shift depending on the source, which is aligned with the direction ofwhiteness enhancement. Sources with little UV/V content, such as the BLED, sit in the upper-right quadrant of the plot, beyond the reference white point: these samples display decreasedwhiteness (W < 100) despite the presence of FWAs.
We also note that both standards show a slight green tint (about 1-2 points) – this is a propertyof the objects. None of the light sources cause a significant additional tint effect.
Figure 6 shows the resulting whiteness for the full series of standards, as a function of theirCIE (D65) whiteness, for three sources (the BB, the BLED and the 8%-VLED). Our proposedmeasure of whiteness is well correlated with CIE whiteness for the BB and VLED (however,the whiteness values at 3000 K are slightly lower than the CIE whiteness, which is due to thevery high UV/V content of D65). The whiteness values under these two sources are quite closeacross the whole sample set. For the BLED, on the other hand, no fluorescence is induced; theslight whiteness variations are due to small changes in the samples’ reflectance spectra.
��
��
���
���
���
�� ��� ��� ���
����������� ����
������������ ������ ��
����
������
Fig. 6. Whiteness of 3000 K sources versus CIE whiteness, for the series of whitenessstandards. The BB and VLED show similar behavior and their whiteness increases with CIEwhiteness, as expected. The BLED, however, shows no trend due to a lack of fluorescence.The dashed line shows the diagonal x = y : all 3000 K sources induce less whiteness thanD65. For W82, which contains no FWAs, all sources yield the same whiteness.
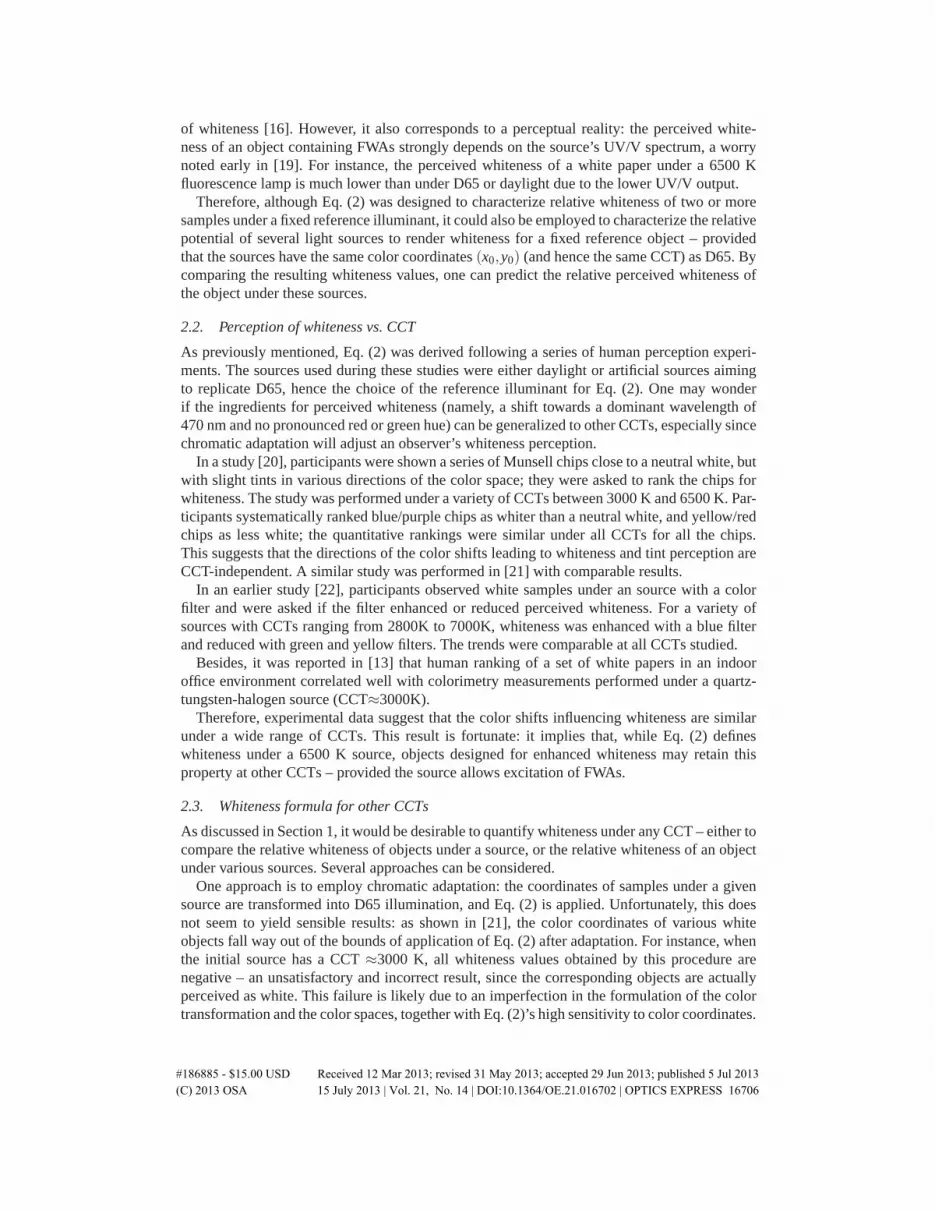
To further illustrate the difference in the sources’ behavior, we compute the color distanceDuv = 1000
√Δu′2 +Δv′2 between a sample illuminated by the blackbody emitter and the var-
ious LED sources. This is relevant in a situation where one wishes to retrofit a halogen sourcewith an LED source, and color matching to the halogen is sought. Figure 7 shows the resultsfor several sources and the series of white standards. The BLED induces a large color distancewhich increases with CIE whiteness. It is above 2 points (a just-noticeable difference) for allfluorescent samples, and reaches 6-8 points for a CIE whiteness of 130-140, typical of manywhitened materials. The 4%-VLED shows a reduced Duv, and the 6%-VLED displays a non-noticeable Duv (below 1 point for all samples). Again, a violet leak in the range 6−8% appearsoptimal to mimic the whiteness generated by a halogen source.
Besides the nine whiteness standards presented here, measurements were also performed onseveral commercially available papers (including printing papers and a business card paper).Such paper samples typically have a CIE whiteness in the range 120-150. The results obtainedon these samples were fully consistent with those obtained on the high-whiteness standards,indicating that our conclusions apply to real-world materials.
#186885 - $15.00 USD Received 12 Mar 2013; revised 31 May 2013; accepted 29 Jun 2013; published 5 Jul 2013(C) 2013 OSA 15 July 2013 | Vol. 21, No. 14 | DOI:10.1364/OE.21.016702 | OPTICS EXPRESS 16711
�
�
�
�
�
�
�
�
� �� ��� ��� ��� ��� ���
����������� ����
���
� ��
���� ��
���� ��
Fig. 7. Color distance Duv between a halogen source and various LED sources, for theseries of white standards. Duv = 2 corresponds to a just-noticeable difference. The BLEDcauses large color shifts for whitened objects, while the 6% VLED shows a minimal Duv.
3.4. Discussion
Our application of the adapted whiteness formula indicates significant changes in whitenessdepending on the light source, which are expected to be readily perceived by an observer. Onecan therefore wonder if this is indeed validated by human experience.
A preliminary study was performed, with fifteen participants. Each participant observed twoside-by-side unlabeled display booths containing a sheet of commercial white paper, illumi-nated respectively by a 4%-VLED and a 6%-VLED. The booths were painted with a high-reflectivity white paint and a calibrated Munsell N8 paint, yielding spectrally flat booths. TheLED sources were carefully selected to have a very similar white point, so that the participantscould not notice a chromatic difference in the empty booths lit by the various lamps. The par-ticipants, who had no knowledge of the research question, were asked to compare the whitenessof the paper in the two booths and to express one of five choices: a moderate or strong prefer-ence for either booth, or no preference. Two subjects indicated a moderate preference for the4%-VLED, while the thirteen others preferred the 6%-VLED either moderately (ten subjects)or strongly (three subjects). This is a rather pronounced signal in favor of the higher violet leak,especially considering the moderate 2% difference in violet leak for this pair.
Further, one of the present authors (AD) tried ranking the nine (unlabeled) whiteness stan-dards visually under various sources. A good agreement with the CIE whiteness rank wasachieved with a 6%-VLED (with a few inversions of nearest-neighbor samples). When watch-ing side-by-side two samples with a 20-point difference in whiteness under the 6%-VLED,a difference was readily perceived. Under BLED illumination, on the other hand, the sampleranking was impossible and all samples appeared yellowish.
These observations are qualitatively compatible with the numerical results presented above.A proper confirmation of these observations would require a controlled human perception study.Besides, more quantitative assessment is desirable – for instance, the value of the scaling factorω and tint tolerance should be assessed experimentally, again calling for psychophysical stud-ies. Such studies are currently being finalized in order to test and refine our proposal, and willbe the object of future publications.
#186885 - $15.00 USD Received 12 Mar 2013; revised 31 May 2013; accepted 29 Jun 2013; published 5 Jul 2013(C) 2013 OSA 15 July 2013 | Vol. 21, No. 14 | DOI:10.1364/OE.21.016702 | OPTICS EXPRESS 16712

4. Conclusions
Whiteness enhancement by FWAs is routinely used in a variety of manufactured materials. Thiseffect is well captured by the CIE whiteness formula; however this formula employs a 6500 Killuminant and does not apply to other CCTs. Yet many of these materials are designed to beobserved under a variety of lighting conditions, including indoors situations where warmerCCT light sources are common. It is desirable to have a method to quantify whiteness in thesesituations, including changes in whiteness that result from illumination.
We have proposed a generalization of the CIE whiteness formula to sources of other CCTs.This generalization appears reasonable in view of the geometric foundations of the whitenessformula, and of past human factor studies which suggest that similar color shifts induce en-hanced whiteness at various CCTs.
As an application of our formula, we have shown how various 3000 K sources are ableto harness enhanced whiteness on fluorescent objects. Incandescent sources induce significantwhiteness due to their UV/V content. Typical blue-pumped LED sources, on the other hand,show no whiteness enhancement due to the absence of short-wavelength radiation in their spec-tra. Violet-pumped LEDs offer an attractive alternative: by tuning the amount of violet lightin the spectrum, enhanced whiteness can be restored – at no expense on other color-qualitymetrics such as CRI and R9, which can be maintained to values beyond 95.
We have also exemplified the impact of FWAs in terms of color difference to a halogensource. In retrofit applications, a good color match is essential – hence the use of color renditionmetrics such as the CRI. However, we conclude that even a blue-pumped LED with a decentCRI (≈80) can cause a significant perceptual difference for FWA-containing objects. Since thisissue is due to a lack of violet radiation, it would not be solved by blue-pumped LEDs with avery high CRI.
Considering the importance of white perception in the pleasantness of objects’ appearance,such effects are important for adoption of LED sources for general illumination. We suggestthat a source’s ability to render and enhance whiteness should be considered as a key metricfor the quality of light, together with metrics that quantify color rendition. The use of ourproposed formula together with standardized whiteness samples, as presented here, constitutesone possible approach. Human factor studies, necessary to confirm our results, are underwayand will be the object of future publications.
A. Numerical values of the whiteness and tint equations vs. CCT
In general, Eq. (2) can be expressed as:
W = Y −P · (x− x0)−Q · (y− y0) (7)
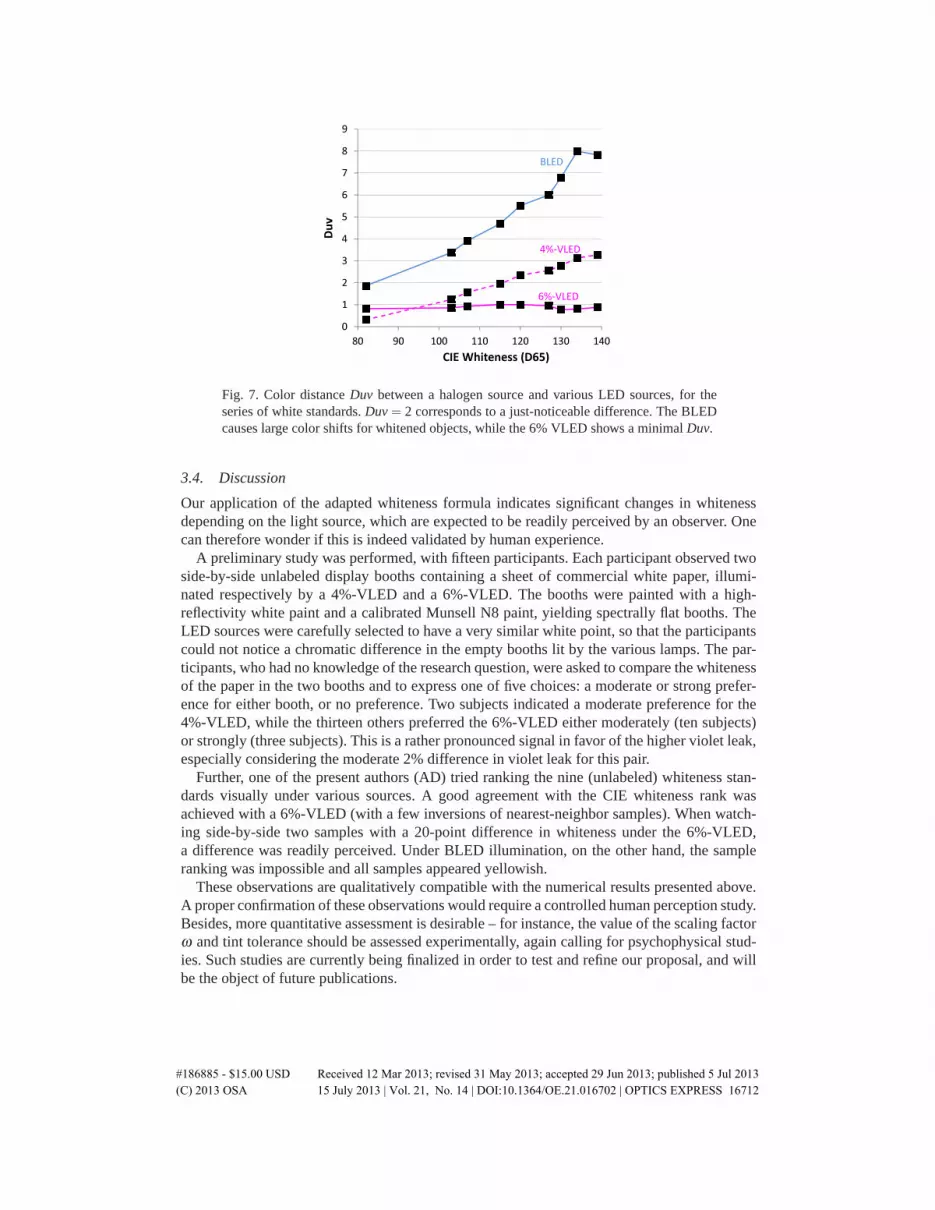
As explained, the values of P and Q can be derived for any CCT taking into account thechromaticity coordinates of the source. Figure 8 indicates the numerical values of P and Qobtained by this method for sources on the blackbody locus. These coefficients can be employedto generate a whiteness formula for a source of any CCT between 2000 and 7000 K.
B. Verification of the samples’ optical characterization procedure
In Section 3.2, we describe how the optical properties of samples with FWAs are characterized.In this Appendix, we check the accuracy of this characterization procedure.
Once the total spectral radiance E of a sample is known, one can compute the optical outputS′ of the sample illuminated by a given source of spectrum S as S′ = E.S, and compare thistheoretical spectrum to an actual measurement of the sample under illumination.
#186885 - $15.00 USD Received 12 Mar 2013; revised 31 May 2013; accepted 29 Jun 2013; published 5 Jul 2013(C) 2013 OSA 15 July 2013 | Vol. 21, No. 14 | DOI:10.1364/OE.21.016702 | OPTICS EXPRESS 16713
2000 3000 4000 5000 6000 7000400
600
800
1000
1200
1400
1600
1800
2000
�������
����
�������
������
������
�����
Fig. 8. Values of the constants P and Q in Eq. (7), vs. CCT. The full lines correspond to the2o CMFs and the dashed lines to the 10o CMFs. The dashed curves at 6500 K have similarvalues to the full curves at 3000 K – this explains the similar values in Eqs. (2) and (5).
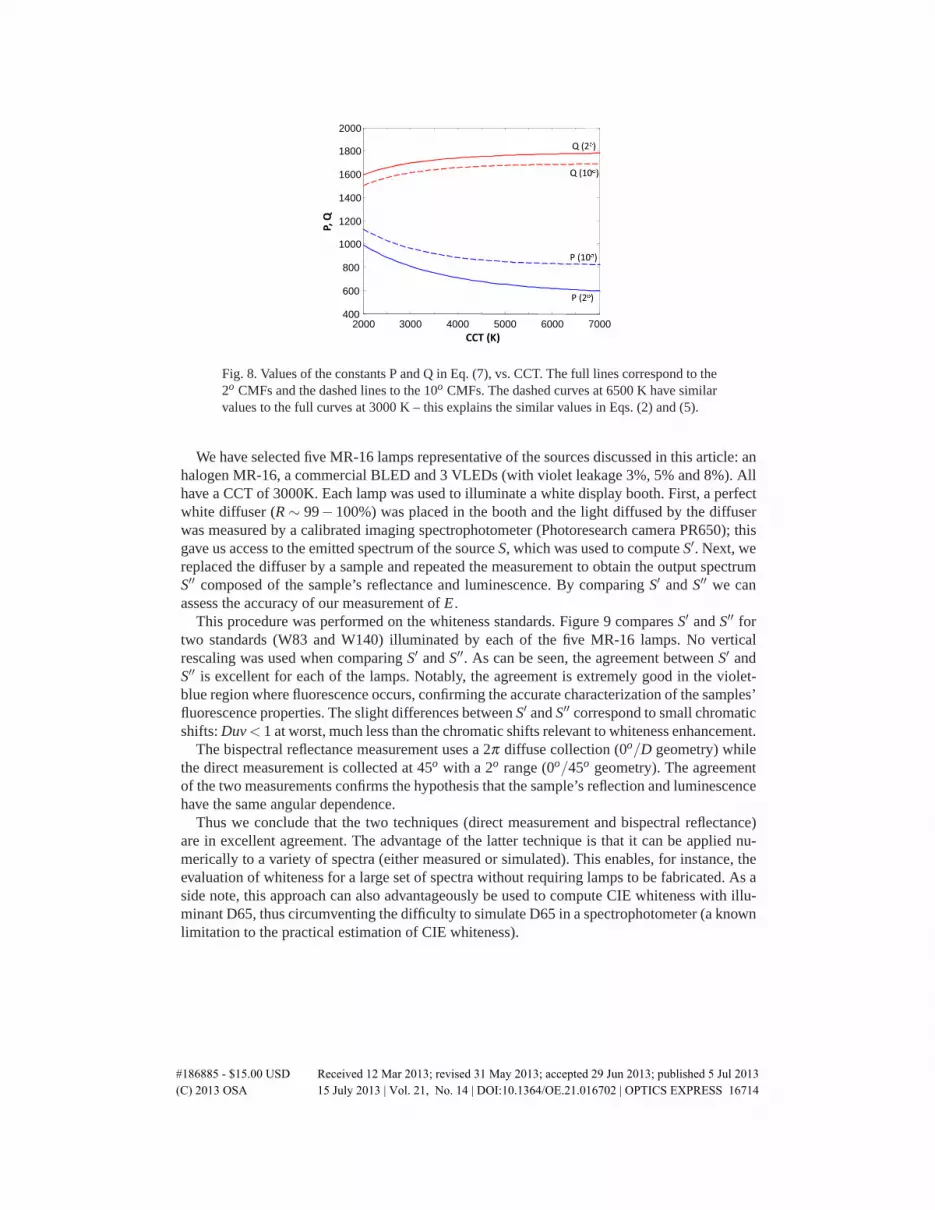
We have selected five MR-16 lamps representative of the sources discussed in this article: anhalogen MR-16, a commercial BLED and 3 VLEDs (with violet leakage 3%, 5% and 8%). Allhave a CCT of 3000K. Each lamp was used to illuminate a white display booth. First, a perfectwhite diffuser (R ∼ 99− 100%) was placed in the booth and the light diffused by the diffuserwas measured by a calibrated imaging spectrophotometer (Photoresearch camera PR650); thisgave us access to the emitted spectrum of the source S, which was used to compute S′. Next, wereplaced the diffuser by a sample and repeated the measurement to obtain the output spectrumS′′ composed of the sample’s reflectance and luminescence. By comparing S′ and S′′ we canassess the accuracy of our measurement of E.
This procedure was performed on the whiteness standards. Figure 9 compares S′ and S′′ fortwo standards (W83 and W140) illuminated by each of the five MR-16 lamps. No verticalrescaling was used when comparing S′ and S′′. As can be seen, the agreement between S′ andS′′ is excellent for each of the lamps. Notably, the agreement is extremely good in the violet-blue region where fluorescence occurs, confirming the accurate characterization of the samples’fluorescence properties. The slight differences between S′ and S′′ correspond to small chromaticshifts: Duv< 1 at worst, much less than the chromatic shifts relevant to whiteness enhancement.
The bispectral reflectance measurement uses a 2π diffuse collection (0o/D geometry) whilethe direct measurement is collected at 45o with a 2o range (0o/45o geometry). The agreementof the two measurements confirms the hypothesis that the sample’s reflection and luminescencehave the same angular dependence.
Thus we conclude that the two techniques (direct measurement and bispectral reflectance)are in excellent agreement. The advantage of the latter technique is that it can be applied nu-merically to a variety of spectra (either measured or simulated). This enables, for instance, theevaluation of whiteness for a large set of spectra without requiring lamps to be fabricated. As aside note, this approach can also advantageously be used to compute CIE whiteness with illu-minant D65, thus circumventing the difficulty to simulate D65 in a spectrophotometer (a knownlimitation to the practical estimation of CIE whiteness).
#186885 - $15.00 USD Received 12 Mar 2013; revised 31 May 2013; accepted 29 Jun 2013; published 5 Jul 2013(C) 2013 OSA 15 July 2013 | Vol. 21, No. 14 | DOI:10.1364/OE.21.016702 | OPTICS EXPRESS 16714

400 500 600 700 400 500 600 700
��� ����
�������
��
�����
������
������
0
10
20
���������� �� �
�
�
5
15
0
10
20
���������� �� �
�
�
5
15
0
10
20
���������� �� �
�
�
5
15
0
10
20
���������� �� �
�
�
5
15
0
10
20
���������� �� �
�
�5
15
30
25
λ ���� λ ����
Fig. 9. Comparison of the output spectra derived from bispectral reflectance (blue curves)and directly measured with an imaging spectrophotometer (red curves), for two whitenessstandards illuminated by five lamps.
#186885 - $15.00 USD Received 12 Mar 2013; revised 31 May 2013; accepted 29 Jun 2013; published 5 Jul 2013(C) 2013 OSA 15 July 2013 | Vol. 21, No. 14 | DOI:10.1364/OE.21.016702 | OPTICS EXPRESS 16715


