Embed Size (px)
Citation preview

World Journal of GastroenterologyWorld J Gastroenterol 2017 December 21; 23(47): 8263-8438
ISSN 1007-9327 (print)ISSN 2219-2840 (online)
Published by Baishideng Publishing Group Inc
The World Journal of Gastroenterology Editorial Board consists of 1353 members, representing a team of worldwide experts in gastroenterology and hepatology. They are from 68 countries, including Albania (1), Algeria (1), Argentina (7), Australia (31), Austria (9), Belgium (10), Brazil (20), Brunei Darussalam (1), Bulgaria (2), Cambodia (1), Canada (25), Chile (4), China (161), Croatia (1), Cuba (1), Czech (6), Denmark (2), Egypt (9), Estonia (2), Finland (6), France (17), Germany (56), Greece (31), Guatemala (1), Hungary (14), Iceland (1), India (33), Indonesia (2), Iran (10), Ireland (9), Israel (18), Italy (195), Japan (151), Jordan (1), Kuwait (1), Lebanon (7), Lithuania (1), Malaysia (1), Mexico (10), Morocco (1), Netherlands (5), New Zealand (4), Nigeria (3), Norway (6), Pakistan (6), Poland (12), Portugal (8), Puerto Rico (1), Qatar (1), Romania (10), Russia (3), Saudi Arabia (2), Singapore (7), Slovenia (2), South Korea (64), Spain (51), Sri Lanka (1), Sudan (1), Sweden (12), Switzerland (5), Thailand (7), Trinidad and Tobago (1), Tunisia (2), Turkey (56), United Kingdom (47), United States (173), Venezuela (1), and Vietnam (1).
Editorial Board2014-2017
EDITORS-IN-CHIEFStephen C Strom, StockholmSaleh A Naser, OrlandoAndrzej S Tarnawski, Long BeachDamian Garcia-Olmo, Madrid
GUEST EDITORIAL BOARD MEMBERSJia-Ming Chang, TaipeiJane CJ Chao, TaipeiKuen-Feng Chen, TaipeiTai-An Chiang, TainanYi-You Chiou, TaipeiSeng-Kee Chuah, KaohsiungWan-Long Chuang, KaohsiungHow-Ran Guo, TainanMing-Chih Hou, TaipeiPo-Shiuan Hsieh, TaipeiChing-Chuan Hsieh, Chiayi countyJun-Te Hsu, TaoyuanChung-Ping Hsu, TaichungChien-Ching Hung, TaipeiChao-Hung Hung, KaohsiungChen-Guo Ker, KaohsiungYung-Chih Lai, TaipeiTeng-Yu Lee, Taichung CityWei-Jei Lee, TaoyuanJin-Ching Lee, KaohsiungJen-Kou Lin, TaipeiYa-Wen Lin, TaipeiHui-kang Liu, TaipeiMin-Hsiung Pan, TaipeiBor-Shyang Sheu, TainanHon-Yi Shi, KaohsiungFung-Chang Sung, TaichungDar-In Tai, Taipei
Jung-Fa Tsai, KaohsiungYao-Chou Tsai, New Taipei CityChih-Chi Wang, KaohsiungLiang-Shun Wang, New Taipei CityHsiu-Po Wang, TaipeiJaw-Yuan Wang, KaohsiungYuan-Huang Wang, TaipeiYuan-Chuen Wang, TaichungDeng-Chyang Wu, KaohsiungShun-Fa Yang, TaichungHsu-Heng Yen, Changhua
MEMBERS OF THE EDITORIAL BOARD
Albania
Saadi Berkane, Algiers
Algeria
Samir Rouabhia, Batna
Argentina
N Tolosa de Talamoni, CórdobaEduardo de Santibanes, Buenos AiresBernardo Frider, Capital FederalGuillermo Mazzolini, PilarCarlos Jose Pirola, Buenos AiresBernabé Matías Quesada, Buenos AiresMaría Fernanda Troncoso, Buenos Aires
Australia
Golo Ahlenstiel, WestmeadMinoti V Apte, SydneyJacqueline S Barrett, MelbourneMichael Beard, AdelaideFilip Braet, SydneyGuy D Eslick, SydneyChristine Feinle-Bisset, AdelaideMark D Gorrell, SydneyMichael Horowitz, AdelaideGordon Stanley Howarth, RoseworthySeungha Kang, BrisbaneAlfred King Lam, Gold CoastIan C Lawrance, PerthFremantleBarbara Anne Leggett, BrisbaneDaniel A Lemberg, SydneyRupert W Leong, SydneyFinlay A Macrae, VictoriaVance Matthews, MelbourneDavid L Morris, SydneyReme Mountifield, Bedford ParkHans J Netter, MelbourneNam Q Nguyen, AdelaideLiang Qiao, WestmeadRajvinder Singh, AdelaideRoss Cyril Smith, StLeonardsKevin J Spring, SydneyDebbie Trinder, FremantleDaniel R van Langenberg, Box HillDavid Ian Watson, AdelaideDesmond Yip, GarranLi Zhang, Sydney
March 26, 2014IWJG|www.wjgnet.com
Austria
Felix Aigner, InnsbruckGabriela A Berlakovich, ViennaHerwig R Cerwenka, GrazPeter Ferenci, WienAlfred Gangl, ViennaKurt Lenz, LinzMarkus Peck-Radosavljevic, ViennaMarkus Raderer, ViennaStefan Riss, Vienna
Belgium
Michael George Adler, BrusselsBenedicte Y De Winter, AntwerpMark De Ridder, JetteOlivier Detry, LiegeDenis Dufrane Dufrane, BrusselsNikos Kotzampassakis, LiègeGeert KMM Robaeys, GenkXavier Sagaert, LeuvenPeter Starkel, BrusselsEddie Wisse, Keerbergen
Brazil
SMP Balzan, Santa Cruz do SulJLF Caboclo, Sao jose do rio pretoFábio Guilherme Campos, Sao PauloClaudia RL Cardoso, Rio de JaneiroRoberto J Carvalho-Filho, Sao PauloCarla Daltro, SalvadorJosé Sebastiao dos Santos, Ribeirao PretoEduardo LR Mello, Rio de JaneiroSthela Maria Murad-Regadas, FortalezaClaudia PMS Oliveira, Sao PauloJúlio C Pereira-Lima, Porto AlegreMarcos V Perini, Sao PauloVietla Satyanarayana Rao, FortalezaRaquel Rocha, SalvadorAC Simoes e Silva, Belo HorizonteMauricio F Silva, Porto AlefreAytan Miranda Sipahi, Sao PauloRosa Leonôra Salerno Soares, NiteróiCristiane Valle Tovo, Porto AlegreEduardo Garcia Vilela, Belo Horizonte
Brunei Darussalam
Vui Heng Chong, Bandar Seri Begawan
Bulgaria
Tanya Kirilova Kadiyska, SofiaMihaela Petrova, Sofia
Cambodia
Francois Rouet, Phnom Penh
Canada
Brian Bressler, Vancouver
Frank J Burczynski, WinnipegWangxue Chen, OttawaFrancesco Crea, VancouverMirko Diksic, MontrealJane A Foster, HamiltonHugh J Freeman, VancouverShahrokh M Ghobadloo, OttawaYuewen Gong, WinnipegPhilip H Gordon, QuebecRakesh Kumar, EdmontonWolfgang A Kunze, HamiltonPatrick Labonte, LavalZhikang Peng, WinnipegJayadev Raju, OttawaMaitreyi Raman, CalgaryGiada Sebastiani, MontrealMaida J Sewitch, MontrealEldon A Shaffer, AlbertaChristopher W Teshima, EdmontonJean Sévigny, QuébecPingchang Yang, HamiltonPingchang Yang, HamiltonEric M Yoshida, VancouverBin Zheng, Edmonton
Chile
Marcelo A Beltran, La SerenaFlavio Nervi, SantiagoAdolfo Parra-Blanco, SantiagoAlejandro Soza, Santiago
China
Zhao-Xiang Bian, Hong Kong San-Jun Cai, ShanghaiGuang-Wen Cao, ShanghaiLong Chen, NanjingRu-Fu Chen, GuangzhouGeorge G Chen, Hong KongLi-Bo Chen, WuhanJia-Xu Chen, BeijingHong-Song Chen, BeijingLin Chen, BeijingYang-Chao Chen, Hong KongZhen Chen, ShanghaiYing-Sheng Cheng, ShanghaiKent-Man Chu, Hong KongZhi-Jun Dai, Xi’anJing-Yu Deng, TianjinYi-Qi Du, ShanghaiZhi Du, TianjinHani El-Nezami, Hong KongBao-Ying Fei, HangzhouChang-Ming Gao, NanjingJian-Ping Gong, ChongqingZuo-Jiong Gong, WuhanJing-Shan Gong, ShenzhenGuo-Li Gu, BeijingYong-Song Guan, ChengduMao-Lin Guo, LuoyangJun-Ming Guo, NingboYan-Mei Guo, ShanghaiXiao-Zhong Guo, ShenyangGuo-Hong Han, Xi’anMing-Liang He, Hong KongPeng Hou, Xi’anZhao-Hui Huang, Wuxi
Feng Ji, HangzhouSimon Law, Hong KongYu-Yuan Li, Guangzhou Meng-Sen Li, HaikouShu-De Li, Shanghai Zong-Fang Li, Xi’anQing-Quan Li, ShanghaiKang Li, LasaHan Liang, TianjinXing’e Liu, HangzhouZheng-Wen Liu, Xi’anXiao-Fang Liu, YantaiBin Liu, TianjinQuan-Da Liu, BeijingHai-Feng Liu, BeijingFei Liu, ShanghaiAi-Guo Lu, ShanghaiHe-Sheng Luo, WuhanXiao-Peng Ma, ShanghaiYong Meng, ShantouKe-Jun Nan, Xi’anSiew Chien Ng, Hong KongSimon SM Ng, Hong KongZhao-Shan Niu, QingdaoBo-Rong Pan, Xi’anDi Qu, ShanghaiRui-Hua Shi, NanjingBao-Min Shi, ShanghaiXiao-Dong Sun, HangzhouSi-Yu Sun, ShenyangGuang-Hong Tan, HaikouWen-Fu Tang, ChengduAnthony YB Teoh, Hong KongWei-Dong Tong, ChongqingEric Tse, Hong KongHong Tu, ShanghaiRong Tu, HaikouJian-She Wang, ShanghaiKai Wang, JinanXiao-Ping Wang, XianyangDao-Rong Wang, YangzhouDe-Sheng Wang, Xi’anChun-You Wang, WuhanGe Wang, ChongqingXi-Shan Wang, HarbinWei-hong Wang, BeijingZhen-Ning Wang, ShenyangWai Man Raymond Wong, Hong KongChun-Ming Wong, Hong KongJian Wu, ShanghaiSheng-Li Wu, Xi’anWu-Jun Wu, Xi’anBing Xia, WuhanQing Xia, ChengduYan Xin, ShenyangDong-Ping Xu, BeijingJian-Min Xu, ShanghaiWei Xu, ChangchunMing Yan, JinanXin-Min Yan, KunmingYi-Qun Yan, ShanghaiFeng Yang, ShanghaiYong-Ping Yang, BeijingHe-Rui Yao, GuangzhouThomas Yau, Hong KongWinnie Yeo, Hong KongJing You, KunmingJian-Qing Yu, WuhanYing-Yan Yu, ShanghaiWei-Zheng Zeng, ChengduZong-Ming Zhang, Beijing
March 26, 2014IIWJG|www.wjgnet.com
Dian-Liang Zhang, QingdaoYa-Ping Zhang, ShijiazhuangYou-Cheng Zhang, LanzhouJian-Zhong Zhang, BeijingJi-Yuan Zhang, BeijingHai-Tao Zhao, BeijingJian Zhao, ShanghaiJian-Hong Zhong, NanningYing-Qiang Zhong, GuangzhouPing-Hong Zhou, ShanghaiYan-Ming Zhou, XiamenTong Zhou, NanchongLi-Ming Zhou, ChengduGuo-Xiong Zhou, NantongFeng-Shang Zhu, ShanghaiJiang-Fan Zhu, ShanghaiZhao-Hui Zhu, Beijing
Croatia
Tajana Filipec Kanizaj, Zagreb
Cuba
Damian Casadesus, Havana
Czech
Jan Bures, Hradec KraloveMarcela Kopacova, Hradec KraloveOtto Kucera, Hradec KraloveMarek Minarik, PraguePavel Soucek, PragueMiroslav Zavoral, Prague
Denmark
Vibeke Andersen, OdenseE Michael Danielsen, Copenhagen
Egypt
Mohamed MM Abdel-Latif, AssiutHussein Atta, CairoAshraf Elbahrawy, CairoMortada Hassan El-Shabrawi, CairoMona El Said El-Raziky, CairoElrashdy M Redwan, New Borg AlrabZeinab Nabil Ahmed Said, CairoRagaa HM Salama, AssiutMaha Maher Shehata, MansouraMostafa Sira, Menofiya
Estonia
Margus Lember, TartuTamara Vorobjova, Tartu
Finland
Marko Kalliomäki, TurkuThomas Kietzmann, Oulu
Kaija-Leena Kolho, HelsinkiEija Korkeila, TurkuHeikki Makisalo, HelsinkiTanja Pessi, Tampere
France
Armando Abergel Clermont, FerrandElie K Chouillard, PolssyPierre Cordelier, ToulousePascal P Crenn, GarchesCatherine Daniel, LilleFanny Daniel, ParisCedric Dray, ToulouseBenoit Foligne, LilleJean-Noel Freund, StrasbourgNathalie Janel, ParisMajid Khatib, BordeauxJacques Marescaux, StrasbourgJean-Claude Marie, ParisHang Nguyen, Clermont-FerrandHugo Perazzo, ParisAlain L Servin, Chatenay-MalabryChang Xian Zhang, Lyon
Germany
Stavros A Antoniou, MonchengladbachErwin Biecker, SiegburgHubert E Blum, FreiburgThomas Bock, BerlinKatja Breitkopf-Heinlein, MannheimElke Cario, EssenGüralp Onur Ceyhan, MunichAngel Cid-Arregui, HeidelbergMichael Clemens Roggendorf, MünchenChristoph F Dietrich, Bad MergentheimValentin Fuhrmann, HamburgNikolaus Gassler, AachenAndreas Geier, WuerzburgMarkus Gerhard, MunichAnton Gillessen, MuensterThorsten Oliver Goetze, OffenbachDaniel Nils Gotthardt, HeidelbergRobert Grützmann, DresdenThilo Hackert, HeidelbergJoerg Haier, MuensterClaus Hellerbrand, RegensburgHarald Peter Hoensch, DarmstadtJens Hoeppner, FreiburgRichard Hummel, MuensterJakob Robert Izbicki, HamburgGernot Maximilian Kaiser, EssenMatthias Kapischke, HamburgMichael Keese, FrankfurtAndrej Khandoga, MunichJorg Kleeff, MunichAlfred Koenigsrainer, TuebingenPeter Christopher Konturek, SaalfeldMichael Linnebacher, RostockStefan Maier, KaufbeurenOliver Mann, HamburgMarc E Martignoni, MunicThomas Minor, BonnOliver Moeschler, OsnabrueckJonas Mudter, EutinSebastian Mueller, HeidelbergMatthias Ocker, Berlin
Andreas Ommer, EssenAlbrecht Piiper, FrankfurtEsther Raskopf, BonnChristoph Reichel, Bad BrückenauElke Roeb, GiessenUdo Rolle, FrankfurtKarl-Herbert Schafer, ZweibrückenAndreas G Schreyer, RegensburgManuel A Silva, PenzbergGeorgios C Sotiropoulos, EssenUlrike S Stein, BerlinDirk Uhlmann, LeipzigMichael Weiss, Halle Hong-Lei Weng, MannheimKarsten Wursthorn, Hamburg
Greece
Alexandra Alexopoulou, AthensNikolaos Antonakopoulos, AthensStelios F Assimakopoulos, PatrasGrigoris Chatzimavroudis, ThessalonikiEvangelos Cholongitas, ThessalonikiGregory Christodoulidis, LarisaGeorge N Dalekos, LarissaMaria Gazouli, AthensUrania Georgopoulou, AthensEleni Gigi, ThessalonikiStavros Gourgiotis, AthensLeontios J Hadjileontiadis, ThessalonikiThomas Hyphantis, IoanninaIoannis Kanellos, ThessalonikiStylianos Karatapanis, RhodesMichael Koutsilieris, AthensSpiros D Ladas, AthensTheodoros K Liakakos, AthensEmanuel K Manesis, AthensSpilios Manolakopoulos, AthensGerassimos John Mantzaris, AthensAthanasios D Marinis, PiraeusNikolaos Ioannis Nikiteas, AthensKonstantinos X Papamichael, AthensGeorge Sgourakis, AthensKonstantinos C Thomopoulos, PatrasKonstantinos Triantafyllou, AthensChristos Triantos, PatrasGeorgios Zacharakis, AthensPetros Zezos, AlexandroupolisDemosthenes E Ziogas, Ioannina
Guatemala
Carlos Maria Parellada, Guatemala
Hungary
Mihaly Boros, SzegedTamás Decsi, PécsGyula Farkas, SzegedAndrea Furka, DebrecenY vette Mandi, SzegedPeter L Lakatos, BudapestPal Miheller, BudapestTamás Molnar, SzegedAttila Olah, GyorMaria Papp, DebrecenZoltan Rakonczay, Szeged
March 26, 2014IIIWJG|www.wjgnet.com
Ferenc Sipos, BudapestMiklós Tanyi, DebrecenTibor Wittmann, Szeged
Iceland
Tryggvi Bjorn Stefánsson, Reykjavík
India
Brij B Agarwal, New DelhiDeepak N Amarapurkar, Mumbai Shams ul Bari, SrinagarSriparna Basu, VaranasiRunu Chakravarty, KolkataDevendra C Desai, Mumbai Nutan D Desai, MumbaiSuneela Sunil Dhaneshwar, PuneRadha K Dhiman, ChandigarhPankaj Garg, MohaliUday C Ghoshal, LucknowKalpesh Jani, VadodaraPremashis Kar, New DelhiJyotdeep Kaur, ChandigarhRakesh Kochhar, ChandigarhPradyumna K Mishra, MumbaiAsish K Mukhopadhyay, KolkataImtiyaz Murtaza, SrinagarP Nagarajan, New DelhiSamiran Nundy, DelhiGopal Pande, HyderabadBenjamin Perakath, VelloreArun Prasad, New DelhiD Nageshwar Reddy, HyderabadLekha Saha, ChandigarhSundeep Singh Saluja, New DelhiMahesh Prakash Sharma, New DelhiSadiq Saleem Sikora, BangaloreSarman Singh, New DelhiRajeev Sinha, JhansiRupjyoti Talukdar, HyderabadRakesh Kumar Tandon, New DelhiNarayanan Thirumoorthy, Coimbatore
Indonesia
David Handojo Muljono, JakartaAndi Utama, Jakarta
Iran
Arezoo Aghakhani, TehranSeyed Mohsen Dehghani, ShirazAhad Eshraghian, ShirazHossein Khedmat, TehranSadegh Massarrat, TehranMarjan Mohammadi, TehranRoja Rahimi, TehranFarzaneh Sabahi, TehranMajid Sadeghizadeh, TehranFarideh Siavoshi, Tehran
Ireland
Gary Alan Bass, Dublin
David J Brayden, DublinRonan A Cahill, DublinGlen A Doherty, DublinLiam J Fanning, CorkBarry Philip McMahon, DublinRossMcManus, DublinDervla O’Malley, CorkSinead M Smith, Dublin
Israel
Dan Carter, Ramat GanJorge-Shmuel Delgado, MetarEli Magen, AshdodNitsan Maharshak, Tel AvivShaul Mordechai, Beer ShevaMenachem Moshkowitz, Tel AvivWilliam Bahij Nseir, NazarethShimon Reif, JerusalemRam Reifen, RehovotAriella Bar-Gil Shitrit, JerusalemNoam Shussman, JerusalemIgor Sukhotnik, HaifaNir Wasserberg, Petach TiqwaJacob Yahav, RehovotDoron Levi Zamir, GederaShira Zelber-Sagi, HaifaRomy Zemel, Petach-Tikva
Italy
Ludovico Abenavoli, CatanzaroLuigi Elio Adinolfi, NaplesCarlo Virginio Agostoni, MilanAnna Alisi, RomePiero Luigi Almasio, PalermoDonato Francesco Altomare, BariAmedeo Amedei, FlorencePietro Andreone, BolognaImerio Angriman, PadovaVito Annese, FlorencePaolo Aurello, RomeSalavtore Auricchio, NaplesGian Luca Baiocchi, BresciaGianpaolo Balzano, MilanAntonio Basoli, RomeGabrio Bassotti, San SistoMauro Bernardi, BolognaAlberto Biondi, RomeEnnio Biscaldi, GenovaMassimo Bolognesi, PaduaLuigi Bonavina, MilanoAldo Bove, ChietiRaffaele Bruno, PaviaLuigi Brusciano, NapoliGiuseppe Cabibbo, PalermoCarlo Calabrese, BolognaDaniele Calistri, MeldolaVincenza Calvaruso, PalermoLorenzo Camellini, Reggio EmiliaMarco Candela, Bologna Raffaele Capasso, NaplesLucia Carulli, ModenaRenato David Caviglia, RomeLuigina Cellini, ChietiGiuseppe Chiarioni, VeronaClaudio Chiesa, RomeMichele Cicala, RomaRachele Ciccocioppo, Pavia
Sandro Contini, ParmaGaetano Corso, FoggiaRenato Costi, ParmaAlessandro Cucchetti, BolognaRosario Cuomo, NapoliGiuseppe Currò, MessinaPaola De Nardi, MilanoGiovanni D De Palma, NaplesRaffaele De Palma, NapoliGiuseppina De Petro, BresciaValli De Re, AvianoPaolo De Simone, PisaGiuliana Decorti, TriesteEmanuele Miraglia del Giudice, NapoliIsidoro Di Carlo, CataniaMatteo Nicola Dario Di Minno, NaplesMassimo Donadelli, VeronaMirko D’Onofrio, VeronaMaria Pina Dore, SassariLuca Elli, MilanoMassimiliano Fabozzi, AostaMassimo Falconi, AnconaEzio Falletto, TurinSilvia Fargion, MilanMatteo Fassan, VeronaGianfranco Delle Fave, RomaAlessandro Federico, NaplesFrancesco Feo, SassariDavide Festi, BolognaNatale Figura, SienaVincenzo Formica, RomeMirella Fraquelli, MilanMarzio Frazzoni, ModenaWalter Fries, MessinaGennaro Galizia, NaplesAndrea Galli, FlorenceMatteo Garcovich, RomeEugenio Gaudio, RomePaola Ghiorzo, GenoaEdoardo G Giannini, GenovaLuca Gianotti, MonzaMaria Cecilia Giron, PadovaAlberto Grassi, RiminiGabriele Grassi, TriesteFrancesco Greco, BergamoLuigi Greco, NaplesAntonio Grieco, RomeFabio Grizzi, RozzanoLaurino Grossi, PescaraSalvatore Gruttadauria, PalermoSimone Guglielmetti, MilanTiberiu Hershcovici, JerusalemCalogero Iacono, VeronaEnzo Ierardi, BariAmedeo Indriolo, BergamoRaffaele Iorio, NaplesPaola Iovino, SalernoAngelo A Izzo, NaplesLoreta Kondili, RomeFilippo La Torre, RomeGiuseppe La Torre, RomeGiovanni Latella, L’AquilaSalvatore Leonardi, CataniaMassimo Libra, CataniaAnna Licata, PalermoC armela Loguercio, NaplesAmedeo Lonardo, ModenaCarmelo Luigiano, CataniaFrancesco Luzza, CatanzaroGiovanni Maconi, MilanoAntonio Macrì, MessinaMariano Malaguarnera, Catania
March 26, 2014IVWJG|www.wjgnet.com
Francesco Manguso, NapoliTommaso Maria Manzia, RomeDaniele Marrelli, SienaGabriele Masselli, RomeSara Massironi, MilanGiuseppe Mazzarella, AvellinoMichele Milella, RomeGiovanni Milito, RomeAntonella d’Arminio Monforte, MilanFabrizio Montecucco, GenoaGiovanni Monteleone, RomeMario Morino, TorinoVincenzo La Mura, MilanGerardo Nardone, NaplesRiccardo Nascimbeni, BresciaGabriella Nesi, FlorenceGiuseppe Nigri, RomeErica Novo, TurinVeronica Ojetti, RomeMichele Orditura, NaplesFabio Pace, SeriateLucia Pacifico, RomeOmero Alessandro Paoluzi, RomeValerio Pazienza, San Giovanni RotondoRinaldo Pellicano, TurinAdriano M Pellicelli, RomeNadia Peparini, CiampinoMario Pescatori, RomeAntonio Picardi, RomeAlberto Pilotto, PadovaAlberto Piperno, MonzaAnna Chiara Piscaglia, RomeMaurizio Pompili, RomeFrancesca Romana Ponziani, RomeCosimo Prantera, RomeGirolamo Ranieri, BariCarlo Ratto, TomeBarbara Renga, PerugiaAlessandro Repici, RozzanoMaria Elena Riccioni, RomeLucia Ricci-Vitiani, RomeLuciana Rigoli, MessinaMario Rizzetto, TorinoBallarin Roberto, ModenaRoberto G Romanelli, FlorenceClaudio Romano, MessinaLuca Roncucci, ModenaCesare Ruffolo, TrevisoL ucia Sacchetti, NapoliRodolfo Sacco, PisaLapo Sali, FlorenceRomina Salpini, RomeGiulio Aniello, Santoro TrevisoArmando Santoro, RozzanoEdoardo Savarino, PaduaMarco Senzolo, PaduaAnnalucia Serafino, RomeGiuseppe S Sica, RomePierpaolo Sileri, RomeCosimo Sperti, PaduaVincenzo Stanghellini, BolognaCristina Stasi, FlorenceGabriele Stocco, TriesteRoberto Tarquini, FlorenceMario Testini, BariGuido Torzilli, MilanGuido Alberto Massimo, Tiberio BresciaGiuseppe Toffoli, AvianoAlberto Tommasini, TriesteFrancesco Tonelli, FlorenceCesare Tosetti Porretta, TermeLucio Trevisani, Cona
Guglielmo M Trovato, CataniaMariapia Vairetti, PaviaLuca Vittorio Valenti, MilanoMariateresa T Ventura, BariGiuseppe Verlato, VeronaAlessandro Vitale, PadovaMarco Vivarelli, AnconaGiovanni Li Volti, CataniaGiuseppe Zanotti, PaduaVincenzo Zara, LecceGianguglielmo Zehender, MilanAnna Linda Zignego, FlorenceRocco Antonio Zoccali, MessinaAngelo Zullo, Rome
Japan
Yasushi Adachi, SapporoTakafumi Ando, NagoyaMasahiro Arai, TokyoMakoto Arai, ChibaTakaaki Arigami, KagoshimaItaru Endo,YokohamaMunechika Enjoji, FukuokaShunji Fujimori, TokyoYasuhiro Fujino, AkashiToshiyoshi Fujiwara, OkayamaYosuke Fukunaga, TokyoToshio Fukusato, TokyoTakahisa Furuta, HamamatsuOsamu Handa, KyotoNaoki Hashimoto, OsakaYoichi Hiasa, ToonMasatsugu Hiraki, SagaSatoshi Hirano, SapporoKeiji Hirata, FukuokaToru Hiyama, HigashihiroshimaAkira Hokama, NishiharaShu Hoteya, TokyoMasao Ichinose, WakayamaTatsuya Ide, KurumeMasahiro Iizuka, AkitaToshiro Iizuka, TokyoKenichi Ikejima, TokyoTetsuya Ikemoto, TokushimaHiroyuki Imaeda, SaitamaAtsushi Imagawa, Kan-onjiHiroo Imazu, TokyoAkio Inui, KagoshimaShuji Isaji, TsuToru Ishikawa, NiigataToshiyuki Ishiwata, TokyoSoichi Itaba, KitakyushuYoshiaki Iwasaki, OkayamaTatehiro Kagawa, IseharaSatoru Kakizaki, MaebashiNaomi Kakushima, ShizuokaTerumi Kamisawa, TokyoAkihide Kamiya, IseharaOsamu Kanauchi, TokyoTatsuo Kanda, ChibaShin Kariya, OkayamaShigeyuki Kawa, MatsumotoTakumi Kawaguchi, KurumeTakashi Kawai, TokyoSoo Ryang Kim, KobeShinsuke Kiriyama, GunmaTsuneo Kitamura, UrayasuMasayuki Kitano, OsakasayamaHirotoshi Kobayashi, TokyoHironori Koga, Kurume
Takashi Kojima, SapporoSatoshi Kokura, KyotoShuhei Komatsu, KyotoTadashi Kondo, TokyoYasuteru Kondo, SendaiYasuhiro Kuramitsu, YamaguchiYukinori Kurokawa, OsakaShin Maeda, YokohamaKoutarou Maeda, ToyoakeHitoshi Maruyama, ChibaAtsushi Masamune, SendaiHiroyuki Matsubayashi, SuntogunAkihisa Matsuda, InzaiHirofumi Matsui, TsukubaAkira Matsumori, KyotoYoichi Matsuo, NagoyaY Matsuzaki, AmiToshihiro Mitaka, SapporoKouichi Miura, AkitaShinichi Miyagawa, MatumotoEiji Miyoshi, SuitaToru Mizuguchi, SapporoNobumasa Mizuno, NagoyaZenichi Morise, NagoyaTomohiko Moriyama, FukuokaKunihiko Murase, Tusima Michihiro Mutoh, TsukijiAkihito Nagahara, TokyoHikaru Nagahara, TokyoHidenari Nagai, TokyoKoichi Nagata, Shimotsuke-shiMasaki Nagaya, KawasakiHisato Nakajima, Nishi-ShinbashiToshifusa Nakajima, TokyoHiroshi Nakano, KawasakiHiroshi Nakase, KyotoToshiyuki Nakayama, NagasakiTakahiro Nakazawa, NagoyaShoji Natsugoe, Kagoshima CityTsutomu Nishida, SuitaShuji Nomoto, NaogyaSachiyo Nomura, TokyoTakeshi Ogura, TakatsukishiNobuhiro Ohkohchi, TsukubaToshifumi Ohkusa, KashiwaHirohide Ohnishi, AkitaTeruo Okano, TokyoSatoshi Osawa, HamamatsuMotoyuki Otsuka, TokyoMichitaka Ozaki, SapporoSatoru Saito, YokohamaChouhei Sakakura, KyotoNaoaki Sakata, SendaiKen Sato, MaebashiToshiro Sato, TokyoTomoyuki Shibata, ToyoakeH Shimada, TokyoTomohiko Shimatani, KureYukihiro Shimizu, NantoTadashi Shimoyama, HirosakiMasayuki Sho, NaraIkuo Shoji, KobeAtsushi Sofuni, TokyoTakeshi Suda, NiigataM Sugimoto, HamamatsuKen Sugimoto, HamamatsuHaruhiko Sugimura, HamamatsuShoichiro Sumi, KyotoHidekazu Suzuki, TokyoMasahiro Tajika, NagoyaHitoshi Takagi, TakasakiToru Takahashi, Niigata
March 26, 2014VWJG|www.wjgnet.com
Yoshihisa Takahashi, TokyoShinsuke Takeno, FukuokaAkihiro Tamori, OsakaKyosuke Tanaka, TsuShinji Tanaka, HiroshimaAtsushi Tanaka, TokyoYasuhito Tanaka, NagoyaShinji Tanaka, TokyoMinoru Tomizawa, Yotsukaido CityKyoko Tsukiyama-Kohara, KagoshimaTakuya Watanabe, NiigataKazuhiro Watanabe, SendaiSatoshi Yamagiwa, NiigataTakayuki Yamamoto, YokkaichiHiroshi Yamamoto, OtsuKosho Yamanouchi, NagasakiIchiro Yasuda, GifuYutaka Yata, Maebashi-cityShin-ichi Yokota, SapporoNorimasa Yoshida, KyotoHiroshi Yoshida, Tama-CityHitoshi Yoshiji, KashiharaKazuhiko Yoshimatsu, TokyoKentaro Yoshioka, ToyoakeNobuhiro Zaima, Nara
Jordan
Khaled Ali Jadallah, Irbid
Kuwait
Islam Khan, Kuwait
Lebanon
Bassam N Abboud, BeirutKassem A Barada, BeirutMarwan Ghosn, BeirutIyad A Issa, BeirutFadi H Mourad, BeirutAIa Sharara, BeirutRita Slim, Beirut
Lithuania
Antanas Mickevicius, Kaunas
Malaysia
Huck Joo Tan, Petaling Jaya
Mexico
Richard A Awad, Mexico CityCarlos R Camara-Lemarroy, MonterreyNorberto C Chavez-Tapia, Mexico CityWolfgang Gaertner, Mexico CityDiego Garcia-Compean, MonterreyArturo Panduro, GuadalajaraOT Teramoto-Matsubara, Mexico CityFelix Tellez-Avila, Mexico CityOmar Vergara-Fernandez, Mexico CitySaúl Villa-Trevino, Cuidad de México
Morocco
Samir Ahboucha, Khouribga
Netherlands
Robert J de Knegt, RotterdamTom Johannes Gerardus Gevers, NijmegenMenno Hoekstra, LeidenBW Marcel Spanier, ArnhemKarel van Erpecum, Utrecht
New Zealand
Leo K Cheng, AucklandAndrew Stewart Day, ChristchurchJonathan Barnes Koea, AucklandMax Petrov, Auckland
Nigeria
Olufunmilayo Adenike Lesi, LagosJesse Abiodun Otegbayo, IbadanStella Ifeanyi Smith, Lagos
Norway
Trond Berg, OsloTrond Arnulf Buanes, KrokkleivaThomas de Lange, RudMagdy El-Salhy, StordRasmus Goll, TromsoDag Arne Lihaug Hoff, Aalesund
Pakistan
Zaigham Abbas, KarachiUsman A Ashfaq, FaisalabadMuhammad Adnan Bawany, HyderabadMuhammad Idrees, LahoreSaeed Sadiq Hamid, KarachiYasir Waheed, Islamabad
Poland
Thomas Brzozowski, CracowMagdalena Chmiela, LodzKrzysztof Jonderko, SosnowiecAnna Kasicka-Jonderko, SosnowiecMichal Kukla, KatowiceTomasz Hubert Mach, KrakowAgata Mulak, WroclawDanuta Owczarek, KrakówPiotr Socha, WarsawPiotr Stalke, GdanskJulian Teodor Swierczynski, GdanskAnna M Zawilak-Pawlik, Wroclaw
Portugal
Marie Isabelle Cremers, Setubal
Ceu Figueiredo, PortoAna Isabel Lopes, LIsbonM Paula Macedo, LisboaRicardo Marcos, PortoRui T Marinho, LisboaGuida Portela-Gomes, EstorilFilipa F Vale, Lisbon
Puerto Rico
Caroline B Appleyard, Ponce
Qatar
Abdulbari Bener, Doha
Romania
Mihai Ciocirlan, BucharestDan LucianDumitrascu, Cluj-NapocaCarmen Fierbinteanu-Braticevici, BucharestRomeo G Mihaila, SibiuLucian Negreanu, BucharestAdrian Saftoiu, CraiovaAndrada Seicean, Cluj-NapocaIoan Sporea, TimisoaraLetiţia Adela Maria Streba, CraiovaAnca Trifan, Iasi
Russia
Victor Pasechnikov, StavropolVasiliy Ivanovich Reshetnyak, MoscowVitaly Skoropad, Obninsk
Saudi Arabia
Abdul-Wahed N Meshikhes, DammamM Ezzedien Rabie, Khamis Mushait
Singapore
Brian KP Goh, SingaporeRichie Soong, SingaporeKer-Kan Tan, SingaporeKok-Yang Tan, SingaporeYee-Joo Tan, SingaporeMark Wong, SingaporeHong Ping Xia, Singapore
Slovenia
Matjaz Homan, LjubljanaMartina Perse, Ljubljana
South Korea
Sang Hoon Ahn, SeoulSoon Koo Baik, WonjuSoo-Cheon Chae, IksanByung-Ho Choe, Daegu
March 26, 2014VIWJG|www.wjgnet.com
Suck Chei Choi, IksanHoon Jai Chun, SeoulYeun-Jun Chung, SeoulYoung-Hwa Chung, SeoulKi-Baik Hahm, SeongnamSang Young Han, BusanSeok Joo Han, SeoulSeung-Heon Hong, IksanJin-Hyeok Hwang, SeoungnamJeong Won Jang, SeoulJin-Young Jang, SeoulDae-Won Jun, SeoulYoung Do Jung, KwangjuGyeong Hoon Kang, SeoulSung-Bum Kang, SeoulKoo Jeong Kang, DaeguKi Mun Kang, JinjuChang Moo Kang, Seodaemun-guGwang Ha Kim, BusanSang Soo Kim, Goyang-siJin Cheon Kim, SeoulTae Il Kim, SeoulJin Hong Kim, SuwonKyung Mo Kim, SeoulKyongmin Kim, SuwonHyung-Ho Kim, SeongnamSeoung Hoon Kim, GoyangSang Il Kim, SeoulHyun-Soo Kim, WonjuJung Mogg Kim, Seoul Dong Yi Kim, GwangjuKyun-Hwan Kim, SeoulJong-Han Kim, AnsanJa-Lok Ku, SeoulKyu Taek Lee, SeoulHae-Wan Lee, ChuncheonInchul Lee, SeoulJung Eun Lee, SeoulSang Chul Lee, DaejeonSong Woo Lee, Ansan-siHyuk-Joon Lee, SeoulSeong-Wook Lee, YonginKil Yeon Lee, SeoulJong-Inn Lee, SeoulKyung A Lee, SeoulJong-Baeck Lim, SeoulEun-Yi Moon, SeoulSH Noh, SeoulSeung Woon Paik, SeoulWon Sang Park, SeoulSung-Joo Park, IksanKyung Sik Park, DaeguSe Hoon Park, SeoulYoonkyung Park, GwangjuSeung-Wan Ryu, DaeguDong Wan Seo, SeoulIl Han Song, CheonanMyeong Jun Song, DaejeonYun Kyoung Yim, DaejeonDae-Yeul Yu Daejeon
Spain
Mariam Aguas, ValenciaRaul J Andrade, MálagaAntonio Arroyo, ElcheJosep M Bordas, BarcelonaLisardo Boscá, MadridRicardo Robles Campos, Murcia
Jordi Camps, ReusCarlos Cervera BarcelonaAlfonso Clemente, Granada Pilar Codoner-Franch, ValenciaFernando J Corrales, PamplonaFermin Sánchez de Medina, GranadaAlberto Herreros de Tejada, MajadahondaEnrique de-Madaria, AlicanteJE Dominguez-Munoz, Santiago de CompostelaVicente Felipo, ValenciaCM Fernandez-Rodriguez, MadridCarmen Frontela-Saseta, MurciaJulio Galvez, GranadaMaria Teresa García, VigoMI Garcia-Fernandez, MálagaEmilio Gonzalez-Reimers, La LagunaMarcel Jimenez, BellaterraAngel Lanas, ZaragozaJuan Ramón Larrubia, GuadalajaraAntonio Lopez-Sanroman, MadridVicente Lorenzo-Zuniga, BadalonaAlfredo J Lucendo, TomellosoVicenta Soledad Martinez-Zorzano, VigoJosé Manuel Martin-Villa, MadridJulio Mayol, MadridManuel Morales-Ruiz, BarcelonaAlfredo Moreno-Egea, MurciaAlbert Pares, BarcelonaMaria Pellise, BarcelonaJosé Perea, MadridMiguel Angel Plaza, ZaragozaMaría J Pozo, CáceresEnrique Quintero, La LagunaJose M Ramia, MadridFrancisco Rodriguez-Frias, BarcelonaSilvia Ruiz-Gaspa, BarcelonaXavier Serra-Aracil, BarcelonaVincent Soriano, MadridJavier Suarez, PamplonaCarlos Taxonera, MadridM Isabel Torres, JaénManuel Vazquez-Carrera, BarcelonaBenito Velayos, ValladolidSilvia Vidal, Barcelona
Sri Lanka
Arjuna Priyadarsin De Silva, Colombo
Sudan
Ishag Adam, Khartoum
Sweden
Roland G Andersson, LundBergthor Björnsson, LinkopingJohan Christopher Bohr, ÖrebroMauro D’Amato, StockholmThomas Franzen, NorrkopingEvangelos Kalaitzakis, LundRiadh Sadik, GothenburgPer Anders Sandstrom, LinkopingErvin Toth, MalmöKonstantinos Tsimogiannis, Vasteras
Apostolos V Tsolakis, Uppsala
Switzerland
Gieri Cathomas, LiestalJean Louis Frossard, GeneveChristian Toso, GenevaStephan Robert Vavricka, ZurichDominique Velin, Lausanne
Thailand
Thawatchai Akaraviputh, BangkokP Yoysungnoen Chintana, PathumthaniVeerapol Kukongviriyapan, MuangVijittra Leardkamolkarn, BangkokVarut Lohsiriwat, BangkokSomchai Pinlaor, Khaon KaenD Wattanasirichaigoon, Bangkok
Trinidad and Tobago
B Shivananda Nayak, Mount Hope
Tunisia
Ibtissem Ghedira, SousseLilia Zouiten-Mekki, Tunis
Turkey
Sami Akbulut, DiyarbakirInci Alican, IstanbulMustafa Altindis, SakaryaMutay Aslan, AntalyaOktar Asoglu, IstanbulYasemin Hatice Balaban, IstanbulMetin Basaranoglu, AnkaraYusuf Bayraktar, Ankara Süleyman Bayram, AdiyamanAhmet Bilici, IstanbulAhmet Sedat Boyacioglu, AnkaraZüleyha Akkan Cetinkaya, Kocaeli Cavit Col, BoluYasar Colak, IstanbulCagatay Erden Daphan, KirikkaleMehmet Demir, HatayAhmet Merih Dobrucali, IstanbulGülsüm Ozlem Elpek, AntalyaAyse Basak Engin, AnkaraEren Ersoy, AnkaraOsman Ersoy, AnkaraYusuf Ziya Erzin, IstanbulMukaddes Esrefoglu, IstanbulLevent Filik, AnkaraOzgur Harmanci, AnkaraKoray Hekimoglu, AnkaraAbdurrahman Kadayifci, GaziantepCem Kalayci, IstanbulSelin Kapan, IstanbulHuseyin Kayadibi, AdanaSabahattin Kaymakoglu, IstanbulMetin Kement, IstanbulMevlut Kurt, BoluResat Ozaras, Istanbul
March 26, 2014VIIWJG|www.wjgnet.com
Elvan Ozbek, AdapazariCengiz Ozcan, MersinHasan Ozen, AnkaraHalil Ozguc, BursaMehmet Ozturk, IzmirOrhan V Ozkan, SakaryaSemra Paydas, AdanaOzlem Durmaz Suoglu, IstanbulIlker Tasci, AnkaraMüge Tecder-ünal, AnkaraMesut Tez, AnkaraSerdar Topaloglu, TrabzonMurat Toruner, AnkaraGokhan Tumgor, AdanaOguz Uskudar, AdanaMehmet Yalniz, ElazigMehmet Yaman, ElazigVeli Yazisiz, AntalyaYusuf Yilmaz, IstanbulOzlem Yilmaz, IzmirOya Yucel, IstanbulIlhami Yuksel, Ankara
United Kingdom
Nadeem Ahmad Afzal, SouthamptonNavneet K Ahluwalia, StockportYeng S Ang, LancashireRamesh P Arasaradnam, CoventryIan Leonard Phillip Beales, NorwichJohn Beynon, SwanseaBarbara Braden, OxfordSimon Bramhall, BirminghamGeoffrey Burnstock, LondonIan Chau, SuttonThean Soon Chew, LondonHelen G Coleman, BelfastAnil Dhawan, LondonSunil Dolwani, CardiffPiers Gatenby, LondonAnil T George, LondonPasquale Giordano, LondonPaul Henderson, EdinburghGeorgina Louise Hold, AberdeenStefan Hubscher, BirminghamRobin D Hughes, LondonNusrat Husain, ManchesterMatt W Johnson, LutonKonrad Koss, MacclesfieldAnastasios Koulaouzidis, EdinburghSimon Lal, SalfordJohn S Leeds, AberdeenHongxiang Liu, CambridgeMichael Joseph McGarvey, LondonMichael Anthony Mendall, LondonAlexander H Mirnezami, SouthamptonJ Bernadette Moore, GuildfordClaudio Nicoletti, NorwichSavvas Papagrigoriadis, LondonDavid Mark Pritchard, LiverpoolJames A Ross, EdinburghKamran Rostami, WorcesterXiong Z Ruan, LondonDina Tiniakos, Newcastle upon TyneFrank I Tovey, LondonDhiraj Tripathi, Birmingham Vamsi R Velchuru, Great YarmouthNicholas T Ventham, EdinburghDiego Vergani, LondonJack Westwood Winter, Glasgow
Terence Wong, LondonLing Yang, Oxford
United States
Daniel E Abbott, CincinnatiGhassan K Abou-Alfa, New YorkJulian Abrams, New YorkDavid William Adelson, Los AngelesJonathan Steven Alexander, ShreveportTauseef Ali, Oklahoma CityMohamed R Ali, SacramentoRajagopal N Aravalli, MinneapolisHassan Ashktorab, WashingtonShashi Bala, WorcesterCharles F Barish, RaleighP Patrick Basu, New YorkRobert L Bell, Berkeley HeightsDavid Bentrem, ChicagoHenry J Binder, New HavenJoshua Bleier, PhiladelphiaWojciech Blonski, Johnson CityKenneth Boorom, CorvallisBrian Boulay, ChicagoCarla W Brady, DurhamKyle E Brown, Iowa CityAdeel AButt, PittsburghWeibiao Cao, ProvidenceAndrea Castillo, CheneyFernando J Castro, WestonAdam S Cheifetz, BostonAdam S Cheifetz, BostonXiaoxin Luke Chen, DurhamRamsey Cheung, Palo AltoParimal Chowdhury, Little RockEdward John Ciaccio, New YorkDahn L Clemens, OmahaYingzi Cong, GalvestonLaura Iris Cosen-Binker, BostonJoseph John Cullen, LowaMark J Czaja, BronxMariana D Dabeva, BronxChristopher James Damman, SeattleIsabelle G De Plaen, ChicagoAbhishek Deshpande, ClevelandPunita Dhawan, NashvilleHui Dong, La JollaWael El-Rifai, NashvilleSukru H Emre, New HavenPaul Feuerstadt, HamdenJosef E Fischer, BostonLaurie N Fishman, BostonJoseph Che Forbi, AtlantaTemitope Foster, AtlantaAmyEFoxx-Orenstein, ScottsdaleDaniel E Freedberg, New YorkShai Friedland, Palo AltoVirgilio George, IndianapolisAjay Goel, DallasOliver Grundmann, GainesvilleStefano Guandalini, ChicagoChakshu Gupta, St. JosephGrigoriy E Gurvits, New YorkXiaonan Han, CincinnatiMohamed Hassan, JacksonMartin Hauer-Jensen, Little RockKoichi Hayano, BostonYingli Hee, AtlantaSamuel B Ho, San Diego
Jason Ken Hou, HoustonLifang Hou, ChicagoK-Qin Hu, OrangeJamal A Ibdah, ColumbiaRobert Thomas Jensen, BethesdaHuanguang “Charlie” Jia, GainesvilleRome Jutabha, Los AngelesAndreas M Kaiser, Los AngelesAvinash Kambadakone, BostonDavid Edward Kaplan, PhiladelphiaRandeep Kashyap, RochesterRashmi Kaul, TulsaAli Keshavarzian, ChicagoAmir Maqbul Khan, MarshallNabeel Hasan Khan, New OrleansSahil Khanna, RochesterKusum K Kharbanda, OmahaHyun Sik Kim, PittsburghJoseph Kim, DuarteJae S Kim, GainesvilleMiran Kim, ProvidenceTimothy R Koch, WashingtonBurton I Korelitz, New YorkBetsy Kren, MinneapolisShiu-Ming Kuo, BuffaloMichelle Lai, BostonAndreas Larentzakis, BostonEdward Wolfgang Lee, Los AngelesDaniel A Leffler, BostonMichael Leitman, New YorkSuthat Liangpunsakul, IndianapolisJoseph K Lim, New HavenElaine Y Lin, BronxHenry C Lin, AlbuquerqueRohit Loomba, La JollaJames David Luketich, PittsburghMohammad F Madhoun, Oklahoma CityThomas C Mahl, BuffaloAshish Malhotra, BettendorfPranoti Mandrekar, WorcesterJohn Marks, WynnewoodWendy M Mars, PittsburghJulien Vahe Matricon, San AntonioCraig J McClain, LouisvilleGeorge K Michalopoulos, PittsburghTamir Miloh, PhoenixAyse Leyla Mindikoglu, BaltimoreHuanbiao Mo, DentonKlaus Monkemuller, BirminghamJohn Morton, StanfordAdnan Muhammad, TampaMichael J Nowicki, JacksonPatrick I Okolo, BaltimoreGiusepp Orlando, Winston SalemNatalia A Osna, OmahaVirendra N Pandey, NewarkMansour A Parsi, Cleveland Michael F Picco, JacksonvilleDaniel S Pratt, BostonXiaofa Qin, NewarkJanardan K Reddy, ChicagoVictor E Reyes, GalvestonJon Marc Rhoads, HoustonGiulia Roda, New YorkJean-Francois Armand Rossignol, TampaPaul A Rufo, BostonMadhusudana Girija Sanal, New York Miguel Saps, ChicagoSushil Sarna, GalvestonAnn O Scheimann, BaltimoreBernd Schnabl, La Jolla
March 26, 2014VIIIWJG|www.wjgnet.com
Matthew J Schuchert, PittsburghEkihiro Seki, La JollaChanjuan Shi, NashvilleDavid Quan Shih, Los AngelesWilliam B Silverman, Iowa CityShashideep Singhal, New YorkBronislaw L Slomiany, NewarkSteven F Solga, BethlehemByoung-Joon Song, BethesdaDario Sorrentino, RoanokeScott R Steele, Fort LewisBranko Stefanovic, TallahasseeArun Swaminath, New YorkKazuaki Takabe, RichmondNaoki Tanaka, BethesdaHans Ludger Tillmann, Durham
George Triadafilopoulos, StanfordJohn Richardson Thompson, NashvilleAndrew Ukleja, WestonMiranda AL van Tilburg, Chapel HillGilberto Vaughan, AtlantaVijayakumar Velu, AtlantaGebhard Wagener, New YorkKasper Saonun Wang, Los AngelesXiangbing Wang, New BrunswickDaoyan Wei, HoustonTheodore H Welling, Ann ArborC Mel Wilcox, BirminghamJacqueline Lee Wolf, BostonLaura Ann Woollett, CincinnatiHarry Hua-Xiang Xia, East HanoverWen Xie, Pittsburgh
Guang Yu Yang, ChicagoMichele T Yip-Schneider, IndianapolisKezhong Zhang, DetroitHuiping Zhou, RichmondXiao-Jian Zhou, CambridgeRichard Zubarik, Burlington
Venezuela
Miguel Angel Chiurillo, Barquisimeto
Vietnam
Van Bang Nguyen, Hanoi
March 26, 2014IXWJG|www.wjgnet.com
S
REVIEW8263 Clinicalepidemiologyanddiseaseburdenofnonalcoholicfattyliverdisease
Perumpail BJ, Khan MA, Yoo ER, Cholankeril G, Kim D, Ahmed A
MINIREVIEWS8277 Obesechildrenwithfattyliver:Betweenrealityanddiseasemongering
Ranucci G, Spagnuolo MI, Iorio R
8283 Procalcitoninininflammatoryboweldisease:Drawbacksandopportunities
Lippi G, Sanchis-Gomar F
ORIGINAL ARTICLEBasic Study
8291 Genemutationsinstoolfromgastricandcolorectalneoplasiapatientsbynext-generationsequencing
Youssef O, Sarhadi V, Ehsan H, Böhling T, Carpelan-Holmström M, Koskensalo S, Puolakkainen P, Kokkola A, Knuutila S
8300 Polymorphismsinoxidativepathwayrelatedgenesandsusceptibilitytoinflammatoryboweldisease
Senhaji N, Nadifi S, Zaid Y, Serrano A, Rodriguez DAL, Serbati N, Karkouri M, Badre W, Martín J
8308 EffectsofinitiatingtimeanddosageofPanaxnotoginseng onmucosalmicrovascularinjuryin
experimentalcolitis
Wang SY, Tao P, Hu HY, Yuan JY, Zhao L, Sun BY, Zhang WJ, Lin J
8321 Fructo-oligosaccharideintensifiesvisceralhypersensitivityandintestinalinflammationinastress-induced
irritablebowelsyndromemousemodel
Chen BR, Du LJ, He HQ, Kim JJ, Zhao Y, Zhang YW, Luo L, Dai N
8334 MorinenhanceshepaticNrf2expressioninaliverfibrosisratmodel
Sang L, Wang XM, Xu DY, Sang LX, Han Y, Jiang LY
8345 CircularRNAcirc-LDLRAD3asabiomarkerindiagnosisofpancreaticcancer
Yang F, Liu DY, Guo JT, Ge N, Zhu P, Liu X, Wang S, Wang GX, Sun SY
Case Control Study
8355 Rifaximinameliorateshepaticencephalopathyandendotoxemiawithoutaffectingthegutmicrobiome
diversity
Kaji K, Takaya H, Saikawa S, Furukawa M, Sato S, Kawaratani H, Kitade M, Moriya K, Namisaki T, Akahane T, Mitoro A,
Yoshiji H
Contents Weekly Volume 23 Number 47 December 21, 2017
� December 21, 2017|Volume 23|�ssue 47|WJG|www.wjgnet.com
ContentsWorld Journal of Gastroenterology
Volume 23 Number 47 December 21, 2017
Retrospective Study
8367 Associationbetweenwhiteopaquesubstanceundermagnifyingcolonoscopyandlipiddropletsin
colorectalepithelialneoplasms
Kawasaki K, Eizuka M, Nakamura S, Endo M, Yanai S, Akasaka R, Toya Y, Fujita Y, Uesugi N, Ishida K, Sugai T, Matsumoto T
8376 Nomogrambasedontumor-associatedneutrophil-to-lymphocyteratiotopredictsurvivalofpatientswith
gastricneuroendocrineneoplasms
Cao LL, Lu J, Lin JX, Zheng CH, Li P, Xie JW, Wang JB, Chen QY, Lin M, Tu RH, Huang CM
8387 Impactofcigarettesmokingonrecurrenceofhyperlipidemicacutepancreatitis
Xiang JX, Hu LS, Liu P, Tian BY, Su Q, Ji YC, Zhang XF, Liu XM, Wu Z, Lv Y
Clinical Trials Study
8395 First-weekclinicalresponsestodexlansoprazole60mgandesomeprazole40mgforthetreatmentofgrades
AandBgastroesophagealrefluxdisease
Liang CM, Kuo MT, Hsu PI, Kuo CH, Tai WC, Yang SC, Wu KL, Wang HM, Yao CC, Tsai CE, Wang YK, Wang JW,
Huang CF, Wu DC, Chuah SK; Taiwan Acid-Related Disease Study Group
Observational Study
8405 Rateofadverseeventsofgastroduodenalsnarepolypectomyfornon-flatpolypislow:Aprospectiveand
multicenterstudy
Córdova H, Argüello L, Loras C, Naranjo Rodríguez A, Riu Pons F, Gornals JB, Nicolás-Pérez D, Andújar Murcia X,
Hernández L, Santolaria S, Leal C, Pons C, Pérez-Cuadrado-Robles E, García-Bosch O, Papo Berger M, Ulla Rocha JL,
Sánchez-Montes C, Fernández-Esparrach G
META-ANALYSIS8415 Chronickidneydiseaseseverelydeterioratestheoutcomeofgastrointestinalbleeding:Ameta-analysis
Hágendorn R, Farkas N, Vincze Á, Gyöngyi Z, Csupor D, Bajor J, Erőss B, Csécsei P, Vasas A, Szakács Z, Szapáry L,
Hegyi P, Mikó A
CASE REPORT8426 Disablingportosystemicencephalopathyinanon-cirrhoticpatient:Successfulendovasculartreatmentofa
giantinferiormesenteric-cavalshuntvia theleftinternaliliacvein
de Martinis L, Groppelli G, Corti R, Moramarco LP, Quaretti P, De Cata P, Rotondi M, Chiovato L
8432 Wernickeencephalopathyinapatientafterlivertransplantation:Acasereport
Xie B, Si ZZ, Tang WT, Qi HZ, Li T
LETTERS TO THE EDITOR8437 Silymarin:Anoptiontotreatnon-alcoholicfattyliverdisease
Colica C, Boccuto L, Abenavoli L
�� December 21, 2017|Volume 23|�ssue 47|WJG|www.wjgnet.com
NAMEOFJOURNALWorld Journal of Gastroenterology
ISSNISSN 1007-9327 (print)ISSN 2219-2840 (online)
LAUNCHDATEOctober 1, 1995
FREQUENCYWeekly
EDITORS-IN-CHIEFDamian Garcia-Olmo, MD, PhD, Doctor, Profes-sor, Surgeon, Department of Surgery, Universidad Autonoma de Madrid; Department of General Sur-gery, Fundacion Jimenez Diaz University Hospital, Madrid 28040, Spain
Stephen C Strom, PhD, Professor, Department of Laboratory Medicine, Division of Pathology, Karo-linska Institutet, Stockholm 141-86, Sweden
Andrzej S Tarnawski, MD, PhD, DSc (Med), Professor of Medicine, Chief Gastroenterology, VA Long Beach Health Care System, University of Cali-fornia, Irvine, CA, 5901 E. Seventh Str., Long Beach,
CA 90822, United States
EDITORIALBOARDMEMBERSAll editorial board members resources online at http://www.wjgnet.com/1007-9327/editorialboard.htm
EDITORIALOFFICEJin-Lei Wang, DirectorZe-Mao Gong, Vice DirectorWorld Journal of GastroenterologyBaishideng Publishing Group Inc7901 Stoneridge Drive, Suite 501, Pleasanton, CA 94588, USATelephone: +1-925-2238242Fax: +1-925-2238243E-mail: [email protected] Desk: http://www.f6publishing.com/helpdeskhttp://www.wjgnet.com
PUBLISHERBaishideng Publishing Group Inc7901 Stoneridge Drive, Suite 501, Pleasanton, CA 94588, USATelephone: +1-925-2238242Fax: +1-925-2238243E-mail: [email protected] Desk: http://www.f6publishing.com/helpdesk
Contents
EDITORS FOR THIS ISSUE
Responsible Assistant Editor: Xiang Li Responsible Science Editor: Ze-Mao GongResponsible Electronic Editor: Yan Huang Proofing Editorial Office Director: Jin-Lei WangProofing Editor-in-Chief: Lian-Sheng Ma
http://www.wjgnet.com
PUBLICATIONDATEDecember 21, 2017
COPYRIGHT© 2017 Baishideng Publishing Group Inc. Articles pub-lished by this Open-Access journal are distributed under the terms of the Creative Commons Attribution Non-commercial License, which permits use, distribution, and reproduction in any medium, provided the original work is properly cited, the use is non commercial and is otherwise in compliance with the license.
SPECIALSTATEMENTAll articles published in journals owned by the Baishideng Publishing Group (BPG) represent the views and opin-ions of their authors, and not the views, opinions or policies of the BPG, except where otherwise explicitly indicated.
INSTRUCTIONSTOAUTHORSFull instructions are available online at http://www.wjgnet.com/bpg/gerinfo/204
ONLINESUBMISSIONhttp://www.f6publishing.com
World Journal of GastroenterologyVolume 23 Number 47 December 21, 2017
Editorial boardmember ofWorld Journal ofGastroenterology , YoshihisaTakahashi,MD,AssociateProfessor,DepartmentofPathology,TeikyoUniversitySchoolofMedicine,Tokyo173-8605,Japan
World Journal of Gastroenterology (World J Gastroenterol, WJG, print ISSN 1007-9327, online ISSN 2219-2840, DOI: 10.3748) is a peer-reviewed open access journal. WJG was estab-lished on October 1, 1995. It is published weekly on the 7th, 14th, 21st, and 28th each month. The WJG Editorial Board consists of 1375 experts in gastroenterology and hepatology from 68 countries. The primary task of WJG is to rapidly publish high-quality original articles, reviews, and commentaries in the fields of gastroenterology, hepatology, gastrointestinal endos-copy, gastrointestinal surgery, hepatobiliary surgery, gastrointestinal oncology, gastroin-testinal radiation oncology, gastrointestinal imaging, gastrointestinal interventional ther-apy, gastrointestinal infectious diseases, gastrointestinal pharmacology, gastrointestinal pathophysiology, gastrointestinal pathology, evidence-based medicine in gastroenterol-ogy, pancreatology, gastrointestinal laboratory medicine, gastrointestinal molecular biol-ogy, gastrointestinal immunology, gastrointestinal microbiology, gastrointestinal genetics, gastrointestinal translational medicine, gastrointestinal diagnostics, and gastrointestinal therapeutics. WJG is dedicated to become an influential and prestigious journal in gas-troenterology and hepatology, to promote the development of above disciplines, and to improve the diagnostic and therapeutic skill and expertise of clinicians.
World Journal of Gastroenterology (WJG) is now indexed in Current Contents®/Clinical Medicine, Science Citation Index Expanded (also known as SciSearch®), Journal Citation Reports®, Index Medicus, MEDLINE, PubMed, PubMed Central and Directory of Open Access Journals. The 2017 edition of Journal Citation Reports® cites the 2016 impact factor for WJG as 3.365 (5-year impact factor: 3.176), ranking WJG as 29th among 79 journals in gastroenterology and hepatol-ogy (quartile in category Q2).
I-IX EditorialBoard
ABOUT COVER
INDEXING/ABSTRACTING
AIMS AND SCOPE
FLYLEAF
��� December 21, 2017|Volume 23|�ssue 47|WJG|www.wjgnet.com
Clinical epidemiology and disease burden of nonalcoholic fatty liver disease
Brandon J Perumpail, Muhammad Ali Khan, Eric R Yoo, George Cholankeril, Donghee Kim, Aijaz Ahmed
Brandon J Perumpail, Department of Medicine, College of Medicine, Drexel University, Philadelphia, PA 19129, United States
Muhammad Ali Khan, Division of Gastroenterology and Hepatology, Health Science Center, University of Tennessee, Memphis, TN 38163, United States
Eric R Yoo, Department of Medicine, Santa Clara Valley Medical Center, San Jose, CA 95128, United States
George Cholankeril, Donghee Kim, Aijaz Ahmed, Division of Gastroenterology and Hepatology, Stanford University School of Medicine, Palo Alto, CA 94304, United States
ORCID number: Brandon J Perumpail (0000-0001-7716-6824); Muhammad Ali Khan (0000-0001-8235-1733); Eric R Yoo (0000-0002-0584-6975); George Cholankeril (0000-0001 -5335-8426); Donghee Kim (0000-0003-1919-6800); Aijaz Ahmed (0000-0002-3609-8586).
Author contributions: Perumpail BJ, Khan MA, Kim D, Cholankeril G and Ahmed A drafted the manuscript; Cholankeril G and Ahmed A critically revised intellectual input; all authors approved the final manuscript.
Conflict-of-interest statement: All authors have no conflicts of interest or financial disclosure relevant to this manuscript.
Open-Access: This article is an open-access article which was selected by an in-house editor and fully peer-reviewed by external reviewers. It is distributed in accordance with the Creative Commons Attribution Non Commercial (CC BY-NC 4.0) license, which permits others to distribute, remix, adapt, build upon this work non-commercially, and license their derivative works on different terms, provided the original work is properly cited and the use is non-commercial. See: http://creativecommons.org/licenses/by-nc/4.0/
Manuscript source: Invited manuscript
Correspondence to: Aijaz Ahmed, MD, Associate Professor, Attending Doctor, Division of Gastroenterology and Hepatology, Stanford University School of Medicine, 750 Welch Road # 210, Palo Alto, CA 94304, United States. [email protected]
Telephone: +1-650-4986091Fax: +1-650-4985692
Received: October 22, 2017Peer-review started: October 25, 2017First decision: November 8, 2017Revised: November 8, 2017Accepted: December 4, 2017 Article in press: December 4, 2017Published online: December 21, 2017
AbstractNonalcoholic fatty liver disease (NAFLD) is defined as the presence of hepatic fat accumulation after the exclusion of other causes of hepatic steatosis, including other causes of liver disease, excessive alcohol consumption, and other conditions that may lead to hepatic steatosis. NAFLD encompasses a broad clinical spectrum ranging from nonalcoholic fatty liver to nonalcoholic steatohepatitis (NASH), advanced fibrosis, cirrhosis, and finally hepatocellular carcinoma (HCC). NAFLD is the most common liver disease in the world and NASH may soon become the most common indication for liver transplantation. Ongoing persistence of obesity with increasing rate of diabetes will increase the prevalence of NAFLD, and as this population ages, many will develop cirrhosis and end-stage liver disease. There has been a general increase in the prevalence of NAFLD, with Asia leading the rise, yet the United States is following closely behind with a rising prevalence from 15% in 2005 to 25% within 5 years. NAFLD is commonly associated with metabolic comorbidities, including obesity, type Ⅱ diabetes, dyslipidemia, and metabolic syndrome. Our understanding of the pathophysiology of NAFLD is constantly evolving. Based on NAFLD subtypes, it has the potential to progress into advanced fibrosis, end-stage liver disease and HCC. The increasing prevalence of NAFLD with advanced fibrosis, is concerning because patients appear to
REVIEW
8263 December 21, 2017|Volume 23|Issue 47|WJG|www.wjgnet.com
Submit a Manuscript: http://www.f6publishing.com
DOI: 10.3748/wjg.v23.i47.8263
World J Gastroenterol 2017 December 21; 23(47): 8263-8276
ISSN 1007-9327 (print) ISSN 2219-2840 (online)
experience higher liver-related and non-liver-related mortality than the general population. The increased morbidity and mortality, healthcare costs and declining health related quality of life associated with NAFLD makes it a formidable disease, and one that requires more in-depth analysis.
Key words: Nonalcoholic fatty liver disease; Hepatic steatosis; Fatty liver; Prevalence; Incidence; Fibrosis; Risk factor; Epidemiology; Outcomes; Nonalcoholic steatohepatitis
© The Author(s) 2017. Published by Baishideng Publishing Group Inc. All rights reserved.
Core tip: Nonalcoholic fatty liver disease (NAFLD) is a term for a host of histological findings stemming from hepatic steatosis and remains the most common liver disease globally with increasing prevalence. The vast variation in disease presentation complicates diagnosis, leading to an underestimate of actual disease occurrence. NAFLD is associated with many metabolic comorbidities, including obesity, type Ⅱ diabetes, dyslipidemia, and metabolic syndrome. Its potential to develop into more severe liver conditions, such as nonalcoholic steatohepatitis, advanced fibrosis, cirrhosis and hepatocellular carcinoma, can lead to a state in which liver transplantation is the only treatment option available. The population at risk of developing progressive liver disease creates a challenge to the healthcare system in terms of screening for this evolving epidemic of liver disease.
Perumpail BJ, Khan MA, Yoo ER, Cholankeril G, Kim D, Ahmed A. Clinical epidemiology and disease burden of nonalcoholic fatty liver disease. World J Gastroenterol 2017; 23(47): 8263-8276 Available from: URL: http://www.wjgnet.com/1007-9327/full/v23/i47/8263.htm DOI: http://dx.doi.org/10.3748/wjg.v23.i47.8263
INTRODUCTION Nonalcoholic fatty liver disease (NAFLD) has become a common cause of chronic liver disease in the world[1] since its first description in 1980 as the “unnamed disease”[2]. It has been studied in-depth subsequently with continuous myriad of further investigations being carried into this soon to be common indication for liver transplantation (LT). Figure 1 summarizes some of the most landmark studies in the current literature on NAFLD.
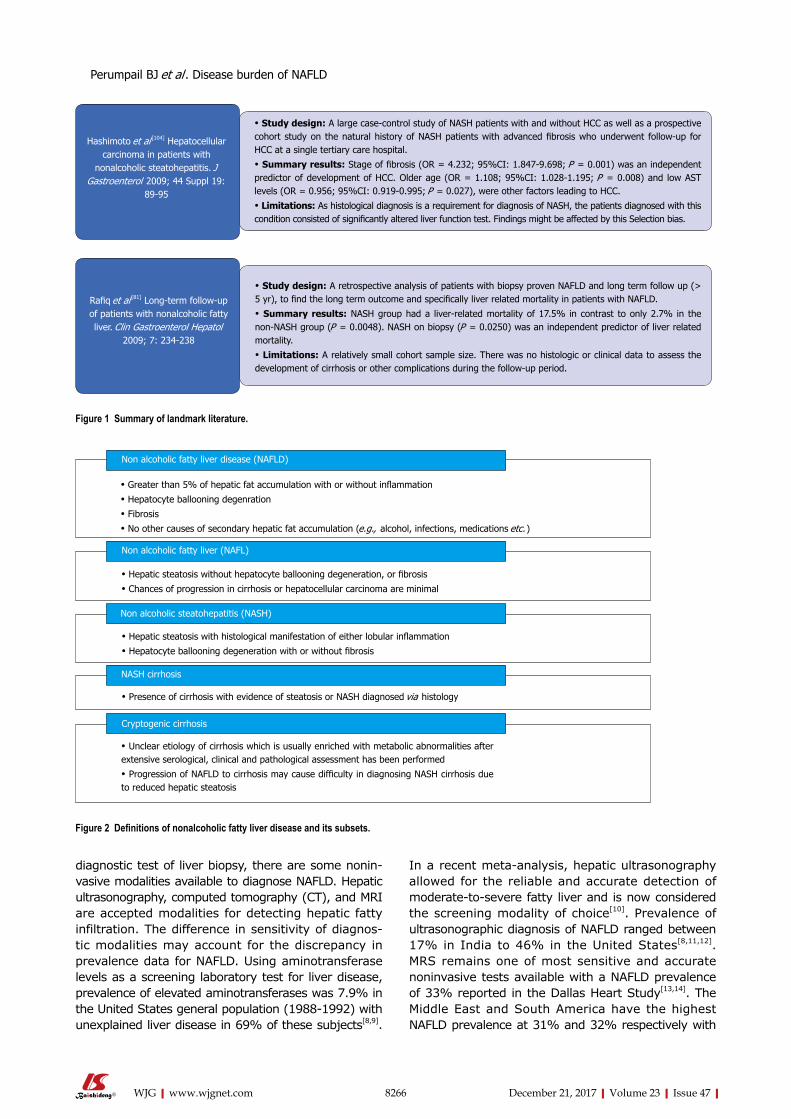
NAFLD CLASSIFICATIONNAFLD encompasses a wide histological variety: Nonalcoholic fatty liver (NAFL), nonalcoholic stea-tohepatitis (NASH), fibrosis, NASH cirrhosis, and
NASH-related hepatocellular carcinoma (HCC) (Figure 2). NAFLD is characterized by ≥ 5% of hepatic fat accumulation in the absence of any secondary causes and is a diagnosis of exclusion. Therefore, other etiologies leading to similar hepatic histology must be ruled out including excessive alcohol consumption; viral hepatitis; other chronic liver disease such as, Wilson’s disease, hemochromatosis, viral hepatitis, autoimmune hepatitis, cholestatic liver disease and other chronic liver diseases; starvation; lipodystrophy; celiac disease; Cushing’s disease; and medications (corticosteroids, methotrexate, diltiazem, oxaliplatin, amiodarone, isoniazid, highly active anti-retroviral therapy, etc.). Current guidelines recommend utilizing criteria requiring an alcohol exposure of less than 30 g/d for men and less than 20 g/d for women as a component of NAFLD diagnosis [1].
EPIDEMIOLOGYNAFLD has diverse manifestations described in all ethnicities all over the world and present in both sexes[3]. The variable presentations probably contribute to the underreported new and existing cases of NAFLD as well as the limited studies undertaken to elucidate the exact incidence and prevalence of NAFLD.
Disease burden It is currently estimated that the global prevalence of NAFLD is as high as one billion[4]. In the United States, NAFLD is estimated to be the most common cause of chronic liver disease, affecting between 80 and 100 million individuals, among whom nearly 25% progress to NASH.
Incidence of NAFLDA study from Japan which followed 3147 patients over 414 d found a 10% annual incidence rate[5]. Another Japanese study evaluated elevated aminotransferase levels, weight gain and insulin resistance development over 5 years to classify patients with NAFLD and their incidence was reported as 31 per 1000 person-years[6]. A retrospective study done in England later demonstrated a much lower incidence of 29 per 100000 person-years[7]. A recent extensive meta-analysis described a pooled regional incidence of NAFLD in Asia and Israel to be 52 [95% confidence interval (CI): 28-97] per 1000 person-years and 28 (95%CI: 19-41) per 1000 person-years, respectively[3]. Current data on incidence for NAFLD are limited in some regions of the world due to the limited number of studies. Further studies seem warranted to determine the true incidence in general population.
Prevalence of NAFLDIn general, the prevalence of NAFLD has increased over the last 20 years. In addition to the gold standard
8264 December 21, 2017|Volume 23|Issue 47|WJG|www.wjgnet.com
Perumpail BJ et al . Disease burden of NAFLD
8265 December 21, 2017|Volume 23|Issue 47|WJG|www.wjgnet.com
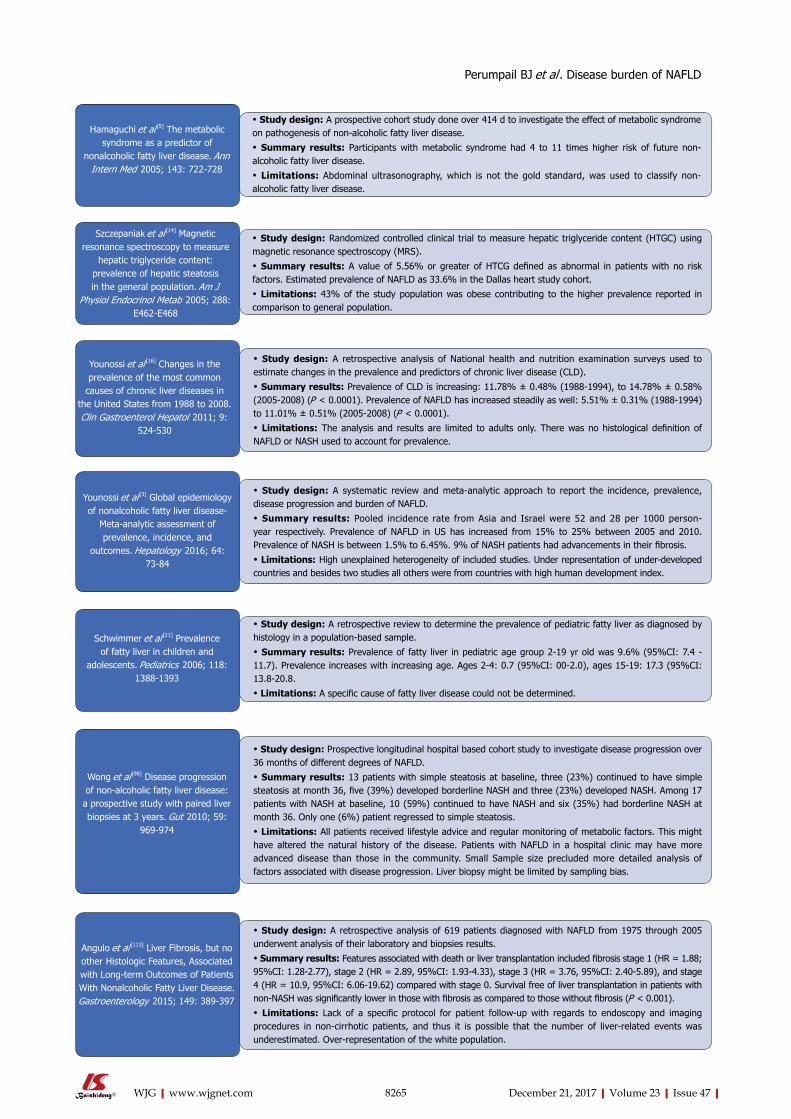
Hamaguchi et al [5] The metabolic syndrome as a predictor of
nonalcoholic fatty liver disease. Ann Intern Med 2005; 143: 722-728
• Study design: A prospective cohort study done over 414 d to investigate the effect of metabolic syndrome on pathogenesis of non-alcoholic fatty liver disease.
• Summary results: Participants with metabolic syndrome had 4 to 11 times higher risk of future non-alcoholic fatty liver disease.
• Limitations: Abdominal ultrasonography, which is not the gold standard, was used to classify non-alcoholic fatty liver disease.
Szczepaniak et al [14] Magnetic resonance spectroscopy to measure
hepatic triglyceride content: prevalence of hepatic steatosis in the general population. Am J
Physiol Endocrinol Metab 2005; 288: E462-E468
• Study design: Randomized controlled clinical trial to measure hepatic triglyceride content (HTGC) using magnetic resonance spectroscopy (MRS).
• Summary results: A value of 5.56% or greater of HTCG defined as abnormal in patients with no risk factors. Estimated prevalence of NAFLD as 33.6% in the Dallas heart study cohort.
• Limitations: 43% of the study population was obese contributing to the higher prevalence reported in comparison to general population.
Younossi et al [16] Changes in the prevalence of the most common
causes of chronic liver diseases in the United States from 1988 to 2008. Clin Gastroenterol Hepatol 2011; 9:
524-530
• Study design: A retrospective analysis of National health and nutrition examination surveys used to estimate changes in the prevalence and predictors of chronic liver disease (CLD).
• Summary results: Prevalence of CLD is increasing: 11.78% ± 0.48% (1988-1994), to 14.78% ± 0.58% (2005-2008) (P < 0.0001). Prevalence of NAFLD has increased steadily as well: 5.51% ± 0.31% (1988-1994) to 11.01% ± 0.51% (2005-2008) (P < 0.0001).
• Limitations: The analysis and results are limited to adults only. There was no histological definition of NAFLD or NASH used to account for prevalence.
Younossi et al [3] Global epidemiology of nonalcoholic fatty liver disease-
Meta-analytic assessment of prevalence, incidence, and
outcomes. Hepatology 2016; 64: 73-84
• Study design: A systematic review and meta-analytic approach to report the incidence, prevalence, disease progression and burden of NAFLD.
• Summary results: Pooled incidence rate from Asia and Israel were 52 and 28 per 1000 person-year respectively. Prevalence of NAFLD in US has increased from 15% to 25% between 2005 and 2010. Prevalence of NASH is between 1.5% to 6.45%. 9% of NASH patients had advancements in their fibrosis.
• Limitations: High unexplained heterogeneity of included studies. Under representation of under-developed countries and besides two studies all others were from countries with high human development index.
Schwimmer et al [21] Prevalence of fatty liver in children and
adolescents. Pediatrics 2006; 118: 1388-1393
• Study design: A retrospective review to determine the prevalence of pediatric fatty liver as diagnosed by histology in a population-based sample.
• Summary results: Prevalence of fatty liver in pediatric age group 2-19 yr old was 9.6% (95%CI: 7.4 - 11.7). Prevalence increases with increasing age. Ages 2-4: 0.7 (95%CI: 00-2.0), ages 15-19: 17.3 (95%CI: 13.8-20.8.
• Limitations: A specific cause of fatty liver disease could not be determined.
• Study design: Prospective longitudinal hospital based cohort study to investigate disease progression over 36 months of different degrees of NAFLD.
• Summary results: 13 patients with simple steatosis at baseline, three (23%) continued to have simple steatosis at month 36, five (39%) developed borderline NASH and three (23%) developed NASH. Among 17 patients with NASH at baseline, 10 (59%) continued to have NASH and six (35%) had borderline NASH at month 36. Only one (6%) patient regressed to simple steatosis.
• Limitations: All patients received lifestyle advice and regular monitoring of metabolic factors. This might have altered the natural history of the disease. Patients with NAFLD in a hospital clinic may have more advanced disease than those in the community. Small Sample size precluded more detailed analysis of factors associated with disease progression. Liver biopsy might be limited by sampling bias.
Wong et al [98] Disease progression of non-alcoholic fatty liver disease: a prospective study with paired liver biopsies at 3 years. Gut 2010; 59:
969-974
Angulo et al [113] Liver Fibrosis, but no other Histologic Features, Associated with Long-term Outcomes of Patients With Nonalcoholic Fatty Liver Disease. Gastroenterology 2015; 149: 389-397
• Study design: A retrospective analysis of 619 patients diagnosed with NAFLD from 1975 through 2005 underwent analysis of their laboratory and biopsies results.
• Summary results: Features associated with death or liver transplantation included fibrosis stage 1 (HR = 1.88; 95%CI: 1.28-2.77), stage 2 (HR = 2.89, 95%CI: 1.93-4.33), stage 3 (HR = 3.76, 95%CI: 2.40-5.89), and stage 4 (HR = 10.9, 95%CI: 6.06-19.62) compared with stage 0. Survival free of liver transplantation in patients with non-NASH was significantly lower in those with fibrosis as compared to those without fibrosis (P < 0.001).
• Limitations: Lack of a specific protocol for patient follow-up with regards to endoscopy and imaging procedures in non-cirrhotic patients, and thus it is possible that the number of liver-related events was underestimated. Over-representation of the white population.
Perumpail BJ et al . Disease burden of NAFLD
8266 December 21, 2017|Volume 23|Issue 47|WJG|www.wjgnet.com
In a recent meta-analysis, hepatic ultrasonography allowed for the reliable and accurate detection of moderate-to-severe fatty liver and is now considered the screening modality of choice[10]. Prevalence of ultrasonographic diagnosis of NAFLD ranged between 17% in India to 46% in the United States[8,11,12]. MRS remains one of most sensitive and accurate noninvasive tests available with a NAFLD prevalence of 33% reported in the Dallas Heart Study[13,14]. The Middle East and South America have the highest NAFLD prevalence at 31% and 32% respectively with
diagnostic test of liver biopsy, there are some nonin-vasive modalities available to diagnose NAFLD. Hepatic ultrasonography, computed tomography (CT), and MRI are accepted modalities for detecting hepatic fatty infiltration. The difference in sensitivity of diagnos-tic modalities may account for the discrepancy in prevalence data for NAFLD. Using aminotransferase levels as a screening laboratory test for liver disease, prevalence of elevated aminotransferases was 7.9% in the United States general population (1988-1992) with unexplained liver disease in 69% of these subjects[8,9].
Non alcoholic fatty liver disease (NAFLD)
• Greater than 5% of hepatic fat accumulation with or without inflammation
• Hepatocyte ballooning degenration
• Fibrosis
• No other causes of secondary hepatic fat accumulation (e.g., alcohol, infections, medications etc. )
• Hepatic steatosis without hepatocyte ballooning degeneration, or fibrosis
• Chances of progression in cirrhosis or hepatocellular carcinoma are minimal
Non alcoholic fatty liver (NAFL)
• Hepatic steatosis with histological manifestation of either lobular inflammation
• Hepatocyte ballooning degeneration with or without fibrosis
Non alcoholic steatohepatitis (NASH)
• Presence of cirrhosis with evidence of steatosis or NASH diagnosed via histology
Cryptogenic cirrhosis
• Unclear etiology of cirrhosis which is usually enriched with metabolic abnormalities after extensive serological, clinical and pathological assessment has been performed
• Progression of NAFLD to cirrhosis may cause difficulty in diagnosing NASH cirrhosis due to reduced hepatic steatosis
NASH cirrhosis
Figure 2 Definitions of nonalcoholic fatty liver disease and its subsets.
• Study design: A large case-control study of NASH patients with and without HCC as well as a prospective cohort study on the natural history of NASH patients with advanced fibrosis who underwent follow-up for HCC at a single tertiary care hospital.
• Summary results: Stage of fibrosis (OR = 4.232; 95%CI: 1.847-9.698; P = 0.001) was an independent predictor of development of HCC. Older age (OR = 1.108; 95%CI: 1.028-1.195; P = 0.008) and low AST levels (OR = 0.956; 95%CI: 0.919-0.995; P = 0.027), were other factors leading to HCC.
• Limitations: As histological diagnosis is a requirement for diagnosis of NASH, the patients diagnosed with this condition consisted of significantly altered liver function test. Findings might be affected by this Selection bias.
• Study design: A retrospective analysis of patients with biopsy proven NAFLD and long term follow up (> 5 yr), to find the long term outcome and specifically liver related mortality in patients with NAFLD.
• Summary results: NASH group had a liver-related mortality of 17.5% in contrast to only 2.7% in the non-NASH group (P = 0.0048). NASH on biopsy (P = 0.0250) was an independent predictor of liver related mortality.
• Limitations: A relatively small cohort sample size. There was no histologic or clinical data to assess the development of cirrhosis or other complications during the follow-up period.
Rafiq et al [81] Long-term follow-up of patients with nonalcoholic fatty liver. Clin Gastroenterol Hepatol
2009; 7: 234-238
Hashimoto et al [104] Hepatocellular carcinoma in patients with
nonalcoholic steatohepatitis. J Gastroenterol 2009; 44 Suppl 19:
89-95
Figure 1 Summary of landmark literature.
Perumpail BJ et al . Disease burden of NAFLD
8267 December 21, 2017|Volume 23|Issue 47|WJG|www.wjgnet.com
the lowest prevalence in Africa at 13.5%[3]. Recently, Asia has been facing the highest obesity epidemic and thus not surprisingly has been experiencing a rapid rate of increase in the prevalence of NAFLD. Chinese adolescents on a “westernized” diet have a greater than 25% prevalence of NAFLD. Studies from Korea, China, Japan and Taiwan have all reported a prevalence ranging from 11%-45%[15]. Along with the global drift, United States has not been immune to the uptrend in NAFLD. A recent United States-based study using the National Health and Nutrition Examination Surveys (NHANES) conducted between 1988 and 2008 found that the prevalence of NAFLD using elevated alanine aminotransferese (ALT) doubled in the United States during this time period (5.5% to 11.0%)[16]. Based on the NHANES-Ⅲ data collected between 1988 and 1994, the prevalence of ultrasonography-diagnosed NAFLD was 34%[17]. Meta-regression of studies done globally also displayed an increased prevalence of NAFLD from 15% in 2005 to 25% in 2010[3]. The discrepancy in the prevalence of NAFLD among studies is most likely due to differences in sample selection, diagnostic modalities, dietary and lifestyle habits.
Economic impactThe current annual medical and societal costs of NAFLD are estimated at $292 billion in the United States[18]. The projected cost of caring for patients is expected to increase by 18% from 2000 to 2035 and health-related quality of life of NAFLD patients is described as declining[19,20].
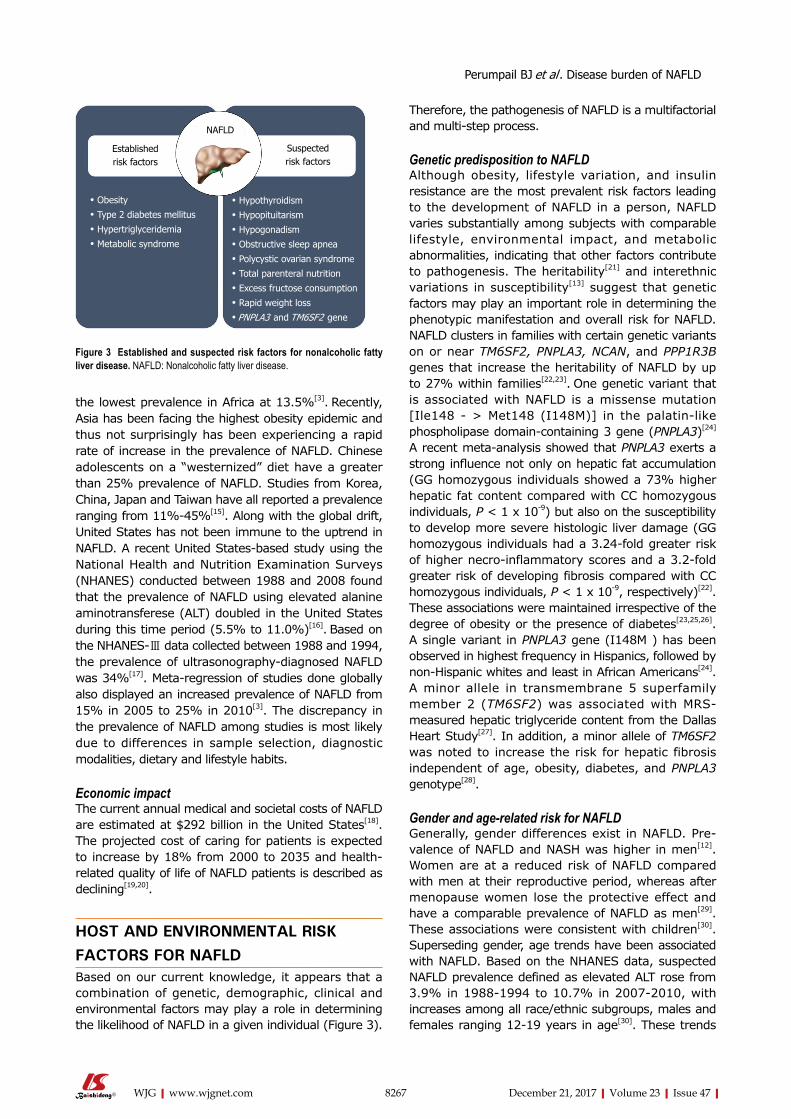
HOST AND ENVIRONMENTAL RISK FACTORS FOR NAFLDBased on our current knowledge, it appears that a combination of genetic, demographic, clinical and environmental factors may play a role in determining the likelihood of NAFLD in a given individual (Figure 3).
Therefore, the pathogenesis of NAFLD is a multifactorial and multi-step process.
Genetic predisposition to NAFLDAlthough obesity, lifestyle variation, and insulin resistance are the most prevalent risk factors leading to the development of NAFLD in a person, NAFLD varies substantially among subjects with comparable lifestyle, environmental impact, and metabolic abnormalities, indicating that other factors contribute to pathogenesis. The heritability[21] and interethnic variations in susceptibility[13] suggest that genetic factors may play an important role in determining the phenotypic manifestation and overall risk for NAFLD. NAFLD clusters in families with certain genetic variants on or near TM6SF2, PNPLA3, NCAN, and PPP1R3B genes that increase the heritability of NAFLD by up to 27% within families[22,23]. One genetic variant that is associated with NAFLD is a missense mutation [Ile148 - > Met148 (I148M)] in the palatin-like phospholipase domain-containing 3 gene (PNPLA3)[24] A recent meta-analysis showed that PNPLA3 exerts a strong influence not only on hepatic fat accumulation (GG homozygous individuals showed a 73% higher hepatic fat content compared with CC homozygous individuals, P < 1 x 10⁻⁹) but also on the susceptibility to develop more severe histologic liver damage (GG homozygous individuals had a 3.24-fold greater risk of higher necro-inflammatory scores and a 3.2-fold greater risk of developing fibrosis compared with CC homozygous individuals, P < 1 x 10⁻⁹, respectively)[22]. These associations were maintained irrespective of the degree of obesity or the presence of diabetes[23,25,26]. A single variant in PNPLA3 gene (I148M ) has been observed in highest frequency in Hispanics, followed by non-Hispanic whites and least in African Americans[24]. A minor allele in transmembrane 5 superfamily member 2 (TM6SF2) was associated with MRS-measured hepatic triglyceride content from the Dallas Heart Study[27]. In addition, a minor allele of TM6SF2 was noted to increase the risk for hepatic fibrosis independent of age, obesity, diabetes, and PNPLA3 genotype[28].
Gender and age-related risk for NAFLDGenerally, gender differences exist in NAFLD. Pre-valence of NAFLD and NASH was higher in men[12]. Women are at a reduced risk of NAFLD compared with men at their reproductive period, whereas after menopause women lose the protective effect and have a comparable prevalence of NAFLD as men[29]. These associations were consistent with children[30]. Superseding gender, age trends have been associated with NAFLD. Based on the NHANES data, suspected NAFLD prevalence defined as elevated ALT rose from 3.9% in 1988-1994 to 10.7% in 2007-2010, with increases among all race/ethnic subgroups, males and females ranging 12-19 years in age[30]. These trends
NAFLD
Suspected risk factors
Established risk factors
• Hypothyroidism
• Hypopituitarism
• Hypogonadism
• Obstructive sleep apnea
• Polycystic ovarian syndrome
• Total parenteral nutrition
• Excess fructose consumption
• Rapid weight loss
• PNPLA3 and TM6SF2 gene
• Obesity
• Type 2 diabetes mellitus
• Hypertriglyceridemia
• Metabolic syndrome
Figure 3 Established and suspected risk factors for nonalcoholic fatty liver disease. NAFLD: Nonalcoholic fatty liver disease.
Perumpail BJ et al . Disease burden of NAFLD
8268 December 21, 2017|Volume 23|Issue 47|WJG|www.wjgnet.com
were also consistent among adolescent and young adults aged 15-39 years[31]. Although the majority of studies are among people aged 30 to 70 years, the general trend of increased prevalence is observed with age with peak prevalence of NAFLD noted between age 50-60 in men[32]; with 16.1% in ages 30 to 40 years old, 22.3% in 41 to 50 years old, 29.3% in 51 to 60 years old, and 27.6% in over 60 years old based on NHANES Ⅲ[33]. In women, prevalence of NAFLD increased with age especially after menopause; with 12.5% in ages 30 to 40 years old, 16.1% in 41 to 50 years old, 21.6% in 51 to 60 years old, and 25.4% in over 60 years old[33]. A study with octogenarians admitted in a geriatric hospital showed a higher than usual prevalence of 46%[34].
Differences in NAFLD from race/ethnicityRace/ethnicity is another variable affecting the pre-valence of NAFLD, with the highest prevalence among Hispanics followed by non-Hispanic whites, and lowest prevalence in African Americans[12,13,35]. The numbers cited are at times double for Hispanics (45%-58%) in comparison to African Americans (24%-35%), with Latinos of Mexican origin having the highest prevalence in a subgroup analysis of the Latino population[13,36]. These findings hold true even in studies in the pediatric population[30]. Underlying genetic and lifestyle variations amongst these ethnicities could further account for the skewed prevalence of NAFLD.
Linking obesity and NAFLDThe prevalence of NAFLD among the obese population ranges from 30% to 37%[8]. Abdominal obesity with increased waist circumference is specifically more strongly correlated with NAFLD[37]. In a recent cohort study of 2017 subjects during a median 4.4 year follow-up, the visceral adiposity was associated with incident NAFLD in a dose-dependent manner, with an adjusted hazard ratio [HR, per 1-standard deviation (SD) increase] for incident NAFLD of 1.36 (1.16-1.59)[38]. In addition, this study found significant relationships with subcutaneous adiposity for regressed NAFLD of HR = 1.36 (95%CI: 1.08-1.72) independent of visceral adiposity[38]. Furthermore, a recent study reported that visceral adiposity increased the risk for NAFLD without significant fibrosis and NAFLD with significant fibrosis after adjusting for known risk factors[39]. Multivariate analysis showed that the visceral adipose tissue area was independently associated with increased risks of NASH and significant fibrosis[39]. These studies suggest that certain types of abdominal fat are risk factors for NAFLD and more advanced NAFLD-related fibrosis, whereas other types could reduce risk for NAFLD. In recent years, several cohort studies demonstrated an association between body weight change and incident NAFLD[40-43]. Even a modest gain in body weight of 2 kg within the normal range has been shown to increase the risk of developing NAFLD[41]. Obesity has also
been noted to be an additive factor causing a two-fold increase in steatosis in the setting significant alcohol use[28]. While it is common to have NAFLD in obese population, it is even more common to have obesity in patients with NAFLD. The pooled prevalence of obesity in NAFLD globally is reported to be 51%[3].
Contribution of diet composition to NAFLDDue to the evidence supporting that obesity is associated with NAFLD, some macro- and micro-nutrients contribute more to the epidemic of NAFLD. Fructose is a major player, either from sucrose or high fructose corn syrup found in beverages. Consumption of such beverages has increased five-fold in the United States since 1950, and drinking two average size sugar containing beverage servings for 6 mo ends up mirroring many features of NAFLD[44]. It is hypothesized that sugars promote de novo lipogenesis and trigger inflammatory response leading to hepatocyte apoptosis via the c-Jun-N-Terminal pathway[45].
Diabetes as a risk factor for NAFLD Pre-existing metabolic disorders, specifically type 2 diabetes mellitus (T2DM), have a close association with NAFLD, with more than three-quarters of diabetic patients reportedly having NAFLD[46]. T2DM and insulin resistance promote lipolysis of the adipose tissue leading to release of free fatty acids and their deposition in the liver leading to steatosis[45]. T2DM is a significant risk factor to cause progressive NASH, fibrosis, cirrhosis and an independent risk factor of mortality in addition to liver-related mortality[47] .
Sleep deprivation as a risk factor for NAFLDSleep disturbances and disorders are common me-dical problems in the current era. Epidemiological studies[48,49] have provided evidence that poor sleep quality and sleep deprivation is associated with obesity which plays a key role in the pathogenesis of NAFLD. Recently, population cohort studies [50-52] reported that sleep deprivation may be independently associated with NAFLD with odds ratio 1.28 (1.13-1.44) in men and 1.71 (1.38-2.13) in women. Further, poor quality sleep was found to be a positive predictor of NAFLD in men and women 1.10 (1.02-1.19) and 1.36 (1.17-1.59) respectively[52]. Biologic plausibility for this independent association has been explored by evaluating the role of inflammatory cytokines interleukin 6 and TNF-α[53,54]. These cytokines are increased by sleep disturbances and play a role in pathogenesis of NAFLD by increasing adipocyte lipolysis which in turn can cause hepatic overflow of free fatty acids[55]. Further, sleep deprivation can affect hypothalamus pituitary adrenal axis, which in turn affects cortisol metabolism leading to hepatic fat accumulation[56,57].
Medical conditions associated with NAFLDIn addition to the above listed risk factors, other
Perumpail BJ et al . Disease burden of NAFLD
8269 December 21, 2017|Volume 23|Issue 47|WJG|www.wjgnet.com
emerging contributors such as hypothyroidism, hypopi-tuitarism, polycystic ovarian disease and obstructive sleep apnea (Figure 3) should be kept in mind[1].
METHODOLOGY FOR NAFLD DIAGNOSISNAFLD is diagnosed based on clinical history, laboratory and radiographic studies which are further complemented by histologic information. Abdominal imaging revealing hepatic steatosis may be sufficient for diagnosis of NAFLD and liver biopsy may not be required if clinical and laboratory data have ruled out other causes of liver disease. However, role of liver biopsy is important in differentiating NASH from simple steatosis and this may have implications in management as NASH has a higher risk of disease progression as compared to simple steatosis[58]. NASH is confirmed when all four features viz. steatosis, inflammation, cellular ballooning and fibrosis are present on histology[58,59]. Apart from imaging and liver biopsy, certain non-invasive tests can help in clinical decision making regarding the presence of advanced fibrosis in NAFLD patients. NAFLD fibrosis score (NFS) is one of the most commonly employed non-invasive tests to assess severity of hepatic fibrosis by utilizing six variables: age, BMI, hyperglycemia, platelet count, albumin and aspartate aminotransferase (AST)/ALT ratio. It is calculated using the published formula available at (Hepatology 2007; 45: 846-854 DOI: 10.1002/hep.21496). A meta-analysis of 3064 patients reported that NFS has an area under the receiver operating curve (AUROC) of 0.85 for predicting bridging fibrosis with nodularity or cirrhosis. A score < -1.45 had 90% sensitivity to exclude advanced fibrosis, whereas a score > 0.67 had a 97% specificity to identify pre-sence of advanced fibrosis[60]. FIB-4 index is another algorithmic score utilized in studies to predict advanced fibrosis. It is based on age, platelet count, AST and ALT and is calculated using published formula (Hepatology 2006; 43: 1317-1325 DOI: 10.1002/hep.21178). Using this formula, patients with score > 3.25 are likely to have advanced fibrosis whereas, those with score < 1.45 are unlikely to have advanced fibrosis. Imajo et al[61] compared various risk scores and elastography against liver histology and showed that NFS and FIB-4 were better than other non-invasive scoring indices like AST to platelet ration index and AST/ALT ratio. Further, NFS and FIB-4 were as good as MR elastography (MRE) in predicting advanced fibrosis in patients with biopsy-proven NAFLD.
Abdominal imaging as a means of measuring hepatic steatosisA variety of imaging tools can be utilized for the diagnosis of NAFLD. Abdominal ultrasound is limited by low sensitivity in patients with less than 30% steatosis on histology[62]. However, it is noninvasive,
widely available and does not require contrast. On the other hand, CT can be associated with radiation hazard and contrast linked nephropathy. It is also limited by low sensitivity hepatic mapping and is expensive[62]. Magnetic resonance imaging (MRI) and magnetic resonance spectroscopy (MRS) provide the highest precision (sensitivity and specificity) in quantifying steatosis and liver fat mapping[63] and may become the test of choice in management of NAFLD[64,65]. Hepatic stiffness measurement with MRE is superior to MRI for the non-invasive diagnosis of significant liver fibrosis and cirrhosis[66], but the role of transient elastography may be limited in subjects with high body mass indices[67]. Further, MRE has the advantage of identifying individuals with steatohepatitis, even before the onset of significant fibrosis[68]. NAFLD with inflammation but without fibrosis demonstrates greater hepatic stiffness than simple steatosis and lower mean stiffness than NAFLD with fibrosis[68]. Despite this, abdominal imaging studies are currently unable to accurately diagnose NASH.
Role of liver biopsy in the diagnosis of NAFLDLiver biopsy with key histologic features is essential for confirmation of NASH. However, due to its invasive nature experts recommend selective use in NAFLD patients who have a higher probability of progressing to NASH. An individualized assessment is needed with discussion of risks and benefits of a diagnostic liver biopsy. Early diagnosis of NASH has crucial management implications and these patients can benefit from newly approved medications, off-label therapy with promising agents and treatment in the setting of a clinical trial in an attempt to retard the progression of liver disease[69-74]. Steatosis may be absent in the setting of advanced fibrosis or cirrhosis[58,69]. Inter-observer variability among experienced pathologists can occur during the histologic evaluation of hepatic balloon degeneration on a liver biopsy sample[58,59,75,76]. Poor inter-observer agreement among pathologists regarding sampling error or identification of hepatic ballooning may have resulted in a lower number of patients meeting the entry criteria in clinical trials[69]. Therefore, liver biopsy although considered as a gold standard for diagnosis of NASH may have several limitations. Patients with isolated hepatic steatosis with any degree of necro-inflammation on an index liver biopsy are at risk for progressive histologic damage[77,78]. In addition, patients with metabolic syndrome or those with individual components of metabolic syndrome coupled with isolated hepatic steatosis on liver biopsy may be at risk for more rapidly worsening histologic damage[77,78]. Figure 2 organizes the predictors of histologic evidence of NASH on an index liver biopsy in patients with NAFLD. Liver biopsy is indicated in NAFLD patients who have persistently elevated ALT and/or AST levels with abdominal imaging consistent with fatty liver age
Perumpail BJ et al . Disease burden of NAFLD
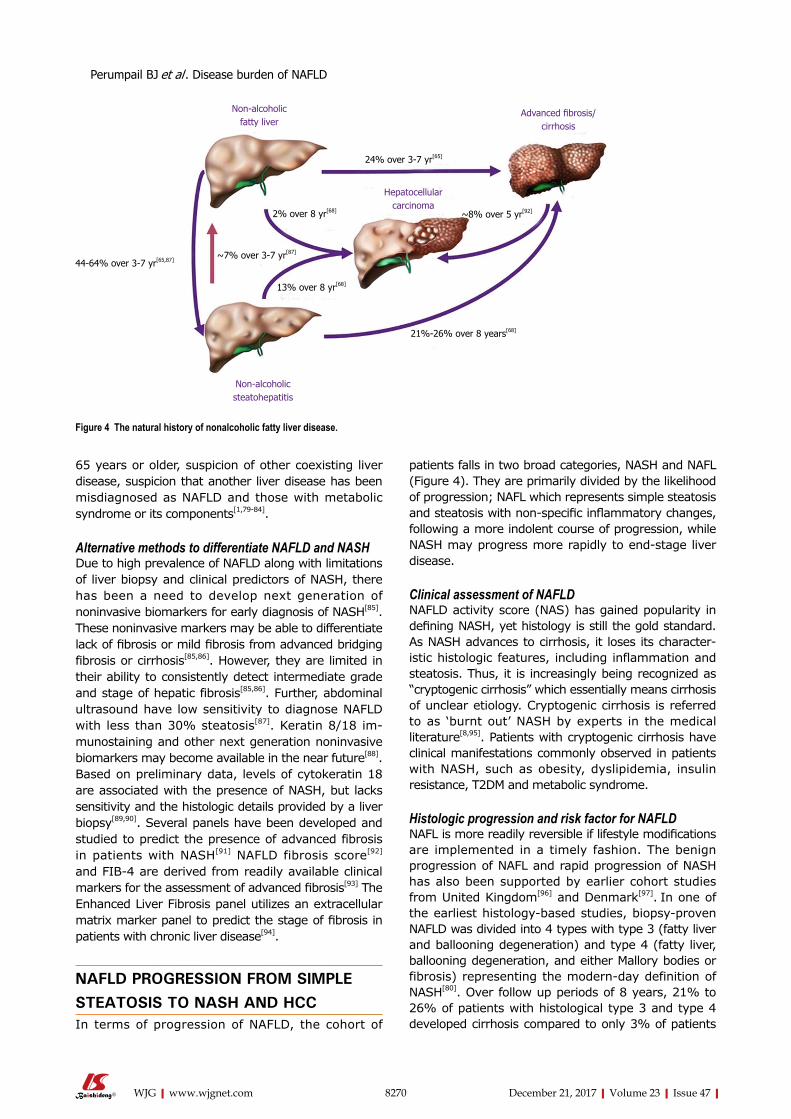
8270 December 21, 2017|Volume 23|Issue 47|WJG|www.wjgnet.com
65 years or older, suspicion of other coexisting liver disease, suspicion that another liver disease has been misdiagnosed as NAFLD and those with metabolic syndrome or its components[1,79-84].
Alternative methods to differentiate NAFLD and NASHDue to high prevalence of NAFLD along with limitations of liver biopsy and clinical predictors of NASH, there has been a need to develop next generation of noninvasive biomarkers for early diagnosis of NASH[85]. These noninvasive markers may be able to differentiate lack of fibrosis or mild fibrosis from advanced bridging fibrosis or cirrhosis[85,86]. However, they are limited in their ability to consistently detect intermediate grade and stage of hepatic fibrosis[85,86]. Further, abdominal ultrasound have low sensitivity to diagnose NAFLD with less than 30% steatosis[87]. Keratin 8/18 im-munostaining and other next generation noninvasive biomarkers may become available in the near future[88]. Based on preliminary data, levels of cytokeratin 18 are associated with the presence of NASH, but lacks sensitivity and the histologic details provided by a liver biopsy[89,90]. Several panels have been developed and studied to predict the presence of advanced fibrosis in patients with NASH[91] NAFLD fibrosis score[92] and FIB-4 are derived from readily available clinical markers for the assessment of advanced fibrosis[93] The Enhanced Liver Fibrosis panel utilizes an extracellular matrix marker panel to predict the stage of fibrosis in patients with chronic liver disease[94].
NAFLD PROGRESSION FROM SIMPLE STEATOSIS TO NASH AND HCCIn terms of progression of NAFLD, the cohort of
patients falls in two broad categories, NASH and NAFL (Figure 4). They are primarily divided by the likelihood of progression; NAFL which represents simple steatosis and steatosis with non-specific inflammatory changes, following a more indolent course of progression, while NASH may progress more rapidly to end-stage liver disease.
Clinical assessment of NAFLDNAFLD activity score (NAS) has gained popularity in defining NASH, yet histology is still the gold standard. As NASH advances to cirrhosis, it loses its character-istic histologic features, including inflammation and steatosis. Thus, it is increasingly being recognized as “cryptogenic cirrhosis” which essentially means cirrhosis of unclear etiology. Cryptogenic cirrhosis is referred to as ‘burnt out’ NASH by experts in the medical literature[8,95]. Patients with cryptogenic cirrhosis have clinical manifestations commonly observed in patients with NASH, such as obesity, dyslipidemia, insulin resistance, T2DM and metabolic syndrome.
Histologic progression and risk factor for NAFLDNAFL is more readily reversible if lifestyle modifications are implemented in a timely fashion. The benign progression of NAFL and rapid progression of NASH has also been supported by earlier cohort studies from United Kingdom[96] and Denmark[97]. In one of the earliest histology-based studies, biopsy-proven NAFLD was divided into 4 types with type 3 (fatty liver and ballooning degeneration) and type 4 (fatty liver, ballooning degeneration, and either Mallory bodies or fibrosis) representing the modern-day definition of NASH[80]. Over follow up periods of 8 years, 21% to 26% of patients with histological type 3 and type 4 developed cirrhosis compared to only 3% of patients
Non-alcoholic fatty liver
Advanced fibrosis/ cirrhosis
24% over 3-7 yr[65]
Hepatocellular carcinoma
Non-alcoholic steatohepatitis
2% over 8 yr[68]
~7% over 3-7 yr[87]
44-64% over 3-7 yr[65,87]
13% over 8 yr[68]
21%-26% over 8 years[68]
~8% over 5 yr[92]
Figure 4 The natural history of nonalcoholic fatty liver disease.
Perumpail BJ et al . Disease burden of NAFLD
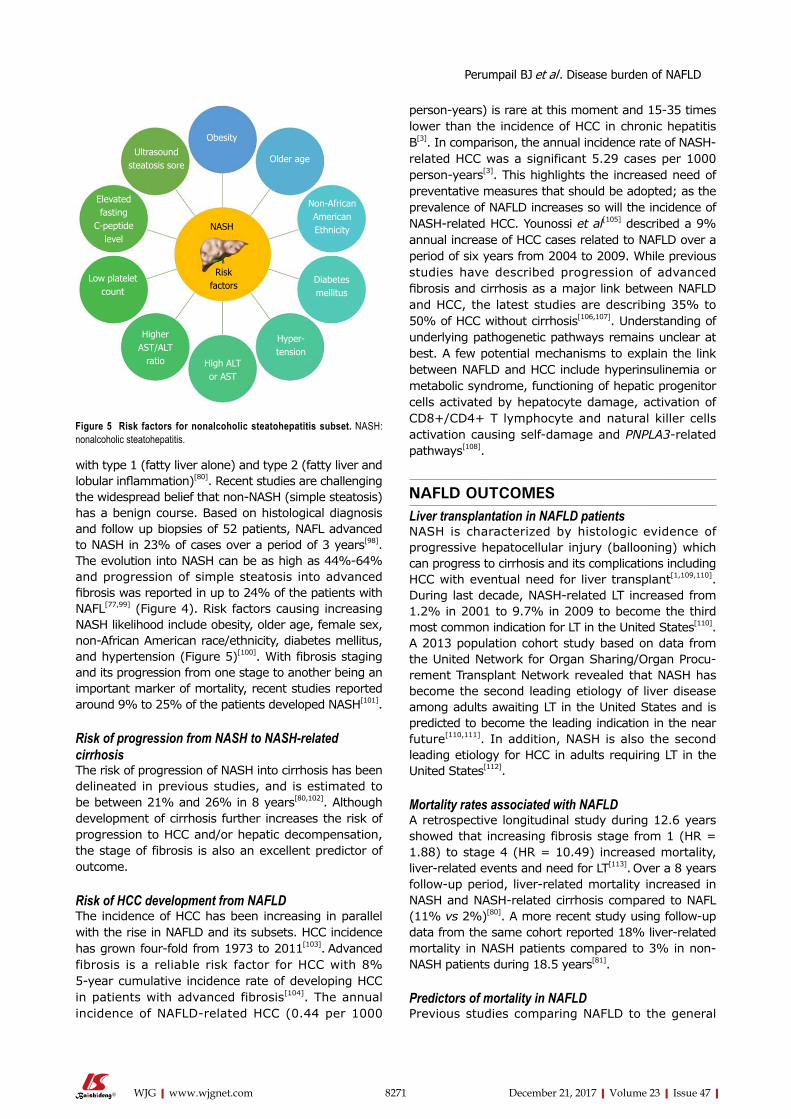
8271 December 21, 2017|Volume 23|Issue 47|WJG|www.wjgnet.com
with type 1 (fatty liver alone) and type 2 (fatty liver and lobular inflammation)[80]. Recent studies are challenging the widespread belief that non-NASH (simple steatosis) has a benign course. Based on histological diagnosis and follow up biopsies of 52 patients, NAFL advanced to NASH in 23% of cases over a period of 3 years[98]. The evolution into NASH can be as high as 44%-64% and progression of simple steatosis into advanced fibrosis was reported in up to 24% of the patients with NAFL[77,99] (Figure 4). Risk factors causing increasing NASH likelihood include obesity, older age, female sex, non-African American race/ethnicity, diabetes mellitus, and hypertension (Figure 5)[100]. With fibrosis staging and its progression from one stage to another being an important marker of mortality, recent studies reported around 9% to 25% of the patients developed NASH[101].
Risk of progression from NASH to NASH-related cirrhosisThe risk of progression of NASH into cirrhosis has been delineated in previous studies, and is estimated to be between 21% and 26% in 8 years[80,102]. Although development of cirrhosis further increases the risk of progression to HCC and/or hepatic decompensation, the stage of fibrosis is also an excellent predictor of outcome.
Risk of HCC development from NAFLDThe incidence of HCC has been increasing in parallel with the rise in NAFLD and its subsets. HCC incidence has grown four-fold from 1973 to 2011[103]. Advanced fibrosis is a reliable risk factor for HCC with 8% 5-year cumulative incidence rate of developing HCC in patients with advanced fibrosis[104]. The annual incidence of NAFLD-related HCC (0.44 per 1000
person-years) is rare at this moment and 15-35 times lower than the incidence of HCC in chronic hepatitis B[3]. In comparison, the annual incidence rate of NASH-related HCC was a significant 5.29 cases per 1000 person-years[3]. This highlights the increased need of preventative measures that should be adopted; as the prevalence of NAFLD increases so will the incidence of NASH-related HCC. Younossi et al[105] described a 9% annual increase of HCC cases related to NAFLD over a period of six years from 2004 to 2009. While previous studies have described progression of advanced fibrosis and cirrhosis as a major link between NAFLD and HCC, the latest studies are describing 35% to 50% of HCC without cirrhosis[106,107]. Understanding of underlying pathogenetic pathways remains unclear at best. A few potential mechanisms to explain the link between NAFLD and HCC include hyperinsulinemia or metabolic syndrome, functioning of hepatic progenitor cells activated by hepatocyte damage, activation of CD8+/CD4+ T lymphocyte and natural killer cells activation causing self-damage and PNPLA3-related pathways[108].
NAFLD OUTCOMESLiver transplantation in NAFLD patients NASH is characterized by histologic evidence of progressive hepatocellular injury (ballooning) which can progress to cirrhosis and its complications including HCC with eventual need for liver transplant[1,109,110]. During last decade, NASH-related LT increased from 1.2% in 2001 to 9.7% in 2009 to become the third most common indication for LT in the United States[110]. A 2013 population cohort study based on data from the United Network for Organ Sharing/Organ Procu-rement Transplant Network revealed that NASH has become the second leading etiology of liver disease among adults awaiting LT in the United States and is predicted to become the leading indication in the near future[110,111]. In addition, NASH is also the second leading etiology for HCC in adults requiring LT in the United States[112].
Mortality rates associated with NAFLDA retrospective longitudinal study during 12.6 years showed that increasing fibrosis stage from 1 (HR = 1.88) to stage 4 (HR = 10.49) increased mortality, liver-related events and need for LT[113]. Over a 8 years follow-up period, liver-related mortality increased in NASH and NASH-related cirrhosis compared to NAFL (11% vs 2%)[80]. A more recent study using follow-up data from the same cohort reported 18% liver-related mortality in NASH patients compared to 3% in non-NASH patients during 18.5 years[81].
Predictors of mortality in NAFLD Previous studies comparing NAFLD to the general
Obesity
Older age
Non-African American Ethnicity
Diabetes mellitus
Hyper-tension
High ALT or AST
Higher AST/ALT
ratio
Low platelet count
Elevated fasting
C-peptide level
Ultrasound steatosis sore
NASH
Risk factors
Figure 5 Risk factors for nonalcoholic steatohepatitis subset. NASH: nonalcoholic steatohepatitis.
Perumpail BJ et al . Disease burden of NAFLD
8272 December 21, 2017|Volume 23|Issue 47|WJG|www.wjgnet.com
population have consistently shown increased mor-tality in NAFLD. However, these studies did not adjust for metabolic confounders in the setting of NAFLD. Data from NHANES Ⅲ revealed no significant difference in the overall survival of ultrasonography-diagnosed subjects with NAFLD compared with the non-NAFLD population after adjusting for multiple metabolic factors[17]. These results suggest that NASH and/or fibrosis may be the major driver contributing to significant long-term outcomes[17].
Causes of mortality in NAFLDNAFLD is associated with increased overall mortality, with ranges for the standardized mortality ratio (SMR) of 1.34-2.6 compared to the general population[114]. An early landmark study by Adams et al[82] documented that patients with NAFLD (n = 435) from Olmsted County, diagnosed histologically or by ultrasonography demonstrated a significantly higher risk of mortality during 7.6 years of follow-up (SMR = 1.34, 95%CI: 1.00-1.76). In this study, liver-related mortality was the third most common cause of death, after malignancy and cardiovascular disease[82]. This is in contrast to the general population where liver-related mortality is reported 12th most common cause of death[115]. NASH cirrhosis has been compared to hepatitis C-related cirrhosis in multiple studies with majority of the studies showing decreased or comparable mortality and lower or similar cirrhosis-related complications and/or HCC[101,114]. However, the cardiovascular mortality was higher in NASH cirrhosis[100]. The increased risk for cardiovascular mortality can be explained by the decreased morbidity when compared to chronic hepatitis C-related cirrhosis. Thus, most patients may outlive their liver disease but develop fatal complications from cardiovascular disease and malignancies.
CONCLUSION NAFLD is a term for a host of histological findings stemming from hepatic steatosis and remains the most common liver disease globally with increasing prevalence. The vast variation in disease presentation complicates diagnosis, leading to an underestimate of actual disease occurrence. NAFLD is associated with many metabolic comorbidities, including obesity, type Ⅱ diabetes, dyslipidemia, and metabolic synd-rome. Its potential to develop into more severe liver conditions, such as NASH, advanced fibrosis, cirrhosis and HCC, can lead to a state in which LT is the only treatment option available. The population at risk of developing progressive liver disease creates a challenge to the healthcare system in terms of screening for this evolving epidemic of liver disease. Further research must be conducted to understand NAFLD pathophysiology and its treatment, as well as, define accurate incidence, current disease burden, and
socioeconomic effects of this disease.
REFERENCES1 Chalasani N, Younossi Z, Lavine JE, Diehl AM, Brunt EM, Cusi K,
Charlton M, Sanyal AJ; American Gastroenterological Association; American Association for the Study of Liver Diseases; American College of Gastroenterologyh. The diagnosis and management of non-alcoholic fatty liver disease: practice guideline by the American Gastroenterological Association, American Association for the Study of Liver Diseases, and American College of Gastroenterology. Gastroenterology 2012; 142: 1592-1609 [PMID: 22656328 DOI: 10.1053/j.gastro.2012.04.001]
2 Siegel R, Naishadham D, Jemal A. Cancer statistics, 2012. CA Cancer J Clin 2012; 62: 10-29 [PMID: 22237781 DOI: 10.3322/caac.20138]
3 Younossi ZM, Koenig AB, Abdelatif D, Fazel Y, Henry L, Wymer M. Global epidemiology of nonalcoholic fatty liver disease-Meta-analytic assessment of prevalence, incidence, and outcomes. Hepatology 2016; 64: 73-84 [PMID: 26707365 DOI: 10.1002/hep.28431]
4 Loomba R, Sanyal AJ. The global NAFLD epidemic. Nat Rev Gastroenterol Hepatol 2013; 10: 686-690 [PMID: 24042449 DOI: 10.1038/nrgastro.2013.171]
5 Hamaguchi M, Kojima T, Takeda N, Nakagawa T, Taniguchi H, Fujii K, Omatsu T, Nakajima T, Sarui H, Shimazaki M, Kato T, Okuda J, Ida K. The metabolic syndrome as a predictor of nonalcoholic fatty liver disease. Ann Intern Med 2005; 143: 722-728 [PMID: 16287793]
6 Suzuki A, Angulo P, Lymp J, St Sauver J, Muto A, Okada T, Lindor K. Chronological development of elevated aminotransferases in a nonalcoholic population. Hepatology 2005; 41: 64-71 [PMID: 15690483 DOI: 10.1002/hep.20543]
7 Whalley S, Puvanachandra P, Desai A, Kennedy H. Hepatology outpatient service provision in secondary care: a study of liver disease incidence and resource costs. Clin Med (Lond) 2007; 7: 119-124 [PMID: 17491498]
8 Vernon G, Baranova A, Younossi ZM. Systematic review: the epidemiology and natural history of non-alcoholic fatty liver disease and non-alcoholic steatohepatitis in adults. Aliment Pharmacol Ther 2011; 34: 274-285 [PMID: 21623852 DOI: 10.1111/j.1365-2036.2011.04724.x]
9 Clark JM, Brancati FL, Diehl AM. The prevalence and etiology of elevated aminotransferase levels in the United States. Am J Gastroenterol 2003; 98: 960-967 [PMID: 12809815 DOI: 10.1111/j.1572-0241.2003.07486.x]
10 Hernaez R, Lazo M, Bonekamp S, Kamel I, Brancati FL, Guallar E, Clark JM. Diagnostic accuracy and reliability of ultrasonography for the detection of fatty liver: a meta-analysis. Hepatology 2011; 54: 1082-1090 [PMID: 21618575 DOI: 10.1002/hep.24452]
11 Amarapurkar D, Kamani P, Patel N, Gupte P, Kumar P, Agal S, Baijal R, Lala S, Chaudhary D, Deshpande A. Prevalence of non-alcoholic fatty liver disease: population based study. Ann Hepatol 2007; 6: 161-163 [PMID: 17786142]
12 Williams CD, Stengel J, Asike MI, Torres DM, Shaw J, Contreras M, Landt CL, Harrison SA. Prevalence of nonalcoholic fatty liver disease and nonalcoholic steatohepatitis among a largely middle-aged population utilizing ultrasound and liver biopsy: a prospective study. Gastroenterology 2011; 140: 124-131 [PMID: 20858492 DOI: 10.1053/j.gastro.2010.09.038]
13 Browning JD, Szczepaniak LS, Dobbins R, Nuremberg P, Horton JD, Cohen JC, Grundy SM, Hobbs HH. Prevalence of hepatic steatosis in an urban population in the United States: impact of ethnicity. Hepatology 2004; 40: 1387-1395 [PMID: 15565570 DOI: 10.1002/hep.20466]
14 Szczepaniak LS, Nurenberg P, Leonard D, Browning JD, Reingold JS, Grundy S, Hobbs HH, Dobbins RL. Magnetic resonance
Perumpail BJ et al . Disease burden of NAFLD
8273 December 21, 2017|Volume 23|Issue 47|WJG|www.wjgnet.com
spectroscopy to measure hepatic triglyceride content: prevalence of hepatic steatosis in the general population. Am J Physiol Endocrinol Metab 2005; 288: E462-E468 [PMID: 15339742 DOI: 10.1152/ajpendo.00064.2004]
15 Farrell GC, Wong VW, Chitturi S. NAFLD in Asia--as common and important as in the West. Nat Rev Gastroenterol Hepatol 2013; 10: 307-318 [PMID: 23458891 DOI: 10.1038/nrgastro.2013.34]
16 Younossi ZM, Stepanova M, Afendy M, Fang Y, Younossi Y, Mir H, Srishord M. Changes in the prevalence of the most common causes of chronic liver diseases in the United States from 1988 to 2008. Clin Gastroenterol Hepatol 2011; 9: 524-530.e1; quiz e60 [PMID: 21440669 DOI: 10.1016/j.cgh.2011.03.020]
17 Kim D, Kim WR, Kim HJ, Therneau TM. Association between noninvasive fibrosis markers and mortality among adults with nonalcoholic fatty liver disease in the United States. Hepatology 2013; 57: 1357-1365 [PMID: 23175136 DOI: 10.1002/hep.26156]
18 Younossi ZM, Blissett D, Blissett R, Henry L, Stepanova M, Younossi Y, Racila A, Hunt S, Beckerman R. The economic and clinical burden of nonalcoholic fatty liver disease in the United States and Europe. Hepatology 2016; 64: 1577-1586 [PMID: 27543837 DOI: 10.1002/hep.28785]
19 Martini EM, Garrett N, Lindquist T, Isham GJ. The boomers are coming: a total cost of care model of the impact of population aging on health care costs in the United States by Major Practice Category. Health Serv Res 2007; 42: 201-218 [PMID: 17355589 DOI: 10.1111/j.1475-6773.2006.00607.x]
20 Younossi ZM, Henry L. Economic and Quality-of-Life Implications of Non-Alcoholic Fatty Liver Disease. Pharmacoeconomics 2015; 33 : 1245-1253 [PMID: 26233836 DOI: 10.1007/s40273-015-0316-5]
21 Schwimmer JB, Celedon MA, Lavine JE, Salem R, Campbell N, Schork NJ, Shiehmorteza M, Yokoo T, Chavez A, Middleton MS, Sirlin CB. Heritability of nonalcoholic fatty liver disease. Gastroenterology 2009; 136: 1585-1592 [PMID: 19208353 DOI: 10.1053/j.gastro.2009.01.050]
22 Sookoian S, Pirola CJ. Meta-analysis of the influence of I148M variant of patatin-like phospholipase domain containing 3 gene (PNPLA3) on the susceptibility and histological severity of nonalcoholic fatty liver disease. Hepatology 2011; 53: 1883-1894 [PMID: 21381068 DOI: 10.1002/hep.24283]
23 Rotman Y, Koh C, Zmuda JM, Kleiner DE, Liang TJ; NASH CRN. The association of genetic variability in patatin-like phospholipase domain-containing protein 3 (PNPLA3) with histological severity of nonalcoholic fatty liver disease. Hepatology 2010; 52: 894-903 [PMID: 20684021 DOI: 10.1002/hep.23759]
24 Romeo S, Kozlitina J, Xing C, Pertsemlidis A, Cox D, Pennacchio LA, Boerwinkle E, Cohen JC, Hobbs HH. Genetic variation in PNPLA3 confers susceptibility to nonalcoholic fatty liver disease. Nat Genet 2008; 40: 1461-1465 [PMID: 18820647 DOI: 10.1038/ng.257]
25 Speliotes EK, Butler JL, Palmer CD, Voight BF; GIANT Consortium; MIGen Consortium; NASH CRN, Hirschhorn JN. PNPLA3 variants specifically confer increased risk for histologic nonalcoholic fatty liver disease but not metabolic disease. Hepatology 2010; 52: 904-912 [PMID: 20648472 DOI: 10.1002/hep.23768]
26 Valenti L, Al-Serri A, Daly AK, Galmozzi E, Rametta R, Dongiovanni P, Nobili V, Mozzi E, Roviaro G, Vanni E, Bugianesi E, Maggioni M, Fracanzani AL, Fargion S, Day CP. Homozygosity for the patatin-like phospholipase-3/adiponutrin I148M polymorphism influences liver fibrosis in patients with nonalcoholic fatty liver disease. Hepatology 2010; 51: 1209-1217 [PMID: 20373368 DOI: 10.1002/hep.23622]
27 Kozlitina J, Smagris E, Stender S, Nordestgaard BG, Zhou HH, Tybjærg-Hansen A, Vogt TF, Hobbs HH, Cohen JC. Exome-wide association study identifies a TM6SF2 variant that confers susceptibility to nonalcoholic fatty liver disease. Nat Genet 2014; 46: 352-356 [PMID: 24531328 DOI: 10.1038/ng.2901]
28 Liu YL, Reeves HL, Burt AD, Tiniakos D, McPherson S, Leathart JB, Allison ME, Alexander GJ, Piguet AC, Anty R, Donaldson P,
Aithal GP, Francque S, Van Gaal L, Clement K, Ratziu V, Dufour JF, Day CP, Daly AK, Anstee QM. TM6SF2 rs58542926 influences hepatic fibrosis progression in patients with non-alcoholic fatty liver disease. Nat Commun 2014; 5: 4309 [PMID: 24978903 DOI: 10.1038/ncomms5309]
29 Yang JD, Abdelmalek MF, Pang H, Guy CD, Smith AD, Diehl AM, Suzuki A. Gender and menopause impact severity of fibrosis among patients with nonalcoholic steatohepatitis. Hepatology 2014; 59: 1406-1414 [PMID: 24123276 DOI: 10.1002/hep.26761]
30 Welsh JA, Karpen S, Vos MB. Increasing prevalence of nonalcoholic fatty liver disease among United States adolescents, 1988-1994 to 2007-2010. J Pediatr 2013; 162: 496-500.e1 [PMID: 23084707 DOI: 10.1016/j.jpeds.2012.08.043]
31 Doycheva I, Watt KD, Rifai G, Abou Mrad R, Lopez R, Zein NN, Carey WD, Alkhouri N. Increasing Burden of Chronic Liver Disease Among Adolescents and Young Adults in the USA: A Silent Epidemic. Dig Dis Sci 2017; 62: 1373-1380 [PMID: 28194666 DOI: 10.1007/s10620-017-4492-3]
32 Choi SY, Kim D, Kim HJ, Kang JH, Chung SJ, Park MJ, Kim YS, Kim CH, Choi SH, Kim W, Kim YJ, Yoon JH, Lee HS, Cho SH, Sung MW, Oh BH. The relation between non-alcoholic fatty liver disease and the risk of coronary heart disease in Koreans. Am J Gastroenterol 2009; 104: 1953-1960 [PMID: 19491838 DOI: 10.1038/ajg.2009.238]
33 Lazo M, Hernaez R, Eberhardt MS, Bonekamp S, Kamel I, Guallar E, Koteish A, Brancati FL, Clark JM. Prevalence of nonalcoholic fatty liver disease in the United States: the Third National Health and Nutrition Examination Survey, 1988-1994. Am J Epidemiol 2013; 178: 38-45 [PMID: 23703888 DOI: 10.1093/aje/kws448]
34 Kagansky N, Levy S, Keter D, Rimon E, Taiba Z, Fridman Z, Berger D, Knobler H, Malnick S. Non-alcoholic fatty liver disease--a common and benign finding in octogenarian patients. Liver Int 2004; 24: 588-594 [PMID: 15566509 DOI: 10.1111/j.1478-3231.2004.0969.x]
35 Torres DM, Williams CD, Harrison SA. Features, diagnosis, and treatment of nonalcoholic fatty liver disease. Clin Gastroenterol Hepatol 2012; 10: 837-858 [PMID: 22446927 DOI: 10.1016/j.cgh.2012.03.011]
36 Saab S, Manne V, Nieto J, Schwimmer JB, Chalasani NP. Nonalcoholic Fatty Liver Disease in Latinos. Clin Gastroenterol Hepatol 2016; 14: 5-12; quiz e9-10 [PMID: 25976180 DOI: 10.1016/j.cgh.2015.05.001]
37 Farrell GC. The liver and the waistline: Fifty years of growth. J Gastroenterol Hepatol 2009; 24 Suppl 3: S105-S118 [PMID: 19799688 DOI: 10.1111/j.1440-1746.2009.06080.x]
38 Kim D, Chung GE, Kwak MS, Seo HB, Kang JH, Kim W, Kim YJ, Yoon JH, Lee HS, Kim CY. Body Fat Distribution and Risk of Incident and Regressed Nonalcoholic Fatty Liver Disease. Clin Gastroenterol Hepatol 2016; 14: 132-138.e4 [PMID: 26226099 DOI: 10.1016/j.cgh.2015.07.024]
39 Yu SJ, Kim W, Kim D, Yoon JH, Lee K, Kim JH, Cho EJ, Lee JH, Kim HY, Kim YJ, Kim CY. Visceral Obesity Predicts Significant Fibrosis in Patients With Nonalcoholic Fatty Liver Disease. Medicine (Baltimore) 2015; 94: e2159 [PMID: 26632897 DOI: 10.1097/MD.0000000000002159]
40 Zelber-Sagi S, Lotan R, Shlomai A, Webb M, Harrari G, Buch A, Nitzan Kaluski D, Halpern Z, Oren R. Predictors for incidence and remission of NAFLD in the general population during a seven-year prospective follow-up. J Hepatol 2012; 56: 1145-1151 [PMID: 22245895 DOI: 10.1016/j.jhep.2011.12.011]
41 Chang Y, Ryu S, Sung E, Woo HY, Cho SI, Yoo SH, Ahn HY, Choi NK. Weight gain within the normal weight range predicts ultrasonographically detected fatty liver in healthy Korean men. Gut 2009; 58: 1419-1425 [PMID: 19505882 DOI: 10.1136/gut.2008.161885]
42 Fan JG, Zhou Q, Wo QH. [Effect of body weight mass and its change on the incidence of nonalcoholic fatty liver disease]. Zhonghua Gan Zang Bing Za Zhi 2010; 18: 676-679 [PMID: 20943079 DOI: 10.3760/cma.j.issn.1007-3418.2010.09.008]
43 Kim HK, Park JY, Lee KU, Lee GE, Jeon SH, Kim JH, Kim
Perumpail BJ et al . Disease burden of NAFLD
8274 December 21, 2017|Volume 23|Issue 47|WJG|www.wjgnet.com
CH. Effect of body weight and lifestyle changes on long-term course of nonalcoholic fatty liver disease in Koreans. Am J Med Sci 2009; 337: 98-102 [PMID: 19214024 DOI: 10.1097/MAJ.0b013e3181812879]
44 Bray GA, Popkin BM. Calorie-sweetened beverages and fructose: what have we learned 10 years later. Pediatr Obes 2013; 8: 242-248 [PMID: 23625798 DOI: 10.1111/j.2047-6310.2013.00171.x]
45 Cusi K. Nonalcoholic fatty liver disease in type 2 diabetes mellitus. Curr Opin Endocrinol Diabetes Obes 2009; 16: 141-149 [PMID: 19262374 DOI: 10.1097/MED.0b013e3283293015]
46 Portillo-Sanchez P, Bril F, Maximos M, Lomonaco R, Biernacki D, Orsak B, Subbarayan S, Webb A, Hecht J, Cusi K. High Prevalence of Nonalcoholic Fatty Liver Disease in Patients With Type 2 Diabetes Mellitus and Normal Plasma Aminotransferase Levels. J Clin Endocrinol Metab 2015; 100: 2231-2238 [PMID: 25885947 DOI: 10.1210/jc.2015-1966]
47 Stepanova M, Rafiq N, Younossi ZM. Components of metabolic syndrome are independent predictors of mortality in patients with chronic liver disease: a population-based study. Gut 2010; 59: 1410-1415 [PMID: 20660697 DOI: 10.1136/gut.2010.213553]
48 Patel SR, Malhotra A, White DP, Gottlieb DJ, Hu FB. Association between reduced sleep and weight gain in women. Am J Epidemiol 2006; 164: 947-954 [PMID: 16914506 DOI: 10.1093/aje/kwj280]
49 Hsieh SD, Muto T, Murase T, Tsuji H, Arase Y. Association of short sleep duration with obesity, diabetes, fatty liver and behavioral factors in Japanese men. Intern Med 2011; 50: 2499-2502 [PMID: 22041348]
50 Trovato FM, Martines GF, Brischetto D, Catalano D, Musumeci G, Trovato GM. Fatty liver disease and lifestyle in youngsters: diet, food intake frequency, exercise, sleep shortage and fashion. Liver Int 2016; 36: 427-433 [PMID: 26346413 DOI: 10.1111/liv.12957]
51 Trovato FM, Martines GF, Brischetto D, Trovato G, Catalano D. Neglected features of lifestyle: Their relevance in non-alcoholic fatty liver disease. World J Hepatol 2016; 8: 1459-1465 [PMID: 27957244 DOI: 10.4254/wjh.v8.i33.1459]
52 Kim CW, Yun KE, Jung HS, Chang Y, Choi ES, Kwon MJ, Lee EH, Woo EJ, Kim NH, Shin H, Ryu S. Sleep duration and quality in relation to non-alcoholic fatty liver disease in middle-aged workers and their spouses. J Hepatol 2013; 59: 351-357 [PMID: 23578884 DOI: 10.1016/j.jhep.2013.03.035]
53 Jarrar MH, Baranova A, Collantes R, Ranard B, Stepanova M, Bennett C, Fang Y, Elariny H, Goodman Z, Chandhoke V, Younossi ZM. Adipokines and cytokines in non-alcoholic fatty liver disease. Aliment Pharmacol Ther 2008; 27: 412-421 [PMID: 18081738 DOI: 10.1111/j.1365-2036.2007.03586.x]
54 Wieckowska A, Papouchado BG, Li Z, Lopez R, Zein NN, Feldstein AE. Increased hepatic and circulating interleukin-6 levels in human nonalcoholic steatohepatitis. Am J Gastroenterol 2008; 103: 1372-1379 [PMID: 18510618 DOI: 10.1111/j.1572-0241.2007.01774.x]
55 Langin D, Arner P. Importance of TNFalpha and neutral lipases in human adipose tissue lipolysis. Trends Endocrinol Metab 2006; 17: 314-320 [PMID: 16938460 DOI: 10.1016/j.tem.2006.08.003]
56 Vgontzas AN, Bixler EO, Lin HM, Prolo P, Mastorakos G, Vela-Bueno A, Kales A, Chrousos GP. Chronic insomnia is associated with nyctohemeral activation of the hypothalamic-pituitary-adrenal axis: clinical implications. J Clin Endocrinol Metab 2001; 86: 3787-3794 [PMID: 11502812 DOI: 10.1210/jcem.86.8.7778]
57 Targher G, Bertolini L, Rodella S, Zoppini G, Zenari L, Falezza G. Associations between liver histology and cortisol secretion in subjects with nonalcoholic fatty liver disease. Clin Endocrinol (Oxf) 2006; 64: 337-341 [PMID: 16487446 DOI: 10.1111/j.1365-2265.2006.02466.x]
58 Kleiner DE, Brunt EM, Van Natta M, Behling C, Contos MJ, Cummings OW, Ferrell LD, Liu YC, Torbenson MS, Unalp-Arida A, Yeh M, McCullough AJ, Sanyal AJ; Nonalcoholic Steatohepatitis Clinical Research Network. Design and validation of a histological scoring system for nonalcoholic fatty liver disease. Hepatology 2005; 41: 1313-1321 [PMID: 15915461 DOI: 10.1002/hep.20701]
59 Juluri R, Vuppalanchi R, Olson J, Unalp A, Van Natta ML, Cummings OW, Tonascia J, Chalasani N. Generalizability of the nonalcoholic steatohepatitis Clinical Research Network histologic scoring system for nonalcoholic fatty liver disease. J Clin Gastroenterol 2011; 45: 55-58 [PMID: 20505526 DOI: 10.1097/MCG.0b013e3181dd1348]
60 Kaswala DH, Lai M, Afdhal NH. Fibrosis Assessment in Nonalcoholic Fatty Liver Disease (NAFLD) in 2016. Dig Dis Sci 2016; 61: 1356-1364 [PMID: 27017224 DOI: 10.1007/s10620-016-4079-4]
61 Imajo K, Kessoku T, Honda Y, Tomeno W, Ogawa Y, Mawatari H, Fujita K, Yoneda M, Taguri M, Hyogo H, Sumida Y, Ono M, Eguchi Y, Inoue T, Yamanaka T, Wada K, Saito S, Nakajima A. Magnetic Resonance Imaging More Accurately Classifies Steatosis and Fibrosis in Patients With Nonalcoholic Fatty Liver Disease Than Transient Elastography. Gastroenterology 2016; 150: 626-637.e7 [PMID: 26677985 DOI: 10.1053/j.gastro.2015.11.048]
62 Bohte AE, van Werven JR, Bipat S, Stoker J. The diagnostic accuracy of US, CT, MRI and 1H-MRS for the evaluation of hepatic steatosis compared with liver biopsy: a meta-analysis. Eur Radiol 2011; 21: 87-97 [PMID: 20680289 DOI: 10.1007/s00330-010-1905-5]
63 Schwenzer NF, Springer F, Schraml C, Stefan N, Machann J, Schick F. Non-invasive assessment and quantification of liver steatosis by ultrasound, computed tomography and magnetic resonance. J Hepatol 2009; 51: 433-445 [PMID: 19604596 DOI: 10.1016/j.jhep.2009.05.023]
64 Le Y, Kroeker R, Kipfer HD, Lin C. Development and evaluation of TWIST Dixon for dynamic contrast-enhanced (DCE) MRI with improved acquisition efficiency and fat suppression. J Magn Reson Imaging 2012; 36: 483-491 [PMID: 22544731 DOI: 10.1002/jmri.23663]
65 Noureddin M, Lam J, Peterson MR, Middleton M, Hamilton G, Le TA, Bettencourt R, Changchien C, Brenner DA, Sirlin C, Loomba R. Utility of magnetic resonance imaging versus histology for quantifying changes in liver fat in nonalcoholic fatty liver disease trials. Hepatology 2013; 58: 1930-1940 [PMID: 23696515 DOI: 10.1002/hep.26455]
66 Venkatesh SK, Yin M, Takahashi N, Glockner JF, Talwalkar JA, Ehman RL. Non-invasive detection of liver fibrosis: MR imaging features vs. MR elastography. Abdom Imaging 2015; 40: 766-775 [PMID: 25805619 DOI: 10.1007/s00261-015-0347-6]
67 Loomba R, Sirlin CB, Ang B, Bettencourt R, Jain R, Salotti J, Soaft L, Hooker J, Kono Y, Bhatt A, Hernandez L, Nguyen P, Noureddin M, Haufe W, Hooker C, Yin M, Ehman R, Lin GY, Valasek MA, Brenner DA, Richards L; San Diego Integrated NAFLD Research Consortium (SINC). Ezetimibe for the treatment of nonalcoholic steatohepatitis: assessment by novel magnetic resonance imaging and magnetic resonance elastography in a randomized trial (MOZART trial). Hepatology 2015; 61: 1239-1250 [PMID: 25482832 DOI: 10.1002/hep.27647]
68 Chen J, Talwalkar JA, Yin M, Glaser KJ, Sanderson SO, Ehman RL. Early detection of nonalcoholic steatohepatitis in patients with nonalcoholic fatty liver disease by using MR elastography. Radiology 2011; 259: 749-756 [PMID: 21460032 DOI: 10.1148/radiol.11101942]
69 Sanyal AJ, Chalasani N, Kowdley KV, McCullough A, Diehl AM, Bass NM, Neuschwander-Tetri BA, Lavine JE, Tonascia J, Unalp A, Van Natta M, Clark J, Brunt EM, Kleiner DE, Hoofnagle JH, Robuck PR; NASH CRN. Pioglitazone, vitamin E, or placebo for nonalcoholic steatohepatitis. N Engl J Med 2010; 362: 1675-1685 [PMID: 20427778 DOI: 10.1056/NEJMoa0907929]
70 Lavine JE, Schwimmer JB, Van Natta ML, Molleston JP, Murray KF, Rosenthal P, Abrams SH, Scheimann AO, Sanyal AJ, Chalasani N, Tonascia J, Ünalp A, Clark JM, Brunt EM, Kleiner DE, Hoofnagle JH, Robuck PR; Nonalcoholic Steatohepatitis Clinical Research Network. Effect of vitamin E or metformin for treatment of nonalcoholic fatty liver disease in children and adolescents: the TONIC randomized controlled trial. JAMA 2011; 305: 1659-1668 [PMID: 21521847 DOI: 10.1001/jama.2011.520]
71 Lutchman G, Modi A, Kleiner DE, Promrat K, Heller T, Ghany M,
Perumpail BJ et al . Disease burden of NAFLD
8275 December 21, 2017|Volume 23|Issue 47|WJG|www.wjgnet.com
Borg B, Loomba R, Liang TJ, Premkumar A, Hoofnagle JH. The effects of discontinuing pioglitazone in patients with nonalcoholic steatohepatitis. Hepatology 2007; 46: 424-429 [PMID: 17559148 DOI: 10.1002/hep.21661]
72 Neuschwander-Tetri BA, Loomba R, Sanyal AJ, Lavine JE, Van Natta ML, Abdelmalek MF, Chalasani N, Dasarathy S, Diehl AM, Hameed B, Kowdley KV, McCullough A, Terrault N, Clark JM, Tonascia J, Brunt EM, Kleiner DE, Doo E; NASH Clinical Research Network. Farnesoid X nuclear receptor ligand obeticholic acid for non-cirrhotic, non-alcoholic steatohepatitis (FLINT): a multicentre, randomised, placebo-controlled trial. Lancet 2015; 385: 956-965 [PMID: 25468160 DOI: 10.1016/S0140-6736(14)61933-4]
73 Loomba R, Lutchman G, Kleiner DE, Ricks M, Feld JJ, Borg BB, Modi A, Nagabhyru P, Sumner AE, Liang TJ, Hoofnagle JH. Clinical trial: pilot study of metformin for the treatment of non-alcoholic steatohepatitis. Aliment Pharmacol Ther 2009; 29: 172-182 [PMID: 18945255 DOI: 10.1111/j.1365-2036.2008.03869.x]
74 Zhang X, Harmsen WS, Mettler TA, Kim WR, Roberts RO, Therneau TM, Roberts LR, Chaiteerakij R. Continuation of metformin use after a diagnosis of cirrhosis significantly improves survival of patients with diabetes. Hepatology 2014; 60: 2008-2016 [PMID: 24798175 DOI: 10.1002/hep.27199]
75 Younossi ZM, Gramlich T, Liu YC, Matteoni C, Petrelli M, Goldblum J, Rybicki L, McCullough AJ. Nonalcoholic fatty liver disease: assessment of variability in pathologic interpretations. Mod Pathol 1998; 11: 560-565 [PMID: 9647594]
76 Gawrieh S, Knoedler DM, Saeian K, Wallace JR, Komorowski RA. Effects of interventions on intra- and interobserver agreement on interpretation of nonalcoholic fatty liver disease histology. Ann Diagn Pathol 2011; 15: 19-24 [PMID: 21106424 DOI: 10.1016/j.anndiagpath.2010.08.001]
77 Pais R, Charlotte F, Fedchuk L, Bedossa P, Lebray P, Poynard T, Ratziu V; LIDO Study Group. A systematic review of follow-up biopsies reveals disease progression in patients with non-alcoholic fatty liver. J Hepatol 2013; 59: 550-556 [PMID: 23665288 DOI: 10.1016/j.jhep.2013.04.027]
78 Pais R, Pascale A, Fedchuck L, Charlotte F, Poynard T, Ratziu V. Progression from isolated steatosis to steatohepatitis and fibrosis in nonalcoholic fatty liver disease. Clin Res Hepatol Gastroenterol 2011; 35: 23-28 [PMID: 21634051]
79 Noureddin M, Yates KP, Vaughn IA, Neuschwander-Tetri BA, Sanyal AJ, McCullough A, Merriman R, Hameed B, Doo E, Kleiner DE, Behling C, Loomba R; NASH CRN. Clinical and histological determinants of nonalcoholic steatohepatitis and advanced fibrosis in elderly patients. Hepatology 2013; 58: 1644-1654 [PMID: 23686698 DOI: 10.1002/hep.26465]
80 Matteoni CA, Younossi ZM, Gramlich T, Boparai N, Liu YC, McCullough AJ. Nonalcoholic fatty liver disease: a spectrum of clinical and pathological severity. Gastroenterology 1999; 116: 1413-1419 [PMID: 10348825]
81 Rafiq N, Bai C, Fang Y, Srishord M, McCullough A, Gramlich T, Younossi ZM. Long-term follow-up of patients with nonalcoholic fatty liver. Clin Gastroenterol Hepatol 2009; 7: 234-238 [PMID: 19049831 DOI: 10.1016/j.cgh.2008.11.005]
82 Adams LA, Lymp JF, St Sauver J, Sanderson SO, Lindor KD, Feldstein A, Angulo P. The natural history of nonalcoholic fatty liver disease: a population-based cohort study. Gastroenterology 2005; 129: 113-121 [PMID: 16012941]
83 Bhala N, Angulo P, van der Poorten D, Lee E, Hui JM, Saracco G, Adams LA, Charatcharoenwitthaya P, Topping JH, Bugianesi E, Day CP, George J. The natural history of nonalcoholic fatty liver disease with advanced fibrosis or cirrhosis: an international collaborative study. Hepatology 2011; 54: 1208-1216 [PMID: 21688282 DOI: 10.1002/hep.24491]
84 Söderberg C, Stål P, Askling J, Glaumann H, Lindberg G, Marmur J, Hultcrantz R. Decreased survival of subjects with elevated liver function tests during a 28-year follow-up. Hepatology 2010; 51: 595-602 [PMID: 20014114 DOI: 10.1002/hep.23314]
85 Sanyal AJ, Friedman SL, McCullough AJ, Dimick-Santos
L; American Association for the Study of Liver Diseases; United States Food and Drug Administration. Challenges and opportunities in drug and biomarker development for nonalcoholic steatohepatitis: findings and recommendations from an American Association for the Study of Liver Diseases-U.S. Food and Drug Administration Joint Workshop. Hepatology 2015; 61: 1392-1405 [PMID: 25557690 DOI: 10.1002/hep.27678]
86 Sanal MG. Biomarkers in nonalcoholic fatty liver disease-the emperor has no clothes? World J Gastroenterol 2015; 21: 3223-3231 [PMID: 25805928 DOI: 10.3748/wjg.v21.i11.3223]
87 Nascimbeni F, Pais R, Bellentani S, Day CP, Ratziu V, Loria P, Lonardo A. From NAFLD in clinical practice to answers from guidelines. J Hepatol 2013; 59: 859-871 [PMID: 23751754 DOI: 10.1016/j.jhep.2013.05.044]
88 Lackner C, Gogg-Kamerer M, Zatloukal K, Stumptner C, Brunt EM, Denk H. Ballooned hepatocytes in steatohepatitis: the value of keratin immunohistochemistry for diagnosis. J Hepatol 2008; 48: 821-828 [PMID: 18329127 DOI: 10.1016/j.jhep.2008.01.026]
89 Wieckowska A, Zein NN, Yerian LM, Lopez AR, McCullough AJ, Feldstein AE. In vivo assessment of liver cell apoptosis as a novel biomarker of disease severity in nonalcoholic fatty liver disease. Hepatology 2006; 44: 27-33 [PMID: 16799979 DOI: 10.1002/hep.21223]
90 Cusi K, Chang Z, Harrison S, Lomonaco R, Bril F, Orsak B, Ortiz-Lopez C, Hecht J, Feldstein AE, Webb A, Louden C, Goros M, Tio F. Limited value of plasma cytokeratin-18 as a biomarker for NASH and fibrosis in patients with non-alcoholic fatty liver disease. J Hepatol 2014; 60: 167-174 [PMID: 23973932 DOI: 10.1016/j.jhep.2013.07.042]
91 Festi D, Schiumerini R, Scaioli E, Colecchia A. Letter: FibroTest for staging fibrosis in non-alcoholic fatty liver disease - authors’ reply. Aliment Pharmacol Ther 2013; 37: 656-657 [PMID: 23406410 DOI: 10.1111/apt.12228]
92 Angulo P, Hui JM, Marchesini G, Bugianesi E, George J, Farrell GC, Enders F, Saksena S, Burt AD, Bida JP, Lindor K, Sanderson SO, Lenzi M, Adams LA, Kench J, Therneau TM, Day CP. The NAFLD fibrosis score: a noninvasive system that identifies liver fibrosis in patients with NAFLD. Hepatology 2007; 45: 846-854 [PMID: 17393509 DOI: 10.1002/hep.21496]
93 McPherson S, Stewart SF, Henderson E, Burt AD, Day CP. Simple non-invasive fibrosis scoring systems can reliably exclude advanced fibrosis in patients with non-alcoholic fatty liver disease. Gut 2010; 59: 1265-1269 [PMID: 20801772 DOI: 10.1136/gut.2010.216077]
94 Lichtinghagen R, Pietsch D, Bantel H, Manns MP, Brand K, Bahr MJ. The Enhanced Liver Fibrosis (ELF) score: normal values, influence factors and proposed cut-off values. J Hepatol 2013; 59: 236-242 [PMID: 23523583 DOI: 10.1016/j.jhep.2013.03.016]
95 Bugianesi E, Leone N, Vanni E, Marchesini G, Brunello F, Carucci P, Musso A, De Paolis P, Capussotti L, Salizzoni M, Rizzetto M. Expanding the natural history of nonalcoholic steatohepatitis: from cryptogenic cirrhosis to hepatocellular carcinoma. Gastroenterology 2002; 123: 134-140 [PMID: 12105842]
96 Teli MR, James OF, Burt AD, Bennett MK, Day CP. The natural history of nonalcoholic fatty liver: a follow-up study. Hepatology 1995; 22: 1714-1719 [PMID: 7489979]
97 Dam-Larsen S, Franzmann M, Andersen IB, Christoffersen P, Jensen LB, Sørensen TI, Becker U, Bendtsen F. Long term prognosis of fatty liver: risk of chronic liver disease and death. Gut 2004; 53: 750-755 [PMID: 15082596]
98 Wong VW, Wong GL, Choi PC, Chan AW, Li MK, Chan HY, Chim AM, Yu J, Sung JJ, Chan HL. Disease progression of non-alcoholic fatty liver disease: a prospective study with paired liver biopsies at 3 years. Gut 2010; 59: 969-974 [PMID: 20581244 DOI: 10.1136/gut.2009.205088]
99 McPherson S, Hardy T, Henderson E, Burt AD, Day CP, Anstee QM. Evidence of NAFLD progression from steatosis to fibrosing-steatohepatitis using paired biopsies: implications for prognosis and clinical management. J Hepatol 2015; 62: 1148-1155 [PMID: 25477264 DOI: 10.1016/j.jhep.2014.11.034]
Perumpail BJ et al . Disease burden of NAFLD
8276 December 21, 2017|Volume 23|Issue 47|WJG|www.wjgnet.com
100 Friedman LS. Liver, Biliary Tract Pancreatic disorders: Non-Alcoholic fatty liver disease. New York: Academic, 2015
101 Goh GB, McCullough AJ. Natural History of Nonalcoholic Fatty Liver Disease. Dig Dis Sci 2016; 61: 1226-1233 [PMID: 27003142 DOI: 10.1007/s10620-016-4095-4]
102 Ahmed A, Wong RJ, Harrison SA. Nonalcoholic Fatty Liver Disease Review: Diagnosis, Treatment, and Outcomes. Clin Gastroenterol Hepatol 2015; 13: 2062-2070 [PMID: 26226097 DOI: 10.1016/j.cgh.2015.07.029]
103 Njei B, Rotman Y, Ditah I, Lim JK. Emerging trends in hepatocellular carcinoma incidence and mortality. Hepatology 2015; 61: 191-199 [PMID: 25142309 DOI: 10.1002/hep.27388]
104 Hashimoto E, Yatsuji S, Tobari M, Taniai M, Torii N, Tokushige K, Shiratori K. Hepatocellular carcinoma in patients with nonalcoholic steatohepatitis. J Gastroenterol 2009; 44 Suppl 19: 89-95 [PMID: 19148800 DOI: 10.1007/s00535-008-2262-x]
105 Younossi ZM, Otgonsuren M, Henry L, Venkatesan C, Mishra A, Erario M, Hunt S. Association of nonalcoholic fatty liver disease (NAFLD) with hepatocellular carcinoma (HCC) in the United States from 2004 to 2009. Hepatology 2015; 62: 1723-1730 [PMID: 26274335 DOI: 10.1002/hep.28123]
106 Mittal S, El-Serag HB, Sada YH, Kanwal F, Duan Z, Temple S, May SB, Kramer JR, Richardson PA, Davila JA. Hepatocellular Carcinoma in the Absence of Cirrhosis in United States Veterans is Associated With Nonalcoholic Fatty Liver Disease. Clin Gastroenterol Hepatol 2016; 14: 124-131.e1 [PMID: 26196445 DOI: 10.1016/j.cgh.2015.07.019]
107 Rinella ME. Nonalcoholic fatty liver disease: a systematic review. JAMA 2015; 313: 2263-2273 [PMID: 26057287 DOI: 10.1001/jama.2015.5370]
108 Wong CR, Nguyen MH, Lim JK. Hepatocellular carcinoma in patients with non-alcoholic fatty liver disease. World J Gastroenterol
2016; 22: 8294-8303 [PMID: 27729736 DOI: 10.3748/wjg.v22.i37.8294]
109 White DL, Kanwal F, El-Serag HB. Association between nonalcoholic fatty liver disease and risk for hepatocellular cancer, based on systematic review. Clin Gastroenterol Hepatol 2012; 10: 1342-1359.e2 [PMID: 23041539 DOI: 10.1016/j.cgh.2012.10.001]
110 Charlton MR, Burns JM, Pedersen RA, Watt KD, Heimbach JK, Dierkhising RA. Frequency and outcomes of liver transplantation for nonalcoholic s teatohepat i t is in the United States . Gastroenterology 2011; 141: 1249-1253 [PMID: 21726509 DOI: 10.1053/j.gastro.2011.06.061]
111 Wong RJ, Aguilar M, Cheung R, Perumpail RB, Harrison SA, Younossi ZM, Ahmed A. Nonalcoholic steatohepatitis is the second leading etiology of liver disease among adults awaiting liver transplantation in the United States. Gastroenterology 2015; 148: 547-555 [PMID: 25461851 DOI: 10.1053/j.gastro.2014.11.039]
112 Wong RJ, Cheung R, Ahmed A. Nonalcoholic steatohepatitis is the most rapidly growing indication for liver transplantation in patients with hepatocellular carcinoma in the U.S. Hepatology 2014; 59: 2188-2195 [PMID: 24375711 DOI: 10.1002/hep.26986]
113 Angulo P, Kleiner DE, Dam-Larsen S, Adams LA, Bjornsson ES, Charatcharoenwitthaya P, Mills PR, Keach JC, Lafferty HD, Stahler A, Haflidadottir S, Bendtsen F. Liver Fibrosis, but No Other Histologic Features, Is Associated With Long-term Outcomes of Patients With Nonalcoholic Fatty Liver Disease. Gastroenterology 2015; 149: 389-397.e10 [PMID: 25935633 DOI: 10.1053/j.gastro.2015.04.043]
114 Kwak MS, Kim D. Long-Term Outcomes of Nonalcoholic Fatty Liver Disease. Curr Hepatol Rep 2015; 14: 69-76 [DOI: 10.1007/s11901-015-0258-6]
115 Heron M. Deaths: Leading Causes for 2014. Natl Vital Stat Rep 2016; 65: 1-96 [PMID: 27376998]
P- Reviewer: Blanco JR, Inzaugarat E, Trovato GMM S- Editor: Chen K L- Editor: A E- Editor: Huang Y
Perumpail BJ et al . Disease burden of NAFLD
Obese children with fatty liver: Between reality and disease mongering
Giusy Ranucci, Maria Immacolata Spagnuolo, Raffaele Iorio
Giusy Ranucci, Maria Immacolata Spagnuolo, Raffaele Iorio, Department of Translational Medical Science, Section of Pediatrics, University Federico II, Naples 80131, Italy
ORCID number: Giusy Ranucci (0000-0002-5895-7257); Maria Immacolata Spagnuolo (0000-0001-5396-4944); Raffaele Iorio (0000-0002-7483-234X).
Author contributions: All authors contributed to the manuscript.
Conflict-of-interest statement: Authors have no conflicts of interest to disclose.
Open-Access: This article is an open-access article which was selected by an in-house editor and fully peer-reviewed by external reviewers. It is distributed in accordance with the Creative Commons Attribution Non Commercial (CC BY-NC 4.0) license, which permits others to distribute, remix, adapt, build upon this work non-commercially, and license their derivative works on different terms, provided the original work is properly cited and the use is non-commercial. See: http://creativecommons.org/licenses/by-nc/4.0/
Manuscript source: Invited manuscript
Correspondence to: Raffaele Iorio, MD, Associate Profe-ssion, Department of Translational Medical Science, Section of Pediatrics, University Federico II, Via Pansini 5, Naples 80131, Italy. [email protected] Telephone: +39-81-7464337Fax: +39-81-7464337
Received: October 23, 2017Peer-review started: October 24, 2017First decision: November 8, 2017Revised: November 14, 2017Accepted: December 4, 2017 Article in press: December 4, 2017Published online: December 21, 2017
AbstractFollowing the current epidemic of obesity, the worldwide prevalence of nonalcoholic fatty liver disease (NAFLD)
has increased with potential serious health implications. While it is established that in adults NAFLD can progress to end-stage liver disease in many cases, the risk of progression during childhood is less well defined. Since most obese children are not adherent to lifestyle modifications and hypocaloric diets, there is a growing number of studies on pharmacological interventions with the risk of disease mongering, the practice of widening the boundaries of illness in order to expand the markets for treatment. Here, we propose a critical appraisal of the best available evidence about long-term course of pediatric NAFLD and efficacy of treatments other than hypocaloric diet and physical exercise. As a result, the number of NAFLD children with a poor outcome is small in spite of the alarming tones used in some papers; large-scale longitudinal studies with long-term follow-up of pediatric NAFLD patients are lacking; the studies on ancillary pharmacological interventions have been performed in few patients with inconclusive and conflicting results.
Key words: Obesity; Children; Non alcoholic fatty liver disease; Non alcoholic steatohepatitis; Cirrhosis; Liver transplant; Disease mongering
© The Author(s) 2017. Published by Baishideng Publishing Group Inc. All rights reserved.
Core tip: The number of obese children with nonal-coholic fatty liver with a documented poor outcome is small in spite of the alarming tones used in some papers. The available studies are insufficient to determine whether or not children with nonalcoholic fatty liver have an elevated risk of developing detrimental health conditions. Large-scale longitudinal studies with long-term follow-up of children with nonalcoholic fatty liver are desirable. Since most obese children are not adherent to lifestyle modifications and hypocaloric diets, there is a growing number of studies on pharmacological interventions with the risk of disease mongering, the practice of widening the
MINIREVIEWS
8277 December 21, 2017|Volume 23|Issue 47|WJG|www.wjgnet.com
Submit a Manuscript: http://www.f6publishing.com
DOI: 10.3748/wjg.v23.i47.8277
World J Gastroenterol 2017 December 21; 23(47): 8277-8282
ISSN 1007-9327 (print) ISSN 2219-2840 (online)
boundaries of illness in order to expand the markets for treatment. The studies on ancillary pharmacological interventions, in addition to diet and exercise, have been performed in few children with inconclusive and conflicting results. The proposal to the obese patient of an ancillary drug may divert his attention from the diet and exercise.
Ranucci G, Spagnuolo MI, Iorio R. Obese children with fatty liver: Between reality and disease mongering. World J Gastroenterol 2017; 23(47): 8277-8282 Available from: URL: http://www.wjgnet.com/1007-9327/full/v23/i47/8277.htm DOI: http://dx.doi.org/10.3748/wjg.v23.i47.8277
INTRODUCTIONChildhood obesity can adversely affect nearly every organ system with increased mortality in adult life from a wide variety of systemic diseases[1]. Following the current epidemic of obesity, the worldwide prevalence of nonalcoholic fatty liver disease (NAFLD) has doubled during the last 20 years with consequent potential serious health implications[2].
In adults NAFLD has been reported to progress to fibrosis and end-stage liver disease in some 15%-20% of cases, sometimes with need of liver transplan-tation[1,3]. Data on fibrosis, evolution to cirrhosis and/or liver cancer in large cohorts of children with NAFLD followed up long-term are scarce[1]. Despite this lack of information, there is a widespread tendency to draw alarming scenarios also for childhood NAFLD[4-6], bordering on the phenomenon of so called “disease mongering”, i.e. the practice of widening the diagnostic boundaries of illnesses and aggressively promoting their public awareness in order to expand the markets for treatment[7-9]. This concept is strictly related to medicalization, which implies an extension of medicine domain on three possible ways: qualitative (disease or not disease), quantitative (lowering threshold), temporal (antedating a diagnosis)[7-9]. It has been reported that the phenomenon of disease mongering is supported by informal alliances comprising drug company staff, physicians and consumer groups, which tend to promote a view of their particular condition as widespread, serious, and treatable[8]. In many cases these alliances are not maliciously preconceived and simply reflect the fear towards some conditions deemed dangerous to health[10]. Given the severe well-documented impact of obesity on health, for which it has been stated that we may see the first generation that will be less healthy and have a shorter life expectancy than their parents[11], it seems paradoxical to invoke the phenomenon of “disease mongering” for obesity-related liver disease. Nevertheless, in the case of obesity there are many myths and presumptions not scientifically supported[12]. Therefore, we think that the
impact of pediatric NAFLD on morbidity and mortality must be critically evaluated.
Risk of progression of pediatric NAFLD toward end-stage liver diseaseAs recently reported[1], there is only one long-term outcome study on the natural history of NAFLD in children, which emphasizes the risk of an unfavorable evolution[4]. In this paper 66 children with NAFLD were enrolled and only 29 patients underwent a baseline liver biopsy, 5 of whom also had a follow-up histology. Moreover, a substantial proportion of the patients enrolled in this study, considered the reference paper for the natural history of children with obesity-related liver disease[1], were not obese (34%) and did not have metabolic syndrome (17%). Anyway, only two patients required liver transplantation: an 11-year-old Hispanic female, with a body mass index (BMI) of 26.9 kg/m2, dyslipidemia, cirrhosis and esophageal varices at onset, transplanted at the age of 20 years for hepatopulmonary syndrome, with recurrence of NAFLD after 9 mo; and a 18.9-year-old female with a BMI of 33.6 kg/m2, low HDL level and hepatopulmonary syndrome, transplanted at the age of 25 years, re-transplanted for recurrence of NAFLD 2.3 years after, who died from multiple organ failure at the age of 27 years.
Both cases had a very severe and atypical clinical course with early recurrence of NAFLD after liver transplantation, suggesting that they might have been affected by an unrecognized genetic metabolic disorder other than NAFLD. In this respect, very little information is provided in the paper on what investigations were done to exclude underlying chronic liver disease. It is to note that hypothalamic-pituitary axis dysfunction and lysosomal acid lipase deficiency (in which the recurrence of non alcoholic steatohepatitis (NASH) following liver transplantation is common) were not ruled out[13].
In Feldstein’s study there were only two children with cirrhosis and these were the same two who required liver transplantation[4]. Overall, four children were included in the poor prognosis group: the two transplanted and two who died for complications related to bariatric surgery and whose death was not liver related. On the basis of the outcome of these four “atypical” patients with NAFLD, a standardized mortality risk of 13.6 was assigned to the category of the children with NAFLD in comparison with general population.
In the introduction of Feldstein’s report[4], particular emphasis is attributed to some cases of cirrhotic stage disease in children with NAFLD previously reported in literature. If we analyze the relative references, we realize that overall a total of only 5 cases were reported. These 5 cases included a 12-year-old boy with craniopharyngioma with secondary obesity[14], and a patient who developed at the age of 30 years
8278 December 21, 2017|Volume 23|Issue 47|WJG|www.wjgnet.com
Ranucci G et al . Obese children with fatty liver
hypertransaminasemia without evidence of metabolic syndrome with hepatic decompensation at 32 years[15]. Interestingly, though this patient had a low ceruloplasmin, Wilson disease was excluded only on the basis of urinary copper excretion[15]. The other two patients were drawn out of two case studies: one reported in 2003 by Schwimmer including 43 obese children[16] and the other reported in 1984 including 299 patients[17]. In these two studies further details about the two patients with cirrhosis were not provided.
Therefore, the critical analysis of the study[4] and its references shows that progressive liver disease is not a common complication of pediatric NAFLD[14-17].
Among the other reports of cirrhosis in children with NAFLD not cited in Feldstein’s study[4], one showed 3 cases of cirrhosis and 8 cases of advanced fibrosis among 100 children with histologically documented NAFLD[18]. Unfortunately, further details about these patients with severe histology were not provided also in this study which, however, documented fi-brosis absent or mild in about two thirds of cases[18]. Furthermore, an Italian study evaluating liver histology on a large sample of 203 children with NAFLD showed no case of stage 4 fibrosis and/or cirrhosis[19].
So far, the histologic evolution of children with NAFLD has been evaluated in few longitudinal studies[20,21]. In a cohort of one-hundred six children, 7 cases (6.6%) had a stage 3-4 fibrosis[21]. Paradoxically, these patients were significantly younger compared with those with mild or no fibrosis. Although the enrolled patients had an accurate histological eval-uation, only 46 patients (43%) were investigated for metabolic syndrome[21].
At the present time, severe cases seem to be too few to refute the arguments on the generally favorable course of pediatric NAFLD as supported from the literature analysis performed here and elsewhere[1].
Table 1[4,14-19,21-24] summarizes pediatric studies on NAFLD with indication of the cases of end stage-liver disease. Unfortunately, none of them provided long enough follow-up to assess long-term cumulative risk of severe outcomes. It is to note that almost all the evaluations were assessed in individuals under 20 years of age.
Risk of liver transplant for pediatric NAFLDWhile NASH has become the second leading etiology of liver disease among adults awaiting liver transplantation, little information is available for children[1]. A recent paper from the States reports that NASH may be an important cause of transplant also in children and young adults[5]. The study included United States patients under 40 years of age transplanted for NASH (no information about the etiology of NASH was provided in the paper) and for cryptogenic cirrhosis associated with a BMI > 30 kg/m2. The overall frequency of transplantation for NASH and cryptogenic cirrhosis
associated with obesity was only 1.67% (330/19904), though this low percentage was not emphasized in the conclusions. Of interest, among these patients only 4.2% were < 18 years old, while 16.4% were between 18 and 29 years and 79.4 % between 30 and 40 years of age, suggesting that NAFLD is not a frequent indication for transplantation in children. Moreover, some 15% of the patients had a BMI < 25 kg/m2 and therefore were not obese.
Despite this, the study is frequently cited to stress the high risk for liver transplantation in obese children[1]. To reinforce the concept that fatty liver due to obesity is rarely leading to liver transplantation is the observation that no children with NAFLD required liver transplant in large pediatric series in Europe and United States[25-28].
Risk of hepatocellular carcinoma among children with NAFLDThough it has been frequently stated that NAFLD can progress to hepatocellular carcinoma in children, because of the role of obesity and insulin resistance in carcinogenesis, Nobili et al[1] reported that “only two cases have been described to date, in both cirrho-tic and non-cirrhotic background”. Is it reasonable to conclude that these cases of HCC are causally associated with obesity? Or, more likely, was it just a fortuity? In brief, given the paucity of data showing a direct correlation between the progression of NAFLD and hepatocellular carcinoma, currently, the risk estimates are not clear and NAFLD can be considered a risk factor likely but not certain. However, what is proved by the evidence is that childhood obesity by itself increases the risk of liver cancer in adulthood, as well as other carcinomas[12,29]. Therefore it appears more important to focus on the systemic impact of obesity in general rather than on the fatty liver.
Treatment of NAFLD in childrenAll studies accept the premise that the most effective treatment for patients with NAFLD, both adults and children, is lifestyle optimization, with a focus on nutrition and exercise. These measures have been proven to be able to revert liver damage[1]. Unfortunately, the majority of obese children are not adherent to lifestyle modifications and hypocaloric diets[30]. Therefore, there is a growing number of studies focused on pharmacological interventions, based on proven or perceived mechanisms involved in the pathogenesis of NAFLD. In children, most of these studies have been generally performed in small series of patients with conflicting and sometimes inconclusive results[31,32]. The evaluation of the effectiveness of the various drugs is based in most cases on serum levels of transaminases with few determinations after a short-term intervention[31,32]. Long-term results of these treatments and their ability to modify the natural course of NAFLD are not available.
8279 December 21, 2017|Volume 23|Issue 47|WJG|www.wjgnet.com
Ranucci G et al . Obese children with fatty liver
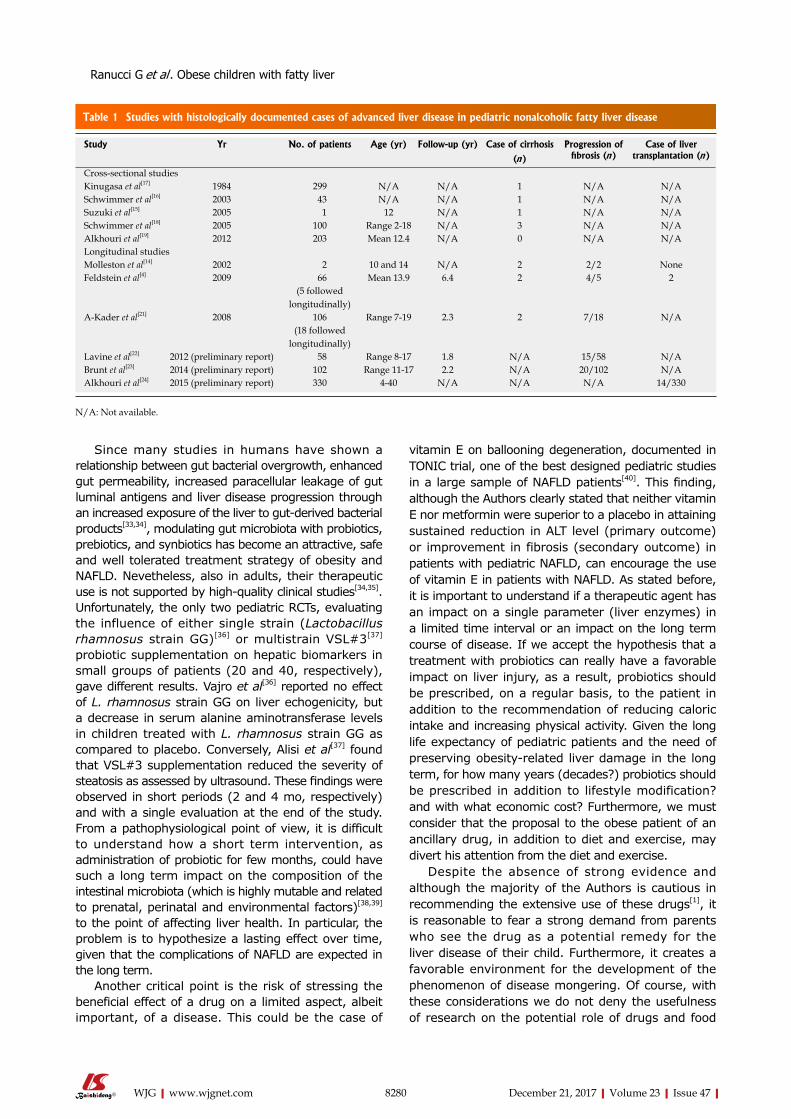
8280 December 21, 2017|Volume 23|Issue 47|WJG|www.wjgnet.com
vitamin E on ballooning degeneration, documented in TONIC trial, one of the best designed pediatric studies in a large sample of NAFLD patients[40]. This finding, although the Authors clearly stated that neither vitamin E nor metformin were superior to a placebo in attaining sustained reduction in ALT level (primary outcome) or improvement in fibrosis (secondary outcome) in patients with pediatric NAFLD, can encourage the use of vitamin E in patients with NAFLD. As stated before, it is important to understand if a therapeutic agent has an impact on a single parameter (liver enzymes) in a limited time interval or an impact on the long term course of disease. If we accept the hypothesis that a treatment with probiotics can really have a favorable impact on liver injury, as a result, probiotics should be prescribed, on a regular basis, to the patient in addition to the recommendation of reducing caloric intake and increasing physical activity. Given the long life expectancy of pediatric patients and the need of preserving obesity-related liver damage in the long term, for how many years (decades?) probiotics should be prescribed in addition to lifestyle modification? and with what economic cost? Furthermore, we must consider that the proposal to the obese patient of an ancillary drug, in addition to diet and exercise, may divert his attention from the diet and exercise.
Despite the absence of strong evidence and although the majority of the Authors is cautious in recommending the extensive use of these drugs[1], it is reasonable to fear a strong demand from parents who see the drug as a potential remedy for the liver disease of their child. Furthermore, it creates a favorable environment for the development of the phenomenon of disease mongering. Of course, with these considerations we do not deny the usefulness of research on the potential role of drugs and food
Since many studies in humans have shown a relationship between gut bacterial overgrowth, enhanced gut permeability, increased paracellular leakage of gut luminal antigens and liver disease progression through an increased exposure of the liver to gut-derived bacterial products[33,34], modulating gut microbiota with probiotics, prebiotics, and synbiotics has become an attractive, safe and well tolerated treatment strategy of obesity and NAFLD. Nevetheless, also in adults, their therapeutic use is not supported by high-quality clinical studies[34,35]. Unfortunately, the only two pediatric RCTs, evaluating the influence of either single strain (Lactobacillus rhamnosus strain GG)[36] or multistrain VSL#3[37] probiotic supplementation on hepatic biomarkers in small groups of patients (20 and 40, respectively), gave different results. Vajro et al[36] reported no effect of L. rhamnosus strain GG on liver echogenicity, but a decrease in serum alanine aminotransferase levels in children treated with L. rhamnosus strain GG as compared to placebo. Conversely, Alisi et al[37] found that VSL#3 supplementation reduced the severity of steatosis as assessed by ultrasound. These findings were observed in short periods (2 and 4 mo, respectively) and with a single evaluation at the end of the study. From a pathophysiological point of view, it is difficult to understand how a short term intervention, as administration of probiotic for few months, could have such a long term impact on the composition of the intestinal microbiota (which is highly mutable and related to prenatal, perinatal and environmental factors)[38,39] to the point of affecting liver health. In particular, the problem is to hypothesize a lasting effect over time, given that the complications of NAFLD are expected in the long term.
Another critical point is the risk of stressing the beneficial effect of a drug on a limited aspect, albeit important, of a disease. This could be the case of
Table 1 Studies with histologically documented cases of advanced liver disease in pediatric nonalcoholic fatty liver disease
Study Yr No. of patients Age (yr) Follow-up (yr) Case of cirrhosis Progression of fibrosis (n)
Case of liver transplantation (n)(n)
Cross-sectional studiesKinugasa et al[17] 1984 299 N/A N/A 1 N/A N/ASchwimmer et al[16] 2003 43 N/A N/A 1 N/A N/ASuzuki et al[15] 2005 1 12 N/A 1 N/A N/ASchwimmer et al[18] 2005 100 Range 2-18 N/A 3 N/A N/AAlkhouri et al[19] 2012 203 Mean 12.4 N/A 0 N/A N/ALongitudinal studiesMolleston et al[14] 2002 2 10 and 14 N/A 2 2/2 NoneFeldstein et al[4] 2009 66 Mean 13.9 6.4 2 4/5 2
(5 followed longitudinally)
A-Kader et al[21] 2008 106 Range 7-19 2.3 2 7/18 N/A(18 followed
longitudinally)Lavine et al[22] 2012 (preliminary report) 58 Range 8-17 1.8 N/A 15/58 N/ABrunt et al[23] 2014 (preliminary report) 102 Range 11-17 2.2 N/A 20/102 N/AAlkhouri et al[24] 2015 (preliminary report) 330 4-40 N/A N/A N/A 14/330
N/A: Not available.
Ranucci G et al . Obese children with fatty liver
8281 December 21, 2017|Volume 23|Issue 47|WJG|www.wjgnet.com
supplements in the therapy of this condition. What we hope however is that their effectiveness is documented with a robust methodology and on large series, that are actually missing.
ACKNOWLEDGMENTSAuthors thank Professor Giorgina Mieli Vergani for precious suggestions.
REFERENCES1 Nobili V, Alisi A, Newton KP, Schwimmer JB. Comparison of
the Phenotype and Approach to Pediatric vs Adult Patients With Nonalcoholic Fatty Liver Disease. Gastroenterology 2016; 150: 1798-1810 [PMID: 27003600 DOI: 10.1053/j.gastro.2016.03.009]
2 Ng M, Fleming T, Robinson M, Thomson B, Graetz N, Margono C, Mullany EC, Biryukov S, Abbafati C, Abera SF, Abraham JP, Abu-Rmeileh NM, Achoki T, AlBuhairan FS, Alemu ZA, Alfonso R, Ali MK, Ali R, Guzman NA, Ammar W, Anwari P, Banerjee A, Barquera S, Basu S, Bennett DA, Bhutta Z, Blore J, Cabral N, Nonato IC, Chang JC, Chowdhury R, Courville KJ, Criqui MH, Cundiff DK, Dabhadkar KC, Dandona L, Davis A, Dayama A, Dharmaratne SD, Ding EL, Durrani AM, Esteghamati A, Farzadfar F, Fay DF, Feigin VL, Flaxman A, Forouzanfar MH, Goto A, Green MA, Gupta R, Hafezi-Nejad N, Hankey GJ, Harewood HC, Havmoeller R, Hay S, Hernandez L, Husseini A, Idrisov BT, Ikeda N, Islami F, Jahangir E, Jassal SK, Jee SH, Jeffreys M, Jonas JB, Kabagambe EK, Khalifa SE, Kengne AP, Khader YS, Khang YH, Kim D, Kimokoti RW, Kinge JM, Kokubo Y, Kosen S, Kwan G, Lai T, Leinsalu M, Li Y, Liang X, Liu S, Logroscino G, Lotufo PA, Lu Y, Ma J, Mainoo NK, Mensah GA, Merriman TR, Mokdad AH, Moschandreas J, Naghavi M, Naheed A, Nand D, Narayan KM, Nelson EL, Neuhouser ML, Nisar MI, Ohkubo T, Oti SO, Pedroza A, Prabhakaran D, Roy N, Sampson U, Seo H, Sepanlou SG, Shibuya K, Shiri R, Shiue I, Singh GM, Singh JA, Skirbekk V, Stapelberg NJ, Sturua L, Sykes BL, Tobias M, Tran BX, Trasande L, Toyoshima H, van de Vijver S, Vasankari TJ, Veerman JL, Velasquez-Melendez G, Vlassov VV, Vollset SE, Vos T, Wang C, Wang X, Weiderpass E, Werdecker A, Wright JL, Yang YC, Yatsuya H, Yoon J, Yoon SJ, Zhao Y, Zhou M, Zhu S, Lopez AD, Murray CJ, Gakidou E. Global, regional, and national prevalence of overweight and obesity in children and adults during 1980-2013: a systematic analysis for the Global Burden of Disease Study 2013. Lancet 2014; 384: 766-781 [PMID: 24880830 DOI: 10.1016/S0140-6736(14)60460-8]
3 Rafiq N, Bai C, Fang Y, Srishord M, McCullough A, Gramlich T, Younossi ZM. Long-term follow-up of patients with nonalcoholic fatty liver. Clin Gastroenterol Hepatol 2009; 7: 234-238 [PMID: 19049831 DOI: 10.1016/j.cgh.2008.11.005]
4 Feldstein AE, Charatcharoenwitthaya P, Treeprasertsuk S, Benson JT, Enders FB, Angulo P. The natural history of non-alcoholic fatty liver disease in children: a follow-up study for up to 20 years. Gut 2009; 58: 1538-1544 [PMID: 19625277 DOI: 10.1136/gut.2008.171280]
5 Alkhouri N, Hanouneh IA, Zein NN, Lopez R, Kelly D, Eghtesad B, Fung JJ. Liver transplantation for nonalcoholic steatohepatitis in young patients. Transpl Int 2016; 29: 418-424 [PMID: 26402655 DOI: 10.1111/tri.12694]
6 Betancourt-Garcia MM, Arguelles A, Montes J, Hernandez A, Singh M, Forse RA. Pediatric Nonalcoholic Fatty Liver Disease: the Rise of a Lethal Disease Among Mexican American Hispanic Children. Obes Surg 2017; 27: 236-244 [PMID: 27822768 DOI: 10.1007/s11695-016-2440-5]
7 Doran E, Henry D. Disease mongering: expanding the boundaries of treatable disease. Intern Med J 2008; 38: 858-861 [PMID: 19120536 DOI: 10.1111/j.1445-5994.2008.01814.x]
8 Moynihan R, Heath I, Henry D. Selling sickness: the pharmaceutical
industry and disease mongering. BMJ 2002; 324: 886-891 [PMID: 11950740 DOI: 10.1136/bmj.324.7342.886]
9 Moynihan R. Alosetron: a case study in regulatory capture, or a victory for patients’ rights? BMJ 2002; 325: 592-595 [PMID: 12228140 DOI: 10.1136/bmj.325.7364.592]
10 Heath I. Combating disease mongering: daunting but nonetheless essential. PLoS Med 2006; 3: e146 [PMID: 16597174 DOI: 10.1371/journal.pmed.0030146]
11 Carmona R. Overweight in Children. Available from: URL: http://www.heart.org/HEARTORG/HealthyLiving/HealthyKids/ChildhoodObesity/Overweight-in-Children_UCM_304054_Article.jsp#.V_OIl1SLTcs
12 Casazza K, Fontaine KR, Astrup A, Birch LL, Brown AW, Bohan Brown MM, Durant N, Dutton G, Foster EM, Heymsfield SB, McIver K, Mehta T, Menachemi N, Newby PK, Pate R, Rolls BJ, Sen B, Smith DL Jr, Thomas DM, Allison DB. Myths, presumptions, and facts about obesity. N Engl J Med 2013; 368: 446-454 [PMID: 23363498 DOI: 10.1056/NEJMsa1208051]
13 Adams LA, Feldstein A, Lindor KD, Angulo P. Nonalcoholic fatty liver disease among patients with hypothalamic and pituitary dysfunction. Hepatology 2004; 39: 909-914 [PMID: 15057893 DOI: 10.1002/hep.20140]
14 Molleston JP, White F, Teckman J, Fitzgerald JF. Obese children with steatohepatitis can develop cirrhosis in childhood. Am J Gastroenterol 2002; 97: 2460-2462 [PMID: 12358273 DOI: 10.1111/j.1572-0241.2002.06003.x]
15 Suzuki D, Hashimoto E, Kaneda K, Tokushige K, Shiratori K. Liver failure caused by non-alcoholic steatohepatitis in an obese young male. J Gastroenterol Hepatol 2005; 20: 327-329 [PMID: 15683446 DOI: 10.1111/j.1440-1746.2005.03724.x]
16 Schwimmer JB, Deutsch R, Rauch JB, Behling C, Newbury R, Lavine JE. Obesity, insulin resistance, and other clinicopathological correlates of pediatric nonalcoholic fatty liver disease. J Pediatr 2003; 143: 500-505 [PMID: 14571229 DOI: 10.1067/S0022-3476(03)00325-1]
17 Kinugasa A, Tsunamoto K, Furukawa N, Sawada T, Kusunoki T, Shimada N. Fatty liver and its fibrous changes found in simple obesity of children. J Pediatr Gastroenterol Nutr 1984; 3: 408-414 [PMID: 6737186 DOI: 10.1097/00005176-198406000-00018]
18 Schwimmer JB, Behling C, Newbury R, Deutsch R, Nievergelt C, Schork NJ, Lavine JE. Histopathology of pediatric nonalcoholic fatty liver disease. Hepatology 2005; 42: 641-649 [PMID: 16116629 DOI: 10.1002/hep.20842]
19 Alkhouri N, De Vito R, Alisi A, Yerian L, Lopez R, Feldstein AE, Nobili V. Development and validation of a new histological score for pediatric non-alcoholic fatty liver disease. J Hepatol 2012; 57: 1312-1318 [PMID: 22871498 DOI: 10.1016/j.jhep.2012.07.027]
20 Goyal NP, Schwimmer JB. The Progression and Natural History of Pediatric Nonalcoholic Fatty Liver Disease. Clin Liver Dis 2016; 20: 325-338 [PMID: 27063272 DOI: 10.1016/j.cld.2015.10.003]
21 A-Kader HH , Henderson J , Vanhoesen K, Ghishan F, Bhattacharyya A. Nonalcoholic fatty liver disease in children: a single center experience. Clin Gastroenterol Hepatol 2008; 6: 799-802 [PMID: 18486560 DOI: 10.1016/j.cgh.2008.03.001]
22 Lavine JE, Yates KP, Brunt EM, Lavine JE, Yates KP, Brunt EM, Kleiner DE, Schwimmer JB, Murray KF, Molleston JP, Abrams SH, Rosenthal P, Loomba R, Unalp A, Tonascia J. The natural history of nonalcoholic fatty liver disease in children and adolescents assessed in placebo recipients in the TONIC trial. Hepatology 2012; 56: 905a
23 Brunt EM, Kleiner DE, Belt PH, Molleston JP, Schwimmer JB, Lavine JE, Neuschwander-Tetri BA. Pediatric nonalcoholic fatty liver disease (NAFLD): histological feature changes over time in paired biopsies from the NASH CRN. Hepatology 2014; 60: 290a.
24 Alkhouri N, Hanouneh IA, Zein NN, Lopez R, Kelly D, Eghtesad B, Fung JJ. l. Liver transplantation for nonalcoholic steatohepatitis (NASH) in children and young adults: the true burden of pediatric nonalcoholic fatty liver disease. Gastroenterology 2015; 148: S-1046
25 McDiarmid SV, Anand R, Lindblad AS; SPLIT Research Group. Studies of Pediatric Liver Transplantation: 2002
Ranucci G et al . Obese children with fatty liver
8282 December 21, 2017|Volume 23|Issue 47|WJG|www.wjgnet.com
update. An overview of demographics, indications, timing, and immunosuppressive practices in pediatric liver transplantation in the United States and Canada. Pediatr Transplant 2004; 8: 284-294 [PMID: 15176967 DOI: 10.1111/j.1399-3046.2004.00153.x]
26 Sze YK, Dhawan A, Taylor RM, Bansal S, Mieli-Vergani G, Rela M, Heaton N. Pediatric liver transplantation for metabolic liver disease: experience at King’s College Hospital. Transplantation 2009; 87: 87-93 [PMID: 19136896 DOI: 10.1097/TP.0b013e31818bc0c4]
27 Spada M, Riva S, Maggiore G, Cintorino D, Gridelli B. Pediatric liver transplantation. World J Gastroenterol 2009; 15: 648-674 [PMID: 19222089 DOI: 10.3748/wjg.15.648]
28 Squires RH, Ng V, Romero R, Ekong U, Hardikar W, Emre S, Mazariegos GV. Evaluation of the pediatric patient for liver transplantation: 2014 practice guideline by the American Association for the Study of Liver Diseases, American Society of Transplantation and the North American Society for Pediatric Gastroenterology, Hepatology and Nutrition. Hepatology 2014; 60: 362-398 [PMID: 24782219 DOI: 10.1002/hep.27191]
29 Berentzen TL, Gamborg M, Holst C, Sørensen TI, Baker JL. Body mass index in childhood and adult risk of primary liver cancer. J Hepatol 2014; 60: 325-330 [PMID: 24076363 DOI: 10.1016/j.jhep.2013.09.015]
30 Kovács E , Siani A, Konstabel K, Hadjigeorgiou C, de Bourdeaudhuij I, Eiben G, Lissner L, Gwozdz W, Reisch L, Pala V, Moreno LA, Pigeot I, Pohlabeln H, Ahrens W, Molnár D; IDEFICS consortium. Adherence to the obesity-related lifestyle intervention targets in the IDEFICS study. Int J Obes (Lond) 2014; 38 Suppl 2: S144-S151 [PMID: 25376216 DOI: 10.1038/ijo.2014.145]
31 Mitchel EB, Lavine JE. Review article: the management of paediatric nonalcoholic fatty liver disease. Aliment Pharmacol Ther 2014; 40: 1155-1170 [PMID: 25267322 DOI: 10.1111/apt.12972]
32 Gibson PS, Lang S, Dhawan A, Fitzpatrick E, Blumfield ML, Truby H, Hart KH, Moore JB. Systematic Review: Nutrition and Physical Activity in the Management of Paediatric Nonalcoholic Fatty Liver Disease. J Pediatr Gastroenterol Nutr 2017; 65: 141-149 [PMID: 28737568 DOI:10.1097/MPG.0000000000001624]
33 Nobili V, Cucchiara S. The Use of Probiotics in Pediatric Nonalcoholic Fatty Liver Disease: Teachable Moment or Missed Opportunity? J Pediatr Gastroenterol Nutr 2017; 64: 336-337 [PMID: 27749611 DOI: 10.1097/MPG.0000000000001431]
34 Tarantino G, Finelli C. Systematic review on intervention with prebiotics/probiotics in patients with obesity-related nonalcoholic fatty liver disease. Future Microbiol 2015; 10: 889-902 [PMID: 26000656 DOI: 10.2217/fmb.15.13]
35 Barengolts E. Gut Microbiota, Prebiotics, Probiotics, and Synbiotics in Management of Obesity and Prediabetes: Review of Randomized Controlled Trials. Endocr Pract 2016; 22: 1224-1234 [PMID: 27409822 DOI: 10.4158/EP151157.RA]
36 Vajro P, Mandato C, Licenziati MR, Franzese A, Vitale DF, Lenta S, Caropreso M, Vallone G, Meli R. Effects of Lactobacillus rhamnosus strain GG in pediatric obesity-related liver disease. J Pediatr Gastroenterol Nutr 2011; 52: 740-743 [PMID: 21505361 DOI: 10.1097/MPG.0b013e31821f9b85]
37 Alisi A, Bedogni G, Baviera G, Giorgio V, Porro E, Paris C, Giammaria P, Reali L, Anania F, Nobili V. Randomised clinical trial: The beneficial effects of VSL#3 in obese children with non-alcoholic steatohepatitis. Aliment Pharmacol Ther 2014; 39: 1276-1285 [PMID: 24738701 DOI: 10.1111/apt.12758]
38 Martí JM, Martínez-Martínez D, Rubio T, Gracia C, Peña M, Latorre A, Moya A, P Garay C. Health and Disease Imprinted in the Time Variability of the Human Microbiome. mSystems 2017; 2: e00144-16 [PMID: 28345059 DOI: 10.1128/mSystems.00144-16]
39 Lloyd-Price J, Abu-Ali G, Huttenhower C. The healthy human microbiome. Genome Med 2016; 8: 51 [PMID: 27122046 DOI: 10.1186/s13073-016-0307-y]
40 Lavine JE, Schwimmer JB, Van Natta ML, Molleston JP, Murray KF, Rosenthal P, Abrams SH, Scheimann AO, Sanyal AJ, Chalasani N, Tonascia J, Ünalp A, Clark JM, Brunt EM, Kleiner DE, Hoofnagle JH, Robuck PR; Nonalcoholic Steatohepatitis Clinical Research Network. Effect of vitamin E or metformin for treatment of nonalcoholic fatty liver disease in children and adolescents: the TONIC randomized controlled trial. JAMA 2011; 305: 1659-1668 [PMID: 21521847 DOI: 10.1001/jama.2011.520]
P- Reviewer: Hamaguchi M, Huang C, Riordan JD S- Editor: Chen K L- Editor: A E- Editor: Huang Y
Ranucci G et al . Obese children with fatty liver
Procalcitonin in inflammatory bowel disease: Drawbacks and opportunities
Giuseppe Lippi, Fabian Sanchis-Gomar
Giuseppe Lippi, Section of Clinical Biochemistry, University of Verona, Verona 37134, Italy
Fabian Sanchis-Gomar, Leon H. Charney Division of Cardiology, New York University School of Medicine, New York, NY 10016, United States
Fabian Sanchis-Gomar, Department of Physiology, Faculty of Medicine, University of Valencia and INCLIVA Biomedical Research Institute, Valencia 46010, Spain
ORCID number: Giuseppe Lippi (0000-0001-9523-9054); Fabian Sanchis-Gomar (0000-0003-0424-4208).
Author contributions: Lippi G and Sanchis-Gomar F con-tributed equally to this work, generated the figures and wrote the manuscript.
Conflict-of-interest statement: The authors have no conflicts of interest to declare.
Open-Access: This article is an open-access article which was selected by an in-house editor and fully peer-reviewed by external reviewers. It is distributed in accordance with the Creative Commons Attribution Non Commercial (CC BY-NC 4.0) license, which permits others to distribute, remix, adapt, build upon this work non-commercially, and license their derivative works on different terms, provided the original work is properly cited and the use is non-commercial. See: http://creativecommons.org/licenses/by-nc/4.0/
Manuscript source: Invited manuscript
Correspondence to: Giuseppe Lippi, MD, Professor, Section of Clinical Biochemistry, University Hospital of Verona, Piazzale L.A. Scuro 10, Verona 37134, Italy. [email protected]: + 39-45-8124308
Received: October 28, 2017Peer-review started: October 29, 2017First decision: November 21, 2017Revised: November 27, 2017Accepted: December 4, 2017 Article in press: December 4, 2017
Published online: December 21, 2017
AbstractThe measurement of procalcitonin has recently become a mainstay for the diagnosis and therapeutic management of severe bacterial infections, especially those sustained by Gram-negative bacteria. Therefore, the aim of this article is to provide a narrative overview on the potential role of procalcitonin measurement in patients with inflammatory bowel disease (IBD). According to the available scientific literature, the clinical significance of procalcitonin for diagnosing IBD or monitoring disease activity remains elusive, and its association with disease severity is confined to a limited number of case-control studies, with low sample size. Nevertheless, literature data also suggests that a supranormal procalcitonin serum concentration (i.e. , > 0.5 ng/mL) may reflect the presence of a number of infective complications in IBD, especially bacterial enterocolitis, bacterial gastroenteritis, intraabdominal abscess, postsurgical infection and sepsis. Rather than for diagnosing or assessing disease activity, the measurement of this biomarker may hence retain practical clinical significance for early prediction, timely diagnosis and therapeutic monitoring of many IBD-associated infections and complications.
Key words: Intestinal bowel disease; Chron’s disease; Ulcerative colitis; Procalcitonin
© The Author(s) 2017. Published by Baishideng Publishing Group Inc. All rights reserved.
Core tip: According to current evidence, the clinical significance of measuring procalcitonin for diagnosing intestinal bowel disease (IBD) or monitoring disease activity remains elusive. Nevertheless, literature data
MINIREVIEWS
8283 December 21, 2017|Volume 23|Issue 47|WJG|www.wjgnet.com
Submit a Manuscript: http://www.f6publishing.com
DOI: 10.3748/wjg.v23.i47.8283
World J Gastroenterol 2017 December 21; 23(47): 8283-8290
ISSN 1007-9327 (print) ISSN 2219-2840 (online)
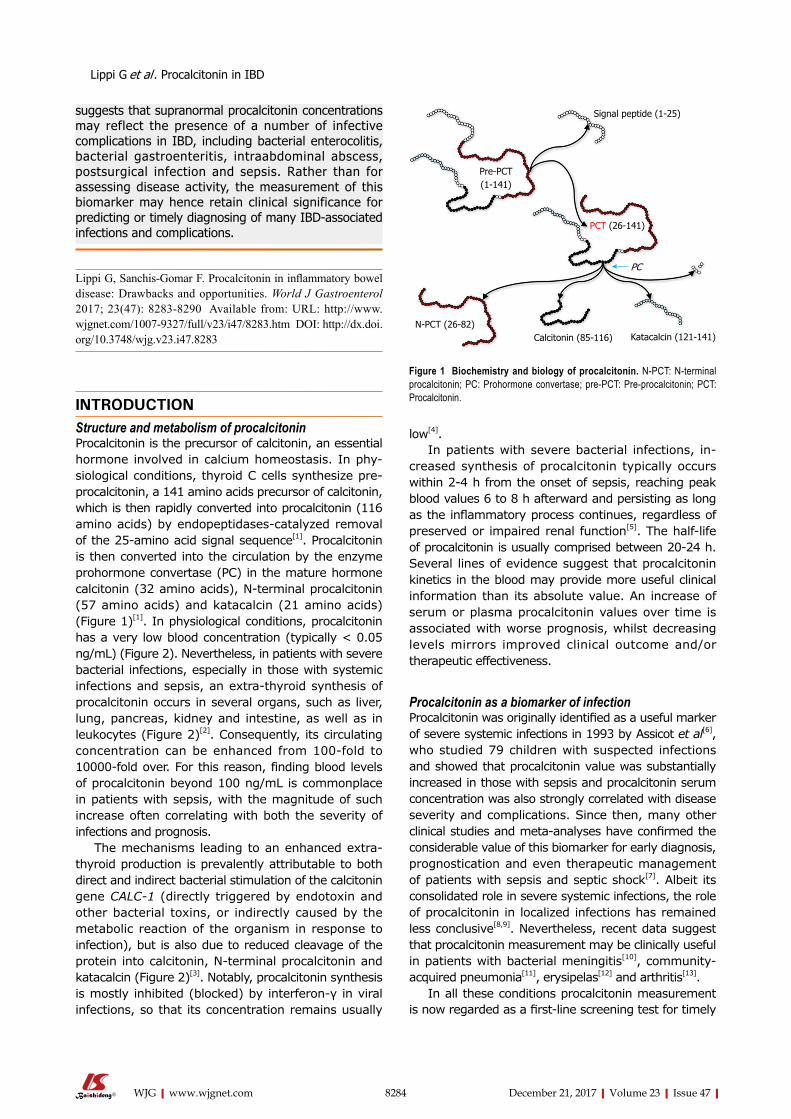
suggests that supranormal procalcitonin concentrations may reflect the presence of a number of infective complications in IBD, including bacterial enterocolitis, bacterial gastroenteritis, intraabdominal abscess, postsurgical infection and sepsis. Rather than for assessing disease activity, the measurement of this biomarker may hence retain clinical significance for predicting or timely diagnosing of many IBD-associated infections and complications.
Lippi G, Sanchis-Gomar F. Procalcitonin in inflammatory bowel disease: Drawbacks and opportunities. World J Gastroenterol 2017; 23(47): 8283-8290 Available from: URL: http://www.wjgnet.com/1007-9327/full/v23/i47/8283.htm DOI: http://dx.doi.org/10.3748/wjg.v23.i47.8283
INTRODUCTIONStructure and metabolism of procalcitoninProcalcitonin is the precursor of calcitonin, an essential hormone involved in calcium homeostasis. In physiological conditions, thyroid C cells synthesize preprocalcitonin, a 141 amino acids precursor of calcitonin, which is then rapidly converted into procalcitonin (116 amino acids) by endopeptidasescatalyzed removal of the 25amino acid signal sequence[1]. Procalcitonin is then converted into the circulation by the enzyme prohormone convertase (PC) in the mature hormone calcitonin (32 amino acids), Nterminal procalcitonin (57 amino acids) and katacalcin (21 amino acids) (Figure 1)[1]. In physiological conditions, procalcitonin has a very low blood concentration (typically < 0.05 ng/mL) (Figure 2). Nevertheless, in patients with severe bacterial infections, especially in those with systemic infections and sepsis, an extrathyroid synthesis of procalcitonin occurs in several organs, such as liver, lung, pancreas, kidney and intestine, as well as in leukocytes (Figure 2)[2]. Consequently, its circulating concentration can be enhanced from 100fold to 10000fold over. For this reason, finding blood levels of procalcitonin beyond 100 ng/mL is commonplace in patients with sepsis, with the magnitude of such increase often correlating with both the severity of infections and prognosis.
The mechanisms leading to an enhanced extrathyroid production is prevalently attributable to both direct and indirect bacterial stimulation of the calcitonin gene CALC-1 (directly triggered by endotoxin and other bacterial toxins, or indirectly caused by the metabolic reaction of the organism in response to infection), but is also due to reduced cleavage of the protein into calcitonin, Nterminal procalcitonin and katacalcin (Figure 2)[3]. Notably, procalcitonin synthesis is mostly inhibited (blocked) by interferon-γ in viral infections, so that its concentration remains usually
low[4]. In patients with severe bacterial infections, in
creased synthesis of procalcitonin typically occurs within 24 h from the onset of sepsis, reaching peak blood values 6 to 8 h afterward and persisting as long as the inflammatory process continues, regardless of preserved or impaired renal function[5]. The halflife of procalcitonin is usually comprised between 2024 h. Several lines of evidence suggest that procalcitonin kinetics in the blood may provide more useful clinical information than its absolute value. An increase of serum or plasma procalcitonin values over time is associated with worse prognosis, whilst decreasing levels mirrors improved clinical outcome and/or therapeutic effectiveness.
Procalcitonin as a biomarker of infectionProcalcitonin was originally identified as a useful marker of severe systemic infections in 1993 by Assicot et al[6], who studied 79 children with suspected infections and showed that procalcitonin value was substantially increased in those with sepsis and procalcitonin serum concentration was also strongly correlated with disease severity and complications. Since then, many other clinical studies and meta-analyses have confirmed the considerable value of this biomarker for early diagnosis, prognostication and even therapeutic management of patients with sepsis and septic shock[7]. Albeit its consolidated role in severe systemic infections, the role of procalcitonin in localized infections has remained less conclusive[8,9]. Nevertheless, recent data suggest that procalcitonin measurement may be clinically useful in patients with bacterial meningitis[10], communityacquired pneumonia[11], erysipelas[12] and arthritis[13].
In all these conditions procalcitonin measurement is now regarded as a first-line screening test for timely
8284 December 21, 2017|Volume 23|Issue 47|WJG|www.wjgnet.com
Lippi G et al . Procalcitonin in IBD
Signal peptide (1-25)
Pre-PCT (1-141)
PCT (26-141)
PC
Calcitonin (85-116) Katacalcin (121-141)N-PCT (26-82)
Figure 1 Biochemistry and biology of procalcitonin. N-PCT: N-terminal procalcitonin; PC: Prohormone convertase; pre-PCT: Pre-procalcitonin; PCT: Procalcitonin.
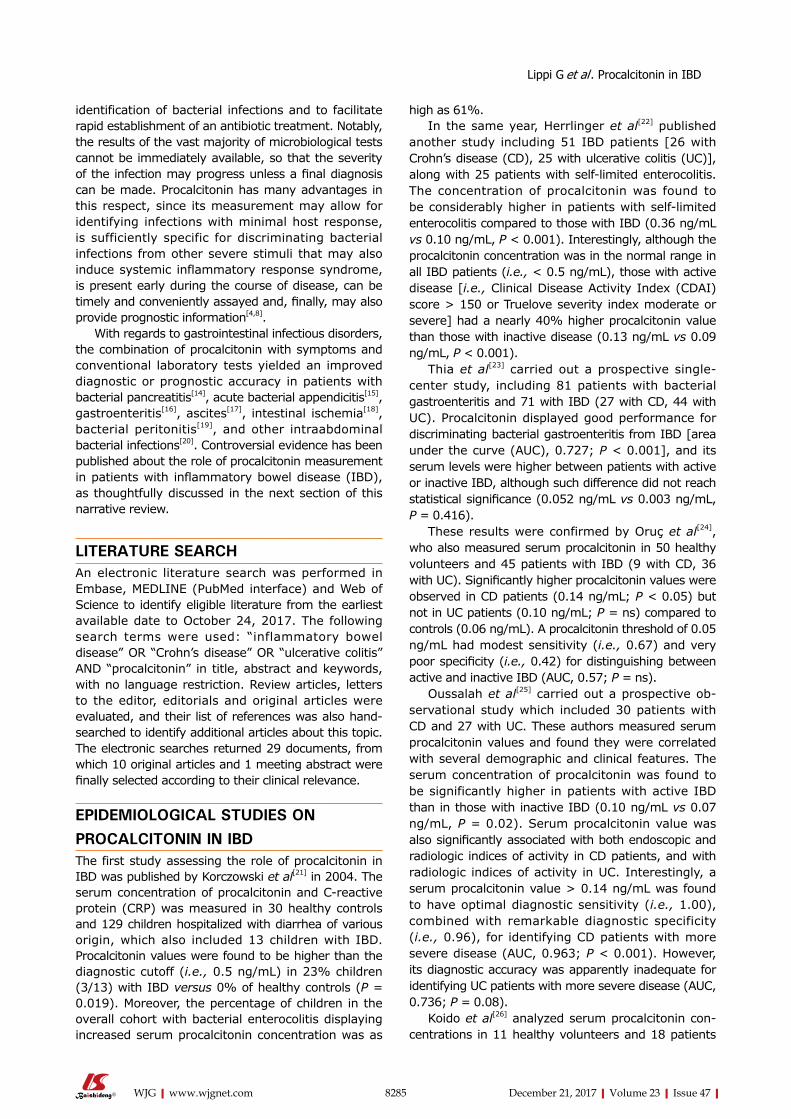
identification of bacterial infections and to facilitate rapid establishment of an antibiotic treatment. Notably, the results of the vast majority of microbiological tests cannot be immediately available, so that the severity of the infection may progress unless a final diagnosis can be made. Procalcitonin has many advantages in this respect, since its measurement may allow for identifying infections with minimal host response, is sufficiently specific for discriminating bacterial infections from other severe stimuli that may also induce systemic inflammatory response syndrome, is present early during the course of disease, can be timely and conveniently assayed and, finally, may also provide prognostic information[4,8].
With regards to gastrointestinal infectious disorders, the combination of procalcitonin with symptoms and conventional laboratory tests yielded an improved diagnostic or prognostic accuracy in patients with bacterial pancreatitis[14], acute bacterial appendicitis[15], gastroenteritis[16], ascites[17], intestinal ischemia[18], bacterial peritonitis[19], and other intraabdominal bacterial infections[20]. Controversial evidence has been published about the role of procalcitonin measurement in patients with inflammatory bowel disease (IBD), as thoughtfully discussed in the next section of this narrative review.
LITERATURE SEARCH An electronic literature search was performed in Embase, MEDLINE (PubMed interface) and Web of Science to identify eligible literature from the earliest available date to October 24, 2017. The following search terms were used: “inflammatory bowel disease” OR “Crohn’s disease” OR “ulcerative colitis” AND “procalcitonin” in title, abstract and keywords, with no language restriction. Review articles, letters to the editor, editorials and original articles were evaluated, and their list of references was also handsearched to identify additional articles about this topic. The electronic searches returned 29 documents, from which 10 original articles and 1 meeting abstract were finally selected according to their clinical relevance.
EPIDEMIOLOGICAL STUDIES ON PROCALCITONIN IN IBDThe first study assessing the role of procalcitonin in IBD was published by Korczowski et al[21] in 2004. The serum concentration of procalcitonin and Creactive protein (CRP) was measured in 30 healthy controls and 129 children hospitalized with diarrhea of various origin, which also included 13 children with IBD. Procalcitonin values were found to be higher than the diagnostic cutoff (i.e., 0.5 ng/mL) in 23% children (3/13) with IBD versus 0% of healthy controls (P = 0.019). Moreover, the percentage of children in the overall cohort with bacterial enterocolitis displaying increased serum procalcitonin concentration was as
high as 61%.In the same year, Herrlinger et al[22] published
another study including 51 IBD patients [26 with Crohn’s disease (CD), 25 with ulcerative colitis (UC)], along with 25 patients with selflimited enterocolitis. The concentration of procalcitonin was found to be considerably higher in patients with selflimited enterocolitis compared to those with IBD (0.36 ng/mL vs 0.10 ng/mL, P < 0.001). Interestingly, although the procalcitonin concentration was in the normal range in all IBD patients (i.e., < 0.5 ng/mL), those with active disease [i.e., Clinical Disease Activity Index (CDAI) score > 150 or Truelove severity index moderate or severe] had a nearly 40% higher procalcitonin value than those with inactive disease (0.13 ng/mL vs 0.09 ng/mL, P < 0.001).
Thia et al[23] carried out a prospective singlecenter study, including 81 patients with bacterial gastroenteritis and 71 with IBD (27 with CD, 44 with UC). Procalcitonin displayed good performance for discriminating bacterial gastroenteritis from IBD [area under the curve (AUC), 0.727; P < 0.001], and its serum levels were higher between patients with active or inactive IBD, although such difference did not reach statistical significance (0.052 ng/mL vs 0.003 ng/mL, P = 0.416).
These results were confirmed by Oruç et al[24], who also measured serum procalcitonin in 50 healthy volunteers and 45 patients with IBD (9 with CD, 36 with UC). Significantly higher procalcitonin values were observed in CD patients (0.14 ng/mL; P < 0.05) but not in UC patients (0.10 ng/mL; P = ns) compared to controls (0.06 ng/mL). A procalcitonin threshold of 0.05 ng/mL had modest sensitivity (i.e., 0.67) and very poor specificity (i.e., 0.42) for distinguishing between active and inactive IBD (AUC, 0.57; P = ns).
Oussalah et al[25] carried out a prospective observational study which included 30 patients with CD and 27 with UC. These authors measured serum procalcitonin values and found they were correlated with several demographic and clinical features. The serum concentration of procalcitonin was found to be significantly higher in patients with active IBD than in those with inactive IBD (0.10 ng/mL vs 0.07 ng/mL, P = 0.02). Serum procalcitonin value was also significantly associated with both endoscopic and radiologic indices of activity in CD patients, and with radiologic indices of activity in UC. Interestingly, a serum procalcitonin value > 0.14 ng/mL was found to have optimal diagnostic sensitivity (i.e., 1.00), combined with remarkable diagnostic specificity (i.e., 0.96), for identifying CD patients with more severe disease (AUC, 0.963; P < 0.001). However, its diagnostic accuracy was apparently inadequate for identifying UC patients with more severe disease (AUC, 0.736; P = 0.08).
Koido et al[26] analyzed serum procalcitonin concentrations in 11 healthy volunteers and 18 patients
8285 December 21, 2017|Volume 23|Issue 47|WJG|www.wjgnet.com
Lippi G et al . Procalcitonin in IBD
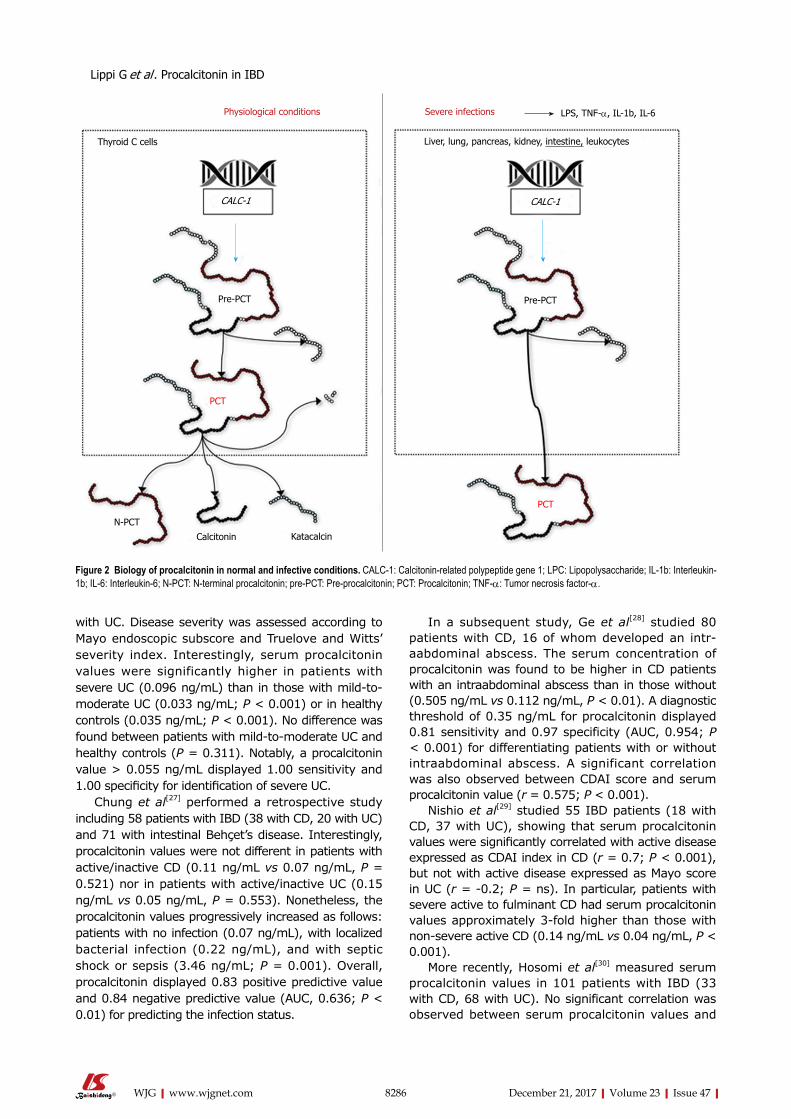
8286 December 21, 2017|Volume 23|Issue 47|WJG|www.wjgnet.com
In a subsequent study, Ge et al[28] studied 80 patients with CD, 16 of whom developed an intraabdominal abscess. The serum concentration of procalcitonin was found to be higher in CD patients with an intraabdominal abscess than in those without (0.505 ng/mL vs 0.112 ng/mL, P < 0.01). A diagnostic threshold of 0.35 ng/mL for procalcitonin displayed 0.81 sensitivity and 0.97 specificity (AUC, 0.954; P < 0.001) for differentiating patients with or without intraabdominal abscess. A significant correlation was also observed between CDAI score and serum procalcitonin value (r = 0.575; P < 0.001).
Nishio et al[29] studied 55 IBD patients (18 with CD, 37 with UC), showing that serum procalcitonin values were significantly correlated with active disease expressed as CDAI index in CD (r = 0.7; P < 0.001), but not with active disease expressed as Mayo score in UC (r = 0.2; P = ns). In particular, patients with severe active to fulminant CD had serum procalcitonin values approximately 3fold higher than those with nonsevere active CD (0.14 ng/mL vs 0.04 ng/mL, P < 0.001).
More recently, Hosomi et al[30] measured serum procalcitonin values in 101 patients with IBD (33 with CD, 68 with UC). No significant correlation was observed between serum procalcitonin values and
with UC. Disease severity was assessed according to Mayo endoscopic subscore and Truelove and Witts’ severity index. Interestingly, serum procalcitonin values were significantly higher in patients with severe UC (0.096 ng/mL) than in those with mildtomoderate UC (0.033 ng/mL; P < 0.001) or in healthy controls (0.035 ng/mL; P < 0.001). No difference was found between patients with mildtomoderate UC and healthy controls (P = 0.311). Notably, a procalcitonin value > 0.055 ng/mL displayed 1.00 sensitivity and 1.00 specificity for identification of severe UC.
Chung et al[27] performed a retrospective study including 58 patients with IBD (38 with CD, 20 with UC) and 71 with intestinal Behçet’s disease. Interestingly, procalcitonin values were not different in patients with active/inactive CD (0.11 ng/mL vs 0.07 ng/mL, P = 0.521) nor in patients with active/inactive UC (0.15 ng/mL vs 0.05 ng/mL, P = 0.553). Nonetheless, the procalcitonin values progressively increased as follows: patients with no infection (0.07 ng/mL), with localized bacterial infection (0.22 ng/mL), and with septic shock or sepsis (3.46 ng/mL; P = 0.001). Overall, procalcitonin displayed 0.83 positive predictive value and 0.84 negative predictive value (AUC, 0.636; P < 0.01) for predicting the infection status.
Physiological conditions Severe infections LPS, TNF-α, IL-1b, IL-6
Thyroid C cells
CALC-1
Pre-PCT
PCT
N-PCT
Calcitonin Katacalcin
PCT
Pre-PCT
CALC-1
Liver, lung, pancreas, kidney, intestine, leukocytes
Figure 2 Biology of procalcitonin in normal and infective conditions. CALC-1: Calcitonin-related polypeptide gene 1; LPC: Lipopolysaccharide; IL-1b: Interleukin-1b; IL-6: Interleukin-6; N-PCT: N-terminal procalcitonin; pre-PCT: Pre-procalcitonin; PCT: Procalcitonin; TNF-α: Tumor necrosis factor-α.
Lippi G et al . Procalcitonin in IBD
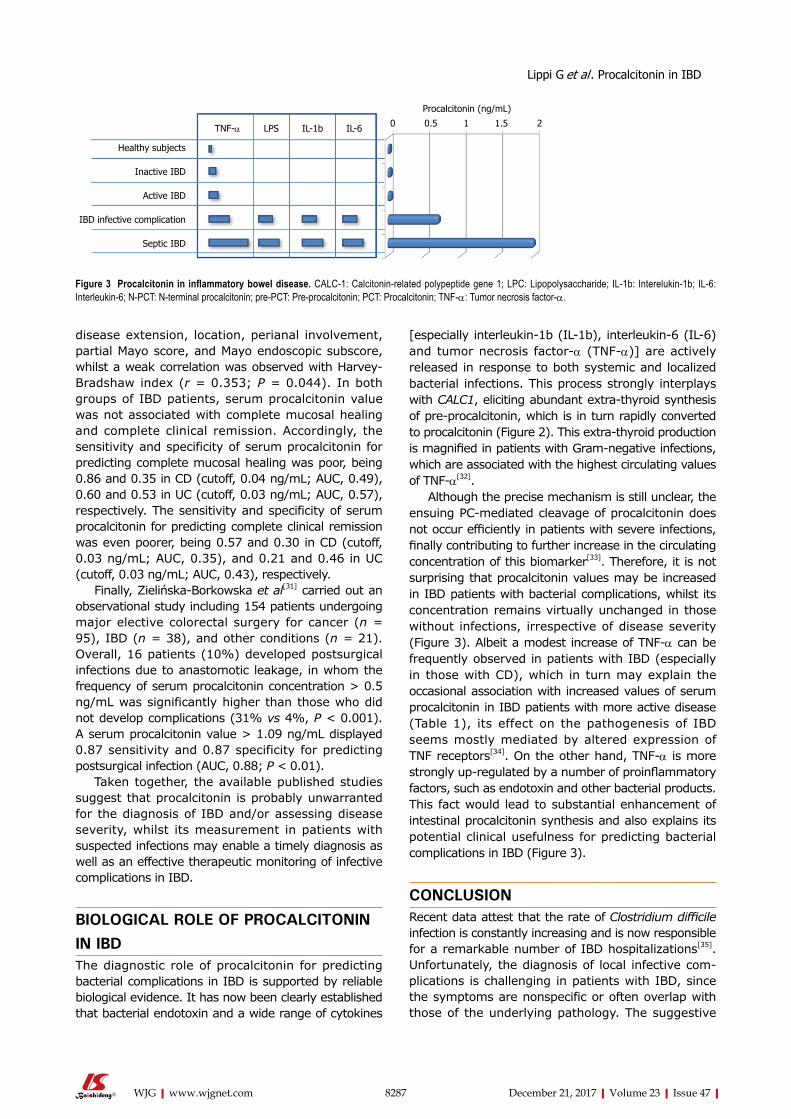
8287 December 21, 2017|Volume 23|Issue 47|WJG|www.wjgnet.com
disease extension, location, perianal involvement, partial Mayo score, and Mayo endoscopic subscore, whilst a weak correlation was observed with HarveyBradshaw index (r = 0.353; P = 0.044). In both groups of IBD patients, serum procalcitonin value was not associated with complete mucosal healing and complete clinical remission. Accordingly, the sensitivity and specificity of serum procalcitonin for predicting complete mucosal healing was poor, being 0.86 and 0.35 in CD (cutoff, 0.04 ng/mL; AUC, 0.49), 0.60 and 0.53 in UC (cutoff, 0.03 ng/mL; AUC, 0.57), respectively. The sensitivity and specificity of serum procalcitonin for predicting complete clinical remission was even poorer, being 0.57 and 0.30 in CD (cutoff, 0.03 ng/mL; AUC, 0.35), and 0.21 and 0.46 in UC (cutoff, 0.03 ng/mL; AUC, 0.43), respectively.
Finally, Zielińska-Borkowska et al[31] carried out an observational study including 154 patients undergoing major elective colorectal surgery for cancer (n = 95), IBD (n = 38), and other conditions (n = 21). Overall, 16 patients (10%) developed postsurgical infections due to anastomotic leakage, in whom the frequency of serum procalcitonin concentration > 0.5 ng/mL was significantly higher than those who did not develop complications (31% vs 4%, P < 0.001). A serum procalcitonin value > 1.09 ng/mL displayed 0.87 sensitivity and 0.87 specificity for predicting postsurgical infection (AUC, 0.88; P < 0.01).
Taken together, the available published studies suggest that procalcitonin is probably unwarranted for the diagnosis of IBD and/or assessing disease severity, whilst its measurement in patients with suspected infections may enable a timely diagnosis as well as an effective therapeutic monitoring of infective complications in IBD.
BIOLOGICAL ROLE OF PROCALCITONIN IN IBDThe diagnostic role of procalcitonin for predicting bacterial complications in IBD is supported by reliable biological evidence. It has now been clearly established that bacterial endotoxin and a wide range of cytokines
[especially interleukin1b (IL1b), interleukin6 (IL6) and tumor necrosis factorα (TNFα)] are actively released in response to both systemic and localized bacterial infections. This process strongly interplays with CALC1, eliciting abundant extrathyroid synthesis of preprocalcitonin, which is in turn rapidly converted to procalcitonin (Figure 2). This extrathyroid production is magnified in patients with Gram-negative infections, which are associated with the highest circulating values of TNFα[32].
Although the precise mechanism is still unclear, the ensuing PCmediated cleavage of procalcitonin does not occur efficiently in patients with severe infections, finally contributing to further increase in the circulating concentration of this biomarker[33]. Therefore, it is not surprising that procalcitonin values may be increased in IBD patients with bacterial complications, whilst its concentration remains virtually unchanged in those without infections, irrespective of disease severity (Figure 3). Albeit a modest increase of TNFα can be frequently observed in patients with IBD (especially in those with CD), which in turn may explain the occasional association with increased values of serum procalcitonin in IBD patients with more active disease (Table 1), its effect on the pathogenesis of IBD seems mostly mediated by altered expression of TNF receptors[34]. On the other hand, TNFα is more strongly up-regulated by a number of proinflammatory factors, such as endotoxin and other bacterial products. This fact would lead to substantial enhancement of intestinal procalcitonin synthesis and also explains its potential clinical usefulness for predicting bacterial complications in IBD (Figure 3).
CONCLUSIONRecent data attest that the rate of Clostridium difficile infection is constantly increasing and is now responsible for a remarkable number of IBD hospitalizations[35]. Unfortunately, the diagnosis of local infective complications is challenging in patients with IBD, since the symptoms are nonspecific or often overlap with those of the underlying pathology. The suggestive
TNF-α LPS IL-1b IL-6
Healthy subjects
Inactive IBD
Active IBD
IBD infective complication
Septic IBD
0 0.5 1 1.5 2
Procalcitonin (ng/mL)
Figure 3 Procalcitonin in inflammatory bowel disease. CALC-1: Calcitonin-related polypeptide gene 1; LPC: Lipopolysaccharide; IL-1b: Interelukin-1b; IL-6: Interleukin-6; N-PCT: N-terminal procalcitonin; pre-PCT: Pre-procalcitonin; PCT: Procalcitonin; TNF-α: Tumor necrosis factor-α.
Lippi G et al . Procalcitonin in IBD
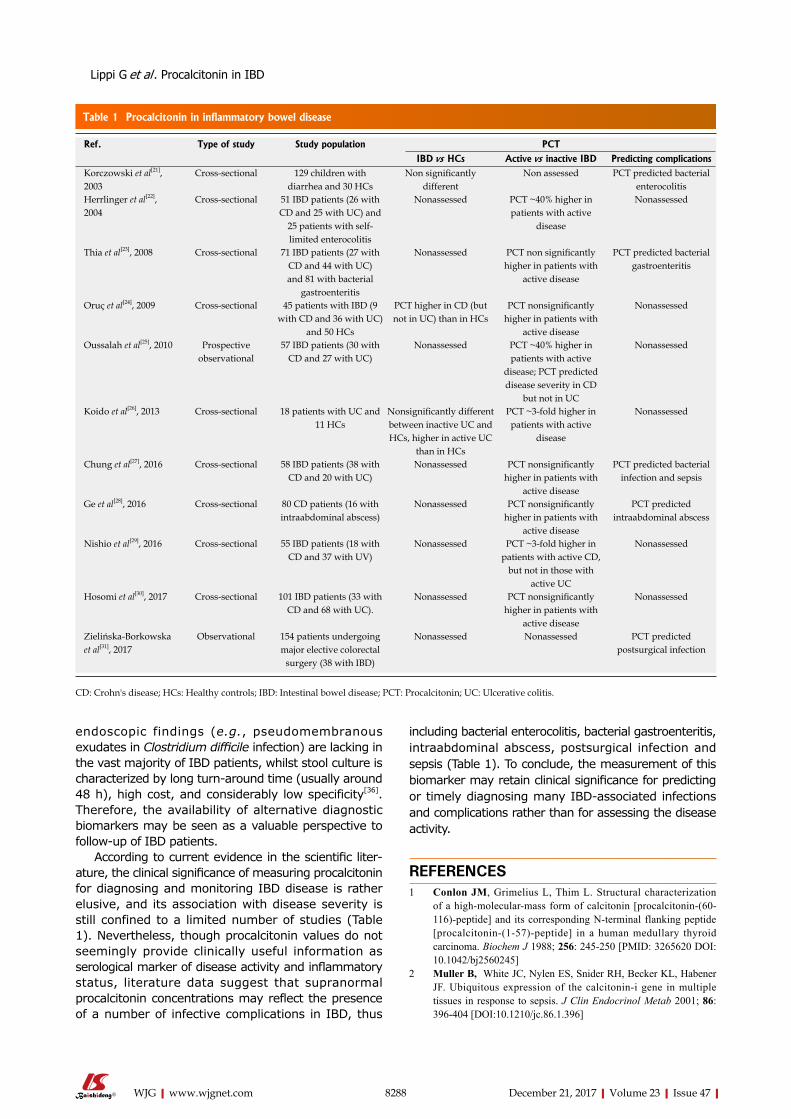
8288 December 21, 2017|Volume 23|Issue 47|WJG|www.wjgnet.com
endoscopic findings (e.g., pseudomembranous exudates in Clostridium difficile infection) are lacking in the vast majority of IBD patients, whilst stool culture is characterized by long turnaround time (usually around 48 h), high cost, and considerably low specificity[36]. Therefore, the availability of alternative diagnostic biomarkers may be seen as a valuable perspective to followup of IBD patients.
According to current evidence in the scientific liter-ature, the clinical significance of measuring procalcitonin for diagnosing and monitoring IBD disease is rather elusive, and its association with disease severity is still confined to a limited number of studies (Table 1). Nevertheless, though procalcitonin values do not seemingly provide clinically useful information as serological marker of disease activity and inflammatory status, literature data suggest that supranormal procalcitonin concentrations may reflect the presence of a number of infective complications in IBD, thus
including bacterial enterocolitis, bacterial gastroenteritis, intraabdominal abscess, postsurgical infection and sepsis (Table 1). To conclude, the measurement of this biomarker may retain clinical significance for predicting or timely diagnosing many IBDassociated infections and complications rather than for assessing the disease activity.
REFERENCES1 Conlon JM, Grimelius L, Thim L. Structural characterization
of a high-molecular-mass form of calcitonin [procalcitonin-(60-116)-peptide] and its corresponding N-terminal flanking peptide [procalcitonin-(1-57)-peptide] in a human medullary thyroid carcinoma. Biochem J 1988; 256: 245-250 [PMID: 3265620 DOI: 10.1042/bj2560245]
2 Muller B, White JC, Nylen ES, Snider RH, Becker KL, Habener JF. Ubiquitous expression of the calcitonin-i gene in multiple tissues in response to sepsis. J Clin Endocrinol Metab 2001; 86: 396-404 [DOI:10.1210/jc.86.1.396]
Table 1 Procalcitonin in inflammatory bowel disease
Ref. Type of study Study population PCT
IBD vs HCs Active vs inactive IBD Predicting complicationsKorczowski et al[21], 2003
Cross-sectional 129 children with diarrhea and 30 HCs
Non significantly different
Non assessed PCT predicted bacterial enterocolitis
Herrlinger et al[22], 2004
Cross-sectional 51 IBD patients (26 with CD and 25 with UC) and
25 patients with self-limited enterocolitis
Nonassessed PCT ~40% higher in patients with active
disease
Nonassessed
Thia et al[23], 2008 Cross-sectional 71 IBD patients (27 with CD and 44 with UC) and 81 with bacterial
gastroenteritis
Nonassessed PCT non significantly higher in patients with
active disease
PCT predicted bacterial gastroenteritis
Oruç et al[24], 2009 Cross-sectional 45 patients with IBD (9 with CD and 36 with UC)
and 50 HCs
PCT higher in CD (but not in UC) than in HCs
PCT nonsignificantly higher in patients with
active disease
Nonassessed
Oussalah et al[25], 2010 Prospective observational
57 IBD patients (30 with CD and 27 with UC)
Nonassessed PCT ~40% higher in patients with active
disease; PCT predicted disease severity in CD
but not in UC
Nonassessed
Koido et al[26], 2013 Cross-sectional 18 patients with UC and 11 HCs
Nonsignificantly different between inactive UC and HCs, higher in active UC
than in HCs
PCT ~3-fold higher in patients with active
disease
Nonassessed
Chung et al[27], 2016 Cross-sectional 58 IBD patients (38 with CD and 20 with UC)
Nonassessed PCT nonsignificantly higher in patients with
active disease
PCT predicted bacterial infection and sepsis
Ge et al[28], 2016 Cross-sectional 80 CD patients (16 with intraabdominal abscess)
Nonassessed PCT nonsignificantly higher in patients with
active disease
PCT predicted intraabdominal abscess
Nishio et al[29], 2016 Cross-sectional 55 IBD patients (18 with CD and 37 with UV)
Nonassessed PCT ~3-fold higher in patients with active CD,
but not in those with active UC
Nonassessed
Hosomi et al[30], 2017 Cross-sectional 101 IBD patients (33 with CD and 68 with UC).
Nonassessed PCT nonsignificantly higher in patients with
active disease
Nonassessed
Zielińska-Borkowska et al[31], 2017
Observational 154 patients undergoing major elective colorectal
surgery (38 with IBD)
Nonassessed Nonassessed PCT predicted postsurgical infection
CD: Crohn's disease; HCs: Healthy controls; IBD: Intestinal bowel disease; PCT: Procalcitonin; UC: Ulcerative colitis.
Lippi G et al . Procalcitonin in IBD
8289 December 21, 2017|Volume 23|Issue 47|WJG|www.wjgnet.com
3 Linscheid P, Seboek D, Nylen ES, Langer I, Schlatter M, Becker KL, Keller U, Müller B. In vitro and in vivo calcitonin I gene expression in parenchymal cells: a novel product of human adipose tissue. Endocrinology 2003; 144: 5578-5584 [PMID: 12960010 DOI: 10.1210/en.2003-0854]
4 Lee H. Procalcitonin as a biomarker of infectious diseases. Korean J Intern Med 2013; 28: 285-291 [PMID: 23682219 DOI: 10.3904/kjim.2013.28.3.285]
5 Meisner M, Schmidt J, Hüttner H, Tschaikowsky K. The natural elimination rate of procalcitonin in patients with normal and impaired renal function. Intensive Care Med 2000; 26 Suppl 2: S212-S216 [PMID: 18470722 DOI: 10.1007/BF02900740]
6 Assicot M, Gendrel D, Carsin H, Raymond J, Guilbaud J, Bohuon C. High serum procalcitonin concentrations in patients with sepsis and infection. Lancet 1993; 341: 515-518 [DOI:10.1016/0140-6736(93)90277-N]
7 Lippi G, Montagnana M, Balboni F, Bellone A, Casagranda I, Cavazza M, Da Rin G, Coen D, Giavarina D, Giostra F, Guzzetti S, Pauri P, Sbrojavacca R, Trenti T, Ciaccio M, Cervellin G. Academy of Emergency Medicine and Care-Society of Clinical Biochemistry and Clinical Molecular Biology consensus recommendations for clinical use of sepsis biomarkers in the emergency department. Emerg Care J 2017; 13: 6877 [DOI:10.4081/ecj.2017.6600]
8 Christ-Crain M, Müller B. Procalcitonin in bacterial infections--hype, hope, more or less? Swiss Med Wkly 2005; 135: 451-460 [PMID: 16208582]
9 Markanday A. Acute Phase Reactants in Infections: Evidence-Based Review and a Guide for Clinicians. Open Forum Infect Dis 2015; 2: ofv098 [PMID: 26258155 DOI: 10.1093/ofid/ofv098]
10 Vikse J, Henry BM, Roy J, Ramakrishnan PK, Tomaszewski KA, Walocha JA. The role of serum procalcitonin in the diagnosis of bacterial meningitis in adults: a systematic review and meta-analysis. Int J Infect Dis 2015; 38: 68-76 [PMID: 26188130 DOI: 10.1016/j.ijid.2015.07.011]
11 Lippi G, Meschi T, Cervellin G. Inflammatory biomarkers for the diagnosis, monitoring and follow-up of community-acquired pneumonia: clinical evidence and perspectives. Eur J Intern Med 2011; 22: 460-465 [PMID: 21925053 DOI: 10.1016/j.ejim.2011.02.023]
12 Rast AC, Knobel D, Faessler L, Kutz A, Felder S, Laukemann S, Steiner D, Haubitz S, Fux CA, Huber A, Mueller B, Schuetz P. Use of procalcitonin, C-reactive protein and white blood cell count to distinguish between lower limb erysipelas and deep vein thrombosis in the emergency department: A prospective observational study. J Dermatol 2015; 42: 778-785 [PMID: 25982244 DOI: 10.1111/1346-8138.12922]
13 Saeed K, Dryden M, Sitjar A, White G. Measuring synovial fluid procalcitonin levels in distinguishing cases of septic arthritis, including prosthetic joints, from other causes of arthritis and aseptic loosening. Infection 2013; 41: 845-849 [PMID: 23645456 DOI: 10.1007/s15010-013-0467-2]
14 Lippi G, Valentino M, Cervellin G. Laboratory diagnosis of acute pancreatitis: in search of the Holy Grail. Crit Rev Clin Lab Sci 2012; 49: 18-31 [PMID: 22339380 DOI: 10.3109/10408363.2012.658354]
15 Acharya A, Markar SR, Ni M, Hanna GB. Biomarkers of acute appendicitis: systematic review and cost-benefit trade-off analysis. Surg Endosc 2017; 31: 1022-1031 [PMID: 27495334 DOI: 10.1007/s00464-016-5109-1]
16 Martínez L AB, Marañón P R, Cobo E PV, Tomatis S C, Guerra M L, Peñalba C AC. [Use of procalcitonin as diagnostic marker in acute gastroenteritis]. Rev Chil Pediatr 2014; 85: 157-163 [PMID: 25697203 DOI: 10.4067/S0370-41062014000200004]
17 Attar BM, Moore CM, George M, Ion-Nedelcu N, Turbay R, Zachariah A, Ramadori G, Fareed J, Van Thiel DH. Procalcitonin, and cytokines document a dynamic inflammatory state in non-infected cirrhotic patients with ascites. World J Gastroenterol 2014; 20: 2374-2382 [PMID: 24605035 DOI: 10.3748/wjg.v20.i9.2374]
18 Cosse C, Sabbagh C, Kamel S, Galmiche A, Regimbeau JM. Procalcitonin and intestinal ischemia: a review of the literature. World J Gastroenterol 2014; 20: 17773-17778 [PMID: 25548475 DOI: 10.3748/wjg.v20.i47.17773]
19 Lippi G, Danese E, Cervellin G, Montagnana M. Laboratory diagnostics of spontaneous bacterial peritonitis. Clin Chim Acta 2014; 430: 164-170 [PMID: 24508989 DOI: 10.1016/j.cca.2014.01.023]
20 Domínguez-Comesaña E, Ballinas-Miranda JR. [Procalcitonin as a marker of intra-abdominal infection]. Cir Cir 2014; 82: 231-239 [PMID: 25312325]
21 Korczowski B, Szybist W. Serum procalcitonin and C-reactive protein in children with diarrhoea of various aetiologies. Acta paediatrica (Oslo, Norway : 1992) 2004; 93: 169-173 [DOI:10.1111/j.1651-2227.2004.tb00700.x]
22 Herrlinger KR, Dittmann R, Weitz G, Wehkamp J, Ludwig D, Schwab M, Stange EF, Fellermann K. Serum procalcitonin differentiates inflammatory bowel disease and self-limited colitis. Inflamm Bowel Dis 2004; 10: 229-233 [DOI:10.1097/00054725-200405000-00008]
23 Thia KT, Chan ES, Ling KL, Ng WY, Jacob E, Ooi CJ. Role of procalcitonin in infectious gastroenteritis and inflammatory bowel disease. Dig Dis Sci 2008; 53: 2960-2968 [PMID: 18415679 DOI: 10.1007/s10620-008-0254-6]
24 Oruç N, Ozütemiz O, Osmanoğlu N, Ilter T. Diagnostic value of serum procalcitonin in determining the activity of inflammatory bowel disease. Turk J Gastroenterol 2009; 20: 9-12 [PMID: 19330729]
25 Oussalah A, Laurent V, Bruot O, Guéant JL, Régent D, Bigard MA, Peyrin-Biroulet L. Additional benefit of procalcitonin to C-reactive protein to assess disease activity and severity in Crohn’s disease. Aliment Pharmacol Ther 2010; 32: 1135-1144 [PMID: 21039675 DOI: 10.1111/j.1365-2036.2010.04459.x]
26 Koido S, Ohkusa T, Takakura K, Odahara S, Tsukinaga S, Yukawa T, Mitobe J, Kajihara M, Uchiyama K, Arakawa H, Tajiri H. Clinical significance of serum procalcitonin in patients with ulcerative colitis. World J Gastroenterol 2013; 19: 8335-8341 [PMID: 24363525 DOI: 10.3748/wjg.v19.i45.8335]
27 Chung SH, Lee HW, Kim SW, Park SJ, Hong SP, Kim TI, Kim WH, Cheon JH. Usefulness of Measuring Serum Procalcitonin Levels in Patients with Inflammatory Bowel Disease. Gut Liver 2016; 10: 574-580 [PMID: 26780089 DOI: 10.5009/gnl15209]
28 Ge X, Hu D, Cao Y, Liu Z, Ding C, Tian H, Gong J, Zhu W, Li N, Li J. Procalcitonin in Crohn’s disease with fever episodes, a variable to differentiate intra-abdominal abscess from disease flares. Int J Surg 2016; 36: 34-39 [PMID: 27743896 DOI: 10.1016/j.ijsu.2016.10.011]
29 Nishio E, Saruta M, Arihiro S, Matsuoka M, Mitsunaga M, Ide D, Iwasaki T, Ogawa M, Sawada R, Nagata Y, Kato T, Tajiri H. The clinical benefit of procalcitonin to assess disease activity and severity in inflammatory bowel disease. Gastroenterology 2016; 150: S995 [DOI:10.1016/S0016-5085(16)33369-8]
30 Hosomi S, Yamagami H, Itani S, Yukawa T, Otani K, Nagami Y, Tanaka F, Taira K, Kamata N, Tanigawa T, Shiba M, Watanabe T, Fujiwara Y. Sepsis markers soluble IL-2 receptor and soluble CD14 subtype as potential biomarkers for complete mucosal healing in patients with inflammatory bowel disease. J Crohns Colitis 2017 [PMID: 28961693 DOI: 10.1093/ecco-jcc/jjx124]
31 Zielińska-Borkowska U, Dib N, Tarnowski W, Skirecki T. Monitoring of procalcitonin but not interleukin-6 is useful for the early prediction of anastomotic leakage after colorectal surgery. Clin Chem Lab Med 2017; 55: 1053-1059 [PMID: 27930362 DOI: 10.1515/cclm-2016-0736]
32 Kim SE. Serum Procalcitonin Is a Candidate Biomarker to Differentiate Bacteremia from Disease Flares in Patients with Inflammatory Bowel Disease. Gut Liver 2016; 10: 491-492 [PMID: 27377736 DOI: 10.5009/gnl16272]
33 Bartolovic D, Ignjatovic S, Stankovic S, Nada Majkić S. Procalcitonin and Other Biomarkers of Sepsis in Newborns in the
Lippi G et al . Procalcitonin in IBD
8290 December 21, 2017|Volume 23|Issue 47|WJG|www.wjgnet.com
Intensive Care Unit. EJIFCC 2011; 22: 24-30 [PMID: 27683386]34 Ślebioda TJ, Kmieć Z. Tumour necrosis factor superfamily
members in the pathogenesis of inflammatory bowel disease. Mediators Inflamm 2014; 2014: 325129 [PMID: 25045210 DOI: 10.1155/2014/325129]
35 Kucharzik T, Maaser C. Infections and Chronic Inflammatory
Bowel Disease. Viszeralmedizin 2014; 30: 326-332 [PMID: 26288602 DOI: 10.1159/000366463]
36 Navaneethan U, Venkatesh PG, Shen B. Clostridium difficile infection and inflammatory bowel disease: understanding the evolving relationship. World J Gastroenterol 2010; 16: 4892-4904 [PMID: 20954275 DOI:10.3748/wjg.v16.i39.4892]
P- Reviewer: Sferra TJ, Sivandzadeh GR S- Editor: Chen K L- Editor: Filipodia E- Editor: Huang Y
Lippi G et al . Procalcitonin in IBD
Omar Youssef, Virinder Sarhadi, Homa Ehsan, Sakari Knuutila, Department of Pathology, Faculty of Medicine, University of Helsinki, Helsinki 00014, Finland
Tom Böhling, Department of Pathology, University of Helsinki and HUSLAB, Helsinki University Hospital, Helsinki 00014, Finland
Monika Carpelan-Holmström, Selja Koskensalo, Pauli Puolakkainen, Arto Kokkola, The HUCH Gastrointestinal Clinic, University Central Hospital of Helsinki, Helsinki 00290, Finland
ORCID numbers: Omar Youssef (0000-0002-1827-9156); Virinder Sarhadi (0000-0003-2503-8198); Homa Ehsan (0000 -0001-5252-4015); Tom Böhling (0000-0001-8903-3690); Monika Carpelan-Holmström (0000-0003-3881-2103); Selja Koskensalo (0000-0001-6959-8715); Pauli Puolakkainen (0000 -0003-2489 -4371); Arto Kokkola (0000-0002-8286-0666); Sakari Knuutila (0000-0001-5592-3839).
Author contributions: Youssef O conducted sequencing of the samples and prepared the manuscript; Ehsan H prepared the samples for sequencing; Kokkola A, Carpelan-Holmström M, Koskensalo S and Puolakkainen P contributed clinical support for the participating subjects and arranged for stool sample collection; Sarhadi V, Böhling T and Knuutila S contributed to the study design and writing of the manuscript.
Institutional review board statement: The research study protocol was approved by the Hospital District of Helsinki and Uusimaa (HUS) Review Board (Ethical permission number 351/13/03/02/2014).
Conflict-of-interest statement: The authors declare no conflicts of interest.
Data sharing statement: Dataset available from [email protected]
Open-Access: This article is an open-access article which was
selected by an in-house editor and fully peer-reviewed by external reviewers. It is distributed in accordance with the Creative Commons Attribution Non Commercial (CC BY-NC 4.0) license, which permits others to distribute, remix, adapt, build upon this work non-commercially, and license their derivative works on different terms, provided the original work is properly cited and the use is non-commercial. See: http://creativecommons.org/licenses/by-nc/4.0/
Manuscript source: Unsolicited manuscript
Correspondence to: Sakari Knuutila, PhD, Professor, Depart-ment of Pathology, Faculty of Medicine, University of Helsinki, Haartmaninkatu 4, Helsinki 00014, Finland. [email protected]: +358-504482797Fax: +358-294126700
Received: October 3, 2017Peer-review started: October 5, 2017First decision: October 18, 2017Revised: November 1, 2017Accepted: November 14, 2017Article in press: November 14, 2017Published online: December 21, 2017
AbstractAIMTo study cancer hotspot mutations by next-generation sequencing (NGS) in stool DNA from patients with different gastrointestinal tract (GIT) neoplasms.
METHODSStool samples were col lected from 87 Finnish patients diagnosed with various gastric and colorectal neoplasms, including benign tumors, and from 14 healthy controls. DNA was isolated from stools by using
8291 December 21, 2017|Volume 23|Issue 47|WJG|www.wjgnet.com
ORIGINAL ARTICLE
Gene mutations in stool from gastric and colorectal neoplasia patients by next-generation sequencing
Basic Study
Omar Youssef, Virinder Sarhadi, Homa Ehsan, Tom Böhling, Monika Carpelan-Holmström, Selja Koskensalo, Pauli Puolakkainen, Arto Kokkola, Sakari Knuutila
Submit a Manuscript: http://www.f6publishing.com
DOI: 10.3748/wjg.v23.i47.8291
World J Gastroenterol 2017 December 21; 23(47): 8291-8299
ISSN 1007-9327 (print) ISSN 2219-2840 (online)
the PSP® Spin Stool DNA Plus Kit. For each sample, 20 ng of DNA was used to construct sequencing libraries using the Ion AmpliSeq Cancer Hotspot Panel v2 or Ion AmpliSeq Colon and Lung Cancer panel v2. Sequencing was performed on Ion PGM. Torrent Suite Software v.5.2.2 was used for variant calling and data analysis.
RESULTSNGS was successful in assaying 72 GIT samples and 13 healthy controls, with success rates of the assay being 78% for stomach neoplasia and 87% for colorectal tumors. In stool specimens from patients with gastric neoplasia, five hotspot mutations were found in APC , CDKN2A and EGFR genes, in addition to seven novel mutations. From colorectal patients, 20 mutations were detected in AKT1 , APC , ERBB2 , FBXW7 , KIT , KRAS , NRAS , SMARCB1 , SMO , STK11 and TP53 . Healthy controls did not exhibit any hotspot mutations, except for two novel ones. APC and TP53 were the most frequently mutated genes in colorectal neoplasms, with five mutations, followed by KRAS with two mutations. APC was the most commonly mutated gene in stools of patients with premalignant/benign GIT lesions.
CONCLUSIONOur results show that in addition to colorectal neoplasms, mutations can also be assayed from stool specimens of patients with gastric neoplasms.
Key words: Stool DNA; Next-generation sequencing; Mutations; Gastric neoplasia; Colorectal neoplasia
© The Author(s) 2017. Published by Baishideng Publishing Group Inc. All rights reserved.
Core tip: Next-generation sequencing (NGS) was successfully applied for detecting cancer gene mutations in stool DNA of patients with different gastrointestinal neoplasms. Using a gene panel, comprising up to 50 cancer genes, it was found that mutations not only could be detected in stool DNA from colorectal cancer patients but also in patients with stomach cancer and those with benign or premalignant lesions. No hotspot mutations were detected in healthy controls. Our results show that NGS could be useful in screening for neoplastic changes of the gastrointestinal tract.
Youssef O, Sarhadi V, Ehsan H, Böhling T, Carpelan-Holmström M, Koskensalo S, Puolakkainen P, Kokkola A, Knuutila S. Gene mutations in stool from gastric and colorectal neoplasia patients by next-generation sequencing. World J Gastroenterol 2017; 23(47): 8291-8299 Available from: URL: http://www.wjgnet.com/1007-9327/full/v23/i47/8291.htm DOI: http://dx.doi.org/10.3748/wjg.v23.i47.8291
INTRODUCTIONGastrointestinal tract (GIT) malignancies are a diverse
group of neoplasms with diverse epidemiology and incidences that affect different regions of the GIT, from the stomach to the large intestine. The value of somatic mutations in GIT malignancies is recognized, (1) as markers for early detection; (2) as markers that predict drug resistance, and (3) for follow up of cancer treatment[1-6]. In global terms, gastric carcinoma is the fifth most common cancer and the third most common cause of cancer-related mortality. Adenocarcinoma is its most typical subtype and present in 90% of all cases[7]. TP53, PIK3CA, ARID1A and cell adhesion pathway genes have been found to be the most frequently mutated genes in gastric adenocarcinomas[8]. The CDH1 gene is described as being involved in the pathogenesis of diffuse gastric carcinoma[9]. In sporadic colorectal cancer (CRC), APC, TP53, KRAS, PI3CA, FBXW7, SMAD4 and BRAF are the most commonly mutated genes[10].
One of the major issues in GIT malignancies, spe-cifically gastric carcinoma, is that they are usually detected at an advanced stage, due to late diagnosis[11]. Moreover, recent studies have demonstrated the diversity of morphological (intestinal and diffuse subtypes) and molecular subtypes (mesenchymal-like type, microsatellite-unstable tumor type, and TP53 tumor type) of gastric carcinoma, which contributes to the challenge of optimizing proper diagnosis and treatment[12]. The principal problem hindering early detection of gastric and colorectal neoplasia is the lack of symptoms; even when symptoms are present, they tend to be mild and nonspecific, which may delay subjecting the patient for endoscopic examination. Exfoliation of cells, whether premalignant or malignant, is continuously occurring from epithelial layer into the digestive lumen[13,14]; these display various genetic changes that have occurred in these cells, and can provide evidence of tumor pathogenesis[15]. Testing DNA abnormalities in stool specimens from GIT carcinoma patients represents a promising noninvasive approach for early cancer detection and for treatment follow-up. Multi-target stool DNA test is currently being used for CRC screening[16].
We have previously shown that next-generation sequencing (NGS) can be successfully applied for investigating mutations in stool DNA obtained from patients with CRC[13]. In the current study, we applied the NGS method to determine whether cancer mutations could also be detected in stool samples from patients with other GIT tumors, including both diffuse and intestinal subtypes of gastric adenocarcinoma, gastric dysplasia, colorectal adenocarcinoma and adenoma, and colorectal leiomyoma.
MATERIALS AND METHODSPatientsDuring the period from April 2015 to May 2017, 79 gastric cancer, 38 gastrointestinal stromal tumor
8292 December 21, 2017|Volume 23|Issue 47|WJG|www.wjgnet.com
Youssef O et al . Gene mutations in stool
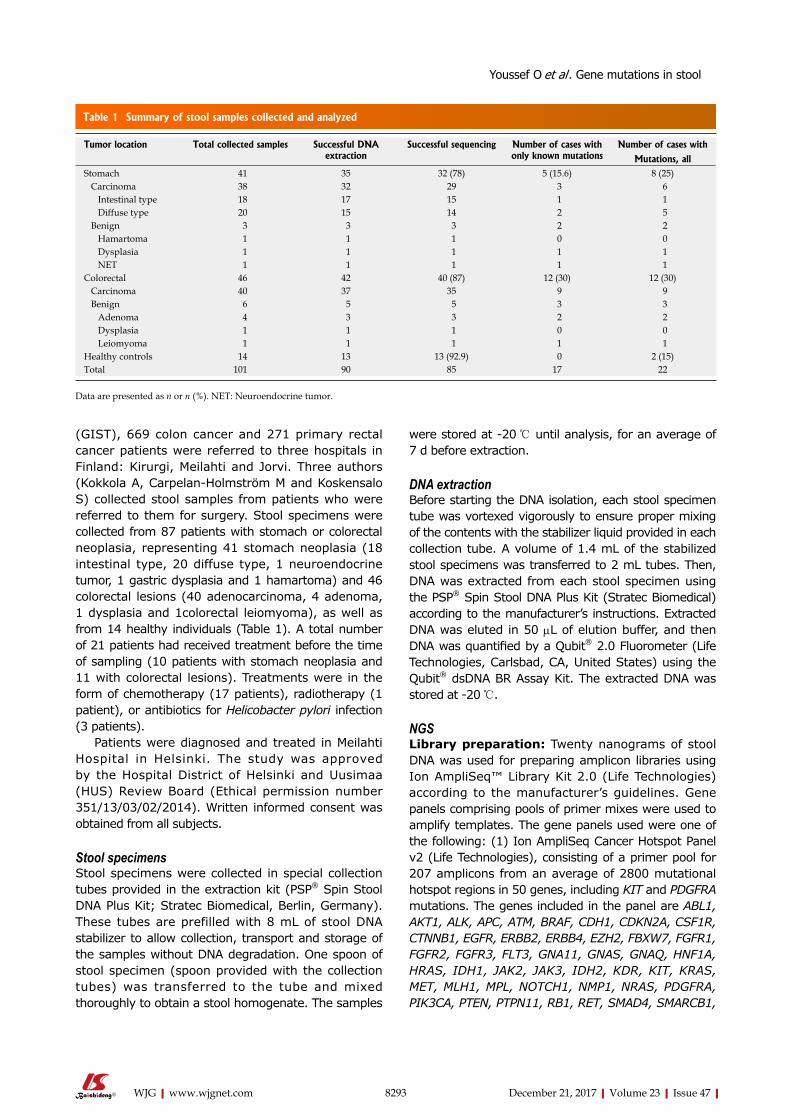
(GIST), 669 colon cancer and 271 primary rectal cancer patients were referred to three hospitals in Finland: Kirurgi, Meilahti and Jorvi. Three authors (Kokkola A, Carpelan-Holmström M and Koskensalo S) collected stool samples from patients who were referred to them for surgery. Stool specimens were collected from 87 patients with stomach or colorectal neoplasia, representing 41 stomach neoplasia (18 intestinal type, 20 diffuse type, 1 neuroendocrine tumor, 1 gastric dysplasia and 1 hamartoma) and 46 colorectal lesions (40 adenocarcinoma, 4 adenoma, 1 dysplasia and 1colorectal leiomyoma), as well as from 14 healthy individuals (Table 1). A total number of 21 patients had received treatment before the time of sampling (10 patients with stomach neoplasia and 11 with colorectal lesions). Treatments were in the form of chemotherapy (17 patients), radiotherapy (1 patient), or antibiotics for Helicobacter pylori infection (3 patients).
Patients were diagnosed and treated in Meilahti Hospital in Helsinki. The study was approved by the Hospital District of Helsinki and Uusimaa (HUS) Review Board (Ethical permission number 351/13/03/02/2014). Written informed consent was obtained from all subjects.
Stool specimensStool specimens were collected in special collection tubes provided in the extraction kit (PSP® Spin Stool DNA Plus Kit; Stratec Biomedical, Berlin, Germany). These tubes are prefilled with 8 mL of stool DNA stabilizer to allow collection, transport and storage of the samples without DNA degradation. One spoon of stool specimen (spoon provided with the collection tubes) was transferred to the tube and mixed thoroughly to obtain a stool homogenate. The samples
were stored at -20 ℃ until analysis, for an average of 7 d before extraction.
DNA extractionBefore starting the DNA isolation, each stool specimen tube was vortexed vigorously to ensure proper mixing of the contents with the stabilizer liquid provided in each collection tube. A volume of 1.4 mL of the stabilized stool specimens was transferred to 2 mL tubes. Then, DNA was extracted from each stool specimen using the PSP® Spin Stool DNA Plus Kit (Stratec Biomedical) according to the manufacturer’s instructions. Extracted DNA was eluted in 50 µL of elution buffer, and then DNA was quantified by a Qubit® 2.0 Fluorometer (Life Technologies, Carlsbad, CA, United States) using the Qubit® dsDNA BR Assay Kit. The extracted DNA was stored at -20 ℃.
NGSLibrary preparation: Twenty nanograms of stool DNA was used for preparing amplicon libraries using Ion AmpliSeq™ Library Kit 2.0 (Life Technologies) according to the manufacturer’s guidelines. Gene panels comprising pools of primer mixes were used to amplify templates. The gene panels used were one of the following: (1) Ion AmpliSeq Cancer Hotspot Panel v2 (Life Technologies), consisting of a primer pool for 207 amplicons from an average of 2800 mutational hotspot regions in 50 genes, including KIT and PDGFRA mutations. The genes included in the panel are ABL1, AKT1, ALK, APC, ATM, BRAF, CDH1, CDKN2A, CSF1R, CTNNB1, EGFR, ERBB2, ERBB4, EZH2, FBXW7, FGFR1, FGFR2, FGFR3, FLT3, GNA11, GNAS, GNAQ, HNF1A, HRAS, IDH1, JAK2, JAK3, IDH2, KDR, KIT, KRAS, MET, MLH1, MPL, NOTCH1, NMP1, NRAS, PDGFRA, PIK3CA, PTEN, PTPN11, RB1, RET, SMAD4, SMARCB1,
8293 December 21, 2017|Volume 23|Issue 47|WJG|www.wjgnet.com
Table 1 Summary of stool samples collected and analyzed
Tumor location Total collected samples Successful DNA extraction
Successful sequencing Number of cases with only known mutations
Number of cases with
Mutations, allStomach 41 35 32 (78) 5 (15.6) 8 (25) Carcinoma 38 32 29 3 6 Intestinal type 18 17 15 1 1 Diffuse type 20 15 14 2 5 Benign 3 3 3 2 2 Hamartoma 1 1 1 0 0 Dysplasia 1 1 1 1 1 NET 1 1 1 1 1Colorectal 46 42 40 (87) 12 (30) 12 (30) Carcinoma 40 37 35 9 9 Benign 6 5 5 3 3 Adenoma 4 3 3 2 2 Dysplasia 1 1 1 0 0 Leiomyoma 1 1 1 1 1Healthy controls 14 13 13 (92.9) 0 2 (15)Total 101 90 85 17 22
Data are presented as n or n (%). NET: Neuroendocrine tumor.
Youssef O et al . Gene mutations in stool
8294 December 21, 2017|Volume 23|Issue 47|WJG|www.wjgnet.com
patient stool samples, while NGS assay was succe-ssfully carried out on 72 patient stool DNA samples. Five samples were removed from NGS assay due to poor DNA quality (too little or degraded DNA). Of the 14 controls, DNA could be isolated from 13 samples and all were successfully sequenced. The success rates of sequencing stool samples for stomach and colorectal neoplasia were rather similar (78% and 87% respectively) (Table 1).
Hotspot (COSMIC) and novel mutationsIn patients’ stool samples, a total of 25 hotspot mutations were found (20 in patients with colorectal neoplasia and 5 in patents with stomach neoplasia), while 9 novel mutations were detected (7 in patients with stomach neoplasia and 2 in control samples).
Thirteen control samples from healthy individuals did not reveal any hotspot mutations, but two novel mutations were observed in ALK, and STK11 genes in two subjects.
Mutations in patients with stomach neoplasmsA total number of five hotspot mutations that had been reported earlier in the COSMIC database were detected in APC, CDKN2A and EGFR genes in stool specimens from 3 gastric adenocarcinoma patients, 1 patient with neuroendocrine tumor, and 1 patient with gastric dysplasia (Table 2). Four samples from patients with adenocarcinoma (diffuse type) revealed a total of seven novel mutations that led to an amino acid change and which had not been reported previously in either the COSMIC or dbSNP databases. The detected novel mutations were found in seven genes, that included APC, CDH1, DDR2, HRAS, NRAS, PTEN, and SMARCB1 (Table 2).
Mutations in patients with colorectal tumorsTwenty hotspot mutations in AKT1, APC, ERBB2, FBXW7, KIT, KRAS, NRAS, SMARCB1, SMO, STK11, and TP53 were seen in 9 patients with ade-nocarcinomas, 2 with benign adenoma, and 1 with leiomyoma. APC was the most frequently mutated gene with five mutations, followed by TP53 (five mutations), and KRAS (two mutations) (Table 2). One case of benign leiomyoma revealed a TP53 mutation (R306*) mutation, which had been reported as a germline mutation associated with the hereditary cancer pre-disposing syndrome. Additionally, this mutation has also been reported as a somatic pathogenic mutation in COSMIC in tumors of the colon and other parts of the digestive tract (Table 2). No novel mutations were found in our study in stool samples from colorectal cases.
DISCUSSIONWe are one of the first groups that applied NGS to
SMO, SRC, STK11, TP53, and VHL; (2) Ion AmpliSeq Colon and Lung Cancer panel v2 (Life Technologies), consisting of a primer pool for 92 amplicons from 504 hotspot regions in 22 genes frequently mutated in CRC. The genes included in this panel are AKT1, ALK, BRAF, CTNNB1, DDR2, EGFR, ERBB2, ERBB4, FBX7, FGFR1, FGFR2, FGFR3, KRAS, MAP2K1, MET, NOTCH1, NRAS, PIK3CA, PTEN, SMAD4, STK11, and TP53.
All specimens from patients with gastric neoplasms and 19 specimens from patients with colorectal neoplasia were assayed using Ion AmpliSeq Cancer Hotspot Panel v2, while the remaining specimens from colorectal neoplasia patients were studied by Ion AmpliSeq Colon and Lung Cancer panel v2. The major reason for using two different platforms was that Ion AmpliSeq Cancer Hotspot Panel v2 contains several genes that are commonly mutated in gastric neoplasia.
The amplified libraries were purified using Agencourt AMPure XP beads (Beckman Coulter Genomics, High Wycombe, United Kingdom). The concentration of the purified libraries was measured on the Qubit® 2.0 Fluorometer, using the Qubit® dsDNA HS Assay Kit. The DNA libraries were stored at -20 ℃ until further use.
Template preparation and sequencing: The amp-lified and purified libraries were diluted to 100 pmol/L, and the templates were prepared and enriched using the Ion OneTouch™ 2 System (Life Technologies), an automated emulsion PCR system. Finally, sequencing was carried out on the Ion Personal Genome Machine System (PGM™; Life Technologies) using Ion 316™ Chips and the Ion PGM™ Sequencing Hi-Q Kit v2.
Data analysisThe Torrent Suite Software v.5.2.2 (Life Technologies) was used to assess run performance and data analysis, and Integrative Genomics Viewer (IGV v 2.2; Broad Institute, Cambridge, MA, United States) was used for visual inspection of the aligned reads.
Variants were further filtered based on quality score (score of 15 or more) and mutant allele frequency (more than 3%). Only single nucleotide variants (SNVs) resulting in a nonsynonymous amino acid change, or a premature stop codon, and all short indels resulting in either a frameshift or insertion/deletion of amino acids were selected. All SNVs were analyzed for previously reported hotspot mutations (somatic mutations reported in the COSMIC database) and novel variations, i.e. new mutations detected by NGS but not reported in either COSMIC or dbSNP (build 150) databases.
RESULTSSuccess rateSuccessful DNA extraction was performed on 77/87
Youssef O et al . Gene mutations in stool
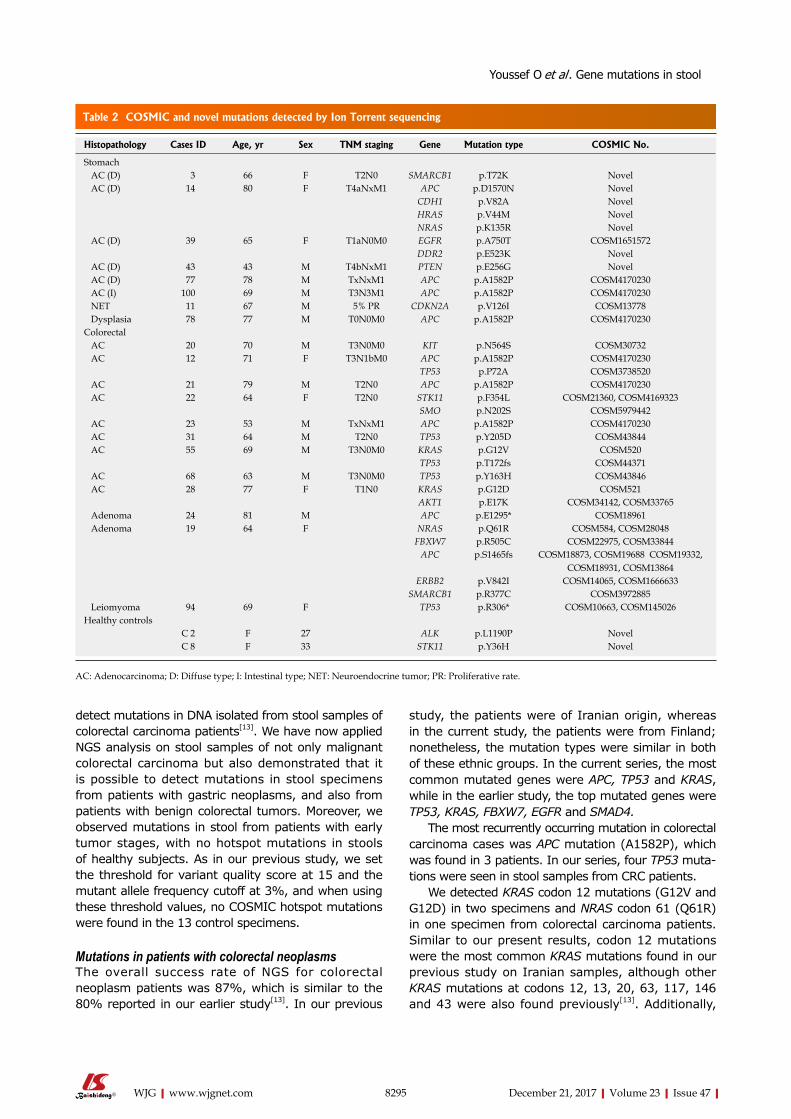
8295 December 21, 2017|Volume 23|Issue 47|WJG|www.wjgnet.com
detect mutations in DNA isolated from stool samples of colorectal carcinoma patients[13]. We have now applied NGS analysis on stool samples of not only malignant colorectal carcinoma but also demonstrated that it is possible to detect mutations in stool specimens from patients with gastric neoplasms, and also from patients with benign colorectal tumors. Moreover, we observed mutations in stool from patients with early tumor stages, with no hotspot mutations in stools of healthy subjects. As in our previous study, we set the threshold for variant quality score at 15 and the mutant allele frequency cutoff at 3%, and when using these threshold values, no COSMIC hotspot mutations were found in the 13 control specimens.
Mutations in patients with colorectal neoplasmsThe overall success rate of NGS for colorectal neoplasm patients was 87%, which is similar to the 80% reported in our earlier study[13]. In our previous
study, the patients were of Iranian origin, whereas in the current study, the patients were from Finland; nonetheless, the mutation types were similar in both of these ethnic groups. In the current series, the most common mutated genes were APC, TP53 and KRAS, while in the earlier study, the top mutated genes were TP53, KRAS, FBXW7, EGFR and SMAD4.
The most recurrently occurring mutation in colorectal carcinoma cases was APC mutation (A1582P), which was found in 3 patients. In our series, four TP53 muta-tions were seen in stool samples from CRC patients.
We detected KRAS codon 12 mutations (G12V and G12D) in two specimens and NRAS codon 61 (Q61R) in one specimen from colorectal carcinoma patients. Similar to our present results, codon 12 mutations were the most common KRAS mutations found in our previous study on Iranian samples, although other KRAS mutations at codons 12, 13, 20, 63, 117, 146 and 43 were also found previously[13]. Additionally,
Table 2 COSMIC and novel mutations detected by Ion Torrent sequencing
Histopathology Cases ID Age, yr Sex TNM staging Gene Mutation type COSMIC No.
Stomach AC (D) 3 66 F T2N0 SMARCB1 p.T72K Novel AC (D) 14 80 F T4aNxM1 APC p.D1570N Novel
CDH1 p.V82A NovelHRAS p.V44M NovelNRAS p.K135R Novel
AC (D) 39 65 F T1aN0M0 EGFR p.A750T COSM1651572DDR2 p.E523K Novel
AC (D) 43 43 M T4bNxM1 PTEN p.E256G Novel AC (D) 77 78 M TxNxM1 APC p.A1582P COSM4170230 AC (I) 100 69 M T3N3M1 APC p.A1582P COSM4170230 NET 11 67 M 5% PR CDKN2A p.V126I COSM13778 Dysplasia 78 77 M T0N0M0 APC p.A1582P COSM4170230Colorectal AC 20 70 M T3N0M0 KIT p.N564S COSM30732 AC 12 71 F T3N1bM0 APC p.A1582P COSM4170230
TP53 p.P72A COSM3738520 AC 21 79 M T2N0 APC p.A1582P COSM4170230 AC 22 64 F T2N0 STK11 p.F354L COSM21360, COSM4169323
SMO p.N202S COSM5979442 AC 23 53 M TxNxM1 APC p.A1582P COSM4170230 AC 31 64 M T2N0 TP53 p.Y205D COSM43844 AC 55 69 M T3N0M0 KRAS p.G12V COSM520
TP53 p.T172fs COSM44371 AC 68 63 M T3N0M0 TP53 p.Y163H COSM43846 AC 28 77 F T1N0 KRAS p.G12D COSM521
AKT1 p.E17K COSM34142, COSM33765 Adenoma 24 81 M APC p.E1295* COSM18961 Adenoma 19 64 F NRAS p.Q61R COSM584, COSM28048
FBXW7 p.R505C COSM22975, COSM33844APC p.S1465fs COSM18873, COSM19688 COSM19332,
COSM18931, COSM13864ERBB2 p.V842I COSM14065, COSM1666633
SMARCB1 p.R377C COSM3972885 Leiomyoma 94 69 F TP53 p.R306* COSM10663, COSM145026Healthy controls
C 2 F 27 ALK p.L1190P NovelC 8 F 33 STK11 p.Y36H Novel
AC: Adenocarcinoma; D: Diffuse type; I: Intestinal type; NET: Neuroendocrine tumor; PR: Proliferative rate.
Youssef O et al . Gene mutations in stool
8296 December 21, 2017|Volume 23|Issue 47|WJG|www.wjgnet.com
a recent study demonstrated the detection of KRAS G12D mutation in stool samples from patients with colorectal carcinoma by using droplet PCR[17]. Clinical data available from those patients for who KRAS testing in tumor tissue was carried out correlated to KRAS mutation status in stool. In patient number 55, the presence of KRAS G12V mutation was confirmed in tumor tissue specimens with 20% mutant allele fraction. The same mutation (KRAS G12V) was detected in the stool DNA from the same patient with 13% mutant allele fraction. Moreover, tissue samples from patient number 23 revealed no KRAS or NRAS mutations, and the same negative findings for those two mutations were also observed in the stool DNA specimen from this case.
Among the patients with benign colorectal tumors, APC mutations were most common and found in two samples with colorectal benign adenoma. Adenomas with APC mutations have been reported more likely to progress into large adenomas and invasive carcinomas[18,19]. Inactivation of the APC gene and the subsequent activation of Wnt signaling pathway are key factors in the initiation of tumorigenesis of CRC[20,21]. The R505C mutation in FBXW7 seen in a colorectal adenoma patient in the present study was also reported in our previous study in a colorectal carcinoma patient[13].
TP53 is another gene commonly mutated in CRC, and plays a crucial role in the adenoma to carcinoma transition during carcinogenesis, and may have an impact on cancer prognosis[22]. A patient with leiomyoma revealed a nonsense TP53 mutation (R306*), which has been reported as a somatic mutation in colon tumors and also considered as a germline mutation associated with hereditary cancer-predisposing syndrome and Li-Fraumeni syndrome in CRC, although not in gastric carcinoma[23]. In our case, this TP53 mutation is apparently somatic, as the allele fraction was 5.5%. A meta-analysis of studies carried out on stool DNA testing has shown an overall sensitivity of 68% and 93% specificity in the diagnosis of advanced colorectal adenoma[24].
Mutations in patients with stomach neoplasmsAs far as we aware, this is the first study to have utilized stool samples from patients with stomach neoplasia. Eight out of 32 patients’ samples (25%) with stomach neoplasia revealed 12 mutations (both hotspot COSMIC and novel).
In gastric neoplasia, the APC gene mutations were those most frequently encountered. Four APC mutations were detected in patients with gastric neoplasia (three mutations in gastric carcinoma, and one in benign gastric dysplasia). APC is a tumor suppressor gene that has a key role in several molecular processes, such as suppression of canonical
Wnt signaling[25], and the presence of APC mutations have been demonstrated in gastric adenocarcinoma samples[26,27]. APC gene mutations have been reported in both intestinal and diffuse types of gastric carcinoma with a higher frequency in the intestinal subtype of the disease[28,29]. The adenoma to carcinoma transition pathway has a 20% APC mutation in the intestinal type of gastric carcinoma[30]. In our study, an APC A1582P mutation was seen in both the intestinal and diffuse types, and an APC D1570N mutation was seen in the diffuse type. Furthermore, we detected the same APC mutation (A1582P) in a stool specimen from a patient with benign gastric dysplasia. This is in concordance with an earlier study that identified the presence of APC mutations in tumorous tissue in cases with gastric adenomas or flat dysplasia, and also in benign cases associated with adenocarcinoma[5,31].
In the diffuse type of gastric carcinoma, CDH1 is reported to be commonly mutated[32], and CDH1 germline mutations have also been reported to play an important role in diffuse gastric carcinoma development[33]. EGFR mutations are also commonly encountered in the diffuse subtype[34-36] of gastric neoplasia, although their role is still controversial. We found the E-cadherin gene (CDH1) V82A mutation in a diffuse gastric carcinoma patient, and also found the exon 19 EGFR (A750T) mutation in another case with diffuse gastric carcinoma.
Novel mutations were found in NRAS (K135R), DDR2 (E523K) and in exon 7 of PTEN (E256). Codon 12 or 13 NRAS mutations in tumor tissues have been reported to be associated with a poor prognosis in metastatic stomach carcinoma[37,38], whereas DDR2 expression in gastric tumor tissues has been described to be associated with an increased risk of peritoneal dissemination[39]. Despite the low frequency of PTEN mutations in gastric malignant tumors, they tend to be associated with poorly differentiated gastric carcinoma, TNM staging and resistance effect to chemotherapy[40,41]. Interestingly, the novel PTEN (E256G) mutation seen in our study was found in a gastric cancer case with an advanced tumor stage (T4bNxM1).
In conclusion, our results demonstrate that NGS technology can be applied for detection of gene mutations in stool specimens from not only colorectal cancer patients but also from patients with stomach neoplasms, as well as those with benign tumors of the gastrointestinal tract.
ARTICLE HIGHLIGHTS Research backgroundStool DNA sample is a simple, noninvasive source for studying genetic markers of diagnostic/prognostic or predictive significance in colorectal cancer. The significance of stool DNA testing is, however, not well known for stomach cancers and for benign tumors. Current assays screen individual or few mutations only, and do not cover all important cancer mutations. Amplicon-
ARTICLE HIGHLIGHTS
Youssef O et al . Gene mutations in stool
8297 December 21, 2017|Volume 23|Issue 47|WJG|www.wjgnet.com
based NGS could, thus, provide a sensitive method for DNA testing from stool samples in gastrointestinal (GIT) malignancies.
Research motivationThe main challenge in stool DNA-based genetic testing is that only a small proportion of stool DNA is of human origin, thus requiring a very sensitive test. We, therefore, hypothesized that diagnostic value of stool-based DNA testing could be enhanced by applying sensitive amplicon–based next-generation sequencing (NGS) to stool DNA. With the application of NGS we could screen all important mutations in 50 genes from a small amount of input DNA in a single test.
Research objectives The objective of the study was to apply NGS for screening hotspot mutations in commonly mutated genes in GIT malignancies from stool DNA. The aim was also to see if mutations could be detected in patients with gastric cancer and in patients with early neoplasms, in addition to those with colorectal cancer.
Research methodsMutation detection was performed by amplicon-based NGS using the Ion AmpliSeq Cancer Hotspot Panel v2 and Ion AmpliSeq Colon and Lung Cancer panel v2. Template preparation was done using the Ion OneTouch™ 2 System and sequencing was performed on Ion PGM (Thermo-Fisher Scientific). Sequencing data analysis and variant calling was performed by using the Torrent Suite Software v.5.2.2 with variant caller plugin. All single nucleotide variants were analyzed for previously reported hotspot mutations (reported in the COSMIC database) and novel variations, i.e. not reported in either COSMIC or dbSNP databases.
Research resultsHotspot mutations in stool DNA were found in APC, CDKN2A and EGFR in patients with stomach neoplasms and in AKT1, APC, ERBB2, FBXW7, KIT, KRAS, NRAS, SMARCB1, SMO, STK11 and TP53 in patients with colorectal neoplasia. APC was the most commonly mutated gene in stools of patients with premalignant/benign GIT lesions.
Research conclusionsThis study demonstrates that NGS-based mutation screening can be successfully applied to stool DNA from patients with GIT neoplasms. In addition to mutation detection in stool DNA from colorectal cancer patients, mutations can also be detected from gastric cancer patients, as well as from patients with premalignant or benign neoplasms.
Mutation testing from stool DNA is mainly carried out for individual gene mutations by PCR-based methods for colorectal cancer screening. Since the amount of DNA of human origin is very low in stool, it was hypothesized that amplicon-based NGS could be highly sensitive and suitable for studying a large number of mutations, which could greatly enhance the diagnostic value of stool DNA testing. The methods used in this study require low input of DNA, can amplify around 200 targeted regions of important cancer genes, and together with the high sensitivity of NGS provide a great advantage over prevailing methods for mutation detection from stool DNA.
This study showed that mutations can also be detected in stool DNA from patients with stomach neoplasms. Detection of mutations in stool DNA of patients with premalignant neoplasm, and also in patients with stage I and II of tumor, demonstrates its application for early detection of GIT neoplasms.
The results of this study could have implication in future NGS-based stool DNA diagnostic tests that could be useful for screening of GIT malignancies and for detection at the premalignant stage. It could also act as a guide in a targeted therapy regimen, and to ease follow up of the treatment.
Research perspectivesGenetic mutations can be detected by amplicon–based NGS in stool DNA from patients with GIT tumors other than colorectal cancer also. Moreover, early neoplastic changes in GIT can also be detected in stool DNA. These results open up possibilities of development of NGS-based stool DNA test. Further testing of this method on a larger number of samples from patients with different GIT malignancies, premalignant lesions and healthy individuals is needed to
fully assess it applicability in cancer diagnostics.
ACKNOWLEDGMENTSWe thank Lauri Lehtimäki and Milja Tikkanen for their skillful technical assistance. Also, we thank Ewen Mac Donald for his language editing of the manuscript.
REFERENCES1 De Roock W, Claes B, Bernasconi D, De Schutter J, Biesmans B,
Fountzilas G, Kalogeras KT, Kotoula V, Papamichael D, Laurent-Puig P, Penault-Llorca F, Rougier P, Vincenzi B, Santini D, Tonini G, Cappuzzo F, Frattini M, Molinari F, Saletti P, De Dosso S, Martini M, Bardelli A, Siena S, Sartore-Bianchi A, Tabernero J, Macarulla T, Di Fiore F, Gangloff AO, Ciardiello F, Pfeiffer P, Qvortrup C, Hansen TP, Van Cutsem E, Piessevaux H, Lambrechts D, Delorenzi M, Tejpar S. Effects of KRAS, BRAF, NRAS, and PIK3CA mutations on the efficacy of cetuximab plus chemotherapy in chemotherapy-refractory metastatic colorectal cancer: a retrospective consortium analysis. Lancet Oncol 2010; 11: 753-762 [PMID: 20619739 DOI: 10.1016/S1470-2045(10)70130-3]
2 Miranda C, Nucifora M, Molinari F, Conca E, Anania MC, Bordoni A, Saletti P, Mazzucchelli L, Pilotti S, Pierotti MA, Tamborini E, Greco A, Frattini M. KRAS and BRAF mutations predict primary resistance to imatinib in gastrointestinal stromal tumors. Clin Cancer Res 2012; 18: 1769-1776 [PMID: 22282465 DOI: 10.1158/1078-0432.CCR-11-2230]
3 Antonescu CR, Romeo S, Zhang L, Nafa K, Hornick JL, Nielsen GP, Mino-Kenudson M, Huang HY, Mosquera JM, Dei Tos PA, Fletcher CD. Dedifferentiation in gastrointestinal stromal tumor to an anaplastic KIT-negative phenotype: a diagnostic pitfall: morphologic and molecular characterization of 8 cases occurring either de novo or after imatinib therapy. Am J Surg Pathol 2013; 37: 385-392 [PMID: 23348204 DOI: 10.1097/PAS.0b013e31826c1761]
4 Joensuu H, Rutkowski P, Nishida T, Steigen SE, Brabec P, Plank L, Nilsson B, Braconi C, Bordoni A, Magnusson MK, Sufliarsky J, Federico M, Jonasson JG, Hostein I, Bringuier PP, Emile JF. KIT and PDGFRA mutations and the risk of GI stromal tumor recurrence. J Clin Oncol 2015; 33: 634-642 [PMID: 25605837 DOI: 10.1200/JCO.2014.57.4970]
5 Lee JH, Abraham SC, Kim HS, Nam JH, Choi C, Lee MC, Park CS, Juhng SW, Rashid A, Hamilton SR, Wu TT. Inverse relationship between APC gene mutation in gastric adenomas and development of adenocarcinoma. Am J Pathol 2002; 161: 611-618 [PMID: 12163385 DOI: 10.1016/S0002-9440(10)64216-2]
6 Fenoglio-Preiser CM, Wang J, Stemmermann GN, Noffsinger A. TP53 and gastric carcinoma: a review. Hum Mutat 2003; 21: 258-270 [PMID: 12619111 DOI: 10.1002/humu.10180]
7 Carneiro F. World Cancer Report 2014. In: Stewart BW and Wild CP. Cancer by organ site: stomach cancer. Lyon, France, IARC, 2014: 383-391
8 Zang ZJ, Cutcutache I, Poon SL, Zhang SL, McPherson JR, Tao J, Rajasegaran V, Heng HL, Deng N, Gan A, Lim KH, Ong CK, Huang D, Chin SY, Tan IB, Ng CC, Yu W, Wu Y, Lee M, Wu J, Poh D, Wan WK, Rha SY, So J, Salto-Tellez M, Yeoh KG, Wong WK, Zhu YJ, Futreal PA, Pang B, Ruan Y, Hillmer AM, Bertrand D, Nagarajan N, Rozen S, Teh BT, Tan P. Exome sequencing of gastric adenocarcinoma identifies recurrent somatic mutations in cell adhesion and chromatin remodeling genes. Nat Genet 2012; 44: 570-574 [PMID: 22484628 DOI: 10.1038/ng.2246]
9 Guilford P, Hopkins J, Harraway J, McLeod M, McLeod N, Harawira P, Taite H, Scoular R, Miller A, Reeve AE. E-cadherin germline mutations in familial gastric cancer. Nature 1998; 392: 402-405 [PMID: 9537325 DOI: 10.1038/32918]
10 Staudacher JJ, Yazici C, Bul V, Zeidan J, Khalid A, Xia Y, Krett
Youssef O et al . Gene mutations in stool
8298 December 21, 2017|Volume 23|Issue 47|WJG|www.wjgnet.com
N, Jung B. Increased frequency of KRAS mutations in African Americans compared with Caucasians in sporadic colorectal cancer. Clin Transl Gastroenterol 2017; 8: e124 [PMID: 29048416 DOI: 10.1038/ctg.2017.48]
11 Gore RM, Mehta UK, Berlin JW, Rao V, Newmark GM. Upper gastrointestinal tumours: diagnosis and staging. Cancer Imaging 2006; 6: 213-217 [PMID: 17208679 DOI: 10.1102/1470-7330.2006.0032]
12 Cristescu R, Lee J, Nebozhyn M, Kim KM, Ting JC, Wong SS, Liu J, Yue YG, Wang J, Yu K, Ye XS, Do IG, Liu S, Gong L, Fu J, Jin JG, Choi MG, Sohn TS, Lee JH, Bae JM, Kim ST, Park SH, Sohn I, Jung SH, Tan P, Chen R, Hardwick J, Kang WK, Ayers M, Hongyue D, Reinhard C, Loboda A, Kim S, Aggarwal A. Molecular analysis of gastric cancer identifies subtypes associated with distinct clinical outcomes. Nat Med 2015; 21: 449-456 [PMID: 25894828 DOI: 10.1038/nm.3850]
13 Armengol G, Sarhadi VK, Ghanbari R, Doghaei-Moghaddam M, Ansari R, Sotoudeh M, Puolakkainen P, Kokkola A, Malekzadeh R, Knuutila S. Driver Gene Mutations in Stools of Colorectal Carcinoma Patients Detected by Targeted Next-Generation Sequencing. J Mol Diagn 2016; 18: 471-479 [PMID: 27155048 DOI: 10.1016/j.jmoldx.2016.01.008]
14 Youssef O, Sarhadi VK, Lehtimäki L, Tikkanen M, Kokkola A, Puolakkainen P, Armengol, G, Knuutila, S. Mutations by next generation sequencing in stool DNA from colorectal carcinoma patients – a literature review and our experience with this methodology. J Anal Oncol 2016; 5: 24-32 [DOI: 10.6000/1927-7229.2016.05.01.3]
15 Bosch LJ, Carvalho B, Fijneman RJ, Jimenez CR, Pinedo HM, van Engeland M, Meijer GA. Molecular tests for colorectal cancer screening. Clin Colorectal Cancer 2011; 10: 8-23 [PMID: 21609931 DOI: 10.3816/CCC.2011.n.002]
16 Brenner H, Chen H. Fecal occult blood versus DNA testing: indirect comparison in a colorectal cancer screening population. Clin Epidemiol 2017; 9: 377-384 [PMID: 28761377 DOI: 10.2147/CLEP.S136565]
17 Olmedillas-López S, Lévano-Linares DC, Alexandre CLA, Vega-Clemente L, Sánchez EL, Villagrasa A, Ruíz-Tovar J, García-Arranz M, García-Olmo D. Detection of KRAS G12D in colorectal cancer stool by droplet digital PCR. World J Gastroenterol 2017; 23: 7087-7097 [PMID: 29093617 DOI: 10.3748/wjg.v23.i39.7087]
18 Samowitz WS, Powers MD, Spirio LN, Nollet F, van Roy F, Slattery ML. Beta-catenin mutations are more frequent in small colorectal adenomas than in larger adenomas and invasive carcinomas. Cancer Res 1999; 59: 1442-1444 [PMID: 10197610]
19 Lamlum H, Papadopoulou A, Ilyas M, Rowan A, Gillet C, Hanby A, Talbot I, Bodmer W, Tomlinson I. APC mutations are sufficient for the growth of early colorectal adenomas. Proc Natl Acad Sci USA 2000; 97: 2225-2228 [PMID: 10681434 DOI: 10.1073/pnas.040564697]
20 Fodde R. The APC gene in colorectal cancer. Eur J Cancer 2002; 38: 867-871 [PMID: 11978510 DOI: 10.1016/S0959-8049(02)00040-0]
21 Rowan AJ, Lamlum H, Ilyas M, Wheeler J, Straub J, Papadopoulou A, Bicknell D, Bodmer WF, Tomlinson IP. APC mutations in sporadic colorectal tumors: A mutational ”hotspot” and interdependence of the ”two hits”. Proc Natl Acad Sci USA 2000; 97: 3352-3357 [PMID: 10737795 DOI: 10.1073/pnas.97.7.3352]
22 Li XL, Zhou J, Chen ZR, Chng WJ. P53 mutations in colorectal cancer - molecular pathogenesis and pharmacological reactivation. World J Gastroenterol 2015; 21: 84-93 [PMID: 25574081 DOI: 10.3748/wjg.v21.i1.84]
23 Yurgelun MB, Masciari S, Joshi VA, Mercado RC, Lindor NM, Gallinger S, Hopper JL, Jenkins MA, Buchanan DD, Newcomb PA, Potter JD, Haile RW, Kucherlapati R, Syngal S; Colon Cancer Family Registry. Germline TP53 mutations in patients with early-onset colorectal cancer in the colon cancer family registry. JAMA Oncol 2015; 1: 214-221 [PMID: 26086041 DOI: 10.1001/jamaoncol.2015.0197]
24 Yang H, Xia BQ, Jiang B, Wang G, Yang YP, Chen H, Li BS, Xu AG, Huang YB, Wang XY. Diagnostic value of stool DNA testing for multiple markers of colorectal cancer and advanced adenoma: a meta-analysis. Can J Gastroenterol 2013; 27: 467-475 [PMID: 23936877 DOI: 10.1155/2013/258030]
25 Aoki K, Taketo MM. Adenomatous polyposis coli (APC): a multi-functional tumor suppressor gene. J Cell Sci 2007; 120: 3327-3335 [PMID: 17881494 DOI: 10.1242/jcs.03485]
26 Nakatsuru S, Yanagisawa A, Ichii S, Tahara E, Kato Y, Nakamura Y, Horii A. Somatic mutation of the APC gene in gastric cancer: frequent mutations in very well differentiated adenocarcinoma and signet-ring cell carcinoma. Hum Mol Genet 1992; 1: 559-563 [PMID: 1338691 DOI: 10.1093/hmg/1.8.559]
27 Horii A, Nakatsuru S, Miyoshi Y, Ichii S, Nagase H, Kato Y, Yanagisawa A, Nakamura Y. The APC gene, responsible for familial adenomatous polyposis, is mutated in human gastric cancer. Cancer Res 1992; 52: 3231-3233 [PMID: 1317264]
28 Fang DC, Luo YH, Yang SM, Li XA, Ling XL, Fang L. Mutation analysis of APC gene in gastric cancer with microsatellite instability. World J Gastroenterol 2002; 8: 787-791 [PMID: 12378616 DOI: 10.3748/wjg.v8.i5.787]
29 Ghatak S, Chakraborty P, Sarkar SR, Chowdhury B, Bhaumik A, Kumar NS. Novel APC gene mutations associated with protein alteration in diffuse type gastric cancer. BMC Med Genet 2017; 18: 61 [PMID: 28576136 DOI: 10.1186/s12881-017-0427-2]
30 Tahara E. Genetic pathways of two types of gastric cancer. IARC Sci Publ 2004; : 327-349 [PMID: 15055305]
31 Tamura G, Maesawa C, Suzuki Y, Tamada H, Satoh M, Ogasawara S, Kashiwaba M, Satodate R. Mutations of the APC gene occur during early stages of gastric adenoma development. Cancer Res 1994; 54: 1149-1151 [PMID: 8118796]
32 Lee YS, Cho YS, Lee GK, Lee S, Kim YW, Jho S, Kim HM, Hong SH, Hwang JA, Kim SY, Hong D, Choi IJ, Kim BC, Kim BC, Kim CH, Choi H, Kim Y, Kim KW, Kong G, Kim HL, Bhak J, Lee SH, Lee JS. Genomic profile analysis of diffuse-type gastric cancers. Genome Biol 2014; 15: R55 [PMID: 24690483 DOI: 10.1186/gb-2014-15-4-r55]
33 Liu X , Chu KM. E-cadherin and gastric cancer: cause, consequence, and applications. Biomed Res Int 2014; 2014: 637308 [PMID: 25184143 DOI: 10.1155/2014/637308]
34 Moutinho C, Mateus AR, Milanezi F, Carneiro F, Seruca R, Suriano G. Epidermal growth factor receptor structural alterations in gastric cancer. BMC Cancer 2008; 8: 10 [PMID: 18199332 DOI: 10.1186/1471-2407-8-10]
35 Atmaca A, Werner D, Pauligk C, Steinmetz K, Wirtz R, Altmannsberger HM, Jäger E, Al-Batran SE. The prognostic impact of epidermal growth factor receptor in patients with metastatic gastric cancer. BMC Cancer 2012; 12: 524 [PMID: 23153332 DOI: 10.1186/1471-2407-12-524]
36 Liu Z, Liu L, Li M, Wang Z, Feng L, Zhang Q, Cheng S, Lu S. Epidermal growth factor receptor mutation in gastric cancer. Pathology 2011; 43: 234-238 [PMID: 21436633 DOI: 10.1097/PAT.0b013e328344e61b]
37 Takahashi N, Yamada Y, Taniguchi H, Fukahori M, Sasaki Y, Shoji H, Honma Y, Iwasa S, Takashima A, Kato K, Hamaguchi T, Shimada Y. Clinicopathological features and prognostic roles of KRAS, BRAF, PIK3CA and NRAS mutations in advanced gastric cancer. BMC Res Notes 2014; 7: 271 [PMID: 24774510 DOI: 10.1186/1756-0500-7-271]
38 Fukahori M. Analysis of gene mutations in KRAS, NRAS, BRAF, and PIK3CA in patients who received systemic chemotherapy with metastatic gastric cancer. J Clin Oncol 2013; 31: 27 [DOI: 10.1200/jco.2013.31.4]
39 Kurashige J, Hasegawa T, Niida A, Sugimachi K, Deng N, Mima K, Uchi R, Sawada G, Takahashi Y, Eguchi H, Inomata M, Kitano S, Fukagawa T, Sasako M, Sasaki H, Sasaki S, Mori M, Yanagihara K, Baba H, Miyano S, Tan P, Mimori K. Integrated molecular profiling of human gastric cancer identifies DDR2 as a potential
Youssef O et al . Gene mutations in stool
8299 December 21, 2017|Volume 23|Issue 47|WJG|www.wjgnet.com
regulator of peritoneal dissemination. Sci Rep 2016; 6: 22371 [PMID: 26934957 DOI: 10.1038/srep22371]
40 Wen YG, Wang Q, Zhou CZ, Qiu GQ, Peng ZH, Tang HM. Mutation analysis of tumor suppressor gene PTEN in patients with gastric carcinomas and its impact on PI3K/AKT pathway. Oncol
Rep 2010; 24: 89-95 [PMID: 20514448]41 Xu WT, Yang Z, Lu NH. Roles of PTEN (Phosphatase and Tensin
Homolog) in gastric cancer development and progression. Asian Pac J Cancer Prev 2014; 15: 17-24 [PMID: 24528021 DOI: 10.7314/APJCP.2014.15.1.17]
P- Reviewer: Mastoraki A, Venu RP S- Editor: Gong ZM L- Editor: Filipodia E- Editor: Huang Y
Youssef O et al . Gene mutations in stool
Nezha Senhaji, Sellama Nadifi, Nadia Serbati, Laboratory of Genetic and Molecular Pathology, Faculty of Medicine and Pharmacy of Casablanca, Hassan II University, Casablanca 20100, Morocco
Younes Zaid, Mohammed VI University of Health Sciences, Casablanca 20000, Morocco
Aurora Serrano, Daniel Arturo Leon Rodriguez, Javier Martín, Instituto de Parasitología y Biomedicina López-Neyra, Consejo Superior de Investigaciones Científicas, P.T.S. Granada 18016, Spain
Mehdi Karkouri, Department of Pathology, CHU Ibn Rochd, Casablanca 20000, Morocco
Wafaa Badre, Department of Gastroenterology, CHU Ibn Rochd, Casablanca 20000, Morocco
Author contributions: Senhaji N carried out the molecular genetics studies, participated in the recruitment of patients and drafted the manuscript; Nadifi S conceived the study and participated in its design and coordination; Zaid Y has been involved in revising the manuscript. Serrano A participated in the molecular genetics study; Rodriguez DAL helped in the statistical analysis; Serbati N participated in the recruitment of patients and clinical data collection; Karkouri M and Badre W coordinated patients’ recruitment and provided the clinical data; Martín J conceived the study and revised the manuscript; all authors read and approved the final manuscript.
Institutional review board statement: The ethics committee of the Faculty of Medicine and Pharmacy of Casablanca approved the study in accordance with the declaration of Helsinki for experiments involving humans.
Conflict-of-interest statement: The authors declare that there are no conflicts of interest.
Data sharing statement: The datasets supporting the conclusions of this article are included within the article.
Open-Access: This article is an open-access article which was
selected by an in-house editor and fully peer-reviewed by external reviewers. It is distributed in accordance with the Creative Commons Attribution Non Commercial (CC BY-NC 4.0) license, which permits others to distribute, remix, adapt, build upon this work non-commercially, and license their derivative works on different terms, provided the original work is properly cited and the use is non-commercial. See: http://creativecommons.org/licenses/by-nc/4.0/
Manuscript source: Unsolicited manuscript
Correspondence to: Nezha Senhaji, PhD, Laboratory of Genetics and Molecular Pathology, Faculty of Medicine and Pharmacy of Casablanca, University Hassan II. 19, rue Tarik Ibnou Ziad, Faculté de Médecine et de Pharmacie, Casablanca 20100, Morocco. [email protected]: +212-6-65896590
Received: March 25, 2017 Peer-review started: March 29, 2017First decision: April 21, 2017Revised: May 14, 2017 Accepted: June 1, 2017 Article in press: June 1, 2017Published online: December 21, 2017
AbstractAIMTo investigate whether common variants in the oxidative pathway genes influence inflammatory bowel disease (IBD) risk among Moroccan patients.
METHODSThe distribution of (TAAA)n_rs12720460 and (CCTTT)n _rs3833912 NOS2A microsatellite repeats, HIF -1A_rs11549467 and NFKB1 -94ins/delATTG_rs28362491 was analyzed in 507 subjects grouped in 199 IBD and 308 healthy controls. Genotyping was performed with
8300 December 21, 2017|Volume 23|Issue 47|WJG|www.wjgnet.com
ORIGINAL ARTICLE
Polymorphisms in oxidative pathway related genes and susceptibility to inflammatory bowel disease
Basic Study
Nezha Senhaji, Sellama Nadifi, Younes Zaid, Aurora Serrano, Daniel Arturo Leon Rodriguez, Nadia Serbati, Mehdi Karkouri, Wafaa Badre, Javier Martín
Submit a Manuscript: http://www.f6publishing.com
DOI: 10.3748/wjg.v23.i47.8300
World J Gastroenterol 2017 December 21; 23(47): 8300-8307
ISSN 1007-9327 (print) ISSN 2219-2840 (online)
polymerase chain reaction-fluorescent method and the TaqMan® allelic discrimination technology.
RESULTSThe allele and genotype frequencies of HIF1A _ rs11549467, NFKB1_rs28362491 and NOS2A_ (TAAA)n did not differ significantly between patients and controls. Analysis of NOS2A _ (CCTTT)n markers evidenced differences between patients and healthy controls. A preferential presence of the (CCTTT)8 (P = 0.02; OR = 1.71, 95%CI: 1.07-2.74), (CCTTT)14 (P = 0.02; OR = 1.71, 95%CI: 1.06-2.76) alleles in IBD, (CCTTT)8 (P = 0.008; OR = 1.95, 95%CI: 1.17-3.23) in CD and (CCTTT)7 (P = 0.009; OR = 7.61, 95%CI: 1.25-46.08), (CCTTT)11 (P = 0.05; OR = 0.51, 95%CI: 0.25-1.01), (CCTTT)14 (P = 0.02; OR = 2.05, 95%CI: 1.07-3.94), (CCTTT)15 (P = 0.01; OR = 2.25, 95%CI: 1.16-4.35) repeats in UC patients indicated its possible association with higher disease risk which need to be confirmed in a larger sample size.
CONCLUSIONOur results suggest that the NOS2A_ (CCTTT)n gene variations may influence IBD susceptibility in the Moroccan population.
Key words: HIF1A ; NFKB1 ; NOS2A ; Inflammatory bowel disease; Moroccan patients
© The Author(s) 2017. Published by Baishideng Publishing Group Inc. All rights reserved.
Core tip: This is the first study to assess the invo-lvement of oxidative pathway related genes in inflammatory bowel disease (IBD) development and to determine a possible effect of these variants on clinical course. We genotyped 507 subjects grouped in 308 healthy controls and 199 IBD patients for the (TAAA)n_rs12720460 and (CCTTT)n_rs3833912 NOS2A microsatellite repeats, HIF-1A_rs11549467 and NFKB1-94ins/delATTG_rs28362491 polymorphisms. The present study showed that NOS2A _ (CCTTT)n gene variations may influence IBD susceptibility in the Moroccan population. However, our data do not support a role for the NFKB1 and HIF1A polymorphisms in the pathogenesis of IBD.
Senhaji N, Nadifi S, Zaid Y, Serrano A, Rodriguez DAL, Serbati N, Karkouri M, Badre W, Martín J. Polymorphisms in oxidative pathway related genes and susceptibility to inflammatory bowel disease. World J Gastroenterol 2017; 23(47): 8300-8307 Available from: URL: http://www.wjgnet.com/1007-9327/full/v23/i47/8300.htm DOI: http://dx.doi.org/10.3748/wjg.v23.i47.8300
INTRODUCTIONInflammatory bowel disease (IBD), a chronic and
relapsing-remitting disorder of the gastrointes-tinal tract, encompasses Crohn’s disease (CD) and ulcerative colitis (UC).
IBD was previously found mainly in Western countries, with higher prevalence reported in developed countries[1]. However, during the last few decades, incidence rates of the two major forms of IBD have been increasing in developing countries[2], including Morocco.
Chronic intestinal inflammation is a hallmark of both disorders, and is believed to result from a number of abnormal conditions. The involvement of oxidative damage in IBD development has been thoroughly documented. Oxidative stress mainly contributes to aberrant inflammatory responses of intestinal cells to commensal bacteria and dietary antigens. During IBD, activated leukocytes generate a wide spectrum of proinflammatory cytokines, in addition to excessive oxidative reactions that alter the redox equilibrium within the gut mucosa. Therefore, the capacity to maintain inflammation by induction of transcription factors and redox-sensitive signaling pathways may influence the occurrence and severity of the disease[3]. Induction of inducible nitric oxide synthase (iNOS) was reported to play a key role in oxidative stress-induced inflammation[4]. The genetic polymorphisms of the NOS2A (nitric oxide synthase) gene have been proposed to be involved in IBD aetiology[5]. Two functionally relevant polymorphisms located at NOS2A gene promoter region were reported, the first one is a highly polymorphic pentanucleotide (CCTTT)n microsatellite repeat which is important in the regulation of NOS2A transcription[6]. The second one is located at the proximal promoter region and consists of an insertion/deletion of one TAAA repeat[7].
Perpetuation of inflammation is also mediated by cellular stress responses of inflammatory cells that produce soluble mediators and reactive species which act by further inducing changes in transcription factors, among which hypoxia-inducible factor-1α (HIF-1α) and nuclear factor κB (NF-κB)[8]. HIF-1-α is a key regulator of cellular response to hypoxia, the gene encoding the HIF-1α subunit (HIF1A) carries a common missense mutation, A588T (G>A, rs11549467), that has been related to increased trans-activation capacity[9]. The involvement of HIF-1-α in the enhancement of the inflammatory response was demonstrated; elevated levels of HIF-1-α in biopsies of primary lesions of patients confirmed its role in inflammatory diseases[10]. HIF-1-α has been shown to induce the secretion of inflammatory mediators by indirect signaling through NF-kB-mediated cytokine and chemokine secretion[11].
NF-κB is activated during inflammation, giving rise to induction of gene expression of several genes involved in mucosal inflammation such as cytokines (TNFA, IL6, IL1β...), Cox-2, and NOS2A[12,13]. A functional NFKB1 promoter polymorphism consisting of a common (-94ins/delATTG) insertion/deletion,
8301 December 21, 2017|Volume 23|Issue 47|WJG|www.wjgnet.com
Senhaji N et al . Oxidative pathway related genes and IBD
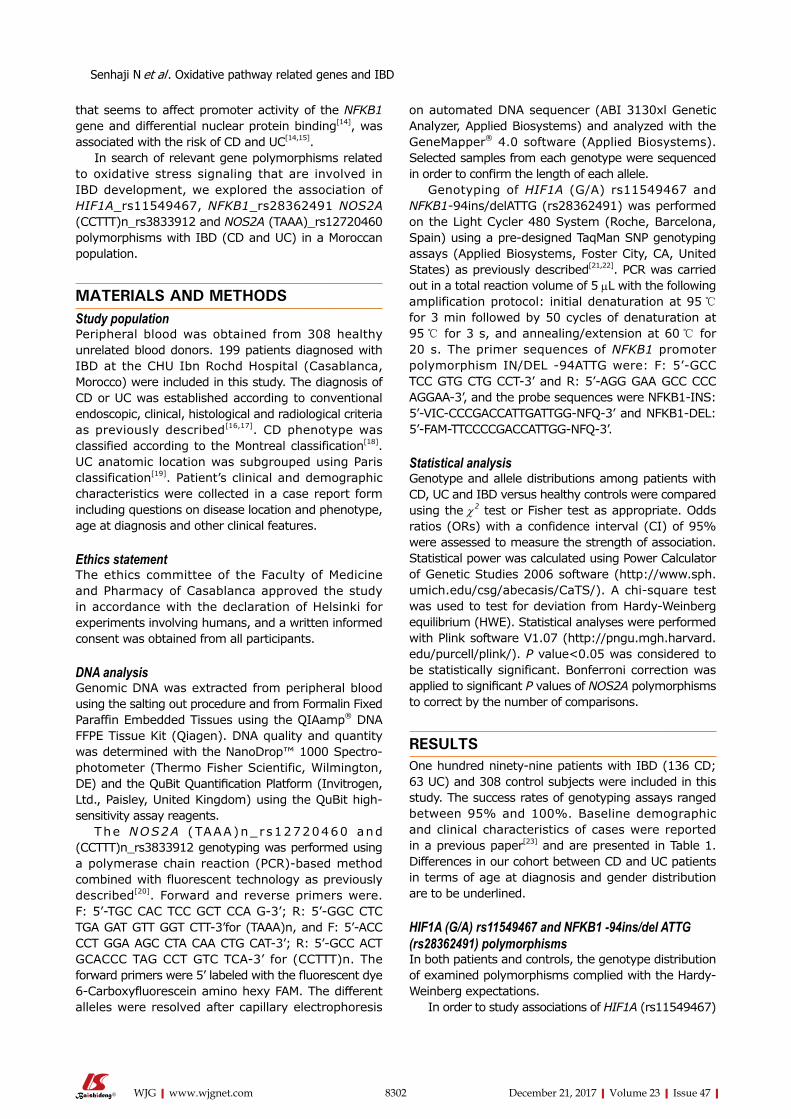
that seems to affect promoter activity of the NFKB1 gene and differential nuclear protein binding[14], was associated with the risk of CD and UC[14,15].
In search of relevant gene polymorphisms related to oxidative stress signaling that are involved in IBD development, we explored the association of HIF1A_rs11549467, NFKB1_rs28362491 NOS2A (CCTTT)n_rs3833912 and NOS2A (TAAA)_rs12720460 polymorphisms with IBD (CD and UC) in a Moroccan population.
MATERIALS AND METHODSStudy populationPeripheral blood was obtained from 308 healthy unrelated blood donors. 199 patients diagnosed with IBD at the CHU Ibn Rochd Hospital (Casablanca, Morocco) were included in this study. The diagnosis of CD or UC was established according to conventional endoscopic, clinical, histological and radiological criteria as previously described[16,17]. CD phenotype was classified according to the Montreal classification[18]. UC anatomic location was subgrouped using Paris classification[19]. Patient’s clinical and demographic characteristics were collected in a case report form including questions on disease location and phenotype, age at diagnosis and other clinical features.
Ethics statementThe ethics committee of the Faculty of Medicine and Pharmacy of Casablanca approved the study in accordance with the declaration of Helsinki for experiments involving humans, and a written informed consent was obtained from all participants.
DNA analysisGenomic DNA was extracted from peripheral blood using the salting out procedure and from Formalin Fixed Paraffin Embedded Tissues using the QIAamp® DNA FFPE Tissue Kit (Qiagen). DNA quality and quantity was determined with the NanoDrop™ 1000 Spectro-photometer (Thermo Fisher Scientific, Wilmington, DE) and the QuBit Quantification Platform (Invitrogen, Ltd., Paisley, United Kingdom) using the QuBit high-sensitivity assay reagents.
The NOS2A (TAAA)n_rs12720460 and (CCTTT)n_rs3833912 genotyping was performed using a polymerase chain reaction (PCR)-based method combined with fluorescent technology as previously described[20]. Forward and reverse primers were. F: 5’-TGC CAC TCC GCT CCA G-3’; R: 5’-GGC CTC TGA GAT GTT GGT CTT-3’for (TAAA)n, and F: 5’-ACC CCT GGA AGC CTA CAA CTG CAT-3’; R: 5’-GCC ACT GCACCC TAG CCT GTC TCA-3’ for (CCTTT)n. The forward primers were 5’ labeled with the fluorescent dye 6-Carboxyfluorescein amino hexy FAM. The different alleles were resolved after capillary electrophoresis
on automated DNA sequencer (ABI 3130xl Genetic Analyzer, Applied Biosystems) and analyzed with the GeneMapper® 4.0 software (Applied Biosystems). Selected samples from each genotype were sequenced in order to confirm the length of each allele.
Genotyping of HIF1A (G/A) rs11549467 and NFKB1-94ins/delATTG (rs28362491) was performed on the Light Cycler 480 System (Roche, Barcelona, Spain) using a pre-designed TaqMan SNP genotyping assays (Applied Biosystems, Foster City, CA, United States) as previously described[21,22]. PCR was carried out in a total reaction volume of 5 μL with the following amplification protocol: initial denaturation at 95 ℃ for 3 min followed by 50 cycles of denaturation at 95 ℃ for 3 s, and annealing/extension at 60 ℃ for 20 s. The primer sequences of NFKB1 promoter polymorphism IN/DEL -94ATTG were: F: 5’-GCC TCC GTG CTG CCT-3’ and R: 5’-AGG GAA GCC CCC AGGAA-3’, and the probe sequences were NFKB1-INS: 5’-VIC-CCCGACCATTGATTGG-NFQ-3’ and NFKB1-DEL: 5’-FAM-TTCCCCGACCATTGG-NFQ-3’.
Statistical analysis Genotype and allele distributions among patients with CD, UC and IBD versus healthy controls were compared using the χ2 test or Fisher test as appropriate. Odds ratios (ORs) with a confidence interval (CI) of 95% were assessed to measure the strength of association. Statistical power was calculated using Power Calculator of Genetic Studies 2006 software (http://www.sph.umich.edu/csg/abecasis/CaTS/). A chi-square test was used to test for deviation from Hardy-Weinberg equilibrium (HWE). Statistical analyses were performed with Plink software V1.07 (http://pngu.mgh.harvard.edu/purcell/plink/). P value<0.05 was considered to be statistically significant. Bonferroni correction was applied to significant P values of NOS2A polymorphisms to correct by the number of comparisons.
RESULTSOne hundred ninety-nine patients with IBD (136 CD; 63 UC) and 308 control subjects were included in this study. The success rates of genotyping assays ranged between 95% and 100%. Baseline demographic and clinical characteristics of cases were reported in a previous paper[23] and are presented in Table 1. Differences in our cohort between CD and UC patients in terms of age at diagnosis and gender distribution are to be underlined.
HIF1A (G/A) rs11549467 and NFKB1 -94ins/del ATTG (rs28362491) polymorphismsIn both patients and controls, the genotype distribution of examined polymorphisms complied with the Hardy-Weinberg expectations.
In order to study associations of HIF1A (rs11549467)
8302 December 21, 2017|Volume 23|Issue 47|WJG|www.wjgnet.com
Senhaji N et al . Oxidative pathway related genes and IBD
8303 December 21, 2017|Volume 23|Issue 47|WJG|www.wjgnet.com
95%CI: 1.06-2.76) alleles was observed in IBD cases compared with controls respectively.
Similarly the (CCTTT)8 repeat/allele was found to be higher in CD patients cohort as compared to controls (11.4% vs 6.2%, P = 0.008, OR = 1.95, 95%CI: 1.17-3.23). Whereas the increased distribution of the (CCTTT)14 repeat among CD cases compared to controls did not reach the significance level (9.1% vs 6.2%, P = 0.09, OR = 1.56, 95%CI: 0.91-2.68).
Furthermore, determination of allele frequencies in UC patients revealed significant association of the 7, 11, 14 and 15 repeats polymorphic forms of the microsatellite to disease risk. Similar trend, though non-significant, was observed for the 16 repeat (P = 0.06, OR = 3.79, 95%CI: 0.83-17.18).
However, it should be noted that after Bonferroni correction by the number of comparisons, none of the observed associations remained significant in all patient groups.
We further analyzed the distribution of TAAA insertion/deletion polymorphism of NOS2A gene in our population. In this regard, no statistically significant allele or genotype differences were observed between IBD patients and controls (Table 6). Nor were sig-nificant differences between stratified CD and UC patients when compared to controls.
DISCUSSIONIBD is an inflammatory disease resulting from a compound effect of a number of abnormal conditions. Genetic factors may play a pivotal role in the development of IBD. In this regard, we explored the potential contribution of genetic polymorphisms of oxidative pathway genes to the risk of IBD development. Our attention was focused on functionally relevant polymorphisms located in the NOS2A and NFKB1 genes, and a common missense mutation of HIF1A gene.
We found differential distribution of (CCTTT)n microsatellite repeats between patients and controls; namely the (CCTTT)8 and (CCTTT)14 repeats for IBD, the (CCTTT)8 for CD and the (CCTTT)7, (CCTTT)11, (CCTTT)14 and (CCTTT)15 repeats for UC patients. As for Caucasians, the most common allele observed in our population was the 12 repeats instead of 10 and 11 repeats for Northwestern Colombians[20]. To our knowledge only two reports investigated the involvement of NOS2A gene polymorphisms in IBD etiology. Concordantly to our results, Martín et al[5] evidenced the influence of the inducible nitric oxide synthase (CCTTT)n microsatellite repeats on UC risk. However, in contrast to our finding, Oliver et al[24] demonstrated no tendency toward an association with IBD predisposition. This discrepant observation can be explained by geographic factors and ethnicity-related gene effect on disease susceptibility. Results from
and NFKB1 (rs28362491) variants in IBD overall and in CD and UC in particular, the distribution of polymorphic alleles was assessed. Genotype and allele frequencies are given in Tables 2 and 3.
The analysis of both HIF1A (rs11549467) and NFKB1 (rs28362491) polymorphisms distribution among patients and controls did not reveal any statistically significant association, both in terms of allele and genotype frequencies. Similarly, we did not observe any effect on disease risk when Genetic models were assessed (Table 3).
NOS2A (TAAA)n and (CCTTT)n repeat microsatellite repeat polymorphisms We explored the potential influence of NOS2A poly-morphisms on the susceptibility to IBD in the Moroccan population. Tables 4 and 5 show the distribution of the pentanucleotide (CCTTT)n microsatellite alleles in controls, IBD, CD and UC cases. Ten different alleles, comprising of 7-16 repeats i.e. 171-216 bp, were observed in our population. (CCTTT)12 was observed to be the most frequent allele in IBD (21.2%), CD (21.7%), UC cases (20.0%) and controls (22.0%). The overall (CCTTT)n distribution showed differences between cases and controls. The average amount of CCTTT tandem repeats was shown to be less in CD and more in UC patients compared to controls.
When individual CCTTT alleles were analyzed, a significant increase in frequency of the 8-repeat (10.2% vs 6.2%, P = 0.02, OR = 1.71, 95%CI: 1.07-2.74) and 14-repeat (9.9% vs 6.2%, P = 0.02, OR = 1.71,
Table 1 Basic characteristics of inflammatory bowel disease patients n (%)
Patient characteristics CD (n = 136) UC (n = 63)
Gender Male 96 34Female 40 29
Age at diagnosis < 16 16 117-40 79 34≥ 40 22 19
Data not available 19 9Location of CD L1 ± L4 38 (28) -
L2 ± L4 30 (22) -L3 ± L4 53 (39) -
L4 4 (3) -Data not available 11 (8) -
Behavior of CD B1 ± p 35 (26) -B2 ± p 47 (34) -B3 ± p 39 (29) -
Data not available 15 (11) -Location of UC E1 - 5 (8)
E2 - 24 (38)E3 - 8 (12)E4 - 13 (21)
Data not available - 13 (21)Smoking habits Yes 35 11
No 67 32Data not available 34 20
CD: Crohn’s disease; UC: Ulcerative colitis.
Senhaji N et al . Oxidative pathway related genes and IBD
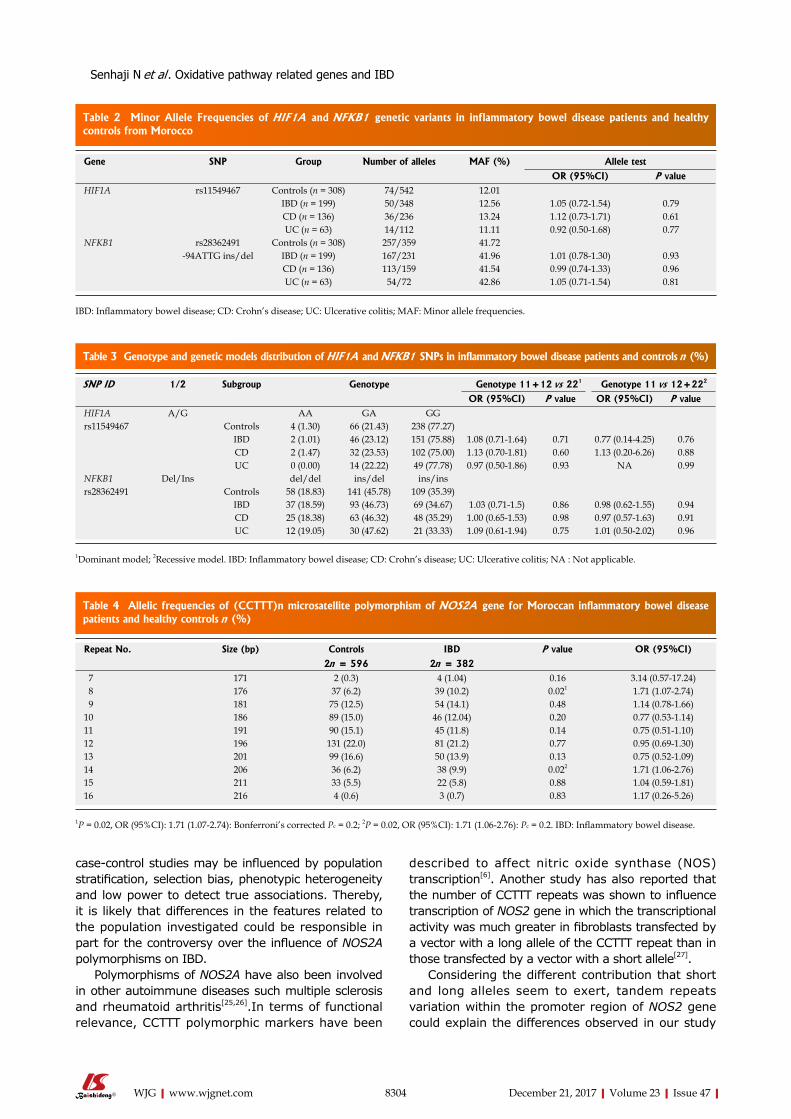
8304 December 21, 2017|Volume 23|Issue 47|WJG|www.wjgnet.com
case-control studies may be influenced by population stratification, selection bias, phenotypic heterogeneity and low power to detect true associations. Thereby, it is likely that differences in the features related to the population investigated could be responsible in part for the controversy over the influence of NOS2A polymorphisms on IBD.
Polymorphisms of NOS2A have also been involved in other autoimmune diseases such multiple sclerosis and rheumatoid arthritis[25,26].In terms of functional relevance, CCTTT polymorphic markers have been
described to affect nitric oxide synthase (NOS) transcription[6]. Another study has also reported that the number of CCTTT repeats was shown to influence transcription of NOS2 gene in which the transcriptional activity was much greater in fibroblasts transfected by a vector with a long allele of the CCTTT repeat than in those transfected by a vector with a short allele[27].
Considering the different contribution that short and long alleles seem to exert, tandem repeats variation within the promoter region of NOS2 gene could explain the differences observed in our study
Table 2 Minor Allele Frequencies of HIF1A and NFKB1 genetic variants in inflammatory bowel disease patients and healthy controls from Morocco
Gene SNP Group Number of alleles MAF (%) Allele test
OR (95%CI) P valueHIF1A rs11549467 Controls (n = 308) 74/542 12.01
IBD (n = 199) 50/348 12.56 1.05 (0.72-1.54) 0.79CD (n = 136) 36/236 13.24 1.12 (0.73-1.71) 0.61UC (n = 63) 14/112 11.11 0.92 (0.50-1.68) 0.77
NFKB1 rs28362491 Controls (n = 308) 257/359 41.72-94ATTG ins/del IBD (n = 199) 167/231 41.96 1.01 (0.78-1.30) 0.93
CD (n = 136) 113/159 41.54 0.99 (0.74-1.33) 0.96UC (n = 63) 54/72 42.86 1.05 (0.71-1.54) 0.81
IBD: Inflammatory bowel disease; CD: Crohn’s disease; UC: Ulcerative colitis; MAF: Minor allele frequencies.
SNP ID 1/2 Subgroup Genotype Genotype 11+12 vs 221 Genotype 11 vs 12+222
OR (95%CI) P value OR (95%CI) P valueHIF1A A/G AA GA GGrs11549467 Controls 4 (1.30) 66 (21.43) 238 (77.27)
IBD 2 (1.01) 46 (23.12) 151 (75.88) 1.08 (0.71-1.64) 0.71 0.77 (0.14-4.25) 0.76CD 2 (1.47) 32 (23.53) 102 (75.00) 1.13 (0.70-1.81) 0.60 1.13 (0.20-6.26) 0.88UC 0 (0.00) 14 (22.22) 49 (77.78) 0.97 (0.50-1.86) 0.93 NA 0.99
NFKB1 Del/Ins del/del ins/del ins/insrs28362491 Controls 58 (18.83) 141 (45.78) 109 (35.39)
IBD 37 (18.59) 93 (46.73) 69 (34.67) 1.03 (0.71-1.5) 0.86 0.98 (0.62-1.55) 0.94CD 25 (18.38) 63 (46.32) 48 (35.29) 1.00 (0.65-1.53) 0.98 0.97 (0.57-1.63) 0.91UC 12 (19.05) 30 (47.62) 21 (33.33) 1.09 (0.61-1.94) 0.75 1.01 (0.50-2.02) 0.96
1Dominant model; 2Recessive model. IBD: Inflammatory bowel disease; CD: Crohn’s disease; UC: Ulcerative colitis; NA : Not applicable.
Table 3 Genotype and genetic models distribution of HIF1A and NFKB1 SNPs in inflammatory bowel disease patients and controls n (%)
Table 4 Allelic frequencies of (CCTTT)n microsatellite polymorphism of NOS2A gene for Moroccan inflammatory bowel disease patients and healthy controls n (%)
Repeat No. Size (bp) Controls IBD P value OR (95%CI)
2n = 596 2n = 382 7 171 2 (0.3) 4 (1.04) 0.16 3.14 (0.57-17.24) 8 176 37 (6.2) 39 (10.2) 0.021 1.71 (1.07-2.74) 9 181 75 (12.5) 54 (14.1) 0.48 1.14 (0.78-1.66)10 186 89 (15.0) 46 (12.04) 0.20 0.77 (0.53-1.14)11 191 90 (15.1) 45 (11.8) 0.14 0.75 (0.51-1.10)12 196 131 (22.0) 81 (21.2) 0.77 0.95 (0.69-1.30)13 201 99 (16.6) 50 (13.9) 0.13 0.75 (0.52-1.09)14 206 36 (6.2) 38 (9.9) 0.022 1.71 (1.06-2.76)15 211 33 (5.5) 22 (5.8) 0.88 1.04 (0.59-1.81)16 216 4 (0.6) 3 (0.7) 0.83 1.17 (0.26-5.26)
1P = 0.02, OR (95%CI): 1.71 (1.07-2.74): Bonferroni’s corrected Pc = 0.2; 2P = 0.02, OR (95%CI): 1.71 (1.06-2.76): Pc = 0.2. IBD: Inflammatory bowel disease.
Senhaji N et al . Oxidative pathway related genes and IBD
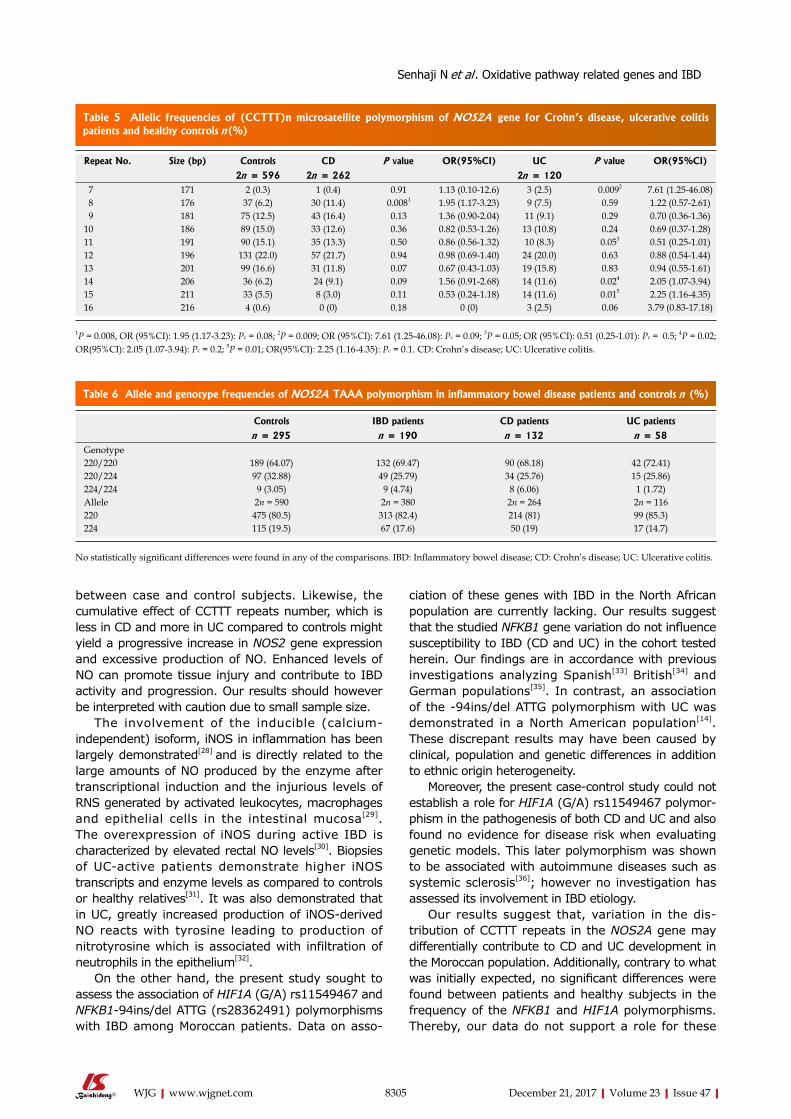
8305 December 21, 2017|Volume 23|Issue 47|WJG|www.wjgnet.com
between case and control subjects. Likewise, the cumulative effect of CCTTT repeats number, which is less in CD and more in UC compared to controls might yield a progressive increase in NOS2 gene expression and excessive production of NO. Enhanced levels of NO can promote tissue injury and contribute to IBD activity and progression. Our results should however be interpreted with caution due to small sample size.
The involvement of the inducible (calcium-independent) isoform, iNOS in inflammation has been largely demonstrated[28] and is directly related to the large amounts of NO produced by the enzyme after transcriptional induction and the injurious levels of RNS generated by activated leukocytes, macrophages and epithelial cells in the intestinal mucosa[29]. The overexpression of iNOS during active IBD is characterized by elevated rectal NO levels[30]. Biopsies of UC-active patients demonstrate higher iNOS transcripts and enzyme levels as compared to controls or healthy relatives[31]. It was also demonstrated that in UC, greatly increased production of iNOS-derived NO reacts with tyrosine leading to production of nitrotyrosine which is associated with infiltration of neutrophils in the epithelium[32].
On the other hand, the present study sought to assess the association of HIF1A (G/A) rs11549467 and NFKB1-94ins/del ATTG (rs28362491) polymorphisms with IBD among Moroccan patients. Data on asso-
ciation of these genes with IBD in the North African population are currently lacking. Our results suggest that the studied NFKB1 gene variation do not influence susceptibility to IBD (CD and UC) in the cohort tested herein. Our findings are in accordance with previous investigations analyzing Spanish[33] British[34] and German populations[35]. In contrast, an association of the -94ins/del ATTG polymorphism with UC was demonstrated in a North American population[14]. These discrepant results may have been caused by clinical, population and genetic differences in addition to ethnic origin heterogeneity.
Moreover, the present case-control study could not establish a role for HIF1A (G/A) rs11549467 polymor-phism in the pathogenesis of both CD and UC and also found no evidence for disease risk when evaluating genetic models. This later polymorphism was shown to be associated with autoimmune diseases such as systemic sclerosis[36]; however no investigation has assessed its involvement in IBD etiology.
Our results suggest that, variation in the dis-tribution of CCTTT repeats in the NOS2A gene may differentially contribute to CD and UC development in the Moroccan population. Additionally, contrary to what was initially expected, no significant differences were found between patients and healthy subjects in the frequency of the NFKB1 and HIF1A polymorphisms. Thereby, our data do not support a role for these
Table 5 Allelic frequencies of (CCTTT)n microsatellite polymorphism of NOS2A gene for Crohn’s disease, ulcerative colitis patients and healthy controls n(%)
Repeat No. Size (bp) Controls CD P value OR(95%CI) UC P value OR(95%CI)
2n = 596 2n = 262 2n = 120 7 171 2 (0.3) 1 (0.4) 0.91 1.13 (0.10-12.6) 3 (2.5) 0.0092 7.61 (1.25-46.08) 8 176 37 (6.2) 30 (11.4) 0.0081 1.95 (1.17-3.23) 9 (7.5) 0.59 1.22 (0.57-2.61) 9 181 75 (12.5) 43 (16.4) 0.13 1.36 (0.90-2.04) 11 (9.1) 0.29 0.70 (0.36-1.36)10 186 89 (15.0) 33 (12.6) 0.36 0.82 (0.53-1.26) 13 (10.8) 0.24 0.69 (0.37-1.28)11 191 90 (15.1) 35 (13.3) 0.50 0.86 (0.56-1.32) 10 (8.3) 0.053 0.51 (0.25-1.01)12 196 131 (22.0) 57 (21.7) 0.94 0.98 (0.69-1.40) 24 (20.0) 0.63 0.88 (0.54-1.44)13 201 99 (16.6) 31 (11.8) 0.07 0.67 (0.43-1.03) 19 (15.8) 0.83 0.94 (0.55-1.61)14 206 36 (6.2) 24 (9.1) 0.09 1.56 (0.91-2.68) 14 (11.6) 0.024 2.05 (1.07-3.94)15 211 33 (5.5) 8 (3.0) 0.11 0.53 (0.24-1.18) 14 (11.6) 0.015 2.25 (1.16-4.35)16 216 4 (0.6) 0 (0) 0.18 0 (0) 3 (2.5) 0.06 3.79 (0.83-17.18)
1P = 0.008, OR (95%CI): 1.95 (1.17-3.23): Pc = 0.08; 2P = 0.009; OR (95%CI): 7.61 (1.25-46.08): Pc = 0.09; 3P = 0.05; OR (95%CI): 0.51 (0.25-1.01): Pc = 0.5; 4P = 0.02; OR(95%CI): 2.05 (1.07-3.94): Pc = 0.2; 5P = 0.01; OR(95%CI): 2.25 (1.16-4.35): Pc = 0.1. CD: Crohn’s disease; UC: Ulcerative colitis.
Controls IBD patients CD patients UC patients
n = 295 n = 190 n = 132 n = 58Genotype220/220 189 (64.07) 132 (69.47) 90 (68.18) 42 (72.41)220/224 97 (32.88) 49 (25.79) 34 (25.76) 15 (25.86)224/224 9 (3.05) 9 (4.74) 8 (6.06) 1 (1.72)Allele 2n = 590 2n = 380 2n = 264 2n = 116220 475 (80.5) 313 (82.4) 214 (81) 99 (85.3)224 115 (19.5) 67 (17.6) 50 (19) 17 (14.7)
Table 6 Allele and genotype frequencies of NOS2A TAAA polymorphism in inflammatory bowel disease patients and controls n (%)
No statistically significant differences were found in any of the comparisons. IBD: Inflammatory bowel disease; CD: Crohn’s disease; UC: Ulcerative colitis.
Senhaji N et al . Oxidative pathway related genes and IBD
8306 December 21, 2017|Volume 23|Issue 47|WJG|www.wjgnet.com
polymorphisms in the pathogenesis of IBD in the Moroccan population.
COMMENTSBackgroundInflammatory bowel disease (IBD), a chronic and relapsing-remitting disorder of the gastrointestinal tract, encompasses Crohn’s disease (CD) and ulcerative colitis (UC). Chronic intestinal inflammation is a hallmark of both disorders, and is believed to result from a number of abnormal conditions. The involvement of oxidative damage in IBD development has been thoroughly documented. However, the genetic factors involved in this process have not been elucidated in the Moroccan population.
Research frontiersOxidative stress was reported to play a key role in the induction and perpetuation of inflammation. In search of relevant gene polymorphisms related to oxidative stress signaling that are involved in IBD development, we explored the association of HIF1A_rs11549467, NFKB1_rs28362491 NOS2A (CCTTT)n_rs3833912 and NOS2A (TAAA)_rs12720460 polymorphisms with IBD (CD and UC) in Moroccan patients.
Innovations and breakthroughsThis study found that variation in the distribution of CCTTT repeats in the NOS2A gene may contribute to IBD development in the Moroccan population. Additionally, no significant differences were found between patients and healthy subjects in the frequency of the NFKB1 and HIF1A polymorphisms. Thereby, our data do not support a role for these polymorphisms in the pathogenesis of IBD in our study cohort.
ApplicationsBy assessing and identifying the genetic polymorphisms associated with susceptibility to inflammatory bowel disease, this study could represent a future preliminary basis for personalized medicine and targeted therapy in disease management.
TerminologyOxidative stress is identified as an imbalance between the prooxidants and antioxidants in the body. Oxidative stress produced due to unresolved and persistent inflammation can be a major factor involved in the change of the dynamics of immune responses.
The mechanism by which oxidative stress and redox signaling induces inflammation in IBD is demonstrated by an increase in the levels of reactive oxygen and nitrogen species (ROS/RNS) in both human subjects and experimental animals.
Peer-reviewThis is an interesting paper, concerning the role of genetic factors related to the oxidative pathway in the susceptibility of inflammatory bowel disease. There are some points that need to be addressed.
ACKNOWLEDGMENTSWe gratefully acknowledge all the members of LGMP and the Gastroenterology department. We also thank Prof. Adam Ziad from Florida Atlantic University for copy-editing our manuscript.
REFERENCES1 Esmat S , El Nady M, Elfekki M, Elsherif Y, Naga M.
Epidemiological and clinical characteristics of inflammatory bowel diseases in Cairo, Egypt. World J Gastroenterol 2014; 20: 814-821 [PMID: 24574754 DOI: 10.3748/wjg.v20.i3.814]
2 Cosnes J, Gower-Rousseau C, Seksik P, Cortot A. Epidemiology and na tura l h is tory of inf lammatory bowel d iseases . Gastroenterology 2011; 140: 1785-1794 [PMID: 21530745 DOI: 10.1053/j.gastro.2011.01.055]
3 Biasi F, Leonarduzzi G, Oteiza PI, Poli G. Inflammatory bowel disease: mechanisms, redox considerations, and therapeutic targets. Antioxid Redox Signal 2013; 19: 1711-1747 [PMID: 23305298 DOI: 10.1089/ars.2012.4530]
4 Zhu H, Li YR. Oxidative stress and redox signaling mechanisms of inflammatory bowel disease: updated experimental and clinical evidence. Exp Biol Med (Maywood) 2012; 237: 474-480 [PMID: 22442342 DOI: 10.1258/ebm.2011.011358]
5 Martín MC, Martinez A, Mendoza JL, Taxonera C, Díaz-Rubio M, Fernández-Arquero M, de la Concha EG, Urcelay E. Influence of the inducible nitric oxide synthase gene (NOS2A) on inflammatory bowel disease susceptibility. Immunogenetics 2007; 59: 833-837 [PMID: 17955236 DOI: 10.1007/s00251-007-0255-1]
6 Warpeha KM, Xu W, Liu L, Charles IG, Patterson CC, Ah-Fat F, Harding S, Hart PM, Chakravarthy U, Hughes AE. Genotyping and functional analysis of a polymorphic (CCTTT) (n) repeat of NOS2A in diabetic retinopathy. FASEB J 1999; 13: 1825-1832 [PMID: 10506586]
7 Bellamy R, Hill AV. A bi-allelic tetranucleotide repeat in the promoter of the human inducible nitric oxide synthase gene. Clin Genet 1997; 52: 192-193 [PMID: 9377812]
8 Reuter S, Gupta SC, Chaturvedi MM, Aggarwal BB. Oxidative stress, inflammation, and cancer: how are they linked? Free Radic Biol Med 2010; 49: 1603-1616 [PMID: 20840865 DOI: 10.1016/j.freeradbiomed.2010.09.006]
9 Tanimoto K, Yoshiga K, Eguchi H, Kaneyasu M, Ukon K, Kumazaki T, Oue N, Yasui W, Imai K, Nakachi K, Poellinger L, Nishiyama M. Hypoxia-inducible factor-1alpha polymorphisms associated with enhanced transactivation capacity, implying clinical significance. Carcinogenesis 2003; 24: 1779-1783 [PMID: 12919954 DOI: 10.1093/carcin/bgg132]
10 Biddlestone J, Bandarra D, Rocha S. The role of hypoxia in inflammatory disease (review). Int J Mol Med 2015; 35: 859-869 [PMID: 25625467 DOI: 10.3892/ijmm.2015.2079]
11 Scortegagna M, Cataisson C, Martin RJ, Hicklin DJ, Schreiber RD, Yuspa SH, Arbeit JM. HIF-1alpha regulates epithelial inflammation by cell autonomous NFkappaB activation and paracrine stromal remodeling. Blood 2008; 111: 3343-3354 [PMID: 18199827 DOI: 10.1182/blood-2007-10-115758]
12 Yasukawa K, Tokuda H, Tun X, Utsumi H, Yamada K. The detrimental effect of nitric oxide on tissue is associated with inflammatory events in the vascular endothelium and neutrophils in mice with dextran sodium sulfate-induced colitis. Free Radic Res 2012; 46: 1427-1436 [PMID: 22998024 DOI: 10.3109/10715762.2012.732698]
13 Tak PP, Firestein GS. NF-kappaB: a key role in inflammatory diseases. J Clin Invest 2001; 107: 7-11 [PMID: 11134171 DOI: 10.1172/JCI11830]
14 Karban AS, Okazaki T, Panhuysen CI, Gallegos T, Potter JJ, Bailey-Wilson JE, Silverberg MS, Duerr RH, Cho JH, Gregersen PK, Wu Y, Achkar JP, Dassopoulos T, Mezey E, Bayless TM, Nouvet FJ, Brant SR. Functional annotation of a novel NFKB1 promoter polymorphism that increases risk for ulcerative colitis. Hum Mol Genet 2004; 13: 35-45 [PMID: 14613970 DOI: 10.1093/hmg/ddh008]
15 Bank S, Skytt Andersen P, Burisch J, Pedersen N, Roug S, Galsgaard J, Ydegaard Turino S, Brodersen JB, Rashid S, Kaiser Rasmussen B, Avlund S, Bastholm Olesen T, Jürgen Hoffmann H, Kragh Thomsen M, Ostergaard Thomsen V, Frydenberg M, Andersen Nexø B, Sode J, Vogel U, Andersen V. Polymorphisms in the inflammatory pathway genes TLR2, TLR4, TLR9, LY96, NFKBIA, NFKB1, TNFA, TNFRSF1A, IL6R, IL10, IL23R, PTPN22, and PPARG are associated with susceptibility of inflammatory bowel disease in a Danish cohort. PLoS One 2014; 9: e98815 [PMID: 24971461 DOI: 10.1371/journal.pone.0098815]
COMMENTS
Senhaji N et al . Oxidative pathway related genes and IBD
8307 December 21, 2017|Volume 23|Issue 47|WJG|www.wjgnet.com
16 Senhaji N, Diakité B, Serbati N, Zaid Y, Badre W, Nadifi S. Toll-like receptor 4 Asp299Gly and Thr399Ile polymorphisms: New data and a meta-analysis. BMC Gastroenterol 2014; 14: 206 [PMID: 25492126 DOI: 10.1186/s12876-014-0206-x]
17 Senhaji N, Serbati N, Diakité B, Arazzakou S, Hamzi K, Badre W, Nadifi S. Methylenetetrahydrofolate reductase C677T variant in Moroccan patients with inflammatory bowel disease. Gene 2013; 521: 45-49 [PMID: 23542077 DOI: 10.1016/j.gene.2013.02.046]
18 Silverberg MS, Satsangi J, Ahmad T, Arnott ID, Bernstein CN, Brant SR, Caprilli R, Colombel JF, Gasche C, Geboes K, Jewell DP, Karban A, Loftus EV Jr, Peña AS, Riddell RH, Sachar DB, Schreiber S, Steinhart AH, Targan SR, Vermeire S, Warren BF. Toward an integrated clinical, molecular and serological classification of inflammatory bowel disease: report of a Working Party of the 2005 Montreal World Congress of Gastroenterology. Can J Gastroenterol 2005; 19 Suppl A: 5A-36A [PMID: 16151544]
19 Levine A, Griffiths A, Markowitz J, Wilson DC, Turner D, Russell RK, Fell J, Ruemmele FM, Walters T, Sherlock M, Dubinsky M, Hyams JS. Pediatric modification of the Montreal classification for inflammatory bowel disease: the Paris classification. Inflamm Bowel Dis 2011; 17: 1314-1321 [PMID: 21560194 DOI: 10.1002/ibd.21493]
20 Gómez LM, Anaya JM, Vilchez JR, Cadena J, Hinojosa R, Vélez L, Lopez-Nevot MA, Martín J. A polymorphism in the inducible nitric oxide synthase gene is associated with tuberculosis. Tuberculosis (Edinb) 2007; 87: 288-294 [PMID: 17475563 DOI: 10.1016/j.tube.2007.03.002]
21 Torres O, Palomino-Morales R, Vazquez-Rodriguez TR, Gamallo C, Morado IC, Miranda-Filloy JA, Amigo-Diaz E, Callejas-Rubio JL, Fernadez-Gutierrez B, Castañeda S, Morado IC, Martin J, Gonzalez-Gay MA. Lack of association between hypoxia inducible factor-1 alpha gene polymorphisms and biopsy-proven giant cell arteritis. Clin Exp Rheumatol 2010; 28: 40-45 [PMID: 20412701]
22 López-Mejías R, García-Bermúdez M, González-Juanatey C, Castañeda S, Miranda-Filloy JA, Gómez-Vaquero C, Fernández-Gutiérrez B, Balsa A, Pascual-Salcedo D, Blanco R, González-Álvaro I, Llorca J, Martín J, González-Gay MA. NFKB1-94ATTG ins/del polymorphism (rs28362491) is associated with cardiovascular disease in patients with rheumatoid arthritis. Atherosclerosis 2012; 224: 426-429 [PMID: 22742859 DOI: 10.1016/j.atherosclerosis.2012.06.008]
23 Senhaji N, Serrano A, Badre W, Serbati N, Karkouri M, Zaid Y, Nadifi S, Martin J. Association of inflammatory cytokine gene polymorphisms with inflammatory bowel disease in a Moroccan cohort. Genes Immun 2016; 17: 60-65 [PMID: 26632999 DOI: 10.1038/gene.2015.52]
24 Oliver J, Gómez-Garcia M, Vilchez JR, López-Nevot MA, Piñero A, Correro F, Nieto A, Martín J. Inducible and endothelial nitric oxide synthase genes polymorphism in inflammatory bowel disease. Tissue Antigens 2006; 67: 326-330 [PMID: 16634870 DOI: 10.1111/j.1399-0039.2006.00578.x]
25 Gonzalez-Gay MA, Llorca J, Sanchez E, Lopez-Nevot MA, Amoli MM, Garcia-Porrua C, Ollier WE, Martin J. Inducible but not endothelial nitric oxide synthase polymorphism is associated with susceptibility to rheumatoid arthritis in northwest Spain. Rheumatology (Oxford) 2004; 43: 1182-1185 [PMID: 15226517 DOI: 10.1093/rheumatology/keh283]
26 Barcellos LF, Begovich AB, Reynolds RL, Caillier SJ, Brassat D, Schmidt S, Grams SE, Walker K, Steiner LL, Cree BA, Stillman A, Lincoln RR, Pericak-Vance MA, Haines JL, Erlich HA, Hauser SL, Oksenberg JR. Linkage and association with the NOS2A locus on chromosome 17q11 in multiple sclerosis. Ann Neurol 2004; 55: 793-800 [PMID: 15174013 DOI: 10.1002/ana.20092]
27 Kawaguchi Y, Tochimoto A, Hara M, Kawamoto M, Sugiura T, Katsumata Y, Okada J, Kondo H, Okubo M, Kamatani N. NOS2 polymorphisms associated with the susceptibility to pulmonary arterial hypertension with systemic sclerosis: contribution to the transcriptional activity. Arthritis Res Ther 2006; 8: R104 [PMID: 16813666 DOI: 10.1186/ar1984]
28 Nathan C. Inducible nitric oxide synthase: what difference does it make? J Clin Invest 1997; 100: 2417-2423 [PMID: 9366554 DOI: 10.1172/JCI119782]
29 Dijkstra G, Moshage H, van Dullemen HM, de Jager-Krikken A, Tiebosch AT, Kleibeuker JH, Jansen PL, van Goor H. Expression of nitric oxide synthases and formation of nitrotyrosine and reactive oxygen species in inflammatory bowel disease. J Pathol 1998; 186: 416-421 [PMID: 10209492 DOI: 10.1002/(SICI)1096-9896(199812)186:4<416::AID-PATH201>3.0.CO;2-U]
30 Ljung T, Lundberg S, Varsanyi M, Johansson C, Schmidt PT, Herulf M, Lundberg JO, Hellstrom PM. Rectal nitric oxide as biomarker in the treatment of inflammatory bowel disease: responders versus nonresponders. World J Gastroenterol 2006; 12: 3386-3392 [PMID: 16733856 DOI: 10.3748/wjg.v12.i21.3386]
31 Herbst JJ, Johnson DG, Oliveros MA. Gastroesophageal reflux with protein-losing enteropathy and finger clubbing. Am J Dis Child 1976; 130: 1256-1258 [PMID: 984011]
32 Singer II, Kawka DW, Scott S, Weidner JR, Mumford RA, Riehl TE, Stenson WF. Expression of inducible nitric oxide synthase and nitrotyrosine in colonic epithelium in inflammatory bowel disease. Gastroenterology 1996; 111: 871-885 [PMID: 8831582]
33 Oliver J, Gómez-García M, Paco L, López-Nevot MA, Piñero A, Correro F, Martín L, Brieva JA, Nieto A, Martín J. A functional polymorphism of the NFKB1 promoter is not associated with ulcerative colitis in a Spanish population. Inflamm Bowel Dis 2005; 11: 576-579 [PMID: 15905705]
34 Mirza MM, Fisher SA, Onnie C, Lewis CM, Mathew CG, Sanderson J, Forbes A. No association of the NFKB1 promoter polymorphism with ulcerative colitis in a British case control cohort. Gut 2005; 54: 1205-1206 [PMID: 16009698 DOI: 10.1136/gut.2005.070029]
35 Glas J, Török HP, Tonenchi L, Müller-Myhsok B, Mussack T, Wetzke M, Klein W, Epplen JT, Griga T, Schiemann U, Lohse P, Seiderer J, Schnitzler F, Brand S, Ochsenkühn T, Folwaczny M, Folwaczny C. Role of the NFKB1 -94ins/delATTG promoter polymorphism in IBD and potential interactions with polymorphisms in the CARD15/NOD2, IKBL, and IL-1RN genes. Inflamm Bowel Dis 2006; 12: 606-611 [PMID: 16804398 DOI: 10.1097/01.ibd.0000225346.23765.6b]
36 Wipff J, Dieude P, Avouac J, Tiev K, Hachulla E, Granel B, Diot E, Sibilia J, Mouthon L, Meyer O, Kahan A, Boileau C, Allanore Y. Association of hypoxia-inducible factor 1A (HIF1A) gene polymorphisms with systemic sclerosis in a French European Caucasian population. Scand J Rheumatol 2009; 38: 291-294 [PMID: 19306159 DOI: 10.1080/03009740802629432]
P- Reviewer: Decorti G, Martin-Villa JM S- Editor: Ma YJ L- Editor: A E- Editor: Huang Y
Senhaji N et al . Oxidative pathway related genes and IBD
Shi-Ying Wang, Ping Tao, Hong-Yi Hu, Lei Zhao, Bo-Yun Sun, Wang-Jun Zhang, Jiang Lin, Department of Gastroenterology, Longhua Hospital, Shanghai University of Traditional Chinese Medicine, Shanghai 200032, China
Shi-Ying Wang, Hong-Yi Hu, Jian-Ye Yuan, Institute of Digestive Diseases, ChinaCanada Center of Research for Digestive Diseases (ccCRDD), Longhua Hospital, Shanghai University of Traditional Chinese Medicine, Shanghai 200032, China
ORCID number: ShiYing Wang (0000000210050381); Ping Tao (0000000259148478); HongYi Hu (00000002 9477903X); JianYe Yuan (0000000337282083); Lei Zhao (0000000207231210); BoYun Sun (0000000305847780); WangJun Zhang (0000000272882888); Jiang Lin (00000001 85246103).
Author contributions: Wang SY performed the experiments, prepared the figures, and contributed to the manuscript writing; Tao P, Zhao L, Sun BY and Zhang WJ performed the experiments and analyzed the data; Tao P and Zhang WJ provided research materials; Yuan JY and Hu HY contributed to experimental design; Lin J contributed to experimental design, interpretation of data, and manuscript writing, and supervised the project; all authors approved the final version.
Supported by the National Natural Science Foundation of China, No. 81373616.
Institutional review board statement: The following study has been reviewed and approved by the Institutional Review Board of Longhua Hospital, Shanghai University of Traditional Chinese Medicine.
Institutional animal care and use committee statement: All procedures involving animals in the following manuscript were reviewed and approved by the Institutional Animal Care and Use Committee of Shanghai University of Traditional Chinese Medicine (No. SZY201612006).
Conflict-of-interest statement: The authors declare that there is no conflict of interest related to this study.
Open-Access: This article is an open-access article which was
selected by an in-house editor and fully peer-reviewed by external reviewers. It is distributed in accordance with the Creative Commons Attribution Non Commercial (CC BY-NC 4.0) license, which permits others to distribute, remix, adapt, build upon this work non-commercially, and license their derivative works on different terms, provided the original work is properly cited and the use is noncommercial. See: http://creativecommons.org/licenses/by-nc/4.0/
Manuscript source: Unsolicited manuscript
Correspondence to: Jiang Lin, PhD, MD, Chief Doctor, Professor, Department of Gastroenterology, Longhua Hospital, Shanghai University of Traditional Chinese Medicine, No. 725, South Wanping Road, Shanghai 200032, China. [email protected]: +862164385700 Fax: +862164398310
Received: September 6, 2017 Peer-review started: September 7, 2017First decision: October 10, 2017Revised: November 3, 2017 Accepted: November 14, 2017 Article in press: November 14, 2017Published online: December 21, 2017
AbstractAIMTo investigate the effects of Panax notoginseng (PN) on microvascular injury in colitis, its mechanisms, initial administration time and dosage.
METHODSDextran sodium sulfate (DSS)- or iodoacetamide (IA)-induced rat colitis models were used to evaluate and investigate the effects of ethanol extract of PN on microvascular injuries and their related mechanisms. PN administration was initiated at 3 and 7 d after the model was established at doses of 0.5, 1.0 and 2.0
8308 December 21, 2017|Volume 23|Issue 47|WJG|www.wjgnet.com
ORIGINAL ARTICLE
Effects of initiating time and dosage of Panax notoginseng on mucosal microvascular injury in experimental colitis
Basic Study
Shi-Ying Wang, Ping Tao, Hong-Yi Hu, Jian-Ye Yuan, Lei Zhao, Bo-Yun Sun, Wang-Jun Zhang, Jiang Lin
Submit a Manuscript: http://www.f6publishing.com
DOI: 10.3748/wjg.v23.i47.8308
World J Gastroenterol 2017 December 21; 23(47): 8308-8320
ISSN 1007-9327 (print) ISSN 2219-2840 (online)
g/kg for 7 d. The severity of colitis was evaluated by disease activity index (DAI). The pathological lesions were observed under a microscope. Microvessel den-sity (MVD) was evaluated by immunohistochemistry. Vascular permeability was evaluated using the Evans blue method. The serum concentrations of cytokines, including vascular endothelial growth factor (VEGF)A121, VEGFA165, interleukin (IL)-4, IL-6, IL-10 and tumor necrosis factor (TNF)-α, were detected by enzyme-linked immunosorbent assay. Myeloperoxidase (MPO) and superoxide dismutase (SOD) were measured to evaluate the level of oxidative stress. Expression of hypoxia-inducible factor (HIF)-1α protein was detected by western blotting.
RESULTSObvious colonic inflammation and injuries of mucosa and microvessels were observed in DSS- and IA-induced colitis groups. DAI scores, serum concentrations of VEGFA121, VEGFA165, VEGFA165/VEGFA121, IL-6 and TNF-α, and concentrations of MPO and HIF-1α in the colon were significantly higher while serum concentrations of IL-4 and IL-10 and MVD in colon were significantly lower in the colitis model groups than in the normal control group. PN promoted repair of injuries of colonic mucosa and microvessels, attenuated inflammation, and decreased DAI scores in rats with colitis. PN also decreased the serum concentrations of VEGFA121, VEGFA165, VEGFA165/VEGFA121, IL-6 and TNF-α, and concentrations of MPO and HIF-1α in the colon, and increased the serum concentrations of IL-4 and IL-10 as well as the concentration of SOD in the colon. The efficacy of PN was dosage dependent. In addition, DAI scores in the group administered PN on day 3 were significantly lower than in the group administered PN on day 7.
CONCLUSIONPN repairs vascular injury in experimental colitis via attenuating inflammation and oxidative stress in the colonic mucosa. Efficacy is related to initial administration time and dose.
Key words: Microvascular injury; Panax notoginseng ; Ulcerative colitis; Oxidative stress
© The Author(s) 2017. Published by Baishideng Publishing Group Inc. All rights reserved.
Core tip: Panax notoginseng (PN) is a traditional Chinese medicine used to treat ulcerative colitis, but its mechanisms are unclear. In our study, we found that PN promoted repair of injuries of colonic mucosa and microvessels in rat colitis. PN decreased concentrations of vascular endothelial growth factor, interleukin (IL)-6 and tumor necrosis factor-α while it increased the concentrations of IL-4 and IL-10 in serum. It also decreased concentrations of myeloperoxidase and hypoxia-inducible factor-1α while it increased the concentration of superoxide dismutase in colon. So it is concluded that PN repairs mucosal and vascular injuries
in rat colitis via attenuating inflammation and oxidative stress in the colonic mucosa.
Wang SY, Tao P, Hu HY, Yuan JY, Zhao L, Sun BY, Zhang WJ, Lin J. Effects of initiating time and dosage of Panax notoginseng on mucosal microvascular injury in experimental colitis. World J Gastroenterol 2017; 23(47): 8308-8320 Available from: URL: http://www.wjgnet.com/1007-9327/full/v23/i47/8308.htm DOI: http://dx.doi.org/10.3748/wjg.v23.i47.8308
INTRODUCTIONMicrovessels are a major component of the colonic mucosa that nourish the colonic tissue and clear metabolic waste via controlling the intestinal blood flow[1]. They also play an important role in maintaining normal intestinal permeability[2]. Recent studies have found that injury of the colonic microvessels precedes injury of the colonic mucosa in the development of experimental colitis[3]. The increased vascular permeability aggravates the early endothelial injury[4], which induces hypoxia of the colonic mucosa and further oxidative stress[5,6].
Previous studies have demonstrated that colonic mucosal hypoxia induced by mucosal vascular injury plays an important role in the pathogenesis of ulcerative colitis (UC)[7]. Our previous study found that colonic mucosal injury in rats with experimental colitis improved along with repair of the mucosal microvascular injury[8]. Therefore, microvascular injury is essential to the development of UC and could be a new therapeutic target. However, there are no drugs that can promote effective microvascular repair.
Panax notoginseng (PN) is a common Chinese herbal medicine that has long been used to treat vascular lesions[9]. Some studies have found that it promotes repair of vascular damage via proangiogenic and antiapoptotic effects[10,11]. Animal experiments have shown that PN attenuates colonic mucosal injury and promotes mucosal repair in mouse models of colitis[12], but its mechanism of action is unclear. It is hypothesized that PN repair of mucosal injury could be related to its promotion of repair of microvascular injury. In this study, we investigated the mechanism of PN repair of colonic mucosal injury in rats with colitis from the aspect of promotion of vascular repair. We also investigated the relationship between dose and initial time of administration of PN and its efficacy.
MATERIALS AND METHODSAnimalsSpragueDawley rats (120140 g) were from Shanghai SLAC Laboratory Animal Co. Ltd. (Shanghai, China). The Institutional Animal Care and Use Committee of Shanghai University of Traditional Chinese Medicine
8309 December 21, 2017|Volume 23|Issue 47|WJG|www.wjgnet.com
Wang SY et al . Panax notoginseng in experimental colitis
approved all procedures. Rats were housed in a pathogenfree environment and allowed to acclimate to the environment for 7 d before inclusion in an experiment.
ReagentsIodoacetamide (IA; purity > 99%), dextran sodium sulfate (DSS), formamide (purity > 99%) and Evans blue (dye content > 75%) were purchased from SigmaAldrich (St. Louis, MO, United States). Enzymelinked immunosorbent assay (ELISA) kits for interleukin (IL)4, IL6, IL10 and tumor necrosis factor (TNF)α were purchased form R&D Systems (Minneapolis, MN, United States). ELISA kits for vascular endothelial growth factor (VEGF)A165 and VEGFA121 were purchased from CloudClone Corp. (Katy, TX, United States). CD31 antibody (ab23680) and goat antimouse antibody were purchased from Abcam (Cambridge, United Kingdom). Myeloperoxidase (MPO) and superoxide dismutase (SOD) assay kits were purchased from Cell Signaling Technology (Danvers, MA, United States).
Preparation of PNPN was purchased from Shanghai Huayu Traditional Chinese Medicine Co. Ltd. (Shanghai, China) and authenticated by Professor Yang Dong (Shanghai University of Traditional Chinese Medicine). PN (0.9 kg) was dissolved in tap water (9 L), boiled at 100 ℃ for 3 h, filtered through a sieve (150 μm), extracted with absolute ethanol, and dried in a freeze dryer. The brown extract powder of PN was stored at 20 ℃.
Animal models of colitisTwo rat models of colitis were used in this study. One was induced by 0.1 mL 6% IA dissolved in 1% methylcellulose given to rats once by enema (7 cm above the anus). The other was induced by DSS, in which rats were allowed free access to purified water containing 5% DSS (w/v) for 7 d. DSS solution was prepared daily.
PN intervention in vivoRats were divided into control, lowdose, mediumdose and highdose groups (n = 6 each). For the intervention groups, PN was intragastrically administered to rats with IAinduced or DSSinduced colitis once daily for seven consecutive days at doses of 0.5, 1.0 or 2.0 g/kg. For the control groups, normal saline was given to the corresponding rats. The initial administration times of PN were 3 and 7 d after establishing the colitis models. Three independent experiments were performed in triplicate.
Disease activity indexBefore, during and after treatment, the severity of colitis was evaluated with disease activity index (DAI),
as described previously[13]. The parameters of DAI included weight loss (0, none; 1, 0%5%; 2, 5%10%; 3, 10%20%; 4, > 20%), stool consistency (0, none; 2, loose stool; 4, watery), and bleeding (0, none; 1, trace; 2, mild occult blood; 3, obvious occult blood; 4, gross bleeding).
Histological assaysSegments of colon were fixed in formalin buffer and embedded in paraffin. Sections of 5 μm thick were deparaffinized and stained with hematoxylin and eosin (HE). The histological changes were assessed by a pathologist.
Microvessel density analysis Fivemicrometerthick paraffinembedded sections of colon were deparaffinized, subjected to heat-mediated antigen retrieval, and blocked with goat serum. The tissues were incubated with the primary antiCD31 antibody (1:200, v/v) overnight at 4 ℃. After three 5min washes, the horseradish peroxidase (HRP)labeled secondary antibody (1: 300) was added and the samples were incubated at 37 ℃ for 1 h. The sections were counterstained with hematoxylin for 1 min at room temperature to visualize the endothelial cell nuclei. Three fields with CD31positive cells in each section were chosen to assess microvessel density (MVD). Areas of highest vascularization were selected by scanning the sections at low magnification. Stained microvessels were counted in a single 200 × field within the selected field by three observers without previous knowledge of control groups. The following cellular structures were considered as countable microvessels: (1) stained lumen; (2) stained endothelial cell; and (3) stained endothelial cell cluster (1 and 2 were clearly separated from adjacent strained lumens, colonic mucosal cells and other connective tissue elements). The MVD value was calculated as the average vessel counts in three selected areas within a microscopic field.
Vascular permeability analysis Vascular permeability (VP) of vessels in colonic mucosa was evaluated by the Evans blue method, as described previously[14]. Rats were anesthetized with intraperitoneal injection of sodium pentobarbital. Evans blue (1 mg/100 g) was injected intravenously 15 min before autopsy. Evans blue was extracted from the 1cm segment of colonic tissue using formamide and measured by spectrophotometry at 610 nm. Results were expressed as OD value per milligram of colon.
ELISA Blood samples were collected from the abdominal aorta. The serum concentrations of VEGFA165 (CloudClone Corp.), VEGFA121 (CloudClone Corp.), IL4 (R&D Systems), IL6 (R&D Systems), IL10 (R&D
8310 December 21, 2017|Volume 23|Issue 47|WJG|www.wjgnet.com
Wang SY et al . Panax notoginseng in experimental colitis
8311 December 21, 2017|Volume 23|Issue 47|WJG|www.wjgnet.com
with the day 7 group, DAI scores, injuries of colonic mucosa and microvessels, serum concentrations of proinflammatory cytokines (IL6 and TNFα), and expression of HIF1α and MPO were significantly lower (Figure 1B, C, EG and I; Figure 2A, C and E; Figure 3A), and serum concentrations of antiinflammatory cytokines (IL4 and IL10), MVD and SOD were significantly higher (Figure 1D, H and J; Figure 3C) in the day 3 group. The earlier PN was administered, the more effective it was in treating acute colitis.
PN repaired colonic mucosal injuries and microvesselsThe rats in the IA and DSSinduced experimental colitis groups had obvious injuries of the colonic mucosa and microvessels, as well as lower MVD. After being treated with PN (0.5, 1.0 and 2.0 g/kg) for seven consecutive days, colonic mucosal injuries and microvessels significantly improved and MVD increased compared with the model groups. The efficacy of PN in attenuating mucosal and microvascular injuries was dose dependent (Figure 4AE). The effects of medium and highdose PN were superior to those of lowdose PN, but there were no significant differences between the medium and highdose groups (Figure 4AE).
PN improved impaired VPVP increased significantly in the groups with experimental colitis induced by DSS and IA compared with the normal control group. PN improved impaired VP in a dosedependent manner. The effects of medium and high doses of PN were superior to those of low dose PN, but there were no significant differences between the medium and highdose groups (Figure 5).
PN reversed the disordered ratio of VEGFA165/VEGFA121The serum concentrations of VEGFA165 and VEGFA121 and the ratio of VEGFA165/VEGFA121 increased significantly in the groups with experimental colitis induced by IA and DSS compared with the normal control group. PN significantly decreased elevated VEGFA165, VEGFA121 and VEGFA165/VEGFA121 ratio in a dosedependent manner in rats with experimental colitis. The effects in the medium and highdose groups were superior to those of the lowdose group, but there were no significant differences between the medium and highdose groups (Figure 6AC).
PN adjusted imbalance of pro-inflammatory and anti-inflammatory cytokines The proinflammatory cytokines (IL6 and TNFα) increased significantly and the antiinflammatory cytokines (IL4 and IL10) decreased significantly in the experimental colitis groups compared with the normal control group. PN downregulated elevated IL6 and TNFα and upregulated reduced IL4 and IL10 in a dosedependent manner compared with the model control group (Figure 6DG). The effects of medium
Systems) and TNFα (R&D Systems) were detected using the appropriate ELISA kits.
SOD and MPO activity assaysSOD activity was measured using the SOD assay kit (Cell Signaling Technology). Tissue homogenate was prepared by vortex homogenizer, heated at 95 ℃ for 40 min and centrifuged at 178 × g at 4 ℃ for 10 min. Ethanolchloroform mixture (5:3, v/v) was used to extract SOD in the homogenate for total SOD activity assay. MPO activity was measured using the MPO assay kit (Cell Signaling Technology). Tissue homogenate was prepared by vortex homogenizer, heated at 95 ℃ for 40 min and centrifuged at 714 × g at 4 ℃ for 10 min. The samples were added to phosphate buffer containing 30 mM H2O2 (pH 7.0) and incubated for 10 min. The enzymatic activity of SOD and MPO was expressed by the decrease of OD240.
Western blotting Hypoxiainducible factor (HIF)1α was measured by western blotting, as described previously[15]. Colonic tissue was cut into pieces and homogenized in 5fold volumes of icecold homogenizing buffer (0.1 mmol/L NaCl, 0.1 mol/L TrisHCl, and 0.001 mol/L EDTA) containing 1 mmol/L phenylmethylsulfonyl fluoride, 1 mg/mL aprotinin and 0.1 mmol/L leupeptin at 3000 × g and 4 ℃ for 1 h. Bovine serum albumin was used to estimate the protein content in supernatants. The protein samples (60 μg in each sample) were subjected to SDS-PAGE and transferred to polyvinylidene fluoride membranes using a transfer apparatus (BioRad, Hercules, CA, United States). The membranes were blocked for 2 h, then the primary antibody antiHIF1α was added and incubated at 4 ℃ overnight, and the corresponding HRPconjugated secondary antibody (Cell Signaling Technology) was added and incubated for 1 h. Proteinantibody complexes were detected by Clarity Western ECL Substrate (BioRad), and results were authenticated with the ImageJ software (Gene Co. Ltd., China).
Statistical analysisData were presented as the mean ± SD. Oneway analysis of variance or general linear model with repeated measures was used to analyze the data sets with three or more groups, and least significant difference post hoc test for multiple comparisons. Student’s ttest was used to analyze data sets with two groups. P < 0.05 was considered significant.
RESULTSEfficacy of PN on experimental colitis was dependent upon initial time of administrationAfter the colitis model was established, PN administration (1.0 g/kg) was initiated at days 3 and 7
for seven consecutive days (Figure 1A). Compared
Wang SY et al . Panax notoginseng in experimental colitis
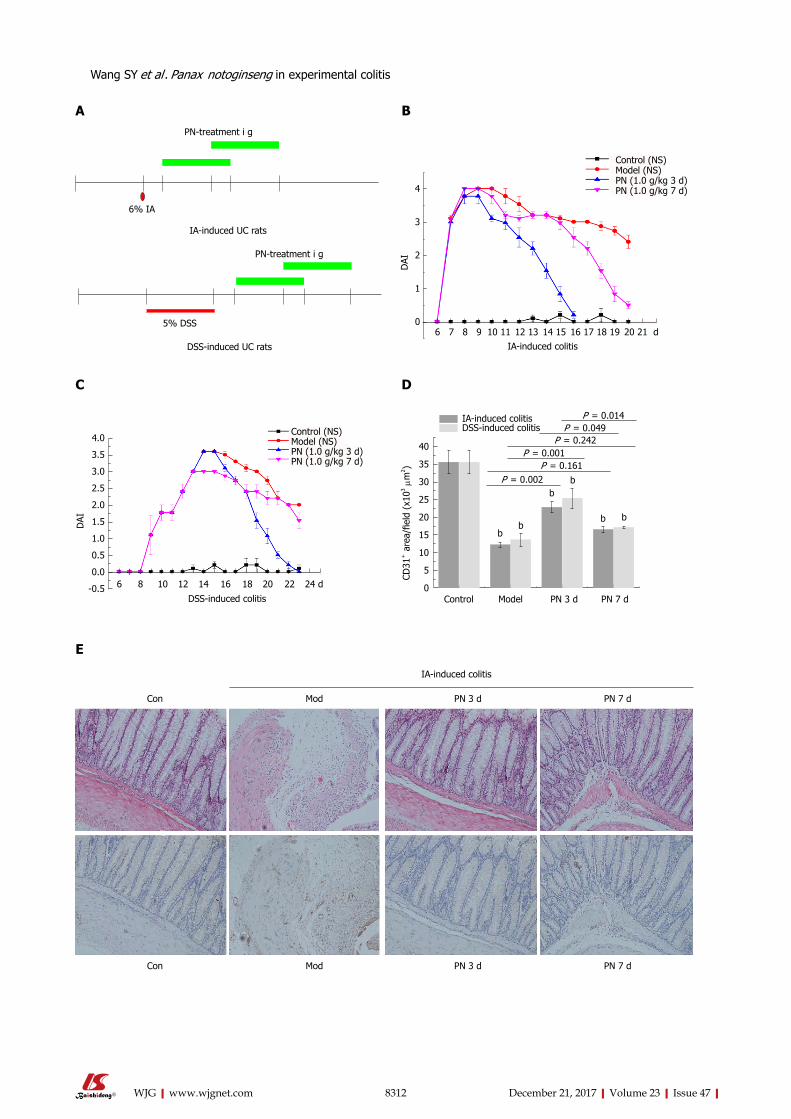
8312 December 21, 2017|Volume 23|Issue 47|WJG|www.wjgnet.com
PN-treatment i g
6% IA
IA-induced UC rats
5% DSS
DSS-induced UC rats
PN-treatment i g
4
3
2
1
0
DAI
6 7 8 9 10 11 12 13 14 15 16 17 18 19 20 21 dIA-induced colitis
Control (NS)Model (NS)PN (1.0 g/kg 3 d)PN (1.0 g/kg 7 d)
4.0
3.5
3.0
2.5
2.0
1.5
1.0
0.5
0.0
-0.5
DAI
6 8 10 12 14 16 18 20 22 24 d
DSS-induced colitis
Control (NS)Model (NS)PN (1.0 g/kg 3 d)PN (1.0 g/kg 7 d)
Control Model PN 3 d PN 7 d
40
35
30
25
20
15
10
5
0
CD31
+ a
rea/
field
(x1
03 μm
2 )IA-induced colitisDSS-induced colitis
P = 0.014P = 0.049
P = 0.242
P = 0.002P = 0.161
P = 0.001
bb
bb
b b
A B
C D
IA-induced colitis
Con Mod PN 3 d PN 7 d
Con Mod PN 3 d PN 7 d
E
Wang SY et al . Panax notoginseng in experimental colitis
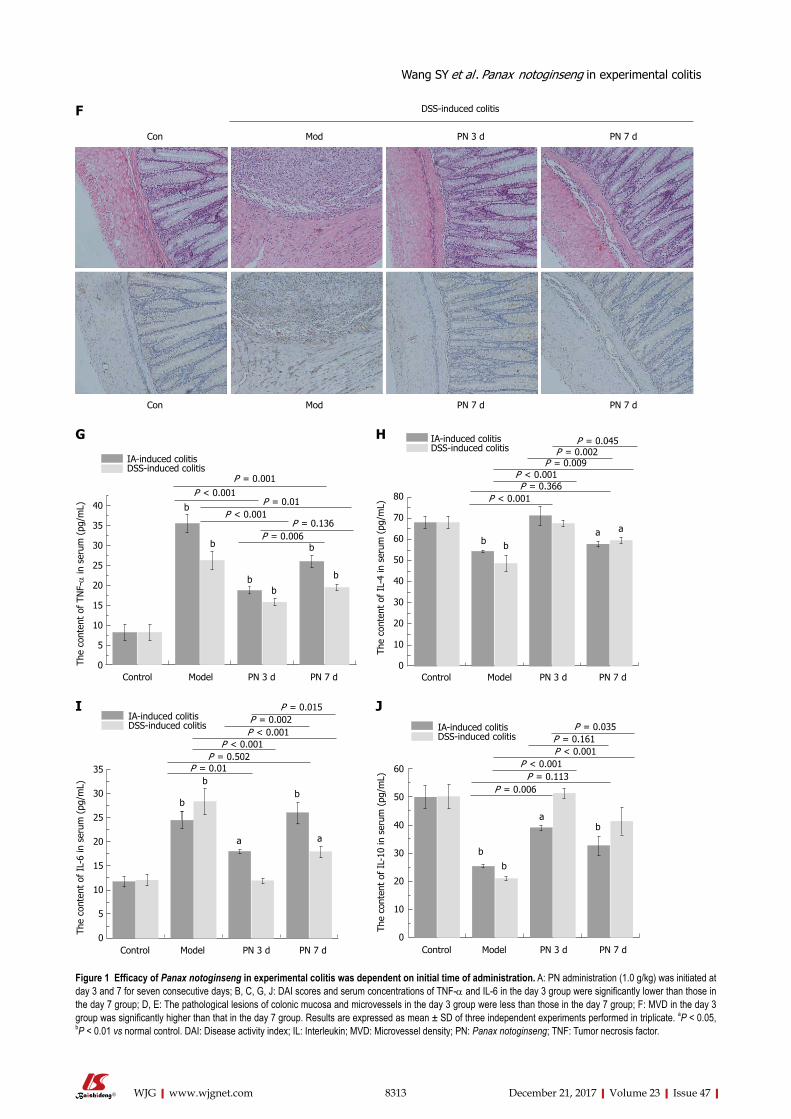
8313 December 21, 2017|Volume 23|Issue 47|WJG|www.wjgnet.com
Con Mod PN 3 d PN 7 d
Con Mod PN 7 d PN 7 d
DSS-induced colitisF
Control Model PN 3 d PN 7 d
40
35
30
25
20
15
10
5
0The
cont
ent
of T
NF-α
in s
erum
(pg
/mL)
IA-induced colitisDSS-induced colitis
P = 0.001
b
P < 0.001P = 0.01
P < 0.001P = 0.136
P = 0.006
b
b
b
b
b
G
Control Model PN 3 d PN 7 d
80
70
60
50
40
30
20
10
0
The
cont
ent
of I
L-4
in s
erum
(pg
/mL)
IA-induced colitisDSS-induced colitis
P = 0.045
P < 0.001
P = 0.002
P < 0.001P = 0.366
bba a
P = 0.009
H
Control Model PN 3 d PN 7 d
35
30
25
20
15
10
5
0
The
cont
ent
of I
L-6
in s
erum
(pg
/mL)
IA-induced colitisDSS-induced colitis
P = 0.015P = 0.002P < 0.001
P < 0.001P = 0.502
P = 0.01
b
bb
a a
I J
Figure 1 Efficacy of Panax notoginseng in experimental colitis was dependent on initial time of administration. A: PN administration (1.0 g/kg) was initiated at day 3 and 7 for seven consecutive days; B, C, G, J: DAI scores and serum concentrations of TNF-α and IL-6 in the day 3 group were significantly lower than those in the day 7 group; D, E: The pathological lesions of colonic mucosa and microvessels in the day 3 group were less than those in the day 7 group; F: MVD in the day 3 group was significantly higher than that in the day 7 group. Results are expressed as mean ± SD of three independent experiments performed in triplicate. aP < 0.05, bP < 0.01 vs normal control. DAI: Disease activity index; IL: Interleukin; MVD: Microvessel density; PN: Panax notoginseng; TNF: Tumor necrosis factor.
Wang SY et al . Panax notoginseng in experimental colitis
Control Model PN 3 d PN 7 d
60
50
40
30
20
10
0
The
cont
ent
of I
L-10
in s
erum
(pg
/mL)
IA-induced colitisDSS-induced colitis
P = 0.035P = 0.161P < 0.001
P < 0.001P = 0.113
P = 0.006
b
b
ba
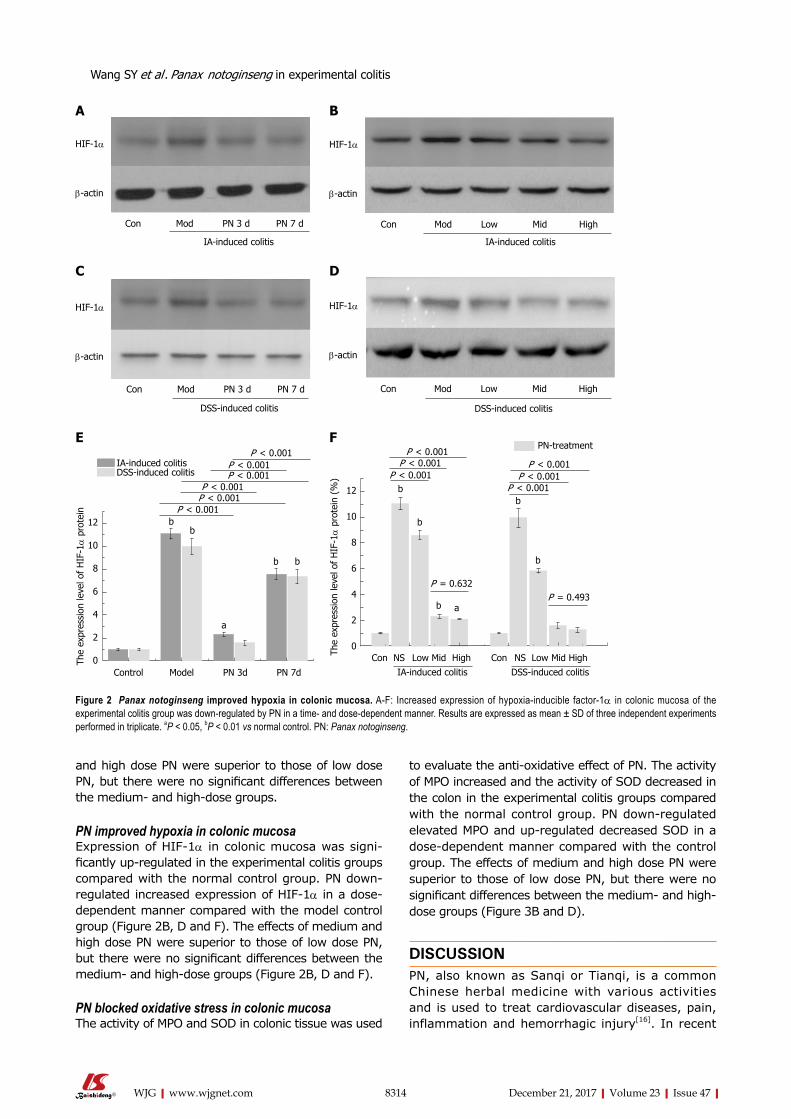
8314 December 21, 2017|Volume 23|Issue 47|WJG|www.wjgnet.com
and high dose PN were superior to those of low dose PN, but there were no significant differences between the medium and highdose groups.
PN improved hypoxia in colonic mucosaExpression of HIF1α in colonic mucosa was significantly up-regulated in the experimental colitis groups compared with the normal control group. PN downregulated increased expression of HIF1α in a dosedependent manner compared with the model control group (Figure 2B, D and F). The effects of medium and high dose PN were superior to those of low dose PN, but there were no significant differences between the medium and highdose groups (Figure 2B, D and F).
PN blocked oxidative stress in colonic mucosaThe activity of MPO and SOD in colonic tissue was used
to evaluate the antioxidative effect of PN. The activity of MPO increased and the activity of SOD decreased in the colon in the experimental colitis groups compared with the normal control group. PN downregulated elevated MPO and upregulated decreased SOD in a dosedependent manner compared with the control group. The effects of medium and high dose PN were superior to those of low dose PN, but there were no significant differences between the medium- and high-dose groups (Figure 3B and D).
DISCUSSIONPN, also known as Sanqi or Tianqi, is a common Chinese herbal medicine with various activities and is used to treat cardiovascular diseases, pain, inflammation and hemorrhagic injury[16]. In recent
HIF-1α
β-actin
DSS-induced colitis
Con Mod PN 3 d PN 7 d
HIF-1α
β-actin
Con Mod PN 3 d PN 7 d
IA-induced colitis
Con Mod Low Mid High
IA-induced colitis
HIF-1α
β-actin
HIF-1α
β-actin
DSS-induced colitis
Con Mod Low Mid High
12
10
8
6
4
2
0Control Model PN 3d PN 7d
The
expr
essi
on le
vel o
f H
IF-1α
pro
tein P < 0.001
IA-induced colitisDSS-induced colitis
P < 0.001P < 0.001
P < 0.001P < 0.001
P < 0.001
b
bb
b
a
12
10
8
6
4
2
0
PN-treatment
Con NS Low Mid High Con NS Low Mid HighIA-induced colitis DSS-induced colitis
The
expr
essi
on le
vel o
f H
IF-1α
pro
tein
(%
)
P < 0.001P < 0.001
P < 0.001P < 0.001
P < 0.001P < 0.001
P = 0.632P = 0.493
b
b
b a
b
b
A B
C D
E F
Figure 2 Panax notoginseng improved hypoxia in colonic mucosa. A-F: Increased expression of hypoxia-inducible factor-1α in colonic mucosa of the experimental colitis group was down-regulated by PN in a time- and dose-dependent manner. Results are expressed as mean ± SD of three independent experiments performed in triplicate. aP < 0.05, bP < 0.01 vs normal control. PN: Panax notoginseng.
Wang SY et al . Panax notoginseng in experimental colitis
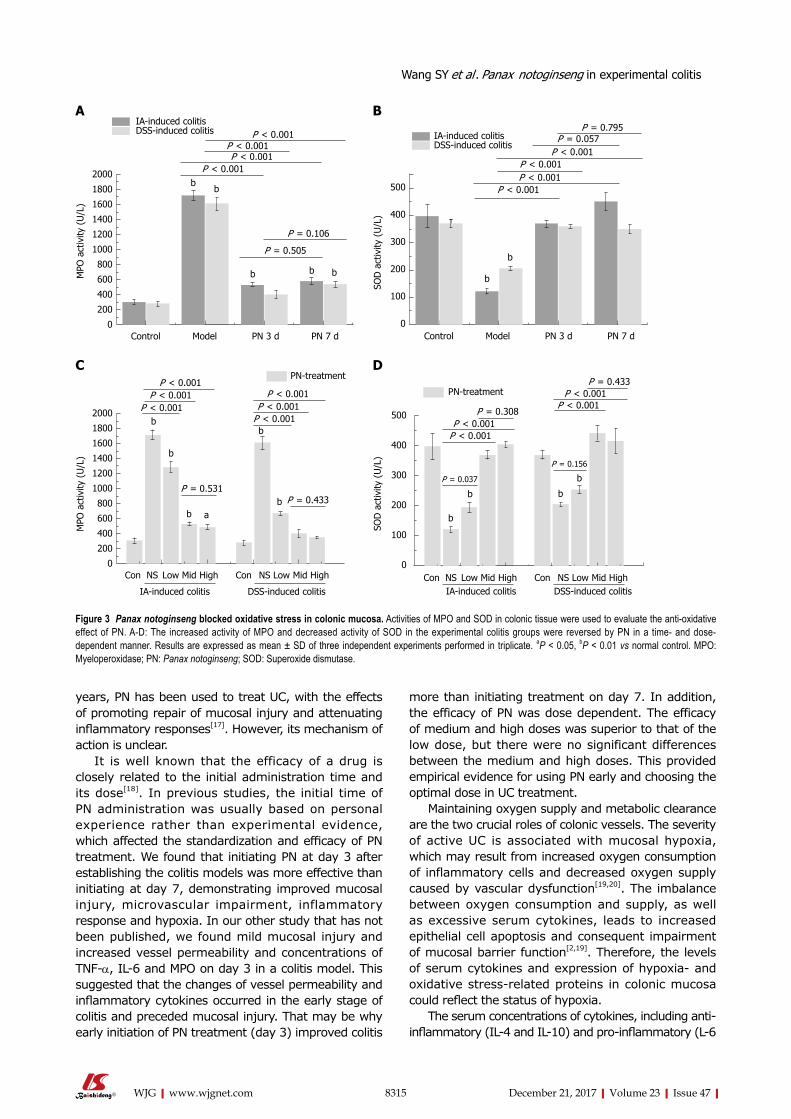
8315 December 21, 2017|Volume 23|Issue 47|WJG|www.wjgnet.com
years, PN has been used to treat UC, with the effects of promoting repair of mucosal injury and attenuating inflammatory responses[17]. However, its mechanism of action is unclear.
It is well known that the efficacy of a drug is closely related to the initial administration time and its dose[18]. In previous studies, the initial time of PN administration was usually based on personal experience rather than experimental evidence, which affected the standardization and efficacy of PN treatment. We found that initiating PN at day 3 after establishing the colitis models was more effective than initiating at day 7, demonstrating improved mucosal injury, microvascular impairment, inflammatory response and hypoxia. In our other study that has not been published, we found mild mucosal injury and increased vessel permeability and concentrations of TNFα, IL6 and MPO on day 3 in a colitis model. This suggested that the changes of vessel permeability and inflammatory cytokines occurred in the early stage of colitis and preceded mucosal injury. That may be why early initiation of PN treatment (day 3) improved colitis
more than initiating treatment on day 7. In addition, the efficacy of PN was dose dependent. The efficacy of medium and high doses was superior to that of the low dose, but there were no significant differences between the medium and high doses. This provided empirical evidence for using PN early and choosing the optimal dose in UC treatment.
Maintaining oxygen supply and metabolic clearance are the two crucial roles of colonic vessels. The severity of active UC is associated with mucosal hypoxia, which may result from increased oxygen consumption of inflammatory cells and decreased oxygen supply caused by vascular dysfunction[19,20]. The imbalance between oxygen consumption and supply, as well as excessive serum cytokines, leads to increased epithelial cell apoptosis and consequent impairment of mucosal barrier function[2,19]. Therefore, the levels of serum cytokines and expression of hypoxia and oxidative stressrelated proteins in colonic mucosa could reflect the status of hypoxia.
The serum concentrations of cytokines, including antiinflammatory (IL-4 and IL-10) and pro-inflammatory (L-6
2000
1800
1600
1400
1200
1000
800
600
400
200
0Control Model PN 3 d PN 7 d
MPO
act
ivity
(U
/L)
P < 0.001
b
P < 0.001P < 0.001
P < 0.001
P = 0.106
P = 0.505
IA-induced colitisDSS-induced colitis
b
b b b
500
400
300
200
100
0Control Model PN 3 d PN 7 d
SOD
act
ivity
(U
/L)
P < 0.001P < 0.001P < 0.001
P < 0.001
P = 0.795P = 0.057IA-induced colitis
DSS-induced colitis
MPO
act
ivity
(U
/L)
2000
1800
1600
1400
1200
1000
800
600
400
200
0
PN-treatment
Con NS Low Mid High Con NS Low Mid High
IA-induced colitis DSS-induced colitis
P < 0.001P < 0.001
P < 0.001P < 0.001P < 0.001
P < 0.001
P = 0.531P = 0.433
b
b
b
b
b
a
500
400
300
200
100
0
SOD
act
ivity
(U
/L)
Con NS Low Mid High Con NS Low Mid HighIA-induced colitis DSS-induced colitis
PN-treatment
P < 0.001P < 0.001
P < 0.001P < 0.001
P = 0.433
P = 0.308
P = 0.037
P = 0.156
A B
C D
Figure 3 Panax notoginseng blocked oxidative stress in colonic mucosa. Activities of MPO and SOD in colonic tissue were used to evaluate the anti-oxidative effect of PN. A-D: The increased activity of MPO and decreased activity of SOD in the experimental colitis groups were reversed by PN in a time- and dose-dependent manner. Results are expressed as mean ± SD of three independent experiments performed in triplicate. aP < 0.05, bP < 0.01 vs normal control. MPO: Myeloperoxidase; PN: Panax notoginseng; SOD: Superoxide dismutase.
b
b
b
b b
b
Wang SY et al . Panax notoginseng in experimental colitis
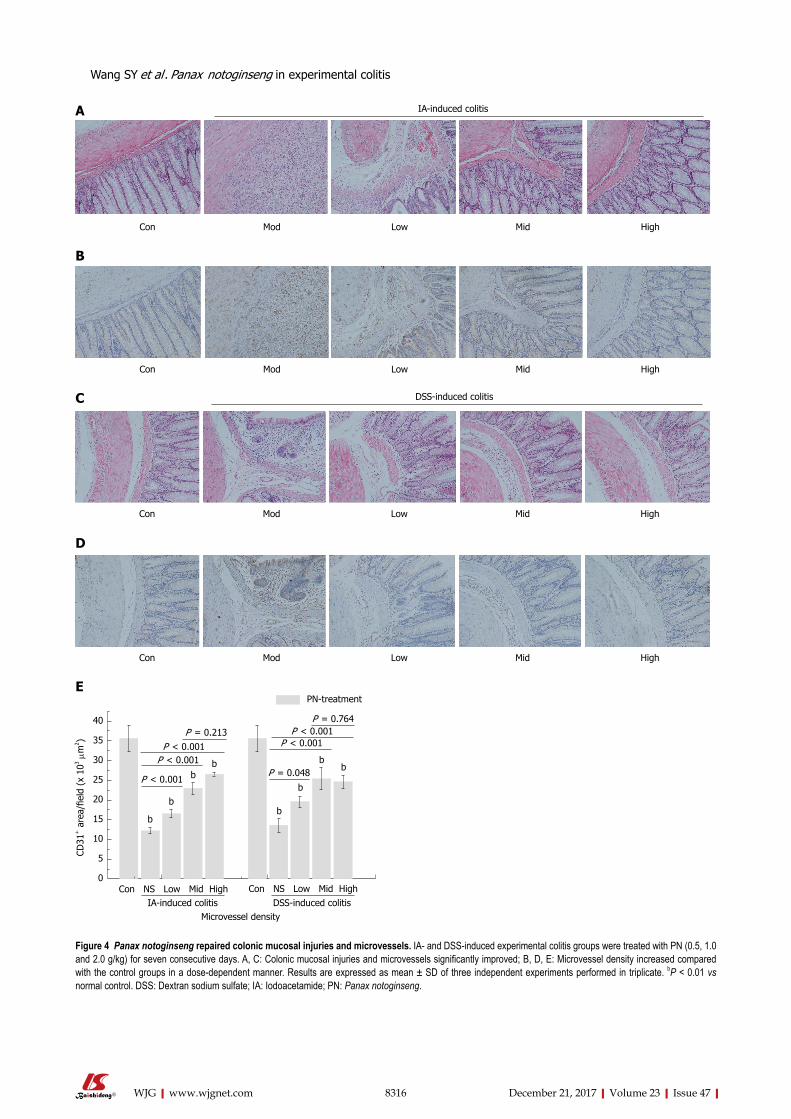
8316 December 21, 2017|Volume 23|Issue 47|WJG|www.wjgnet.com
Con Mod Low Mid High
Con Mod Low Mid High
40
35
30
25
20
15
10
5
0
CD31
+ a
rea/
field
(x
103 μ
m2 )
Con NS Low Mid High Con NS Low Mid High
Microvessel densityIA-induced colitis DSS-induced colitis
PN-treatment
P = 0.213P = 0.764
P = 0.048
P < 0.001P < 0.001
P < 0.001
P < 0.001P < 0.001
b
b
bb
b
b
bb
Con Mod Low Mid High
IA-induced colitisA
B
C
Con Mod Low Mid High
DSS-induced colitis
D
E
Figure 4 Panax notoginseng repaired colonic mucosal injuries and microvessels. IA- and DSS-induced experimental colitis groups were treated with PN (0.5, 1.0 and 2.0 g/kg) for seven consecutive days. A, C: Colonic mucosal injuries and microvessels significantly improved; B, D, E: Microvessel density increased compared with the control groups in a dose-dependent manner. Results are expressed as mean ± SD of three independent experiments performed in triplicate. bP < 0.01 vs normal control. DSS: Dextran sodium sulfate; IA: Iodoacetamide; PN: Panax notoginseng.
Wang SY et al . Panax notoginseng in experimental colitis
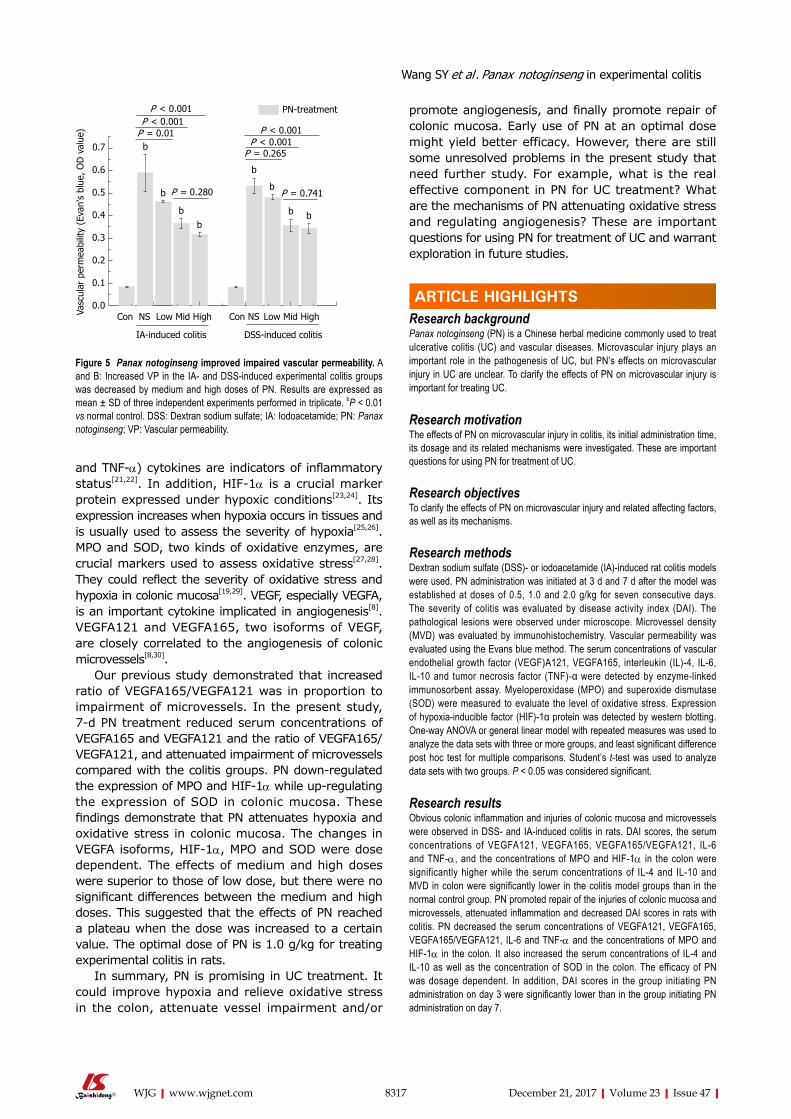
8317 December 21, 2017|Volume 23|Issue 47|WJG|www.wjgnet.com
and TNFα) cytokines are indicators of inflammatory status[21,22]. In addition, HIF1α is a crucial marker protein expressed under hypoxic conditions[23,24]. Its expression increases when hypoxia occurs in tissues and is usually used to assess the severity of hypoxia[25,26]. MPO and SOD, two kinds of oxidative enzymes, are crucial markers used to assess oxidative stress[27,28]. They could reflect the severity of oxidative stress and hypoxia in colonic mucosa[19,29]. VEGF, especially VEGFA, is an important cytokine implicated in angiogenesis[8]. VEGFA121 and VEGFA165, two isoforms of VEGF, are closely correlated to the angiogenesis of colonic microvessels[8,30].
Our previous study demonstrated that increased ratio of VEGFA165/VEGFA121 was in proportion to impairment of microvessels. In the present study, 7d PN treatment reduced serum concentrations of VEGFA165 and VEGFA121 and the ratio of VEGFA165/VEGFA121, and attenuated impairment of microvessels compared with the colitis groups. PN downregulated the expression of MPO and HIF1α while upregulating the expression of SOD in colonic mucosa. These findings demonstrate that PN attenuates hypoxia and oxidative stress in colonic mucosa. The changes in VEGFA isoforms, HIF1α, MPO and SOD were dose dependent. The effects of medium and high doses were superior to those of low dose, but there were no significant differences between the medium and high doses. This suggested that the effects of PN reached a plateau when the dose was increased to a certain value. The optimal dose of PN is 1.0 g/kg for treating experimental colitis in rats.
In summary, PN is promising in UC treatment. It could improve hypoxia and relieve oxidative stress in the colon, attenuate vessel impairment and/or
promote angiogenesis, and finally promote repair of colonic mucosa. Early use of PN at an optimal dose might yield better efficacy. However, there are still some unresolved problems in the present study that need further study. For example, what is the real effective component in PN for UC treatment? What are the mechanisms of PN attenuating oxidative stress and regulating angiogenesis? These are important questions for using PN for treatment of UC and warrant exploration in future studies.
ARTICLE HIGHLIGHTSResearch background Panax notoginseng (PN) is a Chinese herbal medicine commonly used to treat ulcerative colitis (UC) and vascular diseases. Microvascular injury plays an important role in the pathogenesis of UC, but PN’s effects on microvascular injury in UC are unclear. To clarify the effects of PN on microvascular injury is important for treating UC.
Research motivationThe effects of PN on microvascular injury in colitis, its initial administration time, its dosage and its related mechanisms were investigated. These are important questions for using PN for treatment of UC.
Research objectivesTo clarify the effects of PN on microvascular injury and related affecting factors, as well as its mechanisms.
Research methodsDextran sodium sulfate (DSS)- or iodoacetamide (IA)-induced rat colitis models were used. PN administration was initiated at 3 d and 7 d after the model was established at doses of 0.5, 1.0 and 2.0 g/kg for seven consecutive days. The severity of colitis was evaluated by disease activity index (DAI). The pathological lesions were observed under microscope. Microvessel density (MVD) was evaluated by immunohistochemistry. Vascular permeability was evaluated using the Evans blue method. The serum concentrations of vascular endothelial growth factor (VEGF)A121, VEGFA165, interleukin (IL)-4, IL-6, IL-10 and tumor necrosis factor (TNF)-α were detected by enzyme-linked immunosorbent assay. Myeloperoxidase (MPO) and superoxide dismutase (SOD) were measured to evaluate the level of oxidative stress. Expression of hypoxia-inducible factor (HIF)-1α protein was detected by western blotting. One-way ANOVA or general linear model with repeated measures was used to analyze the data sets with three or more groups, and least significant difference post hoc test for multiple comparisons. Student’s t-test was used to analyze data sets with two groups. P < 0.05 was considered significant.
Research resultsObvious colonic inflammation and injuries of colonic mucosa and microvessels were observed in DSS- and IA-induced colitis in rats. DAI scores, the serum concentrations of VEGFA121, VEGFA165, VEGFA165/VEGFA121, IL-6 and TNF-α, and the concentrations of MPO and HIF-1α in the colon were significantly higher while the serum concentrations of IL-4 and IL-10 and MVD in colon were significantly lower in the colitis model groups than in the normal control group. PN promoted repair of the injuries of colonic mucosa and microvessels, attenuated inflammation and decreased DAI scores in rats with colitis. PN decreased the serum concentrations of VEGFA121, VEGFA165, VEGFA165/VEGFA121, IL-6 and TNF-α and the concentrations of MPO and HIF-1α in the colon. It also increased the serum concentrations of IL-4 and IL-10 as well as the concentration of SOD in the colon. The efficacy of PN was dosage dependent. In addition, DAI scores in the group initiating PN administration on day 3 were significantly lower than in the group initiating PN administration on day 7.
0.7
0.6
0.5
0.4
0.3
0.2
0.1
0.0
Vasc
ular
per
mea
bilit
y (E
van'
s bl
ue, O
D v
alue
)
Con NS Low Mid High Con NS Low Mid High
IA-induced colitis DSS-induced colitis
PN-treatmentP < 0.001P < 0.001
P < 0.001P < 0.001
P = 0.01
P = 0.265
b
b
bb
b
b
b b
P = 0.280 P = 0.741
Figure 5 Panax notoginseng improved impaired vascular permeability. A and B: Increased VP in the IA- and DSS-induced experimental colitis groups was decreased by medium and high doses of PN. Results are expressed as mean ± SD of three independent experiments performed in triplicate. bP < 0.01 vs normal control. DSS: Dextran sodium sulfate; IA: Iodoacetamide; PN: Panax notoginseng; VP: Vascular permeability.
Wang SY et al . Panax notoginseng in experimental colitis
ARTICLE HIGHLIGHTS
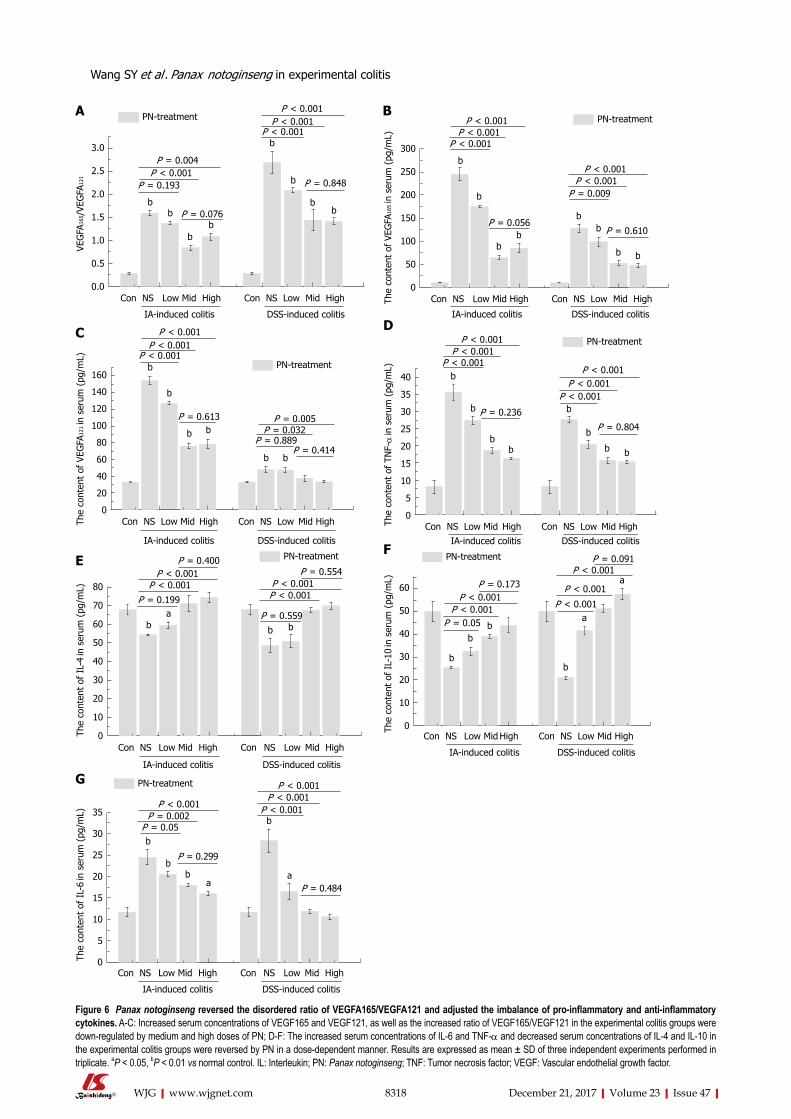
8318 December 21, 2017|Volume 23|Issue 47|WJG|www.wjgnet.com
3.0
2.5
2.0
1.5
1.0
0.5
0.0
VEG
FA16
5 /VE
GFA
121
PN-treatmentP < 0.001
Con NS Low Mid High Con NS Low Mid High
IA-induced colitis DSS-induced colitis
bb
bb
b
bb
b
P < 0.001P < 0.001
P < 0.001P = 0.004
P = 0.193
P = 0.076
300
250
200
150
100
50
0
The
cont
ent
of V
EGFA
165 in
ser
um (
pg/m
L)
PN-treatment
Con NS Low Mid High Con NS Low Mid High
IA-induced colitis DSS-induced colitis
P < 0.001P < 0.001
P < 0.001
P < 0.001P < 0.001
P = 0.009
b
b
bb
bb
b b
P = 0.056P = 0.610
160
140
120
100
80
60
40
20
0
PN-treatment
Con NS Low Mid High Con NS Low Mid High
IA-induced colitis DSS-induced colitis
P = 0.005
The
cont
ent
of V
EGFA
121 in
ser
um (
pg/m
L)
P = 0.032P = 0.889
P = 0.414
P = 0.613
P < 0.001P < 0.001
P < 0.001
b
b
b b
b b
80
70
60
50
40
30
20
10
0
PN-treatment
Con NS Low Mid High Con NS Low Mid High
IA-induced colitis DSS-induced colitis
The
cont
ent
of I
L-4
in s
erum
(pg
/mL)
P < 0.001P < 0.001 P < 0.001
P < 0.001
P = 0.554
P = 0.559
P = 0.400
P = 0.199
b b ba
40
35
30
25
20
15
10
5
0
PN-treatment
Con NS Low Mid High Con NS Low Mid HighIA-induced colitis DSS-induced colitis
The
cont
ent
of T
NF-α
in s
erum
(pg
/mL) P < 0.001
P < 0.001P < 0.001
P < 0.001P < 0.001
P < 0.001b
b
bb
b
b
b b
P = 0.236
60
50
40
30
20
10
0
PN-treatment
Con NS Low Mid High Con NS Low Mid High
IA-induced colitis DSS-induced colitis
The
cont
ent
of I
L-10
in s
erum
(pg
/mL) P = 0.173
P = 0.05P < 0.001
P < 0.001P < 0.001
P < 0.001
P < 0.001P = 0.091
b
bb
b
a
a
35
30
25
20
15
10
5
0
PN-treatment
Con NS Low Mid High Con NS Low Mid High
IA-induced colitis DSS-induced colitis
The
cont
ent
of I
L-6
in s
erum
(pg
/mL)
P < 0.001P = 0.002
P = 0.05
P = 0.299
P < 0.001P < 0.001
P < 0.001
P = 0.484
b
b
ba
a
b
A B
C D
EF
G
Figure 6 Panax notoginseng reversed the disordered ratio of VEGFA165/VEGFA121 and adjusted the imbalance of pro-inflammatory and anti-inflammatory cytokines. A-C: Increased serum concentrations of VEGF165 and VEGF121, as well as the increased ratio of VEGF165/VEGF121 in the experimental colitis groups were down-regulated by medium and high doses of PN; D-F: The increased serum concentrations of IL-6 and TNF-α and decreased serum concentrations of IL-4 and IL-10 in the experimental colitis groups were reversed by PN in a dose-dependent manner. Results are expressed as mean ± SD of three independent experiments performed in triplicate. aP < 0.05, bP < 0.01 vs normal control. IL: Interleukin; PN: Panax notoginseng; TNF: Tumor necrosis factor; VEGF: Vascular endothelial growth factor.
P = 0.848
P = 0.804
Wang SY et al . Panax notoginseng in experimental colitis
8319 December 21, 2017|Volume 23|Issue 47|WJG|www.wjgnet.com
Research conclusionsPN repaired microvessel injury in experimental colitis via attenuating inflammation and oxidative stress in the colonic mucosa. The efficacy of PN was related to the initial administration time and the dose.
Research perspectivesFinding the real effective component in PN and clarifying the mechanisms of PN attenuating oxidative stress and regulating angiogenesis will be conducted in the future studies.
ACKNOWLEDGMENTSThe authors thank all technical staff who provided help in the study and Dr. Ying Dong who provided help in biostatistics.
REFERENCES1 Kaelin WG Jr, Ratcliffe PJ. Oxygen sensing by metazoans: the
central role of the HIF hydroxylase pathway. Mol Cell 2008; 30: 393-402 [PMID: 18498744 DOI: 10.1016/j.molcel.2008.04.009]
2 Saijo H, Tatsumi N, Arihiro S, Kato T, Okabe M, Tajiri H, Hashimoto H. Microangiopathy triggers, and inducible nitric oxide synthase exacerbates dextran sulfate sodium-induced colitis. Lab Invest 2015; 95: 728748 [PMID: 25938626 DOI: 10.1038/labinvest.2015.60]
3 Gutierrez LS, Ling J, Nye D, Papathomas K, Dickinson C. Thrombospondin peptide ABT-898 inhibits inflammation and angiogenesis in a colitis model. World J Gastroenterol 2015; 21: 6157-6166 [PMID: 26034351 DOI: 10.3748/wjg.v21.i20.6157]
4 Tolstanova G, Deng X, French SW, Lungo W, Paunovic B, Khomenko T, Ahluwalia A, Kaplan T, Dacosta-Iyer M, Tarnawski A, Szabo S, Sandor Z. Early endothelial damage and increased colonic vascular permeability in the development of experimental ulcerative colitis in rats and mice. Lab Invest 2012; 92: 921 [PMID: 21894149 DOI: 10.1038/labinvest.2011.122]
5 Pinzón-Daza ML, CuellarSaenz Y, Nualart F, OndoMendez A, Del Riesgo L, CastilloRivera F, Garzón R. Oxidative Stress Promotes Doxorubicin-Induced Pgp and BCRP Expression in Colon Cancer Cells Under Hypoxic Conditions. J Cell Biochem 2017; 118: 1868-1878 [PMID: 28106284 DOI: 10.1002/jcb.25890]
6 Slattery ML, Lundgreen A, Welbourn B, Wolff RK, Corcoran C. Oxidative balance and colon and rectal cancer: interaction of lifestyle factors and genes. Mutat Res 2012; 734: 3040 [PMID: 22531693 DOI: 10.1016/j.mrfmmm.2012.04.002]
7 Deng X, Szabo S, Khomenko T, Tolstanova G, Paunovic B, French SW, Sandor Z. Novel pharmacologic approaches to the prevention and treatment of ulcerative colitis. Curr Pharm Des 2013; 19: 17-28 [PMID: 22950505]
8 Shiying W, Boyun S, Jianye Y, Wanjun Z, Ping T, Jiang L, Hongyi H. The Different Effects of VEGFA121 and VEGFA165 on Regulating Angiogenesis Depend on Phosphorylation Sites of VEGFR2. Inflamm Bowel Dis 2017; 23: 603616 [PMID: 28296822 DOI: 10.1097/MIB.0000000000001055]
9 Ng TB. Pharmacological activity of sanchi ginseng (Panax notoginseng). J Pharm Pharmacol 2006; 58: 10071019 [PMID: 16872547 DOI: 10.1211/jpp.58.8.0001]
10 Yang BR, Cheung KK, Zhou X, Xie RF, Cheng PP, Wu S, Zhou ZY, Tang JY, Hoi PM, Wang YH, Lee SM. Amelioration of acute myocardial infarction by saponins from flower buds of Panax notoginseng via proangiogenesis and antiapoptosis. J Ethnopharmacol 2016; 181: 5058 [PMID: 26806572 DOI: 10.1016/j.jep.2016.01.022]
11 Lei Y, Tao LL, Wang GL. [Effect of extracts from Panax ginseng, Panax notoginseng, and Ligusticum chuanxiong on vascular smooth muscle cells of aging and hypertension rats]. Zhongguo Zhong Xi Yi Jie He Za Zhi 2012; 32: 1374-1379 [PMID: 23163150]
12 Wen XD, Wang CZ, Yu C, Zhao L, Zhang Z, Matin A, Wang Y, Li P, Xiao SY, Du W, He TC, Yuan CS. Panax notoginseng attenuates experimental colitis in the azoxymethane/dextran sulfate sodium mouse model. Phytother Res 2014; 28: 892898 [PMID: 24142591 DOI: 10.1002/ptr.5066]
13 Dai YC, Zheng L, Zhang YL, Chen X, Chen DL, Wang LJ, Tang ZP. Jianpi Qingchang decoction regulates intestinal motility of dextran sulfate sodiuminduced colitis through reducing autophagy of interstitial cells of Cajal. World J Gastroenterol 2017; 23: 4724-4734 [PMID: 28765693 DOI: 10.3748/wjg.v23.i26.4724]
14 Yamamoto A, Itoh T, Nasu R, Nishida R. Sodium alginate ameliorates indomethacin-induced gastrointestinal mucosal injury via inhibiting translocation in rats. World J Gastroenterol 2014; 20: 2641-2652 [PMID: 24627600 DOI: 10.3748/wjg.v20.i10.2641]
15 Glover LE, Bowers BE, Saeedi B, Ehrentraut SF, Campbell EL, Bayless AJ, Dobrinskikh E, Kendrick AA, Kelly CJ, Burgess A, Miller L, Kominsky DJ, Jedlicka P, Colgan SP. Control of creatine metabolism by HIF is an endogenous mechanism of barrier regulation in colitis. Proc Natl Acad Sci USA 2013; 110: 19820-19825 [PMID: 24248342 DOI: 10.1073/pnas.1302840110]
16 Wang T, Guo R, Zhou G, Zhou X, Kou Z, Sui F, Li C, Tang L, Wang Z. Traditional uses, botany, phytochemistry, pharmacology and toxicology of Panax notoginseng (Burk.) F.H. Chen: A review. J Ethnopharmacol 2016; 188: 234258 [PMID: 27154405 DOI: 10.1016/j.jep.2016.05.005]
17 Triantafillidis JK, Triantafyllidi A, Vagianos C, Papalois A. Favorable results from the use of herbal and plant products in inflammatory bowel disease: evidence from experimental animal studies. Ann Gastroenterol 2016; 29: 268281 [PMID: 27366027 DOI: 10.20524/aog.2016.0059]
18 Wang M, Lei Y. Timeeffect relationship of extracts from ginseng, notoginseng and chuanxiong on vascular endothelial cells senescence. Chin J Integr Med 2014; 20: 758763 [PMID: 25073698 DOI: 10.1007/s11655-014-1814-6]
19 Stupin A, Cosic A, Novak S, Vesel M, Jukic I, Popovic B, Karalic K, Loncaric Z, Drenjancevic I. Reduced Dietary Selenium Impairs Vascular Function by Increasing Oxidative Stress in Sprague-Dawley Rat Aortas. Int J Environ Res Public Health 2017; 14: [PMID: 28574428 DOI: 10.3390/ijerph14060591]
20 Cummins EP, Crean D. Hypoxia and inflammatory bowel disease. Microbes Infect 2017; 19: 210221 [PMID: 27664046 DOI: 10.1016/j.micinf.2016.09.004]
21 Liu MY, Yang ZY, Dai WK, Huang JQ, Li YH, Zhang J, Qiu CZ, Wei C, Zhou Q, Sun X, Feng X, Li DF, Wang HP, Zheng YJ. Protective effect of Bifidobacterium infantis CGMCC313-2 on ovalbumin-induced airway asthma and β-lactoglobulin-induced intestinal food allergy mouse models. World J Gastroenterol 2017; 23: 2149-2158 [PMID: 28405142 DOI: 10.3748/wjg.v23.i12.2149]
22 Almeida Junior LD, Quaglio AEV, de Almeida Costa CAR, Di Stasi LC. Intestinal anti-inflammatory activity of Ground Cherry (Physalis angulata L.) standardized CO2 phytopharmaceutical preparation. World J Gastroenterol 2017; 23: 43694380 [PMID: 28706419 DOI: 10.3748/wjg.v23.i24.4369]
23 Sun X, Liu YD, Gao W, Shen SH, Li M. HIF-1α -1790G>A polymorphism significantly increases the risk of digestive tract cancer: a metaanalysis. World J Gastroenterol 2015; 21: 1641-1649 [PMID: 25663785 DOI: 10.3748/wjg.v21.i5.1641]
24 Kim JH, Hwang YJ, Han SH, Lee YE, Kim S, Kim YJ, Cho JH, Kwon KA, Kim JH, Kim SH. Dexamethasone inhibits hypoxia-induced epithelialmesenchymal transition in colon cancer. World J Gastroenterol 2015; 21: 98879899 [PMID: 26379394 DOI: 10.3748/wjg.v21.i34.9887]
25 Okamoto R, Watanabe M. Role of epithelial cells in the pathogenesis and treatment of inflammatory bowel disease. J Gastroenterol 2016; 51: 1121 [PMID: 26138071 DOI: 10.1007/s00535-015-1098-4]
26 Flannigan KL, Agbor TA, Motta JP, Ferraz JG, Wang R, Buret AG, Wallace JL. Proresolution effects of hydrogen sulfide during colitis are mediated through hypoxia-inducible factor-1α.
Wang SY et al . Panax notoginseng in experimental colitis
8320 December 21, 2017|Volume 23|Issue 47|WJG|www.wjgnet.com
FASEB J 2015; 29: 15911602 [PMID: 25550470 DOI: 10.1096/fj.14-266015]
27 Zheng XY, Lv YF, Li S, Li Q, Zhang QN, Zhang XT, Hao ZM. Recombinant adeno-associated virus carrying thymosin β4 suppresses experimental colitis in mice. World J Gastroenterol 2017; 23: 242-255 [PMID: 28127198 DOI: 10.3748/wjg.v23.i2.242]
28 Wang T, Leng YF, Zhang Y, Xue X, Kang YQ, Zhang Y. Oxidative stress and hypoxia-induced factor 1α expression in gastric ischemia. World J Gastroenterol 2011; 17: 19151922 [PMID:
21528068 DOI: 10.3748/wjg.v17.i14.1915]29 Chen Z, Wang J, Yang W, Chen J, Meng Y, Geng B, Cui Q,
Yang J. FAM3A mediates PPARγ’s protection in liver ischemia-reperfusion injury by activating Akt survival pathway and repressing inflammation and oxidative stress. Oncotarget 2017; 8: 49882-49896 [PMID: 28562339 DOI: 10.18632/oncotarget.17805]
30 Xin H, Zhong C, Nudleman E, Ferrara N. Evidence for Proangiogenic Functions of VEGFAx. Cell 2016; 167: 275284.e6 [PMID: 27662093 DOI: 10.1016/j.cell.2016.08.054]
P- Reviewer: Doherty GA, Ziogas GE S- Editor: Ma YJ L- Editor: Filipodia E- Editor: Huang Y
Wang SY et al . Panax notoginseng in experimental colitis
Bin-Rui Chen, Li-Jun Du, Hui-Qin He, Ya-Wen Zhang, Liang Luo, Ning Dai, Department of Gastroenterology, Sir Run Run Shaw Hospital, School of Medicine, Zhejiang University, Hangzhou 310016, Zhejiang Province, China
John J Kim, Yan Zhao, Division of Gastroenterology, Loma Linda University Medical Center, Loma Linda, Ca 92354, United States
ORCID number: Bin-Rui Chen (0000-0002-4535-6516); Li-Jun Du (0000-0002-7783-1959); Hui-Qin He (0000-0002-0333 -4933); John J. Kim (0000-0003-4341-8661); Yan Zhao (0000-0003 -4278-2592); Ya-Wen Zhang (0000-0003-2191-3346); Liang Luo (0000-0002-2630-5828); Ning Dai (0000-0003-0749-9230).
Author contributions: all authors contributed to the design of the study; Chen BR, Du LJ, He HQ, Zhang YW and Luo L performed the experiments; Chen BR and Du LJ analyzed the data; Chen BR, Kim JJ and Zhao Y wrote the paper; Kim JJ and Dai N critically revised the manuscript; all authors have reviewed the manuscript and given advice.
Institutional review board statement: The study was reviewed and approved by Zhejiang University animal Institutional Review Board.
Institutional animal care and use committee statement: all procedures involving animals were reviewed and approved by the Institutional animal Care and Use Committee of Zhejiang University.
Conflict-of-interest statement: The authors declare no conflict of interest related to this study.
Open-Access: This article is an open-access article which was selected by an in-house editor and fully peer-reviewed by external reviewers. It is distributed in accordance with the Creative Commons attribution Non Commercial (CC BY-NC 4.0) license, which permits others to distribute, remix, adapt, build upon this
work non-commercially, and license their derivative works on different terms, provided the original work is properly cited and the use is non-commercial. See: http://creativecommons.org/licenses/by-nc/4.0/
Manuscript source: Unsolicited manuscript
Correspondence to: Ning Dai, MD, PhD, Department Chief, Department of Gastroenterology, Sir Run Run Shaw Hospital, School of Medicine, Zhejiang University, No. 3, East Qingchun Road, Hangzhou 310016, Zhejiang Province, China. [email protected]: +86-571-86044817Fax: +86-571-86044817
Received: September 28, 2017 Peer-review started: September 28, 2017First decision: October 17, 2017Revised: November 14, 2017Accepted: November 21, 2017 Article in press: November 21, 2017Published online: December 21, 2017
AbstractAIMTo determine whether fructo-oligosaccharide (FOS) affects visceral sensitivity, inflammation, and production of intestinal short-chain fatty acids (SCFA) in an irritable bowel syndrome (IBS) mouse model.
METHODSMice were randomly assigned to daily oral gavage of saline solution with or without FOS (8 g/kg body weight) for 14 d. Mice were further assigned to receive either daily one-hour water avoidance stress (WAS) or sham-
8321 December 21, 2017|Volume 23|Issue 47|WJG|www.wjgnet.com
ORIGINAL ARTICLE
Fructo-oligosaccharide intensifies visceral hypersensitivity and intestinal inflammation in a stress-induced irritable bowel syndrome mouse model
Basic Study
Bin-Rui Chen, Li-Jun Du, Hui-Qin He, John J Kim, Yan Zhao, Ya-Wen Zhang, Liang Luo, Ning Dai
Submit a Manuscript: http://www.f6publishing.com
DOI: 10.3748/wjg.v23.i47.8321
World J Gastroenterol 2017 December 21; 23(47): 8321-8333
ISSN 1007-9327 (print) ISSN 2219-2840 (online)
WAS for the first 10 d. After 2 wk, visceral sensitivity was measured by abdominal withdrawal reflex in response to colorectal distension and mucosal inflammation was evaluated. Gas chromatography, real-time reverse transcription PCR, and immunohistochemistry assays were used to quantify cecal concentrations of SCFA, intestinal cytokine expression, and number of intestinal mast cells per high-power field (HPF), respectively.
RESULTSMice subjected to WAS exhibited visceral hypersensitivity and low-grade inflammation. Among mice subjected to WAS, FOS increased visceral hypersensitivity and led to higher cecal concentrations of acetic acid (2.49 ± 0.63 mmol/L vs 1.49 ± 0.72 mmol/L, P < 0.05), propionic acid (0.48 ± 0.09 mmol/L vs 0.36 ± 0.05 mmol/L, P < 0.01), butyric acid (0.28 ± 0.09 mmol/L vs 0.19 ± 0.003 mmol/L, P < 0.05), as well as total SCFA (3.62 ± 0.87 mmol/L vs 2.27 ± 0.75 mmol/L, P < 0.01) compared to saline administration. FOS also increased ileal interleukin (IL)-23 mRNA (4.71 ± 4.16 vs 1.00 ± 0.99, P < 0.05) and colonic IL-1β mRNA (2.15 ± 1.68 vs 0.88 ± 0.53, P < 0.05) expressions as well as increased mean mast cell counts in the ileum (12.3 ± 2.6 per HPF vs 8.3 ± 3.6 per HPF, P < 0.05) and colon (6.3 ± 3.2 per HPF vs 3.4 ± 1.2 per HPF, P < 0.05) compared to saline administration in mice subjected to WAS. No difference in visceral sensitivity, intestinal inflammation, or cecal SCFA levels was detected with or without FOS administration in mice subjected to sham-WAS.
CONCLUSIONFOS administration intensifies visceral hypersensitivity and gut inflammation in stress-induced IBS mice, but not in the control mice, and is also associated with increased intestinal SCFA production.
Key words: Fructo-oligosaccharide; Stress; Irritable bowel syndrome; Visceral hypersensitivity; Intestinal inflammation; Short chain fatty acids; FODMAP
© The Author(s) 2017. Published by Baishideng Publishing Group Inc. All rights reserved.
Core tip: Fructo-oligosaccharide is a component of Fermentable Oligosaccharides, Disaccharides, Mono-saccharides, and Polyols (FODMAP), which has been associated with triggering symptoms in patients with irritable bowel syndrome (IBS). In a stress-induced IBS mouse model, daily fructo-oligosaccharide (FOS) administration further intensified visceral hypersensitivity and low-grade intestinal inflammation compared to saline. FOS administration also led to increased intestinal production of individual and total short-chain fatty acids (SCFA) in mice subjected to stress. However, no difference in visceral sensitivity, intestinal inflammation, or cecal concentrations of SCFA was observed among sham-stressed mice receiving FOS or saline. Our findings suggest a mechanism of FODMAP-
induced gastrointestinal symptoms associated with increased production of SCFA specific to IBS.
Chen BR, Du LJ, He HQ, Kim JJ, Zhao Y, Zhang YW, Luo L, Dai N. Fructo-oligosaccharide intensifies visceral hypersensitivity and intestinal inflammation in a stress-induced irritable bowel syndrome mouse model. World J Gastroenterol 2017; 23(47): 8321-8333 available from: URL: http://www.wjgnet.com/1007-9327/full/v23/i47/8321.htm DOI: http://dx.doi.org/10.3748/wjg.v23.i47.8321
INTRODUCTIONIrritable bowel syndrome (IBS) is a functional gastrointestinal disorder characterized by chronic abdominal pain associated with changes in bowel habit and frequency affecting more than a tenth of the general population[1,2]. Many factors contribute to the development of IBS, including altered visceral pain perception, lowgrade intestinal inflammation, change in microbiota, and psychosocial factors[3]. The complex pathophysiology of IBS has posed challenges to developing effective interventions, and therapeutic gains with conventional pharmacologic therapies have been marginal at less than 15%[4].
Importance of dietary factors in triggering symptoms is increasingly being recognized in patients with IBS. Specifically, poorly absorbed, fermentable carbohydrates categorized as Fermentable Oligosaccharides, Disaccharides, Monosaccharides, and Polyols (FODMAP) have been studied closely[5]. Consumption of food high in FODMAP content triggers abdominal pain, bloating, and flatulence in patients with IBS. Furthermore, several randomized trials have demonstrated that low FODMAP diet reduces gastrointestinal symptoms in patients with IBS[69]. Although largely unexplored, the accumulation of intestinal fluid from osmotic load of poorly digested carbohydrates and excessive colonic gas production associated with ingestion of FODMAP have been proposed as a mechanism for development of gastrointestinal symptoms[10,11]. Intestinal dysmotility, visceral hypersensitivity, altered microbiota, and change in metabolic output also likely contribute to the pathophysiology of gastrointestinal symptoms associated with ingestion of FODMAP in IBS patients[1113]. In addition, the production of shortchain fatty acids (SCFA), such as acetic, propionic, and butyric acids, may also be important in the development of symptoms in IBS[14].
Fructooligosaccharide (FOS) is one of the most frequently consumed FODMAP components in the general diet. The aim of our study was to investigate the effects of FOS on visceral sensitivity, intestinal SCFA production, and intestinal inflammation in a stressinduced IBS mouse model. Water avoidance
8322 December 21, 2017|Volume 23|Issue 47|WJG|www.wjgnet.com
Chen BR et al . Fructo-oligosaccharide in IBS mice
stress (WAS) was utilized to simulate psychological stress in IBS, and a WAS mouse model was used to evaluate the effects of FOS administration on visceral hypersensitivity and intestinal immune activation[15]. Individual (acetic, propionic, and butyric acids) as well as total SCFA concentrations were also quantified in the cecum to determine the effects of FOS administration in a stressinduced IBS mouse model.
MATERIALS AND METHODSAnimalsThreeweekold female C57BL/6 mice (Slac Laboratory Animal Co. Ltd. Shanghai, China) were used as described in a previous study using WAS to develop a stressinduced IBS mouse model[16]. Mice were housed in pathogenfree conditions with temperature (21 ± 1 ℃) and light/dark cycle (12/12 h) regulation. A purified rodent diet (AIN-76A) without any FODMAP content and demineralized water were supplied freely on demand.
Animal care and use statementAll animal experiment protocols were reviewed and approved by the Animal Care and Use Committee of Zhejiang University prior to initiating this study. All animals received humane care in compliance with the criteria described in “The Guide for the Care and Use of Laboratory Animals.”
Experimental designTo evaluate the effects of FOS on WASinduced visceral hypersensitivity and intestinal inflammation, 32 mice were randomly divided into four groups of eight mice (shamWAS + saline administration, shamWAS + FOS administration, WAS + saline administration, and WAS + FOS administration). Mice were administered daily with oral gavage of saline solution with or without FOS (8 g/kg body weight) for 14 d. FOS dose was derived according to the MeehRubner formula[8]. Mice were subjected to either WAS or sham-WAS during the first 10 d. For WAS, mice were placed on a glass platform (3 cm length × 3 cm width × 9 cm height) surrounded by water (25 ℃) in the middle of a plastic container (45 cm × 30 cm × 25 cm) as previously described[15]. Control mice assigned to shamWAS were placed in the same container without water. Food consumption quantity, body weight, and indexes were recorded daily prior to subjecting mice to daily WAS or shamWAS.
Assessment of visceral sensitivityAbdominal withdrawal reflex in response to colorectal distension was evaluated to assess visceral sensitivity as described previously[17]. Semiquantitative abdominal withdrawal reflex score (04) was utilized to evaluate pain responses at different magnitudes of
colorectal distention (20, 40, 60, and 80 mmHg)[18]. With gradual colorectal distention to 100 mmHg, the pressure eliciting abdomen lifting was recorded as pain threshold and that eliciting body arching was recorded as volume threshold. To achieve accuracy, all pressure and threshold measurements were repeated three times and recorded by two independent operators blinded to WAS or FOS assignment.
Histological evaluation of inflammationMice were sacrificed by cervical dislocation, and intestinal tissues were harvested for histological evaluation. Intestinal tissue was fixed in formalin and processed with hematoxylin and eosin stains. The absence or presence of neutrophil infiltration in the lamina propria and the degree of interstitial edema in the intestinal tissues were graded based on previous description[18]. Stained slides were examined by two independent observers blinded to WAS or FOS assignment.
Quantification of SCFA productionSCFA production was quantified using gas chromatography as previously described[19]. Cecal contents (50 mg) were homogenized in 0.5 mL of distilled water and 0.1 mL of 25% (w/v) metaphosphoric acid was added to the suspension. The samples were subsequently centrifuged at 14000 × g for 20 min, and the supernatant was filtered through a membrane filter (pore size 0.22 μm). SCFA in the samples were then separated with InertCap FFAP columns (0.25 mm × 30 mm × 0.25 mm), and the peaks were integrated with GC Solution software (Shimadzu, GC2010 Plus, Japan). Singlepoint internal standard method was used to quantify SCFA.
Intestinal cytokine mRNA detectionIntestinal expression of cytokines such as tumor necrosis factor (TNF)-α, interleukin (IL)6, IL23, IL10, and IL1β was evaluated. Total RNA was isolated from 100 mg of ileal and colonic tissues by using a RNA Extraction Kit (Takara, Japan) and processed with a PrimeScript RT reagent Kit (Takara, Japan) to synthesize cDNA. Primers used are listed in Table 1. Quantitative realtime PCR was performed in triplicate for each sample with Lightcycler 480 instrument (Roche Applied Science, Penzberg, Germany). Reaction conditions for amplification of DNA were as follows: 95 ℃ for 30 s and 40 cycles of 95 ℃ for 5 s and 60 ℃ for 30 s. Cytokine transcript levels were normalized with βactin, and relative gene expression was expressed as the fold change (2-ΔΔCt) relative to the expression in the control samples.
ImmunohistochemistryIntestinal mucosal mast cells were estimated by
8323 December 21, 2017|Volume 23|Issue 47|WJG|www.wjgnet.com
Chen BR et al . Fructo-oligosaccharide in IBS mice
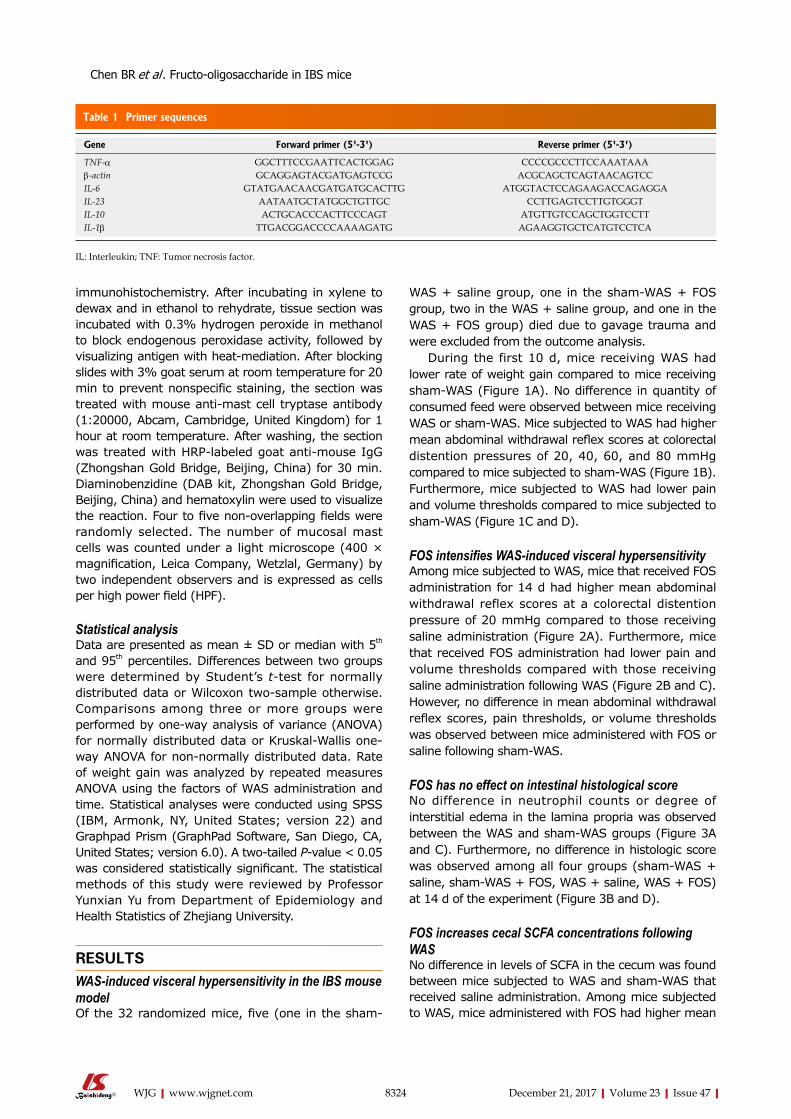
8324 December 21, 2017|Volume 23|Issue 47|WJG|www.wjgnet.com
WAS + saline group, one in the shamWAS + FOS group, two in the WAS + saline group, and one in the WAS + FOS group) died due to gavage trauma and were excluded from the outcome analysis.
During the first 10 d, mice receiving WAS had lower rate of weight gain compared to mice receiving sham-WAS (Figure 1A). No difference in quantity of consumed feed were observed between mice receiving WAS or shamWAS. Mice subjected to WAS had higher mean abdominal withdrawal reflex scores at colorectal distention pressures of 20, 40, 60, and 80 mmHg compared to mice subjected to shamWAS (Figure 1B). Furthermore, mice subjected to WAS had lower pain and volume thresholds compared to mice subjected to shamWAS (Figure 1C and D).
FOS intensifies WAS-induced visceral hypersensitivityAmong mice subjected to WAS, mice that received FOS administration for 14 d had higher mean abdominal withdrawal reflex scores at a colorectal distention pressure of 20 mmHg compared to those receiving saline administration (Figure 2A). Furthermore, mice that received FOS administration had lower pain and volume thresholds compared with those receiving saline administration following WAS (Figure 2B and C). However, no difference in mean abdominal withdrawal reflex scores, pain thresholds, or volume thresholds was observed between mice administered with FOS or saline following shamWAS.
FOS has no effect on intestinal histological scoreNo difference in neutrophil counts or degree of interstitial edema in the lamina propria was observed between the WAS and shamWAS groups (Figure 3A and C). Furthermore, no difference in histologic score was observed among all four groups (shamWAS + saline, shamWAS + FOS, WAS + saline, WAS + FOS) at 14 d of the experiment (Figure 3B and D).
FOS increases cecal SCFA concentrations following WASNo difference in levels of SCFA in the cecum was found between mice subjected to WAS and shamWAS that received saline administration. Among mice subjected to WAS, mice administered with FOS had higher mean
immunohistochemistry. After incubating in xylene to dewax and in ethanol to rehydrate, tissue section was incubated with 0.3% hydrogen peroxide in methanol to block endogenous peroxidase activity, followed by visualizing antigen with heatmediation. After blocking slides with 3% goat serum at room temperature for 20 min to prevent nonspecific staining, the section was treated with mouse antimast cell tryptase antibody (1:20000, Abcam, Cambridge, United Kingdom) for 1 hour at room temperature. After washing, the section was treated with HRPlabeled goat antimouse IgG (Zhongshan Gold Bridge, Beijing, China) for 30 min. Diaminobenzidine (DAB kit, Zhongshan Gold Bridge, Beijing, China) and hematoxylin were used to visualize the reaction. Four to five non-overlapping fields were randomly selected. The number of mucosal mast cells was counted under a light microscope (400 × magnification, Leica Company, Wetzlal, Germany) by two independent observers and is expressed as cells per high power field (HPF).
Statistical analysisData are presented as mean ± SD or median with 5th and 95th percentiles. Differences between two groups were determined by Student’s ttest for normally distributed data or Wilcoxon twosample otherwise. Comparisons among three or more groups were performed by one-way analysis of variance (ANOVA) for normally distributed data or Kruskal-Wallis one-way ANOVA for non-normally distributed data. Rate of weight gain was analyzed by repeated measures ANOVA using the factors of WAS administration and time. Statistical analyses were conducted using SPSS (IBM, Armonk, NY, United States; version 22) and Graphpad Prism (GraphPad Software, San Diego, CA, United States; version 6.0). A two-tailed Pvalue < 0.05 was considered statistically significant. The statistical methods of this study were reviewed by Professor Yunxian Yu from Department of Epidemiology and Health Statistics of Zhejiang University.
RESULTSWAS-induced visceral hypersensitivity in the IBS mouse modelOf the 32 randomized mice, five (one in the sham
Chen BR et al . Fructo-oligosaccharide in IBS mice
Table 1 Primer sequences
Gene Forward primer (5'-3') Reverse primer (5'-3')
TNF-α GGCTTTCCGAATTCACTGGAG CCCCGCCCTTCCAAATAAAβ-actin GCAGGAGTACGATGAGTCCG ACGCAGCTCAGTAACAGTCCIL-6 GTATGAACAACGATGATGCACTTG ATGGTACTCCAGAAGACCAGAGGAIL-23 AATAATGCTATGGCTGTTGC CCTTGAGTCCTTGTGGGTIL-10 ACTGCACCCACTTCCCAGT ATGTTGTCCAGCTGGTCCTTIL-1β TTGACGGACCCCAAAAGATG AGAAGGTGCTCATGTCCTCA
IL: Interleukin; TNF: Tumor necrosis factor.
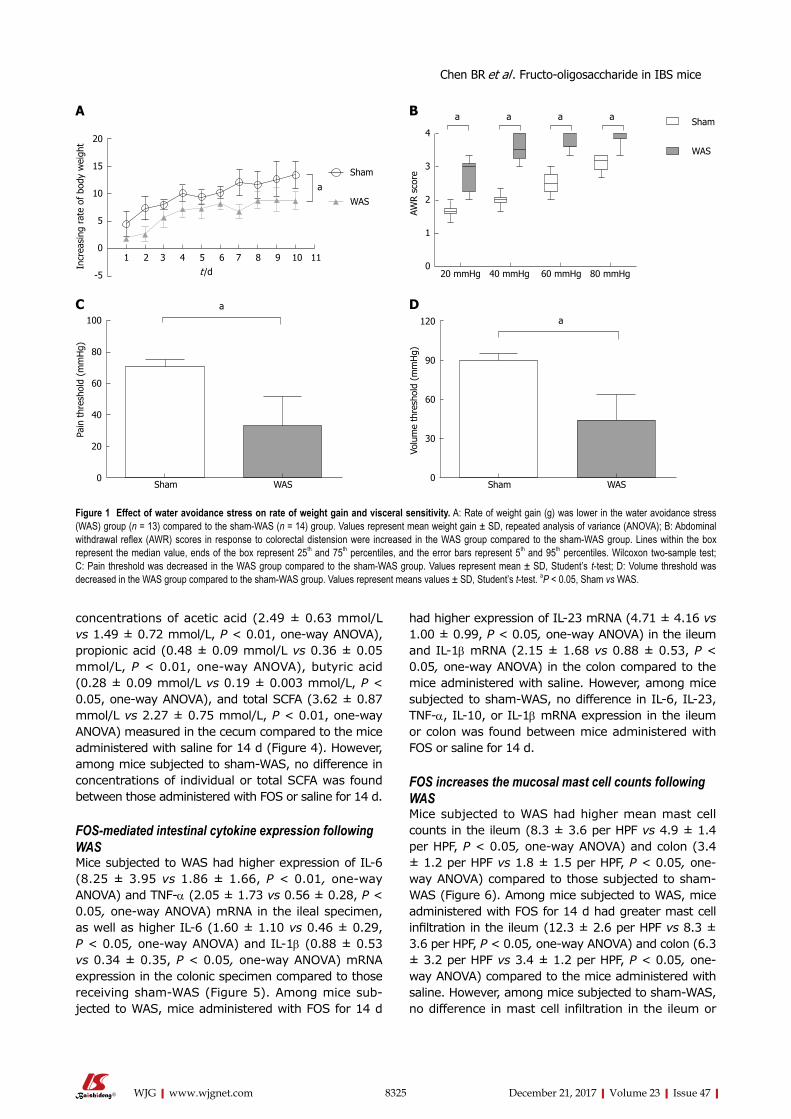
8325 December 21, 2017|Volume 23|Issue 47|WJG|www.wjgnet.com
concentrations of acetic acid (2.49 ± 0.63 mmol/L vs 1.49 ± 0.72 mmol/L, P < 0.01, one-way ANOVA), propionic acid (0.48 ± 0.09 mmol/L vs 0.36 ± 0.05 mmol/L, P < 0.01, one-way ANOVA), butyric acid (0.28 ± 0.09 mmol/L vs 0.19 ± 0.003 mmol/L, P < 0.05, one-way ANOVA), and total SCFA (3.62 ± 0.87 mmol/L vs 2.27 ± 0.75 mmol/L, P < 0.01, oneway ANOVA) measured in the cecum compared to the mice administered with saline for 14 d (Figure 4). However, among mice subjected to shamWAS, no difference in concentrations of individual or total SCFA was found between those administered with FOS or saline for 14 d.
FOS-mediated intestinal cytokine expression following WASMice subjected to WAS had higher expression of IL6 (8.25 ± 3.95 vs 1.86 ± 1.66, P < 0.01, oneway ANOVA) and TNF-α (2.05 ± 1.73 vs 0.56 ± 0.28, P < 0.05, one-way ANOVA) mRNA in the ileal specimen, as well as higher IL6 (1.60 ± 1.10 vs 0.46 ± 0.29, P < 0.05, one-way ANOVA) and IL-1β (0.88 ± 0.53 vs 0.34 ± 0.35, P < 0.05, one-way ANOVA) mRNA expression in the colonic specimen compared to those receiving shamWAS (Figure 5). Among mice subjected to WAS, mice administered with FOS for 14 d
had higher expression of IL-23 mRNA (4.71 ± 4.16 vs 1.00 ± 0.99, P < 0.05, one-way ANOVA) in the ileum and IL1β mRNA (2.15 ± 1.68 vs 0.88 ± 0.53, P < 0.05, one-way ANOVA) in the colon compared to the mice administered with saline. However, among mice subjected to shamWAS, no difference in IL6, IL23, TNF-α, IL10, or IL1β mRNA expression in the ileum or colon was found between mice administered with FOS or saline for 14 d.
FOS increases the mucosal mast cell counts following WASMice subjected to WAS had higher mean mast cell counts in the ileum (8.3 ± 3.6 per HPF vs 4.9 ± 1.4 per HPF, P < 0.05, one-way ANOVA) and colon (3.4 ± 1.2 per HPF vs 1.8 ± 1.5 per HPF, P < 0.05, oneway ANOVA) compared to those subjected to sham-WAS (Figure 6). Among mice subjected to WAS, mice administered with FOS for 14 d had greater mast cell infiltration in the ileum (12.3 ± 2.6 per HPF vs 8.3 ± 3.6 per HPF, P < 0.05, one-way ANOVA) and colon (6.3 ± 3.2 per HPF vs 3.4 ± 1.2 per HPF, P < 0.05, oneway ANOVA) compared to the mice administered with saline. However, among mice subjected to shamWAS, no difference in mast cell infiltration in the ileum or
Sham
WAS
a a a a
20 mmHg 40 mmHg 60 mmHg 80 mmHg
4
3
2
1
0
AWR s
core
Sham WAS
100
80
60
40
20
0
Pain
thr
esho
ld (
mm
Hg)
a
Sham WAS
120
90
60
30
0
Volu
me
thre
shol
d (m
mH
g)
a
Sham
WAS
a
20
15
10
5
0
-5
Incr
easi
ng r
ate
of b
ody
wei
ght
1 2 3 4 5 6 7 8 9 10 11t /d
A B
C D
Figure 1 Effect of water avoidance stress on rate of weight gain and visceral sensitivity. A: Rate of weight gain (g) was lower in the water avoidance stress (WAS) group (n = 13) compared to the sham-WAS (n = 14) group. Values represent mean weight gain ± SD, repeated analysis of variance (ANOVA); B: Abdominal withdrawal reflex (AWR) scores in response to colorectal distension were increased in the WAS group compared to the sham-WAS group. Lines within the box represent the median value, ends of the box represent 25th and 75th percentiles, and the error bars represent 5th and 95th percentiles. Wilcoxon two-sample test; C: Pain threshold was decreased in the WAS group compared to the sham-WAS group. Values represent mean ± SD, Student’s t-test; D: Volume threshold was decreased in the WAS group compared to the sham-WAS group. Values represent means values ± SD, Student’s t-test. aP < 0.05, Sham vs WAS.
Chen BR et al . Fructo-oligosaccharide in IBS mice
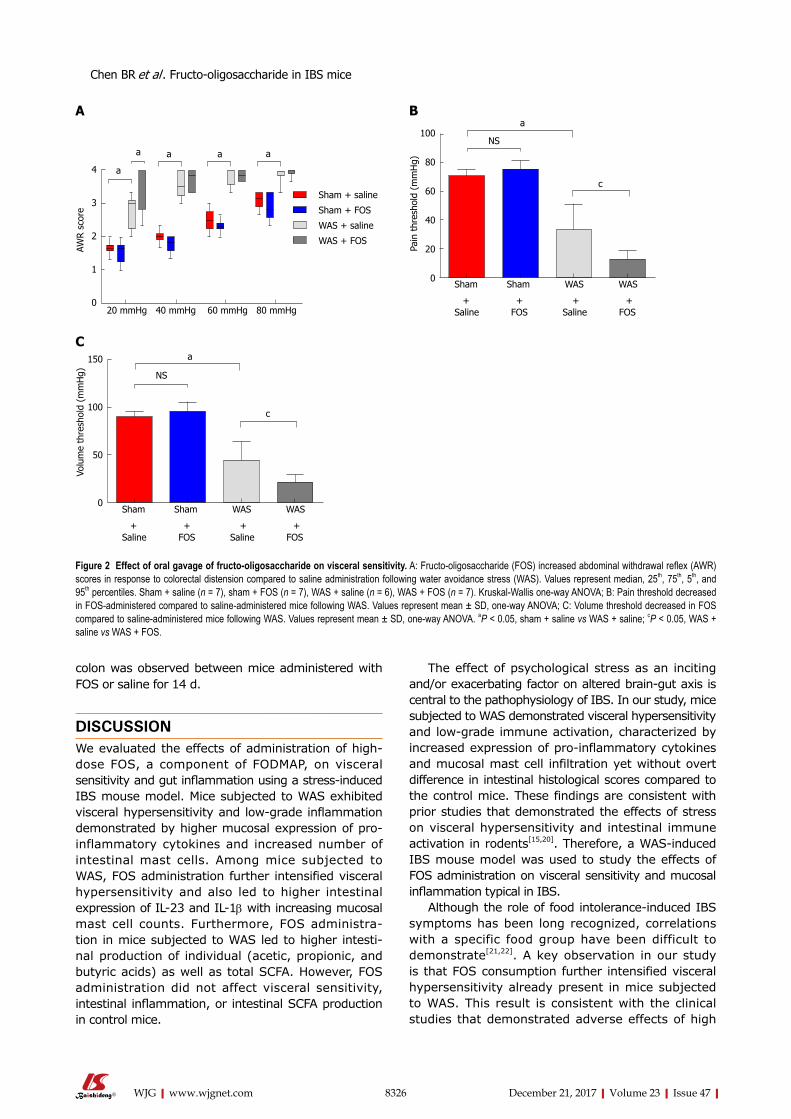
8326 December 21, 2017|Volume 23|Issue 47|WJG|www.wjgnet.com
colon was observed between mice administered with FOS or saline for 14 d.
DISCUSSIONWe evaluated the effects of administration of highdose FOS, a component of FODMAP, on visceral sensitivity and gut inflammation using a stress-induced IBS mouse model. Mice subjected to WAS exhibited visceral hypersensitivity and lowgrade inflammation demonstrated by higher mucosal expression of proinflammatory cytokines and increased number of intestinal mast cells. Among mice subjected to WAS, FOS administration further intensified visceral hypersensitivity and also led to higher intestinal expression of IL23 and IL1β with increasing mucosal mast cell counts. Furthermore, FOS administration in mice subjected to WAS led to higher intestinal production of individual (acetic, propionic, and butyric acids) as well as total SCFA. However, FOS administration did not affect visceral sensitivity, intestinal inflammation, or intestinal SCFA production in control mice.
The effect of psychological stress as an inciting and/or exacerbating factor on altered braingut axis is central to the pathophysiology of IBS. In our study, mice subjected to WAS demonstrated visceral hypersensitivity and lowgrade immune activation, characterized by increased expression of proinflammatory cytokines and mucosal mast cell infiltration yet without overt difference in intestinal histological scores compared to the control mice. These findings are consistent with prior studies that demonstrated the effects of stress on visceral hypersensitivity and intestinal immune activation in rodents[15,20]. Therefore, a WASinduced IBS mouse model was used to study the effects of FOS administration on visceral sensitivity and mucosal inflammation typical in IBS.
Although the role of food intoleranceinduced IBS symptoms has been long recognized, correlations with a specific food group have been difficult to demonstrate[21,22]. A key observation in our study is that FOS consumption further intensified visceral hypersensitivity already present in mice subjected to WAS. This result is consistent with the clinical studies that demonstrated adverse effects of high
Sham + saline
Sham + FOS
WAS + saline
WAS + FOS
20 mmHg 40 mmHg 60 mmHg 80 mmHg
4
3
2
1
0
AWR s
core
a
a a a a
Sham Sham WAS WAS
100
80
60
40
20
0
Pain
thr
esho
ld (
mm
Hg)
Saline FOS Saline FOS+ + + +
a
c
NS
Sham Sham WAS WAS
150
100
50
0
Volu
me
thre
shol
d (m
mH
g)
Saline FOS Saline FOS+ + + +
a
c
NS
A B
C
Figure 2 Effect of oral gavage of fructo-oligosaccharide on visceral sensitivity. A: Fructo-oligosaccharide (FOS) increased abdominal withdrawal reflex (AWR) scores in response to colorectal distension compared to saline administration following water avoidance stress (WAS). Values represent median, 25th, 75th, 5th, and 95th percentiles. Sham + saline (n = 7), sham + FOS (n = 7), WAS + saline (n = 6), WAS + FOS (n = 7). Kruskal-Wallis one-way ANOVA; B: Pain threshold decreased in FOS-administered compared to saline-administered mice following WAS. Values represent mean ± SD, one-way ANOVA; C: Volume threshold decreased in FOS compared to saline-administered mice following WAS. Values represent mean ± SD, one-way ANOVA. aP < 0.05, sham + saline vs WAS + saline; cP < 0.05, WAS + saline vs WAS + FOS.
Chen BR et al . Fructo-oligosaccharide in IBS mice
8327 December 21, 2017|Volume 23|Issue 47|WJG|www.wjgnet.com
FODMAP diet as an individual component or as an aggregate in exacerbating gastrointestinal symptoms in IBS[6,8,23,24]. Along the same vein, our findings are concordant with studies that demonstrated the efficacy of dietary restriction of FODMAP in improving gastrointestinal symptoms, such as abdominal pain, diarrhea, bloating, flatulence, and quality of life in IBS patients[7,9,25]. Interestingly, FOS had no effect on visceral sensitivity in mice exposed to shamWAS. Prior studies also demonstrated that high FODMAP dietinduced gastrointestinal symptoms in IBS patients but not in healthy volunteers except increased flatus[6,8]. Our findings highlight the direct effects of FODMAP on visceral hypersensitivity as a mechanism of FODMAPinduced IBS symptoms other than proposed mechanisms such as osmotic effects of poorly absorbed carbohydrates and increased colonic gas production from intestinal fermentation. A recent study indicated that hypersensitivity to colorectal distension, rather
than excessive gas fermented by FODMAP, was the primary factor contributing to IBS symptoms[26]. Our finding that FOS consumption increased visceral hypersensitivity in the IBS mouse model, but not in control mice, suggests that stressinduced visceral hyperalgesia is a prerequisite for FODMAPinduced visceral hypersensitivity. Similarly, anxiety was demonstrated to be a robust predictor of inducing abdominal symptoms after ingestion of lactose, another FODMAP component, in a previous study among patients with IBS[27].
SCFA are byproducts of FODMAP fermentation. For example, IBS patients on a low FODMAP diet have altered fecal fermentation producing lower levels of stool SCFA including acetic acid and butyric acid[2830]. Our study showed that highdose FOS administration increased production of individual (acetic, propionic, and butyric acids) and total SCFA, which was also associated with increased visceral hypersensitivity
Figure 3 Effect of oral gavage of fructo-oligosaccharide on intestinal histological scores. A: Ileal tissues stained with hematoxylin-eosin (HE) for evaluation of inflammation score (magnification, 200×); B: No difference in structural histology among the four groups; C: Colonic tissues stained with H&E for evaluation of inflammation score (magnification, 200×); D: No difference in structural histology among the four groups. Values represent median with 5 th and 95th percentiles; sham + saline (n = 7), sham + FOS (n = 7), WAS + saline (n = 6), WAS + FOS (n = 7); Kruskal-Wallis one-way ANOVA. FOS: Fructo-oligosaccharide; WAS: Water avoidance stress.
Chen BR et al . Fructo-oligosaccharide in IBS mice
Sham Sham WAS WAS
3
2
1
0
His
tolo
gy s
core
in il
eum
Saline FOS Saline FOS
+ + + +
Sham Sham WAS WAS
3
2
1
0
His
tolo
gy s
core
in c
olon
Saline FOS Saline FOS
+ + + +
Sham + saline Sham + FOS
WAS + saline WAS + FOS
A
CSham + saline Sham + FOS
WAS + saline WAS + FOS
B
D
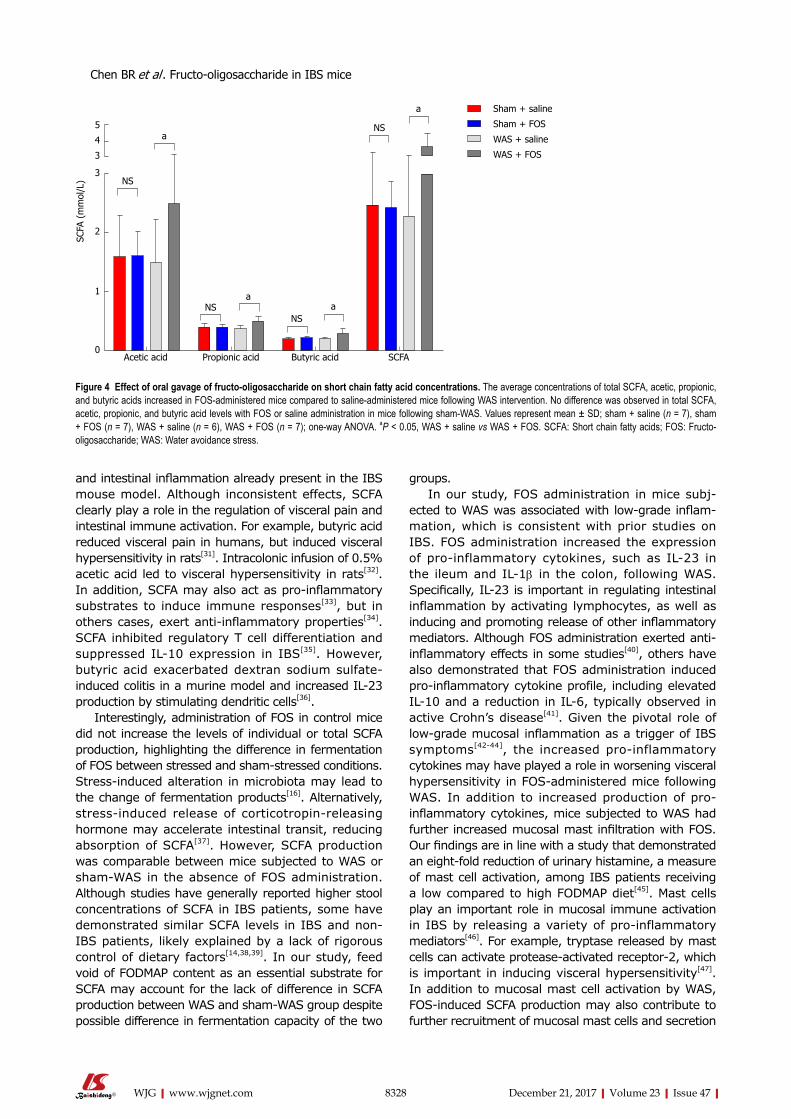
8328 December 21, 2017|Volume 23|Issue 47|WJG|www.wjgnet.com
and intestinal inflammation already present in the IBS mouse model. Although inconsistent effects, SCFA clearly play a role in the regulation of visceral pain and intestinal immune activation. For example, butyric acid reduced visceral pain in humans, but induced visceral hypersensitivity in rats[31]. Intracolonic infusion of 0.5% acetic acid led to visceral hypersensitivity in rats[32]. In addition, SCFA may also act as proinflammatory substrates to induce immune responses[33], but in others cases, exert antiinflammatory properties[34]. SCFA inhibited regulatory T cell differentiation and suppressed IL10 expression in IBS[35]. However, butyric acid exacerbated dextran sodium sulfateinduced colitis in a murine model and increased IL23 production by stimulating dendritic cells[36].
Interestingly, administration of FOS in control mice did not increase the levels of individual or total SCFA production, highlighting the difference in fermentation of FOS between stressed and shamstressed conditions. Stressinduced alteration in microbiota may lead to the change of fermentation products[16]. Alternatively, stressinduced release of corticotropinreleasing hormone may accelerate intestinal transit, reducing absorption of SCFA[37]. However, SCFA production was comparable between mice subjected to WAS or shamWAS in the absence of FOS administration. Although studies have generally reported higher stool concentrations of SCFA in IBS patients, some have demonstrated similar SCFA levels in IBS and nonIBS patients, likely explained by a lack of rigorous control of dietary factors[14,38,39]. In our study, feed void of FODMAP content as an essential substrate for SCFA may account for the lack of difference in SCFA production between WAS and shamWAS group despite possible difference in fermentation capacity of the two
groups. In our study, FOS administration in mice subj
ected to WAS was associated with low-grade inflam-mation, which is consistent with prior studies on IBS. FOS administration increased the expression of proinflammatory cytokines, such as IL23 in the ileum and IL1β in the colon, following WAS. Specifically, IL-23 is important in regulating intestinal inflammation by activating lymphocytes, as well as inducing and promoting release of other inflammatory mediators. Although FOS administration exerted antiinflammatory effects in some studies[40], others have also demonstrated that FOS administration induced proinflammatory cytokine profile, including elevated IL10 and a reduction in IL6, typically observed in active Crohn’s disease[41]. Given the pivotal role of lowgrade mucosal inflammation as a trigger of IBS symptoms[4244], the increased proinflammatory cytokines may have played a role in worsening visceral hypersensitivity in FOSadministered mice following WAS. In addition to increased production of proinflammatory cytokines, mice subjected to WAS had further increased mucosal mast infiltration with FOS. Our findings are in line with a study that demonstrated an eightfold reduction of urinary histamine, a measure of mast cell activation, among IBS patients receiving a low compared to high FODMAP diet[45]. Mast cells play an important role in mucosal immune activation in IBS by releasing a variety of proinflammatory mediators[46]. For example, tryptase released by mast cells can activate proteaseactivated receptor2, which is important in inducing visceral hypersensitivity[47]. In addition to mucosal mast cell activation by WAS, FOSinduced SCFA production may also contribute to further recruitment of mucosal mast cells and secretion
Sham + saline
Sham + FOS
WAS + saline
WAS + FOS
Acetic acid Propionic acid Butyric acid SCFA
5
4
3
3
2
1
0
SCFA
(m
mol
/L)
a
a
aa
NSNS
NS
NS
Figure 4 Effect of oral gavage of fructo-oligosaccharide on short chain fatty acid concentrations. The average concentrations of total SCFA, acetic, propionic, and butyric acids increased in FOS-administered mice compared to saline-administered mice following WAS intervention. No difference was observed in total SCFA, acetic, propionic, and butyric acid levels with FOS or saline administration in mice following sham-WAS. Values represent mean ± SD; sham + saline (n = 7), sham + FOS (n = 7), WAS + saline (n = 6), WAS + FOS (n = 7); one-way ANOVA. aP < 0.05, WAS + saline vs WAS + FOS. SCFA: Short chain fatty acids; FOS: Fructo-oligosaccharide; WAS: Water avoidance stress.
Chen BR et al . Fructo-oligosaccharide in IBS mice
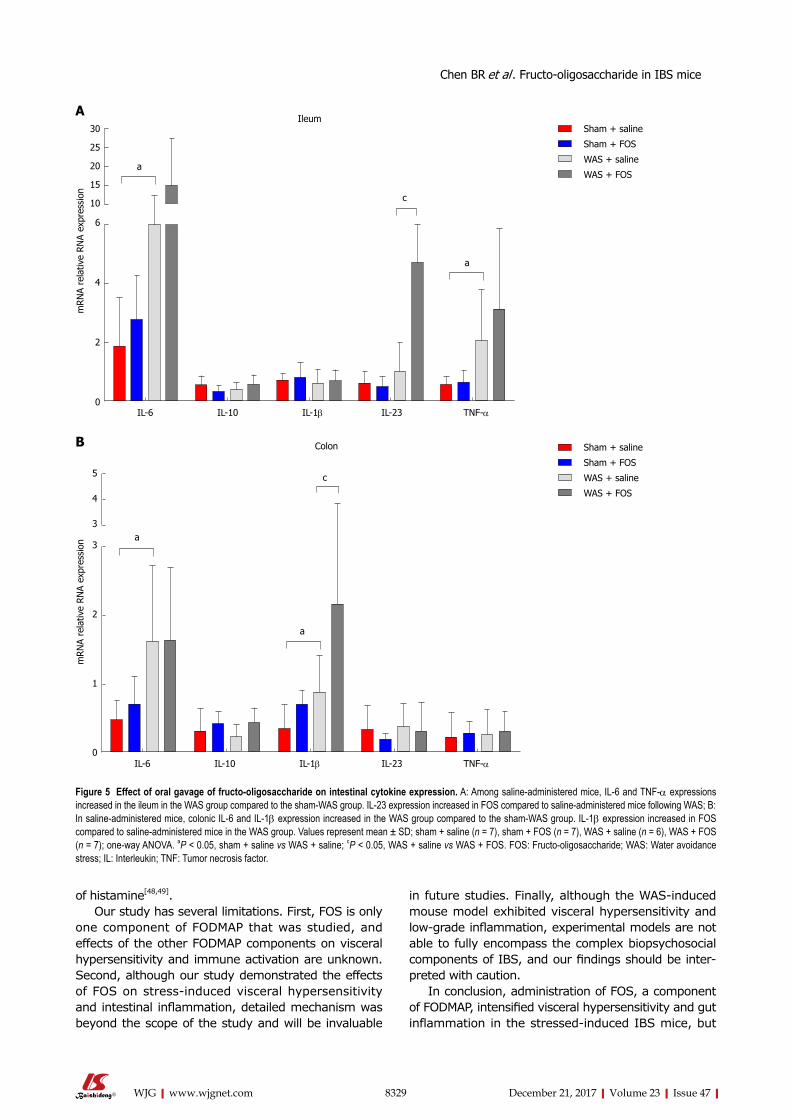
8329 December 21, 2017|Volume 23|Issue 47|WJG|www.wjgnet.com
of histamine[48,49]. Our study has several limitations. First, FOS is only
one component of FODMAP that was studied, and effects of the other FODMAP components on visceral hypersensitivity and immune activation are unknown. Second, although our study demonstrated the effects of FOS on stressinduced visceral hypersensitivity and intestinal inflammation, detailed mechanism was beyond the scope of the study and will be invaluable
in future studies. Finally, although the WASinduced mouse model exhibited visceral hypersensitivity and low-grade inflammation, experimental models are not able to fully encompass the complex biopsychosocial components of IBS, and our findings should be inter-preted with caution.
In conclusion, administration of FOS, a component of FODMAP, intensified visceral hypersensitivity and gut inflammation in the stressedinduced IBS mice, but
IL-6 IL-10 IL-1β IL-23 TNF-α
5
4
3
3
2
1
0
mRN
A re
lativ
e RN
A ex
pres
sion
c
a
a
Colon
IL-6 IL-10 IL-1β IL-23 TNF-α
30
25
20
15
10
6
4
2
0
mRN
A re
lativ
e RN
A ex
pres
sion
c
a
a
Sham + saline
Sham + FOS
WAS + saline
WAS + FOS
A
B Sham + saline
Sham + FOS
WAS + saline
WAS + FOS
Ileum
Figure 5 Effect of oral gavage of fructo-oligosaccharide on intestinal cytokine expression. A: Among saline-administered mice, IL-6 and TNF-α expressions increased in the ileum in the WAS group compared to the sham-WAS group. IL-23 expression increased in FOS compared to saline-administered mice following WAS; B: In saline-administered mice, colonic IL-6 and IL-1β expression increased in the WAS group compared to the sham-WAS group. IL-1β expression increased in FOS compared to saline-administered mice in the WAS group. Values represent mean ± SD; sham + saline (n = 7), sham + FOS (n = 7), WAS + saline (n = 6), WAS + FOS (n = 7); one-way ANOVA. aP < 0.05, sham + saline vs WAS + saline; cP < 0.05, WAS + saline vs WAS + FOS. FOS: Fructo-oligosaccharide; WAS: Water avoidance stress; IL: Interleukin; TNF: Tumor necrosis factor.
Chen BR et al . Fructo-oligosaccharide in IBS mice
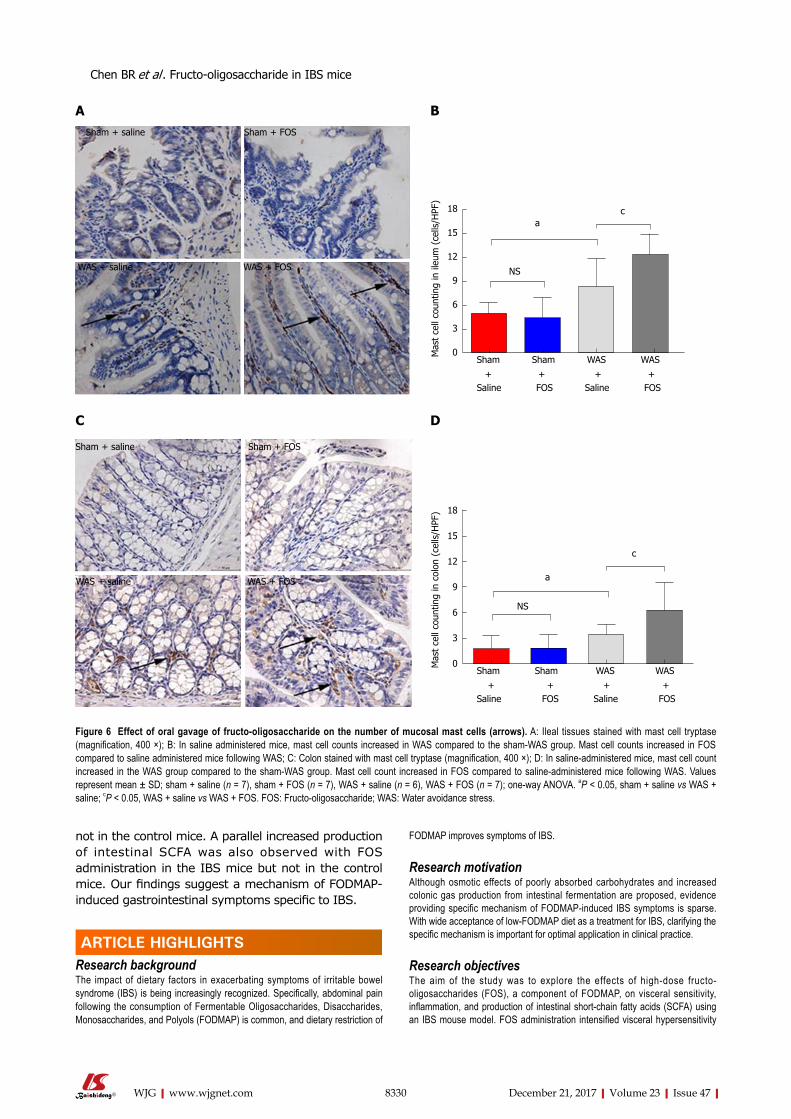
8330 December 21, 2017|Volume 23|Issue 47|WJG|www.wjgnet.com
not in the control mice. A parallel increased production of intestinal SCFA was also observed with FOS administration in the IBS mice but not in the control mice. Our findings suggest a mechanism of FODMAP-induced gastrointestinal symptoms specific to IBS.
ARTICLE HIGHLIGHTSResearch backgroundThe impact of dietary factors in exacerbating symptoms of irritable bowel syndrome (IBS) is being increasingly recognized. Specifically, abdominal pain following the consumption of Fermentable Oligosaccharides, Disaccharides, Monosaccharides, and Polyols (FODMAP) is common, and dietary restriction of
FODMAP improves symptoms of IBS.
Research motivationAlthough osmotic effects of poorly absorbed carbohydrates and increased colonic gas production from intestinal fermentation are proposed, evidence providing specific mechanism of FODMAP-induced IBS symptoms is sparse. With wide acceptance of low-FODMAP diet as a treatment for IBS, clarifying the specific mechanism is important for optimal application in clinical practice.
Research objectivesThe aim of the study was to explore the effects of high-dose fructo-oligosaccharides (FOS), a component of FODMAP, on visceral sensitivity, inflammation, and production of intestinal short-chain fatty acids (SCFA) using an IBS mouse model. FOS administration intensified visceral hypersensitivity
Sham Sham WAS WAS
18
15
12
9
6
3
0Mas
t ce
ll co
untin
g in
col
on (
cells
/HPF
)
Saline FOS Saline FOS+ + + +
a
c
NS
Sham + saline Sham + FOS
WAS + saline WAS + FOS
A
Sham Sham WAS WAS
18
15
12
9
6
3
0Mas
t ce
ll co
untin
g in
ileu
m (
cells
/HPF
)
Saline FOS Saline FOS+ + + +
ac
NS
B
Sham + saline Sham + FOS
WAS + saline WAS + FOS
C D
Figure 6 Effect of oral gavage of fructo-oligosaccharide on the number of mucosal mast cells (arrows). A: Ileal tissues stained with mast cell tryptase (magnification, 400 ×); B: In saline administered mice, mast cell counts increased in WAS compared to the sham-WAS group. Mast cell counts increased in FOS compared to saline administered mice following WAS; C: Colon stained with mast cell tryptase (magnification, 400 ×); D: In saline-administered mice, mast cell count increased in the WAS group compared to the sham-WAS group. Mast cell count increased in FOS compared to saline-administered mice following WAS. Values represent mean ± SD; sham + saline (n = 7), sham + FOS (n = 7), WAS + saline (n = 6), WAS + FOS (n = 7); one-way ANOVA. aP < 0.05, sham + saline vs WAS + saline; cP < 0.05, WAS + saline vs WAS + FOS. FOS: Fructo-oligosaccharide; WAS: Water avoidance stress.
ARTICLE HIGHLIGHTS
Chen BR et al . Fructo-oligosaccharide in IBS mice
8331 December 21, 2017|Volume 23|Issue 47|WJG|www.wjgnet.com
and gut inflammation already present in the stress-induced IBS mice, but not in the control mice, and was also associated with increased cecal SCFA production. The results provide a biologic framework for FODMAP-induced IBS symptoms that supports the application of low FODMAP therapy in clinical practice.
Research methodsThe effects of FOS on visceral sensitivity, SCFA production, and intestinal inflammation were examined by using a water avoidance stress (WAS)-induced IBS mouse model. Mice were randomly assigned to receive daily WAS or sham-WAS for 10 d while receiving daily oral gavage of saline solution with or without high-dose FOS. After 2 wk, visceral sensitivity was measured by abdominal withdrawal reflex in response to colorectal distension and mucosal inflammation was measured by histologic analyses. Furthermore, intestinal SCFA production, cytokine expression, and mast cell counts were evaluated.
Research resultsFOS administration intensified visceral hypersensitivity, increased mucosal mast cell counts, and mediated intestinal cytokine expression in the stressed-induced IBS mice, but not in the control mice. A parallel increase in cecal SCFA levels was also observed with FOS administration in the IBS mice but not in the control mice. These findings suggest that visceral hypersensitivity and gut inflammation intensified by FODMAP diet may lead to worsening IBS symptoms. Examining the effects of other FODMAP components other than FOS on visceral hypersensitivity and immune activation, as well as, detailed molecular mechanism may be invaluable in future studies.
Research conclusionsAdministration of high-dose FOS, a component of FODMAP, intensified visceral sensitivity and intestinal inflammation in a stress-induced IBS mouse model, and was also associated with increased production of SCFA. These findings suggest a mechanism of FODMAP-induced gastrointestinal symptoms specific to IBS and are consistent with clinical studies that demonstrate the efficacy of low-FODMAP diet in treatment of individuals with IBS.
Research perspectivesThe importance of dietary factors in triggering symptoms is increasingly being recognized in patients with IBS. FOS administration intensifies visceral hypersensitivity and gut inflammation in stress-induced IBS mice, and is also associated with increased intestinal SCFA production.
ACKNOWLEDGMENTSWe are grateful to Xin Wang, Ye-Shi Yin, Zheng-Peng Li, and JingGang Chen from Zhejiang Academy of Agricultural Sciences Institute for their guidance on the experiments. We would also like to thank Professor Yun-xian Yu from Zhejiang University for reviewing the statistical methods of this study.
REFERENCES1 Rodríguez-Fandiño O, Hernández-Ruiz J, Schmulson M. From
cytokines to toll-like receptors and beyond - current knowledge and future research needs in irritable bowel syndrome. J Neurogastroenterol Motil 2010; 16: 363-373 [PMID: 21103418 DOI: 10.5056/jnm.2010.16.4.363]
2 Lovell RM, Ford aC. Global prevalence of and risk factors for irritable bowel syndrome: a meta-analysis. Clin Gastroenterol Hepatol 2012; 10: 712-721.e4 [PMID: 22426087 DOI: 10.1016/j.cgh.2012.02.029]
3 Takahashi T, Nakade Y, Fukuda H, Tsukamoto K, Mantyh C, Pappas TN. Daily intake of high dietary fiber slows accelerated colonic transit induced by restrain stress in rats. Dig Dis Sci 2008; 53: 1271-1277 [PMID: 18335315 DOI: 10.1007/s10620-008-0228-8]
4 Jailwala J, Imperiale TF, Kroenke K. Pharmacologic treatment of the irritable bowel syndrome: a systematic review of randomized, controlled trials. Ann Intern Med 2000; 133: 136-147 [PMID: 10896640]
5 Tuck CJ, Muir JG, Barrett JS, Gibson PR. Fermentable oligo-saccharides, disaccharides, monosaccharides and polyols: role in irritable bowel syndrome. Expert Rev Gastroenterol Hepatol 2014; 8: 819-834 [PMID: 24830318 DOI: 10.1586/17474124.2014.917956]
6 Shepherd SJ, Parker FC, Muir JG, Gibson PR. Dietary triggers of abdominal symptoms in patients with irritable bowel syndrome: randomized placebo-controlled evidence. Clin Gastroenterol Hepatol 2008; 6: 765-771 [PMID: 18456565 DOI: 10.1016/j.cgh.2008.02.058]
7 Böhn L, Störsrud S, Liljebo T, Collin L, Lindfors P, Törnblom H, Simrén M. Diet low in FODMaPs reduces symptoms of irritable bowel syndrome as well as traditional dietary advice: a randomized controlled trial. Gastroenterology 2015; 149: 1399-1407.e2 [PMID: 26255043 DOI: 10.1053/j.gastro.2015.07.054]
8 Ong DK, Mitchell SB, Barrett JS, Shepherd SJ, Irving PM, Biesiekierski JR, Smith S, Gibson PR, Muir JG. Manipulation of dietary short chain carbohydrates alters the pattern of gas production and genesis of symptoms in irritable bowel syndrome. J Gastroenterol Hepatol 2010; 25: 1366-1373 [PMID: 20659225 DOI: 10.1111/j.1440-1746.2010.06370.x]
9 Halmos EP, Power Va, Shepherd SJ, Gibson PR, Muir JG. a diet low in FODMaPs reduces symptoms of irritable bowel syndrome. Gastroenterology 2014; 146: 67-75.e5 [PMID: 24076059 DOI: 10.1053/j.gastro.2013.09.046]
10 Barrett JS, Gearry RB, Muir JG, Irving PM, Rose R, Rosella O, Haines ML, Shepherd SJ, Gibson PR. Dietary poorly absorbed, short-chain carbohydrates increase delivery of water and fermentable substrates to the proximal colon. Aliment Pharmacol Ther 2010; 31: 874-882 [PMID: 20102355 DOI: 10.1111/j.1365-2036.2010.04237.x]
11 Staudacher HM, Whelan K. The low FODMaP diet: recent advances in understanding its mechanisms and efficacy in IBS. Gut 2017; 66: 1517-1527 [PMID: 28592442 DOI: 10.1136/gutjnl-2017-313750]
12 Salvioli B, Serra J, azpiroz F, Malagelada JR. Impaired small bowel gas propulsion in patients with bloating during intestinal lipid infusion. Am J Gastroenterol 2006; 101: 1853-1857 [PMID: 16817837 DOI: 10.1111/j.1572-0241.2006.00702.x]
13 Serra J, Villoria a, azpiroz F, Lobo B, Santos J, accarino a, Malagelada JR. Impaired intestinal gas propulsion in manometrically proven dysmotility and in irritable bowel syndrome. Neurogastroenterol Motil 2010; 22: 401-406, e91-e92 [PMID: 20047636 DOI: 10.1111/j.1365-2982.2009.01447.x]
14 Tana C, Umesaki Y, Imaoka a, Handa T, Kanazawa M, Fukudo S. altered profiles of intestinal microbiota and organic acids may be the origin of symptoms in irritable bowel syndrome. Neurogastroenterol Motil 2010; 22: 512-519, e114-e115 [PMID: 19903265 DOI: 10.1111/j.1365-2982.2009.01427.x]
15 Bradesi S, Schwetz I, Ennes HS, Lamy CM, Ohning G, Fanselow M, Pothoulakis C, McRoberts Ja, Mayer Ea. Repeated exposure to water avoidance stress in rats: a new model for sustained visceral hyperalgesia. Am J Physiol Gastrointest Liver Physiol 2005; 289: G42-G53 [PMID: 15746211 DOI: 10.1152/ajpgi.00500.2004]
16 Sun Y, Zhang M, Chen CC, Gillilland M 3rd, Sun X, El-Zaatari M, Huffnagle GB, Young VB, Zhang J, Hong SC, Chang YM, Gumucio DL, Owyang C, Kao JY. Stress-induced corticotropin-releasing hormone-mediated NLRP6 inflammasome inhibition and transmissible enteritis in mice. Gastroenterology 2013; 144: 1478-1487, 1487.e1-1487.e8 [PMID: 23470617 DOI: 10.1053/j.gastro.2013.02.038]
17 Jones RC 3rd, Otsuka E, Wagstrom E, Jensen CS, Price MP, Gebhart GF. Short-term sensitization of colon mechanoreceptors is associated with long-term hypersensitivity to colon distention in the mouse. Gastroenterology 2007; 133: 184-194 [PMID: 17553498 DOI: 10.1053/j.gastro.2007.04.042]
18 Al-Chaer ED, Kawasaki M, Pasricha PJ. a new model of chronic
Chen BR et al . Fructo-oligosaccharide in IBS mice
8332 December 21, 2017|Volume 23|Issue 47|WJG|www.wjgnet.com
visceral hypersensitivity in adult rats induced by colon irritation during postnatal development. Gastroenterology 2000; 119: 1276-1285 [DOI: 10.1053/gast.2000.19576]
19 Bai S, Chen H, Zhu L, Liu W, Yu HD, Wang X, Yin Y. Comparative study on the in vitro effects of Pseudomonas aeruginosa and seaweed alginates on human gut microbiota. PLoS One 2017; 12: e0171576 [PMID: 28170428 DOI: 10.1371/journal.pone.0171576]
20 Xu D, Gao J, Gillilland M 3rd, Wu X, Song I, Kao JY, Owyang C. Rifaximin alters intestinal bacteria and prevents stress-induced gut inflammation and visceral hyperalgesia in rats. Gastroenterology 2014; 146: 484-96.e4 [PMID: 24161699 DOI: 10.1053/j.gastro.2013.10.026]
21 Soares RL, Figueiredo HN, Santos JM, Oliveira RF, Godoy RL, Mendonca Fa. Discrepancies between the responses to skin prick test to food and respiratory antigens in two subtypes of patients with irritable bowel syndrome. World J Gastroenterol 2008; 14: 3044-3048 [PMID: 18494056 DOI: 10.3748/wjg.14.3044]
22 Soares RL, Figueiredo HN, Maneschy CP, Rocha VR, Santos JM. Correlation between symptoms of the irritable bowel syndrome and the response to the food extract skin prick test. Braz J Med Biol Res 2004; 37: 659-662 [PMID: 15107926]
23 Evans PR, Piesse C, Bak YT, Kellow JE. Fructose-sorbitol malabsorption and symptom provocation in irritable bowel syndrome: relationship to enteric hypersensitivity and dysmotility. Scand J Gastroenterol 1998; 33: 1158-1163 [PMID: 9867093]
24 Goldstein R, Braverman D, Stankiewicz H. Carbohydrate malabsorption and the effect of dietary restriction on symptoms of irritable bowel syndrome and functional bowel complaints. Isr Med Assoc J 2000; 2: 583-587 [PMID: 10979349]
25 Eswaran SL, Chey WD, Han-Markey T, Ball S, Jackson K. a Randomized Controlled Trial Comparing the Low FODMaP Diet vs. Modified NICE Guidelines in US Adults with IBS-D. Am J Gastroenterol 2016; 111: 1824-1832 [PMID: 27725652 DOI: 10.1038/ajg.2016.434]
26 Major G, Pritchard S, Murray K, alappadan JP, Hoad CL, Marciani L, Gowland P, Spiller R. Colon Hypersensitivity to Distension, Rather Than Excessive Gas Production, Produces Carbohydrate-Related Symptoms in Individuals With Irritable Bowel Syndrome. Gastroenterology 2017; 152: 124-133.e2 [PMID: 27746233 DOI: 10.1053/j.gastro.2016.09.062]
27 Yang J, Fox M, Cong Y, Chu H, Zheng X, Long Y, Fried M, Dai N. Lactose intolerance in irritable bowel syndrome patients with diarrhoea: the roles of anxiety, activation of the innate mucosal immune system and visceral sensitivity. Aliment Pharmacol Ther 2014; 39: 302-311 [PMID: 24308871 DOI: 10.1111/apt.12582]
28 Hustoft TN, Hausken T, Ystad SO, Valeur J, Brokstad K, Hatlebakk JG, Lied Ga. Effects of varying dietary content of fermentable short-chain carbohydrates on symptoms, fecal microenvironment, and cytokine profiles in patients with irritable bowel syndrome. Neurogastroenterol Motil 2017; 29 [PMID: 27747984 DOI: 10.1111/nmo.12969]
29 Staudacher H, Lomer MC, Lindsay JO, Irving PM, Whelan K. The impact of low FODMaP dietary advice and probiotics on symptoms in irritable bowel syndrome: a randomised, placebo-controlled, 2 × 2 factorial trial. Gut 2015; 64: a51
30 Valeur J, Røseth aG, Knudsen T, Malmstrøm GH, Fiennes JT, Midtvedt T, Berstad a. Fecal Fermentation in Irritable Bowel Syndrome: Influence of Dietary Restriction of Fermentable Oligosaccharides, Disaccharides, Monosaccharides and Polyols. Digestion 2016; 94: 50-56 [PMID: 27487397 DOI: 10.1159/000448280]
31 Kannampalli P, Shaker R, Sengupta JN. Colonic butyrate- algesic or analgesic? Neurogastroenterol Motil 2011; 23: 975-979 [PMID: 21981302 DOI: 10.1111/j.1365-2982.2011.01775.x]
32 Winston J, Shenoy M, Medley D, Naniwadekar a, Pasricha PJ. The vanilloid receptor initiates and maintains colonic hypersensitivity induced by neonatal colon irritation in rats. Gastroenterology 2007; 132: 615-627 [PMID: 17258716 DOI: 10.1053/j.gastro.2006.11.014]
33 Kim MH, Kang SG, Park JH, Yanagisawa M, Kim CH. Short-
chain fatty acids activate GPR41 and GPR43 on intestinal epithelial cells to promote inflammatory responses in mice. Gastroenterology 2013; 145: 396-406.e1-10 [PMID: 23665276 DOI: 10.1053/j.gastro.2013.04.056]
34 Singh N, Gurav a, Sivaprakasam S, Brady E, Padia R, Shi H, Thangaraju M, Prasad PD, Manicassamy S, Munn DH, Lee JR, Offermanns S, Ganapathy V. activation of Gpr109a, receptor for niacin and the commensal metabolite butyrate, suppresses colonic inflammation and carcinogenesis. Immunity 2014; 40: 128-139 [PMID: 24412617 DOI: 10.1016/j.immuni.2013.12.007]
35 Xu WL, Lu G, Liang SJ, Wu XL, Pei LX, Geng H, Ning HX, Sun JH. Short chain fatty acids mediated flora-host interaction and irritable bowel syndrome. Shijie Huaren Xiaohua Zazhi 2015; 23: 5815 [DOI: 10.11569/wcjd.v23.i36.5815]
36 Berndt BE, Zhang M, Owyang SY, Cole TS, Wang TW, Luther J, Veniaminova Na, Merchant JL, Chen CC, Huffnagle GB, Kao JY. Butyrate increases IL-23 production by stimulated dendritic cells. Am J Physiol Gastrointest Liver Physiol 2012; 303: G1384-G1392 [PMID: 23086919 DOI: 10.1152/ajpgi.00540.2011]
37 Murray KA, Lam C, Rehman S, Marciani L, Costigan C, Hoad CL, Lingaya MR, Banwait R, Bawden SJ, Gowland Pa, Spiller RC. Corticotropin-releasing factor increases ascending colon volume after a fructose test meal in healthy humans: a randomized controlled trial. Am J Clin Nutr 2016; 103: 1318-1326 [PMID: 27099247 DOI: 10.3945/ajcn.115.125047]
38 Ringel-Kulka T, Choi CH, Temas D, Kim a, Maier DM, Scott K, Galanko Ja, Ringel Y. altered Colonic Bacterial Fermentation as a Potential Pathophysiological Factor in Irritable Bowel Syndrome. Am J Gastroenterol 2015; 110: 1339-1346 [PMID: 26303129 DOI: 10.1038/ajg.2015.220]
39 Farup PG, Rudi K, Hestad K. Faecal short-chain fatty acids - a diagnostic biomarker for irritable bowel syndrome? BMC Gastroenterol 2016; 16: 51 [PMID: 27121286 DOI: 10.1186/s12876-016-0446-z]
40 Lindsay JO, Whelan K, Stagg aJ, Gobin P, al-Hassi HO, Rayment N, Kamm Ma, Knight SC, Forbes a. Clinical, microbiological, and immunological effects of fructo-oligosaccharide in patients with Crohn’s disease. Gut 2006; 55: 348-355 [PMID: 16162680 DOI: 10.1136/gut.2005.074971]
41 Benjamin JL, Hedin CR, Koutsoumpas a, Ng SC, McCarthy NE, Hart aL, Kamm Ma, Sanderson JD, Knight SC, Forbes a, Stagg aJ, Whelan K, Lindsay JO. Randomised, double-blind, placebo-controlled trial of fructo-oligosaccharides in active Crohn’s disease. Gut 2011; 60: 923-929 [PMID: 21262918 DOI: 10.1136/gut.2010.232025]
42 Vázquez-Frias R , Gutiérrez-Reyes G, Urbán-Reyes M, Velázquez-Guadarrama N, Fortoul-van der Goes TI, Reyes-López A, Consuelo-Sánchez A. Proinflammatory and anti-inflammatory cytokine profile in pediatric patients with irritable bowel syndrome. Rev Gastroenterol Mex 2015; 80: 6-12 [PMID: 25697785 DOI: 10.1016/j.rgmx.2014.11.001]
43 Liebregts T, adam B, Bredack C, Röth a, Heinzel S, Lester S, Downie-Doyle S, Smith E, Drew P, Talley NJ, Holtmann G. Immune activation in patients with irritable bowel syndrome. Gastroenterology 2007; 132: 913-920 [PMID: 17383420 DOI: 10.1053/j.gastro.2007.01.046]
44 Ohman L, Isaksson S, Lindmark aC, Posserud I, Stotzer PO, Strid H, Sjövall H, Simrén M. T-cell activation in patients with irritable bowel syndrome. Am J Gastroenterol 2009; 104: 1205-1212 [PMID: 19367268 DOI: 10.1038/ajg.2009.116]
45 McIntosh K, Reed DE, Schneider T, Dang F, Keshteli aH, De Palma G, Madsen K, Bercik P, Vanner S. FODMaPs alter symptoms and the metabolome of patients with IBS: a randomised controlled trial. Gut 2017; 66: 1241-1251 [PMID: 26976734 DOI: 10.1136/gutjnl-2015-311339]
46 Lee KN, Lee OY. The Role of Mast Cells in Irritable Bowel Syndrome. Gastroenterol Res Pract 2016; 2016: 2031480 [PMID: 28115927 DOI: 10.1155/2016/2031480]
47 Coelho AM, Vergnolle N, Guiard B, Fioramonti J, Bueno L. Proteinases and proteinase-activated receptor 2: a possible role to
Chen BR et al . Fructo-oligosaccharide in IBS mice
8333 December 21, 2017|Volume 23|Issue 47|WJG|www.wjgnet.com
promote visceral hyperalgesia in rats. Gastroenterology 2002; 122: 1035-1047 [PMID: 11910355]
48 Yamada K, Mori M, Matsuo N, Shoji K, Ueyama T, Sugano M. Effects of fatty acids on accumulation and secretion of histamine in RBL-2H3 cells and leukotriene release from peritoneal exudate cells isolated from Wistar rats. J Nutr Sci Vitaminol (Tokyo) 1996;
42: 301-311 [PMID: 8906631]49 Karaki S, Mitsui R, Hayashi H, Kato I, Sugiya H, Iwanaga T,
Furness JB, Kuwahara a. Short-chain fatty acid receptor, GPR43, is expressed by enteroendocrine cells and mucosal mast cells in rat intestine. Cell Tissue Res 2006; 324: 353-360 [PMID: 16453106 DOI: 10.1007/s00441-005-0140-x]
P- Reviewer: Chiba T, Soares RLS S- Editor: Ma YJ L- Editor: Wang TQ E- Editor: Huang Y
Chen BR et al . Fructo-oligosaccharide in IBS mice
Liang Sang, Xue-Mei Wang, Dong-Yang Xu, Department of Ultrasound, The First Hospital of China Medical University, Shenyang 110001, Liaoning Province, China
Li-Xuan Sang, Department of Geriatrics, The First Hospital of China Medical University, Shenyang 110001, Liaoning Province, China
Yang Han, Department of Pathology, China Medical University, Shenyang 110001, Liaoning Province, China
Long-Yang Jiang, Pharmacy College, China Medical University, Shenyang 110001, Liaoning Province, China
ORCID number: Liang Sang (0000-0002-9331-0985); Xue-Mei Wang (0000-0002-4477-1865); Dong-Yang Xu (0000-0001-8317 -1718); Li-Xuan Sang (0000-0002-4562-0022); Yang Han (0000 -0003-4133-6929); Long-Yang Jiang (0000-0002-8409-7043).
Author contributions: Sang L, Wang XM and Sang LX con-ceived and designed the experiments; Sang L, Han Y and Jiang LY performed the experiments; Sang L and Xu DY analyzed the data; Sang L wrote the paper; all authors agreed and approved the final version of the manuscript.
Institutional animal care and use committee statement: This study was performed in accordance with the Guide for Care and Use of Laboratory Animals published by the National Institutes of Health of China (1996), and was approved by Animal Care and Use Committee of the China Medical University (2015038R).
Conflict-of-interest statement: The authors declare no conflict of interest.
Data sharing statement: No additional data are available.
Open-Access: This article is an open-access article which was selected by an in-house editor and fully peer-reviewed by external reviewers. It is distributed in accordance with the Creative Commons Attribution Non Commercial (CC BY-NC 4.0) license, which permits others to distribute, remix, adapt, build upon this work non-commercially, and license their derivative works on different terms, provided the original work is properly cited and
the use is non-commercial. See: http://creativecommons.org/licenses/by-nc/4.0/
Manuscript source: Unsolicited manuscript
Correspondence to: Xue-Mei Wang, MD, Professor, De-partment of Ultrasound, The First Hospital of China Medical University, No. 155, Nanjing North Street, Shenyang 110001, Liaoning Province, China. [email protected]: +86-24-83282998Fax: +86-24-83282998
Received: September 21, 2017Peer-review started: September 22, 2017First decision: October 10, 2017Revised: October 20, 2017Accepted: November 14, 2017 Article in press: November 14, 2017Published online: December 21, 2017
AbstractAIMTo investigate whether morin can reduce hepatic fi-brosis by activating the NF-E2-related factor 2 (Nrf2) signaling pathway.
METHODSTwenty male Sprague-Dawley rats were randomly divided into four groups: control group, morin group, carbon tetrachloride (CCl4) group, and morin + CCl4 group. Rats in both the CCl4 and morin + CCl4 groups were injected intraperitoneally with CCl4 at a dose of 2 mL/kg twice a week. Rats in both the morin and morin + CCl4 groups were treated orally with morin at a dose of 50 mg/kg twice a week. Control rats were treated with vehicle only twice a week. At the end-point of the 8 wk of the experimental period, serum AST, ALT, and ALP were measured, and the liver specimens
8334 December 21, 2017|Volume 23|Issue 47|WJG|www.wjgnet.com
ORIGINAL ARTICLE
Morin enhances hepatic Nrf2 expression in a liver fibrosis rat model
Basic Study
Liang Sang, Xue-Mei Wang, Dong-Yang Xu, Li-Xuan Sang, Yang Han, Long-Yang Jiang
Submit a Manuscript: http://www.f6publishing.com
DOI: 10.3748/wjg.v23.i47.8334
World J Gastroenterol 2017 December 21; 23(47): 8334-8344
ISSN 1007-9327 (print) ISSN 2219-2840 (online)
were obtained for pathological assessment. Real-time PCR and Western blot methods were used to analyze the expression of α-smooth muscle actin (α-SMA), collagen Ⅰ, collagen Ⅲ, Nrf2, heme oxygenase (HO-1), and quinone oxidoreductase 1 (NQO1) using frozen liver specimens.
RESULTSMorin-treated rats in the morin + CCl4 group had less hyperplasia of fiber tissue, minimal inflammatory cells, and less body weight loss with favorable liver enzyme measurements compared to rats treated with CCl4 only. Additionally, morin-treated rats had significantly lower mRNA and protein expression of α-SMA, collagen Ⅰ, and collagen Ⅲ, but significantly higher mRNA and protein expression of Nrf2, HO-1, and NQO1 compared to rats treated with CCl4 only (P < 0.05).
CONCLUSIONMorin could play a protective role by inducing the expression of Nrf2 and its downstream antioxidant factors (HO-1 and NQO1) and reducing the expression of α-SMA, collagen Ⅰ, and collagen Ⅲ in CCl4-induced liver fibrosis rats.
Key words: Liver fibrosis; Rat; Morin; Nrf2
© The Author(s) 2017. Published by Baishideng Publishing Group Inc. All rights reserved.
Core tip: We constructed a liver fibrosis rat model with carbon tetrachloride (CCl4). The Sprague-Dawley rats were randomly divided into four groups: control group, morin group, CCl4 group, and morin + CCl4 group. α-SMA, collagen Ⅰ, collagen Ⅲ, NF-E2-related factor 2 (Nrf2), heme oxygenase (HO-1), and quinone oxidoreductase 1 (NQO1) were analyzed by real-time PCR and Western blot methods using frozen liver specimens. We found that morin could reduce hepatic fibrosis by inducing the expression of Nrf2 and its downstream antioxidant factors in the CCl4-induced rat liver fibrosis model.
Sang L, Wang XM, Xu DY, Sang LX, Han Y, Jiang LY. Morin enhances hepatic Nrf2 expression in a liver fibrosis rat model. World J Gastroenterol 2017; 23(47): 8334-8344 Available from: URL: http://www.wjgnet.com/1007-9327/full/v23/i47/8334.htm DOI: http://dx.doi.org/10.3748/wjg.v23.i47.8334
INTRODUCTIONHepatic fibrosis refers to a series of pathogenic factors and pathological changes in the pathogenesis of a variety of liver diseases with liver extracellular matrix (ECM) metabolic abnormalities[1]. Previous studies have found that the development and progression of liver fibrosis are significantly related to oxidative
stress in which a large number of free radicals lead to cell metabolic disorders and subsequent destruction of normal liver cells[2-5]. Although there is currently no effective therapy for curing liver fibrosis, previous studies showed that the pathological changes in liver fibrosis could be reversed[6,7].
Oxidative stress is closely related to the occurrence of liver disease[8]. A large number of studies have shown that oxidative stress may promote the activation of hepatic satellate cells (HSCs) and increase collagen production[9]. In the past decade, numerous studies proved that NFE2related factor 2 (Nrf2) plays a role as an important transcription factor in normal liver cells, and its activation could increase the expression of the downstream specific genes, such as the quinone oxidoreductase 1 (NQO1), heme oxygenase (HO1), and glutathione, which play a role against oxidative stress[10,11]. Studies have shown that Nrf2 activation could resist oxidative stress caused by hepatic ischemia and injury, liver fibrosis, and druginduced liver damage[12-15].
Flavonoids are rich in a variety of fruits, vegetables, and components of herbalcontaining dietary agents and play an important role in preventing many kinds of diseases. Morin (3, 5, 7, 2’, 4’pentahydroxyflavone) is a kind of flavonoid that consists of a yellowish pigment found in onion and apple[16], almond (P. guajava L.)[17], fig (Chlorophora tinctoria)[18], and other moraceae, including in food and herbal medicines[19] (Figure 1). It has been shown that morin possesses biological properties, including antioxidant[20,21], antiinflammatory[22], antiapoptosis[23,24], and anticancer[19] activities. Morin also protects various human cells, such as myoblasts[25], hepatocytes[26], and erythrocytes, against oxidative damages[27].
Carbon tetrachloride (CCl4) intraperitoneal injection is a classical method for establishing an animal model of hepatic fibrosis, and the toxicity of CCl4 leads to liver cell necrosis and mitochondrial damage along with aggravating oxidative stress. In addition, the abundant release of inflammatory and fibrogenic cytokines induced by CCl4 could further augment the degree of hepatic fibrosis[28]. A previous study demonstrated that morin protected against acute liver damage[29] and ameliorated liver fibrosis[20] induced by CCl4, where morin inhibited proliferation and induced apoptosis of activated HSCs by suppressing the Wnt/βcatenin and NFkB signaling pathways. However, there is no molecular evidence of the effects of morin on the Nrf2 signaling pathway. To our knowledge, in vivo investigation of the effect of morin on the Nrf2 signaling pathway and Nrf2 expression in the CCl4-induced liver fibrosis model has not been reported. The purpose of this study was to investigate whether morin could reduce hepatic fibrosis by inducing the expression of Nrf2 and its downstream antioxidant enzymes using pathology as a gold standard in a rat
8335 December 21, 2017|Volume 23|Issue 47|WJG|www.wjgnet.com
Sang L et al . Morin enhances hepatic Nrf2 expression
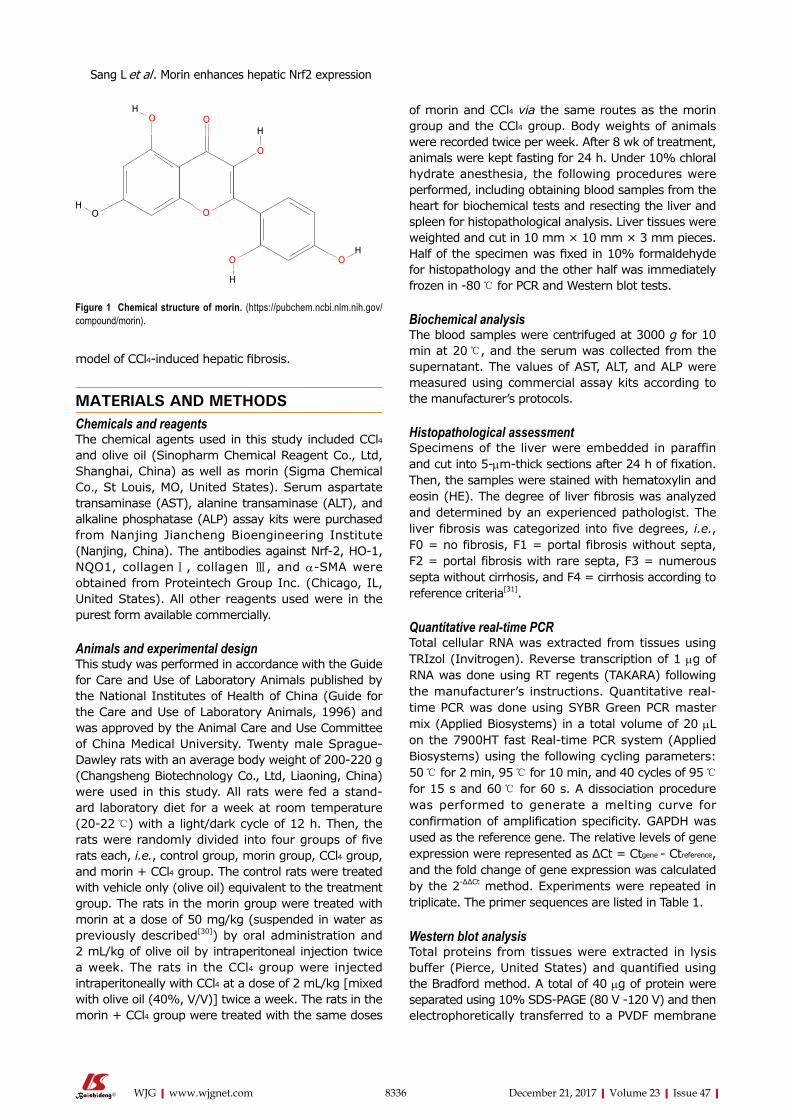
model of CCl4induced hepatic fibrosis.
MATERIALS AND METHODSChemicals and reagentsThe chemical agents used in this study included CCl4 and olive oil (Sinopharm Chemical Reagent Co., Ltd, Shanghai, China) as well as morin (Sigma Chemical Co., St Louis, MO, United States). Serum aspartate transaminase (AST), alanine transaminase (ALT), and alkaline phosphatase (ALP) assay kits were purchased from Nanjing Jiancheng Bioengineering Institute (Nanjing, China). The antibodies against Nrf2, HO1, NQO1, collagen Ⅰ, collagen Ⅲ, and αSMA were obtained from Proteintech Group Inc. (Chicago, IL, United States). All other reagents used were in the purest form available commercially.
Animals and experimental designThis study was performed in accordance with the Guide for Care and Use of Laboratory Animals published by the National Institutes of Health of China (Guide for the Care and Use of Laboratory Animals, 1996) and was approved by the Animal Care and Use Committee of China Medical University. Twenty male SpragueDawley rats with an average body weight of 200220 g (Changsheng Biotechnology Co., Ltd, Liaoning, China) were used in this study. All rats were fed a standard laboratory diet for a week at room temperature (20-22 ℃) with a light/dark cycle of 12 h. Then, the rats were randomly divided into four groups of five rats each, i.e., control group, morin group, CCl4 group, and morin + CCl4 group. The control rats were treated with vehicle only (olive oil) equivalent to the treatment group. The rats in the morin group were treated with morin at a dose of 50 mg/kg (suspended in water as previously described[30]) by oral administration and 2 mL/kg of olive oil by intraperitoneal injection twice a week. The rats in the CCl4 group were injected intraperitoneally with CCl4 at a dose of 2 mL/kg [mixed with olive oil (40%, V/V)] twice a week. The rats in the morin + CCl4 group were treated with the same doses
of morin and CCl4 via the same routes as the morin group and the CCl4 group. Body weights of animals were recorded twice per week. After 8 wk of treatment, animals were kept fasting for 24 h. Under 10% chloral hydrate anesthesia, the following procedures were performed, including obtaining blood samples from the heart for biochemical tests and resecting the liver and spleen for histopathological analysis. Liver tissues were weighted and cut in 10 mm × 10 mm × 3 mm pieces. Half of the specimen was fixed in 10% formaldehyde for histopathology and the other half was immediately frozen in 80 ℃ for PCR and Western blot tests.
Biochemical analysisThe blood samples were centrifuged at 3000 g for 10 min at 20 ℃, and the serum was collected from the supernatant. The values of AST, ALT, and ALP were measured using commercial assay kits according to the manufacturer’s protocols.
Histopathological assessmentSpecimens of the liver were embedded in paraffin and cut into 5µmthick sections after 24 h of fixation. Then, the samples were stained with hematoxylin and eosin (HE). The degree of liver fibrosis was analyzed and determined by an experienced pathologist. The liver fibrosis was categorized into five degrees, i.e., F0 = no fibrosis, F1 = portal fibrosis without septa, F2 = portal fibrosis with rare septa, F3 = numerous septa without cirrhosis, and F4 = cirrhosis according to reference criteria[31].
Quantitative real-time PCRTotal cellular RNA was extracted from tissues using TRIzol (Invitrogen). Reverse transcription of 1 µg of RNA was done using RT regents (TAKARA) following the manufacturer’s instructions. Quantitative realtime PCR was done using SYBR Green PCR master mix (Applied Biosystems) in a total volume of 20 µL on the 7900HT fast Realtime PCR system (Applied Biosystems) using the following cycling parameters: 50 ℃ for 2 min, 95 ℃ for 10 min, and 40 cycles of 95 ℃ for 15 s and 60 ℃ for 60 s. A dissociation procedure was performed to generate a melting curve for confirmation of amplification specificity. GAPDH was used as the reference gene. The relative levels of gene expression were represented as ΔCt = Ctgene - Ctreference, and the fold change of gene expression was calculated by the 2ΔΔCt method. Experiments were repeated in triplicate. The primer sequences are listed in Table 1.
Western blot analysisTotal proteins from tissues were extracted in lysis buffer (Pierce, United States) and quantified using the Bradford method. A total of 40 µg of protein were separated using 10% SDSPAGE (80 V 120 V) and then electrophoretically transferred to a PVDF membrane
8336 December 21, 2017|Volume 23|Issue 47|WJG|www.wjgnet.com
HO O
O
OO
O O
H
H
H
H
Figure 1 Chemical structure of morin. (https://pubchem.ncbi.nlm.nih.gov/compound/morin).
Sang L et al . Morin enhances hepatic Nrf2 expression
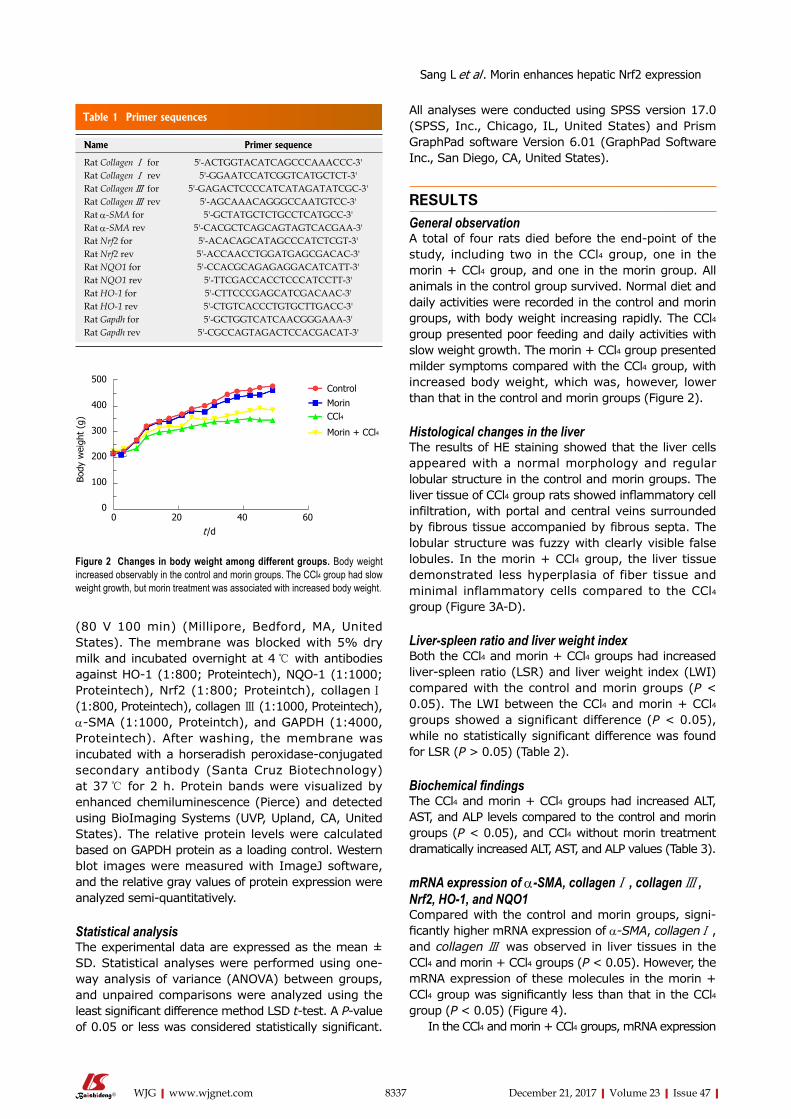
8337 December 21, 2017|Volume 23|Issue 47|WJG|www.wjgnet.com
All analyses were conducted using SPSS version 17.0 (SPSS, Inc., Chicago, IL, United States) and Prism GraphPad software Version 6.01 (GraphPad Software Inc., San Diego, CA, United States).
RESULTSGeneral observationA total of four rats died before the endpoint of the study, including two in the CCl4 group, one in the morin + CCl4 group, and one in the morin group. All animals in the control group survived. Normal diet and daily activities were recorded in the control and morin groups, with body weight increasing rapidly. The CCl4 group presented poor feeding and daily activities with slow weight growth. The morin + CCl4 group presented milder symptoms compared with the CCl4 group, with increased body weight, which was, however, lower than that in the control and morin groups (Figure 2).
Histological changes in the liverThe results of HE staining showed that the liver cells appeared with a normal morphology and regular lobular structure in the control and morin groups. The liver tissue of CCl4 group rats showed inflammatory cell infiltration, with portal and central veins surrounded by fibrous tissue accompanied by fibrous septa. The lobular structure was fuzzy with clearly visible false lobules. In the morin + CCl4 group, the liver tissue demonstrated less hyperplasia of fiber tissue and minimal inflammatory cells compared to the CCl4 group (Figure 3AD).
Liver-spleen ratio and liver weight indexBoth the CCl4 and morin + CCl4 groups had increased liverspleen ratio (LSR) and liver weight index (LWI) compared with the control and morin groups (P < 0.05). The LWI between the CCl4 and morin + CCl4 groups showed a significant difference (P < 0.05), while no statistically significant difference was found for LSR (P > 0.05) (Table 2).
Biochemical findingsThe CCl4 and morin + CCl4 groups had increased ALT, AST, and ALP levels compared to the control and morin groups (P < 0.05), and CCl4 without morin treatment dramatically increased ALT, AST, and ALP values (Table 3).
mRNA expression of α-SMA, collagen Ⅰ , collagen Ⅲ , Nrf2, HO-1, and NQO1Compared with the control and morin groups, significantly higher mRNA expression of α-SMA, collagen Ⅰ , and collagen Ⅲ was observed in liver tissues in the CCl4 and morin + CCl4 groups (P < 0.05). However, the mRNA expression of these molecules in the morin + CCl4 group was significantly less than that in the CCl4 group (P < 0.05) (Figure 4).
In the CCl4 and morin + CCl4 groups, mRNA expression
(80 V 100 min) (Millipore, Bedford, MA, United States). The membrane was blocked with 5% dry milk and incubated overnight at 4 ℃ with antibodies against HO1 (1:800; Proteintech), NQO1 (1:1000; Proteintech), Nrf2 (1:800; Proteintch), collagen Ⅰ (1:800, Proteintech), collagen Ⅲ (1:1000, Proteintech), αSMA (1:1000, Proteintch), and GAPDH (1:4000, Proteintech). After washing, the membrane was incubated with a horseradish peroxidaseconjugated secondary antibody (Santa Cruz Biotechnology) at 37 ℃ for 2 h. Protein bands were visualized by enhanced chemiluminescence (Pierce) and detected using BioImaging Systems (UVP, Upland, CA, United States). The relative protein levels were calculated based on GAPDH protein as a loading control. Western blot images were measured with ImageJ software, and the relative gray values of protein expression were analyzed semiquantitatively.
Statistical analysisThe experimental data are expressed as the mean ± SD. Statistical analyses were performed using oneway analysis of variance (ANOVA) between groups, and unpaired comparisons were analyzed using the least significant difference method LSD ttest. A Pvalue of 0.05 or less was considered statistically significant.
Table 1 Primer sequences
Name Primer sequence
Rat Collagen Ⅰ for 5'-ACTGGTACATCAGCCCAAACCC-3'Rat Collagen Ⅰ rev 5'-GGAATCCATCGGTCATGCTCT-3'Rat Collagen Ⅲ for 5'-GAGACTCCCCATCATAGATATCGC-3'Rat Collagen Ⅲ rev 5'-AGCAAACAGGGCCAATGTCC-3'Rat α-SMA for 5'-GCTATGCTCTGCCTCATGCC-3'Rat α-SMA rev 5'-CACGCTCAGCAGTAGTCACGAA-3'Rat Nrf2 for 5'-ACACAGCATAGCCCATCTCGT-3'Rat Nrf2 rev 5'-ACCAACCTGGATGAGCGACAC-3'Rat NQO1 for 5'-CCACGCAGAGAGGACATCATT-3'Rat NQO1 rev 5'-TTCGACCACCTCCCATCCTT-3'Rat HO-1 for 5'-CTTCCCGAGCATCGACAAC-3'Rat HO-1 rev 5'-CTGTCACCCTGTGCTTGACC-3'Rat Gapdh for 5'-GCTGGTCATCAACGGGAAA-3'Rat Gapdh rev 5'-CGCCAGTAGACTCCACGACAT-3'
0 20 40 60t /d
500
400
300
200
100
0
Body
wei
ght
(g)
Control
MorinCCl4
Morin + CCl4
Figure 2 Changes in body weight among different groups. Body weight increased observably in the control and morin groups. The CCl4 group had slow weight growth, but morin treatment was associated with increased body weight.
Sang L et al . Morin enhances hepatic Nrf2 expression
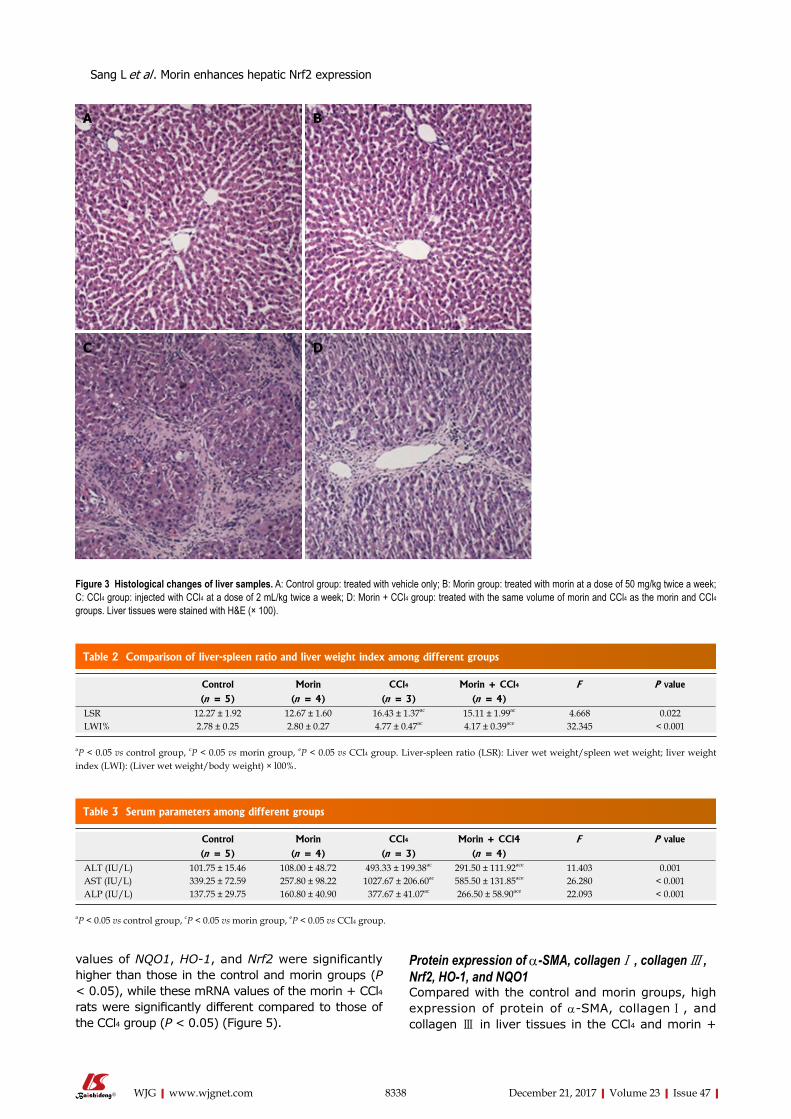
8338 December 21, 2017|Volume 23|Issue 47|WJG|www.wjgnet.com
values of NQO1, HO-1, and Nrf2 were significantly higher than those in the control and morin groups (P < 0.05), while these mRNA values of the morin + CCl4 rats were significantly different compared to those of the CCl4 group (P < 0.05) (Figure 5).
Protein expression of α-SMA, collagen Ⅰ , collagen Ⅲ , Nrf2, HO-1, and NQO1Compared with the control and morin groups, high expression of protein of αSMA, collagen Ⅰ, and collagen Ⅲ in liver tissues in the CCl4 and morin +
Figure 3 Histological changes of liver samples. A: Control group: treated with vehicle only; B: Morin group: treated with morin at a dose of 50 mg/kg twice a week; C: CCl4 group: injected with CCl4 at a dose of 2 mL/kg twice a week; D: Morin + CCl4 group: treated with the same volume of morin and CCl4 as the morin and CCl4 groups. Liver tissues were stained with H&E (× 100).
A B
C D
Table 2 Comparison of liver-spleen ratio and liver weight index among different groups
Control Morin CCl4 Morin + CCl4 F P value
(n = 5) (n = 4) (n = 3) (n = 4)LSR 12.27 ± 1.92 12.67 ± 1.60 16.43 ± 1.37ac 15.11 ± 1.99ac 4.668 0.022LWI% 2.78 ± 0.25 2.80 ± 0.27 4.77 ± 0.47ac 4.17 ± 0.39ace 32.345 < 0.001
aP < 0.05 vs control group, cP < 0.05 vs morin group, eP < 0.05 vs CCl4 group. Liver-spleen ratio (LSR): Liver wet weight/spleen wet weight; liver weight index (LWI): (Liver wet weight/body weight) × l00%.
Table 3 Serum parameters among different groups
Control Morin CCl4 Morin + CCl4 F P value
(n = 5) (n = 4) (n = 3) (n = 4)ALT (IU/L) 101.75 ± 15.46 108.00 ± 48.72 493.33 ± 199.38ac 291.50 ± 111.92ace 11.403 0.001AST (IU/L) 339.25 ± 72.59 257.80 ± 98.22 1027.67 ± 206.60ac 585.50 ± 131.85ace 26.280 < 0.001ALP (IU/L) 137.75 ± 29.75 160.80 ± 40.90 377.67 ± 41.07ac 266.50 ± 58.90ace 22.093 < 0.001
aP < 0.05 vs control group, cP < 0.05 vs morin group, eP < 0.05 vs CCl4 group.
Sang L et al . Morin enhances hepatic Nrf2 expression
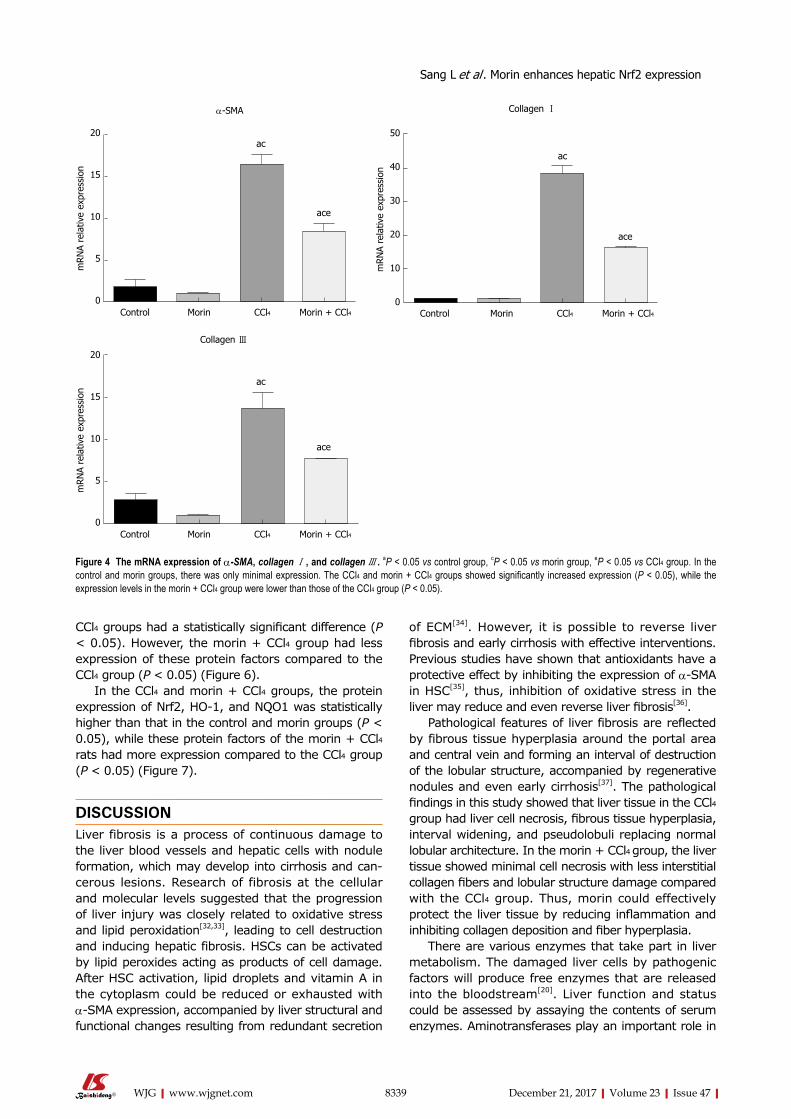
8339 December 21, 2017|Volume 23|Issue 47|WJG|www.wjgnet.com
CCl4 groups had a statistically significant difference (P < 0.05). However, the morin + CCl4 group had less expression of these protein factors compared to the CCl4 group (P < 0.05) (Figure 6).
In the CCl4 and morin + CCl4 groups, the protein expression of Nrf2, HO1, and NQO1 was statistically higher than that in the control and morin groups (P < 0.05), while these protein factors of the morin + CCl4 rats had more expression compared to the CCl4 group (P < 0.05) (Figure 7).
DISCUSSIONLiver fibrosis is a process of continuous damage to the liver blood vessels and hepatic cells with nodule formation, which may develop into cirrhosis and cancerous lesions. Research of fibrosis at the cellular and molecular levels suggested that the progression of liver injury was closely related to oxidative stress and lipid peroxidation[32,33], leading to cell destruction and inducing hepatic fibrosis. HSCs can be activated by lipid peroxides acting as products of cell damage. After HSC activation, lipid droplets and vitamin A in the cytoplasm could be reduced or exhausted with αSMA expression, accompanied by liver structural and functional changes resulting from redundant secretion
of ECM[34]. However, it is possible to reverse liver fibrosis and early cirrhosis with effective interventions. Previous studies have shown that antioxidants have a protective effect by inhibiting the expression of αSMA in HSC[35], thus, inhibition of oxidative stress in the liver may reduce and even reverse liver fibrosis[36].
Pathological features of liver fibrosis are reflected by fibrous tissue hyperplasia around the portal area and central vein and forming an interval of destruction of the lobular structure, accompanied by regenerative nodules and even early cirrhosis[37]. The pathological findings in this study showed that liver tissue in the CCl4 group had liver cell necrosis, fibrous tissue hyperplasia, interval widening, and pseudolobuli replacing normal lobular architecture. In the morin + CCl4 group, the liver tissue showed minimal cell necrosis with less interstitial collagen fibers and lobular structure damage compared with the CCl4 group. Thus, morin could effectively protect the liver tissue by reducing inflammation and inhibiting collagen deposition and fiber hyperplasia.
There are various enzymes that take part in liver metabolism. The damaged liver cells by pathogenic factors will produce free enzymes that are released into the bloodstream[20]. Liver function and status could be assessed by assaying the contents of serum enzymes. Aminotransferases play an important role in
ac
ace
α-SMA
20
15
10
5
0
mRN
A re
lativ
e ex
pres
sion
Control Morin CCl4 Morin + CCl4
ac
ace
Collagen Ⅰ
50
40
30
20
10
0
mRN
A re
lativ
e ex
pres
sion
Control Morin CCl4 Morin + CCl4
ac
ace
20
15
10
5
0
mRN
A re
lativ
e ex
pres
sion
Control Morin CCl4 Morin + CCl4
Collagen Ⅲ
Figure 4 The mRNA expression of α-SMA, collagen Ⅰ , and collagen Ⅲ . aP < 0.05 vs control group, cP < 0.05 vs morin group, eP < 0.05 vs CCl4 group. In the control and morin groups, there was only minimal expression. The CCl4 and morin + CCl4 groups showed significantly increased expression (P < 0.05), while the expression levels in the morin + CCl4 group were lower than those of the CCl4 group (P < 0.05).
Sang L et al . Morin enhances hepatic Nrf2 expression
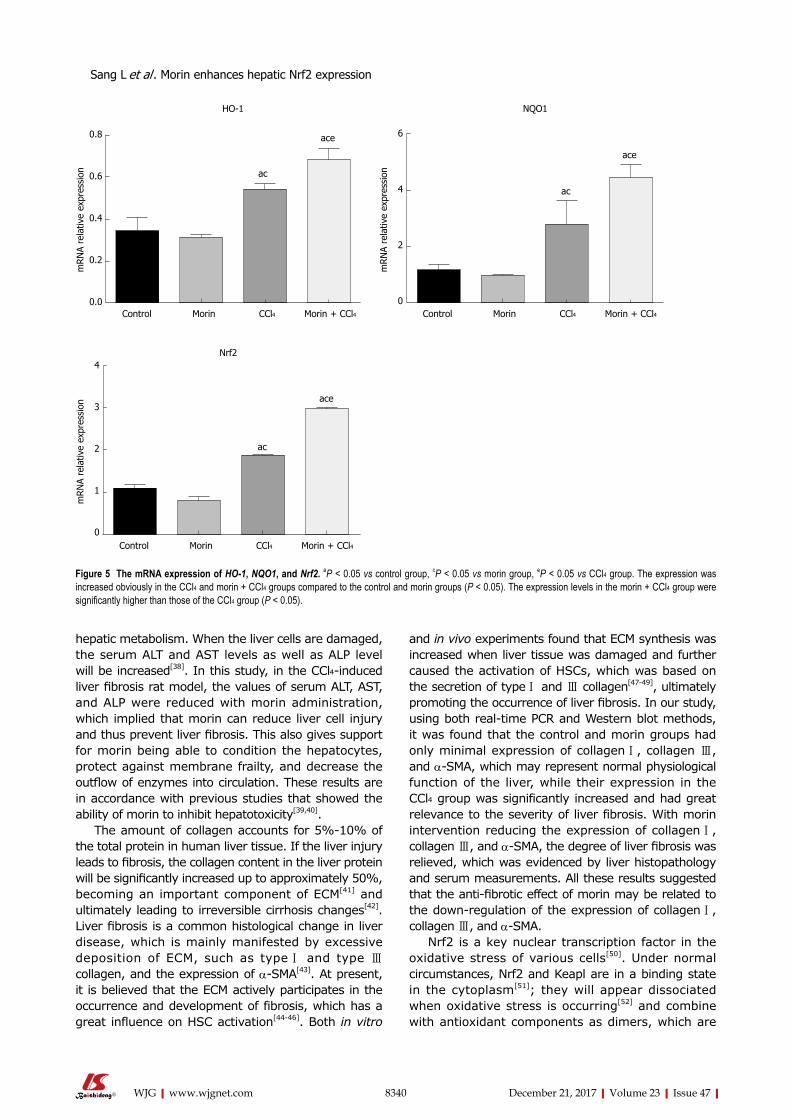
8340 December 21, 2017|Volume 23|Issue 47|WJG|www.wjgnet.com
hepatic metabolism. When the liver cells are damaged, the serum ALT and AST levels as well as ALP level will be increased[38]. In this study, in the CCl4induced liver fibrosis rat model, the values of serum ALT, AST, and ALP were reduced with morin administration, which implied that morin can reduce liver cell injury and thus prevent liver fibrosis. This also gives support for morin being able to condition the hepatocytes, protect against membrane frailty, and decrease the outflow of enzymes into circulation. These results are in accordance with previous studies that showed the ability of morin to inhibit hepatotoxicity[39,40].
The amount of collagen accounts for 5%10% of the total protein in human liver tissue. If the liver injury leads to fibrosis, the collagen content in the liver protein will be significantly increased up to approximately 50%, becoming an important component of ECM[41] and ultimately leading to irreversible cirrhosis changes[42]. Liver fibrosis is a common histological change in liver disease, which is mainly manifested by excessive deposition of ECM, such as type Ⅰ and type Ⅲ collagen, and the expression of αSMA[43]. At present, it is believed that the ECM actively participates in the occurrence and development of fibrosis, which has a great influence on HSC activation[4446]. Both in vitro
and in vivo experiments found that ECM synthesis was increased when liver tissue was damaged and further caused the activation of HSCs, which was based on the secretion of type Ⅰ and Ⅲ collagen[4749], ultimately promoting the occurrence of liver fibrosis. In our study, using both realtime PCR and Western blot methods, it was found that the control and morin groups had only minimal expression of collagen Ⅰ, collagen Ⅲ, and αSMA, which may represent normal physiological function of the liver, while their expression in the CCl4 group was significantly increased and had great relevance to the severity of liver fibrosis. With morin intervention reducing the expression of collagen Ⅰ, collagen Ⅲ, and αSMA, the degree of liver fibrosis was relieved, which was evidenced by liver histopathology and serum measurements. All these results suggested that the antifibrotic effect of morin may be related to the downregulation of the expression of collagen Ⅰ, collagen Ⅲ, and αSMA.
Nrf2 is a key nuclear transcription factor in the oxidative stress of various cells[50]. Under normal circumstances, Nrf2 and Keapl are in a binding state in the cytoplasm[51]; they will appear dissociated when oxidative stress is occurring[52] and combine with antioxidant components as dimers, which are
ac
ace0.8
0.6
0.4
0.2
0.0
mRN
A re
lativ
e ex
pres
sion
Control Morin CCl4 Morin + CCl4
HO-1
ac
ace
6
4
2
0
mRN
A re
lativ
e ex
pres
sion
Control Morin CCl4 Morin + CCl4
NQO1
ac
ace
4
3
2
1
0
mRN
A re
lativ
e ex
pres
sion
Control Morin CCl4 Morin + CCl4
Nrf2
Figure 5 The mRNA expression of HO-1, NQO1, and Nrf2. aP < 0.05 vs control group, cP < 0.05 vs morin group, eP < 0.05 vs CCl4 group. The expression was increased obviously in the CCl4 and morin + CCl4 groups compared to the control and morin groups (P < 0.05). The expression levels in the morin + CCl4 group were significantly higher than those of the CCl4 group (P < 0.05).
Sang L et al . Morin enhances hepatic Nrf2 expression
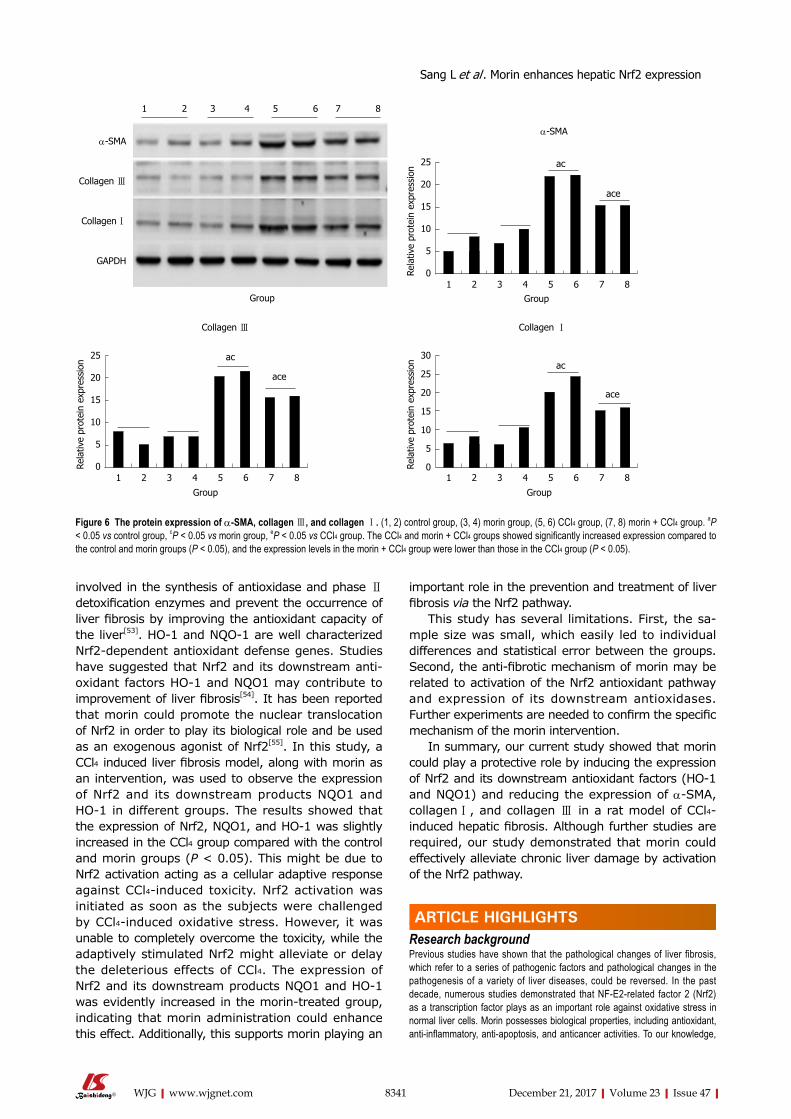
8341 December 21, 2017|Volume 23|Issue 47|WJG|www.wjgnet.com
involved in the synthesis of antioxidase and phase Ⅱ detoxification enzymes and prevent the occurrence of liver fibrosis by improving the antioxidant capacity of the liver[53]. HO1 and NQO1 are well characterized Nrf2dependent antioxidant defense genes. Studies have suggested that Nrf2 and its downstream antioxidant factors HO1 and NQO1 may contribute to improvement of liver fibrosis[54]. It has been reported that morin could promote the nuclear translocation of Nrf2 in order to play its biological role and be used as an exogenous agonist of Nrf2[55]. In this study, a CCl4 induced liver fibrosis model, along with morin as an intervention, was used to observe the expression of Nrf2 and its downstream products NQO1 and HO1 in different groups. The results showed that the expression of Nrf2, NQO1, and HO1 was slightly increased in the CCl4 group compared with the control and morin groups (P < 0.05). This might be due to Nrf2 activation acting as a cellular adaptive response against CCl4induced toxicity. Nrf2 activation was initiated as soon as the subjects were challenged by CCl4induced oxidative stress. However, it was unable to completely overcome the toxicity, while the adaptively stimulated Nrf2 might alleviate or delay the deleterious effects of CCl4. The expression of Nrf2 and its downstream products NQO1 and HO1 was evidently increased in the morintreated group, indicating that morin administration could enhance this effect. Additionally, this supports morin playing an
important role in the prevention and treatment of liver fibrosis via the Nrf2 pathway.
This study has several limitations. First, the sample size was small, which easily led to individual differences and statistical error between the groups. Second, the antifibrotic mechanism of morin may be related to activation of the Nrf2 antioxidant pathway and expression of its downstream antioxidases. Further experiments are needed to confirm the specific mechanism of the morin intervention.
In summary, our current study showed that morin could play a protective role by inducing the expression of Nrf2 and its downstream antioxidant factors (HO1 and NQO1) and reducing the expression of αSMA, collagen Ⅰ, and collagen Ⅲ in a rat model of CCl4-induced hepatic fibrosis. Although further studies are required, our study demonstrated that morin could effectively alleviate chronic liver damage by activation of the Nrf2 pathway.
ARTICLE HIGHLIGHTSResearch backgroundPrevious studies have shown that the pathological changes of liver fibrosis, which refer to a series of pathogenic factors and pathological changes in the pathogenesis of a variety of liver diseases, could be reversed. In the past decade, numerous studies demonstrated that NF-E2-related factor 2 (Nrf2) as a transcription factor plays as an important role against oxidative stress in normal liver cells. Morin possesses biological properties, including antioxidant, anti-inflammatory, anti-apoptosis, and anticancer activities. To our knowledge,
1 2 3 4 5 6 7 8
α-SMA
Collagen Ⅲ
Collagen Ⅰ
GAPDH
Group
25
20
15
10
5
0Rela
tive
prot
ein
expr
essi
on
1 2 3 4 5 6 7 8
ac
ace
α-SMA
Group
30
25
20
15
10
5
0Rela
tive
prot
ein
expr
essi
on
1 2 3 4 5 6 7 8
ac
ace
Collagen Ⅰ
Group
25
20
15
10
5
0Rela
tive
prot
ein
expr
essi
on
1 2 3 4 5 6 7 8
ac
ace
Collagen Ⅲ
Group
Figure 6 The protein expression of α-SMA, collagen Ⅲ, and collagen Ⅰ. (1, 2) control group, (3, 4) morin group, (5, 6) CCl4 group, (7, 8) morin + CCl4 group. aP < 0.05 vs control group, cP < 0.05 vs morin group, eP < 0.05 vs CCl4 group. The CCl4 and morin + CCl4 groups showed significantly increased expression compared to the control and morin groups (P < 0.05), and the expression levels in the morin + CCl4 group were lower than those in the CCl4 group (P < 0.05).
ARTICLE HIGHLIGHTS
Sang L et al . Morin enhances hepatic Nrf2 expression
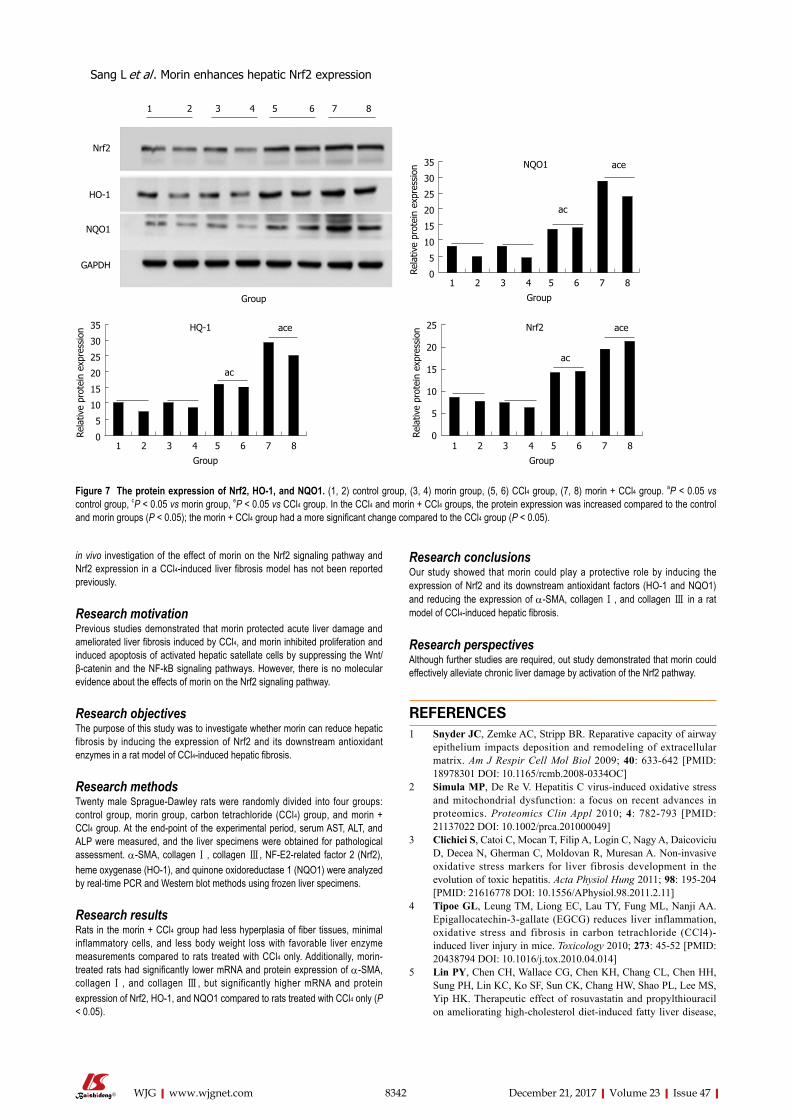
8342 December 21, 2017|Volume 23|Issue 47|WJG|www.wjgnet.com
in vivo investigation of the effect of morin on the Nrf2 signaling pathway and Nrf2 expression in a CCl4-induced liver fibrosis model has not been reported previously.
Research motivationPrevious studies demonstrated that morin protected acute liver damage and ameliorated liver fibrosis induced by CCl4, and morin inhibited proliferation and induced apoptosis of activated hepatic satellate cells by suppressing the Wnt/β-catenin and the NF-kB signaling pathways. However, there is no molecular evidence about the effects of morin on the Nrf2 signaling pathway.
Research objectivesThe purpose of this study was to investigate whether morin can reduce hepatic fibrosis by inducing the expression of Nrf2 and its downstream antioxidant enzymes in a rat model of CCl4-induced hepatic fibrosis.
Research methodsTwenty male Sprague-Dawley rats were randomly divided into four groups: control group, morin group, carbon tetrachloride (CCl4) group, and morin + CCl4 group. At the end-point of the experimental period, serum AST, ALT, and ALP were measured, and the liver specimens were obtained for pathological assessment. α-SMA, collagen Ⅰ, collagen Ⅲ, NF-E2-related factor 2 (Nrf2), heme oxygenase (HO-1), and quinone oxidoreductase 1 (NQO1) were analyzed by real-time PCR and Western blot methods using frozen liver specimens.
Research resultsRats in the morin + CCl4 group had less hyperplasia of fiber tissues, minimal inflammatory cells, and less body weight loss with favorable liver enzyme measurements compared to rats treated with CCl4 only. Additionally, morin-treated rats had significantly lower mRNA and protein expression of α-SMA, collagen Ⅰ, and collagen Ⅲ, but significantly higher mRNA and protein expression of Nrf2, HO-1, and NQO1 compared to rats treated with CCl4 only (P < 0.05).
Research conclusionsOur study showed that morin could play a protective role by inducing the expression of Nrf2 and its downstream antioxidant factors (HO-1 and NQO1) and reducing the expression of α-SMA, collagen Ⅰ, and collagen Ⅲ in a rat model of CCl4-induced hepatic fibrosis.
Research perspectivesAlthough further studies are required, out study demonstrated that morin could effectively alleviate chronic liver damage by activation of the Nrf2 pathway.
REFERENCES1 Snyder JC, Zemke AC, Stripp BR. Reparative capacity of airway
epithelium impacts deposition and remodeling of extracellular matrix. Am J Respir Cell Mol Biol 2009; 40: 633-642 [PMID: 18978301 DOI: 10.1165/rcmb.2008-0334OC]
2 Simula MP, De Re V. Hepatitis C virus-induced oxidative stress and mitochondrial dysfunction: a focus on recent advances in proteomics. Proteomics Clin Appl 2010; 4: 782-793 [PMID: 21137022 DOI: 10.1002/prca.201000049]
3 Clichici S, Catoi C, Mocan T, Filip A, Login C, Nagy A, Daicoviciu D, Decea N, Gherman C, Moldovan R, Muresan A. Non-invasive oxidative stress markers for liver fibrosis development in the evolution of toxic hepatitis. Acta Physiol Hung 2011; 98: 195-204 [PMID: 21616778 DOI: 10.1556/APhysiol.98.2011.2.11]
4 Tipoe GL, Leung TM, Liong EC, Lau TY, Fung ML, Nanji AA. Epigallocatechin-3-gallate (EGCG) reduces liver inflammation, oxidative stress and fibrosis in carbon tetrachloride (CCl4)-induced liver injury in mice. Toxicology 2010; 273: 45-52 [PMID: 20438794 DOI: 10.1016/j.tox.2010.04.014]
5 Lin PY, Chen CH, Wallace CG, Chen KH, Chang CL, Chen HH, Sung PH, Lin KC, Ko SF, Sun CK, Chang HW, Shao PL, Lee MS, Yip HK. Therapeutic effect of rosuvastatin and propylthiouracil on ameliorating high-cholesterol diet-induced fatty liver disease,
1 2 3 4 5 6 7 8
Nrf2
HO-1
NQO1
GAPDH
Group
35
30
25
20
15
10
5
0Rela
tive
prot
ein
expr
essi
on
1 2 3 4 5 6 7 8
ac
aceNQO1
Group
35
30
25
20
15
10
5
0Rela
tive
prot
ein
expr
essi
on
1 2 3 4 5 6 7 8
ac
aceHQ-1
Group
25
20
15
10
5
0Rela
tive
prot
ein
expr
essi
on
1 2 3 4 5 6 7 8
ac
aceNrf2
Group
Figure 7 The protein expression of Nrf2, HO-1, and NQO1. (1, 2) control group, (3, 4) morin group, (5, 6) CCl4 group, (7, 8) morin + CCl4 group. aP < 0.05 vs control group, cP < 0.05 vs morin group, eP < 0.05 vs CCl4 group. In the CCl4 and morin + CCl4 groups, the protein expression was increased compared to the control and morin groups (P < 0.05); the morin + CCl4 group had a more significant change compared to the CCl4 group (P < 0.05).
Sang L et al . Morin enhances hepatic Nrf2 expression
8343 December 21, 2017|Volume 23|Issue 47|WJG|www.wjgnet.com
fibrosis and inflammation in rabbit. Am J Transl Res 2017; 9: 3827-3841 [PMID: 28861173]
6 Kisseleva T, Cong M, Paik Y, Scholten D, Jiang C, Benner C, Iwaisako K, Moore-Morris T, Scott B, Tsukamoto H, Evans SM, Dillmann W, Glass CK, Brenner DA. Myofibroblasts revert to an inactive phenotype during regression of liver fibrosis. Proc Natl Acad Sci USA 2012; 109: 9448-9453 [PMID: 22566629 DOI: 10.1073/pnas.1201840109]
7 Liu C, Liao JZ, Li PY. Traditional Chinese herbal extracts inducing autophagy as a novel approach in therapy of nonalcoholic fatty liver disease. World J Gastroenterol 2017; 23: 1964-1973 [PMID: 28373762 DOI: 10.3748/wjg.v23.i11.1964]
8 Cederbaum AI, Lu Y, Wu D. Role of oxidative stress in alcohol-induced liver injury. Arch Toxicol 2009; 83: 519-548 [PMID: 19448996 DOI: 10.1007/s00204-009-0432-0]
9 Ghatak S, Biswas A, Dhali GK, Chowdhury A, Boyer JL, Santra A. Oxidative stress and hepatic stellate cell activation are key events in arsenic induced liver fibrosis in mice. Toxicol Appl Pharmacol 2011; 251: 59-69 [PMID: 21134390 DOI: 10.1016/j.taap.2010.11.016]
10 Ma JQ, Ding J, Zhang L, Liu CM. Protective effects of ursolic acid in an experimental model of liver fibrosis through Nrf2/ARE pathway. Clin Res Hepatol Gastroenterol 2015; 39: 188-197 [PMID: 25459994 DOI: 10.1016/j.clinre.2014.09.007]
11 Cao M, Wang H, Guo L, Yang S, Liu C, Khor TO, Yu S, Kong AN. Dibenzoylmethane Protects Against CCl4-Induced Acute Liver Injury by Activating Nrf2 via JNK, AMPK, and Calcium Signaling. AAPS J 2017; 19: 1703-1714 [PMID: 28828752 DOI: 10.1208/s12248-017-0133-1]
12 Li B, Wang L, Lu Q, Da W. Liver injury attenuation by curcumin in a rat NASH model: an Nrf2 activation-mediated effect? Ir J Med Sci 2016; 185: 93-100 [PMID: 25385666 DOI: 10.1007/s11845-014-1226-9]
13 Chen S, Zou L, Li L, Wu T. The protective effect of glycyrrhetinic acid on carbon tetrachloride-induced chronic liver fibrosis in mice via upregulation of Nrf2. PLoS One 2013; 8: e53662 [PMID: 23341968 DOI: 10.1371/journal.pone.0053662]
14 Kudoh K, Uchinami H, Yoshioka M, Seki E, Yamamoto Y. Nrf2 activation protects the liver from ischemia/reperfusion injury in mice. Ann Surg 2014; 260: 118-127 [PMID: 24368646 DOI: 10.1097/SLA.0000000000000287]
15 Ni YH, Huo LJ, Li TT. Antioxidant axis Nrf2-keap1-ARE in inhibition of alcoholic liver fibrosis by IL-22. World J Gastroenterol 2017; 23: 2002-2011 [PMID: 28373766 DOI: 10.3748/wjg.v23.i11.2002]
16 Lotito SB, Frei B. Consumption of flavonoid-rich foods and increased plasma antioxidant capacity in humans: cause, consequence, or epiphenomenon? Free Radic Biol Med 2006; 41: 1727-1746 [PMID: 17157175 DOI: 10.1016/j.freeradbiomed.2006.04.033]
17 Wijeratne SS, Abou-Zaid MM, Shahidi F. Antioxidant polyph-enols in almond and its coproducts. J Agric Food Chem 2006; 54: 312-318 [PMID: 16417285 DOI: 10.1021/jf051692j]
18 Aggarwal BB, Shishodia S. Molecular targets of dietary agents for prevention and therapy of cancer. Biochem Pharmacol 2006; 71: 1397-1421 [PMID: 16563357 DOI: 10.1016/j.bcp.2006.02.009]
19 Sivaramakrishnan V, Shilpa PN, Praveen Kumar VR, Niranjali Devaraj S. Attenuation of N-nitrosodiethylamine-induced hepatocellular carcinogenesis by a novel flavonol-Morin. Chem Biol Interact 2008; 171: 79-88 [PMID: 17950263 DOI: 10.1016/j.cbi.2007.09.003]
20 Heeba GH, Mahmoud ME. Therapeutic potential of morin against liver fibrosis in rats: Modulation of oxidative stress, cytokine production and nuclear factor kappa B. Environ Toxicol Pharmacol 2014; 37: 662-671 [PMID: 24583409 DOI: 10.1016/j.etap.2014.01.026]
21 Merwid-Ląd A, Trocha M, Chlebda-Sieragowska E, Sozański T, Szandruk M, Magdalan J, Ksiądzyna D, Pieśniewska M, Fereniec-Gołębiewska L, Kwiatkowska J, Szeląg A. The impact of morin, a natural flavonoid, on cyclophosphamide-induced changes in the oxidative stress parameters in rat livers. Adv Clin Exp Med 2014; 23: 505-509 [PMID: 25166433]
22 Wang X, Zhang DM, Gu TT, Ding XQ, Fan CY, Zhu Q, Shi YW, Hong Y, Kong LD. Morin reduces hepatic inflammation-associated lipid accumulation in high fructose-fed rats via inhibiting sphingosine kinase 1/sphingosine 1-phosphate signaling pathway. Biochem Pharmacol 2013; 86: 1791-1804 [PMID: 24134913 DOI: 10.1016/j.bcp.2013.10.005]
23 MadanKumar P, NaveenKumar P, Devaraj H, NiranjaliDevaraj S. Morin, a dietary flavonoid, exhibits anti-fibrotic effect and induces apoptosis of activated hepatic stellate cells by suppressing canonical NF-κB signaling. Biochimie 2015; 110: 107-118 [PMID: 25577997 DOI: 10.1016/j.biochi.2015.01.002]
24 Sivaramakrishnan V, Devaraj SN. Morin fosters apoptosis in experimental hepatocellular carcinogenesis model. Chem Biol Interact 2010; 183: 284-292 [PMID: 19931519 DOI: 10.1016/j.cbi.2009.11.011]
25 Lee MH, Han MH, Lee DS, Park C, Hong SH, Kim GY, Hong SH, Song KS, Choi IW, Cha HJ, Choi YH. Morin exerts cytoprotective effects against oxidative stress in C2C12 myoblasts via the upregulation of Nrf2-dependent HO-1 expression and the activation of the ERK pathway. Int J Mol Med 2017; 39: 399-406 [PMID: 28035409 DOI: 10.3892/ijmm.2016.2837]
26 Hsiang CY, Wu SL, Ho TY. Morin inhibits 12-O-tetradecanoyl-phorbol-13-acetate-induced hepatocellular transformation via activator protein 1 signaling pathway and cell cycle progression. Biochem Pharmacol 2005; 69: 1603-1611 [PMID: 15896340 DOI: 10.1016/j.bcp.2005.03.008]
27 Kitagawa S, Sakamoto H, Tano H. Inhibitory effects of flavonoids on free radical-induced hemolysis and their oxidative effects on hemoglobin. Chem Pharm Bull (Tokyo) 2004; 52: 999-1001 [PMID: 15305001]
28 Williams AT, Burk RF. Carbon tetrachloride hepatotoxicity: an example of free radical-mediated injury. Semin Liver Dis 1990; 10: 279-284 [PMID: 2281335 DOI: 10.1055/s-2008-1040483]
29 Lee HS, Jung KH, Hong SW, Park IS, Lee C, Han HK, Lee DH, Hong SS. Morin protects acute liver damage by carbon tetrachloride (CCl(4)) in rat. Arch Pharm Res 2008; 31: 1160-1165 [PMID: 18806959 DOI: 10.1007/s12272-001-1283-5]
30 MadanKumar P, NaveenKumar P, Manikandan S, Devaraj H, NiranjaliDevaraj S. Morin ameliorates chemically induced liver fibrosis in vivo and inhibits stellate cell proliferation in vitro by suppressing Wnt/β-catenin signaling. Toxicol Appl Pharmacol 2014; 277: 210-220 [PMID: 24657339 DOI: 10.1016/j.taap.2014.03.008]
31 Bedossa P, Poynard T. An algorithm for the grading of activity in chronic hepatitis C. The METAVIR Cooperative Study Group. Hepatology 1996; 24: 289-293 [PMID: 8690394 DOI: 10.1002/hep.510240201]
32 Brenner DA. Molecular pathogenesis of liver fibrosis. Trans Am Clin Climatol Assoc 2009; 120: 361-368 [PMID: 19768189]
33 Bataller R, Brenner DA. Liver fibrosis. J Clin Invest 2005; 115: 209-218 [PMID: 15690074 DOI: 10.1172/JCI24282]
34 Ismail MH, Pinzani M. Reversal of liver fibrosis. Saudi J Gastroenterol 2009; 15: 72-79 [PMID: 19568569 DOI: 10.4103/1319-3767.45072]
35 Parola M, Robino G. Oxidative stress-related molecules and liver fibrosis. J Hepatol 2001; 35: 297-306 [PMID: 11580156]
36 Li M, Wang XF, Shi JJ, Li YP, Yang N, Zhai S, Dang SS. Caffeic acid phenethyl ester inhibits liver fibrosis in rats. World J Gastroenterol 2015; 21: 3893-3903 [PMID: 25852274 DOI: 10.3748/wjg.v21.i13.3893]
37 Ceni E, Mello T, Galli A. Pathogenesis of alcoholic liver disease: Role of oxidative metabolism. World J Gastroenterol 2014; 20: 17756-17772 [PMID: 25548474 DOI: 10.3748/wjg.v20.i47.17756]
38 Yachi R, Igarashi O, Kiyose C. Protective Effects of Vitamin E Analogs against Carbon Tetrachloride-Induced Fatty Liver in Rats. J Clin Biochem Nutr 2010; 47: 148-154 [PMID: 20838570 DOI: 10.3164/jcbn.10-35]
39 Prahalathan P, Kumar S, Raja B. Effect of morin, a flavonoid against DOCA-salt hypertensive rats: a dose dependent study. Asian Pac J Trop Biomed 2012; 2: 443-448 [PMID: 23569947
Sang L et al . Morin enhances hepatic Nrf2 expression
8344 December 21, 2017|Volume 23|Issue 47|WJG|www.wjgnet.com
DOI: 10.1016/S2221-1691(12)60073-2]40 Shankari SG, Karthikesan K, Jalaludeen AM, Ashokkumar N.
Hepatoprotective effect of morin on ethanol-induced hepatotoxicity in rats. J Basic Clin Physiol Pharmacol 2010; 21: 277-294 [PMID: 21305846 DOI: 10.1515/JBCPP.2010.21.4.277]
41 Milani S, Herbst H, Schuppan D, Surrenti C, Riecken EO, Stein H. Cellular localization of type I III and IV procollagen gene transcripts in normal and fibrotic human liver. Am J Pathol 1990; 137: 59-70 [PMID: 2372043]
42 Friedman SL. Liver fibrosis -- from bench to bedside. J Hepatol 2003; 38 Suppl 1: S38-S53 [PMID: 12591185 DOI: 10.1016/S0168-8278(02)00429-4]
43 Nieto N, Friedman SL, Cederbaum AI. Stimulation and prolifer-ation of primary rat hepatic stellate cells by cytochrome P450 2E1-derived reactive oxygen species. Hepatology 2002; 35: 62-73 [PMID: 11786960 DOI: 10.1053/jhep.2002.30362]
44 Shi MN, Zheng WD, Zhang LJ, Chen ZX, Wang XZ. Effect of IL-10 on the expression of HSC growth factors in hepatic fibrosis rat. World J Gastroenterol 2005; 11: 4788-4793 [PMID: 16097045 DOI: 10.3748/wjg.v11.i31.4788]
45 Friedman SL. Molecular regulation of hepatic fibrosis, an integrated cellular response to tissue injury. J Biol Chem 2000; 275: 2247-2250 [PMID: 10644669]
46 Eng FJ, Friedman SL. Fibrogenesis I. New insights into hepatic stellate cell activation: the simple becomes complex. Physiol Gastrointest Liver Physiol 2000; 279: G7-G11 [PMID: 10898741 DOI: 10.1074/jbc.275.4.2247]
47 Dedhar S. Cell-substrate interactions and signaling through ILK. Curr Opin Cell Biol 2000; 12: 250-256 [PMID: 10712922 DOI: 10.1016/S0955-0674(99)00083-6]
48 Zhang Y, Ikegami T, Honda A, Miyazaki T, Bouscarel B, Rojkind
M, Hyodo I, Matsuzaki Y. Involvement of integrin-linked kinase in carbon tetrachloride-induced hepatic fibrosis in rats. Hepatology 2006; 44: 612-622 [PMID: 16941698 DOI: 10.1002/hep.21315]
49 Feng DY, Zheng H, Tan Y, Cheng RX. Effect of phosphorylation of MAPK and Stat3 and expression of c-fos and c-jun proteins on hepatocarcinogenesis and their clinical significance. World J Gastroenterol 2001; 7: 33-36 [PMID: 11819729 DOI: 10.3748/wjg.v7.i1.33]
50 Yan FJ, Chen YS, Azat R, Zheng XD. Mulberry Anthocyanin Extract Ameliorates Oxidative Damage in HepG2 Cells and Prolongs the Lifespan of Caenorhabditis elegans through MAPK and Nrf2 Pathways. Oxid Med Cell Longev 2017
51 Wortham M, He L, Gyamfi M, Copple BL, Wan YJ. The transition from fatty liver to NASH associates with SAMe depletion in db/db mice fed a methionine choline-deficient diet. Dig Dis Sci 2008; 53: 2761-2774 [PMID: 18299981 DOI: 10.1007/s10620-007-0193-7]
52 Kaspar JW, Niture SK, Jaiswal AK. Nrf2:INrf2 (Keap1) signaling in oxidative stress. Free Radic Biol Med 2009; 47: 1304-1309 [PMID: 19666107 DOI: 10.1016/j.freeradbiomed.2009.07.035]
53 Jin F, Wan C, Li W, Yao L, Zhao H, Zou Y, Peng D, Huang W. Formononetin protects against acetaminophen-induced hepatotoxicity through enhanced NRF2 activity. PloS One 2017; 12: e0170900 [PMID: 28234915 DOI: 10.1371/journal.pone.0170900]
54 Chen Q, Zhang H, Cao Y, Li Y, Sun S, Zhang J, Zhang G. Schisandrin B attenuates CCl4-induced liver fibrosis in rats by regulation of Nrf2-ARE and TGF-β/Smad signaling pathways. Drug Des Devel Ther 2017; 11: 2179-2191 [PMID: 28794616 DOI: 10.2147/DDDT.S137507]
55 Tang W, Jiang YF, Ponnusamy M, Diallo M. Role of Nrf2 in chronic liver disease. World J Gastroenterol 2014; 20: 13079-13087 [PMID: 25278702 DOI: 10.3748/wjg.v20.i36.13079]
P- Reviewer: Deepak P, Faerch K S- Editor: Chen K L- Editor: Wang TQ E- Editor: Huang Y
Sang L et al . Morin enhances hepatic Nrf2 expression
Fan Yang, Jin-Tao Guo, Nan Ge, Ping Zhu, Xiang Liu, Sheng Wang, Guo-Xin Wang, Si-Yu Sun, Endoscopy Center, Shengjing Hospital of China Medical University, Shenyang 110004, Liaoning Province, China
Dong-Yan Liu, Medical Research Center, Shengjing Hospital of China Medical University, Benxi 117000, Liaoning Province, China
ORCID number: Fan Yang (0000-0002-5032-6450); Dong-Yan Liu (0000-0002-3902-9316); Jin-Tao Guo (0000-0001-5722 -6359); Nan Ge (0000-0002-5764-7054); Ping Zhu (0000-0003 -2959-3885); Xiang Liu (0000-0001-7538-6786); Sheng Wang (0000-0001-7194-9641); Guo-Xin Wang (0000-0002-5928 -3370); Si-Yu Sun (0000-0002-7308-0473)
Author contributions: Yang F and Sun SY were involved in the study conception and design; Yang F drafted the article and analyzed and interpreted the data; Guo JT and Ge N performed critical revision of the article for important intellectual content and collected the data; Liu X performed statistical analysis; Zhu P and Wang S conducted the evaluation of TNM stage of pancreatic cancer; all authors performed the final approval of the article.
Supported by Natural Science Foundation of Liaoning Province, No. 20170541024; and the Shengjing Free Researcher Project Foundation, No. 200812.
Institutional review board statement: The study was reviewed and approved by the Ethics Committee of Shengjing Hospital of China Medical University (No. 2016PS277K).
Informed consent statement: All cancer specimen and blood samples from the patients and healthy volunteers were taken after informed written consent and ethical permission were obtained prior to study enrollment.
Conflict-of-interest statement: The authors have no conflicts of interest to declare.
Data sharing statement: No additional data are available for this study. All data are included in the paper itself.
Open-Access: This article is an open-access article which was selected by an in-house editor and fully peer-reviewed by external reviewers. It is distributed in accordance with the Creative Commons Attribution Non Commercial (CC BY-NC 4.0) license, which permits others to distribute, remix, adapt, build upon this work non-commercially, and license their derivative works on different terms, provided the original work is properly cited and the use is non-commercial. See: http://creativecommons.org/licenses/by-nc/4.0/
Manuscript source: Unsolicited manuscript
Correspondence to: Si-Yu Sun, MD, PhD, Chief, Professor, Endoscopy Center, Shengjing Hospital of China Medical University, No. 36, Sanhao Street, Shenyang 110004, Liaoning Province, China. [email protected]: +86-24-96615-26111Fax: +86-24-23892617
Received: November 3, 2017Peer-review started: November 4, 2017First decision: November 14, 2017Revised: November 17, 2017Accepted: November 27, 2017Article in press: November 27, 2017Published online: December 21, 2017
AbstractAIMTo analyze the diagnostic value of a circular RNA (circRNA), circ-LDLRAD3, in pancreatic cancer.
METHODSExpression levels of circ-LDLRAD3 were tested in both cells and clinical samples; the latter included 30 paired pancreatic cancer tissues and adjacent non-tumorous tissues, 31 plasma samples from patients with pan-creatic cancer, and 31 plasma samples from healthy volunteers. Real-time quantitative reverse transcription
8345 December 21, 2017|Volume 23|Issue 47|WJG|www.wjgnet.com
ORIGINAL ARTICLE
Circular RNA circ-LDLRAD3 as a biomarker in diagnosis of pancreatic cancer
Basic Study
Fan Yang, Dong-Yan Liu, Jin-Tao Guo, Nan Ge, Ping Zhu, Xiang Liu, Sheng Wang, Guo-Xin Wang, Si-Yu Sun
Submit a Manuscript: http://www.f6publishing.com
DOI: 10.3748/wjg.v23.i47.8345
World J Gastroenterol 2017 December 21; 23(47): 8345-8354
ISSN 1007-9327 (print) ISSN 2219-2840 (online)
polymerase chain reaction (qRT-PCR) was performed to measure expression levels of circ-LDLRAD3 in cells and clinical samples; then, the relationship between clinicopathological factors of patient samples and expression of circ-LDLRAD3 in pancreatic cancer was analyzed. The diagnostic value of circ-LDLRAD3 was verified by receiver operating characteristic (ROC) curve analysis.
RESULTSCirc-LDLRAD3 was up-regulated in pancreatic cancer cell lines (P < 0.01), pancreatic cancer tissues (P < 0.01), and plasma samples from patients with pancreatic cancer (P < 0.01). High expression of circ-LDLRAD3 was significantly associated with venous invasion, lymphatic invasion, and metastasis. The area under the ROC curve of circ-LDLRAD3 alone or combination with CA19-9 was 0.67 and 0.87, respectively, with a sensitivity and specificity of 0.5738 (alone) and 0.7049 (alone), and 0.8033 (combination) and 0.9355 (combination), respectively.
CONCLUSIONThese data suggest that circ-LDLRAD3 may be a biomarker in the diagnosis of pancreatic cancer.
Key words: Circular RNA; Pancreatic cancer; biomarker
© The Author(s) 2017. Published by baishideng Publishing Group Inc. All rights reserved.
Core tip: Circular RNAs (circRNAs), a novel class of stable endogenous RNAs, play important roles in the occurrence and progression of cancer; however, little is known about their diagnostic value in pancreatic cancer. Our study focused on a novel circRNA, circ-LDLRAD3. Expression levels of circ-LDLRAD3 were tested in both cells and clinical samples, including tissue samples and plasma samples. Then, the relationship between clinicopathological factors of patient samples and expression of circ-LDLRAD3 in pancreatic cancer was analyzed. The diagnostic value of circ-LDLRAD3 was verified by ROC curve analysis. Our study suggests that circ-LDLRAD3 may be a new biomarker in the diagnosis of pancreatic cancer.
Yang F, Liu DY, Guo JT, Ge N, Zhu P, Liu X, Wang S, Wang GX, Sun SY. Circular RNA circ-LDLRAD3 as a biomarker in diagnosis of pancreatic cancer. World J Gastroenterol 2017; 23(47): 8345-8354 Available from: URL: http://www.wjgnet.com/1007-9327/full/v23/i47/8345.htm DOI: http://dx.doi.org/10.3748/wjg.v23.i47.8345
INTRODUCTIONPancreatic cancer is a malignancy of the digestive system with insidious onset and rapid development,
resulting in delayed and difficult early diagnoses and poor prognosis[1,2]. The incidence and mortality of pancreatic cancer are rising every year worldwide, and it is the 7th and 4th leading cause of mortality from all malignant tumors in China[3] and the United States[4], respectively. Surgical resection remains the major means of treatment for pancreatic cancer; however, the 5-year survival rate for patients undergoing a complete resection remains as low as 6%[5]. The key to improving the prognosis of pancreatic cancer mostly lies in early diagnosis and early treatment, which can be achieved by detection of relevant molecular markers among patients with high risk, followed by early and timely interventions[6-8].
Circular RNAs (circRNAs) are a class of noncoding RNAs with continuous, covalently closed circular st-ructures, which have been further found to exhibit species conservation and tissue specificity[9]. With the emergence of next-generation sequencing, especially RNA sequencing technology, circRNAs have been found to be extensively expressed in the cytoplasm. In addition, they have been garnering attention because of their specificity of expression, complexity of regulation, and important role in pathogenesis of many diseases, especially cancer[10]. Unlike their linear counterparts, circRNAs are characterized by stable ring structure formed by a covalently closed continuous loop. Without free 3’ and 5’ ends, these molecules are not easily degraded by nucleases, which makes them ideal biomarkers for detection of disease[11]. Investigators have identified disease-specific patterns of circRNA expression, which can serve as biomarkers for diseases[12], especially cancer[10,13]. However, there has been little investigation into the association of circRNAs with pancreatic cancer.
In this study, we focused our investigation on circRNA-hsa_circ_0006988, whose gene is located at chr11:36248634-36248980. Its gene symbol is LDLRAD3 (low density lipoprotein receptor class A domain containing 3), therefore we will refer to circRNA-hsa_circ_0006988 as circ-LDLRAD3 instead of its original name in circBase[14] (http://www.circbase.org). We chose circ-LDLRAD3 as a target for further study because we previously identified that it may be up-regulated in a previous microarray screening (http://www.ncbi.nlm.nih.gov/geo/query/acc.cgi?acc=GSE69362)[15] and associated with pancreatic cancer in circBase[14] and circ2Traits[16]. By expanding the sample size, we found that the expression levels of circ-LDLRAD3 were higher in both pancreatic cancer tissues and plasma from patients with pancreatic cancer as compared to control samples. Moreover, up-regulated expression of circ-LDLRAD3 was significantly related to major clinicopathological factors of patients with pancreatic cancer. Our results make clear that circ-LDLRAD3 may serve as a biomarker in the diagnosis of pancreatic cancer.
8346 December 21, 2017|Volume 23|Issue 47|WJG|www.wjgnet.com
Yang F et al . circ-LDLRAD3 in pancreatic cancer
MATERIALS AND METHODSClinical samplesThirty samples of pancreatic cancer and their paired adjacent pancreatic tissues were obtained from patients with pancreatic cancer treated at Shengjing Hospital of China Medical University (Shenyang, China) from September 2016 to June 2017. Paired normal tissue samples were obtained 5 cm from the pancreatic cancer tissue and were confirmed to contain no tumor cells after evaluation by two experienced pathologists. All specimens were immediately stored in liquid nitrogen until use.
Peripheral blood samples (4 mL) were collected from another 31 patients with pancreatic cancer and 31 healthy volunteers prior to any medical interventions at Shengjing Hospital of China Medical University (Shenyang, China) from October 2016 to July 2017. Plasma samples were isolated as previously described. The anti-coagulant for peripheral blood samples was ethylenediaminetetraacetic acid (EDTA). Clinical information was collected for all patients and healthy volunteers.
Tumors were staged according to the 8th tumor-node-metastasis (TNM) staging system drafted by the International Union Against Cancer. No patients received radiotherapy, chemotherapy, or targeted therapy before surgery. All patients and healthy volunteers provided written informed consent before the procedure. The Institutional Review Board of China Medical University approved this study based on the Helsinki Declaration.
Cell cultureThe normal pancreatic cell lines, HPC-Y5 and HPDE6-C7, were obtained from the Cell Bank of the Chinese Academy of Sciences (Shanghai, China). The pancreatic cancer cell lines, Capan-2, Panc-1, SW1990, and AsPC-1, were obtained from ATCC (Manassas, United States). HPC-Y5, HPDE6-C7, and Panc-1 cells were cultured in Dulbecco’s modified Eagle’s medium (DMEM) (Gibco, Gaithersburg, MD, United States); Capan-2 and AsPC-1 cells were cultured in RPMI-1640 medium (Gibco, Gaithersburg, MD, United States); and SW1990 cells were cultured in Leibovitz's L-15 medium (Gibco, Gaithersburg, MD, United States). All media contained 10% fetal bovine serum (FBS) (Gibco, Gaithersburg, MD, United States) and all cells were cultured in a humidified atmosphere consisting of 5% CO2 and 95% air at 37 ℃.
Total RNA extractionTotal RNA from all cell lines, pancreatic cancer tissues, and paired adjacent tissues was extracted using TRIzol reagent (Invitrogen, Carlsbad, CA, United States). Total RNA in plasma samples was extracted using a mirVana PARIS Kit (Ambion, Carlsbad, CA, United States) following the manufacturer’s instructions. Quantity
and quality of RNA were determined spectrophoto-metrically at 260 nm and 280 nm. The integrity and contamination were confirmed using denaturing agarose gel electrophoresis.
Reverse transcriptionTotal RNA was reverse transcribed using a PrimeScript reagent kit with gRNA Eraser (Random primers) (TaKaRa, Dalian, China) according to the manufacturer’s instructions.
Sanger sequencingTo precisely examine the primer sequences of circ-LDLRAD3, Sanger sequencing was utilized. In brief, a T vector carrying the target fragment was utilized for Sanger sequencing in order to determine the back-spliced junction of circ-LDLRAD3. The following diverg-ent primers were synthesized by Geneseed Biotech (Guangzhou, China): 5’-CTTGCTGGACCAGAGAAC-3’ (forward) and 5’-CATGAGGTTGTTCCGCTTC-3’ (reverse). Sanger sequencing was performed by the same company.
circ-LDLRAD3 detection using qRT-PCR Real-time quantitative reverse transcription polymerase chain reactions (qRT-PCR) was performed using a Roche 480II system (Roche, Basel, Switzerland) utilizing SYBR Premix Ex Taq Ⅱ (Tli RNaseH Plus) (Takara, Dalian, China), following the manufacturer-provided instructions. Primers for GAPDH were synthesized by Sangon Biotech (Shanghai, China) as follows: 5’-GCACCGTCAAGGCTGAGAAC-3’ (forward) and 5’-TGGTGAAGACGCCAGTGGA-3’ (reverse). The data were analyzed using the comparative cycle threshold (ΔCT) method after three independent experiments. All results are expressed as the mean ± SD.
Serological tumor-associated marker analysisSerum carbohydrate antigen 19-9 (CA19-9) and carcinoembryonic antigen (CEA) were measured using a Roche E601 machine (Roche, Basel, Switzerland) with a cutoff value of 40 U/mL and 5 ng/mL, respectively.
Statistical analysisAll statistical data were analyzed using SPSS 23.0 (SPSS, Chicago, IL, United States), GraphPad 7.0 (GraphPad Software, La Jolla, CA, United States), and SigmaPlot 12.5 (SigmaPlot Software, La Jolla, CA, United States). Differences in expression levels of circ-LDLRAD3 between pancreatic cancer tissues and paired adjacent non-tumorous tissues were compared by using paired t-tests, and differences in expression levels of circ-LDLRAD3 between plasma samples from patients with pancreatic cancer and those from healthy volunteers were compared by Student’s t-tests. A Fisher’s exact test was used to analyze the association between circ-LDLRAD3 expression and patients’ clinicopathological factors. A Spearman’s
8347 December 21, 2017|Volume 23|Issue 47|WJG|www.wjgnet.com
Yang F et al . circ-LDLRAD3 in pancreatic cancer
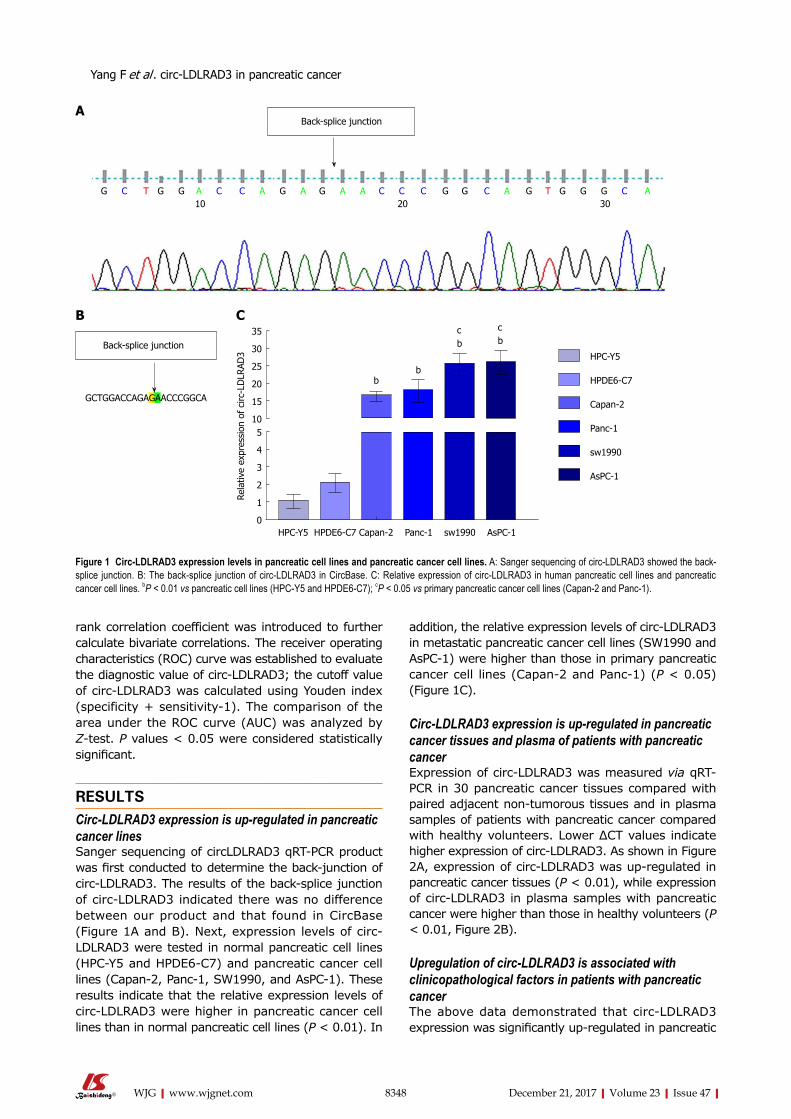
8348 December 21, 2017|Volume 23|Issue 47|WJG|www.wjgnet.com
addition, the relative expression levels of circ-LDLRAD3 in metastatic pancreatic cancer cell lines (SW1990 and AsPC-1) were higher than those in primary pancreatic cancer cell lines (Capan-2 and Panc-1) (P < 0.05) (Figure 1C).
Circ-LDLRAD3 expression is up-regulated in pancreatic cancer tissues and plasma of patients with pancreatic cancerExpression of circ-LDLRAD3 was measured via qRT-PCR in 30 pancreatic cancer tissues compared with paired adjacent non-tumorous tissues and in plasma samples of patients with pancreatic cancer compared with healthy volunteers. Lower ΔCT values indicate higher expression of circ-LDLRAD3. As shown in Figure 2A, expression of circ-LDLRAD3 was up-regulated in pancreatic cancer tissues (P < 0.01), while expression of circ-LDLRAD3 in plasma samples with pancreatic cancer were higher than those in healthy volunteers (P < 0.01, Figure 2B).
Upregulation of circ-LDLRAD3 is associated with clinicopathological factors in patients with pancreatic cancerThe above data demonstrated that circ-LDLRAD3 expression was significantly up-regulated in pancreatic
rank correlation coefficient was introduced to further calculate bivariate correlations. The receiver operating characteristics (ROC) curve was established to evaluate the diagnostic value of circ-LDLRAD3; the cutoff value of circ-LDLRAD3 was calculated using Youden index (specificity + sensitivity-1). The comparison of the area under the ROC curve (AUC) was analyzed by Z-test. P values < 0.05 were considered statistically significant.
RESULTSCirc-LDLRAD3 expression is up-regulated in pancreatic cancer linesSanger sequencing of circLDLRAD3 qRT-PCR product was first conducted to determine the back-junction of circ-LDLRAD3. The results of the back-splice junction of circ-LDLRAD3 indicated there was no difference between our product and that found in CircBase (Figure 1A and B). Next, expression levels of circ-LDLRAD3 were tested in normal pancreatic cell lines (HPC-Y5 and HPDE6-C7) and pancreatic cancer cell lines (Capan-2, Panc-1, SW1990, and AsPC-1). These results indicate that the relative expression levels of circ-LDLRAD3 were higher in pancreatic cancer cell lines than in normal pancreatic cell lines (P < 0.01). In
back-splice junction
G C T G G A C C A G A G A A C C C G G C A G T G G G C A10 20 30
GCTGGACCAGAGAACCCGGCA
back-splice junction
bb
cb
cb
35
30
25
20
15
105
4
3
2
1
0
Rela
tive
expr
essi
on o
f ci
rc-L
DLR
AD3
HPC-Y5 HPDE6-C7 Capan-2 Panc-1 sw1990 AsPC-1
HPC-Y5
HPDE6-C7
Capan-2
Panc-1
sw1990
AsPC-1
A
B C
Figure 1 Circ-LDLRAD3 expression levels in pancreatic cell lines and pancreatic cancer cell lines. A: Sanger sequencing of circ-LDLRAD3 showed the back-splice junction. B: The back-splice junction of circ-LDLRAD3 in CircBase. C: Relative expression of circ-LDLRAD3 in human pancreatic cell lines and pancreatic cancer cell lines. bP < 0.01 vs pancreatic cell lines (HPC-Y5 and HPDE6-C7); cP < 0.05 vs primary pancreatic cancer cell lines (Capan-2 and Panc-1).
Yang F et al . circ-LDLRAD3 in pancreatic cancer
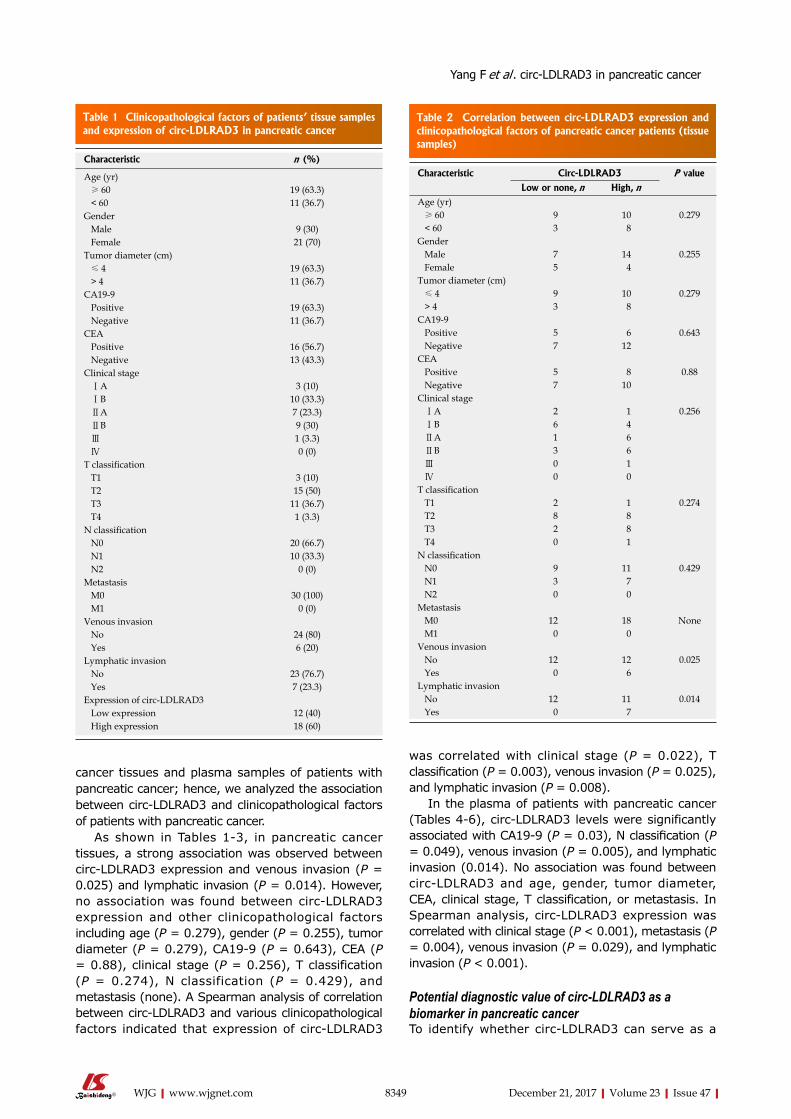
8349 December 21, 2017|Volume 23|Issue 47|WJG|www.wjgnet.com
cancer tissues and plasma samples of patients with pancreatic cancer; hence, we analyzed the association between circ-LDLRAD3 and clinicopathological factors of patients with pancreatic cancer.
As shown in Tables 1-3, in pancreatic cancer tissues, a strong association was observed between circ-LDLRAD3 expression and venous invasion (P = 0.025) and lymphatic invasion (P = 0.014). However, no association was found between circ-LDLRAD3 expression and other clinicopathological factors including age (P = 0.279), gender (P = 0.255), tumor diameter (P = 0.279), CA19-9 (P = 0.643), CEA (P = 0.88), clinical stage (P = 0.256), T classification (P = 0.274), N classification (P = 0.429), and metastasis (none). A Spearman analysis of correlation between circ-LDLRAD3 and various clinicopathological factors indicated that expression of circ-LDLRAD3
was correlated with clinical stage (P = 0.022), T classification (P = 0.003), venous invasion (P = 0.025), and lymphatic invasion (P = 0.008).
In the plasma of patients with pancreatic cancer (Tables 4-6), circ-LDLRAD3 levels were significantly associated with CA19-9 (P = 0.03), N classification (P = 0.049), venous invasion (P = 0.005), and lymphatic invasion (0.014). No association was found between circ-LDLRAD3 and age, gender, tumor diameter, CEA, clinical stage, T classification, or metastasis. In Spearman analysis, circ-LDLRAD3 expression was correlated with clinical stage (P < 0.001), metastasis (P = 0.004), venous invasion (P = 0.029), and lymphatic invasion (P < 0.001).
Potential diagnostic value of circ-LDLRAD3 as a biomarker in pancreatic cancer To identify whether circ-LDLRAD3 can serve as a
Table 1 Clinicopathological factors of patients’ tissue samples and expression of circ-LDLRAD3 in pancreatic cancer
Characteristic n (%)
Age (yr) ≥ 60 19 (63.3) < 60 11 (36.7)Gender Male 9 (30) Female 21 (70)Tumor diameter (cm) ≤ 4 19 (63.3) > 4 11 (36.7)CA19-9 Positive 19 (63.3) Negative 11 (36.7)CEA Positive 16 (56.7) Negative 13 (43.3)Clinical stage ⅠA 3 (10) ⅠB 10 (33.3) ⅡA 7 (23.3) ⅡB 9 (30) Ⅲ 1 (3.3) Ⅳ 0 (0)T classification T1 3 (10) T2 15 (50) T3 11 (36.7) T4 1 (3.3)N classification N0 20 (66.7) N1 10 (33.3) N2 0 (0)Metastasis M0 30 (100) M1 0 (0)Venous invasion No 24 (80) Yes 6 (20)Lymphatic invasion No 23 (76.7) Yes 7 (23.3)Expression of circ-LDLRAD3 Low expression 12 (40) High expression 18 (60)
Table 2 Correlation between circ-LDLRAD3 expression and clinicopathological factors of pancreatic cancer patients (tissue samples)
Characteristic Circ-LDLRAD3 P value
Low or none, n High, nAge (yr) ≥ 60 9 10 0.279 < 60 3 8Gender Male 7 14 0.255 Female 5 4Tumor diameter (cm) ≤ 4 9 10 0.279 > 4 3 8CA19-9 Positive 5 6 0.643 Negative 7 12CEA Positive 5 8 0.88 Negative 7 10Clinical stage ⅠA 2 1 0.256 ⅠB 6 4 ⅡA 1 6 ⅡB 3 6 Ⅲ 0 1 Ⅳ 0 0T classification T1 2 1 0.274 T2 8 8 T3 2 8 T4 0 1N classification N0 9 11 0.429 N1 3 7 N2 0 0Metastasis M0 12 18 None M1 0 0Venous invasion No 12 12 0.025 Yes 0 6Lymphatic invasion No 12 11 0.014 Yes 0 7
Yang F et al . circ-LDLRAD3 in pancreatic cancer
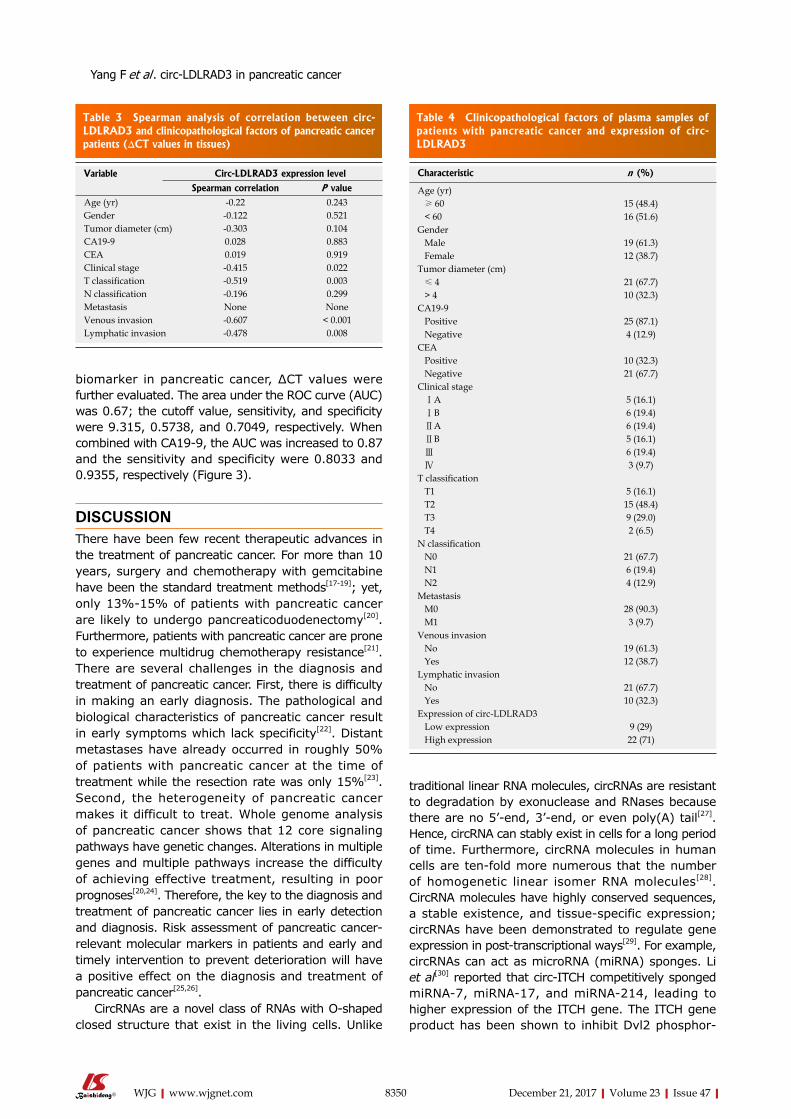
8350 December 21, 2017|Volume 23|Issue 47|WJG|www.wjgnet.com
biomarker in pancreatic cancer, ΔCT values were further evaluated. The area under the ROC curve (AUC) was 0.67; the cutoff value, sensitivity, and specificity were 9.315, 0.5738, and 0.7049, respectively. When combined with CA19-9, the AUC was increased to 0.87 and the sensitivity and specificity were 0.8033 and 0.9355, respectively (Figure 3).
DISCUSSIONThere have been few recent therapeutic advances in the treatment of pancreatic cancer. For more than 10 years, surgery and chemotherapy with gemcitabine have been the standard treatment methods[17-19]; yet, only 13%-15% of patients with pancreatic cancer are likely to undergo pancreaticoduodenectomy[20]. Furthermore, patients with pancreatic cancer are prone to experience multidrug chemotherapy resistance[21]. There are several challenges in the diagnosis and treatment of pancreatic cancer. First, there is difficulty in making an early diagnosis. The pathological and biological characteristics of pancreatic cancer result in early symptoms which lack specificity[22]. Distant metastases have already occurred in roughly 50% of patients with pancreatic cancer at the time of treatment while the resection rate was only 15%[23]. Second, the heterogeneity of pancreatic cancer makes it difficult to treat. Whole genome analysis of pancreatic cancer shows that 12 core signaling pathways have genetic changes. Alterations in multiple genes and multiple pathways increase the difficulty of achieving effective treatment, resulting in poor prognoses[20,24]. Therefore, the key to the diagnosis and treatment of pancreatic cancer lies in early detection and diagnosis. Risk assessment of pancreatic cancer-relevant molecular markers in patients and early and timely intervention to prevent deterioration will have a positive effect on the diagnosis and treatment of pancreatic cancer[25,26].
CircRNAs are a novel class of RNAs with O-shaped closed structure that exist in the living cells. Unlike
traditional linear RNA molecules, circRNAs are resistant to degradation by exonuclease and RNases because there are no 5’-end, 3’-end, or even poly(A) tail[27]. Hence, circRNA can stably exist in cells for a long period of time. Furthermore, circRNA molecules in human cells are ten-fold more numerous that the number of homogenetic linear isomer RNA molecules[28]. CircRNA molecules have highly conserved sequences, a stable existence, and tissue-specific expression; circRNAs have been demonstrated to regulate gene expression in post-transcriptional ways[29]. For example, circRNAs can act as microRNA (miRNA) sponges. Li et al[30] reported that circ-ITCH competitively sponged miRNA-7, miRNA-17, and miRNA-214, leading to higher expression of the ITCH gene. The ITCH gene product has been shown to inhibit Dvl2 phosphor-
Table 3 Spearman analysis of correlation between circ-LDLRAD3 and clinicopathological factors of pancreatic cancer patients (ΔCT values in tissues)
Variable Circ-LDLRAD3 expression level
Spearman correlation P valueAge (yr) -0.22 0.243Gender -0.122 0.521Tumor diameter (cm) -0.303 0.104CA19-9 0.028 0.883CEA 0.019 0.919Clinical stage -0.415 0.022T classification -0.519 0.003N classification -0.196 0.299Metastasis None NoneVenous invasion -0.607 < 0.001Lymphatic invasion -0.478 0.008
Table 4 Clinicopathological factors of plasma samples of patients with pancreatic cancer and expression of circ-LDLRAD3
Characteristic n (%)
Age (yr) ≥ 60 15 (48.4) < 60 16 (51.6)Gender Male 19 (61.3) Female 12 (38.7)Tumor diameter (cm) ≤ 4 21 (67.7) > 4 10 (32.3)CA19-9 Positive 25 (87.1) Negative 4 (12.9)CEA Positive 10 (32.3) Negative 21 (67.7)Clinical stage ⅠA 5 (16.1) ⅠB 6 (19.4) ⅡA 6 (19.4) ⅡB 5 (16.1) Ⅲ 6 (19.4) Ⅳ 3 (9.7)T classification T1 5 (16.1) T2 15 (48.4) T3 9 (29.0) T4 2 (6.5)N classification N0 21 (67.7) N1 6 (19.4) N2 4 (12.9)Metastasis M0 28 (90.3) M1 3 (9.7)Venous invasion No 19 (61.3) Yes 12 (38.7)Lymphatic invasion No 21 (67.7) Yes 10 (32.3)Expression of circ-LDLRAD3 Low expression 9 (29) High expression 22 (71)
Yang F et al . circ-LDLRAD3 in pancreatic cancer
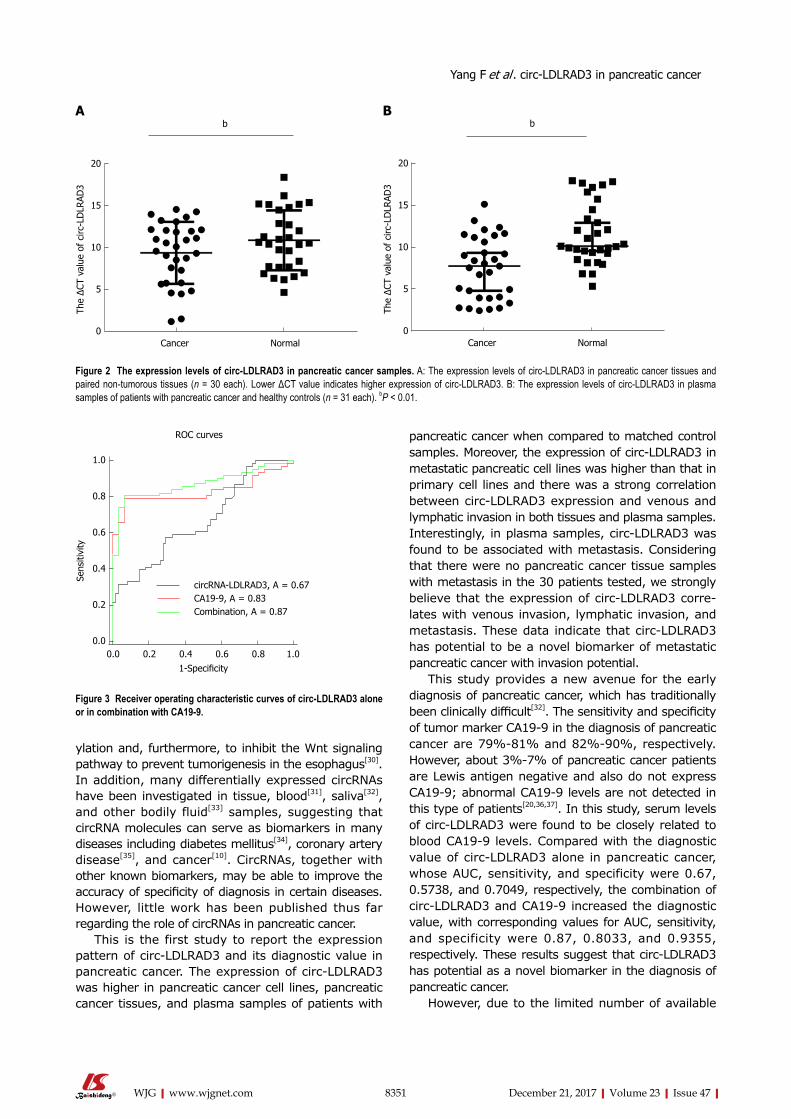
8351 December 21, 2017|Volume 23|Issue 47|WJG|www.wjgnet.com
ylation and, furthermore, to inhibit the Wnt signaling pathway to prevent tumorigenesis in the esophagus[30]. In addition, many differentially expressed circRNAs have been investigated in tissue, blood[31], saliva[32], and other bodily fluid[33] samples, suggesting that circRNA molecules can serve as biomarkers in many diseases including diabetes mellitus[34], coronary artery disease[35], and cancer[10]. CircRNAs, together with other known biomarkers, may be able to improve the accuracy of specificity of diagnosis in certain diseases. However, little work has been published thus far regarding the role of circRNAs in pancreatic cancer.
This is the first study to report the expression pattern of circ-LDLRAD3 and its diagnostic value in pancreatic cancer. The expression of circ-LDLRAD3 was higher in pancreatic cancer cell lines, pancreatic cancer tissues, and plasma samples of patients with
pancreatic cancer when compared to matched control samples. Moreover, the expression of circ-LDLRAD3 in metastatic pancreatic cell lines was higher than that in primary cell lines and there was a strong correlation between circ-LDLRAD3 expression and venous and lymphatic invasion in both tissues and plasma samples. Interestingly, in plasma samples, circ-LDLRAD3 was found to be associated with metastasis. Considering that there were no pancreatic cancer tissue samples with metastasis in the 30 patients tested, we strongly believe that the expression of circ-LDLRAD3 corre-lates with venous invasion, lymphatic invasion, and metastasis. These data indicate that circ-LDLRAD3 has potential to be a novel biomarker of metastatic pancreatic cancer with invasion potential.
This study provides a new avenue for the early diagnosis of pancreatic cancer, which has traditionally been clinically difficult[32]. The sensitivity and specificity of tumor marker CA19-9 in the diagnosis of pancreatic cancer are 79%-81% and 82%-90%, respectively. However, about 3%-7% of pancreatic cancer patients are Lewis antigen negative and also do not express CA19-9; abnormal CA19-9 levels are not detected in this type of patients[20,36,37]. In this study, serum levels of circ-LDLRAD3 were found to be closely related to blood CA19-9 levels. Compared with the diagnostic value of circ-LDLRAD3 alone in pancreatic cancer, whose AUC, sensitivity, and specificity were 0.67, 0.5738, and 0.7049, respectively, the combination of circ-LDLRAD3 and CA19-9 increased the diagnostic value, with corresponding values for AUC, sensitivity, and specificity were 0.87, 0.8033, and 0.9355, respectively. These results suggest that circ-LDLRAD3 has potential as a novel biomarker in the diagnosis of pancreatic cancer.
However, due to the limited number of available
20
15
10
5
0
The
ΔCT
valu
e of
circ
-LD
LRAD
3
Cancer Normal
b
20
15
10
5
0
The
ΔCT
valu
e of
circ
-LD
LRAD
3
Cancer Normal
bA B
Figure 2 The expression levels of circ-LDLRAD3 in pancreatic cancer samples. A: The expression levels of circ-LDLRAD3 in pancreatic cancer tissues and paired non-tumorous tissues (n = 30 each). Lower ΔCT value indicates higher expression of circ-LDLRAD3. B: The expression levels of circ-LDLRAD3 in plasma samples of patients with pancreatic cancer and healthy controls (n = 31 each). bP < 0.01.
1.0
0.8
0.6
0.4
0.2
0.0
Sens
itivi
ty
1-Specificity0.0 0.2 0.4 0.6 0.8 1.0
circRNA-LDLRAD3, A = 0.67CA19-9, A = 0.83Combination, A = 0.87
ROC curves
Figure 3 Receiver operating characteristic curves of circ-LDLRAD3 alone or in combination with CA19-9.
Yang F et al . circ-LDLRAD3 in pancreatic cancer
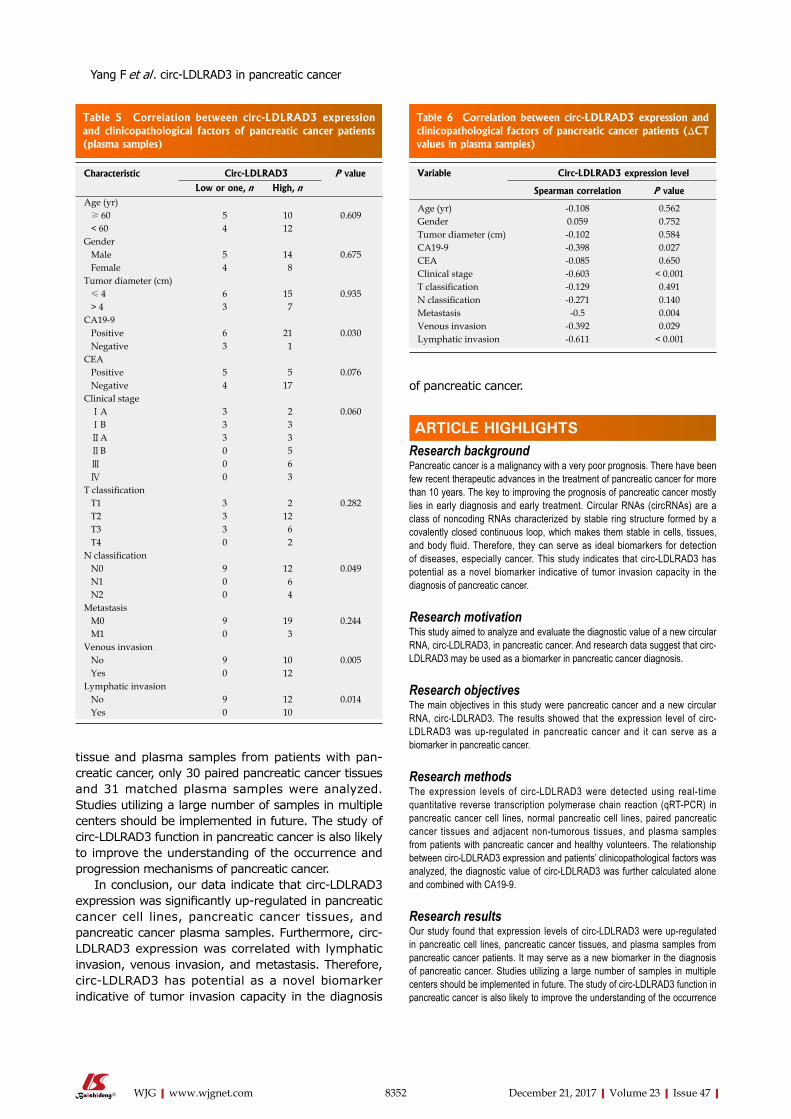
8352 December 21, 2017|Volume 23|Issue 47|WJG|www.wjgnet.com
tissue and plasma samples from patients with pan-creatic cancer, only 30 paired pancreatic cancer tissues and 31 matched plasma samples were analyzed. Studies utilizing a large number of samples in multiple centers should be implemented in future. The study of circ-LDLRAD3 function in pancreatic cancer is also likely to improve the understanding of the occurrence and progression mechanisms of pancreatic cancer.
In conclusion, our data indicate that circ-LDLRAD3 expression was significantly up-regulated in pancreatic cancer cell lines, pancreatic cancer tissues, and pancreatic cancer plasma samples. Furthermore, circ-LDLRAD3 expression was correlated with lymphatic invasion, venous invasion, and metastasis. Therefore, circ-LDLRAD3 has potential as a novel biomarker indicative of tumor invasion capacity in the diagnosis
of pancreatic cancer.
ARTICLE HIGHLIGHTSResearch backgroundPancreatic cancer is a malignancy with a very poor prognosis. There have been few recent therapeutic advances in the treatment of pancreatic cancer for more than 10 years. The key to improving the prognosis of pancreatic cancer mostly lies in early diagnosis and early treatment. Circular RNAs (circRNAs) are a class of noncoding RNAs characterized by stable ring structure formed by a covalently closed continuous loop, which makes them stable in cells, tissues, and body fluid. Therefore, they can serve as ideal biomarkers for detection of diseases, especially cancer. This study indicates that circ-LDLRAD3 has potential as a novel biomarker indicative of tumor invasion capacity in the diagnosis of pancreatic cancer.
Research motivationThis study aimed to analyze and evaluate the diagnostic value of a new circular RNA, circ-LDLRAD3, in pancreatic cancer. And research data suggest that circ-LDLRAD3 may be used as a biomarker in pancreatic cancer diagnosis.
Research objectivesThe main objectives in this study were pancreatic cancer and a new circular RNA, circ-LDLRAD3. The results showed that the expression level of circ-LDLRAD3 was up-regulated in pancreatic cancer and it can serve as a biomarker in pancreatic cancer.
Research methodsThe expression levels of circ-LDLRAD3 were detected using real-time quantitative reverse transcription polymerase chain reaction (qRT-PCR) in pancreatic cancer cell lines, normal pancreatic cell lines, paired pancreatic cancer tissues and adjacent non-tumorous tissues, and plasma samples from patients with pancreatic cancer and healthy volunteers. The relationship between circ-LDLRAD3 expression and patients’ clinicopathological factors was analyzed, the diagnostic value of circ-LDLRAD3 was further calculated alone and combined with CA19-9.
Research resultsOur study found that expression levels of circ-LDLRAD3 were up-regulated in pancreatic cell lines, pancreatic cancer tissues, and plasma samples from pancreatic cancer patients. It may serve as a new biomarker in the diagnosis of pancreatic cancer. Studies utilizing a large number of samples in multiple centers should be implemented in future. The study of circ-LDLRAD3 function in pancreatic cancer is also likely to improve the understanding of the occurrence
Table 5 Correlation between circ-LDLRAD3 expression and clinicopathological factors of pancreatic cancer patients (plasma samples)
Characteristic Circ-LDLRAD3 P value
Low or one, n High, nAge (yr) ≥ 60 5 10 0.609 < 60 4 12Gender Male 5 14 0.675 Female 4 8Tumor diameter (cm) ≤ 4 6 15 0.935 > 4 3 7CA19-9 Positive 6 21 0.030 Negative 3 1CEA Positive 5 5 0.076 Negative 4 17Clinical stage ⅠA 3 2 0.060 ⅠB 3 3 ⅡA 3 3 ⅡB 0 5 Ⅲ 0 6 Ⅳ 0 3T classification T1 3 2 0.282 T2 3 12 T3 3 6 T4 0 2N classification N0 9 12 0.049 N1 0 6 N2 0 4Metastasis M0 9 19 0.244 M1 0 3Venous invasion No 9 10 0.005 Yes 0 12Lymphatic invasion No 9 12 0.014 Yes 0 10
Table 6 Correlation between circ-LDLRAD3 expression and clinicopathological factors of pancreatic cancer patients (ΔCT values in plasma samples)
Variable Circ-LDLRAD3 expression level
Spearman correlation P value
Age (yr) -0.108 0.562Gender 0.059 0.752Tumor diameter (cm) -0.102 0.584CA19-9 -0.398 0.027CEA -0.085 0.650Clinical stage -0.603 < 0.001T classification -0.129 0.491N classification -0.271 0.140Metastasis -0.5 0.004Venous invasion -0.392 0.029Lymphatic invasion -0.611 < 0.001
ARTICLE HIGHLIGHTS
Yang F et al . circ-LDLRAD3 in pancreatic cancer
8353 December 21, 2017|Volume 23|Issue 47|WJG|www.wjgnet.com
and progression mechanisms of pancreatic cancer.
Research conclusionsThis study indicated that the expression of a new circular RNA, circ-LDLRAD3, was significantly up-regulated in pancreatic cancer cell lines, pancreatic cancer tissues, and pancreatic cancer plasma samples. Furthermore, circ-LDLRAD3 expression was correlated with lymphatic invasion, venous invasion, and metastasis. Therefore, circ-LDLRAD3 has potential as a novel biomarker indicative of tumor invasion capacity in the diagnosis of pancreatic cancer. It is highly believed that the key to improving the prognosis of pancreatic cancer mostly lies in early diagnosis and early treatment. Therefore, searching for ideal biomarkers is essential. Circular RNAs are a class of non-coding RNAs which are stable because of their unique circular structure. Previous studies have confirmed that some circRNAs can serve as biomarkers in certain diseases. In this study, we focused a new circular RNA, circ-LDLRAD3, and hypothesized that expression levels of circ-LDLRAD3 were up-regulated in pancreatic cancer. Moreover, this study verified the hypothesis and found that expression levels of circ-LDLRAD3 were significantly up-regulated in pancreatic cancer cell lines, pancreatic cancer tissues, and pancreatic cancer plasma samples, whose expression levels were correlated with lymphatic invasion, venous invasion, and metastasis. Therefore, circ-LDLRAD3 may be a new biomarker in the diagnosis of pancreatic cancer.
Research perspectivesThis is the first study to report the expression pattern of circ-LDLRAD3 and its diagnostic value in pancreatic cancer and provides a new avenue for the early diagnosis of pancreatic cancer. However, due to the limited number of available tissue and plasma samples from patients with pancreatic cancer, studies utilizing a large number of samples in multiple centers should be implemented in future. The study of circ-LDLRAD3 function in pancreatic cancer is also likely to improve the understanding of the occurrence and progression mechanisms of pancreatic cancer. And more types of circular RNAs and their relationship with pancreatic cancer should be verified in the future research.
REFERENCES1 Dimastromatteo J, Houghton JL, Lewis JS, Kelly KA. Challenges
of Pancreatic Cancer. Cancer J 2015; 21: 188-193 [PMID: 26049698 DOI: 10.1097/PPO.0000000000000109]
2 Yamane S, Katada C, Tanabe S, Azuma M, Ishido K, Yano T, Wada T, Watanabe A, Kawanishi N, Furue Y, Kondo Y, Komori S, Ishiyama H, Hayakawa K, Koizumi W. Clinical Outcomes in Patients with Cancer of Unknown Primary Site Treated By Gastrointestinal Oncologists. J Transl Int Med 2017; 5: 58-63 [PMID: 28680840 DOI: 10.1515/jtim-2017-0006]
3 Chen W, Zheng R, Baade PD, Zhang S, Zeng H, Bray F, Jemal A, Yu XQ, He J. Cancer statistics in China, 2015. CA Cancer J Clin 2016; 66: 115-132 [PMID: 26808342 DOI: 10.3322/caac.21338]
4 Siegel RL, Miller KD, Jemal A. Cancer Statistics, 2017. CA Cancer J Clin 2017; 67: 7-30 [PMID: 28055103 DOI: 10.3322/caac.21387]
5 Kamisawa T, Wood LD, Itoi T, Takaori K. Pancreatic cancer. Lancet 2016; 388: 73-85 [PMID: 26830752 DOI: 10.1016/S0140-6736(16)00141-0]
6 Korenblit J, Tholey DM, Tolin J, Loren D, Kowalski T, Adler DG, Davolos J, Siddiqui AA. Effect of the time of day and queue position in the endoscopic schedule on the performance characteristics of endoscopic ultrasound-guided fine-needle aspiration for diagnosing pancreatic malignancies. Endosc Ultrasound 2016; 5: 78-84 [PMID: 27080605 DOI: 10.4103/2303-9027.180470]
7 Ozkan M, Cakiroglu M, Kocaman O, Kurt M, Yilmaz B, Can G, Korkmaz U, Dandil E, Eksi Z. Age-based computer-aided diagnosis approach for pancreatic cancer on endoscopic ultrasound images. Endosc Ultrasound 2016; 5: 101-107 [PMID: 27080608 DOI: 10.4103/2303-9027.180473]
8 Urayama S. Pancreatic cancer early detection: expanding higher-risk group with clinical and metabolomics parameters. World J Gastroenterol 2015; 21: 1707-1717 [PMID: 25684935 DOI:
10.3748/wjg.v21.i6.1707]9 Huang S, Yang B, Chen BJ, Bliim N, Ueberham U, Arendt T,
Janitz M. The emerging role of circular RNAs in transcriptome regulation. Genomics 2017; 109: 401-407 [PMID: 28655641 DOI: 10.1016/j.ygeno.2017.06.005]
10 Wang Y, Mo Y, Gong Z, Yang X, Yang M, Zhang S, Xiong F, Xiang B, Zhou M, Liao Q, Zhang W, Li X, Li X, Li Y, Li G, Zeng Z, Xiong W. Circular RNAs in human cancer. Mol Cancer 2017; 16: 25 [PMID: 28143578 DOI: 10.1186/s12943-017-0598-7]
11 Cortés-López M, Miura P. Emerging Functions of Circular RNAs. Yale J Biol Med 2016; 89: 527-537 [PMID: 28018143]
12 Peng ZY. The biomarkers for acute kidney injury: A clear road ahead? J Transl Int Med 2016; 4: 95-98 [PMID: 28191528 DOI: 10.1515/jtim-2016-0035]
13 Beermann J, Piccoli MT, Viereck J, Thum T. Non-coding RNAs in Development and Disease: Background, Mechanisms, and Therapeutic Approaches. Physiol Rev 2016; 96: 1297-1325 [PMID: 27535639 DOI: 10.1152/physrev.00041.2015]
14 Glažar P, Papavasileiou P, Rajewsky N. circBase: a database for circular RNAs. RNA 2014; 20: 1666-1670 [PMID: 25234927 DOI: 10.1261/rna.043687.113]
15 Qu S, Song W, Yang X, Wang J, Zhang R, Zhang Z, Zhang H, Li H. Microarray expression profile of circular RNAs in human pancreatic ductal adenocarcinoma. Genom Data 2015; 5: 385-387 [PMID: 26484292 DOI: 10.1016/j.gdata.2015.07.017]
16 Ghosal S, Das S, Sen R, Basak P, Chakrabarti J. Circ2Traits: a comprehensive database for circular RNA potentially associated with disease and traits. Front Genet 2013; 4: 283 [PMID: 24339831 DOI: 10.3389/fgene.2013.00283]
17 Strobel O, Büchler MW. Pancreatic cancer: Clinical practice guidelines - what is the evidence? Nat Rev Clin Oncol 2016; 13: 593-594 [PMID: 27531701 DOI: 10.1038/nrclinonc.2016.127]
18 Makohon-Moore A, Iacobuzio-Donahue CA. Pancreatic cancer biology and genetics from an evolutionary perspective. Nat Rev Cancer 2016; 16: 553-565 [PMID: 27444064 DOI: 10.1038/nrc.2016.66]
19 Van Ryckeghem F. Corticosteroids, the oldest agent in the prevention of chemotherapy-induced nausea and vomiting: What about the guidelines? J Transl Int Med 2016; 4: 46-51 [PMID: 28191518 DOI: 10.1515/jtim-2016-0010]
20 Notta F, Chan-Seng-Yue M, Lemire M, Li Y, Wilson GW, Connor AA, Denroche RE, Liang SB, Brown AM, Kim JC, Wang T, Simpson JT, Beck T, Borgida A, Buchner N, Chadwick D, Hafezi-Bakhtiari S, Dick JE, Heisler L, Hollingsworth MA, Ibrahimov E, Jang GH, Johns J, Jorgensen LG, Law C, Ludkovski O, Lungu I, Ng K, Pasternack D, Petersen GM, Shlush LI, Timms L, Tsao MS, Wilson JM, Yung CK, Zogopoulos G, Bartlett JM, Alexandrov LB, Real FX, Cleary SP, Roehrl MH, McPherson JD, Stein LD, Hudson TJ, Campbell PJ, Gallinger S. Erratum: A renewed model of pancreatic cancer evolution based on genomic rearrangement patterns. Nature 2017; 542: 124 [PMID: 27851734 DOI: 10.1038/nature20164]
21 Roe JS, Hwang CI, Somerville TDD, Milazzo JP, Lee EJ, Da Silva B, Maiorino L, Tiriac H, Young CM, Miyabayashi K, Filippini D, Creighton B, Burkhart RA, Buscaglia JM, Kim EJ, Grem JL, Lazenby AJ, Grunkemeyer JA, Hollingsworth MA, Grandgenett PM, Egeblad M, Park Y, Tuveson DA, Vakoc CR. Enhancer Reprogramming Promotes Pancreatic Cancer Metastasis. Cell 2017; 170: 875-888.e20 [PMID: 28757253 DOI: 10.1016/j.cell.2017.07.007]
22 Michalski CW, Hackert T, Büchler MW. Targeting metabolism in pancreatic cancer. Lancet Oncol 2017; 18: 699-700 [PMID: 28495638 DOI: 10.1016/S1470-2045(17)30304-2]
23 Tsutsumi H, Hara K, Mizuno N, Hijioka S, Imaoka H, Tajika M, Tanaka T, Ishihara M, Yoshimura K, Shimizu Y, Niwa Y, Sasaki Y, Yamao K. Clinical impact of preoperative endoscopic ultrasound-guided fine-needle aspiration for pancreatic ductal adenocarcinoma. Endosc Ultrasound 2016; 5: 94-100 [PMID: 27080607 DOI: 10.4103/2303-9027.180472]
24 Yamabe A, Irisawa A, Bhutani MS, Shibukawa G, Fujisawa
Yang F et al . circ-LDLRAD3 in pancreatic cancer
8354 December 21, 2017|Volume 23|Issue 47|WJG|www.wjgnet.com
M, Sato A, Yoshida Y, Arakawa N, Ikeda T, Igarashi R, Maki T, Yamamoto S. Efforts to improve the diagnostic accuracy of endoscopic ultrasound-guided fine-needle aspiration for pancreatic tumors. Endosc Ultrasound 2016; 5: 225-232 [PMID: 27503153 DOI: 10.4103/2303-9027.187862]
25 Zhu P, Sun S. Endoscopic ultrasound pin-points the precision medicine for pancreatic cancer. Endosc Ultrasound 2016; 5: 1-3 [PMID: 26879159 DOI: 10.4103/2303-9027.175874]
26 Kleeff J, Michl P. Targeted therapy of pancreatic cancer: biomarkers are needed. Lancet Oncol 2017; 18: 421-422 [PMID: 28259609 DOI: 10.1016/S1470-2045(17)30087-6]
27 Qu S, Yang X, Li X, Wang J, Gao Y, Shang R, Sun W, Dou K, Li H. Circular RNA: A new star of noncoding RNAs. Cancer Lett 2015; 365: 141-148 [PMID: 26052092 DOI: 10.1016/j.canlet.2015.06.003]
28 Chen LL. The biogenesis and emerging roles of circular RNAs. Nat Rev Mol Cell Biol 2016; 17: 205-211 [PMID: 26908011 DOI: 10.1038/nrm.2015.32]
29 Hansen TB, Jensen TI, Clausen BH, Bramsen JB, Finsen B, Damgaard CK, Kjems J. Natural RNA circles function as efficient microRNA sponges. Nature 2013; 495: 384-388 [PMID: 23446346 DOI: 10.1038/nature11993]
30 Li F, Zhang L, Li W, Deng J, Zheng J, An M, Lu J, Zhou Y. Circular RNA ITCH has inhibitory effect on ESCC by suppressing the Wnt/β-catenin pathway. Oncotarget 2015; 6: 6001-6013 [PMID: 25749389 DOI: 10.18632/oncotarget.3469]
31 Zhang YG, Yang HL, Long Y, Li WL. Circular RNA in blood
corpuscles combined with plasma protein factor for early prediction of pre-eclampsia. BJOG 2016; 123: 2113-2118 [PMID: 26846540 DOI: 10.1111/1471-0528.13897]
32 Bahn JH, Zhang Q, Li F, Chan TM, Lin X, Kim Y, Wong DT, Xiao X. The landscape of microRNA, Piwi-interacting RNA, and circular RNA in human saliva. Clin Chem 2015; 61: 221-230 [PMID: 25376581 DOI: 10.1373/clinchem.2014.230433]
33 Qu S, Zhong Y, Shang R, Zhang X, Song W, Kjems J, Li H. The emerging landscape of circular RNA in life processes. RNA Biol 2017; 14: 992-999 [PMID: 27617908 DOI: 10.1080/15476286.2016.1220473]
34 Zhao Z, Li X, Jian D, Hao P, Rao L, Li M. Hsa_circ_0054633 in peripheral blood can be used as a diagnostic biomarker of pre-diabetes and type 2 diabetes mellitus. Acta Diabetol 2017; 54: 237-245 [PMID: 27878383 DOI: 10.1007/s00592-016-0943-0]
35 Zhao Z, Li X, Gao C, Jian D, Hao P, Rao L, Li M. Peripheral blood circular RNA hsa_circ_0124644 can be used as a diagnostic biomarker of coronary artery disease. Sci Rep 2017; 7: 39918 [PMID: 28045102 DOI: 10.1038/srep39918]
36 Bhutani MS, Koduru P, Joshi V, Saxena P, Suzuki R, Irisawa A, Yamao K. The role of endoscopic ultrasound in pancreatic cancer screening. Endosc Ultrasound 2016; 5: 8-16 [PMID: 26879161 DOI: 10.4103/2303-9027.175876]
37 Mohammad Alizadeh AH, Shahrokh S, Hadizadeh M, Padashi M, Zali MR. Diagnostic potency of EUS-guided FNA for the evaluation of pancreatic mass lesions. Endosc Ultrasound 2016; 5: 30-34 [PMID: 26879164 DOI: 10.4103/2303-9027.175879]
P- Reviewer: Chamberlain MC, Higuchi K, Jones G S- Editor: Gong ZM L- Editor: Wang TQ E- Editor: Huang Y
Yang F et al . circ-LDLRAD3 in pancreatic cancer
Kosuke Kaji, Hiroaki Takaya, Soichiro Saikawa, Masanori Furukawa, Shinya Sato, Hideto Kawaratani, Mitsuteru Kitade, Kei Moriya, Tadashi Namisaki, Takemi Akahane, Akira Mitoro, Hitoshi Yoshiji, Third Department of Internal Medicine, Nara Medical University, Kashihara 634-8522, Japan
ORCID number: Kosuke Kaji (0000-0002-1822-6759); Hiroaki Takaya (0000-0002-4990-7573); Soichiro Saikawa (0000-0002 -3440-050X); Masanori Furukawa (0000-0002-9317-9083); Shinya Sato (0000-0003-3049-3443); Hideto Kawaratani (0000-0002 -4361-0592); Mitsuteru Kitade (0000-0001-7592-7589); Kei Moriya (0000-0002-2878-8296); Tadashi Namisaki (0000-0002 -3158-5318); Takemi Akahane (0000-0002-6675-0475); Akira Mitoro (0000-0002-6666-5633); Hitoshi Yoshiji (0000-0002-5243 -8544).
Author contributions: Kaji K collected and analyzed the data, and drafted the manuscript; Takaya H also collected and analyzed the data; Saikawa S, Furukawa M, Sato S, Kawaratani H, Kitade M, Moriya K, Namisaki T, Akahane T and Mitoro A offered the technical or material support; Yoshiji H designed and supervised the study; all authors have read and approved the final version to be published.
Institutional review board statement: The study was reviewed and approved by the Ethics Committee of Nara Medical University (Nara, Japan; Approval number 994).
Informed consent statement: All study participants, or their legal guardian, provided informed written consent prior to study enrollment.
Conflict-of-interest statement: The authors declare that there is no conflict of interest regarding the publication of this paper.
Data sharing statement: Informed consent for data sharing was not obtained but the presented data are anonymized and risk of identification is low.
Open-Access: This article is an open-access article which was selected by an in-house editor and fully peer-reviewed by external reviewers. It is distributed in accordance with the Creative Commons Attribution Non Commercial (CC BY-NC 4.0) license,
which permits others to distribute, remix, adapt, build upon this work non-commercially, and license their derivative works on different terms, provided the original work is properly cited and the use is non-commercial. See: http://creativecommons.org/licenses/by-nc/4.0/
Manuscript source: Unsolicited manuscript
Correspondence to: Kosuke Kaji, MD, PhD, Third Department of Internal Medicine, Nara Medical University, 840 Shijo-cho, Kashihara, Nara 634-8522, Japan. [email protected]: +81-744-22-3051Fax: +81-744-24-7122
Received: October 4, 2017Peer-review started: October 5, 2017First decision: October 25, 2017Revised: October 30, 2017Accepted: November 14, 2017Article in press: November 14, 2017Published online: December 21, 2017
AbstractAIMTo determine the efficacy of rifaximin for hepatic ence-phalopathy (HE) with the linkage of gut microbiome in decompensated cirrhotic patients.
METHODSTwenty patients (12 men and 8 women; median age, 66.8 years; range, 46-81 years) with decompensated cirrhosis (Child-pugh score > 7) underwent cognitive neuropsychological testing, endotoxin analysis, and fecal microbiome assessment at baseline and after 4 wk of treatment with rifaximin 400 mg thrice a day. HE was determined by serum ammonia level and number connection test (NCT)-A. Changes in whole blood endotoxin activity (EA) was analyzed by endotoxin
8355 December 21, 2017|Volume 23|Issue 47|WJG|www.wjgnet.com
ORIGINAL ARTICLE
Rifaximin ameliorates hepatic encephalopathy and endotoxemia without affecting the gut microbiome diversity
Case Control Study
Kosuke Kaji, Hiroaki Takaya, Soichiro Saikawa, Masanori Furukawa, Shinya Sato, Hideto Kawaratani, Mitsuteru Kitade, Kei Moriya, Tadashi Namisaki, Takemi Akahane, Akira Mitoro, Hitoshi Yoshiji
Submit a Manuscript: http://www.f6publishing.com
DOI: 10.3748/wjg.v23.i47.8355
World J Gastroenterol 2017 December 21; 23(47): 8355-8366
ISSN 1007-9327 (print) ISSN 2219-2840 (online)
activity assay. Fecal microbiome was assessed by 16S ribosome RNA (rRNA) gene sequencing.
RESULTSTreatment with rifaximin for 4 wk improved hyper-ammonemia (from 90.6 ± 23.9 μg/dL to 73.1 ± 33.1 μg/dL; P < 0.05) and time required for NCT (from 68.2 ± 17.4 s to 54.9 ± 20.3 s; P < 0.05) in patients who had higher levels at baseline. Endotoxin activity was reduced (from 0.43 ± 0.03 to 0.32 ± 0.09; P < 0.05) in direct correlation with decrease in serum ammonia levels (r = 0.5886, P < 0.05). No statistically significant differences were observed in the diversity estimator (Shannon diversity index) and major components of the gut microbiome between the baseline and after treatment groups (3.948 ± 0.548 at baseline vs 3.980 ± 0.968 after treatment; P = 0.544), but the relative abundances of genus Veillonella and Streptococcus were lowered.
CONCLUSIONRifaximin significantly improved cognition and reduced endotoxin activity without significantly affecting the composition of the gut microbiome in patients with decompensated cirrhosis.
Key words: gut microbiome; Hepatic encephalopathy; Liver cirrhosis; Endotoxin; Rifaximin
© The Author(s) 2017. Published by Baishideng Publishing group Inc. All rights reserved.
Core tip: Hepatic encephalopathy (HE) is characterized by deficits in cognitive, psychiatric, and motor function and ranges in severity from minimal to overt HE and coma. Rifaximin is used for standard treatment of HE, targeting reduction of ammonia and gut bacterial translocation. This study demonstrates that rifaximin improves hyperammonemia and cognitive impairment with the linkage of decreased endotoxin activity in patients with decompensated cirrhosis. The diversity and major components of gut microbiome analyzed by 16S rRNA gene sequencing are not altered by treatment with rifaximin. This is the first report of systemic and local effects of rifaximin in Japanese patients.
Kaji K, Takaya H, Saikawa S, Furukawa M, Sato S, Kawaratani
H, Kitade M, Moriya K, Namisaki T, Akahane T, Mitoro A, Yoshiji H. Rifaximin ameliorates hepatic encephalopathy and endotoxemia without affecting the gut microbiome diversity. World J Gastroenterol 2017; 23(47): 8355-8366 Available from: URL: http://www.wjgnet.com/1007-9327/full/v23/i47/8355.htm DOI: http://dx.doi.org/10.3748/wjg.v23.i47.8355
INTRODUCTIONHepatic encephalopathy (HE) is a spectrum of neuropsychiatric syndromes that form major complications
in patients with acute or chronic liver disease[1]. It is characterized by a wide range of changes in the mental state from minimal signs of altered brain function to deep coma. Minimal HE is the earliest stage; it occurs in up to 80% of patients with cirrhosis and manifests as abnormalities in the central nervous system function[2,3]. Recent pathophysiological evidence suggests that alterations in the gut microbiome could be critical to bacterial translocation, hyperammonemia, and systemic inflammation, leading to the development of HE[47]. Bacterial overgrowth in the gut microbiome is closely associated with the severity of liver disease, and patients with overt HE reportedly reveal significant changes in the enteric microbiota compared with those with minimal HE[47]. Recent randomized clinical trial has reported that fecal microbiota transplantation, a newly developed microbiometargeted therapy, has the potential to improve HE[8].
Considering the pathogenesis of microbebased HE, endotoxemia is known to play a potentially cardinal role in the development of systemic inflammation and neuroinflammation. In patients with advanced cirrhosis, endotoxin increases the permeability of the bloodbrain barrier and enhances astrocyte swelling via nitric oxide and prostanoid production in the brain microglia[911]. Clinical evidence suggests that endotoxemia is correlated with the severity of HE and increased incidence of overt HE[1012]. Furthermore, accumulating evidences have revealed that microbiotatargeted therapies, such as probiotics, prebiotics, synbiotics, and antibiotics, may cause at least partial improvement of endotoxemia[1316].
Rifaximin, an oral antibiotic with broadspectrum activity against aerobic and anaerobic Grampositive and Gramnegative bacteria, is widely used for the prevention of HE and is proposed to have beneficial effects on overt HE and survival. It could exert antimicrobial activity against ammoniaproducing enteric bacteria including (1) Grampositive aerobic bacteria such as Streptococcus and Bacillus; (2) Gramnegative facultative anaerobic bacteria such as E. coli, Klebsiella, Citrobacter, Enterobacter, and Proteus; (3) Grampositive obligatory anaerobic bacteria such as Clostridium; and (4) Gramnegative obligatory anaerobic bacteria such as Bacteroides[17]. However, in Japan, it has only been recently available for patients with HE[18]. Several studies of cirrhotic patients in the Western countries have reported the possible mechanisms of action of rifaximin, suggesting that it could decrease endotoxin levels without altering the relative abundance of pathogenic bacteria[1921]. To the best of our knowledge, the effects of rifaximin on the gut microbiome in patients from the Eastern countries have not been assessed. Moreover, the relationship between the endotoxin activity and microbial alteration at the gene level has not been elucidated.
The present study aimed to evaluate the impact of rifaximin on the endotoxin activity and gut microb
8356 December 21, 2017|Volume 23|Issue 47|WJG|www.wjgnet.com
Kaji K et al . Rifaximin effect on HE and gut microbiome
iota identified by 16S ribosome RNA (rRNA) gene sequencing in patients with decompensated cirrhosis.
MATERIALS AND METHODSPatients and study designThe study was conducted from January to May 2017 at the Third Department of Internal Medicine of Nara Medical University. The subjects were patients with decompensated cirrhosis (ChildPugh score > 7) due to several causes, aged 18 years or older, who had been diagnosed by clinical, biochemical, and ultrasound findings (n = 45). The exclusion criteria were cardiac and/or respiratory failure or invasive cancer within the past 5 years; renal failure with serum creatinine > 200 μmol/L; clinical or biochemical signs of infection 28 d prior to inclusion; concomitant inflammatory bowel diseases and/or irritable bowel syndrome; previous history of gastrectomy, enterectomy, and/or liver transplantation; and developed portosystemic shunt. Patients who consumed nonabsorbable disaccharides, probiotics, prebiotics, synbiotics, or other antibiotics 28 d prior to inclusion were also excluded. Finally, 20 patients except for the patients to meet the exclusion criteria (n = 17) and decline to participate (n = 8) were finally analyzed.
All subjects were treated with rifaximin 400 mg thrice a day for 4 wk, and the complete investigational program was performed at baseline and after 4 wk of treatment. The program comprised general laboratory tests, measurement of serum ammonia levels, neuropsychological testing, measurement of whole blood endotoxin activity, and analysis of fecal microbiota (Figure 1).
The study protocols conformed to the principles outlined in the 1964 Declaration of Helsinki and its later amendments and were approved by the Ethics Committee of Nara Medical University (approval number 994) and were registered at UMIN000029127. All subjects provided written informed consent prior to their inclusion in the study.
Neuropsychological test systemTo objectively evaluate cognitive performance, we used the number connection test (NCT)A distributed by the Japan Society of Hepatology, as previously described[22,23]. The hardware consisted of a touch screen tablet such as iPad (Apple, Cupertino, CA, United States).
Measurement of endotoxin activityWhole blood endotoxin activity was assessed with the commercially available Endotoxin Activity Assay (EAA) kit (Spectral Diagnostics, Toronto, Canada), which uses a luminol chemiluminescence method. In brief, the EAA is based on the principle that endotoxin binds to antiendotoxin antibodies and is delivered to neutrophils
by complement receptors. In the presence of βglucan and luminol, the neutrophils undergo a respiratory burst accompanied by light emission. The light produced is quantified by a chemiluminometer, and its intensity is proportional to the amount of endotoxin present in the sample[24].
Analysis of fecal microbiota compositionFecal samples were collected before and 4 wk after rifaximin administration and placed in 1.5mL tubes, snapfrozen on dry ice, and stored at 80 ℃. 16S rRNA analysis of fecal samples was performed at Takara Bio (Shiga, Japan). DNA was extracted with the MoBio Powerlyzer Powersoil DNA Isolation Kit (MoBio Laboratories, Carlsbad, CA, United States). The V4 hypervariable region of the bacterial 16S rRNA gene was amplified from the fecal DNA extracts using the modified universal bacterial primer pairs 341F (5′-TCGTCGGCAGCGTCAGATGTGTATAAGA GACAGCCTACGGGNGGCWGCAG-3′) and 806R (5′-GTCTCGTGGGCTCGGAGATGTGTATAAGAGA CAGGGACTACHVGGGTWTCTAAT-3′) with Illumina adaptor overhang sequences. Amplicons were generated, cleaned, indexed, and sequenced according to the Illumina MiSeq 16S Metagenomic Sequencing Library Preparation protocol (http://support.illumina.com/downloads/16s_metagenomic_sequencing_library_ preparation.html), with brief modifications.
Sequencing data were combined and sample identification was assigned to multiplexed reads using the MOTHUR software environment[25]. The data were denoised; lowquality sequences, pyrosequencing errors, and chimeras were removed; and then the sequences were clustered into operational taxonomic units (OTUs) at 97% identity using the CDHITOTU pipeline (available from http://eeizhonglab.ucsd.edu/cdhitotu)[26]. OTUs containing fewer than four reads per individual diet/animal combination were excluded due to the likelihood of a sequencing artifact. The samples were normalized by random resampling sequences used to the lowest number of sequences per sample (each diet/animal combination) using Daisychopper (http://www.festinalente.me/ bioinf/). Taxonomic classification of OTUs was done with the Ribosomal Database Project Classifier[27].
Statistical analysisDifferences between the paired groups were analyzed by the MannWhitney U test. Correlations were calculated with the Spearman rank test. The data are expressed as means ± SD. A twotailed pvalue less than 0.05 was considered to indicate statistical significance. Analyses were performed with EZR (Saitama Medical Center, Jichi Medical University), which is a graphical user interface for R (The R Foundation for Statistical Computing, version 2.13.0). Specifically, EZR is a modified version of R comman-
8357 December 21, 2017|Volume 23|Issue 47|WJG|www.wjgnet.com
Kaji K et al . Rifaximin effect on HE and gut microbiome
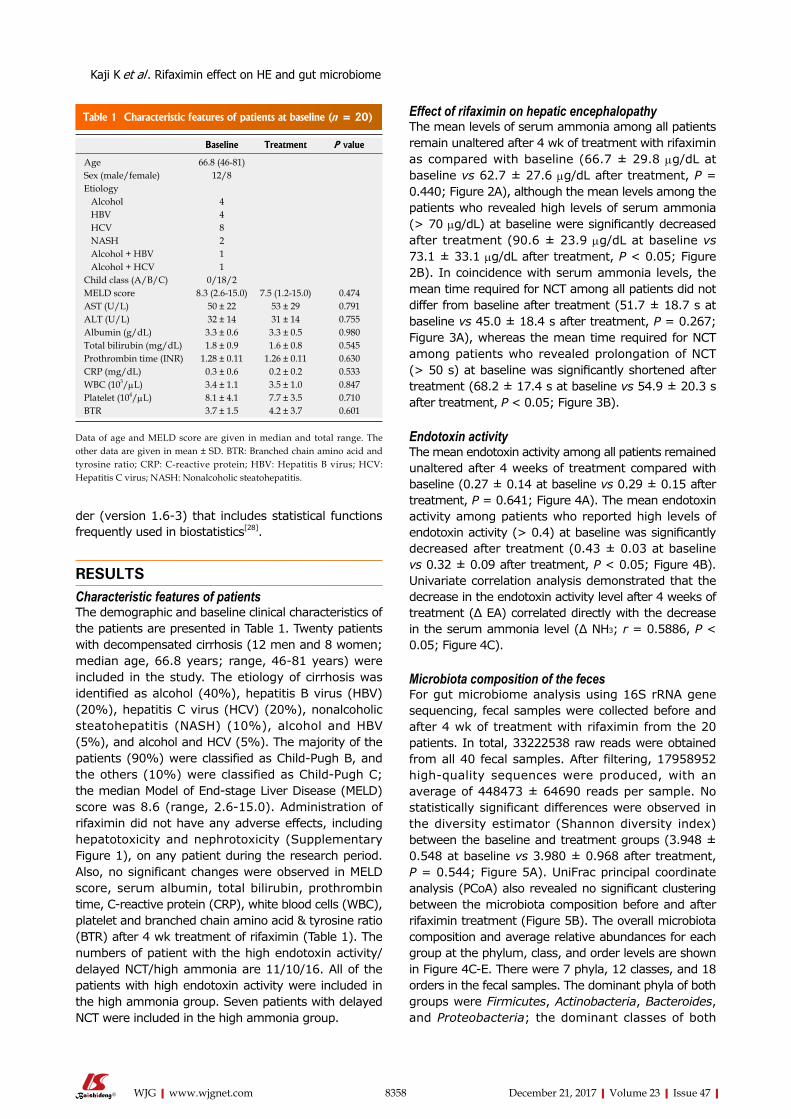
8358 December 21, 2017|Volume 23|Issue 47|WJG|www.wjgnet.com
Effect of rifaximin on hepatic encephalopathyThe mean levels of serum ammonia among all patients remain unaltered after 4 wk of treatment with rifaximin as compared with baseline (66.7 ± 29.8 μg/dL at baseline vs 62.7 ± 27.6 μg/dL after treatment, P = 0.440; Figure 2A), although the mean levels among the patients who revealed high levels of serum ammonia (> 70 μg/dL) at baseline were significantly decreased after treatment (90.6 ± 23.9 μg/dL at baseline vs 73.1 ± 33.1 μg/dL after treatment, P < 0.05; Figure 2B). In coincidence with serum ammonia levels, the mean time required for NCT among all patients did not differ from baseline after treatment (51.7 ± 18.7 s at baseline vs 45.0 ± 18.4 s after treatment, P = 0.267; Figure 3A), whereas the mean time required for NCT among patients who revealed prolongation of NCT (> 50 s) at baseline was significantly shortened after treatment (68.2 ± 17.4 s at baseline vs 54.9 ± 20.3 s after treatment, P < 0.05; Figure 3B).
Endotoxin activityThe mean endotoxin activity among all patients remained unaltered after 4 weeks of treatment compared with baseline (0.27 ± 0.14 at baseline vs 0.29 ± 0.15 after treatment, P = 0.641; Figure 4A). The mean endotoxin activity among patients who reported high levels of endotoxin activity (> 0.4) at baseline was significantly decreased after treatment (0.43 ± 0.03 at baseline vs 0.32 ± 0.09 after treatment, P < 0.05; Figure 4B). Univariate correlation analysis demonstrated that the decrease in the endotoxin activity level after 4 weeks of treatment (Δ EA) correlated directly with the decrease in the serum ammonia level (Δ NH3; r = 0.5886, P < 0.05; Figure 4C).
Microbiota composition of the fecesFor gut microbiome analysis using 16S rRNA gene sequencing, fecal samples were collected before and after 4 wk of treatment with rifaximin from the 20 patients. In total, 33222538 raw reads were obtained from all 40 fecal samples. After filtering, 17958952 highquality sequences were produced, with an average of 448473 ± 64690 reads per sample. No statistically significant differences were observed in the diversity estimator (Shannon diversity index) between the baseline and treatment groups (3.948 ± 0.548 at baseline vs 3.980 ± 0.968 after treatment, P = 0.544; Figure 5A). UniFrac principal coordinate analysis (PCoA) also revealed no significant clustering between the microbiota composition before and after rifaximin treatment (Figure 5B). The overall microbiota composition and average relative abundances for each group at the phylum, class, and order levels are shown in Figure 4CE. There were 7 phyla, 12 classes, and 18 orders in the fecal samples. The dominant phyla of both groups were Firmicutes, Actinobacteria, Bacteroides, and Proteobacteria; the dominant classes of both
der (version 1.63) that includes statistical functions frequently used in biostatistics[28].
RESULTSCharacteristic features of patientsThe demographic and baseline clinical characteristics of the patients are presented in Table 1. Twenty patients with decompensated cirrhosis (12 men and 8 women; median age, 66.8 years; range, 4681 years) were included in the study. The etiology of cirrhosis was identified as alcohol (40%), hepatitis B virus (HBV) (20%), hepatitis C virus (HCV) (20%), nonalcoholic steatohepatitis (NASH) (10%), alcohol and HBV (5%), and alcohol and HCV (5%). The majority of the patients (90%) were classified as ChildPugh B, and the others (10%) were classified as ChildPugh C; the median Model of Endstage Liver Disease (MELD) score was 8.6 (range, 2.615.0). Administration of rifaximin did not have any adverse effects, including hepatotoxicity and nephrotoxicity (Supplementary Figure 1), on any patient during the research period. Also, no significant changes were observed in MELD score, serum albumin, total bilirubin, prothrombin time, Creactive protein (CRP), white blood cells (WBC), platelet and branched chain amino acid & tyrosine ratio (BTR) after 4 wk treatment of rifaximin (Table 1). The numbers of patient with the high endotoxin activity/delayed NCT/high ammonia are 11/10/16. All of the patients with high endotoxin activity were included in the high ammonia group. Seven patients with delayed NCT were included in the high ammonia group.
Table 1 Characteristic features of patients at baseline (n = 20)
Baseline Treatment P value
Age 66.8 (46-81)Sex (male/female) 12/8Etiology Alcohol 4 HBV 4 HCV 8 NASH 2 Alcohol + HBV 1 Alcohol + HCV 1Child class (A/B/C) 0/18/2MELD score 8.3 (2.6-15.0) 7.5 (1.2-15.0) 0.474AST (U/L) 50 ± 22 53 ± 29 0.791ALT (U/L) 32 ± 14 31 ± 14 0.755Albumin (g/dL) 3.3 ± 0.6 3.3 ± 0.5 0.980Total bilirubin (mg/dL) 1.8 ± 0.9 1.6 ± 0.8 0.545Prothrombin time (INR) 1.28 ± 0.11 1.26 ± 0.11 0.630CRP (mg/dL) 0.3 ± 0.6 0.2 ± 0.2 0.533WBC (103/μL) 3.4 ± 1.1 3.5 ± 1.0 0.847Platelet (104/μL) 8.1 ± 4.1 7.7 ± 3.5 0.710BTR 3.7 ± 1.5 4.2 ± 3.7 0.601
Data of age and MELD score are given in median and total range. The other data are given in mean ± SD. BTR: Branched chain amino acid and tyrosine ratio; CRP: C-reactive protein; HBV: Hepatitis B virus; HCV: Hepatitis C virus; NASH: Nonalcoholic steatohepatitis.
Kaji K et al . Rifaximin effect on HE and gut microbiome
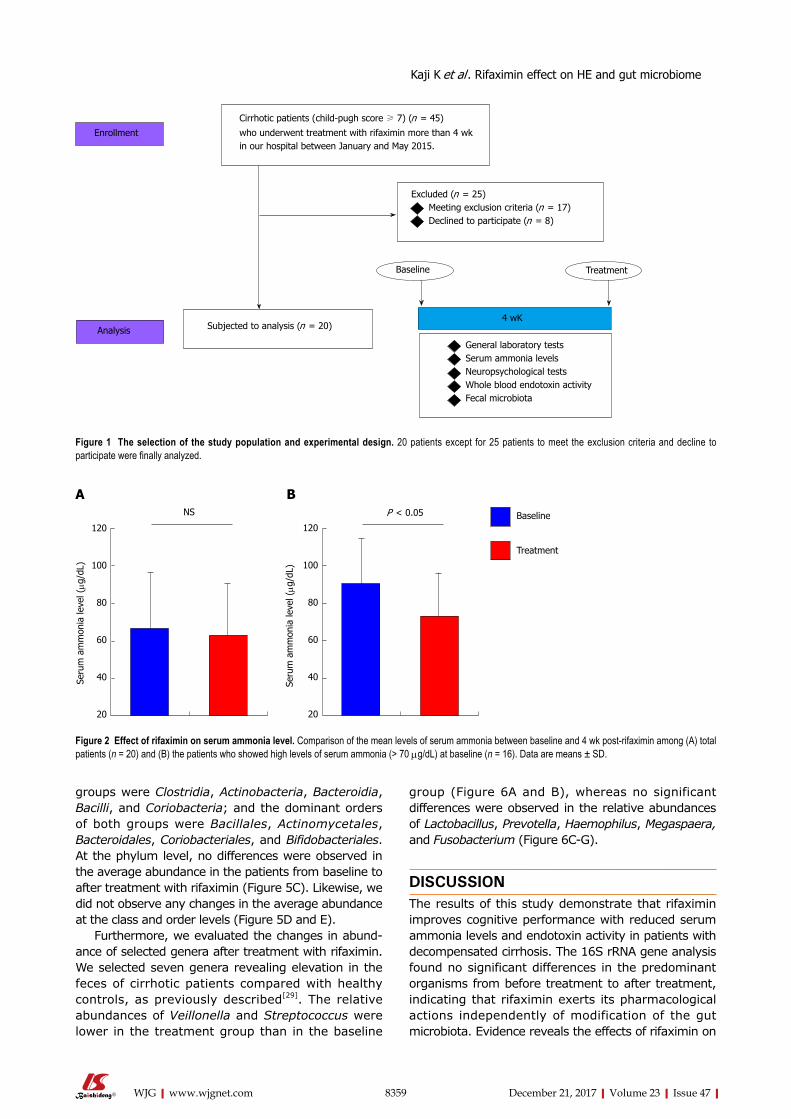
8359 December 21, 2017|Volume 23|Issue 47|WJG|www.wjgnet.com
groups were Clostridia, Actinobacteria, Bacteroidia, Bacilli, and Coriobacteria; and the dominant orders of both groups were Bacillales, Actinomycetales, Bacteroidales, Coriobacteriales, and Bifidobacteriales. At the phylum level, no differences were observed in the average abundance in the patients from baseline to after treatment with rifaximin (Figure 5C). Likewise, we did not observe any changes in the average abundance at the class and order levels (Figure 5D and E).
Furthermore, we evaluated the changes in abundance of selected genera after treatment with rifaximin. We selected seven genera revealing elevation in the feces of cirrhotic patients compared with healthy controls, as previously described[29]. The relative abundances of Veillonella and Streptococcus were lower in the treatment group than in the baseline
group (Figure 6A and B), whereas no significant differences were observed in the relative abundances of Lactobacillus, Prevotella, Haemophilus, Megaspaera, and Fusobacterium (Figure 6CG).
DISCUSSIONThe results of this study demonstrate that rifaximin improves cognitive performance with reduced serum ammonia levels and endotoxin activity in patients with decompensated cirrhosis. The 16S rRNA gene analysis found no significant differences in the predominant organisms from before treatment to after treatment, indicating that rifaximin exerts its pharmacological actions independently of modification of the gut microbiota. Evidence reveals the effects of rifaximin on
Cirrhotic patients (child-pugh score ≥ 7) (n = 45)
who underwent treatment with rifaximin more than 4 wkin our hospital between January and May 2015.
Excluded (n = 25) Meeting exclusion criteria (n = 17) Declined to participate (n = 8)
Subjected to analysis (n = 20)
Enrollment
Analysis
general laboratory tests Serum ammonia levels Neuropsychological tests Whole blood endotoxin activity Fecal microbiota
4 wK
Baseline Treatment
Figure 1 The selection of the study population and experimental design. 20 patients except for 25 patients to meet the exclusion criteria and decline to participate were finally analyzed.
120
100
80
60
40
20
Seru
m a
mm
onia
leve
l (μg
/dL)
NS
120
100
80
60
40
20
Seru
m a
mm
onia
leve
l (μg
/dL)
P < 0.05 Baseline
Treatment
Figure 2 Effect of rifaximin on serum ammonia level. Comparison of the mean levels of serum ammonia between baseline and 4 wk post-rifaximin among (A) total patients (n = 20) and (B) the patients who showed high levels of serum ammonia (> 70 μg/dL) at baseline (n = 16). Data are means ± SD.
A B
Kaji K et al . Rifaximin effect on HE and gut microbiome
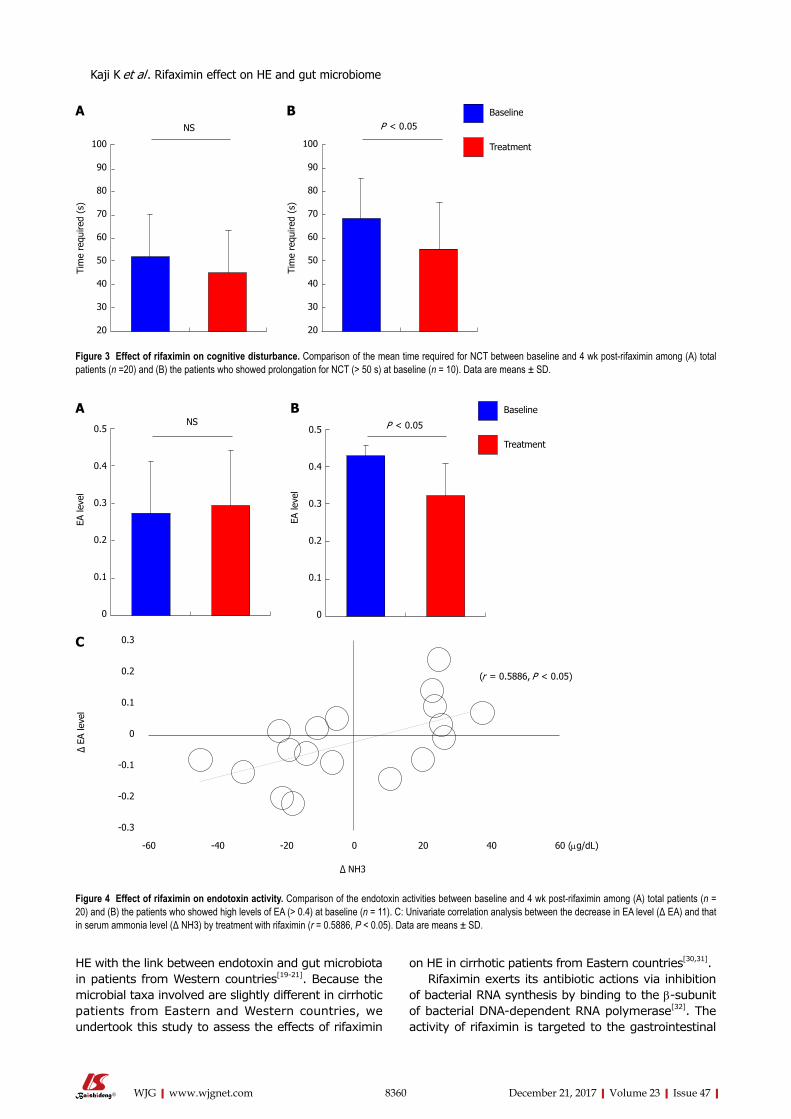
8360 December 21, 2017|Volume 23|Issue 47|WJG|www.wjgnet.com
HE with the link between endotoxin and gut microbiota in patients from Western countries[1921]. Because the microbial taxa involved are slightly different in cirrhotic patients from Eastern and Western countries, we undertook this study to assess the effects of rifaximin
on HE in cirrhotic patients from Eastern countries[30,31].Rifaximin exerts its antibiotic actions via inhibition
of bacterial RNA synthesis by binding to the βsubunit of bacterial DNAdependent RNA polymerase[32]. The activity of rifaximin is targeted to the gastrointestinal
100
90
80
70
60
50
40
30
20
Tim
e re
quire
d (s
)
NS
100
90
80
70
60
50
40
30
20
Tim
e re
quire
d (s
)
P < 0.05Baseline
Treatment
A B
Figure 3 Effect of rifaximin on cognitive disturbance. Comparison of the mean time required for NCT between baseline and 4 wk post-rifaximin among (A) total patients (n =20) and (B) the patients who showed prolongation for NCT (> 50 s) at baseline (n = 10). Data are means ± SD.
Baseline
Treatment
P < 0.050.5
0.4
0.3
0.2
0.1
0
EA le
vel
0.5
0.4
0.3
0.2
0.1
0
EA le
vel
NSA B
Figure 4 Effect of rifaximin on endotoxin activity. Comparison of the endotoxin activities between baseline and 4 wk post-rifaximin among (A) total patients (n = 20) and (B) the patients who showed high levels of EA (> 0.4) at baseline (n = 11). C: Univariate correlation analysis between the decrease in EA level (Δ EA) and that in serum ammonia level (Δ NH3) by treatment with rifaximin (r = 0.5886, P < 0.05). Data are means ± SD.
0.3
0.2
0.1
0
-0.1
-0.2
-0.3
-60 -40 -20 0 20 40 60 (μg/dL)
Δ NH3
Δ EA
leve
l
(r = 0.5886, P < 0.05)
C
Kaji K et al . Rifaximin effect on HE and gut microbiome
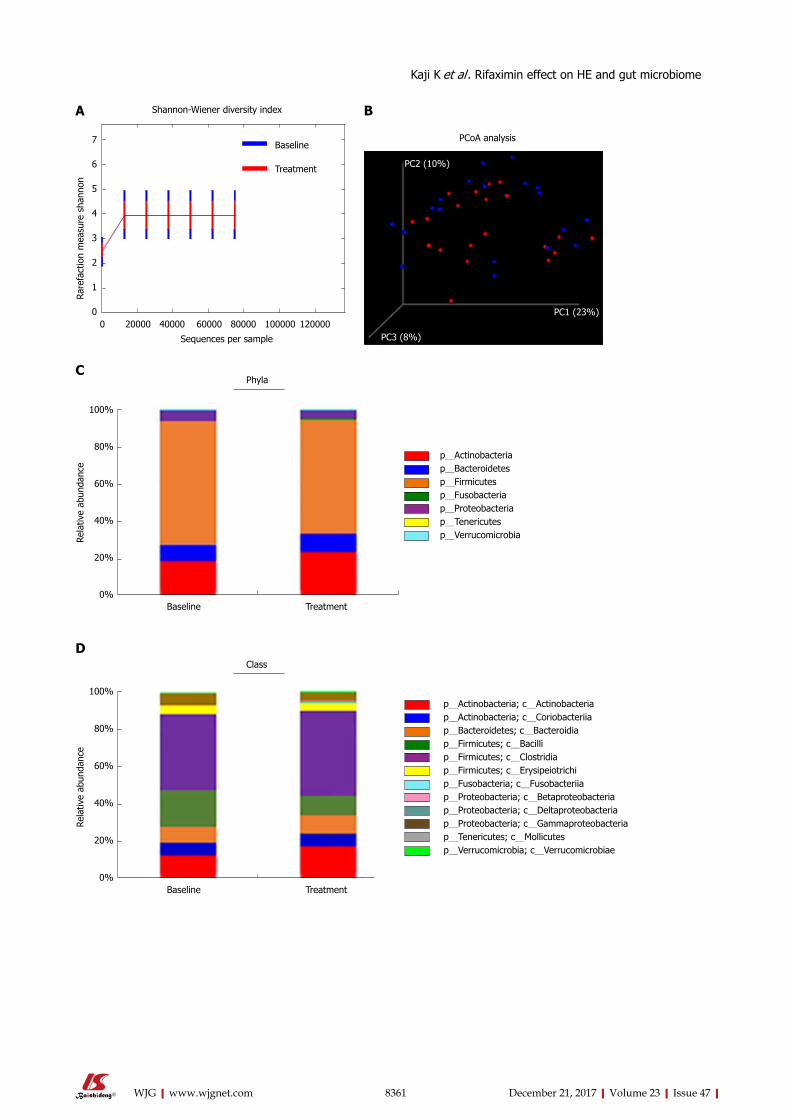
8361 December 21, 2017|Volume 23|Issue 47|WJG|www.wjgnet.com
0 20000 40000 60000 80000 100000 120000
Sequences per sample
7
6
5
4
3
2
1
0
Rare
fact
ion
mea
sure
sha
nnon
Shannon-Wiener diversity index
Baseline
Treatment
PCoA analysis
PC2 (10%)
PC3 (8%)
PC1 (23%)
100%
80%
60%
40%
20%
0%
Rela
tive
abun
danc
e
Phyla
Baseline Treatment
p_Actinobacteriap_Bacteroidetesp_Firmicutesp_Fusobacteriap_Proteobacteriap_Tenericutesp_Verrucomicrobia
A B
C
D
100%
80%
60%
40%
20%
0%
Rela
tive
abun
danc
e
Class
Baseline Treatment
p_Actinobacteria; c_Actinobacteriap_Actinobacteria; c_Coriobacteriiap_Bacteroidetes; c_Bacteroidiap_Firmicutes; c_Bacillip_Firmicutes; c_Clostridiap_Firmicutes; c_Erysipeiotrichip_Fusobacteria; c_Fusobacteriiap_Proteobacteria; c_Betaproteobacteriap_Proteobacteria; c_Deltaproteobacteriap_Proteobacteria; c_gammaproteobacteriap_Tenericutes; c_Mollicutesp_Verrucomicrobia; c_Verrucomicrobiae
Kaji K et al . Rifaximin effect on HE and gut microbiome
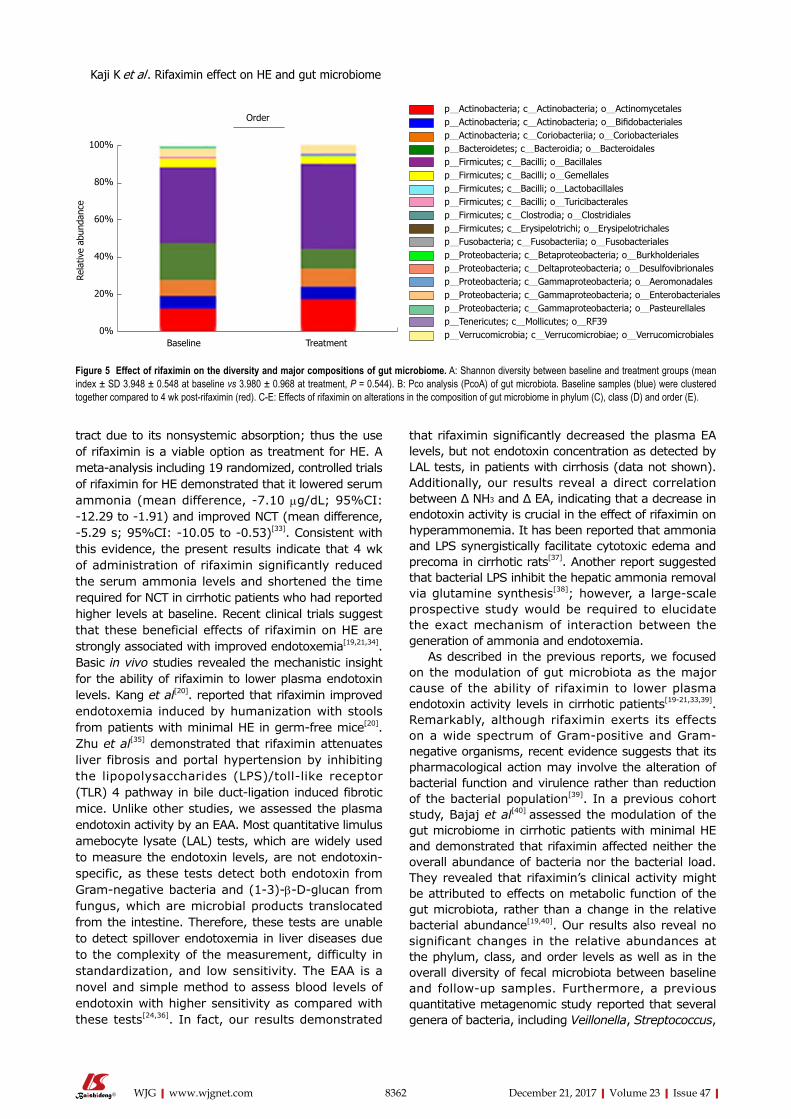
8362 December 21, 2017|Volume 23|Issue 47|WJG|www.wjgnet.com
tract due to its nonsystemic absorption; thus the use of rifaximin is a viable option as treatment for HE. A metaanalysis including 19 randomized, controlled trials of rifaximin for HE demonstrated that it lowered serum ammonia (mean difference, 7.10 μg/dL; 95%CI: 12.29 to 1.91) and improved NCT (mean difference, 5.29 s; 95%CI: 10.05 to 0.53)[33]. Consistent with this evidence, the present results indicate that 4 wk of administration of rifaximin significantly reduced the serum ammonia levels and shortened the time required for NCT in cirrhotic patients who had reported higher levels at baseline. Recent clinical trials suggest that these beneficial effects of rifaximin on HE are strongly associated with improved endotoxemia[19,21,34]. Basic in vivo studies revealed the mechanistic insight for the ability of rifaximin to lower plasma endotoxin levels. Kang et al[20]. reported that rifaximin improved endotoxemia induced by humanization with stools from patients with minimal HE in germfree mice[20]. Zhu et al[35] demonstrated that rifaximin attenuates liver fibrosis and portal hypertension by inhibiting the lipopolysaccharides (LPS)/tolllike receptor (TLR) 4 pathway in bile ductligation induced fibrotic mice. Unlike other studies, we assessed the plasma endotoxin activity by an EAA. Most quantitative limulus amebocyte lysate (LAL) tests, which are widely used to measure the endotoxin levels, are not endotoxinspecific, as these tests detect both endotoxin from Gramnegative bacteria and (13)βDglucan from fungus, which are microbial products translocated from the intestine. Therefore, these tests are unable to detect spillover endotoxemia in liver diseases due to the complexity of the measurement, difficulty in standardization, and low sensitivity. The EAA is a novel and simple method to assess blood levels of endotoxin with higher sensitivity as compared with these tests[24,36]. In fact, our results demonstrated
that rifaximin significantly decreased the plasma EA levels, but not endotoxin concentration as detected by LAL tests, in patients with cirrhosis (data not shown). Additionally, our results reveal a direct correlation between Δ NH3 and Δ EA, indicating that a decrease in endotoxin activity is crucial in the effect of rifaximin on hyperammonemia. It has been reported that ammonia and LPS synergistically facilitate cytotoxic edema and precoma in cirrhotic rats[37]. Another report suggested that bacterial LPS inhibit the hepatic ammonia removal via glutamine synthesis[38]; however, a largescale prospective study would be required to elucidate the exact mechanism of interaction between the generation of ammonia and endotoxemia.
As described in the previous reports, we focused on the modulation of gut microbiota as the major cause of the ability of rifaximin to lower plasma endotoxin activity levels in cirrhotic patients[1921,33,39]. Remarkably, although rifaximin exerts its effects on a wide spectrum of Grampositive and Gramnegative organisms, recent evidence suggests that its pharmacological action may involve the alteration of bacterial function and virulence rather than reduction of the bacterial population[39]. In a previous cohort study, Bajaj et al[40] assessed the modulation of the gut microbiome in cirrhotic patients with minimal HE and demonstrated that rifaximin affected neither the overall abundance of bacteria nor the bacterial load. They revealed that rifaximin’s clinical activity might be attributed to effects on metabolic function of the gut microbiota, rather than a change in the relative bacterial abundance[19,40]. Our results also reveal no significant changes in the relative abundances at the phylum, class, and order levels as well as in the overall diversity of fecal microbiota between baseline and followup samples. Furthermore, a previous quantitative metagenomic study reported that several genera of bacteria, including Veillonella, Streptococcus,
100%
80%
60%
40%
20%
0%
Rela
tive
abun
danc
e
Order
Baseline Treatment
p_Actinobacteria; c_Actinobacteria; o_Actinomycetalesp_Actinobacteria; c_Actinobacteria; o_Bifidobacterialesp_Actinobacteria; c_Coriobacteriia; o_Coriobacterialesp_Bacteroidetes; c_Bacteroidia; o_Bacteroidalesp_Firmicutes; c_Bacilli; o_Bacillalesp_Firmicutes; c_Bacilli; o_gemellalesp_Firmicutes; c_Bacilli; o_Lactobacillalesp_Firmicutes; c_Bacilli; o_Turicibacteralesp_Firmicutes; c_Clostrodia; o_Clostridialesp_Firmicutes; c_Erysipelotrichi; o_Erysipelotrichalesp_Fusobacteria; c_Fusobacteriia; o_Fusobacterialesp_Proteobacteria; c_Betaproteobacteria; o_Burkholderialesp_Proteobacteria; c_Deltaproteobacteria; o_Desulfovibrionalesp_Proteobacteria; c_gammaproteobacteria; o_Aeromonadalesp_Proteobacteria; c_gammaproteobacteria; o_Enterobacterialesp_Proteobacteria; c_gammaproteobacteria; o_Pasteurellalesp_Tenericutes; c_Mollicutes; o_RF39p_Verrucomicrobia; c_Verrucomicrobiae; o_Verrucomicrobiales
Figure 5 Effect of rifaximin on the diversity and major compositions of gut microbiome. A: Shannon diversity between baseline and treatment groups (mean index ± SD 3.948 ± 0.548 at baseline vs 3.980 ± 0.968 at treatment, P = 0.544). B: Pco analysis (PcoA) of gut microbiota. Baseline samples (blue) were clustered together compared to 4 wk post-rifaximin (red). C-E: Effects of rifaximin on alterations in the composition of gut microbiome in phylum (C), class (D) and order (E).
Kaji K et al . Rifaximin effect on HE and gut microbiome
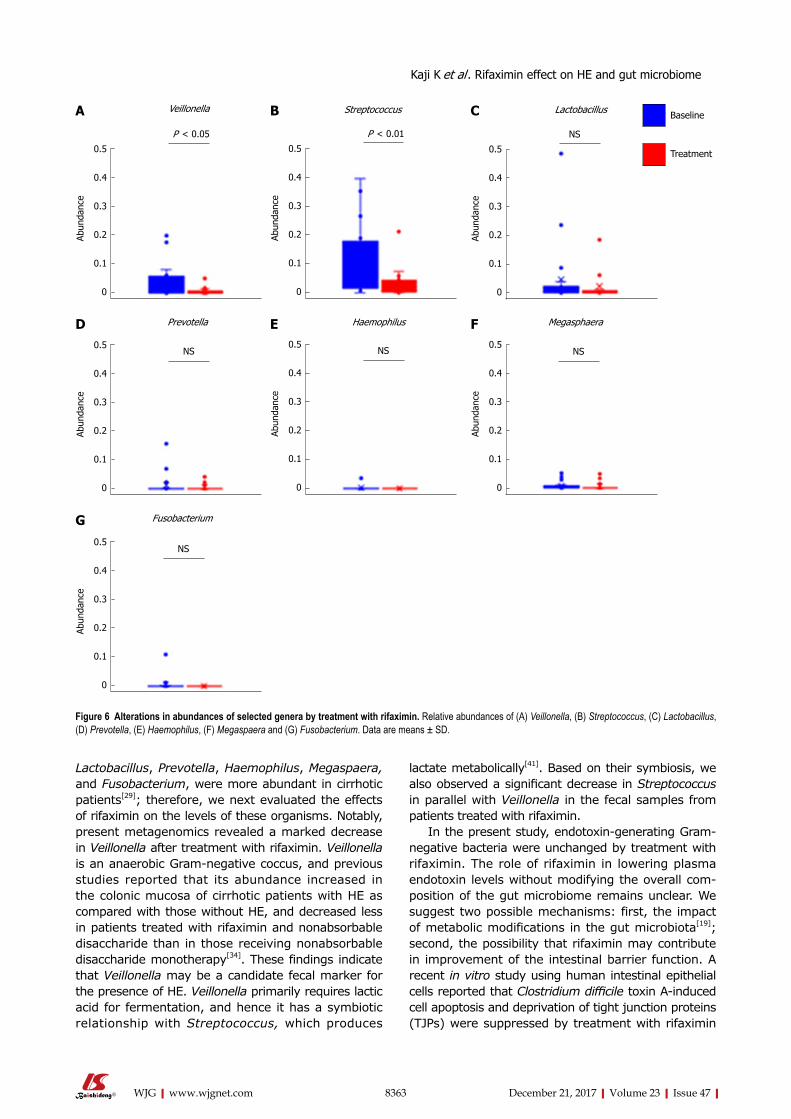
8363 December 21, 2017|Volume 23|Issue 47|WJG|www.wjgnet.com
Lactobacillus, Prevotella, Haemophilus, Megaspaera, and Fusobacterium, were more abundant in cirrhotic patients[29]; therefore, we next evaluated the effects of rifaximin on the levels of these organisms. Notably, present metagenomics revealed a marked decrease in Veillonella after treatment with rifaximin. Veillonella is an anaerobic Gramnegative coccus, and previous studies reported that its abundance increased in the colonic mucosa of cirrhotic patients with HE as compared with those without HE, and decreased less in patients treated with rifaximin and nonabsorbable disaccharide than in those receiving nonabsorbable disaccharide monotherapy[34]. These findings indicate that Veillonella may be a candidate fecal marker for the presence of HE. Veillonella primarily requires lactic acid for fermentation, and hence it has a symbiotic relationship with Streptococcus, which produces
lactate metabolically[41]. Based on their symbiosis, we also observed a significant decrease in Streptococcus in parallel with Veillonella in the fecal samples from patients treated with rifaximin.
In the present study, endotoxingenerating Gramnegative bacteria were unchanged by treatment with rifaximin. The role of rifaximin in lowering plasma endotoxin levels without modifying the overall composition of the gut microbiome remains unclear. We suggest two possible mechanisms: first, the impact of metabolic modifications in the gut microbiota[19]; second, the possibility that rifaximin may contribute in improvement of the intestinal barrier function. A recent in vitro study using human intestinal epithelial cells reported that Clostridium difficile toxin Ainduced cell apoptosis and deprivation of tight junction proteins (TJPs) were suppressed by treatment with rifaximin
0.5
0.4
0.3
0.2
0.1
0
Abun
danc
e
P < 0.05
Veillonella
0.5
0.4
0.3
0.2
0.1
0
Abun
danc
e
P < 0.01
Streptococcus
0.5
0.4
0.3
0.2
0.1
0
Abun
danc
e
NS
Lactobacillus Baseline
Treatment
0.5
0.4
0.3
0.2
0.1
0
Abun
danc
e
NS
Prevotella
0.5
0.4
0.3
0.2
0.1
0
Abun
danc
e
NS
Haemophilus
0.5
0.4
0.3
0.2
0.1
0Ab
unda
nce
NS
Megasphaera
0.5
0.4
0.3
0.2
0.1
0
Abun
danc
e
NS
Fusobacterium
A B C
D E F
G
Figure 6 Alterations in abundances of selected genera by treatment with rifaximin. Relative abundances of (A) Veillonella, (B) Streptococcus, (C) Lactobacillus, (D) Prevotella, (E) Haemophilus, (F) Megaspaera and (G) Fusobacterium. Data are means ± SD.
Kaji K et al . Rifaximin effect on HE and gut microbiome
8364 December 21, 2017|Volume 23|Issue 47|WJG|www.wjgnet.com
through the pregnane X receptordependent inhibition of theTLR4/MyD88/NFkB pathway[42]. Our previous report also demonstrated that antibiotics improved the intestinal permeability and enhanced TJP expression in the rat nonalcoholic steatohepatitis model[43]. A further basic analysis is needed to elucidate the association of these mechanisms.
A limitation of this study was the small sample size. Further studies are essential to evaluate the effects of rifaximin in a larger population and in other Asian countries, as well as the effects of its longterm administration. Additionally, assessment of proinflammatory cytokines such as tumor necrosis factor-α and interleukin6 is currently in progress for deeper analysis of the interaction between endotoxemia and the development of HE.
In conclusion, rifaximin significantly improved cog-nition and reduced endotoxin activity with minor modifi-cation of the gut microbiome in patients with decompensated cirrhosis. This is the first report of systemic and local effects of rifaximin in Japanese patients.
ARTICLE HIGHLIGHTSResearch backgroundHepatic encephalopathy (HE) is characterized by deficits in cognitive, psychiatric, and motor function and ranges in severity from minimal to overt HE and coma. Rifaximin is used for standard treatment of HE, targeting reduction of ammonia and gut bacterial translocation. Currently, rifaximin has been suggested to partially affect gut microbiome in the patients with HE.
Research motivationThe effects of rifaximin on the gut microbiome in patients from the Eastern countries have not been assessed. Moreover, the relationship between the endotoxin activity and microbial alteration at the gene level has not been elucidated. Recently, 16S rRNA gene sequencing has been established as a novel method to directly access the genetic content of entire communities of organisms. Some evidence reveals the effects of rifaximin on HE with the linkage of gut microbiota in patients from Western countries. Because the microbial taxa involved are slightly different in cirrhotic patients from Eastern and Western countries, we undertook this study to assess the effects of rifaximin on HE in cirrhotic patients from Eastern countries. Moreover, the relationship between the endotoxin activity and microbial alteration at the gene level.
Research objectivesTo determine the efficacy of rifaximin for hepatic encephalopathy (HE), evaluated with serum ammonia level, NCT and endotoxin activity, with the linkage of gut microbiome in decompensated cirrhotic patients.
Research methodsTwenty patients with decompensated cirrhosis were enrolled for this study. They were treated with rifaximin 400 mg three times a day for 4 wk. The measurement of serum ammonia level and number connection test (NCT)-A were performed to evaluate their status of hepatic encephalopathy before and after treatment of rifaximin. Endotoxemia was assessed by blood endotoxin activity assay (EAA). The 16S ribosome RNA gene sequencing was performed for analysis of fecal microbiome, and the diversity and compositions of gut microbiome were compared between before and after treatment of rifaximin.
Research resultsThis study demonstrates that rifaximin improves hyperammonemia and cognitive impairment with the linkage of decreased endotoxin activity in
patients with decompensated cirrhosis. The diversity and major components of gut microbiome analyzed by 16S rRNA gene sequencing are not altered by treatment with rifaximin, although the relative abundances of genus Veillonella and Streptococcus were lowered.
Research conclusionsThis study demonstrates that rifaximin significantly improves hepatic encephalopathy with minor modification of the gut microbiome in Japanese patients with decompensated cirrhosis. Rifaximin markedly improved cognition and reduced endotoxin activity without significantly affecting the composition of the gut microbiome indicating that the effect of rifaximin is independent of modification of gut microbial diversity. This effect of rifaximin on gut microbiome in Japanese cirrhotic patients is similar to the patients in the West. On the other hands, rifaximin modified minor compositions of gut microbiome such as decreased relative abundances of genus Veillonella and Streptococcus in current subjects. So far, the mechanism of decreased endotoxin activity by rifaximin is still obscure, but we speculate that it is possibly related to the pharmacological action of rifaximin to improve intestinal barrier function. In conclusion, rifaximin is an effective medical agent for the patients with hepatic encephalopathy.
Research perspectivesThis study demonstrates that rifaximin improves hyperammonemia and cognitive impairment with the linkage of decreased endotoxin activity in patients with decompensated cirrhosis. These effects of rifaximin are independent of alteration of gut microbial diversity, indicating that rifaximin has a potential capacity to decrease ammonia and endotoxin level other than the effect on gut microbiome such as the improvement of intestinal barrier function. Therefore, we will examine the effect of rifaximin on intestinal tight junction protein in the clinical practice to elucidate above hypothesis in near future after the approval of ethical committee. We consider that the best method is to analyze the alteration of intestinal tight junction protein before and after treatment with rifaximin in the biopsy tissues from the patients with decompensated cirrhosis.
ACKNOWLEDGMENTSThe authors gratefully acknowledge the work of ASKA Pharmaceutical Co., Ltd for the support of 16S rRNA gene sequencing analysis.
REFERENCES1 Prakash R, Mullen KD. Mechanisms, diagnosis and management
of hepatic encephalopathy. Nat Rev Gastroenterol Hepatol 2010; 7: 515-525 [PMID: 20703237 DOI: 10.1038/nrgastro.2010.116]
2 Rikkers L, Jenko P, Rudman D, Freides D. Subclinical hepatic encephalopathy: detection, prevalence, and relationship to nitrogen metabolism. Gastroenterology 1978; 75: 462-469 [PMID: 680502]
3 Ortiz M, Jacas C, Córdoba J. Minimal hepatic encephalopathy: diagnosis, clinical significance and recommendations. J Hepatol 2005; 42 Suppl: S45-S53 [PMID: 15777572 DOI: 10.1016/j.jhep.2004.11.028]
4 Chen Y, Yang F, Lu H, Wang B, Chen Y, Lei D, Wang Y, Zhu B, Li L. Characterization of fecal microbial communities in patients with liver cirrhosis. Hepatology 2011; 54: 562-572 [PMID: 21574172 DOI: 10.1002/hep.24423]
5 Bajaj JS, Ridlon JM, Hylemon PB, Thacker LR, Heuman DM, Smith S, Sikaroodi M, Gillevet PM. Linkage of gut microbiome with cognition in hepatic encephalopathy. Am J Physiol Gastrointest Liver Physiol 2012; 302: G168-G175 [PMID: 21940902 DOI: 10.1152/ajpgi.00190.2011]
6 Bajaj JS, Heuman DM, Hylemon PB, Sanyal AJ, White MB, Monteith P, Noble NA, Unser AB, Daita K, Fisher AR, Sikaroodi M, Gillevet PM. Altered profile of human gut microbiome is associated with cirrhosis and its complications. J Hepatol 2014; 60: 940-947 [PMID: 24374295 DOI: 10.1016/j.jhep.2013.12.019]
7 Bajaj JS. The role of microbiota in hepatic encephalopathy. Gut
ARTICLE HIGHLIGHTS
Kaji K et al . Rifaximin effect on HE and gut microbiome
8365 December 21, 2017|Volume 23|Issue 47|WJG|www.wjgnet.com
Microbes 2014; 5: 397-403 [PMID: 24690956 DOI: 10.4161/gmic.28684]
8 Bajaj JS, Kassam Z, Fagan A, Gavis EA, Liu E, Cox IJ, Kheradman R, Heuman D, Wang J, Gurry T, Williams R, Sikaroodi M, Fuchs M, Alm E, John B, Thacker LR, Riva A, Smith M, Taylor-Robinson SD, Gillevet PM. Fecal microbiota transplant from a rational stool donor improves hepatic encephalopathy: A randomized clinical trial. Hepatology 2017; 66: 1727-1738 [PMID: 28586116 DOI: 10.1002/hep.29306]
9 Verma S , Nakaoke R, Dohgu S, Banks WA. Release of cytokines by brain endothelial cells: A polarized response to lipopolysaccharide. Brain Behav Immun 2006; 20: 449-455 [PMID: 16309883 DOI: 10.1016/j.bbi.2005.10.005]
10 Luo M, Guo JY, Cao WK. Inflammation: A novel target of current therapies for hepatic encephalopathy in liver cirrhosis. World J Gastroenterol 2015; 21: 11815-11824 [PMID: 26557005 DOI: 10.3748/wjg.v21.i41.11815]
11 Jayakumar AR, Rama Rao KV, Norenberg MD. Neuroin-flammation in hepatic encephalopathy: mechanistic aspects. J Clin Exp Hepatol 2015; 5: S21-S28 [PMID: 26041953 DOI: 10.1016/j.jceh.2014.07.006]
12 Ahluwalia V, Betrapally NS, Hylemon PB, White MB, Gillevet PM, Unser AB, Fagan A, Daita K, Heuman DM, Zhou H, Sikaroodi M, Bajaj JS. Impaired Gut-Liver-Brain Axis in Patients with Cirrhosis. Sci Rep 2016; 6: 26800 [PMID: 27225869 DOI: 10.1038/srep26800]
13 Chiva M, Soriano G, Rochat I, Peralta C, Rochat F, Llovet T, Mirelis B, Schiffrin EJ, Guarner C, Balanzó J. Effect of Lactobacillus johnsonii La1 and antioxidants on intestinal flora and bacterial translocation in rats with experimental cirrhosis. J Hepatol 2002; 37: 456-462 [PMID: 12217598]
14 Liu Q, Duan ZP, Ha DK, Bengmark S, Kurtovic J, Riordan SM. Synbiotic modulation of gut flora: effect on minimal hepatic encephalopathy in patients with cirrhosis. Hepatology 2004; 39: 1441-1449 [PMID: 15122774 DOI: 10.1002/hep.20194]
15 Bajaj JS, Saeian K, Christensen KM, Hafeezullah M, Varma RR, Franco J, Pleuss JA, Krakower G, Hoffmann RG, Binion DG. Probiotic yogurt for the treatment of minimal hepatic encephalopathy. Am J Gastroenterol 2008; 103: 1707-1715 [PMID: 18691193 DOI: 10.1111/j.1572-0241.2008.01861.x]
16 Rishi P, Bharrhan S, Singh G, Kaur IP. Effect of Lactobacillus plantarum and L-arginine against endotoxin-induced liver injury in a rat model. Life Sci 2011; 89: 847-853 [PMID: 21958471 DOI: 10.1016/j.lfs.2011.09.007]
17 Scarpignato C, Pelosini I. Rifaximin, a poorly absorbed antibiotic: pharmacology and clinical potential. Chemotherapy 2005; 51 Suppl 1: 36-66 [PMID: 15855748 DOI: 10.1159/000081990]
18 Bass NM, Mullen KD, Sanyal A, Poordad F, Neff G, Leevy CB, Sigal S, Sheikh MY, Beavers K, Frederick T, Teperman L, Hillebrand D, Huang S, Merchant K, Shaw A, Bortey E, Forbes WP. Rifaximin treatment in hepatic encephalopathy. N Engl J Med 2010; 362: 1071-1081 [PMID: 20335583 DOI: 10.1056/NEJMoa0907893]
19 Bajaj JS, Heuman DM, Sanyal AJ, Hylemon PB, Sterling RK, Stravitz RT, Fuchs M, Ridlon JM, Daita K, Monteith P, Noble NA, White MB, Fisher A, Sikaroodi M, Rangwala H, Gillevet PM. Modulation of the metabiome by rifaximin in patients with cirrhosis and minimal hepatic encephalopathy. PLoS One 2013; 8: e60042 [PMID: 23565181 DOI: 10.1371/journal.pone.0060042]
20 Kang DJ, Kakiyama G, Betrapally NS, Herzog J, Nittono H, Hylemon PB, Zhou H, Carroll I, Yang J, Gillevet PM, Jiao C, Takei H, Pandak WM, Iida T, Heuman DM, Fan S, Fiehn O, Kurosawa T, Sikaroodi M, Sartor RB, Bajaj JS. Rifaximin Exerts Beneficial Effects Independent of its Ability to Alter Microbiota Composition. Clin Transl Gastroenterol 2016; 7: e187 [PMID: 27560928 DOI: 10.1038/ctg.2016.44]
21 Kimer N, Pedersen JS, Tavenier J, Christensen JE, Busk TM, Hobolth L, Krag A, Al-Soud WA, Mortensen MS, Sørensen SJ, Møller S, Bendtsen F; And members of the CoRif study group. Rifaximin has minor effects on bacterial composition,
inflammation and bacterial translocation in cirrhosis; A randomized trial. J Gastroenterol Hepatol 2017; Epub ahead of print [PMID: 28671712 DOI: 10.1111/jgh.13852]
22 Bajaj JS, Wade JB, Sanyal AJ. Spectrum of neurocognitive impairment in cirrhosis: Implications for the assessment of hepatic encephalopathy. Hepatology 2009; 50: 2014-2021 [PMID: 19787808 DOI: 10.1002/hep.23216]
23 Kawaguchi T, Konishi M, Kato A, Kato M, Kooka Y, Sawara K, Endo R, Torimura T, Suzuki K, Takikawa Y. Updating the neuropsychological test system in Japan for the elderly and in a modern touch screen tablet society by resetting the cut-off values. Hepatol Res 2017; 47: 1335-1339 [PMID: 28066966 DOI: 10.1111/hepr.12864]
24 Yaroustovsky M, Plyushch M, Popov D, Samsonova N, Abramyan M, Popok Z, Krotenko N. Prognostic value of endotoxin activity assay in patients with severe sepsis after cardiac surgery. J Inflamm (Lond) 2013; 10: 8 [PMID: 23510603 DOI: 10.1186/1476-9255-10-8]
25 Schloss PD, Westcott SL, Ryabin T, Hall JR, Hartmann M, Hollister EB, Lesniewski RA, Oakley BB, Parks DH, Robinson CJ, Sahl JW, Stres B, Thallinger GG, Van Horn DJ, Weber CF. Introducing mothur: open-source, platform-independent, community-supported software for describing and comparing microbial communities. Appl Environ Microbiol 2009; 75: 7537-7541 [PMID: 19801464 DOI: 10.1128/AEM.01541-09]
26 Li W, Fu L, Niu B, Wu S, Wooley J. Ultrafast clustering algorithms for metagenomic sequence analysis. Brief Bioinform 2012; 13: 656-668 [PMID: 22772836 DOI: 10.1093/bib/bbs035]
27 Wang Q, Garrity GM, Tiedje JM, Cole JR. Naive Bayesian classifier for rapid assignment of rRNA sequences into the new bacterial taxonomy. Appl Environ Microbiol 2007; 73: 5261-5267 [PMID: 17586664 DOI: 10.1128/AEM.00062-07]
28 Kanda Y. Investigation of the freely available easy-to-use software ‘EZR’ for medical statistics. Bone Marrow Transplant 2013; 48: 452-458 [PMID: 23208313 DOI: 10.1038/bmt.2012.244]
29 Qin N, Yang F, Li A, Prifti E, Chen Y, Shao L, Guo J, Le Chatelier E, Yao J, Wu L, Zhou J, Ni S, Liu L, Pons N, Batto JM, Kennedy SP, Leonard P, Yuan C, Ding W, Chen Y, Hu X, Zheng B, Qian G, Xu W, Ehrlich SD, Zheng S, Li L. Alterations of the human gut microbiome in liver cirrhosis. Nature 2014; 513: 59-64 [PMID: 25079328 DOI: 10.1038/nature13568]
30 Fukui H. Gut-liver axis in liver cirrhosis: How to manage leaky gut and endotoxemia. World J Hepatol 2015; 7: 425-442 [PMID: 25848468 DOI: 10.4254/wjh.v7.i3.425]
31 Nakamoto N, Schnabl B. Does the Intestinal Microbiota Explain Differences in the Epidemiology of Liver Disease between East and West? Inflamm Intest Dis 2016; 1: 3-8 [PMID: 27243019 DOI: 10.1159/000443196]
32 Jiang ZD, DuPont HL. Rifaximin: in vitro and in vivo antibacterial activity--a review. Chemotherapy 2005; 51 Suppl 1: 67-72 [PMID: 15855749 DOI: 10.1159/000081991]
33 Kimer N, Krag A, Møller S, Bendtsen F, Gluud LL. Systematic review with meta-analysis: the effects of rifaximin in hepatic encephalopathy. Aliment Pharmacol Ther 2014; 40: 123-132 [PMID: 24849268 DOI: 10.1111/apt.12803]
34 Bajaj JS, Hylemon PB, Ridlon JM, Heuman DM, Daita K, White MB, Monteith P, Noble NA, Sikaroodi M, Gillevet PM. Colonic mucosal microbiome differs from stool microbiome in cirrhosis and hepatic encephalopathy and is linked to cognition and inflammation. Am J Physiol Gastrointest Liver Physiol 2012; 303: G675-G685 [PMID: 22821944 DOI: 10.1152/ajpgi.00152.2012]
35 Zhu Q, Zou L, Jagavelu K, Simonetto DA, Huebert RC, Jiang ZD, DuPont HL, Shah VH. Intestinal decontamination inhibits TLR4 dependent fibronectin-mediated cross-talk between stellate cells and endothelial cells in liver fibrosis in mice. J Hepatol 2012; 56: 893-899 [PMID: 22173161 DOI: 10.1016/j.jhep.2011.11.013]
36 Marshall JC, Walker PM, Foster DM, Harris D, Ribeiro M, Paice J, Romaschin AD, Derzko AN. Measurement of endotoxin activity in critically ill patients using whole blood neutrophil dependent chemiluminescence. Crit Care 2002; 6: 342-348 [PMID:
Kaji K et al . Rifaximin effect on HE and gut microbiome
8366 December 21, 2017|Volume 23|Issue 47|WJG|www.wjgnet.com
12225611]37 Wright G, Davies NA, Shawcross DL, Hodges SJ, Zwingmann
C, Brooks HF, Mani AR, Harry D, Stadlbauer V, Zou Z, Williams R, Davies C, Moore KP, Jalan R. Endotoxemia produces coma and brain swelling in bile duct ligated rats. Hepatology 2007; 45: 1517-1526 [PMID: 17523148 DOI: 10.1002/hep.21599]
38 Görg B, Wettstein M, Metzger S, Schliess F, Häussinger D. Lipopolysaccharide-induced tyrosine nitration and inactivation of hepatic glutamine synthetase in the rat. Hepatology 2005; 41: 1065-1073 [PMID: 15830392 DOI: 10.1002/hep.20662]
39 Jiang ZD, Ke S, Dupont HL. Rifaximin-induced alteration of virulence of diarrhoea-producing Escherichia coli and Shigella sonnei. Int J Antimicrob Agents 2010; 35: 278-281 [PMID: 20045287 DOI: 10.1016/j.ijantimicag.2009.11.013]
40 Bajaj JS. Review article: potential mechanisms of action of rifaximin in the management of hepatic encephalopathy and other complications of cirrhosis. Aliment Pharmacol Ther 2016; 43
Suppl 1: 11-26 [PMID: 26618922 DOI: 10.1111/apt.13435]41 Mikx FH, Van der Hoeven JS. Symbiosis of Streptococcus mutans
and Veillonella alcalescens in mixed continuous cultures. Arch Oral Biol 1975; 20: 407-410 [PMID: 1096856]
42 Esposito G, Nobile N, Gigli S, Seguella L, Pesce M, d’Alessandro A, Bruzzese E, Capoccia E, Steardo L, Cuomo R, Sarnelli G. Rifaximin Improves Clostridium difficile Toxin A-Induced Toxicity in Caco-2 Cells by the PXR-Dependent TLR4/MyD88/NF-κB Pathway. Front Pharmacol 2016; 7: 120 [PMID: 27242527 DOI: 10.3389/fphar.2016.00120]
43 Douhara A, Moriya K, Yoshiji H, Noguchi R, Namisaki T, Kitade M, Kaji K, Aihara Y, Nishimura N, Takeda K, Okura Y, Kawaratani H, Fukui H. Reduction of endotoxin attenuates liver fibrosis through suppression of hepatic stellate cell activation and remission of intestinal permeability in a rat non-alcoholic steatohepatitis model. Mol Med Rep 2015; 11: 1693-1700 [PMID: 25421042 DOI: 10.3892/mmr.2014.2995]
P- Reviewer: Gencdal G, Hashimoto N, McMillin MA, Stanciu C S- Editor: Gong ZM L- Editor: A E- Editor: Huang Y
Kaji K et al . Rifaximin effect on HE and gut microbiome
Keisuke Kawasaki, Shotaro Nakamura, Shunichi Yanai, Risaburo Akasaka, Yosuke Toya, Takayuki Matsumoto, Division of Gastroenterology, Department of Internal Medicine, Iwate Medical University, Morioka 020-8505, Japan
Makoto Eizuka, Yasuko Fujita, Noriyuki Uesugi, Kazuyuki Ishida, Tamotsu Sugai, Department of Diagnostic Pathology, Iwate Medical University, Morioka 020-8505, Japan
Masaki Endo, Kaiunbashi Endoscopy Clinic, Morioka 020-0022, Japan
ORCID number: Keisuke Kawasaki (0000-0003-2645-4417); Makoto Eizuka (0000-0003-4815-1273); Shotaro Nakamura (0000-0001-8166-2599); Masaki Endo (0000-0001-7249-2540); Shunichi Yanai (0000-0003-1871-2412); Risaburo Akasaka (0000-0001-7087-3016); Yosuke Toya (0000-0002-0990-9304); Yasuko Fujita (0000-0002-3988-9076); Noriyuki Uesugi (0000 -0002-4388-6660); Kazuyuki Ishida (0000-0002-2804-4588); Tamotsu Sugai (0000-0002-4896-3557); Takayuki Matsumoto (0000-0001-9786-3854).
Author contributions: Kawasaki K designed the study, and was involved in patients’ management, performed endoscopic examinations and drafted the manuscript; Eizuka M reviewed the histological specimens and was responsible for the pathological diagnosis; Nakamura S, Endo M, Yanai S, Akasaka R, Toya Y, Fujita Y, Uesugi N and Ishida K participated in helped to draft the manuscript; Sugai T reviewed the histological specimens and was responsible for the pathological diagnosis; Matsumoto T critically reviewed and revised the manuscript; all authors have read and approved the final version of the manuscripts.
Institutional review board statement: The protocol of this retrospective study was approved by the Institutional Review Board at Iwate Medical University.
Informed consent statement: Patients were not required to give informed consent as this is a retrospective study.
Conflict-of-interest statement: The authors have no conflicts of interest to declare.
Data sharing statement: No additional data are available.
Open-Access: This article is an open-access article which was selected by an in-house editor and fully peer-reviewed by external reviewers. It is distributed in accordance with the Creative Commons Attribution Non Commercial (CC BY-NC 4.0) license, which permits others to distribute, remix, adapt, build upon this work non-commercially, and license their derivative works on different terms, provided the original work is properly cited and the use is non-commercial. See: http://creativecommons.org/licenses/by-nc/4.0/
Manuscript source: Invited manuscript
Correspondence to: Keisuke Kawasaki, MD, PhD, Doctor, Division of Gastroenterology, Department of Internal Medicine, Iwate Medical University, 19-1, Uchimaru, Morioka 020-8505, Japan. [email protected]: +81-19-6515111Fax: +81-19-6526664
Received: October 25, 2017Peer-review started: October 26, 2017First decision: November 21, 2017Revised: November 30, 2017Accepted: December 4, 2017 Article in press: December 4, 2017Published online: December 21, 2017
AbstractAIMTo examine the association between white opaque substance (WOS) and histologically verified lipid
8367 December 21, 2017|Volume 23|Issue 47|WJG|www.wjgnet.com
ORIGINAL ARTICLE
Association between white opaque substance under magnifying colonoscopy and lipid droplets in colorectal epithelial neoplasms
Retrospective Study
Keisuke Kawasaki, Makoto Eizuka, Shotaro Nakamura, Masaki Endo, Shunichi Yanai, Risaburo Akasaka, Yosuke Toya, Yasuko Fujita, Noriyuki Uesugi, Kazuyuki Ishida, Tamotsu Sugai, Takayuki Matsumoto
Submit a Manuscript: http://www.f6publishing.com
DOI: 10.3748/wjg.v23.i47.8367
World J Gastroenterol 2017 December 21; 23(47): 8367-8375
ISSN 1007-9327 (print) ISSN 2219-2840 (online)
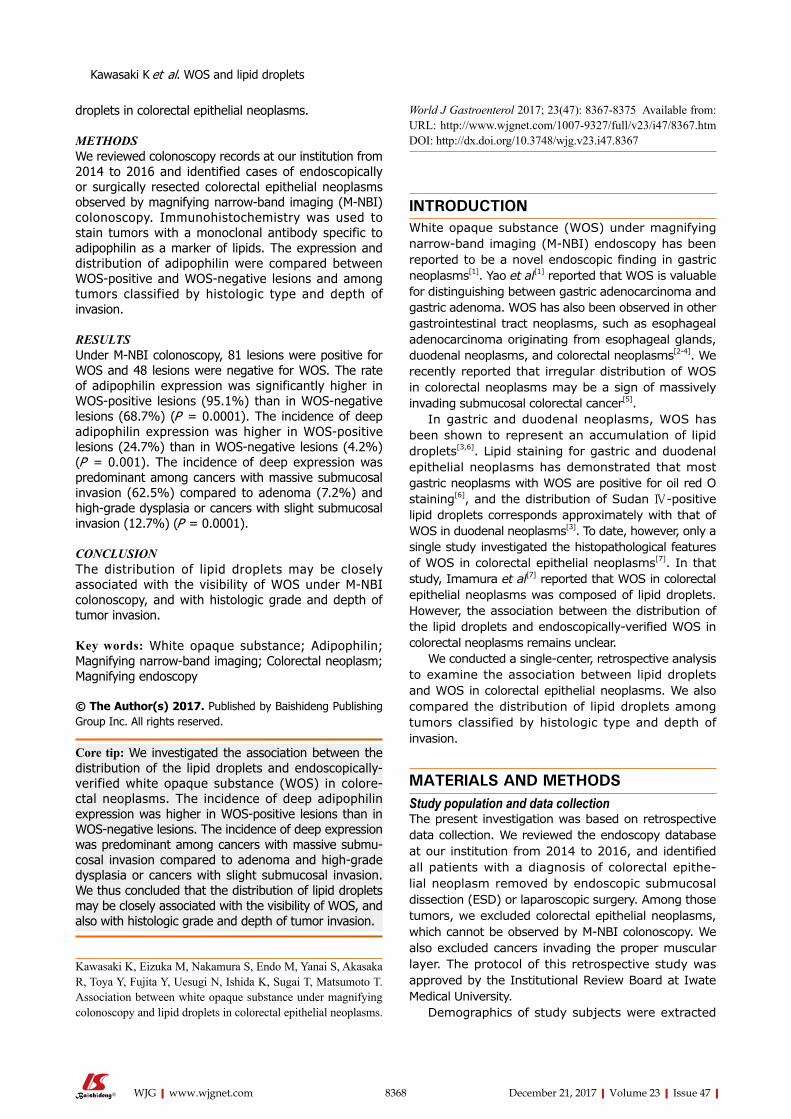
droplets in colorectal epithelial neoplasms.
METHODSWe reviewed colonoscopy records at our institution from 2014 to 2016 and identified cases of endoscopically or surgically resected colorectal epithelial neoplasms observed by magnifying narrow-band imaging (M-NBI) colonoscopy. Immunohistochemistry was used to stain tumors with a monoclonal antibody specific to adipophilin as a marker of lipids. The expression and distribution of adipophilin were compared between WOS-positive and WOS-negative lesions and among tumors classified by histologic type and depth of invasion.
RESULTSUnder M-NBI colonoscopy, 81 lesions were positive for WOS and 48 lesions were negative for WOS. The rate of adipophilin expression was significantly higher in WOS-positive lesions (95.1%) than in WOS-negative lesions (68.7%) (P = 0.0001). The incidence of deep adipophilin expression was higher in WOS-positive lesions (24.7%) than in WOS-negative lesions (4.2%) (P = 0.001). The incidence of deep expression was predominant among cancers with massive submucosal invasion (62.5%) compared to adenoma (7.2%) and high-grade dysplasia or cancers with slight submucosal invasion (12.7%) (P = 0.0001).
CONCLUSIONThe distribution of lipid droplets may be closely associated with the visibility of WOS under M-NBI colonoscopy, and with histologic grade and depth of tumor invasion.
Key words: White opaque substance; Adipophilin; Magnifying narrow-band imaging; Colorectal neoplasm; Magnifying endoscopy
© The Author(s) 2017. Published by Baishideng Publishing Group Inc. All rights reserved.
Core tip: We investigated the association between the distribution of the lipid droplets and endoscopically-verified white opaque substance (WOS) in colore-ctal neoplasms. The incidence of deep adipophilin expression was higher in WOS-positive lesions than in WOS-negative lesions. The incidence of deep expression was predominant among cancers with massive submu-cosal invasion compared to adenoma and high-grade dysplasia or cancers with slight submucosal invasion. We thus concluded that the distribution of lipid droplets may be closely associated with the visibility of WOS, and also with histologic grade and depth of tumor invasion.
Kawasaki K, Eizuka M, Nakamura S, Endo M, Yanai S, Akasaka R, Toya Y, Fujita Y, Uesugi N, Ishida K, Sugai T, Matsumoto T. Association between white opaque substance under magnifying colonoscopy and lipid droplets in colorectal epithelial neoplasms.
World J Gastroenterol 2017; 23(47): 8367-8375 Available from: URL: http://www.wjgnet.com/1007-9327/full/v23/i47/8367.htm DOI: http://dx.doi.org/10.3748/wjg.v23.i47.8367
INTRODUCTIONWhite opaque substance (WOS) under magnifying narrow-band imaging (M-NBI) endoscopy has been reported to be a novel endoscopic finding in gastric neoplasms[1]. Yao et al[1] reported that WOS is valuable for distinguishing between gastric adenocarcinoma and gastric adenoma. WOS has also been observed in other gastrointestinal tract neoplasms, such as esophageal adenocarcinoma originating from esophageal glands, duodenal neoplasms, and colorectal neoplasms[2-4]. We recently reported that irregular distribution of WOS in colorectal neoplasms may be a sign of massively invading submucosal colorectal cancer[5].
In gastric and duodenal neoplasms, WOS has been shown to represent an accumulation of lipid droplets[3,6]. Lipid staining for gastric and duodenal epithelial neoplasms has demonstrated that most gastric neoplasms with WOS are positive for oil red O staining[6], and the distribution of Sudan Ⅳ-positive lipid droplets corresponds approximately with that of WOS in duodenal neoplasms[3]. To date, however, only a single study investigated the histopathological features of WOS in colorectal epithelial neoplasms[7]. In that study, Imamura et al[7] reported that WOS in colorectal epithelial neoplasms was composed of lipid droplets. However, the association between the distribution of the lipid droplets and endoscopically-verified WOS in colorectal neoplasms remains unclear.
We conducted a single-center, retrospective analysis to examine the association between lipid droplets and WOS in colorectal epithelial neoplasms. We also compared the distribution of lipid droplets among tumors classified by histologic type and depth of invasion.
MATERIALS AND METHODSStudy population and data collectionThe present investigation was based on retrospective data collection. We reviewed the endoscopy database at our institution from 2014 to 2016, and identified all patients with a diagnosis of colorectal epithe-lial neoplasm removed by endoscopic submucosal dissection (ESD) or laparoscopic surgery. Among those tumors, we excluded colorectal epithelial neoplasms, which cannot be observed by M-NBI colonoscopy. We also excluded cancers invading the proper muscular layer. The protocol of this retrospective study was approved by the Institutional Review Board at Iwate Medical University.
Demographics of study subjects were extracted
8368 December 21, 2017|Volume 23|Issue 47|WJG|www.wjgnet.com
Kawasaki K et al. WOS and lipid droplets
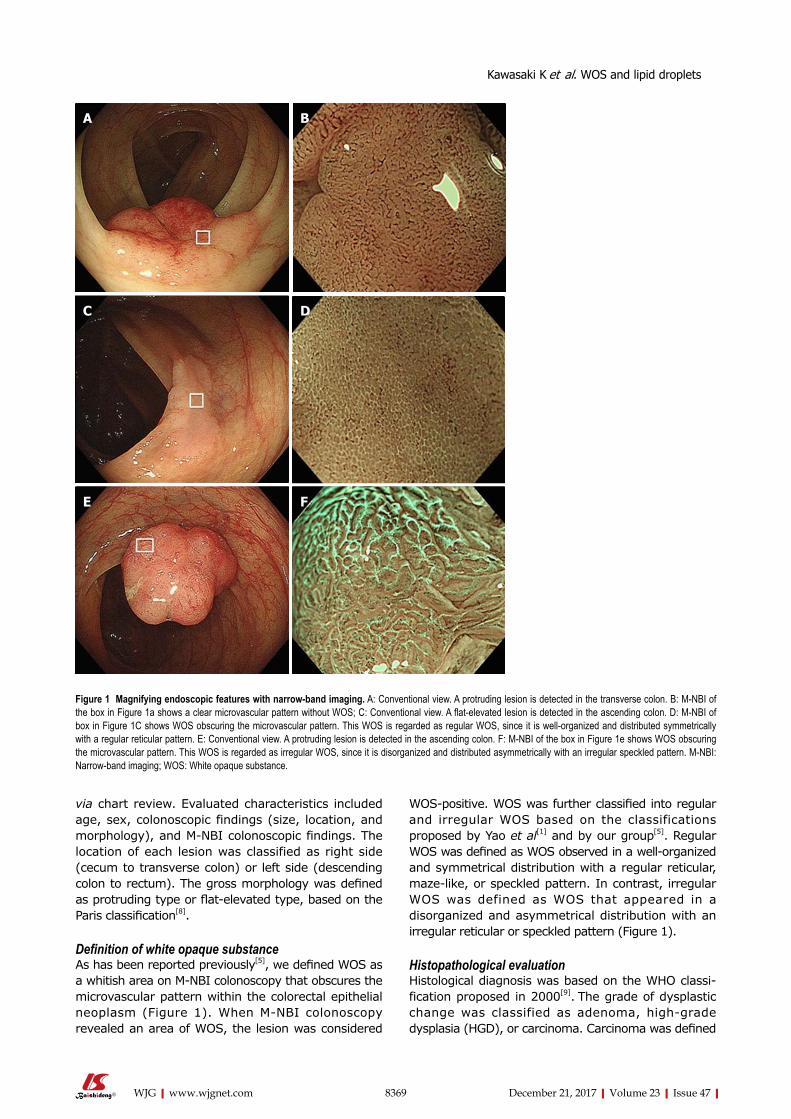
via chart review. Evaluated characteristics included age, sex, colonoscopic findings (size, location, and morphology), and M-NBI colonoscopic findings. The location of each lesion was classified as right side (cecum to transverse colon) or left side (descending colon to rectum). The gross morphology was defined as protruding type or flat-elevated type, based on the Paris classification[8].
Definition of white opaque substanceAs has been reported previously[5], we defined WOS as a whitish area on M-NBI colonoscopy that obscures the microvascular pattern within the colorectal epithelial neoplasm (Figure 1). When M-NBI colonoscopy revealed an area of WOS, the lesion was considered
WOS-positive. WOS was further classified into regular and irregular WOS based on the classifications proposed by Yao et al[1] and by our group[5]. Regular WOS was defined as WOS observed in a well-organized and symmetrical distribution with a regular reticular, maze-like, or speckled pattern. In contrast, irregular WOS was defined as WOS that appeared in a disorganized and asymmetrical distribution with an irregular reticular or speckled pattern (Figure 1).
Histopathological evaluation Histological diagnosis was based on the WHO classi-fication proposed in 2000[9]. The grade of dysplastic change was classified as adenoma, high-grade dysplasia (HGD), or carcinoma. Carcinoma was defined
8369 December 21, 2017|Volume 23|Issue 47|WJG|www.wjgnet.com
Figure 1 Magnifying endoscopic features with narrow-band imaging. A: Conventional view. A protruding lesion is detected in the transverse colon. B: M-NBI of the box in Figure 1a shows a clear microvascular pattern without WOS; C: Conventional view. A flat-elevated lesion is detected in the ascending colon. D: M-NBI of box in Figure 1C shows WOS obscuring the microvascular pattern. This WOS is regarded as regular WOS, since it is well-organized and distributed symmetrically with a regular reticular pattern. E: Conventional view. A protruding lesion is detected in the ascending colon. F: M-NBI of the box in Figure 1e shows WOS obscuring the microvascular pattern. This WOS is regarded as irregular WOS, since it is disorganized and distributed asymmetrically with an irregular speckled pattern. M-NBI: Narrow-band imaging; WOS: White opaque substance.
A B
C D
E F
Kawasaki K et al. WOS and lipid droplets
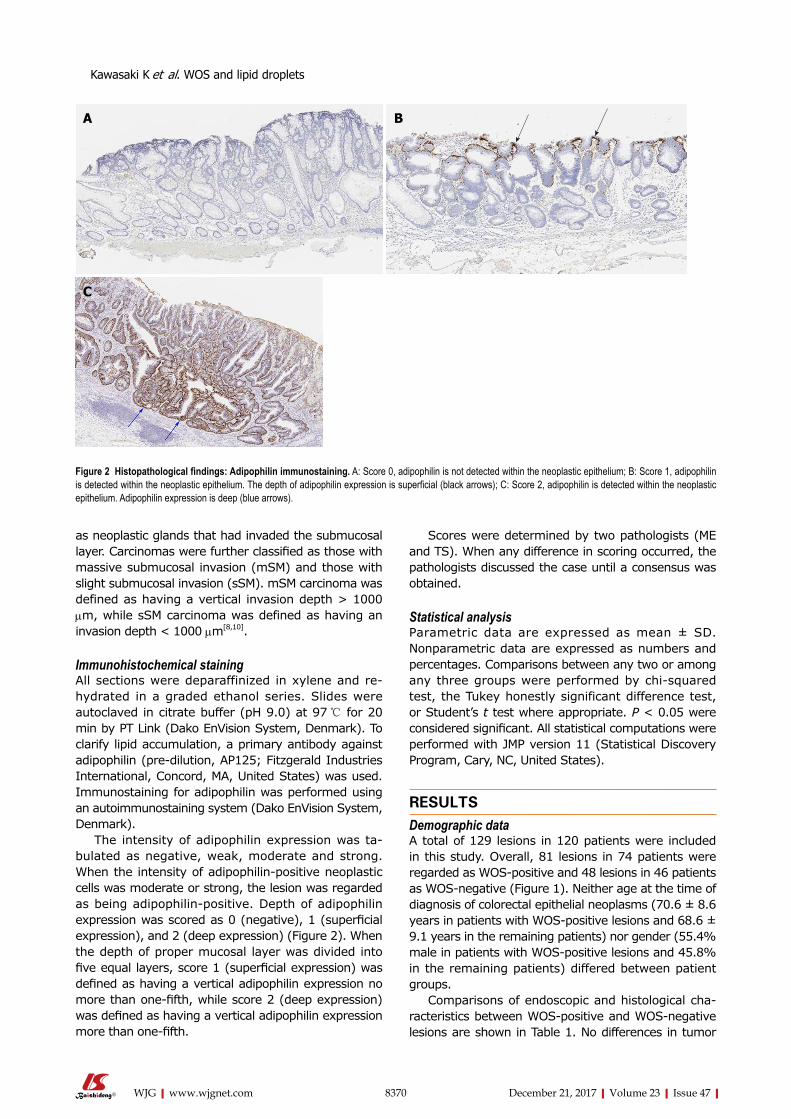
8370 December 21, 2017|Volume 23|Issue 47|WJG|www.wjgnet.com
Scores were determined by two pathologists (ME and TS). When any difference in scoring occurred, the pathologists discussed the case until a consensus was obtained.
Statistical analysisParametric data are expressed as mean ± SD. Nonparametric data are expressed as numbers and percentages. Comparisons between any two or among any three groups were performed by chi-squared test, the Tukey honestly significant difference test, or Student’s t test where appropriate. P < 0.05 were considered significant. All statistical computations were performed with JMP version 11 (Statistical Discovery Program, Cary, NC, United States).
RESULTSDemographic dataA total of 129 lesions in 120 patients were included in this study. Overall, 81 lesions in 74 patients were regarded as WOS-positive and 48 lesions in 46 patients as WOS-negative (Figure 1). Neither age at the time of diagnosis of colorectal epithelial neoplasms (70.6 ± 8.6 years in patients with WOS-positive lesions and 68.6 ± 9.1 years in the remaining patients) nor gender (55.4% male in patients with WOS-positive lesions and 45.8% in the remaining patients) differed between patient groups.
Comparisons of endoscopic and histological cha-racteristics between WOS-positive and WOS-negative lesions are shown in Table 1. No differences in tumor
as neoplastic glands that had invaded the submucosal layer. Carcinomas were further classified as those with massive submucosal invasion (mSM) and those with slight submucosal invasion (sSM). mSM carcinoma was defined as having a vertical invasion depth > 1000 μm, while sSM carcinoma was defined as having an invasion depth < 1000 μm[8,10].
Immunohistochemical stainingAll sections were deparaffinized in xylene and re-hydrated in a graded ethanol series. Slides were autoclaved in citrate buffer (pH 9.0) at 97 ℃ for 20 min by PT Link (Dako EnVision System, Denmark). To clarify lipid accumulation, a primary antibody against adipophilin (pre-dilution, AP125; Fitzgerald Industries International, Concord, MA, United States) was used. Immunostaining for adipophilin was performed using an autoimmunostaining system (Dako EnVision System, Denmark).
The intensity of adipophilin expression was ta-bulated as negative, weak, moderate and strong. When the intensity of adipophilin-positive neoplastic cells was moderate or strong, the lesion was regarded as being adipophilin-positive. Depth of adipophilin expression was scored as 0 (negative), 1 (superficial expression), and 2 (deep expression) (Figure 2). When the depth of proper mucosal layer was divided into five equal layers, score 1 (superficial expression) was defined as having a vertical adipophilin expression no more than one-fifth, while score 2 (deep expression) was defined as having a vertical adipophilin expression more than one-fifth.
Figure 2 Histopathological findings: Adipophilin immunostaining. A: Score 0, adipophilin is not detected within the neoplastic epithelium; B: Score 1, adipophilin is detected within the neoplastic epithelium. The depth of adipophilin expression is superficial (black arrows); C: Score 2, adipophilin is detected within the neoplastic epithelium. Adipophilin expression is deep (blue arrows).
A B
C
Kawasaki K et al. WOS and lipid droplets
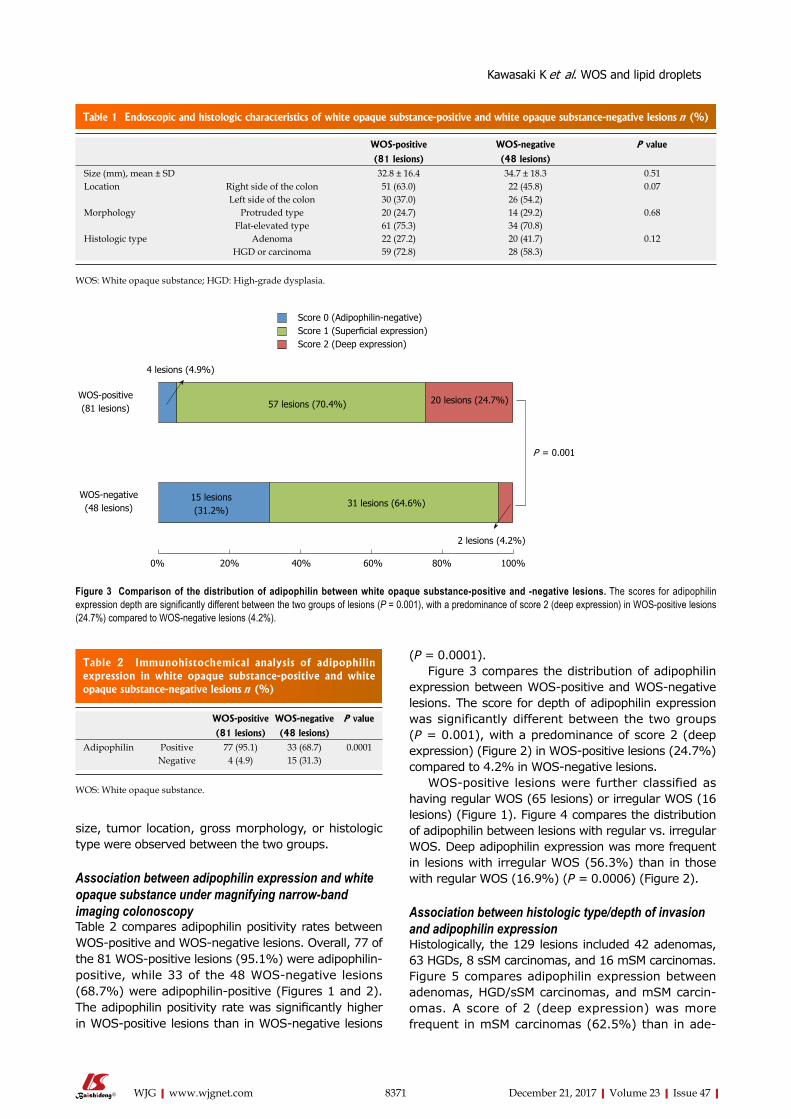
8371 December 21, 2017|Volume 23|Issue 47|WJG|www.wjgnet.com
size, tumor location, gross morphology, or histologic type were observed between the two groups.
Association between adipophilin expression and white opaque substance under magnifying narrow-band imaging colonoscopyTable 2 compares adipophilin positivity rates between WOS-positive and WOS-negative lesions. Overall, 77 of the 81 WOS-positive lesions (95.1%) were adipophilin-positive, while 33 of the 48 WOS-negative lesions (68.7%) were adipophilin-positive (Figures 1 and 2). The adipophilin positivity rate was significantly higher in WOS-positive lesions than in WOS-negative lesions
(P = 0.0001).Figure 3 compares the distribution of adipophilin
expression between WOS-positive and WOS-negative lesions. The score for depth of adipophilin expression was significantly different between the two groups (P = 0.001), with a predominance of score 2 (deep expression) (Figure 2) in WOS-positive lesions (24.7%) compared to 4.2% in WOS-negative lesions.
WOS-positive lesions were further classified as having regular WOS (65 lesions) or irregular WOS (16 lesions) (Figure 1). Figure 4 compares the distribution of adipophilin between lesions with regular vs. irregular WOS. Deep adipophilin expression was more frequent in lesions with irregular WOS (56.3%) than in those with regular WOS (16.9%) (P = 0.0006) (Figure 2).
Association between histologic type/depth of invasion and adipophilin expression Histologically, the 129 lesions included 42 adenomas, 63 HGDs, 8 sSM carcinomas, and 16 mSM carcinomas. Figure 5 compares adipophilin expression between adenomas, HGD/sSM carcinomas, and mSM carcin-omas. A score of 2 (deep expression) was more frequent in mSM carcinomas (62.5%) than in ade-
Table 1 Endoscopic and histologic characteristics of white opaque substance-positive and white opaque substance-negative lesions n (%)
WOS-positive WOS-negative P value
(81 lesions) (48 lesions)Size (mm), mean ± SD 32.8 ± 16.4 34.7 ± 18.3 0.51Location Right side of the colon 51 (63.0) 22 (45.8) 0.07
Left side of the colon 30 (37.0) 26 (54.2)Morphology Protruded type 20 (24.7) 14 (29.2) 0.68
Flat-elevated type 61 (75.3) 34 (70.8)Histologic type Adenoma 22 (27.2) 20 (41.7) 0.12
HGD or carcinoma 59 (72.8) 28 (58.3)
WOS: White opaque substance; HGD: High-grade dysplasia.
4 lesions (4.9%)
WOS-positive (81 lesions)
WOS-negative (48 lesions)
57 lesions (70.4%)
0% 20% 40% 60% 80% 100%
20 lesions (24.7%)
2 lesions (4.2%)
15 lesions (31.2%)
31 lesions (64.6%)
P = 0.001
Score 0 (Adipophilin-negative)Score 1 (Superficial expression)Score 2 (Deep expression)
Figure 3 Comparison of the distribution of adipophilin between white opaque substance-positive and -negative lesions. The scores for adipophilin expression depth are significantly different between the two groups of lesions (P = 0.001), with a predominance of score 2 (deep expression) in WOS-positive lesions (24.7%) compared to WOS-negative lesions (4.2%).
Table 2 Immunohistochemical analysis of adipophilin expression in white opaque substance-positive and white opaque substance-negative lesions n (%)
WOS-positive WOS-negative P value
(81 lesions) (48 lesions)Adipophilin Positive 77 (95.1) 33 (68.7) 0.0001
Negative 4 (4.9) 15 (31.3)
WOS: White opaque substance.
Kawasaki K et al. WOS and lipid droplets
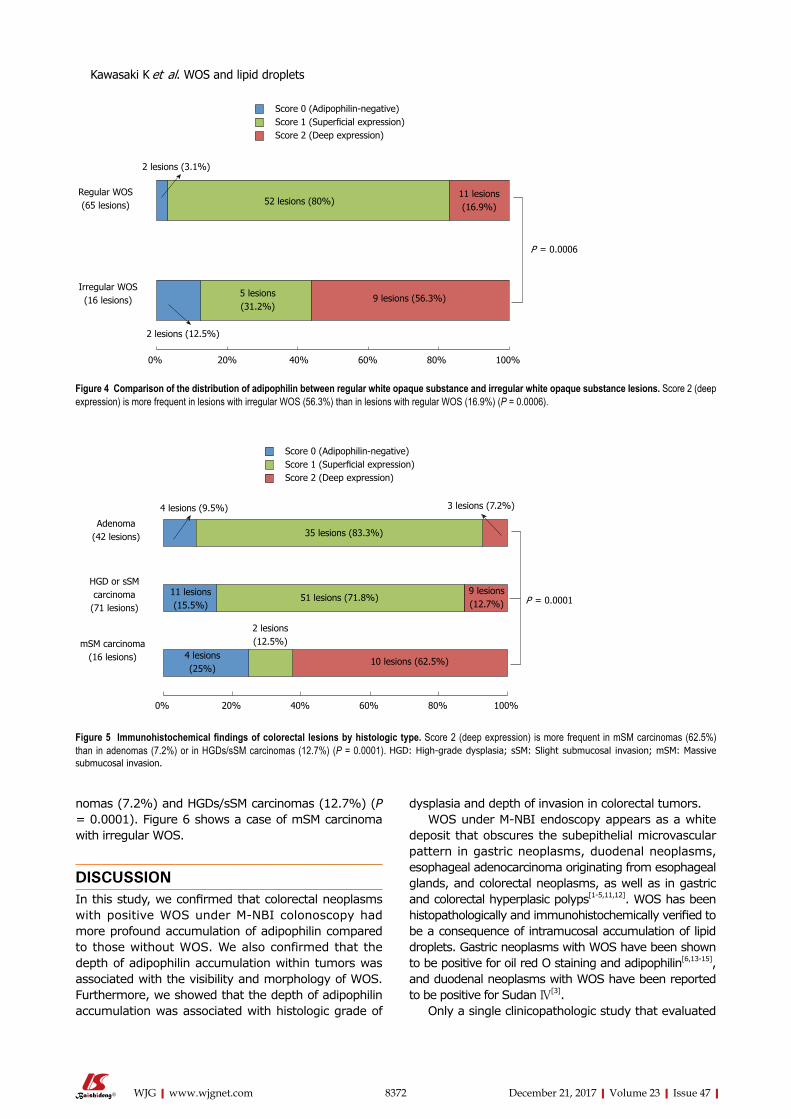
8372 December 21, 2017|Volume 23|Issue 47|WJG|www.wjgnet.com
nomas (7.2%) and HGDs/sSM carcinomas (12.7%) (P = 0.0001). Figure 6 shows a case of mSM carcinoma with irregular WOS.
DISCUSSIONIn this study, we confirmed that colorectal neoplasms with positive WOS under M-NBI colonoscopy had more profound accumulation of adipophilin compared to those without WOS. We also confirmed that the depth of adipophilin accumulation within tumors was associated with the visibility and morphology of WOS. Furthermore, we showed that the depth of adipophilin accumulation was associated with histologic grade of
dysplasia and depth of invasion in colorectal tumors.WOS under M-NBI endoscopy appears as a white
deposit that obscures the subepithelial microvascular pattern in gastric neoplasms, duodenal neoplasms, esophageal adenocarcinoma originating from esophageal glands, and colorectal neoplasms, as well as in gastric and colorectal hyperplasic polyps[1-5,11,12]. WOS has been histopathologically and immunohistochemically verified to be a consequence of intramucosal accumulation of lipid droplets. Gastric neoplasms with WOS have been shown to be positive for oil red O staining and adipophilin[6,13-15], and duodenal neoplasms with WOS have been reported to be positive for Sudan Ⅳ[3].
Only a single clinicopathologic study that evaluated
2 lesions (3.1%)
Regular WOS (65 lesions)
Irregular WOS (16 lesions)
52 lesions (80%)
0% 20% 40% 60% 80% 100%
11 lesions (16.9%)
2 lesions (12.5%)
5 lesions (31.2%)
9 lesions (56.3%)
P = 0.0006
Score 0 (Adipophilin-negative)Score 1 (Superficial expression)Score 2 (Deep expression)
Figure 4 Comparison of the distribution of adipophilin between regular white opaque substance and irregular white opaque substance lesions. Score 2 (deep expression) is more frequent in lesions with irregular WOS (56.3%) than in lesions with regular WOS (16.9%) (P = 0.0006).
4 lesions (9.5%)
Adenoma (42 lesions)
mSM carcinoma (16 lesions)
35 lesions (83.3%)
0% 20% 40% 60% 80% 100%
3 lesions (7.2%)
10 lesions (62.5%)
2 lesions (12.5%)
51 lesions (71.8%) P = 0.0001
Score 0 (Adipophilin-negative)Score 1 (Superficial expression)Score 2 (Deep expression)
4 lesions (25%)
11 lesions (15.5%)
9 lesions (12.7%)
HGD or sSM carcinoma
(71 lesions)
Figure 5 Immunohistochemical findings of colorectal lesions by histologic type. Score 2 (deep expression) is more frequent in mSM carcinomas (62.5%) than in adenomas (7.2%) or in HGDs/sSM carcinomas (12.7%) (P = 0.0001). HGD: High-grade dysplasia; sSM: Slight submucosal invasion; mSM: Massive submucosal invasion.
Kawasaki K et al. WOS and lipid droplets
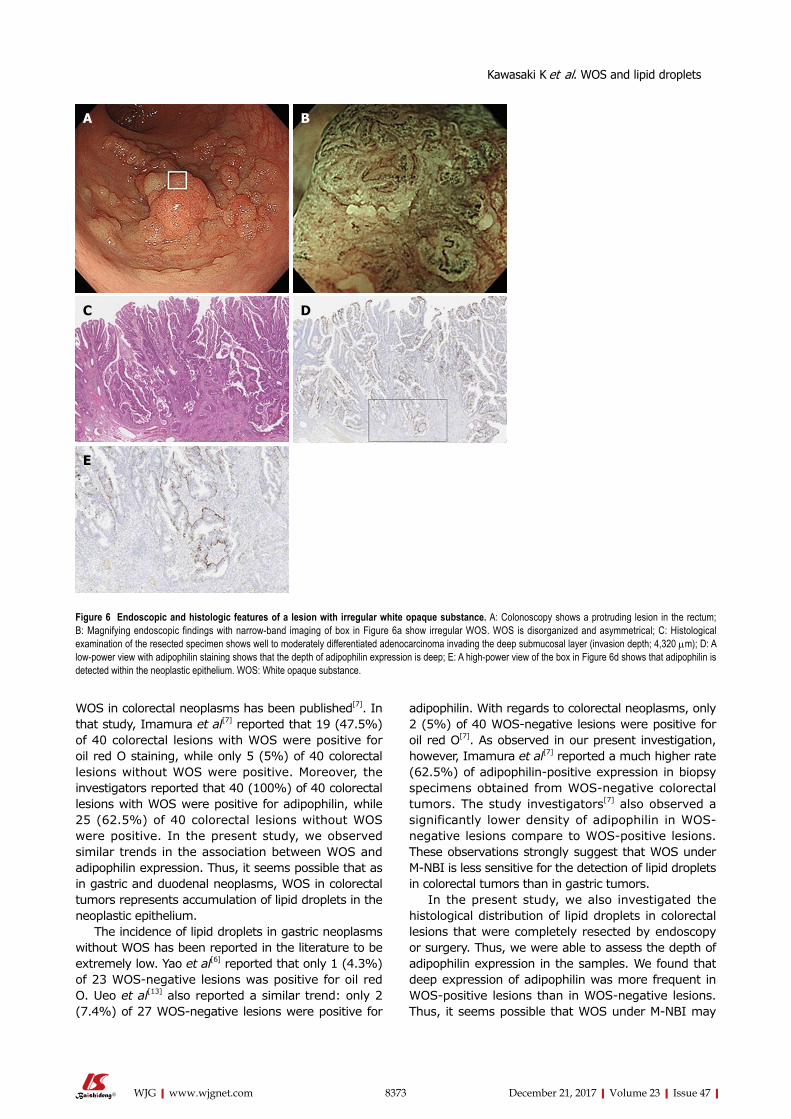
8373 December 21, 2017|Volume 23|Issue 47|WJG|www.wjgnet.com
WOS in colorectal neoplasms has been published[7]. In that study, Imamura et al[7] reported that 19 (47.5%) of 40 colorectal lesions with WOS were positive for oil red O staining, while only 5 (5%) of 40 colorectal lesions without WOS were positive. Moreover, the investigators reported that 40 (100%) of 40 colorectal lesions with WOS were positive for adipophilin, while 25 (62.5%) of 40 colorectal lesions without WOS were positive. In the present study, we observed similar trends in the association between WOS and adipophilin expression. Thus, it seems possible that as in gastric and duodenal neoplasms, WOS in colorectal tumors represents accumulation of lipid droplets in the neoplastic epithelium.
The incidence of lipid droplets in gastric neoplasms without WOS has been reported in the literature to be extremely low. Yao et al[6] reported that only 1 (4.3%) of 23 WOS-negative lesions was positive for oil red O. Ueo et al[13] also reported a similar trend: only 2 (7.4%) of 27 WOS-negative lesions were positive for
adipophilin. With regards to colorectal neoplasms, only 2 (5%) of 40 WOS-negative lesions were positive for oil red O[7]. As observed in our present investigation, however, Imamura et al[7] reported a much higher rate (62.5%) of adipophilin-positive expression in biopsy specimens obtained from WOS-negative colorectal tumors. The study investigators[7] also observed a significantly lower density of adipophilin in WOS-negative lesions compare to WOS-positive lesions. These observations strongly suggest that WOS under M-NBI is less sensitive for the detection of lipid droplets in colorectal tumors than in gastric tumors.
In the present study, we also investigated the histological distribution of lipid droplets in colorectal lesions that were completely resected by endoscopy or surgery. Thus, we were able to assess the depth of adipophilin expression in the samples. We found that deep expression of adipophilin was more frequent in WOS-positive lesions than in WOS-negative lesions. Thus, it seems possible that WOS under M-NBI may
Figure 6 Endoscopic and histologic features of a lesion with irregular white opaque substance. A: Colonoscopy shows a protruding lesion in the rectum; B: Magnifying endoscopic findings with narrow-band imaging of box in Figure 6a show irregular WOS. WOS is disorganized and asymmetrical; C: Histological examination of the resected specimen shows well to moderately differentiated adenocarcinoma invading the deep submucosal layer (invasion depth; 4,320 μm); D: A low-power view with adipophilin staining shows that the depth of adipophilin expression is deep; E: A high-power view of the box in Figure 6d shows that adipophilin is detected within the neoplastic epithelium. WOS: White opaque substance.
A B
C D
E
Kawasaki K et al. WOS and lipid droplets
8374 December 21, 2017|Volume 23|Issue 47|WJG|www.wjgnet.com
be representative of the total volume of lipid droplets in colorectal tumors.
The present results also showed that deep adipo-philin expression was more frequent in mSM carcinomas than in adenomas or HGDs/sSM carcinomas. Yao et al[6] reported that 10 (36.5%) of 26 gastric neoplasms were positive for oil O red staining within surface epithelial cells, while 16 (61.5%) of 26 gastric neoplasms were positive for oil O red both in surface epithelial cells and in the subepithelial region. Ueo et al[13] reported that surface plus cryptal accumulation of adipophilin was frequent in gastric cancers, while surface accumulation was observed in most gastric adenomas. It thus seems possible that the intraepithelial localization of lipid droplets in gastric tumors differs according to the histological grade of dysplasia. However, the association between lipid droplet accumulation and tumor invasion depth has not been examined in gastric epithelial tumors to date. In contrast, our results suggested that the depth of adipophilin expression may be correlated with the depth of invasion, rather than the histologic grade, in colorectal tumors.
In our previous analysis, the incidence of mSM carcinoma was significantly and conspicuously higher among lesions with irregular WOS (82.4%) than among those with regular WOS (1.4%)[5]. In the present study, lesions with irregular WOS had deeper adipophilin expression than those with regular WOS. It thus seems possible that irregular WOS may be a consequence of massive lipid droplet accumulation in colorectal tumors. This speculation appears to partially explain the high rate of submucosal invasion in lesions with irregular WOS. Lipid droplets may be directly or indirectly associated with the malignant potential of colorectal neoplasms.
The present study has several limitations. First, since we included only lesions removed by ESD or surgery and did not include small lesions, it remains unclear whether the present observations are applicable to smaller colorectal lesions. Second, the present results were based on a retrospective analysis in a single center. A need exists for prospective analysis of a greater number of colorectal epithelial neoplasms to determine the association between lipid droplets and WOS under NBI, and also the clinical significance of WOS for the diagnosis and treatment of colorectal tumors.
In conclusion, the present immunohistochemical study showed that WOS observed in colorectal tumors under M-NBI colonoscopy represents lipid droplets. In addition, the distribution of lipid droplets may be closely associated with the visibility of WOS under M-NBI colonoscopy, and also with histologic grade and depth of tumor invasion. Further prospective studies are warranted to establish the clinical significance of WOS for the diagnosis and treatment of colorectal epithelial tumors and the association between lipid
droplets and WOS under NBI.
ARTICLE HIGHLIGHTSResearch backgroundWhite opaque substance (WOS) under magnifying narrow-band imaging (M-NBI) endoscopy is a novel endoscopic finding for the diagnosis of gastrointestinal tract neoplasms. In previous studies, WOS has been shown to contain lipid droplets. However, the association between the distribution of the lipid droplets and endoscopically verified WOS in colorectal neoplasms remains unclear.
Research motivationThe elucidation of WOS or lipid droplets in colorectal epithelial tumors will help the diagnosis and treatment of colorectal epithelial tumors.
Research objectivesTo examine the association between WOS and histologically verified lipid droplets in colorectal epithelial neoplasms.
Research methodsWe conducted this retrospective study involving 129 lesions of endoscopically or surgically resected colorectal epithelial neoplasms observed by M-NBI colonoscopy. Immunohistochemistry was used to stain tumors with a monoclonal antibody specific to adipophilin as a marker of lipids. The expression and distribution of adipophilin were compared between WOS-positive and WOS-negative lesions and among tumors classified by histologic type and depth of invasion.
Research results81 lesions were positive for WOS and 48 lesions were negative for WOS. The rate of adipophilin expression was significantly higher in WOS-positive lesions (95.1%) than in WOS-negative lesions (68.7%) (P = 0.0001). The incidence of deep adipophilin expression was higher in WOS-positive lesions (24.7%) than in WOS-negative lesions (4.2%) (P = 0.001). The incidence of deep expression was predominant among cancers with massive submucosal invasion (62.5%) compared to adenoma (7.2%) and high-grade dysplasia or cancers with slight submucosal invasion (12.7%) (P = 0.0001).
Research conclusions The distribution of lipid droplets may be closely associated with the visibility of WOS under M-NBI colonoscopy, and with histologic grade and depth of tumor invasion.
Research perspectives Our study showed that WOS under M-NBI colonoscopy appears to represent lipid droplets and the distribution of lipid droplets may be closely associated with the visibility of WOS with histologic grade and depth of tumor invasion. The accumulation of lipid droplets may directly or indirectly represent the malignant potential of colon cancer cells. Further prospective studies are warranted to establish the clinical significance of WOS for the diagnosis and treatment of colorectal epithelial tumors and the association between lipid droplets and WOS under NBI.
REFERENCES1 Yao K, Iwashita A, Tanabe H, Nishimata N, Nagahama T, Maki S,
Takaki Y, Hirai F, Hisabe T, Nishimura T, Matsui T. White opaque substance within superficial elevated gastric neoplasia as visualized by magnification endoscopy with narrow-band imaging: a new optical sign for differentiating between adenoma and carcinoma. Gastrointest Endosc 2008; 68: 574-580 [PMID: 18656862 DOI: 10.1016/j.gie.2008.04.011]
ARTICLE HIGHLIGHTS
Kawasaki K et al. WOS and lipid droplets
8375 December 21, 2017|Volume 23|Issue 47|WJG|www.wjgnet.com
2 Yoshii S, Kato M, Honma K, Fujinaga T, Tsujii Y, Maekawa A, Inoue T, Hayashi Y, Akasaka T, Shinzaki S, Nishida T, Iijima H, Tsujii M, Morii E, Takehara T. Esophageal adenocarcinoma with white opaque substance observed by magnifying endoscopy with narrow band imaging. Dig Endosc 2015; 27: 392-396 [PMID: 25041337 DOI: 10.1111/den.12331]
3 Yoshimura N, Goda K, Tajiri H, Ikegami M, Nakayoshi T, Kaise M. Endoscopic features of nonampullary duodenal tumors with narrow-band imaging. Hepatogastroenterology 2010; 57: 462-467 [PMID: 20698209]
4 Hisabe T, Yao K, Imamura K, Ishihara H, Hirai F, Matsui T, Iwashita A. White opaque substance visualized using magnifying endoscopy with narrow-band imaging in colorectal epithelial neoplasms. Dig Dis Sci 2014; 59: 2544-2549 [PMID: 24828918 DOI: 10.1007/s10620-014-3204-5]
5 Kawasaki K, Kurahara K, Yanai S, Oshiro Y, Eizuka M, Uesugi N, Ishida K, Nakamura S, Fuchigami T, Sugai T, Matsumoto T. Significance of a white opaque substance under magnifying narrow-band imaging colonoscopy for the diagnosis of colorectal epithelial neoplasms. Gastrointest Endosc 2015; 82: 1097-1104 [PMID: 26234694 DOI: 10.1016/j.gie.2015.06.023]
6 Yao K, Iwashita A, Nambu M, Tanabe H, Nagahama T, Maki S, Ishikawa H, Matsui T, Enjoji M. Nature of white opaque substance in gastric epithelial neoplasia as visualized by magnifying endoscopy with narrow-band imaging. Dig Endosc 2012; 24: 419-425 [PMID: 23078433 DOI: 10.1111/j.1443-1661.2012.01314.x]
7 Imamura K, Yao K, Hisabe T, Nambu M, Ohtsu K, Ueo T, Yano S, Ishihara H, Nagahama T, Kanemitsu T, Yamasaki K, Matsui T, Tanabe H, Iwashita A, Daa T, Yokoyama S, Matsunaga K, Enjoji M. The nature of the white opaque substance within colorectal neoplastic epithelium as visualized by magnifying endoscopy with narrow-band imaging. Endosc Int Open 2016; 4: E1151-E1157 [PMID: 27853741 DOI: 10.1055/s-0042-116487]
8 The Paris endoscopic classification of superficial neoplastic lesions: esophagus, stomach, and colon. Gastrointest Endosc 2003; 58: S3-S43
9 Hamilton SR, Adaltonen LA, editors. World Health Organization
classification of tumors: pathology and genetics of tumors of the digestive system. Lyon (France): International Agency for Research on Cancer. 2000: 103-119
10 Kitajima K, Fujimori T, Fujii S, Takeda J, Ohkura Y, Kawamata H, Kumamoto T, Ishiguro S, Kato Y, Shimoda T, Iwashita A, Ajioka Y, Watanabe H, Watanabe T, Muto T, Nagasako K. Correlations between lymph node metastasis and depth of submucosal invasion in submucosal invasive colorectal carcinoma: a Japanese collaborative study. J Gastroenterol 2004; 39: 534-543 [PMID: 15235870 DOI: 10.1007/s00535-004-1339-4]
11 Ueyama H, Matsumoto K, Nagahara A, Gushima R, Hayashi T, Yao T, Watanabe S. A white opaque substance-positive gastric hyperplastic polyp with dysplasia. World J Gastroenterol 2013; 19: 4262-4266 [PMID: 23864793 DOI: 10.3748/wjg.v19.i26.4262]
12 Hisabe T, Yao K, Imamura K, Ishihara H, Yamasaki K, Yasaka T, Matsui T, Iwashita A. Novel Endoscopic Findings as Visualized by Magnifying Endoscopy with Narrow-Band Imaging: White Opaque Substance Is Present in Colorectal Hyperplastic Polyps. Digestion 2016; 93: 127-131 [PMID: 26636961 DOI: 10.1159/000441841]
13 Ueo T, Yonemasu H, Yada N, Yano S, Ishida T, Urabe M, Takahashi K, Nagamatsu H, Narita R, Yao K, Daa T, Yokoyama S. White opaque substance represents an intracytoplasmic accumulation of lipid droplets: immunohistochemical and immunoelectron microscopic investigation of 26 cases. Dig Endosc 2013; 25: 147-155 [PMID: 23368762 DOI: 10.1111/j.1443-1661.2012.01364.x]
14 Enjoji M, Kohjima M, Ohtsu K, Matsunaga K, Murata Y, Nakamuta M, Imamura K, Tanabe H, Iwashita A, Nagahama T, Yao K. Intracellular mechanisms underlying lipid accumulation (white opaque substance) in gastric epithelial neoplasms: A pilot study of expression profiles of lipid-metabolism-associated genes. J Gastroenterol Hepatol 2016; 31: 776-781 [PMID: 26513060 DOI: 10.1111/jgh.13216]
15 Ueo T, Yonemasu H, Yao K, Ishida T, Togo K, Yanai Y, Fukuda M, Motomura M, Narita R, Murakami K. Histologic differentiation and mucin phenotype in white opaque substance-positive gastric neoplasias. Endosc Int Open 2015; 3: E597-E604 [PMID: 26716119 DOI: 10.1055/s-0034-1393177]
P- Reviewer: Alberti LR, Arya V S- Editor: Chen K L- Editor: A E- Editor: Huang Y
Kawasaki K et al. WOS and lipid droplets
Long-Long Cao, Jun Lu, Jian-Xian Lin, Chao-Hui Zheng, Ping Li, Jian-Wei Xie, Jia-Bin Wang, Qi-Yue Chen, Mi Lin, Ru-Hong Tu, Chang-Ming Huang, Department of Gastric Surgery, Fujian Medical University Union Hospital, Fuzhou 350001, Fujian Province, China
Author contributions: Cao LL, Lu J, Lin JX and Huang CM conceived the study, analyzed the data, and drafted the manuscript; Zheng CH helped critically revise the manuscript for important intellectual content; Li P, Xie JW, Wang JB, Chen QY, Lin M and Tu RH helped collect the data and designed the study; All authors read and approved the final manuscript.
Supported by National Key Clinical Specialty Discipline Construction Program of China, No. [2012] 649.
Institutional review board statement: This study was reviewed and approved by the Ethics Committee of the Fujian Medical University Union Hospital.
Conflict-of-interest statement: The authors declare that there are no conflicts of interest associated with the publication of this manuscript.
Data sharing statement: No additional data are available.
Open-Access: This article is an open-access article which was selected by an in-house editor and fully peer-reviewed by external reviewers. It is distributed in accordance with the Creative Commons Attribution Non Commercial (CC BY-NC 4.0) license, which permits others to distribute, remix, adapt, build upon this work non-commercially, and license their derivative works on different terms, provided the original work is properly cited and the use is non-commercial. See: http://creativecommons.org/licenses/by-nc/4.0/
Manuscript source: Unsolicited manuscript
Correspondence to: Dr. Chang-Ming Huang, Professor, Department of Gastric Surgery, Fujian Medical University Union Hospital, No. 29, Xinquan Road, Fuzhou 350001, Fujian Province, China. [email protected]: +86-591-83363366
Fax: +86-591-83320319
Received: March 10, 2017 Peer-review started: March 11, 2017First decision: May 9, 2017Revised: June 3, 2017 Accepted: July 4, 2017 Article in press: July 4, 2017Published online: December 21, 2017
AbstractAIMTo assess the predictive value of the tumor-associated neutrophil-to-lymphocyte ratio in terms of the clinical outcomes of patients with gastric neuroendocrine neoplasms after radical surgery.
METHODSData were retrospectively collected from 142 patients who were diagnosed with gastric neuroendocrine neoplasms and who underwent radical gastrectomy at our department from March 2006 to March 2015. These data were retrospectively analyzed, and a receiver operating characteristic curve analysis was used to identify the optimal value of the tumor-associated neutrophil-to-lymphocyte ratio. Univariate and multivariate survival analyses were used to identify prognostic factors. A nomogram was then applied to predict clinical outcomes after surgery.
RESULTSThe tumor-associated neutrophil-to-lymphocyte ratio was significantly associated with tumor recurrence, especially with liver metastasis and lymph node metastasis (P < 0.05 for both), but not with clinical characteristics (P > 0.05 for all). A multivariate Cox regression analysis identified the tumor-associated
8376 December 21, 2017|Volume 23|Issue 47|WJG|www.wjgnet.com
ORIGINAL ARTICLE
Nomogram based on tumor-associated neutrophil-to-lymphocyte ratio to predict survival of patients with gastric neuroendocrine neoplasms
Retrospective Study
Long-Long Cao, Jun Lu, Jian-Xian Lin, Chao-Hui Zheng, Ping Li, Jian-Wei Xie, Jia-Bin Wang, Qi-Yue Chen, Mi Lin, Ru-Hong Tu, Chang-Ming Huang
Submit a Manuscript: http://www.f6publishing.com
DOI: 10.3748/wjg.v23.i47.8376
World J Gastroenterol 2017 December 21; 23(47): 8376-8386
ISSN 1007-9327 (print) ISSN 2219-2840 (online)
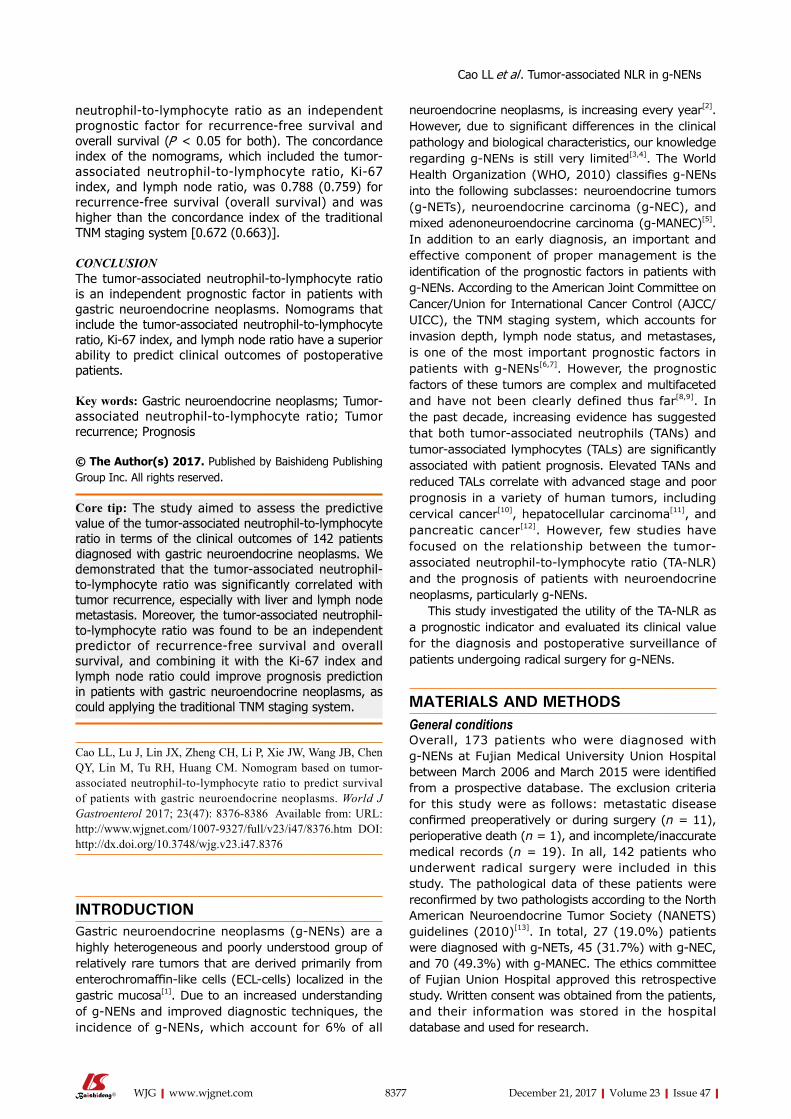
neutrophil-to-lymphocyte ratio as an independent prognostic factor for recurrence-free survival and overall survival (P < 0.05 for both). The concordance index of the nomograms, which included the tumor-associated neutrophil-to-lymphocyte ratio, Ki-67 index, and lymph node ratio, was 0.788 (0.759) for recurrence-free survival (overall survival) and was higher than the concordance index of the traditional TNM staging system [0.672 (0.663)].
CONCLUSIONThe tumor-associated neutrophil-to-lymphocyte ratio is an independent prognostic factor in patients with gastric neuroendocrine neoplasms. Nomograms that include the tumor-associated neutrophil-to-lymphocyte ratio, Ki-67 index, and lymph node ratio have a superior ability to predict clinical outcomes of postoperative patients.
Key words: Gastric neuroendocrine neoplasms; Tumor-associated neutrophil-to-lymphocyte ratio; Tumor recurrence; Prognosis
© The Author(s) 2017. Published by Baishideng Publishing Group Inc. All rights reserved.
Core tip: The study aimed to assess the predictive value of the tumor-associated neutrophil-to-lymphocyte ratio in terms of the clinical outcomes of 142 patients diagnosed with gastric neuroendocrine neoplasms. We demonstrated that the tumor-associated neutrophil-to-lymphocyte ratio was significantly correlated with tumor recurrence, especially with liver and lymph node metastasis. Moreover, the tumor-associated neutrophil-to-lymphocyte ratio was found to be an independent predictor of recurrence-free survival and overall survival, and combining it with the Ki-67 index and lymph node ratio could improve prognosis prediction in patients with gastric neuroendocrine neoplasms, as could applying the traditional TNM staging system.
Cao LL, Lu J, Lin JX, Zheng CH, Li P, Xie JW, Wang JB, Chen QY, Lin M, Tu RH, Huang CM. Nomogram based on tumor-associated neutrophil-to-lymphocyte ratio to predict survival of patients with gastric neuroendocrine neoplasms. World J Gastroenterol 2017; 23(47): 8376-8386 Available from: URL: http://www.wjgnet.com/1007-9327/full/v23/i47/8376.htm DOI: http://dx.doi.org/10.3748/wjg.v23.i47.8376
INTRODUCTIONGastric neuroendocrine neoplasms (g-NENs) are a highly heterogeneous and poorly understood group of relatively rare tumors that are derived primarily from enterochromaffin-like cells (ECL-cells) localized in the gastric mucosa[1]. Due to an increased understanding of g-NENs and improved diagnostic techniques, the incidence of g-NENs, which account for 6% of all
neuroendocrine neoplasms, is increasing every year[2]. However, due to significant differences in the clinical pathology and biological characteristics, our knowledge regarding g-NENs is still very limited[3,4]. The World Health Organization (WHO, 2010) classifies g-NENs into the following subclasses: neuroendocrine tumors (g-NETs), neuroendocrine carcinoma (g-NEC), and mixed adenoneuroendocrine carcinoma (g-MANEC)[5]. In addition to an early diagnosis, an important and effective component of proper management is the identification of the prognostic factors in patients with g-NENs. According to the American Joint Committee on Cancer/Union for International Cancer Control (AJCC/UICC), the TNM staging system, which accounts for invasion depth, lymph node status, and metastases, is one of the most important prognostic factors in patients with g-NENs[6,7]. However, the prognostic factors of these tumors are complex and multifaceted and have not been clearly defined thus far[8,9]. In the past decade, increasing evidence has suggested that both tumor-associated neutrophils (TANs) and tumor-associated lymphocytes (TALs) are significantly associated with patient prognosis. Elevated TANs and reduced TALs correlate with advanced stage and poor prognosis in a variety of human tumors, including cervical cancer[10], hepatocellular carcinoma[11], and pancreatic cancer[12]. However, few studies have focused on the relationship between the tumor-associated neutrophil-to-lymphocyte ratio (TA-NLR) and the prognosis of patients with neuroendocrine neoplasms, particularly g-NENs.
This study investigated the utility of the TA-NLR as a prognostic indicator and evaluated its clinical value for the diagnosis and postoperative surveillance of patients undergoing radical surgery for g-NENs.
MATERIALS AND METHODSGeneral conditionsOverall, 173 patients who were diagnosed with g-NENs at Fujian Medical University Union Hospital between March 2006 and March 2015 were identified from a prospective database. The exclusion criteria for this study were as follows: metastatic disease confirmed preoperatively or during surgery (n = 11), perioperative death (n = 1), and incomplete/inaccurate medical records (n = 19). In all, 142 patients who underwent radical surgery were included in this study. The pathological data of these patients were reconfirmed by two pathologists according to the North American Neuroendocrine Tumor Society (NANETS) guidelines (2010)[13]. In total, 27 (19.0%) patients were diagnosed with g-NETs, 45 (31.7%) with g-NEC, and 70 (49.3%) with g-MANEC. The ethics committee of Fujian Union Hospital approved this retrospective study. Written consent was obtained from the patients, and their information was stored in the hospital database and used for research.
8377 December 21, 2017|Volume 23|Issue 47|WJG|www.wjgnet.com
Cao LL et al . Tumor-associated NLR in g-NENs
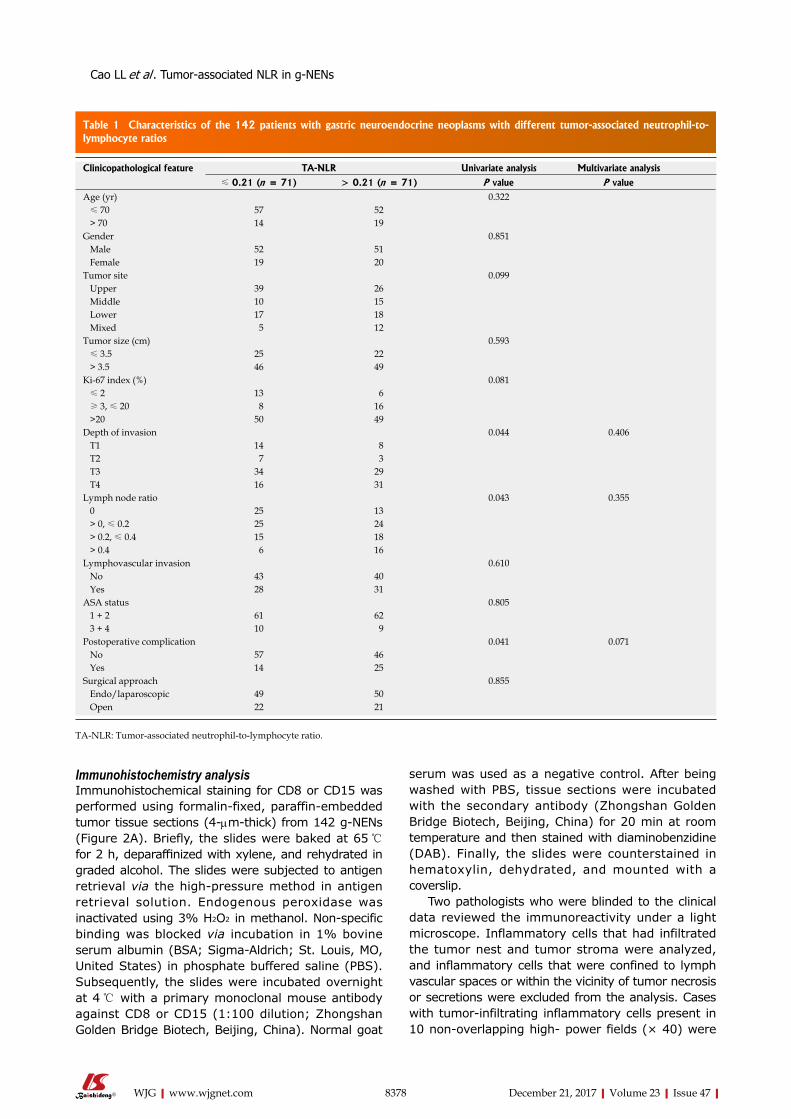
Immunohistochemistry analysisImmunohistochemical staining for CD8 or CD15 was performed using formalin-fixed, paraffin-embedded tumor tissue sections (4-μm-thick) from 142 g-NENs (Figure 2A). Briefly, the slides were baked at 65 ℃ for 2 h, deparaffinized with xylene, and rehydrated in graded alcohol. The slides were subjected to antigen retrieval via the high-pressure method in antigen retrieval solution. Endogenous peroxidase was inactivated using 3% H2O2 in methanol. Non-specific binding was blocked via incubation in 1% bovine serum albumin (BSA; Sigma-Aldrich; St. Louis, MO, United States) in phosphate buffered saline (PBS). Subsequently, the slides were incubated overnight at 4 ℃ with a primary monoclonal mouse antibody against CD8 or CD15 (1:100 dilution; Zhongshan Golden Bridge Biotech, Beijing, China). Normal goat
serum was used as a negative control. After being washed with PBS, tissue sections were incubated with the secondary antibody (Zhongshan Golden Bridge Biotech, Beijing, China) for 20 min at room temperature and then stained with diaminobenzidine (DAB). Finally, the slides were counterstained in hematoxylin, dehydrated, and mounted with a coverslip.
Two pathologists who were blinded to the clinical data reviewed the immunoreactivity under a light microscope. Inflammatory cells that had infiltrated the tumor nest and tumor stroma were analyzed, and inflammatory cells that were confined to lymph vascular spaces or within the vicinity of tumor necrosis or secretions were excluded from the analysis. Cases with tumor-infiltrating inflammatory cells present in 10 non-overlapping high- power fields (× 40) were
8378 December 21, 2017|Volume 23|Issue 47|WJG|www.wjgnet.com
Table 1 Characteristics of the 142 patients with gastric neuroendocrine neoplasms with different tumor-associated neutrophil-to-lymphocyte ratios
Clinicopathological feature TA-NLR Univariate analysis Multivariate analysis≤ 0.21 (n = 71) > 0.21 (n = 71) P value P value
Age (yr) 0.322 ≤ 70 57 52 > 70 14 19Gender 0.851 Male 52 51 Female 19 20Tumor site 0.099 Upper 39 26 Middle 10 15 Lower 17 18 Mixed 5 12Tumor size (cm) 0.593 ≤ 3.5 25 22 > 3.5 46 49Ki-67 index (%) 0.081 ≤ 2 13 6 ≥ 3, ≤ 20 8 16 >20 50 49Depth of invasion 0.044 0.406 T1 14 8 T2 7 3 T3 34 29 T4 16 31Lymph node ratio 0.043 0.355 0 25 13 > 0, ≤ 0.2 25 24 > 0.2, ≤ 0.4 15 18 > 0.4 6 16Lymphovascular invasion 0.610 No 43 40 Yes 28 31ASA status 0.805 1 + 2 61 62 3 + 4 10 9Postoperative complication 0.041 0.071 No 57 46 Yes 14 25Surgical approach 0.855 Endo/laparoscopic 49 50 Open 22 21
TA-NLR: Tumor-associated neutrophil-to-lymphocyte ratio.
Cao LL et al . Tumor-associated NLR in g-NENs
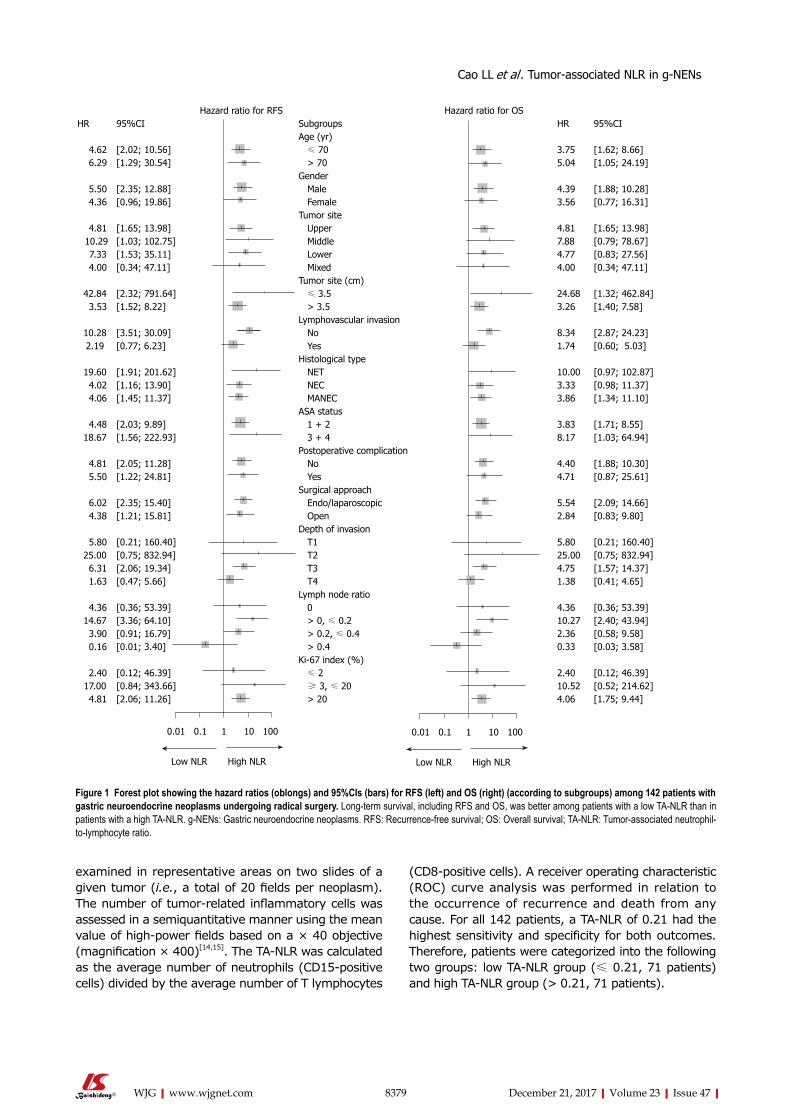
8379 December 21, 2017|Volume 23|Issue 47|WJG|www.wjgnet.com
(CD8-positive cells). A receiver operating characteristic (ROC) curve analysis was performed in relation to the occurrence of recurrence and death from any cause. For all 142 patients, a TA-NLR of 0.21 had the highest sensitivity and specificity for both outcomes. Therefore, patients were categorized into the following two groups: low TA-NLR group (≤ 0.21, 71 patients) and high TA-NLR group (> 0.21, 71 patients).
examined in representative areas on two slides of a given tumor (i.e., a total of 20 fields per neoplasm). The number of tumor-related inflammatory cells was assessed in a semiquantitative manner using the mean value of high-power fields based on a × 40 objective (magnification × 400)[14,15]. The TA-NLR was calculated as the average number of neutrophils (CD15-positive cells) divided by the average number of T lymphocytes
Hazard ratio for RFS Hazard ratio for OSHR 95%CI Subgroups HR 95%CI
Age (yr) 4.62 [2.02; 10.56] ≤ 70 3.75 [1.62; 8.66] 6.29 [1.29; 30.54] > 70 5.04 [1.05; 24.19]
Gender 5.50 [2.35; 12.88] Male 4.39 [1.88; 10.28] 4.36 [0.96; 19.86] Female 3.56 [0.77; 16.31]
Tumor site 4.81 [1.65; 13.98] Upper 4.81 [1.65; 13.98] 10.29 [1.03; 102.75] Middle 7.88 [0.79; 78.67] 7.33 [1.53; 35.11] Lower 4.77 [0.83; 27.56] 4.00 [0.34; 47.11] Mixed 4.00 [0.34; 47.11]
Tumor site (cm)42.84 [2.32; 791.64] ≤ 3.5 24.68 [1.32; 462.84] 3.53 [1.52; 8.22] > 3.5 3.26 [1.40; 7.58]
Lymphovascular invasion10.28 [3.51; 30.09] No 8.34 [2.87; 24.23]2.19 [0.77; 6.23] Yes 1.74 [0.60; 5.03]
Histological type19.60 [1.91; 201.62] NET 10.00 [0.97; 102.87] 4.02 [1.16; 13.90] NEC 3.33 [0.98; 11.37] 4.06 [1.45; 11.37] MANEC 3.86 [1.34; 11.10]
ASA status 4.48 [2.03; 9.89] 1 + 2 3.83 [1.71; 8.55]18.67 [1.56; 222.93] 3 + 4 8.17 [1.03; 64.94]
Postoperative complication 4.81 [2.05; 11.28] No 4.40 [1.88; 10.30] 5.50 [1.22; 24.81] Yes 4.71 [0.87; 25.61]
Surgical approach 6.02 [2.35; 15.40] Endo/laparoscopic 5.54 [2.09; 14.66] 4.38 [1.21; 15.81] Open 2.84 [0.83; 9.80]
Depth of invasion 5.80 [0.21; 160.40] T1 5.80 [0.21; 160.40]25.00 [0.75; 832.94] T2 25.00 [0.75; 832.94] 6.31 [2.06; 19.34] T3 4.75 [1.57; 14.37] 1.63 [0.47; 5.66] T4 1.38 [0.41; 4.65]
Lymph node ratio 4.36 [0.36; 53.39] 0 4.36 [0.36; 53.39]14.67 [3.36; 64.10] > 0, ≤ 0.2 10.27 [2.40; 43.94] 3.90 [0.91; 16.79] > 0.2, ≤ 0.4 2.36 [0.58; 9.58] 0.16 [0.01; 3.40] > 0.4 0.33 [0.03; 3.58]
Ki-67 index (%) 2.40 [0.12; 46.39] ≤ 2 2.40 [0.12; 46.39]17.00 [0.84; 343.66] ≥ 3, ≤ 20 10.52 [0.52; 214.62] 4.81 [2.06; 11.26] > 20 4.06 [1.75; 9.44]
0.01 0.1 1 10 100
Low NLR High NLR
0.01 0.1 1 10 100
Low NLR High NLR
Figure 1 Forest plot showing the hazard ratios (oblongs) and 95%CIs (bars) for RFS (left) and OS (right) (according to subgroups) among 142 patients with gastric neuroendocrine neoplasms undergoing radical surgery. Long-term survival, including RFS and OS, was better among patients with a low TA-NLR than in patients with a high TA-NLR. g-NENs: Gastric neuroendocrine neoplasms. RFS: Recurrence-free survival; OS: Overall survival; TA-NLR: Tumor-associated neutrophil-to-lymphocyte ratio.
Cao LL et al . Tumor-associated NLR in g-NENs
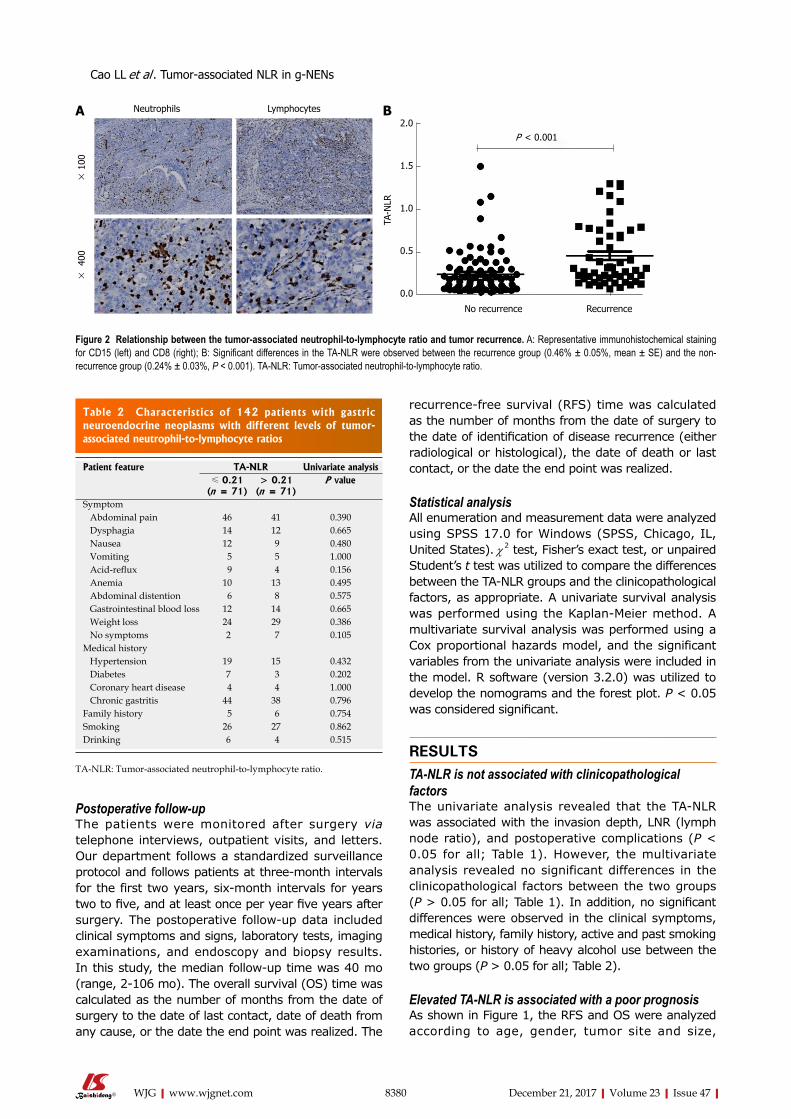
8380 December 21, 2017|Volume 23|Issue 47|WJG|www.wjgnet.com
Postoperative follow-upThe patients were monitored after surgery via telephone interviews, outpatient visits, and letters. Our department follows a standardized surveillance protocol and follows patients at three-month intervals for the first two years, six-month intervals for years two to five, and at least once per year five years after surgery. The postoperative follow-up data included clinical symptoms and signs, laboratory tests, imaging examinations, and endoscopy and biopsy results. In this study, the median follow-up time was 40 mo (range, 2-106 mo). The overall survival (OS) time was calculated as the number of months from the date of surgery to the date of last contact, date of death from any cause, or the date the end point was realized. The
recurrence-free survival (RFS) time was calculated as the number of months from the date of surgery to the date of identification of disease recurrence (either radiological or histological), the date of death or last contact, or the date the end point was realized.
Statistical analysisAll enumeration and measurement data were analyzed using SPSS 17.0 for Windows (SPSS, Chicago, IL, United States). χ 2 test, Fisher’s exact test, or unpaired Student’s t test was utilized to compare the differences between the TA-NLR groups and the clinicopathological factors, as appropriate. A univariate survival analysis was performed using the Kaplan-Meier method. A multivariate survival analysis was performed using a Cox proportional hazards model, and the significant variables from the univariate analysis were included in the model. R software (version 3.2.0) was utilized to develop the nomograms and the forest plot. P < 0.05 was considered significant.
RESULTSTA-NLR is not associated with clinicopathological factorsThe univariate analysis revealed that the TA-NLR was associated with the invasion depth, LNR (lymph node ratio), and postoperative complications (P < 0.05 for all; Table 1). However, the multivariate analysis revealed no significant differences in the clinicopathological factors between the two groups (P > 0.05 for all; Table 1). In addition, no significant differences were observed in the clinical symptoms, medical history, family history, active and past smoking histories, or history of heavy alcohol use between the two groups (P > 0.05 for all; Table 2).
Elevated TA-NLR is associated with a poor prognosisAs shown in Figure 1, the RFS and OS were analyzed according to age, gender, tumor site and size,
Neutrophils Lymphocytes
× 40
0 ×
100
A
Figure 2 Relationship between the tumor-associated neutrophil-to-lymphocyte ratio and tumor recurrence. A: Representative immunohistochemical staining for CD15 (left) and CD8 (right); B: Significant differences in the TA-NLR were observed between the recurrence group (0.46% ± 0.05%, mean ± SE) and the non-recurrence group (0.24% ± 0.03%, P < 0.001). TA-NLR: Tumor-associated neutrophil-to-lymphocyte ratio.
Table 2 Characteristics of 142 patients with gastric neuroendocrine neoplasms with different levels of tumor-associated neutrophil-to-lymphocyte ratios
Patient feature TA-NLR Univariate analysis≤ 0.21
(n = 71)> 0.21
(n = 71)P value
Symptom Abdominal pain 46 41 0.390 Dysphagia 14 12 0.665 Nausea 12 9 0.480 Vomiting 5 5 1.000 Acid-reflux 9 4 0.156 Anemia 10 13 0.495 Abdominal distention 6 8 0.575 Gastrointestinal blood loss 12 14 0.665 Weight loss 24 29 0.386 No symptoms 2 7 0.105Medical history Hypertension 19 15 0.432 Diabetes 7 3 0.202 Coronary heart disease 4 4 1.000 Chronic gastritis 44 38 0.796Family history 5 6 0.754Smoking 26 27 0.862Drinking 6 4 0.515
TA-NLR: Tumor-associated neutrophil-to-lymphocyte ratio.
2.0
1.5
1.0
0.5
0.0
P < 0.001
TA-N
LR
No recurrence Recurrence
B
Cao LL et al . Tumor-associated NLR in g-NENs
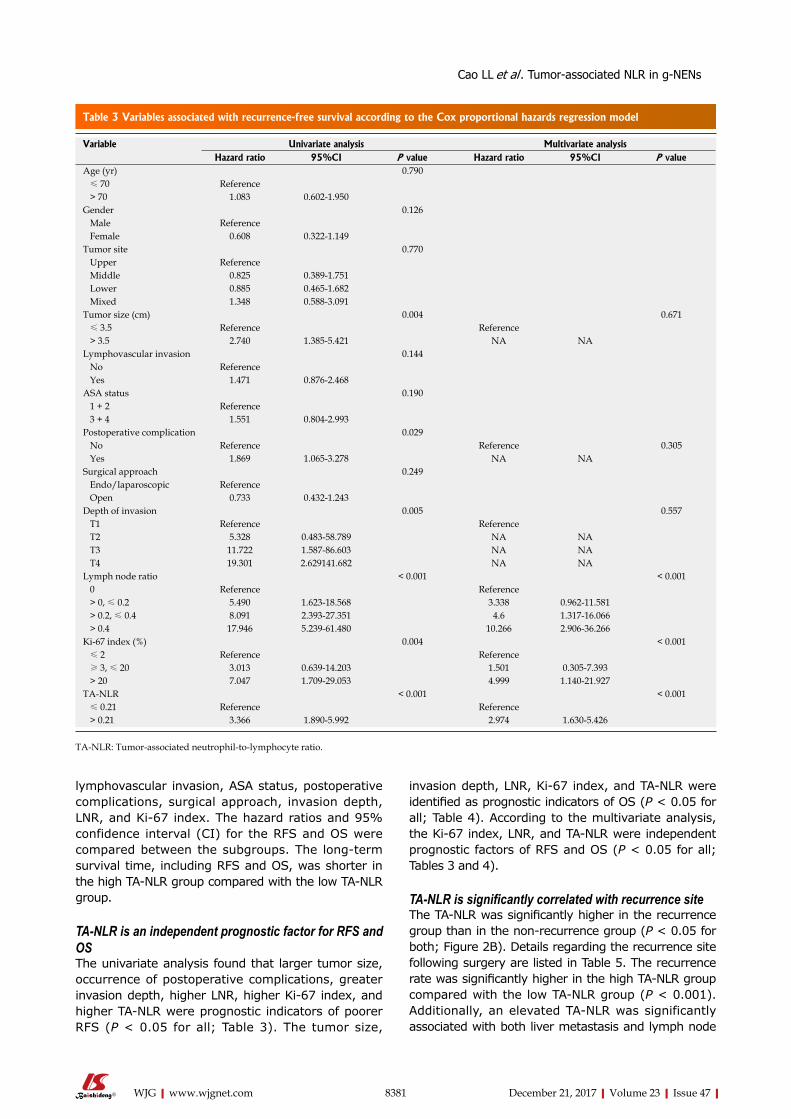
8381 December 21, 2017|Volume 23|Issue 47|WJG|www.wjgnet.com
lymphovascular invasion, ASA status, postoperative complications, surgical approach, invasion depth, LNR, and Ki-67 index. The hazard ratios and 95% confidence interval (CI) for the RFS and OS were compared between the subgroups. The long-term survival time, including RFS and OS, was shorter in the high TA-NLR group compared with the low TA-NLR group.
TA-NLR is an independent prognostic factor for RFS and OSThe univariate analysis found that larger tumor size, occurrence of postoperative complications, greater invasion depth, higher LNR, higher Ki-67 index, and higher TA-NLR were prognostic indicators of poorer RFS (P < 0.05 for all; Table 3). The tumor size,
invasion depth, LNR, Ki-67 index, and TA-NLR were identified as prognostic indicators of OS (P < 0.05 for all; Table 4). According to the multivariate analysis, the Ki-67 index, LNR, and TA-NLR were independent prognostic factors of RFS and OS (P < 0.05 for all; Tables 3 and 4).
TA-NLR is significantly correlated with recurrence siteThe TA-NLR was significantly higher in the recurrence group than in the non-recurrence group (P < 0.05 for both; Figure 2B). Details regarding the recurrence site following surgery are listed in Table 5. The recurrence rate was significantly higher in the high TA-NLR group compared with the low TA-NLR group (P < 0.001). Additionally, an elevated TA-NLR was significantly associated with both liver metastasis and lymph node
Table 3 Variables associated with recurrence-free survival according to the Cox proportional hazards regression model
Variable Univariate analysis Multivariate analysisHazard ratio 95%CI P value Hazard ratio 95%CI P value
Age (yr) 0.790 ≤ 70 Reference > 70 1.083 0.602-1.950Gender 0.126 Male Reference Female 0.608 0.322-1.149Tumor site 0.770 Upper Reference Middle 0.825 0.389-1.751 Lower 0.885 0.465-1.682 Mixed 1.348 0.588-3.091Tumor size (cm) 0.004 0.671 ≤ 3.5 Reference Reference > 3.5 2.740 1.385-5.421 NA NALymphovascular invasion 0.144 No Reference Yes 1.471 0.876-2.468ASA status 0.190 1 + 2 Reference 3 + 4 1.551 0.804-2.993Postoperative complication 0.029 No Reference Reference 0.305 Yes 1.869 1.065-3.278 NA NASurgical approach 0.249 Endo/laparoscopic Reference Open 0.733 0.432-1.243Depth of invasion 0.005 0.557 T1 Reference Reference T2 5.328 0.483-58.789 NA NA T3 11.722 1.587-86.603 NA NA T4 19.301 2.629141.682 NA NALymph node ratio < 0.001 < 0.001 0 Reference Reference > 0, ≤ 0.2 5.490 1.623-18.568 3.338 0.962-11.581 > 0.2, ≤ 0.4 8.091 2.393-27.351 4.6 1.317-16.066 > 0.4 17.946 5.239-61.480 10.266 2.906-36.266Ki-67 index (%) 0.004 < 0.001 ≤ 2 Reference Reference ≥ 3, ≤ 20 3.013 0.639-14.203 1.501 0.305-7.393 > 20 7.047 1.709-29.053 4.999 1.140-21.927TA-NLR < 0.001 < 0.001 ≤ 0.21 Reference Reference > 0.21 3.366 1.890-5.992 2.974 1.630-5.426
TA-NLR: Tumor-associated neutrophil-to-lymphocyte ratio.
Cao LL et al . Tumor-associated NLR in g-NENs
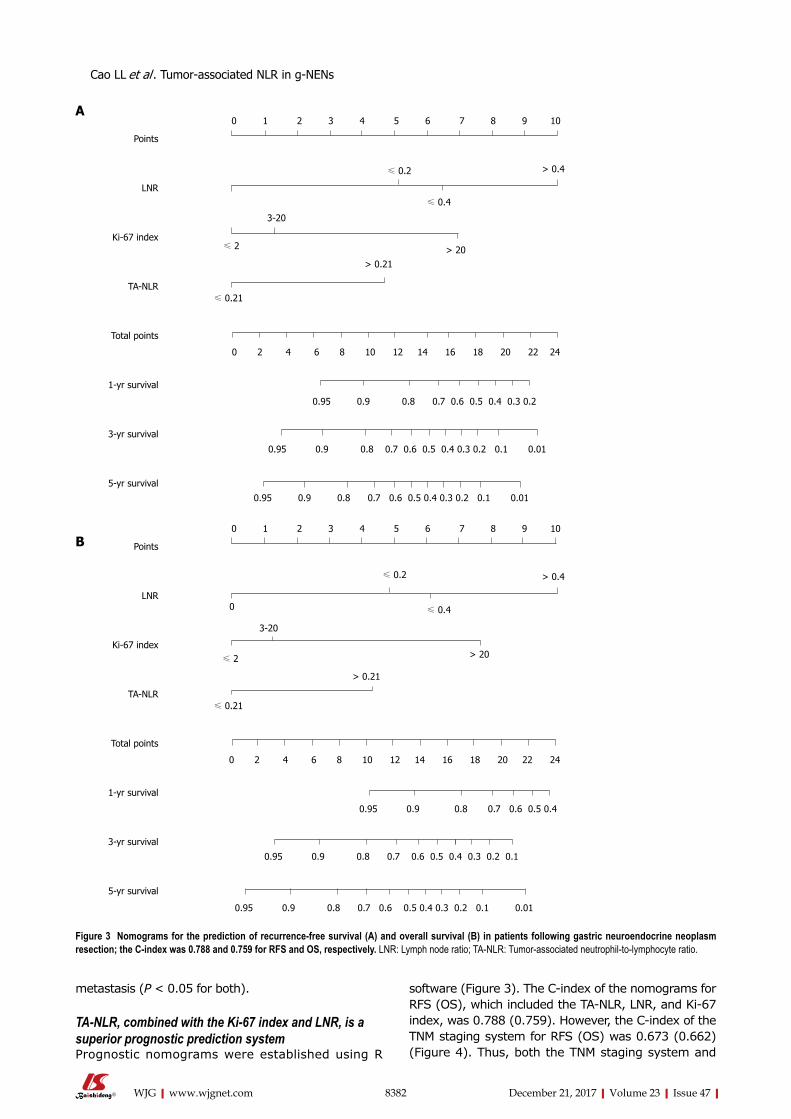
8382 December 21, 2017|Volume 23|Issue 47|WJG|www.wjgnet.com
metastasis (P < 0.05 for both).
TA-NLR, combined with the Ki-67 index and LNR, is a superior prognostic prediction systemPrognostic nomograms were established using R
software (Figure 3). The C-index of the nomograms for RFS (OS), which included the TA-NLR, LNR, and Ki-67 index, was 0.788 (0.759). However, the C-index of the TNM staging system for RFS (OS) was 0.673 (0.662) (Figure 4). Thus, both the TNM staging system and
Figure 3 Nomograms for the prediction of recurrence-free survival (A) and overall survival (B) in patients following gastric neuroendocrine neoplasm resection; the C-index was 0.788 and 0.759 for RFS and OS, respectively. LNR: Lymph node ratio; TA-NLR: Tumor-associated neutrophil-to-lymphocyte ratio.
Cao LL et al . Tumor-associated NLR in g-NENs
Points
LNR
Ki-67 index
TA-NLR
Total points
1-yr survival
3-yr survival
5-yr survival
0 1 2 3 4 5 6 7 8 9 10
≤ 0.2 > 0.4
≤ 0.4
≤ 2 > 20> 0.21
≤ 0.21
0 2 4 6 8 10 12 14 16 18 20 22 24
0.95 0.9 0.8 0.7 0.6 0.5 0.4 0.3 0.2
0.95 0.9 0.8 0.7 0.6 0.5 0.4 0.3 0.2 0.1 0.01
0.95 0.9 0.8 0.7 0.6 0.5 0.4 0.3 0.2 0.1 0.01
A
3-20
≤ 0.4
Points
LNR
Ki-67 index
TA-NLR
Total points
1-yr survival
3-yr survival
5-yr survival
0 1 2 3 4 5 6 7 8 9 10
≤ 0.2 > 0.4
≤ 2 > 20
> 0.21
≤ 0.21
0 2 4 6 8 10 12 14 16 18 20 22 24
0.95 0.9 0.8 0.7 0.6 0.5 0.4
0
3-20
0.95 0.9 0.8 0.7 0.6 0.5 0.4 0.3 0.2 0.1
0.95 0.9 0.8 0.7 0.6 0.5 0.4 0.3 0.2 0.1 0.01
B
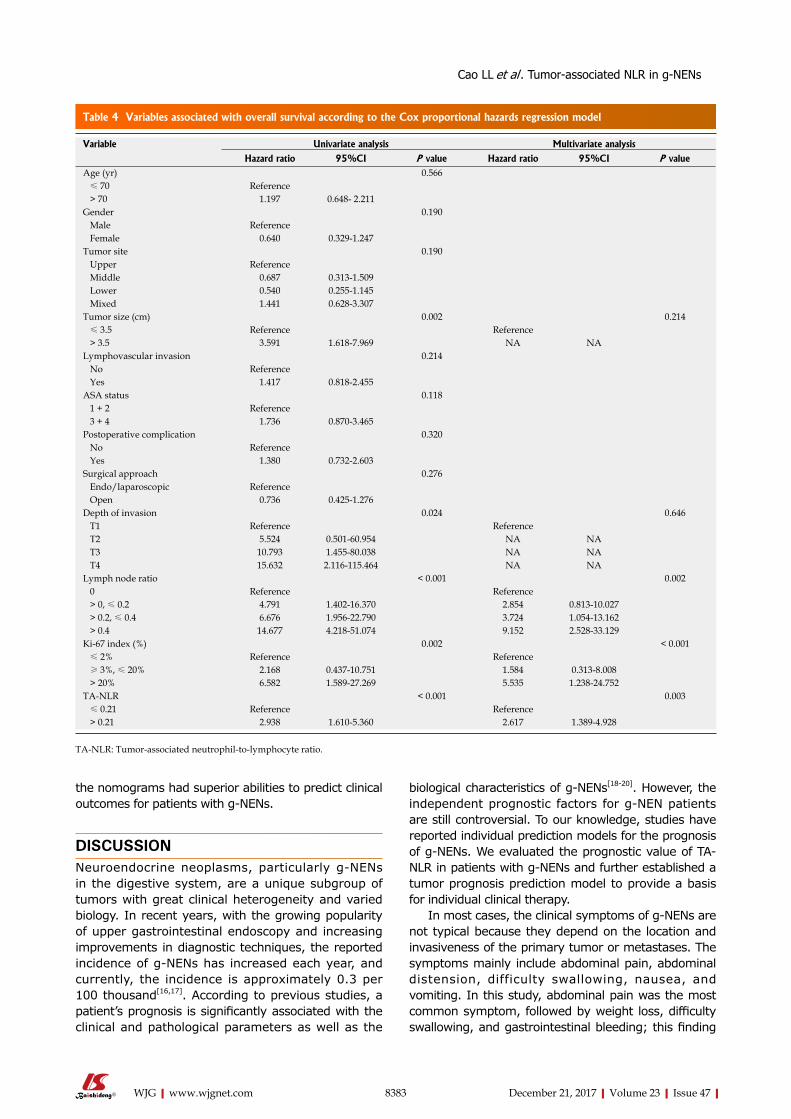
8383 December 21, 2017|Volume 23|Issue 47|WJG|www.wjgnet.com
the nomograms had superior abilities to predict clinical outcomes for patients with g-NENs.
DISCUSSION Neuroendocrine neoplasms, particularly g-NENs in the digestive system, are a unique subgroup of tumors with great clinical heterogeneity and varied biology. In recent years, with the growing popularity of upper gastrointestinal endoscopy and increasing improvements in diagnostic techniques, the reported incidence of g-NENs has increased each year, and currently, the incidence is approximately 0.3 per 100 thousand[16,17]. According to previous studies, a patient’s prognosis is significantly associated with the clinical and pathological parameters as well as the
biological characteristics of g-NENs[18-20]. However, the independent prognostic factors for g-NEN patients are still controversial. To our knowledge, studies have reported individual prediction models for the prognosis of g-NENs. We evaluated the prognostic value of TA-NLR in patients with g-NENs and further established a tumor prognosis prediction model to provide a basis for individual clinical therapy.
In most cases, the clinical symptoms of g-NENs are not typical because they depend on the location and invasiveness of the primary tumor or metastases. The symptoms mainly include abdominal pain, abdominal distension, difficulty swallowing, nausea, and vomiting. In this study, abdominal pain was the most common symptom, followed by weight loss, difficulty swallowing, and gastrointestinal bleeding; this finding
Table 4 Variables associated with overall survival according to the Cox proportional hazards regression model
Variable Univariate analysis Multivariate analysis
Hazard ratio 95%CI P value Hazard ratio 95%CI P valueAge (yr) 0.566 ≤ 70 Reference > 70 1.197 0.648- 2.211Gender 0.190 Male Reference Female 0.640 0.329-1.247Tumor site 0.190 Upper Reference Middle 0.687 0.313-1.509 Lower 0.540 0.255-1.145 Mixed 1.441 0.628-3.307Tumor size (cm) 0.002 0.214 ≤ 3.5 Reference Reference > 3.5 3.591 1.618-7.969 NA NALymphovascular invasion 0.214 No Reference Yes 1.417 0.818-2.455ASA status 0.118 1 + 2 Reference 3 + 4 1.736 0.870-3.465Postoperative complication 0.320 No Reference Yes 1.380 0.732-2.603Surgical approach 0.276 Endo/laparoscopic Reference Open 0.736 0.425-1.276Depth of invasion 0.024 0.646 T1 Reference Reference T2 5.524 0.501-60.954 NA NA T3 10.793 1.455-80.038 NA NA T4 15.632 2.116-115.464 NA NALymph node ratio < 0.001 0.002 0 Reference Reference > 0, ≤ 0.2 4.791 1.402-16.370 2.854 0.813-10.027 > 0.2, ≤ 0.4 6.676 1.956-22.790 3.724 1.054-13.162 > 0.4 14.677 4.218-51.074 9.152 2.528-33.129Ki-67 index (%) 0.002 < 0.001 ≤ 2% Reference Reference ≥ 3%, ≤ 20% 2.168 0.437-10.751 1.584 0.313-8.008 > 20% 6.582 1.589-27.269 5.535 1.238-24.752TA-NLR < 0.001 0.003 ≤ 0.21 Reference Reference > 0.21 2.938 1.610-5.360 2.617 1.389-4.928
TA-NLR: Tumor-associated neutrophil-to-lymphocyte ratio.
Cao LL et al . Tumor-associated NLR in g-NENs
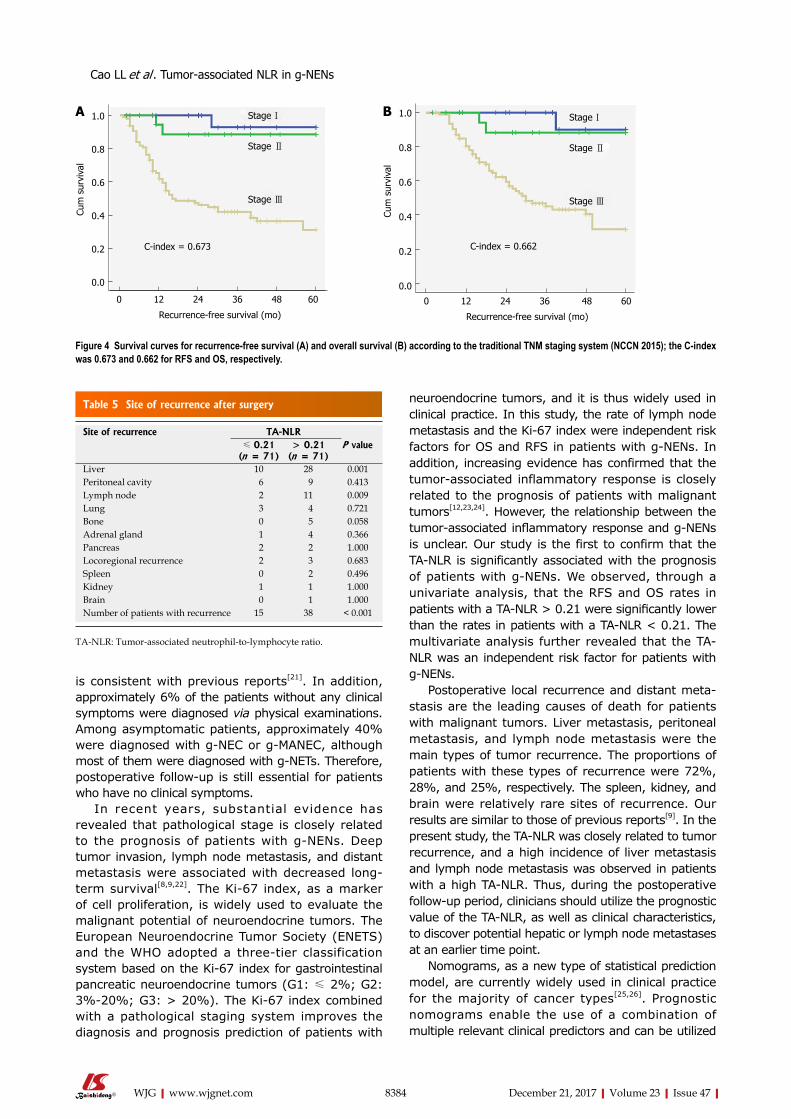
8384 December 21, 2017|Volume 23|Issue 47|WJG|www.wjgnet.com
is consistent with previous reports[21]. In addition, approximately 6% of the patients without any clinical symptoms were diagnosed via physical examinations. Among asymptomatic patients, approximately 40% were diagnosed with g-NEC or g-MANEC, although most of them were diagnosed with g-NETs. Therefore, postoperative follow-up is still essential for patients who have no clinical symptoms.
In recent years, substantial evidence has revealed that pathological stage is closely related to the prognosis of patients with g-NENs. Deep tumor invasion, lymph node metastasis, and distant metastasis were associated with decreased long-term survival[8,9,22]. The Ki-67 index, as a marker of cell proliferation, is widely used to evaluate the malignant potential of neuroendocrine tumors. The European Neuroendocrine Tumor Society (ENETS) and the WHO adopted a three-tier classification system based on the Ki-67 index for gastrointestinal pancreatic neuroendocrine tumors (G1: ≤ 2%; G2: 3%-20%; G3: > 20%). The Ki-67 index combined with a pathological staging system improves the diagnosis and prognosis prediction of patients with
neuroendocrine tumors, and it is thus widely used in clinical practice. In this study, the rate of lymph node metastasis and the Ki-67 index were independent risk factors for OS and RFS in patients with g-NENs. In addition, increasing evidence has confirmed that the tumor-associated inflammatory response is closely related to the prognosis of patients with malignant tumors[12,23,24]. However, the relationship between the tumor-associated inflammatory response and g-NENs is unclear. Our study is the first to confirm that the TA-NLR is significantly associated with the prognosis of patients with g-NENs. We observed, through a univariate analysis, that the RFS and OS rates in patients with a TA-NLR > 0.21 were significantly lower than the rates in patients with a TA-NLR < 0.21. The multivariate analysis further revealed that the TA-NLR was an independent risk factor for patients with g-NENs.
Postoperative local recurrence and distant meta-stasis are the leading causes of death for patients with malignant tumors. Liver metastasis, peritoneal metastasis, and lymph node metastasis were the main types of tumor recurrence. The proportions of patients with these types of recurrence were 72%, 28%, and 25%, respectively. The spleen, kidney, and brain were relatively rare sites of recurrence. Our results are similar to those of previous reports[9]. In the present study, the TA-NLR was closely related to tumor recurrence, and a high incidence of liver metastasis and lymph node metastasis was observed in patients with a high TA-NLR. Thus, during the postoperative follow-up period, clinicians should utilize the prognostic value of the TA-NLR, as well as clinical characteristics, to discover potential hepatic or lymph node metastases at an earlier time point.
Nomograms, as a new type of statistical prediction model, are currently widely used in clinical practice for the majority of cancer types[25,26]. Prognostic nomograms enable the use of a combination of multiple relevant clinical predictors and can be utilized
1.0
0.8
0.6
0.4
0.2
0.0
Cum
sur
viva
l
0 12 24 36 48 60
Recurrence-free survival (mo)
Stage Ⅰ
Stage Ⅱ
Stage Ⅲ
C-index = 0.673
A 1.0
0.8
0.6
0.4
0.2
0.0
Cum
sur
viva
l
0 12 24 36 48 60
Recurrence-free survival (mo)
Stage Ⅰ
Stage Ⅱ
Stage Ⅲ
C-index = 0.662
B
Figure 4 Survival curves for recurrence-free survival (A) and overall survival (B) according to the traditional TNM staging system (NCCN 2015); the C-index was 0.673 and 0.662 for RFS and OS, respectively.
Table 5 Site of recurrence after surgery
Site of recurrence TA-NLR≤ 0.21
(n = 71)> 0.21
(n = 71)P value
Liver 10 28 0.001Peritoneal cavity 6 9 0.413Lymph node 2 11 0.009Lung 3 4 0.721Bone 0 5 0.058Adrenal gland 1 4 0.366Pancreas 2 2 1.000Locoregional recurrence 2 3 0.683Spleen 0 2 0.496Kidney 1 1 1.000Brain 0 1 1.000Number of patients with recurrence 15 38 < 0.001
TA-NLR: Tumor-associated neutrophil-to-lymphocyte ratio.
Cao LL et al . Tumor-associated NLR in g-NENs
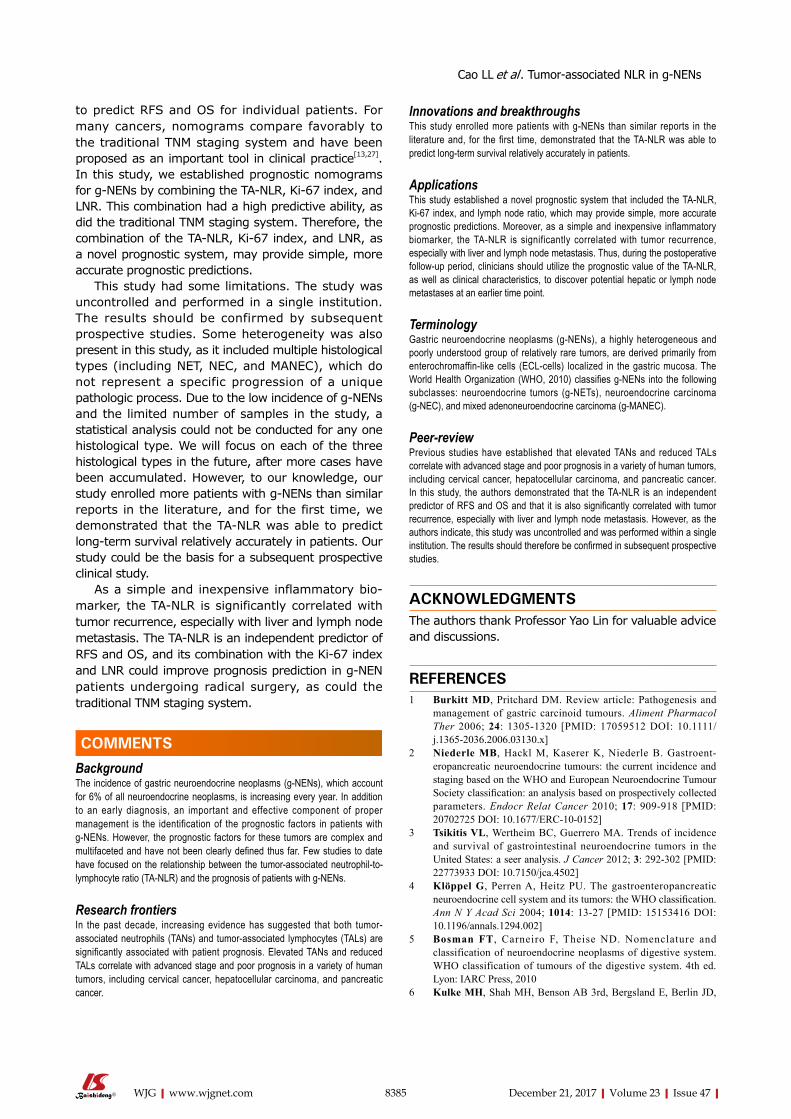
8385 December 21, 2017|Volume 23|Issue 47|WJG|www.wjgnet.com
to predict RFS and OS for individual patients. For many cancers, nomograms compare favorably to the traditional TNM staging system and have been proposed as an important tool in clinical practice[13,27]. In this study, we established prognostic nomograms for g-NENs by combining the TA-NLR, Ki-67 index, and LNR. This combination had a high predictive ability, as did the traditional TNM staging system. Therefore, the combination of the TA-NLR, Ki-67 index, and LNR, as a novel prognostic system, may provide simple, more accurate prognostic predictions.
This study had some limitations. The study was uncontrolled and performed in a single institution. The results should be confirmed by subsequent prospective studies. Some heterogeneity was also present in this study, as it included multiple histological types (including NET, NEC, and MANEC), which do not represent a specific progression of a unique pathologic process. Due to the low incidence of g-NENs and the limited number of samples in the study, a statistical analysis could not be conducted for any one histological type. We will focus on each of the three histological types in the future, after more cases have been accumulated. However, to our knowledge, our study enrolled more patients with g-NENs than similar reports in the literature, and for the first time, we demonstrated that the TA-NLR was able to predict long-term survival relatively accurately in patients. Our study could be the basis for a subsequent prospective clinical study.
As a simple and inexpensive inflammatory bio-marker, the TA-NLR is significantly correlated with tumor recurrence, especially with liver and lymph node metastasis. The TA-NLR is an independent predictor of RFS and OS, and its combination with the Ki-67 index and LNR could improve prognosis prediction in g-NEN patients undergoing radical surgery, as could the traditional TNM staging system.
COMMENTSBackgroundThe incidence of gastric neuroendocrine neoplasms (g-NENs), which account for 6% of all neuroendocrine neoplasms, is increasing every year. In addition to an early diagnosis, an important and effective component of proper management is the identification of the prognostic factors in patients with g-NENs. However, the prognostic factors for these tumors are complex and multifaceted and have not been clearly defined thus far. Few studies to date have focused on the relationship between the tumor-associated neutrophil-to-lymphocyte ratio (TA-NLR) and the prognosis of patients with g-NENs.
Research frontiersIn the past decade, increasing evidence has suggested that both tumor-associated neutrophils (TANs) and tumor-associated lymphocytes (TALs) are significantly associated with patient prognosis. Elevated TANs and reduced TALs correlate with advanced stage and poor prognosis in a variety of human tumors, including cervical cancer, hepatocellular carcinoma, and pancreatic cancer.
Innovations and breakthroughsThis study enrolled more patients with g-NENs than similar reports in the literature and, for the first time, demonstrated that the TA-NLR was able to predict long-term survival relatively accurately in patients.
Applications This study established a novel prognostic system that included the TA-NLR, Ki-67 index, and lymph node ratio, which may provide simple, more accurate prognostic predictions. Moreover, as a simple and inexpensive inflammatory biomarker, the TA-NLR is significantly correlated with tumor recurrence, especially with liver and lymph node metastasis. Thus, during the postoperative follow-up period, clinicians should utilize the prognostic value of the TA-NLR, as well as clinical characteristics, to discover potential hepatic or lymph node metastases at an earlier time point.
TerminologyGastric neuroendocrine neoplasms (g-NENs), a highly heterogeneous and poorly understood group of relatively rare tumors, are derived primarily from enterochromaffin-like cells (ECL-cells) localized in the gastric mucosa. The World Health Organization (WHO, 2010) classifies g-NENs into the following subclasses: neuroendocrine tumors (g-NETs), neuroendocrine carcinoma (g-NEC), and mixed adenoneuroendocrine carcinoma (g-MANEC).
Peer-reviewPrevious studies have established that elevated TANs and reduced TALs correlate with advanced stage and poor prognosis in a variety of human tumors, including cervical cancer, hepatocellular carcinoma, and pancreatic cancer. In this study, the authors demonstrated that the TA-NLR is an independent predictor of RFS and OS and that it is also significantly correlated with tumor recurrence, especially with liver and lymph node metastasis. However, as the authors indicate, this study was uncontrolled and was performed within a single institution. The results should therefore be confirmed in subsequent prospective studies.
ACKNOWLEDGMENTSThe authors thank Professor Yao Lin for valuable advice and discussions.
REFERENCES1 Burkitt MD, Pritchard DM. Review article: Pathogenesis and
management of gastric carcinoid tumours. Aliment Pharmacol Ther 2006; 24: 1305-1320 [PMID: 17059512 DOI: 10.1111/j.1365-2036.2006.03130.x]
2 Niederle MB, Hackl M, Kaserer K, Niederle B. Gastroent-eropancreatic neuroendocrine tumours: the current incidence and staging based on the WHO and European Neuroendocrine Tumour Society classification: an analysis based on prospectively collected parameters. Endocr Relat Cancer 2010; 17: 909-918 [PMID: 20702725 DOI: 10.1677/ERC-10-0152]
3 Tsikitis VL, Wertheim BC, Guerrero MA. Trends of incidence and survival of gastrointestinal neuroendocrine tumors in the United States: a seer analysis. J Cancer 2012; 3: 292-302 [PMID: 22773933 DOI: 10.7150/jca.4502]
4 Klöppel G, Perren A, Heitz PU. The gastroenteropancreatic neuroendocrine cell system and its tumors: the WHO classification. Ann N Y Acad Sci 2004; 1014: 13-27 [PMID: 15153416 DOI: 10.1196/annals.1294.002]
5 Bosman FT, Carneiro F, Theise ND. Nomenclature and classification of neuroendocrine neoplasms of digestive system. WHO classification of tumours of the digestive system. 4th ed. Lyon: IARC Press, 2010
6 Kulke MH, Shah MH, Benson AB 3rd, Bergsland E, Berlin JD,
COMMENTS
Cao LL et al . Tumor-associated NLR in g-NENs
8386 December 21, 2017|Volume 23|Issue 47|WJG|www.wjgnet.com
Blaszkowsky LS, Emerson L, Engstrom PF, Fanta P, Giordano T, Goldner WS, Halfdanarson TR, Heslin MJ, Kandeel F, Kunz PL, Kuvshinoff BW 2nd, Lieu C, Moley JF, Munene G, Pillarisetty VG, Saltz L, Sosa JA, Strosberg JR, Vauthey JN, Wolfgang C, Yao JC, Burns J, Freedman-Cass D; National comprehensive cancer network. Neuroendocrine tumors, version 1.2015. J Natl Compr Canc Netw 2015; 13: 78-108 [PMID: 25583772 DOI: 10.6004/jnccn.2015.0011]
7 Klöppel G, Couvelard A, Perren A, Komminoth P, McNicol AM, Nilsson O, Scarpa A, Scoazec JY, Wiedenmann B, Papotti M, Rindi G, Plöckinger U; Mallorca Consensus Conference participants; European Neuroendocrine Tumor Society. ENETS Consensus Guidelines for the Standards of Care in Neuroendocrine Tumors: towards a standardized approach to the diagnosis of gastroenteropancreatic neuroendocrine tumors and their prognostic stratification. Neuroendocrinology 2009; 90: 162-166 [PMID: 19060454 DOI: 10.1159/000182196]
8 Faggiano A, Ferolla P, Grimaldi F, Campana D, Manzoni M, Davì MV, Bianchi A, Valcavi R, Papini E, Giuffrida D, Ferone D, Fanciulli G, Arnaldi G, Franchi GM, Francia G, Fasola G, Crinò L, Pontecorvi A, Tomassetti P, Colao A. Natural history of gastro-entero-pancreatic and thoracic neuroendocrine tumors. Data from a large prospective and retrospective Italian epidemiological study: the NET management study. J Endocrinol Invest 2012; 35: 817-823 [PMID: 22080849 DOI: 10.3275/8102]
9 Lewkowicz E, Trofimiuk-Müldner M, Wysocka K, Pach D, Kiełtyka A, Stefańska A, Sowa-Staszczak A, Tomaszewska R, Hubalewska-Dydejczyk A. Gastroenteropancreatic neuroendocrine neoplasms: a 10-year experience of a single center. Pol Arch Med Wewn 2015; 125: 337-346 [PMID: 25924181 DOI: 10.20452/pamw.2832]
10 Carus A, Ladekarl M, Hager H, Nedergaard BS, Donskov F. Tumour-associated CD66b+ neutrophil count is an independent prognostic factor for recurrence in localised cervical cancer. Br J Cancer 2013; 108: 2116-2122 [PMID: 23591202 DOI: 10.1038/bjc.2013.167]
11 Li YW, Qiu SJ, Fan J, Zhou J, Gao Q, Xiao YS, Xu YF. Intratumoral neutrophils: a poor prognostic factor for hepatocellular carcinoma following resection. J Hepatol 2011; 54: 497-505 [PMID: 21112656 DOI: 10.1016/j.jhep.2010.07.044]
12 Sadot E, Basturk O, Klimstra DS, Gönen M, Lokshin A, Do RK, D’Angelica MI, DeMatteo RP, Kingham TP, Jarnagin WR, Allen PJ. Tumor-associated Neutrophils and Malignant Progression in Intraductal Papillary Mucinous Neoplasms: An Opportunity for Identification of High-risk Disease. Ann Surg 2015; 262: 1102-1107 [PMID: 25563865 DOI: 10.1097/SLA.0000000000001044]
13 Anthony LB, Strosberg JR, Klimstra DS, Maples WJ, O’Dorisio TM, Warner RR, Wiseman GA, Benson AB 3rd, Pommier RF; North American Neuroendocrine Tumor Society (NANETS). The NANETS consensus guidelines for the diagnosis and management of gastrointestinal neuroendocrine tumors (nets): well-differentiated nets of the distal colon and rectum. Pancreas 2010; 39: 767-774 [PMID: 20664474 DOI: 10.1097/MPA.0b013e3181ec1261]
14 Caruso RA, Bellocco R, Pagano M, Bertoli G, Rigoli L, Inferrera C. Prognostic value of intratumoral neutrophils in advanced gastric carcinoma in a high-risk area in northern Italy. Mod Pathol 2002; 15: 831-837 [PMID: 12181268 DOI: 10.1097/01.MP.0000020391.98998.6B]
15 Reid MD, Basturk O, Thirabanjasak D, Hruban RH, Klimstra DS, Bagci P, Altinel D, Adsay V. Tumor-infiltrating neutrophils in
pancreatic neoplasia. Mod Pathol 2011; 24: 1612-1619 [PMID: 21822201 DOI: 10.1038/modpathol.2011.113]
16 Modlin IM, Lye KD, Kidd M. A 5-decade analysis of 13,715 carcinoid tumors. Cancer 2003; 97: 934-959 [PMID: 12569593 DOI: 10.1002/cncr.11105]
17 Yao JC, Hassan M, Phan A, Dagohoy C, Leary C, Mares JE, Abdalla EK, Fleming JB, Vauthey JN, Rashid A, Evans DB. One hundred years after “carcinoid”: epidemiology of and prognostic factors for neuroendocrine tumors in 35,825 cases in the United States. J Clin Oncol 2008; 26: 3063-3072 [PMID: 18565894 DOI: 10.1200/JCO.2007.15.4377]
18 Hu HK, Ke NW, Li A, Du XJ, Guo Q, Hu WM. Clinical characteristics and prognostic factors of gastroenteropancreatic neuroendocrine tumors: a single center experience in China. Hepatogastroenterology 2015; 62: 178-183 [PMID: 25911892]
19 Ezziddin S, Attassi M, Yong-Hing CJ, Ahmadzadehfar H, Willinek W, Grünwald F, Guhlke S, Biersack HJ, Sabet A. Predictors of long-term outcome in patients with well-differentiated gastroenteropancreatic neuroendocrine tumors after peptide receptor radionuclide therapy with 177Lu-octreotate. J Nucl Med 2014; 55: 183-190 [PMID: 24434296 DOI: 10.2967/jnumed.113.125336]
20 Xu X, Li J, Han X, Shi C, Jin D, Lou W. Clinical characteristics and prognostic factors of patients with gastric neuroendocrine carcinoma treated with radical surgery. Chin Med J (Engl) 2014; 127: 2419-2422 [PMID: 24985576]
21 Shebani KO, Souba WW, Finkelstein DM, Stark PC, Elgadi KM, Tanabe KK, Ott MJ. Prognosis and survival in patients with gastrointestinal tract carcinoid tumors. Ann Surg 1999; 229: 815-821; discussion 822-823 [PMID: 10363895 DOI: 10.1097/00000658-199906000-00008]
22 Kubota T, Ohyama S, Hiki N, Nunobe S, Yamamoto N, Yamaguchi T. Endocrine carcinoma of the stomach: clinicopathological analysis of 27 surgically treated cases in a single institute. Gastric Cancer 2012; 15: 323-330 [PMID: 22252152 DOI: 10.1007/s10120-011-0122-5]
23 Zhang Y, Ren H, Wang L, Ning Z, Zhuang Y, Gan J, Chen S, Zhou D, Zhu H, Tan D, Zhang H. Clinical impact of tumor-infiltrating inflammatory cells in primary small cell esophageal carcinoma. Int J Mol Sci 2014; 15: 9718-9734 [PMID: 24886814 DOI: 10.3390/ijms15069718]
24 Zhao JJ, Pan K, Wang W, Chen JG, Wu YH, Lv L, Li JJ, Chen YB, Wang DD, Pan QZ, Li XD, Xia JC. The prognostic value of tumor-infiltrating neutrophils in gastric adenocarcinoma after resection. PLoS One 2012; 7: e33655 [PMID: 22442706 DOI: 10.1371/journal.pone.0033655]
25 Liang W, Zhang L, Jiang G, Wang Q, Liu L, Liu D, Wang Z, Zhu Z, Deng Q, Xiong X, Shao W, Shi X, He J. Development and validation of a nomogram for predicting survival in patients with resected non-small-cell lung cancer. J Clin Oncol 2015; 33: 861-869 [PMID: 25624438 DOI: 10.1200/JCO.2014.56.6661]
26 Sternberg CN. Are nomograms better than currently available stage groupings for bladder cancer? J Clin Oncol 2006; 24: 3819-3820 [PMID: 16864852 DOI: 10.1200/JCO.2006.07.1290]
27 Wang Y, Li J, Xia Y, Gong R, Wang K, Yan Z, Wan X, Liu G, Wu D, Shi L, Lau W, Wu M, Shen F. Prognostic nomogram for intrahepatic cholangiocarcinoma after partial hepatectomy. J Clin Oncol 2013; 31: 1188-1195 [PMID: 23358969 DOI: 10.1200/JCO.2012.41.5984]
P- Reviewer: Harmanci O S- Editor: Ma YJ L- Editor: Wang TQ E- Editor: Ma YJ
Cao LL et al . Tumor-associated NLR in g-NENs
Jun-Xi Xiang, Liang-Shuo Hu, Bo-Yan Tian, Qing Su, Yi-Chun Ji, Xu-Feng Zhang, Xue-Min Liu, Zheng Wu, Yi Lv, Department of Hepatobiliary Surgery, First Affiliated Hospital of Xi’an Jiaotong University, Xi’an 710061, Shaanxi Province, China
Jun-Xi Xiang, Liang-Shuo Hu, Peng Liu, Xu-Feng Zhang, Xue-Min Liu, Yi Lv, Regenerative Medicine and Surgery Engineering Research Center of Shaanxi Province, Xi’an 710061, Shaanxi Province, China
ORCID number: Jun-Xi Xiang (0000-0002-7772-3261); Liang-Shuo Hu (0000-0001-8288-592X); Peng Liu (0000-0002 -7951-9555); Bo-Yan Tian (0000-0002-8806-138X); Qing Su (0000-0003-0358-2221); Yi-Chun Ji (0000-0003-4192-8051); Xu-Feng Zhang (0000-0002-7908-1645); Xue-Min Liu (0000 -0002-4489-9439); Zheng Wu (0000-0002-7102-9543); Yi Lv (0000-0002-7104-2414).
Author contributions: Xiang JX analyzed the data and drafted the manuscript; Hu LS provided analytical oversight; Liu P and Tian BY offered the technical support; Su Q and Ji YC collected the data; Zhang XF and Liu XM revised the manuscript for important intellectual content; Wu Z provided administrative support; Lv Y designed and supervised the study; all authors have read and approved the final version to be published.
Supported by the National Natural Science Foundation of China, No. 81501608.
Institutional review board statement: The entire study was carried out in strict accordance with protocols approved by the Ethics Committee of the First Affiliated Hospital of Xi’an Jiaotong University (Permit Number: 2017-017).
Informed consent statement: This study received an informed consent waiver from our Institutional Review Board due to minimal risk to study subjects.
Conflict-of-interest statement: The authors have declared that no conflicts of interest exist.
Data sharing statement: No additional data available.
Open-Access: This article is an open-access article which was selected by an in-house editor and fully peer-reviewed by external reviewers. It is distributed in accordance with the Creative Commons Attribution Non Commercial (CC BY-NC 4.0) license, which permits others to distribute, remix, adapt, build upon this work non-commercially, and license their derivative works on different terms, provided the original work is properly cited and the use is non-commercial. See: http://creativecommons.org/licenses/by-nc/4.0/
Manuscript source: Unsolicited manuscript
Correspondence to: Yi Lv, MD, PhD, Professor, Department of Hepatobiliary Surgery, First Affiliated Hospital of Xi’an Jiaotong University, No. 277, West Yanta Road, Xi’an 710061, Shaanxi Province, China. [email protected]: +86-29-85323902 Fax: +86-29-85323904
Received: October 18, 2017Peer-review started: October 18, 2017First decision: November 8, 2017Revised: November 11, 2017Accepted: November 27, 2017 Article in press: November 27, 2017Published online: December 21, 2017
AbstractAIMTo investigate the impact of cigarette smoking on the recurrence rate and recurrence-free survival in patients with hyperlipidemic acute pancreatitis (HLAP).
METHODSA total of 863 patients were admitted to our hospital for acute pancreatitis (AP) from January 2013 to March
8387 December 21, 2017|Volume 23|Issue 47|WJG|www.wjgnet.com
ORIGINAL ARTICLE
Impact of cigarette smoking on recurrence of hyperlipidemic acute pancreatitis
Retrospective Study
Jun-Xi Xiang, Liang-Shuo Hu, Peng Liu, Bo-Yan Tian, Qing Su, Yi-Chun Ji, Xu-Feng Zhang, Xue-Min Liu, Zheng Wu, Yi Lv
Submit a Manuscript: http://www.f6publishing.com
DOI: 10.3748/wjg.v23.i47.8387
World J Gastroenterol 2017 December 21; 23(47): 8387-8394
ISSN 1007-9327 (print) ISSN 2219-2840 (online)
2016, of whom 88 diagnosed with HLAP were enrolled in this retrospective study. Demographic data, medical history, previous episodes of pancreatitis, consumption of alcohol and cigarettes, as well as biochemical and hematological data were carefully recorded for univariate and multivariate analyses. During follow-up, the information on current smoking status and recurrent AP was gathered. Recurrence-free survival (RFS) was calculated using the Kaplan-Meier method, and the differences between groups were compared using the log-rank test.
RESULTSNo significant differences were observed between the three groups in age or medical history of hyperlipidemia, fatty liver, diabetes mellitus, hypertension, or AP. The current smokers had a remarkably higher recurrence rate and a greater incidence of repeated episodes of AP (50.0% and 77.8%, respectively) than non-smokers (9.8% and 39.0%), and these two percentages were reduced to 9.1% and 36.4% for patients who gave up smoking. The median follow-up time was 13.5 mo and HLAP recurred after hospital discharge in 23 (26.1%) patients. Multivariate analysis identified current smoking (HR = 6.3, P = 0.020) as an independent risk factor contributing to HLAP recurrence. Current smokers had significantly worse RFS than non-smokers (23 mo vs 42 mo), but no significant difference was documented between ex-smokers (34 mo) and non-smokers. The RFS was not significantly different between light and heavy smokers.
CONCLUSIONSmoking is associated with worse RFS and an increased rate of HLAP recurrence. Continued smoking correlates with a compromised survival and smoking cessation should be recommended.
Key words: Acute pancreatitis; Hyperlipemia; Smoking; Recurrence; Epidemiology
© The Author(s) 2017. Published by Baishideng Publishing Group Inc. All rights reserved.
Core tip: This present study retrospectively enrolled hyperlipidemic acute pancreatitis (HLAP) patients in a large regional central hospital and revealed that cigarette smoking was associated with worse recurrence-free survival and an increased rate of HLAP recurrence. For smokers, continued smoking might be strongly correlated with HLAP recurrence and compromised survival. Therefore, smoking cessation should be strongly recommended.
Xiang JX, Hu LS, Liu P, Tian BY, Su Q, Ji YC, Zhang XF, Liu XM, Wu Z, Lv Y. Impact of cigarette smoking on recurrence of hyperlipidemic acute pancreatitis. World J Gastroenterol 2017; 23(47): 8387-8394 Available from: URL: http://www.wjgnet.
com/1007-9327/full/v23/i47/8387.htm DOI: http://dx.doi.org/10.3748/wjg.v23.i47.8387
INTRODUCTIONAcute pancreatitis (AP) is a potentially life-threatening acute inflammatory condition of the pancreas with high morbidity and mortality[1]. It is widely believed that the most common etiologies of AP are gallstone disease and alcohol abuse. Currently, 12%-20% of patients with AP have previous hypertriglyceridemia, which has become a well-recognized etiology[2-4]. Hyperlipidemic acute pancreatitis (HLAP) is a form of AP occurring in the presence of severe hypertriglyceridemia and in the absence of other causes[5]. Some researchers even report hypertriglyceridemia as the underlying cause in more than half of all gestational pancreatitis cases[6]. Numerous studies have suggested that compared with other types of pancreatitis, HLAP is associated with more complications, a longer course of disease, and a higher recurrence rate[7].
The exact pathophysiology of HLAP is not entirely certain. At present, it is believed that HLAP is related to injury in the pancreatic tissue (including acinar cells and pancreatic ducts) and microcirculation disturbance caused by free fatty acids (FFAs) that are produced by the pancreatic lipase, which catalyzes decomposition of triglycerides[5]. The resulting ischemia creates an acidic environment, which further triggers FFAs toxicity. In this way, inflammation can be initiated and amplified within the pancreas. Earlier studies found that cigarette smoking was independently associated with pancreatic cancer and chronic pancreatitis (CP) by leading to pancreatic calcification and abnormal secretion of the pancreatic ducts[8-10]. Notably, some recent studies identified that smoking was significantly associated with non-biliary AP instead of biliary AP[11,12], indicating different pathophysiological mechanisms for these subtypes. However, whether cigarette smoking has any long-term impact on HLAP recurrence has not yet been investigated. Because the nicotine in tobacco can cause lipid metabolism disturbance and oxidative stress and further increase blood viscosity and microcirculation dysfunction in the pancreas[13], it is reasonable to hypothesize that smoking may be associated with the high recurrence rate of HLAP.
This present study retrospectively enrolled HLAP patients treated at a large regional central hospital. The impact of cigarette smoking on recurrence rate and recurrence-free survival (RFS) in HLAP patients was investigated.
MATERIALS AND METHODSPatients and diagnosisA total of 863 patients were admitted to our hospital
8388 December 21, 2017|Volume 23|Issue 47|WJG|www.wjgnet.com
Xiang JX et al . Cigarette smoking causes HLAP recurrence
for AP from January 2013 to March 2016, of whom 90 were hospitalized at least twice. Among these patients, those with biliary pancreatitis, alcoholic pancreatitis, and other causes were excluded from the study. The remaining 88 patients identified with HLAP were enrolled. The diagnosis of HLAP was made if patients had AP in the presence of serum total triglyceride (TG) > 11.3 mmol/L (1000 mg/dL), or had a serum TG level of 5.65 to 11.3 mmol/L accompanied by chylous serum after excluding other known risk factors for AP. The diagnosis of AP requires at least two of the following three features: acute upper abdominal pain often radiating through to the back, serum amylase and/or lipase levels ≥ three times the upper limit of normal, and evidence of pancreatitis upon abdominal imaging[14]. The work described was carried out in accordance with The Code of Ethics of the World Medical Association. This research was approved by the Ethics Committees of the First Affiliated Hospital of Medical College, Xi’an Jiaotong University.
Tobacco and alcohol exposure assessmentData on tobacco exposure were obtained from the baseline questionnaire and telephone follow-up. All patients were asked if they smoke regularly and, if so, for how many years they had smoked and the average number of cigarettes they smoked per day. Smoking data included smoking pack-years (PY, packages of cigarettes smoked per day multiplied by the number of years for which the individual has smoked). Smoking status was defined as non-smoker (<100 cigarettes during lifetime), ex-smoker, and current smoker. An ex-smoker was defined as one who had quitted smoking for more than 6 mo before the end of follow-up after being discharged from the hospital. A current smoker was defined as one who smoked at least 1 cigarette per day for over 1 year and continued to smoke within 1 year prior to follow-up. Tobacco exposure was characterized as none, light smoker (0 < PY < 10), and heavy smoker (PY ≥ 10)[15,16]. Since alcohol and smoking are often linked behaviors[17], there are questions about the independent influence of smoking. Therefore, exposure of alcohol was also investigated and taken into consideration. In accordance with previous guidelines, a high drinker was defined as one who has drunk at least 40 g/d (20 g/d for female) for over 5 years. Smokers and alcohol abusers were routinely encouraged to give up these bad habits.
Treatment and follow-upAll the patients were treated with comprehensive routine therapy, including restriction of oral intake, fluid expansion, parenteral nutrition, analgesia, proton pump inhibitor administration, inhibition of pancreatic enzyme secretion, antibiotics, early enteral nutrition, and plasma exchange, if needed[18].
The information on demographic data, history of
hypertriglyceridemia, fatty liver, diabetes, hyperten-sion, previous episodes of pancreatitis, consumption of alcohol and cigarettes, as well as biochemical and hematological data were carefully recorded at admission. During follow-up, we gathered information on current smoking status and recurrent AP. Repeated episodes were defined as patients who were diagnosed with AP more than twice during their lifetime. To avoid recurrence, all patients were counseled to continue dietary fat restriction after treatment. Lipid lowering agents were used for patients when necessary.
Statistical analysisStatistical analyses were performed with the SPSS 21.0 software package (SPSS Inc., Chicago, IL, United States). Continuous variables are expressed as the mean ± SE, and comparisons between groups were performed using non-parametric tests, the t-test, or ANOVA, as appropriate. Categorical variables were compared between groups using the χ2 test or Fisher’s exact test. RFS was calculated using the Kaplan-Meier method, and the differences between groups were compared using the log-rank test. Risk factors for the recurrence of HLAP were analyzed by univariate analysis first, and those with P < 0.20 and possible clinical effect were included in multivariate analysis using a Cox proportional hazards model. A P value < 0.05 was considered statistically significant. The statistical methods and results of this study were reviewed by a biostatistician (Qian Li, PhD) at Xi’an Jiaotong University.
RESULTSOf the 88 patients with HLAP who were enrolled and analyzed (66 men and 22 women with a mean age of 40.9 ± 1.1 year), 36 and 11 patients were documented as current smokers and ex-smokers, respectively, while 41 patients had no cigarette smoking history. The characteristics of the patients in the three groups are shown in Table 1. No significant differences were observed between the three groups in age or medical history of hyperlipemia, fatty liver, diabetes mellitus, hypertension, or AP. Of the current smokers, 55.6% had a history of AP, which was significantly higher than that of non-smokers (31.7%). Cigarette smoking patients were more likely to have concomitant alcohol abuse than non-smokers (P = 0.037), and more male patients than females tended to smoke. Biochemical tests of serum TG, cholesterol (CHOL), amylase, lipase, and calcium levels were not significantly different between these groups, and nor were the leukocyte and platelet counts. Patients who currently or previously smoked had higher systemic inflammatory response syndrome (SIRS) proportions and bedside index for severity in acute pancreatitis (BISAP) scores than non-smokers, but the differences were not significant.
8389 December 21, 2017|Volume 23|Issue 47|WJG|www.wjgnet.com
Xiang JX et al . Cigarette smoking causes HLAP recurrence
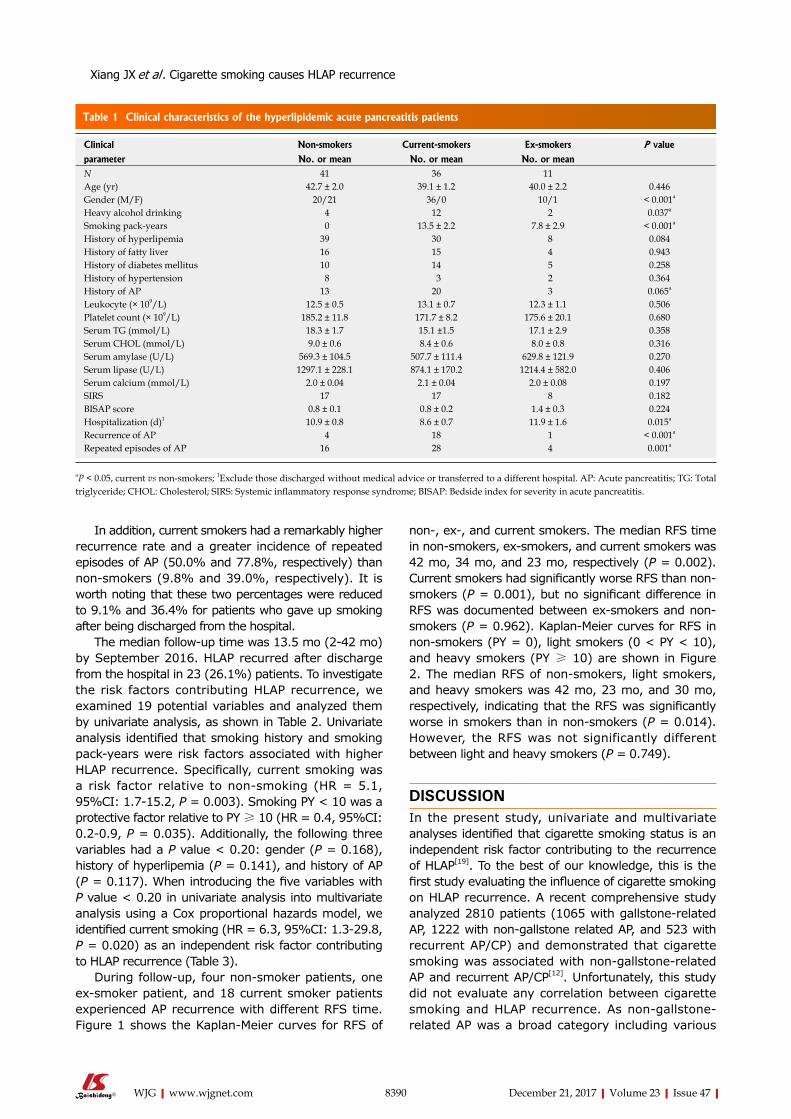
8390 December 21, 2017|Volume 23|Issue 47|WJG|www.wjgnet.com
non-, ex-, and current smokers. The median RFS time in non-smokers, ex-smokers, and current smokers was 42 mo, 34 mo, and 23 mo, respectively (P = 0.002). Current smokers had significantly worse RFS than non-smokers (P = 0.001), but no significant difference in RFS was documented between ex-smokers and non-smokers (P = 0.962). Kaplan-Meier curves for RFS in non-smokers (PY = 0), light smokers (0 < PY < 10), and heavy smokers (PY ≥ 10) are shown in Figure 2. The median RFS of non-smokers, light smokers, and heavy smokers was 42 mo, 23 mo, and 30 mo, respectively, indicating that the RFS was significantly worse in smokers than in non-smokers (P = 0.014). However, the RFS was not significantly different between light and heavy smokers (P = 0.749).
DISCUSSIONIn the present study, univariate and multivariate analyses identified that cigarette smoking status is an independent risk factor contributing to the recurrence of HLAP[19]. To the best of our knowledge, this is the first study evaluating the influence of cigarette smoking on HLAP recurrence. A recent comprehensive study analyzed 2810 patients (1065 with gallstone-related AP, 1222 with non-gallstone related AP, and 523 with recurrent AP/CP) and demonstrated that cigarette smoking was associated with non-gallstone-related AP and recurrent AP/CP[12]. Unfortunately, this study did not evaluate any correlation between cigarette smoking and HLAP recurrence. As non-gallstone-related AP was a broad category including various
In addition, current smokers had a remarkably higher recurrence rate and a greater incidence of repeated episodes of AP (50.0% and 77.8%, respectively) than non-smokers (9.8% and 39.0%, respectively). It is worth noting that these two percentages were reduced to 9.1% and 36.4% for patients who gave up smoking after being discharged from the hospital.
The median follow-up time was 13.5 mo (2-42 mo) by September 2016. HLAP recurred after discharge from the hospital in 23 (26.1%) patients. To investigate the risk factors contributing HLAP recurrence, we examined 19 potential variables and analyzed them by univariate analysis, as shown in Table 2. Univariate analysis identified that smoking history and smoking pack-years were risk factors associated with higher HLAP recurrence. Specifically, current smoking was a risk factor relative to non-smoking (HR = 5.1, 95%CI: 1.7-15.2, P = 0.003). Smoking PY < 10 was a protective factor relative to PY ≥ 10 (HR = 0.4, 95%CI: 0.2-0.9, P = 0.035). Additionally, the following three variables had a P value < 0.20: gender (P = 0.168), history of hyperlipemia (P = 0.141), and history of AP (P = 0.117). When introducing the five variables with P value < 0.20 in univariate analysis into multivariate analysis using a Cox proportional hazards model, we identified current smoking (HR = 6.3, 95%CI: 1.3-29.8, P = 0.020) as an independent risk factor contributing to HLAP recurrence (Table 3).
During follow-up, four non-smoker patients, one ex-smoker patient, and 18 current smoker patients experienced AP recurrence with different RFS time. Figure 1 shows the Kaplan-Meier curves for RFS of
Table 1 Clinical characteristics of the hyperlipidemic acute pancreatitis patients
Clinical Non-smokers Current-smokers Ex-smokers P value
parameter No. or mean No. or mean No. or meanN 41 36 11Age (yr) 42.7 ± 2.0 39.1 ± 1.2 40.0 ± 2.2 0.446Gender (M/F) 20/21 36/0 10/1 < 0.001a
Heavy alcohol drinking 4 12 2 0.037a
Smoking pack-years 0 13.5 ± 2.2 7.8 ± 2.9 < 0.001a
History of hyperlipemia 39 30 8 0.084History of fatty liver 16 15 4 0.943History of diabetes mellitus 10 14 5 0.258History of hypertension 8 3 2 0.364History of AP 13 20 3 0.065a
Leukocyte (× 109/L) 12.5 ± 0.5 13.1 ± 0.7 12.3 ± 1.1 0.506Platelet count (× 109/L) 185.2 ± 11.8 171.7 ± 8.2 175.6 ± 20.1 0.680Serum TG (mmol/L) 18.3 ± 1.7 15.1 ±1.5 17.1 ± 2.9 0.358Serum CHOL (mmol/L) 9.0 ± 0.6 8.4 ± 0.6 8.0 ± 0.8 0.316Serum amylase (U/L) 569.3 ± 104.5 507.7 ± 111.4 629.8 ± 121.9 0.270Serum lipase (U/L) 1297.1 ± 228.1 874.1 ± 170.2 1214.4 ± 582.0 0.406Serum calcium (mmol/L) 2.0 ± 0.04 2.1 ± 0.04 2.0 ± 0.08 0.197SIRS 17 17 8 0.182BISAP score 0.8 ± 0.1 0.8 ± 0.2 1.4 ± 0.3 0.224Hospitalization (d)1 10.9 ± 0.8 8.6 ± 0.7 11.9 ± 1.6 0.015a
Recurrence of AP 4 18 1 < 0.001a
Repeated episodes of AP 16 28 4 0.001a
aP < 0.05, current vs non-smokers; 1Exclude those discharged without medical advice or transferred to a different hospital. AP: Acute pancreatitis; TG: Total triglyceride; CHOL: Cholesterol; SIRS: Systemic inflammatory response syndrome; BISAP: Bedside index for severity in acute pancreatitis.
Xiang JX et al . Cigarette smoking causes HLAP recurrence
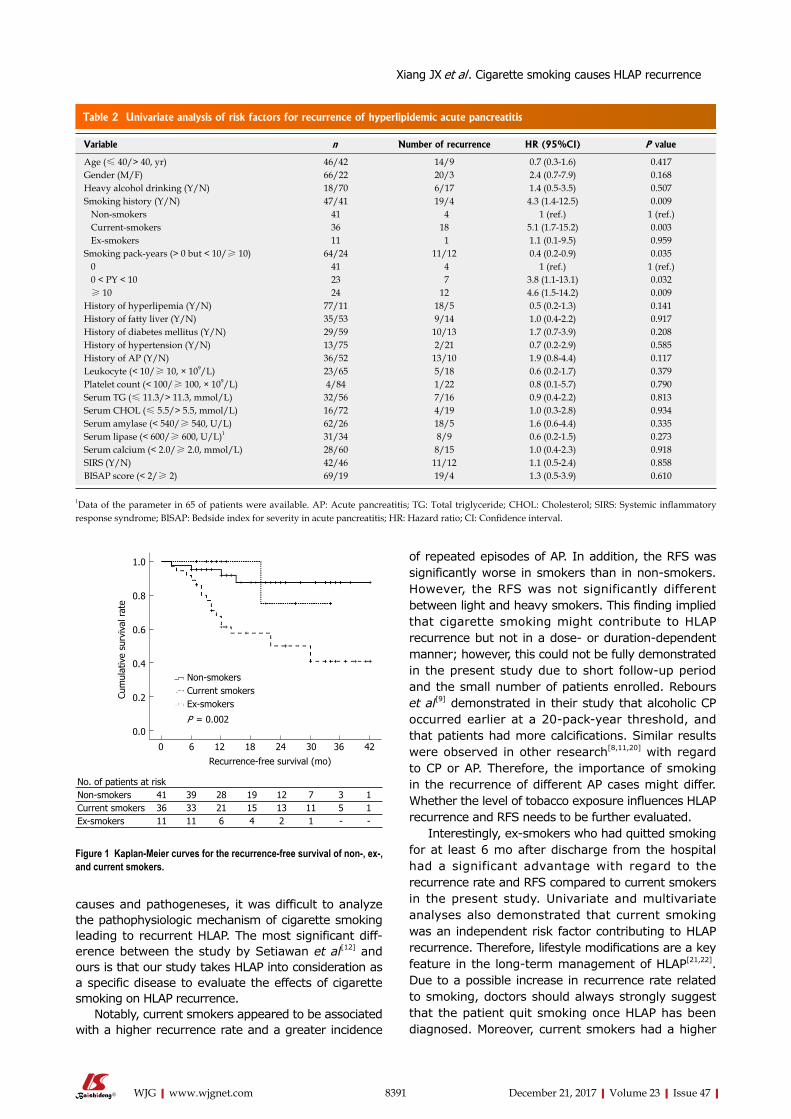
8391 December 21, 2017|Volume 23|Issue 47|WJG|www.wjgnet.com
causes and pathogeneses, it was difficult to analyze the pathophysiologic mechanism of cigarette smoking leading to recurrent HLAP. The most significant diff-erence between the study by Setiawan et al[12] and ours is that our study takes HLAP into consideration as a specific disease to evaluate the effects of cigarette smoking on HLAP recurrence.
Notably, current smokers appeared to be associated with a higher recurrence rate and a greater incidence
of repeated episodes of AP. In addition, the RFS was significantly worse in smokers than in non-smokers. However, the RFS was not significantly different between light and heavy smokers. This finding implied that cigarette smoking might contribute to HLAP recurrence but not in a dose- or duration-dependent manner; however, this could not be fully demonstrated in the present study due to short follow-up period and the small number of patients enrolled. Rebours et al[9] demonstrated in their study that alcoholic CP occurred earlier at a 20-pack-year threshold, and that patients had more calcifications. Similar results were observed in other research[8,11,20] with regard to CP or AP. Therefore, the importance of smoking in the recurrence of different AP cases might differ. Whether the level of tobacco exposure influences HLAP recurrence and RFS needs to be further evaluated.
Interestingly, ex-smokers who had quitted smoking for at least 6 mo after discharge from the hospital had a significant advantage with regard to the recurrence rate and RFS compared to current smokers in the present study. Univariate and multivariate analyses also demonstrated that current smoking was an independent risk factor contributing to HLAP recurrence. Therefore, lifestyle modifications are a key feature in the long-term management of HLAP[21,22]. Due to a possible increase in recurrence rate related to smoking, doctors should always strongly suggest that the patient quit smoking once HLAP has been diagnosed. Moreover, current smokers had a higher
Table 2 Univariate analysis of risk factors for recurrence of hyperlipidemic acute pancreatitis
Variable n Number of recurrence HR (95%CI) P value
Age (≤ 40/> 40, yr) 46/42 14/9 0.7 (0.3-1.6) 0.417Gender (M/F) 66/22 20/3 2.4 (0.7-7.9) 0.168Heavy alcohol drinking (Y/N) 18/70 6/17 1.4 (0.5-3.5) 0.507Smoking history (Y/N) 47/41 19/4 4.3 (1.4-12.5) 0.009 Non-smokers 41 4 1 (ref.) 1 (ref.) Current-smokers 36 18 5.1 (1.7-15.2) 0.003 Ex-smokers 11 1 1.1 (0.1-9.5) 0.959Smoking pack-years (> 0 but < 10/≥ 10) 64/24 11/12 0.4 (0.2-0.9) 0.035 0 41 4 1 (ref.) 1 (ref.) 0 < PY < 10 23 7 3.8 (1.1-13.1) 0.032 ≥ 10 24 12 4.6 (1.5-14.2) 0.009History of hyperlipemia (Y/N) 77/11 18/5 0.5 (0.2-1.3) 0.141History of fatty liver (Y/N) 35/53 9/14 1.0 (0.4-2.2) 0.917History of diabetes mellitus (Y/N) 29/59 10/13 1.7 (0.7-3.9) 0.208History of hypertension (Y/N) 13/75 2/21 0.7 (0.2-2.9) 0.585History of AP (Y/N) 36/52 13/10 1.9 (0.8-4.4) 0.117Leukocyte (< 10/≥ 10, × 109/L) 23/65 5/18 0.6 (0.2-1.7) 0.379Platelet count (< 100/≥ 100, × 109/L) 4/84 1/22 0.8 (0.1-5.7) 0.790Serum TG (≤ 11.3/> 11.3, mmol/L) 32/56 7/16 0.9 (0.4-2.2) 0.813Serum CHOL (≤ 5.5/> 5.5, mmol/L) 16/72 4/19 1.0 (0.3-2.8) 0.934Serum amylase (< 540/≥ 540, U/L) 62/26 18/5 1.6 (0.6-4.4) 0.335Serum lipase (< 600/≥ 600, U/L)1 31/34 8/9 0.6 (0.2-1.5) 0.273Serum calcium (< 2.0/≥ 2.0, mmol/L) 28/60 8/15 1.0 (0.4-2.3) 0.918SIRS (Y/N) 42/46 11/12 1.1 (0.5-2.4) 0.858BISAP score (< 2/≥ 2) 69/19 19/4 1.3 (0.5-3.9) 0.610
1Data of the parameter in 65 of patients were available. AP: Acute pancreatitis; TG: Total triglyceride; CHOL: Cholesterol; SIRS: Systemic inflammatory response syndrome; BISAP: Bedside index for severity in acute pancreatitis; HR: Hazard ratio; CI: Confidence interval.
No. of patients at riskNon-smokers 41 39 28 19 12 7 3 1Current smokers 36 33 21 15 13 11 5 1Ex-smokers 11 11 6 4 2 1 - -
0 6 12 18 24 30 36 42
Recurrence-free survival (mo)
1.0
0.8
0.6
0.4
0.2
0.0
Cum
ulat
ive
surv
ival
rat
e
Non-smokersCurrent smokersEx-smokers
P = 0.002
Figure 1 Kaplan-Meier curves for the recurrence-free survival of non-, ex-, and current smokers.
Xiang JX et al . Cigarette smoking causes HLAP recurrence
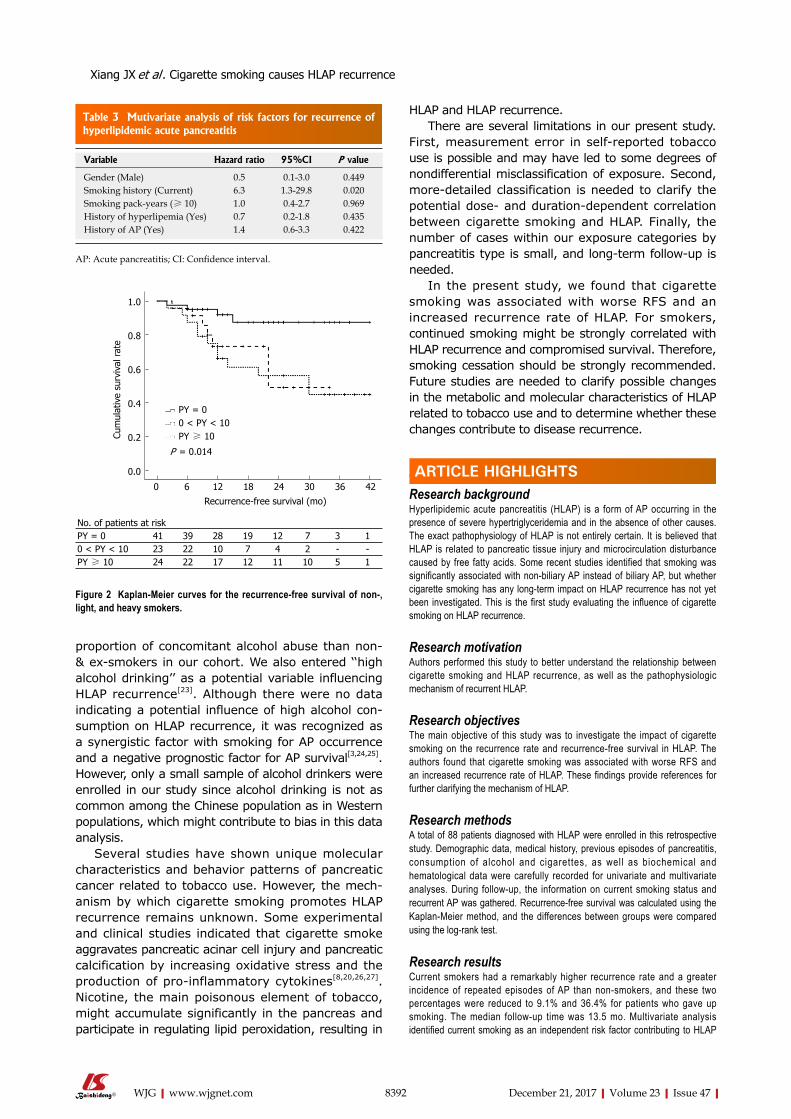
8392 December 21, 2017|Volume 23|Issue 47|WJG|www.wjgnet.com
proportion of concomitant alcohol abuse than non- & ex-smokers in our cohort. We also entered ‘‘high alcohol drinking’’ as a potential variable influencing HLAP recurrence[23]. Although there were no data indicating a potential influence of high alcohol con-sumption on HLAP recurrence, it was recognized as a synergistic factor with smoking for AP occurrence and a negative prognostic factor for AP survival[3,24,25]. However, only a small sample of alcohol drinkers were enrolled in our study since alcohol drinking is not as common among the Chinese population as in Western populations, which might contribute to bias in this data analysis.
Several studies have shown unique molecular characteristics and behavior patterns of pancreatic cancer related to tobacco use. However, the mech-anism by which cigarette smoking promotes HLAP recurrence remains unknown. Some experimental and clinical studies indicated that cigarette smoke aggravates pancreatic acinar cell injury and pancreatic calcification by increasing oxidative stress and the production of pro-inflammatory cytokines[8,20,26,27]. Nicotine, the main poisonous element of tobacco, might accumulate significantly in the pancreas and participate in regulating lipid peroxidation, resulting in
HLAP and HLAP recurrence.There are several limitations in our present study.
First, measurement error in self-reported tobacco use is possible and may have led to some degrees of nondifferential misclassification of exposure. Second, more-detailed classification is needed to clarify the potential dose- and duration-dependent correlation between cigarette smoking and HLAP. Finally, the number of cases within our exposure categories by pancreatitis type is small, and long-term follow-up is needed.
In the present study, we found that cigarette smoking was associated with worse RFS and an increased recurrence rate of HLAP. For smokers, continued smoking might be strongly correlated with HLAP recurrence and compromised survival. Therefore, smoking cessation should be strongly recommended. Future studies are needed to clarify possible changes in the metabolic and molecular characteristics of HLAP related to tobacco use and to determine whether these changes contribute to disease recurrence.
ARTICLE HIGHLIGHTSResearch backgroundHyperlipidemic acute pancreatitis (HLAP) is a form of AP occurring in the presence of severe hypertriglyceridemia and in the absence of other causes. The exact pathophysiology of HLAP is not entirely certain. It is believed that HLAP is related to pancreatic tissue injury and microcirculation disturbance caused by free fatty acids. Some recent studies identified that smoking was significantly associated with non-biliary AP instead of biliary AP, but whether cigarette smoking has any long-term impact on HLAP recurrence has not yet been investigated. This is the first study evaluating the influence of cigarette smoking on HLAP recurrence.
Research motivationAuthors performed this study to better understand the relationship between cigarette smoking and HLAP recurrence, as well as the pathophysiologic mechanism of recurrent HLAP.
Research objectivesThe main objective of this study was to investigate the impact of cigarette smoking on the recurrence rate and recurrence-free survival in HLAP. The authors found that cigarette smoking was associated with worse RFS and an increased recurrence rate of HLAP. These findings provide references for further clarifying the mechanism of HLAP.
Research methodsA total of 88 patients diagnosed with HLAP were enrolled in this retrospective study. Demographic data, medical history, previous episodes of pancreatitis, consumption of alcohol and cigarettes, as well as biochemical and hematological data were carefully recorded for univariate and multivariate analyses. During follow-up, the information on current smoking status and recurrent AP was gathered. Recurrence-free survival was calculated using the Kaplan-Meier method, and the differences between groups were compared using the log-rank test.
Research resultsCurrent smokers had a remarkably higher recurrence rate and a greater incidence of repeated episodes of AP than non-smokers, and these two percentages were reduced to 9.1% and 36.4% for patients who gave up smoking. The median follow-up time was 13.5 mo. Multivariate analysis identified current smoking as an independent risk factor contributing to HLAP
Table 3 Mutivariate analysis of risk factors for recurrence of hyperlipidemic acute pancreatitis
Variable Hazard ratio 95%CI P value
Gender (Male) 0.5 0.1-3.0 0.449Smoking history (Current) 6.3 1.3-29.8 0.020Smoking pack-years (≥ 10) 1.0 0.4-2.7 0.969History of hyperlipemia (Yes) 0.7 0.2-1.8 0.435History of AP (Yes) 1.4 0.6-3.3 0.422
AP: Acute pancreatitis; CI: Confidence interval.
0 6 12 18 24 30 36 42
Recurrence-free survival (mo)
1.0
0.8
0.6
0.4
0.2
0.0
Cum
ulat
ive
surv
ival
rat
e
PY = 00 < PY < 10PY ≥ 10
P = 0.014
No. of patients at riskPY = 0 41 39 28 19 12 7 3 10 < PY < 10 23 22 10 7 4 2 - -PY ≥ 10 24 22 17 12 11 10 5 1
Figure 2 Kaplan-Meier curves for the recurrence-free survival of non-, light, and heavy smokers.
ARTICLE HIGHLIGHTS
Xiang JX et al . Cigarette smoking causes HLAP recurrence
8393 December 21, 2017|Volume 23|Issue 47|WJG|www.wjgnet.com
recurrence. Current smokers had significantly worse RFS than non-smokers, but no significant difference was documented between ex-smokers and non-smokers.
Research conclusionsIn the present study, the authors found that cigarette smoking was associated with worse RFS and an increased recurrence rate of HLAP. For smokers, continued smoking might be strongly correlated with HLAP recurrence and compromised survival. Smoking cessation for at least 6 mo would lead to a significant advantage in recurrence rate and RFS compared to current smokers.
Research perspectivesThe study revealed that smoking is associated with worse RFS and higher recurrence rate of HLAP. Besides, smoking cessation for at least 6 mo would lead to a significant advantage in recurrence rate and RFS compared to current smokers. For the future research, more detailed classification is needed to clarify the potential dose- and duration-dependent correlation between cigarette smoking and HLAP. Besides, expanding the number of cases and long-term follow-up are needed.
REFERENCES1 Whitcomb DC. Clinical practice. Acute pancreatitis. N Engl J
Med 2006; 354: 2142-2150 [PMID: 16707751 DOI: 10.1056/NEJMcp054958]
2 Chang MC, Su CH, Sun MS, Huang SC, Chiu CT, Chen MC, Lee KT, Lin CC, Lin JT. Etiology of acute pancreatitis--a multi-center study in Taiwan. Hepatogastroenterology 2003; 50: 1655-1657 [PMID: 14571809]
3 Yadav D, Lowenfels AB. The epidemiology of pancreatitis and pancreatic cancer. Gastroenterology 2013; 144: 1252-1261 [PMID: 23622135 DOI: 10.1053/j.gastro.2013.01.068]
4 Yin G, Cang X, Yu G, Hu G, Ni J, Xiong J, Hu Y, Xing M, Chen C, Huang Y, Tang M, Zhao Y, Cheng G, Wan R, Wang S, Wang X. Different Clinical Presentations of Hyperlipidemic Acute Pancreatitis: A Retrospective Study. Pancreas 2015; 44: 1105-1110 [PMID: 26348469 DOI: 10.1097/MPA.0000000000000403]
5 Valdivielso P, Ramírez-Bueno A, Ewald N. Current knowledge of hypertriglyceridemic pancreatitis. Eur J Intern Med 2014; 25: 689-694 [PMID: 25269432 DOI: 10.1016/j.ejim.2014.08.008]
6 Papadakis EP, Sarigianni M, Mikhailidis DP, Mamopoulos A, Karagiannis V. Acute pancreatitis in pregnancy: an overview. Eur J Obstet Gynecol Reprod Biol 2011; 159: 261-266 [PMID: 21840110 DOI: 10.1016/j.ejogrb.2011.07.037]
7 Qiu L, Sun RQ, Jia RR, Ma XY, Cheng L, Tang MC, Zhao Y. Comparison of Existing Clinical Scoring Systems in Predicting Severity and Prognoses of Hyperlipidemic Acute Pancreatitis in Chinese Patients: A Retrospective Study. Medicine (Baltimore) 2015; 94: e957 [PMID: 26061329 DOI: 10.1097/MD.0000000000000957]
8 Law R, Parsi M, Lopez R, Zuccaro G, Stevens T. Cigarette smoking is independently associated with chronic pancreatitis. Pancreatology 2010; 10: 54-59 [PMID: 20332662 DOI: 10.1159/000225927]
9 Rebours V, Vullierme MP, Hentic O, Maire F, Hammel P, Ruszniewski P, Lévy P. Smoking and the course of recurrent acute and chronic alcoholic pancreatitis: a dose-dependent relationship. Pancreas 2012; 41: 1219-1224 [PMID: 23086245 DOI: 10.1097/MPA.0b013e31825de97d]
10 Maisonneuve P, Lowenfels AB, Müllhaupt B, Cavallini G, Lankisch PG, Andersen JR, Dimagno EP, Andrén-Sandberg A, Domellöf L, Frulloni L, Ammann RW. Cigarette smoking accelerates progression of alcoholic chronic pancreatitis. Gut 2005; 54: 510-514 [PMID: 15753536 DOI: 10.1136/gut.2004.039263]
11 Sadr-Azodi O, Andrén-Sandberg Å, Orsini N, Wolk A. Cigarette smoking, smoking cessation and acute pancreatitis: a prospective population-based study. Gut 2012; 61: 262-267 [PMID: 21836026 DOI: 10.1136/gutjnl-2011-300566]
12 Setiawan VW, Pandol SJ, Porcel J, Wilkens LR, Le Marchand L, Pike MC, Monroe KR. Prospective Study of Alcohol Drinking, Smoking, and Pancreatitis: The Multiethnic Cohort. Pancreas 2016; 45: 819-825 [PMID: 27171516 DOI: 10.1097/MPA.0000000000000657]
13 Chowdhury P, Walker A. A cell-based approach to study changes in the pancreas following nicotine exposure in an animal model of injury. Langenbecks Arch Surg 2008; 393: 547-555 [PMID: 18204935 DOI: 10.1007/s00423-007-0267-1]
14 Banks PA, Bollen TL, Dervenis C, Gooszen HG, Johnson CD, Sarr MG, Tsiotos GG, Vege SS; Acute Pancreatitis Classification Working Group. Classification of acute pancreatitis--2012: revision of the Atlanta classification and definitions by international consensus. Gut 2013; 62: 102-111 [PMID: 23100216 DOI: 10.1136/gutjnl-2012-302779]
15 Shih WL, Chang HC, Liaw YF, Lin SM, Lee SD, Chen PJ, Liu CJ, Lin CL, Yu MW. Influences of tobacco and alcohol use on hepatocellular carcinoma survival. Int J Cancer 2012; 131: 2612-2621 [PMID: 22362517 DOI: 10.1002/ijc.27508]
16 Zhang XF, Wei T, Liu XM, Liu C, Lv Y. Impact of cigarette smoking on outcome of hepatocellular carcinoma after surgery in patients with hepatitis B. PLoS One 2014; 9: e85077 [PMID: 24454795 DOI: 10.1371/journal.pone.0085077]
17 Di Leo M, Leandro G, Singh SK, Mariani A, Bianco M, Zuppardo RA, Goni E, Rogger TM, Di Mario F, Guslandi M, De Cobelli F, Del Maschio A, Testoni PA, Cavestro GM. Low Alcohol and Cigarette Use Is Associated to the Risk of Developing Chronic Pancreatitis. Pancreas 2017; 46: 225-229 [PMID: 27846144 DOI: 10.1097/MPA.0000000000000737]
18 Yin G, Hu G, Cang X, Yu G, Hu Y, Xing M, Chen C, Huang Y, Tang M, Zhao Y, Cheng G, Wan R, Wang X. C-reactive protein: rethinking its role in evaluating the severity of hyperlipidemic acute pancreatitis. Pancreas 2014; 43: 1323-1328 [PMID: 25083999 DOI: 10.1097/MPA.0000000000000187]
19 Sun X, Huang X, Zhao R, Chen B, Xie Q. Meta-analysis: Tobacco smoking may enhance the risk of acute pancreatitis. Pancreatology 2015; 15: 286-294 [PMID: 25804129 DOI: 10.1016/j.pan.2015.03.001]
20 Coté GA, Yadav D, Slivka A, Hawes RH, Anderson MA, Burton FR, Brand RE, Banks PA, Lewis MD, Disario JA, Gardner TB, Gelrud A, Amann ST, Baillie J, Money ME, O’Connell M, Whitcomb DC, Sherman S; North American Pancreatitis Study Group. Alcohol and smoking as risk factors in an epidemiology study of patients with chronic pancreatitis. Clin Gastroenterol Hepatol 2011; 9: 266-273; quiz e27 [PMID: 21029787 DOI: 10.1016/j.cgh.2010.10.015]
21 Morton C, Klatsky AL, Udaltsova N. Smoking, coffee, and pancreatitis. Am J Gastroenterol 2004; 99: 731-738 [PMID: 15089909 DOI: 10.1111/j.1572-0241.2004.04143.x]
22 Lindkvist B, Appelros S, Manjer J, Berglund G, Borgstrom A. A prospective cohort study of smoking in acute pancreatitis. Pancreatology 2008; 8 : 63-70 [PMID: 18235217 DOI: 10.1159/000114868]
23 Munigala S, Conwell DL, Gelrud A, Agarwal B. Heavy Smoking Is Associated With Lower Age at First Episode of Acute Pancreatitis and a Higher Risk of Recurrence. Pancreas 2015; 44: 876-881 [PMID: 25906444 DOI: 10.1097/MPA.0000000000000364]
24 Kristiansen L, Grønbaek M, Becker U, Tolstrup JS. Risk of pancreatitis according to alcohol drinking habits: a population-based cohort study. Am J Epidemiol 2008; 168: 932-937 [PMID: 18779386 DOI: 10.1093/aje/kwn222]
25 Yadav D, Hawes RH, Brand RE, Anderson MA, Money ME, Banks PA, Bishop MD, Baillie J, Sherman S, DiSario J, Burton FR, Gardner TB, Amann ST, Gelrud A, Lawrence C, Elinoff B, Greer JB, O’Connell M, Barmada MM, Slivka A, Whitcomb DC; North American Pancreatic Study Group. Alcohol consumption, cigarette smoking, and the risk of recurrent acute and chronic pancreatitis.
Xiang JX et al . Cigarette smoking causes HLAP recurrence
8394 December 21, 2017|Volume 23|Issue 47|WJG|www.wjgnet.com
Arch Intern Med 2009; 169: 1035-1045 [PMID: 19506173 DOI: 10.1001/archinternmed.2009.125]
26 Chowdhury P, Bose C, Udupa KB. Nicotine-induced proliferation of isolated rat pancreatic acinar cells: effect on cell signalling and function. Cell Prolif 2007; 40: 125-141 [PMID: 17227300 DOI:
10.1111/j.1365-2184.2007.00418.x]27 Greer JB, Thrower E, Yadav D. Epidemiologic and Mechanistic
Associations Between Smoking and Pancreatitis. Curr Treat Options Gastroenterol 2015; 13: 332-346 [PMID: 26109145 DOI: 10.1007/s11938-015-0056-9]
P- Reviewer: Bradley EL, Gonzalez-Ojeda AG S- Editor: Chen K L- Editor: Wang TQ E- Editor: Huang Y
Xiang JX et al . Cigarette smoking causes HLAP recurrence
Chih-Ming Liang, Ming-Te Kuo, Wei-Chen Tai, Shih-Cheng Yang, Keng-Liang Wu, Hsing-Ming Wang, Chih-Chien Yao, Cheng-En Tsai, Seng-Kee Chuah, Division of Hepato-Gastroenterology, Department of Internal Medicine, Kaohsiung Chang Gung Memorial Hospital and Chang Gung University College of Medicine, Kaohsiung 833, Taiwan
Pin-I Hsu, Division of Gastroenterology, Department of Internal Medicine, Kaohsiung Veterans General Hospital, National Yang-Ming University, Kaohsiung 833, Taiwan
Chao-Hung Kuo, Yao-Kuang Wang, Jiunn-Wei Wang, Deng-Chyang Wu, Division of Gastroenterology, Department of Internal Medicine, Kaohsiung Medical University Hospital and Kaohsiung Medical University, Kaohsiung 833, Taiwan
Chih-Fang Huang, Division of Family Physicians, Kaohsiung Chang Gung Memorial Hospital and Chang Gung University College of Medicine, Kaohsiung 833, Taiwan
ORCID numbers: Chih-Ming Liang (0000-0002-6614-5937); Ming-Te Kuo ((0000-0001-9223-318X); Pin-I Hsu (0000-0003 -3905-4674); Chao-Hung Kuo (0000-0003-1847-395X); Wei-Chen Tai (0000-0002-8026-1408); Shih-Cheng Yang (0000 -0002-8288-8845); Keng-Liang Wu (0000-0002-8703-6625); Hsing-Ming Wang (0000-0002-2599-6495); Chih-Chien Yao (0000-0002-4868-200X); Cheng-En Tsai (0000-0001 -9840-4051); Yao-Kuang Wang (0000-0002-5536-7542); Jiunn-Wei Wang (0000-0003-2534-438X); Chih-Fang Huang (0000- 0002-5900-292X); Deng-Chyang Wu (0000-0003-3742-0634); Seng-Kee Chuah (0000-0002-8934-3223).
Author contributions: Liang CM and Kuo MT contributed equally to this work; Chuah SK contributed to the research design and critical revision of the manuscript for important intellectual content; Hsu PI, Kuo CH, Tai WC, Yang SC, Wu KL, Wang HM, Yao CC, Tsai CE, Wang YK, Wang JW, Huang CF, Wu DC
and Chuah SK performed the research; Liang CM and Kuo MT analyzed the data and wrote the manuscript; all authors approved the final version of the manuscript.
Supported by Research Foundation of Chang Gung Memorial Hospital, No. CMRPG8D1441.
Institutional review board statement: The study was reviewed and approved by the Chang Gung Memorial Hospital institutional review board.
Clinical trial registration statement: ClinicalTrials.gov number: NCT03128736.
Informed consent statement: The data collection in this study is based on reviewing computerized medical charts. Informed consent was obtained from all patients in the study.
Conflict-of-interest statement: None of the authors have a conflict of interest related to the manuscript.
Data sharing statement: No additional data are available.
Open-Access: This article is an open-access article which was selected by an in-house editor and fully peer-reviewed by external reviewers. It is distributed in accordance with the Creative Commons Attribution Non Commercial (CC BY-NC 4.0) license, which permits others to distribute, remix, adapt, build upon this work non-commercially, and license their derivative works on different terms, provided the original work is properly cited and the use is non-commercial. See: http://creativecommons.org/licenses/by-nc/4.0/
Manuscript source: Unsolicited manuscript
Correspondence to: Seng-Kee Chuah, MD, Chief Doctor, Professor, Division of Hepatogastroenterology, Department of Internal Medicine, Kaohsiung Chang Gung Memorial Hospital
8395 December 21, 2017|Volume 23|Issue 47|WJG|www.wjgnet.com
ORIGINAL ARTICLE
First-week clinical responses to dexlansoprazole 60 mg and esomeprazole 40 mg for the treatment of grades A and B gastroesophageal reflux disease
Clinical Trials Study
Chih-Ming Liang, Ming-Te Kuo, Pin-I Hsu, Chao-Hung Kuo, Wei-Chen Tai, Shih-Cheng Yang, Keng-Liang Wu, Hsing-Ming Wang, Chih-Chien Yao, Cheng-En Tsai, Yao-Kuang Wang, Jiunn-Wei Wang, Chih-Fang Huang, Deng-Chyang Wu, Seng-Kee Chuah; Taiwan Acid-Related Disease Study Group
Submit a Manuscript: http://www.f6publishing.com
DOI: 10.3748/wjg.v23.i47.8395
World J Gastroenterol 2017 December 21; 23(47): 8395-8404
ISSN 1007-9327 (print) ISSN 2219-2840 (online)
and Chang Gung University College of Medicine, 123 Ta Pei Road, Niao-Sung District, Kaohsiung 833, Taiwan. [email protected]: +886-7-7317123-2360 Fax: +886-7-7322402
Received: July 28, 2017Peer-review started: July 28, 2017First decision: August 30, 2017Revised: September 19, 2017Accepted: September 26, 2017 Article in press: September 26, 2017Published online: December 21, 2017
AbstractAIMTo compare the one-week clinical effects of single doses of dexlansoprazole and esomeprazole on grades A and B erosive esophagitis.
METHODSWe enrolled 175 adult patients with gastroesophageal reflux disease (GERD). The patients were randomized in a 1:1 ratio into two sequence groups to define the order in which they received single doses of dexlansoprazole (n = 88) and esomeprazole (n = 87) for an intention-to-treat analysis. The primary end-points were the complete symptom resolution (CSR) rates at days 1, 3, and 7 after drug administration.
RESULTSThirteen patients were lost to follow-up, resulting in 81 patients in each group for the per-protocol analysis. The CSRs for both groups were similar at days 1, 3 and 7. In the subgroup analysis, the female patients achieved higher CSRs in the dexlansoprazole group than in the esomeprazole group at day 3 (38.3% vs 18.4%, P = 0.046). An increasing trend toward a higher CSR was observed in the dexlansoprazole group at day 7 (55.3% vs 36.8%, P = 0.09). In the esomeprazole group, female sex was a negative predictive factor for CSR on post-administration day 1 [OR = -1.249 ± 0.543; 95%CI: 0.287 (0.099-0.832), P = 0.022] and day 3 [OR = -1.254 ± 0.519; 95%CI: 0.285 (0.103-0.789), P = 0.016]. Patients with spicy food eating habits achieved lower CSRs on day 1 [37.3% vs 21.4%, OR = -0.969 ± 0.438; 95%CI: 0.380 (0.161-0.896), P = 0.027].
CONCLUSIONThe overall CSR for GERD patients was similar at days 1-7 for both the dexlansoprazole and esomepra-zole groups, although a higher incidence of CSR was observed on day 3 in female patients who received a single dose of dexlansoprazole.
Key words: Dexlansoprazole; Esomeprazole; One-week response; Complete symptom resolution rate; Gastroesophageal reflux disease
© The Author(s) 2017. Published by Baishideng Publishing Group Inc. All rights reserved.
Core tip: No existing report has investigated the short-term clinical effects of dexlansoprazole 60 mg vs esomeprazole 40 mg. This study compared the one-week clinical effects of a single dose of the two drugs for grades A and B erosive esophagitis. We enrolled 175 adult patients with gastroesophageal reflux disease (GERD) and randomized them in a 1:1 ratio into a dexlansoprazole (n = 88) or esomeprazole group (n = 87) for an intention-to-treat analysis (ITT). The primary end-points were the complete symptom resolution (CSR) rates at days 1, 3, and 7. The CSRs for both groups were similar at days 1, 3 and 7. In the subgroup analysis, female patients achieved higher CSRs in the dexlansoprazole group than in the esomeprazole group at day 3 (38.3% vs 18.4%, P = 0.046). In the esomeprazole group, female sex was a negative predictive factor for CSR at post-dose day 1 [OR = -1.249 ± 0.543; 95%CI: 0.287 (0.099-0.832), P = 0.022] and day 3 [OR = -1.254 ± 0.519; 95%CI: 0.285 (0.103-0.789), P = 0.016]. This pilot study suggested that the overall CSR rates for GERD patients were similar at days 1 through 7 for both the dexlansoprazole and esomeprazole groups, although a higher CSR was observed at day 3 in female patients who received a single dose of dexlansoprazole.
Liang CM, Kuo MT, Hsu PI, Kuo CH, Tai WC, Yang SC, Wu KL, Wang HM, Yao CC, Tsai CE, Wang YK, Wang JW, Huang CF, Wu DC, Chuah SK; Taiwan Acid-Related Disease Study Group. First-week clinical responses to dexlansoprazole 60 mg and esomeprazole 40 mg for the treatment of grades A and B gastroesophageal reflux disease. World J Gastroenterol 2017; 23(47): 8395-8404 Available from: URL: http://www.wjgnet.com/1007-9327/full/v23/i47/8395.htm DOI: http://dx.doi.org/10.3748/wjg.v23.i47.8395
INTRODUCTIONGastroesophageal reflux disease (GERD) is a common gastrointestinal disorder worldwide. GERD continues to increase in incidence with the aging population and the obesity epidemic[1,2]. Based on the Montreal definition, GERD is diagnosed when the reflux of stomach contents causes troublesome symptoms[3], such as heartburn and regurgitation, as well as other atypical or extraesophageal symptoms, such as chest pain, asthma, voice hoarseness, and sleep disturbance[4]. Proton pump inhibitors (PPIs) are widely recognized as superior to other antisecretory therapies, including histamine-2 receptor antagonists (H2RA), and thus play a critical role in pharmacological therapy for the treatment of GERD[5]. Although PPIs represent the mainstay of treatment for healing erosive esophagitis,
8396 December 21, 2017|Volume 23|Issue 47|WJG|www.wjgnet.com
Liang CM et al . First-week clinical responses to dexlansoprazole and esomeprazole for reflux disease
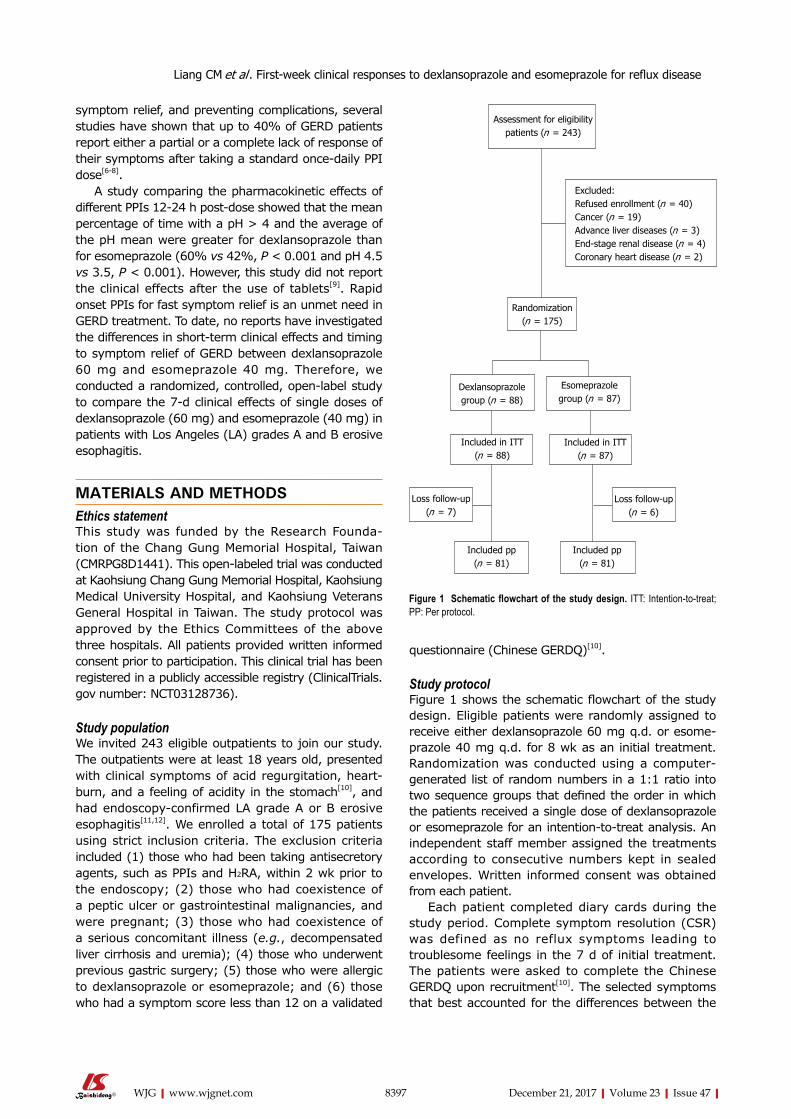
symptom relief, and preventing complications, several studies have shown that up to 40% of GERD patients report either a partial or a complete lack of response of their symptoms after taking a standard once-daily PPI dose[6-8].
A study comparing the pharmacokinetic effects of different PPIs 12-24 h post-dose showed that the mean percentage of time with a pH > 4 and the average of the pH mean were greater for dexlansoprazole than for esomeprazole (60% vs 42%, p < 0.001 and pH 4.5 vs 3.5, p < 0.001). However, this study did not report the clinical effects after the use of tablets[9]. Rapid onset PPIs for fast symptom relief is an unmet need in GERD treatment. To date, no reports have investigated the differences in short-term clinical effects and timing to symptom relief of GERD between dexlansoprazole 60 mg and esomeprazole 40 mg. Therefore, we conducted a randomized, controlled, open-label study to compare the 7-d clinical effects of single doses of dexlansoprazole (60 mg) and esomeprazole (40 mg) in patients with Los Angeles (LA) grades A and B erosive esophagitis.
MATERIALS AND METHODSEthics statementThis study was funded by the Research Founda-tion of the Chang Gung Memorial Hospital, Taiwan (CMRPG8D1441). This open-labeled trial was conducted at Kaohsiung Chang Gung Memorial Hospital, Kaohsiung Medical University Hospital, and Kaohsiung Veterans General Hospital in Taiwan. The study protocol was approved by the Ethics Committees of the above three hospitals. All patients provided written informed consent prior to participation. This clinical trial has been registered in a publicly accessible registry (ClinicalTrials.gov number: NCT03128736).
Study populationWe invited 243 eligible outpatients to join our study. The outpatients were at least 18 years old, presented with clinical symptoms of acid regurgitation, heart-burn, and a feeling of acidity in the stomach[10], and had endoscopy-confirmed LA grade A or B erosive esophagitis[11,12]. We enrolled a total of 175 patients using strict inclusion criteria. The exclusion criteria included (1) those who had been taking antisecretory agents, such as PPIs and H2RA, within 2 wk prior to the endoscopy; (2) those who had coexistence of a peptic ulcer or gastrointestinal malignancies, and were pregnant; (3) those who had coexistence of a serious concomitant illness (e.g., decompensated liver cirrhosis and uremia); (4) those who underwent previous gastric surgery; (5) those who were allergic to dexlansoprazole or esomeprazole; and (6) those who had a symptom score less than 12 on a validated
questionnaire (Chinese GERDQ)[10].
Study protocolFigure 1 shows the schematic flowchart of the study design. Eligible patients were randomly assigned to receive either dexlansoprazole 60 mg q.d. or esome-prazole 40 mg q.d. for 8 wk as an initial treatment. Randomization was conducted using a computer-generated list of random numbers in a 1:1 ratio into two sequence groups that defined the order in which the patients received a single dose of dexlansoprazole or esomeprazole for an intention-to-treat analysis. An independent staff member assigned the treatments according to consecutive numbers kept in sealed envelopes. Written informed consent was obtained from each patient.
Each patient completed diary cards during the study period. Complete symptom resolution (CSR) was defined as no reflux symptoms leading to troublesome feelings in the 7 d of initial treatment. The patients were asked to complete the Chinese GERDQ upon recruitment[10]. The selected symptoms that best accounted for the differences between the
8397 December 21, 2017|Volume 23|Issue 47|WJG|www.wjgnet.com
Excluded:Refused enrollment (n = 40)Cancer (n = 19)Advance liver diseases (n = 3)End-stage renal disease (n = 4)Coronary heart disease (n = 2)
Assessment for eligibility patients (n = 243)
Randomization (n = 175)
Dexlansoprazole group (n = 88)
Esomeprazole group (n = 87)
Included in ITT (n = 88)
Loss follow-up (n = 7)
Included pp (n = 81)
Included in ITT (n = 87)
Included pp (n = 81)
Loss follow-up (n = 6)
Figure 1 Schematic flowchart of the study design. ITT: Intention-to-treat; PP: Per protocol.
Liang CM et al . First-week clinical responses to dexlansoprazole and esomeprazole for reflux disease
8398 December 21, 2017|Volume 23|Issue 47|WJG|www.wjgnet.com
treatment phase.
Statistical analysis According to the observations in this study, the CSR rate after a once-daily PPI therapy was approximately 50% at day 7. Assuming that the two types of PPIs provided similar effects on the CSR rates with a standard deviation of less than 10%[13] , we estimated that we required at least 196 patients in each treatment group to demonstrate a 10% absolute difference in the CSR with a type Ⅰ error of 0.05 and a statistical power of 80% and assuming a 10% loss to follow-up. As a consequence of not achieving the target number, our study was a pilot study.
In this pilot study, the χ2 test with or without Yates correction for continuity and Fisher’s exact test were used when appropriate to compare the rates of CSR, symptom relapse, and esophagitis relapse between the groups. The mean reflux symptom scores between groups were compared using the Wilcoxon rank sum test. All statistical analyses were performed using the SPSS program (version 10.1, Chicago, IL, United States). A p value less than 0.05 was considered significant.
RESULTSFrom April 2014 to March 2016, two hundred and forty-three eligible symptomatic patients who had endoscopy-confirmed Los Angeles grade A or B erosive esophagitis were assessed. A total of 175 of these patients were recruited for randomization after excluding 68 patients who refused enrollment (n = 40), cancer patients (n = 19), and patients with advanced liver disease (n = 3), end-stage renal disease (n = 4), and coronary heart disease (n = 2). A total of 88 patients received the dexlansoprazole treatment, and 87 patients received the esomeprazole treatment. A total of 13 patients were lost during the follow-up period (seven in the dexlansoprazole group and 6 in the esomeprazole group) (Figure 1). The baseline characteristics of the two groups were similar in age, sex, diet habits, body mass index, and symptom scores (GERDQ) (Table 1). At days 1, 3, and 7 post-dose, the CSR rates for the dexlansoprazole vs esomeprazole groups were 25.9% vs 28.4% (p = 0.724), 33.3% vs 32.1% (p = 0.867), and 51.9% vs 48.1% (p = 0.637), respectively. The symptoms and frequencies of nighttime reflux were similar in both groups (Table 2). In the subgroup analysis based on sex, females had higher CSR rates in the dexlansoprazole group at day 3 (38.3% vs 18.4%, p = 0.046), and an increasing trend was observed at day 7 (55.3% vs 36.8%, p = 0.09) (Table 3). However, no significant differences were observed in the subgroup analyses based on age and body weight. After splitting
patients with GERD and the controls included acid regurgitation, heartburn, and a feeling of acidity in the stomach. The severity and frequency of symptoms in the questionnaire were graded on a five-point Likert scale as follows: (1) (none: no symptoms/none in the last month); (2) (mild: symptoms could be easily ignored/less than once per month); (3) (moderate: awareness of symptoms but easily tolerated/≥ once per month); (4) (severe: symptoms sufficient to interfere with normal activities/≥ once per week); and (5) (incapacitating: incapacitating symptoms with an inability to perform daily activities or requiring a day off work/≥ once daily)[10]. Blood samples were collected to measure the fasting blood sugar, serum cholesterol, and triglyceride levels. In addition, the body mass index (BMI) was calculated. Upon initial endoscopy, specimens taken from the greater curvature within 5 cm from the pylorus and from the greater curvature of the middle body were subjected to a microscopic examination for Helicobacter pylori (H. pylori) using a hematoxylin and eosin stain. No eradication therapy was administered during the study period.
Patient demographic data and follow-upA complete medical history and demographic data were obtained from each patient. The collected variables included age (< 60 or ≥ 60 years), sex, history of smoking, history of alcohol consumption (< 80 g/d or ≥ 80 g/d), coffee ingestion (< 1 cup/d or ≥ 1 cup/d), tea ingestion (< 1 cup/d or ≥ 1 cup/d), coexistence of a systemic disease (yes or no), severity of erosive esophagitis, and BMI. A gastric biopsy for histology and an H. pylori examination were also performed. The patients returned to the clinics for drug refills and evaluation of reflux symptoms after one week. Adverse events were prospectively evaluated. The adverse events were assessed according to a 4-point scale system as follows: none; mild (discomfort, annoying but not interfering with daily work); moderate (discomfort sufficient to interfere with daily work); and severe (discomfort resulting in discontinuation of PPI therapy). Compliance was checked by counting the unused medication at the completion of 7 d of treatment.
End pointsCSR was defined as no reflux symptoms sufficient to impair the quality of life before the end of the initial treatment phase. The main outcome measures were the CSR rates at days 1, 3 and 7 of the initial treatment period. All patients who started esomeprazole or dexlansoprazole as their initial treatment were included in the intent-to-treat (ITT) analysis. Patients with poor drug compliance were excluded from the per-protocol (PP) analysis. Poor compliance was defined as taking less than 80% of the total medication during the initial
Liang CM et al . First-week clinical responses to dexlansoprazole and esomeprazole for reflux disease
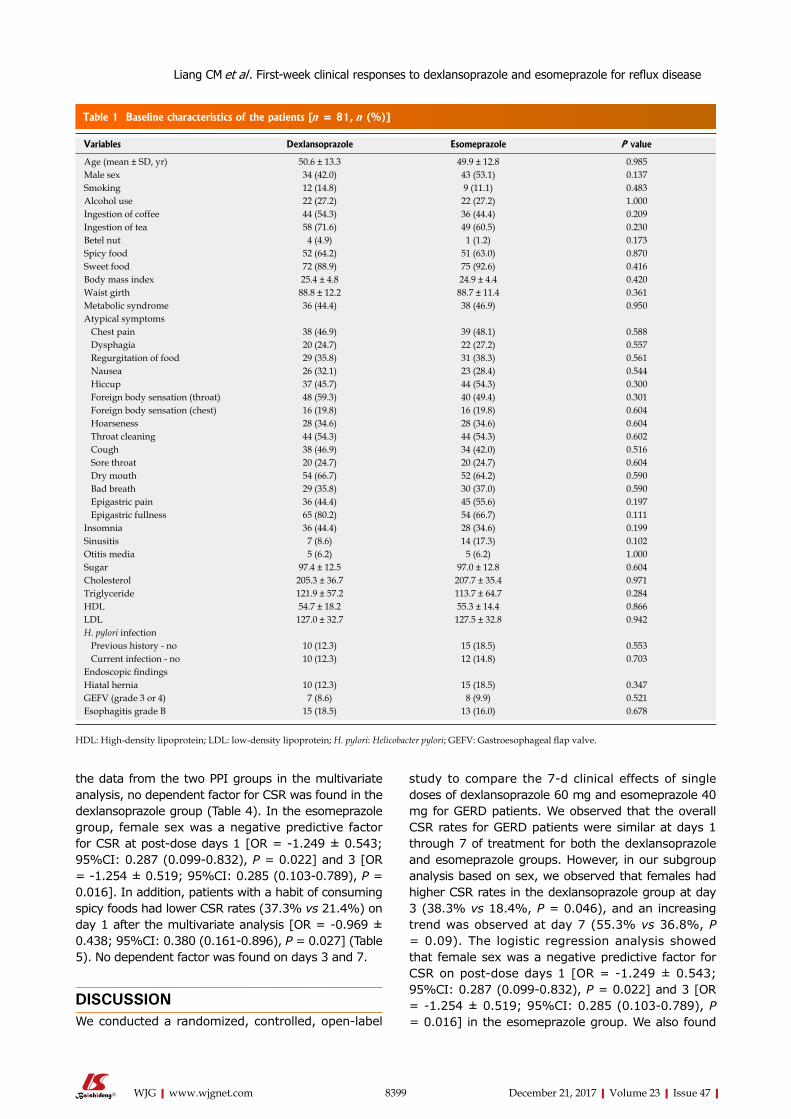
8399 December 21, 2017|Volume 23|Issue 47|WJG|www.wjgnet.com
the data from the two PPI groups in the multivariate analysis, no dependent factor for CSR was found in the dexlansoprazole group (Table 4). In the esomeprazole group, female sex was a negative predictive factor for CSR at post-dose days 1 [OR = -1.249 ± 0.543; 95%CI: 0.287 (0.099-0.832), p = 0.022] and 3 [OR = -1.254 ± 0.519; 95%CI: 0.285 (0.103-0.789), p = 0.016]. In addition, patients with a habit of consuming spicy foods had lower CSR rates (37.3% vs 21.4%) on day 1 after the multivariate analysis [OR = -0.969 ± 0.438; 95%CI: 0.380 (0.161-0.896), p = 0.027] (Table 5). No dependent factor was found on days 3 and 7.
DISCUSSIONWe conducted a randomized, controlled, open-label
study to compare the 7-d clinical effects of single doses of dexlansoprazole 60 mg and esomeprazole 40 mg for GERD patients. We observed that the overall CSR rates for GERD patients were similar at days 1 through 7 of treatment for both the dexlansoprazole and esomeprazole groups. However, in our subgroup analysis based on sex, we observed that females had higher CSR rates in the dexlansoprazole group at day 3 (38.3% vs 18.4%, p = 0.046), and an increasing trend was observed at day 7 (55.3% vs 36.8%, p = 0.09). The logistic regression analysis showed that female sex was a negative predictive factor for CSR on post-dose days 1 [OR = -1.249 ± 0.543; 95%CI: 0.287 (0.099-0.832), p = 0.022] and 3 [OR = -1.254 ± 0.519; 95%CI: 0.285 (0.103-0.789), p = 0.016] in the esomeprazole group. We also found
Table 1 Baseline characteristics of the patients [n = 81, n (%)]
Variables Dexlansoprazole Esomeprazole P value
Age (mean ± SD, yr) 50.6 ± 13.3 49.9 ± 12.8 0.985Male sex 34 (42.0) 43 (53.1) 0.137Smoking 12 (14.8) 9 (11.1) 0.483Alcohol use 22 (27.2) 22 (27.2) 1.000Ingestion of coffee 44 (54.3) 36 (44.4) 0.209Ingestion of tea 58 (71.6) 49 (60.5) 0.230Betel nut 4 (4.9) 1 (1.2) 0.173Spicy food 52 (64.2) 51 (63.0) 0.870Sweet food 72 (88.9) 75 (92.6) 0.416Body mass index 25.4 ± 4.8 24.9 ± 4.4 0.420Waist girth 88.8 ± 12.2 88.7 ± 11.4 0.361Metabolic syndrome 36 (44.4) 38 (46.9) 0.950Atypical symptoms Chest pain 38 (46.9) 39 (48.1) 0.588 Dysphagia 20 (24.7) 22 (27.2) 0.557 Regurgitation of food 29 (35.8) 31 (38.3) 0.561 Nausea 26 (32.1) 23 (28.4) 0.544 Hiccup 37 (45.7) 44 (54.3) 0.300 Foreign body sensation (throat) 48 (59.3) 40 (49.4) 0.301 Foreign body sensation (chest) 16 (19.8) 16 (19.8) 0.604 Hoarseness 28 (34.6) 28 (34.6) 0.604 Throat cleaning 44 (54.3) 44 (54.3) 0.602 Cough 38 (46.9) 34 (42.0) 0.516 Sore throat 20 (24.7) 20 (24.7) 0.604 Dry mouth 54 (66.7) 52 (64.2) 0.590 Bad breath 29 (35.8) 30 (37.0) 0.590 Epigastric pain 36 (44.4) 45 (55.6) 0.197 Epigastric fullness 65 (80.2) 54 (66.7) 0.111Insomnia 36 (44.4) 28 (34.6) 0.199Sinusitis 7 (8.6) 14 (17.3) 0.102Otitis media 5 (6.2) 5 (6.2) 1.000Sugar 97.4 ± 12.5 97.0 ± 12.8 0.604Cholesterol 205.3 ± 36.7 207.7 ± 35.4 0.971Triglyceride 121.9 ± 57.2 113.7 ± 64.7 0.284HDL 54.7 ± 18.2 55.3 ± 14.4 0.866LDL 127.0 ± 32.7 127.5 ± 32.8 0.942H. pylori infection Previous history - no 10 (12.3) 15 (18.5) 0.553 Current infection - no 10 (12.3) 12 (14.8) 0.703Endoscopic findings Hiatal hernia 10 (12.3) 15 (18.5) 0.347GEFV (grade 3 or 4) 7 (8.6) 8 (9.9) 0.521Esophagitis grade B 15 (18.5) 13 (16.0) 0.678
HDL: High-density lipoprotein; LDL: low-density lipoprotein; H. pylori: Helicobacter pylori; GEFV: Gastroesophageal flap valve.
Liang CM et al . First-week clinical responses to dexlansoprazole and esomeprazole for reflux disease
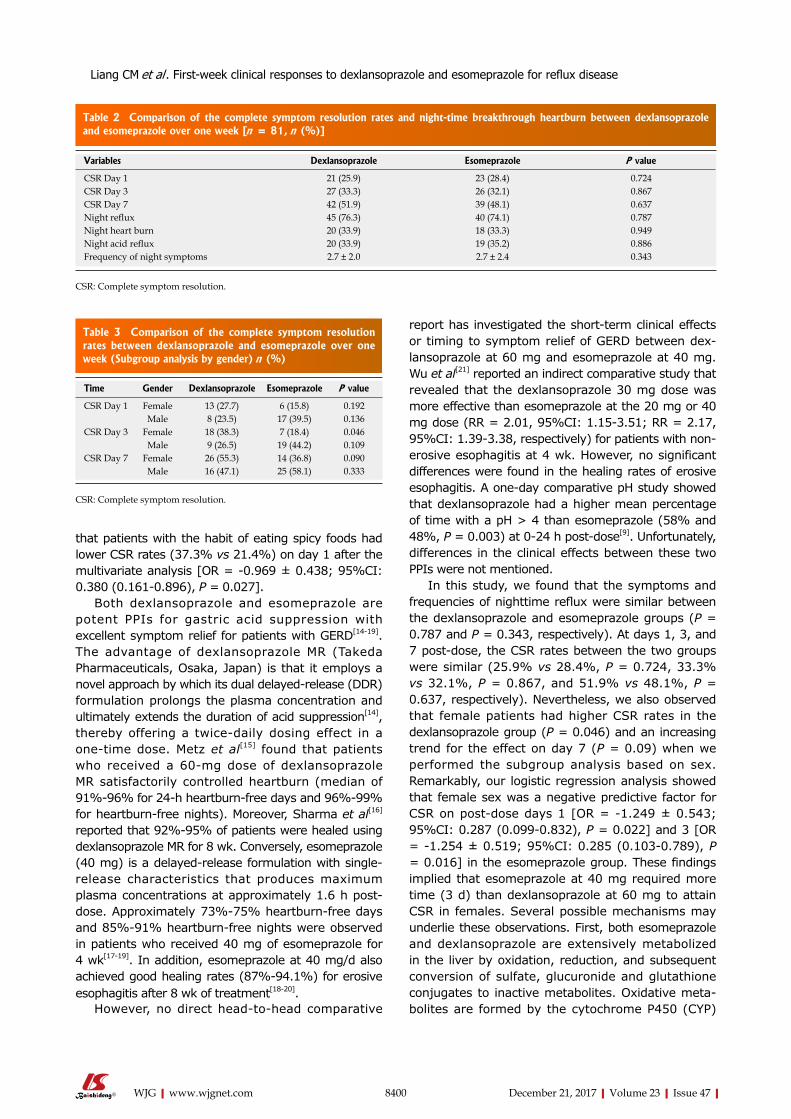
8400 December 21, 2017|Volume 23|Issue 47|WJG|www.wjgnet.com
that patients with the habit of eating spicy foods had lower CSR rates (37.3% vs 21.4%) on day 1 after the multivariate analysis [OR = -0.969 ± 0.438; 95%CI: 0.380 (0.161-0.896), p = 0.027].
Both dexlansoprazole and esomeprazole are potent PPIs for gastric acid suppression with excellent symptom relief for patients with GERD[14-19]. The advantage of dexlansoprazole MR (Takeda Pharmaceuticals, Osaka, Japan) is that it employs a novel approach by which its dual delayed-release (DDR) formulation prolongs the plasma concentration and ultimately extends the duration of acid suppression[14], thereby offering a twice-daily dosing effect in a one-time dose. Metz et al[15] found that patients who received a 60-mg dose of dexlansoprazole MR satisfactorily controlled heartburn (median of 91%-96% for 24-h heartburn-free days and 96%-99% for heartburn-free nights). Moreover, Sharma et al[16] reported that 92%-95% of patients were healed using dexlansoprazole MR for 8 wk. Conversely, esomeprazole (40 mg) is a delayed-release formulation with single-release characteristics that produces maximum plasma concentrations at approximately 1.6 h post-dose. Approximately 73%-75% heartburn-free days and 85%-91% heartburn-free nights were observed in patients who received 40 mg of esomeprazole for 4 wk[17-19]. In addition, esomeprazole at 40 mg/d also achieved good healing rates (87%-94.1%) for erosive esophagitis after 8 wk of treatment[18-20].
However, no direct head-to-head comparative
report has investigated the short-term clinical effects or timing to symptom relief of GERD between dex-lansoprazole at 60 mg and esomeprazole at 40 mg. Wu et al[21] reported an indirect comparative study that revealed that the dexlansoprazole 30 mg dose was more effective than esomeprazole at the 20 mg or 40 mg dose (RR = 2.01, 95%CI: 1.15-3.51; RR = 2.17, 95%CI: 1.39-3.38, respectively) for patients with non-erosive esophagitis at 4 wk. However, no significant differences were found in the healing rates of erosive esophagitis. A one-day comparative pH study showed that dexlansoprazole had a higher mean percentage of time with a pH > 4 than esomeprazole (58% and 48%, p = 0.003) at 0-24 h post-dose[9]. Unfortunately, differences in the clinical effects between these two PPIs were not mentioned.
In this study, we found that the symptoms and frequencies of nighttime reflux were similar between the dexlansoprazole and esomeprazole groups (p = 0.787 and p = 0.343, respectively). At days 1, 3, and 7 post-dose, the CSR rates between the two groups were similar (25.9% vs 28.4%, p = 0.724, 33.3% vs 32.1%, p = 0.867, and 51.9% vs 48.1%, p = 0.637, respectively). Nevertheless, we also observed that female patients had higher CSR rates in the dexlansoprazole group (p = 0.046) and an increasing trend for the effect on day 7 (p = 0.09) when we performed the subgroup analysis based on sex. Remarkably, our logistic regression analysis showed that female sex was a negative predictive factor for CSR on post-dose days 1 [OR = -1.249 ± 0.543; 95%CI: 0.287 (0.099-0.832), p = 0.022] and 3 [OR = -1.254 ± 0.519; 95%CI: 0.285 (0.103-0.789), p = 0.016] in the esomeprazole group. These findings implied that esomeprazole at 40 mg required more time (3 d) than dexlansoprazole at 60 mg to attain CSR in females. Several possible mechanisms may underlie these observations. First, both esomeprazole and dexlansoprazole are extensively metabolized in the liver by oxidation, reduction, and subsequent conversion of sulfate, glucuronide and glutathione conjugates to inactive metabolites. Oxidative meta-bolites are formed by the cytochrome P450 (CYP)
Table 2 Comparison of the complete symptom resolution rates and night-time breakthrough heartburn between dexlansoprazole and esomeprazole over one week [n = 81, n (%)]
Variables Dexlansoprazole Esomeprazole P value
CSR Day 1 21 (25.9) 23 (28.4) 0.724CSR Day 3 27 (33.3) 26 (32.1) 0.867CSR Day 7 42 (51.9) 39 (48.1) 0.637Night reflux 45 (76.3) 40 (74.1) 0.787Night heart burn 20 (33.9) 18 (33.3) 0.949Night acid reflux 20 (33.9) 19 (35.2) 0.886Frequency of night symptoms 2.7 ± 2.0 2.7 ± 2.4 0.343
CSR: Complete symptom resolution.
Table 3 Comparison of the complete symptom resolution rates between dexlansoprazole and esomeprazole over one week (Subgroup analysis by gender) n (%)
Time Gender Dexlansoprazole Esomeprazole P value
CSR Day 1 Female 13 (27.7) 6 (15.8) 0.192Male 8 (23.5) 17 (39.5) 0.136
CSR Day 3 Female 18 (38.3) 7 (18.4) 0.046Male 9 (26.5) 19 (44.2) 0.109
CSR Day 7 Female 26 (55.3) 14 (36.8) 0.090Male 16 (47.1) 25 (58.1) 0.333
CSR: Complete symptom resolution.
Liang CM et al . First-week clinical responses to dexlansoprazole and esomeprazole for reflux disease
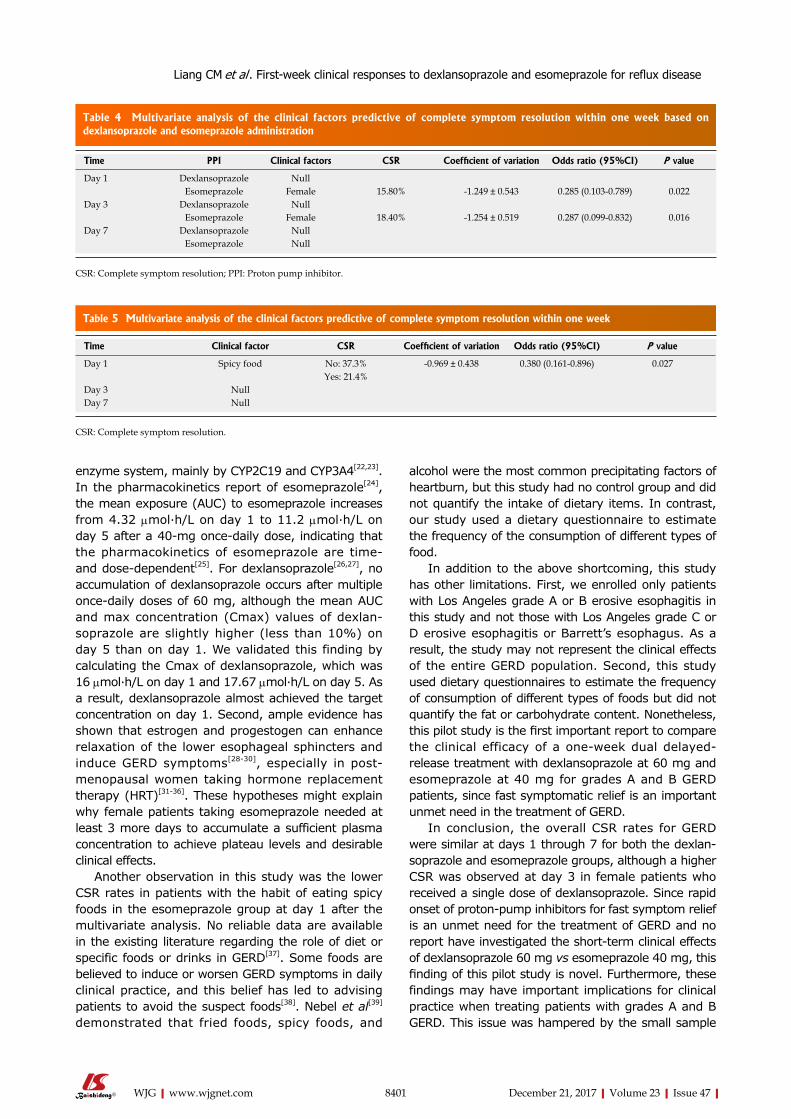
8401 December 21, 2017|Volume 23|Issue 47|WJG|www.wjgnet.com
enzyme system, mainly by CYP2C19 and CYP3A4[22,23]. In the pharmacokinetics report of esomeprazole[24], the mean exposure (AUC) to esomeprazole increases from 4.32 μmol·h/L on day 1 to 11.2 μmol·h/L on day 5 after a 40-mg once-daily dose, indicating that the pharmacokinetics of esomeprazole are time- and dose-dependent[25]. For dexlansoprazole[26,27], no accumulation of dexlansoprazole occurs after multiple once-daily doses of 60 mg, although the mean AUC and max concentration (Cmax) values of dexlan-soprazole are slightly higher (less than 10%) on day 5 than on day 1. We validated this finding by calculating the Cmax of dexlansoprazole, which was 16 μmol·h/L on day 1 and 17.67 μmol·h/L on day 5. As a result, dexlansoprazole almost achieved the target concentration on day 1. Second, ample evidence has shown that estrogen and progestogen can enhance relaxation of the lower esophageal sphincters and induce GERD symptoms[28-30], especially in post-menopausal women taking hormone replacement therapy (HRT)[31-36]. These hypotheses might explain why female patients taking esomeprazole needed at least 3 more days to accumulate a sufficient plasma concentration to achieve plateau levels and desirable clinical effects.
Another observation in this study was the lower CSR rates in patients with the habit of eating spicy foods in the esomeprazole group at day 1 after the multivariate analysis. No reliable data are available in the existing literature regarding the role of diet or specific foods or drinks in GERD[37]. Some foods are believed to induce or worsen GERD symptoms in daily clinical practice, and this belief has led to advising patients to avoid the suspect foods[38]. Nebel et al[39] demonstrated that fried foods, spicy foods, and
alcohol were the most common precipitating factors of heartburn, but this study had no control group and did not quantify the intake of dietary items. In contrast, our study used a dietary questionnaire to estimate the frequency of the consumption of different types of food.
In addition to the above shortcoming, this study has other limitations. First, we enrolled only patients with Los Angeles grade A or B erosive esophagitis in this study and not those with Los Angeles grade C or D erosive esophagitis or Barrett’s esophagus. As a result, the study may not represent the clinical effects of the entire GERD population. Second, this study used dietary questionnaires to estimate the frequency of consumption of different types of foods but did not quantify the fat or carbohydrate content. Nonetheless, this pilot study is the first important report to compare the clinical efficacy of a one-week dual delayed-release treatment with dexlansoprazole at 60 mg and esomeprazole at 40 mg for grades A and B GERD patients, since fast symptomatic relief is an important unmet need in the treatment of GERD.
In conclusion, the overall CSR rates for GERD were similar at days 1 through 7 for both the dexlan-soprazole and esomeprazole groups, although a higher CSR was observed at day 3 in female patients who received a single dose of dexlansoprazole. Since rapid onset of proton-pump inhibitors for fast symptom relief is an unmet need for the treatment of GERD and no report have investigated the short-term clinical effects of dexlansoprazole 60 mg vs esomeprazole 40 mg, this finding of this pilot study is novel. Furthermore, these findings may have important implications for clinical practice when treating patients with grades A and B GERD. This issue was hampered by the small sample
Table 4 Multivariate analysis of the clinical factors predictive of complete symptom resolution within one week based on dexlansoprazole and esomeprazole administration
Time PPI Clinical factors CSR Coefficient of variation Odds ratio (95%CI) P value
Day 1 Dexlansoprazole NullEsomeprazole Female 15.80% -1.249 ± 0.543 0.285 (0.103-0.789) 0.022
Day 3 Dexlansoprazole NullEsomeprazole Female 18.40% -1.254 ± 0.519 0.287 (0.099-0.832) 0.016
Day 7 Dexlansoprazole NullEsomeprazole Null
CSR: Complete symptom resolution; PPI: Proton pump inhibitor.
Time Clinical factor CSR Coefficient of variation Odds ratio (95%CI) P value
Day 1 Spicy food No: 37.3% -0.969 ± 0.438 0.380 (0.161-0.896) 0.027Yes: 21.4%
Day 3 NullDay 7 Null
Table 5 Multivariate analysis of the clinical factors predictive of complete symptom resolution within one week
CSR: Complete symptom resolution.
Liang CM et al . First-week clinical responses to dexlansoprazole and esomeprazole for reflux disease
8402 December 21, 2017|Volume 23|Issue 47|WJG|www.wjgnet.com
size. Thus, we believe that large-scale comparative studies are necessary.
ARTICLE HIGHLIGHTSResearch backgroundgastroesophageal reflux disease (GERD) is a common gastrointestinal disorder worldwide and continues to increase in incidence due to the aging population and obesity epidemic. Although proton pump inhibitors (PPIs) represent the mainstay of treatment for healing erosive esophagitis, symptom relief, and preventing complications, several studies have shown that up to 40% of GERD patients report either a partial or a complete lack of response of their symptoms after taking a standard once daily PPI dose. Rapid onset proton-pump inhibitors for fast symptom relief is an unmet need for GERD treatment. To date, no reports have investigated the short-term clinical effects and timing to symptom relief of gastroesophageal reflux disease (GERD) between dexlansoprazole (60 mg) and esomeprazole (40 mg). This report is the first randomized, controlled, open-label study to compare the 7-d clinical effects of single doses of dexlansoprazole at 60 mg and esomeprazole at 40 mg for LA grades A and B erosive esophagitis.
Research motivationA study comparing the pharmacokinetic effects of different PPIs 12-24 h post-dose showed that the mean percentage of time with a pH > 4 and the average of the pH mean were greater for dexlansoprazole than for esomeprazole (60% vs 42%, p < 0.001 and pH 4.5 vs 3.5, p < 0.001). However, this study did not report the clinical effects after the use of tablets. Therefore, the significance of solving these problems for future research in this field should be based on large-scale, head-to-head comparisons of these PPIs on immediate symptom relief for GERD to fulfill the unmet need in real-world treatment.
Research objectives The main objectives realized in this study motivated us to conduct this randomized, controlled, open-label study that compared the 7-d clinical effects of single doses of dexlansoprazole at 60 mg and esomeprazole at 40 mg for LA grades A and B erosive esophagitis.
Research methodsThis study was funded by the Research Foundation of the Chang Gung Memorial Hospital, Taiwan (CMRPG8D1441), and has been registered in a publicly accessible registry (ClinicalTrials.gov number: NCT03128736). We enrolled 175 adult GERD subjects and randomized them in a 1:1 ratio into two sequence groups that defined the order in which they received single doses of dexlansoprazole (n = 88) and esomeprazole (n = 87) for an ITT. Written informed consent was obtained from each patient. The patients were asked to complete the Chinese GERDQ upon recruitment. Blood samples were collected to measure the fasting blood sugar, serum cholesterol, and triglyceride levels. In addition, the BMI was calculated. A complete medical history and demographic data were obtained from each patient. The primary end points were the complete symptom resolution (CSR) rates at days 1, 3, and 7. CSR was defined as no reflux symptoms sufficient to impair the quality of life before the end of the initial treatment phase. The main outcome measures were the CSR rates at days 1, 3 and 7 of the initial treatment period. All patients starting esomeprazole or dexlansoprazole as their initial treatment were included in the ITT analysis. Patients with poor drug compliance were excluded from the PP analysis.
Research resultsThirteen patients were lost during the follow up period, resulting in the inclusion of 81 patients in each group in the PP analysis. The CSRs for both groups were similar at days 1, 3 and 7. In the subgroup analysis, female patients achieved higher CSRs in the dexlansoprazole group than in the esomeprazole group at day 3 (38.3% vs 18.4%, p = 0.046). An increasing trend toward CSR was observed at day 7 (55.3% vs 36.8%, p = 0.09). In the esomeprazole group, female sex was a negative predictive factor for CSR at post-dose days 1 (OR = -1.249 ± 0.543; 95%CI: 0.287 (0.099-0.832), p = 0.022) and 3 (OR = -1.254 ±
0.519; 95%CI: 0.285 (0.103-0.789), p = 0.016). Patients with spicy food eating habits achieved lower CSRs on day 1 (37.3% vs 21.4%, OR = -0.969 ± 0.438; 95%CI: 0.380 (0.161-0.896), p = 0.027).
Research conclusionsThe conclusion of this study was that the overall CSR rates for GERD were similar on days 1 through 7 for both the dexlansoprazole and esomeprazole groups, although a higher incidence was observed on day 3 in female patients who received a single dose of dexlansoprazole. The findings of this study are novel, since no report has investigated the short-term clinical effects of dexlansoprazole 60 mg vs esomeprazole 40 mg. This comparison represents an unmet need for GERD treatment in real-world clinical practice. The findings in this study could have important implications for clinical practice in the future for the treatment of grade A and B GERD patients. Furthermore, this study observed that female sex was a negative predictive factor for CSR at post-dose days 1 and 3 in the esomeprazole group. These findings implied that esomeprazole at 40 mg required more time (3 d) than dexlansoprazole at 60 mg to attain CSR in females. The new theories proposed suggest that these observations could be due to differences in the pharmacokinetics of esomeprazole and dexlansoprazole. Esomeprazole is time- and dose-dependent, especially at days 1 and 5. No accumulation of dexlansoprazole occurs after multiple once-daily doses at 60 mg. The authors validated this possibility by calculating the Cmax of dexlansoprazole, which was 16 μmol·h/L on day 1 and 17.67 μmol·h/L on day 5. As a result, dexlansoprazole almost achieved the target concentration on day 1. In addition, there is ample evidence that estrogen and progestogen enhance relaxation of the lower esophageal sphincters and induce GERD symptoms, especially in post-menopausal women taking hormone replacement therapy. These hypotheses could explain why female patients taking esomeprazole needed at least 3 more days to accumulate a sufficient plasma concentration to achieve plateau levels and desirable clinical effects.
Research perspectivesThe important message of this study is that rapid onset PPIs for fast symptom relief remains an unmet need for GERD treatment. However, no report has investigated the short-term clinical effects of dexlansoprazole 60 mg vs esomeprazole 40 mg. Thus, the findings of this pilot study are novel and may have important implications for clinical practice in the future for the treatment of patients with grades A and B GERD. This pilot study was hampered by the small sample size. We believe that large-scale randomized controlled trials are necessary to further fulfill the future perspectives.
REFERENCES1 El-Serag HB. Time trends of gastroesophageal reflux disease:
a systematic review. Clin Gastroenterol Hepatol 2007; 5: 17-26 [PMID: 17142109 DOI: 10.1016/j.cgh.2006.09.016]
2 El-Serag HB, Graham DY, Satia JA, Rabeneck L. Obesity is an independent risk factor for GERD symptoms and erosive esophagitis. Am J Gastroenterol 2005; 100: 1243-1250 [PMID: 15929752 DOI: 10.1111/j.1572-0241.2005.41703.x]
3 Peery AF, Dellon ES, Lund J, Crockett SD, McGowan CE, Bulsiewicz WJ, Gangarosa LM, Thiny MT, Stizenberg K, Morgan DR, Ringel Y, Kim HP, Dibonaventura MD, Carroll CF, Allen JK, Cook SF, Sandler RS, Kappelman MD, Shaheen NJ. Burden of gastrointestinal disease in the United States: 2012 update. Gastroenterology 2012; 143: 1179-1187.e1-3 [PMID: 22885331 DOI: 10.1053/j.gastro.2012.08.002]
4 Modlin IM, Moss SF. Symptom evaluation in gastroesophageal reflux disease. J Clin Gastroenterol 2008; 42: 558-563 [PMID: 18364584 DOI: 10.1097/MCG.0b013e31816207cb]
5 Kahrilas PJ, Shaheen NJ, Vaezi MF, Hiltz SW, Black E, Modlin IM, Johnson SP, Allen J, Brill JV; American Gastroenterological Association. American Gastroenterological Association Medical Position Statement on the management of gastroesophageal reflux disease. Gastroenterology 2008; 135: 1383-1391, 1391.e1-1391.e5 [PMID: 18789939 DOI: 10.1053/j.gastro.2008.08.045]
ARTICLE HIGHLIGHTS
Liang CM et al . First-week clinical responses to dexlansoprazole and esomeprazole for reflux disease
8403 December 21, 2017|Volume 23|Issue 47|WJG|www.wjgnet.com
6 Hershcovici T, Fass R. An algorithm for diagnosis and treatment of refractory GERD. Best Pract Res Clin Gastroenterol 2010; 24: 923-936 [PMID: 21126704 DOI: 10.1016/j.bpg.2010.10.004]
7 Fass R. Proton pump inhibitor failure--what are the therapeutic options? Am J Gastroenterol 2009; 104 Suppl 2: S33-S38 [PMID: 19262545 DOI: 10.1038/ajg.2009.50]
8 Revicki DA, Wood M, Maton PN, Sorensen S. The impact of gastroesophageal reflux disease on health-related quality of life. Am J Med 1998; 104: 252-258 [PMID: 9552088]
9 Kukulka M, Eisenberg C, Nudurupati S. Comparator pH study to evaluate the single-dose pharmacodynamics of dual delayed-release dexlansoprazole 60 mg and delayed-release esomeprazole 40 mg. Clin Exp Gastroenterol 2011; 4: 213-220 [PMID: 22016582 DOI: 10.2147/CEG.S24063]
10 Wong WM, Lai KC, Lam KF, Hui WM, Hu WH, Lam CL, Xia HH, Huang JQ, Chan CK, Lam SK, Wong BC. Prevalence, clinical spectrum and health care utilization of gastro-oesophageal reflux disease in a Chinese population: a population-based study. Aliment Pharmacol Ther 2003; 18: 595-604 [PMID: 12969086]
11 Lundell LR, Dent J, Bennett JR, Blum AL, Armstrong D, Galmiche JP, Johnson F, Hongo M, Richter JE, Spechler SJ, Tytgat GN, Wallin L. Endoscopic assessment of oesophagitis: clinical and functional correlates and further validation of the Los Angeles classification. Gut 1999; 45: 172-180 [PMID: 10403727]
12 Vakil N, van Zanten SV, Kahrilas P, Dent J, Jones R; Global Consensus Group. The Montreal definition and classification of gastroesophageal reflux disease: a global evidence-based consensus. Am J Gastroenterol 2006; 101: 1900-1920; quiz 1943 [PMID: 16928254 DOI: 10.1111/j.1572-0241.2006.00630.x]
13 Jones B, Jarvis P, Lewis JA, Ebbutt AF. Trials to assess equivalence: the importance of rigorous methods. BMJ 1996; 313: 36-39 [PMID: 8664772]
14 Katz PO, Gerson LB, Vela MF. Guidelines for the diagnosis and management of gastroesophageal reflux disease. Am J Gastroenterol 2013; 108: 308-328; quiz 329 [PMID: 23419381 DOI: 10.1038/ajg.2012.444]
15 Metz DC, Howden CW, Perez MC, Larsen L, O’Neil J, Atkinson SN. Clinical trial: dexlansoprazole MR, a proton pump inhibitor with dual delayed-release technology, effectively controls symptoms and prevents relapse in patients with healed erosive oesophagitis. Aliment Pharmacol Ther 2009; 29: 742-754 [PMID: 19210298 DOI: 10.1111/j.1365-2036.2009.03954.x]
16 Sharma P, Shaheen NJ, Perez MC, Pilmer BL, Lee M, Atkinson SN, Peura D. Clinical trials: healing of erosive oesophagitis with dexlansoprazole MR, a proton pump inhibitor with a novel dual delayed-release formulation--results from two randomized controlled studies. Aliment Pharmacol Ther 2009; 29: 731-741 [PMID: 19183157 DOI: 10.1111/j.1365-2036.2009.03933.x]
17 Richter JE, Kahrilas PJ, Johanson J, Maton P, Breiter JR, Hwang C, Marino V, Hamelin B, Levine JG; Esomeprazole Study Investigators. Efficacy and safety of esomeprazole compared with omeprazole in GERD patients with erosive esophagitis: a randomized controlled trial. Am J Gastroenterol 2001; 96: 656-665 [PMID: 11280530 DOI: 10.1111/j.1572-0241.2001.3600_b.x]
18 Kahrilas PJ, Falk GW, Johnson DA, Schmitt C, Collins DW, Whipple J, D’Amico D, Hamelin B, Joelsson B. Esomeprazole improves healing and symptom resolution as compared with omeprazole in reflux oesophagitis patients: a randomized controlled trial. The Esomeprazole Study Investigators. Aliment Pharmacol Ther 2000; 14: 1249-1258 [PMID: 11012468]
19 Schmitt C, Lightdale CJ, Hwang C, Hamelin B. A multicenter, randomized, double-blind, 8-week comparative trial of standard doses of esomeprazole (40 mg) and omeprazole (20 mg) for the treatment of erosive esophagitis. Dig Dis Sci 2006; 51: 844-850 [PMID: 16642422 DOI: 10.1007/s10620-005-9062-4]
20 Hsu PI, Lu CL, Wu DC, Kuo CH, Kao SS, Chang CC, Tai WC, Lai KH, Chen WC, Wang HM, Cheng JS, Tsai TJ, Chuah SK. Eight weeks of esomeprazole therapy reduces symptom relapse,
compared with 4 weeks, in patients with Los Angeles grade A or B erosive esophagitis. Clin Gastroenterol Hepatol 2015; 13: 859-66.e1 [PMID: 25245625 DOI: 10.1016/j.cgh.2014.09.033]
21 Wu MS, Tan SC, Xiong T. Indirect comparison of randomised controlled trials: comparative efficacy of dexlansoprazole vs. esomeprazole in the treatment of gastro-oesophageal reflux disease. Aliment Pharmacol Ther 2013; 38: 190-201 [PMID: 23718547 DOI: 10.1111/apt.12349]
22 Stedman CA, Barclay ML. Review article: comparison of the pharmacokinetics, acid suppression and efficacy of proton pump inhibitors. Aliment Pharmacol Ther 2000; 14: 963-978 [PMID: 10930890]
23 Shin JM, Kim N. Pharmacokinetics and pharmacodynamics of the proton pump inhibitors. J Neurogastroenterol Motil 2013; 19: 25-35 [PMID: 23350044 DOI: 10.5056/jnm.2013.19.1.25]
24 Junghard O, Hassan-Alin M, Hasselgren G. The effect of the area under the plasma concentration vs time curve and the maximum plasma concentration of esomeprazole on intragastric pH. Eur J Clin Pharmacol 2002; 58: 453-458 [PMID: 12389067 DOI: 10.1007/s00228-002-0502-1]
25 Andersson T , Röhss K, Bredberg E, Hassan-Alin M. Pharmacokinetics and pharmacodynamics of esomeprazole, the S-isomer of omeprazole. Aliment Pharmacol Ther 2001; 15: 1563-1569 [PMID: 11563995]
26 Metz DC, Vakily M, Dixit T, Mulford D. Review article: dual delayed release formulation of dexlansoprazole MR, a novel approach to overcome the limitations of conventional single release proton pump inhibitor therapy. Aliment Pharmacol Ther 2009; 29: 928-937 [PMID: 19298580 DOI: 10.1111/j.1365-2036.2009.03984.x]
27 Behm BW, Peura DA. Dexlansoprazole MR for the management of gastroesophageal reflux disease. Expert Rev Gastroenterol Hepatol 2011; 5: 439-445 [PMID: 21780890 DOI: 10.1586/egh.11.37]
28 Smout AJPM. Gastro-oesophageal reflux disease. Pathogenesis and Diagnosis. In Evolving concepts in Gastrointestinal Motility. Edited by Champion MC, Orr WC. Oxford, England: Blackwell Science; 1996: 46-63
29 Van Thiel DH, Gavaler JS, Stremple J. Lower esophageal sphincter pressure in women using sequential oral contraceptives. Gastroenterology 1976; 71: 232-234 [PMID: 939383]
30 Bruce LA, Behsudi FM. Progesterone effects on three regional gastrointestinal tissues. Life Sci 1979; 25: 729-734 [PMID: 491852]
31 Menon S, Prew S, Parkes G, Evans S, Smith L, Nightingale P, Trudgill N. Do differences in female sex hormone levels contribute to gastro-oesophageal reflux disease? Eur J Gastroenterol Hepatol 2013; 25: 772-777 [PMID: 23470358 DOI: 10.1097/MEG.0b013e32835fbaab]
32 Nordenstedt H, Zheng Z, Cameron AJ, Ye W, Pedersen NL, Lagergren J. Postmenopausal hormone therapy as a risk factor for gastroesophageal reflux symptoms among female twins. Gastroenterology 2008; 134: 921-928 [PMID: 18294635 DOI: 10.1053/j.gastro.2008.01.009]
33 Zheng Z, Margolis KL, Liu S, Tinker LF, Ye W; Women’s Health Initiative Investigators. Effects of estrogen with and without progestin and obesity on symptomatic gastroesophageal reflux. Gastroenterology 2008; 135: 72-81 [PMID: 18502208 DOI: 10.1053/j.gastro.2008.03.039]
34 Jacobson BC, Moy B, Colditz GA, Fuchs CS. Postmenopausal hormone use and symptoms of gastroesophageal reflux. Arch Intern Med 2008; 168: 1798-1804 [PMID: 18779468 DOI: 10.1001/archinte.168.16.1798]
35 Alvarez-Sánchez A, Rey E, Achem SR, Díaz-Rubio M. Does progesterone fluctuation across the menstrual cycle predispose to gastroesophageal reflux? Am J Gastroenterol 1999; 94: 1468-1471 [PMID: 10364009 DOI: 10.1111/j.1572-0241.1999.01128.x]
36 Close H, Mason JM, Wilson D, Hungin AP. Hormone replacement therapy is associated with gastro-oesophageal reflux disease: a retrospective cohort study. BMC Gastroenterol 2012; 12: 56 [PMID:
Liang CM et al . First-week clinical responses to dexlansoprazole and esomeprazole for reflux disease
8404 December 21, 2017|Volume 23|Issue 47|WJG|www.wjgnet.com
22642788 DOI: 10.1186/1471-230X-12-56]37 Festi D, Scaioli E, Baldi F, Vestito A, Pasqui F, Di Biase
AR, Colecchia A. Body weight, lifestyle, dietary habits and gastroesophageal reflux disease. World J Gastroenterol 2009; 15: 1690-1701 [PMID: 19360912 DOI: 10.3748/wjg.15.1690]
38 DeVault KR, Castell DO; American College of Gastroenterology.
Updated guidelines for the diagnosis and treatment of gastroesophageal reflux disease. Am J Gastroenterol 2005; 100: 190-200 [PMID: 15654800 DOI: 10.1111/j.1572-0241.2005.41217.x]
39 Nebel OT, Fornes MF, Castell DO. Symptomatic gastroesophageal reflux: incidence and precipitating factors. Am J Dig Dis 1976; 21: 953-956 [PMID: 984016]
P- Reviewer: Cicala M, Skrypnyk IN, Thomopoulos KC S- Editor: Ma YJ L- Editor: Ma JY E- Editor: Huang Y
Liang CM et al . First-week clinical responses to dexlansoprazole and esomeprazole for reflux disease
Henry Córdova, Cristina Sánchez-Montes, Gloria Fernández-Esparrach, Endoscopy Unit. Institut de Malalties Digestives, Hospital Clínic, IDIBAPS, CIBERehd, Universitat de Barcelona, Barcelona 08036, Spain
Lidia Argüello, Digestive Endoscopy Unit, Digestive Diseases Department, Gastrointestinal Endoscopy Research Group, IIS, La Fe Polytechnic University Hospital, Valencia 46026, Spain
Carme Loras, Xavier Andújar Murcia, Hospital Universitari Mútua de Terrassa, CIBERehd, Terrassa 08221, Spain
Antonio Naranjo Rodríguez, Hospital Reina Sofía, Córdoba 14004, Spain
Faust Riu Pons, Hospital Del Mar, Barcelona 08003, Spain
Joan B Gornals, Hospital Universitari de Bellvitge, IDIBELL, Universitat de Barcelona, Hospitalet de Llobregat, Barcelona 08907, Spain
David Nicolás-Pérez, Hospital Universitario de Canarias, Santa Cruz de Tenerife 38320, Spain
Luis Hernández, Hospital Santos Reyes, Aranda de Duero, Burgos 09400, Spain
Santos Santolaria, Hospital San Jorge, Huesca 22004, Spain
Carles Leal, Consorci Hospitalari de Vic, Universitat de Vic, Vic 08500, Spain
Carles Pons, Hospital de Viladecans, Viladecans, Barcelona 08840, Spain
Enrique Pérez-Cuadrado-Robles, Hospital Morales Meseguer,
Murcia 30008, Spain.
Orlando García-Bosch, Hospital Moisès Broggi, Sant Joan Despí, Barcelona 08970, Spain
Michel Papo Berger, Hospital Joan XXIII, Tarragona 43005, Spain
José Luis Ulla Rocha, Complejo Hospitalario de Pontevedra, Pontevedra 36164, Spain
ORCID number: Henry Córdova (0000-0002-6636-6764); Lidia Argüello (0000-0002-3041-033X); Carme Loras (0000-0002-4035-3316); Antonio Naranjo Rodríguez (0000 -0002-4347-2249); Faust Riu Pons (0000-0002-6576-4226); Joan B Gornals (0000-0001-8857-3556); David Nicolás-Pérez (0000-0002-6775-710X); Xavier Andújar Murcia ( 0 0 0 0 - 0 0 0 2 - 3 1 6 2 - 9 7 8 X ) ; L u i s H e r n á n d e z ( 0 0 0 0 -0002-9175-4312); Santos Santolaria (0000-0003-4414 -2361); Carles Leal (0000-0003-0941-2661); Carles Pons (0000-0002-0652-8776); Enrique Pérez-Cuadrado-Robles (0000-0001-8254-7453); Orlando García-Bosch (0000-0002 -9202-7272); Michel Papo Berger (0000-0002-3388-1110); José Luis Ulla Rocha (0000-0002-2349-1987); Cristina Sánchez-Montes (0000-0002-9692-9521); Gloria Fernández-Esparrach (0000-0002-3378-3940).
Author contributions: Córdova H and Fernández-Esparrach G designed research and wrote the paper; Córdova H, Argüello L, Loras C, Naranjo Rodríguez A, Riu Pons F, Gornals JB, Nicolás-Pérez D, Andújar Murcia X, Hernández L, Santolaria S, Leal C, Pons C, Pérez-Cuadrado-Robles E, García-Bosch O, Papo Berger M, Ulla Rocha JL and Fernández-Esparrach G performed research; Córdova H, Sánchez-Montes C and Fernández-Esparrach G contributed new reagents or analytic tools; Córdova H, Sánchez-Montes C and Fernández-Esparrach G analyzed data.
8405 December 21, 2017|Volume 23|Issue 47|WJG|www.wjgnet.com
ORIGINAL ARTICLE
rate of adverse events of gastroduodenal snare polypectomy for non-flat polyp is low: A prospective and multicenter study
Observational Study
Henry Córdova, Lidia Argüello, Carme Loras, Antonio Naranjo Rodríguez, Faust Riu Pons, Joan B Gornals, David Nicolás-Pérez, Xavier Andújar Murcia, Luis Hernández, Santos Santolaria, Carles Leal, Carles Pons, Enrique Pérez-Cuadrado-Robles, Orlando García-Bosch, Michel Papo Berger, José Luis Ulla Rocha, Cristina Sánchez-Montes, Gloria Fernández-Esparrach
Submit a Manuscript: http://www.f6publishing.com
DOI: 10.3748/wjg.v23.i47.8405
World J Gastroenterol 2017 December 21; 23(47): 8405-8414
ISSN 1007-9327 (print) ISSN 2219-2840 (online)
procedure.
RESULTS308 patients were included and a single polypectomy was performed in 205. Only 36 (11.7%) were on prior anticoagulant therapy. Mean polyp size was 15 ± 8.9 mm (5-60) and in 294 cases (95.4%) were located in the stomach. Hemorrhage prophylaxis was performed in 219 (71.1%) patients. Nine patients presented AEs (2.9%), and 6 of them were bleeding (n = 6, 1.9%) (in 5 out of 6 AE, different types of endoscopic treatment were performed). Other 24 hemorrhagic episodes could be managed without any change in the outcome of the endoscopy and, consequently, were considered incidents. We did not find any independent risk factor of bleeding.
CONCLUSIONGastroduodenal polypectomy using prophylactic measures has a rate of AEs small enough to consider this procedure a safe and effective method for polyp resection independently of the polyp size and location.
Key words: Polypectomy; Bleeding; Adverse events; Protruded polyps; Gastroduodenal; Foregut
© The Author(s) 2017. Published by Baishideng Publishing Group Inc. All rights reserved.
Core tip: The safety of polypectomy in the upper gastroduodenal tract is controversial because the reported rate in retrospective studies is higher than in colonic polypectomy but results come mainly from retrospective studies and they do not use the same standardized nomenclature and definitions for adverse events. To our knowledge, this is the first study using the ASGE lexicon for reporting adverse events of gastro-duodenal polypectomy and shows an acceptable low rate, confirming the safety of this procedure.
Córdova H, Argüello L, Loras C, Naranjo Rodríguez A, Riu Pons F, Gornals JB, Nicolás-Pérez D, Andújar Murcia X, Hernández L, Santolaria S, Leal C, Pons C, Pérez-Cuadrado-Robles E, García-Bosch O, Papo Berger M, Ulla Rocha JL, Sánchez-Montes C, Fernández-Esparrach G. Rate of adverse events of gastroduodenal snare polypectomy for non-flat polyp is low: A prospective and multicenter study. World J Gastroenterol 2017; 23(47): 8405-8414 Available from: URL: http://www.wjgnet.com/1007-9327/full/v23/i47/8405.htm DOI: http://dx.doi.org/10.3748/wjg.v23.i47.8405
INTRODUCTIONGastric polyps are found in around 3%-6% of patients undergoing upper endoscopy[1,2]. According to these sources, the most common gastric polyps are the hyperplastic and fundic gland types (70%-90%)
Institutional review board statement: The study was reviewed and approved by the Hospital Clinic Institutional Review Board.
Informed consent statement: All involved persons (subjects or legally authorized representative) gave their written informed consent prior to study inclusion.
Conflict-of-interest statement: None of the authors of this manuscript, Henry Córdova, Lidia Argüello, Carme Loras, Antonio Naranjo Rodríguez, Faust Riu Pons, Joan B Gornals, David Nicolás-Pérez, Xavier Andújar Murcia, Luis Hernández, Santos Santolaria, Carles Leal, Carles Pons, Enrique Pérez-Cuadrado-Robles, Orlando García-Bosch, Michel Papo Berger, José Luis Ulla Rocha, Cristina Sánchez-Montes, Gloria Fernández-Esparrach have any conflicts of interest or financial ties to disclose.
Data sharing statement: Technical appendix, statistical code, and dataset available from the corresponding author at [email protected].
Open-Access: This article is an open-access article which was selected by an in-house editor and fully peer-reviewed by external reviewers. It is distributed in accordance with the Creative Commons Attribution Non Commercial (CC BY-NC 4.0) license, which permits others to distribute, remix, adapt, build upon this work non-commercially, and license their derivative works on different terms, provided the original work is properly cited and the use is non-commercial. See: http://creativecommons.org/licenses/by-nc/4.0/
Manuscript source: Unsolicited manuscript
Correspondence to: Gloria Fernández-Esparrach, MD, PhD, Endoscopy Unit. Institut de Malalties Digestives, Hospital Clínic, Villarroel 170, Barcelona 08036, Spain. [email protected]: +34-93-2275400Fax: +34-93-2279387
Received: September 1, 2017Peer-review started: September 3, 2017First decision: September 20, 2017Revised: October 3, 2017Accepted: October 26, 2017Article in press: October 26, 2017Published online: December 21, 2017
AbstractAIMTo evaluate the rate of adverse events (AEs) during consecutive gastric and duodenal polypectomies in several Spanish centers.
METHODSPolypectomies of protruded gastric or duodenal polyps ≥ 5 mm using hot snare were prospectively included. Prophylactic measures of hemorrhage were allowed in predefined cases. AEs were defined and graded according to the lexicon recommended by the American Society for Gastrointestinal Endoscopy. Patients were followed for 48 h, one week and 1 mo after the
8406 December 21, 2017|Volume 23|Issue 47|WJG|www.wjgnet.com
Córdova H et al . Adverse events of gastroduodenal polypectomy
followed by adenomas, with a variable prevalence among countries depending on the use of proton pump inhibitor drugs (PPI) or the prevalence of Helicobacter pylori (H. pylori) infection. In western countries, where H. pylori infection is low and PPI use is very common, fundic gland polyps are seen more frequently[2,3]. However, two retrospective Spanish series showed that in Spain the most frequent were hyperplastic polyps (50.9%), followed by fundic gland polyps (7.4%), adenomas (3%), and adenocarcinomas (1.9%)[4,5].
Sporadic duodenal polyps are uncommon with a prevalence of 0.3% to 4.6%[6,7]. Whereas multiple, small polyps in the duodenal bulb are benign a substantial number of them located in the descending duodenum are adenomas[7]. Duodenal adenomas can occur sporadically or more commonly in patients with Familial Adenomatous Polyposis, occurring in 50% to 100%[8]. Most of gastric and duodenal polyps are asymptomatic and are incidentally found at endoscopy performed for unrelated reasons.
Gastric and duodenal polyps have a risk of mali-gnant transformation that depends on histologic type. The risk of gastric polyps undergoing malignant transformation is near 2% for hyperplasic polyps, 5% for tubular adenoma, and up to 30% for tubulovillous adenoma[9-11]. However, polyp histology cannot be reliably distinguished by endoscopic appearance[12,13] and biopsy is not always representative of the entire polyp[14]. Therefore, polypectomy is warranted if feasible and clinically appropriate; this is supported by current guidelines[15,16].
Endoscopic polypectomy has become standard in the management of most polyps in the gastrointestinal tract. Gastric and duodenal polyps can be safely removed with snare depending on size, location and presence of a stalk. However, bleeding is the most common adverse event (AE) of snare polypectomy, with an incidence of 6% to 7.2% in gastric polyps and up to 13.9% in duodenal polyps[17,18]. Although these figures are higher than those reported in colonic polypectomies (0.3%-6%)[19,20], the available evidence is limited by the fact that it is often based on retrospective studies performed at a single center or with a small number of patients and the nomenclature and definitions used for AEs are different. The need for standardized nomenclature and agreement on definitions for AEs was addressed by the American Society for Gastrointestinal Endoscopy (ASGE) in a workshop celebrated in 2008 and whose recommendations were published in 2010[21]. Moreover, there are few studies that specifically evaluate risk factors and the efficacy of different hemostatic techniques in the prevention and control of post-polypectomy bleeding.
The aim of this study was to estimate the incidence and risk factors of several types of AEs associated with gastroduodenal polypectomy in several Spanish hospitals using a standardized lexicon specific for
endoscopic procedures.
MATERIALS AND METHODSPatientsThis is a prospective multicenter study performed at 15 Spanish hospitals. Patients with gastric and duodenal polyps that underwent endoscopic polypectomy were eligible for inclusion in the study. All patients included in the study had been previously diagnosed of gastric polyps and subsequently underwent a second endoscopy to perform the polypectomy. Therefore, when the physicians were aware that they had to perform the polypectomy, they previously asked the patient for consent to participate in the study. Inclusion criteria were: (1) protruded gastric or duodenal polyps ≥ 5 mm; and (2) polypectomy performed using an electrocautery snare. The exclusion criteria were: (1) age under 18 years; (2) prothrombin time < 50% or INR > 1.5 and platelet count < 50000 (blood test were only mandatory in patients with anticoagulation therapy or with conditions associated with coagulation disturbances); (3) aspirin intake during the previous 3 d; (4) clopidogrel intake during the previous 7 d; and (5) conditions associated with coagulation disturbances. The study protocol was approved by the Ethics Committee of each hospital and informed consent was obtained from all patients.
Three days before the procedure, oral anti-coagulants were replaced by subcutaneous low-molecular weight heparin. The patients were guided to reintroduce them 24-h after the procedure (the dose depended on the value of the previous INR value). Aspirin and clopidogrel were also reintroduced at usual doses.
Snare polypectomy was performed according to the conventional method encircling the polyp with a poly-pectomy snare and applying electrocautery current[22]. Patients were placed in the left lateral decubitus position and sedation was administered according to the endoscopist or anaesthesiologist’s preference.
Variables were recorded in database templates. The database included demographic characteristics, medical and drug history, indication of upper endo-scopy, endoscopists’ expertise (staff or fellow), morphological features and localization of polyps, technical information about the polypectomy pro-cedure (bloc/peacemeal resection, cautery setting, hemorrhage prophylaxis technique), type of sedation, unexpected events and measures for correcting them, and patient outcome. Polyp size was determined endoscopically using an open biopsy forceps (7 mm in length, Boston Scientific Large Capacity with Needle Biopsy Forceps 2.8 mm). In cases with multiple polyps, the biggest one’s characteristics were recorded.
Definition of AEsAEs were defined, following the lexicon of ASGE
8407 December 21, 2017|Volume 23|Issue 47|WJG|www.wjgnet.com
Córdova H et al . Adverse events of gastroduodenal polypectomy
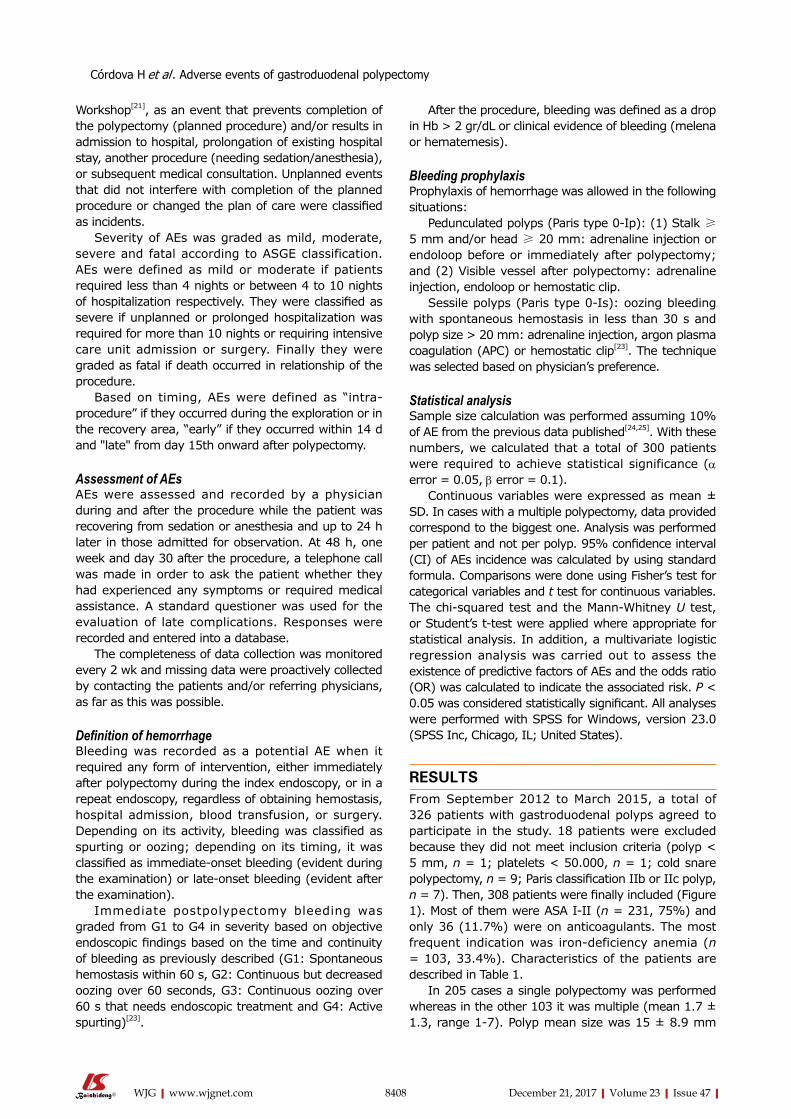
8408 December 21, 2017|Volume 23|Issue 47|WJG|www.wjgnet.com
After the procedure, bleeding was defined as a drop in Hb > 2 gr/dL or clinical evidence of bleeding (melena or hematemesis).
Bleeding prophylaxisProphylaxis of hemorrhage was allowed in the following situations:
Pedunculated polyps (Paris type 0-Ip): (1) Stalk ≥ 5 mm and/or head ≥ 20 mm: adrenaline injection or endoloop before or immediately after polypectomy; and (2) Visible vessel after polypectomy: adrenaline injection, endoloop or hemostatic clip.
Sessile polyps (Paris type 0-Is): oozing bleeding with spontaneous hemostasis in less than 30 s and polyp size > 20 mm: adrenaline injection, argon plasma coagulation (APC) or hemostatic clip[23]. The technique was selected based on physician’s preference.
Statistical analysisSample size calculation was performed assuming 10% of AE from the previous data published[24,25]. With these numbers, we calculated that a total of 300 patients were required to achieve statistical significance (α error = 0.05, β error = 0.1).
Continuous variables were expressed as mean ± SD. In cases with a multiple polypectomy, data provided correspond to the biggest one. Analysis was performed per patient and not per polyp. 95% confidence interval (CI) of AEs incidence was calculated by using standard formula. Comparisons were done using Fisher’s test for categorical variables and t test for continuous variables. The chi-squared test and the Mann-Whitney U test, or Student’s t-test were applied where appropriate for statistical analysis. In addition, a multivariate logistic regression analysis was carried out to assess the existence of predictive factors of AEs and the odds ratio (OR) was calculated to indicate the associated risk. P < 0.05 was considered statistically significant. All analyses were performed with SPSS for Windows, version 23.0 (SPSS Inc, Chicago, IL; United States).
RESULTSFrom September 2012 to March 2015, a total of 326 patients with gastroduodenal polyps agreed to participate in the study. 18 patients were excluded because they did not meet inclusion criteria (polyp < 5 mm, n = 1; platelets < 50.000, n = 1; cold snare polypectomy, n = 9; Paris classification IIb or IIc polyp, n = 7). Then, 308 patients were finally included (Figure 1). Most of them were ASA I-II (n = 231, 75%) and only 36 (11.7%) were on anticoagulants. The most frequent indication was iron-deficiency anemia (n = 103, 33.4%). Characteristics of the patients are described in Table 1.
In 205 cases a single polypectomy was performed whereas in the other 103 it was multiple (mean 1.7 ± 1.3, range 1-7). Polyp mean size was 15 ± 8.9 mm
Workshop[21], as an event that prevents completion of the polypectomy (planned procedure) and/or results in admission to hospital, prolongation of existing hospital stay, another procedure (needing sedation/anesthesia), or subsequent medical consultation. Unplanned events that did not interfere with completion of the planned procedure or changed the plan of care were classified as incidents.
Severity of AEs was graded as mild, moderate, severe and fatal according to ASGE classification. AEs were defined as mild or moderate if patients required less than 4 nights or between 4 to 10 nights of hospitalization respectively. They were classified as severe if unplanned or prolonged hospitalization was required for more than 10 nights or requiring intensive care unit admission or surgery. Finally they were graded as fatal if death occurred in relationship of the procedure.
Based on timing, AEs were defined as “intra-procedure” if they occurred during the exploration or in the recovery area, “early” if they occurred within 14 d and "late" from day 15th onward after polypectomy.
Assessment of AEsAEs were assessed and recorded by a physician during and after the procedure while the patient was recovering from sedation or anesthesia and up to 24 h later in those admitted for observation. At 48 h, one week and day 30 after the procedure, a telephone call was made in order to ask the patient whether they had experienced any symptoms or required medical assistance. A standard questioner was used for the evaluation of late complications. Responses were recorded and entered into a database.
The completeness of data collection was monitored every 2 wk and missing data were proactively collected by contacting the patients and/or referring physicians, as far as this was possible.
Definition of hemorrhage Bleeding was recorded as a potential AE when it required any form of intervention, either immediately after polypectomy during the index endoscopy, or in a repeat endoscopy, regardless of obtaining hemostasis, hospital admission, blood transfusion, or surgery. Depending on its activity, bleeding was classified as spurting or oozing; depending on its timing, it was classified as immediate-onset bleeding (evident during the examination) or late-onset bleeding (evident after the examination).
Immediate postpolypectomy bleeding was graded from G1 to G4 in severity based on objective endoscopic findings based on the time and continuity of bleeding as previously described (G1: Spontaneous hemostasis within 60 s, G2: Continuous but decreased oozing over 60 seconds, G3: Continuous oozing over 60 s that needs endoscopic treatment and G4: Active spurting)[23].
Córdova H et al . Adverse events of gastroduodenal polypectomy
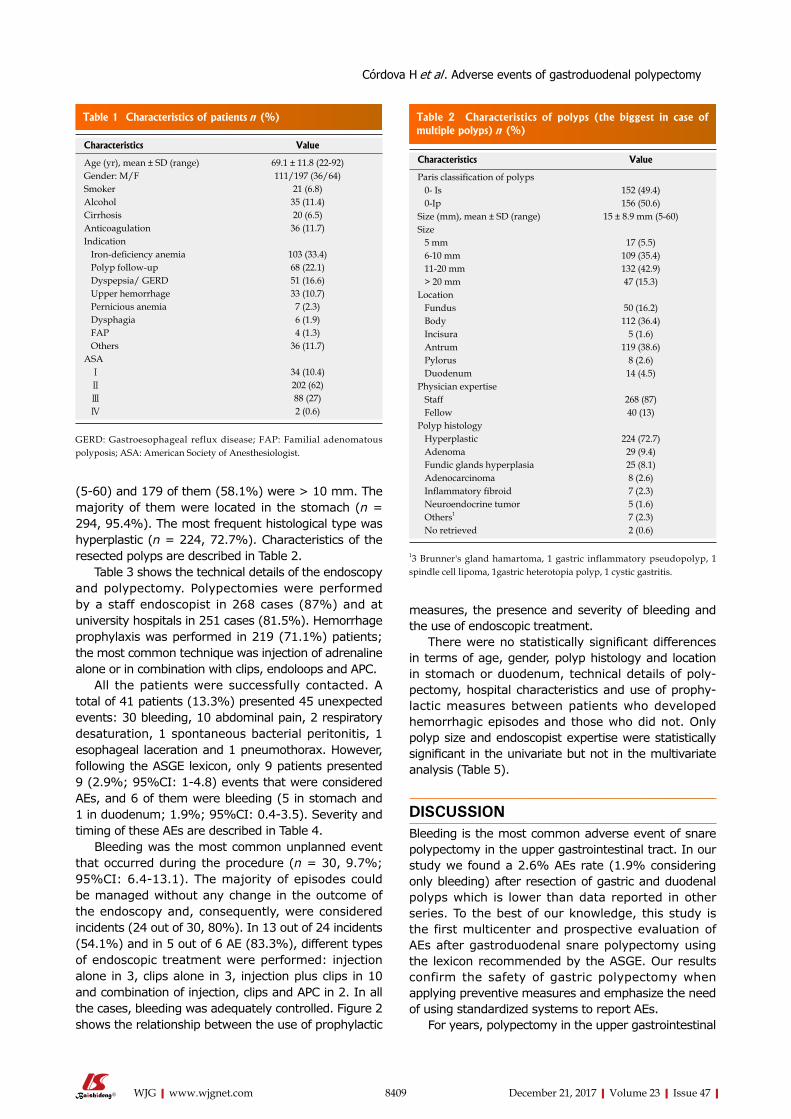
8409 December 21, 2017|Volume 23|Issue 47|WJG|www.wjgnet.com
(5-60) and 179 of them (58.1%) were > 10 mm. The majority of them were located in the stomach (n = 294, 95.4%). The most frequent histological type was hyperplastic (n = 224, 72.7%). Characteristics of the resected polyps are described in Table 2.
Table 3 shows the technical details of the endoscopy and polypectomy. Polypectomies were performed by a staff endoscopist in 268 cases (87%) and at university hospitals in 251 cases (81.5%). Hemorrhage prophylaxis was performed in 219 (71.1%) patients; the most common technique was injection of adrenaline alone or in combination with clips, endoloops and APC.
All the patients were successfully contacted. A total of 41 patients (13.3%) presented 45 unexpected events: 30 bleeding, 10 abdominal pain, 2 respiratory desaturation, 1 spontaneous bacterial peritonitis, 1 esophageal laceration and 1 pneumothorax. However, following the ASGE lexicon, only 9 patients presented 9 (2.9%; 95%CI: 1-4.8) events that were considered AEs, and 6 of them were bleeding (5 in stomach and 1 in duodenum; 1.9%; 95%CI: 0.4-3.5). Severity and timing of these AEs are described in Table 4.
Bleeding was the most common unplanned event that occurred during the procedure (n = 30, 9.7%; 95%CI: 6.4-13.1). The majority of episodes could be managed without any change in the outcome of the endoscopy and, consequently, were considered incidents (24 out of 30, 80%). In 13 out of 24 incidents (54.1%) and in 5 out of 6 AE (83.3%), different types of endoscopic treatment were performed: injection alone in 3, clips alone in 3, injection plus clips in 10 and combination of injection, clips and APC in 2. In all the cases, bleeding was adequately controlled. Figure 2 shows the relationship between the use of prophylactic
measures, the presence and severity of bleeding and the use of endoscopic treatment.
There were no statistically significant differences in terms of age, gender, polyp histology and location in stomach or duodenum, technical details of poly-pectomy, hospital characteristics and use of prophy-lactic measures between patients who developed hemorrhagic episodes and those who did not. Only polyp size and endoscopist expertise were statistically significant in the univariate but not in the multivariate analysis (Table 5).
DISCUSSIONBleeding is the most common adverse event of snare polypectomy in the upper gastrointestinal tract. In our study we found a 2.6% AEs rate (1.9% considering only bleeding) after resection of gastric and duodenal polyps which is lower than data reported in other series. To the best of our knowledge, this study is the first multicenter and prospective evaluation of AEs after gastroduodenal snare polypectomy using the lexicon recommended by the ASGE. Our results confirm the safety of gastric polypectomy when applying preventive measures and emphasize the need of using standardized systems to report AEs.
For years, polypectomy in the upper gastrointestinal
Table 1 Characteristics of patients n (%)
Characteristics Value
Age (yr), mean ± SD (range) 69.1 ± 11.8 (22-92)Gender: M/F 111/197 (36/64)Smoker 21 (6.8)Alcohol 35 (11.4)Cirrhosis 20 (6.5)Anticoagulation 36 (11.7)Indication Iron-deficiency anemia 103 (33.4) Polyp follow-up 68 (22.1) Dyspepsia/ GERD 51 (16.6) Upper hemorrhage 33 (10.7) Pernicious anemia 7 (2.3) Dysphagia 6 (1.9) FAP 4 (1.3) Others 36 (11.7)ASA Ⅰ 34 (10.4) Ⅱ 202 (62) Ⅲ 88 (27) Ⅳ 2 (0.6)
GERD: Gastroesophageal reflux disease; FAP: Familial adenomatous polyposis; ASA: American Society of Anesthesiologist.
Table 2 Characteristics of polyps (the biggest in case of multiple polyps) n (%)
Characteristics Value
Paris classification of polyps 0- Is 152 (49.4) 0-Ip 156 (50.6)Size (mm), mean ± SD (range) 15 ± 8.9 mm (5-60)Size 5 mm 17 (5.5) 6-10 mm 109 (35.4) 11-20 mm 132 (42.9) > 20 mm 47 (15.3)Location Fundus 50 (16.2) Body 112 (36.4) Incisura 5 (1.6) Antrum 119 (38.6) Pylorus 8 (2.6) Duodenum 14 (4.5)Physician expertise Staff 268 (87) Fellow 40 (13)Polyp histology Hyperplastic 224 (72.7) Adenoma 29 (9.4) Fundic glands hyperplasia 25 (8.1) Adenocarcinoma 8 (2.6) Inflammatory fibroid 7 (2.3) Neuroendocrine tumor 5 (1.6) Others1 7 (2.3) No retrieved 2 (0.6)
13 Brunner's gland hamartoma, 1 gastric inflammatory pseudopolyp, 1 spindle cell lipoma, 1gastric heterotopia polyp, 1 cystic gastritis.
Córdova H et al . Adverse events of gastroduodenal polypectomy
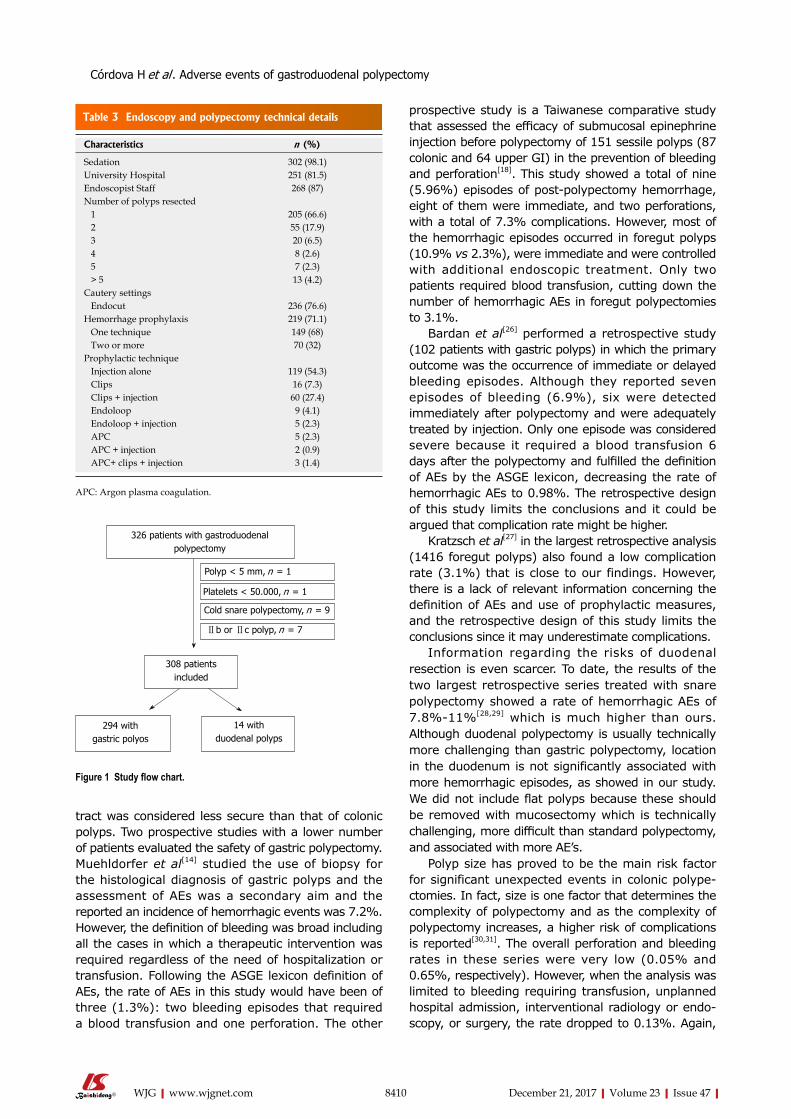
8410 December 21, 2017|Volume 23|Issue 47|WJG|www.wjgnet.com
tract was considered less secure than that of colonic polyps. Two prospective studies with a lower number of patients evaluated the safety of gastric polypectomy. Muehldorfer et al[14] studied the use of biopsy for the histological diagnosis of gastric polyps and the assessment of AEs was a secondary aim and the reported an incidence of hemorrhagic events was 7.2%. However, the definition of bleeding was broad including all the cases in which a therapeutic intervention was required regardless of the need of hospitalization or transfusion. Following the ASGE lexicon definition of AEs, the rate of AEs in this study would have been of three (1.3%): two bleeding episodes that required a blood transfusion and one perforation. The other
prospective study is a Taiwanese comparative study that assessed the efficacy of submucosal epinephrine injection before polypectomy of 151 sessile polyps (87 colonic and 64 upper GI) in the prevention of bleeding and perforation[18]. This study showed a total of nine (5.96%) episodes of post-polypectomy hemorrhage, eight of them were immediate, and two perforations, with a total of 7.3% complications. However, most of the hemorrhagic episodes occurred in foregut polyps (10.9% vs 2.3%), were immediate and were controlled with additional endoscopic treatment. Only two patients required blood transfusion, cutting down the number of hemorrhagic AEs in foregut polypectomies to 3.1%.
Bardan et al[26] performed a retrospective study (102 patients with gastric polyps) in which the primary outcome was the occurrence of immediate or delayed bleeding episodes. Although they reported seven episodes of bleeding (6.9%), six were detected immediately after polypectomy and were adequately treated by injection. Only one episode was considered severe because it required a blood transfusion 6 days after the polypectomy and fulfilled the definition of AEs by the ASGE lexicon, decreasing the rate of hemorrhagic AEs to 0.98%. The retrospective design of this study limits the conclusions and it could be argued that complication rate might be higher.
Kratzsch et al[27] in the largest retrospective analysis (1416 foregut polyps) also found a low complication rate (3.1%) that is close to our findings. However, there is a lack of relevant information concerning the definition of AEs and use of prophylactic measures, and the retrospective design of this study limits the conclusions since it may underestimate complications.
Information regarding the risks of duodenal resection is even scarcer. To date, the results of the two largest retrospective series treated with snare polypectomy showed a rate of hemorrhagic AEs of 7.8%-11%[28,29] which is much higher than ours. Although duodenal polypectomy is usually technically more challenging than gastric polypectomy, location in the duodenum is not significantly associated with more hemorrhagic episodes, as showed in our study. We did not include flat polyps because these should be removed with mucosectomy which is technically challenging, more difficult than standard polypectomy, and associated with more AE’s.
Polyp size has proved to be the main risk factor for significant unexpected events in colonic polype-ctomies. In fact, size is one factor that determines the complexity of polypectomy and as the complexity of polypectomy increases, a higher risk of complications is reported[30,31]. The overall perforation and bleeding rates in these series were very low (0.05% and 0.65%, respectively). However, when the analysis was limited to bleeding requiring transfusion, unplanned hospital admission, interventional radiology or endo-scopy, or surgery, the rate dropped to 0.13%. Again,
Table 3 Endoscopy and polypectomy technical details
Characteristics n (%)
Sedation 302 (98.1)University Hospital 251 (81.5)Endoscopist Staff 268 (87)Number of polyps resected 1 205 (66.6) 2 55 (17.9) 3 20 (6.5) 4 8 (2.6) 5 7 (2.3) > 5 13 (4.2)Cautery settings Endocut 236 (76.6)Hemorrhage prophylaxis 219 (71.1) One technique 149 (68) Two or more 70 (32)Prophylactic technique Injection alone 119 (54.3) Clips 16 (7.3) Clips + injection 60 (27.4) Endoloop 9 (4.1) Endoloop + injection 5 (2.3) APC 5 (2.3) APC + injection 2 (0.9) APC+ clips + injection 3 (1.4)
APC: Argon plasma coagulation.
326 patients with gastroduodenal polypectomy
Polyp < 5 mm, n = 1
Platelets < 50.000, n = 1
Cold snare polypectomy, n = 9
Ⅱb or Ⅱc polyp, n = 7
308 patients included
294 with gastric polyos
14 with duodenal polyps
Figure 1 Study flow chart.
Córdova H et al . Adverse events of gastroduodenal polypectomy
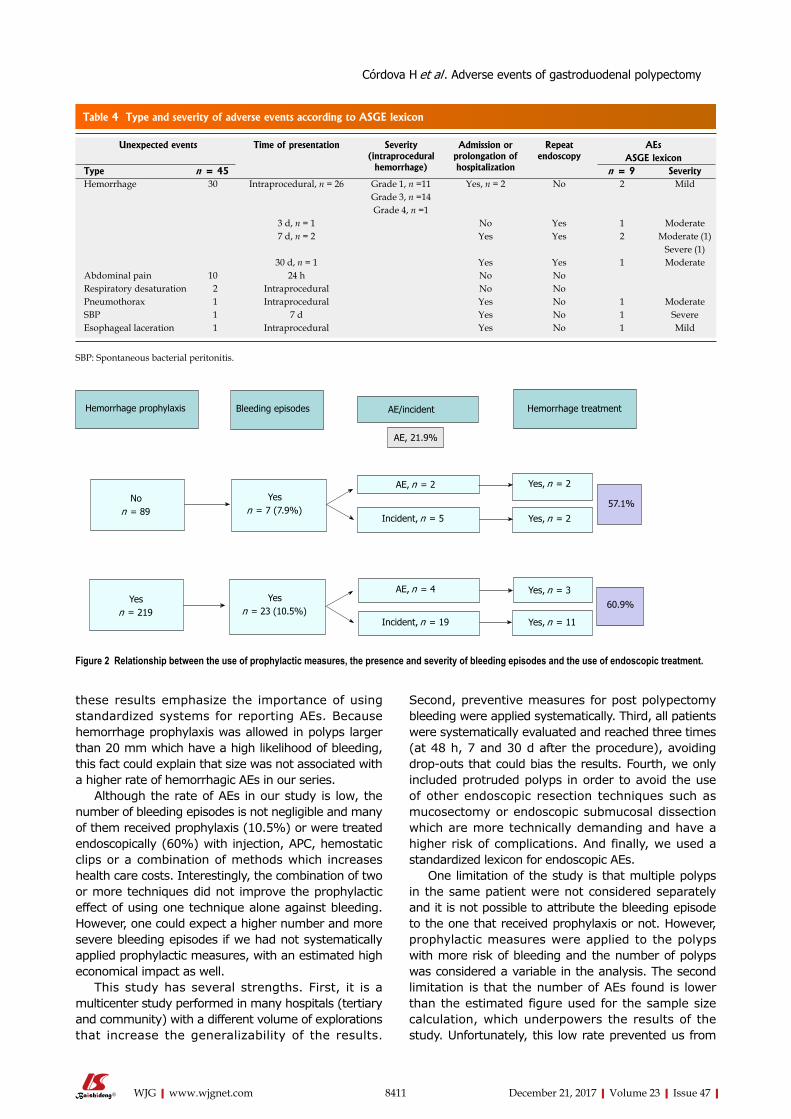
8411 December 21, 2017|Volume 23|Issue 47|WJG|www.wjgnet.com
these results emphasize the importance of using standardized systems for reporting AEs. Because hemorrhage prophylaxis was allowed in polyps larger than 20 mm which have a high likelihood of bleeding, this fact could explain that size was not associated with a higher rate of hemorrhagic AEs in our series.
Although the rate of AEs in our study is low, the number of bleeding episodes is not negligible and many of them received prophylaxis (10.5%) or were treated endoscopically (60%) with injection, APC, hemostatic clips or a combination of methods which increases health care costs. Interestingly, the combination of two or more techniques did not improve the prophylactic effect of using one technique alone against bleeding. However, one could expect a higher number and more severe bleeding episodes if we had not systematically applied prophylactic measures, with an estimated high economical impact as well.
This study has several strengths. First, it is a multicenter study performed in many hospitals (tertiary and community) with a different volume of explorations that increase the generalizability of the results.
Second, preventive measures for post polypectomy bleeding were applied systematically. Third, all patients were systematically evaluated and reached three times (at 48 h, 7 and 30 d after the procedure), avoiding drop-outs that could bias the results. Fourth, we only included protruded polyps in order to avoid the use of other endoscopic resection techniques such as mucosectomy or endoscopic submucosal dissection which are more technically demanding and have a higher risk of complications. And finally, we used a standardized lexicon for endoscopic AEs.
One limitation of the study is that multiple polyps in the same patient were not considered separately and it is not possible to attribute the bleeding episode to the one that received prophylaxis or not. However, prophylactic measures were applied to the polyps with more risk of bleeding and the number of polyps was considered a variable in the analysis. The second limitation is that the number of AEs found is lower than the estimated figure used for the sample size calculation, which underpowers the results of the study. Unfortunately, this low rate prevented us from
Table 4 Type and severity of adverse events according to ASGE lexicon
Unexpected events Time of presentation Severity (intraprocedural
hemorrhage)
Admission or prolongation of hospitalization
Repeat endoscopy
AEsASGE lexicon
Type n = 45 n = 9 SeverityHemorrhage 30 Intraprocedural, n = 26 Grade 1, n =11 Yes, n = 2 No 2 Mild
Grade 3, n =14Grade 4, n =1
3 d, n = 1 No Yes 1 Moderate7 d, n = 2 Yes Yes 2 Moderate (1)
Severe (1)30 d, n = 1 Yes Yes 1 Moderate
Abdominal pain 10 24 h No NoRespiratory desaturation 2 Intraprocedural No NoPneumothorax 1 Intraprocedural Yes No 1 ModerateSBP 1 7 d Yes No 1 SevereEsophageal laceration 1 Intraprocedural Yes No 1 Mild
SBP: Spontaneous bacterial peritonitis.
Hemorrhage prophylaxis Bleeding episodes AE/incident Hemorrhage treatment
Non = 89
Yesn = 7 (7.9%)
AE, n = 2
Incident, n = 5
Yes, n = 2
57.1%
60.9%
Yes, n = 2
Yes, n = 3
Yes, n = 11
Yesn = 219
Yesn = 23 (10.5%)
AE, n = 4
Incident, n = 19
AE, 21.9%
Figure 2 Relationship between the use of prophylactic measures, the presence and severity of bleeding episodes and the use of endoscopic treatment.
Córdova H et al . Adverse events of gastroduodenal polypectomy
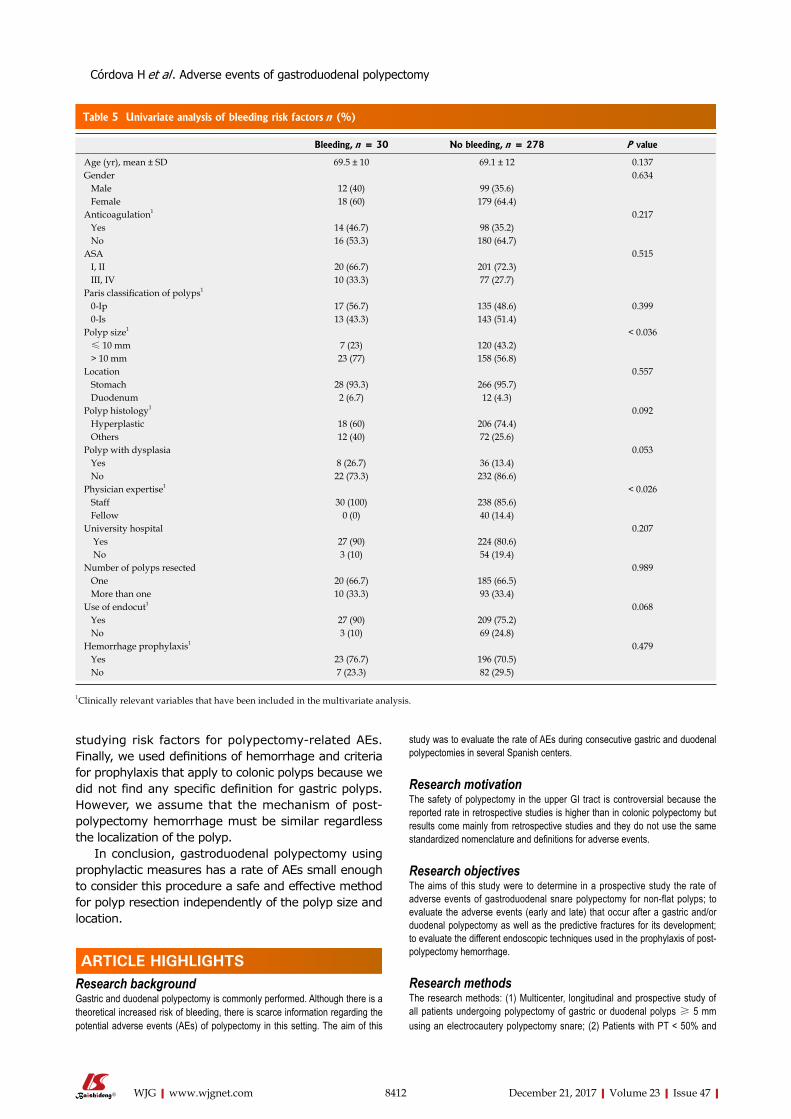
8412 December 21, 2017|Volume 23|Issue 47|WJG|www.wjgnet.com
studying risk factors for polypectomy-related AEs. Finally, we used definitions of hemorrhage and criteria for prophylaxis that apply to colonic polyps because we did not find any specific definition for gastric polyps. However, we assume that the mechanism of post-polypectomy hemorrhage must be similar regardless the localization of the polyp.
In conclusion, gastroduodenal polypectomy using prophylactic measures has a rate of AEs small enough to consider this procedure a safe and effective method for polyp resection independently of the polyp size and location.
ARTICLE HIGHLIGHTSResearch backgroundGastric and duodenal polypectomy is commonly performed. Although there is a theoretical increased risk of bleeding, there is scarce information regarding the potential adverse events (AEs) of polypectomy in this setting. The aim of this
study was to evaluate the rate of AEs during consecutive gastric and duodenal polypectomies in several Spanish centers.
Research motivationThe safety of polypectomy in the upper GI tract is controversial because the reported rate in retrospective studies is higher than in colonic polypectomy but results come mainly from retrospective studies and they do not use the same standardized nomenclature and definitions for adverse events.
Research objectives The aims of this study were to determine in a prospective study the rate of adverse events of gastroduodenal snare polypectomy for non-flat polyps; to evaluate the adverse events (early and late) that occur after a gastric and/or duodenal polypectomy as well as the predictive fractures for its development; to evaluate the different endoscopic techniques used in the prophylaxis of post-polypectomy hemorrhage.
Research methodsThe research methods: (1) Multicenter, longitudinal and prospective study of all patients undergoing polypectomy of gastric or duodenal polyps ≥ 5 mm using an electrocautery polypectomy snare; (2) Patients with PT < 50% and
Table 5 Univariate analysis of bleeding risk factors n (%)
Bleeding, n = 30 No bleeding, n = 278 P value
Age (yr), mean ± SD 69.5 ± 10 69.1 ± 12 0.137Gender 0.634 Male 12 (40) 99 (35.6) Female 18 (60) 179 (64.4)Anticoagulation1 0.217 Yes 14 (46.7) 98 (35.2) No 16 (53.3) 180 (64.7)ASA 0.515 I, II 20 (66.7) 201 (72.3) III, IV 10 (33.3) 77 (27.7)Paris classification of polyps1
0-Ip 17 (56.7) 135 (48.6) 0.399 0-Is 13 (43.3) 143 (51.4)Polyp size1 < 0.036 ≤ 10 mm 7 (23) 120 (43.2) > 10 mm 23 (77) 158 (56.8)Location 0.557 Stomach 28 (93.3) 266 (95.7) Duodenum 2 (6.7) 12 (4.3)Polyp histology1 0.092 Hyperplastic 18 (60) 206 (74.4) Others 12 (40) 72 (25.6)Polyp with dysplasia 0.053 Yes 8 (26.7) 36 (13.4) No 22 (73.3) 232 (86.6)Physician expertise1 < 0.026 Staff 30 (100) 238 (85.6) Fellow 0 (0) 40 (14.4)University hospital 0.207 Yes 27 (90) 224 (80.6) No 3 (10) 54 (19.4)Number of polyps resected 0.989 One 20 (66.7) 185 (66.5) More than one 10 (33.3) 93 (33.4)Use of endocut1 0.068 Yes 27 (90) 209 (75.2) No 3 (10) 69 (24.8)Hemorrhage prophylaxis1 0.479 Yes 23 (76.7) 196 (70.5) No 7 (23.3) 82 (29.5)
1Clinically relevant variables that have been included in the multivariate analysis.
ARTICLE HIGHLIGHTS
Córdova H et al . Adverse events of gastroduodenal polypectomy
8413 December 21, 2017|Volume 23|Issue 47|WJG|www.wjgnet.com
platelets < 50000 or clopidogrel in the 7 d prior to endoscopy were excluded; (3) Prophylactic measures of hemorrhage were allowed in certain predefined cases; (4) Intraprocedural hemorrhage was defined as bleeding that lasts more than 30 seconds and severity was graded from 1 to 4; (5) Late hemorrhage was defined as melena or hematochezia since discharge from endoscopy unit and up to 30 d. (6) Patients were followed during 30 d with serial phone calls; and (7) Predictive factors of complications were analyzed
Research results308 patients were included and a single polypectomy was performed in 205. Hemorrhage prophylaxis was performed in 219 (71.1%) patients. Nine patients presented AEs (2.9%), and 6 of them were bleeding (n = 6, 1.9%) (In 5 out of 6 AEs, different types of endoscopic treatment were performed). Other 24 hemorrhagic episodes could be managed without any change in the outcome of the endoscopy and, consequently, were considered incidents. We did not find any independent risk factor of bleeding.
Research conclusionsThe rate of adverse events of gastroduodenal snare polypectomy for non-flat polyp is low. However, the number of bleeding episodes is not negligible and many of them receive prophylaxis or are treated endoscopically with injection, APC, hemostatic clips or a combination of methods which increases health care costs. Prophylactic measures do not reduce the risk of hemorrhage. To our knowledge, this is the first study using the ASGE lexicon for reporting adverse events of gastro-duodenal polypectomy and shows an acceptable low rate, confirming the safety of this procedure. Because AEs of gastroduodenal polypectomies are low, there is no need of using more than one prophylactic endoscopic technique (clips, sclerosis, APC…) with the consequent reduction of costs.
Research perspectivesGastroduodenal polypectomy using prophylactic measures has a rate of AEs small enough to consider this procedure a safe and effective method for polyp resection independently of the polyp size and location. The future research direction is to compare the use of prophylaxis or not before polypectomy in gastric polyps and the best method would be a prospective, comparative and randomized study.
REFERENCES1 Turner JR, Odze RD. Polyps of the stomach. In Odze RD,
Goldblum JR, Crawford JM (eds). Surgical Pathology of the GI Tract, Liver, Biliary Tract, and Pancreas , 1st edn Saunders, Elsevier: Philadelphia, 2004: 267-294
2 Carmack SW, Genta RM, Schuler CM, Saboorian MH. The current spectrum of gastric polyps: a 1-year national study of over 120,000 patients. Am J Gastroenterol 2009; 104: 1524-1532 [PMID: 19491866 DOI: 10.1038/ajg.2009.139]
3 Jalving M, Koornstra JJ, Wesseling J, Boezen HM, DE Jong S, Kleibeuker JH. Increased risk of fundic gland polyps during long-term proton pump inhibitor therapy. Aliment Pharmacol Ther 2006; 24: 1341-1348 [PMID: 17059515 DOI: 10.1111/j.1365-2036.2006.03127.x]
4 Macenlle García R, Bassante Flores LA, Fernández Seara J. [Gastric epithelial polyps. A retrospective study 1995-2000]. Rev Clin Esp 2003; 203: 368-372 [PMID: 12855115 DOI: 10.1157/13049433]
5 García-Alonso FJ, Martín-Mateos RM, González Martín JA, Foruny JR, Vázquez-Sequeiros E, Boixeda de Miquel D. Gastric polyps: analysis of endoscopic and histological features in our center. Rev Esp Enferm Dig 2011; 103: 416-420 [PMID: 21867351 DOI: 10.4321/S1130-01082011000800005]
6 Culver EL, McIntyre AS. Sporadic duodenal polyps: classification, investigation, and management. Endoscopy 2011; 43: 144-155 [PMID: 21271466 DOI: 10.1055/s-0030-1255925]
7 Jepsen JM, Persson M, Jakobsen NO, Christiansen T, Skoubo-Kristensen E, Funch-Jensen P, Kruse A, Thommesen P. Prospective study of prevalence and endoscopic and histopathologic characteristics of duodenal polyps in patients submitted to upper
endoscopy. Scand J Gastroenterol 1994; 29: 483-487 [PMID: 8079103 DOI: 10.3109/00365529409092458]
8 Bleau BL, Gostout CJ. Endoscopic treatment of ampullary adenomas in familial adenomatous polyposis. J Clin Gastroenterol 1996; 22: 237-241 [PMID: 8724267 DOI: 10.1097/00004836-199604000-00021]
9 Schmitz JM, Stolte M. Gastric polyps as precancerous lesions. Gastrointest Endosc Clin N Am 1997; 7: 29-46 [PMID: 8995111]
10 Choudhry U, Boyce HW Jr, Coppola D. Proton pump inhibitor-associated gastric polyps: a retrospective analysis of their frequency, and endoscopic, histologic, and ultrastructural characteristics. Am J Clin Pathol 1998; 110: 615-621 [PMID: 9802346 DOI: 10.1093/ajcp/110.5.615]
11 Cristallini EG, Ascani S, Bolis GB. Association between histologic type of polyp and carcinoma in the stomach. Gastrointest Endosc 1992; 38: 481-484 [PMID: 1511825 DOI: 10.1016/S0016-5107(92)70481-7]
12 Ginsberg GG, Al-Kawas FH, Fleischer DE, Reilly HF, Benjamin SB. Gastric polyps: relationship of size and histology to cancer risk. Am J Gastroenterol 1996; 91: 714-717 [PMID: 8677935]
13 Fujiwara Y, Arakawa T, Fukuda T, Kimura S, Uchida T, Obata A, Higuchi K, Wakasa K, Sakurai M, Kobayashi K. Diagnosis of borderline adenomas of the stomach by endoscopic mucosal resection. Endoscopy 1996; 28: 425-430 [PMID: 8858231 DOI: 10.1055/s-2007-1005505]
14 Muehldorfer SM, Stolte M, Martus P, Hahn EG, Ell C; Multicenter Study Group “Gastric Polyps”. Diagnostic accuracy of forceps biopsy versus polypectomy for gastric polyps: a prospective multicentre study. Gut 2002; 50: 465-470 [PMID: 11889063 DOI: 10.1136/gut.50.4.465]
15 Hirota WK, Zuckerman MJ, Adler DG, Davila RE, Egan J, Leighton JA, Qureshi WA, Rajan E, Fanelli R, Wheeler-Harbaugh J, Baron TH, Faigel DO; Standards of Practice Committee, American Society for Gastrointestinal Endoscopy. ASGE guideline: the role of endoscopy in the surveillance of premalignant conditions of the upper GI tract. Gastrointest Endosc 2006; 63: 570-580 [PMID: 16564854 DOI: 10.1016/j.gie.2006.02.004]
16 Carmack SW, Genta RM, Graham DY, Lauwers GY. Management of gastric polyps: a pathology-based guide for gastroenterologists. Nat Rev Gastroenterol Hepatol 2009; 6: 331-341 [PMID: 19421245 DOI: 10.1038/nrgastro.2009.70]
17 Lanza FL, Graham DY, Nelson RS, Godines R, McKechnie JC. Endoscopic upper gastrointestinal polypectomy. Report of 73 polypectomies in 63 patients. Am J Gastroenterol 1981; 75: 345-348 [PMID: 7270528]
18 Hsieh YH , Lin HJ, Tseng GY, Perng CL, Li AF, Chang FY, Lee SD. Is submucosal epinephrine injection necessary before polypectomy? A prospective, comparative study. Hepatogastroenterology 2001; 48: 1379-1382 [PMID: 11677969]
19 Van Gossum A, Cozzoli A, Adler M, Taton G, Cremer M. Colonoscopic snare polypectomy: analysis of 1485 resections comparing two types of current. Gastrointest Endosc 1992; 38: 472-475 [PMID: 1511824 DOI: 10.1016/S0016-5107(92)70479-9]
20 Mühldorfer SM, Kekos G, Hahn EG, Ell C. Complications of therapeutic gastrointestinal endoscopy. Endoscopy 1992; 24: 276-283 [PMID: 1612041 DOI: 10.1055/s-2007-1010482]
21 Cotton PB, Eisen GM, Aabakken L, Baron TH, Hutter MM, Jacobson BC, Mergener K, Nemcek A Jr, Petersen BT, Petrini JL, Pike IM, Rabeneck L, Romagnuolo J, Vargo JJ. A lexicon for endoscopic adverse events: report of an ASGE workshop. Gastrointest Endosc 2010; 71: 446-454 [PMID: 20189503 DOI: 10.1016/j.gie.2009.10.027]
22 Fyock CJ, Draganov PV. Colonoscopic polypectomy and associated techniques. World J Gastroenterol 2010; 16: 3630-3637 [PMID: 20677334 DOI: 10.3748/wjg.v16.i29.3630]
23 Kim HS, Kim TI, Kim WH, Kim YH, Kim HJ, Yang SK, Myung SJ, Byeon JS, Lee MS, Chung IK, Jung SA, Jeen YT, Choi JH, Choi KY, Choi H, Han DS, Song JS. Risk factors for immediate postpolypectomy bleeding of the colon: a multicenter study. Am J Gastroenterol 2006; 101: 1333-1341 [PMID: 16771958 DOI:
Córdova H et al . Adverse events of gastroduodenal polypectomy
8414 December 21, 2017|Volume 23|Issue 47|WJG|www.wjgnet.com
10.1111/j.1572-0241.2006.00638.x]24 Levin TR, Zhao W, Conell C, Seeff LC, Manninen DL, Shapiro
JA, Schulman J. Complications of colonoscopy in an integrated health care delivery system. Ann Intern Med 2006; 145: 880-886 [PMID: 17179057 DOI: 10.7326/0003-4819-145-12-200612190-00004]
25 Wolfsen HC, Hemminger LL, Achem SR, Loeb DS, Stark ME, Bouras EP, DeVault KR. Complications of endoscopy of the upper gastrointestinal tract: a single-center experience. Mayo Clin Proc 2004; 79: 1264-1267 [PMID: 15473407 DOI: 10.4065/79.10.1264]
26 Bardan E, Maor Y, Carter D, Lang A, Bar-Meir S, Avidan B. Endoscopic ultrasound (EUS) before gastric polyp resection: is it mandatory? J Clin Gastroenterol 2007; 41: 371-374 [PMID: 17413604 DOI: 10.1097/01.mcg.0000225578.58138.56]
27 Kratzsch KH, Bosseckert H. [Results of endoscopic polypectomy in the upper gastrointestinal tract--a multicenter study]. Dtsch Z Verdau Stoffwechselkr 1984; 44: 61-66 [PMID: 6332729]
28 Apel D, Jakobs R, Spiethoff A, Riemann JF. Follow-up after endoscopic snare resection of duodenal adenomas. Endoscopy 2005; 37: 444-448 [PMID: 15844023 DOI: 10.1055/s-2005-861287]
29 Eswaran SL, Sanders M, Bernadino KP, Ansari A, Lawrence C, Stefan A, Mattia A, Howell DA. Success and complications of endoscopic removal of giant duodenal and ampullary polyps: a comparative series. Gastrointest Endosc 2006; 64: 925-932 [PMID: 17140900 DOI: 10.1016/j.gie.2006.06.018]
30 Chukmaitov A, Bradley CJ, Dahman B, Siangphoe U, Warren JL, Klabunde CN. Association of polypectomy techniques, endoscopist volume, and facility type with colonoscopy complications. Gastrointest Endosc 2013; 77: 436-446 [PMID: 23290773 DOI: 10.1016/j.gie.2012.11.012]
31 Rutter MD, Nickerson C, Rees CJ, Patnick J, Blanks RG. Risk factors for adverse events related to polypectomy in the English Bowel Cancer Screening Programme. Endoscopy 2014; 46: 90-97 [PMID: 24477363 DOI: 10.1055/s-0033-1344987]
P- Reviewer: Emara MH, Qayed E, Rodrigo L, Slomiany BL S- Editor: Gong ZM L- Editor: A E- Editor: Huang Y
Córdova H et al . Adverse events of gastroduodenal polypectomy
Chronic kidney disease severely deteriorates the outcome of gastrointestinal bleeding: A meta-analysis
Roland Hágendorn, Nelli Farkas, Áron Vincze, Zoltán Gyöngyi, Dezső Csupor, Judit Bajor, Bálint Erőss, Péter Csécsei, Andrea Vasas, Zsolt Szakács, László Szapáry, Péter Hegyi, Alexandra Mikó
Roland Hágendorn, Áron Vincze, Judit Bajor, Department of Gastroenterology, First Department of Medicine, University of Pécs, Pécs 7624, Hungary
Nelli Farkas, Institute of Bioanalysis, University of Pécs, Pécs 7624, Hungary
Bálint Erőss, Zsolt Szakács, László Szapáry, Péter Hegyi, Alexandra Mikó, Institute for Translational Medicine, University of Pécs, Pécs 7624, Hungary
Zoltán Gyöngyi, Department of Public Health Medicine, University of Pécs, Pécs 7624, Hungary
Dezső Csupor, Andrea Vasas, Department of Pharmacognosy, Faculty of Pharmacy, University of Szeged, Szeged 6720, Hungary
Péter Csécsei, Department of Neurology, University of Pécs, Pécs 7623, Hungary
ORCID number: Roland Hágendorn (0000-0002-9984-2309); Nelli Farkas (0000-0002-5349-6527); Áron Vincze (0000 -0003-2217-7686); Zoltán Gyöngyi (0000-0001-9330-9110); Dezső Csupor (0000-0002-4088-3333); Judit Bajor (0000-0002 -3941-4871); Bálint Erőss (0000-0003-3658-8427); Péter Csécsei (0000-0002-4982-2481); Andrea Vasas (0000-0002-1818-7702); Zsolt Szakács (0000-0002-7035-941X); László Szapáry (0000 -0003-2056-0825); Péter Hegyi (0000-0003-0399-7259); Alexandra Mikó(0000-0002-5322-4425).
Author contributions: Hegyi P and Mikó A contributed equally to this article; Hegyi P and Mikó A designed the research and the study concept; Hágendorn R and Mikó A performed the acquisition of data; Farkas N analysed and interpreted the data; Hágendorn R, Farkas N, Hegyi P and Mikó A wrote the paper; Vincze Á, Erőss B, Gyöngyi Z and Bajor J supervised the study; Csupor D, Csécsei P, Vasas A, Szakács Z and Szapáry L conducted a critical revision of the manuscript for important intellectual content; all of the co-authors granted final approval of
the version of the article to be published.
Supported by Project Grants No. K116634 and KH125678 (to Hegyi P); Economic Development and Innovation Operative Programme Grant, No. GINOP 2.3.2-15-2016-00048 (to Hegyi P); Human Resources Development Operational Programme Grant No. EFOP-3.6.2-16-2017-00006 (to Hegyi P) of the National Research, Development; and Innovation Office and by a Momentum Grant of the Hungarian Academy of Sciences No. LP2014-10/2014 to (Hegyi P).
Conflict-of-interest statement: The authors declare that there is no conflict of interest regarding the publication of this article.
Data sharing statement: No additional data are available.
Open-Access: This article is an open-access article which was selected by an in-house editor and fully peer-reviewed by external reviewers. It is distributed in accordance with the Creative Commons Attribution Non Commercial (CC BY-NC 4.0) license, which permits others to distribute, remix, adapt, build upon this work non-commercially, and license their derivative works on different terms, provided the original work is properly cited and the use is non-commercial. See: http://creativecommons.org/licenses/by-nc/4.0/
Manuscript source: Invited manuscript
Correspondence to: Alexandra Mikó MD, PhD, Centre for Translational Medicine, University of Pécs, Szigeti Street 12., II. floor, Pécs 7624, Hungary, [email protected]: +36-72-536246Fax: +36-72-536247
Received: October 30, 2017Peer-review started: October 31, 2017First decision: November 14, 2017Revised: November 23, 2017Accepted: December 4, 2017Article in press: December 4, 2017
META-ANALYSIS
8415 December 21, 2017|Volume 23|Issue 47|WJG|www.wjgnet.com
Submit a Manuscript: http://www.f6publishing.com
DOI: 10.3748/wjg.v23.i47.8415
World J Gastroenterol 2017 December 21; 23(47): 8415-8425
ISSN 1007-9327 (print) ISSN 2219-2840 (online)
Published online: December 21, 2017
AbstractAIMTo understand the influence of chronic kidney disease (CKD) on mortality, need for transfusion and rebleeding in gastrointestinal (GI) bleeding patients.
METHODSA systematic search was conducted in three databases for studies on GI bleeding patients with CKD or end-stage renal disease (ESRD) with data on outcomes of mortality, transfusion requirement, rebleeding rate and length of hospitalization (LOH). Calculations were performed with Comprehensive Meta-Analysis software using the random effects model. Heterogeneity was tested by using Cochrane’s Q and I 2 statistics. Mean difference (MD) and OR (odds ratio) were calculated.
RESULTS1063 articles (EMBASE: 589; PubMed: 459; Cochrane: 15) were found in total. 5 retrospective articles and 1 prospective study were available for analysis. These 6 articles contained data on 406035 patients, of whom 51315 had impaired renal function. The analysis showed a higher mortality in the CKD group (OR = 1.786, 95%CI: 1.689-1.888, P < 0.001) and the ESRD group (OR = 2.530, 95%CI: 1.386-4.616, P = 0.002), and a rebleeding rate (OR = 2.510, 95%CI: 1.521-4.144, P < 0.001) in patients with impaired renal function. CKD patients required more unit red blood cell transfusion (MD = 1.863, 95%CI: 0.812-2.915, P < 0.001) and spent more time in hospital (MD = 13.245, 95%CI: 6.886-19.623, P < 0.001) than the controls.
CONCLUSIONESRD increases mortality, need for transfusion, rebleeding rate and LOH among GI bleeding patients. Prospective patient registries and observational clinical trials are crucially needed.
Key words: Gastrointestinal bleeding; Chronic kidney disease; Mortality; Blood transfusion; Rebleeding
© The Author(s) 2017. Published by Baishideng Publishing Group Inc. All rights reserved.
Core tip: Acute gastrointestinal bleeding is a potentially life-threatening abdominal emergency that remains a common cause of hospitalization. Pre-existing chronic kidney disease (CKD) may worsen the prognosis. This is the first meta-analysis to compare CKD patients and normal renal function patients based on GI bleeding. We investigated these two groups in terms of mortality, transfusion amount, rebleeding rate and length of
hospitalization.
Hágendorn R, Farkas N, Vincze Á, Gyöngyi Z, Csupor D, Bajor J, Erőss B, Csécsei P, Vasas A, Szakács Z, Szapáry L, Hegyi P, Mikó A. Chronic kidney disease severely deteriorates the outcome of gastrointestinal bleeding: A meta-analysis. World J Gastroenterol 2017; 23(47): 8415-8425 Available from: URL: http://www.wjgnet.com/1007-9327/full/v23/i47/8415.htm DOI: http://dx.doi.org/10.3748/wjg.v23.i47.8415
INTRODUCTIONAcute gastrointestinal bleeding (GI) is an abdominal emergency which remains a common cause of hospitalization[1]. An accurate diagnosis of GI bleeding relies on prompt resuscitation, initial risk evaluation, and provisional clinical diagnosis followed by an appropriate definitive investigation which enables specific therapeutic interventions. GI bleeding involves any bleeding in the GI tract from the esophagus, stomach, small intestines or large intestines to the anus.
Upper GI bleeding has an annual incidence that ranges from 40 to 150 episodes per 100000 persons and a morality rate of 6%-10%[2], whereas lower GI bleeding has an annual incidence ranging from 20 to 27 episodes per 100000 persons and a mortality rate of 4%-10%[3,4]. Since GI bleeding is a potentially life-threatening acute disorder, understanding the risk factors that worsen the disease is of great importance. Scoring systems have therefore been developed to predict the outcome of therapy. The Rockall score is one of these scoring systems. It includes pre-endoscopic (age, shock and comorbidity) and post-endoscopic (diagnosis and presence or absence of endoscopic stigmata of recent haemorrhage) factors[5]. Several studies have demonstrated high mortality with higher Rockall scores[6]. However, Laeeq et al[7] have not found significantly higher mortality in patients with high pre-endoscopic Rockall score (> 5). The Rockall score only assesses the risk of mortality in patients with upper GI bleeding. The Glasgow Blatchford score is another scoring system which uses clinical and laboratory parameters. Neither scoring system makes distinction between pre-existing renal failure and acute renal failure due to haemorrhage. Both of these scoring systems have been designed for the risk assessment of upper GI bleeding. Previous studies have shown evidence of increased risk of GI bleeding in chronic kidney disease (CKD) patients and with end-stage renal disease (ESRD) requiring renal replacement therapy in comparison with the general population, but also an association with higher
8416 December 21, 2017|Volume 23|Issue 47|WJG|www.wjgnet.com
Hágendorn R et al . GI bleeding and chronic kidney disease
mortality[8-10]. Further studies have demonstrated that bleeding in CKD patients from the upper GI tract is more common than from the lower GI tract[11]. The increased prevalence of small bowel erosions, ulcers and angioectasias is also well known in CKD patients and it may be as high as 33% and it often causes obscure gastrointestinal bleeding[12-14]. However, no meta-analyses or systematic reviews have been conducted to assess the difference between CKD/ESRD patients and the normal renal function population with regard to GI bleeding.
The aim of this study was therefore to examine outcomes of GI bleeding, such as mortality, blood transfusion requirement, rebleeding rate and length of hospitalization (LOH) in CKD/ESRD patients compared to patients with normal renal functions.
MATERIALS AND METHODSSearch strategyThis study was conducted using the preferred reporting items for systematic review and meta-analysis protocols (PRISMA-P)[15]. It was registered in the international prospective register of systematic reviews, PROSPERO (under registration number CRD42017077987). The meta-analysis was based on the PICO (Patient, Intervention, Comparison, Outcome) format (P: patients with GI bleeding; I: chronic renal failure; C: normal renal function; O: mortality, blood transfusion, rebleeding). A systematic search was performed in 3 databases, Pubmed, EMBASE and the Cochrane Library, with the following terms: (“GI bleeding” OR “gastrointestinal bleeding” OR “gastrointestinal hemorrhage”) AND (“chronic renal failure” OR “uremia” OR “chronic kidney failure”). The search was limited to human data and to full-text English-language articles if appropriate. The exact search term in Pubmed was: [“GI bleeding”(All Fields) OR “gastrointestinal bleeding”(All Fields) OR “gastrointestinal hemorrhage”(All Fields)] AND [“chronic renal failure”(All Fields) OR “uraemia”(All Fields) OR “uremia”(MeSH Terms) OR “uremia”(All Fields) OR “chronic kidney failure”(All Fields)] AND [“humans”(MeSH Terms) AND English(lang)]. The database search was conducted up to 10 March 2017. Reference management software (EndNote X7) was used to remove duplicates by searching overlaps between titles, authors and publication years. The reference lists in the articles obtained were also checked, and one more eligible publication was found.
Study selectionThe studies were selected separately by two inves-tigators (RH and AM). Disagreements were resolved by consulting a third reviewer (PH). Clinical studies were eligible provided they reported data on adult patients hospitalized with upper or lower GI bleeding
grouped into normal renal function and CKD or ESRD groups. Articles were eligible containing data of CKD/ESRD patients and a control group in the same study. Information on mortality, transfusion, rebleeding and length of hospitalization (LOH) was manually searched. Case reports, conference abstracts, reviews and studies on paediatric patients up to age 18 alone were excluded. We found a high number of articles in which the risk of GI bleeding in CKD patients was studied, but they were not eligible for our meta-analysis, as there were no data available on outcomes of the GI bleeding in a control population without CKD/ESRD.
Data extraction, synthesis and analysisMortality data, number of transfused blood units, rebleeding and length of hospitalization data were extracted to analyse the influence of CKD and/or ESRD on the outcome of GI bleeding. In Sood et al[9], Tsai et al[16] and Boyle et al[17], the number of patients was calculated from percentages of mortality. Boyle et al[17] supplied information on transfusion in mean and standard error of mean, for which statistical calculation standard deviation (SD) was computed. Tsai et al[16] reported data from transfusions in the median and interquartile range (IQR), from which mean and SD were calculated with Hozo’s method[18]. All meta-analytic calculations were performed with Comprehensive Meta-Analysis software (Version 3.0, Biostat Inc.) using the random effects model (DerSimonian-Laird method[19]). Odds ratios (OR) and 95% confidence intervals (CI) were calculated for binary outcomes. In the case of LOH and transfusion for comparing mean data, a mean difference (MD) with 95%CI was calculated. All analyses were two-tailed, with an α of 0.05.
Heterogeneity was tested using Cochrane’s Q and the I2 statistics. Based on the Cochrane Handbook, I2 = 100% × (Q - df)/Q, with I2 representing the magnitude of the heterogeneity (moderate: 30%-60%; substantial: 50%-90%; considerable: 75%-100%)[20]. Only results that were available from at least 3 studies were displayed graphically with forest plots. We performed a sensitivity analysis to assess whether removing any study result in different interpretation and final conclusion[21]. To assess the effect of the year of publication on the outcome data we performed meta-regression analysis. We calculated the regression coefficient and interpreted the data with their 95%CI and r-analog.
Quality of studies and risk of biasBecause of the low number of eligible articles, publication bias was obtained with a visual inspection of the funnel plots alone according to the Cochrane Handbook[20]. The Newcastle-Ottawa Scale (NOS) adjusted to our study design was used[22] to assess the quality of nonrandomized cohort studies. The
8417 December 21, 2017|Volume 23|Issue 47|WJG|www.wjgnet.com
Hágendorn R et al . GI bleeding and chronic kidney disease
8418 December 21, 2017|Volume 23|Issue 47|WJG|www.wjgnet.com
included in the analysis reported in Alvarez et al[24], so we did not use the data in that publication. The remaining 5[9,16,17,25,26] and one other[10] eligible record which was found in reference lists were included in the meta-analysis. The basic characteristics of the 6 eligible articles in the meta-analysis are shown in Table 2. These 6 publications contained data on 406,035 patients, of whom 51315 had impaired renal function parameters and 354720 had normal renal functions. 2 articles contained data on patients with CKD and 4 on ESRD patients. There were 2 studies involving CKD and ESRD patients, with their group identified as the CKD mixed group. The number of ESRD patients analysed was 15201, the CKD group had 36035 members, and 79 patients could be classified in the CKD mixed group.
MortalityData on mortality was available in all of the articles included, but Zuckerman et al[26] reported no mortality data for the control group; we therefore removed it from the statistical analysis. Hung et al[25] reported mortality data from a 6-wk follow-up period, while the other articles contained data on an unknown follow-up period. In the subgroup analysis for CKD and ESRD, a higher mortality rate was detected compared to the control population (CKD: OR = 1.786, 95%CI: 1.689-1.888, P < 0.001; ESRD: OR = 2.530, 95%CI: 1.386-4.616, P = 0.002, Figure 2).
Required units for transfusion4 studies reported data on the transfused units of red blood cells. The required transfusion was 1.8 times higher in the patients with abnormal renal function (MD
selection, comparability and outcome data were assessed based on 6 items (Table 1) with the “star system”: high-quality items with a low risk of bias received one star, while low-quality items with a high or unknown risk of bias were assigned no stars. 3 items were included during the selection process. In the case of representativeness in the study population, we assigned a star if all of the GI bleeding patients with normal or impaired renal function were included. If any selection criteria applied, we assigned no points. We used the classical definition of CKD[23], which characterizes the disease with a glomerular filtration rate (GFR) < 60 m/min lasting longer than 3 mo. ESRD was defined as a condition where haemodialysis or chronic peritoneal dialysis is performed for at least 3 mo. With regard to outcome, only the follow-up time for rebleeding was rated in articles that provided this information. Assessment of outcome and length of follow-up were not rated because most of the articles were retrospective.
RESULTSStudy selection1063 articles (EMBASE: 589; PubMed: 459; Cochrane: 15) were found altogether through database searches. The flowchart (Figure 1) shows the study selection strategy. Studies in our meta-analysis were dated from 1946 to 2017. After removing duplicates, 875 publications remained. Following initial screening based on titles and abstracts, 23 articles were retrieved and screened. A further 18 were excluded because of missing outcome data or a missing control group. Patients with acute renal failure were also
Table 1 Modified Newcastle-Ottawa Scale criteria
Adapted Newcastle-Ottawa Scale Items High-quality items carrying a low risk of bias (green)
Low-quality items carrying a high (red) or an unknown (yellow) risk of bias
Item 1: Representativeness of the initial study population - patients with GI bleeding and CKD/ESRD
All patients with upper or lower GI bleeding and CKD/ESRD were included.
Low: any selection criteria were applied to the study population (e.g., only transplanted patients).
Unknown: no data on selection process.Item 2: Representativeness of the initial study population - patients with GI bleeding without CKD/ESRD
All patients with upper or lower GI bleeding without CKD/ESRD included.
Low: any selection criteria were applied to the study population.
Unknown: no data on selection process.Item 3: Ascertainment of exposure We defined chronic renal failure as present when
eGFR was < 60 mL/min at least 3 mo. We defined end-stage renal disease as a condition where hemodialysis or chronic peritoneal dialysis is
performed at least for 3 mo.
Low: CKD or ESRD is not present in all of the patients.
Unknown: no definitions of the conditions mentioned are provided.
Item 4: Comparability of cohorts A Study controls for age: no significant difference was detected.
Low: significant difference was detected.Unknown: no statement.
Item 5: Comparability of cohorts B Study controls for taking ulcerogenic drugs: no significant difference was detected
Low: significant difference was detected between taking ulcerogenic drugs.
Unknown: no comparison made by taking ulcerogenic drugs.
Item 6: Follow-up time for rebleeding The follow-up time is clearly defined. Low: incomplete follow-upUnknown: no follow-up time is mentioned.
CKD: Chronic kidney disease; ESRD: End-stage renal disease.
Hágendorn R et al . GI bleeding and chronic kidney disease
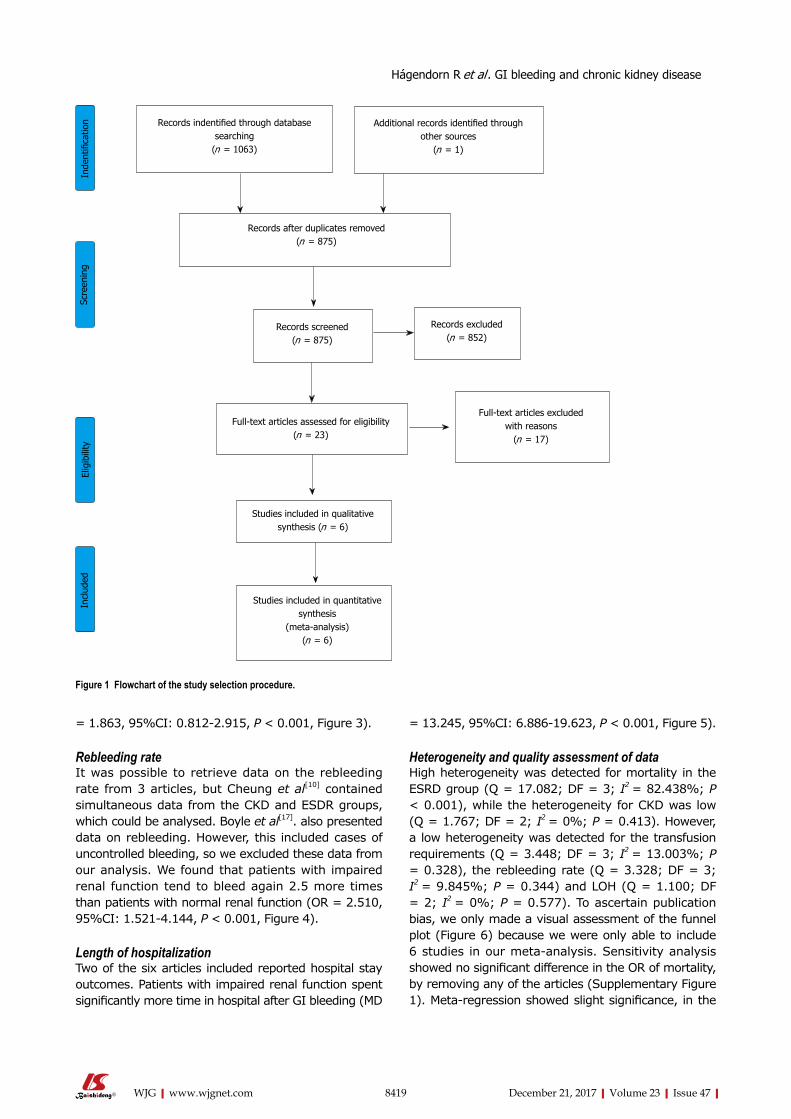
8419 December 21, 2017|Volume 23|Issue 47|WJG|www.wjgnet.com
= 1.863, 95%CI: 0.812-2.915, P < 0.001, Figure 3).
Rebleeding rateIt was possible to retrieve data on the rebleeding rate from 3 articles, but Cheung et al[10] contained simultaneous data from the CKD and ESDR groups, which could be analysed. Boyle et al[17]. also presented data on rebleeding. However, this included cases of uncontrolled bleeding, so we excluded these data from our analysis. We found that patients with impaired renal function tend to bleed again 2.5 more times than patients with normal renal function (OR = 2.510, 95%CI: 1.521-4.144, P < 0.001, Figure 4).
Length of hospitalizationTwo of the six articles included reported hospital stay outcomes. Patients with impaired renal function spent significantly more time in hospital after GI bleeding (MD
= 13.245, 95%CI: 6.886-19.623, P < 0.001, Figure 5).
Heterogeneity and quality assessment of dataHigh heterogeneity was detected for mortality in the ESRD group (Q = 17.082; DF = 3; I2 = 82.438%; P < 0.001), while the heterogeneity for CKD was low (Q = 1.767; DF = 2; I2 = 0%; P = 0.413). However, a low heterogeneity was detected for the transfusion requirements (Q = 3.448; DF = 3; I2 = 13.003%; P = 0.328), the rebleeding rate (Q = 3.328; DF = 3; I2 = 9.845%; P = 0.344) and LOH (Q = 1.100; DF = 2; I2 = 0%; P = 0.577). To ascertain publication bias, we only made a visual assessment of the funnel plot (Figure 6) because we were only able to include 6 studies in our meta-analysis. Sensitivity analysis showed no significant difference in the OR of mortality, by removing any of the articles (Supplementary Figure 1). Meta-regression showed slight significance, in the
Records indentified through database searching
(n = 1063)
Additional records identified through other sources
(n = 1)
Records after duplicates removed (n = 875)
Records screened (n = 875)
Records excluded (n = 852)
Full-text articles assessed for eligibility (n = 23)
Studies included in qualitative synthesis (n = 6)
Inde
ntifi
catio
nSc
reen
ing
Elig
ibili
tyIn
clud
ed
Studies included in quantitative synthesis
(meta-analysis) (n = 6)
Full-text articles excluded with reasons
(n = 17)
Figure 1 Flowchart of the study selection procedure.
Hágendorn R et al . GI bleeding and chronic kidney disease
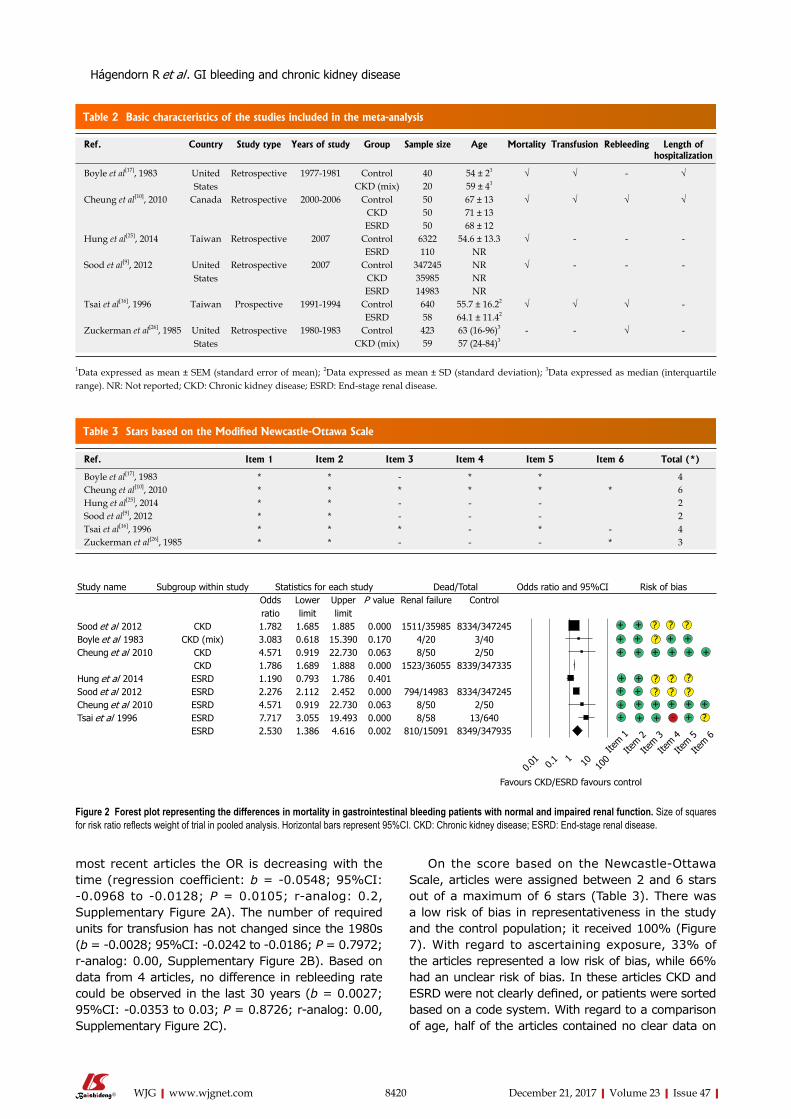
8420 December 21, 2017|Volume 23|Issue 47|WJG|www.wjgnet.com
most recent articles the OR is decreasing with the time (regression coefficient: b = -0.0548; 95%CI: -0.0968 to -0.0128; P = 0.0105; r-analog: 0.2, Supplementary Figure 2A). The number of required units for transfusion has not changed since the 1980s (b = -0.0028; 95%CI: -0.0242 to -0.0186; P = 0.7972; r-analog: 0.00, Supplementary Figure 2B). Based on data from 4 articles, no difference in rebleeding rate could be observed in the last 30 years (b = 0.0027; 95%CI: -0.0353 to 0.03; P = 0.8726; r-analog: 0.00, Supplementary Figure 2C).
On the score based on the Newcastle-Ottawa Scale, articles were assigned between 2 and 6 stars out of a maximum of 6 stars (Table 3). There was a low risk of bias in representativeness in the study and the control population; it received 100% (Figure 7). With regard to ascertaining exposure, 33% of the articles represented a low risk of bias, while 66% had an unclear risk of bias. In these articles CKD and ESRD were not clearly defined, or patients were sorted based on a code system. With regard to a comparison of age, half of the articles contained no clear data on
Table 2 Basic characteristics of the studies included in the meta-analysis
Ref. Country Study type Years of study Group Sample size Age Mortality Transfusion Rebleeding Length of hospitalization
Boyle et al[17], 1983 United States
Retrospective 1977-1981 Control 40 54 ± 21 √ √ - √CKD (mix) 20 59 ± 41
Cheung et al[10], 2010 Canada Retrospective 2000-2006 Control 50 67 ± 13 √ √ √ √CKD 50 71 ± 13ESRD 50 68 ± 12
Hung et al[25], 2014 Taiwan Retrospective 2007 Control 6322 54.6 ± 13.3 √ - - -ESRD 110 NR
Sood et al[9], 2012 United States
Retrospective 2007 Control 347245 NR √ - - -CKD 35985 NRESRD 14983 NR
Tsai et al[16], 1996 Taiwan Prospective 1991-1994 Control 640 55.7 ± 16.22 √ √ √ -ESRD 58 64.1 ± 11.42
Zuckerman et al[26], 1985 United States
Retrospective 1980-1983 Control 423 63 (16-96)3 - - √ -CKD (mix) 59 57 (24-84)3
1Data expressed as mean ± SEM (standard error of mean); 2Data expressed as mean ± SD (standard deviation); 3Data expressed as median (interquartile range). NR: Not reported; CKD: Chronic kidney disease; ESRD: End-stage renal disease.
Table 3 Stars based on the Modified Newcastle-Ottawa Scale
Ref. Item 1 Item 2 Item 3 Item 4 Item 5 Item 6 Total (*)
Boyle et al[17], 1983 * * - * * 4Cheung et al[10], 2010 * * * * * * 6Hung et al[25], 2014 * * - - - 2Sood et al[9], 2012 * * - - - 2Tsai et al[16], 1996 * * * - * - 4Zuckerman et al[26], 1985 * * - - - * 3
Figure 2 Forest plot representing the differences in mortality in gastrointestinal bleeding patients with normal and impaired renal function. Size of squares for risk ratio reflects weight of trial in pooled analysis. Horizontal bars represent 95%CI. CKD: Chronic kidney disease; ESRD: End-stage renal disease.
Hágendorn R et al . GI bleeding and chronic kidney disease
Study name Subgroup within study Statistics for each study Dead/Total Odds ratio and 95%CI Risk of biasOdds ratio
Lower limit
Upper limit
P value Renal failure Control
Sood et al 2012 CKD 1.782 1.685 1.885 0.000 1511/35985 8334/347245Boyle et al 1983 CKD (mix) 3.083 0.618 15.390 0.170 4/20 3/40Cheung et al 2010 CKD 4.571 0.919 22.730 0.063 8/50 2/50
CKD 1.786 1.689 1.888 0.000 1523/36055 8339/347335Hung et al 2014 ESRD 1.190 0.793 1.786 0.401Sood et al 2012 ESRD 2.276 2.112 2.452 0.000 794/14983 8334/347245Cheung et al 2010 ESRD 4.571 0.919 22.730 0.063 8/50 2/50Tsai et al 1996 ESRD 7.717 3.055 19.493 0.000 8/58 13/640
ESRD 2.530 1.386 4.616 0.002 810/15091 8349/347935
Favours CKD/ESRD favours control
Item 1
Item 2
Item 3
Item 4
Item 5
Item 6
??
? ?
??????
?-
+++ + + + + +
++ + +
+++ + + + + ++ + +
++
+
1001 100.0
10.1
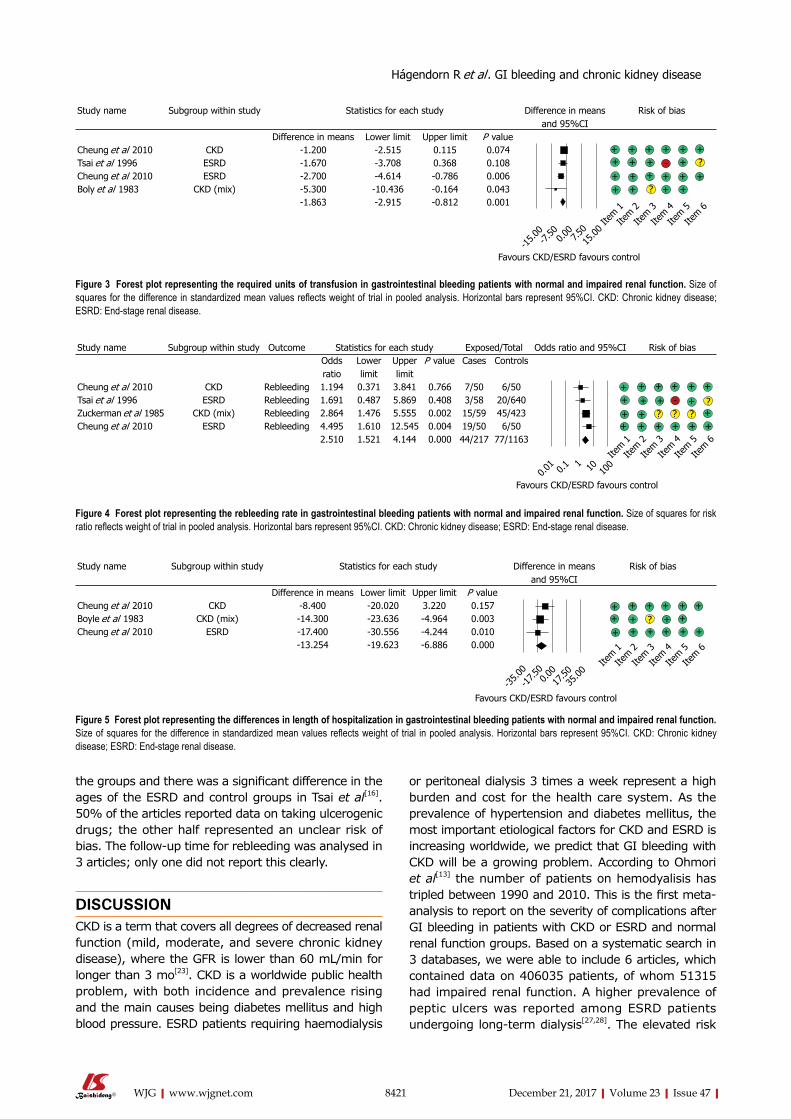
8421 December 21, 2017|Volume 23|Issue 47|WJG|www.wjgnet.com
the groups and there was a significant difference in the ages of the ESRD and control groups in Tsai et al[16]. 50% of the articles reported data on taking ulcerogenic drugs; the other half represented an unclear risk of bias. The follow-up time for rebleeding was analysed in 3 articles; only one did not report this clearly.
DISCUSSIONCKD is a term that covers all degrees of decreased renal function (mild, moderate, and severe chronic kidney disease), where the GFR is lower than 60 mL/min for longer than 3 mo[23]. CKD is a worldwide public health problem, with both incidence and prevalence rising and the main causes being diabetes mellitus and high blood pressure. ESRD patients requiring haemodialysis
or peritoneal dialysis 3 times a week represent a high burden and cost for the health care system. As the prevalence of hypertension and diabetes mellitus, the most important etiological factors for CKD and ESRD is increasing worldwide, we predict that GI bleeding with CKD will be a growing problem. According to Ohmori et al[13] the number of patients on hemodyalisis has tripled between 1990 and 2010. This is the first meta-analysis to report on the severity of complications after GI bleeding in patients with CKD or ESRD and normal renal function groups. Based on a systematic search in 3 databases, we were able to include 6 articles, which contained data on 406035 patients, of whom 51315 had impaired renal function. A higher prevalence of peptic ulcers was reported among ESRD patients undergoing long-term dialysis[27,28]. The elevated risk
Study name Subgroup within study Statistics for each study Difference in means and 95%CI
Risk of bias
Difference in means Lower limit Upper limit P valueCheung et al 2010 CKD -1.200 -2.515 0.115 0.074Tsai et al 1996 ESRD -1.670 -3.708 0.368 0.108Cheung et al 2010 ESRD -2.700 -4.614 -0.786 0.006Boly et al 1983 CKD (mix) -5.300 -10.436 -0.164 0.043
-1.863 -2.915 -0.812 0.001
Favours CKD/ESRD favours control
+ + + + + ++ ++ + + + +
?+ + + +
+++
Item 1
Item 2
Item 3
Item 4
Item 5
Item 6
Figure 3 Forest plot representing the required units of transfusion in gastrointestinal bleeding patients with normal and impaired renal function. Size of squares for the difference in standardized mean values reflects weight of trial in pooled analysis. Horizontal bars represent 95%CI. CKD: Chronic kidney disease; ESRD: End-stage renal disease.
Study name Subgroup within study Outcome Statistics for each study Exposed/Total Odds ratio and 95%CI Risk of biasOdds ratio
Lower limit
Upper limit
P value Cases Controls
Cheung et al 2010 CKD Rebleeding 1.194 0.371 3.841 0.766 7/50 6/50Tsai et al 1996 ESRD Rebleeding 1.691 0.487 5.869 0.408 3/58 20/640Zuckerman et al 1985 CKD (mix) Rebleeding 2.864 1.476 5.555 0.002 15/59 45/423Cheung et al 2010 ESRD Rebleeding 4.495 1.610 12.545 0.004 19/50 6/50
2.510 1.521 4.144 0.000 44/217 77/1163
+ + + + + ++ + + - ?
???+ + ++ + + + + +
Item 1
Item 2
Item 3
Item 4
Item 5
Item 6
Favours CKD/ESRD favours control
Figure 4 Forest plot representing the rebleeding rate in gastrointestinal bleeding patients with normal and impaired renal function. Size of squares for risk ratio reflects weight of trial in pooled analysis. Horizontal bars represent 95%CI. CKD: Chronic kidney disease; ESRD: End-stage renal disease.
Study name Subgroup within study Statistics for each study Difference in means and 95%CI
Risk of bias
Difference in means Lower limit Upper limit P valueCheung et al 2010 CKD -8.400 -20.020 3.220 0.157Boyle et al 1983 CKD (mix) -14.300 -23.636 -4.964 0.003Cheung et al 2010 ESRD -17.400 -30.556 -4.244 0.010
-13.254 -19.623 -6.886 0.000
+ + + + + +
+ + + + + ++ + +
Item 1
Item 2
Item 3
Item 4
Item 5
Item 6
Favours CKD/ESRD favours control
Figure 5 Forest plot representing the differences in length of hospitalization in gastrointestinal bleeding patients with normal and impaired renal function. Size of squares for the difference in standardized mean values reflects weight of trial in pooled analysis. Horizontal bars represent 95%CI. CKD: Chronic kidney disease; ESRD: End-stage renal disease.
- ?
+
? +
Hágendorn R et al . GI bleeding and chronic kidney disease
0.00
-15.0
07.5
0-7.
5015
.00
1001 100.0
10.1
0.00
-35.0
017
.50-1
7.50
35.00
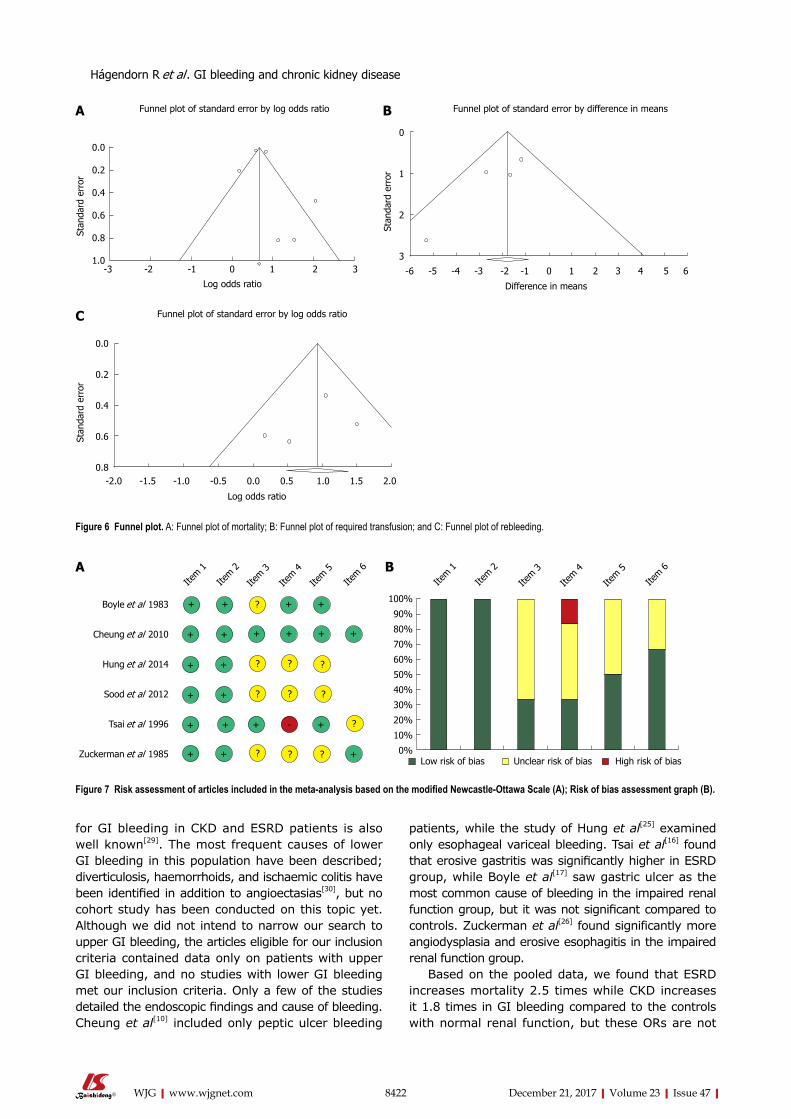
8422 December 21, 2017|Volume 23|Issue 47|WJG|www.wjgnet.com
for GI bleeding in CKD and ESRD patients is also well known[29]. The most frequent causes of lower GI bleeding in this population have been described; diverticulosis, haemorrhoids, and ischaemic colitis have been identified in addition to angioectasias[30], but no cohort study has been conducted on this topic yet. Although we did not intend to narrow our search to upper GI bleeding, the articles eligible for our inclusion criteria contained data only on patients with upper GI bleeding, and no studies with lower GI bleeding met our inclusion criteria. Only a few of the studies detailed the endoscopic findings and cause of bleeding. Cheung et al[10] included only peptic ulcer bleeding
patients, while the study of Hung et al[25] examined only esophageal variceal bleeding. Tsai et al[16] found that erosive gastritis was significantly higher in ESRD group, while Boyle et al[17] saw gastric ulcer as the most common cause of bleeding in the impaired renal function group, but it was not significant compared to controls. Zuckerman et al[26] found significantly more angiodysplasia and erosive esophagitis in the impaired renal function group.
Based on the pooled data, we found that ESRD increases mortality 2.5 times while CKD increases it 1.8 times in GI bleeding compared to the controls with normal renal function, but these ORs are not
-3 -2 -1 0 1 2 3
0.0
0.2
0.4
0.6
0.8
1.0
Log odds ratio
Stan
dard
err
or
Funnel plot of standard error by log odds ratio
-6 -5 -4 -3 -2 -1 0 1 2 3 4 5 6
0
1
2
3
Difference in means
Stan
dard
err
or
Funnel plot of standard error by difference in means
-2.0 -1.5 -1.0 -0.5 0.0 0.5 1.0 1.5 2.0
0.0
0.2
0.4
0.6
0.8
Log odds ratio
Stan
dard
err
or
Funnel plot of standard error by log odds ratio
Figure 6 Funnel plot. A: Funnel plot of mortality; B: Funnel plot of required transfusion; and C: Funnel plot of rebleeding.
+ + + +
++++++
?
+
+
+
+ +
+
+
+ ?
?
+
? ? ? +
?+-
?
? ?
?
Item 1
Item 2
Item 3
Item 4
Item 5
Item 6
Boyle et al 1983
Cheung et al 2010
Hung et al 2014
Sood et al 2012
Tsai et al 1996
Zuckerman et al 1985
Item 1
Item 2
Item 3
Item 4
Item 5
Item 6
Low risk of bias Unclear risk of bias High risk of bias
100%
90%
80%
70%
60%
50%
40%
30%
20%
10%
0%
A B
Figure 7 Risk assessment of articles included in the meta-analysis based on the modified Newcastle-Ottawa Scale (A); Risk of bias assessment graph (B).
Hágendorn R et al . GI bleeding and chronic kidney disease
A B
C
8423 December 21, 2017|Volume 23|Issue 47|WJG|www.wjgnet.com
significantly different. Weng et al[31] reported that ESRD patients admitted with primary upper GI bleeding have a profoundly increased risk of in-hospital mortality. Using a large multi-centre database, Sood et al[9] reported that the in-hospital mortality risk is 50% higher in CKD patients and 3 times greater in ESRD patients. Holden et al[32] reported that the incidence rate of major bleeding episodes in haemodialyzed patients was 2.5% per person-year and that use of aspirin and/or warfarin increased this risk. Based on the result of the meta-regression the mortality-rate of GI bleeding has improved since the 1980s. It is likely one of the reasons for the heterogeneity of the data. Inhomogen patient groups also result in a significant bias. However the sensitivity analysis showed that none of the articles influences significantly the pooled OR.
Cardiovascular disease, current smoking[33] and even haemostasis disorders[34] may play a role in the background of higher risk for GI bleeding in ESRD patients. Unfortunately only few of the analysed articles detailed the other comorbidities of the GI bleeding patients. In the article of Cheung et al[10]. there was no significant difference in the comorbidities between ESRD, CKD and normal renal function group. More people in CKD and ESRD groups suffered from hypertension, diabetes mellitus and platelet abnormalities in the study of Sood et al[9], while the cirrhosis was less common than in controls. Volume replacement and blood transfusion are important parts of the therapy of GI bleeding. This meta-analysis demonstrated that patients with chronic impaired renal function develop 2.5 times more rebleeding episodes and require almost 2 more red blood cell units for transfusion than the control group. Patients with impaired renal function spent more time in hospital than the control group.
There are several limitations to this study; the-refore, the results of this meta-analysis should be regarded with caution. Unfortunately, only a low number of articles was found on this topic, with half of them written in the 1980s and 1990s. In the recent articles, CKD and ESRD groups were separated, but in the earlier publications these groups were mixed, leading to a bias in our analysis, and the definition of GFR was also not mentioned. The diagnosis was based on elevated creatinine level. Hung et al[25] only involved patients with cirrhosis and the mortality rate was monitored up to 6 wk, while hospital mortalities were presumably included in the other articles. Publications with rebleeding data did not follow patients for the same time interval, and 1 paper did not report on the follow-up time. The strength of this meta-analysis is the high number of patients.
Our results have demonstrated that patients with ESRD show higher mortality during GI bleeding. CKD patients require more transfusion, and the rebleeding rate is also more elevated than that in patients with
normal renal function. Because of these severe con-ditions, the LOH is also longer. Patients with ESRD or CKD should be observed more carefully due to the elevated complication rate. In this meta-analysis we wanted to highlight the importance of this clinical problem and we believe that it needs further scientific research. In order to understand the effect of CKD/ESRD and other comorbidities on the outcomes of GI bleeding in more details, observational trials, and registries on GI bleeding should be developed.
ARTICLE HIGHLIGHTSResearch backgroundChronic kidney disease is a significant comorbidity, which can worsen the outcomes of gastrointestinal (GI) bleeding.
Research motivationWe wanted to understand the role of chronic kidney disease (CKD) and end-stage renal disease (ESRD) in the natural history of GI bleeding.
Research objectivesOur goal was to investigate the influence of CKD and ESRD on the outcomes of GI bleeding, based on all available data published in this topic.
Research methodsA comprehensive search was carried out in PubMed, Embase and Cochrane Library databases for studies detailing the outcomes of GI bleeding in the context of kidney functions. We used the PRISMA P protocol, registered our project through PROSPERO and assessed the quality of the included articles by using the Newcastle-Ottawa Scale, to ensure that this meta-analysis is done to the highest possible standards. The statistical calculations were performed with Comprehensive Meta-Analysis software, using the random effects model (DerSimonian-Laird method).
Research resultsIn this analysis 51315 patients with CKD and 354720 controls were included (6 articles). We found that the mortality of GI bleeding was significantly worse in CKD and ESRD with an OR of 1.79 and 2.53 respectively. Patients with kidney disease needed significantly more transfusion with a MD of 1.86 and the rebleeding rate was significantly worse in the group with impaired kidney function with an OR of 2.51. Patients with impaired kidney function needed significantly longer hospitalization with a MD of 13.25.
Research conclusionsThis is the first meta-analysis and systematic review in this topic, which quantifies kidney disease as a negative risk factor in GI bleeding. GI bleeding in patients with chronic renal failure significantly increases the mortality rate, rebleeding rate, length of hospitalization, and require more blood transfusion compared to patients with normal kidney functions. Kidney disease significantly worsens the outlook of patients presenting with GI bleeding. Patients with chronic kidney disease will need to be treated with more caution due to the worse outcomes of GI bleeding. Close monitoring of the fluid balance and kidney functions, careful fluid therapy and prevention of acute kidney injury in these patients may improve the outcomes of GI bleeding.
Research perspectivesAlthough CKD, ESRD, and other comorbidities are major risk factors for unfavorable outcomes in GI bleeding, their roles are not well investigated nor understood and they need further scrutiny. We would better understand the role of CKD in ESRD in GI bleeding from analysis of extensive data from large multicenter and multinational observational studies and registries accurately recording the outcomes and the kidney functions.
ARTICLE HIGHLIGHTS
Hágendorn R et al . GI bleeding and chronic kidney disease
8424 December 21, 2017|Volume 23|Issue 47|WJG|www.wjgnet.com
ACKNOWLEDGMENTSThe present paper is dedicated to the 650th anniversary of the founding of the University of Pécs, Hungary.
REFERENCES1 Cutler JA, Mendeloff AI. Upper gastrointestinal bleeding. Nature
and magnitude of the problem in the U.S. Dig Dis Sci 1981; 26: 90S-96S [PMID: 6985341]
2 Vreeburg EM, Snel P, de Bruijne JW, Bartelsman JF, Rauws EA, Tytgat GN. Acute upper gastrointestinal bleeding in the Amsterdam area: incidence, diagnosis, and clinical outcome. Am J Gastroenterol 1997; 92: 236-243 [PMID: 9040198]
3 Hussain H, Lapin S, Cappell MS. Clinical scoring systems for determining the prognosis of gastrointestinal bleeding. Gastroenterol Clin North Am 2000; 29: 445-464 [PMID: 10836189 DOI: 10.1016/S0889-8553(05)70122-9]
4 Zuccaro G Jr . Management of the adult pat ient with acute lower gastrointestinal bleeding. American College of Gastroenterology. Practice Parameters Committee. Am J Gastroenterol 1998; 93: 1202-1208 [PMID: 9707037 DOI: 10.1111/j.1572-0241.1998.00395.x]
5 Rockall TA, Logan RF, Devlin HB, Northfield TC. Risk assessment after acute upper gastrointestinal haemorrhage. Gut 1996; 38: 316-321 [PMID: 8675081]
6 Lin CC, Wang HP, Wu MS, Ho WC, Lee H, Lin JT. The etiology and clinical characteristics of acute lower gastrointestinal bleeding in patients hospitalized for comorbid illnesses. Hepatogastroenterology 2006; 53: 395-398 [PMID: 16795980]
7 Laeeq SM, Tasneem AA, Hanif FM, Luck NH, Mandhwani R, Wadhva R. Upper Gastrointestinal Bleeding in Patients with End Stage Renal Disease: Causes, Characteristics and Factors Associated with Need for Endoscopic Therapeutic Intervention. J Transl Int Med 2017; 5: 106-111 [PMID: 28721343 DOI: 10.1515/jtim-2017-0019]
8 Kuo CC, Kuo HW, Lee IM, Lee CT, Yang CY. The risk of upper gastrointestinal bleeding in patients treated with hemodialysis: a population-based cohort study. BMC Nephrol 2013; 14: 15 [PMID: 23324652 DOI: 10.1186/1471-2369-14-15]
9 Sood P, Kumar G, Nanchal R, Sakhuja A, Ahmad S, Ali M, Kumar N, Ross EA. Chronic kidney disease and end-stage renal disease predict higher risk of mortality in patients with primary upper gastrointestinal bleeding. Am J Nephrol 2012; 35: 216-224 [PMID: 22310659 DOI: 10.1159/000336107]
10 Cheung J, Yu A, LaBossiere J, Zhu Q, Fedorak RN. Peptic ulcer bleeding outcomes adversely affected by end-stage renal disease. Gastrointest Endosc 2010; 71: 44-49 [PMID: 19595311 DOI: 10.1016/j.gie.2009.04.014]
11 Gheissari A, Rajyaguru V, Kumashiro R, Matsumoto T. Gastrointestinal hemorrhage in end stage renal disease patients. Int Surg 1990; 75: 93-95 [PMID: 2379997]
12 Docherty E, Koulaouzidis A, Douglas S, Plevris JN. Use of small bowel capsule endoscopy in patients with chronic kidney disease: experience from a University Referral Center. Ann Gastroenterol 2015; 28: 99-104 [PMID: 25608445]
13 Ohmori T, Konishi H, Nakamura S, Shiratori K. Abnormalities of the small intestine detected by capsule endoscopy in hemodialysis patients. Intern Med 2012; 51: 1455-1460 [PMID: 22728474]
14 Karagiannis S, Goulas S, Kosmadakis G, Galanis P, Arvanitis D, Boletis J, Georgiou E, Mavrogiannis C. Wireless capsule endoscopy in the investigation of patients with chronic renal failure and obscure gastrointestinal bleeding (preliminary data). World J Gastroenterol 2006; 12: 5182-5185 [PMID: 16937529 DOI: 10.3748/wjg.v12.i32.5182]
15 Moher D, Liberati A, Tetzlaff J, Altman DG; PRISMA Group. Preferred reporting items for systematic reviews and meta-analyses: the PRISMA statement. PLoS Med 2009; 6: e1000097
[PMID: 19621072 DOI: 10.1371/journal.pmed.1000097]16 Tsai CJ, Hwang JC. Investigation of upper gastrointestinal
hemorrhage in chronic renal failure. J Clin Gastroenterol 1996; 22: 2-5 [PMID: 8776085]
17 Boyle JM, Johnston B. Acute upper gastrointestinal hemorrhage in patients with chronic renal disease. Am J Med 1983; 75: 409-412 [PMID: 6604455]
18 Hozo SP, Djulbegovic B, Hozo I. Estimating the mean and variance from the median, range, and the size of a sample. BMC Med Res Methodol 2005; 5: 13 [PMID: 15840177 DOI: 10.1186/1471-2288-5-13]
19 DerSimonian R, Laird N. Meta-analysis in clinical trials. Control Clin Trials 1986; 7: 177-188 [PMID: 3802833]
20 Higgins JP, Green S. Cochrane Handbook for Systematic Reviews of Interventions. Version 5.1.0 (updated March 2011). The Cochrane Collaboration, 2011
21 Viel JF, Pobel D, Carré A. Incidence of leukaemia in young people around the La Hague nuclear waste reprocessing plant: a sensitivity analysis. Stat Med 1995; 14: 2459-2472 [PMID: 8711281]
22 Wells G, Shea B, O’connell D, Peterson J, Welch V, Losos M, Tugwell P. The Newcastle-Ottawa Scale (NOS) for assessing the quality of nonrandomised studies in meta-analyses. 2010
23 Stevens PE, Levin A; Kidney Disease: Improving Global Outcomes Chronic Kidney Disease Guideline Development Work Group Members. Evaluation and management of chronic kidney disease: synopsis of the kidney disease: improving global outcomes 2012 clinical practice guideline. Ann Intern Med 2013; 158: 825-830 [PMID: 23732715 DOI: 10.7326/0003-4819-158-11-201306040-00007]
24 Alvarez L, Puleo J, Balint JA. Investigation of gastrointestinal bleeding in patients with end stage renal disease. Am J Gastroenterol 1993; 88: 30-33 [PMID: 8420270]
25 Hung TH, Tseng CW, Tseng KC, Hsieh YH, Tsai CC, Tsai CC. Is end stage renal disease a risk factor for the mortality of cirrhotic patients with esophageal variceal bleeding? Hepatogastroenterology 2014; 61: 1871-1875 [PMID: 25713881]
26 Zuckerman GR, Cornette GL, Clouse RE, Harter HR. Upper gastrointestinal bleeding in patients with chronic renal failure. Ann Intern Med 1985; 102: 588-592 [PMID: 3872616]
27 Sugimoto M, Sakai K, Kita M, Imanishi J, Yamaoka Y. Prevalence of Helicobacter pylori infection in long-term hemodialysis patients. Kidney Int 2009; 75: 96-103 [PMID: 18843261 DOI: 10.1038/ki.2008.508]
28 Khedmat H, Ahmadzad-Asl M, Amini M, Lessan-Pezeshki M, Einollahi B, Pourfarziani V, Naseri MH, Davoudi F. Gastro-duodenal lesions and Helicobacter pylori infection in uremic patients and renal transplant recipients. Transplant Proc 2007; 39: 1003-1007 [PMID: 17524875 DOI: 10.1016/j.transproceed.2007.03.034]
29 Luo JC, Leu HB, Huang KW, Huang CC, Hou MC, Lin HC, Lee FY, Lee SD. Incidence of bleeding from gastroduodenal ulcers in patients with end-stage renal disease receiving hemodialysis. CMAJ 2011; 183: E1345-E1351 [PMID: 22083684 DOI: 10.1503/cmaj.110299]
30 Kalman RS , Pedrosa MC. Evidence-based review of gastrointestinal bleeding in the chronic kidney disease patient. Semin Dial 2015; 28: 68-74 [PMID: 25215610 DOI: 10.1111/sdi.12301]
31 Weng SC, Shu KH, Tarng DC, Tang YJ, Cheng CH, Chen CH, Yu TM, Chuang YW, Huang ST, Sheu WH, Wu MJ. In-hospital mortality risk estimation in patients with acute nonvariceal upper gastrointestinal bleeding undergoing hemodialysis: a retrospective cohort study. Ren Fail 2013; 35: 243-248 [PMID: 23336331 DOI: 10.3109/0886022X.2012.747140]
32 Holden RM, Harman GJ, Wang M, Holland D, Day AG. Major bleeding in hemodialysis patients. Clin J Am Soc Nephrol 2008; 3: 105-110 [PMID: 18003768 DOI: 10.2215/cjn.01810407]
33 Wasse H, Gillen DL, Ball AM, Kestenbaum BR, Seliger SL, Sherrard D, Stehman-Breen CO. Risk factors for upper
Hágendorn R et al . GI bleeding and chronic kidney disease
8425 December 21, 2017|Volume 23|Issue 47|WJG|www.wjgnet.com
gastrointestinal bleeding among end-stage renal disease patients. Kidney Int 2003; 64: 1455-1461 [PMID: 12969166 DOI: 10.1046/j.1523-1755.2003.00225.x]
34 Jalal DI, Chonchol M, Targher G. Disorders of hemostasis associated with chronic kidney disease. Semin Thromb Hemost 2010; 36: 34-40 [PMID: 20391294 DOI: 10.1055/s-0030-1248722]
P- Reviewer: Kozarek RA, Perez-Cuadrado-Robles E, Triantafyllou K S- Editor: Gong ZM L- Editor: A E- Editor: Huang Y
Hágendorn R et al . GI bleeding and chronic kidney disease
Disabling portosystemic encephalopathy in a non-cirrhotic patient: successful endovascular treatment of a giant inferior mesenteric-caval shunt via the left internal iliac vein
Luca de Martinis, Gloria Groppelli, Riccardo Corti, Lorenzo Paolo Moramarco, Pietro Quaretti, Pasquale De Cata, Mario Rotondi, Luca Chiovato
Luca de Martinis, Gloria Groppelli, Pasquale De Cata, Mario Rotondi, Luca Chiovato, Unit of Endocrinology and Internal Medicine, University of Pavia, ICS Maugeri SPA Società Benefit, Pavia 27100, Italy
Riccardo Corti, Lorenzo Paolo Moramarco, Pietro Quaretti, Unit of Interventional Radiology, Radiology Department, IRCCS Fondazione Policlinico San Matteo, Pavia 27100, Italy
ORCID number: Luca de Martinis (0000-0002-3272-3145); Gloria Groppelli (0000-0001-5017-0348); Riccardo Corti (0000 -0001-8741-4019); Lorenzo Paolo Moramarco (0000-0001-8958 -6068); Pietro Quaretti (0000-0002-8002-6432); Pasquale De Cata (0000-0002-6342-1203); Mario Rotondi (0000-0001-5597-3668); Luca Chiovato (0000-0001-7457-7353).
Author contributions: de Martinis L and Groppelli G performed the data collection; Moramarco LP and Quaretti P performed the vascular intervention; Corti R provided radiological support; de Martinis L, De Cata P, Quaretti P, Rotondi M and Chiovato L designed and wrote the report; all authors contributed to revision of this manuscript.
Informed consent statement: The patient gave her written informed consent authorizing use and disclosure of her protected health information.
Conflict-of-interest statement: All authors have no conflicts of interests to declare.
Open-Access: This article is an open-access article which was selected by an in-house editor and fully peer-reviewed by external reviewers. It is distributed in accordance with the Creative Commons Attribution Non Commercial (CC BY-NC 4.0) license, which permits others to distribute, remix, adapt, build upon this work non-commercially, and license their derivative works on different terms, provided the original work is properly cited and the use is non-commercial. See: http://creativecommons.org/licenses/by-nc/4.0/
Manuscript source: Unsolicited manuscript
Correspondence to: Luca de Martinis, MD, Doctor, Unit of Endocrinology and Internal Medicine, University of Pavia, ICS Maugeri SPA Società Benefit, Via Maugeri 10, Pavia 27100, Italy. [email protected]: +39-339-6940039Fax: +39-382-592692
Received: September 22, 2017Peer-review started: September 23, 2017First decision: October 11, 2017Revised: October 20, 2017Accepted: November 1, 2017Article in press: November 1, 2017Published online: December 21, 2017
AbstractHepatic encephalopathy is suspected in non-cirrhotic cases of encephalopathy because the symptoms are accompanied by hyperammonaemia. Some cases have been misdiagnosed as psychiatric diseases and consequently patients hospitalized in psychiatric institutions or geriatric facilities. Therefore, the importance of accurate diagnosis of this disease should be strongly emphasized. A 68-year-old female patient presented to the Emergency Room with confusion, lethargy, nausea and vomiting. Examination disclosed normal vital signs. Neurological examination revealed a minimally responsive woman without apparent focal deficits and normal reflexes. She had no history of hematologic disorders or alcohol abuse. Her brain TC did not demonstrate any intracranial abnormalities and electroencephalography did not reveal any subclinical epileptiform discharges. Her ammonia level was > 400 mg/dL (reference range < 75 mg/dL) while hepatitis viral markers were negative. The patient was started on lactulose, rifaximin and low-protein diet.
CASE REPORT
8426 December 21, 2017|Volume 23|Issue 47|WJG|www.wjgnet.com
Submit a Manuscript: http://www.f6publishing.com
DOI: 10.3748/wjg.v23.i47.8426
World J Gastroenterol 2017 December 21; 23(47): 8426-8431
ISSN 1007-9327 (print) ISSN 2219-2840 (online)
On the basis of the doppler ultrasound and abdomen computed tomography angiography findings, the decision was made to attempt portal venography which confirmed the presence of a giant portal-systemic venous shunt. Therefore, mechanic obliteration of shunt by interventional radiology was performed. As a consequence, mesenteric venous blood returned to hepatopetally flow into the liver, metabolic detoxification of ammonia increased and hepatic encephalopathy subsided. It is crucial that physicians immediately recognize the presence of non-cirrhotic encephalopathy, in view of the potential therapeutic resolution after accurate diagnosis and appropriate treatments.
Key words: Non-cirrhotic patient; Portosystemic shunt; Hyperammonaemia; Interventional radiology; Mechanical embolization; Encephalopathy
© The Author(s) 2017. Published by Baishideng Publishing Group Inc. All rights reserved.
Core tip: We present the case of a non-cirrhotic female patient who first presented to the Emergency Room with acute hyperammonemic encephalopathy causing massive relapsing neurological symptoms due to a huge inferior mesenteric-caval shunt via the left internal iliac vein which was successfully cured by interventional radiology procedure. Therefore, the importance of accurate diagnosis and appropriate treatment of this disease should be strongly emphasized.
de Martinis L, Groppelli G, Corti R, Moramarco LP, Quaretti P, De Cata P, Rotondi M, Chiovato L. Disabling portosystemic encephalopathy in a non-cirrhotic patient: Successful endovascular treatment of a giant inferior mesenteric-caval shunt via the left internal iliac vein. World J Gastroenterol 2017; 23(47): 8426-8431 Available from: URL: http://www.wjgnet.com/1007-9327/full/v23/i47/8426.htm DOI: http://dx.doi.org/10.3748/wjg.v23.i47.8426
INTRODUCTIONHepatic encephalopathy (HE) most commonly occurs in patients with cirrhosis and end-stage liver disease. Non cirrhosis-related HE is, by far, less frequently encountered[1]. The development of HE in the absence of liver disease is mainly dependent upon the presence of spontaneous portal vein thrombosis or portosystemic shunts which ultimately lead to hyperammonaemia[1]. At difference with HE associated with end-stage liver disease, in these latter cases interventional radiology procedures provide a chance of complete remission[1-3]. Abdominal trauma, prior surgery, post-natal viral or hepatotoxic injuries could potentially induce the occurrence of portosystemic shunts without liver disease. There are, however, shunts retaining the onphalomensenteric venous system which have in most
cases a congenital origin[1,4-9]. Owing to overlapping neurological symptoms due to hyperammonaemia, at least some patients with HE have been misdiagnosed as harbouring psychiatric diseases (such as dementia, depression and others) with subsequent hospitalization in psychiatric institutions or geriatric facilities[9,10]. The above cited evidences highlight the need for an accurate differential diagnosis between the spectrum of neurologic conditions and the, by far less frequent, non cirrhosis related HE, especially in view of the potential therapeutic resolution of the latter condition[1]. We hereby report the case of a non-cirrhotic patient who first presented with acute hyperammonemic encephalopathy causing massive relapsing neurological symptoms due to a huge inferior mesenteric-caval shunt via the left internal iliac vein which was successfully cured by interventional radiology procedure.
CASE REPORTA 68-year-old female patient presented three times to the Emergency Room with confusion, lethargy, dysarthria, nausea and vomiting. Each time the first evaluation disclosed normal vital signs where neurological examination always revealed a minimally responsive woman without apparent focal deficits but with asterixis and increased tendon reflexes. The crisis resolved after conservative therapy. Brain computed tomography (CT) showed chronic cerebral vascular disease, absence of any acute intracranial lesions and electroencephalography did not reveal any subclinical epileptiform sign. Chest x-ray did not reveal any insurgent abnormalities, except for outcome signs of fractures of the Ⅳ, Ⅴ and Ⅵ ribs that patients reported two months before because of an accidental fall. Normal levels of hemoglobin, leukocytes, platelets, glucose, electrolytes and creatinine were found. In the last admission serum ammonia level was finally measured and found to be far above the normal value (nv < 75 mg/dL): > 400 mg/dL. Based on these findings, the patient was eventually transferred to our Internal Medicine department and started on lactulose, rifaximin, low-protein diet. The past medical history revealed: normal growth and pubertal development with no history of congenital malformation, left quadrantectomy plus lymphadenectomy followed by radiotherapy and chemotherapy with tamoxifen for breast carcinoma in 2003 (at that time patient was declared free of disease and was not taking any anti-cancer therapy); hypertension in treatment with beta-blockers and ace-inhibitors; mechanic aortic valve replacement due to severe aortic stenosis for which was taking oral anticoagulants and pacemaker implantation in 2007; depression and migraine self-treated. She had no history of alcohol abuse, hematologic disorder or liver disease. The biochemical assessment showed: normal thyroid function, euglycemia, normal levels of ACTH and cortisol, normal GH with low IGF-1 for age (37 ng/mL
8427 December 21, 2017|Volume 23|Issue 47|WJG|www.wjgnet.com
De Martinis L et al . Portosystemic shunt-related encephalophaty in non-cirrhotic patient
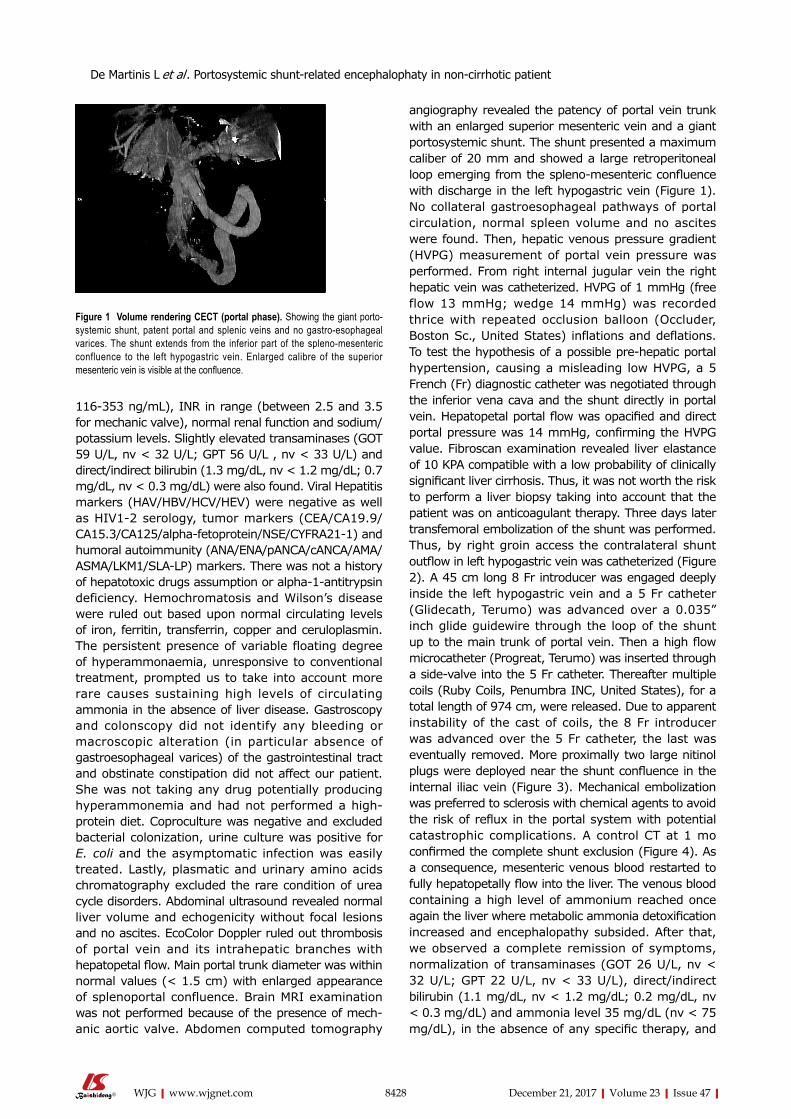
116-353 ng/mL), INR in range (between 2.5 and 3.5 for mechanic valve), normal renal function and sodium/potassium levels. Slightly elevated transaminases (GOT 59 U/L, nv < 32 U/L; GPT 56 U/L , nv < 33 U/L) and direct/indirect bilirubin (1.3 mg/dL, nv < 1.2 mg/dL; 0.7 mg/dL, nv < 0.3 mg/dL) were also found. Viral Hepatitis markers (HAV/HBV/HCV/HEV) were negative as well as HIV1-2 serology, tumor markers (CEA/CA19.9/CA15.3/CA125/alpha-fetoprotein/NSE/CYFRA21-1) and humoral autoimmunity (ANA/ENA/pANCA/cANCA/AMA/ASMA/LKM1/SLA-LP) markers. There was not a history of hepatotoxic drugs assumption or alpha-1-antitrypsin deficiency. Hemochromatosis and Wilson’s disease were ruled out based upon normal circulating levels of iron, ferritin, transferrin, copper and ceruloplasmin. The persistent presence of variable floating degree of hyperammonaemia, unresponsive to conventional treatment, prompted us to take into account more rare causes sustaining high levels of circulating ammonia in the absence of liver disease. Gastroscopy and colonscopy did not identify any bleeding or macroscopic alteration (in particular absence of gastroesophageal varices) of the gastrointestinal tract and obstinate constipation did not affect our patient. She was not taking any drug potentially producing hyperammonemia and had not performed a high-protein diet. Coproculture was negative and excluded bacterial colonization, urine culture was positive for E. coli and the asymptomatic infection was easily treated. Lastly, plasmatic and urinary amino acids chromatography excluded the rare condition of urea cycle disorders. Abdominal ultrasound revealed normal liver volume and echogenicity without focal lesions and no ascites. EcoColor Doppler ruled out thrombosis of portal vein and its intrahepatic branches with hepatopetal flow. Main portal trunk diameter was within normal values (< 1.5 cm) with enlarged appearance of splenoportal confluence. Brain MRI examination was not performed because of the presence of mech-anic aortic valve. Abdomen computed tomography
angiography revealed the patency of portal vein trunk with an enlarged superior mesenteric vein and a giant portosystemic shunt. The shunt presented a maximum caliber of 20 mm and showed a large retroperitoneal loop emerging from the spleno-mesenteric confluence with discharge in the left hypogastric vein (Figure 1). No collateral gastroesophageal pathways of portal circulation, normal spleen volume and no ascites were found. Then, hepatic venous pressure gradient (HVPG) measurement of portal vein pressure was performed. From right internal jugular vein the right hepatic vein was catheterized. HVPG of 1 mmHg (free flow 13 mmHg; wedge 14 mmHg) was recorded thrice with repeated occlusion balloon (Occluder, Boston Sc., United States) inflations and deflations. To test the hypothesis of a possible pre-hepatic portal hypertension, causing a misleading low HVPG, a 5 French (Fr) diagnostic catheter was negotiated through the inferior vena cava and the shunt directly in portal vein. Hepatopetal portal flow was opacified and direct portal pressure was 14 mmHg, confirming the HVPG value. Fibroscan examination revealed liver elastance of 10 KPA compatible with a low probability of clinically significant liver cirrhosis. Thus, it was not worth the risk to perform a liver biopsy taking into account that the patient was on anticoagulant therapy. Three days later transfemoral embolization of the shunt was performed. Thus, by right groin access the contralateral shunt outflow in left hypogastric vein was catheterized (Figure 2). A 45 cm long 8 Fr introducer was engaged deeply inside the left hypogastric vein and a 5 Fr catheter (Glidecath, Terumo) was advanced over a 0.035”inch glide guidewire through the loop of the shunt up to the main trunk of portal vein. Then a high flow microcatheter (Progreat, Terumo) was inserted through a side-valve into the 5 Fr catheter. Thereafter multiple coils (Ruby Coils, Penumbra INC, United States), for a total length of 974 cm, were released. Due to apparent instability of the cast of coils, the 8 Fr introducer was advanced over the 5 Fr catheter, the last was eventually removed. More proximally two large nitinol plugs were deployed near the shunt confluence in the internal iliac vein (Figure 3). Mechanical embolization was preferred to sclerosis with chemical agents to avoid the risk of reflux in the portal system with potential catastrophic complications. A control CT at 1 mo confirmed the complete shunt exclusion (Figure 4). As a consequence, mesenteric venous blood restarted to fully hepatopetally flow into the liver. The venous blood containing a high level of ammonium reached once again the liver where metabolic ammonia detoxification increased and encephalopathy subsided. After that, we observed a complete remission of symptoms, normalization of transaminases (GOT 26 U/L, nv < 32 U/L; GPT 22 U/L, nv < 33 U/L), direct/indirect bilirubin (1.1 mg/dL, nv < 1.2 mg/dL; 0.2 mg/dL, nv < 0.3 mg/dL) and ammonia level 35 mg/dL (nv < 75 mg/dL), in the absence of any specific therapy, and
8428 December 21, 2017|Volume 23|Issue 47|WJG|www.wjgnet.com
Figure 1 Volume rendering CECT (portal phase). Showing the giant porto-systemic shunt, patent portal and splenic veins and no gastro-esophageal varices. The shunt extends from the inferior part of the spleno-mesenteric confluence to the left hypogastric vein. Enlarged calibre of the superior mesenteric vein is visible at the confluence.
De Martinis L et al . Portosystemic shunt-related encephalophaty in non-cirrhotic patient
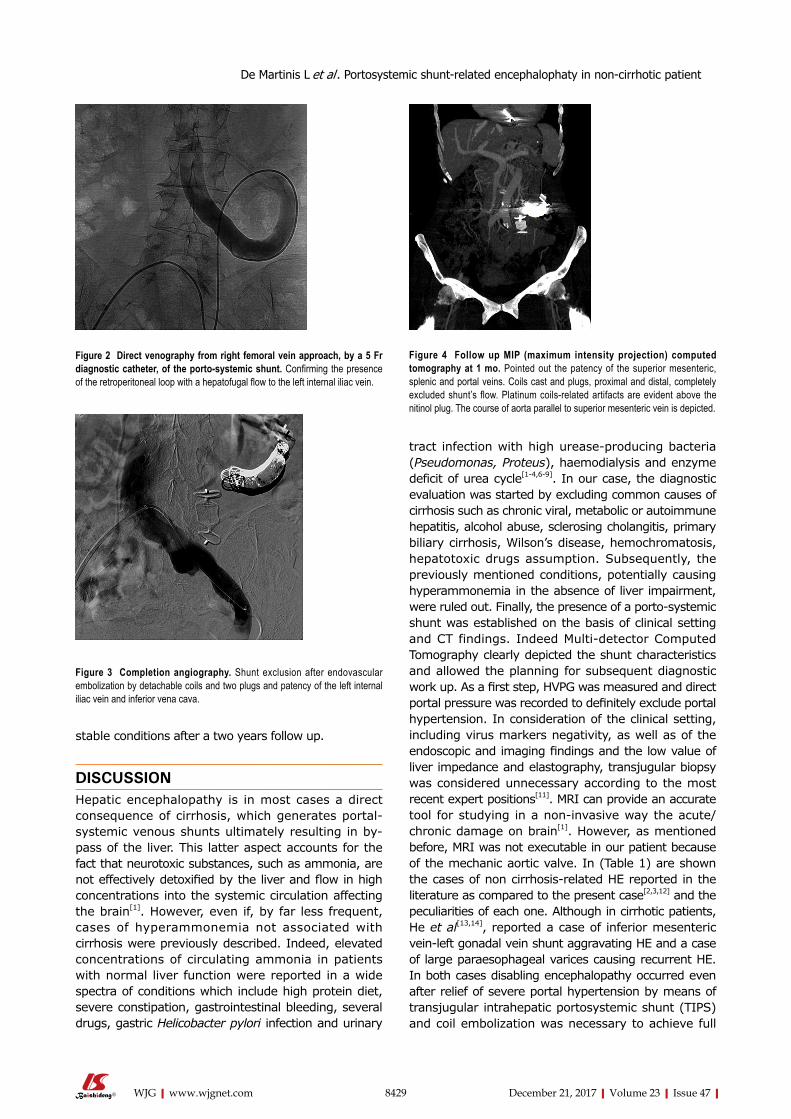
8429 December 21, 2017|Volume 23|Issue 47|WJG|www.wjgnet.com
tract infection with high urease-producing bacteria (Pseudomonas, Proteus), haemodialysis and enzyme deficit of urea cycle[1-4,6-9]. In our case, the diagnostic evaluation was started by excluding common causes of cirrhosis such as chronic viral, metabolic or autoimmune hepatitis, alcohol abuse, sclerosing cholangitis, primary biliary cirrhosis, Wilson’s disease, hemochromatosis, hepatotoxic drugs assumption. Subsequently, the previously mentioned conditions, potentially causing hyperammonemia in the absence of liver impairment, were ruled out. Finally, the presence of a porto-systemic shunt was established on the basis of clinical setting and CT findings. Indeed Multi-detector Computed Tomography clearly depicted the shunt characteristics and allowed the planning for subsequent diagnostic work up. As a first step, HVPG was measured and direct portal pressure was recorded to definitely exclude portal hypertension. In consideration of the clinical setting, including virus markers negativity, as well as of the endoscopic and imaging findings and the low value of liver impedance and elastography, transjugular biopsy was considered unnecessary according to the most recent expert positions[11]. MRI can provide an accurate tool for studying in a non-invasive way the acute/chronic damage on brain[1]. However, as mentioned before, MRI was not executable in our patient because of the mechanic aortic valve. In (Table 1) are shown the cases of non cirrhosis-related HE reported in the literature as compared to the present case[2,3,12] and the peculiarities of each one. Although in cirrhotic patients, He et al[13,14], reported a case of inferior mesenteric vein-left gonadal vein shunt aggravating HE and a case of large paraesophageal varices causing recurrent HE. In both cases disabling encephalopathy occurred even after relief of severe portal hypertension by means of transjugular intrahepatic portosystemic shunt (TIPS) and coil embolization was necessary to achieve full
stable conditions after a two years follow up.
DISCUSSIONHepatic encephalopathy is in most cases a direct consequence of cirrhosis, which generates portal-systemic venous shunts ultimately resulting in by-pass of the liver. This latter aspect accounts for the fact that neurotoxic substances, such as ammonia, are not effectively detoxified by the liver and flow in high concentrations into the systemic circulation affecting the brain[1]. However, even if, by far less frequent, cases of hyperammonemia not associated with cirrhosis were previously described. Indeed, elevated concentrations of circulating ammonia in patients with normal liver function were reported in a wide spectra of conditions which include high protein diet, severe constipation, gastrointestinal bleeding, several drugs, gastric Helicobacter pylori infection and urinary
Figure 2 Direct venography from right femoral vein approach, by a 5 Fr diagnostic catheter, of the porto-systemic shunt. Confirming the presence of the retroperitoneal loop with a hepatofugal flow to the left internal iliac vein.
Figure 3 Completion angiography. Shunt exclusion after endovascular embolization by detachable coils and two plugs and patency of the left internal iliac vein and inferior vena cava.
Figure 4 Follow up MIP (maximum intensity projection) computed tomography at 1 mo. Pointed out the patency of the superior mesenteric, splenic and portal veins. Coils cast and plugs, proximal and distal, completely excluded shunt’s flow. Platinum coils-related artifacts are evident above the nitinol plug. The course of aorta parallel to superior mesenteric vein is depicted.
De Martinis L et al . Portosystemic shunt-related encephalophaty in non-cirrhotic patient
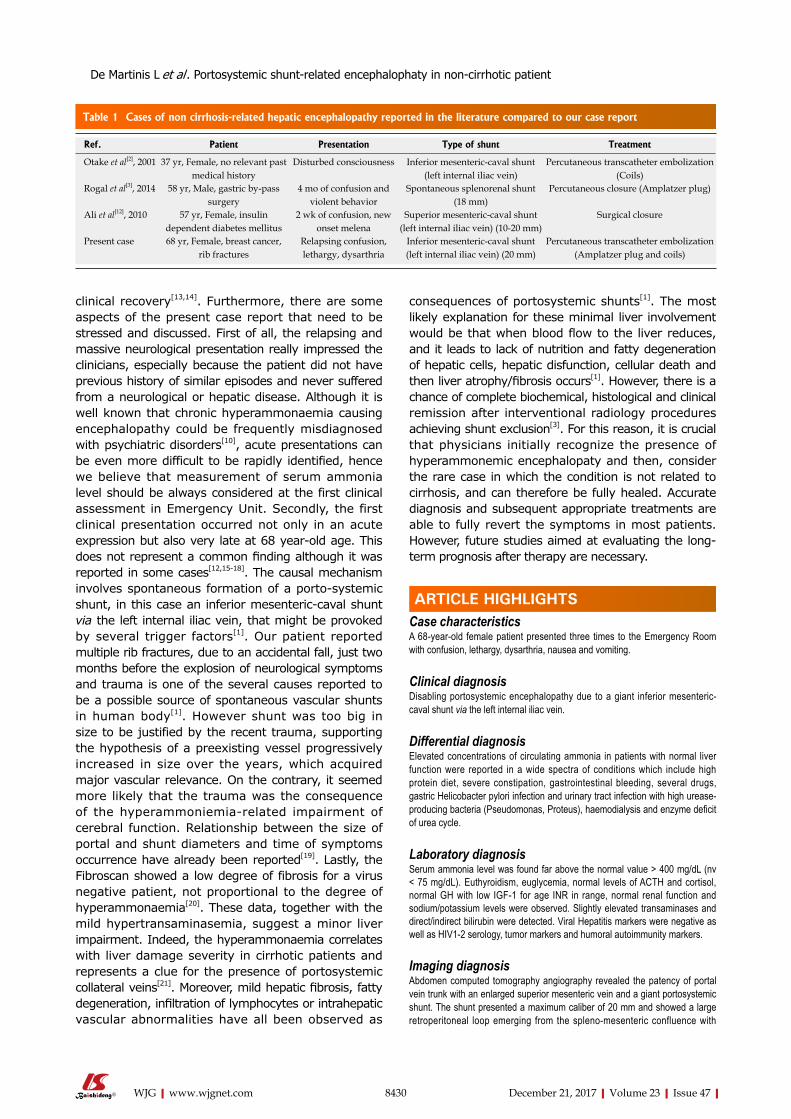
8430 December 21, 2017|Volume 23|Issue 47|WJG|www.wjgnet.com
clinical recovery[13,14]. Furthermore, there are some aspects of the present case report that need to be stressed and discussed. First of all, the relapsing and massive neurological presentation really impressed the clinicians, especially because the patient did not have previous history of similar episodes and never suffered from a neurological or hepatic disease. Although it is well known that chronic hyperammonaemia causing encephalopathy could be frequently misdiagnosed with psychiatric disorders[10], acute presentations can be even more difficult to be rapidly identified, hence we believe that measurement of serum ammonia level should be always considered at the first clinical assessment in Emergency Unit. Secondly, the first clinical presentation occurred not only in an acute expression but also very late at 68 year-old age. This does not represent a common finding although it was reported in some cases[12,15-18]. The causal mechanism involves spontaneous formation of a porto-systemic shunt, in this case an inferior mesenteric-caval shunt via the left internal iliac vein, that might be provoked by several trigger factors[1]. Our patient reported multiple rib fractures, due to an accidental fall, just two months before the explosion of neurological symptoms and trauma is one of the several causes reported to be a possible source of spontaneous vascular shunts in human body[1]. However shunt was too big in size to be justified by the recent trauma, supporting the hypothesis of a preexisting vessel progressively increased in size over the years, which acquired major vascular relevance. On the contrary, it seemed more likely that the trauma was the consequence of the hyperammoniemia-related impairment of cerebral function. Relationship between the size of portal and shunt diameters and time of symptoms occurrence have already been reported[19]. Lastly, the Fibroscan showed a low degree of fibrosis for a virus negative patient, not proportional to the degree of hyperammonaemia[20]. These data, together with the mild hypertransaminasemia, suggest a minor liver impairment. Indeed, the hyperammonaemia correlates with liver damage severity in cirrhotic patients and represents a clue for the presence of portosystemic collateral veins[21]. Moreover, mild hepatic fibrosis, fatty degeneration, infiltration of lymphocytes or intrahepatic vascular abnormalities have all been observed as
consequences of portosystemic shunts[1]. The most likely explanation for these minimal liver involvement would be that when blood flow to the liver reduces, and it leads to lack of nutrition and fatty degeneration of hepatic cells, hepatic disfunction, cellular death and then liver atrophy/fibrosis occurs[1]. However, there is a chance of complete biochemical, histological and clinical remission after interventional radiology procedures achieving shunt exclusion[3]. For this reason, it is crucial that physicians initially recognize the presence of hyperammonemic encephalopaty and then, consider the rare case in which the condition is not related to cirrhosis, and can therefore be fully healed. Accurate diagnosis and subsequent appropriate treatments are able to fully revert the symptoms in most patients. However, future studies aimed at evaluating the long-term prognosis after therapy are necessary.
ARTICLE HIGHLIGHTSCase characteristicsA 68-year-old female patient presented three times to the Emergency Room with confusion, lethargy, dysarthria, nausea and vomiting.
Clinical diagnosisDisabling portosystemic encephalopathy due to a giant inferior mesenteric-caval shunt via the left internal iliac vein.
Differential diagnosisElevated concentrations of circulating ammonia in patients with normal liver function were reported in a wide spectra of conditions which include high protein diet, severe constipation, gastrointestinal bleeding, several drugs, gastric Helicobacter pylori infection and urinary tract infection with high urease-producing bacteria (Pseudomonas, Proteus), haemodialysis and enzyme deficit of urea cycle.
Laboratory diagnosisSerum ammonia level was found far above the normal value > 400 mg/dL (nv < 75 mg/dL). Euthyroidism, euglycemia, normal levels of ACTH and cortisol, normal GH with low IGF-1 for age INR in range, normal renal function and sodium/potassium levels were observed. Slightly elevated transaminases and direct/indirect bilirubin were detected. Viral Hepatitis markers were negative as well as HIV1-2 serology, tumor markers and humoral autoimmunity markers.
Imaging diagnosisAbdomen computed tomography angiography revealed the patency of portal vein trunk with an enlarged superior mesenteric vein and a giant portosystemic shunt. The shunt presented a maximum caliber of 20 mm and showed a large retroperitoneal loop emerging from the spleno-mesenteric confluence with
Table 1 Cases of non cirrhosis-related hepatic encephalopathy reported in the literature compared to our case report
Ref. Patient Presentation Type of shunt Treatment
Otake et al[2], 2001 37 yr, Female, no relevant past medical history
Disturbed consciousness Inferior mesenteric-caval shunt (left internal iliac vein)
Percutaneous transcatheter embolization (Coils)
Rogal et al[3], 2014 58 yr, Male, gastric by-pass surgery
4 mo of confusion and violent behavior
Spontaneous splenorenal shunt (18 mm)
Percutaneous closure (Amplatzer plug)
Ali et al[12], 2010 57 yr, Female, insulin dependent diabetes mellitus
2 wk of confusion, new onset melena
Superior mesenteric-caval shunt (left internal iliac vein) (10-20 mm)
Surgical closure
Present case 68 yr, Female, breast cancer, rib fractures
Relapsing confusion, lethargy, dysarthria
Inferior mesenteric-caval shunt (left internal iliac vein) (20 mm)
Percutaneous transcatheter embolization (Amplatzer plug and coils)
ARTICLE HIGHLIGHTS
De Martinis L et al . Portosystemic shunt-related encephalophaty in non-cirrhotic patient
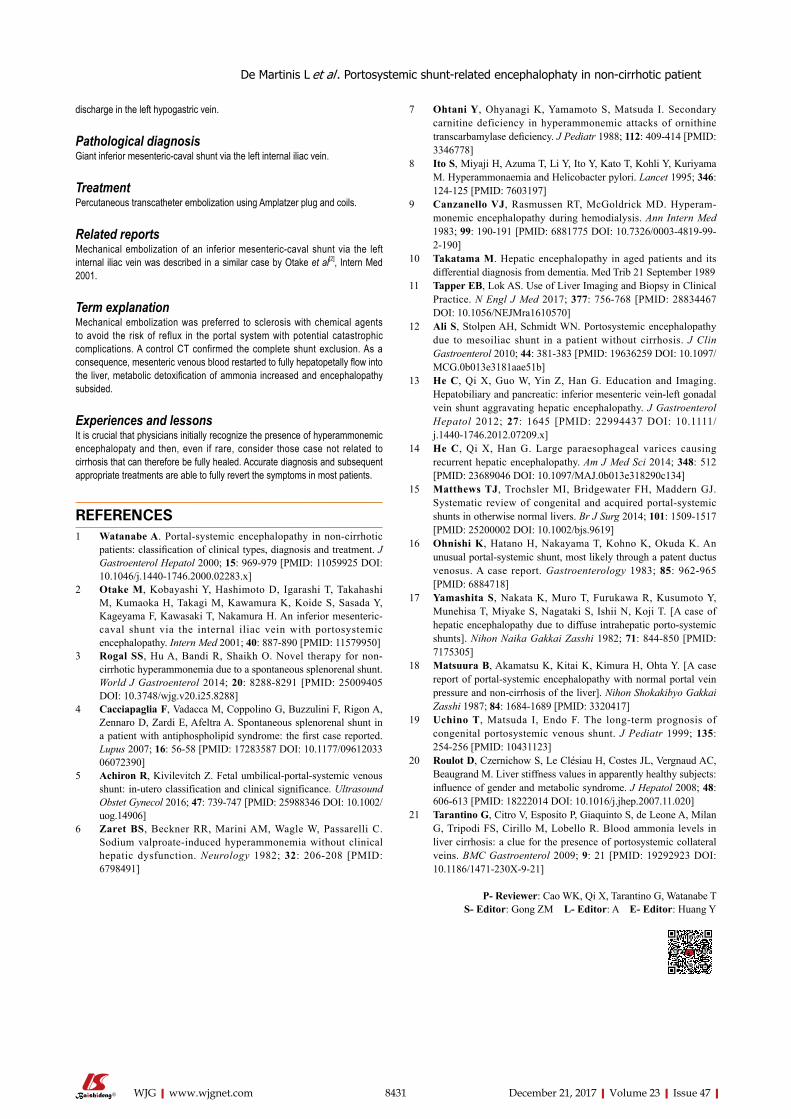
8431 December 21, 2017|Volume 23|Issue 47|WJG|www.wjgnet.com
discharge in the left hypogastric vein.
Pathological diagnosisGiant inferior mesenteric-caval shunt via the left internal iliac vein.
TreatmentPercutaneous transcatheter embolization using Amplatzer plug and coils.
Related reportsMechanical embolization of an inferior mesenteric-caval shunt via the left internal iliac vein was described in a similar case by Otake et al[2], Intern Med 2001.
Term explanationMechanical embolization was preferred to sclerosis with chemical agents to avoid the risk of reflux in the portal system with potential catastrophic complications. A control CT confirmed the complete shunt exclusion. As a consequence, mesenteric venous blood restarted to fully hepatopetally flow into the liver, metabolic detoxification of ammonia increased and encephalopathy subsided.
Experiences and lessonsIt is crucial that physicians initially recognize the presence of hyperammonemic encephalopaty and then, even if rare, consider those case not related to cirrhosis that can therefore be fully healed. Accurate diagnosis and subsequent appropriate treatments are able to fully revert the symptoms in most patients.
REFERENCES1 Watanabe A. Portal-systemic encephalopathy in non-cirrhotic
patients: classification of clinical types, diagnosis and treatment. J Gastroenterol Hepatol 2000; 15: 969-979 [PMID: 11059925 DOI: 10.1046/j.1440-1746.2000.02283.x]
2 Otake M, Kobayashi Y, Hashimoto D, Igarashi T, Takahashi M, Kumaoka H, Takagi M, Kawamura K, Koide S, Sasada Y, Kageyama F, Kawasaki T, Nakamura H. An inferior mesenteric-caval shunt via the internal iliac vein with portosystemic encephalopathy. Intern Med 2001; 40: 887-890 [PMID: 11579950]
3 Rogal SS, Hu A, Bandi R, Shaikh O. Novel therapy for non-cirrhotic hyperammonemia due to a spontaneous splenorenal shunt. World J Gastroenterol 2014; 20: 8288-8291 [PMID: 25009405 DOI: 10.3748/wjg.v20.i25.8288]
4 Cacciapaglia F, Vadacca M, Coppolino G, Buzzulini F, Rigon A, Zennaro D, Zardi E, Afeltra A. Spontaneous splenorenal shunt in a patient with antiphospholipid syndrome: the first case reported. Lupus 2007; 16: 56-58 [PMID: 17283587 DOI: 10.1177/0961203306072390]
5 Achiron R, Kivilevitch Z. Fetal umbilical-portal-systemic venous shunt: in-utero classification and clinical significance. Ultrasound Obstet Gynecol 2016; 47: 739-747 [PMID: 25988346 DOI: 10.1002/uog.14906]
6 Zaret BS, Beckner RR, Marini AM, Wagle W, Passarelli C. Sodium valproate-induced hyperammonemia without clinical hepatic dysfunction. Neurology 1982; 32: 206-208 [PMID: 6798491]
7 Ohtani Y, Ohyanagi K, Yamamoto S, Matsuda I. Secondary carnitine deficiency in hyperammonemic attacks of ornithine transcarbamylase deficiency. J Pediatr 1988; 112: 409-414 [PMID: 3346778]
8 Ito S, Miyaji H, Azuma T, Li Y, Ito Y, Kato T, Kohli Y, Kuriyama M. Hyperammonaemia and Helicobacter pylori. Lancet 1995; 346: 124-125 [PMID: 7603197]
9 Canzanello VJ, Rasmussen RT, McGoldrick MD. Hyperam-monemic encephalopathy during hemodialysis. Ann Intern Med 1983; 99: 190-191 [PMID: 6881775 DOI: 10.7326/0003-4819-99-2-190]
10 Takatama M. Hepatic encephalopathy in aged patients and its differential diagnosis from dementia. Med Trib 21 September 1989
11 Tapper EB, Lok AS. Use of Liver Imaging and Biopsy in Clinical Practice. N Engl J Med 2017; 377: 756-768 [PMID: 28834467 DOI: 10.1056/NEJMra1610570]
12 Ali S, Stolpen AH, Schmidt WN. Portosystemic encephalopathy due to mesoiliac shunt in a patient without cirrhosis. J Clin Gastroenterol 2010; 44: 381-383 [PMID: 19636259 DOI: 10.1097/MCG.0b013e3181aae51b]
13 He C, Qi X, Guo W, Yin Z, Han G. Education and Imaging. Hepatobiliary and pancreatic: inferior mesenteric vein-left gonadal vein shunt aggravating hepatic encephalopathy. J Gastroenterol Hepatol 2012; 27: 1645 [PMID: 22994437 DOI: 10.1111/j.1440-1746.2012.07209.x]
14 He C, Qi X, Han G. Large paraesophageal varices causing recurrent hepatic encephalopathy. Am J Med Sci 2014; 348: 512 [PMID: 23689046 DOI: 10.1097/MAJ.0b013e318290c134]
15 Matthews TJ, Trochsler MI, Bridgewater FH, Maddern GJ. Systematic review of congenital and acquired portal-systemic shunts in otherwise normal livers. Br J Surg 2014; 101: 1509-1517 [PMID: 25200002 DOI: 10.1002/bjs.9619]
16 Ohnishi K, Hatano H, Nakayama T, Kohno K, Okuda K. An unusual portal-systemic shunt, most likely through a patent ductus venosus. A case report. Gastroenterology 1983; 85: 962-965 [PMID: 6884718]
17 Yamashita S, Nakata K, Muro T, Furukawa R, Kusumoto Y, Munehisa T, Miyake S, Nagataki S, Ishii N, Koji T. [A case of hepatic encephalopathy due to diffuse intrahepatic porto-systemic shunts]. Nihon Naika Gakkai Zasshi 1982; 71: 844-850 [PMID: 7175305]
18 Matsuura B, Akamatsu K, Kitai K, Kimura H, Ohta Y. [A case report of portal-systemic encephalopathy with normal portal vein pressure and non-cirrhosis of the liver]. Nihon Shokakibyo Gakkai Zasshi 1987; 84: 1684-1689 [PMID: 3320417]
19 Uchino T, Matsuda I, Endo F. The long-term prognosis of congenital portosystemic venous shunt. J Pediatr 1999; 135: 254-256 [PMID: 10431123]
20 Roulot D, Czernichow S, Le Clésiau H, Costes JL, Vergnaud AC, Beaugrand M. Liver stiffness values in apparently healthy subjects: influence of gender and metabolic syndrome. J Hepatol 2008; 48: 606-613 [PMID: 18222014 DOI: 10.1016/j.jhep.2007.11.020]
21 Tarantino G, Citro V, Esposito P, Giaquinto S, de Leone A, Milan G, Tripodi FS, Cirillo M, Lobello R. Blood ammonia levels in liver cirrhosis: a clue for the presence of portosystemic collateral veins. BMC Gastroenterol 2009; 9: 21 [PMID: 19292923 DOI: 10.1186/1471-230X-9-21]
P- Reviewer: Cao WK, Qi X, Tarantino G, Watanabe T S- Editor: Gong ZM L- Editor: A E- Editor: Huang Y
De Martinis L et al . Portosystemic shunt-related encephalophaty in non-cirrhotic patient
Wernicke encephalopathy in a patient after liver transplantation: A case report
Bin Xie, Zhong-Zhou Si, Wei-Ting Tang, Hai-Zhi Qi, Ting Li
Bin Xie, Zhong-Zhou Si, Hai-Zhi Qi, Ting Li, Organ Transplantation Center, The Second Xiangya Hospital, Central South University, Changsha 410011, Hunan Province, China
Wei-Ting Tang, Department of Neurology, Xiangya Hospital, Central South University, Changsha 410008, Hunan Province, China
ORCID number: Bin Xie (0000000162977579); ZhongZhou Si (0000000320213081); WeiTing Tang (000000031403 9582); HaiZhi Qi (0000000244978110); Ting Li (00000002 93667116).
Author contributions: Xie B designed the study and wrote the manuscript; Si ZZ and Li T performed the operation; Xie B and Tang WT collected the clinical data; Qi HZ and Li T were involved in editing of the manuscript and provided financial support.
Supported by National Natural Science Foundation of China, No. 81200326; Natural Science Foundation of Hunan Province, No. 2016JJ3165.
Informed consent statement: The patient involved in this study gave his written informed consent authorizing use and disclosure of his protected health information.
Conflict-of-interest statement: All the authors have no conflicts of interest to declare.
Open-Access: This article is an openaccess article which was selected by an inhouse editor and fully peerreviewed by external reviewers. It is distributed in accordance with the Creative Commons Attribution Non Commercial (CC BYNC 4.0) license, which permits others to distribute, remix, adapt, build upon this work noncommercially, and license their derivative works on different terms, provided the original work is properly cited and the use is noncommercial. See: http://creativecommons.org/licenses/bync/4.0/
Manuscript source: Unsolicited manuscript
Correspondence to: Ting Li, MD, PhD, Associate Research Scientist, Surgeon, Organ Transplantation Center, The Second Xiangya Hospital, Central South University, No. 139 Middle
Renmin Road, Changsha 410011, Hunan Province, China. [email protected]: +8673185295808Fax: +8673185295808
Received: October 20, 2017Peer-review started: October 23, 2017First decision: November 8, 2017Revised: November 22, 2017Accepted: November 27, 2017 Article in press: November 27, 2017Published online: December 21, 2017
AbstractWernicke encephalopathy (WE) is an acute neurological disorder resulting from vitamin B1 deficiency, which is common in chronic alcoholism and is rare in acute liver failure. So far, there are 2 cases of WE reported after liver transplantation. Here, we report a case of a 45-year-old nonalcoholic male patient who developed psychiatric and neurological disturbance 15 d after receiving orthotopic liver transplantation because of hepatitis B-related cirrhosis and portal hypertension. Brain magnetic resonance imaging (MRI) showed symmetric high-signal intensities in the periaqued-uctal area. The patient was diagnosed with WE and given intravenous high-dose vitamin B1 immediately. His neurological disturbance resolved in 7 d after receiving the vitamin B1. Brain MRI after 5 mo showed nearly complete recovery. Most WE cases may be misdiagnosed in patients after liver transplantation, and we should pay more attention to its onset.
Key words: Liver transplantation; Thiamine deficiency; Wernicke encephalopathy; Magnetic resonance imaging; Prevention; Pharmacotherapy
© The Author(s) 2017. Published by Baishideng Publishing Group Inc. All rights reserved.
CASE REPORT
8432 December 21, 2017|Volume 23|Issue 47|WJG|www.wjgnet.com
Submit a Manuscript: http://www.f6publishing.com
DOI: 10.3748/wjg.v23.i47.8432
World J Gastroenterol 2017 December 21; 23(47): 8432-8436
ISSN 1007-9327 (print) ISSN 2219-2840 (online)
Core tip: Wernicke encephalopathy (WE) is rare in acute liver failure. This is the third case of WE after liver transplantation reported. Most WE may be misdiagnosed in patients after liver transplantation.
Xie B, Si ZZ, Tang WT, Qi HZ, Li T. Wernicke encephalopathy in a patient after liver transplantation: A case report. World J Gastroenterol 2017; 23(47): 84328436 Available from: URL: http://www.wjgnet.com/10079327/full/v23/i47/8432.htm DOI: http://dx.doi.org/10.3748/wjg.v23.i47.8432
INTRODUCTIONWernicke encephalopathy (WE) was first reported by Carl Wernicke in 1881[1] and is an acute neurological disorder resulting from vitamin B1 deficiency, which is common in chronic alcoholism. Its typical triad symptoms are ataxia, nystagmus and ophthalmoplegia, and confusion. The prevalence rate of WE has been reported as 0.4%2.8%[2]. It was overlooked in 68% of alcoholics and 94% of nonalcoholics[3], and the mortality rate reached 20%[4]. With an increasing morbidity, nonalcoholic WE is difficult to diagnose because of its various presentation. Since WE after liver transplantation can be seen in only a few reports[57], we present a nonalcoholic patient who developed WE after liver transplantation.
CASE REPORTA 45yearold male patient was admitted to our hospital for liver transplantation because of nausea, abdominal distension for 3 mo, and unconsciousness for 3 d. His preoperative diagnoses were decompensatory cirrhosis, hepatic encephalopathy, portal hypertension and chronic hepatitis B. His hepatic encephalopathy was characterized by changes of behavior, disorientation, confusion and flapping tremor; his Glasgow coma score was 10 (E2V3M5). He underwent successful orthotopic liver transplantation with a model of endstage liver disease score of 32.3 on January 1, 2017, and received imipenemcilastin sodium to prevent infection, FK506 + MMF + pred to prevent acute rejection. Because of his gastrointestinal disorder and malnutrition, parenteral nutrition was given from 3 d before transplantation till 22 d after transplantation. The components were glucose, lipids, amino acids electrolytes and insulin, while the proportion and amount differed in accordance with enteral nutrition status.
The transplanted liver recovered smoothly, without severe complications. The antibiotic therapy was discontinued 10 d after transplantation. On the 15th postoperative day, he became irritable, raving and lethargic, and appeared to gradually develop unclear enunciation, difficulty in grasping objects, and
memory loss, without nystagmus or diplopia. He had no paresthesia, muscle tremor or incontinence and no dysfunction in his cardiac, respiratory and urinary system. He had no history of alcohol consumption or psychiatric disorders. At the time, his weight was 56.0 kg, being 54.8 kg before the transplantation; his height was 172 cm and his body mass index was then 18.9 kg/m2. His temperature was 36.8 °C, heart rate was 82/min, respiration was 16/min and blood pressure was 108/68 mmHg. Pupils were equal and reactive to light. In terms of laboratory examinations, blood routine test showed white blood cell count was 8.83 × 10⁹/L, with 87.8% neutrophils and 6.2% lymphocytes, red blood cell count was 2.63 × 10¹²/L, hemoglobin concentration was 81 g/L, and platelet count was 83 × 109/L. Liver function test showed alanine aminotransferase of 13.3 U/L, aspartate aminotransferase of 23.3 U/L, albumin of 39.8 g/L, and total bilirubin of 17.8 μmol/L. Besides the renal function test, the serum electrolytes test, coagulation function test, blood ammonia test and arterial blood gas were normal. The random blood glucose fluctuated from 4.9 mmol/L to 8.4 mmol/L, and the tacrolimus valley point concentration was 8.1 ng/mL.
The brain magnetic resonance imaging (MRI) showed symmetrical high T1 and T2 signal intensities in thalamus and pons (Figure 1A) and high signal intensities of T2 Flair in the paraventricular area (Figure 1B). The medical history and brain MRI examination suggested WE, even though the plasma level of thiamine was not tested, and we started intravenous vitamin B1 500 mg daily for 1 wk immediately. His difficulties in speech and grasp resolved within 3 d and other neurological symptoms recovered 7 d after thiamine treatment. Considering the side effect of thiamine, he took 3 compound vitamin B tablets orally for 3 times daily for 3 mo. His general condition was good and he underwent another brain MRI 5 mo after the surgery. It showed significant reduction of previously abnormal signal in thalamus and pons (Figure 1C and D).
DISCUSSIONEtiology and pathogenesis of WEWE is caused by vitamin B1 (thiamine) deficiency for many reasons, such as chronic alcoholism, recurrent vomiting, parenteral nutrition, gastrointestinal surgery, cancer, liver diseases and so on. Despite some reports of WE after bone marrow transplantation[811], there have been few reports about WE and liver transplantation. In this case, the patient, with a long duration of liver disease, had poor feeding before the surgery due to nausea and abdominal distension, which could be a highrisk factor for WE. It could be the parenteral nutrition given postoperatively without vitamin B1 supplement that led to his WE.
8433 December 21, 2017|Volume 23|Issue 47|WJG|www.wjgnet.com
Xie B et al . Wernicke encephalopathy after liver transplantation
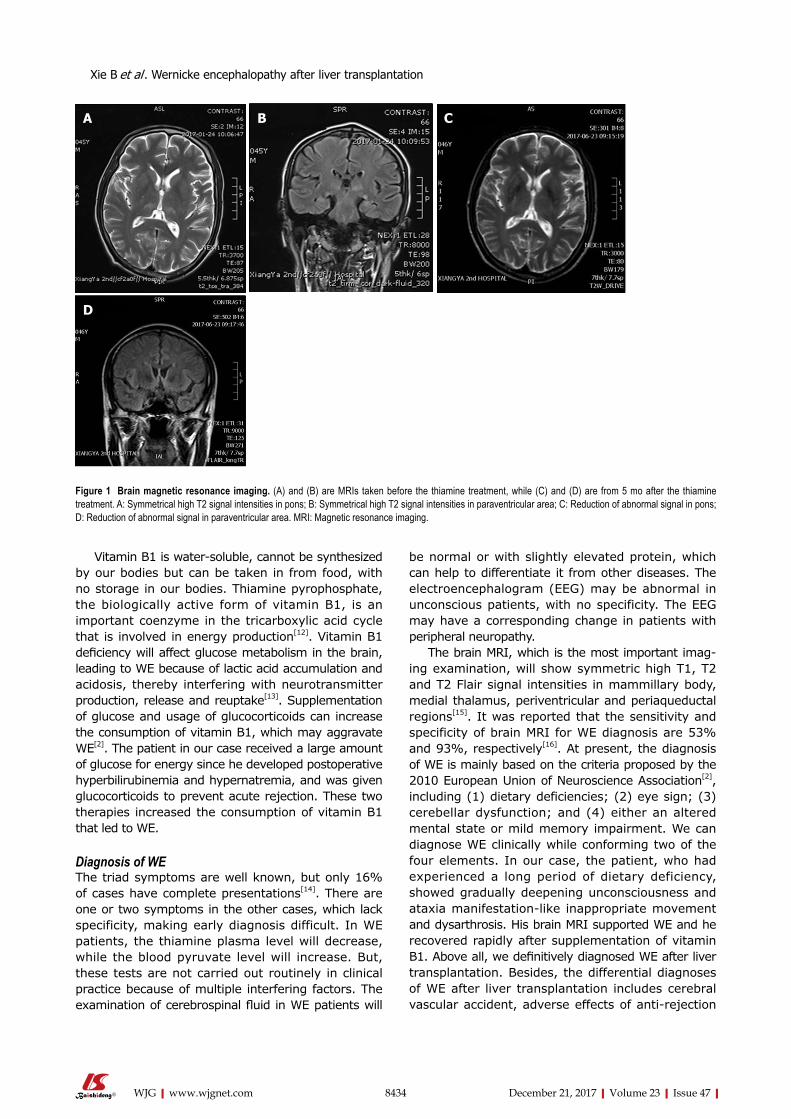
Vitamin B1 is watersoluble, cannot be synthesized by our bodies but can be taken in from food, with no storage in our bodies. Thiamine pyrophosphate, the biologically active form of vitamin B1, is an important coenzyme in the tricarboxylic acid cycle that is involved in energy production[12]. Vitamin B1 deficiency will affect glucose metabolism in the brain, leading to WE because of lactic acid accumulation and acidosis, thereby interfering with neurotransmitter production, release and reuptake[13]. Supplementation of glucose and usage of glucocorticoids can increase the consumption of vitamin B1, which may aggravate WE[2]. The patient in our case received a large amount of glucose for energy since he developed postoperative hyperbilirubinemia and hypernatremia, and was given glucocorticoids to prevent acute rejection. These two therapies increased the consumption of vitamin B1 that led to WE.
Diagnosis of WEThe triad symptoms are well known, but only 16% of cases have complete presentations[14]. There are one or two symptoms in the other cases, which lack specificity, making early diagnosis difficult. In WE patients, the thiamine plasma level will decrease, while the blood pyruvate level will increase. But, these tests are not carried out routinely in clinical practice because of multiple interfering factors. The examination of cerebrospinal fluid in WE patients will
be normal or with slightly elevated protein, which can help to differentiate it from other diseases. The electroencephalogram (EEG) may be abnormal in unconscious patients, with no specificity. The EEG may have a corresponding change in patients with peripheral neuropathy.
The brain MRI, which is the most important imaging examination, will show symmetric high T1, T2 and T2 Flair signal intensities in mammillary body, medial thalamus, periventricular and periaqueductal regions[15]. It was reported that the sensitivity and specificity of brain MRI for WE diagnosis are 53% and 93%, respectively[16]. At present, the diagnosis of WE is mainly based on the criteria proposed by the 2010 European Union of Neuroscience Association[2], including (1) dietary deficiencies; (2) eye sign; (3) cerebellar dysfunction; and (4) either an altered mental state or mild memory impairment. We can diagnose WE clinically while conforming two of the four elements. In our case, the patient, who had experienced a long period of dietary deficiency, showed gradually deepening unconsciousness and ataxia manifestationlike inappropriate movement and dysarthrosis. His brain MRI supported WE and he recovered rapidly after supplementation of vitamin B1. Above all, we definitively diagnosed WE after liver transplantation. Besides, the differential diagnoses of WE after liver transplantation includes cerebral vascular accident, adverse effects of antirejection
8434 December 21, 2017|Volume 23|Issue 47|WJG|www.wjgnet.com
Figure 1 Brain magnetic resonance imaging. (A) and (B) are MRIs taken before the thiamine treatment, while (C) and (D) are from 5 mo after the thiamine treatment. A: Symmetrical high T2 signal intensities in pons; B: Symmetrical high T2 signal intensities in paraventricular area; C: Reduction of abnormal signal in pons; D: Reduction of abnormal signal in paraventricular area. MRI: Magnetic resonance imaging.
A B C
D
Xie B et al . Wernicke encephalopathy after liver transplantation
8435 December 21, 2017|Volume 23|Issue 47|WJG|www.wjgnet.com
Clinical diagnosisThe patient became irritable, raving and lethargic, and appeared to gradually develop unclear enunciation, difficulty in grasping objects, and memory loss.
Differential diagnosisHepatic encephalopathy and adverse effects of anti-rejection drugs.
Laboratory diagnosisThiamine plasma level was not tested, while the other laboratory results were close to normal.
Imaging diagnosisBrain magnetic resonance imaging showed symmetrical high T1 and T2 signal intensities in thalamus and pons and high signal intensities of T2 Flair in the paraventricular area.
Pathological diagnosisNo pathological examination was performed.
TreatmentIntravenous vitamin B1 at 500 mg daily for 1 wk and 3 compound vitamin B tablets orally 3 times daily for 3 mo.
Related reportsOnly 2 other cases of Wernicke encephalopathy after liver transplantation have been reported, and there have been case reports of Wernicke encephalopathy in bone marrow transplantation.
Term explanation Wernicke encephalopathy is an acute neurological disorder resulting from vitamin B1 deficiency, which is common in chronic alcoholism.
Experiences and lessonsWe should pay more attention to Wernicke encephalopathy after liver transplantation to avoid delaying treatment. Patients who had poor nutrition preoperation or who needed a long fasting duration postoperation should receive intravenous vitamin B1 at 100 mg daily until return to their normal diet.
REFERENCES1 Reuler JB, Girard DE, Cooney TG. Current concepts. Wernicke’
s encephalopathy. N Engl J Med 1985; 312: 10351039 [PMID: 3885034 DOI: 10.1056/NEJM198504183121606]
2 Galvin R, Bråthen G, Ivashynka A, Hillbom M, Tanasescu R, Leone MA; EFNS. EFNS guidelines for diagnosis, therapy and prevention of Wernicke encephalopathy. Eur J Neurol 2010; 17: 14081418 [PMID: 20642790 DOI: 10.1111/j.14681331.2010.03153.x]
3 Day GS, del Campo CM. Wernicke encephalopathy: a medical emergency. CMAJ 2014; 186: E295 [PMID: 24016788 DOI: 10.1503/cmaj.130091]
4 Infante MT, Fancellu R, Murialdo A, Barletta L, Castellan L, Serrati C. Challenges in Diagnosis and Treatment of Wernicke Encephalopathy: Report of 2 Cases. Nutr Clin Pract 2016; 31: 186190 [PMID: 26869612 DOI: 10.1177/0884533615621753]
5 Shin NY, Nam HS, Lee SK. Hemorrhagic Wernicke encephalopathy in a patient with liver transplantation. Neurology 2009; 73: 1423 [PMID: 19858466 DOI: 10.1212/WNL.0b013e3181bd82b9]
6 Benidir AN, Laughlin S, Ng VL. Visual disturbances in total parenteral nutrition dependent liver transplant pediatric patient. Gastroenterology 2014; 146: e10e11 [PMID: 24680803 DOI: 10.1053/j.gastro.2013.12.039]
7 Blanco-Múñez O, SuárezGauthier A, MartínGarcía H, DíazKonrad V, San AntonioRomán V, Cabello A. [Unusual cortical compromise in a case of Wernicke’s encephalopathy]. Rev Neurol
drugs, hepatic encephalopathy and so on.
Treatment and prevention of WE after liver transplantationWE is a clinical emergency, and once diagnosed, the patient should receive vitamin B1 treatment immediately. The initial treatment requires parenteral routes, either intramuscular or intravenous, to ensure adequate absorption[17]. With a short halflife short, up to 96 min, vitamin B1 should be given three times a day or continuously by intravenous route. Till now, we have not reached a consensus on the dose and course of vitamin B1 therapy. So, the dose of vitamin B1 should be individualized based on the severity[18]. In general, alcoholic WE patients need more vitamin B1 than nonalcoholics. Vitamin B1 should be given before carbohydrates and glucocorticoids because glucose metabolism consumes vitamin B1[2].
In our case, the patient received intravenous vitamin B1 at 500 mg/d, starting immediately upon consideration of the WE diagnosis. His clinical symptoms improved and ataxia disappeared 3 d later, neurological disturbance resolved 7 d later. Then, he took compound vitamin B tablets instead of intravenous vitamin B1. The brain MRI 5 mo later revealed great improvement. The therapy of vitamin B1 supplementation was effective, without adverse reactions.
Vitamin B1 has wide safety range, since it is watersoluble and can excrete easily via the kidney. In order to prevent WE after liver transplantation, patients who had poor nutrition preoperation or needed a long fasting duration postoperation should receive intravenous vitamin B1 at 100 mg daily until returned to their normal diet.
Liver transplantation is a largescale surgery, and the patients may have poor nutrition preoperation due to abdominal distension or nausea. Many factors increase the consumption of vitamin B1 postoperation, such as surgical stress, hypermetabolism, parenteral nutrition therapy, and use of glucocorticoids. The patients may suffer WE without extra supplementation of vitamin B1. We should consider WE when patients with highrisk factors develop disturbances of consciousness, diplopia or ataxia. Brain MRI can help substantially towards making the diagnosis. The effective treatment of WE is prompt supplementation of vitamin B1. To date, there are few relevant reports of WE after liver transplantation. As transplant doctors, we should improve awareness of this disease to avoid delaying the treatment.
ARTICLE HIGHLIGHTSCase characteristicsA 45-year-old male patient received liver transplantation due to decompensatory cirrhosis because of hepatitis B and developed Wernicke encephalopathy on the 15th postoperative day.
ARTICLE HIGHLIGHTS
Xie B et al . Wernicke encephalopathy after liver transplantation
8436 December 21, 2017|Volume 23|Issue 47|WJG|www.wjgnet.com
2006; 42: 596599 [PMID: 16703527]8 Majolino I, Caponetto A, Scimé R, Vasta S, Fabbiano F, Caronia
F. Wernickelike encephalopathy after autologous bone marrow transplantation. Haematologica 1990; 75: 282284 [PMID: 2227627]
9 Baek JH, Sohn SK, Kim DH, Kim JG, Lee HW, Park SP, Lee KB. Wernicke’s encephalopathy after allogeneic stem cell transplantation. Bone Marrow Transplant 2005; 35: 829830 [PMID: 15750604 DOI: 10.1038/sj.bmt.1704893]
10 Bleggi-Torres LF, de Medeiros BC, Ogasawara VS, Loddo G, Zanis Neto J, Pasquini R, de Medeiros CR. Iatrogenic Wernicke’s encephalopathy in allogeneic bone marrow transplantation: a study of eight cases. Bone Marrow Transplant 1997; 20: 391395 [PMID: 9339755 DOI: 10.1038/sj.bmt.1700892]
11 Bleggi-Torres LF, de Medeiros BC, Werner B, Neto JZ, Loddo G, Pasquini R, de Medeiros CR. Neuropathological findings after bone marrow transplantation: an autopsy study of 180 cases. Bone Marrow Transplant 2000; 25: 301307 [PMID: 10673702 DOI: 10.1038/sj.bmt.1702140]
12 Wijnia JW, Oudman E. Biomarkers of delirium as a clue to diagnosis and pathogenesis of WernickeKorsakoff syndrome. Eur J Neurol 2013; 20: 15311538 [PMID: 23790077 DOI: 10.1111/ene.12217]
13 Zahr NM, Kaufman KL, Harper CG. Clinical and pathological features of alcoholrelated brain damage. Nat Rev Neurol 2011; 7: 284294 [PMID: 21487421 DOI: 10.1038/nrneurol.2011.42]
14 Harper CG, Giles M, FinlayJones R. Clinical signs in the WernickeKorsakoff complex: a retrospective analysis of 131 cases diagnosed at necropsy. J Neurol Neurosurg Psychiatry 1986; 49: 341345 [PMID: 3701343 DOI: 10.1136/jnnp.49.4.341]
15 Manzo G, De Gennaro A, Cozzolino A, Serino A, Fenza G, Manto A. MR imaging findings in alcoholic and nonalcoholic acute Wernicke’s encephalopathy: a review. Biomed Res Int 2014; 2014: 503596 [PMID: 25050351 DOI: 10.1155/2014/503596]
16 Elefante A, Puoti G, Senese R, Coppola C, Russo C, Tortora F, de Divitiis O, Brunetti A. Nonalcoholic acute Wernicke’s encephalopathy: role of MRI in non typical cases. Eur J Radiol 2012; 81: 40994104 [PMID: 22954409 DOI: 10.1016/j.ejrad.2012.08.006]
17 Sechi G, Serra A. Wernicke’s encephalopathy: new clinical settings and recent advances in diagnosis and management. Lancet Neurol 2007; 6: 442455 [PMID: 17434099 DOI: 10.1016/S14744422(07)701047]
18 Latt N, Dore G. Thiamine in the treatment of Wernicke encephalopathy in patients with alcohol use disorders. Intern Med J 2014; 44: 911915 [PMID: 25201422 DOI: 10.1111/imj.12522]
P- Reviewer: Kita K, Salvadori M, Taheri S S- Editor: Chen K L- Editor: Filipodia E- Editor: Huang Y
Xie B et al . Wernicke encephalopathy after liver transplantation
Silymarin: An option to treat non-alcoholic fatty liver disease
Carmela Colica, Luigi Boccuto, Ludovico Abenavoli
Carmela Colica, CNR, IBFM UOS of Germaneto, University “Magna Graecia”, Catanzaro 88100, Italy
Luigi Boccuto, Research Department, Greenwood Genetic Center, School of Health Research, Clemson University, Greenwood 29646, United States
Ludovico Abenavoli, Department of Health Sciences, University Magna Græcia, Campus Germaneto, Viale Europa, Catanzaro 88100, Italy
ORCID number: Carmela Colica (0000-0001-6424-1223); Luigi Boccuto (0000-0001-6524-4493); Ludovico Abenavoli (0000-0002-5922-1524).
Author contributions: Colica C and Abenavoli L performed research of literature data and wrote the paper; Boccuto L revised the paper.
Conflict-of-interest statement: Authors declares no conflict of interest related to this publication.
Open-Access: This article is an open-access article which was selected by an in-house editor and fully peer-reviewed by external reviewers. It is distributed in accordance with the Creative Commons Attribution Non Commercial (CC BY-NC 4.0) license, which permits others to distribute, remix, adapt, build upon this work non-commercially, and license their derivative works on different terms, provided the original work is properly cited and the use is non-commercial. See: http://creativecommons.org/licenses/by-nc/4.0/
Manuscript source: Unsolicited manuscript
Correspondence to: Ludovico Abenavoli MD, PhD, Associate Professor, Department of Health Sciences, University Magna Græcia, Campus Germaneto, Viale Europa - Germaneto, Catanzaro 88100, Italy. [email protected]: +39-961-3697113Fax: +39-961-754220
Received: November 8, 2017Peer-review started: November 9, 2017First decision: November 21, 2017Revised: November 27, 2017
Accepted: December 4, 2017 Article in press: December 4, 2017Published online: December 21, 2017
AbstractWe have read with a great interest the review pub-lished by Singh et al , on the treatment options in alcoholic and non-alcoholic fatty liver disease, including various new targeted therapies that are currently under investigation. Recently, we described the health effects of the Mediterranean diet associated to an antioxidant complex rich in silymarin, to improve in overweight patients anthropometric parameters, glucose and lipid metabolism and intra-hepatic fat accumulation.
Key words: Mediterranean diet; Antioxidant; Silymarin; Non-alcoholic fatty liver disease
© The Author(s) 2017. Published by Baishideng Publishing Group Inc. All rights reserved.
Core tip: Supplementation of silymarin in association with an hypocaloric diet and physical activity, can be a correct approach to treat patients with non-alcoholic fatty liver disease in clinical practice.
Colica C, Boccuto L, Abenavoli L. Silymarin: An option to treat non-alcoholic fatty liver disease. World J Gastroenterol 2017; 23(47): 8437-8438 Available from: URL: http://www.wjgnet.com/1007-9327/full/v23/i47/8437.htm DOI: http://dx.doi.org/10.3748/wjg.v23.i47.8437
TO THE EDITORWe read with great interest the recent review by Singh et al[1] on the treatment options in alcoholic and
LETTERS TO THE EDITOR
8437 December 21, 2017|Volume 23|Issue 47|WJG|www.wjgnet.com
Submit a Manuscript: http://www.f6publishing.com
DOI: 10.3748/wjg.v23.i47.8437
World J Gastroenterol 2017 December 21; 23(47): 8437-8438
ISSN 1007-9327 (print) ISSN 2219-2840 (online)
non-alcoholic fatty liver disease (NAFLD), including various new targeted therapies that are currently under investigation. In the last decades the diagnosis of NAFLD was increasingly evoked in clinical practice, with a worldwide spread of NAFLD, with an estimated prevalence between 25%-30% of general population, not only in Western world but also in urban area of developing Countries[2]. NAFLD is an umbrella term that includes different clinical pictures ranged from simple fat accumulation to steato-hepatitis, fibrosis, cirrhosis and its complications. Central obesity, dyslipidemia, insulin resistance, and diabetes in a context of metabolic syndrome are the risk factors largely associated to the development and progression of NAFLD[3]. Recently, studies on the mechanisms involved in the pathogenesis of NAFLD, highlight the role of genetic polymorphisms enhancing oxidative stress, pro-inflammatory cytokines production and disequilibrium in the glucose and lipid metabolism[4]. The standard of care to treat NAFLD, described by international guidelines, is focused on lifestyle modifications and in particular on starting a healthy diet and increasing physical exercise. However, no drugs are currently approved to treat NAFLD and its secondary complications by regulatory agencies[5]. Reactive oxygen species production, including super-oxide radical, hydroxyl radical, hydrogen peroxide, and lipid peroxide radicals, are involved in the pathogenesis and progression of NAFLD, in a multi-step process[6]. Silybum marianum, commonly known as Milk Thistle (MT), family of Asteraceae/Compositae, has been used since the time of ancient physicians, to treat liver diseases[7]. The active complex of MT is a lipophilic extract from the seeds of the plant and is composed of four isomer flavonolignans, collectively known as silymarin. Several pre-clinical and clinical studies have been carried out on silymarin and silibinin, its predominant and most active component. It has been described that silymarin possesses anti-oxidant, anti-inflammatory, and anti-fibrotic properties. Our study group have been reported in a randomized study, the health effects of a hypocaloric Mediterranean diet in association with an antioxidant formulation with silymarin, on liver damage, glucose metabolism and anthropometric parameters in NAFLD overweight patients[8]. Data on the effects of silymarin in patients with NAFLD are limited. However, some studies showed that treatment with silymarin has been associated with an improvement of the oxidative profile, due to the ability of silymarin to inhibit the production of pro-inflammatory cytokines[9]. In addition, our data can be
explained by the effectiveness of the diet associated to silymarin to reduce the extent of fat infiltration in the hepatocytes and to modulate the mitochondrial function.
In accordance with the paper by Singh et al[1], we conclude that new therapeutic targets are now under investigation for NAFLD. In this context, on the basis of our experience we support the role of silymarin, in association with lifestyle changes, to treat NAFLD patients, considering that it offers similar effects than some of the drugs listed by Singh et al[1] in terms of anti-oxidant (e.g., NOX-1/4 inhibitors), anti-fibrotic (e.g., galectin-3 antagonists, simtuzumab) and anti-inflammatory (e.g., sirtuins) properties, but with considerably lower side effects.
REFERENCES1 Singh S, Osna NA, Kharbanda KK. Treatment options for
alcoholic and non-alcoholic fatty liver disease: A review. World J Gastroenterol 2017; 23: 6549-6570 [PMID: 29085205 DOI: 10.3748/wjg.v23.i36.6549]
2 Masarone M, Federico A, Abenavoli L, Loguercio C, Persico M. Non alcoholic fatty liver: epidemiology and natural history. Rev Recent Clin Trials 2014; 9: 126-133 [PMID: 25514916 DOI: 10.2174/1574887109666141216111143]
3 Abenavoli L, Milic N, Di Renzo L, Preveden T, Medić-Stojanoska M, De Lorenzo A. Metabolic aspects of adult patients with nonalcoholic fatty liver disease. World J Gastroenterol 2016; 22: 7006-7016 [PMID: 27610012 DOI: 10.3748/wjg.v22.i31.7006]
4 Boccuto L, Abenavoli L. Genetic and Epigenetic Profile of Patients With Alcoholic Liver Disease. Ann Hepatol 2017; 16: 490-500 [PMID: 28612750 DOI: 10.5604/01.3001.0010.0274]
5 European Association for the Study of the Liver (EASL); European Association for the Study of Diabetes (EASD); European Association for the Study of Obesity (EASO). EASL-EASD-EASO Clinical Practice Guidelines for the management of non-alcoholic fatty liver disease. J Hepatol 2016; 64: 1388-1402 [PMID: 27062661 DOI: 10.1016/j.jhep.2015.11.004]
6 Abenavoli L, Capasso R, Milic N, Capasso F. Milk thistle in liver diseases: past, present, future. Phytother Res 2010; 24: 1423-1432 [PMID: 20564545 DOI: 10.1002/ptr.3207]
7 Colica C, Di Renzo L, Trombetta D, Smeriglio A, Bernardini S, Cioccoloni G, Costa de Miranda R, Gualtieri P, Sinibaldi Salimei P, De Lorenzo A. Antioxidant Effects of a Hydroxytyrosol-Based Pharmaceutical Formulation on Body Composition, Metabolic State, and Gene Expression: A Randomized Double-Blinded, Placebo-Controlled Crossover Trial. Oxid Med Cell Longev 2017; 2017: 2473495 [PMID: 28855976 DOI: 10.1155/2017/2473495]
8 Abenavoli L, Greco M, Nazionale I, Peta V, Milic N, Accattato F, Foti D, Gulletta E, Luzza F. Effects of Mediterranean diet supplemented with silybin-vitamin E-phospholipid complex in overweight patients with non-alcoholic fatty liver disease. Expert Rev Gastroenterol Hepatol 2015; 9: 519-527 [PMID: 25617046 DOI: 10.1586/17474124.2015.1004312]
9 Federico A, Dallio M, Loguercio C. Silymarin/Silybin and Chronic Liver Disease: A Marriage of Many Years. Molecules 2017; 22: [PMID: 28125040 DOI: 10.3390/molecules22020191]
P- Reviewer: Hamaguchi M S- Editor: Chen K L- Editor: A E- Editor: Huang Y
8438 December 21, 2017|Volume 23|Issue 47|WJG|www.wjgnet.com
Colica C et al . Silymarin and non-alcoholic fatty liver

© 2017 Baishideng Publishing Group Inc. All rights reserved.
Published by Baishideng Publishing Group Inc7901 Stoneridge Drive, Suite 501, Pleasanton, CA 94588, USA
Telephone: +1-925-223-8242Fax: +1-925-223-8243
E-mail: [email protected] Desk: http://www.f6publishing.com/helpdesk
http://www.wjgnet.com
I S S N 1 0 0 7 - 9 3 2 7
9 7 7 1 0 07 9 3 2 0 45
4 7