Embed Size (px)
Citation preview

World Journal of GastroenterologyWorld J Gastroenterol 2015 September 14; 21(34): 9833-10056
ISSN 1007-9327 (print)ISSN 2219-2840 (online)
Published by Baishideng Publishing Group Inc
The World Journal of Gastroenterology Editorial Board consists of 1377 members, representing a team of worldwide experts in gastroenterology and hepatology. They are from 68 countries, including Algeria (2), Argentina (7), Australia (31), Austria (9), Belgium (11), Brazil (20), Brunei Darussalam (1), Bulgaria (2), Cambodia (1), Canada (26), Chile (4), China (164), Croatia (2), Cuba (1), Czech (6), Denmark (2), Egypt (9), Estonia (2), Finland (6), France (20), Germany (58), Greece (31), Guatemala (1), Hungary (15), Iceland (1), India (33), Indonesia (2), Iran (10), Ireland (9), Israel (18), Italy (194), Japan (150), Jordan (1), Kuwait (1), Lebanon (7), Lithuania (1), Malaysia (1), Mexico (11), Morocco (1), Netherlands (5), New Zealand (4), Nigeria (3), Norway (6), Pakistan (6), Poland (12), Portugal (8), Puerto Rico (1), Qatar (1), Romania (10), Russia (3), Saudi Arabia (2), Singapore (7), Slovenia (2), South Africa (1), South Korea (69), Spain (51), Sri Lanka (1), Sudan (1), Sweden (12), Switzerland (5), Thailand (7), Trinidad and Tobago (1), Tunisia (2), Turkey (55), United Kingdom (49), United States (180), Venezuela (1), and Vietnam (1).
Editorial Board2014-2017
EDITORS-IN-CHIEFStephen C Strom, StockholmAndrzej S Tarnawski, Long BeachDamian Garcia-Olmo, Madrid
ASSOCIATE EDITORYung-Jue Bang, SeoulVincent Di Martino, BesanconDaniel T Farkas, BronxRoberto J Firpi, GainesvilleMaria Gazouli, AthensChung-Feng Huang, KaohsiungNamir Katkhouda, Los AngelesAnna Kramvis, JohannesburgWolfgang Kruis, ColognePeter L Lakatos, BudapestHan Chu Lee, SeoulChristine McDonald, ClevelandNahum Mendez-Sanchez, Mexico CityGeorge K Michalopoulos, PittsburghSuk Woo Nam, SeoulShu-You Peng, HangzhouDaniel von Renteln, MontrealAngelo Sangiovanni, MilanHildegard M Schuller, KnoxvilleDong-Wan Seo, SeoulAdrian John Stanley, GlasgowJurgen Stein, FrankfurtBei-Cheng Sun, NanjingYoshio Yamaoka, Yufu
GUEST EDITORIAL BOARD MEMBERSJia-Ming Chang, TaipeiJane CJ Chao, Taipei
Kuen-Feng Chen, TaipeiTai-An Chiang, TainanYi-You Chiou, TaipeiSeng-Kee Chuah, KaohsiungWan-Long Chuang, KaohsiungHow-Ran Guo, TainanMing-Chih Hou, TaipeiPo-Shiuan Hsieh, TaipeiChing-Chuan Hsieh, Chiayi countyJun-Te Hsu, TaoyuanChung-Ping Hsu, TaichungChien-Ching Hung, TaipeiChao-Hung Hung, KaohsiungChen-Guo Ker, KaohsiungYung-Chih Lai, TaipeiTeng-Yu Lee, Taichung CityWei-Jei Lee, TaoyuanJin-Ching Lee, KaohsiungJen-Kou Lin, TaipeiYa-Wen Lin, TaipeiHui-kang Liu, TaipeiMin-Hsiung Pan, TaipeiBor-Shyang Sheu, TainanHon-Yi Shi, KaohsiungFung-Chang Sung, TaichungDar-In Tai, TaipeiJung-Fa Tsai, KaohsiungYao-Chou Tsai, New Taipei CityChih-Chi Wang, KaohsiungLiang-Shun Wang, New Taipei CityHsiu-Po Wang, TaipeiJaw-Yuan Wang, KaohsiungYuan-Huang Wang, TaipeiYuan-Chuen Wang, Taichung
Deng-Chyang Wu, KaohsiungShun-Fa Yang, TaichungHsu-Heng Yen, Changhua
MEMBERS OF THE EDITORIAL BOARD
AlgeriaSaadi Berkane, AlgiersSamir Rouabhia, Batna
ArgentinaN Tolosa de Talamoni, CórdobaEduardo de Santibanes, Buenos AiresBernardo Frider, Capital FederalGuillermo Mazzolini, PilarCarlos Jose Pirola, Buenos AiresBernabé Matías Quesada, Buenos AiresMaría Fernanda Troncoso, Buenos Aires
AustraliaGolo Ahlenstiel, WestmeadMinoti V Apte, SydneyJacqueline S Barrett, MelbourneMichael Beard, AdelaideFilip Braet, SydneyGuy D Eslick, SydneyChristine Feinle-Bisset, AdelaideMark D Gorrell, SydneyMichael Horowitz, Adelaide
September 10, 2015IWJG|www.wjgnet.com
Gordon Stanley Howarth, RoseworthySeungha Kang, BrisbaneAlfred King Lam, Gold CoastIan C Lawrance, PerthFremantleBarbara Anne Leggett, BrisbaneDaniel A Lemberg, SydneyRupert W Leong, SydneyFinlay A Macrae, VictoriaVance Matthews, MelbourneDavid L Morris, SydneyReme Mountifield, Bedford ParkHans J Netter, MelbourneNam Q Nguyen, AdelaideLiang Qiao, WestmeadRajvinder Singh, AdelaideRoss Cyril Smith, StLeonardsKevin J Spring, SydneyDebbie Trinder, FremantleDaniel R van Langenberg, Box HillDavid Ian Watson, AdelaideDesmond Yip, GarranLi Zhang, Sydney
AustriaFelix Aigner, InnsbruckGabriela A Berlakovich, ViennaHerwig R Cerwenka, GrazPeter Ferenci, WienAlfred Gangl, ViennaKurt Lenz, LinzMarkus Peck-Radosavljevic, ViennaMarkus Raderer, ViennaStefan Riss, Vienna
BelgiumMichael George Adler, BrusselsBenedicte Y De Winter, AntwerpMark De Ridder, JetteOlivier Detry, LiegeDenis Dufrane Dufrane, BrusselsSven M Francque, EdegemNikos Kotzampassakis, LiègeGeert KMM Robaeys, GenkXavier Sagaert, LeuvenPeter Starkel, BrusselsEddie Wisse, Keerbergen
BrazilSMP Balzan, Santa Cruz do SulJLF Caboclo, Sao jose do rio pretoFábio Guilherme Campos, Sao PauloClaudia RL Cardoso, Rio de JaneiroRoberto J Carvalho-Filho, Sao PauloCarla Daltro, SalvadorJosé Sebastiao dos Santos, Ribeirao PretoEduardo LR Mello, Rio de JaneiroSthela Maria Murad-Regadas, FortalezaClaudia PMS Oliveira, Sao PauloJúlio C Pereira-Lima, Porto AlegreMarcos V Perini, Sao PauloVietla Satyanarayana Rao, Fortaleza
Raquel Rocha, SalvadorAC Simoes e Silva, Belo HorizonteMauricio F Silva, Porto AlefreAytan Miranda Sipahi, Sao PauloRosa Leonôra Salerno Soares, NiteróiCristiane Valle Tovo, Porto AlegreEduardo Garcia Vilela, Belo Horizonte
Brunei DarussalamVui Heng Chong, Bandar Seri Begawan
BulgariaTanya Kirilova Kadiyska, SofiaMihaela Petrova, Sofia
CambodiaFrancois Rouet, Phnom Penh
CanadaBrian Bressler, VancouverFrank J Burczynski, WinnipegWangxue Chen, OttawaFrancesco Crea, VancouverMirko Diksic, MontrealJane A Foster, HamiltonHugh J Freeman, VancouverShahrokh M Ghobadloo, OttawaYuewen Gong, WinnipegPhilip H Gordon, QuebecRakesh Kumar, EdmontonWolfgang A Kunze, HamiltonPatrick Labonte, LavalZhikang Peng, WinnipegJayadev Raju, OttawaMaitreyi Raman, CalgaryGiada Sebastiani, MontrealMaida J Sewitch, MontrealEldon A Shaffer, AlbertaChristopher W Teshima, EdmontonJean Sévigny, QuébecPingchang Yang, HamiltonPingchang Yang, HamiltonEric M Yoshida, VancouverBin Zheng, Edmonton
ChileMarcelo A Beltran, La SerenaFlavio Nervi, SantiagoAdolfo Parra-Blanco, SantiagoAlejandro Soza, Santiago
ChinaZhao-Xiang Bian, Hong Kong San-Jun Cai, ShanghaiGuang-Wen Cao, ShanghaiLong Chen, NanjingRu-Fu Chen, Guangzhou
George G Chen, Hong KongLi-Bo Chen, WuhanJia-Xu Chen, BeijingHong-Song Chen, BeijingLin Chen, BeijingYang-Chao Chen, Hong KongZhen Chen, ShanghaiYing-Sheng Cheng, ShanghaiKent-Man Chu, Hong KongZhi-Jun Dai, Xi’anJing-Yu Deng, TianjinYi-Qi Du, ShanghaiZhi Du, TianjinHani El-Nezami, Hong KongBao-Ying Fei, HangzhouChang-Ming Gao, NanjingJian-Ping Gong, ChongqingZuo-Jiong Gong, WuhanJing-Shan Gong, ShenzhenGuo-Li Gu, BeijingYong-Song Guan, ChengduMao-Lin Guo, LuoyangJun-Ming Guo, NingboYan-Mei Guo, ShanghaiXiao-Zhong Guo, ShenyangGuo-Hong Han, Xi’anMing-Liang He, Hong KongPeng Hou, Xi’anZhao-Hui Huang, WuxiFeng Ji, HangzhouSimon Law, Hong KongYu-Yuan Li, Guangzhou Meng-Sen Li, HaikouShu-De Li, Shanghai Zong-Fang Li, Xi’anQing-Quan Li, ShanghaiKang Li, LasaHan Liang, TianjinXing’e Liu, HangzhouZheng-Wen Liu, Xi’anXiao-Fang Liu, YantaiBin Liu, TianjinQuan-Da Liu, BeijingHai-Feng Liu, BeijingFei Liu, ShanghaiAi-Guo Lu, ShanghaiHe-Sheng Luo, WuhanXiao-Peng Ma, ShanghaiYong Meng, ShantouKe-Jun Nan, Xi’anSiew Chien Ng, Hong KongSimon SM Ng, Hong KongZhao-Shan Niu, QingdaoDi Qu, ShanghaiYing-Mo Shen, BeijingRui-Hua Shi, NanjingBao-Min Shi, ShanghaiXiao-Dong Sun, HangzhouSi-Yu Sun, ShenyangGuang-Hong Tan, HaikouWen-Fu Tang, ChengduAnthony YB Teoh, Hong KongWei-Dong Tong, ChongqingEric Tse, Hong KongHong Tu, Shanghai
September 10, 2015IIWJG|www.wjgnet.com
Rong Tu, HaikouJian-She Wang, ShanghaiKai Wang, JinanXiao-Ping Wang, XianyangXiu-Yan Wang, ShanghaiDao-Rong Wang, YangzhouDe-Sheng Wang, Xi’anChun-You Wang, WuhanGe Wang, ChongqingXi-Shan Wang, HarbinWei-hong Wang, BeijingZhen-Ning Wang, ShenyangWai Man Raymond Wong, Hong KongChun-Ming Wong, Hong KongJian Wu, ShanghaiSheng-Li Wu, Xi’anWu-Jun Wu, Xi’anQing Xia, ChengduYan Xin, ShenyangDong-Ping Xu, BeijingJian-Min Xu, ShanghaiWei Xu, ChangchunMing Yan, JinanXin-Min Yan, KunmingYi-Qun Yan, ShanghaiFeng Yang, ShanghaiYong-Ping Yang, BeijingHe-Rui Yao, GuangzhouThomas Yau, Hong KongWinnie Yeo, Hong KongJing You, KunmingJian-Qing Yu, WuhanYing-Yan Yu, ShanghaiWei-Zheng Zeng, ChengduZong-Ming Zhang, BeijingDian-Liang Zhang, QingdaoYa-Ping Zhang, ShijiazhuangYou-Cheng Zhang, LanzhouJian-Zhong Zhang, BeijingJi-Yuan Zhang, BeijingHai-Tao Zhao, BeijingJian Zhao, ShanghaiJian-Hong Zhong, NanningYing-Qiang Zhong, GuangzhouPing-Hong Zhou, ShanghaiYan-Ming Zhou, XiamenTong Zhou, NanchongLi-Ming Zhou, ChengduGuo-Xiong Zhou, NantongFeng-Shang Zhu, ShanghaiJiang-Fan Zhu, ShanghaiZhao-Hui Zhu, Beijing
CroatiaTajana Filipec Kanizaj, ZagrebMario Tadic, Zagreb
CubaDamian Casadesus, Havana
CzechJan Bures, Hradec KraloveMarcela Kopacova, Hradec Kralove
Otto Kucera, Hradec KraloveMarek Minarik, PraguePavel Soucek, PragueMiroslav Zavoral, Prague
DenmarkVibeke Andersen, OdenseE Michael Danielsen, Copenhagen
EgyptMohamed MM Abdel-Latif, AssiutHussein Atta, CairoAshraf Elbahrawy, CairoMortada Hassan El-Shabrawi, CairoMona El Said El-Raziky, CairoElrashdy M Redwan, New Borg AlrabZeinab Nabil Ahmed Said, CairoRagaa HM Salama, AssiutMaha Maher Shehata, Mansoura
EstoniaMargus Lember, TartuTamara Vorobjova, Tartu
FinlandMarko Kalliomäki, TurkuThomas Kietzmann, OuluKaija-Leena Kolho, HelsinkiEija Korkeila, TurkuHeikki Makisalo, HelsinkiTanja Pessi, Tampere
FranceArmando Abergel Clermont, FerrandElie K Chouillard, PolssyPierre Cordelier, ToulousePascal P Crenn, GarchesCatherine Daniel, LilleFanny Daniel, ParisCedric Dray, ToulouseBenoit Foligne, LilleJean-Noel Freund, StrasbourgHervé Guillou, ToulouseNathalie Janel, ParisMajid Khatib, BordeauxJacques Marescaux, StrasbourgJean-Claude Marie, ParisDriffa Moussata, Pierre BeniteHang Nguyen, Clermont-FerrandHugo Perazzo, ParisAlain L Servin, Chatenay-MalabryChang Xian Zhang, Lyon
GermanyStavros A Antoniou, MonchengladbachErwin Biecker, SiegburgHubert E Blum, Freiburg
Thomas Bock, BerlinKatja Breitkopf-Heinlein, MannheimElke Cario, EssenGüralp Onur Ceyhan, MunichAngel Cid-Arregui, HeidelbergMichael Clemens Roggendorf, MünchenChristoph F Dietrich, Bad MergentheimValentin Fuhrmann, HamburgNikolaus Gassler, AachenAndreas Geier, WuerzburgMarkus Gerhard, MunichAnton Gillessen, MuensterThorsten Oliver Goetze, OffenbachDaniel Nils Gotthardt, HeidelbergRobert Grützmann, DresdenThilo Hackert, HeidelbergClaus Hellerbrand, RegensburgHarald Peter Hoensch, DarmstadtJens Hoeppner, FreiburgRichard Hummel, MuensterJakob Robert Izbicki, HamburgGernot Maximilian Kaiser, EssenMatthias Kapischke, HamburgMichael Keese, FrankfurtAndrej Khandoga, MunichJorg Kleeff, MunichAlfred Koenigsrainer, TuebingenPeter Christopher Konturek, SaalfeldMichael Linnebacher, RostockStefan Maier, KaufbeurenOliver Mann, HamburgMarc E Martignoni, MunicThomas Minor, BonnOliver Moeschler, OsnabrueckJonas Mudter, EutinSebastian Mueller, HeidelbergMatthias Ocker, BerlinAndreas Ommer, EssenAlbrecht Piiper, FrankfurtEsther Raskopf, BonnChristoph Reichel, Bad BrückenauElke Roeb, GiessenUdo Rolle, FrankfurtKarl-Herbert Schafer, ZweibrückenPeter Schemmer, HeidelbergAndreas G Schreyer, RegensburgManuel A Silva, PenzbergGeorgios C Sotiropoulos, EssenUlrike S Stein, BerlinDirk Uhlmann, LeipzigMichael Weiss, Halle Hong-Lei Weng, MannheimKarsten Wursthorn, Hamburg
GreeceAlexandra Alexopoulou, AthensNikolaos Antonakopoulos, AthensStelios F Assimakopoulos, PatrasGrigoris Chatzimavroudis, ThessalonikiEvangelos Cholongitas, ThessalonikiGregory Christodoulidis, LarisaGeorge N Dalekos, LarissaUrania Georgopoulou, AthensEleni Gigi, Thessaloniki
September 10, 2015IIIWJG|www.wjgnet.com
Stavros Gourgiotis, AthensLeontios J Hadjileontiadis, ThessalonikiThomas Hyphantis, IoanninaIoannis Kanellos, ThessalonikiStylianos Karatapanis, RhodesMichael Koutsilieris, AthensSpiros D Ladas, AthensTheodoros K Liakakos, AthensEmanuel K Manesis, AthensSpilios Manolakopoulos, AthensGerassimos John Mantzaris, AthensAthanasios D Marinis, PiraeusNikolaos Ioannis Nikiteas, AthensKonstantinos X Papamichael, AthensGeorge Sgourakis, AthensKonstantinos C Thomopoulos, PatrasKonstantinos Triantafyllou, AthensChristos Triantos, PatrasGeorgios Zacharakis, AthensPetros Zezos, AlexandroupolisDemosthenes E Ziogas, Ioannina
GuatemalaCarlos Maria Parellada, Guatemala
HungaryMihaly Boros, SzegedTamás Decsi, PécsGyula Farkas, SzegedAndrea Furka, DebrecenY vette Mandi, SzegedPeter L Lakatos, BudapestPal Miheller, BudapestTamás Molnar, SzegedAttila Olah, GyorMaria Papp, DebrecenZoltan Rakonczay, SzegedFerenc Sipos, BudapestMiklós Tanyi, DebrecenTibor Wittmann, Szeged
IcelandTryggvi Bjorn Stefánsson, Reykjavík
IndiaBrij B Agarwal, New DelhiDeepak N Amarapurkar, Mumbai Shams ul Bari, SrinagarSriparna Basu, VaranasiRunu Chakravarty, KolkataDevendra C Desai, Mumbai Nutan D Desai, MumbaiSuneela Sunil Dhaneshwar, PuneRadha K Dhiman, ChandigarhPankaj Garg, MohaliUday C Ghoshal, LucknowKalpesh Jani, VadodaraPremashis Kar, New DelhiJyotdeep Kaur, ChandigarhRakesh Kochhar, Chandigarh
Pradyumna K Mishra, MumbaiAsish K Mukhopadhyay, KolkataImtiyaz Murtaza, SrinagarP Nagarajan, New DelhiSamiran Nundy, DelhiGopal Pande, HyderabadBenjamin Perakath, VelloreArun Prasad, New DelhiD Nageshwar Reddy, HyderabadLekha Saha, ChandigarhSundeep Singh Saluja, New DelhiMahesh Prakash Sharma, New DelhiSadiq Saleem Sikora, BangaloreSarman Singh, New DelhiRajeev Sinha, JhansiRupjyoti Talukdar, HyderabadRakesh Kumar Tandon, New DelhiNarayanan Thirumoorthy, Coimbatore
IndonesiaDavid Handojo Muljono, JakartaAndi Utama, Jakarta
IranArezoo Aghakhani, TehranSeyed Mohsen Dehghani, ShirazAhad Eshraghian, ShirazHossein Khedmat, TehranSadegh Massarrat, TehranMarjan Mohammadi, TehranRoja Rahimi, TehranFarzaneh Sabahi, TehranMajid Sadeghizadeh, TehranFarideh Siavoshi, Tehran
IrelandGary Alan Bass, DublinDavid J Brayden, DublinRonan A Cahill, DublinGlen A Doherty, DublinLiam J Fanning, CorkBarry Philip McMahon, DublinRossMcManus, DublinDervla O’Malley, CorkSinead M Smith, Dublin
IsraelDan Carter, Ramat GanJorge-Shmuel Delgado, MetarEli Magen, AshdodNitsan Maharshak, Tel AvivShaul Mordechai, Beer ShevaMenachem Moshkowitz, Tel AvivWilliam Bahij Nseir, NazarethShimon Reif, JerusalemRam Reifen, RehovotAriella Bar-Gil Shitrit, JerusalemNoam Shussman, JerusalemIgor Sukhotnik, HaifaNir Wasserberg, Petach Tiqwa
Jacob Yahav, RehovotDoron Levi Zamir, GederaShira Zelber-Sagi, HaifaRomy Zemel, Petach-Tikva
ItalyLudovico Abenavoli, CatanzaroLuigi Elio Adinolfi, NaplesCarlo Virginio Agostoni, MilanAnna Alisi, RomePiero Luigi Almasio, PalermoDonato Francesco Altomare, BariAmedeo Amedei, FlorencePietro Andreone, BolognaImerio Angriman, PadovaVito Annese, FlorencePaolo Aurello, RomeSalavtore Auricchio, NaplesGian Luca Baiocchi, BresciaGianpaolo Balzano, MilanAntonio Basoli, RomeGabrio Bassotti, San SistoMauro Bernardi, BolognaAlberto Biondi, RomeEnnio Biscaldi, GenovaMassimo Bolognesi, PaduaLuigi Bonavina, MilanoAldo Bove, ChietiRaffaele Bruno, PaviaLuigi Brusciano, NapoliGiuseppe Cabibbo, PalermoCarlo Calabrese, BolognaDaniele Calistri, MeldolaVincenza Calvaruso, PalermoLorenzo Camellini, Reggio EmiliaMarco Candela, Bologna Raffaele Capasso, NaplesLucia Carulli, ModenaRenato David Caviglia, RomeLuigina Cellini, ChietiGiuseppe Chiarioni, VeronaClaudio Chiesa, RomeMichele Cicala, RomaRachele Ciccocioppo, PaviaSandro Contini, ParmaGaetano Corso, FoggiaRenato Costi, ParmaAlessandro Cucchetti, BolognaRosario Cuomo, NapoliGiuseppe Currò, MessinaPaola De Nardi, MilanoGiovanni D De Palma, NaplesRaffaele De Palma, NapoliGiuseppina De Petro, BresciaValli De Re, AvianoPaolo De Simone, PisaGiuliana Decorti, TriesteEmanuele Miraglia del Giudice, NapoliIsidoro Di Carlo, CataniaMatteo Nicola Dario Di Minno, NaplesMassimo Donadelli, VeronaMirko D’Onofrio, VeronaMaria Pina Dore, SassariLuca Elli, MilanoMassimiliano Fabozzi, Aosta
September 10, 2015IVWJG|www.wjgnet.com
Massimo Falconi, AnconaEzio Falletto, TurinSilvia Fargion, MilanMatteo Fassan, VeronaGianfranco Delle Fave, RomaAlessandro Federico, NaplesFrancesco Feo, SassariDavide Festi, BolognaNatale Figura, SienaVincenzo Formica, RomeMirella Fraquelli, MilanMarzio Frazzoni, ModenaWalter Fries, MessinaGennaro Galizia, NaplesAndrea Galli, FlorenceMatteo Garcovich, RomeEugenio Gaudio, RomePaola Ghiorzo, GenoaEdoardo G Giannini, GenovaLuca Gianotti, MonzaMaria Cecilia Giron, PadovaAlberto Grassi, RiminiGabriele Grassi, TriesteFrancesco Greco, BergamoLuigi Greco, NaplesAntonio Grieco, RomeFabio Grizzi, RozzanoLaurino Grossi, PescaraSimone Guglielmetti, MilanTiberiu Hershcovici, JerusalemCalogero Iacono, VeronaEnzo Ierardi, BariAmedeo Indriolo, BergamoRaffaele Iorio, NaplesPaola Iovino, SalernoAngelo A Izzo, NaplesLoreta Kondili, RomeFilippo La Torre, RomeGiuseppe La Torre, RomeGiovanni Latella, L’AquilaSalvatore Leonardi, CataniaMassimo Libra, CataniaAnna Licata, PalermoC armela Loguercio, NaplesAmedeo Lonardo, ModenaCarmelo Luigiano, CataniaFrancesco Luzza, CatanzaroGiovanni Maconi, MilanoAntonio Macrì, MessinaMariano Malaguarnera, CataniaFrancesco Manguso, NapoliTommaso Maria Manzia, RomeDaniele Marrelli, SienaGabriele Masselli, RomeSara Massironi, MilanGiuseppe Mazzarella, AvellinoMichele Milella, RomeGiovanni Milito, RomeAntonella d’Arminio Monforte, MilanFabrizio Montecucco, GenoaGiovanni Monteleone, RomeMario Morino, TorinoVincenzo La Mura, MilanGerardo Nardone, NaplesRiccardo Nascimbeni, BresciaGabriella Nesi, FlorenceGiuseppe Nigri, Rome
Erica Novo, TurinVeronica Ojetti, RomeMichele Orditura, NaplesFabio Pace, SeriateLucia Pacifico, RomeOmero Alessandro Paoluzi, RomeValerio Pazienza, San Giovanni RotondoRinaldo Pellicano, TurinAdriano M Pellicelli, RomeNadia Peparini, CiampinoMario Pescatori, RomeAntonio Picardi, RomeAlberto Pilotto, PadovaAlberto Piperno, MonzaAnna Chiara Piscaglia, RomeMaurizio Pompili, RomeFrancesca Romana Ponziani, RomeCosimo Prantera, RomeGirolamo Ranieri, BariCarlo Ratto, TomeBarbara Renga, PerugiaAlessandro Repici, RozzanoMaria Elena Riccioni, RomeLucia Ricci-Vitiani, RomeLuciana Rigoli, MessinaMario Rizzetto, TorinoBallarin Roberto, ModenaRoberto G Romanelli, FlorenceClaudio Romano, MessinaLuca Roncucci, ModenaCesare Ruffolo, TrevisoL ucia Sacchetti, NapoliRodolfo Sacco, PisaLapo Sali, FlorenceRomina Salpini, RomeGiulio Aniello, Santoro TrevisoArmando Santoro, RozzanoEdoardo Savarino, PaduaMarco Senzolo, PaduaAnnalucia Serafino, RomeGiuseppe S Sica, RomePierpaolo Sileri, RomeCosimo Sperti, PaduaVincenzo Stanghellini, BolognaCristina Stasi, FlorenceGabriele Stocco, TriesteRoberto Tarquini, FlorenceMario Testini, BariGuido Torzilli, MilanGuido Alberto Massimo, Tiberio BresciaGiuseppe Toffoli, AvianoAlberto Tommasini, TriesteFrancesco Tonelli, FlorenceCesare Tosetti Porretta, TermeLucio Trevisani, ConaGuglielmo M Trovato, CataniaMariapia Vairetti, PaviaLuca Vittorio Valenti, MilanoMariateresa T Ventura, BariGiuseppe Verlato, VeronaMarco Vivarelli, AnconaGiovanni Li Volti, CataniaGiuseppe Zanotti, PaduaVincenzo Zara, LecceGianguglielmo Zehender, MilanAnna Linda Zignego, FlorenceRocco Antonio Zoccali, Messina
Angelo Zullo, Rome
JapanYasushi Adachi, SapporoTakafumi Ando, NagoyaMasahiro Arai, TokyoMakoto Arai, ChibaTakaaki Arigami, KagoshimaItaru Endo,YokohamaMunechika Enjoji, FukuokaShunji Fujimori, TokyoYasuhiro Fujino, AkashiToshiyoshi Fujiwara, OkayamaYosuke Fukunaga, TokyoToshio Fukusato, TokyoTakahisa Furuta, HamamatsuOsamu Handa, KyotoNaoki Hashimoto, OsakaYoichi Hiasa, ToonMasatsugu Hiraki, SagaSatoshi Hirano, SapporoKeiji Hirata, FukuokaToru Hiyama, HigashihiroshimaAkira Hokama, NishiharaShu Hoteya, TokyoMasao Ichinose, WakayamaTatsuya Ide, KurumeMasahiro Iizuka, AkitaToshiro Iizuka, TokyoKenichi Ikejima, TokyoTetsuya Ikemoto, TokushimaHiroyuki Imaeda, SaitamaAtsushi Imagawa, Kan-onjiHiroo Imazu, TokyoShuji Isaji, TsuToru Ishikawa, NiigataToshiyuki Ishiwata, TokyoSoichi Itaba, KitakyushuYoshiaki Iwasaki, OkayamaTatehiro Kagawa, IseharaSatoru Kakizaki, MaebashiNaomi Kakushima, ShizuokaTerumi Kamisawa, TokyoAkihide Kamiya, IseharaOsamu Kanauchi, TokyoTatsuo Kanda, ChibaShin Kariya, OkayamaShigeyuki Kawa, MatsumotoTakumi Kawaguchi, KurumeTakashi Kawai, TokyoSoo Ryang Kim, KobeShinsuke Kiriyama, GunmaTsuneo Kitamura, UrayasuMasayuki Kitano, OsakasayamaHirotoshi Kobayashi, TokyoHironori Koga, KurumeTakashi Kojima, SapporoSatoshi Kokura, KyotoShuhei Komatsu, KyotoTadashi Kondo, TokyoYasuteru Kondo, SendaiYasuhiro Kuramitsu, YamaguchiYukinori Kurokawa, OsakaShin Maeda, YokohamaKoutarou Maeda, ToyoakeHitoshi Maruyama, Chiba
September 10, 2015VWJG|www.wjgnet.com
Atsushi Masamune, SendaiHiroyuki Matsubayashi, SuntogunAkihisa Matsuda, InzaiHirofumi Matsui, TsukubaAkira Matsumori, KyotoYoichi Matsuo, NagoyaY Matsuzaki, AmiToshihiro Mitaka, SapporoKouichi Miura, AkitaShinichi Miyagawa, MatumotoEiji Miyoshi, SuitaToru Mizuguchi, SapporoNobumasa Mizuno, NagoyaZenichi Morise, NagoyaTomohiko Moriyama, FukuokaKunihiko Murase, Tusima Michihiro Mutoh, TsukijiAkihito Nagahara, TokyoHikaru Nagahara, TokyoHidenari Nagai, TokyoKoichi Nagata, Shimotsuke-shiMasaki Nagaya, KawasakiHisato Nakajima, Nishi-ShinbashiToshifusa Nakajima, TokyoHiroshi Nakano, KawasakiHiroshi Nakase, KyotoToshiyuki Nakayama, NagasakiTakahiro Nakazawa, NagoyaShoji Natsugoe, Kagoshima CityTsutomu Nishida, SuitaShuji Nomoto, NaogyaSachiyo Nomura, TokyoTakeshi Ogura, TakatsukishiNobuhiro Ohkohchi, TsukubaToshifumi Ohkusa, KashiwaHirohide Ohnishi, AkitaTeruo Okano, TokyoSatoshi Osawa, HamamatsuMotoyuki Otsuka, TokyoMichitaka Ozaki, SapporoSatoru Saito, YokohamaNaoaki Sakata, SendaiKen Sato, MaebashiToshiro Sato, TokyoTomoyuki Shibata, ToyoakeH Shimada, TokyoTomohiko Shimatani, KureYukihiro Shimizu, NantoTadashi Shimoyama, HirosakiMasayuki Sho, NaraIkuo Shoji, KobeAtsushi Sofuni, TokyoTakeshi Suda, NiigataM Sugimoto, HamamatsuKen Sugimoto, HamamatsuHaruhiko Sugimura, HamamatsuShoichiro Sumi, KyotoHidekazu Suzuki, TokyoMasahiro Tajika, NagoyaHitoshi Takagi, TakasakiToru Takahashi, NiigataYoshihisa Takahashi, TokyoShinsuke Takeno, FukuokaAkihiro Tamori, OsakaKyosuke Tanaka, TsuShinji Tanaka, Hiroshima
Atsushi Tanaka, TokyoYasuhito Tanaka, NagoyaShinji Tanaka, TokyoMinoru Tomizawa, Yotsukaido CityKyoko Tsukiyama-Kohara, KagoshimaTakuya Watanabe, NiigataKazuhiro Watanabe, SendaiSatoshi Yamagiwa, NiigataTakayuki Yamamoto, YokkaichiHiroshi Yamamoto, OtsuKosho Yamanouchi, NagasakiIchiro Yasuda, GifuYutaka Yata, Maebashi-cityShin-ichi Yokota, SapporoNorimasa Yoshida, KyotoHiroshi Yoshida, Tama-CityHitoshi Yoshiji, KashiharaKazuhiko Yoshimatsu, TokyoKentaro Yoshioka, ToyoakeNobuhiro Zaima, Nara
JordanKhaled Ali Jadallah, Irbid
KuwaitIslam Khan, Kuwait
LebanonBassam N Abboud, BeirutKassem A Barada, BeirutMarwan Ghosn, BeirutIyad A Issa, BeirutFadi H Mourad, BeirutAIa Sharara, BeirutRita Slim, Beirut
LithuaniaAntanas Mickevicius, Kaunas
MalaysiaHuck Joo Tan, Petaling Jaya
MexicoRichard A Awad, Mexico CityCarlos R Camara-Lemarroy, MonterreyNorberto C Chavez-Tapia, Mexico CityWolfgang Gaertner, Mexico CityDiego Garcia-Compean, MonterreyArturo Panduro, GuadalajaraOT Teramoto-Matsubara, Mexico CityFelix Tellez-Avila, Mexico CityOmar Vergara-Fernandez, Mexico CitySaúl Villa-Trevino, Cuidad de México
MoroccoSamir Ahboucha, Khouribga
NetherlandsRobert J de Knegt, RotterdamTom Johannes Gerardus Gevers, NijmegenMenno Hoekstra, LeidenBW Marcel Spanier, ArnhemKarel van Erpecum, Utrecht
New ZealandLeo K Cheng, AucklandAndrew Stewart Day, ChristchurchJonathan Barnes Koea, AucklandMax Petrov, Auckland
NigeriaOlufunmilayo Adenike Lesi, LagosJesse Abiodun Otegbayo, IbadanStella Ifeanyi Smith, Lagos
NorwayTrond Berg, OsloTrond Arnulf Buanes, KrokkleivaThomas de Lange, RudMagdy El-Salhy, StordRasmus Goll, TromsoDag Arne Lihaug Hoff, Aalesund
PakistanZaigham Abbas, KarachiUsman A Ashfaq, FaisalabadMuhammad Adnan Bawany, HyderabadMuhammad Idrees, LahoreSaeed Sadiq Hamid, KarachiYasir Waheed, Islamabad
PolandThomas Brzozowski, CracowMagdalena Chmiela, LodzKrzysztof Jonderko, SosnowiecAnna Kasicka-Jonderko, SosnowiecMichal Kukla, KatowiceTomasz Hubert Mach, KrakowAgata Mulak, WroclawDanuta Owczarek, KrakówPiotr Socha, WarsawPiotr Stalke, GdanskJulian Teodor Swierczynski, GdanskAnna M Zawilak-Pawlik, Wroclaw
PortugalMarie Isabelle Cremers, SetubalCeu Figueiredo, PortoAna Isabel Lopes, LIsbonM Paula Macedo, LisboaRicardo Marcos, PortoRui T Marinho, LisboaGuida Portela-Gomes, Estoril
September 10, 2015VIWJG|www.wjgnet.com
Filipa F Vale, Lisbon
Puerto RicoCaroline B Appleyard, Ponce
QatarAbdulbari Bener, Doha
RomaniaMihai Ciocirlan, BucharestDan LucianDumitrascu, Cluj-NapocaCarmen Fierbinteanu-Braticevici, BucharestRomeo G Mihaila, SibiuLucian Negreanu, BucharestAdrian Saftoiu, CraiovaAndrada Seicean, Cluj-NapocaIoan Sporea, TimisoaraLetiţia Adela Maria Streba, CraiovaAnca Trifan, Iasi
RussiaVictor Pasechnikov, StavropolVasiliy Ivanovich Reshetnyak, MoscowVitaly Skoropad, Obninsk
Saudi ArabiaAbdul-Wahed N Meshikhes, DammamM Ezzedien Rabie, Khamis Mushait
SingaporeBrian KP Goh, SingaporeRichie Soong, SingaporeKer-Kan Tan, SingaporeKok-Yang Tan, SingaporeYee-Joo Tan, SingaporeMark Wong, SingaporeHong Ping Xia, Singapore
SloveniaMatjaz Homan, LjubljanaMartina Perse, Ljubljana
South KoreaSang Hoon Ahn, SeoulSeung Hyuk Baik, SeoulSoon Koo Baik, WonjuSoo-Cheon Chae, IksanByung-Ho Choe, DaeguSuck Chei Choi, IksanHoon Jai Chun, SeoulYeun-Jun Chung, SeoulYoung-Hwa Chung, SeoulKi-Baik Hahm, SeongnamSang Young Han, Busan
Seok Joo Han, SeoulSeung-Heon Hong, IksanJin-Hyeok Hwang, SeoungnamJeong Won Jang, SeoulJin-Young Jang, SeoulDae-Won Jun, SeoulYoung Do Jung, KwangjuGyeong Hoon Kang, SeoulSung-Bum Kang, SeoulKoo Jeong Kang, DaeguKi Mun Kang, JinjuChang Moo Kang, Seodaemun-guGwang Ha Kim, BusanSang Soo Kim, Goyang-siJin Cheon Kim, SeoulTae Il Kim, SeoulJin Hong Kim, SuwonKyung Mo Kim, SeoulKyongmin Kim, SuwonHyung-Ho Kim, SeongnamSeoung Hoon Kim, GoyangSang Il Kim, SeoulHyun-Soo Kim, WonjuJung Mogg Kim, Seoul Dong Yi Kim, GwangjuKyun-Hwan Kim, SeoulJong-Han Kim, AnsanSang Wun Kim, SeoulJa-Lok Ku, SeoulKyu Taek Lee, SeoulHae-Wan Lee, ChuncheonInchul Lee, SeoulJung Eun Lee, SeoulSang Chul Lee, DaejeonSong Woo Lee, Ansan-siHyuk-Joon Lee, SeoulSeong-Wook Lee, YonginKil Yeon Lee, SeoulJong-Inn Lee, SeoulKyung A Lee, SeoulJong-Baeck Lim, SeoulEun-Yi Moon, SeoulSH Noh, SeoulSeung Woon Paik, SeoulWon Sang Park, SeoulSung-Joo Park, IksanKyung Sik Park, DaeguSe Hoon Park, SeoulYoonkyung Park, GwangjuSeung-Wan Ryu, DaeguIl Han Song, CheonanMyeong Jun Song, DaejeonYun Kyoung Yim, DaejeonDae-Yeul Yu Daejeon
SpainMariam Aguas, ValenciaRaul J Andrade, MálagaAntonio Arroyo, ElcheJosep M Bordas, BarcelonaLisardo Boscá, MadridRicardo Robles Campos, MurciaJordi Camps, ReusCarlos Cervera Barcelona
Alfonso Clemente, Granada Pilar Codoner-Franch, ValenciaFernando J Corrales, PamplonaFermin Sánchez de Medina, GranadaAlberto Herreros de Tejada, MajadahondaEnrique de-Madaria, AlicanteJE Dominguez-Munoz, Santiago de CompostelaVicente Felipo, ValenciaCM Fernandez-Rodriguez, MadridCarmen Frontela-Saseta, MurciaJulio Galvez, GranadaMaria Teresa García, VigoMI Garcia-Fernandez, MálagaEmilio Gonzalez-Reimers, La LagunaMarcel Jimenez, BellaterraAngel Lanas, ZaragozaJuan Ramón Larrubia, GuadalajaraAntonio Lopez-Sanroman, MadridVicente Lorenzo-Zuniga, BadalonaAlfredo J Lucendo, TomellosoVicenta Soledad Martinez-Zorzano, VigoJosé Manuel Martin-Villa, MadridJulio Mayol, MadridManuel Morales-Ruiz, BarcelonaAlfredo Moreno-Egea, MurciaAlbert Pares, BarcelonaMaria Pellise, BarcelonaJosé Perea, MadridMiguel Angel Plaza, ZaragozaMaría J Pozo, CáceresEnrique Quintero, La LagunaJose M Ramia, MadridFrancisco Rodriguez-Frias, BarcelonaSilvia Ruiz-Gaspa, BarcelonaXavier Serra-Aracil, BarcelonaVincent Soriano, MadridJavier Suarez, PamplonaCarlos Taxonera, MadridM Isabel Torres, JaénManuel Vazquez-Carrera, BarcelonaBenito Velayos, ValladolidSilvia Vidal, Barcelona
Sri LankaArjuna Priyadarsin De Silva, Colombo
SudanIshag Adam, Khartoum
SwedenRoland G Andersson, LundBergthor Björnsson, LinkopingJohan Christopher Bohr, ÖrebroMauro D’Amato, StockholmThomas Franzen, NorrkopingEvangelos Kalaitzakis, LundRiadh Sadik, GothenburgPer Anders Sandstrom, LinkopingErvin Toth, MalmöKonstantinos Tsimogiannis, VasterasApostolos V Tsolakis, Uppsala
September 10, 2015VIIWJG|www.wjgnet.com
SwitzerlandGieri Cathomas, LiestalJean Louis Frossard, GeneveChristian Toso, GenevaStephan Robert Vavricka, ZurichDominique Velin, Lausanne
ThailandThawatchai Akaraviputh, BangkokP Yoysungnoen Chintana, PathumthaniVeerapol Kukongviriyapan, MuangVijittra Leardkamolkarn, BangkokVarut Lohsiriwat, BangkokSomchai Pinlaor, Khaon KaenD Wattanasirichaigoon, Bangkok
Trinidad and TobagoB Shivananda Nayak, Mount Hope
TunisiaIbtissem Ghedira, SousseLilia Zouiten-Mekki, Tunis
TurkeyInci Alican, IstanbulMustafa Altindis, SakaryaMutay Aslan, AntalyaOktar Asoglu, IstanbulYasemin Hatice Balaban, IstanbulMetin Basaranoglu, AnkaraYusuf Bayraktar, Ankara Süleyman Bayram, AdiyamanAhmet Bilici, IstanbulAhmet Sedat Boyacioglu, AnkaraZüleyha Akkan Cetinkaya, Kocaeli Cavit Col, BoluYasar Colak, IstanbulCagatay Erden Daphan, KirikkaleMehmet Demir, HatayAhmet Merih Dobrucali, IstanbulGülsüm Ozlem Elpek, AntalyaAyse Basak Engin, AnkaraEren Ersoy, AnkaraOsman Ersoy, AnkaraYusuf Ziya Erzin, IstanbulMukaddes Esrefoglu, IstanbulLevent Filik, AnkaraOzgur Harmanci, AnkaraKoray Hekimoglu, AnkaraAbdurrahman Kadayifci, GaziantepCem Kalayci, IstanbulSelin Kapan, IstanbulHuseyin Kayadibi, AdanaSabahattin Kaymakoglu, IstanbulMetin Kement, IstanbulMevlut Kurt, BoluResat Ozaras, IstanbulElvan Ozbek, Adapazari
Cengiz Ozcan, MersinHasan Ozen, AnkaraHalil Ozguc, BursaMehmet Ozturk, IzmirOrhan V Ozkan, SakaryaSemra Paydas, AdanaOzlem Durmaz Suoglu, IstanbulIlker Tasci, AnkaraMüge Tecder-ünal, AnkaraMesut Tez, AnkaraSerdar Topaloglu, TrabzonMurat Toruner, AnkaraGokhan Tumgor, AdanaOguz Uskudar, AdanaMehmet Yalniz, ElazigMehmet Yaman, ElazigVeli Yazisiz, AntalyaYusuf Yilmaz, IstanbulOzlem Yilmaz, IzmirOya Yucel, IstanbulIlhami Yuksel, Ankara
United KingdomNadeem Ahmad Afzal, SouthamptonNavneet K Ahluwalia, StockportYeng S Ang, LancashireRamesh P Arasaradnam, CoventryIan Leonard Phillip Beales, NorwichJohn Beynon, SwanseaBarbara Braden, OxfordSimon Bramhall, BirminghamGeoffrey Burnstock, LondonIan Chau, SuttonThean Soon Chew, LondonHelen G Coleman, BelfastAnil Dhawan, LondonSunil Dolwani, CardiffPiers Gatenby, LondonAnil T George, LondonPasquale Giordano, LondonPaul Henderson, EdinburghGeorgina Louise Hold, AberdeenStefan Hubscher, BirminghamRobin D Hughes, LondonNusrat Husain, ManchesterMatt W Johnson, LutonKonrad Koss, MacclesfieldAnastasios Koulaouzidis, EdinburghSimon Lal, SalfordJohn S Leeds, AberdeenJK K Limdi, ManchesterHongxiang Liu, CambridgeMichael Joseph McGarvey, LondonMichael Anthony Mendall, LondonAlexander H Mirnezami, SouthamptonJ Bernadette Moore, GuildfordClaudio Nicoletti, NorwichSavvas Papagrigoriadis, LondonSylvia LF Pender, SouthamptonDavid Mark Pritchard, LiverpoolJames A Ross, EdinburghKamran Rostami, WorcesterXiong Z Ruan, LondonFrank I Tovey, LondonDhiraj Tripathi, Birmingham
Vamsi R Velchuru, Great YarmouthNicholas T Ventham, EdinburghDiego Vergani, LondonJack Westwood Winter, GlasgowTerence Wong, LondonLing Yang, Oxford
United StatesDaniel E Abbott, CincinnatiGhassan K Abou-Alfa, New YorkJulian Abrams, New YorkDavid William Adelson, Los AngelesJonathan Steven Alexander, ShreveportTauseef Ali, Oklahoma CityMohamed R Ali, SacramentoRajagopal N Aravalli, MinneapolisHassan Ashktorab, WashingtonShashi Bala, WorcesterCharles F Barish, RaleighP Patrick Basu, New YorkRobert L Bell, Berkeley HeightsDavid Bentrem, ChicagoHenry J Binder, New HavenJoshua Bleier, PhiladelphiaWojciech Blonski, Johnson CityKenneth Boorom, CorvallisBrian Boulay, ChicagoCarla W Brady, DurhamKyle E Brown, Iowa CityAdeel A Butt, PittsburghWeibiao Cao, ProvidenceAndrea Castillo, CheneyFernando J Castro, WestonAdam S Cheifetz, BostonXiaoxin Luke Chen, DurhamRamsey Cheung, Palo AltoParimal Chowdhury, Little RockEdward John Ciaccio, New YorkDahn L Clemens, OmahaYingzi Cong, GalvestonLaura Iris Cosen-Binker, BostonJoseph John Cullen, LowaMark J Czaja, BronxMariana D Dabeva, BronxChristopher James Damman, SeattleIsabelle G De Plaen, ChicagoPunita Dhawan, NashvilleHui Dong, La JollaWael El-Rifai, NashvilleSukru H Emre, New HavenPaul Feuerstadt, HamdenJosef E Fischer, BostonLaurie N Fishman, BostonJoseph Che Forbi, AtlantaTemitope Foster, AtlantaAmy E Foxx-Orenstein, ScottsdaleDaniel E Freedberg, New YorkShai Friedland, Palo AltoVirgilio George, IndianapolisAjay Goel, DallasOliver Grundmann, GainesvilleStefano Guandalini, ChicagoChakshu Gupta, St. JosephGrigoriy E Gurvits, New York
September 10, 2015VIIIWJG|www.wjgnet.com
Xiaonan Han, CincinnatiMohamed Hassan, JacksonMartin Hauer-Jensen, Little RockKoichi Hayano, BostonYingli Hee, AtlantaSamuel B Ho, San DiegoJason Ken Hou, HoustonLifang Hou, ChicagoK-Qin Hu, OrangeJamal A Ibdah, ColumbiaRobert Thomas Jensen, BethesdaHuanguang “Charlie” Jia, GainesvilleRome Jutabha, Los AngelesAndreas M Kaiser, Los AngelesAvinash Kambadakone, BostonDavid Edward Kaplan, PhiladelphiaRandeep Kashyap, RochesterRashmi Kaul, TulsaAli Keshavarzian, ChicagoAmir Maqbul Khan, MarshallNabeel Hasan Khan, New OrleansSahil Khanna, RochesterKusum K Kharbanda, OmahaHyun Sik Kim, PittsburghJoseph Kim, DuarteJae S Kim, GainesvilleMiran Kim, ProvidenceTimothy R Koch, WashingtonBurton I Korelitz, New YorkBetsy Kren, MinneapolisShiu-Ming Kuo, BuffaloMichelle Lai, BostonAndreas Larentzakis, BostonEdward Wolfgang Lee, Los AngelesDaniel A Leffler, BostonMichael Leitman, New YorkSuthat Liangpunsakul, IndianapolisJoseph K Lim, New HavenElaine Y Lin, BronxHenry C Lin, AlbuquerqueRohit Loomba, La JollaJames David Luketich, Pittsburgh
Li Ma, StanfordMohammad F Madhoun, Oklahoma CityThomas C Mahl, BuffaloAshish Malhotra, BettendorfPranoti Mandrekar, WorcesterJohn Marks, WynnewoodWendy M Mars, PittsburghJulien Vahe Matricon, San AntonioCraig J McClain, LouisvilleTamir Miloh, PhoenixAyse Leyla Mindikoglu, BaltimoreHuanbiao Mo, DentonKlaus Monkemuller, BirminghamJohn Morton, StanfordAdnan Muhammad, TampaMichael J Nowicki, JacksonPatrick I Okolo, BaltimoreGiusepp Orlando, Winston SalemNatalia A Osna, OmahaVirendra N Pandey, NewarkMansour A Parsi, Cleveland Michael F Picco, JacksonvilleDaniel S Pratt, BostonXiaofa Qin, NewarkJanardan K Reddy, ChicagoVictor E Reyes, GalvestonJon Marc Rhoads, HoustonGiulia Roda, New YorkJean-Francois Armand Rossignol, TampaPaul A Rufo, BostonMadhusudana Girija Sanal, New York Miguel Saps, ChicagoSushil Sarna, GalvestonAnn O Scheimann, BaltimoreBernd Schnabl, La JollaMatthew J Schuchert, PittsburghEkihiro Seki, La JollaChanjuan Shi, NashvilleDavid Quan Shih, Los AngelesShadab A Siddiqi, OrlandoWilliam B Silverman, Iowa CityShashideep Singhal, New York
Bronislaw L Slomiany, NewarkSteven F Solga, BethlehemByoung-Joon Song, BethesdaDario Sorrentino, RoanokeScott R Steele, Fort LewisBranko Stefanovic, TallahasseeArun Swaminath, New YorkKazuaki Takabe, RichmondNaoki Tanaka, BethesdaHans Ludger Tillmann, DurhamGeorge Triadafilopoulos, StanfordJohn Richardson Thompson, NashvilleAndrew Ukleja, WestonMiranda AL van Tilburg, Chapel HillGilberto Vaughan, AtlantaVijayakumar Velu, AtlantaGebhard Wagener, New YorkKasper Saonun Wang, Los AngelesXiangbing Wang, New BrunswickDaoyan Wei, HoustonTheodore H Welling, Ann ArborC Mel Wilcox, BirminghamJacqueline Lee Wolf, BostonLaura Ann Woollett, CincinnatiHarry Hua-Xiang Xia, East HanoverWen Xie, PittsburghGuang Yu Yang, ChicagoMichele T Yip-Schneider, IndianapolisSam Zakhari, BethesdaKezhong Zhang, DetroitHuiping Zhou, RichmondXiao-Jian Zhou, CambridgeRichard Zubarik, Burlington
VenezuelaMiguel Angel Chiurillo, Barquisimeto
VietnamVan Bang Nguyen, Hanoi
September 10, 2015IXWJG|www.wjgnet.com
S
EDITORIAL
9833 Internationalguidelinesforthemanagementofpancreaticintraductalpapillarymucinousneoplasms
Goh BKP
TOPIC HIGHLIGHT
9838 Recentadvancesinthemoleculardiagnosticsofgastriccancer
Kanda M, Kodera Y
9853 CirculatingmicroRNAsasdiagnosticandprognostictoolsforhepatocellularcarcinoma
Zhang YC, Xu Z, Zhang TF, Wang YL
REVIEW
9863 CirculatingmicroRNAsandlongnon-codingRNAsingastriccancerdiagnosis:Anupdateandreview
Huang YK, Yu JC
ORIGINAL ARTICLE
Basic Study
9887 Dexamethasoneinhibitshypoxia-inducedepithelial-mesenchymaltransitionincoloncancer
Kim JH, Hwang YJ, Han SH, Lee YE, Kim S, Kim YJ, Cho JH, Kwon KA, Kim JH, Kim SH
9900 MiR-9a-5pregulatesproliferationandmigrationofhepaticstellatecellsunderpressurethroughinhibition
ofSirt1
Qi F, Hu JF, Liu BH, Wu CQ, Yu HY, Yao DK, Zhu L
9916 Macrophagemigrationinhibitoryfactorasapotentialprognosticfactoringastriccancer
He LJ, Xie D, Hu PJ, Liao YJ, Deng HX, Kung HF, Zhu SL
9927 DevelopmentofaratmodelofD-galactosamine/lipopolysaccharideinducedhepatorenalsyndrome
Wang JB, Wang HT, Li LP, Yan YC, Wang W, Liu JY, Zhao YT, Gao WS, Zhang MX
9936 Neurochemicalfeaturesofendomorphin-2-containingneuronsinthesubmucosalplexusoftheratcolon
Li JP, Zhang T, Gao CJ, Kou ZZ, Jiao XW, Zhang LX, Wu ZY, He ZY, Li YQ
9945 β-elemeneenhancestheradiosensitivityofgastriccancercellsbyinhibitingPak1activation
Liu JS, Che XM, Chang S, Qiu GL, He SC, Fan L, Zhao W, Zhang ZL, Wang SF
Contents Weekly Volume 21 Number 34 September 14, 2015
� September 14, 2015|Volume 21|�ssue 34|WJG|www.wjgnet.com

ContentsWorld Journal of Gastroenterology
Volume 21 Number 34 September 14, 2015
Retrospective Cohort Study
9957 Associationofserumgamma-glutamyltransferasewithtreatmentoutcomeinchronichepatitisBpatients
Huang R, Yang CC, Liu Y, Xia J, Su R, Xiong YL, Wang GY, Sun ZH, Yan XM, Lu S, Wu C
Retrospective Study
9966 Prognosticsignificanceofthelymphocyte-to-monocyteratioinpatientswithmetastaticcolorectalcancer
Shibutani M, Maeda K, Nagahara H, Ohtani H, Sakurai K, Yamazoe S, Kimura K, Toyokawa T, Amano R, Tanaka H,
Muguruma K, Hirakawa K
9974 ClinicalutilityofanewendoscopicscoringsystemforCrohn'sdisease
Morise K, Ando T, Watanabe O, Nakamura M, Miyahara R, Maeda O, Ishiguro K, Hirooka Y, Goto H
9982 Novel3-dimensionalvirtualhepatectomysimulationcombinedwithreal-timedeformation
Oshiro Y, Yano H, Mitani J, Kim S, Kim J, Fukunaga K, Ohkohchi N
9993 Detectionofgallbladderstonesbydual-energyspectralcomputedtomographyimaging
Chen AL, Liu AL, Wang S, Liu JH, Ju Y, Sun MY, Liu YJ
9999 Clinicalcomparisonofantrum-preservingdoubletractreconstructionvs roux-en-Yreconstructionafter
gastrectomyforSiewerttypesⅡandⅢadenocarcinomaoftheesophagogastricjunction
Xiao JW, Liu ZL, Ye PC, Luo YJ, Fu ZM, Zou Q, Wei SJ
Observational Study
10008 Computedtomographyandmagneticresonanceimagingfeaturesoflipid-richneuroendocrinetumorsof
thepancreas
Fukukura Y, Shindo T, Higashi M, Takumi K, Umanodan T, Yoneyama T, Yoshiura T
Prospective Study
10018 Accuracyofabdominalauscultationforbowelobstruction
Breum BM, Rud B, Kirkegaard T, Nordentoft T
META-ANALYSIS
10025 CTLA-4 andMDR1polymorphismsincreasetheriskforulcerativecolitis:Ameta-analysis
Zhao JJ, Wang D, Yao H, Sun DW, Li HY
CASE REPORT
10041 Ligation-assistedendoscopicsubmucosalresectionwithcircumferentialmucosalincisionforduodenal
carcinoidtumor
Harada H, Suehiro S, Shimizu T, Katsuyama Y, Hayasaka K, Ito H
�� September 14, 2015|Volume 21|�ssue 34|WJG|www.wjgnet.com

ContentsWorld Journal of Gastroenterology
Volume 21 Number 34 September 14, 2015
10045 Endoscopicultrasound-guidedbiliarydrainage:Bilateralsystemsdrainagevia leftductapproach
Prachayakul V, Aswakul P
10049 Trousseau'ssyndromeinapatientwithadvancedstagegastriccancer
Chien TL, Rau KM, Chung WJ, Tai WC, Wang SH, Chiu YC, Wu KL, Chou YP, Wu CC, Chen YH, Chuah SK;
Gastric Cancer Team
LETTERS TO THE EDITOR10054 PNPLA3I148Mvariantaffectsnon-alcoholicfattyliverdiseaseinlivertransplantrecipients
Liu ZT, Chen TC, Lu XX, Cheng J, Xie HY, Zhou L, Zheng SS
��� September 14, 2015|Volume 21|�ssue 34|WJG|www.wjgnet.com
NAMEOFJOURNALWorld Journal of Gastroenterology
ISSNISSN 1007-9327 (print)ISSN 2219-2840 (online)
LAUNCHDATEOctober 1, 1995
FREQUENCYWeekly
EDITORS-IN-CHIEFDamian Garcia-Olmo, MD, PhD, Doctor, Profes-sor, Surgeon, Department of Surgery, Universidad Autonoma de Madrid; Department of General Sur-gery, Fundacion Jimenez Diaz University Hospital, Madrid 28040, Spain
Stephen C Strom, PhD, Professor, Department of Laboratory Medicine, Division of Pathology, Karo-linska Institutet, Stockholm 141-86, Sweden
Andrzej S Tarnawski, MD, PhD, DSc (Med), Professor of Medicine, Chief Gastroenterology, VA
Long Beach Health Care System, University of Cali-fornia, Irvine, CA, 5901 E. Seventh Str., Long Beach, CA 90822, United States
EDITORIALOFFICEJin-Lei Wang, DirectorXiu-Xia Song, Vice DirectorWorld Journal of GastroenterologyRoom 903, Building D, Ocean International Center, No. 62 Dongsihuan Zhonglu, Chaoyang District, Beijing 100025, ChinaTelephone: +86-10-59080039Fax: +86-10-85381893E-mail: [email protected] Desk: http://www.wjgnet.com/esps/helpdesk.aspxhttp://www.wjgnet.com
PUBLISHERBaishideng Publishing Group Inc8226 Regency Drive, Pleasanton, CA 94588, USATelephone: +1-925-223-8242Fax: +1-925-223-8243E-mail: [email protected] Desk: http://www.wjgnet.com/esps/helpdesk.aspxhttp://www.wjgnet.com
Contents
EDITORS FOR THIS ISSUE
Responsible Assistant Editor: Xiang Li Responsible Science Editor: Ze-Mao GongResponsible Electronic Editor: Shuai Ma Proofing Editorial Office Director: Jin-Lei WangProofing Editor-in-Chief: Lian-Sheng Ma
PUBLICATIONDATESeptember 14, 2015
COPYRIGHT© 2015 Baishideng Publishing Group Inc. Articles pub-lished by this Open-Access journal are distributed under the terms of the Creative Commons Attribution Non-commercial License, which permits use, distribution, and reproduction in any medium, provided the original work is properly cited, the use is non commercial and is otherwise in compliance with the license.
SPECIALSTATEMENTAll articles published in journals owned by the Baishideng Publishing Group (BPG) represent the views and opin-ions of their authors, and not the views, opinions or policies of the BPG, except where otherwise explicitly indicated.
INSTRUCTIONSTOAUTHORSFull instructions are available online at http://www.wjgnet.com/1007-9327/g_info_20100315215714.htm
ONLINESUBMISSIONhttp://www.wjgnet.com/esps/
World Journal of GastroenterologyVolume 21 Number 34 September 14, 2015
EditorialboardmemberofWorldJournalofGastroenterology,EnzoIerardi,MD,AdjunctProfessor,AssociateProfessor,SeniorScientist,EmergencyandOrganTransplantation,SectionofGastroenterology,UniversityofBari,Bari,Puglia70124,Italy
World Journal of Gastroenterology (World J Gastroenterol, WJG, print ISSN 1007-9327, online ISSN 2219-2840, DOI: 10.3748) is a peer-reviewed open access journal. WJG was estab-lished on October 1, 1995. It is published weekly on the 7th, 14th, 21st, and 28th each month. The WJG Editorial Board consists of 1377 experts in gastroenterology and hepatology from 68 countries. The primary task of WJG is to rapidly publish high-quality original articles, reviews, and commentaries in the fields of gastroenterology, hepatology, gastrointestinal endos-copy, gastrointestinal surgery, hepatobiliary surgery, gastrointestinal oncology, gastroin-testinal radiation oncology, gastrointestinal imaging, gastrointestinal interventional ther-apy, gastrointestinal infectious diseases, gastrointestinal pharmacology, gastrointestinal pathophysiology, gastrointestinal pathology, evidence-based medicine in gastroenterol-ogy, pancreatology, gastrointestinal laboratory medicine, gastrointestinal molecular biol-ogy, gastrointestinal immunology, gastrointestinal microbiology, gastrointestinal genetics, gastrointestinal translational medicine, gastrointestinal diagnostics, and gastrointestinal therapeutics. WJG is dedicated to become an influential and prestigious journal in gas-troenterology and hepatology, to promote the development of above disciplines, and to improve the diagnostic and therapeutic skill and expertise of clinicians.
World Journal of Gastroenterology is now indexed in Current Contents®/Clinical Medicine, Sci-ence Citation Index Expanded (also known as SciSearch®), Journal Citation Reports®, Index Medicus, MEDLINE, PubMed, PubMed Central, Digital Object Identifier, and Directory of Open Access Journals. According to the 2014 Journal Citation Reports® released by Thomson Reuters (ISI), the 2014 impact factor for WJG is 2.369, ranking 41 among 76 journals in gastro-enterology and hepatology, quartile in category Q2.
I-IX EditorialBoard
ABOUT COVER
INDEXING/ABSTRACTING
AIMS AND SCOPE
FLYLEAF
�V September 14, 2015|Volume 21|�ssue 34|WJG|www.wjgnet.com
International guidelines for the management of pancreatic intraductal papillary mucinous neoplasms
Brian KP Goh
Brian KP Goh, Department of Hepatopancreatobiliary and Transplant Surgery, Singapore General Hospital, Singapore 169856, Singapore
Brian KP Goh, Duke -National University of Singapore Graduate Medical School, Singapore 169857, Singapore
Author contributions: Goh BKP contributed to this paper.
Conflict-of-interest statement: There are no conflicts of interest in relation to this manuscript.
Open-Access: This article is an open-access article which was selected by an in-house editor and fully peer-reviewed by external reviewers. It is distributed in accordance with the Creative Commons Attribution Non Commercial (CC BY-NC 4.0) license, which permits others to distribute, remix, adapt, build upon this work non-commercially, and license their derivative works on different terms, provided the original work is properly cited and the use is non-commercial. See: http://creativecommons.org/licenses/by-nc/4.0/
Correspondence to: Brian KP Goh, MBBS, MMed, MSc, FRCS(Ed), FAMS, Associate Professor, Senior Consultant, Department of Hepatopancreatobiliary and Transplantation Surgery, Singapore General Hospital, Academia, 20 College Road, Singapore 169856, Singapore. [email protected]: +65-63265564Fax: +65-62209323
Received: January 28, 2015Peer-review started: January 29, 2015First decision: March 26, 2015Revised: April 10, 2015Accepted: June 10, 2015Article in press: June 10, 2015Published online: September 14, 2015
AbstractThe management of intraductal papillary mucinous neoplasms (IPMN) is presently evolving as a result of the improved understanding of the natural history
EDITORIAL
Submit a Manuscript: http://www.wjgnet.com/esps/Help Desk: http://www.wjgnet.com/esps/helpdesk.aspxDOI: 10.3748/wjg.v21.i34.9833
World J Gastroenterol 2015 September 14; 21(34): 9833-9837 ISSN 1007-9327 (print) ISSN 2219-2840 (online)
© 2015 Baishideng Publishing Group Inc. All rights reserved.
9833 September 14, 2015|Volume 21|Issue 34|WJG|www.wjgnet.com
and biological behavior of the different pancreatic cystic neoplasms; and better preoperative diagnosis of these neoplasms due to advancement in preoperative diagnostic tools. International consensus guidelines for the management of IPMN were first formulated in 2006 and subsequently revised in 2012. Both these guidelines were constructed based on expert opinion and not on robust clinical data. The main limitation of the original Sendai guidelines was that it had a low positive predictive value resulting in many benign neoplasms being resected. Hence, these guidelines were revised in 2012. However, although the updated guidelines resulted in an improvement in the positive predictive value over the Sendai Guidelines, the results of several studies validating these guidelines demonstrated that its positive predictive value remained low. Furthermore, although both guidelines were associated with high negative predictive values, several investigators have demonstrated that some malignant IPMNs may be missed. Finally, it is imperative to emphasize that major considerations when managing a patient with IPMN including the patient’s surgical risk, life-expectancy and even cost of investigations are not taken into account in current guidelines. The management of a patient with IPMN should be individualized and tailored according to a patient’s risk benefit profile for resection vs surveillance.
Key words: Intraductal papillary mucinous neoplasms; Pancreatic cystic neoplasms; Cystic lesions of the pancreas; Mucinous cystic neoplasms; Pancreatic cysts; Guidelines; Management
© The Author(s) 2015. Published by Baishideng Publishing Group Inc. All rights reserved.
Core tip: Current guidelines of the management of intraductal papillary mucinous neoplasms are limited by the low positive predictive value resulting in many benign neoplasms being resected. Furthermore, despite a high negative predictive value, some malignant
and mixed-duct types (MT)[12,20,21]. BD-IPMNs were found to exhibit a less aggressive biological behavior when compared to MD/MT-IPMN and several studies have since demonstrated that many BD-IPMNs can be managed conservatively[2,5,8,10,20,21]. MD and MT-IPMN have been reportedly associated with a malignancy risk of between 40%-92%[10,20-22] compared to BD-IPMN which harbors a risk of malignancy in only approximately 15%-25% of case[10,22].
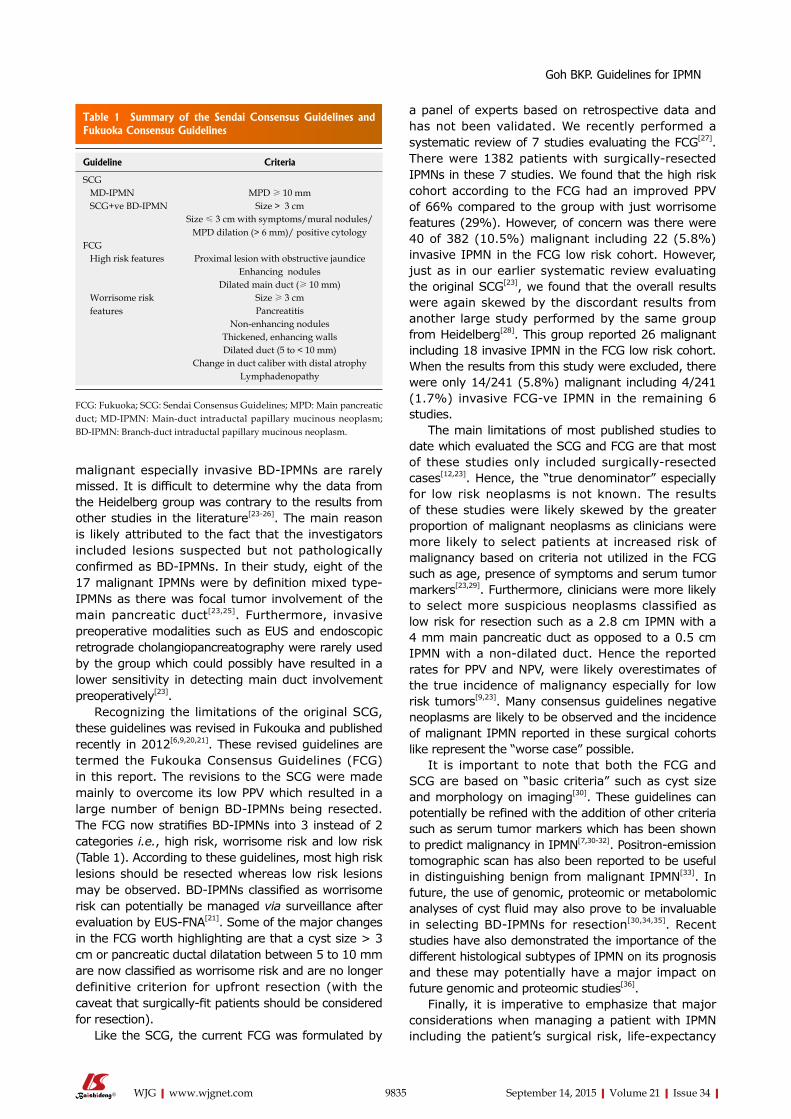
In order to guide management of MCNs and IPMNs, an international panel of experts convened in Sendai and in 2006 published consensus guidelines for the management of MCN and IPMN[20]. These guidelines are now widely known as the Sendai Consensus Guidelines (SCG) and were formulated based on expert opinion after review of preexisting retrospective data rather than on robust clinical data[12,23]. According to these guidelines, all MCNs and MD/MT IPMNs should be surgically resected whereas selected BD-IPMNs could be managed conservatively[20,23]. Symptomatic BD-IPMNs or asymptomatic BD-IPMNs larger than 3 cm, with a dilated pancreatic duct > 6 mm, presence of solid component or positive cyst fluid cytology were recommended for resection according to the SCG (Table 1)[20].
After its introduction, the SCG was widely adopted world-wide despite limited evidence supporting its utility[23]. Subsequently, several large studies[6,22,23] were conducted to validate the SCG. These studies revealed that the main limitation of the SCG was its low positive predictive value (PPV) whereby many benign BD-IPMNs were resected. The SCG was reported to be safe as it had a high negative predictive value (NPV) of close to 100% and malignant lesions especially invasive carcinomas were rarely missed[8,22,23]. However, a large study from Heidelberg published in 2012 questioned the safety of the SCG as the investigators reported that in their cohort of 123 surgically-resected BD-IPMNs, 17 of 69 SCG-ve BD-IPMNs were malignant including 11 which were invasive carcinomas[10]. Our recent systematic review[23] of 9 studies analyzing 690 surgically resected BD-IPMNs confirmed the low PPV and high NPV of the SCG. The PPV of SCG+ve neoplasms was 150/501 (29.9%) and the NPV of SCG-ve neoplasms was 171/189 (90%). However, when the results of the study from Heidelberg were excluded, the NPV was 170/171 (99%) and none of the SCG-ve neoplasms were invasive. Recent results from the Memorial Sloan-Kettering Cancer Center and the Massachusetts General Hospital also seemed to support the findings of our systematic review whereby the Memorial group reported 5 (14%) HGD among 35 resected SCG-ve BD-IPMN[24] and the MGH reported a 6.5% risk of HGD among 46 SCG-ve BD-IPMN smaller than 3 cm based on the revised 2012 SCG[8,25]. No invasive cancers were detected in both these studies among the SCG-ve neoplasms[25]. Hence, it is widely accepted by most experts that it generally safe to adopt the SCG and
Goh BKP. Guidelines for IPMN
9834 September 14, 2015|Volume 21|Issue 34|WJG|www.wjgnet.com
neoplasms may be missed based on these guidelines.
Goh BKP. International guidelines for the management of pancreatic intraductal papillary mucinous neoplasms. World J Gastroenterol 2015; 21(34): 9833-9837 Available from: URL: http://www.wjgnet.com/1007-9327/full/v21/i34/9833.htm DOI: http://dx.doi.org/10.3748/wjg.v21.i34.9833
The incidence of pancreatic cystic neoplasms have been reported to be rapidly increasing over the past 2 decades with the routine use of cross-sectional imaging such as computed tomographic (CT) scan and ultrasonographic (US) scan[1-3]. Many cystic lesions of the pancreas (CLP) are now incidentally detected[1,2,4]. In the past, an aggressive resection approach was recommended for the management of cystic lesions of the pancreas detected on imaging as preoperative diagnosis was difficult and little was known of the biology and natural history of these lesions[1,4]. However, presently; the management of pancreatic cystic neoplasms has gradually evolved in general towards a more conservative approach whereby many CLP are managed via surveillance rather than upfront resection[5-10]. This may be attributed to the rapid advancement of knowledge in the field resulting in: (1) an improved understanding of the natural history and biological behavior of the different pancreatic cystic neoplasms; and (2) better preoperative diagnosis of these neoplasms as a result of a better understanding of their individual imaging characteristics and the introduction of newer diagnostic modalities such as endoscopic ultrasonography with fine needle aspirate (EUS-FNA)[6,7,11,12]. Since the landmark papers by Compagno and Oertel in 1978[13,14]; the general consensus among clinicians were that all mucin-containing cystic neoplasms were potentially malignant or malignant and should be resected whereas serous cystic neoplasms were benign and could be managed conservatively[6,15,16]. Although this presumption remains true, with better understanding of the biology and natural history of these neoplasms; we now know that many mucinous lesions are relatively indolent and may take decades to transform into invasive lesions. In 1982, Ohashi provided the first pathological description of a previously unrecognized pancreatic mucinous neoplasm which we now know as intraductal papillary mucinous neoplasms (IPMN)[17]. Based on these pioneering findings, it is widely-recognized now that mucinous neoplasms are actually composed of 2 different pathological entities termed mucinous cystic neoplasms (MCNs) and IPMNs today[15,18,19]. Pathologically, the 2 entities may be distinguished by the presence of ovarian-type stroma in MCNs[15,18] and communication with the pancreatic duct in IPMNs[16]. More recently, investigators have also recognized that IPMNs could be classified according to their ductal involvement into branch-duct (BD), main-duct (MD)
malignant especially invasive BD-IPMNs are rarely missed. It is difficult to determine why the data from the Heidelberg group was contrary to the results from other studies in the literature[23-26]. The main reason is likely attributed to the fact that the investigators included lesions suspected but not pathologically confirmed as BD-IPMNs. In their study, eight of the 17 malignant IPMNs were by definition mixed type-IPMNs as there was focal tumor involvement of the main pancreatic duct[23,25]. Furthermore, invasive preoperative modalities such as EUS and endoscopic retrograde cholangiopancreatography were rarely used by the group which could possibly have resulted in a lower sensitivity in detecting main duct involvement preoperatively[23].
Recognizing the limitations of the original SCG, these guidelines was revised in Fukouka and published recently in 2012[6,9,20,21]. These revised guidelines are termed the Fukouka Consensus Guidelines (FCG) in this report. The revisions to the SCG were made mainly to overcome its low PPV which resulted in a large number of benign BD-IPMNs being resected. The FCG now stratifies BD-IPMNs into 3 instead of 2 categories i.e., high risk, worrisome risk and low risk (Table 1). According to these guidelines, most high risk lesions should be resected whereas low risk lesions may be observed. BD-IPMNs classified as worrisome risk can potentially be managed via surveillance after evaluation by EUS-FNA[21]. Some of the major changes in the FCG worth highlighting are that a cyst size > 3 cm or pancreatic ductal dilatation between 5 to 10 mm are now classified as worrisome risk and are no longer definitive criterion for upfront resection (with the caveat that surgically-fit patients should be considered for resection).
Like the SCG, the current FCG was formulated by
a panel of experts based on retrospective data and has not been validated. We recently performed a systematic review of 7 studies evaluating the FCG[27]. There were 1382 patients with surgically-resected IPMNs in these 7 studies. We found that the high risk cohort according to the FCG had an improved PPV of 66% compared to the group with just worrisome features (29%). However, of concern was there were 40 of 382 (10.5%) malignant including 22 (5.8%) invasive IPMN in the FCG low risk cohort. However, just as in our earlier systematic review evaluating the original SCG[23], we found that the overall results were again skewed by the discordant results from another large study performed by the same group from Heidelberg[28]. This group reported 26 malignant including 18 invasive IPMN in the FCG low risk cohort. When the results from this study were excluded, there were only 14/241 (5.8%) malignant including 4/241 (1.7%) invasive FCG-ve IPMN in the remaining 6 studies.
The main limitations of most published studies to date which evaluated the SCG and FCG are that most of these studies only included surgically-resected cases[12,23]. Hence, the “true denominator” especially for low risk neoplasms is not known. The results of these studies were likely skewed by the greater proportion of malignant neoplasms as clinicians were more likely to select patients at increased risk of malignancy based on criteria not utilized in the FCG such as age, presence of symptoms and serum tumor markers[23,29]. Furthermore, clinicians were more likely to select more suspicious neoplasms classified as low risk for resection such as a 2.8 cm IPMN with a 4 mm main pancreatic duct as opposed to a 0.5 cm IPMN with a non-dilated duct. Hence the reported rates for PPV and NPV, were likely overestimates of the true incidence of malignancy especially for low risk tumors[9,23]. Many consensus guidelines negative neoplasms are likely to be observed and the incidence of malignant IPMN reported in these surgical cohorts like represent the “worse case” possible.
It is important to note that both the FCG and SCG are based on “basic criteria” such as cyst size and morphology on imaging[30]. These guidelines can potentially be refined with the addition of other criteria such as serum tumor markers which has been shown to predict malignancy in IPMN[7,30-32]. Positron-emission tomographic scan has also been reported to be useful in distinguishing benign from malignant IPMN[33]. In future, the use of genomic, proteomic or metabolomic analyses of cyst fluid may also prove to be invaluable in selecting BD-IPMNs for resection[30,34,35]. Recent studies have also demonstrated the importance of the different histological subtypes of IPMN on its prognosis and these may potentially have a major impact on future genomic and proteomic studies[36].
Finally, it is imperative to emphasize that major considerations when managing a patient with IPMN including the patient’s surgical risk, life-expectancy
9835 September 14, 2015|Volume 21|Issue 34|WJG|www.wjgnet.com
Table 1 Summary of the Sendai Consensus Guidelines and Fukuoka Consensus Guidelines
Guideline Criteria
SCG MD-IPMN MPD ≥ 10 mm SCG+ve BD-IPMN Size > 3 cm
Size ≤ 3 cm with symptoms/mural nodules/MPD dilation (> 6 mm)/ positive cytology
FCG High risk features Proximal lesion with obstructive jaundice
Enhancing nodulesDilated main duct (≥ 10 mm)
Worrisome risk features
Size ≥ 3 cmPancreatitis
Non-enhancing nodulesThickened, enhancing wallsDilated duct (5 to < 10 mm)
Change in duct caliber with distal atrophyLymphadenopathy
FCG: Fukuoka; SCG: Sendai Consensus Guidelines; MPD: Main pancreatic duct; MD-IPMN: Main-duct intraductal papillary mucinous neoplasm; BD-IPMN: Branch-duct intraductal papillary mucinous neoplasm.
Goh BKP. Guidelines for IPMN
s10434-014-3501-4]10 Fritz S, Klauss M, Bergmann F, Hackert T, Hartwig W, Strobel
O, Bundy BD, Büchler MW, Werner J. Small (Sendai negative) branch-duct IPMNs: not harmless. Ann Surg 2012; 256: 313-320 [PMID: 22791105 DOI: 10.1097/SLA.0b013e31825d355f]
11 Gaujoux S, Brennan MF, Gonen M, D’Angelica MI, DeMatteo R, Fong Y, Schattner M, DiMaio C, Janakos M, Jarnagin WR, Allen PJ. Cystic lesions of the pancreas: changes in the presentation and management of 1,424 patients at a single institution over a 15-year time period. J Am Coll Surg 2011; 212: 590-600; discussion 600-603 [PMID: 21463795 DOI: 10.1016/j.jamcollsurg.2011.01.016]
12 Goh BK. Current guidelines for the management of branch duct intraductal papillary mucinous neoplasms. Pancreat Disord Ther 2014; 4-1 [DOI: 10.4172/2165-7092.1000e134]
13 Compagno J, Oertel JE. Mucinous cystic neoplasms of the pancreas with overt and latent malignancy (cystadenocarcinoma and cystadenoma). A clinicopathologic study of 41 cases. Am J Clin Pathol 1978; 69: 573-580 [PMID: 665578]
14 Compagno J, Oertel JE. Microcystic adenomas of the pancreas (glycogen-rich cystadenomas): a clinicopathologic study of 34 cases. Am J Clin Pathol 1978; 69: 289-298 [PMID: 637043]
15 Goh BK, Tan YM, Cheow PC, Chung YF, Chow PK, Wong WK, Ooi LL. Cystic neoplasms of the pancreas with mucin-production. Eur J Surg Oncol 2005; 31: 282-287 [PMID: 15780564]
16 Goh BK, Tan YM, Yap WM, Cheow PC, Chow PK, Chung YF, Wong WK, Ooi LL. Pancreatic serous oligocystic adenomas: clinicopathologic features and a comparison with serous microcystic adenomas and mucinous cystic neoplasms. World J Surg 2006; 30: 1553-1559 [PMID: 16773248]
17 Balzano G, Zerbi A, Di Carlo V. Intraductal papillary mucinous tumors of the pancreas: incidence, clinical findings and natural history. JOP 2005; 6: 108-111 [PMID: 15650294]
18 Goh BK, Tan YM, Chung YF, Chow PK, Cheow PC, Wong WK, Ooi LL. A review of mucinous cystic neoplasms of the pancreas defined by ovarian-type stroma: clinicopathological features of 344 patients. World J Surg 2006; 30: 2236-2245 [PMID: 17103100]
19 Pelaez-Luna M, Chari ST, Smyrk TC, Takahashi N, Clain JE, Levy MJ, Pearson RK, Petersen BT, Topazian MD, Vege SS, Kendrick M, Farnell MB. Do consensus indications for resection in branch duct intraductal papillary mucinous neoplasm predict malignancy? A study of 147 patients. Am J Gastroenterol 2007; 102: 1759-1764 [PMID: 17686073]
20 Tanaka M, Chari S, Adsay V, Fernandez-del Castillo C, Falconi M, Shimizu M, Yamaguchi K, Yamao K, Matsuno S. International consensus guidelines for management of intraductal papillary mucinous neoplasms and mucinous cystic neoplasms of the pancreas. Pancreatology 2006; 6: 17-32 [PMID: 16327281]
21 Tanaka M, Fernández-del Castillo C, Adsay V, Chari S, Falconi M, Jang JY, Kimura W, Levy P, Pitman MB, Schmidt CM, Shimizu M, Wolfgang CL, Yamaguchi K, Yamao K; International Association of Pancreatology. International consensus guidelines 2012 for the management of IPMN and MCN of the pancreas. Pancreatology 2012; 12: 183-197 [PMID: 22687371]
22 Tang RS , Weinberg B, Dawson DW, Reber H, Hines OJ, Tomlinson JS, Chaudhari V, Raman S, Farrell JJ. Evaluation of the guidelines for management of pancreatic branch-duct intraductal papillary mucinous neoplasm. Clin Gastroenterol Hepatol 2008; 6: 815-819; quiz 719 [PMID: 18602036]
23 Goh BK, Tan DM, Ho MM, Lim TK, Chung AY, Ooi LL. Utility of the sendai consensus guidelines for branch-duct intraductal papillary mucinous neoplasms: a systematic review. J Gastrointest Surg 2014; 18: 1350-1357 [PMID: 24668367 DOI: 10.1007/s11605-014-2510-8]
24 Correa-Gallego C, Brennan MF, Fong Y, Kingham TP, DeMatteo RP, D’Angelica MI, Jarnagin WR, Allen PJ. Liberal resection for (presumed) Sendai negative branch-duct intraductal papillary mucinous neoplasms--also not harmless. Ann Surg 2014; 259: e45 [PMID: 23979281 DOI: 10.1097/SLA.0b013e3182a599b3]
25 Goh BK. Sendai Consensus Guidelines for Branch-Duct IPMN:
and even cost of investigations are not taken into account in current guidelines. The management of a patient with IPMN should be individualized and tailored according to a patient’s risk benefit profile for resection vs surveillance and guidelines are precisely just guidelines[12,25]. When considering appropriate treatment of a patient with IPMN, the risk of a patient dying from invasive cancer should be balanced against his/her risk of surgical mortality and morbidity. Today, pancreatectomy remains a surgery associated with a high morbidity[37,38] especially for right-sided lesions although the postoperative mortality rate has fallen to about 1%-3% in top international centers[38]. It is also important to highlight that IPMN should ideally be resected before they turn invasive as the outcome of invasive IPMN is poor with a 5-year overall survival of only 30%[39].
REFERENCES1 Goh BK, Tan YM, Cheow PC, Chung YF, Chow PK, Wong
WK, Ooi LL. Cystic lesions of the pancreas: an appraisal of an aggressive resectional policy adopted at a single institution during 15 years. Am J Surg 2006; 192: 148-154 [PMID: 16860621]
2 Goh BK, Tan YM, Chung YF, Chow PK, Cheow PC, Thng CH, Mesenas S, Wong WK, Ooi LL. Pancreatic cysts: a proposed management algorithm based on current evidence. Am J Surg 2007; 193: 749-755 [PMID: 17512290]
3 Ng DZ, Goh BK, Tham EH, Young SM, Ooi LL. Cystic neoplasms of the pancreas: current diagnostic modalities and management. Ann Acad Med Singapore 2009; 38: 251-259 [PMID: 19347080]
4 Brugge WR, Lauwers GY, Sahani D, Fernandez-del Castillo C, Warshaw AL. Cystic neoplasms of the pancreas. N Engl J Med 2004; 351: 1218-1226 [PMID: 15371579]
5 Allen PJ, D’Angelica M, Gonen M, Jaques DP, Coit DG, Jarnagin WR, DeMatteo R, Fong Y, Blumgart LH, Brennan MF. A selective approach to the resection of cystic lesions of the pancreas: results from 539 consecutive patients. Ann Surg 2006; 244: 572-582 [PMID: 16998366]
6 Goh BK, Thng CH, Tan DM, Low AS, Wong JS, Cheow PC, Chow PK, Chung AY, Wong WK, Ooi LL. Evaluation of the Sendai and 2012 International Consensus Guidelines based on cross-sectional imaging findings performed for the initial triage of mucinous cystic lesions of the pancreas: a single institution experience with 114 surgically treated patients. Am J Surg 2014; 208: 202-209 [PMID: 24530043 DOI: 10.1016/j.amjsurg.2013.09.031]
7 Goh BK, Tan YM, Thng CH, Cheow PC, Chung YF, Chow PK, Wong WK, Ooi LL. How useful are clinical, biochemical, and cross-sectional imaging features in predicting potentially malignant or malignant cystic lesions of the pancreas? Results from a single institution experience with 220 surgically treated patients. J Am Coll Surg 2008; 206: 17-27 [PMID: 18155564]
8 Sahora K, Mino-Kenudson M, Brugge W, Thayer SP, Ferrone CR, Sahani D, Pitman MB, Warshaw AL, Lillemoe KD, Fernandez-del Castillo CF. Branch duct intraductal papillary mucinous neoplasms: does cyst size change the tip of the scale? A critical analysis of the revised international consensus guidelines in a large single-institutional series. Ann Surg 2013; 258: 466-475 [PMID: 24022439]
9 Goh BK, Tan DM, Thng CH, Lee SY, Low AS, Chan CY, Wong JS, Lee VT, Cheow PC, Chow PK, Chung AY, Wong WK, Ooi LL. Are the Sendai and Fukuoka consensus guidelines for cystic mucinous neoplasms of the pancreas useful in the initial triage of all suspected pancreatic cystic neoplasms? A single-institution experience with 317 surgically-treated patients. Ann Surg Oncol 2014; 21: 1919-1926 [PMID: 24504924 DOI: 10.1245/
9836 September 14, 2015|Volume 21|Issue 34|WJG|www.wjgnet.com
Goh BKP. Guidelines for IPMN
Guidelines Are Just Guidelines. Ann Surg 2014; Epub ahead of print [PMID: 24441825]
26 Fernandez-del Castillo CF, Thayer SP, Ferrone CR, Wargo J. Surgery for small and asymptomatic branch-duct IPMNs. Ann Surg 2014; 259: e47 [PMID: 24096750 DOI: 10.1097/SLA.0000000000000270]
27 Goh BK, Lin Z, Tan DM, Thng CH, Khor CJ, Lim TK, Ooi LL, Chung AY. Evaluation of the Fukuoka Consensus Guidelines for intraductal papillary mucinous neoplasms of the pancreas: Results from a systematic review of 1,382 surgically resected patients. Surgery 2015; Epub ahead of print [PMID: 26032832 DOI: 10.1016/j.surg.2015.03.021]
28 Fritz S, Klauss M, Bergmann F, Strobel O, Schneider L, Werner J, Hackert T, Büchler MW. Pancreatic main-duct involvement in branch-duct IPMNs: an underestimated risk. Ann Surg 2014; 260: 848-855; discussion 855-856 [PMID: 25379856 DOI: 10.1097/SLA.0000000000000980]
29 Sawhney MS, Al-Bashir S, Cury MS, Brown A, Chuttani R, Pleskow DK, Callery MP, Vollmer CM. International consensus guidelines for surgical resection of mucinous neoplasms cannot be applied to all cystic lesions of the pancreas. Clin Gastroenterol Hepatol 2009; 7: 1373-1376 [PMID: 19577006 DOI: 10.1016/j.cgh.2009.06.026]
30 Freeny PC, Saunders MD. Moving beyond morphology: new insights into the characterization and management of cystic pancreatic lesions. Radiology 2014; 272: 345-363 [PMID: 25058133 DOI: 10.1148/radiol.14131126]
31 Jang JY, Park T, Lee S, Kang MJ, Lee SY, Lee KB, Chang YR, Kim SW. Validation of international consensus guidelines for the resection of branch duct-type intraductal papillary mucinous neoplasms. Br J Surg 2014; 101: 686-692 [PMID: 24668442 DOI: 10.1002/bjs.9491]
32 Fritz S, Hackert T, Hinz U, Hartwig W, Büchler MW, Werner J. Role of serum carbohydrate antigen 19-9 and carcinoembryonic antigen in distinguishing between benign and invasive intraductal papillary mucinous neoplasm of the pancreas. Br J Surg 2011; 98:
104-110 [PMID: 20949535 DOI: 10.1002/bjs.7280]33 Pedrazzoli S, Sperti C, Pasquali C, Bissoli S, Chierichetti F.
Comparison of International Consensus Guidelines versus 18-FDG PET in detecting malignancy of intraductal papillary mucinous neoplasms of the pancreas. Ann Surg 2011; 254: 971-976 [PMID: 22076067 DOI: 10.1097/SLA.0b013e3182383137]
34 Park WG, Wu M, Bowen R, Zheng M, Fitch WL, Pai RK, Wodziak D, Visser BC, Poultsides GA, Norton JA, Banerjee S, Chen AM, Friedland S, Scott BA, Pasricha PJ, Lowe AW, Peltz G. Metabolomic-derived novel cyst fluid biomarkers for pancreatic cysts: glucose and kynurenine. Gastrointest Endosc 2013; 78: 295-302.e2 [PMID: 23566642 DOI: 10.1016/j.gie.2013.02.037]
35 Khalid A, Zahid M, Finkelstein SD, LeBlanc JK, Kaushik N, Ahmad N, Brugge WR, Edmundowicz SA, Hawes RH, McGrath KM. Pancreatic cyst fluid DNA analysis in evaluating pancreatic cysts: a report of the PANDA study. Gastrointest Endosc 2009; 69: 1095-1102 [PMID: 19152896 DOI: 10.1016/j.gie.2008.07.033]
36 Koh YX, Zheng HL, Chok AY, Tan CS, Wyone W, Lim TK, Tan DM, Goh BK. Systematic review and meta-analysis of the spectrum and outcomes of different histologic subtypes of noninvasive and invasive intraductal papillary mucinous neoplasms. Surgery 2015; 157: 496-509 [PMID: 25656693 DOI: 10.1016/j.surg.2014.08.098]
37 Goh BK, Tan YM, Chung YF, Cheow PC, Ong HS, Chan WH, Chow PK, Soo KC, Wong WK, Ooi LL. Critical appraisal of 232 consecutive distal pancreatectomies with emphasis on risk factors, outcome, and management of the postoperative pancreatic fistula: a 21-year experience at a single institution. Arch Surg 2008; 143: 956-965 [PMID: 18936374 DOI: 10.1001/archsurg.143.10.956]
38 Cameron JL, Riall TS, Coleman J, Belcher KA. One thousand consecutive pancreaticoduodenectomies. Ann Surg 2006; 244: 10-15 [PMID: 16794383]
39 Koh YX, Chok AY, Zheng HL, Tan CS, Goh BK. Systematic review and meta-analysis comparing the surgical outcomes of invasive intraductal papillary mucinous neoplasms and conventional pancreatic ductal adenocarcinoma. Ann Surg Oncol 2014; 21: 2782-2800 [PMID: 24687151 DOI: 10.1245/s10434-014-3639-0]
P- Reviewer: Harada R S- Editor: Wang JL L- Editor: A E- Editor: Ma S
9837 September 14, 2015|Volume 21|Issue 34|WJG|www.wjgnet.com
Goh BKP. Guidelines for IPMN
Recent advances in the molecular diagnostics of gastric cancer
Mitsuro Kanda, Yasuhiro Kodera
Mitsuro Kanda, Yasuhiro Kodera, Department of Gastroenterological Surgery (Surgery II), Nagoya University Graduate School of Medicine, Nagoya 4668550, Japan
Author contributions: Kanda M wrote the manuscript; and Kodera Y revised the manuscript for important intellectual content.
Conflict-of-interest statement: the authors have no conflict of interest related to the manuscript.
Open-Access: this article is an openaccess article which was selected by an inhouse editor and fully peerreviewed by external reviewers. It is distributed in accordance with the Creative Commons Attribution Non Commercial (CC BYNC 4.0) license, which permits others to distribute, remix, adapt, build upon this work noncommercially, and license their derivative works on different terms, provided the original work is properly cited and the use is noncommercial. See: http://creativecommons.org/licenses/bync/4.0/
Correspondence to: Mitsuro Kanda, MD, PhD, Department of Gastroenterological Surgery (Surgery II), Nagoya University Graduate School of Medicine, 65 tsurumaicho, Showaku, Nagoya 4668550, Japan. m[email protected]u.ac.jpTelephone: +81527442249 Fax: +81527442255
Received: April 5, 2015 Peer-review started: April 7, 2015First decision: June 2, 2015Revised: June 15, 2015 Accepted: August 25, 2015Article in press: August 25, 2015Published online: September 14, 2015
AbstractGastric cancer (GC) is the third most common cause of cancer-related death in the world, representing a major global health issue. Although the incidence of
TOPIC HIGHLIGHT
Submit a Manuscript: http://www.wjgnet.com/esps/Help Desk: http://www.wjgnet.com/esps/helpdesk.aspxDOI: 10.3748/wjg.v21.i34.9838
World J Gastroenterol 2015 September 14; 21(34): 9838-9852 ISSN 1007-9327 (print) ISSN 2219-2840 (online)
© 2015 Baishideng Publishing Group Inc. All rights reserved.
9838 September 14, 2015|Volume 21|Issue 34|WJG|www.wjgnet.com
2015 Advances in Gastric Cancer
GC is declining, the outcomes for GC patients remain dismal because of the lack of effective biomarkers to detect early GC and predict both recurrence and chemosensitivity. Current tumor markers for GC, including serum carcinoembryonic antigen and carbohydrate antigen 19-9, are not ideal due to their relatively low sensitivity and specificity. Recent improvements in molecular techniques are better able to identify aberrant expression of GC-related molecules, including oncogenes, tumor suppressor genes, microRNAs and long non-coding RNAs, and DNA methylation, as novel molecular markers, although the molecular pathogenesis of GC is complicated by tumor heterogeneity. Detection of genetic and epigenetic alterations from gastric tissue or blood samples has diagnostic value in the management of GC. There are high expectations for molecular markers that can be used as new screening tools for early detection of GC as well as for patient stratification towards personalized treatment of GC through prediction of prognosis and drug-sensitivity. In this review, the studies of potential molecular biomarkers for GC that have been reported in the publicly available literature between 2012 and 2015 are reviewed and summarized, and certain highlighted papers are examined.
Key words: Gastric cancer; Biomarker; Prognosis; MicroRNA; DNA methylation; Long non-coding RNA
© The Author(s) 2015. Published by Baishideng Publishing Group Inc. All rights reserved.
Core tip: Gastric cancer (GC), although declining in incidence in recent decades, is still the fourth most common malignancy and the third leading cause of cancer-related death worldwide. Although reliable biomarkers are necessary to improve the management of GC, conventional tumor markers have insufficient diagnostic performance. Detection of molecular markers in gastric tissue and blood samples may enhance the
The aim of this review is to provide up-to-date information regarding molecular biomarkers for early detection and risk stratification for patients with GC. A prognostic cancer biomarker provides information on the likely course of the disease. In contrast, a predictive biomarker is defined as a marker that can be used to identify subpopulations of patients most likely to respond to a targeted therapy[8,16]. The search for cancer biomarkers is carried out in order to identify tumor cells at early stages and predict treatment response, ultimately leading to a favorable therapeutic outcome[8,17]. The studies of potential molecular biomarkers for GC that have been reported in the publicly available literature between 2012 and 2015 are reviewed, summarized and categorized by based on their suggested clinical implication; early detection, monitoring recurrences, prediction of survival and prediction of treatment response.
UPDATE ON GENES OVEREXPRESSED IN GCTo date, numerous GC-related oncogenes have been reported. Oncogenes are frequently overexpressed in GC and promote cancer cell growth and cell cycle progression[7,18]. They also inhibit apoptosis by silencing growth-inhibition associated genes[19]. Particularly, when the target molecules are minimally expressed in normal gastric mucosa or blood samples from healthy controls, detection of aberrantly activated oncogenes can be of great diagnostic value. Recently reported genes that are overexpressed in GC are listed in Table 1[20-44], and we review certain highlighted studies.
Bone morphogenetic protein 4Bone morphogenetic protein 4 (BMP4) encodes a secreted protein belonging to the TGFb superfamily. BMP4 binds to BMP type Ⅰ/Ⅱ receptors, resulting in activation of a signaling cascade that culminates in phosphorylation of SMAD1/5/8 and the regulation of gene expression[45]. Ivanova et al[24] conducted an integrated epigenomics study to identify genes associated with cisplatin resistance in GC and found that BMP4 was an epigenetically regulated gene that is highly expressed in cisplatin-resistant GC cell lines. BMP4 promoter methylation levels were inversely correlated with BMP4 expression, and patients with high BMP4-expressing GC showed significantly worse prognosis. Inhibition of BMP4 resulted in significant sensitization of GC cells to cisplatin, and BMP4-expressing GC cells did not exhibit cross-resistance to oxaliplatin[24]. These results indicated that BMP4 epigenetic and expression status may represent a promising biomarker for cisplatin resistance in GC.
Dihydropyrimidinase-like 3Dihydropyrimidinase-like 3 (DPYSL3) has been described as a cell-adhesion molecule; it is actively expressed in
Kanda M et al . Molecular diagnostics of GC
9839 September 14, 2015|Volume 21|Issue 34|WJG|www.wjgnet.com
sensitivity and specificity of diagnostic and prognostic tests for early stage GC and provide a means to monitor recurrence and predict response to treatment. In this review, we introduce recently reported candidates for GC-related biomarkers and overview important findings.
Kanda M, Kodera Y. Recent advances in the molecular diagnostics of gastric cancer. World J Gastroenterol 2015; 21(34): 98389852 Available from: URL: http://www.wjgnet.com/10079327/full/v21/i34/9838.htm DOI: http://dx.doi.org/10.3748/wjg.v21.i34.9838
INTRODUCTIONGastric cancer (GC), the third leading cause of global cancer death, is a malignant disease with a high mortality rate despite declining incidence in the recent decade[1,2]. Multimodal treatment strategies including surgery, chemotherapy and radiotherapy can improve local and regional tumor control and decrease the rate of systemic metastasis[3,4]. However, the overall prognosis for advanced disease remains poor. The high mortality rate attributed to GC is mainly due to the lack of both early detection methods and effective medical treatment for advanced stages of the disease[1,5]. Early diagnosis is beneficial and critical for successful surgical removal of GCs because peritoneal dissemination and local/distal metastases often occur in the late stages of GC and greatly reduce the efficacy of surgical intervention[6,7].
Carcinoembryonic antigen, carbohydrate antigen (CA) 19-9 and CA72-4 are the most commonly used biomarkers for GC[8]. Although widely used, they are not ideal markers because of their relatively low sensitivity and specificity in the diagnosis and prognosis of GC[9,10]. Therefore, identification of more specific and sensitive novel markers for GC is urgently required to establish screening strategies and further stratify patients for individualized therapies[3,11]. Modern biomedical research has explored many potential GC biomarker genes by examining serum protein antigens, oncogenic genes or gene families through improved molecular biological technologies, such as microarray and next-generation sequencing analyses[12]. However, there remains room for improvement of molecular-based diagnosis methods in terms of sensitivity, specificity and accessibility; therefore, they have not been utilized in clinical practice.
Recently, it was demonstrated that microRNA (miRNA) and long non-coding RNA (lncRNA) can be effective candidates for molecular diagnostics in GC in addition to altered expression of oncogenes and tumor suppressor genes (TSGs)[8,13,14]. The search for non-invasive tools for diagnosis has led to the investigation of proteins and circulating nucleic acids, including miRNAs and lncRNAs, in plasma and serum samples[15].
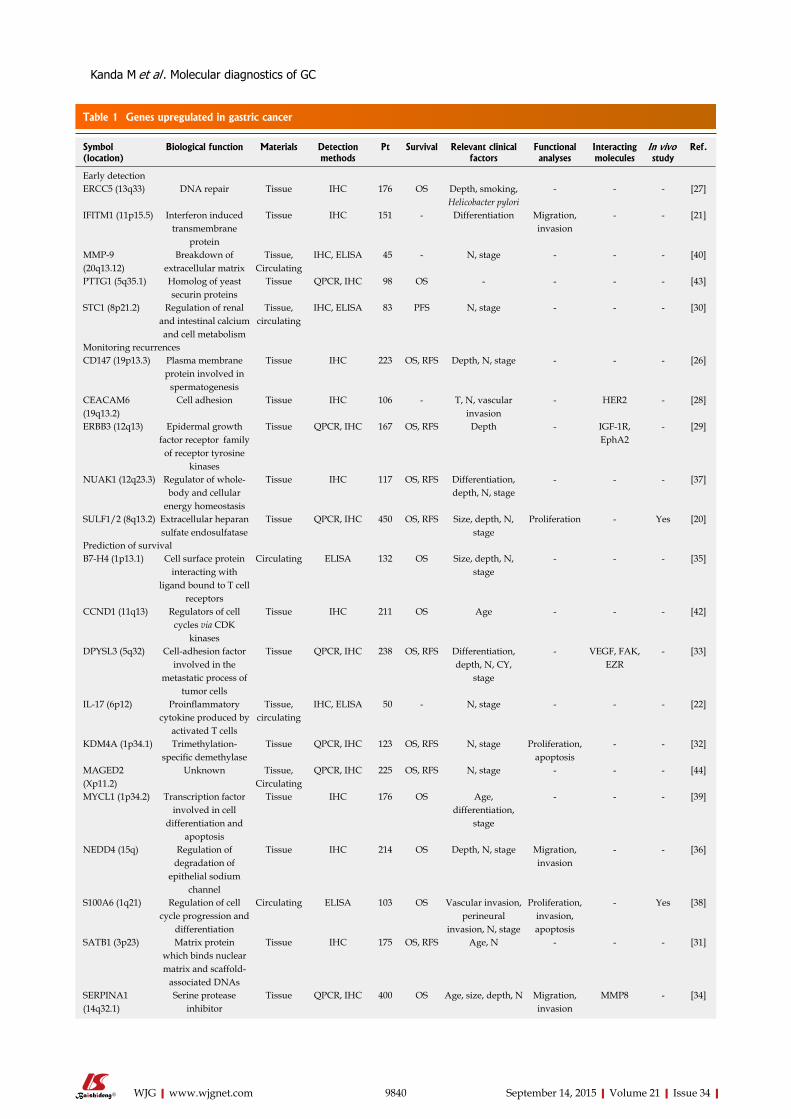
9840 September 14, 2015|Volume 21|Issue 34|WJG|www.wjgnet.com
Table 1 Genes upregulated in gastric cancer
Symbol (location)
Biological function Materials Detection methods
Pt Survival Relevant clinical factors
Functional analyses
Interacting molecules
In vivo study
Ref.
Early detectionERCC5 (13q33) DNA repair Tissue IHC 176 OS Depth, smoking,
Helicobacter pylori- - - [27]
IFITM1 (11p15.5) Interferon induced transmembrane
protein
Tissue IHC 151 - Differentiation Migration, invasion
- - [21]
MMP-9 (20q13.12)
Breakdown of extracellular matrix
Tissue, Circulating
IHC, ELISA 45 - N, stage - - - [40]
PTTG1 (5q35.1) Homolog of yeast securin proteins
Tissue QPCR, IHC 98 OS - - - - [43]
STC1 (8p21.2) Regulation of renal and intestinal calcium and cell metabolism
Tissue, circulating
IHC, ELISA 83 PFS N, stage - - - [30]
Monitoring recurrencesCD147 (19p13.3) Plasma membrane
protein involved in spermatogenesis
Tissue IHC 223 OS, RFS Depth, N, stage - - - [26]
CEACAM6 (19q13.2)
Cell adhesion Tissue IHC 106 - T, N, vascular invasion
- HER2 - [28]
ERBB3 (12q13) Epidermal growth factor receptor family
of receptor tyrosine kinases
Tissue QPCR, IHC 167 OS, RFS Depth - IGF-1R, EphA2
- [29]
NUAK1 (12q23.3) Regulator of whole-body and cellular
energy homeostasis
Tissue IHC 117 OS, RFS Differentiation, depth, N, stage
- - - [37]
SULF1/2 (8q13.2) Extracellular heparan sulfate endosulfatase
Tissue QPCR, IHC 450 OS, RFS Size, depth, N, stage
Proliferation - Yes [20]
Prediction of survivalB7-H4 (1p13.1) Cell surface protein
interacting with ligand bound to T cell
receptors
Circulating ELISA 132 OS Size, depth, N, stage
- - - [35]
CCND1 (11q13) Regulators of cell cycles via CDK
kinases
Tissue IHC 211 OS Age - - - [42]
DPYSL3 (5q32) Cell-adhesion factor involved in the
metastatic process of tumor cells
Tissue QPCR, IHC 238 OS, RFS Differentiation, depth, N, CY,
stage
- VEGF, FAK, EZR
- [33]
IL-17 (6p12) Proinflammatory cytokine produced by
activated T cells
Tissue, circulating
IHC, ELISA 50 - N, stage - - - [22]
KDM4A (1p34.1) Trimethylation-specific demethylase
Tissue QPCR, IHC 123 OS, RFS N, stage Proliferation, apoptosis
- - [32]
MAGED2 (Xp11.2)
Unknown Tissue, Circulating
QPCR, IHC 225 OS, RFS N, stage - - - [44]
MYCL1 (1p34.2) Transcription factor involved in cell
differentiation and apoptosis
Tissue IHC 176 OS Age, differentiation,
stage
- - - [39]
NEDD4 (15q) Regulation of degradation of
epithelial sodium channel
Tissue IHC 214 OS Depth, N, stage Migration, invasion
- - [36]
S100A6 (1q21) Regulation of cell cycle progression and
differentiation
Circulating ELISA 103 OS Vascular invasion, perineural
invasion, N, stage
Proliferation, invasion, apoptosis
- Yes [38]
SATB1 (3p23) Matrix protein which binds nuclear matrix and scaffold-
associated DNAs
Tissue IHC 175 OS, RFS Age, N - - - [31]
SERPINA1 (14q32.1)
Serine protease inhibitor
Tissue QPCR, IHC 400 OS Age, size, depth, N Migration, invasion
MMP8 - [34]
Kanda M et al . Molecular diagnostics of GC
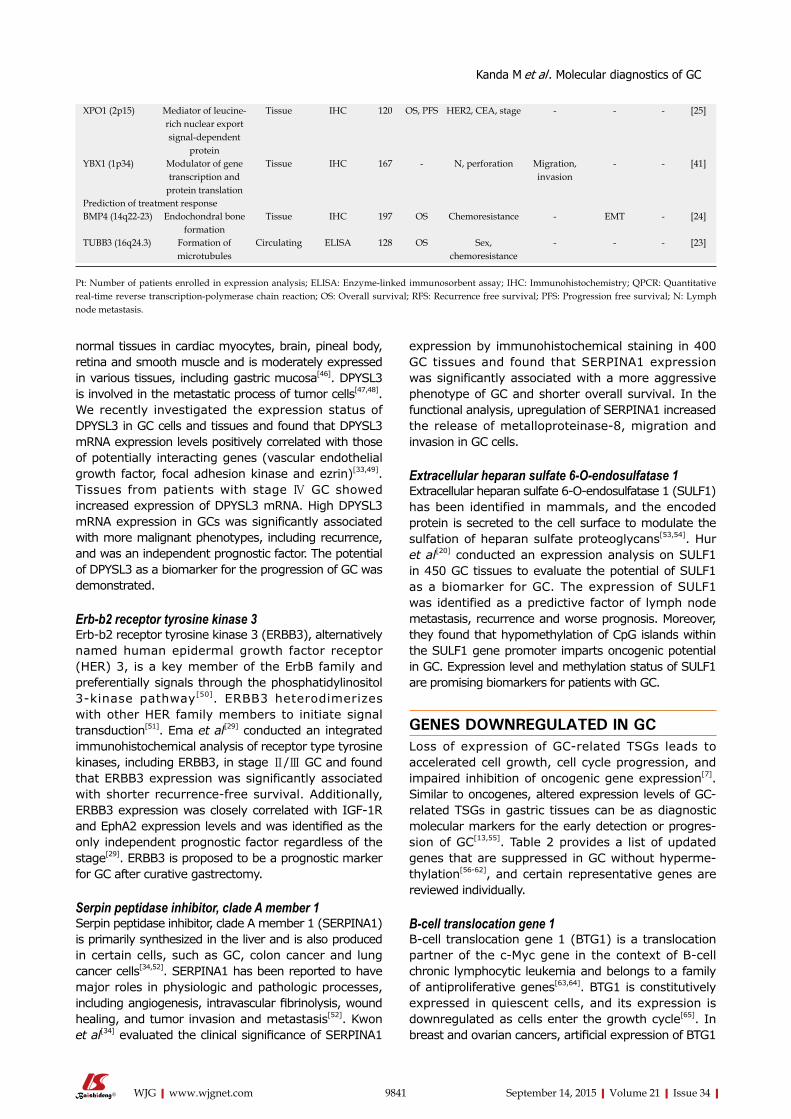
expression by immunohistochemical staining in 400 GC tissues and found that SERPINA1 expression was significantly associated with a more aggressive phenotype of GC and shorter overall survival. In the functional analysis, upregulation of SERPINA1 increased the release of metalloproteinase-8, migration and invasion in GC cells.
Extracellular heparan sulfate 6-O-endosulfatase 1Extracellular heparan sulfate 6-O-endosulfatase 1 (SULF1) has been identified in mammals, and the encoded protein is secreted to the cell surface to modulate the sulfation of heparan sulfate proteoglycans[53,54]. Hur et al[20] conducted an expression analysis on SULF1 in 450 GC tissues to evaluate the potential of SULF1 as a biomarker for GC. The expression of SULF1 was identified as a predictive factor of lymph node metastasis, recurrence and worse prognosis. Moreover, they found that hypomethylation of CpG islands within the SULF1 gene promoter imparts oncogenic potential in GC. Expression level and methylation status of SULF1 are promising biomarkers for patients with GC.
GENES DOWNREGULATED IN GCLoss of expression of GC-related TSGs leads to accelerated cell growth, cell cycle progression, and impaired inhibition of oncogenic gene expression[7]. Similar to oncogenes, altered expression levels of GC-related TSGs in gastric tissues can be as diagnostic molecular markers for the early detection or progres-sion of GC[13,55]. Table 2 provides a list of updated genes that are suppressed in GC without hyperme-thylation[56-62], and certain representative genes are reviewed individually.
B-cell translocation gene 1B-cell translocation gene 1 (BTG1) is a translocation partner of the c-Myc gene in the context of B-cell chronic lymphocytic leukemia and belongs to a family of antiproliferative genes[63,64]. BTG1 is constitutively expressed in quiescent cells, and its expression is downregulated as cells enter the growth cycle[65]. In breast and ovarian cancers, artificial expression of BTG1
normal tissues in cardiac myocytes, brain, pineal body, retina and smooth muscle and is moderately expressed in various tissues, including gastric mucosa[46]. DPYSL3 is involved in the metastatic process of tumor cells[47,48]. We recently investigated the expression status of DPYSL3 in GC cells and tissues and found that DPYSL3 mRNA expression levels positively correlated with those of potentially interacting genes (vascular endothelial growth factor, focal adhesion kinase and ezrin)[33,49]. Tissues from patients with stage Ⅳ GC showed increased expression of DPYSL3 mRNA. High DPYSL3 mRNA expression in GCs was significantly associated with more malignant phenotypes, including recurrence, and was an independent prognostic factor. The potential of DPYSL3 as a biomarker for the progression of GC was demonstrated.
Erb-b2 receptor tyrosine kinase 3Erb-b2 receptor tyrosine kinase 3 (ERBB3), alternatively named human epidermal growth factor receptor (HER) 3, is a key member of the ErbB family and preferentially signals through the phosphatidylinositol 3-kinase pathway[50]. ERBB3 heterodimerizes with other HER family members to initiate signal transduction[51]. Ema et al[29] conducted an integrated immunohistochemical analysis of receptor type tyrosine kinases, including ERBB3, in stage Ⅱ/Ⅲ GC and found that ERBB3 expression was significantly associated with shorter recurrence-free survival. Additionally, ERBB3 expression was closely correlated with IGF-1R and EphA2 expression levels and was identified as the only independent prognostic factor regardless of the stage[29]. ERBB3 is proposed to be a prognostic marker for GC after curative gastrectomy.
Serpin peptidase inhibitor, clade A member 1Serpin peptidase inhibitor, clade A member 1 (SERPINA1) is primarily synthesized in the liver and is also produced in certain cells, such as GC, colon cancer and lung cancer cells[34,52]. SERPINA1 has been reported to have major roles in physiologic and pathologic processes, including angiogenesis, intravascular fibrinolysis, wound healing, and tumor invasion and metastasis[52]. Kwon et al[34] evaluated the clinical significance of SERPINA1
9841 September 14, 2015|Volume 21|Issue 34|WJG|www.wjgnet.com
XPO1 (2p15) Mediator of leucine-rich nuclear export signal-dependent
protein
Tissue IHC 120 OS, PFS HER2, CEA, stage - - - [25]
YBX1 (1p34) Modulator of gene transcription and
protein translation
Tissue IHC 167 - N, perforation Migration, invasion
- - [41]
Prediction of treatment responseBMP4 (14q22-23) Endochondral bone
formationTissue IHC 197 OS Chemoresistance - EMT - [24]
TUBB3 (16q24.3) Formation of microtubules
Circulating ELISA 128 OS Sex, chemoresistance
- - - [23]
Pt: Number of patients enrolled in expression analysis; ELISA: Enzyme-linked immunosorbent assay; IHC: Immunohistochemistry; QPCR: Quantitative real-time reverse transcription-polymerase chain reaction; OS: Overall survival; RFS: Recurrence free survival; PFS: Progression free survival; N: Lymph node metastasis.
Kanda M et al . Molecular diagnostics of GC
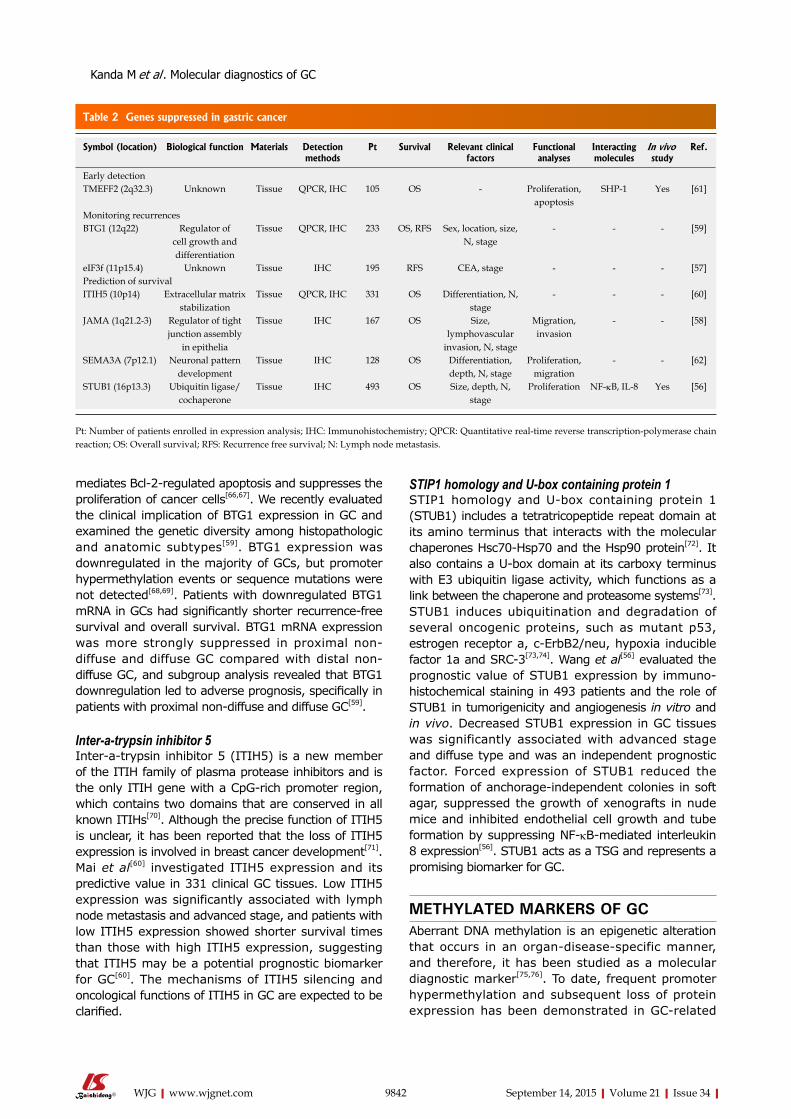
mediates Bcl-2-regulated apoptosis and suppresses the proliferation of cancer cells[66,67]. We recently evaluated the clinical implication of BTG1 expression in GC and examined the genetic diversity among histopathologic and anatomic subtypes[59]. BTG1 expression was downregulated in the majority of GCs, but promoter hypermethylation events or sequence mutations were not detected[68,69]. Patients with downregulated BTG1 mRNA in GCs had significantly shorter recurrence-free survival and overall survival. BTG1 mRNA expression was more strongly suppressed in proximal non-diffuse and diffuse GC compared with distal non-diffuse GC, and subgroup analysis revealed that BTG1 downregulation led to adverse prognosis, specifically in patients with proximal non-diffuse and diffuse GC[59].
Inter-a-trypsin inhibitor 5Inter-a-trypsin inhibitor 5 (ITIH5) is a new member of the ITIH family of plasma protease inhibitors and is the only ITIH gene with a CpG-rich promoter region, which contains two domains that are conserved in all known ITIHs[70]. Although the precise function of ITIH5 is unclear, it has been reported that the loss of ITIH5 expression is involved in breast cancer development[71]. Mai et al[60] investigated ITIH5 expression and its predictive value in 331 clinical GC tissues. Low ITIH5 expression was significantly associated with lymph node metastasis and advanced stage, and patients with low ITIH5 expression showed shorter survival times than those with high ITIH5 expression, suggesting that ITIH5 may be a potential prognostic biomarker for GC[60]. The mechanisms of ITIH5 silencing and oncological functions of ITIH5 in GC are expected to be clarified.
STIP1 homology and U-box containing protein 1STIP1 homology and U-box containing protein 1 (STUB1) includes a tetratricopeptide repeat domain at its amino terminus that interacts with the molecular chaperones Hsc70-Hsp70 and the Hsp90 protein[72]. It also contains a U-box domain at its carboxy terminus with E3 ubiquitin ligase activity, which functions as a link between the chaperone and proteasome systems[73]. STUB1 induces ubiquitination and degradation of several oncogenic proteins, such as mutant p53, estrogen receptor a, c-ErbB2/neu, hypoxia inducible factor 1a and SRC-3[73,74]. Wang et al[56] evaluated the prognostic value of STUB1 expression by immuno-histochemical staining in 493 patients and the role of STUB1 in tumorigenicity and angiogenesis in vitro and in vivo. Decreased STUB1 expression in GC tissues was significantly associated with advanced stage and diffuse type and was an independent prognostic factor. Forced expression of STUB1 reduced the formation of anchorage-independent colonies in soft agar, suppressed the growth of xenografts in nude mice and inhibited endothelial cell growth and tube formation by suppressing NF-kB-mediated interleukin 8 expression[56]. STUB1 acts as a TSG and represents a promising biomarker for GC.
METHYLATED MARKERS OF GCAberrant DNA methylation is an epigenetic alteration that occurs in an organ-disease-specific manner, and therefore, it has been studied as a molecular diagnostic marker[75,76]. To date, frequent promoter hypermethylation and subsequent loss of protein expression has been demonstrated in GC-related
9842 September 14, 2015|Volume 21|Issue 34|WJG|www.wjgnet.com
Table 2 Genes suppressed in gastric cancer
Symbol (location) Biological function Materials Detection methods
Pt Survival Relevant clinical factors
Functional analyses
Interacting molecules
In vivo study
Ref.
Early detectionTMEFF2 (2q32.3) Unknown Tissue QPCR, IHC 105 OS - Proliferation,
apoptosisSHP-1 Yes [61]
Monitoring recurrencesBTG1 (12q22) Regulator of
cell growth and differentiation
Tissue QPCR, IHC 233 OS, RFS Sex, location, size, N, stage
- - - [59]
eIF3f (11p15.4) Unknown Tissue IHC 195 RFS CEA, stage - - - [57]Prediction of survivalITIH5 (10p14) Extracellular matrix
stabilizationTissue QPCR, IHC 331 OS Differentiation, N,
stage- - - [60]
JAMA (1q21.2-3) Regulator of tight junction assembly
in epithelia
Tissue IHC 167 OS Size, lymphovascular
invasion, N, stage
Migration, invasion
- - [58]
SEMA3A (7p12.1) Neuronal pattern development
Tissue IHC 128 OS Differentiation, depth, N, stage
Proliferation, migration
- - [62]
STUB1 (16p13.3) Ubiquitin ligase/cochaperone
Tissue IHC 493 OS Size, depth, N, stage
Proliferation NF-kB, IL-8 Yes [56]
Pt: Number of patients enrolled in expression analysis; IHC: Immunohistochemistry; QPCR: Quantitative real-time reverse transcription-polymerase chain reaction; OS: Overall survival; RFS: Recurrence free survival; N: Lymph node metastasis.
Kanda M et al . Molecular diagnostics of GC
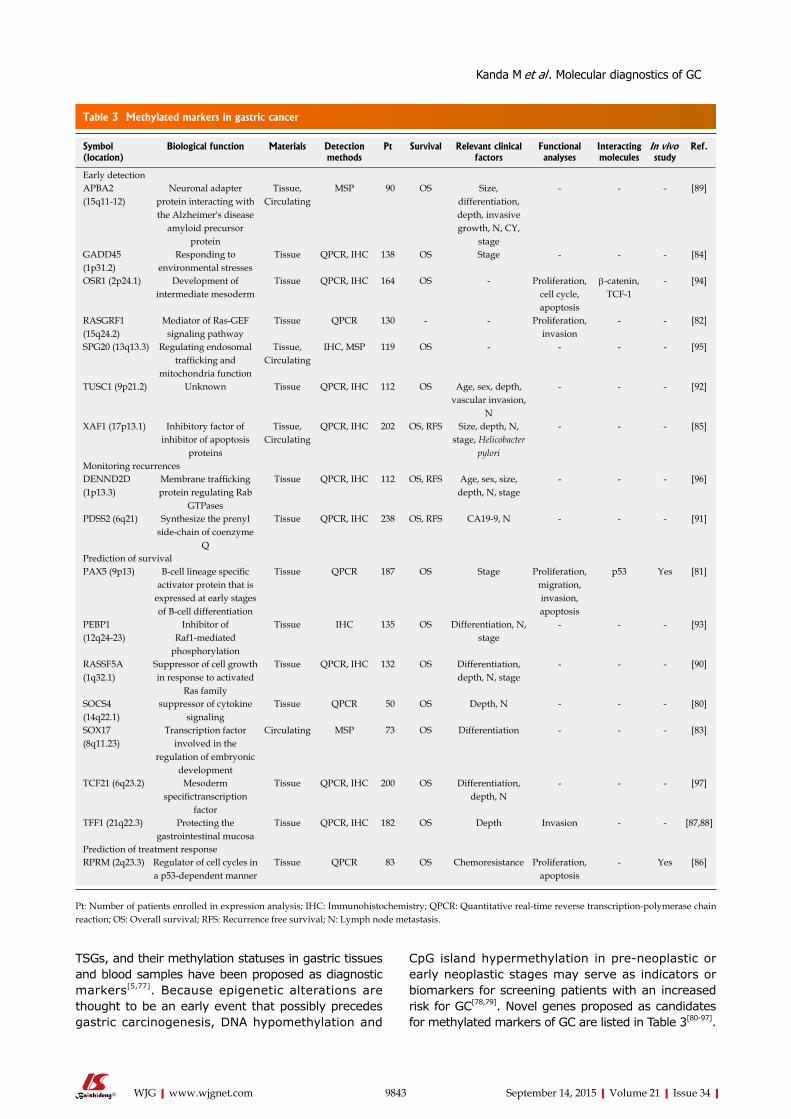
TSGs, and their methylation statuses in gastric tissues and blood samples have been proposed as diagnostic markers[5,77]. Because epigenetic alterations are thought to be an early event that possibly precedes gastric carcinogenesis, DNA hypomethylation and
CpG island hypermethylation in pre-neoplastic or early neoplastic stages may serve as indicators or biomarkers for screening patients with an increased risk for GC[78,79]. Novel genes proposed as candidates for methylated markers of GC are listed in Table 3[80-97].
9843 September 14, 2015|Volume 21|Issue 34|WJG|www.wjgnet.com
Table 3 Methylated markers in gastric cancer
Symbol (location)
Biological function Materials Detection methods
Pt Survival Relevant clinical factors
Functional analyses
Interacting molecules
In vivo study
Ref.
Early detectionAPBA2 (15q11-12)
Neuronal adapter protein interacting with the Alzheimer's disease
amyloid precursor protein
Tissue, Circulating
MSP 90 OS Size, differentiation, depth, invasive growth, N, CY,
stage
- - - [89]
GADD45 (1p31.2)
Responding to environmental stresses
Tissue QPCR, IHC 138 OS Stage - - - [84]
OSR1 (2p24.1) Development of intermediate mesoderm
Tissue QPCR, IHC 164 OS - Proliferation, cell cycle, apoptosis
β-catenin, TCF-1
- [94]
RASGRF1 (15q24.2)
Mediator of Ras-GEF signaling pathway
Tissue QPCR 130 - - Proliferation, invasion
- - [82]
SPG20 (13q13.3) Regulating endosomal trafficking and
mitochondria function
Tissue, Circulating
IHC, MSP 119 OS - - - - [95]
TUSC1 (9p21.2) Unknown Tissue QPCR, IHC 112 OS Age, sex, depth, vascular invasion,
N
- - - [92]
XAF1 (17p13.1) Inhibitory factor of inhibitor of apoptosis
proteins
Tissue, Circulating
QPCR, IHC 202 OS, RFS Size, depth, N, stage, Helicobacter
pylori
- - - [85]
Monitoring recurrencesDENND2D (1p13.3)
Membrane trafficking protein regulating Rab
GTPases
Tissue QPCR, IHC 112 OS, RFS Age, sex, size, depth, N, stage
- - - [96]
PDSS2 (6q21) Synthesize the prenyl side-chain of coenzyme
Q
Tissue QPCR, IHC 238 OS, RFS CA19-9, N - - - [91]
Prediction of survivalPAX5 (9p13) B-cell lineage specific
activator protein that is expressed at early stages of B-cell differentiation
Tissue QPCR 187 OS Stage Proliferation, migration, invasion, apoptosis
p53 Yes [81]
PEBP1 (12q24-23)
Inhibitor of Raf1-mediated
phosphorylation
Tissue IHC 135 OS Differentiation, N, stage
- - - [93]
RASSF5A (1q32.1)
Suppressor of cell growth in response to activated
Ras family
Tissue QPCR, IHC 132 OS Differentiation, depth, N, stage
- - - [90]
SOCS4 (14q22.1)
suppressor of cytokine signaling
Tissue QPCR 50 OS Depth, N - - - [80]
SOX17 (8q11.23)
Transcription factor involved in the
regulation of embryonic development
Circulating MSP 73 OS Differentiation - - - [83]
TCF21 (6q23.2) Mesoderm specifictranscription
factor
Tissue QPCR, IHC 200 OS Differentiation, depth, N
- - - [97]
TFF1 (21q22.3) Protecting the gastrointestinal mucosa
Tissue QPCR, IHC 182 OS Depth Invasion - - [87,88]
Prediction of treatment responseRPRM (2q23.3) Regulator of cell cycles in
a p53-dependent mannerTissue QPCR 83 OS Chemoresistance Proliferation,
apoptosis- Yes [86]
Pt: Number of patients enrolled in expression analysis; IHC: Immunohistochemistry; QPCR: Quantitative real-time reverse transcription-polymerase chain reaction; OS: Overall survival; RFS: Recurrence free survival; N: Lymph node metastasis.
Kanda M et al . Molecular diagnostics of GC
Amyloid beta precursor protein-binding, family A, member 2Amyloid beta precursor protein-binding, family A, member 2 (APBA2) is a multimodular adapter protein encoded by a member of the X11 protein family and functions in membrane transport and organization[98]. Furthermore, APBA2 has been reported to be involved in signal transduction processes and is also regarded as a putative vesicular trafficking protein in the brain that can form a complex with the potential to couple synaptic vesicle exocytosis to neuronal cell adhesion[89]. Han et al[89] performed quantitative methylation-specific PCR analysis to detect APBA2 methylation using gastric tissues, peritoneal lavage fluids and blood samples. Notably, methylation of APBA2 was found in approximately 40% of peritoneal lavage fluids and blood samples from patients with GC, but not in healthy controls. In addition, positive methylation in peritoneal lavage fluids and blood samples was associated with peritoneal dissemination, advanced tumor and poor prognosis[89]. Methylation status of APBA2 can be a good biomarker that is applicable in multiple types of samples.
DENN/MADD domain-containing 2DDENN/MADD domain-containing 2D (DENND2D) regulates Rab GTPases and represents a newly recognized class of membrane trafficking proteins[99]. DENND2D interacts directly with Rab35 and functions as a guanine nucleotide exchange factor for this GTPase[100]. We evaluated the expression level and methylation status of DENND2D in 112 pairs of gastric tissues and found that GC tissues showed a significantly lower mean mRNA expression level and a higher frequency of promoter hypermethylation of DENND2D than corresponding noncancerous tissues[96]. These findings were independent of tumor differentiation, location, and morphology. Downregulation of DENND2D mRNA in GC tissues was significantly associated with factors related to more advanced GC, recurrence and a subsequent poor prognosis[96]. Expression level and methylation status of DENND2D can serve as novel tumor biomarkers that predict progression and early recurrence of all types of GC.
Paired box gene 5Paired box gene 5 (PAX5) was recently characterized as the key nuclear protein in the paired box-containing family of transcription factors that are involved in control of organ development and tissue differentiation[101]. PAX5 also plays a role in the early stages of B-cell differentiation, as well as neural development and spermatogenesis[102]. Li et al[81] investigated the expression, methylation and function of PAX5 in GC cells and tissues. PAX5 was frequently downregulated in GC concomitant with promoter hypermethylation. Artificial forced expression of PAX5 inhibited proliferation, migration and invasion of GC
cells, arrested the cell cycle, induced apoptosis, and repressed tumorigenicity in mouse xenografts. The antitumorigenic function of PAX5 was shown to be mediated by upregulating downstream targets of p53, p21, and metastasis suppressor 1 and downregulating BCL2, cyclin D1 and mesenchymal–epithelial transition factor. Hypermethylation of PAX5 was detected in approximately 80% of GC tissues and identified as an independent prognostic factor[81]. PAX5 serves as a TSG, and its methylation status would be a prognostic marker for GC.
ReprimoReprimo (RPRM) is a highly glycosylated protein localized predominantly in the cytoplasm, and it has been reported to be a mediator of the cell cycle[103]. Forced expression of RPRM induces G2 arrest of the cell cycle by inhibiting Cdc2 activity and nuclear translocation of the Cdc2–cyclin B1 complex in various cell lines[104]. Ooki et al[86] evaluated the epigenetic inactivation of RPRM and its biologic function as well as its clinical relevance in GC. Frequent promoter hypermethylation was specifically detected in GCs. Forced RPRM expression inhibited proliferation, anchorage-independent colony formation of GC cells and enhanced DNA damage-induced apoptosis. Furthermore, the tumor inhibitory effect of RPRM was proven in an in vivo study. Methylation of RPRM was significantly associated with a poor response to chemotherapy and poor patient prognosis[86]. RPRM is a novel putative TSG, and promoter methylation of RPRM may serve as a predictive marker for chemotherapy and the malignant behavior of GC.
DIAGNOSTIC POTENTIAL OF miRNAS IN GCExtensive studies in the past decade have indicated the existence and importance of an additional epigenetic mechanism for regulation of gene function by means of small non-coding miRNAs[105]. Currently, miRNAs are recognized as one of the major regulatory gatekeepers of protein-coding genes in the human genome[106]. Mature miRNAs measuring 20 to 23 nucleotides in length are incorporated into miRNA-induced silencing complexes[107]. These complexes then bind to imperfect complementary sequences in the 3’-untranslated region of target mRNAs and negatively regulate gene expression through either mRNA degradation or translational inhibition[108]. MiRNAs can be released from cancer cells into body fluids via secreting exosome particles, which could protect them from RNase degradation in the circulation[108]. With the surprising stability of miRNAs in tissues, serum or other body fluids, miRNAs have emerged as a new type of cancer biomarker with immeasurable clinical potential[12]. Here, we introduce newly identified miRNAs that potentially represent biomarkers for GC
9844 September 14, 2015|Volume 21|Issue 34|WJG|www.wjgnet.com
Kanda M et al . Molecular diagnostics of GC
(Table 4)[109-136].
MiR-25Li et al[124] investigated the expression level of miR-25 in plasma and GC tissues and found overexpression of miR-25 in patients with lymph node metastasis. Inhibition of miR-25 significantly suppressed metastasis, invasion and proliferation in vitro and reduced the metastatic capacity of GC cells in vivo through repression of transducer of ERBB2, 1 expression. Furthermore, patients with high plasma expression of miR-25 had poor prognoses[124]. MiR-25 is related to GC progression through repression of transducer of ERBB2, 1 and may represent a noninvasive biomarker for GC.
MiR-129It has been reported that miR-129 is a cancer-associated miRNA[137]. In previous studies, miR-129 levels were significantly altered in cancerous tissues, including GC, when compared to noncancerous tissues. MiR-129 has been shown to play an important role in regulating cell proliferation by downregulation of cyclin-dependent kinase 6[118,138]. Yu et al[118] assessed the diagnostic values of miR-129-1/2 in gastric secretion samples to propose a new screening tool for GC. After examining 141 secretion samples, patients with GC showed significantly lower levels of miR-129-1 and miR-129-2. Gastric secretions may be a good resource for the molecular diagnosis of GC.
MiR-199a-3pLi et al[115] performed microarray profiling of plasma samples to compare expression patterns in GC patients and healthy controls and to identify circulating miRNAs that may be novel diagnostic markers for GC. MiRNA-199a-3p was found to be significantly elevated in GC patients and was reduced after resection of the primary tumors in the training set. In the validation stage in a large cohort, plasma miR-199a-3p was elevated in GC patients compared to healthy controls, with a high under the receiver operating characteristic curve area (0.837), and was significantly associated with tumor depth, lymph node metastasis and stage[115]. Plasma miRNA-199a-3p was shown to be a potential biomarker both for early detection and progression of GC.
MiR-630MiR-630 has been reported to be elevated in lung, head and neck, and pancreatic cancers, and reports show that it can modulate chemosensitivity[139]. Chu et al[120] examined expression levels of miR-630 in 236 GC and adjacent normal tissues and found that miR-630 was elevated in GC tissues. Increased expression of miR-630 was significantly associated with depth of the tumor, lymph node metastasis, distant metastasis and poor overall survival, indicating that miR-630 may serve as a potential marker for the initiation and progression of GC.
SIGNIFICANCE OF lncRNAS IN GCThe genome sequencing projects revealed that the human genome is composed of less than 2% protein-coding genes and that more than 90% of the genome is transcribed as noncoding RNAs[107,140]. LncRNAs are a class of newly identified noncoding RNAs, > 200 nucleotides in length, that are currently being studied for their roles in cellular processes[141]. Changes in the expression levels of lncRNAs have been increasingly reported in various malignancies, suggesting that lncRNAs may play a role in tumorigenesis and tumor progression[142]. Interestingly, recent studies have suggested that lncRNAs also exist in serum, plasma and other body fluids, and certain lncRNAs have been described as candidate biomarkers[142,143]. Here, we introduce reported GC-related lncRNAs from recent publications (Table 5)[140,142,144-147].
Colon cancer associated transcript 1Colon cancer associated transcript 1 (CCAT1) was found to be generally upregulated in colon cancer and correlated with the rs6983267 allele, which was associated with increased cancer susceptibility[148]. The MYC enhancer region physically interacts with the promoter region of CCAT1, suggesting that the cancer-associated variant rs6983267 as an MYC enhancer could regulate CCAT1 expression[140]. Additionally, CCAT1 was reported to have a role in cell-cycle regulation and development of colon cancer[148]. Zhang et al[140] reported that CCAT1 was upregulated in GC tissues compared to paired adjacent normal tissues and that knockdown of CCAT1 significantly inhibited proliferation of GC cells by inducing G0/G1 cell-cycle arrest, apoptosis and inactivation of the ERK/MAPK signaling pathway. Diagnostic performance of CCAT1 is expected to be evaluated in a large cohort in the future.
Hypoxia inducible factor 1 alpha antisense RNA-2Hypoxia inducible factor 1 alpha antisense RNA-2 (HIF1A-AS2) is an antisense long noncoding RNA, which is a natural antisense transcript of hypoxia-inducible factor 1alpha (HIF-1a)[149]. Although earlier reports indicated that HIF1A-AS2 plays a crucial role in cancer development, via regulation of the cancer-relevant HIF-1a pathway, its oncological role in GC remains to be determined[150,151]. Chen et al[146] reported that upregulation of HIF1A-AS2 was found in GC tissues and significantly correlated with tumor depth, lymph node metastasis, advanced stage and poor prognosis. Furthermore, knockdown of HIF1A-AS2 in GC cells inhibited proliferation in vitro and tumorigenesis in vivo. HIF1A-AS2 may be considered as a promising biomarker for GC.
Gastric adenocarcinoma predictive long intergenic noncoding RNAHu et al[145] conducted global microarray and in situ
9845 September 14, 2015|Volume 21|Issue 34|WJG|www.wjgnet.com
Kanda M et al . Molecular diagnostics of GC
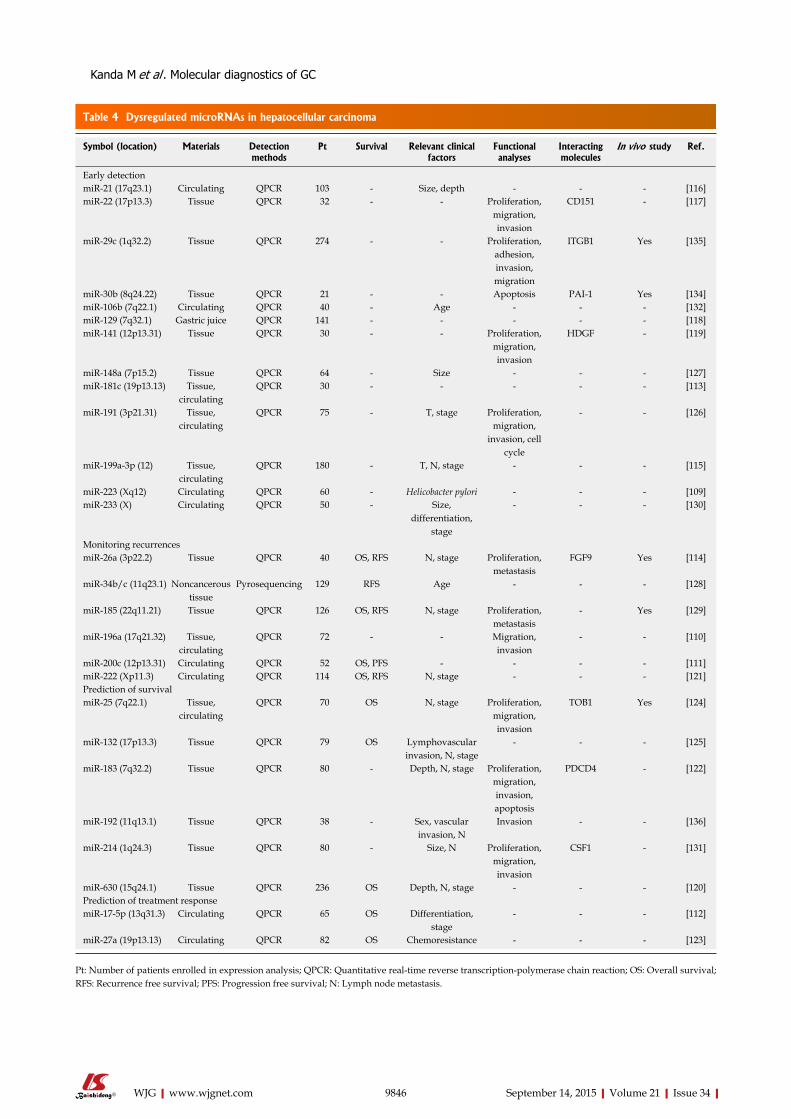
9846 September 14, 2015|Volume 21|Issue 34|WJG|www.wjgnet.com
Table 4 Dysregulated microRNAs in hepatocellular carcinoma
Symbol (location) Materials Detection methods
Pt Survival Relevant clinical factors
Functional analyses
Interacting molecules
In vivo study Ref.
Early detectionmiR-21 (17q23.1) Circulating QPCR 103 - Size, depth - - - [116]miR-22 (17p13.3) Tissue QPCR 32 - - Proliferation,
migration, invasion
CD151 - [117]
miR-29c (1q32.2) Tissue QPCR 274 - - Proliferation, adhesion, invasion, migration
ITGB1 Yes [135]
miR-30b (8q24.22) Tissue QPCR 21 - - Apoptosis PAI-1 Yes [134]miR-106b (7q22.1) Circulating QPCR 40 - Age - - - [132]miR-129 (7q32.1) Gastric juice QPCR 141 - - - - - [118]miR-141 (12p13.31) Tissue QPCR 30 - - Proliferation,
migration, invasion
HDGF - [119]
miR-148a (7p15.2) Tissue QPCR 64 - Size - - - [127]miR-181c (19p13.13) Tissue,
circulatingQPCR 30 - - - - - [113]
miR-191 (3p21.31) Tissue, circulating
QPCR 75 - T, stage Proliferation, migration,
invasion, cell cycle
- - [126]
miR-199a-3p (12) Tissue, circulating
QPCR 180 - T, N, stage - - - [115]
miR-223 (Xq12) Circulating QPCR 60 - Helicobacter pylori - - - [109]miR-233 (X) Circulating QPCR 50 - Size,
differentiation, stage
- - - [130]
Monitoring recurrencesmiR-26a (3p22.2) Tissue QPCR 40 OS, RFS N, stage Proliferation,
metastasisFGF9 Yes [114]
miR-34b/c (11q23.1) Noncancerous tissue
Pyrosequencing 129 RFS Age - - - [128]
miR-185 (22q11.21) Tissue QPCR 126 OS, RFS N, stage Proliferation, metastasis
- Yes [129]
miR-196a (17q21.32) Tissue, circulating
QPCR 72 - - Migration, invasion
- - [110]
miR-200c (12p13.31) Circulating QPCR 52 OS, PFS - - - - [111]miR-222 (Xp11.3) Circulating QPCR 114 OS, RFS N, stage - - - [121]Prediction of survivalmiR-25 (7q22.1) Tissue,
circulatingQPCR 70 OS N, stage Proliferation,
migration, invasion
TOB1 Yes [124]
miR-132 (17p13.3) Tissue QPCR 79 OS Lymphovascular invasion, N, stage
- - - [125]
miR-183 (7q32.2) Tissue QPCR 80 - Depth, N, stage Proliferation, migration, invasion, apoptosis
PDCD4 - [122]
miR-192 (11q13.1) Tissue QPCR 38 - Sex, vascular invasion, N
Invasion - - [136]
miR-214 (1q24.3) Tissue QPCR 80 - Size, N Proliferation, migration, invasion
CSF1 - [131]
miR-630 (15q24.1) Tissue QPCR 236 OS Depth, N, stage - - - [120]Prediction of treatment responsemiR-17-5p (13q31.3) Circulating QPCR 65 OS Differentiation,
stage- - - [112]
miR-27a (19p13.13) Circulating QPCR 82 OS Chemoresistance - - - [123]
Pt: Number of patients enrolled in expression analysis; QPCR: Quantitative real-time reverse transcription-polymerase chain reaction; OS: Overall survival; RFS: Recurrence free survival; PFS: Progression free survival; N: Lymph node metastasis.
Kanda M et al . Molecular diagnostics of GC
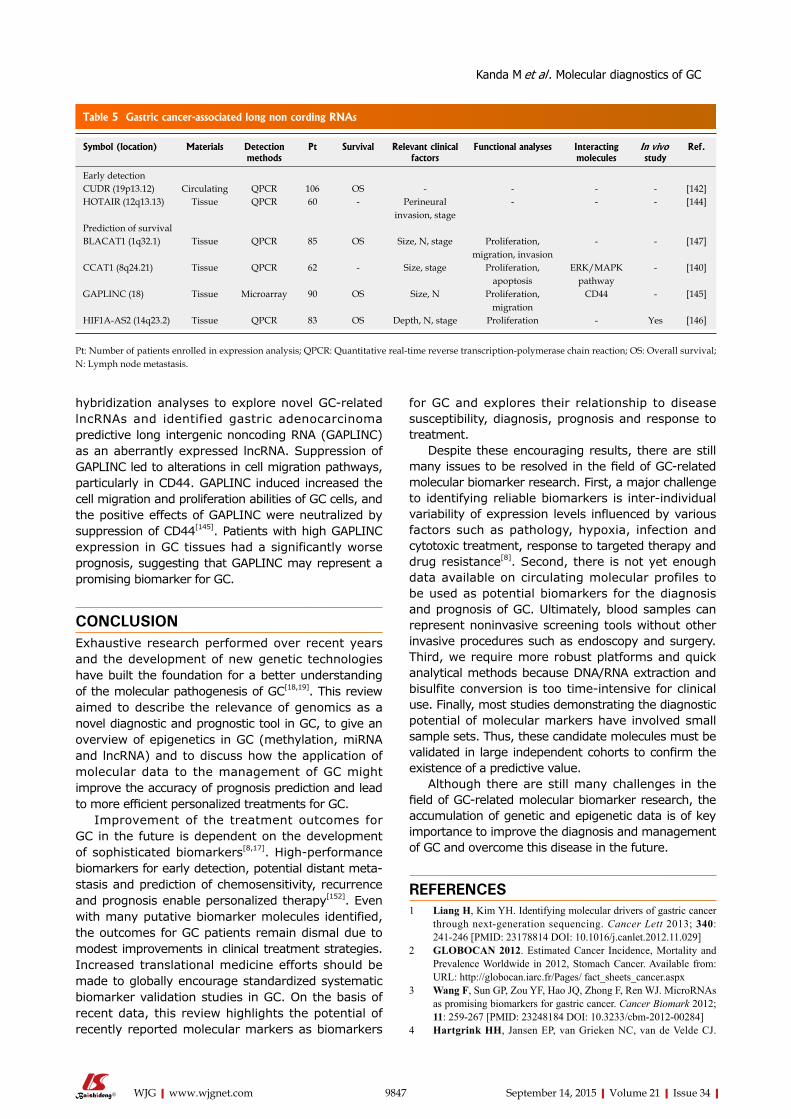
hybridization analyses to explore novel GC-related lncRNAs and identified gastric adenocarcinoma predictive long intergenic noncoding RNA (GAPLINC) as an aberrantly expressed lncRNA. Suppression of GAPLINC led to alterations in cell migration pathways, particularly in CD44. GAPLINC induced increased the cell migration and proliferation abilities of GC cells, and the positive effects of GAPLINC were neutralized by suppression of CD44[145]. Patients with high GAPLINC expression in GC tissues had a significantly worse prognosis, suggesting that GAPLINC may represent a promising biomarker for GC.
CONCLUSIONExhaustive research performed over recent years and the development of new genetic technologies have built the foundation for a better understanding of the molecular pathogenesis of GC[18,19]. This review aimed to describe the relevance of genomics as a novel diagnostic and prognostic tool in GC, to give an overview of epigenetics in GC (methylation, miRNA and lncRNA) and to discuss how the application of molecular data to the management of GC might improve the accuracy of prognosis prediction and lead to more efficient personalized treatments for GC.
Improvement of the treatment outcomes for GC in the future is dependent on the development of sophisticated biomarkers[8,17]. High-performance biomarkers for early detection, potential distant meta-stasis and prediction of chemosensitivity, recurrence and prognosis enable personalized therapy[152]. Even with many putative biomarker molecules identified, the outcomes for GC patients remain dismal due to modest improvements in clinical treatment strategies. Increased translational medicine efforts should be made to globally encourage standardized systematic biomarker validation studies in GC. On the basis of recent data, this review highlights the potential of recently reported molecular markers as biomarkers
for GC and explores their relationship to disease susceptibility, diagnosis, prognosis and response to treatment.
Despite these encouraging results, there are still many issues to be resolved in the field of GC-related molecular biomarker research. First, a major challenge to identifying reliable biomarkers is inter-individual variability of expression levels influenced by various factors such as pathology, hypoxia, infection and cytotoxic treatment, response to targeted therapy and drug resistance[8]. Second, there is not yet enough data available on circulating molecular profiles to be used as potential biomarkers for the diagnosis and prognosis of GC. Ultimately, blood samples can represent noninvasive screening tools without other invasive procedures such as endoscopy and surgery. Third, we require more robust platforms and quick analytical methods because DNA/RNA extraction and bisulfite conversion is too time-intensive for clinical use. Finally, most studies demonstrating the diagnostic potential of molecular markers have involved small sample sets. Thus, these candidate molecules must be validated in large independent cohorts to confirm the existence of a predictive value.
Although there are still many challenges in the field of GC-related molecular biomarker research, the accumulation of genetic and epigenetic data is of key importance to improve the diagnosis and management of GC and overcome this disease in the future.
REFERENCES1 Liang H, Kim YH. Identifying molecular drivers of gastric cancer
through nextgeneration sequencing. Cancer Lett 2013; 340: 241246 [PMID: 23178814 DOI: 10.1016/j.canlet.2012.11.029]
2 GLOBOCAN 2012. Estimated Cancer Incidence, Mortality and Prevalence Worldwide in 2012, Stomach Cancer. Available from: URL: http://globocan.iarc.fr/Pages/ fact_sheets_cancer.aspx
3 Wang F, Sun GP, Zou YF, Hao JQ, Zhong F, Ren WJ. MicroRNAs as promising biomarkers for gastric cancer. Cancer Biomark 2012; 11: 259267 [PMID: 23248184 DOI: 10.3233/cbm201200284]
4 Hartgrink HH, Jansen EP, van Grieken NC, van de Velde CJ.
9847 September 14, 2015|Volume 21|Issue 34|WJG|www.wjgnet.com
Table 5 Gastric cancer-associated long non cording RNAs
Symbol (location) Materials Detection methods
Pt Survival Relevant clinical factors
Functional analyses Interacting molecules
In vivo study
Ref.
Early detectionCUDR (19p13.12) Circulating QPCR 106 OS - - - - [142]HOTAIR (12q13.13) Tissue QPCR 60 - Perineural
invasion, stage- - - [144]
Prediction of survivalBLACAT1 (1q32.1) Tissue QPCR 85 OS Size, N, stage Proliferation,
migration, invasion- - [147]
CCAT1 (8q24.21) Tissue QPCR 62 - Size, stage Proliferation, apoptosis
ERK/MAPK pathway
- [140]
GAPLINC (18) Tissue Microarray 90 OS Size, N Proliferation, migration
CD44 - [145]
HIF1A-AS2 (14q23.2) Tissue QPCR 83 OS Depth, N, stage Proliferation - Yes [146]
Pt: Number of patients enrolled in expression analysis; QPCR: Quantitative real-time reverse transcription-polymerase chain reaction; OS: Overall survival; N: Lymph node metastasis.
Kanda M et al . Molecular diagnostics of GC
Gastric cancer. Lancet 2009; 374: 477490 [PMID: 19625077 DOI: 10.1016/s01406736(09)606176]
5 González CA, Agudo A. Carcinogenesis, prevention and early detection of gastric cancer: where we are and where we should go. Int J Cancer 2012; 130: 745753 [PMID: 21918974 DOI: 10.1002/ijc.26430]
6 Kanda M, Kobayashi D, tanaka C, Iwata N, Yamada S, Fujii t, Nakayama G, Sugimoto H, Koike M, Nomoto S, Murotani K, Fujiwara M, Kodera Y. Adverse prognostic impact of perioperative allogeneic transfusion on patients with stage II/III gastric cancer. Gastric Cancer 2015; Epub ahead of print [PMID: 25563579 DOI: 10.1007/s101200140456x]
7 Cho JY. Molecular diagnosis for personalized target therapy in gastric cancer. J Gastric Cancer 2013; 13: 129135 [PMID: 24156032 DOI: 10.5230/jgc.2013.13.3.129]
8 Durães C, Almeida GM, Seruca R, Oliveira C, Carneiro F. Biomarkers for gastric cancer: prognostic, predictive or targets of therapy? Virchows Arch 2014; 464: 367378 [PMID: 24487788 DOI: 10.1007/s004280131533y]
9 Emoto S, Ishigami H, Yamashita H, Yamaguchi H, Kaisaki S, Kitayama J. Clinical significance of CA125 and CA72-4 in gastric cancer with peritoneal dissemination. Gastric Cancer 2012; 15: 154161 [PMID: 21892754 DOI: 10.1007/s1012001100918]
10 Kanda M, Fujii t, takami H, Suenaga M, Inokawa Y, Yamada S, Nakayama G, Sugimoto H, Koike M, Nomoto S, Kodera Y. the combination of the serum carbohydrate antigen 199 and carcinoembryonic antigen is a simple and accurate predictor of mortality in pancreatic cancer patients. Surg Today 2014; 44: 16921701 [PMID: 24114022 DOI: 10.1007/s0059501307529]
11 Leung WK, Wu MS, Kakugawa Y, Kim JJ, Yeoh KG, Goh KL, Wu KC, Wu DC, Sollano J, Kachintorn U, Gotoda t, Lin Jt, You WC, Ng EK, Sung JJ. Screening for gastric cancer in Asia: current evidence and practice. Lancet Oncol 2008; 9: 279287 [PMID: 18308253 DOI: 10.1016/s14702045(08)70072x]
12 Wu HH, Lin WC, tsai KW. Advances in molecular biomarkers for gastric cancer: miRNAs as emerging novel cancer markers. Expert Rev Mol Med 2014; 16: e1 [PMID: 24456939 DOI: 10.1017/erm.2013.16]
13 Janjigian YY, Kelsen DP. Genomic dysregulation in gastric tumors. J Surg Oncol 2013; 107: 237242 [PMID: 23042588 DOI: 10.1002/jso.23263]
14 Cancer Genome Atlas Research Network. Comprehensive molecular characterization of gastric adenocarcinoma. Nature 2014; 513: 202209 [PMID: 25079317 DOI: 10.1038/nature13480]
15 Liu HS, Xiao HS. MicroRNAs as potential biomarkers for gastric cancer. World J Gastroenterol 2014; 20: 1200712017 [PMID: 25232237 DOI: 10.3748/wjg.v20.i34.12007]
16 Yasui W, Sentani K, Sakamoto N, Anami K, Naito Y, Oue N. Molecular pathology of gastric cancer: research and practice. Pathol Res Pract 2011; 207: 608612 [PMID: 22005013 DOI: 10.1016/j.prp.2011.09.006]
17 Lin LL, Huang HC, Juan HF. Discovery of biomarkers for gastric cancer: a proteomics approach. J Proteomics 2012; 75: 30813097 [PMID: 22498886 DOI: 10.1016/j.jprot.2012.03.046]
18 McLean MH, ElOmar EM. Genetics of gastric cancer. Nat Rev Gastroenterol Hepatol 2014; 11: 664674 [PMID: 25134511 DOI: 10.1038/nrgastro.2014.143]
19 Razzak M. Genetics: new molecular classification of gastric adenocarcinoma proposed by the Cancer Genome Atlas. Nat Rev Clin Oncol 2014; 11: 499 [PMID: 25113841 DOI: 10.1038/nrclinonc.2014.138]
20 Hur K, Han tS, Jung EJ, Yu J, Lee HJ, Kim WH, Goel A, Yang HK. Upregulated expression of sulfatases (SULF1 and SULF2) as prognostic and metastasis predictive markers in human gastric cancer. J Pathol 2012; 228: 8898 [PMID: 22653794 DOI: 10.1002/path.4055]
21 Lee J, Goh SH, Song N, Hwang JA, Nam S, Choi IJ, Shin A, Kim IH, Ju MH, Jeong JS, Lee YS. Overexpression of IFItM1 has clinicopathologic effects on gastric cancer and is regulated by an epigenetic mechanism. Am J Pathol 2012; 181: 4352 [PMID:
22609115 DOI: 10.1016/j.ajpath.2012.03.027]22 Meng XY, Zhou CH, Ma J, Jiang C, Ji P. Expression of inter
leukin17 and its clinical significance in gastric cancer patients. Med Oncol 2012; 29: 30243028 [PMID: 22744708 DOI: 10.1007/s1203201202731]
23 Yu J, Gao J, Lu Z, Li Y, Shen L. Serum levels of tUBB3 correlate with clinical outcome in Chinese patients with advanced gastric cancer receiving first-line paclitaxel plus capecitabine. Med Oncol 2012; 29: 30293034 [PMID: 22766748 DOI: 10.1007/s120320120292y]
24 Ivanova T, Zouridis H, Wu Y, Cheng LL, tan IB, Gopalakrishnan V, Ooi CH, Lee J, Qin L, Wu J, Lee M, Rha SY, Huang D, Liem N, Yeoh KG, Yong WP, teh Bt, tan P. Integrated epigenomics identifies BMP4 as a modulator of cisplatin sensitivity in gastric cancer. Gut 2013; 62: 2233 [PMID: 22535375 DOI: 10.1136/gutjnl2011301113]
25 Zhou F, Qiu W, Yao R, Xiang J, Sun X, Liu S, Lv J, Yue L. CRM1 is a novel independent prognostic factor for the poor prognosis of gastric carcinomas. Med Oncol 2013; 30: 726 [PMID: 24026662 DOI: 10.1007/s1203201307261]
26 Chu D, Zhu S, Li J, Ji G, Wang W, Wu G, Zheng J. CD147 expression in human gastric cancer is associated with tumor recurrence and prognosis. PLoS One 2014; 9: e101027 [PMID: 24979746 DOI: 10.1371/journal.pone.0101027]
27 Deng N, Liu JW, Sun LP, Xu Q, Duan ZP, Dong NN, Yuan Y. Expression of XPG protein in the development, progression and prognosis of gastric cancer. PLoS One 2014; 9: e108704 [PMID: 25268735 DOI: 10.1371/journal.pone.0108704]
28 Deng X, Liu P, Zhao Y, Wang Q. Expression profiling of CEACAM6 associated with the tumorigenesis and progression in gastric adenocarcinoma. Genet Mol Res 2014; 13: 76867697 [PMID: 25299082 DOI: 10.4238/2014.September.26.6]
29 Ema A, Yamashita K, Ushiku H, Kojo K, Minatani N, Kikuchi M, Mieno H, Moriya H, Hosoda K, Katada N, Kikuchi S, Watanabe M. Immunohistochemical analysis of RTKs expression identified HER3 as a prognostic indicator of gastric cancer. Cancer Sci 2014; 105: 15911600 [PMID: 25455899 DOI: 10.1111/cas.12556]
30 Fang Z, tian Z, Luo K, Song H, Yi J. Clinical significance of stanniocalcin expression in tissue and serum of gastric cancer patients. Chin J Cancer Res 2014; 26: 602610 [PMID: 25400427 DOI: 10.3978/j.issn.10009604.2014.10.08]
31 Hedner C, Gaber A, Korkocic D, Nodin B, Uhlén M, Kuteeva E, Johannesson H, Jirström K, Eberhard J. SAtB1 is an independent prognostic factor in radically resected upper gastrointestinal tract adenocarcinoma. Virchows Arch 2014; 465: 649659 [PMID: 25326863 DOI: 10.1007/s0042801416676]
32 Hu CE, Liu YC, Zhang HD, Huang GJ. JMJD2A predicts prognosis and regulates cell growth in human gastric cancer. Biochem Biophys Res Commun 2014; 449: 17 [PMID: 24802408 DOI: 10.1016/j.bbrc.2014.04.126]
33 Kanda M, Nomoto S, Oya H, Shimizu D, takami H, Hibino S, Hashimoto R, Kobayashi D, tanaka C, Yamada S, Fujii t, Nakayama G, Sugimoto H, Koike M, Fujiwara M, Kodera Y. Dihydropyrimidinaselike 3 facilitates malignant behavior of gastric cancer. J Exp Clin Cancer Res 2014; 33: 66 [PMID: 25096402 DOI: 10.1186/s1304601400669]
34 Kwon CH, Park HJ, Lee JR, Kim HK, Jeon tY, Jo HJ, Kim DH, Kim GH, Park DY. Serpin peptidase inhibitor clade A member 1 is a biomarker of poor prognosis in gastric cancer. Br J Cancer 2014; 111: 19932002 [PMID: 25211665 DOI: 10.1038/bjc.2014.490]
35 Shi H, Ji M, Wu J, Zhou Q, Li X, Li Z, Zheng X, Xu B, Zhao W, Wu C, Jiang J. Serum B7-H4 expression is a significant prognostic indicator for patients with gastric cancer. World J Surg Oncol 2014; 12: 188 [PMID: 24947047 DOI: 10.1186/1477781912188]
36 Sun A, Yu G, Dou X, Yan X, Yang W, Lin Q. Nedd41 is an exceptional prognostic biomarker for gastric cardia adenocarcinoma and functionally associated with metastasis. Mol Cancer 2014; 13: 248 [PMID: 25395181 DOI: 10.1186/1476459813248]
37 Ye XT, Guo AJ, Yin PF, Cao XD, Chang JC. Overexpression of NUAK1 is associated with diseasefree survival and overall
9848 September 14, 2015|Volume 21|Issue 34|WJG|www.wjgnet.com
Kanda M et al . Molecular diagnostics of GC
survival in patients with gastric cancer. Med Oncol 2014; 31: 61 [PMID: 24943992 DOI: 10.1007/s1203201400611]
38 Zhang J, Zhang K, Jiang X, Zhang J. S100A6 as a potential serum prognostic biomarker and therapeutic target in gastric cancer. Dig Dis Sci 2014; 59: 21362144 [PMID: 24705642 DOI: 10.1007/s106200143137z]
39 Chen S, tang J, Huang L, Lin J. Expression and prognostic value of Mycl1 in gastric cancer. Biochem Biophys Res Commun 2015; 456: 879883 [PMID: 25528583 DOI: 10.1016/j.bbrc.2014.12.060]
40 Chen SZ, Yao HQ, Zhu SZ, Li QY, Guo GH, Yu J. Expression levels of matrix metalloproteinase9 in human gastric carcinoma. Oncol Lett 2015; 9: 915919 [PMID: 25621068 DOI: 10.3892/ol.2014.2768]
41 Guo T, Yu Y, Yip GW, Baeg GH, thike AA, Lim tK, tan PH, Matsumoto K, Bay BH. Ybox binding protein 1 is correlated with lymph node metastasis in intestinaltype gastric cancer. Histopathology 2015; 66: 491499 [PMID: 25270600 DOI: 10.1111/his.12570]
42 Ma L, Wang X, Lan F, Yu Y, Ouyang X, Liu W, Xie F, Huang Q. Prognostic value of differential CCND1 expression in patients with resected gastric adenocarcinoma. Med Oncol 2015; 32: 338 [PMID: 25452171 DOI: 10.1007/s1203201403384]
43 Xu MD, Dong L, Qi P, Weng WW, Shen XH, Ni SJ, Huang D, tan C, Sheng WQ, Zhou XY, Du X. Pituitary tumortransforming gene1 serves as an independent prognostic biomarker for gastric cancer. Gastric Cancer 2015; Epub ahead of print [PMID: 25627474 DOI: 10.1007/s1012001504592]
44 Kanda M, Nomoto S, Oya H, takami H, Shimizu D, Hibino S, Hashimoto R, Kobayashi D, tanaka C, Yamada S, Fujii t, Nakayama G, Sugimoto H, Koike M, Fujiwara M, Kodera Y. the Expression of MelanomaAssociated Antigen D2 Both in Surgically Resected and Serum Samples Serves as Clinically Relevant Biomarker of Gastric Cancer Progression. Ann Surg Oncol 2015; Epub ahead of print [PMID: 25743330 DOI: 10.1245/s1043401544578]
45 Pinto M, Oliveira C, Cirnes L, Carlos Machado J, Ramires M, Nogueira A, Carneiro F, Seruca R. Promoter methylation of tGFbeta receptor I and mutation of tGFbeta receptor II are frequent events in MSI sporadic gastric carcinomas. J Pathol 2003; 200: 3238 [PMID: 12692838 DOI: 10.1002/path.1327]
46 Oya H, Kanda M, Sugimoto H, Shimizu D, takami H, Hibino S, Hashimoto R, Okamura Y, Yamada S, Fujii t, Nakayama G, Koike M, Nomoto S, Fujiwara M, Kodera Y. Dihydropyrimidinaselike 3 is a putative hepatocellular carcinoma tumor suppressor. J Gastroenterol 2015; 50: 590600 [PMID: 25173447 DOI: 10.1007/s0053501409934]
47 Rosslenbroich V, Dai L, Baader SL, Noegel AA, Gieselmann V, Kappler J. Collapsin response mediator protein4 regulates Factin bundling. Exp Cell Res 2005; 310: 434444 [PMID: 16181627 DOI: 10.1016/j.yexcr.2005.08.005]
48 Kawahara T, Hotta N, Ozawa Y, Kato S, Kano K, Yokoyama Y, Nagino M, takahashi t, Yanagisawa K. Quantitative proteomic profiling identifies DPYSL3 as pancreatic ductal adenocarcinoma-associated molecule that regulates cell adhesion and migration by stabilization of focal adhesion complex. PLoS One 2013; 8: e79654 [PMID: 24339867 DOI: 10.1371/journal.pone.0079654]
49 Gao X, Pang J, Li LY, Liu WP, Di JM, Sun QP, Fang YQ, Liu XP, Pu XY, He D, Li Mt, Su ZL, Li BY. Expression profiling identifies new function of collapsin response mediator protein 4 as a metastasissuppressor in prostate cancer. Oncogene 2010; 29: 45554566 [PMID: 20543870 DOI: 10.1038/onc.2010.213]
50 Begnami MD, Fukuda E, Fregnani JH, Nonogaki S, Montagnini AL, da Costa WL, Soares FA. Prognostic implications of altered human epidermal growth factor receptors (HERs) in gastric carcinomas: HER2 and HER3 are predictors of poor outcome. J Clin Oncol 2011; 29: 30303036 [PMID: 21709195 DOI: 10.1200/jco.2010.33.6313]
51 Ocana A, VeraBadillo F, Seruga B, templeton A, Pandiella A, Amir E. HER3 overexpression and survival in solid tumors: a metaanalysis. J Natl Cancer Inst 2013; 105: 266273 [PMID:
23221996 DOI: 10.1093/jnci/djs501]52 Allgayer H, Babic R, Grützner KU, Beyer BC, tarabichi A,
Schildberg FW, Heiss MM. tumorassociated proteases and inhibitors in gastric cancer: analysis of prognostic impact and individual risk protease patterns. Clin Exp Metastasis 1998; 16: 6273 [PMID: 9502078]
53 Dhoot GK, Gustafsson MK, Ai X, Sun W, Standiford DM, Emerson CP. Regulation of Wnt signaling and embryo patterning by an extracellular sulfatase. Science 2001; 293: 16631666 [PMID: 11533491 DOI: 10.1126/science.293.5535.1663]
54 Morimoto-Tomita M, Uchimura K, Werb Z, Hemmerich S, Rosen SD. Cloning and characterization of two extracellular heparindegrading endosulfatases in mice and humans. J Biol Chem 2002; 277: 4917549185 [PMID: 12368295 DOI: 10.1074/jbc.M205131200]
55 Jang BG, Kim WH. Molecular pathology of gastric carcinoma. Pathobiology 2011; 78: 302310 [PMID: 22104201 DOI: 10.1159/000321703]
56 Wang S, Wu X, Zhang J, Chen Y, Xu J, Xia X, He S, Qiang F, Li A, Shu Y, Røe OD, Li G, Zhou JW. CHIP functions as a novel suppressor of tumour angiogenesis with prognostic significance in human gastric cancer. Gut 2013; 62: 496508 [PMID: 22535373 DOI: 10.1136/gutjnl2011301522]
57 Cheng Y, Jia C, Li G, Li H. Expression of eukaryotic initiation factor 3f is associated with prognosis in gastric carcinomas. Oncol Res Treat 2014; 37: 198202 [PMID: 24732644 DOI: 10.1159/000360779]
58 Huang JY, Xu YY, Sun Z, Wang ZN, Zhu Z, Song YX, Luo Y, Zhang X, Xu HM. Low junctional adhesion molecule A expression correlates with poor prognosis in gastric cancer. J Surg Res 2014; 192: 494502 [PMID: 25033702 DOI: 10.1016/j.jss.2014.06.025]
59 Kanda M, Oya H, Nomoto S, takami H, Shimizu D, Hashimoto R, Sueoka S, Kobayashi D, tanaka C, Yamada S, Fujii t, Nakayama G, Sugimoto H, Koike M, Fujiwara M, Kodera Y. Diversity of clinical implication of Bcell translocation gene 1 expression by histopathologic and anatomic subtypes of gastric cancer. Dig Dis Sci 2015; 60: 12561264 [PMID: 25487193 DOI: 10.1007/s1062001434778]
60 Mai C, Zhao JJ, tang XF, Wang W, Pan K, Pan QZ, Zhang XF, Jiang SS, Zhao BW, Li YF, Xia JC, Zhou ZW. Decreased ItIH5 expression is associated with poor prognosis in primary gastric cancer. Med Oncol 2014; 31: 53 [PMID: 24913813 DOI: 10.1007/s1203201400531]
61 Sun T, Du W, Xiong H, Yu Y, Weng Y, Ren L, Zhao H, Wang Y, Chen Y, Xu J, Xiang Y, Qin W, Cao W, Zou W, Chen H, Hong J, Fang JY. tMEFF2 deregulation contributes to gastric carcinogenesis and indicates poor survival outcome. Clin Cancer Res 2014; 20: 46894704 [PMID: 24987055 DOI: 10.1158/10780432.ccr140315]
62 Tang C, Gao X, Liu H, Jiang t, Zhai X. Decreased expression of SEMA3A is associated with poor prognosis in gastric carcinoma. Int J Clin Exp Pathol 2014; 7: 47824794 [PMID: 25197349]
63 Rouault JP, Rimokh R, tessa C, Paranhos G, Ffrench M, Duret L, Garoccio M, Germain D, Samarut J, Magaud JP. BtG1, a member of a new family of antiproliferative genes. EMBO J 1992; 11: 16631670 [PMID: 1373383]
64 Nahta R, Yuan LX, Fiterman DJ, Zhang L, Symmans WF, Ueno Nt, Esteva FJ. B cell translocation gene 1 contributes to antisense Bcl2mediated apoptosis in breast cancer cells. Mol Cancer Ther 2006; 5: 15931601 [PMID: 16818519 DOI: 10.1158/15357163.mct060133]
65 Kanda M, Sugimoto H, Nomoto S, Oya H, Hibino S, Shimizu D, takami H, Hashimoto R, Okamura Y, Yamada S, Fujii t, Nakayama G, Koike M, Fujiwara M, Kodera Y. Bcell translocation gene 1 serves as a novel prognostic indicator of hepatocellular carcinoma. Int J Oncol 2015; 46: 641648 [PMID: 25405901 DOI: 10.3892/ijo.2014.2762]
66 Sheng SH, Zhao CM, Sun GG. BtG1 expression correlates with the pathogenesis and progression of breast carcinomas. Tumour Biol 2014; 35: 33173326 [PMID: 24272202 DOI: 10.1007/
9849 September 14, 2015|Volume 21|Issue 34|WJG|www.wjgnet.com
Kanda M et al . Molecular diagnostics of GC
s1327701314370]67 Sun GG, Lu YF, Cheng YJ, Hu WN. the expression of BtG1
is downregulated in NSCLC and possibly associated with tumor metastasis. Tumour Biol 2014; 35: 29492957 [PMID: 24264312 DOI: 10.1007/s1327701313796]
68 Kanda M, Matthaei H, Wu J, Hong SM, Yu J, Borges M, Hruban RH, Maitra A, Kinzler K, Vogelstein B, Goggins M. Presence of somatic mutations in most earlystage pancreatic intraepithelial neoplasia. Gastroenterology 2012; 142: 730733.e9 [PMID: 22226782 DOI: 10.1053/j.gastro.2011.12.042]
69 Kanda M, Knight S, topazian M, Syngal S, Farrell J, Lee J, Kamel I, Lennon AM, Borges M, Young A, Fujiwara S, Seike J, Eshleman J, Hruban RH, Canto MI, Goggins M. Mutant GNAS detected in duodenal collections of secretinstimulated pancreatic juice indicates the presence or emergence of pancreatic cysts. Gut 2013; 62: 10241033 [PMID: 22859495 DOI: 10.1136/gutjnl2012302823]
70 Himmelfarb M, Klopocki E, Grube S, Staub E, Klaman I, Hinzmann B, Kristiansen G, Rosenthal A, Dürst M, Dahl E. ItIH5, a novel member of the interalphatrypsin inhibitor heavy chain family is downregulated in breast cancer. Cancer Lett 2004; 204: 6977 [PMID: 14744536]
71 Veeck J, Chorovicer M, Naami A, Breuer E, Zafrakas M, Bektas N, Dürst M, Kristiansen G, Wild PJ, Hartmann A, Knuechel R, Dahl E. the extracellular matrix protein ItIH5 is a novel prognostic marker in invasive nodenegative breast cancer and its aberrant expression is caused by promoter hypermethylation. Oncogene 2008; 27: 865876 [PMID: 17653090 DOI: 10.1038/sj.onc.1210669]
72 Esser C , Alberti S, Höhfeld J. Cooperation of molecular chaperones with the ubiquitin/proteasome system. Biochim Biophys Acta 2004; 1695: 171188 [PMID: 15571814 DOI: 10.1016/j.bbamcr.2004.09.020]
73 Connell P, Ballinger CA, Jiang J, Wu Y, thompson LJ, Höhfeld J, Patterson C. the cochaperone CHIP regulates protein triage decisions mediated by heatshock proteins. Nat Cell Biol 2001; 3: 9396 [PMID: 11146632 DOI: 10.1038/35050618]
74 Muller P, Hrstka R, Coomber D, Lane DP, Vojtesek B. Chaperonedependent stabilization and degradation of p53 mutants. Oncogene 2008; 27: 33713383 [PMID: 18223694 DOI: 10.1038/sj.onc.1211010]
75 Bird A. DNA methylation patterns and epigenetic memory. Genes Dev 2002; 16: 621 [PMID: 11782440 DOI: 10.1101/gad.947102]
76 Bird A. Perceptions of epigenetics. Nature 2007; 447: 396398 [PMID: 17522671 DOI: 10.1038/nature05913]
77 Calcagno DQ, Gigek CO, Chen ES, Burbano RR, Smith Mde A. DNA and histone methylation in gastric carcinogenesis. World J Gastroenterol 2013; 19: 11821192 [PMID: 23482412 DOI: 10.3748/wjg.v19.i8.1182]
78 Terry MB, DelgadoCruzata L, VinRaviv N, Wu HC, Santella RM. DNA methylation in white blood cells: association with risk factors in epidemiologic studies. Epigenetics 2011; 6: 828837 [PMID: 21636973]
79 Matsusaka K , Funata S, Fukayama M, Kaneda A. DNA methylation in gastric cancer, related to Helicobacter pylori and EpsteinBarr virus. World J Gastroenterol 2014; 20: 39163926 [PMID: 24744581 DOI: 10.3748/wjg.v20.i14.3916]
80 Kobayashi D, Nomoto S, Kodera Y, Fujiwara M, Koike M, Nakayama G, Ohashi N, Nakao A. Suppressor of cytokine signaling 4 detected as a novel gastric cancer suppressor gene using double combination array analysis. World J Surg 2012; 36: 362372 [PMID: 22127425 DOI: 10.1007/s0026801113582]
81 Li X, Cheung KF, Ma X, tian L, Zhao J, Go MY, Shen B, Cheng AS, Ying J, tao Q, Sung JJ, Kung HF, Yu J. Epigenetic inactivation of paired box gene 5, a novel tumor suppressor gene, through direct upregulation of p53 is associated with prognosis in gastric cancer patients. Oncogene 2012; 31: 34193430 [PMID: 22105368 DOI: 10.1038/onc.2011.511]
82 Takamaru H, Yamamoto E, Suzuki H, Nojima M, Maruyama R, Yamano HO, Yoshikawa K, Kimura t, Harada t, Ashida M, Suzuki R, Yamamoto H, Kai M, tokino t, Sugai t, Imai K, toyota
M, Shinomura Y. Aberrant methylation of RASGRF1 is associated with an epigenetic field defect and increased risk of gastric cancer. Cancer Prev Res (Phila) 2012; 5: 12031212 [PMID: 22961779 DOI: 10.1158/19406207.capr120056]
83 Balgkouranidou I, Karayiannakis A, Matthaios D, Bolanaki H, tripsianis G, tentes AA, Lianidou E, Chatzaki E, Fiska A, Lambropoulou M, Kolios G, Kakolyris S. Assessment of SOX17 DNA methylation in cell free DNA from patients with operable gastric cancer. Association with prognostic variables and survival. Clin Chem Lab Med 2013; 51: 15051510 [PMID: 23403728 DOI: 10.1515/cclm20120320]
84 Guo W, Dong Z, Guo Y, Chen Z, Kuang G, Yang Z. Methylationmediated repression of GADD45A and GADD45G expression in gastric cardia adenocarcinoma. Int J Cancer 2013; 133: 20432053 [PMID: 23616123 DOI: 10.1002/ijc.28223]
85 Ling ZQ, Lv P, Lu XX, Yu JL, Han J, Ying LS, Zhu X, Zhu WY, Fang XH, Wang S, Wu YC. Circulating Methylated XAF1 DNA Indicates Poor Prognosis for Gastric Cancer. PLoS One 2013; 8: e67195 [PMID: 23826230 DOI: 10.1371/journal.pone.0067195]
86 Ooki A, Yamashita K, Yamaguchi K, Mondal A, Nishimiya H, Watanabe M. DNA damageinducible gene, reprimo functions as a tumor suppressor and is suppressed by promoter methylation in gastric cancer. Mol Cancer Res 2013; 11: 13621374 [PMID: 23982217 DOI: 10.1158/15417786.mcr130091]
87 Tanaka T, Nakamura J, Kitajima Y, Kai K, Miyake S, Hiraki M, Ide t, Koga Y, Noshiro H. Loss of trefoil factor 1 is regulated by DNA methylation and is an independent predictive factor for poor survival in advanced gastric cancer. Int J Oncol 2013; 42: 894902 [PMID: 23291975 DOI: 10.3892/ijo.2013.1759]
88 Feng G, Zhang Y, Yuan H, Bai R, Zheng J, Zhang J, Song M. DNA methylation of trefoil factor 1 (tFF1) is associated with the tumorigenesis of gastric carcinoma. Mol Med Rep 2014; 9: 109117 [PMID: 24190027 DOI: 10.3892/mmr.2013.1772]
89 Han J, Lv P, Yu JL, Wu YC, Zhu X, Hong LL, Zhu WY, Yu QM, Wang XB, Li P, Ling ZQ. Circulating methylated MINt2 promoter DNA is a potential poor prognostic factor in gastric cancer. Dig Dis Sci 2014; 59: 11601168 [PMID: 24385013 DOI: 10.1007/s1062001330070]
90 Han L, Dong Z, Wang C, Guo Y, Shen S, Kuang G, Guo W. Decreased expression and aberrant methylation of RASSF5A correlates with malignant progression of gastric cardia adenocarcinoma. Mol Carcinog 2014; Epub ahead of print [PMID: 25420558 DOI: 10.1002/mc.22245]
91 Kanda M, Nomoto S, Oya H, Hashimoto R, takami H, Shimizu D, Sonohara F, Kobayashi D, tanaka C, Yamada S, Fujii t, Nakayama G, Sugimoto H, Koike M, Murotani K, Fujiwara M, Kodera Y. Decreased expression of prenyl diphosphate synthase subunit 2 correlates with reduced survival of patients with gastric cancer. J Exp Clin Cancer Res 2014; 33: 88 [PMID: 25330808 DOI: 10.1186/s1304601400883]
92 Kanda M, Shimizu D, Nomoto S, Hibino S, Oya H, takami H, Kobayashi D, Yamada S, Inokawa Y, tanaka C, Fujii t, Sugimoto H, Koike M, Fujiwara M, Kodera Y. Clinical significance of expression and epigenetic profiling of TUSC1 in gastric cancer. J Surg Oncol 2014; 110: 136144 [PMID: 24700496 DOI: 10.1002/jso.23614]
93 Li DX, Cai HY, Wang X, Feng YL, Cai SW. Promoter methylation of Raf kinase inhibitory protein: A significant prognostic indicator for patients with gastric adenocarcinoma. Exp Ther Med 2014; 8: 844850 [PMID: 25120612 DOI: 10.3892/etm.2014.1833]
94 Otani K, Dong Y, Li X, Lu J, Zhang N, Xu L, Go MY, Ng EK, Arakawa t, Chan FK, Sung JJ, Yu J. Oddskipped related 1 is a novel tumour suppressor gene and a potential prognostic biomarker in gastric cancer. J Pathol 2014; 234: 302315 [PMID: 24931004 DOI: 10.1002/path.4391]
95 Zhang H, Song Y, Xia P, Cheng Y, Guo Q, Diao D, Wang W, Wu X, Liu D, Dang C. Detection of aberrant hypermethylated spastic paraplegia20 as a potential biomarker and prognostic factor in gastric cancer. Med Oncol 2014; 31: 830 [PMID: 24381142 DOI: 10.1007/s1203201308302]
9850 September 14, 2015|Volume 21|Issue 34|WJG|www.wjgnet.com
Kanda M et al . Molecular diagnostics of GC
96 Kanda M, Shimizu D, Nomoto S, takami H, Hibino S, Oya H, Hashimoto R, Suenaga M, Inokawa Y, Kobayashi D, tanaka C, Yamada S, Fujii t, Nakayama G, Sugimoto H, Koike M, Fujiwara M, Kodera Y. Prognostic impact of expression and methylation status of DENN/MADD domaincontaining protein 2D in gastric cancer. Gastric Cancer 2015; 18: 288296 [PMID: 24695972 DOI: 10.1007/s1012001403720]
97 Yang Z, Li DM, Xie Q, Dai DQ. Protein expression and promoter methylation of the candidate biomarker tCF21 in gastric cancer. J Cancer Res Clin Oncol 2015; 141: 211220 [PMID: 25156819 DOI: 10.1007/s004320141809x]
98 Hao Y, Chai KH, McLoughlin DM, Chan HY, Lau KF. Promoter characterization and genomic organization of the human X11β gene APBA2. Neuroreport 2012; 23: 146151 [PMID: 22222501 DOI: 10.1097/WNR.0b013e32834f1934]
99 Kanda M, Nomoto S, Oya H, takami H, Hibino S, Hishida M, Suenaga M, Yamada S, Inokawa Y, Nishikawa Y, Asai M, Fujii t, Sugimoto H, Kodera Y. Downregulation of DENND2D by promoter hypermethylation is associated with early recurrence of hepatocellular carcinoma. Int J Oncol 2014; 44: 4452 [PMID: 24189587 DOI: 10.3892/ijo.2013.2165]
100 Marat AL, Dokainish H, McPherson PS. DENN domain proteins: regulators of Rab GtPases. J Biol Chem 2011; 286: 1379113800 [PMID: 21330364 DOI: 10.1074/jbc.R110.217067]
101 Liu W, Li X, Chu ES, Go MY, Xu L, Zhao G, Li L, Dai N, Si J, tao Q, Sung JJ, Yu J. Paired box gene 5 is a novel tumor suppressor in hepatocellular carcinoma through interaction with p53 signaling pathway. Hepatology 2011; 53: 843853 [PMID: 21319196 DOI: 10.1002/hep.24124]
102 Nutt SL , Urbánek P, Rolink A, Busslinger M. Essential functions of Pax5 (BSAP) in proB cell development: difference between fetal and adult B lymphopoiesis and reduced VtoDJ recombination at the IgH locus. Genes Dev 1997; 11: 476491 [PMID: 9042861]
103 Ohki R, Nemoto J, Murasawa H, Oda E, Inazawa J, tanaka N, taniguchi t. Reprimo, a new candidate mediator of the p53mediated cell cycle arrest at the G2 phase. J Biol Chem 2000; 275: 2262722630 [PMID: 10930422 DOI: 10.1074/jbc.C000235200]
104 Zhang Z , Li J, Lantry LE, Wang Y, Wiseman RW, Lubet RA, You M. p53 transgenic mice are highly susceptible to 1, 2dimethylhydrazineinduced uterine sarcomas. Cancer Res 2002; 62: 30243029 [PMID: 12036908]
105 Pogribny IP, Rusyn I. Role of epigenetic aberrations in the development and progression of human hepatocellular carcinoma. Cancer Lett 2014; 342: 223230 [PMID: 22306342 DOI: 10.1016/j.canlet.2012.01.038]
106 Toiyama Y, Okugawa Y, Goel A. DNA methylation and microRNA biomarkers for noninvasive detection of gastric and colorectal cancer. Biochem Biophys Res Commun 2014; 455: 4357 [PMID: 25128828 DOI: 10.1016/j.bbrc.2014.08.001]
107 Wang J, Song YX, Wang ZN. Noncoding RNAs in gastric cancer. Gene 2015; 560: 18 [PMID: 25659765 DOI: 10.1016/j.gene.2015.02.004]
108 Aravalli RN, Steer CJ, Cressman EN. Molecular mechanisms of hepatocellular carcinoma. Hepatology 2008; 48: 20472063 [PMID: 19003900 DOI: 10.1002/hep.22580]
109 Li BS, Zhao YL, Guo G, Li W, Zhu ED, Luo X, Mao XH, Zou QM, Yu PW, Zuo QF, Li N, tang B, Liu KY, Xiao B. Plasma microRNAs, miR223, miR21 and miR218, as novel potential biomarkers for gastric cancer detection. PLoS One 2012; 7: e41629 [PMID: 22860003 DOI: 10.1371/journal.pone.0041629]
110 Tsai KW, Liao YL, Wu CW, Hu LY, Li SC, Chan WC, Ho MR, Lai CH, Kao HW, Fang WL, Huang KH, Lin WC. Aberrant expression of miR196a in gastric cancers and correlation with recurrence. Genes Chromosomes Cancer 2012; 51: 394401 [PMID: 22420029]
111 Valladares-Ayerbes M, Reboredo M, MedinaVillaamil V, IglesiasDíaz P, LorenzoPatiño MJ, Haz M, Santamarina I, Blanco M, Fernándeztajes J, Quindós M, Carral A, Figueroa A, AntónAparicio LM, Calvo L. Circulating miR200c as a diagnostic and
prognostic biomarker for gastric cancer. J Transl Med 2012; 10: 186 [PMID: 22954417 DOI: 10.1186/1479587610186]
112 Wang M, Gu H, Wang S, Qian H, Zhu W, Zhang L, Zhao C, tao Y, Xu W. Circulating miR175p and miR20a: molecular markers for gastric cancer. Mol Med Rep 2012; 5: 15141520 [PMID: 22406928 DOI: 10.3892/mmr.2012.828]
113 Cui MH, Hou XL, Lei XY, Mu FH, Yang GB, Yue L, Fu Y, Yi GX. Upregulation of microRNA 181c expression in gastric cancer tissues and plasma. Asian Pac J Cancer Prev 2013; 14: 30633066 [PMID: 23803080]
114 Deng M, tang HL, Lu XH, Liu MY, Lu XM, Gu YX, Liu JF, He ZM. miR26a suppresses tumor growth and metastasis by targeting FGF9 in gastric cancer. PLoS One 2013; 8: e72662 [PMID: 24015269 DOI: 10.1371/journal.pone.0072662]
115 Li C, Li JF, Cai Q, Qiu QQ, Yan M, Liu BY, Zhu ZG. miRNA199a3p in plasma as a potential diagnostic biomarker for gastric cancer. Ann Surg Oncol 2013; 20 Suppl 3: S397S405 [PMID: 22956063 DOI: 10.1245/s1043401226003]
116 Song J, Bai Z, Zhang J, Meng H, Cai J, Deng W, Bi J, Ma X, Zhang Z. Serum microRNA21 levels are related to tumor size in gastric cancer patients but cannot predict prognosis. Oncol Lett 2013; 6: 17331737 [PMID: 24260069 DOI: 10.3892/ol.2013.1626]
117 Wang W, Li F, Zhang Y, tu Y, Yang Q, Gao X. Reduced expression of miR22 in gastric cancer is related to clinicopathologic characteristics or patient prognosis. Diagn Pathol 2013; 8: 102 [PMID: 23786758 DOI: 10.1186/174615968102]
118 Yu X, Luo L, Wu Y, Yu X, Liu Y, Yu X, Zhao X, Zhang X, Cui L, Ye G, Le Y, Guo J. Gastric juice miR129 as a potential biomarker for screening gastric cancer. Med Oncol 2013; 30: 365 [PMID: 23307240 DOI: 10.1007/s120320120365y]
119 Chen B, Huang t, Jiang J, Lv L, Li H, Xia S. miR141 suppresses proliferation and motility of gastric cancer cells by targeting HDGF. Mol Cell Biochem 2014; 388: 211218 [PMID: 24276755 DOI: 10.1007/s1101001319123]
120 Chu D, Zhao Z, Li Y, Li J, Zheng J, Wang W, Zhao Q, Ji G. Increased microRNA630 expression in gastric cancer is associated with poor overall survival. PLoS One 2014; 9: e90526 [PMID: 24621930 DOI: 10.1371/journal.pone.0090526]
121 Fu Z, Qian F, Yang X, Jiang H, Chen Y, Liu S. Circulating miR222 in plasma and its potential diagnostic and prognostic value in gastric cancer. Med Oncol 2014; 31: 164 [PMID: 25129310 DOI: 10.1007/s1203201401648]
122 Gu W, Gao t, Shen J, Sun Y, Zheng X, Wang J, Ma J, Hu XY, Li J, Hu MJ. MicroRNA183 inhibits apoptosis and promotes proliferation and invasion of gastric cancer cells by targeting PDCD4. Int J Clin Exp Med 2014; 7: 25192529 [PMID: 25356105]
123 Huang D, Wang H, Liu R, Li H, Ge S, Bai M, Deng t, Yao G, Ba Y. miRNA27a is a biomarker for predicting chemosensitivity and prognosis in metastatic or recurrent gastric cancer. J Cell Biochem 2014; 115: 549556 [PMID: 24122958 DOI: 10.1002/jcb.24689]
124 Li BS, Zuo QF, Zhao YL, Xiao B, Zhuang Y, Mao XH, Wu C, Yang SM, Zeng H, Zou QM, Guo G. MicroRNA25 promotes gastric cancer migration, invasion and proliferation by directly targeting transducer of ERBB2, 1 and correlates with poor survival. Oncogene 2015; 34: 25562565 [PMID: 25043310 DOI: 10.1038/onc.2014.214]
125 Liu X, Yu H, Cai H, Wang Y. the expression and clinical significance of miR-132 in gastric cancer patients. Diagn Pathol 2014; 9: 57 [PMID: 24621117 DOI: 10.1186/17461596957]
126 Peng WZ, Ma R, Wang F, Yu J, Liu ZB. Role of miR191/425 cluster in tumorigenesis and diagnosis of gastric cancer. Int J Mol Sci 2014; 15: 40314048 [PMID: 24603541 DOI: 10.3390/ijms15034031]
127 Sun J, Song Y, Wang Z, Wang G, Gao P, Chen X, Gao Z, Xu H. Clinical significance of promoter region hypermethylation of microRNA148a in gastrointestinal cancers. Onco Targets Ther 2014; 7: 853863 [PMID: 24920927 DOI: 10.2147/ott.s60888]
128 Suzuki R, Yamamoto E, Nojima M, Maruyama R, Yamano
9851 September 14, 2015|Volume 21|Issue 34|WJG|www.wjgnet.com
Kanda M et al . Molecular diagnostics of GC
HO, Yoshikawa K, Kimura t, Harada t, Ashida M, Niinuma t, Sato A, Nosho K, Yamamoto H, Kai M, Sugai t, Imai K, Suzuki H, Shinomura Y. Aberrant methylation of microRNA34b/c is a predictive marker of metachronous gastric cancer risk. J Gastroenterol 2014; 49: 11351144 [PMID: 23942619 DOI: 10.1007/s0053501308617]
129 Tan Z, Jiang H, Wu Y, Xie L, Dai W, tang H, tang S. miR185 is an independent prognosis factor and suppresses tumor metastasis in gastric cancer. Mol Cell Biochem 2014; 386: 223231 [PMID: 24352663 DOI: 10.1007/s110100131860y]
130 Wang H, Wang L, Wu Z, Sun R, Jin H, Ma J, Liu L, Ling R, Yi J, Wang L, Bian J, Chen J, Li N, Yuan S, Yun J. three dysregulated microRNAs in serum as novel biomarkers for gastric cancer screening. Med Oncol 2014; 31: 298 [PMID: 25367852 DOI: 10.1007/s1203201402988]
131 Wang YW, Shi DB, Chen X, Gao C, Gao P. Clinicopathological significance of microRNA-214 in gastric cancer and its effect on cell biological behaviour. PLoS One 2014; 9: e91307 [PMID: 24614175 DOI: 10.1371/journal.pone.0091307]
132 Zeng Q, Jin C, Chen W, Xia F, Wang Q, Fan F, Du J, Guo Y, Lin C, Yang K, Li J, Peng X, Li X, Cao K. Downregulation of serum miR17 and miR106b levels in gastric cancer and benign gastric diseases. Chin J Cancer Res 2014; 26: 711716 [PMID: 25561770 DOI: 10.3978/j.issn.10009604.2014.12.03]
133 Zhang R, Wang W, Li F, Zhang H, Liu J. MicroRNA106b~25 expressions in tumor tissues and plasma of patients with gastric cancers. Med Oncol 2014; 31: 243 [PMID: 25218271 DOI: 10.1007/s120320140243x]
134 Zhu ED, Li N, Li BS, Li W, Zhang WJ, Mao XH, Guo G, Zou QM, Xiao B. miR30b, downregulated in gastric cancer, promotes apoptosis and suppresses tumor growth by targeting plasminogen activator inhibitor1. PLoS One 2014; 9: e106049 [PMID: 25170877 DOI: 10.1371/journal.pone.0106049]
135 Han TS, Hur K, Xu G, Choi B, Okugawa Y, toiyama Y, Oshima H, Oshima M, Lee HJ, Kim VN, Chang AN, Goel A, Yang HK. MicroRNA29c mediates initiation of gastric carcinogenesis by directly targeting ItGB1. Gut 2015; 64: 203214 [PMID: 24870620 DOI: 10.1136/gutjnl2013306640]
136 Xu YJ, Fan Y. MiR215/192 participates in gastric cancer progression. Clin Transl Oncol 2015; 17: 3440 [PMID: 24981590 DOI: 10.1007/s1209401411946]
137 Gaur A, Jewell DA, Liang Y, Ridzon D, Moore JH, Chen C, Ambros VR, Israel MA. Characterization of microRNA expression levels and their biological correlates in human cancer cell lines. Cancer Res 2007; 67: 24562468 [PMID: 17363563 DOI: 10.1158/00085472.can062698]
138 Wu J, Qian J, Li C, Kwok L, Cheng F, Liu P, Perdomo C, Kotton D, Vaziri C, Anderlind C, Spira A, Cardoso WV, Lü J. miR129 regulates cell proliferation by downregulating Cdk6 expression. Cell Cycle 2010; 9: 18091818 [PMID: 20404570]
139 Farhana L, Dawson MI, Murshed F, Das JK, Rishi AK, Fontana JA. Upregulation of miR150* and miR630 induces apoptosis in pancreatic cancer cells by targeting IGF1R. PLoS One 2013; 8: e61015 [PMID: 23675407 DOI: 10.1371/journal.pone.0061015]
140 Zhang Y, Ma M, Liu W, Ding W, Yu H. Enhanced expression of
long noncoding RNA CARLo5 is associated with the development of gastric cancer. Int J Clin Exp Pathol 2014; 7: 84718479 [PMID: 25674211]
141 Fatica A, Bozzoni I. Long noncoding RNAs: new players in cell differentiation and development. Nat Rev Genet 2014; 15: 721 [PMID: 24296535 DOI: 10.1038/nrg3606]
142 Dong L, Qi P, Xu MD, Ni SJ, Huang D, Xu QH, Weng WW, tan C, Sheng WQ, Zhou XY, Du X. Circulating CUDR, LSINCt5 and PtENP1 long noncoding RNAs in sera distinguish patients with gastric cancer from healthy controls. Int J Cancer 2015; Epub ahead of print [PMID: 25694351 DOI: 10.1002/ijc.29484]
143 Panzitt K, tschernatsch MM, Guelly C, Moustafa t, Stradner M, Strohmaier HM, Buck CR, Denk H, Schroeder R, trauner M, Zatloukal K. Characterization of HULC, a novel gene with striking upregulation in hepatocellular carcinoma, as noncoding RNA. Gastroenterology 2007; 132: 330342 [PMID: 17241883 DOI: 10.1053/j.gastro.2006.08.026]
144 Emadi-Andani E, Nikpour P, EmadiBaygi M, Bidmeshkipour A. Association of HOtAIR expression in gastric carcinoma with invasion and distant metastasis. Adv Biomed Res 2014; 3: 135 [PMID: 24949306 DOI: 10.4103/22779175.133278]
145 Hu Y, Wang J, Qian J, Kong X, tang J, Wang Y, Chen H, Hong J, Zou W, Chen Y, Xu J, Fang JY. Long noncoding RNA GAPLINC regulates CD44dependent cell invasiveness and associates with poor prognosis of gastric cancer. Cancer Res 2014; 74: 68906902 [PMID: 25277524 DOI: 10.1158/00085472.can140686]
146 Chen WM, Huang MD, Kong R, Xu tP, Zhang EB, Xia R, Sun M, De W, Shu YQ. Antisense Long Noncoding RNA HIF1AAS2 Is Upregulated in Gastric Cancer and Associated with Poor Prognosis. Dig Dis Sci 2015; 60: 16551662 [PMID: 25686741 DOI: 10.1007/s1062001535240]
147 Hu Y, Pan J, Wang Y, Li L, Huang Y. Long noncoding RNA lincUBC1 is negative prognostic factor and exhibits tumor prooncogenic activity in gastric cancer. Int J Clin Exp Pathol 2015; 8: 594600 [PMID: 25755750]
148 Kim T, Cui R, Jeon YJ, Lee JH, Lee JH, Sim H, Park JK, Fadda P, tili E, Nakanishi H, Huh MI, Kim SH, Cho JH, Sung BH, Peng Y, Lee tJ, Luo Z, Sun HL, Wei H, Alder H, Oh JS, Shim KS, Ko SB, Croce CM. Longrange interaction and correlation between MYC enhancer and oncogenic long noncoding RNA CARLo5. Proc Natl Acad Sci USA 2014; 111: 41734178 [PMID: 24594601 DOI: 10.1073/pnas.1400350111]
149 Thrash-Bingham CA, tartof KD. aHIF: a natural antisense transcript overexpressed in human renal cancer and during hypoxia. J Natl Cancer Inst 1999; 91: 143151 [PMID: 9923855]
150 Rossignol F, Vaché C, Clottes E. Natural antisense transcripts of hypoxiainducible factor 1alpha are detected in different normal and tumour human tissues. Gene 2002; 299: 135140 [PMID: 12459261]
151 Bertozzi D, Iurlaro R, Sordet O, Marinello J, Zaffaroni N, Capranico G. Characterization of novel antisense HIF-1α transcripts in human cancers. Cell Cycle 2011; 10: 31893197 [PMID: 21897117]
152 Resende C, thiel A, Machado JC, Ristimäki A. Gastric cancer: basic aspects. Helicobacter 2011; 16 Suppl 1: 3844 [PMID: 21896084 DOI: 10.1111/j.15235378.2011.00879.x]
P- Reviewer: Larentzakis A, Li Y S- Editor: Ma YJ L- Editor: A E- Editor: Ma S
9852 September 14, 2015|Volume 21|Issue 34|WJG|www.wjgnet.com
Kanda M et al . Molecular diagnostics of GC
Yu-Cheng Zhang, Science Research Center, China-Japan Union Hospital, Jilin University, Changchun 130033, Jilin Province, China
Zhuo Xu, Rehabilitation Department, China-Japan Union Hospital, Jilin University, Changchun 130033, Jilin Province, China
Tian-Fu Zhang, Stomatology Department, China-Japan Union Hospital, Jilin University, Changchun 130033, Jilin Province, China
Ya-Li Wang, Department of Blood Transfusion, China-Japan Union Hospital, Jilin University, Changchun 130033, Jilin Province, China
Author contributions: Zhang TF, Xu Z and Wang YL contributed equally to this work; Zhang YC designed and wrote the manuscript; Zhang TF, Xu Z and Wang YL researched the literature data and revised the paper.
Supported by Department of Public Health of Jilin Province of China, No. 2009Z080 and No. 2014Q025; and Supporting Program of Bethune Medical Research of Jilin University, No. 2013207058.
Conflict-of-interest statement: The authors have no conflicts of interest to report.
Open-Access: This article is an open-access article which was selected by an in-house editor and fully peer-reviewed by external reviewers. It is distributed in accordance with the Creative Commons Attribution Non Commercial (CC BY-NC 4.0) license, which permits others to distribute, remix, adapt, build upon this work non-commercially, and license their derivative works on different terms, provided the original work is properly cited and the use is non-commercial. See: http://creativecommons.org/licenses/by-nc/4.0/
Correspondence to: Ya-Li Wang, MD, PHD, Department of Blood Transfusion, China-Japan Union Hospital, Jilin University, Changchun 130033, Jilin Province, China. [email protected]: +86-431-84995423
Fax: +86-431-85166570
Received: April 26, 2015 Peer-review started: April 27, 2015First decision: June 2, 2015Revised: June 23, 2015 Accepted: July 18, 2015Article in press: July 18, 2015Published online: September 14, 2015
AbstractHepatocellular carcinoma (HCC) is an aggressive malignancy and the second leading cause of cancer-related deaths worldwide. Conventional biomarkers exhibit poor performance in the surveillance, diagnosis, and prognosis of HCC. MicroRNAs (miRNAs) are a class of evolutionarily conserved small non-coding RNAs that are involved in the regulation of gene expression and protein translation, and they play critical roles in cell growth, differentiation, and the development of various types of cancers, including HCC. Recent evidence revealed the role of miRNAs as potential novel and ideal biomarkers for HCC. miRNAs are released to extracellular spaces, and they are extremely stable in bodily fluids, including serum or plasma, where they are packaged into various microparticles or associated with RNA-binding proteins. Numerous studies have demonstrated that circulating miRNAs have potential applications as minimally invasive biomarkers for HCC diagnosis and prognosis. The present review highlights current understanding of miRNA biogenesis and the origins and types of circulating miRNAs. We summarize recent progress in the use of circulating miRNAs as diagnostic and prognostic biomarkers for HCC. We also discuss the challenges and perspectives of the clinical utility of circulating miRNAs in HCC.
Key words: Circulating microRNAs; Diagnosis; Prognosis;
Submit a Manuscript: http://www.wjgnet.com/esps/Help Desk: http://www.wjgnet.com/esps/helpdesk.aspxDOI: 10.3748/wjg.v21.i34.9853
9853 September 14, 2015|Volume 21|Issue 34|WJG|www.wjgnet.com
World J Gastroenterol 2015 September 14; 21(34): 9853-9862 ISSN 1007-9327 (print) ISSN 2219-2840 (online)
© 2015 Baishideng Publishing Group Inc. All rights reserved.
TOPIC HIGHLIGHT
Circulating microRNAs as diagnostic and prognostic tools for hepatocellular carcinoma
2015 Advances in Hepatocellular Carcinoma
Yu-Cheng Zhang, Zhuo Xu, Tian-Fu Zhang, Ya-Li Wang
Hepatocellular carcinoma; Biomarkers
© The Author(s) 2015. Published by Baishideng Publishing Group Inc. All rights reserved.
Core tip: MicroRNAs (miRNAs) play critical roles in cell growth, differentiation, and the development of hepatocellular carcinoma (HCC). The study of circulating miRNAs is a rapidly growing field of research, indicating the potential applications of miRNAs as minimally invasive biomarkers for HCC diagnosis, recurrence monitoring and prognosis. This review highlights current understanding of miRNA biogenesis and the origins and types of circulating miRNAs and summarizes recent progress in the study of circulating miRNAs as diagnostic and prognostic biomarkers for HCC. We also discuss the challenges and perspectives regarding the clinical utility of circulating miRNAs in HCC.
Zhang YC, Xu Z, Zhang TF, Wang YL. Circulating microRNAs as diagnostic and prognostic tools for hepatocellular carcinoma. World J Gastroenterol 2015; 21(34): 9853-9862 Available from: URL: http://www.wjgnet.com/1007-9327/full/v21/i34/9853.htm DOI: http://dx.doi.org/10.3748/wjg.v21.i34.9853
INTRODUCTIONHepatocellular carcinoma (HCC) is the seventh most common malignancy and the second leading cause of cancer-related deaths worldwide. Globally, there are approximately 750000 new cases and 700000 deaths of HCC reported per annum[1-3]. Two well-known risk factors for HCC are chronic viral hepatitis B (HBV) and C (HCV), which account for 80%-90% of all HCC cases worldwide. Other risks for HCC include obesity, diabetes, vitamin D deficiency, aflatoxin B1 exposure, alcoholic and non-alcoholic liver cirrhosis[4,5]. However, the underlying mechanism of HCC has not been entirely elucidated. Surgical resection and orthotopic liver transplantation are the best curative tools for the long-term survival of HCC patients. However, surgical resection is not feasible in more than 80% of HCC patients because of tumor location, tumor size or severity of the underlying liver disease. Only 5%-15% of HCC patients are potentially resectable[6,7]. The overall five-year survival rate in patients with HCC is very low, ranging from 5% to 9%. The cumulative five-year recurrence rate is approximately 70% to 80% even after curative surgical resection. Recurrence after resection generally results in a high rate of mortality[8]. Therefore, the most urgent needs are the identification of sensitive and specific markers for early diagnosis, the monitoring of recurrence and the prediction of prognosis for HCC.
Current methods for HCC diagnosis are classified into the following main categories: imaging [abdominal ultrasonography, magnetic resonance imaging (MRI),
and contrast-enhanced computed tomography (CT)] and laboratory biomarker analysis [serum alpha-fetoprotein (AFP) levels][9,10]. However, the diagnostic performance of imaging technologies is unsatisfactory, particularly for the diagnosis of small lesions and early-stage HCC[11,12]. AFP is the most commonly used tumor marker for HCC diagnosis and prognosis prediction, but the false negative rate using AFP level alone is as high as 40% for patients with early-stage HCC. AFP levels remain normal in 15%-30% of all the patients, even patients with advanced HCC[6,13]. Therefore, the American Association for the Study of Liver Disease Practice Guidelines discarded AFP for surveillance and diagnosis because of its low sensitivity (39%-64%) and specificity (76%-94%)[14]. Therefore, the identification of novel and ideal biomarkers with high specificity and sensitivity for HCC diagnosis is desperately needed. Circulating microRNAs (miRNAs) have received remarkable attention because they offer great advantages and good performance as novel biomarkers for HCC diagnosis and prognosis prediction[15].
Emerging evidence demonstrated that miRNAs are an important class of non-coding RNAs as tumor oncogenes or suppressors that are involved in the HCC development[16]. miRNAs are endogenous nucleotides that are found in intra- and extracellular spaces, such as blood, urine and saliva[15,17]. Cellular miRNAs are also released, detected and quantified in the blood[18]. Circulating miRNAs exhibit several obvious advantages as potentially novel and ideal diagnostic biomarkers, including significant stability in various types of body fluids, resistance to endogenous RNase digestion, low cost, ease of analysis, and sensitive detection methods, such as real-time quantitative polymerase chain reaction (qRT-PCR)[19-21]. The above characteristics of circulating miRNAs and the limitations of currently available non-invasive methods to monitor HCC indicate that circulating miRNAs are a rapidly growing field of research that hold great promise for the development of reliable biomarkers for the diagnosis and monitoring of HCC[6,20,22].
This review highlights miRNA biogenesis and the types and origins of circulating miRNAs, summarizes recent findings of circulating miRNAs as prognostic and predictive biomarkers for HCC, and addresses challenges and perspectives for the clinical utility of circulating miRNAs in HCC.
miRNA BIOGENESIS AND FUNCTIONmiRNAs are single-stranded, non-coding RNA strands of 19-25 nucleotides that regulate more than 50% of all protein-coding genes in mammals[23,24]. There are 1881 human miRNAs sequences registered in the miRBase database. The synthesis of miRNAs primarily consists of two steps, including nuclear synthesis within and outside of the nucleus[25] (Figure 1). First, RNA polymerase Ⅱ transcribes miRNAs in the nucleus
9854 September 14, 2015|Volume 21|Issue 34|WJG|www.wjgnet.com
Zhang YC et al . Circulating microRNAs for HCC diagnosis and prognosis
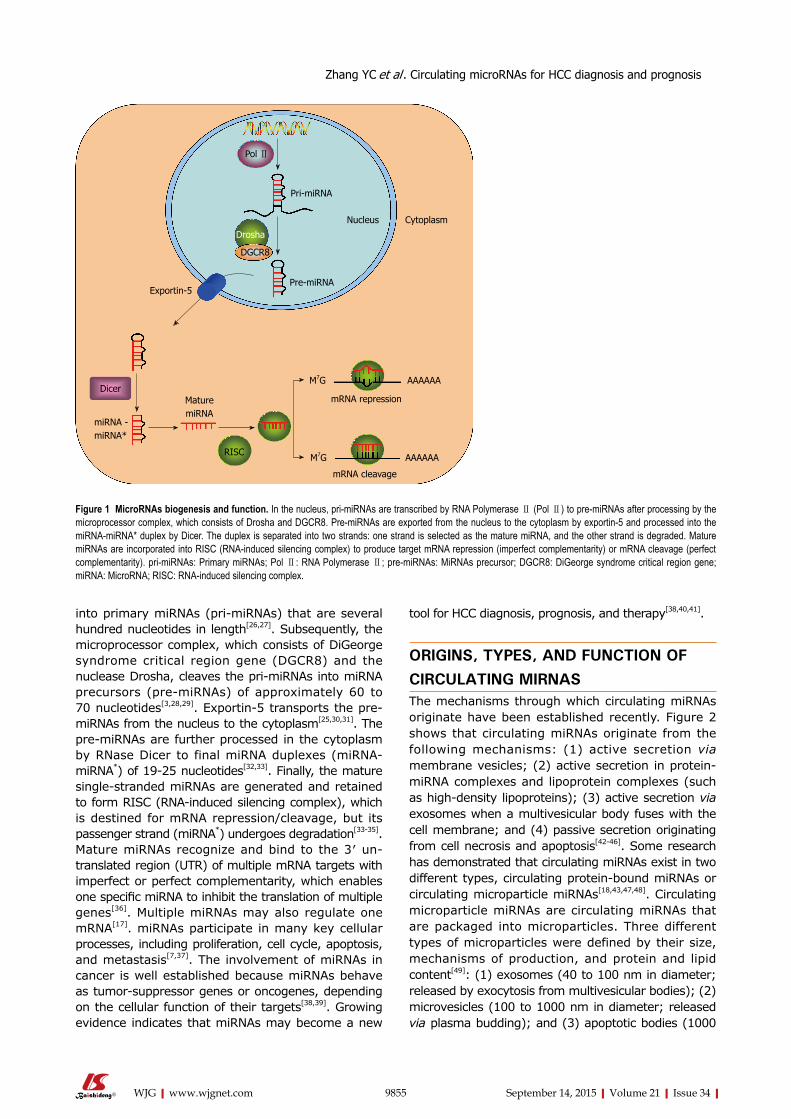
into primary miRNAs (pri-miRNAs) that are several hundred nucleotides in length[26,27]. Subsequently, the microprocessor complex, which consists of DiGeorge syndrome critical region gene (DGCR8) and the nuclease Drosha, cleaves the pri-miRNAs into miRNA precursors (pre-miRNAs) of approximately 60 to 70 nucleotides[3,28,29]. Exportin-5 transports the pre-miRNAs from the nucleus to the cytoplasm[25,30,31]. The pre-miRNAs are further processed in the cytoplasm by RNase Dicer to final miRNA duplexes (miRNA-miRNA*) of 19-25 nucleotides[32,33]. Finally, the mature single-stranded miRNAs are generated and retained to form RISC (RNA-induced silencing complex), which is destined for mRNA repression/cleavage, but its passenger strand (miRNA*) undergoes degradation[33-35]. Mature miRNAs recognize and bind to the 3′ un-translated region (UTR) of multiple mRNA targets with imperfect or perfect complementarity, which enables one specific miRNA to inhibit the translation of multiple genes[36]. Multiple miRNAs may also regulate one mRNA[17]. miRNAs participate in many key cellular processes, including proliferation, cell cycle, apoptosis, and metastasis[7,37]. The involvement of miRNAs in cancer is well established because miRNAs behave as tumor-suppressor genes or oncogenes, depending on the cellular function of their targets[38,39]. Growing evidence indicates that miRNAs may become a new
tool for HCC diagnosis, prognosis, and therapy[38,40,41].
ORIGINS, TYPES, AND FUNCTION OF CIRCULATING MIRNASThe mechanisms through which circulating miRNAs originate have been established recently. Figure 2 shows that circulating miRNAs originate from the following mechanisms: (1) active secretion via membrane vesicles; (2) active secretion in protein-miRNA complexes and lipoprotein complexes (such as high-density lipoproteins); (3) active secretion via exosomes when a multivesicular body fuses with the cell membrane; and (4) passive secretion originating from cell necrosis and apoptosis[42-46]. Some research has demonstrated that circulating miRNAs exist in two different types, circulating protein-bound miRNAs or circulating microparticle miRNAs[18,43,47,48]. Circulating microparticle miRNAs are circulating miRNAs that are packaged into microparticles. Three different types of microparticles were defined by their size, mechanisms of production, and protein and lipid content[49]: (1) exosomes (40 to 100 nm in diameter; released by exocytosis from multivesicular bodies); (2) microvesicles (100 to 1000 nm in diameter; released via plasma budding); and (3) apoptotic bodies (1000
9855 September 14, 2015|Volume 21|Issue 34|WJG|www.wjgnet.com
Figure 1 MicroRNAs biogenesis and function. In the nucleus, pri-miRNAs are transcribed by RNA Polymerase Ⅱ (Pol Ⅱ) to pre-miRNAs after processing by the microprocessor complex, which consists of Drosha and DGCR8. Pre-miRNAs are exported from the nucleus to the cytoplasm by exportin-5 and processed into the miRNA-miRNA* duplex by Dicer. The duplex is separated into two strands: one strand is selected as the mature miRNA, and the other strand is degraded. Mature miRNAs are incorporated into RISC (RNA-induced silencing complex) to produce target mRNA repression (imperfect complementarity) or mRNA cleavage (perfect complementarity). pri-miRNAs: Primary miRNAs; Pol Ⅱ: RNA Polymerase Ⅱ; pre-miRNAs: MiRNAs precursor; DGCR8: DiGeorge syndrome critical region gene; miRNA: MicroRNA; RISC: RNA-induced silencing complex.
Zhang YC et al . Circulating microRNAs for HCC diagnosis and prognosis
Pol Ⅱ
Pri-miRNA
Nucleus Cytoplasm
Drosha
DGCR8
Pre-miRNA Exportin-5
Dicer
miRNA - miRNA*
Mature miRNA
RISC
mRNA cleavage
mRNA repression
M7G AAAAAA
M7G AAAAAA
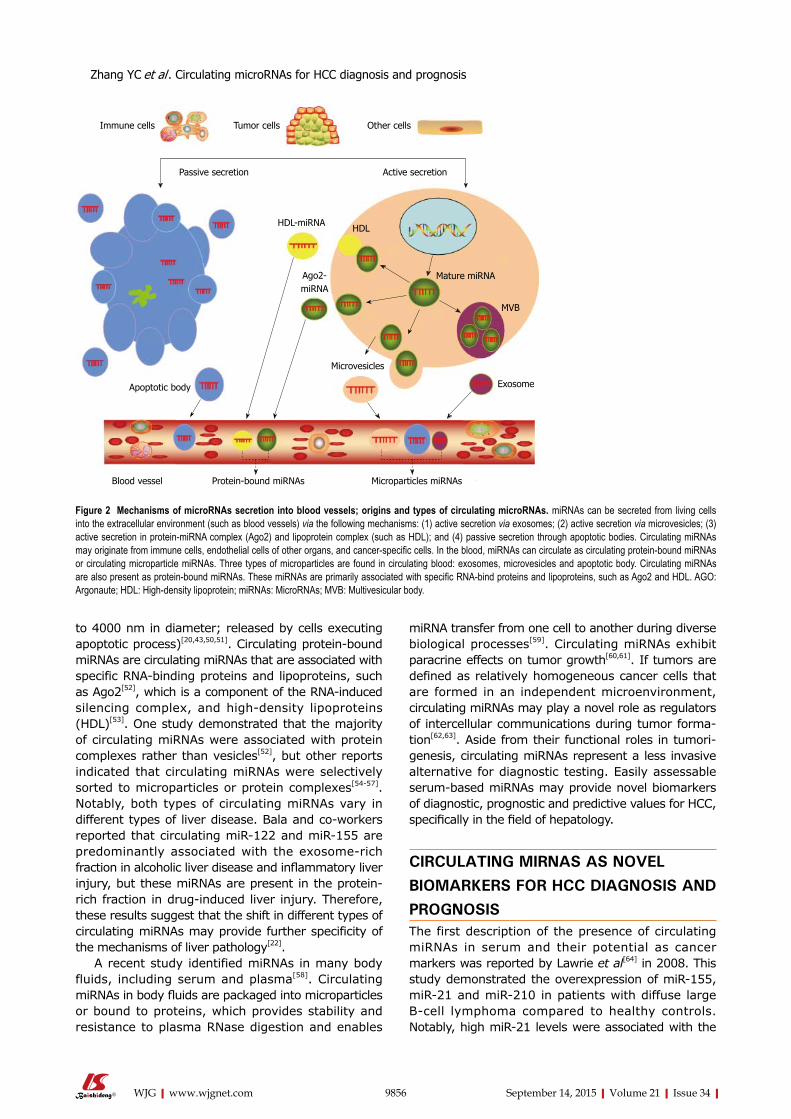
9856 September 14, 2015|Volume 21|Issue 34|WJG|www.wjgnet.com
miRNA transfer from one cell to another during diverse biological processes[59]. Circulating miRNAs exhibit paracrine effects on tumor growth[60,61]. If tumors are defined as relatively homogeneous cancer cells that are formed in an independent microenvironment, circulating miRNAs may play a novel role as regulators of intercellular communications during tumor forma-tion[62,63]. Aside from their functional roles in tumori-genesis, circulating miRNAs represent a less invasive alternative for diagnostic testing. Easily assessable serum-based miRNAs may provide novel biomarkers of diagnostic, prognostic and predictive values for HCC, specifically in the field of hepatology.
CIRCULATING MIRNAS AS NOVEL BIOMARKERS FOR HCC DIAGNOSIS AND PROGNOSISThe first description of the presence of circulating miRNAs in serum and their potential as cancer markers was reported by Lawrie et al[64] in 2008. This study demonstrated the overexpression of miR-155, miR-21 and miR-210 in patients with diffuse large B-cell lymphoma compared to healthy controls. Notably, high miR-21 levels were associated with the
to 4000 nm in diameter; released by cells executing apoptotic process)[20,43,50,51]. Circulating protein-bound miRNAs are circulating miRNAs that are associated with specific RNA-binding proteins and lipoproteins, such as Ago2[52], which is a component of the RNA-induced silencing complex, and high-density lipoproteins (HDL)[53]. One study demonstrated that the majority of circulating miRNAs were associated with protein complexes rather than vesicles[52], but other reports indicated that circulating miRNAs were selectively sorted to microparticles or protein complexes[54-57]. Notably, both types of circulating miRNAs vary in different types of liver disease. Bala and co-workers reported that circulating miR-122 and miR-155 are predominantly associated with the exosome-rich fraction in alcoholic liver disease and inflammatory liver injury, but these miRNAs are present in the protein-rich fraction in drug-induced liver injury. Therefore, these results suggest that the shift in different types of circulating miRNAs may provide further specificity of the mechanisms of liver pathology[22].
A recent study identified miRNAs in many body fluids, including serum and plasma[58]. Circulating miRNAs in body fluids are packaged into microparticles or bound to proteins, which provides stability and resistance to plasma RNase digestion and enables
Immune cells Tumor cells Other cells
Passive secretion Active secretion
HDL-miRNA
Ago2-miRNA
HDL
Mature miRNA
MVB
Microvesicles
ExosomeApoptotic body
Blood vessel Protein-bound miRNAs Microparticles miRNAs
Figure 2 Mechanisms of microRNAs secretion into blood vessels; origins and types of circulating microRNAs. miRNAs can be secreted from living cells into the extracellular environment (such as blood vessels) via the following mechanisms: (1) active secretion via exosomes; (2) active secretion via microvesicles; (3) active secretion in protein-miRNA complex (Ago2) and lipoprotein complex (such as HDL); and (4) passive secretion through apoptotic bodies. Circulating miRNAs may originate from immune cells, endothelial cells of other organs, and cancer-specific cells. In the blood, miRNAs can circulate as circulating protein-bound miRNAs or circulating microparticle miRNAs. Three types of microparticles are found in circulating blood: exosomes, microvesicles and apoptotic body. Circulating miRNAs are also present as protein-bound miRNAs. These miRNAs are primarily associated with specific RNA-bind proteins and lipoproteins, such as Ago2 and HDL. AGO: Argonaute; HDL: High-density lipoprotein; miRNAs: MicroRNAs; MVB: Multivesicular body.
Zhang YC et al . Circulating microRNAs for HCC diagnosis and prognosis
9857 September 14, 2015|Volume 21|Issue 34|WJG|www.wjgnet.com
relapse-free survival of these patients[60]. Multiple studies identified circulating miRNAs as diagnostic and prognostic markers for a wide range of malignancies, which primarily used blood plasma or serum for their analyses[48].
Evidence also suggests that miRNAs are widely involved in HCC carcinogenesis, differentiation and metastasis. Aberrant miRNA expression was reported in HCC patients and cell lines. More information on aberrant miRNA expression in HCC is available in comprehensive reviews[3,40]. Therefore, circulating miRNAs should be affected during HCC development and progression. Various reports demonstrated the potential clinical application of circulating miRNAs in HCC diagnosis and prognosis.
Single circulating miRNAs as biomarkers for HCC diagnosisThe identification of a single or several individual circulating miRNAs as biomarkers for HCC diagnosis is expected. This approach has a unique advantage because it is much simpler and more straightforward compared to the detection of all circulating miRNAs. For example, miR-122 in the liver was the most abundant liver-specific miRNA, and it accounted for 70% of the total hepatic miRNAs[65]. MiR-122 plays a critical role in liver homeostasis and hepatocarcinogenesis[66]. Xu et al[67] and Qi et al[68] found elevated levels of circulating miR-122 in patients with HCC compared to healthy individuals. Qi et al[68] revealed that serum miR-122 was a potential marker for the discrimination of HCC patients from healthy controls with an AUC (the area under the receiver operating characteristic curve) of 0.869, and a cut-off value of 0.475. The sensitivity and specificity for serum miR-122 were 81.6% and 83.3%, respectively. Xu et al[67] found similar results. These results suggest that circulating miR-122, which is a liver-specific miRNA, may serve as a potential marker for HCC diagnosis. MiR-21 is also a promising biochemical biomarker for HCC diagnosis because plasma levels of miR-21 are notably higher in HCC patients than in healthy volunteers and patients with chronic hepatitis[69]. Zhang et al[6] demonstrated that serum miR-143 and miR-215 were valuable biomarkers to distinguish HCC from healthy controls with an AUC of 0.795 (sensitivity and specificity were 71% and 83%, respectively) and 0.816 (sensitivity and specificity were 80% and 91%, respectively), respectively.
However, the specificity of the detection method for a single or several individual HCC-related circulating miRNAs is relatively poor. For example, increased levels of circulating miRNA-122 are found in HCC, HBV infection[70], HCV infection[71], non-alcoholic fatty-liver disease[72], liver cirrhosis[67], and alcohol-related liver disease[73]. Xu et al[67] and Qi et al[68] suggest that serum miR-122 is a potential marker for the discrimination of HCC patients from healthy
controls, but not HCC patients from patients with chronic hepatitis. Therefore, these authors proposed serum miR-122 as a novel biomarker for liver injury but not specifically for HCC. HCC is a highly complex, multifactorial and heterogeneous disease, and numerous miRNAs are dysregulated during HCC onset and progression. Therefore, a combination of multiple circulating miRNAs or a plasma/serum miRNA panel instead of a single circulating miRNA may offer more specificity and sensitivity as biomarkers for HCC diagnosis and prognosis prediction.
Plasma/serum miRNA panel as biomarkers for HCC diagnosisJiang et al[74] demonstrated that three serum miRNAs (miR-10b, miR-106b, and miR-181a) discriminated HCC patients from normal controls (AUC of 0.85, 0.82, and 0.89, respectively). However, the ability of single serum miRNA to differentiate CLD patients from normal controls was not satisfactory. This report indicated that the panel of three serum miRNAs displayed better performance compared to a single serum miRNA assay, with an AUC of 0.94 in discriminating HCC patients from normal controls and 0.91 in discriminating HCC patients from CLD.
Tan et al[12] preformed a study of 667 subjects (261 HCC patients, 233 cirrhosis patients, and 173 healthy controls) to identify a serum miRNA panel for use as biomarkers in the diagnosis of HBV-related HCC. Tan et al[12] first used sequencing to analyze miRNAs that were differently expressed in serum samples obtained from three patients with HBV-related HCC compared to sera from three cirrhosis patients, and three healthy controls. Secondly, differently expressed miRNAs were validated using qRT-PCR in 20 HBV-related HCC patients, 20 cirrhosis patients and 20 healthy controls in the biomarker selection stage. Subsequently, 135 HBV-related HCC patients, 132 cirrhosis patients and 90 healthy controls formed a training set. Finally, the established serum miRNA panel was tested in an independent cohort in the validation phase (103 HBV-related HCC patients, 78 cirrhosis patients, and 60 healthy controls). These data identified eight miRNAs (miR-206, miR-141-3p, miR-433-3p, miR-1228-5p, miR-199a-5p, miR-122-5p, miR-192-5p, and miR-26a-5p) and established a serum miRNA panel that provided high diagnostic accuracy for HCC (AUC = 0.887 and 0.879 for training and validation sets, respectively). These results demonstrated that a serum miRNA panel could differentiate HBV-related HCC from healthy controls (AUC = 0.893) and cirrhosis (AUC = 0.892) with a high degree of accuracy.
Similarly, Zhou et al[75] also attempted to identify a plasma miRNA panel for the diagnosis of HBV-related HCC. This study investigated 934 participants (healthy, chronic hepatitis B, cirrhosis, and HBV-related HCC). First, Zhou et al[75] used microarrays to screen 723 miRNAs in 137 plasma samples for the diagnosis of
Zhang YC et al . Circulating microRNAs for HCC diagnosis and prognosis
9858 September 14, 2015|Volume 21|Issue 34|WJG|www.wjgnet.com
HCC in the discovery stage. Fifteen candidate miRNAs that were discovered via microarray were selected for further testing using qRT-PCR from 102 participants in the training stage. Seven miRNAs that were differentially expressed between the HCC and control groups (healthy, chronic hepatitis B, and cirrhosis) were further tested in an additional 305 participants. Finally, seven miRNAs were used to predict the probability of HCC diagnosis in an independent cohort of 390 patients in the validation phase. The results demonstrated that the plasma miRNA panel (miR-122, miR-192, miR-21, miR-223, miR-26a, miR-27a, and miR-801) provided a high diagnostic accuracy of HCC (AUC = 0.864 and 0.888 for training and validation data set, respectively), and it differentiated HCC from healthy controls (AUC = 0.941), chronic hepatitis B (AUC = 0.842), and cirrhosis (AUC = 0.884), respectively.
Combination of serum/plasma miRNAs with AFP for HCC diagnosisAFP is the most widely used and broadly known biomarker for HCC diagnosis, and the combination of AFP measurement and ultrasound at 6-mo intervals are the standard tools for the diagnosis and monitoring of HCC in China. However, the sensitivity and specificity of serum AFP levels are relatively unsatisfactory, especially for AFP-negative HCC and small-size HCC (< 3 cm). The testing of AFP levels was dropped from current surveillance guidelines in Europe and the United States because of its low sensitivity and specificity[12,76,77]. AFP is not an ideal biomarker for HCC, but some reports demonstrated that a combination of serum/plasma miRNAs with alkaline phosphatase (ALP) may be beneficial in HCC patients and improve the sensitivity and specificity of liver cancer diagnosis.
For example, Tomimaru et al[69] measured plasma miR-21 level using qRT-PCR in 126 HCC patients, 30 chronic hepatitis patients, and 50 healthy volunteers. Their results suggested that miR-21 levels were higher in HCC patients than in chronic hepatitis patients (AUC of 77.3; sensitivity of 61.1% and specificity of 83.3%) and healthy volunteers (AUC of 95.3; sensitivity of 87.3% and specificity of 96%). Notably, the combination of plasma miR-21 with AFP improved the differentiation power between HCC patients and patients with chronic hepatitis (AUC of 0.823; sensitivity of 81.0% and specificity of 80.0%) and healthy volunteers (AUC to 0.971; sensitivity of 92.9% and specificity of 94.0%). Qu et al[78] analyzed serum levels of three miRNAs, namely miR-16, miR-195, and miR-199a, either alone or in combination with conventional serum markers (AFP, ALP-L3 and DCP) to differentiate HCC from CLDs. These authors suggested that miR-16 was a more sensitive biomarker for HCC, and the combination of miR-16, AFP, AFP-L3, and DCP identified 92.4% of HCC cases with a high specificity (78.5%). These results demonstrated that the
combination of serum/plasma miRNAs with already established markers (such as AFP) may improve the performance of HCC diagnosis.
Circulating miRNAs as prognostic biomarkers for HCCCirculating miRNAs may also aid the prediction of HCC prognosis. For example, Xu et al[4] analyzed the prognostic role of serum miR-122 levels in 122 HCC patients, and their results revealed a higher overall survival rate in HCC patients with high serum miR-122 levels compared to low miR-122 levels. They also found that high serum miR-122 levels were independently associated with higher overall survival rates in HCC patients. These outcomes suggest that a high serum miR-122 level is a good biomarker of prognosis in HCC patients. Köberle et al[79] also found that HCC patients with higher miR-122 serum levels exhibited longer overall survival than individuals with lower miR-122 serum concentrations, but the serum miR-122 level was not independently associated with overall survival. However, Köberle et al[79] suggested that miR-1 serum levels were independently associated with overall survival, but miR-1 serum levels exhibited no relevant correlation with clinical chemistry liver parameters. Their data indicated that serum miR-1 might improve the predictive value of classical HCC staging scores. Li et al[80] found that high levels of miR-221 expression correlated with tumor size, cirrhosis and tumor stage in HCC patients. Their results also suggested that the overall survival rate of the high miR-221 expression group was significantly lower than that of the low miR-221 expression group. Therefore, serum miR-221 also might provide predictive significance for the prognosis of HCC patients.
Collectively, these data illustrate that circulating miRNAs may be used as non-invasive biomarkers for the diagnosis and prognosis of HCC, and these nucleotides may become promising next-generation biomarkers for HCC detection. The data described above are summarized in Table 1.
CONCLUSIONThe use of circulating miRNAs as biomarkers for HCC has received attention since the first circulating miRNAs signatures were reported as potential diagnostic tools in oncology in 2008. This review highlights the process of miRNAs biogenesis and elaborates the origins and types of circulating miRNAs. Notably, we have summarized recent advances in circulating miRNAs signatures as non-invasive biomarkers in the diagnosis and prognosis of HCC. Overall, our review illustrates the potential application of circulating miRNAs, either as a single marker or as a panel of circulating miRNAs or in combination with conventional markers, as biomarkers for HCC diagnosis and prognosis predictions.
Encouraging progress in the use of circulating miRNAs in HCC diagnosis and prognosis has been
Zhang YC et al . Circulating microRNAs for HCC diagnosis and prognosis
9859 September 14, 2015|Volume 21|Issue 34|WJG|www.wjgnet.com
made, and circulating miRNAs are extremely promising biomarkers. However, there are no clinically used miRNAs biomarkers for HCC, and further investigation is required to overcome some of the challenges in their application. First, the origin of circulating miRNAs has not been fully elucidated. Circulating miRNAs in serum/plasma have a heterogeneous origin, including from blood cells, endothelia cells, and other high blood-flow organs, which demonstrates that the expression of tumor-specific miRNA signatures may be masked by circulating miRNAs from other origins[19,81-83]. Another issue is that well-standardized protocols are not implemented for pre-analytical decisions of circulating miRNAs (e.g., sample storage, sample processing, the profiling method) to post-analytical processing (e.g., data normalization), which makes definitive comparisons between studies difficult[43,84]. Unfortunately, there is no widely accepted endogenous normalization control for circulating miRNAs, despite the use of qRT-PCR, which is the most commonly used technology for the detection of miRNAs in circulation. Furthermore, most miRNAs studies use small sample
sizes, limited number of screened miRNAs, fail to differentiate HCC from hepatitis B and C, and lack large-scale prospective studies[9,20,74]. Moreover, much work is also required to compare values of circulating protein-bound miRNAs and microparticle miRNAs in different HCC patients. Finally, it is very important to use appropriate controls that are well matched in age, race, gender, etiology and severity of underlying liver disease when evaluating the sensitivity and specificity of circulating miRNAs for the diagnosis and monitoring of HCC[20,85,86].
Research on circulating miRNAs is in its infancy, and there are some challenges in the clinical application of circulating miRNAs. However, an improved understanding of the origins, stability, detection methods, and roles of circulating miRNAs in HCC will support the great potential of circulating miRNAs to become diagnostic and prognostic tools for HCC in the future.
REFERENCES1 Maluccio M, Covey A. Recent progress in understanding, diag-
Table 1 Circulating microRNAs as diagnostic and prognostic biomarkers for hepatocellular carcinoma
MicroRNAs Diagnosis/prognosis
Up/downregulated in plasma/serum
Plasma/serum Relevance Ref.
miR-12 Yes/No Upregulated Serum Compared with healthy control [67]miR-122 Yes/No Upregulated Serum [67]miR-223 Yes/No Upregulated Serum [67]miR-122 Yes/No Upregulated Serum Compared with healthy control [68]miR-21 Yes/No Upregulated Plasma Compared with chronic hepatitis or healthy control [69]miR-143 Yes/No Upregulated Serum Compared with healthy control [6]miR-215 Yes/No Upregulated Serum [6]miR-10b Yes/No Upregulated Serum Compared with CLD or healthy control [74]miR-106b Yes/No Upregulated Serum [74]miR-181a Yes/No Downregulated Serum [74]miR-206 Yes/No Upregulated Serum HBV-related HCC compared with cirrhosis or healthy
control[12]
miR-141-3p Yes/No Upregulated Serum [12]miR-433-3p Yes/No Upregulated Serum [12]miR-1228-5p Yes/No Upregulated Serum [12]miR-199a-5p Yes/No Downregulated Serum [12]miR-122-5p Yes/No Downregulated Serum [12]miR-192-5p Yes/No Downregulated Serum [12]miR-26a-5p Yes/No Downregulated Serum [12]miR-122 Yes/No Downregulated Plasma HBV-related HCC compared with chronic hepatitis B or
healthy control[75]
miR-192 Yes/No Upregulated Plasma [75]miR-21 Yes/No Upregulated Plasma [75]miR-223 Yes/No Downregulated Plasma [75]miR-26a Yes/No Downregulated Plasma [75]miR-27a Yes/No Downregulated Plasma [75]miR-801 Yes/No Upregulated Plasma [75]miR-16 Yes/No Downregulated Serum Compared with CLD or healthy control [78]miR-21 Yes/No Upregulated Plasma Compared with chronic hepatitis or healthy volunteers [69]miR-375d Yes/No Downregulated Serum Compared with healthy control [87]miR-199a-3p Yes/No Downregulated [87]miR-30c-5p Yes/No Upregulated Serum HCV-related HCC compared with healthy control [15]miR-223-3p Yes/No Downregulated Serum [15]miR-302c-3p Yes/No Upregulated Serum [15]miR-17-5p Yes/No Upregulated Serum [15]miR-122 No/Yes Upregulated Serum Improved overall survival [4]miR-1 No/Yes Upregulated Serum Improved overall survival [79]miR-221 No/Yes Upregulated Serum High serum miR-221 levels decreased survival rate [81]
miRNAs: MicroRNAs; CLD: Chronic liver disease; HCC: Hepatocellular carcinoma; HBV: Hepatitis B virus; HCV: Hepatitis C virus.
Zhang YC et al . Circulating microRNAs for HCC diagnosis and prognosis
9860 September 14, 2015|Volume 21|Issue 34|WJG|www.wjgnet.com
nosing, and treating hepatocellular carcinoma. CA Cancer J Clin 2012; 62: 394-399 [PMID: 23070690 DOI: 10.3322/caac.21161]
2 Zhang Y, Wang Y, Du Z, Wang Q, Wu M, Wang X, Wang L, Cao L, Hamid AS, Zhang G. Recombinant human decorin suppresses liver HepG2 carcinoma cells by p21 upregulation. Onco Targets Ther 2012; 5: 143-152 [PMID: 22927763 DOI: 10.2147/OTT.S32918]
3 Borel F, Konstantinova P, Jansen PL. Diagnostic and therapeutic potential of miRNA signatures in patients with hepatocellular carcinoma. J Hepatol 2012; 56: 1371-1383 [PMID: 22314424 DOI: 10.1016/j.jhep.2011.11.026]
4 Xu Y, Bu X, Dai C, Shang C. High serum microRNA-122 level is independently associated with higher overall survival rate in hepatocellular carcinoma patients. Tumour Biol 2015; 36: 4773-4776 [PMID: 25636448 DOI: 10.1007/s13277-015-3128-5]
5 Hamid AS, Tesfamariam IG, Zhang Y, Zhang ZG. Aflatoxin B1-induced hepatocellular carcinoma in developing countries: Geographical distribution, mechanism of action and prevention. Oncol Lett 2013; 5: 1087-1092 [PMID: 23599745 DOI: 10.3892/ol.2013.1169]
6 Zhang ZQ, Meng H, Wang N, Liang LN, Liu LN, Lu SM, Luan Y. Serum microRNA 143 and microRNA 215 as potential biomarkers for the diagnosis of chronic hepatitis and hepatocellular carcinoma. Diagn Pathol 2014; 9: 135 [PMID: 24993656 DOI: 10.1186/1746-1596-9-135]
7 Yang Z, Miao R, Li G, Wu Y, Robson SC, Yang X, Zhao Y, Zhao H, Zhong Y. Identification of Recurrence Related microRNAs in Hepatocellular Carcinoma after Surgical Resection. Int J Mol Sci 2013; 14: 1105-1118 [PMID: 23299437 DOI: 10.3390/ijms14011105]
8 Kumamoto T, Tanaka K, Matsuo K, Takeda K, Nojiri K, Mori R, Taniguchi K, Matsuyama R, Ueda M, Akiyama H, Ichikawa Y, Ota M, Endo I. Adjuvant hepatic arterial infusion chemotherapy with 5-Fluorouracil and interferon after curative resection of hepatocellular carcinoma: a preliminary report. Anticancer Res 2013; 33: 5585-5590 [PMID: 24324102]
9 Yin W, Zhao Y, Ji YJ, Tong LP, Liu Y, He SX, Wang AQ. Serum/plasma microRNAs as biomarkers for HBV-related hepatocellular carcinoma in China. Biomed Res Int 2015; 2015: 965185 [PMID: 25688372 DOI: 10.1155/2015/965185]
10 Scaggiante B, Kazemi M, Pozzato G, Dapas B, Farra R, Grassi M, Zanconati F, Grassi G. Novel hepatocellular carcinoma molecules with prognostic and therapeutic potentials. World J Gastroenterol 2014; 20: 1268-1288 [PMID: 24574801 DOI: 10.3748/wjg.v20.i5.1268]
11 Murakami T, Kim T, Oi H, Nakamura H, Igarashi H, Matsushita M, Okamura J, Kozuka T. Detectability of hypervascular hepatocellular carcinoma by arterial phase images of MR and spiral CT. Acta Radiol 1995; 36: 372-376 [PMID: 7619614]
12 Tan Y, Ge G, Pan T, Wen D, Chen L, Yu X, Zhou X, Gan J. A serum microRNA panel as potential biomarkers for hepatocellular carcinoma related with hepatitis B virus. PLoS One 2014; 9: e107986 [PMID: 25238238 DOI: 10.1371/journal.pone.0107986]
13 Volk ML, Hernandez JC, Su GL, Lok AS, Marrero JA. Risk factors for hepatocellular carcinoma may impair the performance of biomarkers: a comparison of AFP, DCP, and AFP-L3. Cancer Biomark 2007; 3: 79-87 [PMID: 17522429]
14 Zinkin NT, Grall F, Bhaskar K, Otu HH, Spentzos D, Kalmowitz B, Wells M, Guerrero M, Asara JM, Libermann TA, Afdhal NH. Serum proteomics and biomarkers in hepatocellular carcinoma and chronic liver disease. Clin Cancer Res 2008; 14: 470-477 [PMID: 18223221 DOI: 10.1158/1078-0432.CCR-07-0586]
15 Oksuz Z, Serin MS, Kaplan E, Dogen A, Tezcan S, Aslan G, Emekdas G, Sezgin O, Altintas E, Tiftik EN. Serum microRNAs; miR-30c-5p, miR-223-3p, miR-302c-3p and miR-17-5p could be used as novel non-invasive biomarkers for HCV-positive cirrhosis and hepatocellular carcinoma. Mol Biol Rep 2015; 42: 713-720 [PMID: 25391771 DOI: 10.1007/s11033-014-3819-9]
16 Zhu Z, Zhang X, Wang G, Zheng H. Role of MicroRNAs in Hepatocellular Carcinoma. Hepat Mon 2014; 14: e18672 [PMID: 25337143 DOI: 10.5812/hepatmon.18672]
17 Fujita Y, Kuwano K, Ochiya T, Takeshita F. The impact of
extracellular vesicle-encapsulated circulating microRNAs in lung cancer research. Biomed Res Int 2014; 2014: 486413 [PMID: 25295261 DOI: 10.1155/2014/486413]
18 Roderburg C, Luedde T. Circulating microRNAs as markers of liver inflammation, fibrosis and cancer. J Hepatol 2014; 61: 1434-1437 [PMID: 25306489 DOI: 10.1016/j.jhep.2014.07.017]
19 Schwarzenbach H, Nishida N, Calin GA, Pantel K. Clinical relevance of circulating cell-free microRNAs in cancer. Nat Rev Clin Oncol 2014; 11: 145-156 [PMID: 24492836 DOI: 10.1038/nrclinonc.2014.5]
20 Arrese M, Eguchi A, Feldstein AE. Circulating microRNAs: emerging biomarkers of liver disease. Semin Liver Dis 2015; 35: 43-54 [PMID: 25632934 DOI: 10.1055/s-0034-1397348]
21 Mitchell PS, Parkin RK, Kroh EM, Fritz BR, Wyman SK, Pogosova-Agadjanyan EL, Peterson A, Noteboom J, O’Briant KC, Allen A, Lin DW, Urban N, Drescher CW, Knudsen BS, Stirewalt DL, Gentleman R, Vessella RL, Nelson PS, Martin DB, Tewari M. Circulating microRNAs as stable blood-based markers for cancer detection. Proc Natl Acad Sci USA 2008; 105: 10513-10518 [PMID: 18663219 DOI: 10.1073/pnas.0804549105]
22 Bala S, Petrasek J, Mundkur S, Catalano D, Levin I, Ward J, Alao H, Kodys K, Szabo G. Circulating microRNAs in exosomes indicate hepatocyte injury and inflammation in alcoholic, drug-induced, and inflammatory liver diseases. Hepatology 2012; 56: 1946-1957 [PMID: 22684891 DOI: 10.1002/hep.25873]
23 Krol J, Loedige I, Filipowicz W. The widespread regulation of microRNA biogenesis, function and decay. Nat Rev Genet 2010; 11: 597-610 [PMID: 20661255 DOI: 10.1038/nrg2843]
24 Tan YL, Chen WN. MicroRNAs as therapeutic strategy for hepatitis B virus-associated hepatocellular carcinoma: current status and future prospects. World J Gastroenterol 2014; 20: 5973-5986 [PMID: 24876720 DOI: 10.3748/wjg.v20.i20.5973]
25 Chu R, Mo G, Duan Z, Huang M, Chang J, Li X, Liu P. miRNAs affect the development of hepatocellular carcinoma via dysregulation of their biogenesis and expression. Cell Commun Signal 2014; 12: 45 [PMID: 25012758 DOI: 10.1186/s12964-014-0045-y]
26 Piontek K, Selaru FM. MicroRNAs in the biology and diagnosis of cholangiocarcinoma. Semin Liver Dis 2015; 35: 55-62 [PMID: 25632935 DOI: 10.1055/s-0034-1397349]
27 Saini HK, Griffiths-Jones S, Enright AJ. Genomic analysis of human microRNA transcripts. Proc Natl Acad Sci USA 2007; 104: 17719-17724 [PMID: 17965236 DOI: 10.1073/pnas.0703890104]
28 Denli AM, Tops BB, Plasterk RH, Ketting RF, Hannon GJ. Processing of primary microRNAs by the Microprocessor complex. Nature 2004; 432: 231-235 [PMID: 15531879 DOI: 10.1038/nature03049]
29 Lee Y, Ahn C, Han J, Choi H, Kim J, Yim J, Lee J, Provost P, Rådmark O, Kim S, Kim VN. The nuclear RNase III Drosha initiates microRNA processing. Nature 2003; 425: 415-419 [PMID: 14508493 DOI: 10.1038/nature01957]
30 Lund E, Güttinger S, Calado A, Dahlberg JE, Kutay U. Nuclear export of microRNA precursors. Science 2004; 303: 95-98 [PMID: 14631048 DOI: 10.1126/science.1090599]
31 Okada C, Yamashita E, Lee SJ, Shibata S, Katahira J, Nakagawa A, Yoneda Y, Tsukihara T. A high-resolution structure of the pre-microRNA nuclear export machinery. Science 2009; 326: 1275-1279 [PMID: 19965479 DOI: 10.1126/science.1178705]
32 Hammond SM, Bernstein E, Beach D, Hannon GJ. An RNA-directed nuclease mediates post-transcriptional gene silencing in Drosophila cells. Nature 2000; 404: 293-296 [PMID: 10749213 DOI: 10.1038/35005107]
33 Bernstein E, Caudy AA, Hammond SM, Hannon GJ. Role for a bidentate ribonuclease in the initiation step of RNA interference. Nature 2001; 409: 363-366 [PMID: 11201747 DOI: 10.1038/35053110]
34 Kalla R, Ventham NT, Kennedy NA, Quintana JF, Nimmo ER, Buck AH, Satsangi J. MicroRNAs: new players in IBD. Gut 2015; 64: 504-517 [PMID: 25475103 DOI: 10.1136/gutjnl-2014-307891]
35 Gregory RI, Chendrimada TP, Cooch N, Shiekhattar R. Human RISC couples microRNA biogenesis and posttranscriptional gene
Zhang YC et al . Circulating microRNAs for HCC diagnosis and prognosis
9861 September 14, 2015|Volume 21|Issue 34|WJG|www.wjgnet.com
silencing. Cell 2005; 123: 631-640 [PMID: 16271387 DOI: 10.1016/j.cell.2005.10.022]
36 Andersen HH, Duroux M, Gazerani P. MicroRNAs as modulators and biomarkers of inflammatory and neuropathic pain conditions. Neurobiol Dis 2014; 71: 159-168 [PMID: 25119878 DOI: 10.1016/j.nbd.2014.08.003]
37 Ambros V. The functions of animal microRNAs. Nature 2004; 431: 350-355 [PMID: 15372042 DOI: 10.1038/nature02871]
38 Giordano S, Columbano A. MicroRNAs: new tools for diagnosis, prognosis, and therapy in hepatocellular carcinoma? Hepatology 2013; 57: 840-847 [PMID: 23081718 DOI: 10.1002/hep.26095]
39 Lujambio A, Lowe SW. The microcosmos of cancer. Nature 2012; 482: 347-355 [PMID: 22337054 DOI: 10.1038/nature10888]
40 D’Anzeo M, Faloppi L, Scartozzi M, Giampieri R, Bianconi M, Del Prete M, Silvestris N, Cascinu S. The role of micro-RNAs in hepatocellular carcinoma: from molecular biology to treatment. Molecules 2014; 19: 6393-6406 [PMID: 24853455 DOI: 10.3390/molecules19056393]
41 Scaggiante B, Dapas B, Farra R, Grassi M, Pozzato G, Giansante C, Fiotti N, Grassi G. Improving siRNA bio-distribution and minimizing side effects. Curr Drug Metab 2011; 12: 11-23 [PMID: 21222588]
42 Zen K, Zhang CY. Circulating microRNAs: a novel class of biomarkers to diagnose and monitor human cancers. Med Res Rev 2012; 32: 326-348 [PMID: 22383180 DOI: 10.1002/med.20215]
43 Lindner K, Haier J, Wang Z, Watson DI, Hussey DJ, Hummel R. Circulating microRNAs: emerging biomarkers for diagnosis and prognosis in patients with gastrointestinal cancers. Clin Sci (Lond) 2015; 128: 1-15 [PMID: 25168167 DOI: 10.1042/CS20140089]
44 Kosaka N, Iguchi H, Yoshioka Y, Takeshita F, Matsuki Y, Ochiya T. Secretory mechanisms and intercellular transfer of microRNAs in living cells. J Biol Chem 2010; 285: 17442-17452 [PMID: 20353945 DOI: 10.1074/jbc.M110.107821]
45 Rayner KJ, Hennessy EJ. Extracellular communication via microRNA: lipid particles have a new message. J Lipid Res 2013; 54: 1174-1181 [PMID: 23505318 DOI: 10.1194/jlr.R034991]
46 Ma R, Jiang T, Kang X. Circulating microRNAs in cancer: origin, function and application. J Exp Clin Cancer Res 2012; 31: 38 [PMID: 22546315 DOI: 10.1186/1756-9966-31-38]
47 Creemers EE, Tijsen AJ, Pinto YM. Circulating microRNAs: novel biomarkers and extracellular communicators in cardiovascular disease? Circ Res 2012; 110: 483-495 [PMID: 22302755 DOI: 10.1161/CIRCRESAHA.111.247452]
48 Cortez MA, Bueso-Ramos C, Ferdin J, Lopez-Berestein G, Sood AK, Calin GA. MicroRNAs in body fluids--the mix of hormones and biomarkers. Nat Rev Clin Oncol 2011; 8: 467-477 [PMID: 21647195 DOI: 10.1038/nrclinonc.2011.76]
49 Lemoinne S, Thabut D, Housset C, Moreau R, Valla D, Boulanger CM, Rautou PE. The emerging roles of microvesicles in liver diseases. Nat Rev Gastroenterol Hepatol 2014; 11: 350-361 [PMID: 24492276 DOI: 10.1038/nrgastro.2014.7]
50 Dragovic RA, Gardiner C, Brooks AS, Tannetta DS, Ferguson DJ, Hole P, Carr B, Redman CW, Harris AL, Dobson PJ, Harrison P, Sargent IL. Sizing and phenotyping of cellular vesicles using Nanoparticle Tracking Analysis. Nanomedicine 2011; 7: 780-788 [PMID: 21601655 DOI: 10.1016/j.nano.2011.04.003]
51 Rani S, O’Brien K, Kelleher FC, Corcoran C, Germano S, Radomski MW, Crown J, O’Driscoll L. Isolation of exosomes for subsequent mRNA, MicroRNA, and protein profiling. Methods Mol Biol 2011; 784: 181-195 [PMID: 21898221 DOI: 10.1007/978-1-61779-289-2_13]
52 Arroyo JD, Chevillet JR, Kroh EM, Ruf IK, Pritchard CC, Gibson DF, Mitchell PS, Bennett CF, Pogosova-Agadjanyan EL, Stirewalt DL, Tait JF, Tewari M. Argonaute2 complexes carry a population of circulating microRNAs independent of vesicles in human plasma. Proc Natl Acad Sci USA 2011; 108: 5003-5008 [PMID: 21383194 DOI: 10.1073/pnas.1019055108]
53 Vickers KC, Palmisano BT, Shoucri BM, Shamburek RD, Remaley AT. MicroRNAs are transported in plasma and delivered to recipient cells by high-density lipoproteins. Nat Cell Biol 2011; 13: 423-433
[PMID: 21423178 DOI: 10.1038/ncb2210]54 Zhang Y, Liu D, Chen X, Li J, Li L, Bian Z, Sun F, Lu J, Yin Y, Cai X,
Sun Q, Wang K, Ba Y, Wang Q, Wang D, Yang J, Liu P, Xu T, Yan Q, Zhang J, Zen K, Zhang CY. Secreted monocytic miR-150 enhances targeted endothelial cell migration. Mol Cell 2010; 39: 133-144 [PMID: 20603081 DOI: 10.1016/j.molcel.2010.06.010]
55 Nolte-’t Hoen EN, Buermans HP, Waasdorp M, Stoorvogel W, Wauben MH, ‘t Hoen PA. Deep sequencing of RNA from immune cell-derived vesicles uncovers the selective incorporation of small non-coding RNA biotypes with potential regulatory functions. Nucleic Acids Res 2012; 40: 9272-9285 [PMID: 22821563 DOI: 10.1093/nar/gks658]
56 Jaiswal R, Luk F, Gong J, Mathys JM, Grau GE, Bebawy M. Microparticle conferred microRNA profiles--implications in the transfer and dominance of cancer traits. Mol Cancer 2012; 11: 37 [PMID: 22682234 DOI: 10.1186/1476-4598-11-37]
57 Li H, Huang S, Guo C, Guan H, Xiong C. Cell-free seminal mRNA and microRNA exist in different forms. PLoS One 2012; 7: e34566 [PMID: 22506029 DOI: 10.1371/journal.pone.0034566]
58 Weber JA, Baxter DH, Zhang S, Huang DY, Huang KH, Lee MJ, Galas DJ, Wang K. The microRNA spectrum in 12 body fluids. Clin Chem 2010; 56: 1733-1741 [PMID: 20847327 DOI: 10.1373/clinchem.2010.147405]
59 Wang WT, Chen YQ. Circulating miRNAs in cancer: from detection to therapy. J Hematol Oncol 2014; 7: 86 [PMID: 25476853 DOI: 10.1186/s13045-014-0086-0]
60 Khoury S, Tran N. Circulating microRNAs: potential biomarkers for common malignancies. Biomark Med 2015; 9: 131-151 [PMID: 25689901 DOI: 10.2217/bmm.14.102]
61 Fabbri M, Paone A, Calore F, Galli R, Croce CM. A new role for microRNAs, as ligands of Toll-like receptors. RNA Biol 2013; 10: 169-174 [PMID: 23296026 DOI: 10.4161/rna.23144]
62 Hergenreider E, Heydt S, Tréguer K, Boettger T, Horrevoets AJ, Zeiher AM, Scheffer MP, Frangakis AS, Yin X, Mayr M, Braun T, Urbich C, Boon RA, Dimmeler S. Atheroprotective communication between endothelial cells and smooth muscle cells through miRNAs. Nat Cell Biol 2012; 14: 249-256 [PMID: 22327366 DOI: 10.1038/ncb2441]
63 Chen WX, Cai YQ, Lv MM, Chen L, Zhong SL, Ma TF, Zhao JH, Tang JH. Exosomes from docetaxel-resistant breast cancer cells alter chemosensitivity by delivering microRNAs. Tumour Biol 2014; 35: 9649-9659 [PMID: 24969560 DOI: 10.1007/s13277-014-2242-0]
64 Lawrie CH, Gal S, Dunlop HM, Pushkaran B, Liggins AP, Pulford K, Banham AH, Pezzella F, Boultwood J, Wainscoat JS, Hatton CS, Harris AL. Detection of elevated levels of tumour-associated microRNAs in serum of patients with diffuse large B-cell lymphoma. Br J Haematol 2008; 141: 672-675 [PMID: 18318758 DOI: 10.1111/j.1365-2141.2008.07077.x]
65 Chang J, Guo JT, Jiang D, Guo H, Taylor JM, Block TM. Liver-specific microRNA miR-122 enhances the replication of hepatitis C virus in nonhepatic cells. J Virol 2008; 82: 8215-8223 [PMID: 18550664 DOI: 10.1128/JVI.02575-07]
66 Tsai WC, Hsu SD, Hsu CS, Lai TC, Chen SJ, Shen R, Huang Y, Chen HC, Lee CH, Tsai TF, Hsu MT, Wu JC, Huang HD, Shiao MS, Hsiao M, Tsou AP. MicroRNA-122 plays a critical role in liver homeostasis and hepatocarcinogenesis. J Clin Invest 2012; 122: 2884-2897 [PMID: 22820290 DOI: 10.1172/JCI63455]
67 Xu J, Wu C, Che X, Wang L, Yu D, Zhang T, Huang L, Li H, Tan W, Wang C, Lin D. Circulating microRNAs, miR-21, miR-122, and miR-223, in patients with hepatocellular carcinoma or chronic hepatitis. Mol Carcinog 2011; 50: 136-142 [PMID: 21229610 DOI: 10.1002/mc.20712]
68 Qi P, Cheng SQ, Wang H, Li N, Chen YF, Gao CF. Serum microRNAs as biomarkers for hepatocellular carcinoma in Chinese patients with chronic hepatitis B virus infection. PLoS One 2011; 6: e28486 [PMID: 22174818 DOI: 10.1371/journal.pone.0028486]
69 Tomimaru Y, Eguchi H, Nagano H, Wada H, Kobayashi S, Marubashi S, Tanemura M, Tomokuni A, Takemasa I, Umeshita K, Kanto T, Doki Y, Mori M. Circulating microRNA-21 as a novel biomarker for hepatocellular carcinoma. J Hepatol 2012; 56:
Zhang YC et al . Circulating microRNAs for HCC diagnosis and prognosis
9862 September 14, 2015|Volume 21|Issue 34|WJG|www.wjgnet.com
167-175 [PMID: 21749846 DOI: 10.1016/j.jhep.2011.04.026]70 Ji F, Yang B, Peng X, Ding H, You H, Tien P. Circulating microRNAs
in hepatitis B virus-infected patients. J Viral Hepat 2011; 18: e242-e251 [PMID: 21692939 DOI: 10.1111/j.1365-2893.2011.01443.x]
71 Bihrer V, Friedrich-Rust M, Kronenberger B, Forestier N, Haupenthal J, Shi Y, Peveling-Oberhag J, Radeke HH, Sarrazin C, Herrmann E, Zeuzem S, Waidmann O, Piiper A. Serum miR-122 as a biomarker of necroinflammation in patients with chronic hepatitis C virus infection. Am J Gastroenterol 2011; 106: 1663-1669 [PMID: 21606975 DOI: 10.1038/ajg.2011.161]
72 Cermelli S, Ruggieri A, Marrero JA, Ioannou GN, Beretta L. Circulating microRNAs in patients with chronic hepatitis C and non-alcoholic fatty liver disease. PLoS One 2011; 6: e23937 [PMID: 21886843 DOI: 10.1371/journal.pone.0023937]
73 Zhang Y, Jia Y, Zheng R, Guo Y, Wang Y, Guo H, Fei M, Sun S. Plasma microRNA-122 as a biomarker for viral-, alcohol-, and chemical-related hepatic diseases. Clin Chem 2010; 56: 1830-1838 [PMID: 20930130 DOI: 10.1373/clinchem.2010.147850]
74 Jiang L, Cheng Q, Zhang BH, Zhang MZ. Circulating microRNAs as biomarkers in hepatocellular carcinoma screening: a validation set from China. Medicine (Baltimore) 2015; 94: e603 [PMID: 25761179 DOI: 10.1097/MD.0000000000000603]
75 Zhou J, Yu L, Gao X, Hu J, Wang J, Dai Z, Wang JF, Zhang Z, Lu S, Huang X, Wang Z, Qiu S, Wang X, Yang G, Sun H, Tang Z, Wu Y, Zhu H, Fan J. Plasma microRNA panel to diagnose hepatitis B virus-related hepatocellular carcinoma. J Clin Oncol 2011; 29: 4781-4788 [PMID: 22105822 DOI: 10.1200/JCO.2011.38.2697]
76 Wang L, Yao M, Dong Z, Zhang Y, Yao D. Circulating specific biomarkers in diagnosis of hepatocellular carcinoma and its metastasis monitoring. Tumour Biol 2014; 35: 9-20 [PMID: 24006223 DOI: 10.1007/s13277-013-1141-0]
77 Schütte K, Schulz C, Link A, Malfertheiner P. Current biomarkers for hepatocellular carcinoma: Surveillance, diagnosis and prediction of prognosis. World J Hepatol 2015; 7: 139-149 [PMID: 25729470 DOI: 10.4254/wjh.v7.i2.139]
78 Qu KZ, Zhang K, Li H, Afdhal NH, Albitar M. Circulating microRNAs as biomarkers for hepatocellular carcinoma. J Clin Gastroenterol 2011; 45: 355-360 [PMID: 21278583 DOI: 10.1097/
MCG.0b013e3181f18ac2]79 Köberle V, Kronenberger B, Pleli T, Trojan J, Imelmann E,
Peveling-Oberhag J, Welker MW, Elhendawy M, Zeuzem S, Piiper A, Waidmann O. Serum microRNA-1 and microRNA-122 are prognostic markers in patients with hepatocellular carcinoma. Eur J Cancer 2013; 49: 3442-3449 [PMID: 23810247 DOI: 10.1016/j.ejca.2013.06.002]
80 Li J, Wang Y, Yu W, Chen J, Luo J. Expression of serum miR-221 in human hepatocellular carcinoma and its prognostic significance. Biochem Biophys Res Commun 2011; 406: 70-73 [PMID: 21295551 DOI: 10.1016/j.bbrc.2011.01.111]
81 Turchinovich A, Weiz L, Langheinz A, Burwinkel B. Characterization of extracellular circulating microRNA. Nucleic Acids Res 2011; 39: 7223-7233 [PMID: 21609964 DOI: 10.1093/nar/gkr254]
82 Pritchard CC, Kroh E, Wood B, Arroyo JD, Dougherty KJ, Miyaji MM, Tait JF, Tewari M. Blood cell origin of circulating microRNAs: a cautionary note for cancer biomarker studies. Cancer Prev Res (Phila) 2012; 5: 492-497 [PMID: 22158052 DOI: 10.1158/1940-6207.CAPR-11-0370]
83 Williams Z, Ben-Dov IZ, Elias R, Mihailovic A, Brown M, Rosenwaks Z, Tuschl T. Comprehensive profiling of circulating microRNA via small RNA sequencing of cDNA libraries reveals biomarker potential and limitations. Proc Natl Acad Sci USA 2013; 110: 4255-4260 [PMID: 23440203 DOI: 10.1073/pnas.1214046110]
84 Grasedieck S, Sorrentino A, Langer C, Buske C, Döhner H, Mertens D, Kuchenbauer F. Circulating microRNAs in hematological diseases: principles, challenges, and perspectives. Blood 2013; 121: 4977-4984 [PMID: 23550041 DOI: 10.1182/blood-2013-01-480079]
85 Berger F, Reiser MF. Micro-RNAs as potential new molecular biomarkers in oncology: have they reached relevance for the clinical imaging sciences? Theranostics 2013; 3: 943-952 [PMID: 24396505 DOI: 10.7150/thno.7445]
86 Qi J, Wang J, Katayama H, Sen S, Liu SM. Circulating microRNAs (cmiRNAs) as novel potential biomarkers for hepatocellular carcinoma. Neoplasma 2013; 60: 135-142 [PMID: 23259781]
87 Yin J, Hou P, Wu Z, Wang T, Nie Y. Circulating miR-375 and miR-199a-3p as potential biomarkers for the diagnosis of hepatocellular carcinoma. Tumour Biol 2015; 36: 4501-4507 [PMID: 25618599 DOI: 10.1007/s13277-015-3092-0]
P- Reviewer: Grassi G, Tomizawa M S- Editor: Ma YJ L- Editor: Wang TQ E- Editor: Wang CH
Zhang YC et al . Circulating microRNAs for HCC diagnosis and prognosis
Circulating microRNAs and long non-coding RNAs in gastric cancer diagnosis: An update and review
Ya-Kai Huang, Jian-Chun Yu
Ya-Kai Huang, Jian-Chun Yu, Department of General Surgery, Peking Union Medical College Hospital, Chinese Academy of Medical Sciences and Peking Union Medical College, Beijing 100730, China
Author contributions: Huang YK wrote the paper; and Yu JC reviewed and edited the manuscript.
Conflict-of-interest statement: The authors have declared that no competing interests exist.
Open-Access: This article is an open-access article which was selected by an in-house editor and fully peer-reviewed by external reviewers. It is distributed in accordance with the Creative Commons Attribution Non Commercial (CC BY-NC 4.0) license, which permits others to distribute, remix, adapt, build upon this work non-commercially, and license their derivative works on different terms, provided the original work is properly cited and the use is non-commercial. See: http://creativecommons.org/licenses/by-nc/4.0/
Correspondence to: Jian-Chun Yu, MD, Department of General Surgery, Peking Union Medical College Hospital, Chinese Academy of Medical Sciences and Peking Union Medical College, No. 1 Shuaifuyuan, Wangfujing, Dongcheng District, Beijing 100730, China. [email protected]: +86-10-69152215Fax: +86-10-69152215
Received: April 3, 2015 Peer-review started: April 4, 2015First decision: April 23, 2015Revised: May 15, 2015 Accepted: July 18, 2015Article in press: July 18, 2015Published online: September 14, 2015
AbstractGastric cancer (GC) is the fourth most common cancer and the third leading cause of cancer mortality worldwide. MicroRNAs (miRNAs) and long non-coding RNAs (lncRNAs) are the most popular non-coding
RNAs in cancer research. To date, the roles of miRNAs and lncRNAs have been extensively studied in GC, suggesting that miRNAs and lncRNAs represent a vital component of tumor biology. Furthermore, circulating miRNAs and lncRNAs are found to be dysregulated in patients with GC compared with healthy individuals. Circulating miRNAs and lncRNAs may function as promising biomarkers to improve the early detection of GC. Multiple possibilities for miRNA secretion have been elucidated, including active secretion by microvesicles, exosomes, apoptotic bodies, high-density lipoproteins and protein complexes as well as passive leakage from cells. However, the mechanism underlying lncRNA secretion and the functions of circulating miRNAs and lncRNAs have not been fully illuminated. Concurrently, to standardize results of global investigations of circulating miRNAs and lncRNAs biomarker studies, several recommendations for pre-analytic considerations are put forward. In this review, we summarize the known circulating miRNAs and lncRNAs for GC diagnosis. The possible mechanism of miRNA and lncRNA secretion as well as methodologies for identification of circulating miRNAs and lncRNAs are also discussed. The topics covered here highlight new insights into GC diagnosis and screening.
Key words: Circulating microRNAs; Circulating long non-coding RNAs; Gastric cancer; Diagnosis; Secretion; Methodologies
© The Author(s) 2015. Published by Baishideng Publishing Group Inc. All rights reserved.
Core tip: MicroRNAs (miRNAs) and long non-coding RNAs (lncRNAs) are the most popular non-coding RNAs in cancer research. The roles of miRNAs and lncRNAs have been extensively studied in gastric cancer (GC). Concurrently, circulating miRNAs and lncRNAs may function as promising biomarkers to improve the early detection of GC. In this review, we summarize the known circulating miRNAs and lncRNAs for GC diagnosis. The possible mechanism of miRNA and lncRNA secretion
REVIEW
Submit a Manuscript: http://www.wjgnet.com/esps/Help Desk: http://www.wjgnet.com/esps/helpdesk.aspxDOI: 10.3748/wjg.v21.i34.9863
9863 September 14, 2015|Volume 21|Issue 34|WJG|www.wjgnet.com
World J Gastroenterol 2015 September 14; 21(34): 9863-9886 ISSN 1007-9327 (print) ISSN 2219-2840 (online)
© 2015 Baishideng Publishing Group Inc. All rights reserved.
as well as methodologies for identification of circulating miRNAs and lncRNAs are also discussed. The topics covered here highlight new insights into GC diagnosis and screening.
Huang YK, Yu JC. Circulating microRNAs and long non-coding RNAs in gastric cancer diagnosis: An update and review. World J Gastroenterol 2015; 21(34): 9863-9886 Available from: URL: http://www.wjgnet.com/1007-9327/full/v21/i34/9863.htm DOI: http://dx.doi.org/10.3748/wjg.v21.i34.9863
INTRODUCTIONGastric cancer (GC) was the fourth most common cancer and the third leading cause of cancer mortality worldwide in 2012[1]. To date, the development of diagnostic methods and surgical techniques has remarkably improved the prognosis of patients with GC[2]. However, for advanced GC, the 5-year survival rate is 30%-50%, and the most common forms of recurrence are lymph node metastasis, hematogenous spread and peritoneal dissemination. The prognosis for individuals with advanced disease remains poor[3]. Early-stage diagnosis of GC potentially reduces the mortality of this disease. Many non-invasive methods for GC detection are available, such as serum pepsinogen and MG-7. However, the sensitivity and specificity of these methods remain unsatisfactory. Endoscopic screening for GC is currently the most reliable diagnostic tool, but its cost and invasive nature have limited its use. Therefore, novel, non-invasive, cost-effective and highly sensitive biomarkers are urgently needed to improve GC detection.
RNA transcripts include mRNA and non-coding RNAs; non-coding RNAs are defined as RNA transcripts that do not encode a protein. Non-coding RNAs are divided into two primary categories: small non-coding RNAs (< 200 nt) and long non-coding RNAs (lncRNAs; > 200 nt) (Figure 1). Some small non-coding RNAs are housekeeping RNAs, such as rRNA and tRNA, which are essential for cell physiology, while others, such as microRNAs (miRNAs), splicing RNAs, promoter-associated short RNAs, tiny transcription-initiation RNAs, termini-associated short RNAs, antisense termini-associated short RNAs and 3’-untranslated region (UTR)-derived RNAs, are associated with protein-coding gene regulation.
To date, miRNAs are the most extensively studied small non-coding RNAs. miRNAs are endogenous, single-stranded, non-coding, small RNAs of 21-22 nucleotides that are involved in regulating gene expression by incorporating into the RNA-induced silencing complex (RISC) and preferential binding to specific sequences in the 3’-UTR of their target mRNAs to suppress translation or to induce mRNA degradation[4]. Since their discovery
in 1993, accumulating evidence has suggested that ectopic expression of miRNAs is responsible for a variety of biological processes including embryonic development and carcinogenesis[5-8]. Ectopic expression of miRNAs involved in tumorigenesis has been well described in most tumor types. Up-regulation, down-regulation or silencing of specific miRNAs has been described previously in the carcinogenesis of GC. A series of miRNAs have been identified to be down-regulated and act as tumor suppressors in GC by restraining oncogene expression or interfering with pathways that regulate cellular proliferation. Conversely, a number of miRNAs have been detected that are up-regulated and that may exhibit oncogenic functions in GC by targeting tumor suppressor genes.
lncRNAs have also gained increasing popularity in the current research climate. lncRNAs are defined as RNA transcripts of more than 200 nucleotides in length with no protein-coding capability and are sometimes referred to as lincRNAs for long intergenic non-coding RNAs. lncRNAs play crucial roles in controlling gene expression during various physiological processes. Emerging evidence has suggested that ectopic lncRNA expression constitutes an important component of tumorigenesis and is involved in angiogenesis and cell proliferation, migration, and apoptosis[9-11]. lncRNAs exhibit a wide spectrum of biological functions and may work in conjunction with mRNAs and miRNAs to serve the following functions (Figure 2): (1) serve as enhancer RNAs (eRNAs) to compete with nascent mRNA for negative elongation factor (NELF) complex binding at the target promoter for transcriptional regulation[12]; (2) serve as a scaffolding base for the coordination of epigenetic or chromatin-modifying complexes[13]; (3) directly modulate tumor suppressor signaling by either transcriptional regulation of tumor suppressor genes or mediation of tumor suppressor target gene activation[14,15]; (4) serve as molecular sponges for miRNAs[16]; (5) gene expression regulation by direct lncRNA-mRNA interactions[17]; (6) function as a decoy for miRNA or translation factors to regulate gene expression[16]; and (7) hybridize with their corresponding spliced mRNAs to form dsRNAs, which are cleaved by Dicer to generate endogenous small interfering RNAs (endo-siRNAs) to modulate gene expression[18,19]. Growing evidence suggests that lncRNA dysregulation correlates with GC tumorigenesis, metastasis and prognosis. H19, HOTAIR, CCAT1, GHET1, CDKN2B LSINCT-5, CUDR, LINC00152 and MALAT1 can exhibit oncogenic functions in GC, whereas GAS5, MEG3, BM742401 and FER1L4 may function as tumor suppressors; their critical effects on tumor growth may be mediated through competition for targeted miRNAs or positive regulation of epithelial-mesenchymal transition[20].
miRNAs that are protected by exosomes and other microparticles have been detected in plasma, serum,
9864 September 14, 2015|Volume 21|Issue 34|WJG|www.wjgnet.com
Huang YK et al . Circulating microRNAs and long non-coding RNAs in GC diagnosis
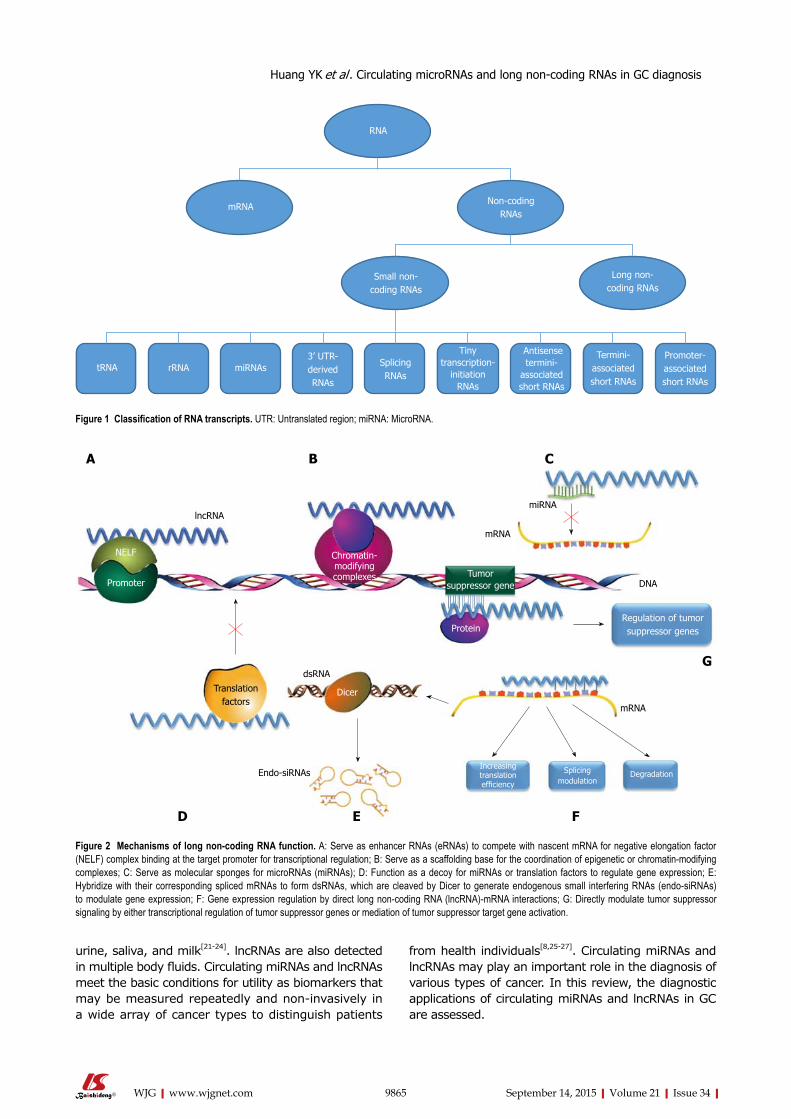
urine, saliva, and milk[21-24]. lncRNAs are also detected in multiple body fluids. Circulating miRNAs and lncRNAs meet the basic conditions for utility as biomarkers that may be measured repeatedly and non-invasively in a wide array of cancer types to distinguish patients
from health individuals[8,25-27]. Circulating miRNAs and lncRNAs may play an important role in the diagnosis of various types of cancer. In this review, the diagnostic applications of circulating miRNAs and lncRNAs in GC are assessed.
9865 September 14, 2015|Volume 21|Issue 34|WJG|www.wjgnet.com
tRNA
Antisense termini-
associated short RNAs
Termini-associated short RNAs
Promoter-associated short RNAs
Tiny transcription-
initiation RNAs
Splicing RNAs
3’ UTR-derived RNAs
miRNAs rRNA
Small non-coding RNAs
Long non-coding RNAs
Non-codingRNAs
mRNA
RNA
Figure 1 Classification of RNA transcripts. UTR: Untranslated region; miRNA: MicroRNA.
Increasing translation efficiency
Figure 2 Mechanisms of long non-coding RNA function. A: Serve as enhancer RNAs (eRNAs) to compete with nascent mRNA for negative elongation factor (NELF) complex binding at the target promoter for transcriptional regulation; B: Serve as a scaffolding base for the coordination of epigenetic or chromatin-modifying complexes; C: Serve as molecular sponges for microRNAs (miRNAs); D: Function as a decoy for miRNAs or translation factors to regulate gene expression; E: Hybridize with their corresponding spliced mRNAs to form dsRNAs, which are cleaved by Dicer to generate endogenous small interfering RNAs (endo-siRNAs) to modulate gene expression; F: Gene expression regulation by direct long non-coding RNA (lncRNA)-mRNA interactions; G: Directly modulate tumor suppressor signaling by either transcriptional regulation of tumor suppressor genes or mediation of tumor suppressor target gene activation.
NELF
Promoter
lncRNA
Chromatin-modifyingcomplexes Tumor
suppressor gene
mRNA
miRNA
Regulation of tumor suppressor genesProtein
mRNA
DNA
Splicing modulation
Degradation
dsRNA
Dicer
Endo-siRNAs
Translation factors
A B C
D E F
G
Huang YK et al . Circulating microRNAs and long non-coding RNAs in GC diagnosis
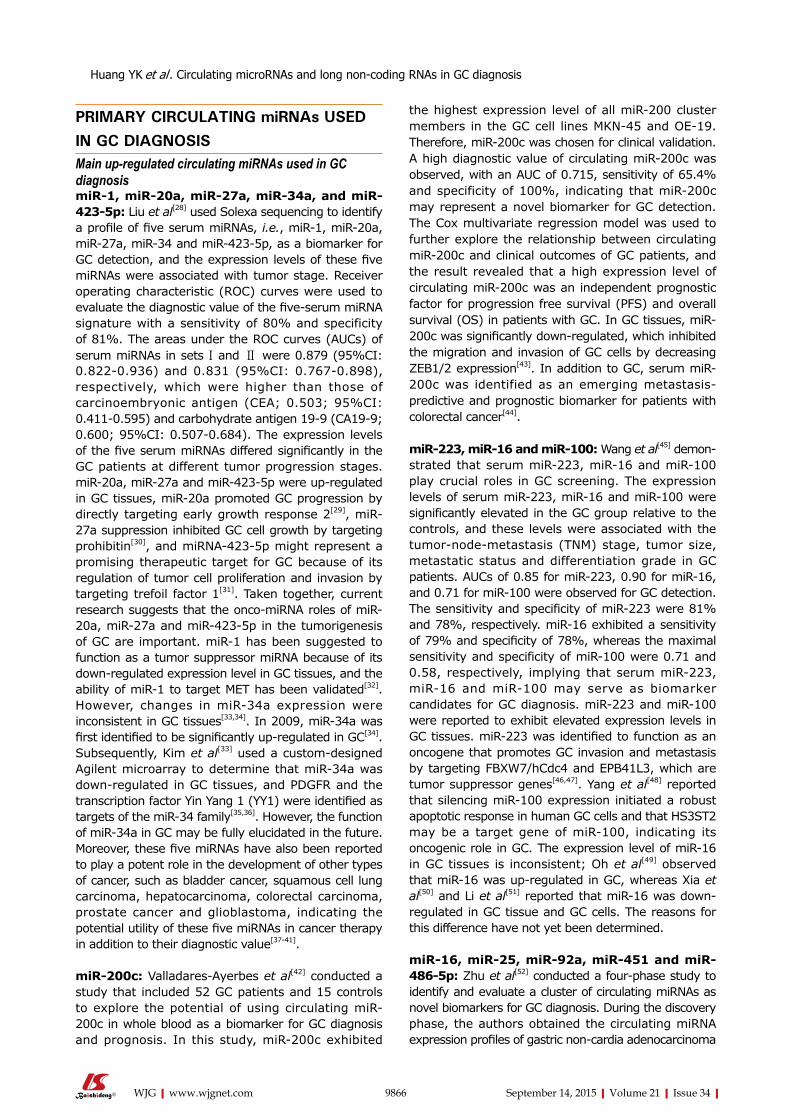
9866 September 14, 2015|Volume 21|Issue 34|WJG|www.wjgnet.com
the highest expression level of all miR-200 cluster members in the GC cell lines MKN-45 and OE-19. Therefore, miR-200c was chosen for clinical validation. A high diagnostic value of circulating miR-200c was observed, with an AUC of 0.715, sensitivity of 65.4% and specificity of 100%, indicating that miR-200c may represent a novel biomarker for GC detection. The Cox multivariate regression model was used to further explore the relationship between circulating miR-200c and clinical outcomes of GC patients, and the result revealed that a high expression level of circulating miR-200c was an independent prognostic factor for progression free survival (PFS) and overall survival (OS) in patients with GC. In GC tissues, miR-200c was significantly down-regulated, which inhibited the migration and invasion of GC cells by decreasing ZEB1/2 expression[43]. In addition to GC, serum miR-200c was identified as an emerging metastasis-predictive and prognostic biomarker for patients with colorectal cancer[44].
miR-223, miR-16 and miR-100: Wang et al[45] demon-strated that serum miR-223, miR-16 and miR-100 play crucial roles in GC screening. The expression levels of serum miR-223, miR-16 and miR-100 were significantly elevated in the GC group relative to the controls, and these levels were associated with the tumor-node-metastasis (TNM) stage, tumor size, metastatic status and differentiation grade in GC patients. AUCs of 0.85 for miR-223, 0.90 for miR-16, and 0.71 for miR-100 were observed for GC detection. The sensitivity and specificity of miR-223 were 81% and 78%, respectively. miR-16 exhibited a sensitivity of 79% and specificity of 78%, whereas the maximal sensitivity and specificity of miR-100 were 0.71 and 0.58, respectively, implying that serum miR-223, miR-16 and miR-100 may serve as biomarker candidates for GC diagnosis. miR-223 and miR-100 were reported to exhibit elevated expression levels in GC tissues. miR-223 was identified to function as an oncogene that promotes GC invasion and metastasis by targeting FBXW7/hCdc4 and EPB41L3, which are tumor suppressor genes[46,47]. Yang et al[48] reported that silencing miR-100 expression initiated a robust apoptotic response in human GC cells and that HS3ST2 may be a target gene of miR-100, indicating its oncogenic role in GC. The expression level of miR-16 in GC tissues is inconsistent; Oh et al[49] observed that miR-16 was up-regulated in GC, whereas Xia et al[50] and Li et al[51] reported that miR-16 was down-regulated in GC tissue and GC cells. The reasons for this difference have not yet been determined.
miR-16, miR-25, miR-92a, miR-451 and miR-486-5p: Zhu et al[52] conducted a four-phase study to identify and evaluate a cluster of circulating miRNAs as novel biomarkers for GC diagnosis. During the discovery phase, the authors obtained the circulating miRNA expression profiles of gastric non-cardia adenocarcinoma
PRIMARY CIRCULATING miRNAs USED IN GC DIAGNOSISMain up-regulated circulating miRNAs used in GC diagnosismiR-1, miR-20a, miR-27a, miR-34a, and miR-423-5p: Liu et al[28] used Solexa sequencing to identify a profile of five serum miRNAs, i.e., miR-1, miR-20a, miR-27a, miR-34 and miR-423-5p, as a biomarker for GC detection, and the expression levels of these five miRNAs were associated with tumor stage. Receiver operating characteristic (ROC) curves were used to evaluate the diagnostic value of the five-serum miRNA signature with a sensitivity of 80% and specificity of 81%. The areas under the ROC curves (AUCs) of serum miRNAs in sets Ⅰ and Ⅱ were 0.879 (95%CI: 0.822-0.936) and 0.831 (95%CI: 0.767-0.898), respectively, which were higher than those of carcinoembryonic antigen (CEA; 0.503; 95%CI: 0.411-0.595) and carbohydrate antigen 19-9 (CA19-9; 0.600; 95%CI: 0.507-0.684). The expression levels of the five serum miRNAs differed significantly in the GC patients at different tumor progression stages. miR-20a, miR-27a and miR-423-5p were up-regulated in GC tissues, miR-20a promoted GC progression by directly targeting early growth response 2[29], miR-27a suppression inhibited GC cell growth by targeting prohibitin[30], and miRNA-423-5p might represent a promising therapeutic target for GC because of its regulation of tumor cell proliferation and invasion by targeting trefoil factor 1[31]. Taken together, current research suggests that the onco-miRNA roles of miR-20a, miR-27a and miR-423-5p in the tumorigenesis of GC are important. miR-1 has been suggested to function as a tumor suppressor miRNA because of its down-regulated expression level in GC tissues, and the ability of miR-1 to target MET has been validated[32]. However, changes in miR-34a expression were inconsistent in GC tissues[33,34]. In 2009, miR-34a was first identified to be significantly up-regulated in GC[34]. Subsequently, Kim et al[33] used a custom-designed Agilent microarray to determine that miR-34a was down-regulated in GC tissues, and PDGFR and the transcription factor Yin Yang 1 (YY1) were identified as targets of the miR-34 family[35,36]. However, the function of miR-34a in GC may be fully elucidated in the future. Moreover, these five miRNAs have also been reported to play a potent role in the development of other types of cancer, such as bladder cancer, squamous cell lung carcinoma, hepatocarcinoma, colorectal carcinoma, prostate cancer and glioblastoma, indicating the potential utility of these five miRNAs in cancer therapy in addition to their diagnostic value[37-41].
miR-200c: Valladares-Ayerbes et al[42] conducted a study that included 52 GC patients and 15 controls to explore the potential of using circulating miR-200c in whole blood as a biomarker for GC diagnosis and prognosis. In this study, miR-200c exhibited
Huang YK et al . Circulating microRNAs and long non-coding RNAs in GC diagnosis
9867 September 14, 2015|Volume 21|Issue 34|WJG|www.wjgnet.com
(GNCA) patients and controls using TLDA chips with pooled samples, and differentially expressed circulating miRNAs (miR-16, miR-25, miR-92a, miR-451 and miR-486-5p) were validated by real-time quantitative polymerase chain reaction (qRT-PCR). During the independent validation phase, the five identified miRNAs were examined in a larger independent sample and found to be consistent with the previous phase, suggesting that these five plasma miRNAs might serve as promising biomarkers for early GNCA detection with a sensitivity of 72.9%, specificity of 89.2% and AUC of 0.812. In addition, miR-16, miR-92a and miR-25, but not miR-486-5p or miR-451, were identified as secretory miRNAs in BGC823 and MGC803 cell lines. miR-25 and miR-92a were also found to be up-regulated in GC tissues. miR-25 promotes GC cell motility and proliferation by targeting LATS2 and RECK[53,54], and miR-92a promotes GC cell growth by targeting E2F1 and HIPK1[55], supporting the onco-miRNA roles of miR-25 and miR-92a in GC. miR-16, miR-451 and miR-486-5p have exhibited inconsistent expression levels in GC tissues in different research studies[33,51,56,57] potentially due to different methodologies for miRNA detection. In addition to GC, aberrant expression of miR-16, miR-92, miR-25, miR-451 and miR-486-5p was also found to participate in the development of many other types of cancer[58-69].
miR-16 and miR-93 were also identified by Song et al[70] as suitable reference genes for serum miRNA analysis in GC patients and healthy controls. In their study, Song et al[71] identified seven candidate reference miRNAs from the sera of GC patients. miR-16 and miR-93 were identified as the top two most stable miRNAs serving as reference genes for serum miRNA analysis for GC detection. miR-93 was significantly up-regulated in GC specimens compared with healthy controls, and the prognostic value of miR-93 was observed in resectable gastric adenocarcinomas[71]. In addition to GC, circulating miR-93 also exhibits potential diagnostic value for breast cancer detection[72]. Du et al[73] demonstrated that miR-93 functioned as a potent suppressor of DAB2, which was identified as a tumor suppressor gene in multiple cancer types, and miR-93 overexpression correlated with poor survival of patients with lung cancer, indicating the vital role of miR-93 in cancer development and progression and in GC diagnosis.
miR-421: Zhou et al[74] reported that circulating miR-421 in mononuclear cells (MNCs) could serve as a distinctive biomarker for circulating tumor cells (CTCs). In their study, the authors used reverse transcription-polymerase chain reaction (RT-PCR) to evaluate the diagnostic value of miR-421 in peripheral blood for GC detection, and the sensitivity, specificity and AUC of miR-421 were 94.12%, 62.50% and 0.773, respectively. In addition, the authors observed that the miR-421 inhibitor repressed the proliferation and viability of GC cells in vivo and in vitro, indicating
that miR-421 might act an onco-miRNA in GC. Wu et al[75] also validated the high diagnostic efficiency of serum miR-421 in a large sample set composed of 90 GC patients and 90 controls with a maximal sensitivity of 95.5%, maximal specificity of 89.1% and maximal AUC of 0.821, which was superior to cancer antigen 125 (CA125) and CEA for GC detection. The expression level of miR-421 in GC tissues was up-regulated, which was consistent with the circulating levels. Furthermore, one of the targets of miR-421 was identified as caspase-3[76], which is important for apoptosis. In addition, miR421 was identified to play a crucial role in the tumorigenesis and development of many other cancer types, including breast cancer, nasopharyngeal carcinoma, and SKX squamous cell carcinoma[76-80].
miR-378: Liu et al[81] used microarrays to obtain serum genome-wide miRNA profiles and identified serum miR-378 as a biomarker for the early detection of GC. In their article, three miRNAs (miR-187, miR-371-5p, and miR-378) were detected in all 30 samples and exhibited significantly higher expression in GC serum than in controls or in the colorectal cancer group. Further, the authors performed qRT-PCR in another independent set composed of 40 GC serum samples and 41 healthy controls to verify the diagnostic value of the three miRNAs in discriminating GC patients from controls. Subsequently, ROC curve and multivariate logistic regression analyses indicated that miR-378 was a potential biomarker for GC detection with a sensitivity of 87.5%, specificity of 70.73% and AUC of 0.861, whereas serum miR-187 and miR-371-5p could not improve GC diagnosis. Serum miR-378 expression levels did not differ significantly among the different TNM stages. Meanwhile, the expression level of miR-378 in GC tissues was down-regulated relative to normal tissues, indicating that miR-378 might serve as a tumor suppressor miRNA in GC. MAPK1 may be the target of miR-378 to assist miR-378 in inhibiting the progression of human GC cells[82]. However, miR-378 was overexpressed in ovarian cancer cells and tumor specimens vs normal ovarian epithelial cells[83], indicating that the expression pattern of miR-378 was dependent on the type of cancer. Moreover, miR-378 was identified as an ideal biomarker candidate for breast cancer, renal cell carcinoma, non-small cell lung cancer and colorectal cancer[84-86].
miR-199a-3p: Li et al[87] conducted a study to explore the expression levels of tumor-associated miRNAs in the plasma of patients with early GC. The authors determined that the expression of miR-199a-3p in the plasma of 30 early GC patients was significantly higher relative to healthy controls and patients with gastric precancerous diseases (GPDs). Meanwhile, the expression level of plasma miR-199a-3p in the postoperative patients was significantly reduced compared with the preoperative patients. Moreover,
Huang YK et al . Circulating microRNAs and long non-coding RNAs in GC diagnosis
9868 September 14, 2015|Volume 21|Issue 34|WJG|www.wjgnet.com
the AUC of plasma miR-199a-3p for early GC diagnosis was 0.818, which was significantly higher than that of combined tumor markers such as CEA, CA125, CA724, CA199, CA242 and CA50. The sensitivity, specificity, and accuracy of plasma miR-199a-3p for early GC diagnosis were 76%, 74%, and 75%, respectively. Peng et al[88] suggested that miR-199a-3p was down-regulated in gastric carcinoma tissues and regulated human GC cell proliferation by targeting the mTOR signaling pathway. However, Wang et al[89] demonstrated that miR-199a-3p was significantly up-regulated in GC tissues and cell lines and that its oncogenic activity in GC might involve the direct targeting of ZHX1. The expression level of miR-199a-3p in GC tissues is inconsistent, and the controversy may be resolved by stricter and more reliable studies.
miR-106a and miR-17: Zhou et al[90] performed a study to identify circulating miRNAs to detect circulating tumor cells in peripheral blood for GC diagnosis. The authors observed that the expression levels of miR-106a and miR-17 in the circulation were higher in GC patients compared with controls. Ninety GC patients and 27 controls were recruited to evaluate the diagnostic value of miR-106a and miR-17 in peripheral blood, and the result revealed that the AUC, sensitivity and specificity of miR-106a were 0.684, 48.15% and 90.24%, respectively, whereas the AUC, sensitivity and specificity of miR-17 were 0.743, 51.85% and 92.68%, respectively. Additionally, the AUC, sensitivity and specificity of the combination of miR-106a and miR-17 were 0.741, 62.96%, 80.49%, respectively. Zeng et al[91] suggested that the expression level of serum miR-17 was significantly reduced in both GC and benign gastric disease patients compared with healthy controls. The AUC for serum miR-17 to discriminate GC patients from controls was 0.879, with a sensitivity of 90.6% and specificity of 57.5%. To discriminate benign gastric disease patients from controls, the AUC, sensitivity and specificity of serum miR-17 were 0.725, 62.9% and 81.2%, respectively. In GC tissues, miR-17 was overexpressed to function as an onco-miRNA to promote cell proliferation, and UBE2C and FBXO31 were identified as the targets of miR-17[92,93]. Concurrently, miR-106a overexpression was observed in GC tissues, and miR-106a might play an oncogenic role in GC by targeting TIMP2 and FAS[94,95]. miR-106a in gastric juice was also demonstrated to exhibit potential diagnostic value for GC detection, with a sensitivity of 73.8%, specificity of 89.3%, and AUC of 0.871[96], which was consistent with the diagnostic value of circulating levels. In addition to GC, miR-106a and miR-17 were also found to be widely used as promising diagnostic or prognostic biomarkers for various types of cancer such as hepatocellular carcinoma, non-small cell lung cancer, prostate cancer, breast cancer and nasopharyngeal carcinoma[97-100].
miR-103, miR-107, miR-194 and miR-210: Rotkrua et al[101] established a mouse line to recapitulate human diffuse-type GC (DGC) morphologically and molecularly by E-cadherin/p53 double conditional knockout (DCKO). Subsequently, the authors employed miRNA microarrays to screen candidate miRNAs in individual mouse samples at different ages. miR-103, miR-107, miR-194, miR-210 and miR-291b-5p were identified as DGC-related miRNAs. To evaluate the accuracy of the microarray data, the authors measured the expression levels of these five miRNAs in serum samples using TaqMan qRT-PCR. miR-107, miR-103, miR-194 and miR-210 exhibited significantly increased expression levels in the sera of 6-12-mo-old DCKO mice (early-stage DGC) with histologically proven intramucosal DGC compared with the control group, suggesting that the four miRNAs had the potential to identify DGC at an early stage. In 12-mo-old DCKO mice (advanced-stage DGC), the expression levels of miR-107, miR-103 and miR-194 in the sera were significantly increased compared with controls, whereas the expression level of miR-210 was unchanged, indicating that miR-210 might be an inappropriate biomarker of advanced DGC. To discriminate DGC cases from controls, miR-103 exhibited a sensitivity of 81.8%, specificity of 95.7% and AUC of 0.881; miR-107 exhibited a sensitivity of 90.9%, specificity of 95.7% and AUC of 0.909; and miR-194 exhibited a sensitivity of 90.9%, specificity of 95.7% and AUC of 0.925. For differentiating early early-stage DGC cases from controls, miR-210 exhibited a sensitivity of 72.7%, specificity of 87.0% and AUC of 0.846. The expression levels of miR-107, miR-103 and miR-210 in human GC tissues were inconsistent. miR-107 expression was up-regulated in eight studies and down-regulated in one study[33,34,47,49,51,57,102-104], miR-103 expression was up-regulated in seven studies and down-regulated in one study[33,34,47,49,57,102-104], and miR-210 expression was up-regulated in one study and down-regulated in two studies[30,33,47]. However, these differences may be due to the different detection methods and small patient samples. miR-194 was significantly down-regulated in GC tissues, indicating its tumor suppressor role in GC development[105]. miR-103, miR-107, miR-194 and miR-210 were also found to modulate the proliferation, migration or multidrug resistance of GC cells[106-109]. Moreover, these four miRNAs were identified to play crucial roles in the oncogenesis of many other malignant tumor types, such as cervical cancer, colorectal cancer, pancreatic cancer, non-small cell lung carcinoma and endometrial cancer[69,109-113].
miR-18a: Tsujiura et al[114] assessed plasma miR-18 as a biomarker in patients with GC. The authors determined that the expression level of miR-18 in-creased significantly in GC tissues compared with normal gastric tissues. The diagnostic value of circulating miR-18 in plasma was evaluated, and the
Huang YK et al . Circulating microRNAs and long non-coding RNAs in GC diagnosis
9869 September 14, 2015|Volume 21|Issue 34|WJG|www.wjgnet.com
results indicated that the AUC of miR-18 was 0.8059, with a sensitivity of 0.846 and specificity of 0.692. Concurrently, plasma miR-18 exhibited significantly lower expression levels in postoperative patients compared with preoperative patients, indicating that circulating miR-18 in the plasma might function as a biomarker for GC screening and tumor dynamic monitoring. Su et al[115] also validated the diagnostic value of plasma miR-18a for GC detection and reported AUC, sensitivity and specificity values for discriminating GC patients from healthy controls to be 0.907, 80.5% and 84.6%, respectively. STAT3 was identified as the target of miR-18a to promote its onco-miRNA activity in GC[116]. In addition to GC, plasma/serum miR-18a also exhibited potential as a next-generation biomarker in the screening of other types of cancer, such as pancreatic cancer (AUC = 0.936), esophageal cancer (AUC = 0.944), hepatocellular cancer (AUC = 0.881) and colorectal cancer with a clinically satisfactory degree of specificity and sensitivity[117].
miR-223 and miR-21: Li et al[118] reported that the expression levels of miR-223 and miR-21 in the plasma were significantly higher in GC patients than in healthy controls, whereas miR-218 was significantly lower. The study they conducted comprised of 60 GC patients and 60 healthy controls in the validation stage. The combination of miR-223, miR-21 and miR-218 yielded an AUC of 0.9531 with a sensitivity of 84.29% and specificity of 92.86% in differentiating GC patients from healthy controls. The use of a single miRNA in the plasma as biomarker for GC detection produced sensitivity values of 84.29% and 74.29%; specificity values of 88.57% and 75.71%; and AUC values of 0.9089 and 0.7944 for miR-223 and miR-21, respectively. In addition to this, the expression level of miR-223 in the plasma was associated with Helicobacter pylori (H. pylori) infection status. miR-21 overexpression in the circulation also correlates with lymph node metastasis, tumor size and TNM stage in GC patients[119,120]. A meta-analysis suggested that the AUC of plasma miR-21 as a biomarker for GC diagnosis was 0.80, with a pooled sensitivity of 66.5% and pooled specificity of 83.1%[121]. Concurrently, miR-21 in gastric juice exhibited high diagnostic values for GC detection, with a sensitivity of 85.7%, specificity of 97.8%, and AUC of 0.969[96], consistent with those in the circulation. The expression levels of miR-223 and miR-21 in GC tissues were elevated, consistent with their expression levels in the circulation[46,122,123]. miR-223 functions as an oncogene in GC by targeting FBXW7/hCdc4, EPB41L3 and Stathmin1[46,47,124], and miR-21 promotes tumor proliferation and invasion or confers cisplatin resistance in GC by targeting NF-kB and PTEN[125-127]. In addition to GC, the two miRNAs were found to participate in tumorigenesis and enhance chemosensitivity in various other types of cancer, including prostate cancer, esophageal cancer, osteosarcoma, hepatocellular carcinoma and lung
adenocarcinoma[128-132].
miR-21 and miR-106b: Shiotani et al[133] investigated the expression levels of serum miRNAs in high-risk GC patients before and after H. pylori eradication. The study recruited 87 early-stage, non-cardia, intestinal-type GC patients without lymph node metastasis and 114 sex- and age-matched healthy controls. Serum miR-106b was significantly up-regulated in the GC group before and after H. pylori eradication compared with healthy controls, whereas serum miR-21 also manifested higher expression levels in the GC group relative to healthy controls immediately after H. pylori eradication. ROC analyses revealed that the AUC, sensitivity and specificity values of miR-106b for early GC screening were 0.61, 55.6% and 70.3% before H. pylori eradication, respectively. For early GC screening after H. pylori eradication, the AUC values of miR-106b and miR-21 were 0.70 and 0.72; the sensitivity values of miR-106b, miR-21 and the combination of miR-106b and miR-21 were 75.8%, 58.6% and 69.0%; and the specificity values of miR-106b, miR-21 and the combination of miR-106b and miR-21 were 51.4%, 51.4% and 69.4%, respectively, superior to serum pepsinogen Ⅰ and Ⅱ. Zeng et al[91] also suggested that serum miR-106b yielded an AUC of 0.856, sensitivity of 75.0% and specificity of 92.5% for discriminating GC patients from healthy controls; an AUC of 0.700, sensitivity of 87.2% and specificity of 45.0% for discriminating GC patients from benign gastric disease patients; and an AUC of 0.739, sensitivity of 75.0% and specificity of 68.7% for discriminating benign gastric disease patients from healthy controls. In addition, the expression level of the miR-106b~25 cluster (miR-106b, miR-93 and miR-25) in the plasma was suggestive of significant correlation with TNM stage, tumor size and Bormann type of GC[134]. Recent observations also demonstrated that miR-106b is up-regulated in GC tissues to function as an oncogene by targeting PTEN, p21, E2F5 and p57[135-137].
miR-221, miR-376c and miR-744: Song et al[138] conducted a multi-stage, nested case-control study from two large cohorts to explore the potential use of serum miRNAs in GC detection. The study was composed of four stepwise phases, and 82 GC patients, 46 dysplasia patients and 128 controls with superficial gastritis or atrophic gastritis were recruited. The results indicated that a combination of miR-221, miR-376c and miR-744 was an efficient biomarker for GC diagnosis with a sensitivity of 82.4% and specificity of 58.8%. For early GC detection, the three-miRNA panel exhibited an interesting diagnostic value with a sensitivity of 73.3%. Concurrently, the three-miRNA panel could also discriminate dysplasia from controls with a sensitivity of 56.5% and specificity of 47.8%. Furthermore, a significant positive correlation between the expression levels of two serum miRNAs (miR-221, miR-376c) and the poor differentiation of GC was
Huang YK et al . Circulating microRNAs and long non-coding RNAs in GC diagnosis
9870 September 14, 2015|Volume 21|Issue 34|WJG|www.wjgnet.com
observed. In GC tissues and cell lines, miR-221 is up-regulated to function as an oncogene to promote GC invasion and metastasis by targeting PTEN, and its expression level is associated with the TNM stage and venous invasion[139,140]. However, miR-376c and miR-744 have not been well elucidated in GC. In addition to GC, serum miR-376c exhibits potential in the detection of breast cancer, and miR-221, miR-376c and miR-744 play pivotal roles in the development of multiple other types of cancer[141].
Main down-regulated circulating miRNAs used in GC diagnosislet-7a: Wang et al[142] demonstrated that let-7a exhibited a lower expression level in the sera of GC patients than in healthy individuals, corresponding with lower let-7a expression levels in gastric adenocarcinoma tissues relative to peritumoral tissues. The expression levels of let-7a in serum samples and tumor tissues were significantly correlated, indicating that let-7a could be a diagnostic biomarker of GC. In that study, in vitro experiments revealed that let-7a might function as a tumor suppressor miRNA in GC by suppressing CCR7. Tsujiura et al[143] found that the expression levels of miR-17-5p, miR-106b, miR-106a and miR-21 were significantly elevated in GC patients compared with controls, whereas let-7a exhibited a lower plasma concentration in GC patients compared with controls. To evaluate the diagnostic value of these circulating miRNAs for GC detection, large-scale validation including 69 GC patients and 30 controls was performed, and the result indicated that the ratio of miR-106a/let-7a exhibited a sensitivity of 85.5%, specificity of 80.0% and maximum AUC of 0.879. Tchernitsa et al[102] used miRNA microarrays and reported that let-7a was up-regulated in GC compared with non-neoplastic tissue, which was inconsistent with the research by Wang et al[142]. However, the result of Oleg Tchernitsa’s study revealed marginal significance with a P-value of 0.0474, which should be validated in a larger scale study. In addition to GC, let-7a also exhibits a potent role in regulating cell proliferation or chemosensitivity in other types of cancer such as hepatocellular carcinoma, breast cancer, lung cancer, bladder cancer, colorectal cancer, nasopharyngeal carcinoma, prostate cancer, esophageal cancer, pancreatic cancer and ovarian cancer[144-154], indicating its extensive and universal function in tumor development.
miR-375: Zhang et al[155] conducted a study to explore the miRNA profile of distal gastric adenocar-cinoma (DGAC) and identified miR-375 as significantly down-regulated in DGAC tissue and GC cell lines (MGC-803, BGC-823, and SGC-7901) relative to normal gastric tissues and cell lines (GES-1). Concurrently, in an independent set composed of 20 patients with preoperative DGAC and 20 age-matched healthy individuals, serum miR-375 was identified as a biomarker candidate for discriminating patients
with DGAC from healthy controls. The AUC of serum miR-375 was 0.835, with a sensitivity of 80% and specificity of 85%. Previous studies of miR-375 in GC had emphasized that miR-375 was frequently down-regulated in GC tissues. JAK2, ERBB2, STAT3 and p53 were identified as targets of miR-375, suggesting its tumor suppressor role in GC[156-160]. In addition to GC, miR-375 also exhibits a tumor suppressor miRNA role in many other malignant tumors, and circulating miR-375 is a potential diagnostic marker for other malignant tumors such as hepatocellular carcinoma[161], prostate cancer[162], non-small-cell lung cancer[163] and pancreatic cancer[164].
miR-218: The expression levels of miR-218 was identified to be significantly lower in GC patients than in healthy controls by Li et al[118] as well. As a single biomarker in plasma for GC detection, miR-218 produced a sensitivity of 94.29%, specificity of 44.29%, and AUC of 0.7432. In addition to this, miR-218 in the sera of patients with GC was also up-regulated after cytoreductive surgery (CRS) and hyperthermic intraperitoneal chemotherapy (HIPEC), and its expression level in the sera correlated with GC tumor grade, stage and metastasis[165,166], suggesting that circulating miR-218 might exhibit a prognostic value for GC patients. miR-218 expression in GC tissues was reduced significantly, and miR-218 overexpression notably inhibited GC cell proliferation, indicating the tumor suppressor role of miR-218 in GC. NF-kB, Robo1 and VOPP1 were identified as targets of miR-218[122,167,168]. In addition to GC, miR-218 were found to participate in tumorigenesis in various other types of cancer[131,169-171].
Other circulating miRNAs used in GC diagnosisCai et al[172] demonstrated that plasma miR-106b, miR-20a and miR-221 might serve as potential non-invasive biomarkers for GC detection with AUCs of 0.7733, 0.8593 and 0.7960, respectively. Tsai et al[173] suggested that serum miR-196a is significantly down-regulated in postoperative GC patients compared with preoperative GC patients and that the expression level of serum miR-196a is significantly increased when patients experience recurrence, indicating that miR-196a might serve as a promising biomarker for GC detection and disease relapse. Plasma miR-192 and miR-122 were also identified to exhibit potential in distinguishing GC patients with distant metastasis (GC/DM) from those with non-distant metastasis (GC/NDM), and the results indicated that the AUCs for discriminating GC/DM from GC/NDM were 0.732 for miR-192 and 0.808 for miR-122 and that the AUCs to discriminate GC patients from healthy controls were 0.818 for miR-192 and 0.815 for miR-122[174]. Gorur et al[175] stated that plasma miR-195-5p was most significantly down-regulated, with more than 13-fold changes in the expression in GC patients compared with control groups, suggesting its potential as a
Huang YK et al . Circulating microRNAs and long non-coding RNAs in GC diagnosis
9871 September 14, 2015|Volume 21|Issue 34|WJG|www.wjgnet.com
biomarker for GC detection. Moreover, the expression levels of serum miR-146a, miR-21 and miR-148a were associated with GC pN stage, and the combination of these three miRNAs could represent a biomarker candidate for differentiating LN metastasis of GC patients from LN-negative GC patients with an AUC of 0.764[120]. Wang et al[176] demonstrated that the expression levels of plasma miR-17-5p and miR-20a were significantly associated with the differentiation status and TNM stage of GC and that the elevated miR-17-5p/20a levels in plasma indicated poorer overall survival of patients with GC.
Summary of circulating miRNAs used in GC diagnosisThe characteristics of circulating miRNAs in GC detection are summarized in Table 1. The AUC, sensitivity and specificity ranges were 0.684-0.9531, 48.15%-94.29%, and 44.29%-95.7%, respectively. The combination of miR-223, miR-21 and miR-218 exhibited the highest diagnostic value for GC detection in humans, regardless of tumor site, tumor stage and pathological type, with an AUC of 0.9531, sensitivity of 84.29% and specificity of 92.86%. Among these circulating miRNAs, the combination of miR-16, miR-25, miR-92a, miR-451 and miR-486-5p; miR-210; the combination of miR-221, miR-376c and miR-744; miR-199a-3p; and the combination of miR-21 and miR-106b were observed to exert effective diagnostic values for the detection of early GC with an AUC range of 0.7-0.846, sensitivity range of 72%-75.8% and specificity range of 51.4%-89.2%. Of all of these combinations, the combination of miR-16, miR-25, miR-92a, miR-451 and miR-486-5p is indicative of the highest diagnostic value, with an AUC of 0.89, sensitivity of 84.1% and specificity of 90.8%. For non-cardiac early GC detection specifically, miRNA-199a-3p demonstrates the highest AUC of 0.818, with a sensitivity of 74% and specificity of 75%. Improvement of the early diagnosis of GC is the best way to improve the prognosis of patients with GC. For non-cardiac GC diagnosis, the combination of miR-16, miR-25, miR-92a, miR-451 and miR-486-5p produces the highest AUC value of 0.89, with a sensitivity of 84.1% and specificity of 90.8%. Concurrently, miR-375 has been identified to have potential in discriminating distal gastric adenocarcinoma (DGAC) patients from healthy individuals, with an AUC of 0.835, sensitivity of 80% and specificity of 85%. However, few studies have been conducted to examine the diagnostic value of circulating miRNAs for cardiac GC detection. miR-103, miR-107, miR-194 and miR-210 are utilized for the detection of diffuse-type GC (DGC), with a sensitivity range of 72.7%-90.9%, specificity range of 87.0%-95.7% and AUC range of 0.846-0.925. Of these miRNAs, miR-194 exhibits the highest diagnostic value with an AUC of 0.925, sensitivity of 90.9% and specificity of 95.7%; however, these miRNAs were detected in mouse lines rather than in humans, and the sample size was small (5
advanced-stage DGCs, 6 early-stage DGCs and 18 healthy controls)[101]. Therefore, these results must be validated in GC patients on a larger scale. As presented in Table 2, miR-1, miR-17-5p, miR-16, miR-18a, miR-20a, miR-21, miR-25, miR-27a, miR-34a, miR-92a, miR-100, miR-103, miR-106a, miR-106b, miR-107, miR-146a, miR-148a, miR-192, miR-194, miR-196a, miR-199a-3p, miR-200c, miR-210, miR-221, miR-223, miR-376c, miR-378, miR-423-5p, miR-421, miR-451, miR-486-5p, miR-744 and miR-93 are up-regulated in the circulation of GC patients; on the contrary, miR-195-5p, let-7a, miR-218, miR-375 and miR-122 are down-regulated in the circulation. Among these miRNAs, miR-17-5p, miR-18a, miR-20a, miR-21, miR-25, miR-27a, miR-92a, miR-100, miR-106a, miR-106b, miR-192, miR-221, miR-223, miR-423-5p, miR-421, and miR-93 are overexpressed in GC tissues, and these data suggest that this group of miRNAs represent onco-miRNAs in GC. In contrast, the expression levels of miR-1, miR-146a, miR-148a, miR-194, miR-200c, miR-218, miR-375 and miR-378 are down-regulated in GC tissues, indicating that these miRNAs act as tumor suppressor miRNAs. miR-16, miR-34a, miR-103, miR-107, miR-196a, miR-199a-3p, miR-210, miR-451, miR-486-5p and let-7a manifest inconsistent expression in GC tissues among different research studies, which may be the result of different inclusion or exclusion criteria of study subjects, different accuracies of profiling platforms, different protocols for specimen collection and processing, previous cytotoxic treatments, underestimated hypoxia and infection and tumor heterogeneity. However, the reason for these differences should be elucidated sufficiently in the future. In all the circulating miRNAs, the expression levels of miR-1, miR-146a, miR-148a, miR-194, miR-200c, miR-218, miR-375 and miR-378 in GC tissues are inconsistent with their circulating levels, suggesting that these miRNAs are actively secreted into the circulation or by other mechanisms rather than by being passively released. Although the function and origin of circulating miRNAs in patients with GC have not been systematically clarified, they have exhibited superior diagnostic value as biomarkers for GC detection compared with conventional tumor markers such as CA199, CA125, CA724, CA242, CA50 and CEA. To standardize the results of global investigations of circulating miRNA biomarker studies, formal recommendations for pre-analytic considerations have been put forward[177]. Circulating miRNAs have gained in popularity as biomarker candidates for GC diagnosis and screening.
PRIMARY CIRCULATING lncRNAs USED IN GC DIAGNOSISMain up-regulated circulating lncRNAs used in GC diagnosisH19: Arita et al[178] suggested that plasma H19
Huang YK et al . Circulating microRNAs and long non-coding RNAs in GC diagnosis
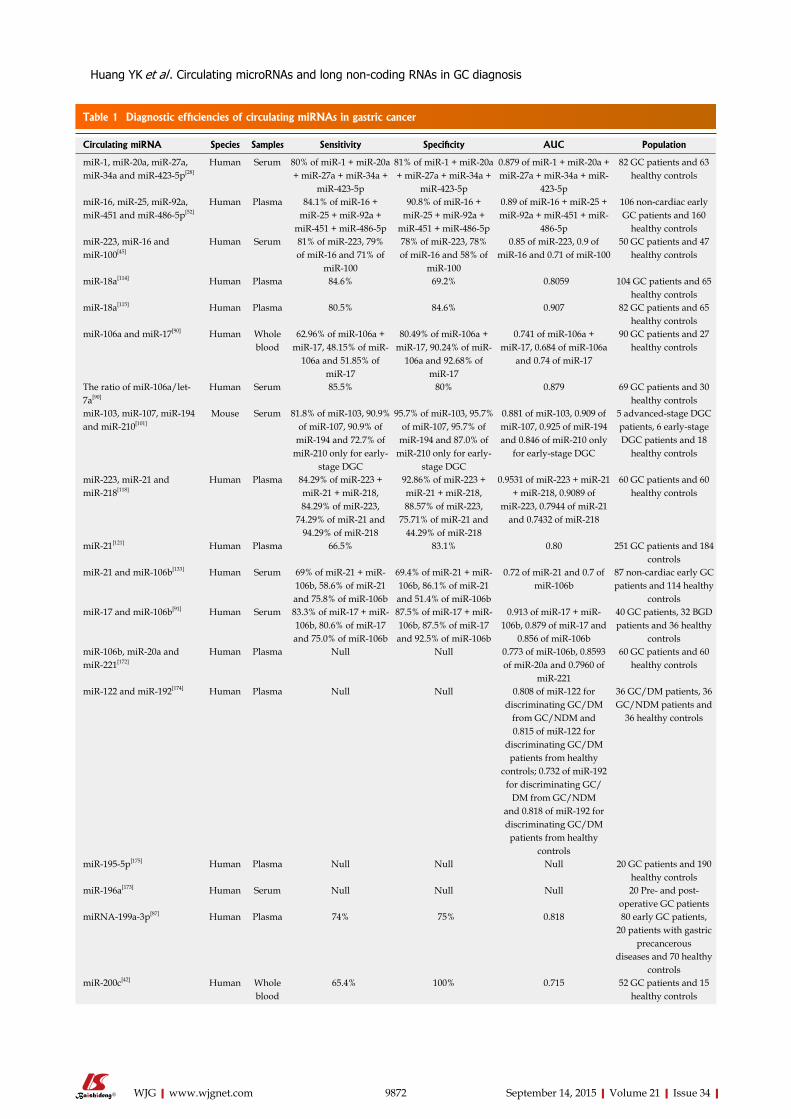
9872 September 14, 2015|Volume 21|Issue 34|WJG|www.wjgnet.com
Huang YK et al . Circulating microRNAs and long non-coding RNAs in GC diagnosis
Table 1 Diagnostic efficiencies of circulating miRNAs in gastric cancer
Circulating miRNA Species Samples Sensitivity Specificity AUC Population
miR-1, miR-20a, miR-27a, miR-34a and miR-423-5p[28]
Human Serum 80% of miR-1 + miR-20a + miR-27a + miR-34a +
miR-423-5p
81% of miR-1 + miR-20a + miR-27a + miR-34a +
miR-423-5p
0.879 of miR-1 + miR-20a + miR-27a + miR-34a + miR-
423-5p
82 GC patients and 63 healthy controls
miR-16, miR-25, miR-92a, miR-451 and miR-486-5p[52]
Human Plasma 84.1% of miR-16 + miR-25 + miR-92a +
miR-451 + miR-486-5p
90.8% of miR-16 + miR-25 + miR-92a +
miR-451 + miR-486-5p
0.89 of miR-16 + miR-25 + miR-92a + miR-451 + miR-
486-5p
106 non-cardiac early GC patients and 160
healthy controlsmiR-223, miR-16 and miR-100[45]
Human Serum 81% of miR-223, 79% of miR-16 and 71% of
miR-100
78% of miR-223, 78% of miR-16 and 58% of
miR-100
0.85 of miR-223, 0.9 of miR-16 and 0.71 of miR-100
50 GC patients and 47 healthy controls
miR-18a[114] Human Plasma 84.6% 69.2% 0.8059 104 GC patients and 65 healthy controls
miR-18a[115] Human Plasma 80.5% 84.6% 0.907 82 GC patients and 65 healthy controls
miR-106a and miR-17[90] Human Whole blood
62.96% of miR-106a + miR-17, 48.15% of miR-
106a and 51.85% of miR-17
80.49% of miR-106a + miR-17, 90.24% of miR-
106a and 92.68% of miR-17
0.741 of miR-106a + miR-17, 0.684 of miR-106a
and 0.74 of miR-17
90 GC patients and 27 healthy controls
The ratio of miR-106a/let-7a[90]
Human Serum 85.5% 80% 0.879 69 GC patients and 30 healthy controls
miR-103, miR-107, miR-194 and miR-210[101]
Mouse Serum 81.8% of miR-103, 90.9% of miR-107, 90.9% of
miR-194 and 72.7% of miR-210 only for early-
stage DGC
95.7% of miR-103, 95.7% of miR-107, 95.7% of
miR-194 and 87.0% of miR-210 only for early-
stage DGC
0.881 of miR-103, 0.909 of miR-107, 0.925 of miR-194 and 0.846 of miR-210 only
for early-stage DGC
5 advanced-stage DGC patients, 6 early-stage DGC patients and 18
healthy controls
miR-223, miR-21 and miR-218[118]
Human Plasma 84.29% of miR-223 + miR-21 + miR-218, 84.29% of miR-223,
74.29% of miR-21 and 94.29% of miR-218
92.86% of miR-223 + miR-21 + miR-218, 88.57% of miR-223,
75.71% of miR-21 and 44.29% of miR-218
0.9531 of miR-223 + miR-21 + miR-218, 0.9089 of
miR-223, 0.7944 of miR-21 and 0.7432 of miR-218
60 GC patients and 60 healthy controls
miR-21[121] Human Plasma 66.5% 83.1% 0.80 251 GC patients and 184 controls
miR-21 and miR-106b[133] Human Serum 69% of miR-21 + miR-106b, 58.6% of miR-21 and 75.8% of miR-106b
69.4% of miR-21 + miR-106b, 86.1% of miR-21 and 51.4% of miR-106b
0.72 of miR-21 and 0.7 of miR-106b
87 non-cardiac early GC patients and 114 healthy
controlsmiR-17 and miR-106b[91] Human Serum 83.3% of miR-17 + miR-
106b, 80.6% of miR-17 and 75.0% of miR-106b
87.5% of miR-17 + miR-106b, 87.5% of miR-17 and 92.5% of miR-106b
0.913 of miR-17 + miR-106b, 0.879 of miR-17 and
0.856 of miR-106b
40 GC patients, 32 BGD patients and 36 healthy
controlsmiR-106b, miR-20a and miR-221[172]
Human Plasma Null Null 0.773 of miR-106b, 0.8593 of miR-20a and 0.7960 of
miR-221
60 GC patients and 60 healthy controls
miR-122 and miR-192[174] Human Plasma Null Null 0.808 of miR-122 for discriminating GC/DM
from GC/NDM and 0.815 of miR-122 for
discriminating GC/DM patients from healthy
controls; 0.732 of miR-192 for discriminating GC/
DM from GC/NDM and 0.818 of miR-192 for discriminating GC/DM
patients from healthy controls
36 GC/DM patients, 36 GC/NDM patients and
36 healthy controls
miR-195-5p[175] Human Plasma Null Null Null 20 GC patients and 190 healthy controls
miR-196a[173] Human Serum Null Null Null 20 Pre- and post-operative GC patients
miRNA-199a-3p[87] Human Plasma 74% 75% 0.818 80 early GC patients, 20 patients with gastric
precancerousdiseases and 70 healthy
controlsmiR-200c[42] Human Whole
blood 65.4% 100% 0.715 52 GC patients and 15
healthy controls
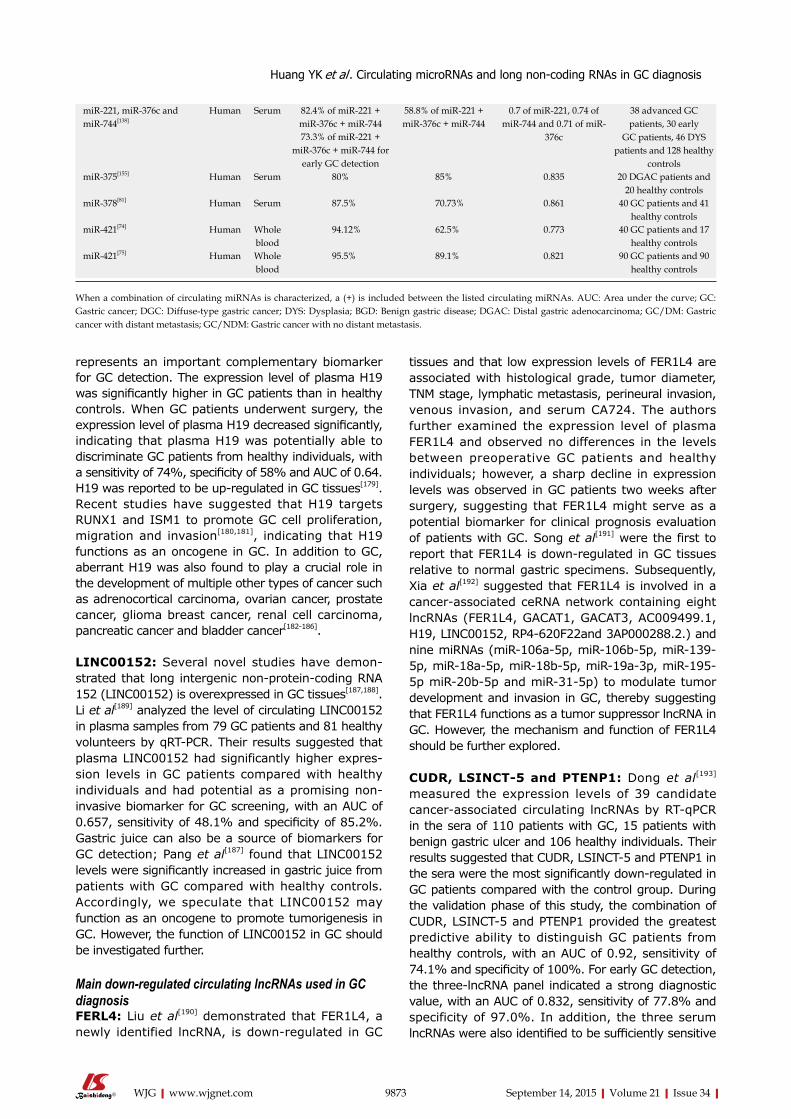
9873 September 14, 2015|Volume 21|Issue 34|WJG|www.wjgnet.com
represents an important complementary biomarker for GC detection. The expression level of plasma H19 was significantly higher in GC patients than in healthy controls. When GC patients underwent surgery, the expression level of plasma H19 decreased significantly, indicating that plasma H19 was potentially able to discriminate GC patients from healthy individuals, with a sensitivity of 74%, specificity of 58% and AUC of 0.64. H19 was reported to be up-regulated in GC tissues[179]. Recent studies have suggested that H19 targets RUNX1 and ISM1 to promote GC cell proliferation, migration and invasion[180,181], indicating that H19 functions as an oncogene in GC. In addition to GC, aberrant H19 was also found to play a crucial role in the development of multiple other types of cancer such as adrenocortical carcinoma, ovarian cancer, prostate cancer, glioma breast cancer, renal cell carcinoma, pancreatic cancer and bladder cancer[182-186].
LINC00152: Several novel studies have demon-strated that long intergenic non-protein-coding RNA 152 (LINC00152) is overexpressed in GC tissues[187,188]. Li et al[189] analyzed the level of circulating LINC00152 in plasma samples from 79 GC patients and 81 healthy volunteers by qRT-PCR. Their results suggested that plasma LINC00152 had significantly higher expres-sion levels in GC patients compared with healthy individuals and had potential as a promising non-invasive biomarker for GC screening, with an AUC of 0.657, sensitivity of 48.1% and specificity of 85.2%. Gastric juice can also be a source of biomarkers for GC detection; Pang et al[187] found that LINC00152 levels were significantly increased in gastric juice from patients with GC compared with healthy controls. Accordingly, we speculate that LINC00152 may function as an oncogene to promote tumorigenesis in GC. However, the function of LINC00152 in GC should be investigated further.
Main down-regulated circulating lncRNAs used in GC diagnosisFERL4: Liu et al[190] demonstrated that FER1L4, a newly identified lncRNA, is down-regulated in GC
tissues and that low expression levels of FER1L4 are associated with histological grade, tumor diameter, TNM stage, lymphatic metastasis, perineural invasion, venous invasion, and serum CA724. The authors further examined the expression level of plasma FER1L4 and observed no differences in the levels between preoperative GC patients and healthy individuals; however, a sharp decline in expression levels was observed in GC patients two weeks after surgery, suggesting that FER1L4 might serve as a potential biomarker for clinical prognosis evaluation of patients with GC. Song et al[191] were the first to report that FER1L4 is down-regulated in GC tissues relative to normal gastric specimens. Subsequently, Xia et al[192] suggested that FER1L4 is involved in a cancer-associated ceRNA network containing eight lncRNAs (FER1L4, GACAT1, GACAT3, AC009499.1, H19, LINC00152, RP4-620F22and 3AP000288.2.) and nine miRNAs (miR-106a-5p, miR-106b-5p, miR-139-5p, miR-18a-5p, miR-18b-5p, miR-19a-3p, miR-195-5p miR-20b-5p and miR-31-5p) to modulate tumor development and invasion in GC, thereby suggesting that FER1L4 functions as a tumor suppressor lncRNA in GC. However, the mechanism and function of FER1L4 should be further explored.
CUDR, LSINCT-5 and PTENP1: Dong et al[193] measured the expression levels of 39 candidate cancer-associated circulating lncRNAs by RT-qPCR in the sera of 110 patients with GC, 15 patients with benign gastric ulcer and 106 healthy individuals. Their results suggested that CUDR, LSINCT-5 and PTENP1 in the sera were the most significantly down-regulated in GC patients compared with the control group. During the validation phase of this study, the combination of CUDR, LSINCT-5 and PTENP1 provided the greatest predictive ability to distinguish GC patients from healthy controls, with an AUC of 0.92, sensitivity of 74.1% and specificity of 100%. For early GC detection, the three-lncRNA panel indicated a strong diagnostic value, with an AUC of 0.832, sensitivity of 77.8% and specificity of 97.0%. In addition, the three serum lncRNAs were also identified to be sufficiently sensitive
Huang YK et al . Circulating microRNAs and long non-coding RNAs in GC diagnosis
When a combination of circulating miRNAs is characterized, a (+) is included between the listed circulating miRNAs. AUC: Area under the curve; GC: Gastric cancer; DGC: Diffuse-type gastric cancer; DYS: Dysplasia; BGD: Benign gastric disease; DGAC: Distal gastric adenocarcinoma; GC/DM: Gastric cancer with distant metastasis; GC/NDM: Gastric cancer with no distant metastasis.
miR-221, miR-376c and miR-744[138]
Human Serum 82.4% of miR-221 + miR-376c + miR-744
58.8% of miR-221 + miR-376c + miR-744
0.7 of miR-221, 0.74 of miR-744 and 0.71 of miR-
376c
38 advanced GC patients, 30 early
GC patients, 46 DYS patients and 128 healthy
controls
73.3% of miR-221 + miR-376c + miR-744 for
early GC detection miR-375[155] Human Serum 80% 85% 0.835 20 DGAC patients and
20 healthy controlsmiR-378[81] Human Serum 87.5% 70.73% 0.861 40 GC patients and 41
healthy controlsmiR-421[74] Human Whole
blood 94.12% 62.5% 0.773 40 GC patients and 17
healthy controlsmiR-421[75] Human Whole
blood 95.5% 89.1% 0.821 90 GC patients and 90
healthy controls
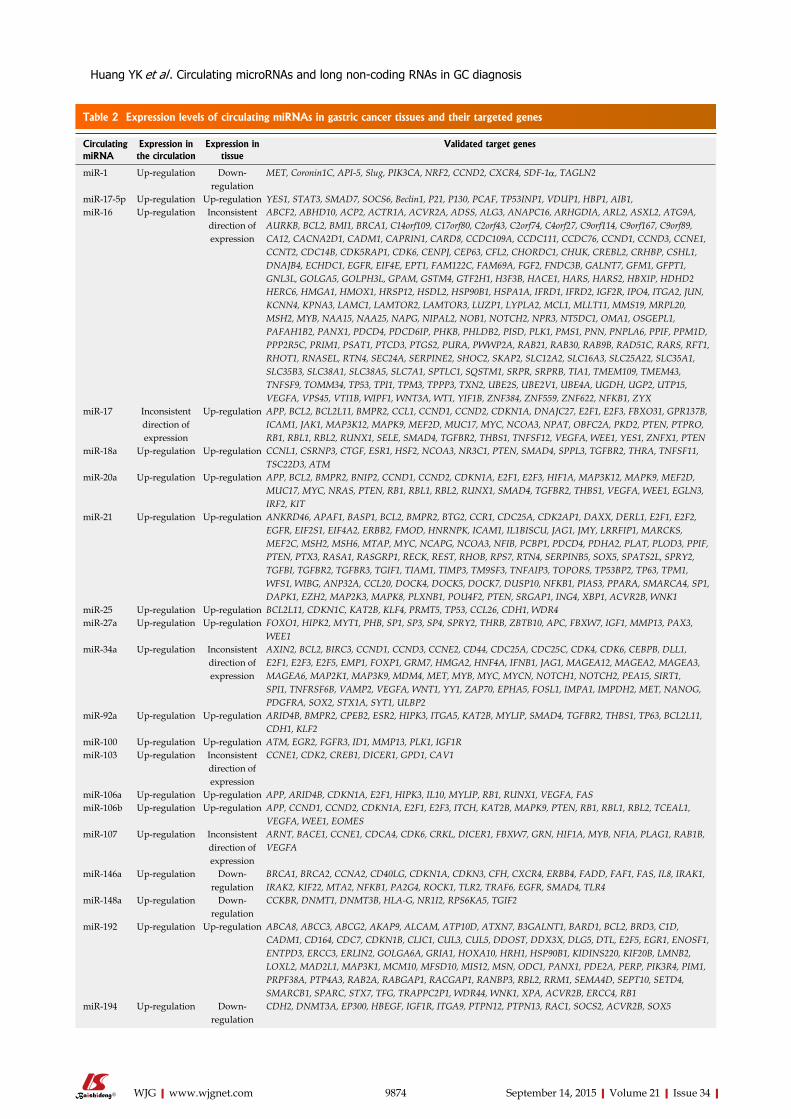
9874 September 14, 2015|Volume 21|Issue 34|WJG|www.wjgnet.com
Huang YK et al . Circulating microRNAs and long non-coding RNAs in GC diagnosis
Table 2 Expression levels of circulating miRNAs in gastric cancer tissues and their targeted genes
Circulating miRNA
Expression in the circulation
Expression in tissue
Validated target genes
miR-1 Up-regulation Down-regulation
MET, Coronin1C, API-5, Slug, PIK3CA, NRF2, CCND2, CXCR4, SDF-1α, TAGLN2
miR-17-5p Up-regulation Up-regulation YES1, STAT3, SMAD7, SOCS6, Beclin1, P21, P130, PCAF, TP53INP1, VDUP1, HBP1, AIB1, miR-16 Up-regulation Inconsistent
direction of expression
ABCF2, ABHD10, ACP2, ACTR1A, ACVR2A, ADSS, ALG3, ANAPC16, ARHGDIA, ARL2, ASXL2, ATG9A, AURKB, BCL2, BMI1, BRCA1, C14orf109, C17orf80, C2orf43, C2orf74, C4orf27, C9orf114, C9orf167, C9orf89, CA12, CACNA2D1, CADM1, CAPRIN1, CARD8, CCDC109A, CCDC111, CCDC76, CCND1, CCND3, CCNE1, CCNT2, CDC14B, CDK5RAP1, CDK6, CENPJ, CEP63, CFL2, CHORDC1, CHUK, CREBL2, CRHBP, CSHL1, DNAJB4, ECHDC1, EGFR, EIF4E, EPT1, FAM122C, FAM69A, FGF2, FNDC3B, GALNT7, GFM1, GFPT1, GNL3L, GOLGA5, GOLPH3L, GPAM, GSTM4, GTF2H1, H3F3B, HACE1, HARS, HARS2, HBXIP, HDHD2HERC6, HMGA1, HMOX1, HRSP12, HSDL2, HSP90B1, HSPA1A, IFRD1, IFRD2, IGF2R, IPO4, ITGA2, JUN, KCNN4, KPNA3, LAMC1, LAMTOR2, LAMTOR3, LUZP1, LYPLA2, MCL1, MLLT11, MMS19, MRPL20, MSH2, MYB, NAA15, NAA25, NAPG, NIPAL2, NOB1, NOTCH2, NPR3, NT5DC1, OMA1, OSGEPL1, PAFAH1B2, PANX1, PDCD4, PDCD6IP, PHKB, PHLDB2, PISD, PLK1, PMS1, PNN, PNPLA6, PPIF, PPM1D, PPP2R5C, PRIM1, PSAT1, PTCD3, PTGS2, PURA, PWWP2A, RAB21, RAB30, RAB9B, RAD51C, RARS, RFT1, RHOT1, RNASEL, RTN4, SEC24A, SERPINE2, SHOC2, SKAP2, SLC12A2, SLC16A3, SLC25A22, SLC35A1, SLC35B3, SLC38A1, SLC38A5, SLC7A1, SPTLC1, SQSTM1, SRPR, SRPRB, TIA1, TMEM109, TMEM43, TNFSF9, TOMM34, TP53, TPI1, TPM3, TPPP3, TXN2, UBE2S, UBE2V1, UBE4A, UGDH, UGP2, UTP15, VEGFA, VPS45, VTI1B, WIPF1, WNT3A, WT1, YIF1B, ZNF384, ZNF559, ZNF622, NFKB1, ZYX
miR-17 Inconsistent direction of expression
Up-regulation APP, BCL2, BCL2L11, BMPR2, CCL1, CCND1, CCND2, CDKN1A, DNAJC27, E2F1, E2F3, FBXO31, GPR137B, ICAM1, JAK1, MAP3K12, MAPK9, MEF2D, MUC17, MYC, NCOA3, NPAT, OBFC2A, PKD2, PTEN, PTPRO, RB1, RBL1, RBL2, RUNX1, SELE, SMAD4, TGFBR2, THBS1, TNFSF12, VEGFA, WEE1, YES1, ZNFX1, PTEN
miR-18a Up-regulation Up-regulation CCNL1, CSRNP3, CTGF, ESR1, HSF2, NCOA3, NR3C1, PTEN, SMAD4, SPPL3, TGFBR2, THRA, TNFSF11, TSC22D3, ATM
miR-20a Up-regulation Up-regulation APP, BCL2, BMPR2, BNIP2, CCND1, CCND2, CDKN1A, E2F1, E2F3, HIF1A, MAP3K12, MAPK9, MEF2D, MUC17, MYC, NRAS, PTEN, RB1, RBL1, RBL2, RUNX1, SMAD4, TGFBR2, THBS1, VEGFA, WEE1, EGLN3, IRF2, KIT
miR-21 Up-regulation Up-regulation ANKRD46, APAF1, BASP1, BCL2, BMPR2, BTG2, CCR1, CDC25A, CDK2AP1, DAXX, DERL1, E2F1, E2F2, EGFR, EIF2S1, EIF4A2, ERBB2, FMOD, HNRNPK, ICAM1, IL1BISCU, JAG1, JMY, LRRFIP1, MARCKS, MEF2C, MSH2, MSH6, MTAP, MYC, NCAPG, NCOA3, NFIB, PCBP1, PDCD4, PDHA2, PLAT, PLOD3, PPIF, PTEN, PTX3, RASA1, RASGRP1, RECK, REST, RHOB, RPS7, RTN4, SERPINB5, SOX5, SPATS2L, SPRY2, TGFBI, TGFBR2, TGFBR3, TGIF1, TIAM1, TIMP3, TM9SF3, TNFAIP3, TOPORS, TP53BP2, TP63, TPM1, WFS1, WIBG, ANP32A, CCL20, DOCK4, DOCK5, DOCK7, DUSP10, NFKB1, PIAS3, PPARA, SMARCA4, SP1, DAPK1, EZH2, MAP2K3, MAPK8, PLXNB1, POU4F2, PTEN, SRGAP1, ING4, XBP1, ACVR2B, WNK1
miR-25 Up-regulation Up-regulation BCL2L11, CDKN1C, KAT2B, KLF4, PRMT5, TP53, CCL26, CDH1, WDR4miR-27a Up-regulation Up-regulation FOXO1, HIPK2, MYT1, PHB, SP1, SP3, SP4, SPRY2, THRB, ZBTB10, APC, FBXW7, IGF1, MMP13, PAX3,
WEE1miR-34a Up-regulation Inconsistent
direction of expression
AXIN2, BCL2, BIRC3, CCND1, CCND3, CCNE2, CD44, CDC25A, CDC25C, CDK4, CDK6, CEBPB, DLL1, E2F1, E2F3, E2F5, EMP1, FOXP1, GRM7, HMGA2, HNF4A, IFNB1, JAG1, MAGEA12, MAGEA2, MAGEA3, MAGEA6, MAP2K1, MAP3K9, MDM4, MET, MYB, MYC, MYCN, NOTCH1, NOTCH2, PEA15, SIRT1, SPI1, TNFRSF6B, VAMP2, VEGFA, WNT1, YY1, ZAP70, EPHA5, FOSL1, IMPA1, IMPDH2, MET, NANOG, PDGFRA, SOX2, STX1A, SYT1, ULBP2
miR-92a Up-regulation Up-regulation ARID4B, BMPR2, CPEB2, ESR2, HIPK3, ITGA5, KAT2B, MYLIP, SMAD4, TGFBR2, THBS1, TP63, BCL2L11, CDH1, KLF2
miR-100 Up-regulation Up-regulation ATM, EGR2, FGFR3, ID1, MMP13, PLK1, IGF1RmiR-103 Up-regulation Inconsistent
direction of expression
CCNE1, CDK2, CREB1, DICER1, GPD1, CAV1
miR-106a Up-regulation Up-regulation APP, ARID4B, CDKN1A, E2F1, HIPK3, IL10, MYLIP, RB1, RUNX1, VEGFA, FASmiR-106b Up-regulation Up-regulation APP, CCND1, CCND2, CDKN1A, E2F1, E2F3, ITCH, KAT2B, MAPK9, PTEN, RB1, RBL1, RBL2, TCEAL1,
VEGFA, WEE1, EOMESmiR-107 Up-regulation Inconsistent
direction of expression
ARNT, BACE1, CCNE1, CDCA4, CDK6, CRKL, DICER1, FBXW7, GRN, HIF1A, MYB, NFIA, PLAG1, RAB1B, VEGFA
miR-146a Up-regulation Down-regulation
BRCA1, BRCA2, CCNA2, CD40LG, CDKN1A, CDKN3, CFH, CXCR4, ERBB4, FADD, FAF1, FAS, IL8, IRAK1, IRAK2, KIF22, MTA2, NFKB1, PA2G4, ROCK1, TLR2, TRAF6, EGFR, SMAD4, TLR4
miR-148a Up-regulation Down-regulation
CCKBR, DNMT1, DNMT3B, HLA-G, NR1I2, RPS6KA5, TGIF2
miR-192 Up-regulation Up-regulation ABCA8, ABCC3, ABCG2, AKAP9, ALCAM, ATP10D, ATXN7, B3GALNT1, BARD1, BCL2, BRD3, C1D, CADM1, CD164, CDC7, CDKN1B, CLIC1, CUL3, CUL5, DDOST, DDX3X, DLG5, DTL, E2F5, EGR1, ENOSF1, ENTPD3, ERCC3, ERLIN2, GOLGA6A, GRIA1, HOXA10, HRH1, HSP90B1, KIDINS220, KIF20B, LMNB2, LOXL2, MAD2L1, MAP3K1, MCM10, MFSD10, MIS12, MSN, ODC1, PANX1, PDE2A, PERP, PIK3R4, PIM1, PRPF38A, PTP4A3, RAB2A, RABGAP1, RACGAP1, RANBP3, RBL2, RRM1, SEMA4D, SEPT10, SETD4, SMARCB1, SPARC, STX7, TFG, TRAPPC2P1, WDR44, WNK1, XPA, ACVR2B, ERCC4, RB1
miR-194 Up-regulation Down-regulation
CDH2, DNMT3A, EP300, HBEGF, IGF1R, ITGA9, PTPN12, PTPN13, RAC1, SOCS2, ACVR2B, SOX5
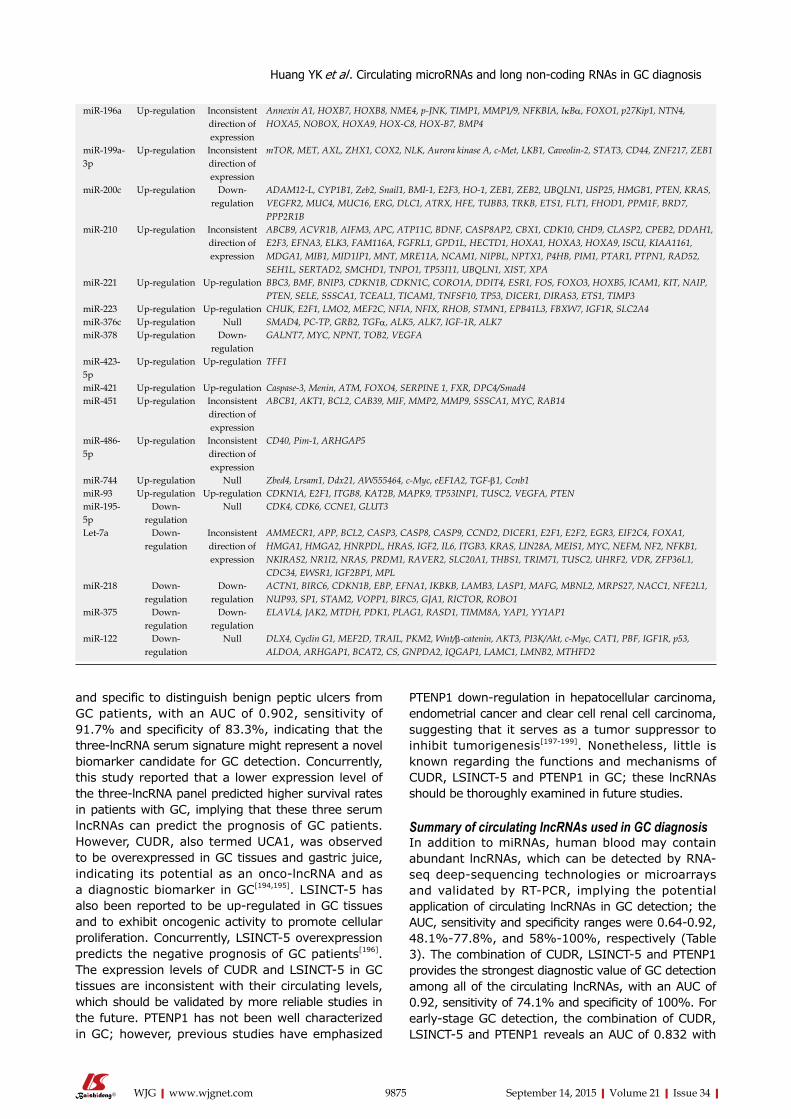
9875 September 14, 2015|Volume 21|Issue 34|WJG|www.wjgnet.com
and specific to distinguish benign peptic ulcers from GC patients, with an AUC of 0.902, sensitivity of 91.7% and specificity of 83.3%, indicating that the three-lncRNA serum signature might represent a novel biomarker candidate for GC detection. Concurrently, this study reported that a lower expression level of the three-lncRNA panel predicted higher survival rates in patients with GC, implying that these three serum lncRNAs can predict the prognosis of GC patients. However, CUDR, also termed UCA1, was observed to be overexpressed in GC tissues and gastric juice, indicating its potential as an onco-lncRNA and as a diagnostic biomarker in GC[194,195]. LSINCT-5 has also been reported to be up-regulated in GC tissues and to exhibit oncogenic activity to promote cellular proliferation. Concurrently, LSINCT-5 overexpression predicts the negative prognosis of GC patients[196]. The expression levels of CUDR and LSINCT-5 in GC tissues are inconsistent with their circulating levels, which should be validated by more reliable studies in the future. PTENP1 has not been well characterized in GC; however, previous studies have emphasized
PTENP1 down-regulation in hepatocellular carcinoma, endometrial cancer and clear cell renal cell carcinoma, suggesting that it serves as a tumor suppressor to inhibit tumorigenesis[197-199]. Nonetheless, little is known regarding the functions and mechanisms of CUDR, LSINCT-5 and PTENP1 in GC; these lncRNAs should be thoroughly examined in future studies.
Summary of circulating lncRNAs used in GC diagnosisIn addition to miRNAs, human blood may contain abundant lncRNAs, which can be detected by RNA-seq deep-sequencing technologies or microarrays and validated by RT-PCR, implying the potential application of circulating lncRNAs in GC detection; the AUC, sensitivity and specificity ranges were 0.64-0.92, 48.1%-77.8%, and 58%-100%, respectively (Table 3). The combination of CUDR, LSINCT-5 and PTENP1 provides the strongest diagnostic value of GC detection among all of the circulating lncRNAs, with an AUC of 0.92, sensitivity of 74.1% and specificity of 100%. For early-stage GC detection, the combination of CUDR, LSINCT-5 and PTENP1 reveals an AUC of 0.832 with
Huang YK et al . Circulating microRNAs and long non-coding RNAs in GC diagnosis
miR-196a Up-regulation Inconsistent direction of expression
Annexin A1, HOXB7, HOXB8, NME4, p-JNK, TIMP1, MMP1/9, NFKBIA, IkBα, FOXO1, p27Kip1, NTN4, HOXA5, NOBOX, HOXA9, HOX-C8, HOX-B7, BMP4
miR-199a-3p
Up-regulation Inconsistent direction of expression
mTOR, MET, AXL, ZHX1, COX2, NLK, Aurora kinase A, c-Met, LKB1, Caveolin-2, STAT3, CD44, ZNF217, ZEB1
miR-200c Up-regulation Down-regulation
ADAM12-L, CYP1B1, Zeb2, Snail1, BMI-1, E2F3, HO-1, ZEB1, ZEB2, UBQLN1, USP25, HMGB1, PTEN, KRAS, VEGFR2, MUC4, MUC16, ERG, DLC1, ATRX, HFE, TUBB3, TRKB, ETS1, FLT1, FHOD1, PPM1F, BRD7, PPP2R1B
miR-210 Up-regulation Inconsistent direction of expression
ABCB9, ACVR1B, AIFM3, APC, ATP11C, BDNF, CASP8AP2, CBX1, CDK10, CHD9, CLASP2, CPEB2, DDAH1, E2F3, EFNA3, ELK3, FAM116A, FGFRL1, GPD1L, HECTD1, HOXA1, HOXA3, HOXA9, ISCU, KIAA1161, MDGA1, MIB1, MID1IP1, MNT, MRE11A, NCAM1, NIPBL, NPTX1, P4HB, PIM1, PTAR1, PTPN1, RAD52, SEH1L, SERTAD2, SMCHD1, TNPO1, TP53I11, UBQLN1, XIST, XPA
miR-221 Up-regulation Up-regulation BBC3, BMF, BNIP3, CDKN1B, CDKN1C, CORO1A, DDIT4, ESR1, FOS, FOXO3, HOXB5, ICAM1, KIT, NAIP, PTEN, SELE, SSSCA1, TCEAL1, TICAM1, TNFSF10, TP53, DICER1, DIRAS3, ETS1, TIMP3
miR-223 Up-regulation Up-regulation CHUK, E2F1, LMO2, MEF2C, NFIA, NFIX, RHOB, STMN1, EPB41L3, FBXW7, IGF1R, SLC2A4miR-376c Up-regulation Null SMAD4, PC-TP, GRB2, TGFα, ALK5, ALK7, IGF-1R, ALK7miR-378 Up-regulation Down-
regulationGALNT7, MYC, NPNT, TOB2, VEGFA
miR-423-5p
Up-regulation Up-regulation TFF1
miR-421 Up-regulation Up-regulation Caspase-3, Menin, ATM, FOXO4, SERPINE 1, FXR, DPC4/Smad4miR-451 Up-regulation Inconsistent
direction of expression
ABCB1, AKT1, BCL2, CAB39, MIF, MMP2, MMP9, SSSCA1, MYC, RAB14
miR-486-5p
Up-regulation Inconsistent direction of expression
CD40, Pim-1, ARHGAP5
miR-744 Up-regulation Null Zbed4, Lrsam1, Ddx21, AW555464, c-Myc, eEF1A2, TGF-β1, Ccnb1miR-93 Up-regulation Up-regulation CDKN1A, E2F1, ITGB8, KAT2B, MAPK9, TP53INP1, TUSC2, VEGFA, PTENmiR-195-5p
Down-regulation
Null CDK4, CDK6, CCNE1, GLUT3
Let-7a Down-regulation
Inconsistent direction of expression
AMMECR1, APP, BCL2, CASP3, CASP8, CASP9, CCND2, DICER1, E2F1, E2F2, EGR3, EIF2C4, FOXA1, HMGA1, HMGA2, HNRPDL, HRAS, IGF2, IL6, ITGB3, KRAS, LIN28A, MEIS1, MYC, NEFM, NF2, NFKB1, NKIRAS2, NR1I2, NRAS, PRDM1, RAVER2, SLC20A1, THBS1, TRIM71, TUSC2, UHRF2, VDR, ZFP36L1, CDC34, EWSR1, IGF2BP1, MPL
miR-218 Down-regulation
Down-regulation
ACTN1, BIRC6, CDKN1B, EBP, EFNA1, IKBKB, LAMB3, LASP1, MAFG, MBNL2, MRPS27, NACC1, NFE2L1, NUP93, SP1, STAM2, VOPP1, BIRC5, GJA1, RICTOR, ROBO1
miR-375 Down-regulation
Down-regulation
ELAVL4, JAK2, MTDH, PDK1, PLAG1, RASD1, TIMM8A, YAP1, YY1AP1
miR-122 Down-regulation
Null DLX4, Cyclin G1, MEF2D, TRAIL, PKM2, Wnt/β-catenin, AKT3, PI3K/Akt, c-Myc, CAT1, PBF, IGF1R, p53, ALDOA, ARHGAP1, BCAT2, CS, GNPDA2, IQGAP1, LAMC1, LMNB2, MTHFD2
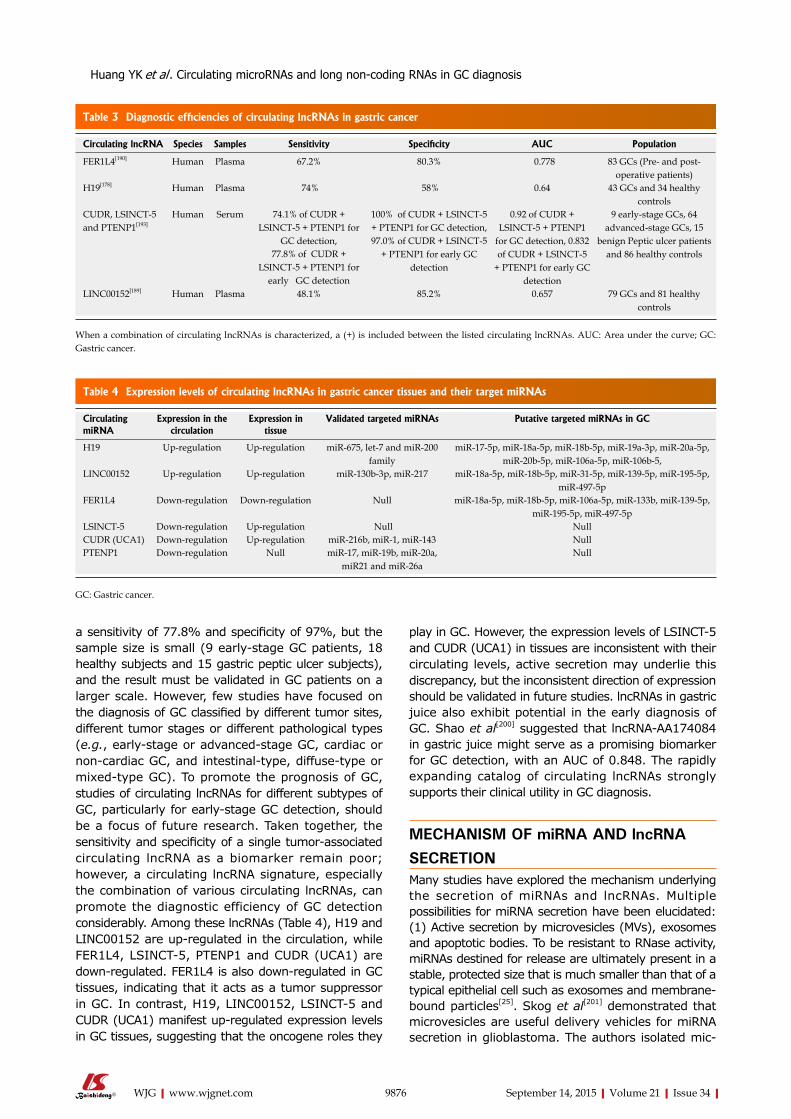
9876 September 14, 2015|Volume 21|Issue 34|WJG|www.wjgnet.com
a sensitivity of 77.8% and specificity of 97%, but the sample size is small (9 early-stage GC patients, 18 healthy subjects and 15 gastric peptic ulcer subjects), and the result must be validated in GC patients on a larger scale. However, few studies have focused on the diagnosis of GC classified by different tumor sites, different tumor stages or different pathological types (e.g., early-stage or advanced-stage GC, cardiac or non-cardiac GC, and intestinal-type, diffuse-type or mixed-type GC). To promote the prognosis of GC, studies of circulating lncRNAs for different subtypes of GC, particularly for early-stage GC detection, should be a focus of future research. Taken together, the sensitivity and specificity of a single tumor-associated circulating lncRNA as a biomarker remain poor; however, a circulating lncRNA signature, especially the combination of various circulating lncRNAs, can promote the diagnostic efficiency of GC detection considerably. Among these lncRNAs (Table 4), H19 and LINC00152 are up-regulated in the circulation, while FER1L4, LSINCT-5, PTENP1 and CUDR (UCA1) are down-regulated. FER1L4 is also down-regulated in GC tissues, indicating that it acts as a tumor suppressor in GC. In contrast, H19, LINC00152, LSINCT-5 and CUDR (UCA1) manifest up-regulated expression levels in GC tissues, suggesting that the oncogene roles they
play in GC. However, the expression levels of LSINCT-5 and CUDR (UCA1) in tissues are inconsistent with their circulating levels, active secretion may underlie this discrepancy, but the inconsistent direction of expression should be validated in future studies. lncRNAs in gastric juice also exhibit potential in the early diagnosis of GC. Shao et al[200] suggested that lncRNA-AA174084 in gastric juice might serve as a promising biomarker for GC detection, with an AUC of 0.848. The rapidly expanding catalog of circulating lncRNAs strongly supports their clinical utility in GC diagnosis.
MECHANISM OF miRNA AND lncRNA SECRETIONMany studies have explored the mechanism underlying the secretion of miRNAs and lncRNAs. Multiple possibilities for miRNA secretion have been elucidated: (1) Active secretion by microvesicles (MVs), exosomes and apoptotic bodies. To be resistant to RNase activity, miRNAs destined for release are ultimately present in a stable, protected size that is much smaller than that of a typical epithelial cell such as exosomes and membrane-bound particles[25]. Skog et al[201] demonstrated that microvesicles are useful delivery vehicles for miRNA secretion in glioblastoma. The authors isolated mic-
Table 3 Diagnostic efficiencies of circulating lncRNAs in gastric cancer
Circulating lncRNA Species Samples Sensitivity Specificity AUC Population
FER1L4[190] Human Plasma 67.2% 80.3% 0.778 83 GCs (Pre- and post-operative patients)
H19[178] Human Plasma 74% 58% 0.64 43 GCs and 34 healthy controls
CUDR, LSINCT-5 and PTENP1[193]
Human Serum 74.1% of CUDR + LSINCT-5 + PTENP1 for
GC detection,
100% of CUDR + LSINCT-5 + PTENP1 for GC detection, 97.0% of CUDR + LSINCT-5
+ PTENP1 for early GC detection
0.92 of CUDR + LSINCT-5 + PTENP1
for GC detection, 0.832 of CUDR + LSINCT-5
+ PTENP1 for early GC detection
9 early-stage GCs, 64 advanced-stage GCs, 15
benign Peptic ulcer patients and 86 healthy controls77.8% of CUDR +
LSINCT-5 + PTENP1 for early GC detection
LINC00152[189] Human Plasma 48.1% 85.2% 0.657 79 GCs and 81 healthy controls
When a combination of circulating lncRNAs is characterized, a (+) is included between the listed circulating lncRNAs. AUC: Area under the curve; GC: Gastric cancer.
Table 4 Expression levels of circulating lncRNAs in gastric cancer tissues and their target miRNAs
Circulating miRNA
Expression in the circulation
Expression in tissue
Validated targeted miRNAs Putative targeted miRNAs in GC
H19 Up-regulation Up-regulation miR-675, let-7 and miR-200 family
miR-17-5p, miR-18a-5p, miR-18b-5p, miR-19a-3p, miR-20a-5p, miR-20b-5p, miR-106a-5p, miR-106b-5,
LINC00152 Up-regulation Up-regulation miR-130b-3p, miR-217 miR-18a-5p, miR-18b-5p, miR-31-5p, miR-139-5p, miR-195-5p, miR-497-5p
FER1L4 Down-regulation Down-regulation Null miR-18a-5p, miR-18b-5p, miR-106a-5p, miR-133b, miR-139-5p, miR-195-5p, miR-497-5p
LSINCT-5 Down-regulation Up-regulation Null NullCUDR (UCA1) Down-regulation Up-regulation miR-216b, miR-1, miR-143 NullPTENP1 Down-regulation Null miR-17, miR-19b, miR-20a,
miR21 and miR-26a Null
GC: Gastric cancer.
Huang YK et al . Circulating microRNAs and long non-coding RNAs in GC diagnosis
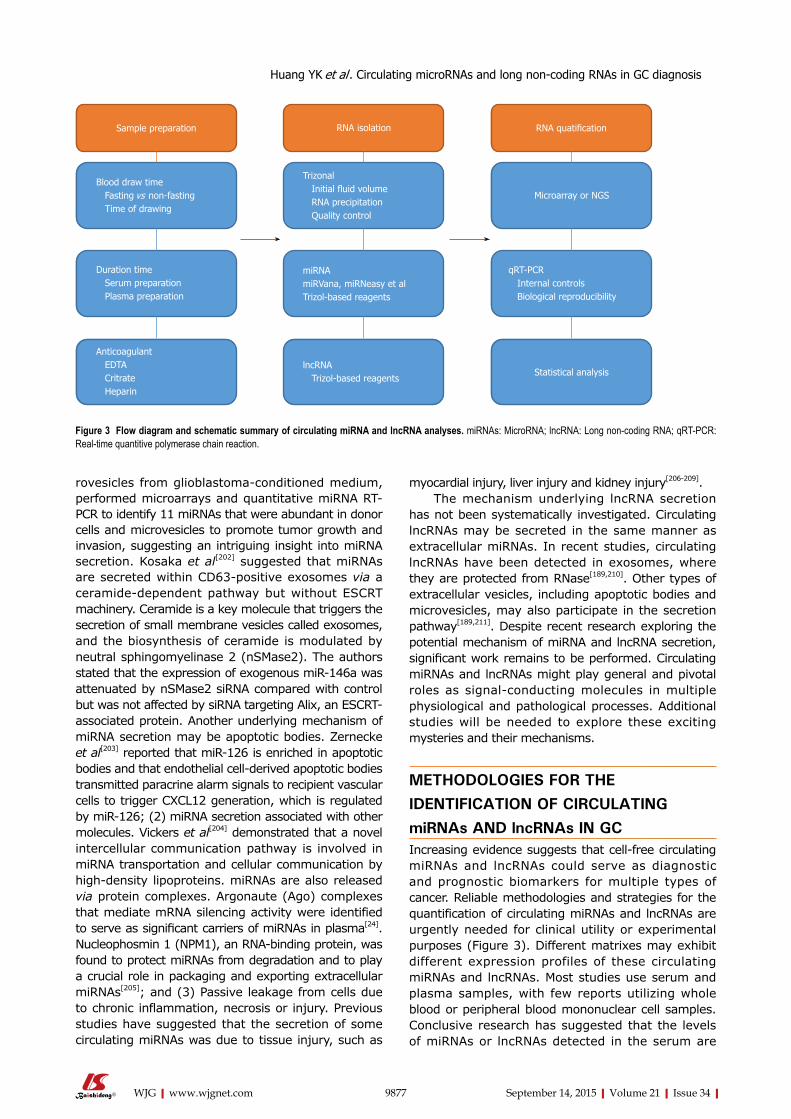
9877 September 14, 2015|Volume 21|Issue 34|WJG|www.wjgnet.com
rovesicles from glioblastoma-conditioned medium, performed microarrays and quantitative miRNA RT-PCR to identify 11 miRNAs that were abundant in donor cells and microvesicles to promote tumor growth and invasion, suggesting an intriguing insight into miRNA secretion. Kosaka et al[202] suggested that miRNAs are secreted within CD63-positive exosomes via a ceramide-dependent pathway but without ESCRT machinery. Ceramide is a key molecule that triggers the secretion of small membrane vesicles called exosomes, and the biosynthesis of ceramide is modulated by neutral sphingomyelinase 2 (nSMase2). The authors stated that the expression of exogenous miR-146a was attenuated by nSMase2 siRNA compared with control but was not affected by siRNA targeting Alix, an ESCRT-associated protein. Another underlying mechanism of miRNA secretion may be apoptotic bodies. Zernecke et al[203] reported that miR-126 is enriched in apoptotic bodies and that endothelial cell-derived apoptotic bodies transmitted paracrine alarm signals to recipient vascular cells to trigger CXCL12 generation, which is regulated by miR-126; (2) miRNA secretion associated with other molecules. Vickers et al[204] demonstrated that a novel intercellular communication pathway is involved in miRNA transportation and cellular communication by high-density lipoproteins. miRNAs are also released via protein complexes. Argonaute (Ago) complexes that mediate mRNA silencing activity were identified to serve as significant carriers of miRNAs in plasma[24]. Nucleophosmin 1 (NPM1), an RNA-binding protein, was found to protect miRNAs from degradation and to play a crucial role in packaging and exporting extracellular miRNAs[205]; and (3) Passive leakage from cells due to chronic inflammation, necrosis or injury. Previous studies have suggested that the secretion of some circulating miRNAs was due to tissue injury, such as
myocardial injury, liver injury and kidney injury[206-209]. The mechanism underlying lncRNA secretion
has not been systematically investigated. Circulating lncRNAs may be secreted in the same manner as extracellular miRNAs. In recent studies, circulating lncRNAs have been detected in exosomes, where they are protected from RNase[189,210]. Other types of extracellular vesicles, including apoptotic bodies and microvesicles, may also participate in the secretion pathway[189,211]. Despite recent research exploring the potential mechanism of miRNA and lncRNA secretion, significant work remains to be performed. Circulating miRNAs and lncRNAs might play general and pivotal roles as signal-conducting molecules in multiple physiological and pathological processes. Additional studies will be needed to explore these exciting mysteries and their mechanisms.
METHODOLOGIES FOR THE IDENTIFICATION OF CIRCULATING miRNAs AND lncRNAs IN GCIncreasing evidence suggests that cell-free circulating miRNAs and lncRNAs could serve as diagnostic and prognostic biomarkers for multiple types of cancer. Reliable methodologies and strategies for the quantification of circulating miRNAs and lncRNAs are urgently needed for clinical utility or experimental purposes (Figure 3). Different matrixes may exhibit different expression profiles of these circulating miRNAs and lncRNAs. Most studies use serum and plasma samples, with few reports utilizing whole blood or peripheral blood mononuclear cell samples. Conclusive research has suggested that the levels of miRNAs or lncRNAs detected in the serum are
Sample preparation
Blood draw time Fasting vs non-fasting Time of drawing
Duration time Serum preparation Plasma preparation
Anticoagulant EDTA Critrate Heparin
RNA isolation
Trizonal Initial fluid volume RNA precipitation Quality control
miRNAmiRVana, miRNeasy et alTrizol-based reagents
lncRNA Trizol-based reagents
RNA quatification
Microarray or NGS
qRT-PCR Internal controls Biological reproducibility
Statistical analysis
Figure 3 Flow diagram and schematic summary of circulating miRNA and lncRNA analyses. miRNAs: MicroRNA; lncRNA: Long non-coding RNA; qRT-PCR: Real-time quantitive polymerase chain reaction.
Huang YK et al . Circulating microRNAs and long non-coding RNAs in GC diagnosis
9878 September 14, 2015|Volume 21|Issue 34|WJG|www.wjgnet.com
consistent with the levels in plasma in the same pathology if cellular contaminants are avoided; miRNAs and lncRNAs are both generally detected in hemocytes such as thrombocytes and erythrocytes[26]. Consequently, because the blood cell fraction may generate background noise, using serum or plasma will decrease the background noise and promote higher accuracy for circulating miRNAs and lncRNAs detection over whole blood[212]. Nonetheless, hemolysis frequently occurs at low levels during the sampling and processing of blood. To estimate the suitability of serum/plasma samples for analysis, the extent of hemolysis should be estimated by measuring the free hemoglobin and endogenous RNAs[213].
miRNAs and lncRNAs can be extracted using different approaches. Acid guanidinium thiocyanate-phenol-chloroform (AGPC) extraction is used pri-marily for RNA isolation, followed by either column-based RNA purification from the aqueous solution or precipitation of the RNA-containing aqueous solution. RNAs can be precipitated from aqueous solutions by adding 2-isopropanol and then stored overnight at -20 ℃ or -80 ℃. Currently, standard protocols, including commercial kits directing small RNA enrichment or TRIzol-based reagents, have garnered wide acceptance[214]. If we target miRNAs, a miRVana extraction kit may improve the detection precision. However, discrepancies may be observed between different methods of extraction; most of the variabilities discovered between replicates are due to the different RNA extraction processes[213]. Therefore, to reduce the heterogeneity of circulating miRNA and lncRNA profiles, selective and consistent extraction methods throughout an entire study are strongly recommended[215].
Microarrays and next-generation sequencing (NGS) are performed to obtain large-scale profiles of circulating miRNAs and lncRNAs following the extraction of miRNAs and lncRNAs. miRNA qPCR arrays and lncRNA PCR arrays are also utilized to capture miRNA and lncRNA profiles. Each method has its own advantages and limitations. NGS can identify novel miRNAs and lncRNAs but is less cost-effective and less efficient compared with microarrays. Git et al[216] analyzed three biological samples across six miRNA microarray platforms and compared their hybridization performance. Only 53 miRNAs were consistent among the 4 microarrays. The sensitivity and specificity of the different platforms vary significantly. Different methods for the detection of circulating lncRNAs and miRNAs can lead to discrepancies in GC diagnoses. A large sample size is recommended to improve the reliability of the results.
After large-scale profiling of GC, the differential circulating miRNAs and lncRNAs between patients and healthy individuals must be validated in larger cohorts[217]. The standard reference for miRNA and lncRNA qualification is qRT-PCR. With low detection limits and high sensitivity, this method is suitable for circulating
miRNA and lncRNA identification. Endogenous controls are important for qRT-PCR. U6, miR-93 and miR-16 are the most frequently used endogenous controls for miRNA normalization in qRT-PCR for GC detection. Chen et al[218] stated that the combination of let-7g, let-7d and let-7i could function as a reference gene superior to U6 and miR-16 for the normalization of circulating miRNAs. Kraus et al[219] investigated the expression stability of 90 lncRNAs in 30 tissue specimens, including anaplastic astrocytoma, human diffuse astrocytoma, glioblastoma and normal white matter. Their results indicated that 4 lncRNAs (BC200, Zfhx2as, H19 upstream conserved 1 and 2, and HOXA6as) were suitable for use as normalizers of lncRNA expression profiling in glioma and normal brain. Nonetheless, no current consensus exists with respect to a reference for the normalization of circulating lncRNAs. cDNA synthesis of miRNAs and lncRNAs is crucial for qRT-PCR, and universal poly-A tailing and stem-loop primer extension are two current methods. Dunnett et al[220] suggested that poly-A tail extension exhibited more amplification than stem-loop primer extension and that using poly-A tail extension might be best, particularly when low traces of sample are available. Universal poly-A tail extension may be an interesting method for miRNA identification in bodily fluids. Chugh et al[221] suggested that sequence-specific stem-loop primer extension failed to generate a signal (CT) for low-abundance miRNAs compared with universal poly-A tailing assays; however, universal poly-A tailing generated a quantitative signal with significant non-specific amplification. cDNA synthesis of lncRNA has not been extensively studied at present; most researchers use commercial kits. Speth et al[222] suggested a simple and sensitive protocol that allows the quantification of mRNAs, selected sRNAs, and lncRNAs in one cDNA sample by qRT-PCR.
CONCLUSIONGC was the world’s third leading cause of cancer mortality in 2012 and was responsible for 723000 deaths[223]. Delayed diagnosis is the largest obstacle to the treatment of GC; thus, the effective means to improve the prognosis of GC is to search for ideal biomarkers for early GC detection. Many serum markers, including CA199, CA125, CA724, CA242, CA50, CEA, and pepsinogen, are widely utilized in the clinic for GC detection. However, low sensitivity or low specificity diminishes their clinical value for GC diagnosis. A large number of non-protein-coding transcripts were formerly regarded as “noise” or “garbage” within the genome. With the progression of high-throughput sequencing technologies (microarray or RNA-seq), something important that had been hidden in the diverse non-coding RNAs has attracted the attention of many researchers and has driven them to search for promising functions of non-coding RNAs in the pathogenesis of diseases[224]. More importantly, the study of miRNAs and lncRNAs has gradually become
Huang YK et al . Circulating microRNAs and long non-coding RNAs in GC diagnosis
9879 September 14, 2015|Volume 21|Issue 34|WJG|www.wjgnet.com
prominent in RNA biology. Emerging evidence has suggested that the dysregulated expression of miRNAs and lncRNAs in cancer alters the spectrum of disease progression and might serve as an independent biomarker of multiple types of cancer[14]. The detection of circulating miRNAs and lncRNAs may be valuable for improving the diagnostic and prognostic value of GC. In this review, we have highlighted circulating miRNAs and lncRNAs in GC detection and summarized the potential mechanisms underlying extracellular miRNA and lncRNA secretion. The use of miRNAs and lncRNAs has several limitations such as the diverse methodologies for miRNA and lncRNA detection and the small cohort size for the validation steps in the present studies. Nonetheless, circulating miRNAs and lncRNAs exhibit higher diagnostic values relative to conventional tumor markers such as CA199, CA125, CA724, CA242, CA50, CEA, and pepsinogen. The combination of biomarkers may improve the diagnostic accuracy, and the combination of circulating miRNAs, lncRNAs and other screening methods may be particularly useful in cancer detection. Prospective studies should validate the feasibility of using circulating miRNAs and lncRNAs as diagnostic biomarkers for GC detection in different populations. These circulating small nucleic acids (miRNAs, lncRNAs and others) may have potential in distinguishing patients with GC from healthy individuals, with the advantages of practicability, non-invasiveness and cost-effectiveness.
REFERENCES1 Ferlay J, Soerjomataram I, Dikshit R, Eser S, Mathers C, Rebelo
M, Parkin DM, Forman D, Bray F. Cancer incidence and mortality worldwide: sources, methods and major patterns in GLOBOCAN 2012. Int J Cancer 2015; 136: E359-E386 [PMID: 25220842 DOI: 10.1002/ijc.29210]
2 Zhu X, Lv M, Wang H, Guan W. Identification of circulating microRNAs as novel potential biomarkers for gastric cancer detection: a systematic review and meta-analysis. Dig Dis Sci 2014; 59: 911-919 [PMID: 24337687 DOI: 10.1007/s10620-013-2970-9]
3 Nilsson PJ, van Etten B, Hospers GA, Påhlman L, van de Velde CJ, Beets-Tan RG, Blomqvist L, Beukema JC, Kapiteijn E, Marijnen CA, Nagtegaal ID, Wiggers T, Glimelius B. Short-course radiotherapy followed by neo-adjuvant chemotherapy in locally advanced rectal cancer--the RAPIDO trial. BMC Cancer 2013; 13: 279 [PMID: 23742033 DOI: 10.1186/1471-2407-13-279]
4 Bartel DP. MicroRNAs: genomics, biogenesis, mechanism, and function. Cell 2004; 116: 281-297 [PMID: 14744438]
5 Ebert MS, Sharp PA. Roles for microRNAs in conferring robustness to biological processes. Cell 2012; 149: 515-524 [PMID: 22541426 DOI: 10.1016/j.cell.2012.04.005]
6 Nikitina EG, Urazova LN, Stegny VN. MicroRNAs and human cancer. Exp Oncol 2012; 34: 2-8 [PMID: 22453141]
7 Mendell JT, Olson EN. MicroRNAs in stress signaling and human disease. Cell 2012; 148: 1172-1187 [PMID: 22424228 DOI: 10.1016/j.cell.2012.02.005]
8 Calin GA, Croce CM. MicroRNA signatures in human cancers. Nat Rev Cancer 2006; 6: 857-866 [PMID: 17060945 DOI: 10.1038/nrc1997]
9 Prensner JR, Iyer MK, Balbin OA, Dhanasekaran SM, Cao Q, Brenner JC, Laxman B, Asangani IA, Grasso CS, Kominsky HD, Cao X, Jing X, Wang X, Siddiqui J, Wei JT, Robinson D, Iyer HK, Palanisamy N, Maher CA, Chinnaiyan AM. Transcriptome
sequencing across a prostate cancer cohort identifies PCAT-1, an unannotated lincRNA implicated in disease progression. Nat Biotechnol 2011; 29: 742-749 [PMID: 21804560 DOI: 10.1038/nbt.1914]
10 Gutschner T, Diederichs S. The hallmarks of cancer: a long non-coding RNA point of view. RNA Biol 2012; 9: 703-719 [PMID: 22664915 DOI: 10.4161/rna.20481]
11 Brunner AL, Beck AH, Edris B, Sweeney RT, Zhu SX, Li R, Montgomery K, Varma S, Gilks T, Guo X, Foley JW, Witten DM, Giacomini CP, Flynn RA, Pollack JR, Tibshirani R, Chang HY, van de Rijn M, West RB. Transcriptional profiling of long non-coding RNAs and novel transcribed regions across a diverse panel of archived human cancers. Genome Biol 2012; 13: R75 [PMID: 22929540 DOI: 10.1186/gb-2012-13-8-r75]
12 Schaukowitch K, Joo JY, Liu X, Watts JK, Martinez C, Kim TK. Enhancer RNA facilitates NELF release from immediate early genes. Mol Cell 2014; 56: 29-42 [PMID: 25263592 DOI: 10.1016/j.molcel.2014.08.023]
13 Gibb EA, Brown CJ, Lam WL. The functional role of long non-coding RNA in human carcinomas. Mol Cancer 2011; 10: 38 [PMID: 21489289 DOI: 10.1186/1476-4598-10-38]
14 Prensner JR, Chinnaiyan AM. The emergence of lncRNAs in cancer biology. Cancer Discov 2011; 1: 391-407 [PMID: 22096659 DOI: 10.1158/2159-8290.CD-11-0209]
15 Yap KL, Li S, Muñoz-Cabello AM, Raguz S, Zeng L, Mujtaba S, Gil J, Walsh MJ, Zhou MM. Molecular interplay of the noncoding RNA ANRIL and methylated histone H3 lysine 27 by polycomb CBX7 in transcriptional silencing of INK4a. Mol Cell 2010; 38: 662-674 [PMID: 20541999 DOI: 10.1016/j.molcel.2010.03.021]
16 Poliseno L, Salmena L, Zhang J, Carver B, Haveman WJ, Pandolfi PP. A coding-independent function of gene and pseudogene mRNAs regulates tumour biology. Nature 2010; 465: 1033-1038 [PMID: 20577206 DOI: 10.1038/nature09144]
17 Gong C, Maquat LE. lncRNAs transactivate STAU1-mediated mRNA decay by duplexing with 3’ UTRs via Alu elements. Nature 2011; 470: 284-288 [PMID: 21307942 DOI: 10.1038/nature09701]
18 Tam OH, Aravin AA, Stein P, Girard A, Murchison EP, Cheloufi S, Hodges E, Anger M, Sachidanandam R, Schultz RM, Hannon GJ. Pseudogene-derived small interfering RNAs regulate gene expression in mouse oocytes. Nature 2008; 453: 534-538 [PMID: 18404147 DOI: 10.1038/nature06904]
19 Watanabe T, Totoki Y, Toyoda A, Kaneda M, Kuramochi-Miyagawa S, Obata Y, Chiba H, Kohara Y, Kono T, Nakano T, Surani MA, Sakaki Y, Sasaki H. Endogenous siRNAs from naturally formed dsRNAs regulate transcripts in mouse oocytes. Nature 2008; 453: 539-543 [PMID: 18404146 DOI: 10.1038/nature06908]
20 Zhao Y, Guo Q, Chen J, Hu J, Wang S, Sun Y. Role of long non-coding RNA HULC in cell proliferation, apoptosis and tumor metastasis of gastric cancer: a clinical and in vitro investigation. Oncol Rep 2014; 31: 358-364 [PMID: 24247585 DOI: 10.3892/or.2013.2850]
21 Sun Y, Zhang K, Fan G, Li J. Identification of circulating microRNAs as biomarkers in cancers: what have we got? Clin Chem Lab Med 2012; 50: 2121-2126 [PMID: 23087086 DOI: 10.1515/cclm-2012-0360]
22 Zandberga E, Kozirovskis V, Ābols A, Andrējeva D, Purkalne G, Linē A. Cell-free microRNAs as diagnostic, prognostic, and predictive biomarkers for lung cancer. Genes Chromosomes Cancer 2013; 52: 356-369 [PMID: 23404859 DOI: 10.1002/gcc.22032]
23 Taylor DD, Gercel-Taylor C. MicroRNA signatures of tumor-derived exosomes as diagnostic biomarkers of ovarian cancer. Gynecol Oncol 2008; 110: 13-21 [PMID: 18589210 DOI: 10.1016/j.ygyno.2008.04.033]
24 Arroyo JD, Chevillet JR, Kroh EM, Ruf IK, Pritchard CC, Gibson DF, Mitchell PS, Bennett CF, Pogosova-Agadjanyan EL, Stirewalt DL, Tait JF, Tewari M. Argonaute2 complexes carry a population of circulating microRNAs independent of vesicles in human plasma. Proc Natl Acad Sci USA 2011; 108: 5003-5008 [PMID: 21383194 DOI: 10.1073/pnas.1019055108]
25 Mitchell PS, Parkin RK, Kroh EM, Fritz BR, Wyman SK, Pogosova-Agadjanyan EL, Peterson A, Noteboom J, O’Briant KC,
Huang YK et al . Circulating microRNAs and long non-coding RNAs in GC diagnosis
9880 September 14, 2015|Volume 21|Issue 34|WJG|www.wjgnet.com
Allen A, Lin DW, Urban N, Drescher CW, Knudsen BS, Stirewalt DL, Gentleman R, Vessella RL, Nelson PS, Martin DB, Tewari M. Circulating microRNAs as stable blood-based markers for cancer detection. Proc Natl Acad Sci USA 2008; 105: 10513-10518 [PMID: 18663219 DOI: 10.1073/pnas.0804549105]
26 Chen X, Ba Y, Ma L, Cai X, Yin Y, Wang K, Guo J, Zhang Y, Chen J, Guo X, Li Q, Li X, Wang W, Zhang Y, Wang J, Jiang X, Xiang Y, Xu C, Zheng P, Zhang J, Li R, Zhang H, Shang X, Gong T, Ning G, Wang J, Zen K, Zhang J, Zhang CY. Characterization of microRNAs in serum: a novel class of biomarkers for diagnosis of cancer and other diseases. Cell Res 2008; 18: 997-1006 [PMID: 18766170 DOI: 10.1038/cr.2008.282]
27 Wang J, Huang SK, Zhao M, Yang M, Zhong JL, Gu YY, Peng H, Che YQ, Huang CZ. Identification of a circulating microRNA signature for colorectal cancer detection. PLoS One 2014; 9: e87451 [PMID: 24709885 DOI: 10.1371/journal.pone.0087451]
28 Liu R, Zhang C, Hu Z, Li G, Wang C, Yang C, Huang D, Chen X, Zhang H, Zhuang R, Deng T, Liu H, Yin J, Wang S, Zen K, Ba Y, Zhang CY. A five-microRNA signature identified from genome-wide serum microRNA expression profiling serves as a fingerprint for gastric cancer diagnosis. Eur J Cancer 2011; 47: 784-791 [PMID: 21112772 DOI: 10.1016/j.ejca.2010.10.025]
29 Li X, Zhang Z, Yu M, Li L, Du G, Xiao W, Yang H. Involvement of miR-20a in promoting gastric cancer progression by targeting early growth response 2 (EGR2). Int J Mol Sci 2013; 14: 16226-16239 [PMID: 23924943 DOI: 10.3390/ijms140816226]
30 Liu T, Tang H, Lang Y, Liu M, Li X. MicroRNA-27a functions as an oncogene in gastric adenocarcinoma by targeting prohibitin. Cancer Lett 2009; 273: 233-242 [PMID: 18789835 DOI: 10.1016/j.canlet.2008.08.003]
31 Liu J, Wang X, Yang X, Liu Y, Shi Y, Ren J, Guleng B. miRNA423-5p regulates cell proliferation and invasion by targeting trefoil factor 1 in gastric cancer cells. Cancer Lett 2014; 347: 98-104 [PMID: 24486742 DOI: 10.1016/j.canlet.2014.01.024]
32 Han C, Zhou Y, An Q, Li F, Li D, Zhang X, Yu Z, Zheng L, Duan Z, Kan Q. MicroRNA-1 (miR-1) inhibits gastric cancer cell proliferation and migration by targeting MET. Tumour Biol 2015; Epub ahead of print [PMID: 25874496 DOI: 10.1007/s13277-015-3358-6]
33 Kim CH, Kim HK, Rettig RL, Kim J, Lee ET, Aprelikova O, Choi IJ, Munroe DJ, Green JE. miRNA signature associated with outcome of gastric cancer patients following chemotherapy. BMC Med Genomics 2011; 4: 79 [PMID: 22112324 DOI: 10.1186/1755-8794-4-79]
34 Yao Y, Suo AL, Li ZF, Liu LY, Tian T, Ni L, Zhang WG, Nan KJ, Song TS, Huang C. MicroRNA profiling of human gastric cancer. Mol Med Rep 2009; 2: 963-970 [PMID: 21475928 DOI: 10.3892/mmr_00000199]
35 Wang AM, Huang TT, Hsu KW, Huang KH, Fang WL, Yang MH, Lo SS, Chi CW, Lin JJ, Yeh TS. Yin Yang 1 is a target of microRNA-34 family and contributes to gastric carcinogenesis. Oncotarget 2014; 5: 5002-5016 [PMID: 24970812]
36 Peng Y, Guo JJ, Liu YM, Wu XL. MicroRNA-34A inhibits the growth, invasion and metastasis of gastric cancer by targeting PDGFR and MET expression. Biosci Rep 2014; 34: [PMID: 24837198 DOI: 10.1042/BSR20140020]
37 Hu Z, Chen X, Zhao Y, Tian T, Jin G, Shu Y, Chen Y, Xu L, Zen K, Zhang C, Shen H. Serum microRNA signatures identified in a genome-wide serum microRNA expression profiling predict survival of non-small-cell lung cancer. J Clin Oncol 2010; 28: 1721-1726 [PMID: 20194856 DOI: 10.1200/JCO.2009.24.9342]
38 Xu L, Zhang Y, Wang H, Zhang G, Ding Y, Zhao L. Tumor suppressor miR-1 restrains epithelial-mesenchymal transition and metastasis of colorectal carcinoma via the MAPK and PI3K/AKT pathway. J Transl Med 2014; 12: 244 [PMID: 25196260 DOI: 10.1186/s12967-014-0244-8]
39 Stope MB, Stender C, Schubert T, Peters S, Weiss M, Ziegler P, Zimmermann U, Walther R, Burchardt M. Heat-shock protein HSPB1 attenuates microRNA miR-1 expression thereby restoring oncogenic pathways in prostate cancer cells. Anticancer Res 2014;
34: 3475-3480 [PMID: 24982356]40 Han C, Yu Z, Duan Z, Kan Q. Role of microRNA-1 in human
cancer and its therapeutic potentials. Biomed Res Int 2014; 2014: 428371 [PMID: 24949449 DOI: 10.1155/2014/428371]
41 Bronisz A, Wang Y, Nowicki MO, Peruzzi P, Ansari KI, Ogawa D, Balaj L, De Rienzo G, Mineo M, Nakano I, Ostrowski MC, Hochberg F, Weissleder R, Lawler SE, Chiocca EA, Godlewski J. Extracellular vesicles modulate the glioblastoma microenvi-ronment via a tumor suppression signaling network directed by miR-1. Cancer Res 2014; 74: 738-750 [PMID: 24310399 DOI: 10.1158/0008-5472.CAN-13-2650]
42 Valladares-Ayerbes M, Reboredo M, Medina-Villaamil V, Iglesias-Díaz P, Lorenzo-Patiño MJ, Haz M, Santamarina I, Blanco M, Fernández-Tajes J, Quindós M, Carral A, Figueroa A, Antón-Aparicio LM, Calvo L. Circulating miR-200c as a diagnostic and prognostic biomarker for gastric cancer. J Transl Med 2012; 10: 186 [PMID: 22954417 DOI: 10.1186/1479-5876-10-186]
43 Zhou X, Wang Y, Shan B, Han J, Zhu H, Lv Y, Fan X, Sang M, Liu XD, Liu W. The downregulation of miR-200c/141 promotes ZEB1/2 expression and gastric cancer progression. Med Oncol 2015; 32: 428 [PMID: 25502084 DOI: 10.1007/s12032-014-0428-3]
44 Toiyama Y, Hur K, Tanaka K, Inoue Y, Kusunoki M, Boland CR, Goel A. Serum miR-200c is a novel prognostic and metastasis-predictive biomarker in patients with colorectal cancer. Ann Surg 2014; 259: 735-743 [PMID: 23982750 DOI: 10.1097/SLA.0b013e3182a6909d]
45 Wang H, Wang L, Wu Z, Sun R, Jin H, Ma J, Liu L, Ling R, Yi J, Wang L, Bian J, Chen J, Li N, Yuan S, Yun J. Three dysregulated microRNAs in serum as novel biomarkers for gastric cancer screening. Med Oncol 2014; 31: 298 [PMID: 25367852 DOI: 10.1007/s12032-014-0298-8]
46 Li J , Guo Y, Liang X, Sun M, Wang G, De W, Wu W. MicroRNA-223 functions as an oncogene in human gastric cancer by targeting FBXW7/hCdc4. J Cancer Res Clin Oncol 2012; 138: 763-774 [PMID: 22270966 DOI: 10.1007/s00432-012-1154-x]
47 Li X, Zhang Y, Zhang H, Liu X, Gong T, Li M, Sun L, Ji G, Shi Y, Han Z, Han S, Nie Y, Chen X, Zhao Q, Ding J, Wu K, Daiming F. miRNA-223 promotes gastric cancer invasion and metastasis by targeting tumor suppressor EPB41L3. Mol Cancer Res 2011; 9: 824-833 [PMID: 21628394 DOI: 10.1158/1541-7786.MCR-10-0529]
48 Yang G, Gong Y, Wang Q, Wang Y, Zhang X. The role of miR-100-mediated Notch pathway in apoptosis of gastric tumor cells. Cell Signal 2015; 27: 1087-1101 [PMID: 25703026 DOI: 10.1016/j.cellsig.2015.02.013]
49 Oh HK, Tan AL, Das K, Ooi CH, Deng NT, Tan IB, Beillard E, Lee J, Ramnarayanan K, Rha SY, Palanisamy N, Voorhoeve PM, Tan P. Genomic loss of miR-486 regulates tumor progression and the OLFM4 antiapoptotic factor in gastric cancer. Clin Cancer Res 2011; 17: 2657-2667 [PMID: 21415212 DOI: 10.1158/1078-0432.CCR-10-3152]
50 Xia L, Zhang D, Du R, Pan Y, Zhao L, Sun S, Hong L, Liu J, Fan D. miR-15b and miR-16 modulate multidrug resistance by targeting BCL2 in human gastric cancer cells. Int J Cancer 2008; 123: 372-379 [PMID: 18449891 DOI: 10.1002/ijc.23501]
51 Li X, Luo F, Li Q, Xu M, Feng D, Zhang G, Wu W. Identification of new aberrantly expressed miRNAs in intestinal-type gastric cancer and its clinical significance. Oncol Rep 2011; 26: 1431-1439 [PMID: 21874264 DOI: 10.3892/or.2011.1437]
52 Zhu C, Ren C, Han J, Ding Y, Du J, Dai N, Dai J, Ma H, Hu Z, Shen H, Xu Y, Jin G. A five-microRNA panel in plasma was identified as potential biomarker for early detection of gastric cancer. Br J Cancer 2014; 110: 2291-2299 [PMID: 24595006 DOI: 10.1038/bjc.2014.119]
53 Zhang M , Wang X, Li W, Cui Y. miR-107 and miR-25 simultaneously target LATS2 and regulate proliferation and invasion of gastric adenocarcinoma (GAC) cells. Biochem Biophys Res Commun 2015; 460: 806-812 [PMID: 25824045 DOI: 10.1016/j.bbrc.2015.03.110]
54 Zhao H, Wang Y, Yang L, Jiang R, Li W. MiR-25 promotes gastric
Huang YK et al . Circulating microRNAs and long non-coding RNAs in GC diagnosis
9881 September 14, 2015|Volume 21|Issue 34|WJG|www.wjgnet.com
cancer cells growth and motility by targeting RECK. Mol Cell Biochem 2014; 385: 207-213 [PMID: 24078004 DOI: 10.1007/s11010-013-1829-x]
55 Wu Q, Yang Z, Wang F, Hu S, Yang L, Shi Y, Fan D. MiR-19b/20a/92a regulates the self-renewal and proliferation of gastric cancer stem cells. J Cell Sci 2013; 126: 4220-4229 [PMID: 23868977 DOI: 10.1242/jcs.127944]
56 Ueda T, Volinia S, Okumura H, Shimizu M, Taccioli C, Rossi S, Alder H, Liu CG, Oue N, Yasui W, Yoshida K, Sasaki H, Nomura S, Seto Y, Kaminishi M, Calin GA, Croce CM. Relation between microRNA expression and progression and prognosis of gastric cancer: a microRNA expression analysis. Lancet Oncol 2010; 11: 136-146 [PMID: 20022810 DOI: 10.1016/S1470-2045(09)70343-2]
57 Tsukamoto Y, Nakada C, Noguchi T, Tanigawa M, Nguyen LT, Uchida T, Hijiya N, Matsuura K, Fujioka T, Seto M, Moriyama M. MicroRNA-375 is downregulated in gastric carcinomas and regulates cell survival by targeting PDK1 and 14-3-3zeta. Cancer Res 2010; 70: 2339-2349 [PMID: 20215506 DOI: 10.1158/0008-5472.CAN-09-2777]
58 He Z, Liu Y, Xiao B, Qian X. miR-25 modulates NSCLC cell radio-sensitivity through directly inhibiting BTG2 expression. Biochem Biophys Res Commun 2015; 457: 235-241 [PMID: 25576360 DOI: 10.1016/j.bbrc.2014.12.094]
59 Li Z, Sun Y, Chen X, Squires J, Nowroozizadeh B, Liang C, Huang J. p53 Mutation Directs AURKA Overexpression via miR-25 and FBXW7 in Prostatic Small Cell Neuroendocrine Carcinoma. Mol Cancer Res 2015; 13: 584-591 [PMID: 25512615 DOI: 10.1158/1541-7786.MCR-14-0277-T]
60 Ju X, Li D, Shi Q, Hou H, Sun N, Shen B. Differential microRNA expression in childhood B-cell precursor acute lymphoblastic leukemia. Pediatr Hematol Oncol 2009; 26: 1-10 [PMID: 19206004 DOI: 10.1080/08880010802378338]
61 Bandres E, Bitarte N, Arias F, Agorreta J, Fortes P, Agirre X, Zarate R, Diaz-Gonzalez JA, Ramirez N, Sola JJ, Jimenez P, Rodriguez J, Garcia-Foncillas J. microRNA-451 regulates macrophage migration inhibitory factor production and proliferation of gastrointestinal cancer cells. Clin Cancer Res 2009; 15: 2281-2290 [PMID: 19318487 DOI: 10.1158/1078-0432.CCR-08-1818]
62 Wang P, Yang D, Zhang H, Wei X, Ma T, Cheng Z, Hong Q, Hu J, Zhuo H, Song Y, Jia C, Jing F, Jin Q, Bai C, Mao H, Zhao J. Early Detection of Lung Cancer in Serum by a Panel of MicroRNA Biomarkers. Clin Lung Cancer 2015; 16: 313-319.e1 [PMID: 25639977 DOI: 10.1016/j.cllc.2014.12.006]
63 Langhe R, Norris L, Saadeh FA, Blackshields G, Varley R, Harrison A, Gleeson N, Spillane C, Martin C, O’Donnell DM, D’Arcy T, O’Leary J, O’Toole S. A novel serum microRNA panel to discriminate benign from malignant ovarian disease. Cancer Lett 2015; 356: 628-636 [PMID: 25451316 DOI: 10.1016/j.canlet.2014.10.010]
64 Zhou X, Zhang X, Yang Y, Li Z, Du L, Dong Z, Qu A, Jiang X, Li P, Wang C. Urinary cell-free microRNA-106b as a novel biomarker for detection of bladder cancer. Med Oncol 2014; 31: 197 [PMID: 25168920 DOI: 10.1007/s12032-014-0197-z]
65 Komatsu S, Ichikawa D, Hirajima S, Kawaguchi T, Miyamae M, Okajima W, Ohashi T, Arita T, Konishi H, Shiozaki A, Fujiwara H, Okamoto K, Yagi N, Otsuji E. Plasma microRNA profiles: identification of miR-25 as a novel diagnostic and monitoring biomarker in oesophageal squamous cell carcinoma. Br J Cancer 2014; 111: 1614-1624 [PMID: 25117812 DOI: 10.1038/bjc.2014.451]
66 Wang Y, Gao Y, Shi W, Zhai D, Rao Q, Jia X, Liu J, Jiao X, Du Z. Profiles of differential expression of circulating microRNAs in hepatitis B virus-positive small hepatocellular carcinoma. Cancer Biomark 2015; 15: 171-180 [PMID: 25519019 DOI: 10.3233/CBM-140451]
67 Chang CC, Lin CC, Hsieh WL, Lai HW, Tsai CH, Cheng YW. MicroRNA expression profiling in PBMCs: a potential diagnostic biomarker of chronic hepatitis C. Dis Markers 2014; 2014: 367157 [PMID: 25505813 DOI: 10.1155/2014/367157]
68 Ralfkiaer U, Lindahl LM, Litman T, Gjerdrum LM, Ahler CB, Gniadecki R, Marstrand T, Fredholm S, Iversen L, Wasik MA,
Bonefeld CM, Geisler C, Krejsgaard T, Glue C, Røpke MA, Woetmann A, Skov L, Grønbæk K, Odum N. MicroRNA expression in early mycosis fungoides is distinctly different from atopic dermatitis and advanced cutaneous T-cell lymphoma. Anticancer Res 2014; 34: 7207-7217 [PMID: 25503151]
69 Tafsiri E, Darbouy M, Shadmehr MB, Zagryazhskaya A, Alizadeh J, Karimipoor M. Expression of miRNAs in non-small-cell lung carcinomas and their association with clinicopathological features. Tumour Biol 2015; 36: 1603-1612 [PMID: 25384507 DOI: 10.1007/s13277-014-2755-6]
70 Song J, Bai Z, Han W, Zhang J, Meng H, Bi J, Ma X, Han S, Zhang Z. Identification of suitable reference genes for qPCR analysis of serum microRNA in gastric cancer patients. Dig Dis Sci 2012; 57: 897-904 [PMID: 22198701 DOI: 10.1007/s10620-011-1981-7]
71 Chen L, Jiang M, Yuan W, Tang H. Prognostic value of miR-93 overexpression in resectable gastric adenocarcinomas. Acta Gastroenterol Belg 2012; 75: 22-27 [PMID: 22567743]
72 Si H, Sun X, Chen Y, Cao Y, Chen S, Wang H, Hu C. Circulating microRNA-92a and microRNA-21 as novel minimally invasive biomarkers for primary breast cancer. J Cancer Res Clin Oncol 2013; 139: 223-229 [PMID: 23052693 DOI: 10.1007/s00432-012-1315-y]
73 Du L, Zhao Z, Ma X, Hsiao TH, Chen Y, Young E, Suraokar M, Wistuba I, Minna JD, Pertsemlidis A. miR-93-directed downregulation of DAB2 defines a novel oncogenic pathway in lung cancer. Oncogene 2014; 33: 4307-4315 [PMID: 24037530 DOI: 10.1038/onc.2013.381]
74 Zhou H, Xiao B, Zhou F, Deng H, Zhang X, Lou Y, Gong Z, Du C, Guo J. MiR-421 is a functional marker of circulating tumor cells in gastric cancer patients. Biomarkers 2012; 17: 104-110 [PMID: 22263628 DOI: 10.3109/1354750X.2011.614961]
75 Wu J, Li G, Yao Y, Wang Z, Sun W, Wang J. MicroRNA-421 is a new potential diagnosis biomarker with higher sensitivity and specificity than carcinoembryonic antigen and cancer antigen 125 in gastric cancer. Biomarkers 2015; 20: 58-63 [PMID: 25510566 DOI: 10.3109/1354750X.2014.992812]
76 Wu JH, Yao YL, Gu T, Wang ZY, Pu XY, Sun WW, Zhang X, Jiang YB, Wang JJ. MiR-421 regulates apoptosis of BGC-823 gastric cancer cells by targeting caspase-3. Asian Pac J Cancer Prev 2014; 15: 5463-5468 [PMID: 25041019]
77 Li Y, Li W, Zhang JG, Li HY, Li YM. Downregulation of tumor suppressor menin by miR-421 promotes proliferation and migration of neuroblastoma. Tumour Biol 2014; 35: 10011-10017 [PMID: 25012242 DOI: 10.1007/s13277-014-1921-1]
78 Wang B, Li J, Sun M, Sun L, Zhang X. miRNA expression in breast cancer varies with lymph node metastasis and other clinicopathologic features. IUBMB Life 2014; 66: 371-377 [PMID: 24846313 DOI: 10.1002/iub.1273]
79 Chen L, Tang Y, Wang J, Yan Z, Xu R. miR-421 induces cell proliferation and apoptosis resistance in human nasopharyngeal carcinoma via downregulation of FOXO4. Biochem Biophys Res Commun 2013; 435: 745-750 [PMID: 23707940 DOI: 10.1016/j.bbrc.2013.05.056]
80 Mansour WY, Bogdanova NV, Kasten-Pisula U, Rieckmann T, Köcher S, Borgmann K, Baumann M, Krause M, Petersen C, Hu H, Gatti RA, Dikomey E, Dörk T, Dahm-Daphi J. Aberrant overexpression of miR-421 downregulates ATM and leads to a pronounced DSB repair defect and clinical hypersensitivity in SKX squamous cell carcinoma. Radiother Oncol 2013; 106: 147-154 [PMID: 23199656 DOI: 10.1016/j.radonc.2012.10.020]
81 Liu H, Zhu L, Liu B, Yang L, Meng X, Zhang W, Ma Y, Xiao H. Genome-wide microRNA profiles identify miR-378 as a serum biomarker for early detection of gastric cancer. Cancer Lett 2012; 316: 196-203 [PMID: 22169097 DOI: 10.1016/j.canlet.2011.10.034]
82 Fei B, Wu H. MiR-378 inhibits progression of human gastric cancer MGC-803 cells by targeting MAPK1 in vitro. Oncol Res 2012; 20: 557-564 [PMID: 24139413 DOI: 10.3727/096504013X13775486749254]
83 Chan JK, Kiet TK, Blansit K, Ramasubbaiah R, Hilton JF, Kapp DS, Matei D. MiR-378 as a biomarker for response to anti-
Huang YK et al . Circulating microRNAs and long non-coding RNAs in GC diagnosis
9882 September 14, 2015|Volume 21|Issue 34|WJG|www.wjgnet.com
angiogenic treatment in ovarian cancer. Gynecol Oncol 2014; 133: 568-574 [PMID: 24680769 DOI: 10.1016/j.ygyno.2014.03.564]
84 Yin JY, Deng ZQ, Liu FQ, Qian J, Lin J, Tang Q, Wen XM, Zhou JD, Zhang YY, Zhu XW. Association between mir-24 and mir-378 in formalin-fixed paraffin-embedded tissues of breast cancer. Int J Clin Exp Pathol 2014; 7: 4261-4267 [PMID: 25120807]
85 Redova M, Poprach A, Nekvindova J, Iliev R, Radova L, Lakomy R, Svoboda M, Vyzula R, Slaby O. Circulating miR-378 and miR-451 in serum are potential biomarkers for renal cell carcinoma. J Transl Med 2012; 10: 55 [PMID: 22440013 DOI: 10.1186/1479-5876-10-55]
86 Chen LT , Xu SD, Xu H, Zhang JF, Ning JF, Wang SF. MicroRNA-378 is associated with non-small cell lung cancer brain metastasis by promoting cell migration, invasion and tumor angiogenesis. Med Oncol 2012; 29: 1673-1680 [PMID: 22052152 DOI: 10.1007/s12032-011-0083-x]
87 Li C, Li JF, Cai Q, Qiu QQ, Yan M, Liu BY, Zhu ZG. MiRNA-199a-3p: A potential circulating diagnostic biomarker for early gastric cancer. J Surg Oncol 2013; 108: 89-92 [PMID: 23733518 DOI: 10.1002/jso.23358]
88 Peng W, Chen ZY, Wang L, Wang Z, Li J. MicroRNA-199a-3p is downregulated in gastric carcinomas and modulates cell proliferation. Genet Mol Res 2013; 12: 3038-3047 [PMID: 24065659 DOI: 10.4238/2013.August.20.5]
89 Wang Z, Ma X, Cai Q, Wang X, Yu B, Cai Q, liu B, Zhu Z, Li C. MiR-199a-3p promotes gastric cancer progression by targeting ZHX1. FEBS Lett 2014; 588: 4504-4512 [PMID: 25448600 DOI: 10.1016/j.febslet.2014.09.047]
90 Zhou H, Guo JM, Lou YR, Zhang XJ, Zhong FD, Jiang Z, Cheng J, Xiao BX. Detection of circulating tumor cells in peripheral blood from patients with gastric cancer using microRNA as a marker. J Mol Med (Berl) 2010; 88: 709-717 [PMID: 20349219 DOI: 10.1007/s00109-010-0617-2]
91 Zeng Q, Jin C, Chen W, Xia F, Wang Q, Fan F, Du J, Guo Y, Lin C, Yang K, Li J, Peng X, Li X, Cao K. Downregulation of serum miR-17 and miR-106b levels in gastric cancer and benign gastric diseases. Chin J Cancer Res 2014; 26: 711-716 [PMID: 25561770 DOI: 10.3978/j.issn.1000-9604.2014.12.03]
92 Zhang Y, Han T, Wei G, Wang Y. Inhibition of microRNA-17/20a suppresses cell proliferation in gastric cancer by modulating UBE2C expression. Oncol Rep 2015; 33: 2529-2536 [PMID: 25760688 DOI: 10.3892/or.2015.3835]
93 Zhang X, Kong Y, Xu X, Xing H, Zhang Y, Han F, Li W, Yang Q, Zeng J, Jia J, Liu Z. F-box protein FBXO31 is down-regulated in gastric cancer and negatively regulated by miR-17 and miR-20a. Oncotarget 2014; 5: 6178-6190 [PMID: 25115392]
94 Wang Z, Liu M, Zhu H, Zhang W, He S, Hu C, Quan L, Bai J, Xu N. miR-106a is frequently upregulated in gastric cancer and inhibits the extrinsic apoptotic pathway by targeting FAS. Mol Carcinog 2013; 52: 634-646 [PMID: 22431000 DOI: 10.1002/mc.21899]
95 Zhu M, Zhang N, He S, Lui Y, Lu G, Zhao L. MicroRNA-106a targets TIMP2 to regulate invasion and metastasis of gastric cancer. FEBS Lett 2014; 588: 600-607 [PMID: 24440352 DOI: 10.1016/j.febslet.2013.12.028]
96 Cui L, Zhang X, Ye G, Zheng T, Song H, Deng H, Xiao B, Xia T, Yu X, Le Y, Guo J. Gastric juice MicroRNAs as potential biomarkers for the screening of gastric cancer. Cancer 2013; 119: 1618-1626 [PMID: 23335180 DOI: 10.1002/cncr.27903]
97 Oksuz Z, Serin MS, Kaplan E, Dogen A, Tezcan S, Aslan G, Emekdas G, Sezgin O, Altintas E, Tiftik EN. Serum microRNAs; miR-30c-5p, miR-223-3p, miR-302c-3p and miR-17-5p could be used as novel non-invasive biomarkers for HCV-positive cirrhosis and hepatocellular carcinoma. Mol Biol Rep 2015; 42: 713-720 [PMID: 25391771 DOI: 10.1007/s11033-014-3819-9]
98 Zeng X, Xiang J, Wu M, Xiong W, Tang H, Deng M, Li X, Liao Q, Su B, Luo Z, Zhou Y, Zhou M, Zeng Z, Li X, Shen S, Shuai C, Li G, Fang J, Peng S. Circulating miR-17, miR-20a, miR-29c, and miR-223 combined as non-invasive biomarkers in nasopharyngeal carcinoma. PLoS One 2012; 7: e46367 [PMID: 23056289 DOI: 10.1371/journal.pone.0046367]
99 Eichelser C, Flesch-Janys D, Chang-Claude J, Pantel K, Schwarzenbach H. Deregulated serum concentrations of circulating cell-free microRNAs miR-17, miR-34a, miR-155, and miR-373 in human breast cancer development and progression. Clin Chem 2013; 59: 1489-1496 [PMID: 23748853 DOI: 10.1373/clinchem.2013.205161]
100 Lin HM, Castillo L, Mahon KL, Chiam K, Lee BY, Nguyen Q, Boyer MJ, Stockler MR, Pavlakis N, Marx G, Mallesara G, Gurney H, Clark SJ, Swarbrick A, Daly RJ, Horvath LG. Circulating microRNAs are associated with docetaxel chemotherapy outcome in castration-resistant prostate cancer. Br J Cancer 2014; 110: 2462-2471 [PMID: 24714754 DOI: 10.1038/bjc.2014.181]
101 Rotkrua P, Shimada S, Mogushi K, Akiyama Y, Tanaka H, Yuasa Y. Circulating microRNAs as biomarkers for early detection of diffuse-type gastric cancer using a mouse model. Br J Cancer 2013; 108: 932-940 [PMID: 23385731 DOI: 10.1038/bjc.2013.30]
102 Tchernitsa O, Kasajima A, Schäfer R, Kuban RJ, Ungethüm U, Györffy B, Neumann U, Simon E, Weichert W, Ebert MP, Röcken C. Systematic evaluation of the miRNA-ome and its downstream effects on mRNA expression identifies gastric cancer progression. J Pathol 2010; 222: 310-319 [PMID: 20726036 DOI: 10.1002/path.2759]
103 Petrocca F, Visone R, Onelli MR, Shah MH, Nicoloso MS, de Martino I, Iliopoulos D, Pilozzi E, Liu CG, Negrini M, Cavazzini L, Volinia S, Alder H, Ruco LP, Baldassarre G, Croce CM, Vecchione A. E2F1-regulated microRNAs impair TGFbeta-dependent cell-cycle arrest and apoptosis in gastric cancer. Cancer Cell 2008; 13: 272-286 [PMID: 18328430 DOI: 10.1016/j.ccr.2008.02.013]
104 Volinia S, Calin GA, Liu CG, Ambs S, Cimmino A, Petrocca F, Visone R, Iorio M, Roldo C, Ferracin M, Prueitt RL, Yanaihara N, Lanza G, Scarpa A, Vecchione A, Negrini M, Harris CC, Croce CM. A microRNA expression signature of human solid tumors defines cancer gene targets. Proc Natl Acad Sci USA 2006; 103: 2257-2261 [PMID: 16461460 DOI: 10.1073/pnas.0510565103]
105 Chen X, Wang Y, Zang W, Du Y, Li M, Zhao G. miR-194 targets RBX1 gene to modulate proliferation and migration of gastric cancer cells. Tumour Biol 2015; 36: 2393-2401 [PMID: 25412959 DOI: 10.1007/s13277-014-2849-1]
106 Zhang Y, Qu X, Li C, Fan Y, Che X, Wang X, Cai Y, Hu X, Liu Y. miR-103/107 modulates multidrug resistance in human gastric carcinoma by downregulating Cav-1. Tumour Biol 2015; 36: 2277-2285 [PMID: 25407491 DOI: 10.1007/s13277-014-2835-7]
107 Li F, Liu B, Gao Y, Liu Y, Xu Y, Tong W, Zhang A. Upregulation of microRNA-107 induces proliferation in human gastric cancer cells by targeting the transcription factor FOXO1. FEBS Lett 2014; 588: 538-544 [PMID: 24374340 DOI: 10.1016/j.febslet.2013.12.009]
108 Kiga K, Mimuro H, Suzuki M, Shinozaki-Ushiku A, Kobayashi T, Sanada T, Kim M, Ogawa M, Iwasaki YW, Kayo H, Fukuda-Yuzawa Y, Yashiro M, Fukayama M, Fukao T, Sasakawa C. Epigenetic silencing of miR-210 increases the proliferation of gastric epithelium during chronic Helicobacter pylori infection. Nat Commun 2014; 5: 4497 [PMID: 25187177 DOI: 10.1038/ncomms5497]
109 Zhou C, Li G, Zhou J, Han N, Liu Z, Yin J. miR-107 activates ATR/Chk1 pathway and suppress cervical cancer invasion by targeting MCL1. PLoS One 2014; 9: e111860 [PMID: 25386925 DOI: 10.1371/journal.pone.0111860]
110 Molina-Pinelo S, Carnero A, Rivera F, Estevez-Garcia P, Bozada JM, Limon ML, Benavent M, Gomez J, Pastor MD, Chaves M, Suarez R, Paz-Ares L, de la Portilla F, Carranza-Carranza A, Sevilla I, Vicioso L, Garcia-Carbonero R. MiR-107 and miR-99a-3p predict chemotherapy response in patients with advanced colorectal cancer. BMC Cancer 2014; 14: 656 [PMID: 25197016 DOI: 10.1186/1471-2407-14-656]
111 Geng L, Sun B, Gao B, Wang Z, Quan C, Wei F, Fang XD. MicroRNA-103 promotes colorectal cancer by targeting tumor suppressor DICER and PTEN. Int J Mol Sci 2014; 15: 8458-8472 [PMID: 24828205 DOI: 10.3390/ijms15058458]
112 Wang ZH, Ren LL, Zheng P, Zheng HM, Yu YN, Wang JL, Lin YW, Chen YX, Ge ZZ, Chen XY, Hong J, Fang JY. miR-194 as a predictor for adenoma recurrence in patients with advanced colorectal adenoma after polypectomy. Cancer Prev Res (Phila)
Huang YK et al . Circulating microRNAs and long non-coding RNAs in GC diagnosis
9883 September 14, 2015|Volume 21|Issue 34|WJG|www.wjgnet.com
2014; 7: 607-616 [PMID: 24691499 DOI: 10.1158/1940-6207.CAPR-13-0426]
113 Zhai H, Karaayvaz M, Dong P, Sakuragi N, Ju J. Prognostic significance of miR-194 in endometrial cancer. Biomark Res 2013; 1:pii 12 [PMID: 24040515 DOI: 10.1186/2050-7771-1-12]
114 Tsujiura M, Komatsu S, Ichikawa D, Shiozaki A, Konishi H, Takeshita H, Moriumura R, Nagata H, Kawaguchi T, Hirajima S, Arita T, Fujiwara H, Okamoto K, Otsuji E. Circulating miR-18a in plasma contributes to cancer detection and monitoring in patients with gastric cancer. Gastric Cancer 2015; 18: 271-279 [PMID: 24626859 DOI: 10.1007/s10120-014-0363-1]
115 Su ZX, Zhao J, Rong ZH, Wu YG, Geng WM, Qin CK. Diagnostic and prognostic value of circulating miR-18a in the plasma of patients with gastric cancer. Tumour Biol 2014; 35: 12119-12125 [PMID: 25416437 DOI: 10.1007/s13277-014-2516-6]
116 Wu W, Takanashi M, Borjigin N, Ohno SI, Fujita K, Hoshino S, Osaka Y, Tsuchida A, Kuroda M. MicroRNA-18a modulates STAT3 activity through negative regulation of PIAS3 during gastric adenocarcinogenesis. Br J Cancer 2013; 108: 653-661 [PMID: 23322197 DOI: 10.1038/bjc.2012.587]
117 Komatsu S, Ichikawa D, Takeshita H, Morimura R, Hirajima S, Tsujiura M, Kawaguchi T, Miyamae M, Nagata H, Konishi H, Shiozaki A, Otsuji E. Circulating miR-18a: a sensitive cancer screening biomarker in human cancer. In Vivo 2014; 28: 293-297 [PMID: 24815829]
118 Li BS, Zhao YL, Guo G, Li W, Zhu ED, Luo X, Mao XH, Zou QM, Yu PW, Zuo QF, Li N, Tang B, Liu KY, Xiao B. Plasma microRNAs, miR-223, miR-21 and miR-218, as novel potential biomarkers for gastric cancer detection. PLoS One 2012; 7: e41629 [PMID: 22860003 DOI: 10.1371/journal.pone.0041629]
119 Song J, Bai Z, Zhang J, Meng H, Cai J, Deng W, Bi J, Ma X, Zhang Z. Serum microRNA-21 levels are related to tumor size in gastric cancer patients but cannot predict prognosis. Oncol Lett 2013; 6: 1733-1737 [PMID: 24260069 DOI: 10.3892/ol.2013.1626]
120 Kim SY, Jeon TY, Choi CI, Kim DH, Kim DH, Kim GH, Ryu DY, Lee BE, Kim HH. Validation of circulating miRNA biomarkers for predicting lymph node metastasis in gastric cancer. J Mol Diagn 2013; 15: 661-669 [PMID: 23806809 DOI: 10.1016/j.jmoldx.2013.04.004]
121 Zeng Z, Wang J, Zhao L, Hu P, Zhang H, Tang X, He D, Tang S, Zeng Z. Potential role of microRNA-21 in the diagnosis of gastric cancer: a meta-analysis. PLoS One 2013; 8: e73278 [PMID: 24023850 DOI: 10.1371/journal.pone.0073278]
122 Gao C, Zhang Z, Liu W, Xiao S, Gu W, Lu H. Reduced microRNA-218 expression is associated with high nuclear factor kappa B activation in gastric cancer. Cancer 2010; 116: 41-49 [PMID: 19890957 DOI: 10.1002/cncr.24743]
123 Li L, Zhou L, Li Y, Lin S, Tomuleasa C. MicroRNA-21 stimulates gastric cancer growth and invasion by inhibiting the tumor suppressor effects of programmed cell death protein 4 and phosphatase and tensin homolog. J BUON 2014; 19: 228-236 [PMID: 24659669]
124 Kang W, Tong JH, Chan AW, Lung RW, Chau SL, Wong QW, Wong N, Yu J, Cheng AS, To KF. Stathmin1 plays oncogenic role and is a target of microRNA-223 in gastric cancer. PLoS One 2012; 7: e33919 [PMID: 22470493 DOI: 10.1371/journal.pone.0033919]
125 Shin VY, Jin H, Ng EK, Cheng AS, Chong WW, Wong CY, Leung WK, Sung JJ, Chu KM. NF-κB targets miR-16 and miR-21 in gastric cancer: involvement of prostaglandin E receptors. Carcinogenesis 2011; 32: 240-245 [PMID: 21081469 DOI: 10.1093/carcin/bgq240]
126 Zhang BG, Li JF, Yu BQ, Zhu ZG, Liu BY, Yan M. microRNA-21 promotes tumor proliferation and invasion in gastric cancer by targeting PTEN. Oncol Rep 2012; 27: 1019-1026 [PMID: 22267008 DOI: 10.3892/or.2012.1645]
127 Yang SM, Huang C, Li XF, Yu MZ, He Y, Li J. miR-21 confers cisplatin resistance in gastric cancer cells by regulating PTEN. Toxicology 2013; 306: 162-168 [PMID: 23466500 DOI: 10.1016/j.tox.2013.02.014]
128 Wei Y, Yang J, Yi L, Wang Y, Dong Z, Liu Z, Ou-yang S, Wu H, Zhong Z, Yin Z, Zhou K, Gao Y, Yan B, Wang Z. MiR-223-3p
targeting SEPT6 promotes the biological behavior of prostate cancer. Sci Rep 2014; 4: 7546 [PMID: 25519054 DOI: 10.1038/srep07546]
129 Yang T, Zheng ZM, Li XN, Li ZF, Wang Y, Geng YF, Bai L, Zhang XB. MiR-223 modulates multidrug resistance via downregulation of ABCB1 in hepatocellular carcinoma cells. Exp Biol Med (Maywood) 2013; 238: 1024-1032 [PMID: 23925649 DOI: 10.1177/1535370213497321]
130 Li P, Mao WM, Zheng ZG, Dong ZM, Ling ZQ. Down-regulation of PTEN expression modulated by dysregulated miR-21 contributes to the progression of esophageal cancer. Dig Dis Sci 2013; 58: 3483-3493 [PMID: 24221338 DOI: 10.1007/s10620-013-2854-z]
131 Sher YP, Wang LJ, Chuang LL, Tsai MH, Kuo TT, Huang CC, Chuang EY, Lai LC. ADAM9 up-regulates N-cadherin via miR-218 suppression in lung adenocarcinoma cells. PLoS One 2014; 9: e94065 [PMID: 24705471 DOI: 10.1371/journal.pone.0094065]
132 Xu J, Yao Q, Hou Y, Xu M, Liu S, Yang L, Zhang L, Xu H. MiR-223/Ect2/p21 signaling regulates osteosarcoma cell cycle progression and proliferation. Biomed Pharmacother 2013; 67: 381-386 [PMID: 23601845 DOI: 10.1016/j.biopha.2013.03.013]
133 Shiotani A, Murao T, Kimura Y, Matsumoto H, Kamada T, Kusunoki H, Inoue K, Uedo N, Iishi H, Haruma K. Identification of serum miRNAs as novel non-invasive biomarkers for detection of high risk for early gastric cancer. Br J Cancer 2013; 109: 2323-2330 [PMID: 24104965 DOI: 10.1038/bjc.2013.596]
134 Zhang R, Wang W, Li F, Zhang H, Liu J. MicroRNA-106b~25 expressions in tumor tissues and plasma of patients with gastric cancers. Med Oncol 2014; 31: 243 [PMID: 25218271 DOI: 10.1007/s12032-014-0243-x]
135 Yao YL, Wu XY, Wu JH, Gu T, Chen L, Gu JH, Liu Y, Zhang QH. Effects of microRNA-106 on proliferation of gastric cancer cell through regulating p21 and E2F5. Asian Pac J Cancer Prev 2013; 14: 2839-2843 [PMID: 23803041]
136 Yang TS, Yang XH, Chen X, Wang XD, Hua J, Zhou DL, Zhou B, Song ZS. MicroRNA-106b in cancer-associated fibroblasts from gastric cancer promotes cell migration and invasion by targeting PTEN. FEBS Lett 2014; 588: 2162-2169 [PMID: 24842611 DOI: 10.1016/j.febslet.2014.04.050]
137 Wang J, Wang Q, Liu H, Hu B, Zhou W, Cheng Y. MicroRNA expression and its implication for the diagnosis and therapeutic strategies of gastric cancer. Cancer Lett 2010; 297: 137-143 [PMID: 20797817 DOI: 10.1016/j.canlet.2010.07.018]
138 Song MY, Pan KF, Su HJ, Zhang L, Ma JL, Li JY, Yuasa Y, Kang D, Kim YS, You WC. Identification of serum microRNAs as novel non-invasive biomarkers for early detection of gastric cancer. PLoS One 2012; 7: e33608 [PMID: 22432036 DOI: 10.1371/journal.pone.0033608]
139 Chun-Zhi Z, Lei H, An-Ling Z, Yan-Chao F, Xiao Y, Guang-Xiu W, Zhi-Fan J, Pei-Yu P, Qing-Yu Z, Chun-Sheng K. MicroRNA-221 and microRNA-222 regulate gastric carcinoma cell proliferation and radioresistance by targeting PTEN. BMC Cancer 2010; 10: 367 [PMID: 20618998 DOI: 10.1186/1471-2407-10-367]
140 Wang M, Zhao C, Shi H, Zhang B, Zhang L, Zhang X, Wang S, Wu X, Yang T, Huang F, Cai J, Zhu Q, Zhu W, Qian H, Xu W. Deregulated microRNAs in gastric cancer tissue-derived mesenchymal stem cells: novel biomarkers and a mechanism for gastric cancer. Br J Cancer 2014; 110: 1199-1210 [PMID: 24473397 DOI: 10.1038/bjc.2014.14]
141 Cuk K, Zucknick M, Madhavan D, Schott S, Golatta M, Heil J, Marmé F, Turchinovich A, Sinn P, Sohn C, Junkermann H, Schneeweiss A, Burwinkel B. Plasma microRNA panel for minimally invasive detection of breast cancer. PLoS One 2013; 8: e76729 [PMID: 24194846 DOI: 10.1371/journal.pone.0076729]
142 Wang WN, Chen Y, Zhang YD, Hu TH. The regulatory mechanism of CCR7 gene expression and its involvement in the metastasis and progression of gastric cancer. Tumour Biol 2013; 34: 1865-1871 [PMID: 23519840 DOI: 10.1007/s13277-013-0728-9]
143 Tsujiura M, Ichikawa D, Komatsu S, Shiozaki A, Takeshita H, Kosuga T, Konishi H, Morimura R, Deguchi K, Fujiwara H, Okamoto K, Otsuji E. Circulating microRNAs in plasma of patients with gastric cancers. Br J Cancer 2010; 102: 1174-1179 [PMID:
Huang YK et al . Circulating microRNAs and long non-coding RNAs in GC diagnosis
9884 September 14, 2015|Volume 21|Issue 34|WJG|www.wjgnet.com
20234369 DOI: 10.1038/sj.bjc.6605608]144 Li Y, Liu H, Lai C, Du X, Su Z, Gao S. The Lin28/let-7a/c-Myc
pathway plays a role in non-muscle invasive bladder cancer. Cell Tissue Res 2013; 354: 533-541 [PMID: 24036903 DOI: 10.1007/s00441-013-1715-6]
145 Luu C, Heinrich EL, Duldulao M, Arrington AK, Fakih M, Garcia-Aguilar J, Kim J. TP53 and let-7a micro-RNA regulate K-Ras activity in HCT116 colorectal cancer cells. PLoS One 2013; 8: e70604 [PMID: 23936455 DOI: 10.1371/journal.pone.0070604]
146 Wang YY, Ren T, Cai YY, He XY. MicroRNA let-7a inhibits the proliferation and invasion of nonsmall cell lung cancer cell line 95D by regulating K-Ras and HMGA2 gene expression. Cancer Biother Radiopharm 2013; 28: 131-137 [PMID: 23134218 DOI: 10.1089/cbr.2012.1307]
147 Cai K, Wan Y, Sun G, Shi L, Bao X, Wang Z. Let-7a inhibits proliferation and induces apoptosis by targeting EZH2 in nasopharyngeal carcinoma cells. Oncol Rep 2012; 28: 2101-2106 [PMID: 22972404 DOI: 10.3892/or.2012.2027]
148 Wu XQ, Huang C, Liu XH, Li J. MicroRNA let-7a: a novel therapeutic candidate in prostate cancer. Asian J Androl 2014; 16: 327-328 [PMID: 24480926 DOI: 10.4103/1008-682X.123680]
149 Lu L, Schwartz P, Scarampi L, Rutherford T, Canuto EM, Yu H, Katsaros D. MicroRNA let-7a: a potential marker for selection of paclitaxel in ovarian cancer management. Gynecol Oncol 2011; 122: 366-371 [PMID: 21571355 DOI: 10.1016/j.ygyno.2011.04.033]
150 Yuan R, Zhi Q, Zhao H, Han Y, Gao L, Wang B, Kou Z, Guo Z, He S, Xue X, Hu H. Upregulated expression of miR-106a by DNA hypomethylation plays an oncogenic role in hepatocellular carcinoma. Tumour Biol 2015; 36: 3093-3100 [PMID: 25510666 DOI: 10.1007/s13277-014-2945-2]
151 Huh JH, Kim TH, Kim K, Song JA, Jung YJ, Jeong JY, Lee MJ, Kim YK, Lee DH, An HJ. Dysregulation of miR-106a and miR-591 confers paclitaxel resistance to ovarian cancer. Br J Cancer 2013; 109: 452-461 [PMID: 23807165 DOI: 10.1038/bjc.2013.305]
152 Chen Y, Jacamo R, Konopleva M, Garzon R, Croce C, Andreeff M. CXCR4 downregulation of let-7a drives chemoresistance in acute myeloid leukemia. J Clin Invest 2013; 123: 2395-2407 [PMID: 23676502 DOI: 10.1172/JCI66553]
153 Hamano R, Miyata H, Yamasaki M, Kurokawa Y, Hara J, Moon JH, Nakajima K, Takiguchi S, Fujiwara Y, Mori M, Doki Y. Overexpression of miR-200c induces chemoresistance in esophageal cancers mediated through activation of the Akt signaling pathway. Clin Cancer Res 2011; 17: 3029-3038 [PMID: 21248297 DOI: 10.1158/1078-0432.CCR-10-2532]
154 Bhutia YD, Hung SW, Krentz M, Patel D, Lovin D, Manoharan R, Thomson JM, Govindarajan R. Differential processing of let-7a precursors influences RRM2 expression and chemosensitivity in pancreatic cancer: role of LIN-28 and SET oncoprotein. PLoS One 2013; 8: e53436 [PMID: 23335963 DOI: 10.1371/journal.pone.0053436]
155 Zhang WH, Gui JH, Wang CZ, Chang Q, Xu SP, Cai CH, Li YN, Tian YP, Yan L, Wu B. The identification of miR-375 as a potential biomarker in distal gastric adenocarcinoma. Oncol Res 2012; 20: 139-147 [PMID: 23461060]
156 Xu Y, Jin J, Liu Y, Huang Z, Deng Y, You T, Zhou T, Si J, Zhuo W. Snail-regulated MiR-375 inhibits migration and invasion of gastric cancer cells by targeting JAK2. PLoS One 2014; 9: e99516 [PMID: 25055044 DOI: 10.1371/journal.pone.0099516]
157 Shen ZY, Zhang ZZ, Liu H, Zhao EH, Cao H. miR-375 inhibits the proliferation of gastric cancer cells by repressing ERBB2 expression. Exp Ther Med 2014; 7: 1757-1761 [PMID: 24926380 DOI: 10.3892/etm.2014.1627]
158 Miao L, Liu K, Xie M, Xing Y, Xi T. miR-375 inhibits Helicobacter pylori-induced gastric carcinogenesis by blocking JAK2-STAT3 signaling. Cancer Immunol Immunother 2014; 63: 699-711 [PMID: 24718681 DOI: 10.1007/s00262-014-1550-y]
159 Liu Y, Xing R, Zhang X, Dong W, Zhang J, Yan Z, Li W, Cui J, Lu Y. miR-375 targets the p53 gene to regulate cellular response to ionizing radiation and etoposide in gastric cancer cells. DNA Repair (Amst) 2013; 12: 741-750 [PMID: 23835407 DOI: 10.1016/
j.dnarep.2013.06.002]160 Ding L, Xu Y, Zhang W, Deng Y, Si M, Du Y, Yao H, Liu X, Ke Y,
Si J, Zhou T. MiR-375 frequently downregulated in gastric cancer inhibits cell proliferation by targeting JAK2. Cell Res 2010; 20: 784-793 [PMID: 20548334 DOI: 10.1038/cr.2010.79]
161 Yin J, Hou P, Wu Z, Wang T, Nie Y. Circulating miR-375 and miR-199a-3p as potential biomarkers for the diagnosis of hepatocellular carcinoma. Tumour Biol 2015; 36: 4501-4507 [PMID: 25618599 DOI: 10.1007/s13277-015-3092-0]
162 Kachakova D, Mitkova A, Popov E, Popov I, Vlahova A, Dikov T, Christova S, Mitev V, Slavov C, Kaneva R. Combinations of serum prostate-specific antigen and plasma expression levels of let-7c, miR-30c, miR-141, and miR-375 as potential better diagnostic biomarkers for prostate cancer. DNA Cell Biol 2015; 34: 189-200 [PMID: 25521481 DOI: 10.1089/dna.2014.2663]
163 Yu H, Jiang L, Sun C, Li Guo L, Lin M, Huang J, Zhu L. Decreased circulating miR-375: a potential biomarker for patients with non-small-cell lung cancer. Gene 2014; 534: 60-65 [PMID: 24404590]
164 Kawaguchi T, Komatsu S, Ichikawa D, Morimura R, Tsujiura M, Konishi H, Takeshita H, Nagata H, Arita T, Hirajima S, Shiozaki A, Ikoma H, Okamoto K, Ochiai T, Taniguchi H, Otsuji E. Clinical impact of circulating miR-221 in plasma of patients with pancreatic cancer. Br J Cancer 2013; 108: 361-369 [PMID: 23329235 DOI: 10.1038/bjc.2012.546]
165 Zhang XL, Shi HJ, Wang JP, Tang HS, Wu YB, Fang ZY, Cui SZ, Wang LT. MicroRNA-218 is upregulated in gastric cancer after cytoreductive surgery and hyperthermic intraperitoneal chemotherapy and increases chemosensitivity to cisplatin. World J Gastroenterol 2014; 20: 11347-11355 [PMID: 25170221 DOI: 10.3748/wjg.v20.i32.11347]
166 Xin SY, Feng XS, Zhou LQ, Sun JJ, Gao XL, Yao GL. Reduced expression of circulating microRNA-218 in gastric cancer and correlation with tumor invasion and prognosis. World J Gastroenterol 2014; 20: 6906-6911 [PMID: 24944481 DOI: 10.3748/wjg.v20.i22.6906]
167 Tie J, Pan Y, Zhao L, Wu K, Liu J, Sun S, Guo X, Wang B, Gang Y, Zhang Y, Li Q, Qiao T, Zhao Q, Nie Y, Fan D. MiR-218 inhibits invasion and metastasis of gastric cancer by targeting the Robo1 receptor. PLoS Genet 2010; 6: e1000879 [PMID: 20300657 DOI: 10.1371/journal.pgen.1000879]
168 Gao C, Pang M, Zhou Z, Long S, Dong D, Yang J, Cao M, Zhang C, Han S, Li L. Epidermal growth factor receptor-coamplified and overexpressed protein (VOPP1) is a putative oncogene in gastric cancer. Clin Exp Med 2014; Epub ahead of print [PMID: 25398664 DOI: 10.1007/s10238-014-0320-7]
169 Tian H, Hou L, Xiong YM, Huang JX, She YJ, Bi XB, Song XR. miR-218 suppresses tumor growth and enhances the chemo-sensitivity of esophageal squamous cell carcinoma to cisplatin. Oncol Rep 2015; 33: 981-989 [PMID: 25482044 DOI: 10.3892/or.2014.3657]
170 Wang HT, Liu AG, Luo DS, Zhou ZN, Lin HG, Chen RZ, He JS, Chen K. miR-218 expression in osteosarcoma tissues and its effect on cell growth in osteosarcoma cells. Asian Pac J Trop Med 2014; 7: 1000-1004 [PMID: 25479631 DOI: 10.1016/S1995-7645(14)60176-0]
171 Han G, Fan M, Zhang X. microRNA-218 inhibits prostate cancer cell growth and promotes apoptosis by repressing TPD52 expression. Biochem Biophys Res Commun 2015; 456: 804-809 [PMID: 25511701 DOI: 10.1016/j.bbrc.2014.12.026]
172 Cai H, Yuan Y, Hao YF, Guo TK, Wei X, Zhang YM. Plasma microRNAs serve as novel potential biomarkers for early detection of gastric cancer. Med Oncol 2013; 30: 452 [PMID: 23307259 DOI: 10.1007/s12032-012-0452-0]
173 Tsai KW, Liao YL, Wu CW, Hu LY, Li SC, Chan WC, Ho MR, Lai CH, Kao HW, Fang WL, Huang KH, Lin WC. Aberrant expression of miR-196a in gastric cancers and correlation with recurrence. Genes Chromosomes Cancer 2012; 51: 394-401 [PMID: 22420029]
174 Chen Q, Ge X, Zhang Y, Xia H, Yuan D, Tang Q, Chen L, Pang X, Leng W, Bi F. Plasma miR-122 and miR-192 as potential novel biomarkers for the early detection of distant metastasis of gastric
Huang YK et al . Circulating microRNAs and long non-coding RNAs in GC diagnosis
9885 September 14, 2015|Volume 21|Issue 34|WJG|www.wjgnet.com
cancer. Oncol Rep 2014; 31: 1863-1870 [PMID: 24481716 DOI: 10.3892/or.2014.3004]
175 Gorur A, Balci Fidanci S, Dogruer Unal N, Ayaz L, Akbayir S, Yildirim Yaroglu H, Dirlik M, Serin MS, Tamer L. Determination of plasma microRNA for early detection of gastric cancer. Mol Biol Rep 2013; 40: 2091-2096 [PMID: 23212612 DOI: 10.1007/s11033-012-2267-7]
176 Wang M, Gu H, Wang S, Qian H, Zhu W, Zhang L, Zhao C, Tao Y, Xu W. Circulating miR-17-5p and miR-20a: molecular markers for gastric cancer. Mol Med Rep 2012; 5: 1514-1520 [PMID: 22406928 DOI: 10.3892/mmr.2012.828]
177 Duttagupta R, Jiang R, Gollub J, Getts RC, Jones KW. Impact of cellular miRNAs on circulating miRNA biomarker signatures. PLoS One 2011; 6: e20769 [PMID: 21698099 DOI: 10.1371/journal.pone.0020769]
178 Arita T, Ichikawa D, Konishi H, Komatsu S, Shiozaki A, Shoda K, Kawaguchi T, Hirajima S, Nagata H, Kubota T, Fujiwara H, Okamoto K, Otsuji E. Circulating long non-coding RNAs in plasma of patients with gastric cancer. Anticancer Res 2013; 33: 3185-3193 [PMID: 23898077]
179 Yang F, Bi J, Xue X, Zheng L, Zhi K, Hua J, Fang G. Up-regulated long non-coding RNA H19 contributes to proliferation of gastric cancer cells. FEBS J 2012; 279: 3159-3165 [PMID: 22776265 DOI: 10.1111/j.1742-4658.2012.08694.x]
180 Li H, Yu B, Li J, Su L, Yan M, Zhu Z, Liu B. Overexpression of lncRNA H19 enhances carcinogenesis and metastasis of gastric cancer. Oncotarget 2014; 5: 2318-2329 [PMID: 24810858]
181 Zhuang M, Gao W, Xu J, Wang P, Shu Y. The long non-coding RNA H19-derived miR-675 modulates human gastric cancer cell proliferation by targeting tumor suppressor RUNX1. Biochem Biophys Res Commun 2014; 448: 315-322 [PMID: 24388988 DOI: 10.1016/j.bbrc.2013.12.126]
182 Zhu M, Chen Q, Liu X, Sun Q, Zhao X, Deng R, Wang Y, Huang J, Xu M, Yan J, Yu J. lncRNA H19/miR-675 axis represses prostate cancer metastasis by targeting TGFBI. FEBS J 2014; 281: 3766-3775 [PMID: 24988946 DOI: 10.1111/febs.12902]
183 Shi Y, Wang Y, Luan W, Wang P, Tao T, Zhang J, Qian J, Liu N, You Y. Long non-coding RNA H19 promotes glioma cell invasion by deriving miR-675. PLoS One 2014; 9: e86295 [PMID: 24466011 DOI: 10.1371/journal.pone.0086295]
184 Luo M, Li Z, Wang W, Zeng Y, Liu Z, Qiu J. Long non-coding RNA H19 increases bladder cancer metastasis by associating with EZH2 and inhibiting E-cadherin expression. Cancer Lett 2013; 333: 213-221 [PMID: 23354591 DOI: 10.1016/j.canlet.2013.01.033]
185 Glover AR, Zhao JT, Ip JC, Lee JC, Robinson BG, Gill AJ, Soon PS, Sidhu SB. Long noncoding RNA profiles of adrenocortical cancer can be used to predict recurrence. Endocr Relat Cancer 2015; 22: 99-109 [PMID: 25595289 DOI: 10.1530/ERC-14-0457]
186 Medrzycki M, Zhang Y, Zhang W, Cao K, Pan C, Lailler N, McDonald JF, Bouhassira EE, Fan Y. Histone h1.3 suppresses h19 noncoding RNA expression and cell growth of ovarian cancer cells. Cancer Res 2014; 74: 6463-6473 [PMID: 25205099 DOI: 10.1158/0008-5472.CAN-13-2922]
187 Pang Q, Ge J, Shao Y, Sun W, Song H, Xia T, Xiao B, Guo J. Increased expression of long intergenic non-coding RNA LINC00152 in gastric cancer and its clinical significance. Tumour Biol 2014; 35: 5441-5447 [PMID: 24523021 DOI: 10.1007/s13277-014-1709-3]
188 Cao WJ, Wu HL, He BS, Zhang YS, Zhang ZY. Analysis of long non-coding RNA expression profiles in gastric cancer. World J Gastroenterol 2013; 19: 3658-3664 [PMID: 23801869 DOI: 10.3748/wjg.v19.i23.3658]
189 Li Q, Shao Y, Zhang X, Zheng T, Miao M, Qin L, Wang B, Ye G, Xiao B, Guo J. Plasma long noncoding RNA protected by exosomes as a potential stable biomarker for gastric cancer. Tumour Biol 2015; 36: 2007-2012 [PMID: 25391424 DOI: 10.1007/s13277-014-2807-y]
190 Liu Z, Shao Y, Tan L, Shi H, Chen S, Guo J. Clinical significance of the low expression of FER1L4 in gastric cancer patients. Tumour Biol 2014; 35: 9613-9617 [PMID: 24961353 DOI: 10.1007/s13277-014-2259-4]
191 Song H, Sun W, Ye G, Ding X, Liu Z, Zhang S, Xia T, Xiao B, Xi Y, Guo J. Long non-coding RNA expression profile in human gastric cancer and its clinical significances. J Transl Med 2013; 11: 225 [PMID: 24063685 DOI: 10.1186/1479-5876-11-225]
192 Xia T, Liao Q, Jiang X, Shao Y, Xiao B, Xi Y, Guo J. Long noncoding RNA associated-competing endogenous RNAs in gastric cancer. Sci Rep 2014; 4: 6088 [PMID: 25124853 DOI: 10.1038/srep06088]
193 Dong L, Qi P, Xu MD, Ni SJ, Huang D, Xu QH, Weng WW, Tan C, Sheng WQ, Zhou XY, Du X. Circulating CUDR, LSINCT-5 and PTENP1 long noncoding RNAs in sera distinguish patients with gastric cancer from healthy controls. Int J Cancer 2015; Epub ahead of print [PMID: 25694351 DOI: 10.1002/ijc.29484]
194 Zheng Q, Wu F, Dai WY, Zheng DC, Zheng C, Ye H, Zhou B, Chen JJ, Chen P. Aberrant expression of UCA1 in gastric cancer and its clinical significance. Clin Transl Oncol 2015; 17: 640-646 [PMID: 25903045 DOI: 10.1007/s12094-015-1290-2]
195 Lin XC, Zhu Y, Chen WB, Lin LW, Chen DH, Huang JR, Pan K, Lin Y, Wu BT, Dai Y, Tu ZG. Integrated analysis of long non-coding RNAs and mRNA expression profiles reveals the potential role of lncRNAs in gastric cancer pathogenesis. Int J Oncol 2014; 45: 619-628 [PMID: 24819045 DOI: 10.3892/ijo.2014.2431]
196 Xu MD, Qi P, Weng WW, Shen XH, Ni SJ, Dong L, Huang D, Tan C, Sheng WQ, Zhou XY, Du X. Long non-coding RNA LSINCT5 predicts negative prognosis and exhibits oncogenic activity in gastric cancer. Medicine (Baltimore) 2014; 93: e303 [PMID: 25526476 DOI: 10.1097/MD.0000000000000303]
197 Yu G, Yao W, Gumireddy K, Li A, Wang J, Xiao W, Chen K, Xiao H, Li H, Tang K, Ye Z, Huang Q, Xu H. Pseudogene PTENP1 functions as a competing endogenous RNA to suppress clear-cell renal cell carcinoma progression. Mol Cancer Ther 2014; 13: 3086-3097 [PMID: 25249556 DOI: 10.1158/1535-7163.MCT-14-0245]
198 Chen CL, Tseng YW, Wu JC, Chen GY, Lin KC, Hwang SM, Hu YC. Suppression of hepatocellular carcinoma by baculovirus-mediated expression of long non-coding RNA PTENP1 and MicroRNA regulation. Biomaterials 2015; 44: 71-81 [PMID: 25617127 DOI: 10.1016/j.biomaterials.2014.12.023]
199 Kovalenko TF, Sorokina AV, Ozolinia LA, Patrushev LI. Pseudogene PTENP1 5’-region methylation in endometrial cancer and hyperplasias. Bioorg Khim 2013; 39: 445-453 [PMID: 24707726]
200 Shao Y, Ye M, Jiang X, Sun W, Ding X, Liu Z, Ye G, Zhang X, Xiao B, Guo J. Gastric juice long noncoding RNA used as a tumor marker for screening gastric cancer. Cancer 2014; 120: 3320-3328 [PMID: 24986041 DOI: 10.1002/cncr.28882]
201 Skog J, Würdinger T, van Rijn S, Meijer DH, Gainche L, Sena-Esteves M, Curry WT, Carter BS, Krichevsky AM, Breakefield XO. Glioblastoma microvesicles transport RNA and proteins that promote tumour growth and provide diagnostic biomarkers. Nat Cell Biol 2008; 10: 1470-1476 [PMID: 19011622 DOI: 10.1038/ncb1800]
202 Kosaka N, Iguchi H, Yoshioka Y, Takeshita F, Matsuki Y, Ochiya T. Secretory mechanisms and intercellular transfer of microRNAs in living cells. J Biol Chem 2010; 285: 17442-17452 [PMID: 20353945 DOI: 10.1074/jbc.M110.107821]
203 Zernecke A, Bidzhekov K, Noels H, Shagdarsuren E, Gan L, Denecke B, Hristov M, Köppel T, Jahantigh MN, Lutgens E, Wang S, Olson EN, Schober A, Weber C. Delivery of microRNA-126 by apoptotic bodies induces CXCL12-dependent vascular protection. Sci Signal 2009; 2: ra81 [PMID: 19996457 DOI: 10.1126/scisignal.2000610]
204 Vickers KC, Palmisano BT, Shoucri BM, Shamburek RD, Remaley AT. MicroRNAs are transported in plasma and delivered to recipient cells by high-density lipoproteins. Nat Cell Biol 2011; 13: 423-433 [PMID: 21423178 DOI: 10.1038/ncb2210]
205 Wang K, Zhang S, Weber J, Baxter D, Galas DJ. Export of microRNAs and microRNA-protective protein by mammalian cells. Nucleic Acids Res 2010; 38: 7248-7259 [PMID: 20615901 DOI: 10.1093/nar/gkq601]
206 Ji X, Takahashi R, Hiura Y, Hirokawa G, Fukushima Y, Iwai N. Plasma miR-208 as a biomarker of myocardial injury. Clin Chem 2009; 55: 1944-1949 [PMID: 19696117 DOI: 10.1373/
Huang YK et al . Circulating microRNAs and long non-coding RNAs in GC diagnosis
9886 September 14, 2015|Volume 21|Issue 34|WJG|www.wjgnet.com
clinchem.2009.125310]207 Wang K, Zhang S, Marzolf B, Troisch P, Brightman A, Hu Z,
Hood LE, Galas DJ. Circulating microRNAs, potential biomarkers for drug-induced liver injury. Proc Natl Acad Sci USA 2009; 106: 4402-4407 [PMID: 19246379 DOI: 10.1073/pnas.0813371106]
208 Hornby RJ, Starkey Lewis P, Dear J, Goldring C, Park BK. MicroRNAs as potential circulating biomarkers of drug-induced liver injury: key current and future issues for translation to humans. Expert Rev Clin Pharmacol 2014; 7: 349-362 [PMID: 24694030 DOI: 10.1586/17512433.2014.904201]
209 Ramachandran K, Saikumar J, Bijol V, Koyner JL, Qian J, Betensky RA, Waikar SS, Vaidya VS. Human miRNome profiling identifies microRNAs differentially present in the urine after kidney injury. Clin Chem 2013; 59: 1742-1752 [PMID: 24153252 DOI: 10.1373/clinchem.2013.210245]
210 Huang X, Yuan T, Tschannen M, Sun Z, Jacob H, Du M, Liang M, Dittmar RL, Liu Y, Liang M, Kohli M, Thibodeau SN, Boardman L, Wang L. Characterization of human plasma-derived exosomal RNAs by deep sequencing. BMC Genomics 2013; 14: 319 [PMID: 23663360 DOI: 10.1186/1471-2164-14-319]
211 Raposo G, Stoorvogel W. Extracellular vesicles: exosomes, microvesicles, and friends. J Cell Biol 2013; 200: 373-383 [PMID: 23420871 DOI: 10.1083/jcb.201211138]
212 Mo MH, Chen L, Fu Y, Wang W, Fu SW. Cell-free Circulating miRNA Biomarkers in Cancer. J Cancer 2012; 3: 432-448 [PMID: 23074383 DOI: 10.7150/jca.4919]
213 McDonald JS, Milosevic D, Reddi HV, Grebe SK, Algeciras-Schimnich A. Analysis of circulating microRNA: preanalytical and analytical challenges. Clin Chem 2011; 57: 833-840 [PMID: 21487102 DOI: 10.1373/clinchem.2010.157198]
214 Accerbi M, Schmidt SA, De Paoli E, Park S, Jeong DH, Green PJ. Methods for isolation of total RNA to recover miRNAs and other small RNAs from diverse species. Methods Mol Biol 2010; 592: 31-50 [PMID: 19802587 DOI: 10.1007/978-1-60327-005-2_3]
215 Baker M. MicroRNA profiling: separating signal from noise. Nat Methods 2010; 7: 687-692 [PMID: 20805796 DOI: 10.1038/
nmeth0910-687]216 Git A, Dvinge H, Salmon-Divon M, Osborne M, Kutter C, Hadfield J,
Bertone P, Caldas C. Systematic comparison of microarray profiling, real-time PCR, and next-generation sequencing technologies for measuring differential microRNA expression. RNA 2010; 16: 991-1006 [PMID: 20360395 DOI: 10.1261/rna.1947110]
217 De Guire V, Robitaille R, Tétreault N, Guérin R, Ménard C, Bambace N, Sapieha P. Circulating miRNAs as sensitive and specific biomarkers for the diagnosis and monitoring of human diseases: promises and challenges. Clin Biochem 2013; 46: 846-860 [PMID: 23562576 DOI: 10.1016/j.clinbiochem.2013.03.015]
218 Chen X, Liang H, Guan D, Wang C, Hu X, Cui L, Chen S, Zhang C, Zhang J, Zen K, Zhang CY. A combination of Let-7d, Let-7g and Let-7i serves as a stable reference for normalization of serum microRNAs. PLoS One 2013; 8: e79652 [PMID: 24223986 DOI: 10.1371/journal.pone.0079652]
219 Kraus TF, Greiner A, Guibourt V, Lisec K, Kretzschmar HA. Identification of Stably Expressed lncRNAs as Valid Endogenous Controls for Profiling of Human Glioma. J Cancer 2015; 6: 111-119 [PMID: 25561975 DOI: 10.7150/jca.10867]
220 Dunnett H, van der Meer D, Williams GA. Evaluation of stem-loop reverse transcription and poly-A tail extension in microRNA analysis of body fluids. Microrna 2014; 3: 150-154 [PMID: 25612781]
221 Chugh P, Dittmer DP. Potential pitfalls in microRNA profiling. Wiley Interdiscip Rev RNA 2012; 3: 601-616 [PMID: 22566380 DOI: 10.1002/wrna.1120]
222 Speth C, Laubinger S. Rapid and parallel quantification of small and large RNA species. Methods Mol Biol 2014; 1158: 93-106 [PMID: 24792046 DOI: 10.1007/978-1-4939-0700-7_6]
223 Cancer Genome Atlas Research Network. Comprehensive mo-lecular characterization of gastric adenocarcinoma. Nature 2014; 513: 202-209 [PMID: 25079317 DOI: 10.1038/nature13480]
224 Zhang XM, Ma ZW, Wang Q, Wang JN, Yang JW, Li XD, Li H, Men TY. A new RNA-seq method to detect the transcription and non-coding RNA in prostate cancer. Pathol Oncol Res 2014; 20: 43-50 [PMID: 24043589 DOI: 10.1007/s12253-013-9618-0]
P- Reviewer: Chiurillo MA, Park WS S- Editor: Ma YJ L- Editor: Wang TQ E- Editor: Wang CH
Huang YK et al . Circulating microRNAs and long non-coding RNAs in GC diagnosis
Jung Ho Kim, You-Jin Hwang, Sang Hoon Han, Young Eun Lee, Saerom Kim, Yoon Jae Kim, Jae Hee Cho, Kwang An Kwon, Ju Hyun Kim, Se-Hee Kim
Jung Ho Kim, Young Eun Lee, Saerom Kim, Yoon Jae Kim, Jae Hee Cho, Kwang An Kwon, Ju Hyun Kim, Department of Internal Medicine, Gachon University Gil Medical Center, Incheon 405-760, South Korea
You-Jin Hwang, Division of Biological Science, Gachon University of Medicine and Science, Incheon 406-799, South Korea
Sang Hoon Han, Department of Internal Medicine, Jeju National University School of Medicine, Jeju-si 890-716, South Korea
Se-Hee Kim, Gachon Medical Research Institute, Gachon University Gil Medical Center, Incheon 405-760, South Korea
Author contributions: Kim JH performed the research and wrote the manuscript; Han SH, Lee YE, and Kim S edited and provided critical revisions of the manuscript; Hwang YJ, Kim YJ, and Cho JH analyzed the data; Kim JH and Kim SH coordinated and supervised this work; Kim JH and Kim SH contributed equally to this work and were corresponding authors.
Supported by A grant of the Korea Health Technology R&D Project through the Korea Health Industry Development Institute, funded by the Ministry of Health & Welfare, Republic of Korea, No. HI13C-1602-010014); and grants of the Gachon University Gil Medical Center, No. 2013-01, 2014-11 and 2014-25.
Conflict-of-interest statement: The authors have declared that no competing interests exist.
Data sharing statement: No additional data are available.
Open-Access: This article is an open-access article which was selected by an in-house editor and fully peer-reviewed by external reviewers. It is distributed in accordance with the Creative Commons Attribution Non Commercial (CC BY-NC 4.0) license, which permits others to distribute, remix, adapt, build upon this work non-commercially, and license their derivative works on different terms, provided the original work is properly cited and the use is non-commercial. See: http://creativecommons.org/licenses/by-nc/4.0/
Correspondence to: Se-Hee Kim, PhD, Gachon Medical Research Institute, Gachon University Gil Medical Center, 21 Namdong-daero 774 beon-gil, Namdong-gu, Incheon 405-760, South Korea. [email protected]: +82-32-4608470Fax: +82-32-4608470
Received: March 20, 2015Peer-review started: March 21, 2015First decision: April 13, 2015Revised: May 16, 2015Accepted: July 8, 2015Article in press: July 8, 2015Published online: September 14, 2015
AbstractAIM: To elucidate the effects of dexamethasone on hypoxia-induced epithelial-to-mesenchymal transition (EMT) in colon cancer.
METHODS: Human colon cancer HCT116 and HT29 cells were exposed to normoxic (21%) and hypoxic (1%) conditions. First, the effect of dexamethasone on cell viability was examined by MTT cell proliferation assay. In order to measure the expression levels of EMT markers (Snail, Slug, Twist, E-cadherin, and integrin αVβ6) and hypoxia-related genes [Hypoxia-inducible factor-1α (HIF-1α) and vascular endothelial growth factor (VEGF)] by dexamethasone, quantitative real-time polymerase chain reaction and western blot analysis were performed. Furthermore, the morphological changes of colon cancer cells and the expression pattern of E-cadherin by dexamethasone were detected through immunocytochemistry. Finally, the effects of dexamethasone on the invasiveness and migration of colon cancer cells were elucidated using matrigel invasion, migration, and wound healing migration assays.
ORIGINAL ARTICLE
Submit a Manuscript: http://www.wjgnet.com/esps/Help Desk: http://www.wjgnet.com/esps/helpdesk.aspxDOI: 10.3748/wjg.v21.i34.9887
World J Gastroenterol 2015 September 14; 21(34): 9887-9899 ISSN 1007-9327 (print) ISSN 2219-2840 (online)
© 2015 Baishideng Publishing Group Inc. All rights reserved.
9887 September 14, 2015|Volume 21|Issue 34|WJG|www.wjgnet.com
Basic Study
Dexamethasone inhibits hypoxia-induced epithelial-mesenchymal transition in colon cancer
effective chemotherapeutic adjuvants is important to decrease cancer recurrence and increase cure rates in these patients.
Many human cancers contain hypoxic regions resulting from the increased consumption of oxygen by rapidly proliferating tumor cells, as well as the structural and functional irregularities of intratumoral blood vessels[2]. Intratumoral hypoxia promotes the accumulation of hypoxia-inducible factor-1α (HIF-1α), which is immediately degraded by proteasomal ubiquitination under normoxic conditions[2,3]. HIF-1α is a critical regulator of tumor invasion and metastasis[4-7]. For metastasis to occur, cancer cells must detach from the primary tumor and then invade and migrate via the connective tissues, blood, and lymphatic vessels. The process by which epithelial cells lose their cell polarity and cell-cell adhesions and thereby acquire migratory and invasive properties of mesenchymal cells is termed as epithelial-to-mesenchymal transition (EMT)[8,9]. The EMT is an important molecular step in cancer progression that provides cancer cells with a more aggressive phenotype. Notably, this process is potentiated by hypoxia in the tumor microenvironment[7].
The synthetic glucocorticoid dexamethasone (DEX) is widely used in the treatment of many diseases, particularly in hematologic malignancies where it has shown to have cytotoxic effects[10,11]. While DEX lacks this activity in solid tumors, patients are still treated with corticosteroids to prevent complications often associated with cancer therapy, including cancer-related pain, lack of appetite, edema, and electrolyte imbalance[12]. Although DEX is commonly prescribed as a co-medication in cancer treatment, its effects on the metastatic capacity of colorectal cancer are unknown. As such, this study aims to investigate the influence of DEX treatment on hypoxia-dependent EMT in colorectal cancer cell lines.
MATERIALS AND METHODSCell lines and cell culture conditionsHuman colon cancer cell lines, HCT116 and HT29, were purchased from the Korean Cell Line Bank (Seoul, South Korea) and grown in McCoy’s (Gibco Cell Culture, Carlsbad, CA, United States) supplemented with 10% FBS (Gibco) and 1% penicillin-streptomycin (Gibco). For hypoxic conditions, both cell lines were maintained in a hypoxic incubator (New Brunswick Scientific, Edison, NJ, United States) with a humidified environment consisting of 1% O2, 5% CO2, and 94% N2.
ReagentsDEX and deferoxamine (DFO) were purchased from Sigma-Aldrich (St. Louis, MO, United States) and dissolved in ethanol and water, respectively.
Kim JH et al . DEX inhibits EMT in colon cancer
9888 September 14, 2015|Volume 21|Issue 34|WJG|www.wjgnet.com
RESULTS: Under hypoxia, dexamethasone treatment inhibited HIF-1α protein level and its downstream gene, VEGF mRNA level in the colon cancer cell lines, HCT116 and HT29. In addition, the presence of dexamethasone down-regulated the mRNA levels of hypoxia-induced Snail, Slug, and Twist, all transcriptional factors of EMT, as well as hypoxia-induced integrin αVβ6 protein level, a well-known EMT marker for colon cancer cells. Furthermore, reduced E-cadherin in hypoxic condition was found to be recoverable by treating with dexamethasone in both colon cancer cell lines. Similarly, under hypoxic conditions, dexamethasone restored the growth pattern and morphological phenotype reminiscent of colon cancer cells grown under normoxic conditions; dexamethasone blocked the migration and invasion of both colorectal cancer cell lines in hypoxia.
CONCLUSION: Our study suggested that dexa-methasone has inhibitory effects on cell migration and invasion by suppressing EMT of colon cancer cell lines in hypoxic condition.
Key words: Dexamethasone; Colon cancer; Hypoxia; Hypoxia-inducible factor-1α; Epithelial-mesenchymal transition
© The Author(s) 2015. Published by Baishideng Publishing Group Inc. All rights reserved.
Core tip: In solid tumors, the heightened metabolism of cancer cells often leads to areas of hypoxia that can drive epithelial-mesenchymal transition (EMT). Dexamethasone is often given to patients with colon cancer to limit the negative side effects of chemotherapy. Our study investigated the effects of dexamethasone on hypoxia-induced EMT and found that it was sufficient to block the propensity for cells to undergo EMT by repressing the hypoxia-induced expression of Hypoxia-inducible factor-1α, vascular endothelial growth factor and other EMT markers. This evidence suggests that dexamethasone co-treatment may limit the migratory properties of colorectal cancer cells that subsist in the hypoxic regions of colorectal cancers.
Kim JH, Hwang YJ, Han SH, Lee YE, Kim S, Kim YJ, Cho JH, Kwon KA, Kim JH, Kim SH. Dexamethasone inhibits hypoxia-induced epithelial-mesenchymal transition in colon cancer. World J Gastroenterol 2015; 21(34): 9887-9899 Available from: URL: http://www.wjgnet.com/1007-9327/full/v21/i34/9887.htm DOI: http://dx.doi.org/10.3748/wjg.v21.i34.9887
INTRODUCTIONAmong newly diagnosed cases of colorectal cancer in the United States, approximately 20% are fully metastatic and an additional 37% are lymph node-positive at presentation[1]. Thus, development of
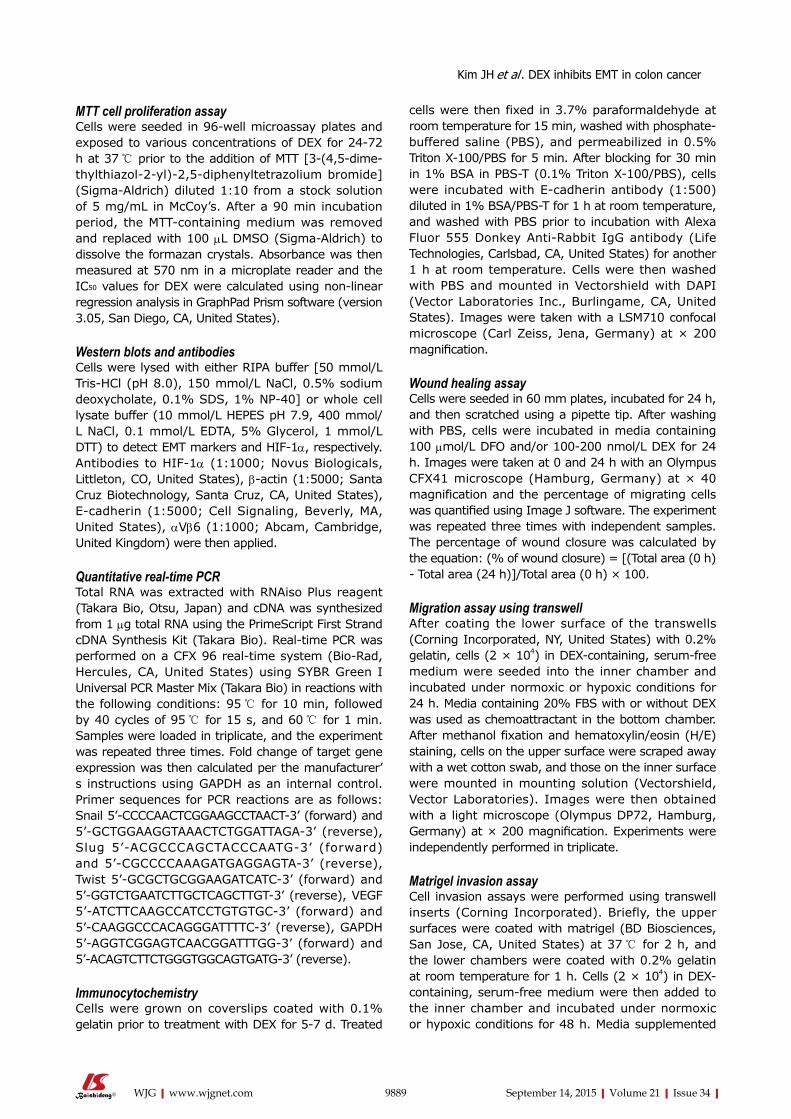
MTT cell proliferation assayCells were seeded in 96-well microassay plates and exposed to various concentrations of DEX for 24-72 h at 37 ℃ prior to the addition of MTT [3-(4,5-dime-thylthiazol-2-yl)-2,5-diphenyltetrazolium bromide] (Sigma-Aldrich) diluted 1:10 from a stock solution of 5 mg/mL in McCoy’s. After a 90 min incubation period, the MTT-containing medium was removed and replaced with 100 μL DMSO (Sigma-Aldrich) to dissolve the formazan crystals. Absorbance was then measured at 570 nm in a microplate reader and the IC50 values for DEX were calculated using non-linear regression analysis in GraphPad Prism software (version 3.05, San Diego, CA, United States).
Western blots and antibodiesCells were lysed with either RIPA buffer [50 mmol/L Tris-HCl (pH 8.0), 150 mmol/L NaCl, 0.5% sodium deoxycholate, 0.1% SDS, 1% NP-40] or whole cell lysate buffer (10 mmol/L HEPES pH 7.9, 400 mmol/L NaCl, 0.1 mmol/L EDTA, 5% Glycerol, 1 mmol/L DTT) to detect EMT markers and HIF-1α, respectively. Antibodies to HIF-1α (1:1000; Novus Biologicals, Littleton, CO, United States), β-actin (1:5000; Santa Cruz Biotechnology, Santa Cruz, CA, United States), E-cadherin (1:5000; Cell Signaling, Beverly, MA, United States), αVβ6 (1:1000; Abcam, Cambridge, United Kingdom) were then applied.
Quantitative real-time PCRTotal RNA was extracted with RNAiso Plus reagent (Takara Bio, Otsu, Japan) and cDNA was synthesized from 1 μg total RNA using the PrimeScript First Strand cDNA Synthesis Kit (Takara Bio). Real-time PCR was performed on a CFX 96 real-time system (Bio-Rad, Hercules, CA, United States) using SYBR Green I Universal PCR Master Mix (Takara Bio) in reactions with the following conditions: 95 ℃ for 10 min, followed by 40 cycles of 95 ℃ for 15 s, and 60 ℃ for 1 min. Samples were loaded in triplicate, and the experiment was repeated three times. Fold change of target gene expression was then calculated per the manufacturer’s instructions using GAPDH as an internal control. Primer sequences for PCR reactions are as follows: Snail 5’-CCCCAACTCGGAAGCCTAACT-3’ (forward) and 5’-GCTGGAAGGTAAACTCTGGATTAGA-3’ (reverse), Slug 5’-ACGCCCAGCTACCCAATG-3’ (forward) and 5’-CGCCCCAAAGATGAGGAGTA-3’ (reverse), Twist 5’-GCGCTGCGGAAGATCATC-3’ (forward) and 5’-GGTCTGAATCTTGCTCAGCTTGT-3’ (reverse), VEGF 5’-ATCTTCAAGCCATCCTGTGTGC-3’ (forward) and 5’-CAAGGCCCACAGGGATTTTC-3’ (reverse), GAPDH 5’-AGGTCGGAGTCAACGGATTTGG-3’ (forward) and 5’-ACAGTCTTCTGGGTGGCAGTGATG-3’ (reverse).
ImmunocytochemistryCells were grown on coverslips coated with 0.1% gelatin prior to treatment with DEX for 5-7 d. Treated
cells were then fixed in 3.7% paraformaldehyde at room temperature for 15 min, washed with phosphate-buffered saline (PBS), and permeabilized in 0.5% Triton X-100/PBS for 5 min. After blocking for 30 min in 1% BSA in PBS-T (0.1% Triton X-100/PBS), cells were incubated with E-cadherin antibody (1:500) diluted in 1% BSA/PBS-T for 1 h at room temperature, and washed with PBS prior to incubation with Alexa Fluor 555 Donkey Anti-Rabbit IgG antibody (Life Technologies, Carlsbad, CA, United States) for another 1 h at room temperature. Cells were then washed with PBS and mounted in Vectorshield with DAPI (Vector Laboratories Inc., Burlingame, CA, United States). Images were taken with a LSM710 confocal microscope (Carl Zeiss, Jena, Germany) at × 200 magnification.
Wound healing assayCells were seeded in 60 mm plates, incubated for 24 h, and then scratched using a pipette tip. After washing with PBS, cells were incubated in media containing 100 μmol/L DFO and/or 100-200 nmol/L DEX for 24 h. Images were taken at 0 and 24 h with an Olympus CFX41 microscope (Hamburg, Germany) at × 40 magnification and the percentage of migrating cells was quantified using Image J software. The experiment was repeated three times with independent samples. The percentage of wound closure was calculated by the equation: (% of wound closure) = [(Total area (0 h) - Total area (24 h)]/Total area (0 h) × 100.
Migration assay using transwellAfter coating the lower surface of the transwells (Corning Incorporated, NY, United States) with 0.2% gelatin, cells (2 × 10⁴) in DEX-containing, serum-free medium were seeded into the inner chamber and incubated under normoxic or hypoxic conditions for 24 h. Media containing 20% FBS with or without DEX was used as chemoattractant in the bottom chamber. After methanol fixation and hematoxylin/eosin (H/E) staining, cells on the upper surface were scraped away with a wet cotton swab, and those on the inner surface were mounted in mounting solution (Vectorshield, Vector Laboratories). Images were then obtained with a light microscope (Olympus DP72, Hamburg, Germany) at × 200 magnification. Experiments were independently performed in triplicate.
Matrigel invasion assayCell invasion assays were performed using transwell inserts (Corning Incorporated). Briefly, the upper surfaces were coated with matrigel (BD Biosciences, San Jose, CA, United States) at 37 ℃ for 2 h, and the lower chambers were coated with 0.2% gelatin at room temperature for 1 h. Cells (2 × 10⁴) in DEX-containing, serum-free medium were then added to the inner chamber and incubated under normoxic or hypoxic conditions for 48 h. Media supplemented
9889 September 14, 2015|Volume 21|Issue 34|WJG|www.wjgnet.com
Kim JH et al . DEX inhibits EMT in colon cancer
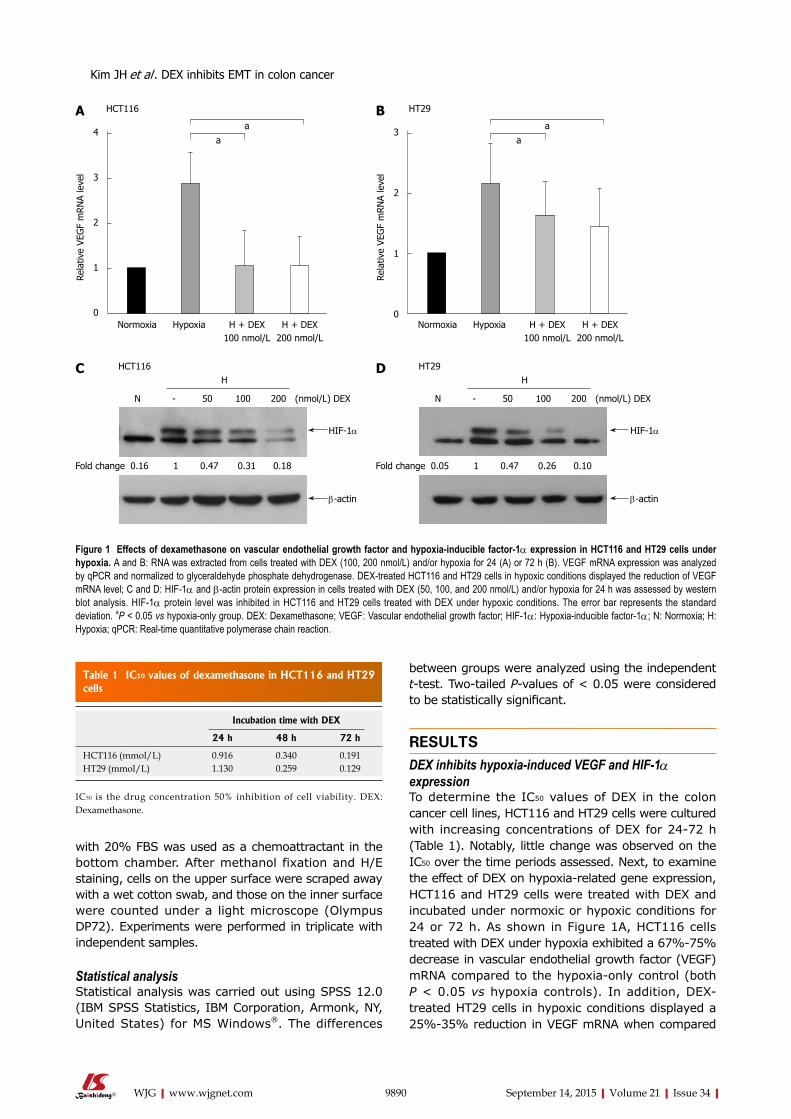
between groups were analyzed using the independent t-test. Two-tailed P-values of < 0.05 were considered to be statistically significant.
RESULTSDEX inhibits hypoxia-induced VEGF and HIF-1α expressionTo determine the IC50 values of DEX in the colon cancer cell lines, HCT116 and HT29 cells were cultured with increasing concentrations of DEX for 24-72 h (Table 1). Notably, little change was observed on the IC50 over the time periods assessed. Next, to examine the effect of DEX on hypoxia-related gene expression, HCT116 and HT29 cells were treated with DEX and incubated under normoxic or hypoxic conditions for 24 or 72 h. As shown in Figure 1A, HCT116 cells treated with DEX under hypoxia exhibited a 67%-75% decrease in vascular endothelial growth factor (VEGF) mRNA compared to the hypoxia-only control (both P < 0.05 vs hypoxia controls). In addition, DEX-treated HT29 cells in hypoxic conditions displayed a 25%-35% reduction in VEGF mRNA when compared
with 20% FBS was used as a chemoattractant in the bottom chamber. After methanol fixation and H/E staining, cells on the upper surface were scraped away with a wet cotton swab, and those on the inner surface were counted under a light microscope (Olympus DP72). Experiments were performed in triplicate with independent samples.
Statistical analysisStatistical analysis was carried out using SPSS 12.0 (IBM SPSS Statistics, IBM Corporation, Armonk, NY, United States) for MS Windows®. The differences
9890 September 14, 2015|Volume 21|Issue 34|WJG|www.wjgnet.com
Table 1 IC50 values of dexamethasone in HCT116 and HT29 cells
Incubation time with DEX
24 h 48 h 72 h
HCT116 (mmol/L) 0.916 0.340 0.191HT29 (mmol/L) 1.130 0.259 0.129
IC50 is the drug concentration 50% inhibition of cell viability. DEX: Dexamethasone.
HCT116A
aa
Normoxia Hypoxia H + DEX100 nmol/L
H + DEX200 nmol/L
4
3
2
1
0
Rela
tive
VEG
F m
RN
A le
vel
Normoxia Hypoxia H + DEX100 nmol/L
H + DEX200 nmol/L
3
2
1
0
Rela
tive
VEG
F m
RN
A le
vel
aa
HT29B
HCT116
N - 50 100 200 (nmol/L) DEX
H
0.16 1 0.47 0.31 0.18Fold change
C
HIF-1α
β-actin
HT29
N - 50 100 200 (nmol/L) DEX
H
0.05 1 0.47 0.26 0.10Fold change
D
HIF-1α
β-actin
Figure 1 Effects of dexamethasone on vascular endothelial growth factor and hypoxia-inducible factor-1α expression in HCT116 and HT29 cells under hypoxia. A and B: RNA was extracted from cells treated with DEX (100, 200 nmol/L) and/or hypoxia for 24 (A) or 72 h (B). VEGF mRNA expression was analyzed by qPCR and normalized to glyceraldehyde phosphate dehydrogenase. DEX-treated HCT116 and HT29 cells in hypoxic conditions displayed the reduction of VEGF mRNA level; C and D: HIF-1α and β-actin protein expression in cells treated with DEX (50, 100, and 200 nmol/L) and/or hypoxia for 24 h was assessed by western blot analysis. HIF-1α protein level was inhibited in HCT116 and HT29 cells treated with DEX under hypoxic conditions. The error bar represents the standard deviation. aP < 0.05 vs hypoxia-only group. DEX: Dexamethasone; VEGF: Vascular endothelial growth factor; HIF-1α: Hypoxia-inducible factor-1α; N: Normoxia; H: Hypoxia; qPCR: Real-time quantitative polymerase chain reaction.
Kim JH et al . DEX inhibits EMT in colon cancer
to the hypoxia-only control (both P < 0.05 vs hypoxia controls) (Figure 1B). The HIF-1α protein expression is kept low under normoxic conditions via ubiquitin-mediated proteasomal degradation; thus, we sought to investigate whether DEX treatment had any effect on HIF-1α protein level in either cell line. For this, cells were cultured under hypoxic conditions for 24 h in the presence of varying concentrations of DEX. Finally, Western blot analysis also demonstrated DEX’s inhibitory effect on HIF-1α protein expression by 53%-82% in HCT116 and 53%-90% in HT29 cells compared to the hypoxia-only controls (Figure 1C and D).
DEX reduces the expression of EMT markers in hypoxic cellsTo monitor whether DEX regulates hypoxia-induced EMT in human colon cancer cells, we incubated HCT116 and HT29 cells with or without DEX under normoxic or hypoxic conditions for 24 or 72 h. The mRNA expression of Snail, Slug, and Twist was then examined by real-time quantitative polymerase chain reaction. While hypoxia alone augmented the mRNA levels of Snail, Slug, and Twist in HCT116 and HT29 cells, adding DEX resulted in the decrease of the mRNA levels as follows. HCT116 cells: Snail (73%-81%, P < 0.05 and P < 0.001 vs hypoxia controls), Slug (75%-85%, P < 0.05 and P < 0.001 vs hypoxia controls), and Twist (89%-93%, P < 0.01 and P < 0.001 vs hypoxia controls). HT29 cells: Snail (49%-65%, P < 0.05 and P < 0.01 vs hypoxia controls), Slug (46%-62%, both P < 0.05 vs hypoxia controls), and Twist (62%-81%, both P < 0.01 vs hypoxia controls) (Figure 2A-F).
Next, we explored the effect of DEX and hypoxia on expression of the EMT markers, E-cadherin and integrin αVβ6 at the protein level. As shown in Figure 2G and H, E-cadherin expression was reduced by hypoxia alone and recovered in a dose-dependent manner by the addition of DEX. Reversely, hypoxia-induced integrin αVβ6 was further depressed by DEX treatment under hypoxic conditions. Moreover, DEX-treated HCT116 and HT29 cells cultured under hypoxic conditions showed that E-cadherin was recovered by 26% and 33%, whereas integrin αVβ6 was reduced by 44% and 53%, respectively (Figure 2G and H).
DEX restores morphological changes by hypoxiaSince hypoxia has been shown to regulate the expression of EMT markers and change cell mor-phology, we assessed whether DEX could rescue the expression of E-cadherin and alter the morphology of cells cultured in the presence of hypoxia. To perform this experiment, HCT116 and HT29 cells were treated with DEX (100 and 200 nmol/L) and incubated under normoxic or hypoxic conditions for 5 or 7 d. Both HCT116 and HT29 cells were largely clustered together when cultured under normoxic conditions, whereas those exposed to hypoxia were scattered and
displayed morphological changes, such as an elongated fibroblastic morphology (Figure 3A and B). Importantly, the presence of DEX partially restored the growth pattern and morphological phenotype reminiscent of cells grown under normoxic conditions. Furthermore, E-cadherin expression was increased by DEX compared to hypoxia control counterparts. These effects were present in both cell lines, HCT116 and HT29.
DEX blocks migration and invasion of colon cancer cellsTo examine the effect of DEX on epithelial cell migration, we performed wound healing assays in both cell lines. For these analyses, we used DFO to mimic hypoxic conditions. As shown in Figure 4, DFO-treated cells were highly migratory as compared to the untreated groups, whereas those co-treated with DEX and DFO exhibited a lower propensity for migration compared to DFO-only control cells. Additionally, in hypoxic conditions, DEX showed 55%-57% (both P < 0.05 vs DFO-only controls) and 77%-92% (P < 0.01 and P < 0.001 vs DFO-only controls) decrease on recovery of wounds in HCT116 and HT29 cells, respectively. To confirm this inhibitory effect of DEX on the migration of hypoxic colon cancer cells, we performed the migration assay using transwells. Consistently, the hypoxia-induced migration of HCT116 and HT29 cells decreased by 21%-25% (P < 0.05 and P < 0.01 vs hypoxia controls) and 37%-63% (both P < 0.05 vs hypoxia controls) in DEX-treated cells, respectively (Figure 5A and B).
Finally, we employed matrigel invasion assays to investigate the effect of DEX on colorectal cancer cell invasion. As shown in Figure 5C and D, hypoxic DEX-treated cells showed reductions of 87%-90% (both P < 0.01 vs hypoxia controls) and 56%-98% (P < 0.05 and P < 0.001 vs hypoxia controls) on the invasive capacity of HCT116 and HT29 cells compared to the hypoxia-only controls. This inhibitory effect of DEX on invasion was observed in both cell lines consistently.
DISCUSSIONHypoxia is a hallmark of various human malignancies and is currently observed as an unfavorable prognostic factor often associated with other high-risk charac-teristics, such as therapy-resistant metastasis[13]. Thus, tumor hypoxia has been suggested to favor selection of the most aggressive/invasive neoplastic cells, and subsequently facilitate cancer progression[14,15].
In the current study, we used two colorectal cancer cell lines, HCT116 and HT29 to study the effect of DEX on hypoxia-induced EMT. Colon cancer can be classified into two major groups: MSI (microsatellite instability) and MSS (microsatellite stable, chromosome instability)[16]. HCT116 and HT29 were used for this study since they belong to MSI and MSS, respectively. In addition, we hypothesized that DEX blocks the migration and invasion of colorectal cancer cells by repressing
9891 September 14, 2015|Volume 21|Issue 34|WJG|www.wjgnet.com
Kim JH et al . DEX inhibits EMT in colon cancer
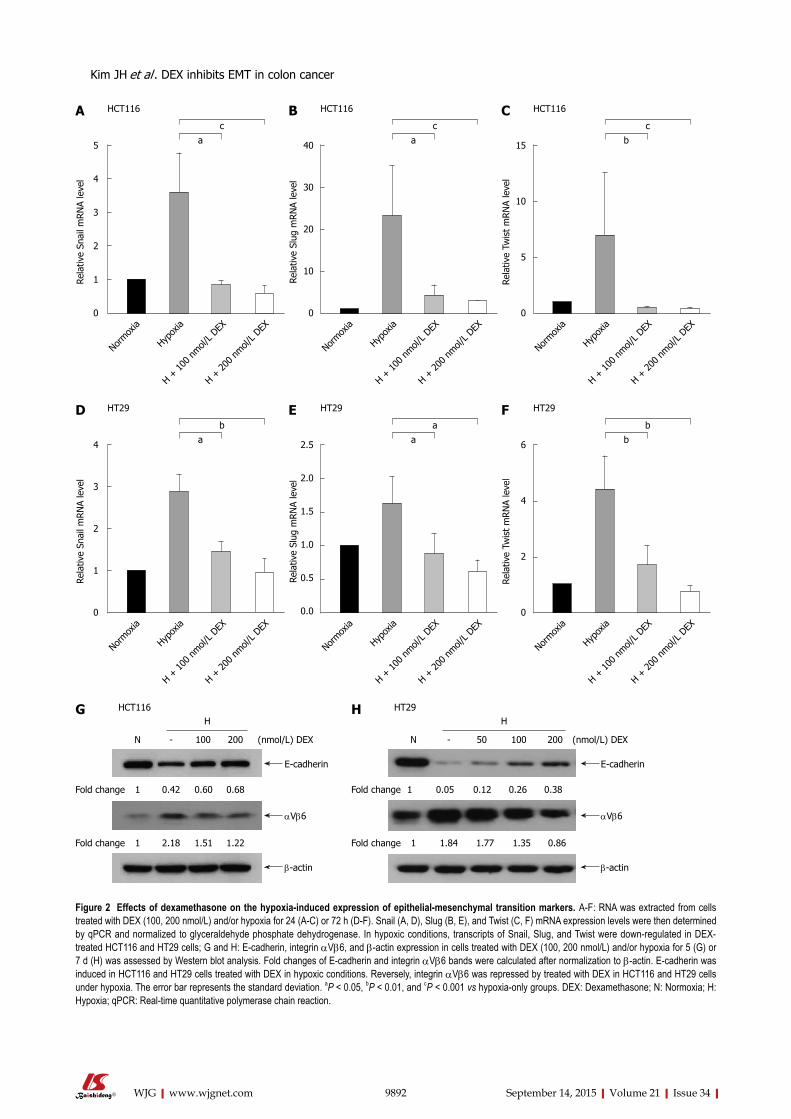
9892 September 14, 2015|Volume 21|Issue 34|WJG|www.wjgnet.com
HCT116A HCT116 HCT116C
bc
Normox
ia
Hypox
ia
H + 10
0 nmol/
L DEX
H + 20
0 nmol/
L DEX
15
10
5
0
Rela
tive
Twis
t m
RN
A le
vel
B
ac
Normox
ia
Hypox
ia
H + 10
0 nmol/
L DEX
H + 20
0 nmol/
L DEX
40
30
20
10
0
Rela
tive
Slug
mRN
A le
vel
ac
Normox
ia
Hypox
ia
H + 10
0 nmol/
L DEX
H + 20
0 nmol/
L DEX
5
4
3
2
1
0
Rela
tive
Snai
l mRN
A le
vel
Figure 2 Effects of dexamethasone on the hypoxia-induced expression of epithelial-mesenchymal transition markers. A-F: RNA was extracted from cells treated with DEX (100, 200 nmol/L) and/or hypoxia for 24 (A-C) or 72 h (D-F). Snail (A, D), Slug (B, E), and Twist (C, F) mRNA expression levels were then determined by qPCR and normalized to glyceraldehyde phosphate dehydrogenase. In hypoxic conditions, transcripts of Snail, Slug, and Twist were down-regulated in DEX-treated HCT116 and HT29 cells; G and H: E-cadherin, integrin αVβ6, and β-actin expression in cells treated with DEX (100, 200 nmol/L) and/or hypoxia for 5 (G) or 7 d (H) was assessed by Western blot analysis. Fold changes of E-cadherin and integrin αVβ6 bands were calculated after normalization to β-actin. E-cadherin was induced in HCT116 and HT29 cells treated with DEX in hypoxic conditions. Reversely, integrin αVβ6 was repressed by treated with DEX in HCT116 and HT29 cells under hypoxia. The error bar represents the standard deviation. aP < 0.05, bP < 0.01, and cP < 0.001 vs hypoxia-only groups. DEX: Dexamethasone; N: Normoxia; H: Hypoxia; qPCR: Real-time quantitative polymerase chain reaction.
HT29 HT29HT29E
aa
Normox
ia
Hypox
ia
H + 10
0 nmol/
L DEX
H + 20
0 nmol/
L DEX
2.5
2.0
1.5
1.0
0.5
0.0
Rela
tive
Slug
mRN
A le
vel
F
bb
Normox
ia
Hypox
ia
H + 10
0 nmol/
L DEX
H + 20
0 nmol/
L DEX
6
4
2
0
Rela
tive
Twis
t m
RN
A le
vel
D
ab
Normox
ia
Hypox
ia
H + 10
0 nmol/
L DEX
H + 20
0 nmol/
L DEX
4
3
2
1
0
Rela
tive
Snai
l mRN
A le
vel
G HCT116
N - 100 200 (nmol/L) DEX
H
1 0.42 0.60 0.68Fold change
E-cadherin
αVβ6
1 2.18 1.51 1.22Fold change
β-actin
H HT29
N - 50 100 (nmol/L) DEX
H
1 0.05 0.12 0.26Fold change
E-cadherin
αVβ6
1 1.84 1.77 1.35Fold change
β-actin
200
0.86
0.38
Kim JH et al . DEX inhibits EMT in colon cancer
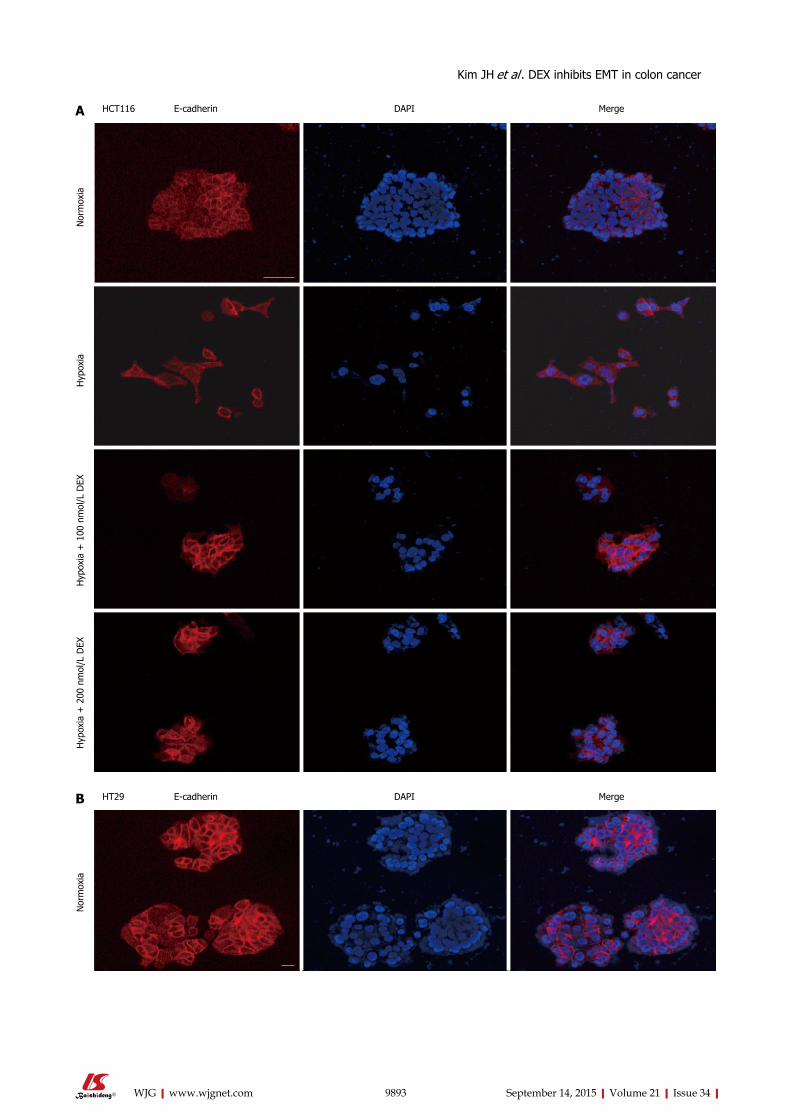
9893 September 14, 2015|Volume 21|Issue 34|WJG|www.wjgnet.com
E-cadherin DAPI Merge
Nor
mox
iaH
ypox
iaH
ypox
ia +
100
nm
ol/L
DEX
Hyp
oxia
+ 2
00 n
mol
/L D
EX
A
E-cadherin DAPI Merge
Nor
mox
ia
B
HCT116
HT29
Kim JH et al . DEX inhibits EMT in colon cancer
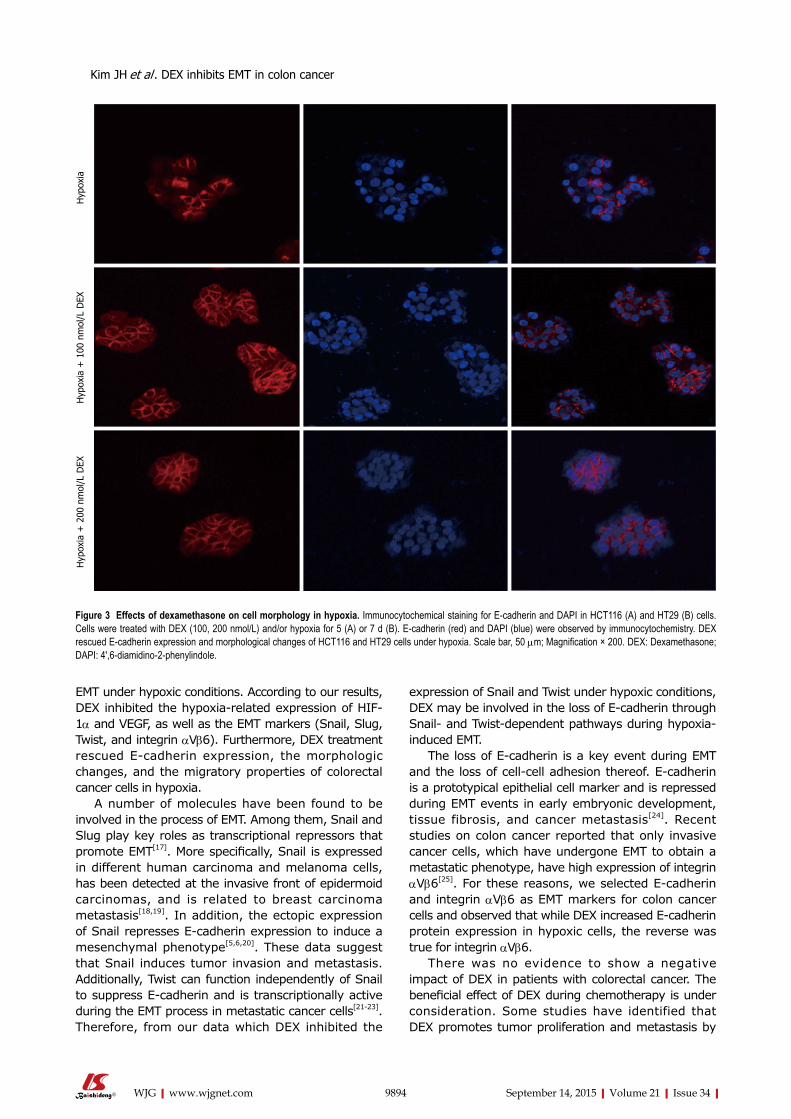
EMT under hypoxic conditions. According to our results, DEX inhibited the hypoxia-related expression of HIF-1α and VEGF, as well as the EMT markers (Snail, Slug, Twist, and integrin αVβ6). Furthermore, DEX treatment rescued E-cadherin expression, the morphologic changes, and the migratory properties of colorectal cancer cells in hypoxia.
A number of molecules have been found to be involved in the process of EMT. Among them, Snail and Slug play key roles as transcriptional repressors that promote EMT[17]. More specifically, Snail is expressed in different human carcinoma and melanoma cells, has been detected at the invasive front of epidermoid carcinomas, and is related to breast carcinoma metastasis[18,19]. In addition, the ectopic expression of Snail represses E-cadherin expression to induce a mesenchymal phenotype[5,6,20]. These data suggest that Snail induces tumor invasion and metastasis. Additionally, Twist can function independently of Snail to suppress E-cadherin and is transcriptionally active during the EMT process in metastatic cancer cells[21-23]. Therefore, from our data which DEX inhibited the
expression of Snail and Twist under hypoxic conditions, DEX may be involved in the loss of E-cadherin through Snail- and Twist-dependent pathways during hypoxia-induced EMT.
The loss of E-cadherin is a key event during EMT and the loss of cell-cell adhesion thereof. E-cadherin is a prototypical epithelial cell marker and is repressed during EMT events in early embryonic development, tissue fibrosis, and cancer metastasis[24]. Recent studies on colon cancer reported that only invasive cancer cells, which have undergone EMT to obtain a metastatic phenotype, have high expression of integrin αVβ6[25]. For these reasons, we selected E-cadherin and integrin αVβ6 as EMT markers for colon cancer cells and observed that while DEX increased E-cadherin protein expression in hypoxic cells, the reverse was true for integrin αVβ6.
There was no evidence to show a negative impact of DEX in patients with colorectal cancer. The beneficial effect of DEX during chemotherapy is under consideration. Some studies have identified that DEX promotes tumor proliferation and metastasis by
9894 September 14, 2015|Volume 21|Issue 34|WJG|www.wjgnet.com
Hyp
oxia
Hyp
oxia
+ 1
00 n
mol
/L D
EXH
ypox
ia +
200
nm
ol/L
DEX
Figure 3 Effects of dexamethasone on cell morphology in hypoxia. Immunocytochemical staining for E-cadherin and DAPI in HCT116 (A) and HT29 (B) cells. Cells were treated with DEX (100, 200 nmol/L) and/or hypoxia for 5 (A) or 7 d (B). E-cadherin (red) and DAPI (blue) were observed by immunocytochemistry. DEX rescued E-cadherin expression and morphological changes of HCT116 and HT29 cells under hypoxia. Scale bar, 50 μm; Magnification × 200. DEX: Dexamethasone; DAPI: 4',6-diamidino-2-phenylindole.
Kim JH et al . DEX inhibits EMT in colon cancer
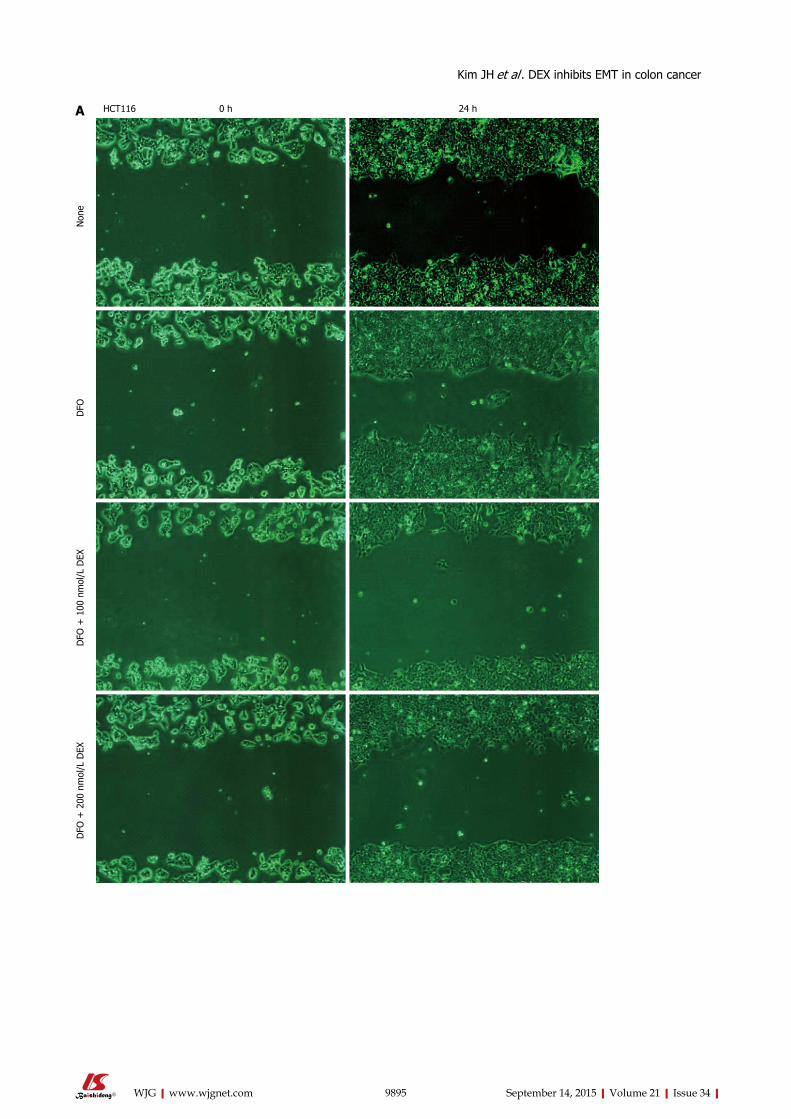
9895 September 14, 2015|Volume 21|Issue 34|WJG|www.wjgnet.com
0 h 24 h
Non
eD
FOD
FO +
100
nm
ol/L
DEX
DFO
+ 2
00 n
mol
/L D
EX
A HCT116
Kim JH et al . DEX inhibits EMT in colon cancer
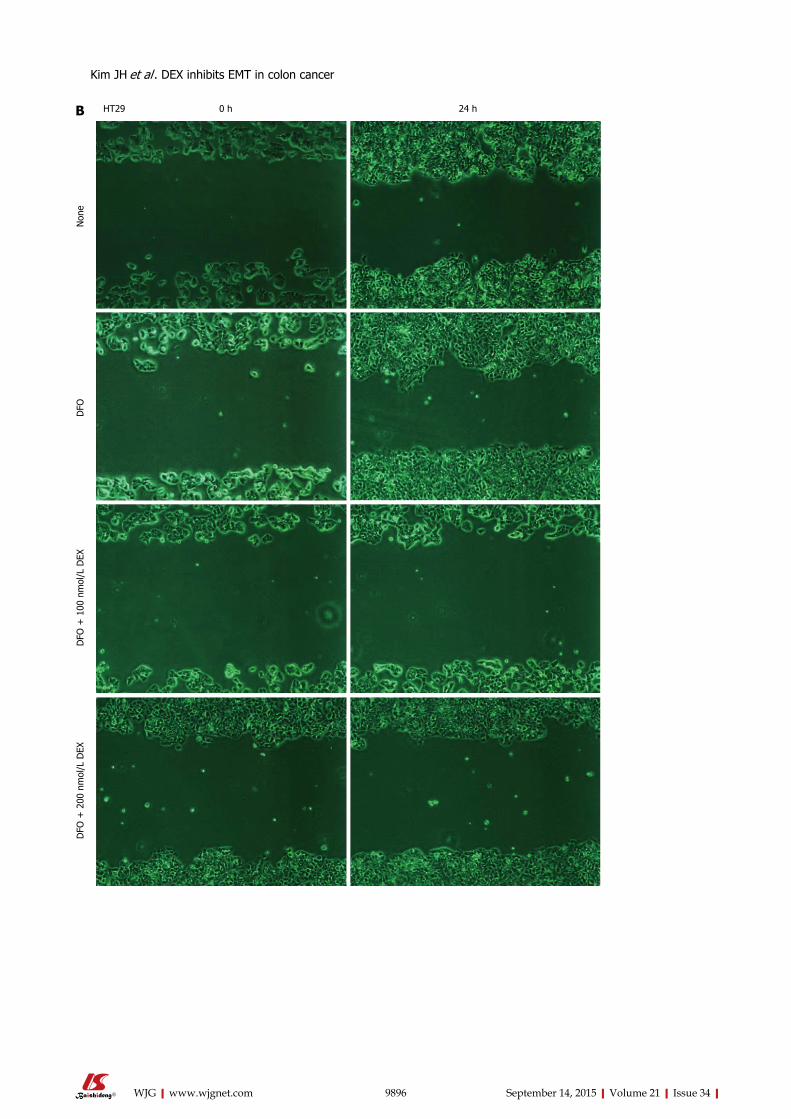
9896 September 14, 2015|Volume 21|Issue 34|WJG|www.wjgnet.com
0 h 24 h
Non
eD
FOD
FO +
100
nm
ol/L
DEX
DFO
+ 2
00 n
mol
/L D
EX
B HT29
Kim JH et al . DEX inhibits EMT in colon cancer
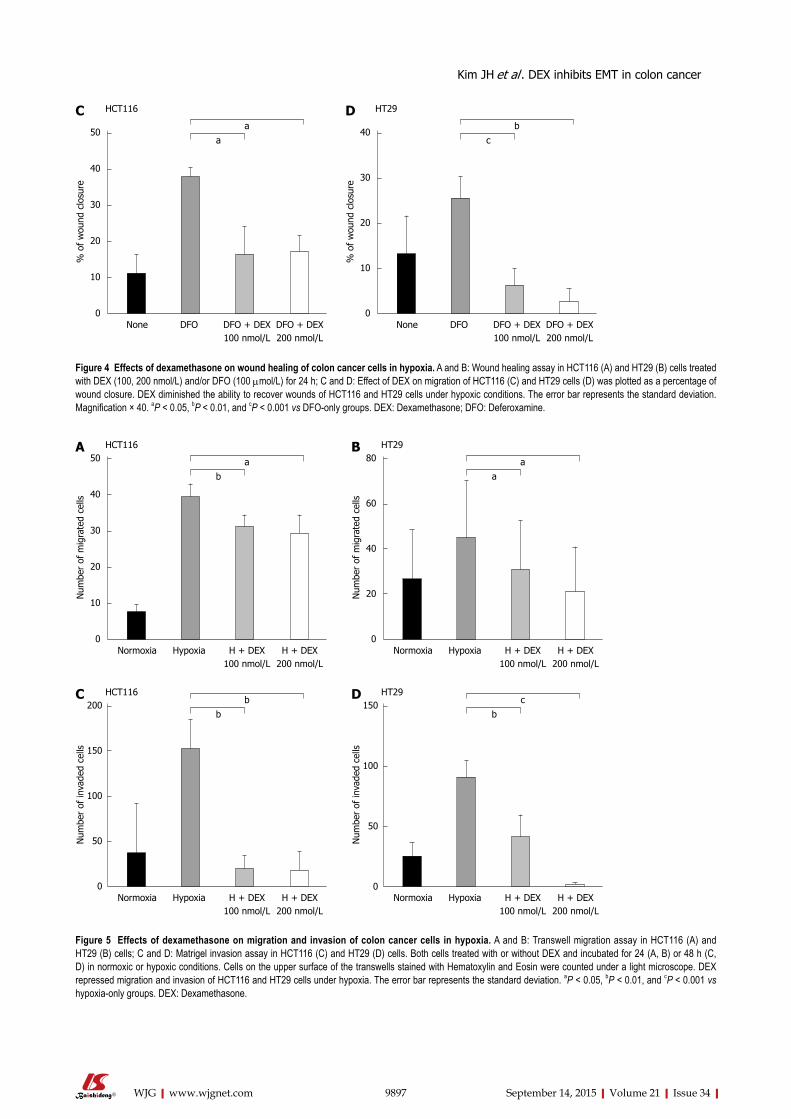
9897 September 14, 2015|Volume 21|Issue 34|WJG|www.wjgnet.com
HCT116C
aa
None DFO DFO + DEX100 nmol/L
DFO + DEX200 nmol/L
50
40
30
20
10
0
% o
f w
ound
clo
sure
HT29D
cb
None DFO DFO + DEX100 nmol/L
DFO + DEX200 nmol/L
40
30
20
10
0
% o
f w
ound
clo
sure
Figure 4 Effects of dexamethasone on wound healing of colon cancer cells in hypoxia. A and B: Wound healing assay in HCT116 (A) and HT29 (B) cells treated with DEX (100, 200 nmol/L) and/or DFO (100 μmol/L) for 24 h; C and D: Effect of DEX on migration of HCT116 (C) and HT29 cells (D) was plotted as a percentage of wound closure. DEX diminished the ability to recover wounds of HCT116 and HT29 cells under hypoxic conditions. The error bar represents the standard deviation. Magnification × 40. aP < 0.05, bP < 0.01, and cP < 0.001 vs DFO-only groups. DEX: Dexamethasone; DFO: Deferoxamine.
HCT116A
ba
Normoxia Hypoxia H + DEX100 nmol/L
H + DEX200 nmol/L
50
40
30
20
10
0
Num
ber
of m
igra
ted
cells
HT29B
aa
Normoxia Hypoxia H + DEX100 nmol/L
H + DEX200 nmol/L
80
60
40
20
0
Num
ber
of m
igra
ted
cells
HCT116Cb
b
Normoxia Hypoxia H + DEX100 nmol/L
H + DEX200 nmol/L
200
150
100
50
0
Num
ber
of in
vade
d ce
lls
HT29Db
c
Normoxia Hypoxia H + DEX100 nmol/L
H + DEX200 nmol/L
150
100
50
0
Num
ber
of in
vade
d ce
lls
Figure 5 Effects of dexamethasone on migration and invasion of colon cancer cells in hypoxia. A and B: Transwell migration assay in HCT116 (A) and HT29 (B) cells; C and D: Matrigel invasion assay in HCT116 (C) and HT29 (D) cells. Both cells treated with or without DEX and incubated for 24 (A, B) or 48 h (C, D) in normoxic or hypoxic conditions. Cells on the upper surface of the transwells stained with Hematoxylin and Eosin were counted under a light microscope. DEX repressed migration and invasion of HCT116 and HT29 cells under hypoxia. The error bar represents the standard deviation. aP < 0.05, bP < 0.01, and cP < 0.001 vs hypoxia-only groups. DEX: Dexamethasone.
Kim JH et al . DEX inhibits EMT in colon cancer
blocking apoptosis and anti-tumor immunosurveillance and, thereby causing resistance to treatment agents[12,26-28], whereas others have reported on the benefits for DEX therapy[20,29,30]. These conflicting results of glucocorticoids may be explained by the differential expression of glucocorticoid receptor co-activators and corepressors in diverse cell types[27]. Corticosteroids activate or repress the transcription of many target genes by binding specific intracellular receptors that can vary between cell lineages. Thus, the observed difference in the efficacy of glucocorticoids on cell viability likely results from cell-type specific transcriptional regulation; however, the mechanistic understanding for this effect is unclear.
A recent report suggests that DEX as a preoperative prophylactic induces no difference in overall and disease-free survival among patients with colorectal cancer, and yet the rate of recurrence is higher among patients receiving DEX[31]. This result conflicts with our hypothesis; however, these results are based on observations after a single dose, and we are unable to make decision on the efficacy of DEX due to the small sample size and lack of a comparable study.
A limitation of this study is the lack of a detailed molecular mechanism underlying the regulation of EMT by DEX in colorectal cancer cells. Wagner et al[32] previously reported that DEX impairs HIF-1α function by causing an unusual protein distribution from the nucleus to the cytosol in hepatocellular carcinoma cells; however, our western blot analysis using the whole cell lysate from DEX-treated colorectal cancer cells showed that DEX blocked EMT by inhibiting HIF-1α stability, which can be explained by the cell-type specific activity of DEX. Therefore, further studies are necessary to determine how DEX controls HIF-1α stability and the expression of EMT markers under hypoxia.
Limiting the side effects of chemotherapy is clinically significant, as improved treatment outcome and prognosis can be achieved in patients undergoing chemotherapy in terms of recommended dose and duration of treatment. Given that DEX prevented hypoxia-dependent EMT of colon cancer cells, the use of DEX in colorectal cancer patients might be beneficial in mitigating tumor progression or metastasis. However, this finding should be interpreted with caution given the in vitro nature of this study.
COMMENTSBackgroundThe synthetic glucocorticoid dexamethasone (DEX) is widely used in the treatment of many diseases, particularly in hematologic malignancies where it has shown to have cytotoxic effects. While DEX lacks this activity in solid tumors, patients are still treated with corticosteroids to prevent complications often associated with cancer therapy, including cancer-related pain, lack of appetite, edema, and electrolyte imbalance. Although DEX is commonly prescribed as a co-medication in cancer treatment, the effect of DEX on the metastatic capacity of colorectal cancer is unknown.
Research frontiersThe beneficial effect of DEX during chemotherapy is under consideration. The authors hypothesized that DEX blocks the migration and invasion of colorectal cancer cells by repressing epithelial-mesenchymal transition (EMT) under hypoxic conditions. According to this results, DEX inhibited the hypoxia-related expression of hypoxia-inducible factor-1α (HIF-1α) and vascular endothelial growth factor (VEGF), as well as the EMT markers, Snail, Slug, Twist, and integrin αVβ6. Furthermore, DEX treatment rescued E-cadherin expression, mesenchymal morphology, and the migratory properties of colorectal cancer cells in hypoxia.
Innovations and breakthroughsThis study investigated the effects of DEX on hypoxia-induced EMT and found that it was sufficient to block the propensity for cells to undergo EMT by repressing the hypoxia-induced expression of HIF-1α and VEGF, as well as the EMT markers. This evidence suggests that DEX co-treatment may limit the migratory properties of colorectal tumors subsisting in the hypoxic regions of colorectal cancers. A limitation of this study is the lack of a detailed molecular mechanism underlying the regulation of EMT by DEX in colorectal cancer cells.
ApplicationsLimiting the side effects of chemotherapy is clinically significant, as improved treatment outcome and prognosis can be achieved in patients undergoing chemotherapy in terms of recommended dose and duration of treatment. Given that DEX prevented hypoxia-dependent EMT of colon cancer cells, its use in colorectal cancer patients might be beneficial in mitigating tumor progression or metastasis. However, this finding should be interpreted with caution given the in vitro nature of this study.
Peer-reviewThe authors address a clinically very interesting issue, considering the fact that most patients undergoing chemotherapeutic treatment for metastatic colorectal cancer also receive anti-emetic treatment with synthetic corticosteroids. These authors state that dexamethasone was sufficient to block the propensity for cells to undergo EMT by repressing the hypoxia-induced expression of HIF-1α. This study is easily read, addresses an interesting question, and adds to the existing evidence in the field.
REFERENCES1 Howlader N, Noone AM, Krapcho M, Garshell J, Miller D,
Altekruse SF, Kosary CL, Yu M, Ruhl J, Tatalovich Z, Mariotto A, Lewis DR, Chen HS, Feuer EJ, Cronin KA, editors. SEER Cancer Statistics Review, 1975-2011. Bethesda, MD: National Cancer Institute, 2014. Available from: URL: http://seer.cancer.gov/csr/1975_2011/
2 Tang CM, Yu J. Hypoxia-inducible factor-1 as a therapeutic target in cancer. J Gastroenterol Hepatol 2013; 28: 401-405 [PMID: 23173651 DOI: 10.1111/jgh.12038]
3 Keith B, Simon MC. Hypoxia-inducible factors, stem cells, and cancer. Cell 2007; 129: 465-472 [PMID: 17482542 DOI: 10.1016/j.cell.2007.04.019]
4 Bao B, Azmi AS, Ali S, Ahmad A, Li Y, Banerjee S, Kong D, Sarkar FH. The biological kinship of hypoxia with CSC and EMT and their relationship with deregulated expression of miRNAs and tumor aggressiveness. Biochim Biophys Acta 2012; 1826: 272-296 [PMID: 22579961 DOI: 10.1016/j.bbcan.2012.04.008]
5 Liao D, Corle C, Seagroves TN, Johnson RS. Hypoxia-inducible factor-1alpha is a key regulator of metastasis in a transgenic model of cancer initiation and progression. Cancer Res 2007; 67: 563-572 [PMID: 17234764 DOI: 10.1158/0008-5472.CAN-06-2701]
6 Ruan K, Song G, Ouyang G. Role of hypoxia in the hallmarks of human cancer. J Cell Biochem 2009; 107: 1053-1062 [PMID: 19479945 DOI: 10.1002/jcb.22214]
7 Marie-Egyptienne DT, Lohse I, Hill RP. Cancer stem cells, the epithelial to mesenchymal transition (EMT) and radioresistance: potential role of hypoxia. Cancer Lett 2013; 341: 63-72 [PMID: 23200673 DOI: 10.1016/j.canlet.2012.11.019]
9898 September 14, 2015|Volume 21|Issue 34|WJG|www.wjgnet.com
COMMENTS
Kim JH et al . DEX inhibits EMT in colon cancer
8 Natalwala A, Spychal R, Tselepis C. Epithelial-mesenchymal transition mediated tumourigenesis in the gastrointestinal tract. World J Gastroenterol 2008; 14: 3792-3797 [PMID: 18609701 DOI: 10.3748/wjg.14.3792]
9 Kalluri R, Weinberg RA. The basics of epithelial-mesenchymal transition. J Clin Invest 2009; 119: 1420-1428 [PMID: 19487818 DOI: 10.1172/JCI39104]
10 Bindreither D, Ecker S, Gschirr B, Kofler A, Kofler R, Rainer J. The synthetic glucocorticoids prednisolone and dexamethasone regulate the same genes in acute lymphoblastic leukemia cells. BMC Genomics 2014; 15: 662 [PMID: 25103118 DOI: 10.1186/1471-2164-15-662]
11 Inaba H, Pui CH. Glucocorticoid use in acute lymphoblastic leukaemia. Lancet Oncol 2010; 11: 1096-1106 [PMID: 20947430 DOI: 10.1016/S1470-2045(10)70114-5]
12 Rutz HP. Effects of corticosteroid use on treatment of solid tumours. Lancet 2002; 360: 1969-1970 [PMID: 12493280 DOI: 10.1016/S0140-6736(02)11922-2]
13 Vaupel P, Mayer A. Hypoxia in cancer: significance and impact on clinical outcome. Cancer Metastasis Rev 2007; 26: 225-239 [PMID: 17440684 DOI: 10.1007/s10555-007-9055-1]
14 Le QT, Denko NC, Giaccia AJ. Hypoxic gene expression and metastasis. Cancer Metastasis Rev 2004; 23: 293-310 [PMID: 15197330 DOI: 10.1023/B:CANC.0000031768.89246.d7]
15 Semenza GL. HIF-1 and tumor progression: pathophysiology and therapeutics. Trends Mol Med 2002; 8: S62-S67 [PMID: 11927290 DOI: 10.1016/S1471-4914(02)02317-1]
16 Giacomini CP, Leung SY, Chen X, Yuen ST, Kim YH, Bair E, Pollack JR. A gene expression signature of genetic instability in colon cancer. Cancer Res 2005; 65: 9200-9205 [PMID: 16230380 DOI: 10.1158/0008-5472.can-04-4163]
17 Nieto MA. The snail superfamily of zinc-finger transcription factors. Nat Rev Mol Cell Biol 2002; 3: 155-166 [PMID: 11994736 DOI: 10.1038/nrm757]
18 Peinado H, Olmeda D, Cano A. Snail, Zeb and bHLH factors in tumour progression: an alliance against the epithelial phenotype? Nat Rev Cancer 2007; 7: 415-428 [PMID: 17508028 DOI: 10.1038/nrc2131]
19 Blanco MJ, Moreno-Bueno G, Sarrio D, Locascio A, Cano A, Palacios J, Nieto MA. Correlation of Snail expression with histological grade and lymph node status in breast carcinomas. Oncogene 2002; 21: 3241-3246 [PMID: 12082640 DOI: 10.1038/sj.onc.1205416]
20 Zhang L, Lei W, Wang X, Tang Y, Song J. Glucocorticoid induces mesenchymal-to-epithelial transition and inhibits TGF-β1-induced epithelial-to-mesenchymal transition and cell migration. FEBS Lett 2010; 584: 4646-4654 [PMID: 20971111 DOI: 10.1016/j.febslet.2010.10.038]
21 Yang J, Mani SA, Donaher JL, Ramaswamy S, Itzykson RA, Come C, Savagner P, Gitelman I, Richardson A, Weinberg RA.
Twist, a master regulator of morphogenesis, plays an essential role in tumor metastasis. Cell 2004; 117: 927-939 [PMID: 15210113 DOI: 10.1016/j.cell.2004.06.006]
22 Venkov CD, Link AJ, Jennings JL, Plieth D, Inoue T, Nagai K, Xu C, Dimitrova YN, Rauscher FJ, Neilson EG. A proximal activator of transcription in epithelial-mesenchymal transition. J Clin Invest 2007; 117: 482-491 [PMID: 17273560 DOI: 10.1172/JCI29544]
23 Yu W, Kamara H, Svoboda KK. The role of twist during palate development. Dev Dyn 2008; 237: 2716-2725 [PMID: 18697225 DOI: 10.1002/dvdy.21627]
24 Thiery JP, Acloque H, Huang RY, Nieto MA. Epithelial-mesenchymal transitions in development and disease. Cell 2009; 139: 871-890 [PMID: 19945376 DOI: 10.1016/j.cell.2009.11.007]
25 Bates RC, Bellovin DI, Brown C, Maynard E, Wu B, Kawakatsu H, Sheppard D, Oettgen P, Mercurio AM. Transcriptional activation of integrin beta6 during the epithelial-mesenchymal transition defines a novel prognostic indicator of aggressive colon carcinoma. J Clin Invest 2005; 115: 339-347 [PMID: 15668738 DOI: 10.1172/JCI23183]
26 Gündisch S, Boeckeler E, Behrends U, Amtmann E, Ehrhardt H, Jeremias I. Glucocorticoids augment survival and proliferation of tumor cells. Anticancer Res 2012; 32: 4251-4261 [PMID: 23060545]
27 Zhang C, Kolb A, Mattern J, Gassler N, Wenger T, Herzer K, Debatin KM, Büchler M, Friess H, Rittgen W, Edler L, Herr I. Dexamethasone desensitizes hepatocellular and colorectal tumours toward cytotoxic therapy. Cancer Lett 2006; 242: 104-111 [PMID: 16338063 DOI: 10.1016/j.canlet.2005.10.037]
28 Zheng Y, Izumi K, Li Y, Ishiguro H, Miyamoto H. Contrary regulation of bladder cancer cell proliferation and invasion by dexamethasone-mediated glucocorticoid receptor signals. Mol Cancer Ther 2012; 11: 2621-2632 [PMID: 23033490 DOI: 10.1158/1535-7163.MCT-12-0621]
29 Keith BD. Systematic review of the clinical effect of glucocor-ticoids on nonhematologic malignancy. BMC Cancer 2008; 8: 84 [PMID: 18373855 DOI: 10.1186/1471-2407-8-84]
30 Münstedt K, Borces D, Bohlmann MK, Zygmunt M, von Georgi R. Glucocorticoid administration in antiemetic therapy: is it safe? Cancer 2004; 101: 1696-1702 [PMID: 15468188 DOI: 10.1002/cncr.20534]
31 Singh PP, Lemanu DP, Taylor MH, Hill AG. Association between preoperative glucocorticoids and long-term survival and cancer recurrence after colectomy: follow-up analysis of a previous randomized controlled trial. Br J Anaesth 2014; 113 Suppl 1: i68-i73 [PMID: 24583820 DOI: 10.1093/bja/aet577]
32 Wagner AE, Huck G, Stiehl DP, Jelkmann W, Hellwig-Bürgel T. Dexamethasone impairs hypoxia-inducible factor-1 function. Biochem Biophys Res Commun 2008; 372: 336-340 [PMID: 18501194 DOI: 10.1016/j.bbrc.2008.05.061]
P- Reviewer: Engelmann BE, Wang ZX S- Editor: Wang JL L- Editor: A E- Editor: Ma S
9899 September 14, 2015|Volume 21|Issue 34|WJG|www.wjgnet.com
Kim JH et al . DEX inhibits EMT in colon cancer

Feng Qi, Jiang-Feng Hu, Bao-Hai Liu, Chao-Qun Wu, Hong-Yu Yu, Ding-Kang Yao, Liang Zhu
Feng Qi, Bao-Hai Liu, Hong-Yu Yu, Ding-Kang Yao, Liang Zhu, Department of Gastroenterology, Changzheng Hospital, the Second Military Medical University, Shanghai 200003, China
Jiang-Feng Hu, Department of Gastroenterology, Institute of Digestive Diseases, Tongji Hospital, Tongji University, Shanghai 200065, China
Chao-Qun Wu, Genetics Institute, Fudan University, Shanghai 200433, China
Author contributions: Qi F and Hu JF performed the majority of experiments; Liu BH, Wu CQ, Yu HY, Yao DK and Zhu L provided vital reagents and analytical tools and were also involved in editing the manuscript; Qi F designed the study and wrote the manuscript.
Supported by National Natural Science Foundation of China, No. 11272342/A0205.
Institutional animal care and use committee statement: All procedures involving animals were reviewed and approved by the Committee on the Ethics of Animal Experiments of the Second Military Medical University animal center (protocol number: 13071002107).
Conflict-of-interest statement: The authors declare that they have no competing interests.
Data sharing statement: Dataset available from the corresponding author at http://www.ncbi.nlm.nih.gov/geo/query/acc.cgi?acc=GSE63783.
Open-Access: This article is an openaccess article which was selected by an inhouse editor and fully peerreviewed by external reviewers. It is distributed in accordance with the Creative Commons Attribution Non Commercial (CC BYNC 4.0) license, which permits others to distribute, remix, adapt, build upon this work noncommercially, and license their derivative works on different terms, provided the original work is properly cited and the use is noncommercial. See: http://creativecommons.org/licenses/bync/4.0/
Correspondence to: Liang Zhu, Professor, Department of
Gastroenterology, Changzheng Hospital, the Second Military Medical University, No. 415 Fengyang Road, Shanghai 200003, China. [email protected]: +862181885261
Received: February 26, 2015Peer-review started: February 27, 2015First decision: March 26, 2015Revised: April 11, 2015Accepted: July 3, 2015Article in press: July 3, 2015Published online: September 14, 2015
AbstractAIM: To reveal the functions of microRNAs (miRNAs) with respect to hepatic stellate cells (HSCs) in response to portal hypertension.
METHODS: Primary rat HSCs were exposed to static water pressure (10 mmHg, 1 h) and the pressure-induced miRNA expression profile was detected by next-generation sequencing. Quantitative real-time polymerase chain reaction was used to verify the expression of miRNAs. A potential target of MiR-9a-5p was measured by a luciferase reporter assay and Western blot. CCK-8 assay and Transwell assay were used to detect the proliferation and migration of HSCs under pressure.
RESULTS: According to the profile, the expression of miR-9a-5p was further confirmed to be significantly increased after pressure overload in HSCs (3.70 ± 0.61 vs 0.97 ± 0.15, P = 0.0226), which resulted in the proliferation, migration and activation of HSCs. In vivo , the up-regulation of miR-9a-5p (2.09 ± 0.91 vs 4.27 ± 1.74, P = 0.0025) and the down-regulation of Sirt1 (2.41 ± 0.51 vs 1.13 ± 0.11, P = 0.0006) were observed in rat fibrotic liver with portal hypertension. Sirt1 was a potential target gene of miR-9a-5p. Through restoring
ORIGINAL ARTICLE
Submit a Manuscript: http://www.wjgnet.com/esps/Help Desk: http://www.wjgnet.com/esps/helpdesk.aspxDOI: 10.3748/wjg.v21.i34.9900
World J Gastroenterol 2015 September 14; 21(34): 9900-9915 ISSN 1007-9327 (print) ISSN 2219-2840 (online)
© 2015 Baishideng Publishing Group Inc. All rights reserved.
9900 September 14, 2015|Volume 21|Issue 34|WJG|www.wjgnet.com
Basic Study
MiR-9a-5p regulates proliferation and migration of hepatic stellate cells under pressure through inhibition of Sirt1
nucleotides in length that regulate gene expression by binding to the 3′-untranslated region (UTR) of mRNAs; this in turn causes the degradation or translational repression of the corresponding mRNAs[8,9]. According to a study of liver fibrosis, miRNAs play an important role in the regulation of the differentiation, proliferation and apoptosis of HSCs[10]. In one study, miR-15b and miR-16 promoted apoptosis of HSCs via the inhibition of Bcl-2 protein expression[11]. In another study, miR-335 was significantly reduced during the activation of HSCs, and the restoration of miR-335 could inhibit the activation and migration of HSCs[12]. The overexpression of miR-19b inhibited the activation of HSCs and negatively regulated profibrotic TGF-β signaling[13]. However, little is known about whether miRNAs play a role in the response of HSCs to the portal vein pressure.
In this study, an HSC pressure-loading apparatus was applied followed by a screening of the increased pressure-induced miRNA expression profile in HSCs by next-generation sequencing (after 14 d when HSCs were fully activated)[14]. Among these miRNAs, miR-9a-5p was validated to be significantly upregulated by real-time quantitative polymerase chain reaction (qRT-PCR) during HSC pressure overload. Meanwhile, miR-9a-5p was upregulated and Sirt1 was downregulated following fibrotic liver injury in vivo. We also found that the inhibition of miR-9a-5p could significantly suppress the proliferation, migration and activation of HSCs. Furthermore, our findings indicated that miR-9a-5p might function by directly binding to the 3’-UTR of Sirt1. Collectively, these results revealed that miR-9a-5p, as a regulator of Sirt1, influences the activation, proliferation and migration of HSCs.
MATERIALS AND METHODSRat model of liver fibrosisTen male rats (180-200 g) received an intraperitoneal injection of CCl4 (2 mL/kg body weight) mixed with olive oil (40% CCl4), and then the first dosage was doubled. In order to induce liver fibrosis, CCl4 was injected twice a week for 8 wk. Ten control animals were injected with an equal volume of olive oil at the same time intervals. Rats were sacrificed 48 h after the last injection. The method of sacrifice entailed the use of 2 mL of 10% chloral hydrate that was injected into the heart. The experimental procedures were approved by the Committee on the Ethics of Animal Experiments of the Second Military Medical University animal center. All surgeries were performed under sodium pentobarbital anesthesia to minimize pain.
Isolation and culture of primary HSCsPrimary HSCs were extracted from male Sprague-Dawley rats (with a weight of approximately 400-600 g) that were purchased from the animal experiment center of the Second Military Medical University. The
Qi F et al . MiR-9a-5p and HSCs under pressure
9901 September 14, 2015|Volume 21|Issue 34|WJG|www.wjgnet.com
the expression of Sirt1 in miR-9a-5p transfected HSCs on pressure overload, we found that overexpression of Sirt1 could partially abrogate the miR-9a-5p mediated suppression of the proliferation, migration and activation of HSCs.
CONCLUSION: Our results suggest that during liver fibrosis, portal hypertension may induce the proliferation, migration and activation of HSCs through the up-regulation of miR-9a-5p, which targets Sirt1.
Key words: MicroRNA; miR-9a-5p; Sirt1; Pressure; Hepatic stellate cells
© The Author(s) 2015. Published by Baishideng Publishing Group Inc. All rights reserved.
Core tip: Portal hypertension is a syndrome as the main characteristics of the portal system hemodynamics change. Hepatic stellate cell (HSC) activation is the key factor of promoting the development of the occurrence of liver cirrhosis and portal hypertension. We determined the levels of miR-9a-5p in HSCs under pressure. We found that higher levels of miR-9a-5p, which targeted Sirt1, were expressed in vivo . The restored expression of miR-9a-5p and Sirt1 could significantly suppress the proliferation, migration and activation of HSCs.
Qi F, Hu JF, Liu BH, Wu CQ, Yu HY, Yao DK, Zhu L. MiR9a5p regulates proliferation and migration of hepatic stellate cells under pressure through inhibition of Sirt1. World J Gastroenterol 2015; 21(34): 99009915 Available from: URL: http://www.wjgnet.com/10079327/full/v21/i34/9900.htm DOI: http://dx.doi.org/10.3748/wjg.v21.i34.9900
INTRODUCTIONPortal hypertension is the consequence of an increase in both intrahepatic vascular resistance and portal blood flow[1]. In the normal liver, hepatic stellate cells (HSCs) reside in the space of Disse. Under physiological conditions, the main function of HSCs is the storage of vitamin A and other retinoids. In response to liver injury, HSCs gradually transdifferentiate to an activated α-SMA-positive phenotype through extensive proliferation and are considered to be the major source of fibrillar collagen production[2,3]. It has been widely accepted that the activation of HSCs is a key factor in the pathogenesis of liver fibrosis and portal hypertension[4]. Moreover, the increased portal pressure can promote the activation and migration of HSCs which further exacerbate liver fibrosis and cirrhosis[5-7]. However, whether HSCs are regulated by elevated portal pressure has received little attention.
MicroRNAs (miRNAs), which were discovered in recent years, are small noncoding RNAs 21-25
method of isolation of primary rat HSCs was described previously[15].
Pressure loadingPressure loading was performed as described previously with some amendments[16]. During the progression from chronic liver disease (CLD) to cirrhosis of the liver, the activation of HSCs plays a more important role. Therefore, 14 d was the time frame in which the primary HSCs were cultured before the pressure device was applied. This device was connected to nitrogen and to a hematomanometer; the hematomanometer was opened, and nitrogen was slowly injected. When the pressure rose to 10 mmHg, the valve was closed, which sealed the container so that it could be used in subsequent experiments after loading for 1 h (as reported previously).
Extraction of miRNAs and next-generation sequencingTotal RNA was isolated with TRIzol (Invitrogen) and was treated with DNase to remove potential genomic DNA contamination, according to the manufacturer’s protocol. The quality of the RNA was analyzed with an Agilent 2100 Bioanalyzer (Agilent Technologies). Adapters were ligated to the 5’ and 3’ ends of the isolated small RNAs. Reverse transcription followed by PCR was then used to create cDNA constructs based on the small RNA ligated with the 5’ and 3’ adapters. The cDNA was then sequenced with an ABI Proton. Reads Per Kilobase of exon model per Million mapped reads (RPKM) was adopted to quantitatively express the miRNA[17] with DEG-Seq to compare the pressure group and the control group. The following criteria were used to screen for different miRNAs: fold change ≥ 2, fold change ≤ 0.5, and false discovery rate (FDR) < 0.05[18]. The original data have been submitted to Gene Expression Omnibus (GEO) database (http://www.ncbi.nlm.nih.gov/geo/query/acc.cgi?acc=GSE63783).
Gene ontology analysis and pathway analysisGene ontology (GO) analysis was applied to analyze the main function of the differential expression of genes according to the GO which is the key functional classification of NCBI. Generally, Fisher’s exact test and χ 2 test were used to classify the GO category, and the FDR was calculated to correct the P-value; the smaller the FDR, the smaller the error in judging the P-value. The FDR was defined as FDR = Nk/T, where Nk refers to the number of Fisher’s test P-values less than χ 2 test P-values. We computed P-values for the GOs of all the
differential genes.Pathway analysis was used to find out the
significant pathways of the differential genes. Pathway annotations of microarray genes were downloaded from KEGG (http://www.genome.jp/kegg/). A Fisher exact test was used to find the significant enrichment pathways. The resulting P-values were adjusted using the BH FDR algorithm. Pathway categories with an FDR < 0.05 were reported. Enrichment provides a measure of the significance of the function: as the enrichment increases, the corresponding function is more specific, which helps us to find those more significant pathways in the experiment. The enrichment was given by: enrichment = (ng/na)/(Ng/Na). Where ng is the number of differential genes within the particular pathway, na is the total number of genes within the same pathway, Ng is the number of differential genes which have at least one pathway annotation, and Na is the number of genes which have at least one pathway annotation in the entire microarray.
qRT-PCRHSCs were exposed to the indicated pressures. The concentration of the sample RNA was detected with a spectrophotometer: RNA concentration (μg/μL) = A260 value × dilution ratio × 40/1000. The amplification primers of α-SMA, collagen type Ⅰ (Col1) and Sirt1 were then designed (Table 1). The primers of miRNAs were designed by Guangzhou RiboBio Co., Ltd. Then, 20 μL were obtained from the experimental group and the control group, respectively, for reverse transcription. According to the instructions included in the TaKaRa kit, the reverse transcription reaction was performed for the mRNA (37 ℃ for 15 min or 85 ℃ for 5 s) and miRNA (42 ℃ for 60 min or 70 ℃ for 10 min). Gene transcripts were quantified on a 7900HT Fast Real-Time PCR System (Life Technologies Corporation, United States) with SYBR green dye and were normalized to GAPDH and U6. The experiments for each sample were repeated 3 times.
Western blot analysisAntibodies against the following proteins were used for Western blot analysis: α-SMA (1:1000; Abcam, United States), Col1 (1:5000; Sigma, United States), β-actin (1:1000; CST, United States) and Sirt1 (1:1000; CST, United States). Lysed protein samples were electrophoresed by SDS-PAGE and transferred to polyvinylidene fluoride membranes (Millipore Co. United States). The membranes were first incubated
9902 September 14, 2015|Volume 21|Issue 34|WJG|www.wjgnet.com
Table 1 Primers used in real-time polymerase chain reaction
Gene Forward primer (5’-3’) Reverse primer (5’-3’) Product size (bp)
α-SMA GCCACTGCTGCTTCCTCTTCTT CCGCCGACTCCATTCCAATGAA 136Col1 GCTCGTGGATTGCCTGGAACAG CACCGACAGCACCATCGTTACC 235Sirt1 TGTGGGTCTATGCCTTTCTGGGT GCTTGCGTGTGATGCTCTGTC 239GAPDH ACGGCAAGTTCAACGGCACAG CCACGACATACTCAGCACCAGC 132
Qi F et al . MiR-9a-5p and HSCs under pressure
PlasmidsSirt1 3′-UTR constructs were PCR amplified (Primer sequence, forward: 5′-CATGAGCTCCACTATTGAAGC-TGTCCGGATTC-3′; reverse: 5′-GAGCTGAAAACAG-TCTTCACTG-3′) and cloned into pRL-CMV-Basic vector for Luciferase reporter gene assay. The detailed sequence information was reported previously[21]. The construction of the Sirt1 3′-UTR mutant was done using the Quickchange site directed mutagenesis kit (Qiagen, United States) (Primer sequence, forward: 5′-GAACAGCTTATCTAGACCGCGGAATGGTA-TTTCACACTTT-3′; reverse: 5′-AAAGTGTGAAATA-CCATTCCGCGGTCTAGATAAGCTGTTC-3′).
Luciferase assaysHEK293T cells were transfected with pmir-Report-Sirt1 3’-UTR (wild-type or mutant), miR-9a-5p mimic and the control. The cells were harvested 24 h later and a luciferase assay was performed with the Stratagene Luciferase Assay kit (Infinite M1000, TECAN) according to the manufacturer’s instructions. The luciferase activity was determined by a dual luciferase assay and is expressed as a percentage of the control.
Statistical analysisAll data are expressed as the mean ± SD of three independent experiments. Student’s t-test was performed when the data consisted of only two groups. One-way ANOVA was performed when three or more groups were compared. SPSS software, version 16.0, was used for all of the statistical analyses, and P values ≤ 0.05 were considered statistically significant.
RESULTSMiRNA expression profiles of primary HSCs under pressure overloadThe purity of primary HSCs was determined by autofluorescence and immunohistochemistry with antibodies against desmin (1:100, Santa Cruz Biotechnology, Santa Cruz, CA, United States) and α-SMA (1:100, Abcam, CA, United States) (Figure 1A). A total of 18 significantly abnormally expressed miRNAs were discovered by next-generation sequenc-ing among zero pressure-loaded HSCs and pressure-overloaded HSCs. According to the screening criteria, 11 of these miRNAs were upregulated and the rest were downregulated (Table 2). qRT-PCR was used to confirm these data (Figure 1B). According to the results of the data mining, different GOs were controlled by upregulated miRNAs and downregulated miRNAs, such as cell cycle, negative regulation of fibroblast proliferation, positive regulation of macroau-tophagy, response to retinoic acid, protein K48-linked deubiquitination, protein K63-linked deubiquitination and negative regulation of gene expression (Figure 2A) (Supplementary material). Meanwhile, miRNAs
with the primary antibodies and were then incubated with the secondary antibodies. After washing with TBST 3 times for 10 min each, the membranes were developed with an enhanced chemiluminescent ECL assay kit (Santa Cruz Biotechnology, United States).
Transfection with miRNA mimic and inhibitorCells were transfected using a ribo FECT™ CP Transfection Kit (Guangzhou RiboBio Co., Ltd) according to the manufacturer’s instructions. Control miR-9a-5p, an miR-9a-5p inhibitor and an miR-9a-5p mimic were purchased from Guangzhou RiboBio Co., Ltd. The miRNA inhibitor and the miRNA mimic were transfected into the cells at a density of 100 nmol/L and 50 nmol/L, respectively; the cells were collected after 24-48 h.
Cell proliferation and cell cycle assaysAfter the transfection with the miRNA inhibitor and the subsequent pressure loading (10 mmHg, 1 h), the cells were fostered in 96-well plates and cultivated for 24, 48 or 72 h. A Cell Counting Kit 8 (Weiao, Shanghai, China) and an EL × 800 microplate reader (BioTek Instruments Inc., Winooski, Vermont, United States) (absorbance at 450 nm) were used to determine the cell proliferation rate.
A total of 1 × 10⁶ cells that were transfected with the miRNA inhibitor were grown in a 6-cm Petri dish under the appropriate pressure (10 mmHg, 1 h). After the cells were collected, they were mixed with ice-cold 70% ethanol, washed with PBS, and resuspended in 0.5 mL PBS with propidium iodide (0.5 mg/mL in PBS with 0.1% sodium azide) and RNase A (1 mg/mL). Finally, the cells were incubated at 37 ℃ for 30 min. The results were obtained with a FACS Calibur flow cytometer (Becton–Dickinson, CA, United States) and FlowJo software (Tree Star, Ashland, OR, United States).
Cell migration assayTranswell was used for migration assay experiments. HSCs were transfected and given pressure loading (10 mmHg, 1 h) as described previously. HSCs were inoculated at a density of 5 × 10³ cells/well with 100 μL cell suspension of each small chamber. After migration for 24 h, the downside cells were fixed and stained. Five fields (× 200) were randomly observed and the bottom of the filter was visualized for counting the number of cells on each surface. This experiment was repeated 3 times.
ImmunohistochemistryLiver tissues were obtained from the rats with CCl4-induced liver fibrosis[19,20]. Tissues were fixed in 4% paraformaldehyde and stained with anti-Sirt1 antibody as previously described. Sections (6 μm in thickness) were cut from paraffin embedded tissues.
9903 September 14, 2015|Volume 21|Issue 34|WJG|www.wjgnet.com
Qi F et al . MiR-9a-5p and HSCs under pressure
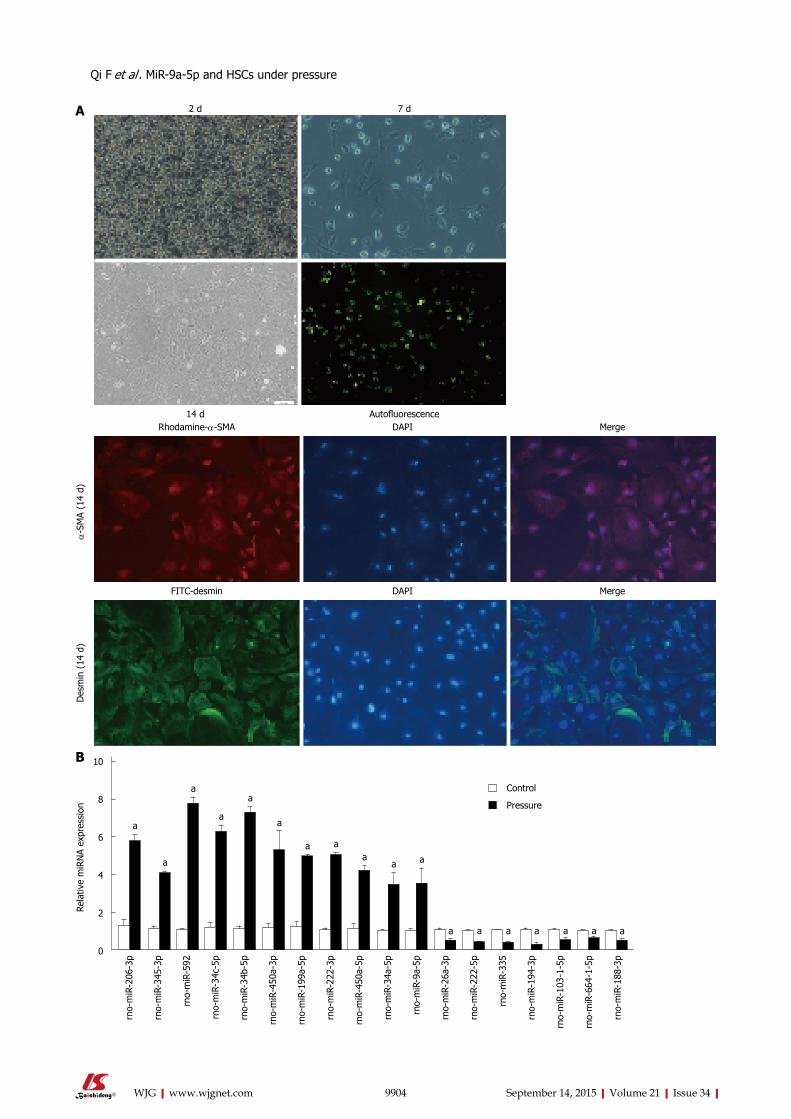
9904 September 14, 2015|Volume 21|Issue 34|WJG|www.wjgnet.com
2 d 7 d
14 d Autofluorescence
α-S
MA
(14
d)D
esm
in (
14 d
)
Rhodamine-α-SMA DAPI Merge
FITC-desmin DAPI Merge
A
Rela
tive
miR
NA
expr
essi
on
a
a
a
a
a
a
a aa
a a
a a a a a a a
10
8
6
4
2
0
Control
Pressure
rno-
miR
-206
-3p
rno-
miR
-345
-3p
rno-
miR
-592
rno-
miR
-34c
-5p
rno-
miR
-34b
-5p
rno-
miR
-450
a-3p
rno-
miR
-199
a-5p
rno-
miR
-222
-3p
rno-
miR
-450
a-5p
rno-
miR
-34a
-5p
rno-
miR
-9a-
5p
rno-
miR
-26a
-3p
rno-
miR
-222
-5p
rno-
miR
-335
rno-
miR
-194
-3p
rno-
miR
-103
-1-5
p
rno-
miR
-664
-1-5
p
rno-
miR
-188
-3p
B
Qi F et al . MiR-9a-5p and HSCs under pressure
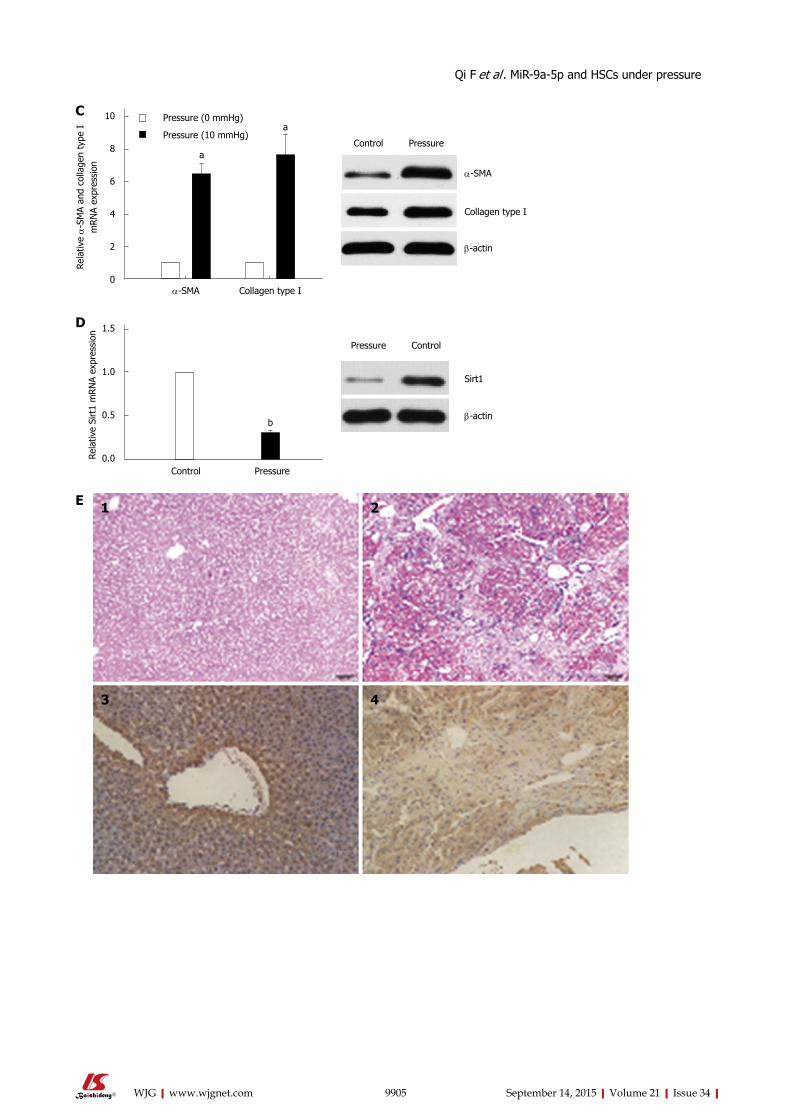
9905 September 14, 2015|Volume 21|Issue 34|WJG|www.wjgnet.com
a
a
Rela
tive α
-SM
A an
d co
llage
n ty
pe I
m
RN
A ex
pres
sion
α-SMA Collagen type I
Pressure (0 mmHg)
Pressure (10 mmHg)
10
8
6
4
2
0
C
Control Pressure
α-SMA
Collagen type I
β-actin
b
Rela
tive
Sirt
1 m
RN
A ex
pres
sion
Control Pressure
1.5
1.0
0.5
0.0
D
Pressure Control
β-actin
Sirt1
E 1 2
3 4
Qi F et al . MiR-9a-5p and HSCs under pressure
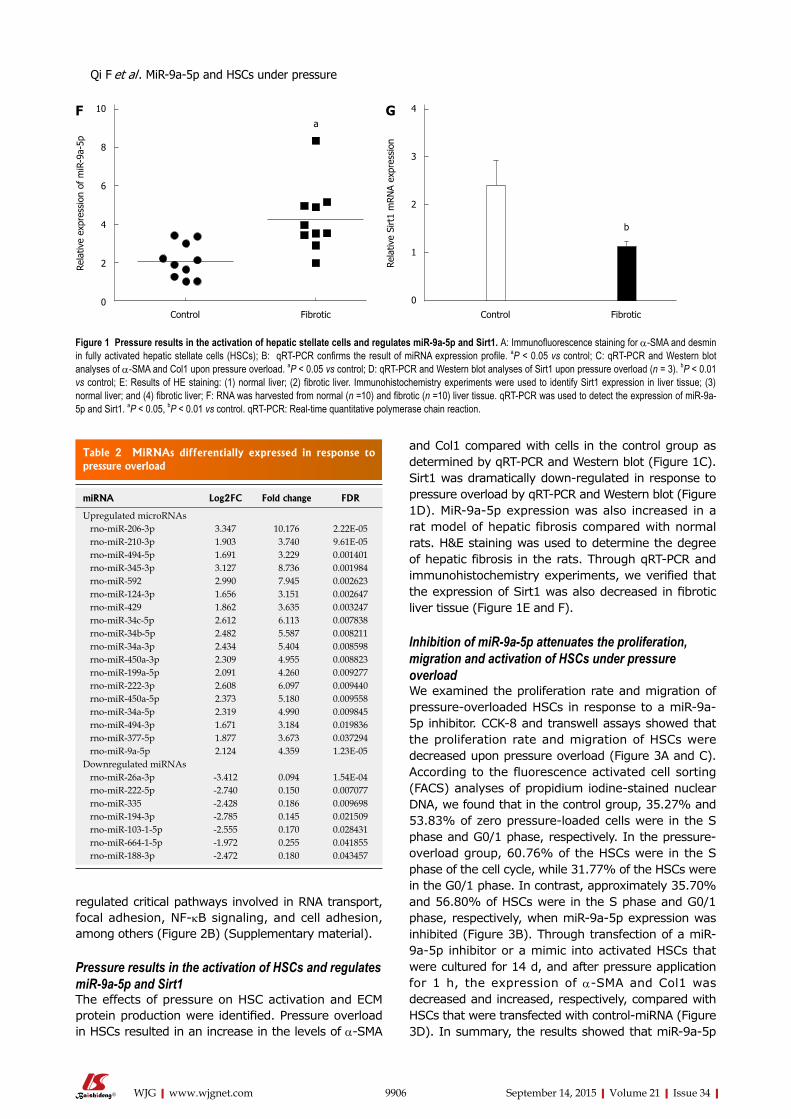
regulated critical pathways involved in RNA transport, focal adhesion, NF-kB signaling, and cell adhesion, among others (Figure 2B) (Supplementary material).
Pressure results in the activation of HSCs and regulates miR-9a-5p and Sirt1The effects of pressure on HSC activation and ECM protein production were identified. Pressure overload in HSCs resulted in an increase in the levels of α-SMA
and Col1 compared with cells in the control group as determined by qRT-PCR and Western blot (Figure 1C). Sirt1 was dramatically down-regulated in response to pressure overload by qRT-PCR and Western blot (Figure 1D). MiR-9a-5p expression was also increased in a rat model of hepatic fibrosis compared with normal rats. H&E staining was used to determine the degree of hepatic fibrosis in the rats. Through qRT-PCR and immunohistochemistry experiments, we verified that the expression of Sirt1 was also decreased in fibrotic liver tissue (Figure 1E and F).
Inhibition of miR-9a-5p attenuates the proliferation, migration and activation of HSCs under pressure overloadWe examined the proliferation rate and migration of pressure-overloaded HSCs in response to a miR-9a-5p inhibitor. CCK-8 and transwell assays showed that the proliferation rate and migration of HSCs were decreased upon pressure overload (Figure 3A and C). According to the fluorescence activated cell sorting (FACS) analyses of propidium iodine-stained nuclear DNA, we found that in the control group, 35.27% and 53.83% of zero pressure-loaded cells were in the S phase and G0/1 phase, respectively. In the pressure-overload group, 60.76% of the HSCs were in the S phase of the cell cycle, while 31.77% of the HSCs were in the G0/1 phase. In contrast, approximately 35.70% and 56.80% of HSCs were in the S phase and G0/1 phase, respectively, when miR-9a-5p expression was inhibited (Figure 3B). Through transfection of a miR-9a-5p inhibitor or a mimic into activated HSCs that were cultured for 14 d, and after pressure application for 1 h, the expression of α-SMA and Col1 was decreased and increased, respectively, compared with HSCs that were transfected with control-miRNA (Figure 3D). In summary, the results showed that miR-9a-5p
9906 September 14, 2015|Volume 21|Issue 34|WJG|www.wjgnet.com
Control Fibrotic
10
8
6
4
2
0
Rela
tive
expr
essi
on o
f m
iR-9
a-5p
aF
Figure 1 Pressure results in the activation of hepatic stellate cells and regulates miR-9a-5p and Sirt1. A: Immunofluorescence staining for α-SMA and desmin in fully activated hepatic stellate cells (HSCs); B: qRT-PCR confirms the result of miRNA expression profile. aP < 0.05 vs control; C: qRT-PCR and Western blot analyses of α-SMA and Col1 upon pressure overload. aP < 0.05 vs control; D: qRT-PCR and Western blot analyses of Sirt1 upon pressure overload (n = 3). bP < 0.01 vs control; E: Results of HE staining: (1) normal liver; (2) fibrotic liver. Immunohistochemistry experiments were used to identify Sirt1 expression in liver tissue; (3) normal liver; and (4) fibrotic liver; F: RNA was harvested from normal (n =10) and fibrotic (n =10) liver tissue. qRT-PCR was used to detect the expression of miR-9a-5p and Sirt1. aP < 0.05, bP < 0.01 vs control. qRT-PCR: Real-time quantitative polymerase chain reaction.
Table 2 MiRNAs differentially expressed in response to pressure overload
miRNA Log2FC Fold change FDR
Upregulated microRNAs rno-miR-206-3p 3.347 10.176 2.22E-05 rno-miR-210-3p 1.903 3.740 9.61E-05 rno-miR-494-5p 1.691 3.229 0.001401 rno-miR-345-3p 3.127 8.736 0.001984 rno-miR-592 2.990 7.945 0.002623 rno-miR-124-3p 1.656 3.151 0.002647 rno-miR-429 1.862 3.635 0.003247 rno-miR-34c-5p 2.612 6.113 0.007838 rno-miR-34b-5p 2.482 5.587 0.008211 rno-miR-34a-3p 2.434 5.404 0.008598 rno-miR-450a-3p 2.309 4.955 0.008823 rno-miR-199a-5p 2.091 4.260 0.009277 rno-miR-222-3p 2.608 6.097 0.009440 rno-miR-450a-5p 2.373 5.180 0.009558 rno-miR-34a-5p 2.319 4.990 0.009845 rno-miR-494-3p 1.671 3.184 0.019836 rno-miR-377-5p 1.877 3.673 0.037294 rno-miR-9a-5p 2.124 4.359 1.23E-05Downregulated miRNAs rno-miR-26a-3p -3.412 0.094 1.54E-04 rno-miR-222-5p -2.740 0.150 0.007077 rno-miR-335 -2.428 0.186 0.009698 rno-miR-194-3p -2.785 0.145 0.021509 rno-miR-103-1-5p -2.555 0.170 0.028431 rno-miR-664-1-5p -1.972 0.255 0.041855 rno-miR-188-3p -2.472 0.180 0.043457
Control Fibrotic
4
3
2
1
0
Rela
tive
Sirt
1 m
RN
A ex
pres
sion
b
G
Qi F et al . MiR-9a-5p and HSCs under pressure
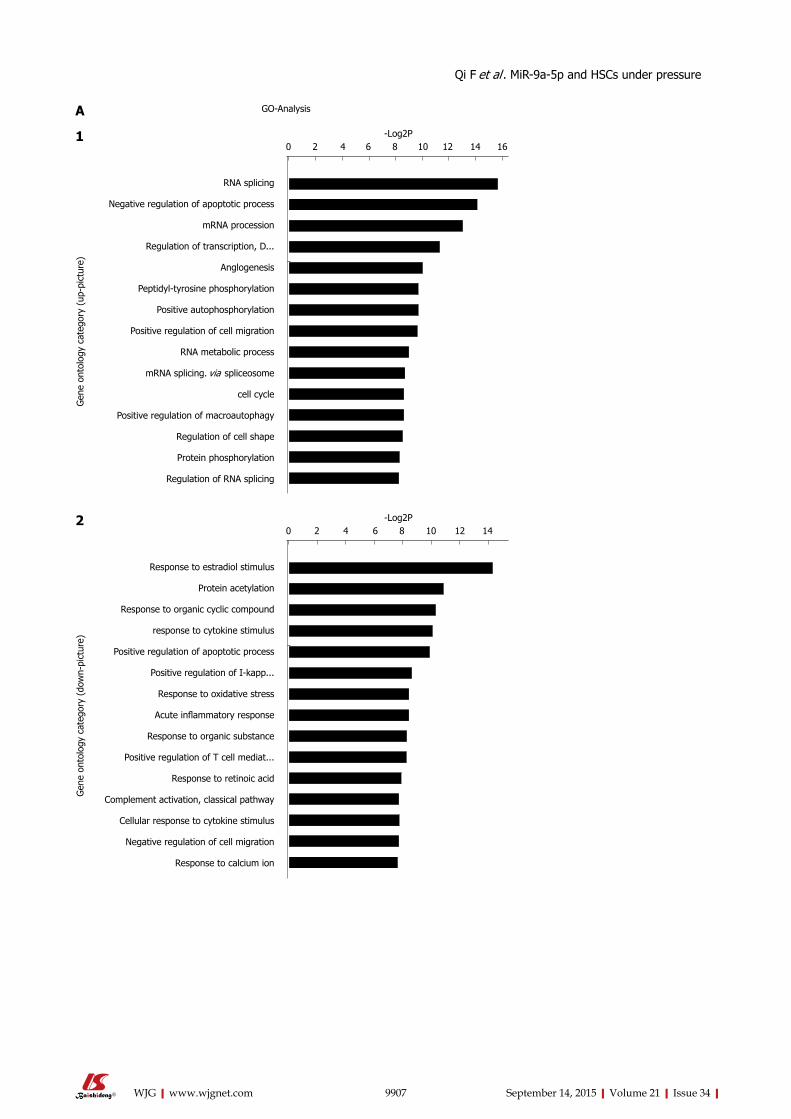
9907 September 14, 2015|Volume 21|Issue 34|WJG|www.wjgnet.com
GO-AnalysisA
RNA splicing
Negative regulation of apoptotic process
mRNA procession
Regulation of transcription, D...
Anglogenesis
Peptidyl-tyrosine phosphorylation
Positive autophosphorylation
Positive regulation of cell migration
RNA metabolic process
mRNA splicing. via spliceosome
cell cycle
Positive regulation of macroautophagy
Regulation of cell shape
Protein phosphorylation
Regulation of RNA splicing
0 2 4 6 8 10 12 14 16-Log2P
Gen
e on
tolo
gy c
ateg
ory
(up-
pict
ure)
1
Response to estradiol stimulus
Protein acetylation
Response to organic cyclic compound
response to cytokine stimulus
Positive regulation of apoptotic process
Positive regulation of I-kapp...
Response to oxidative stress
Acute inflammatory response
Response to organic substance
Positive regulation of T cell mediat...
Response to retinoic acid
Complement activation, classical pathway
Cellular response to cytokine stimulus
Negative regulation of cell migration
Response to calcium ion
0 2 4 6 8 10 12 14-Log2P
Gen
e on
tolo
gy c
ateg
ory
(dow
n-pi
ctur
e)
2
Qi F et al . MiR-9a-5p and HSCs under pressure
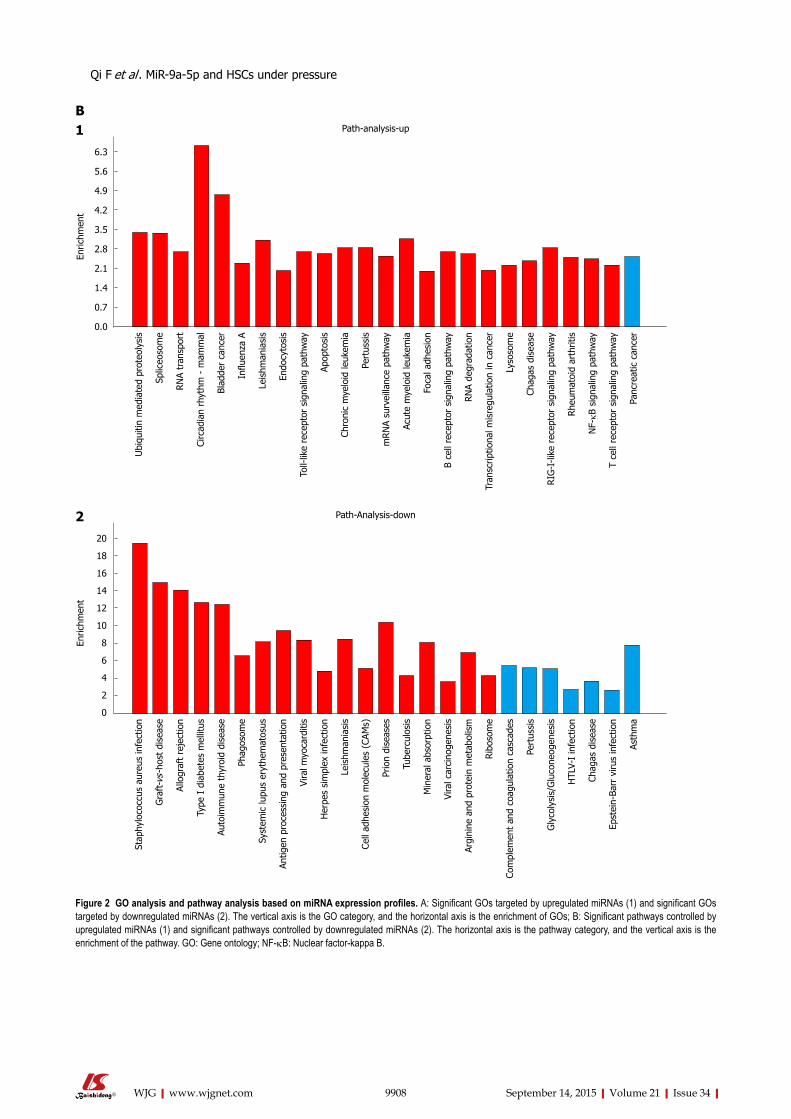
9908 September 14, 2015|Volume 21|Issue 34|WJG|www.wjgnet.com
B
6.3
5.6
4.9
4.2
3.5
2.8
2.1
1.4
0.7
0.0
Ubi
quiti
n m
edia
ted
prot
eoly
sis
Splic
eoso
me
RN
A tr
ansp
ort
Circ
adia
n rh
ythm
- m
amm
al
Blad
der
canc
er
Influ
enza
A
Leis
hman
iasi
s
Endo
cyto
sis
Toll-
like
rece
ptor
sig
nalin
g pa
thw
ay
Apop
tosi
s
Chro
nic
mye
loid
leuk
emia
Pert
ussi
s
mRN
A su
rvei
llanc
e pa
thw
ay
Acut
e m
yelo
id le
ukem
ia
Foca
l adh
esio
n
B ce
ll re
cept
or s
igna
ling
path
way
RN
A de
grad
atio
n
Tran
scrip
tiona
l mis
regu
latio
n in
can
cer
Lyso
som
e
Chag
as d
isea
se
RIG
-I-li
ke r
ecep
tor
sign
alin
g pa
thw
ay
Rhe
umat
oid
arth
ritis
NF-kB
sig
nalin
g pa
thw
ay
T ce
ll re
cept
or s
igna
ling
path
way
Panc
reat
ic c
ance
r
Path-analysis-up
Enric
hmen
t
1
20
18
16
14
12
10
8
6
4
2
0
Stap
hylo
cocc
us a
ureu
s in
fect
ion
Gra
ft-v
s-ho
st d
isea
se
Allo
graf
t re
ject
ion
Type
I d
iabe
tes
mel
litus
Auto
imm
une
thyr
oid
dise
ase
Phag
osom
e
Syst
emic
lupu
s er
ythe
mat
osus
Antig
en p
roce
ssin
g an
d pr
esen
tatio
n
Vira
l myo
card
itis
Her
pes
sim
plex
infe
ctio
n
Leis
hman
iasi
s
Cell
adhe
sion
mol
ecul
es (
CAM
s)
Prio
n di
seas
es
Tube
rcul
osis
Min
eral
abs
orpt
ion
Vira
l car
cino
gene
sis
Argi
nine
and
pro
tein
met
abol
ism
Rib
osom
e
Com
plem
ent
and
coag
ulat
ion
casc
ades
Pert
ussi
s
Gly
coly
sis/
Glu
cone
ogen
esis
HTL
V-I
infe
ctio
n
Chag
as d
isea
se
Epst
ein-
Barr
viru
s in
fect
ion
Asth
ma
Path-Analysis-down
Enric
hmen
t
2
Figure 2 GO analysis and pathway analysis based on miRNA expression profiles. A: Significant GOs targeted by upregulated miRNAs (1) and significant GOs targeted by downregulated miRNAs (2). The vertical axis is the GO category, and the horizontal axis is the enrichment of GOs; B: Significant pathways controlled by upregulated miRNAs (1) and significant pathways controlled by downregulated miRNAs (2). The horizontal axis is the pathway category, and the vertical axis is the enrichment of the pathway. GO: Gene ontology; NF-kB: Nuclear factor-kappa B.
Qi F et al . MiR-9a-5p and HSCs under pressure
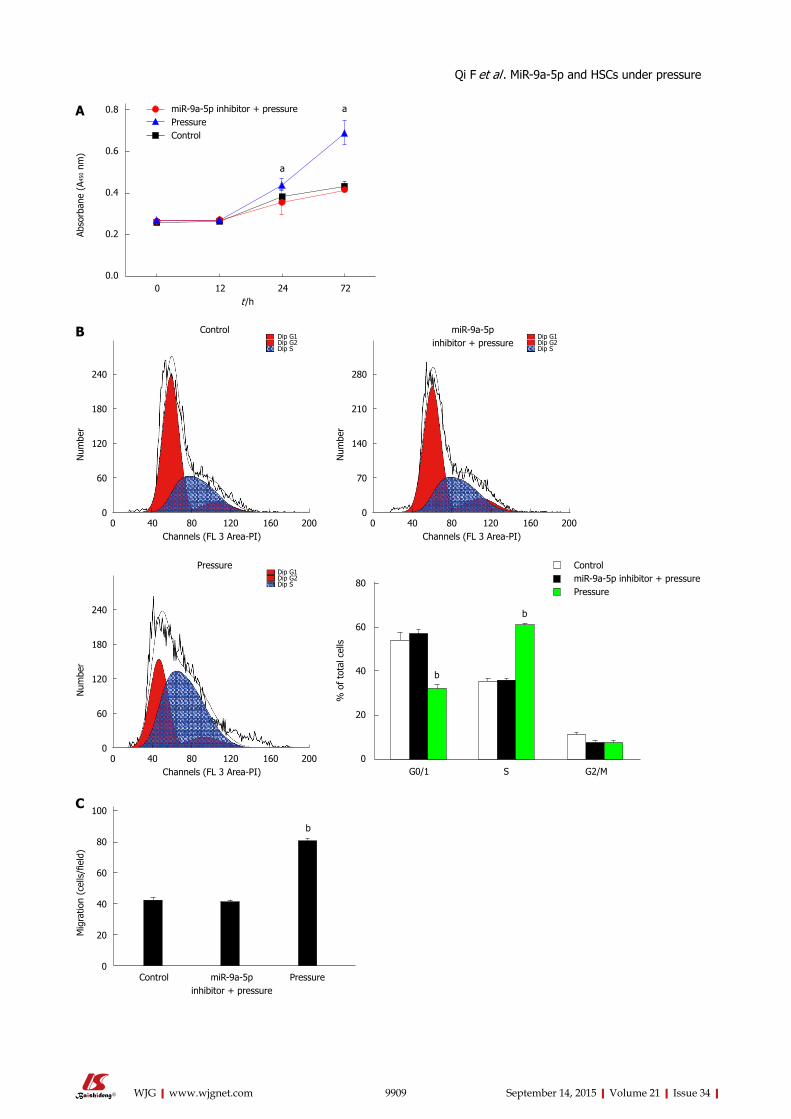
9909 September 14, 2015|Volume 21|Issue 34|WJG|www.wjgnet.com
miR-9a-5p inhibitor + pressurePressureControl
0.8
0.6
0.4
0.2
0.0
Abso
rban
e (A
450
nm)
a
a
0 12 24 72 t /h
A
0 40 80 120 160 200 Channels (FL 3 Area-PI)
240
180
120
60
0
Num
ber
Dip G1Dip G2Dip S
Control
0 40 80 120 160 200 Channels (FL 3 Area-PI)
280
210
140
70
0
Num
ber
Dip G1Dip G2Dip S
miR-9a-5p inhibitor + pressure
0 40 80 120 160 200 Channels (FL 3 Area-PI)
240
180
120
60
0
Num
ber
Dip G1Dip G2Dip S
Pressure
B
b
b
G0/1 S G2/M
80
60
40
20
0
% o
f to
tal c
ells
ControlmiR-9a-5p inhibitor + pressurePressure
b
100
80
60
40
20
0
Mig
ratio
n (c
ells
/fiel
d)
miR-9a-5p inhibitor + pressure
Control Pressure
C
Qi F et al . MiR-9a-5p and HSCs under pressure
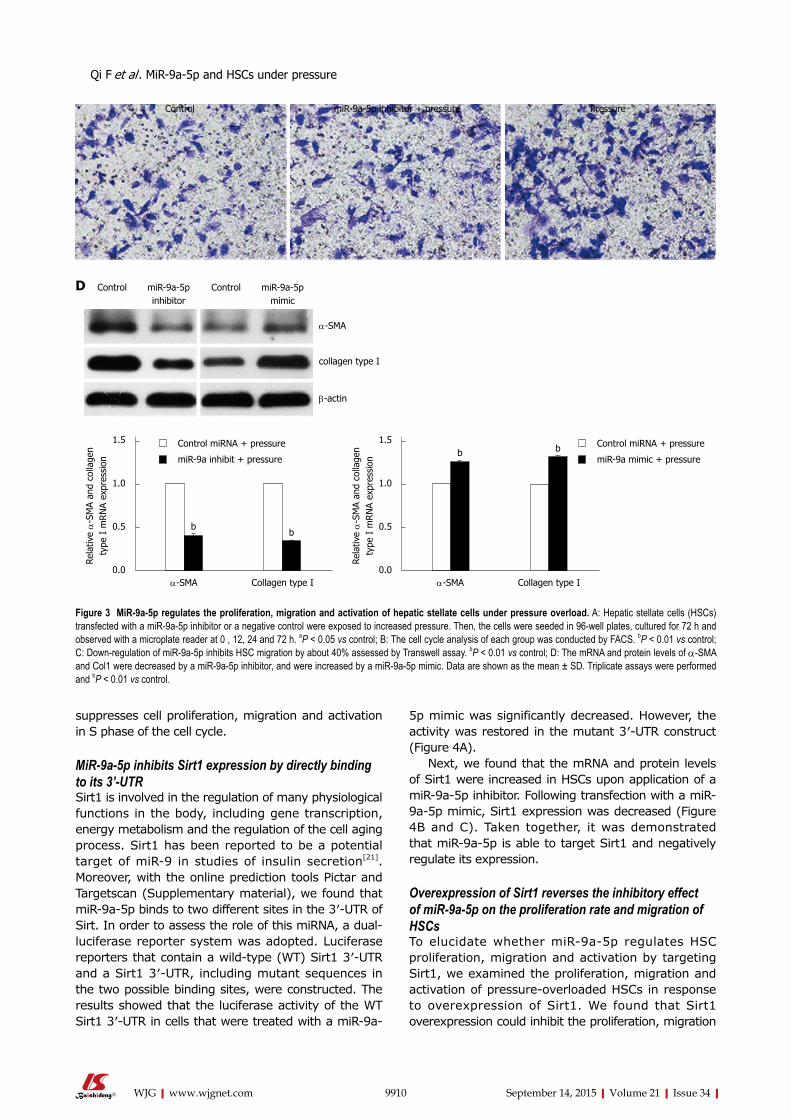
suppresses cell proliferation, migration and activation in S phase of the cell cycle.
MiR-9a-5p inhibits Sirt1 expression by directly binding to its 3’-UTRSirt1 is involved in the regulation of many physiological functions in the body, including gene transcription, energy metabolism and the regulation of the cell aging process. Sirt1 has been reported to be a potential target of miR-9 in studies of insulin secretion[21]. Moreover, with the online prediction tools Pictar and Targetscan (Supplementary material), we found that miR-9a-5p binds to two different sites in the 3′-UTR of Sirt. In order to assess the role of this miRNA, a dual-luciferase reporter system was adopted. Luciferase reporters that contain a wild-type (WT) Sirt1 3′-UTR and a Sirt1 3′-UTR, including mutant sequences in the two possible binding sites, were constructed. The results showed that the luciferase activity of the WT Sirt1 3′-UTR in cells that were treated with a miR-9a-
5p mimic was significantly decreased. However, the activity was restored in the mutant 3′-UTR construct (Figure 4A).
Next, we found that the mRNA and protein levels of Sirt1 were increased in HSCs upon application of a miR-9a-5p inhibitor. Following transfection with a miR-9a-5p mimic, Sirt1 expression was decreased (Figure 4B and C). Taken together, it was demonstrated that miR-9a-5p is able to target Sirt1 and negatively regulate its expression.
Overexpression of Sirt1 reverses the inhibitory effect of miR-9a-5p on the proliferation rate and migration of HSCsTo elucidate whether miR-9a-5p regulates HSC proliferation, migration and activation by targeting Sirt1, we examined the proliferation, migration and activation of pressure-overloaded HSCs in response to overexpression of Sirt1. We found that Sirt1 overexpression could inhibit the proliferation, migration
9910 September 14, 2015|Volume 21|Issue 34|WJG|www.wjgnet.com
Control miR-9a-5p inhibitor
Control miR-9a-5p mimic
α-SMA
collagen type I
β-actin
D
Rela
tive α
-SM
A an
d co
llage
n ty
pe I
mRN
A ex
pres
sion
α-SMA Collagen type I
1.5
1.0
0.5
0.0
bb
Control miRNA + pressure
miR-9a inhibit + pressure
Rela
tive α
-SM
A an
d co
llage
n ty
pe I
mRN
A ex
pres
sion
α-SMA Collagen type I
1.5
1.0
0.5
0.0
b b Control miRNA + pressure
miR-9a mimic + pressure
Figure 3 MiR-9a-5p regulates the proliferation, migration and activation of hepatic stellate cells under pressure overload. A: Hepatic stellate cells (HSCs) transfected with a miR-9a-5p inhibitor or a negative control were exposed to increased pressure. Then, the cells were seeded in 96-well plates, cultured for 72 h and observed with a microplate reader at 0 , 12, 24 and 72 h. aP < 0.05 vs control; B: The cell cycle analysis of each group was conducted by FACS. bP < 0.01 vs control; C: Down-regulation of miR-9a-5p inhibits HSC migration by about 40% assessed by Transwell assay. bP < 0.01 vs control; D: The mRNA and protein levels of α-SMA and Col1 were decreased by a miR-9a-5p inhibitor, and were increased by a miR-9a-5p mimic. Data are shown as the mean ± SD. Triplicate assays were performed and bP < 0.01 vs control.
Qi F et al . MiR-9a-5p and HSCs under pressure
Control miR-9a-5p inhibitor + pressure Pressure
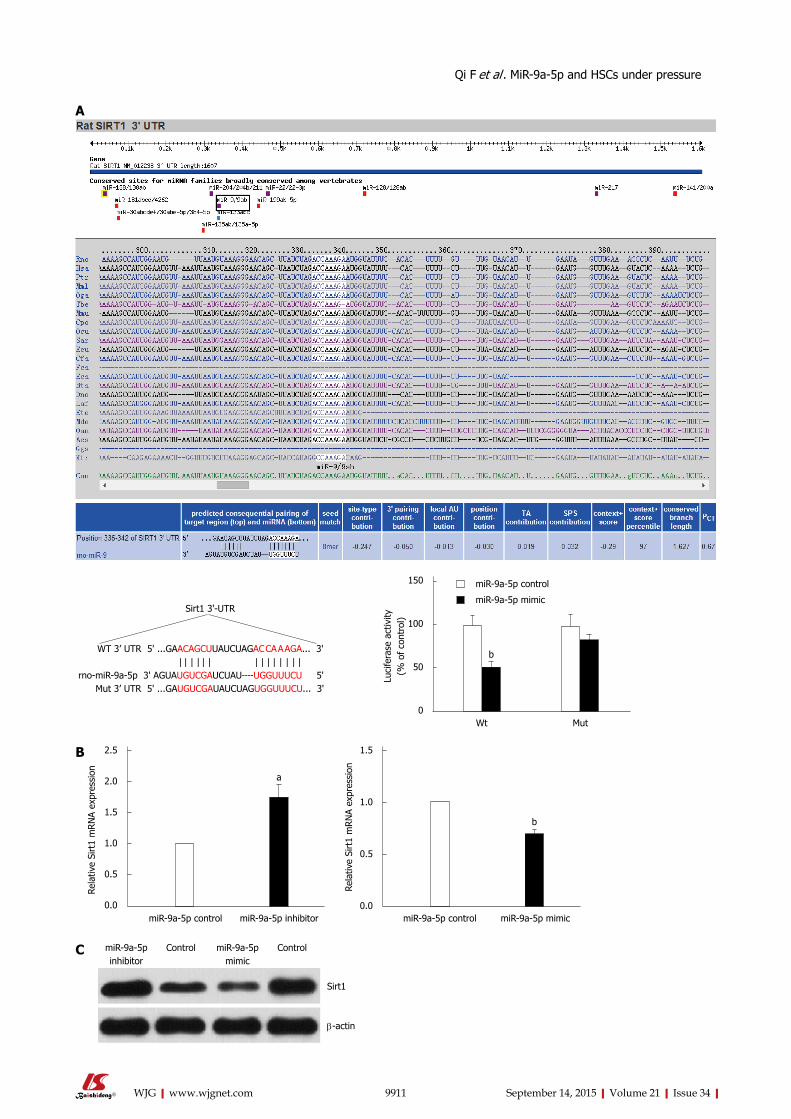
9911 September 14, 2015|Volume 21|Issue 34|WJG|www.wjgnet.com
Sirt1 3'-UTR
WT 3’ UTR 5' ...GAACAGCUUAUCUAGAC CA A AGA... 3' | | | | | | | | | | | | | | rno-miR-9a-5p 3' AGUAUGUCGAUCUAU----UGGUUUCU 5' Mut 3’ UTR 5' ...GAUGUCGAUAUCUAGUGGUUUCU... 3'
Luci
fera
se a
ctiv
ity
(% o
f co
ntro
l)
Wt Mut
150
100
50
0
b
miR-9a-5p control
miR-9a-5p mimic
A
Rela
tive
Sirt
1 m
RN
A ex
pres
sion
miR-9a-5p inhibitor
2.5
2.0
1.5
1.0
0.5
0.0
a
miR-9a-5p control miR-9a-5p mimic
1.5
1.0
0.5
0.0
b
miR-9a-5p control
B
Rela
tive
Sirt
1 m
RN
A ex
pres
sion
miR-9a-5p inhibitor
Control miR-9a-5p mimic
Control
Sirt1
β-actin
C
Qi F et al . MiR-9a-5p and HSCs under pressure
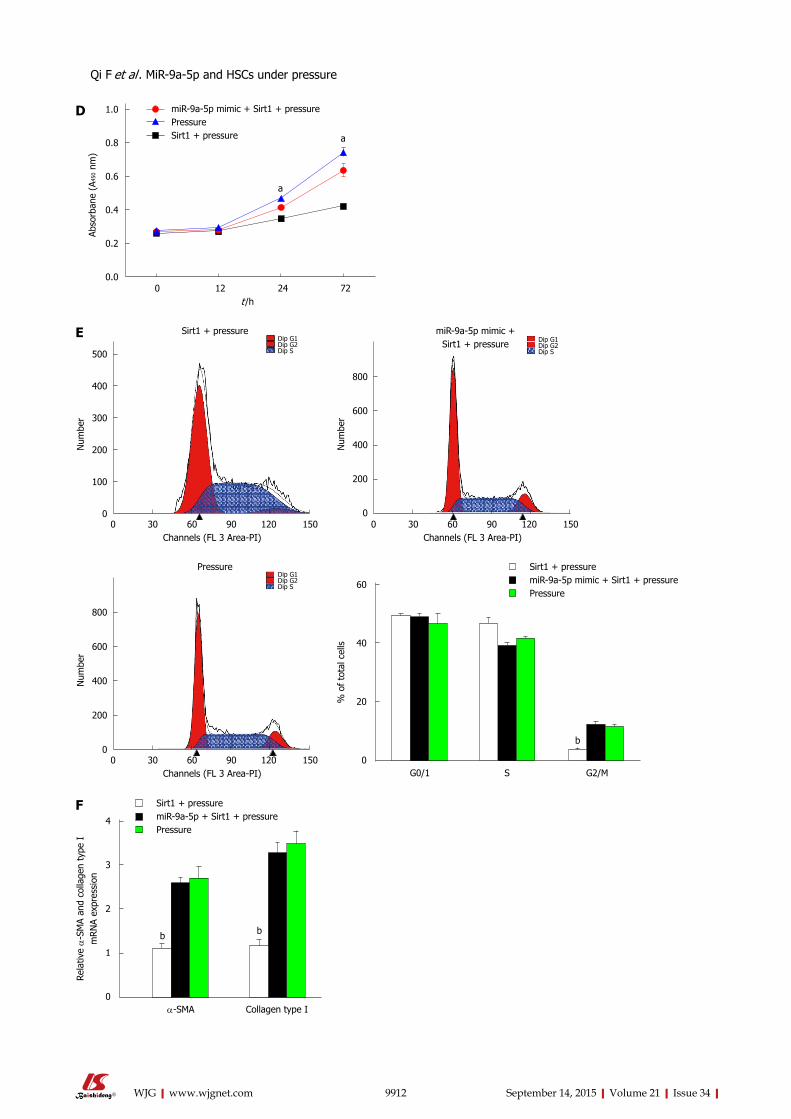
9912 September 14, 2015|Volume 21|Issue 34|WJG|www.wjgnet.com
miR-9a-5p mimic + Sirt1 + pressurePressureSirt1 + pressure
1.0
0.8
0.6
0.4
0.2
0.0
Abso
rban
e (A
450
nm)
a
a
0 12 24 72 t /h
D
0 30 60 90 120 150 Channels (FL 3 Area-PI)
500
400
300
200
100
0
Num
ber
Dip G1Dip G2Dip S
Sirt1 + pressure
0 30 60 90 120 150 Channels (FL 3 Area-PI)
800
600
400
200
0
Num
ber
Dip G1Dip G2Dip S
miR-9a-5p mimic + Sirt1 + pressure
0 30 60 90 120 150 Channels (FL 3 Area-PI)
800
600
400
200
0
Num
ber
Dip G1Dip G2Dip S
Pressure
b
G0/1 S G2/M
60
40
20
0
% o
f to
tal c
ells
Sirt1 + pressuremiR-9a-5p mimic + Sirt1 + pressurePressure
E
Qi F et al . MiR-9a-5p and HSCs under pressure
α-SMA Collagen type I
4
3
2
1
0
Rela
tive α
-SM
A an
d co
llage
n ty
pe I
m
RN
A ex
pres
sion
Sirt1 + pressuremiR-9a-5p + Sirt1 + pressurePressure
b
F
b
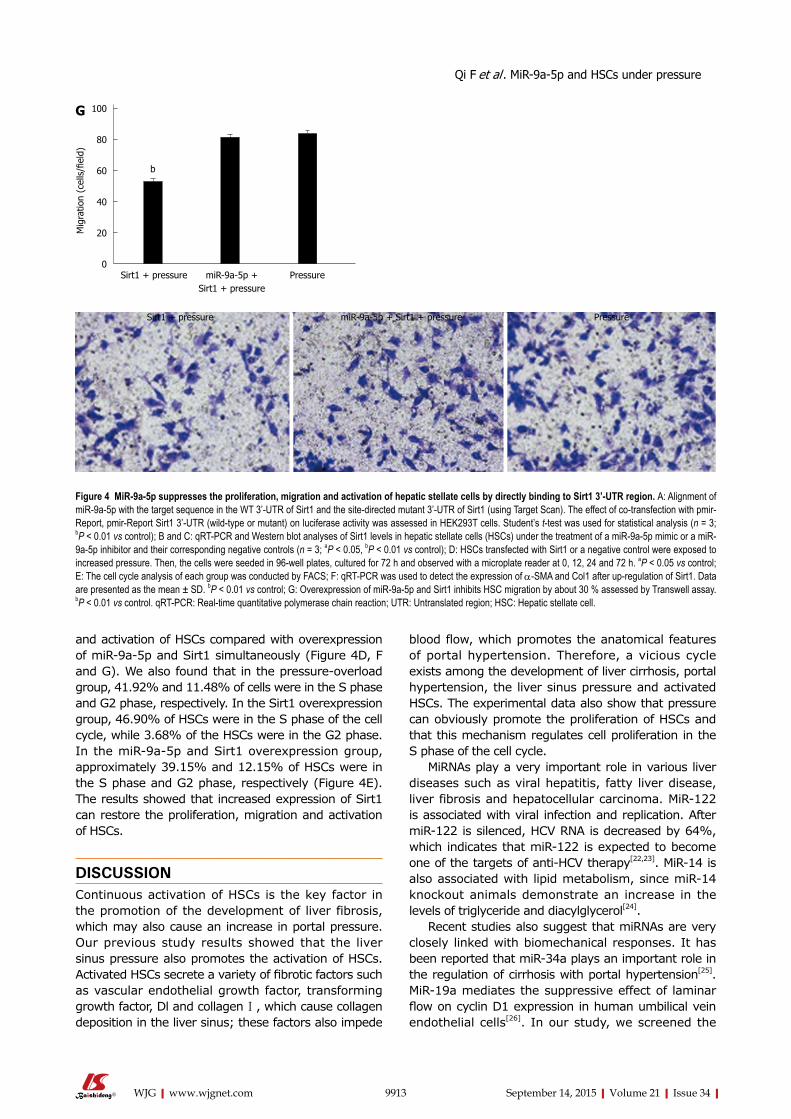
and activation of HSCs compared with overexpression of miR-9a-5p and Sirt1 simultaneously (Figure 4D, F and G). We also found that in the pressure-overload group, 41.92% and 11.48% of cells were in the S phase and G2 phase, respectively. In the Sirt1 overexpression group, 46.90% of HSCs were in the S phase of the cell cycle, while 3.68% of the HSCs were in the G2 phase. In the miR-9a-5p and Sirt1 overexpression group, approximately 39.15% and 12.15% of HSCs were in the S phase and G2 phase, respectively (Figure 4E). The results showed that increased expression of Sirt1 can restore the proliferation, migration and activation of HSCs.
DISCUSSIONContinuous activation of HSCs is the key factor in the promotion of the development of liver fibrosis, which may also cause an increase in portal pressure. Our previous study results showed that the liver sinus pressure also promotes the activation of HSCs. Activated HSCs secrete a variety of fibrotic factors such as vascular endothelial growth factor, transforming growth factor, Dl and collagen Ⅰ, which cause collagen deposition in the liver sinus; these factors also impede
blood flow, which promotes the anatomical features of portal hypertension. Therefore, a vicious cycle exists among the development of liver cirrhosis, portal hypertension, the liver sinus pressure and activated HSCs. The experimental data also show that pressure can obviously promote the proliferation of HSCs and that this mechanism regulates cell proliferation in the S phase of the cell cycle.
MiRNAs play a very important role in various liver diseases such as viral hepatitis, fatty liver disease, liver fibrosis and hepatocellular carcinoma. MiR-122 is associated with viral infection and replication. After miR-122 is silenced, HCV RNA is decreased by 64%, which indicates that miR-122 is expected to become one of the targets of anti-HCV therapy[22,23]. MiR-14 is also associated with lipid metabolism, since miR-14 knockout animals demonstrate an increase in the levels of triglyceride and diacylglycerol[24].
Recent studies also suggest that miRNAs are very closely linked with biomechanical responses. It has been reported that miR-34a plays an important role in the regulation of cirrhosis with portal hypertension[25]. MiR-19a mediates the suppressive effect of laminar flow on cyclin D1 expression in human umbilical vein endothelial cells[26]. In our study, we screened the
9913 September 14, 2015|Volume 21|Issue 34|WJG|www.wjgnet.com
b
100
80
60
40
20
0
Mig
ratio
n (c
ells
/fiel
d)
miR-9a-5p + Sirt1 + pressure
Sirt1 + pressure Pressure
G
Figure 4 MiR-9a-5p suppresses the proliferation, migration and activation of hepatic stellate cells by directly binding to Sirt1 3’-UTR region. A: Alignment of miR-9a-5p with the target sequence in the WT 3’-UTR of Sirt1 and the site-directed mutant 3’-UTR of Sirt1 (using Target Scan). The effect of co-transfection with pmir-Report, pmir-Report Sirt1 3’-UTR (wild-type or mutant) on luciferase activity was assessed in HEK293T cells. Student’s t-test was used for statistical analysis (n = 3; bP < 0.01 vs control); B and C: qRT-PCR and Western blot analyses of Sirt1 levels in hepatic stellate cells (HSCs) under the treatment of a miR-9a-5p mimic or a miR-9a-5p inhibitor and their corresponding negative controls (n = 3; aP < 0.05, bP < 0.01 vs control); D: HSCs transfected with Sirt1 or a negative control were exposed to increased pressure. Then, the cells were seeded in 96-well plates, cultured for 72 h and observed with a microplate reader at 0, 12, 24 and 72 h. aP < 0.05 vs control; E: The cell cycle analysis of each group was conducted by FACS; F: qRT-PCR was used to detect the expression of α-SMA and Col1 after up-regulation of Sirt1. Data are presented as the mean ± SD. bP < 0.01 vs control; G: Overexpression of miR-9a-5p and Sirt1 inhibits HSC migration by about 30 % assessed by Transwell assay. bP < 0.01 vs control. qRT-PCR: Real-time quantitative polymerase chain reaction; UTR: Untranslated region; HSC: Hepatic stellate cell.
Qi F et al . MiR-9a-5p and HSCs under pressure
Sirt1 + pressure miR-9a-5p + Sirt1 + pressure Pressure
pressurization-induced miRNA expression profile in HSCs by next-generation sequencing. The expression of miR-9a-5p is obviously differentially expressed. qRT-PCR results showed that miR-9a-5p also signifi-cantly increased under increased pressure, which is consistent with its expression in quiescent HSCs vs activated HSCs[27]. In this study, we found that miR-9a-5p directly reduced the expression of Sirt1. Recent research also suggests that Sirt1 is a target gene of miR-9a-5p in the beta cells of pancreatic islets[21]. In addition, some studies have shown that Sirt1 participates in hepatic steatosis[28,29]. We also found that a miR-9a-5p inhibitor could inhibit HSC proliferation and migration. Compared with the control group, HSC proliferative and migration activity was significantly inhibited in the miR-9a-5p inhibitor group, and miR-9a-5p regulates HSC proliferation and migration by targeting Sirt1. Interestingly, when miR-9a-5p was upregulated, the expression of Sirt1 was significantly decreased in rats with liver fibrosis compared with controls.
Overall, these systematic studies indicate that miR-9a-5p is a novel regulator of HSCs in the setting of increased pressure and hepatic fibrosis in rats, and that overexpression of miR-9a-5p following HSC activation perpetuates the fibrotic response. MiR-9a-5p could negatively regulate Sirt1 expression and plays an important role in the regulation of HSC proliferation and migration, which provides a potential therapeutic target for portal hypertension.
ACKNOWLEDGMENTSWe thank Liebing Company for miRNA next-generation sequencing.
COMMENTSBackgroundPortal hypertension is the consequence of an increase in both intrahepatic vascular resistance and portal blood flow. Clinical manifestations include esophageal gastric varices, ascites, splenomegaly and with gastrointestinal bleeding, hepatic encephalopathy and hepatorenal syndrome. In this study, the authors used hepatic stellate cells (HSCs) pressure-loading apparatus to screen the pressurization induced miRNA expression profile in HSCs by next-generation sequencing (Choose 14 d fully activated HSCs). In addition, miR-9a-5p was verified to be importantly upregulated during HSC pressure-loading by real-time quantitative polymerase chain reaction.
Research frontiersHSC activation is the key factor of promoting the development of cirrhotic portal hypertension. Portal hypertension with liver sinus pressure also promoted the sustained activation of HSCs. Therefore, there is a vicious cycle between sustained activation of HSCs and cirrhotic portal hypertension. MicroRNAs (miRNAs) play an important role in regulating the proliferation, migration and activation of HSCs.
Innovations and breakthroughsThe pressure-induced miRNA expression profile was detected by next-generation sequencing. MiR-9a-5p, which targets Sirt1, regulated proliferation, migration and activation of hepatic stellate cells. In vivo, the expression level
of miR-9a-5p was up-regulated and the expression level of Sirt1 was down-regulated.
ApplicationsThe study results suggest that high expression of miR-9a-5p directly and indirectly results in activation of HSCs due to pressure. miR-9a-5p is involved in cirrhotic portal hypertension, and may be regarded as a potential molecular and a therapeutic target in this disorder.
TerminologyPortal hypertension is a syndrome as the main characteristics of the portal system hemodynamics change. MiR-9a-5p is a recently found miRNA. MiRNAs are small noncoding RNAs that regulate gene expression by binding to the 3′ untranslated region of mRNAs to cause their degradation or translational repression. Hepatic stellate cell is a kind of liver cell, accounting for about 15% of the whole liver cells, located in the clearance between hepatic sinus endothelial cells and liver plate.
Peer-reviewIn this manuscript authors analyzed miRNA profiling in HSCs. They obtained evidence that miR-9a-5p was upregulated during HSC pressure overload, and Sirt1 is one of its functional targets. Their observation is interesting that miR-9a-5p, as well as Sirt1, might influence the activation, proliferation and migration of HSCs.
REFERENCES1 de Franchis R, Dell’Era A, Iannuzzi F. Diagnosis and treatment
of portal hypertension. Dig Liver Dis 2004; 36: 787798 [PMID: 15646423 DOI: 10.1016/j.dld.2004.08.001]
2 Török NJ. Recent advances in the pathogenesis and diagnosis of liver fibrosis. J Gastroenterol 2008; 43: 315321 [PMID: 18592147 DOI: 10.1007/s005350082181x]
3 Soon RK, Yee HF. Stellate cell contraction: role, regulation, and potential therapeutic target. Clin Liver Dis 2008; 12: 791803, viii [PMID: 18984467 DOI: 10.1016/j.cld.2008.07.004]
4 Reynaert H, Thompson MG, Thomas T, Geerts A. Hepatic stellate cells: role in microcirculation and pathophysiology of portal hypertension. Gut 2002; 50: 571581 [PMID: 11889082]
5 van Leeuwen DJ, Howe SC, Scheuer PJ, Sherlock S. Portal hypertension in chronic hepatitis: relationship to morphological changes. Gut 1990; 31: 339343 [PMID: 2323602]
6 Blendis LM. Hepatocyte swelling and portal hypertension. J Hepatol 1992; 15: 45 [PMID: 1506655]
7 Abraldes JG, Iwakiri Y, LoureiroSilva M, Haq O, Sessa WC, Groszmann RJ. Mild increases in portal pressure upregulate vascular endothelial growth factor and endothelial nitric oxide synthase in the intestinal microcirculatory bed, leading to a hyperdynamic state. Am J Physiol Gastrointest Liver Physiol 2006; 290: G980G987 [PMID: 16603731 DOI: 10.1152/ajpgi.00336.2005]
8 Valencia-Sanchez MA, Liu J, Hannon GJ, Parker R. Control of translation and mRNA degradation by miRNAs and siRNAs. Genes Dev 2006; 20: 515524 [PMID: 16510870 DOI: 10.1101/gad.1399806]
9 Chitwood DH, Timmermans MC. Target mimics modulate miRNAs. Nat Genet 2007; 39: 935936 [PMID: 17660806 DOI: 10.1038/ng0807935]
10 Lakner AM, Bonkovsky HL, Schrum LW. microRNAs: fad or future of liver disease. World J Gastroenterol 2011; 17: 25362542 [PMID: 21633658 DOI: 10.3748/wjg.v17.i20.2536]
11 Guo CJ, Pan Q, Li DG, Sun H, Liu BW. miR15b and miR16 are implicated in activation of the rat hepatic stellate cell: An essential role for apoptosis. J Hepatol 2009; 50: 766778 [PMID: 19232449 DOI: 10.1016/j.jhep.2008.11.025]
12 Chen C, Wu CQ, Zhang ZQ, Yao DK, Zhu L. Loss of expression of miR335 is implicated in hepatic stellate cell migration and activation. Exp Cell Res 2011; 317: 17141725 [PMID: 21586285 DOI: 10.1016/j.yexcr.2011.05.001]
9914 September 14, 2015|Volume 21|Issue 34|WJG|www.wjgnet.com
COMMENTS
Qi F et al . MiR-9a-5p and HSCs under pressure
13 Lakner AM, Steuerwald NM, Walling TL, Ghosh S, Li T, McKillop IH, Russo MW, Bonkovsky HL, Schrum LW. Inhibitory effects of microRNA 19b in hepatic stellate cellmediated fibrogenesis. Hepatology 2012; 56: 300310 [PMID: 22278637 DOI: 10.1002/hep.25613]
14 Watanabe S, Nagashio Y, Asaumi H, Nomiyama Y, Taguchi M, Tashiro M, Kihara Y, Nakamura H, Otsuki M. Pressure activates rat pancreatic stellate cells. Am J Physiol Gastrointest Liver Physiol 2004; 287: G1175G1181 [PMID: 15319186 DOI: 10.1152/ajpgi.00339.2004]
15 Friedman SL, Roll FJ. Isolation and culture of hepatic lipocytes, Kupffer cells, and sinusoidal endothelial cells by density gradient centrifugation with Stractan. Anal Biochem 1987; 161: 207218 [PMID: 3578783 DOI: 10.1016/00032697(87)906737]
16 Okada Y, Tsuzuki Y, Hokari R, Miyazaki J, Matsuzaki K, Mataki N, Komoto S, Watanabe C, Kawaguchi A, Nagao S, Itoh K, Miura S. Pressure loading and ethanol exposure differentially modulate rat hepatic stellate cell activation. J Cell Physiol 2008; 215: 472480 [PMID: 18064666 DOI: 10.1002/jcp.21329]
17 Wang W, Meng M, Zhang Y, Wei C, Xie Y, Jiang L, Wang C, Yang F, Tang W, Jin X, Chen D, Zong J, Hou Z, Li R. Global transcriptomewide analysis of CIK cells identify distinct roles of IL2 and IL15 in acquisition of cytotoxic capacity against tumor. BMC Med Genomics 2014; 7: 49 [PMID: 25108500 DOI: 10.1186/17558794749]
18 Anders S, Huber W. Differential expression analysis for sequence count data. Genome Biol 2010; 11: R106 [PMID: 20979621 DOI: 10.1186/gb20101110r106]
19 George J, Rao KR, Stern R, Chandrakasan G. Dimethylnitrosamineinduced liver injury in rats: the early deposition of collagen. Toxicology 2001; 156: 129138 [PMID: 11164615 DOI: 10.1016/S0300483X(00)003528]
20 Starkel P, Leclercq IA. Animal models for the study of hepatic fibrosis. Best Pract Res Clin Gastroenterol 2011; 25: 319333 [PMID: 21497748 DOI: 10.1016/j.bpg.2011.02.004]
21 Ramachandran D, Roy U, Garg S, Ghosh S, Pathak S, KolthurSeetharam U. Sirt1 and mir9 expression is regulated during glucosestimulated insulin secretion in pancreatic β-islets. FEBS J 2011; 278: 11671174 [PMID: 21288303 DOI: 10.1111/j.17424658.2011.08042.
x]22 Jopling CL, Yi M, Lancaster AM, Lemon SM, Sarnow P.
Modulation of hepatitis C virus RNA abundance by a liver-specific MicroRNA. Science 2005; 309: 15771581 [PMID: 16141076 DOI: 10.1126/science.1113329]
23 Shan Y, Zheng J, Lambrecht RW, Bonkovsky HL. Reciprocal effects of microRNA122 on expression of heme oxygenase1 and hepatitis C virus genes in human hepatocytes. Gastroenterology 2007; 133: 11661174 [PMID: 17919492 DOI: 10.1053/j.gastro.2007.08.002]
24 Xu P, Vernooy SY, Guo M, Hay BA. The Drosophila microRNA Mir14 suppresses cell death and is required for normal fat metabolism. Curr Biol 2003; 13: 790795 [PMID: 12725740 DOI: 10.1016/S09609822(03)002501]
25 Jansen C, Eischeid H, Goertzen J, Schierwagen R, Anadol E, Strassburg CP, Sauerbruch T, Odenthal M, Trebicka J. The role of miRNA34a as a prognostic biomarker for cirrhotic patients with portal hypertension receiving TIPS. PLoS One 2014; 9: e103779 [PMID: 25068403 DOI: 10.1371/journal.pone.0103779]
26 Qin X, Wang X, Wang Y, Tang Z, Cui Q, Xi J, Li YS, Chien S, Wang N. MicroRNA19a mediates the suppressive effect of laminar flow on cyclin D1 expression in human umbilical vein endothelial cells. Proc Natl Acad Sci USA 2010; 107: 32403244 [PMID: 20133739 DOI: 10.1073/pnas.0914882107]
27 Noetel A, Elfimova N, Altmüller J, Becker C, Becker D, Lahr W, Nürnberg P, Wasmuth H, Teufel A, Büttner R, Dienes HP, Odenthal M. Next generation sequencing of the Ago2 interacting transcriptome identified chemokine family members as novel targets of neuronal microRNAs in hepatic stellate cells. J Hepatol 2013; 58: 335341 [PMID: 23041308 DOI: 10.1016/j.jhep.2012.09.024]
28 Yang Y, Li W, Liu Y, Sun Y, Li Y, Yao Q, Li J, Zhang Q, Gao Y, Gao L, Zhao J. Alphalipoic acid improves highfat dietinduced hepatic steatosis by modulating the transcription factors SREBP1, FoxO1 and Nrf2 via the SIRT1/LKB1/AMPK pathway. J Nutr Biochem 2014; 25: 12071217 [PMID: 25123628 DOI: 10.1016/j.jnutbio.2014.06.001]
29 Han JY, Park SH, Yang JH, Kim MG, Cho SS, Yoon G, Cheon SH, Ki SH. Licochalcone Suppresses LXRαInduced Hepatic Lipogenic Gene Expression through AMPK/Sirt1 Pathway Activation. Toxicol Res 2014; 30: 1925 [PMID: 24795795]
P- Reviewer: Ma L, Seren O, Yang J S- Editor: Wang JL L- Editor: Wang TQ E- Editor: Ma S
9915 September 14, 2015|Volume 21|Issue 34|WJG|www.wjgnet.com
Qi F et al . MiR-9a-5p and HSCs under pressure
9916 September 14, 2015|Volume 21|Issue 34|WJG|www.wjgnet.com
ORIGINAL ARTICLE
Long-Jun He, Pin-Jin Hu, Sen-Lin Zhu, Department of Gastroenterology, the First Affiliated Hospital, Sun Yat-sen University, Guangzhou 510080, Guangdong Province, China
Long-Jun He, Dan Xie, Yi-Ji Liao, Hai-Xia Deng, Sun Yat-sen University Cancer Center; State Key Laboratory of Oncology in South China; Collaborative Innovation Center for Cancer Medicine, Guangzhou 510060, Guangdong Province, China
Hsiang-Fu Kung, Stanley Ho Center for Emerging Infectious Diseases and Li Ka Shing Institute of Health Sciences, Hong Kong, China
Hsiang-Fu Kung, State Key Laboratory of Oncology in South China, The Chinese university of Hong Kong, Hong Kong, China
Author contributions: Zhu SL designed the study and was the project leader; He LJ and Liao YJ performed the experiments; Hu PJ and Deng HX collected the data; Xie D and Kung HF served as scientific advisors.
Supported by Grants from the National Natural Science Foundation of China, No. 81072044; and the Guangdong Natural Science Foundation, No. S2011010004653.
Institutional review board statement: The study was reviewed and approved by the Medical Ethics Committee of the First Affiliated Hospital, Sun Yat-sen Univeristy.
Conflict-of-interest statement: Participants have received no fees or funds from outside organizations except this study’s own research funding. No participants own stocks or shares in study-related organizations.
Open-Access: This article is an open-access article which was selected by an in-house editor and fully peer-reviewed by external reviewers. It is distributed in accordance with the Creative Commons Attribution Non Commercial (CC BY-NC 4.0) license, which permits others to distribute, remix, adapt, build upon this work non-commercially, and license their derivative works on different terms, provided the original work is properly cited and the use is non-commercial. See: http://creativecommons.org/licenses/by-nc/4.0/
Correspondence to: Dr. Sen-Lin Zhu, Department of Gastroenterology, the First Affiliated Hospital, Sun Yat-sen University, No. 58 Zhongshan 2nd Road, Guangzhou 510080, Guangdong Province, China. [email protected]: +86-20-87332200
Received: February 23, 2015Peer-review started: February 26, 2015First decision: March 26, 2015Revised: April 13, 2015Accepted: July 15, 2015Article in press: July 15, 2015Published online: September 14, 2015
AbstractAIM: To investigate macrophage migration inhibitory factor (MIF) expression and its clinical relevance in gastric cancer, and effects of MIF knockdown on proliferation of gastric cancer cells.
METHODS: T issue microarray contain ing 117 samples of gastric cancer and adjacent non-cancer normal tissues was studied for MIF expression by immunohistochemistry (IHC) semiquantitatively, and the association of MIF expression with clinical parameters was analyzed. MIF expression in gastric cancer cell lines was detected by reverse transcription-polymerase chain reaction (RT-PCR) and Western blot. Two pairs of siRNA targeting the MIF gene (MIF si-1 and MIF si-2) and one pair of scrambled siRNA as a negative control (NC) were designed and chemically synthesized. All siRNAs were transiently transfected in AGS cells with OligofectamineTM to knock down the MIF expression, with the NC group and mock group (OligofectamineTM alone) as controls. At 24, 48, and 72 h after transfection, MIF mRNA was analyzed by RT-PCR, and MIF and proliferating cell nuclear antigen (PCNA) proteins were detected by Western blot.
Basic Study
Macrophage migration inhibitory factor as a potential prognostic factor in gastric cancer
Long-Jun He, Dan Xie, Pin-Jin Hu, Yi-Ji Liao, Hai-Xia Deng, Hsiang-Fu Kung, Sen-Lin Zhu
Submit a Manuscript: http://www.wjgnet.com/esps/Help Desk: http://www.wjgnet.com/esps/helpdesk.aspxDOI: 10.3748/wjg.v21.i34.9916
World J Gastroenterol 2015 September 14; 21(34): 9916-9926 ISSN 1007-9327 (print) ISSN 2219-2840 (online)
© 2015 Baishideng Publishing Group Inc. All rights reserved.
He LJ et al . MIF in gastric cancer
9917 September 14, 2015|Volume 21|Issue 34|WJG|www.wjgnet.com
The proliferative rate of AGS cells was assessed by methylthiazolyl tetrazolium (MTT) assay and colony forming assay.
RESULTS: The tissue microarray was informative for IHC staining, in which the MIF expression in gastric cancer tissues was higher than that in adjacent non-cancer normal tissues (P < 0.001), and high level of MIF was related to poor tumor differentiation, advanced T stage, advanced tumor stage, lymph node metastasis, and poor patient survival (P < 0.05 for all). After siRNA transfection, MIF mRNA was measured by real-time PCR, and MIF protein and PCNA were assessed by Western blot analysis. We found that compared to the NC group and mock group, MIF expression was knocked down successfully in gastric cancer cells, and PCNA expression was downregulated with MIF knockdown as well. The cell counts and the doubling times were assayed by MTT 4 d after transfection, and colonies formed were assayed by colony forming assay 10 d after transfection; all these showed significant changes in gastric cancer cells transfected with specific siRNA compared with the control siRNA and mock groups (P < 0.001 for all).
CONCLUSION: MIF could be of prognostic value in gastric cancer and might be a potential target for small-molecule therapy.
Key words: Macrophage migration inhibitory factor; Proliferation; RNA interference; Stomach neoplasm; Survival
© The Author(s) 2015. Published by Baishideng Publishing Group Inc. All rights reserved.
Core tip: Macrophage migration inhibitory factor (MIF) is a multifunctional cytokine, which plays a significant role in the tumor development. The objective of this study was to investigate the expression of MIF in gastric cancer and the inhibitory effect of its knockdown on gastric cancer cell proliferation. The results show that MIF is expressed highly in gastric cancer, and its expression was related to clinical stage. The proliferation of gastric cancer cells was inhibited by MIF knockdown, suggesting that MIF is a potential target in molecular therapy for gastric cancer.
He LJ, Xie D, Hu PJ, Liao YJ, Deng HX, Kung HF, Zhu SL. Macrophage migration inhibitory factor as a potential prognostic factor in gastric cancer. World J Gastroenterol 2015; 21(34): 9916-9926 Available from: URL: http://www.wjgnet.com/1007-9327/full/v21/i34/9916.htm DOI: http://dx.doi.org/10.3748/wjg.v21.i34.9916
INTRODUCTIONMacrophage migration inhibitory factor (MIF) is a
pluripotent cytokine that can inhibit macrophage migration in vitro and promote the accumulation of macrophages in delayed skin hypersensitivity[1,2]. Autocrine MIF signaling stimulates macrophage production of tumor necrosis factor-α, interleukin-1, nitric oxide, hydrogen peroxide and other inflammatory factors[3]. MIF is an important mediator in the pathogenesis of gastric inflammation in rats, and its expression increases significantly in Helicobacter pylori (H. pylori)-induced inflammation in humans[4,5].
Previously, we have shown that MIF knockout mice are protected against H. pylori-induced gastritis[6]. Furthermore, MIF is highly expressed in various tumors, including lung[7], liver[8], breast[9], gastric[10], colon[11], and prostate[12] cancers, and overexpression of MIF stimulates proliferation and inhibits apoptosis in cancer cells via the paracrine pathway[13,14]. These findings suggest that MIF plays an essential part in the development of chronic inflammation and cancer, and possibly in carcinogenesis related to chronic inflammation.
MIF has been suggested as a potential molecular target for cancer therapy. In an in vitro study, proliferation of colon cancer cells was inhibited when MIF was downregulated by transduction of MIF antisense plasmids[15]. In another report, the growth and invasion of DU-145 prostate cancer cells were attenuated by inhibition of MIF and its receptor, CD74[16]. However, whether MIF silencing has any effects on the development of gastric cancer and whether MIF is a potential therapeutic molecular target in this disease are not understood.
In this report, we demonstrate that MIF is substantially expressed in gastric cancer cells in vitro and in vivo, MIF expression is associated with patient survival in gastric cancer and thus may be of prognostic value, and MIF may act as a potential therapeutic target for gastric cancer.
MATERIALS AND METHODSTissue samplesIn this study, we retrospectively recruited formalin-fixed, paraffin-embedded tissues from 117 cases of gastric cancer, which were resected initially between March 2001 and August 2003. Samples were collected from the archives of the Department of Pathology, the First Affiliated Hospital of Sun Yat-sen University, Guangzhou, China. Tumor differentiation was defined based on the criteria proposed by the World Health Organization (WHO) Classification of Tumors (2003). Tumor stages were defined according to the American Joint Committee on Cancer (AJCC) TNM Staging Classification for Carcinoma of the Stomach (7th
Ed, 2010). This study was approved by the Ethics Committee of the Sun Yat-sen University Cancer Center, and written informed consent was obtained from each patient.
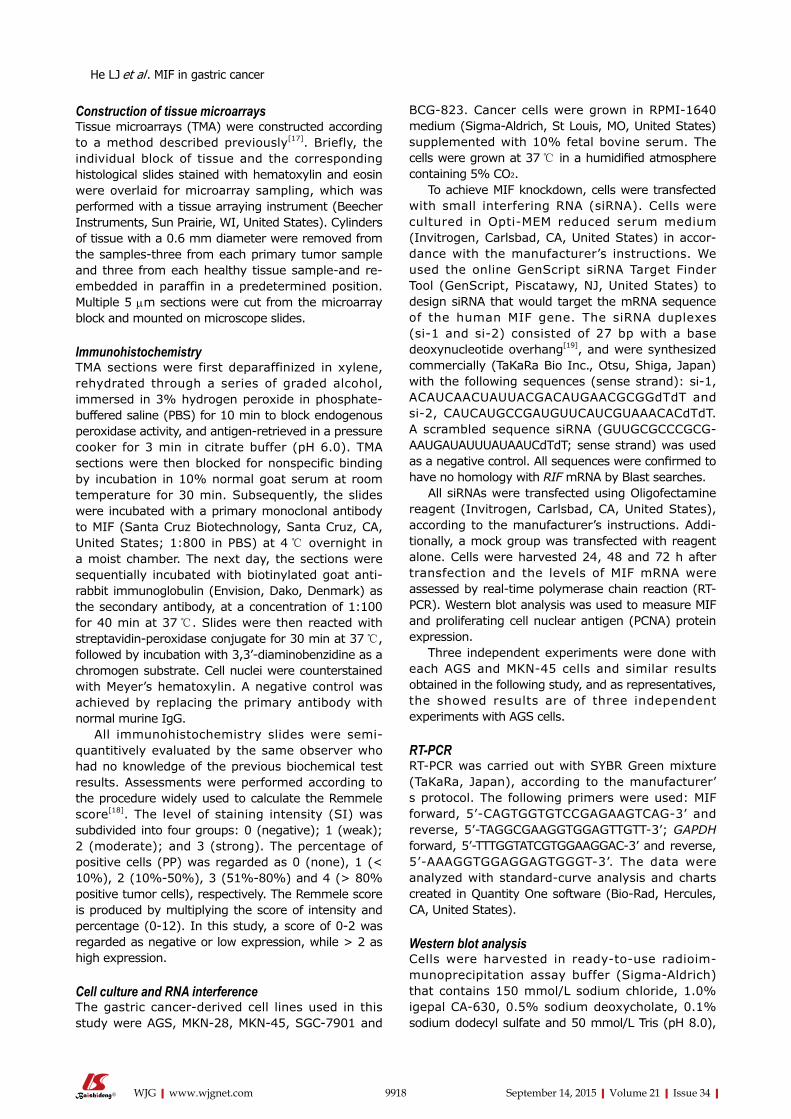
9918 September 14, 2015|Volume 21|Issue 34|WJG|www.wjgnet.com
Construction of tissue microarraysTissue microarrays (TMA) were constructed according to a method described previously[17]. Briefly, the individual block of tissue and the corresponding histological slides stained with hematoxylin and eosin were overlaid for microarray sampling, which was performed with a tissue arraying instrument (Beecher Instruments, Sun Prairie, WI, United States). Cylinders of tissue with a 0.6 mm diameter were removed from the samples-three from each primary tumor sample and three from each healthy tissue sample-and re-embedded in paraffin in a predetermined position. Multiple 5 μm sections were cut from the microarray block and mounted on microscope slides.
ImmunohistochemistryTMA sections were first deparaffinized in xylene, rehydrated through a series of graded alcohol, immersed in 3% hydrogen peroxide in phosphate-buffered saline (PBS) for 10 min to block endogenous peroxidase activity, and antigen-retrieved in a pressure cooker for 3 min in citrate buffer (pH 6.0). TMA sections were then blocked for nonspecific binding by incubation in 10% normal goat serum at room temperature for 30 min. Subsequently, the slides were incubated with a primary monoclonal antibody to MIF (Santa Cruz Biotechnology, Santa Cruz, CA, United States; 1:800 in PBS) at 4 ℃ overnight in a moist chamber. The next day, the sections were sequentially incubated with biotinylated goat anti-rabbit immunoglobulin (Envision, Dako, Denmark) as the secondary antibody, at a concentration of 1:100 for 40 min at 37 ℃. Slides were then reacted with streptavidin-peroxidase conjugate for 30 min at 37 ℃, followed by incubation with 3,3’-diaminobenzidine as a chromogen substrate. Cell nuclei were counterstained with Meyer’s hematoxylin. A negative control was achieved by replacing the primary antibody with normal murine IgG.
All immunohistochemistry slides were semi-quantitively evaluated by the same observer who had no knowledge of the previous biochemical test results. Assessments were performed according to the procedure widely used to calculate the Remmele score[18]. The level of staining intensity (SI) was subdivided into four groups: 0 (negative); 1 (weak); 2 (moderate); and 3 (strong). The percentage of positive cells (PP) was regarded as 0 (none), 1 (< 10%), 2 (10%-50%), 3 (51%-80%) and 4 (> 80% positive tumor cells), respectively. The Remmele score is produced by multiplying the score of intensity and percentage (0-12). In this study, a score of 0-2 was regarded as negative or low expression, while > 2 as high expression.
Cell culture and RNA interferenceThe gastric cancer-derived cell lines used in this study were AGS, MKN-28, MKN-45, SGC-7901 and
BCG-823. Cancer cells were grown in RPMI-1640 medium (Sigma-Aldrich, St Louis, MO, United States) supplemented with 10% fetal bovine serum. The cells were grown at 37 ℃ in a humidified atmosphere containing 5% CO2.
To achieve MIF knockdown, cells were transfected with small interfering RNA (siRNA). Cells were cultured in Opti-MEM reduced serum medium (Invitrogen, Carlsbad, CA, United States) in accor-dance with the manufacturer’s instructions. We used the online GenScript siRNA Target Finder Tool (GenScript, Piscatawy, NJ, United States) to design siRNA that would target the mRNA sequence of the human MIF gene. The siRNA duplexes (si-1 and si-2) consisted of 27 bp with a base deoxynucleotide overhang[19], and were synthesized commercially (TaKaRa Bio Inc., Otsu, Shiga, Japan) with the following sequences (sense strand): si-1, ACAUCAACUAUUACGACAUGAACGCGGdTdT and si-2, CAUCAUGCCGAUGUUCAUCGUAAACACdTdT. A scrambled sequence siRNA (GUUGCGCCCGCG-AAUGAUAUUUAUAAUCdTdT; sense strand) was used as a negative control. All sequences were confirmed to have no homology with RIF mRNA by Blast searches.
All siRNAs were transfected using Oligofectamine reagent (Invitrogen, Carlsbad, CA, United States), according to the manufacturer’s instructions. Addi-tionally, a mock group was transfected with reagent alone. Cells were harvested 24, 48 and 72 h after transfection and the levels of MIF mRNA were assessed by real-time polymerase chain reaction (RT-PCR). Western blot analysis was used to measure MIF and proliferating cell nuclear antigen (PCNA) protein expression.
Three independent experiments were done with each AGS and MKN-45 cells and similar results obtained in the following study, and as representatives, the showed results are of three independent experiments with AGS cells.
RT-PCRRT-PCR was carried out with SYBR Green mixture (TaKaRa, Japan), according to the manufacturer’s protocol. The following primers were used: MIF forward, 5’-CAGTGGTGTCCGAGAAGTCAG-3’ and reverse, 5’-TAGGCGAAGGTGGAGTTGTT-3’; GAPDH forward, 5’-TTTGGTATCGTGGAAGGAC-3’ and reverse, 5’-AAAGGTGGAGGAGTGGGT-3’. The data were analyzed with standard-curve analysis and charts created in Quantity One software (Bio-Rad, Hercules, CA, United States).
Western blot analysisCells were harvested in ready-to-use radioim-munoprecipitation assay buffer (Sigma-Aldrich) that contains 150 mmol/L sodium chloride, 1.0% igepal CA-630, 0.5% sodium deoxycholate, 0.1% sodium dodecyl sulfate and 50 mmol/L Tris (pH 8.0),
He LJ et al . MIF in gastric cancer
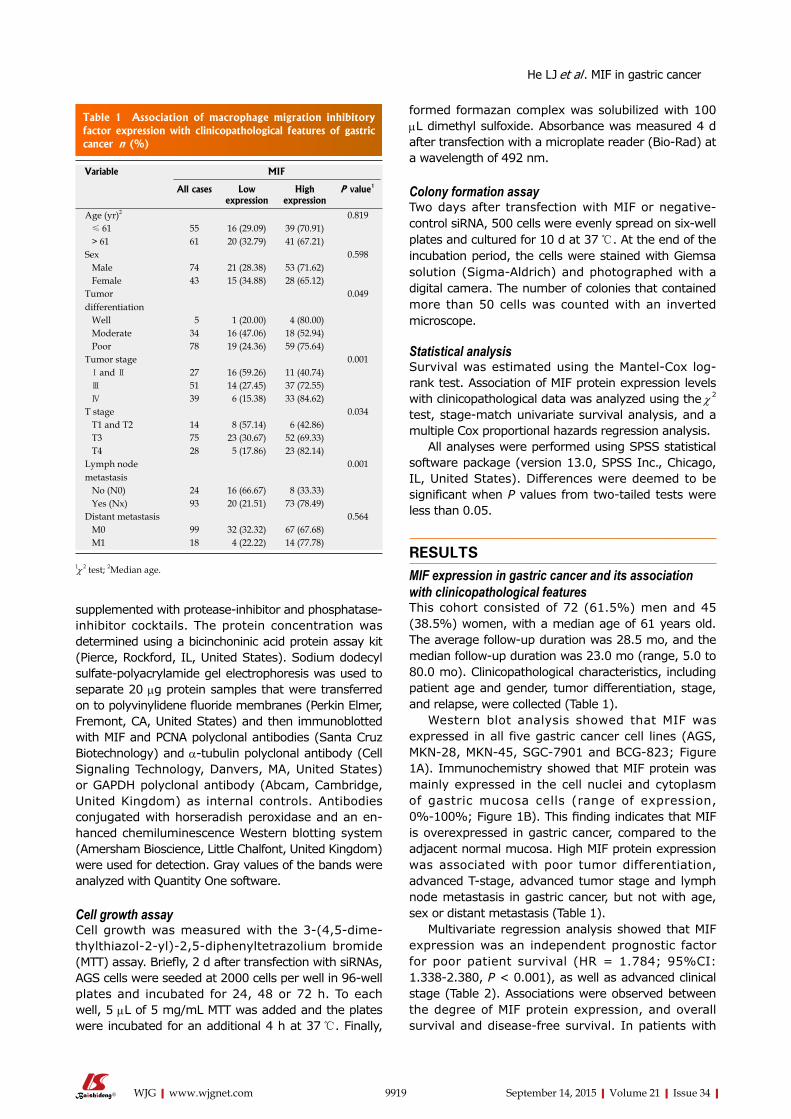
Table 1 Association of macrophage migration inhibitory factor expression with clinicopathological features of gastric cancer n (%)
9919 September 14, 2015|Volume 21|Issue 34|WJG|www.wjgnet.com
supplemented with protease-inhibitor and phosphatase-inhibitor cocktails. The protein concentration was determined using a bicinchoninic acid protein assay kit (Pierce, Rockford, IL, United States). Sodium dodecyl sulfate-polyacrylamide gel electrophoresis was used to separate 20 μg protein samples that were transferred on to polyvinylidene fluoride membranes (Perkin Elmer, Fremont, CA, United States) and then immunoblotted with MIF and PCNA polyclonal antibodies (Santa Cruz Biotechnology) and α-tubulin polyclonal antibody (Cell Signaling Technology, Danvers, MA, United States) or GAPDH polyclonal antibody (Abcam, Cambridge, United Kingdom) as internal controls. Antibodies conjugated with horseradish peroxidase and an en-hanced chemiluminescence Western blotting system (Amersham Bioscience, Little Chalfont, United Kingdom) were used for detection. Gray values of the bands were analyzed with Quantity One software.
Cell growth assayCell growth was measured with the 3-(4,5-dime-thylthiazol-2-yl)-2,5-diphenyltetrazolium bromide (MTT) assay. Briefly, 2 d after transfection with siRNAs, AGS cells were seeded at 2000 cells per well in 96-well plates and incubated for 24, 48 or 72 h. To each well, 5 μL of 5 mg/mL MTT was added and the plates were incubated for an additional 4 h at 37 ℃. Finally,
formed formazan complex was solubilized with 100 μL dimethyl sulfoxide. Absorbance was measured 4 d after transfection with a microplate reader (Bio-Rad) at a wavelength of 492 nm.
Colony formation assayTwo days after transfection with MIF or negative-control siRNA, 500 cells were evenly spread on six-well plates and cultured for 10 d at 37 ℃. At the end of the incubation period, the cells were stained with Giemsa solution (Sigma-Aldrich) and photographed with a digital camera. The number of colonies that contained more than 50 cells was counted with an inverted microscope.
Statistical analysisSurvival was estimated using the Mantel-Cox log-rank test. Association of MIF protein expression levels with clinicopathological data was analyzed using the χ 2 test, stage-match univariate survival analysis, and a multiple Cox proportional hazards regression analysis.
All analyses were performed using SPSS statistical software package (version 13.0, SPSS Inc., Chicago, IL, United States). Differences were deemed to be significant when P values from two-tailed tests were less than 0.05.
RESULTSMIF expression in gastric cancer and its association with clinicopathological featuresThis cohort consisted of 72 (61.5%) men and 45 (38.5%) women, with a median age of 61 years old. The average follow-up duration was 28.5 mo, and the median follow-up duration was 23.0 mo (range, 5.0 to 80.0 mo). Clinicopathological characteristics, including patient age and gender, tumor differentiation, stage, and relapse, were collected (Table 1).
Western blot analysis showed that MIF was expressed in all five gastric cancer cell lines (AGS, MKN-28, MKN-45, SGC-7901 and BCG-823; Figure 1A). Immunochemistry showed that MIF protein was mainly expressed in the cell nuclei and cytoplasm of gastric mucosa cells (range of expression, 0%-100%; Figure 1B). This finding indicates that MIF is overexpressed in gastric cancer, compared to the adjacent normal mucosa. High MIF protein expression was associated with poor tumor differentiation, advanced T-stage, advanced tumor stage and lymph node metastasis in gastric cancer, but not with age, sex or distant metastasis (Table 1).
Multivariate regression analysis showed that MIF expression was an independent prognostic factor for poor patient survival (HR = 1.784; 95%CI: 1.338-2.380, P < 0.001), as well as advanced clinical stage (Table 2). Associations were observed between the degree of MIF protein expression, and overall survival and disease-free survival. In patients with
Variable MIF
All cases Low expression
High expression
P value1
Age (yr)2 0.819 ≤ 61 55 16 (29.09) 39 (70.91) > 61 61 20 (32.79) 41 (67.21)Sex 0.598 Male 74 21 (28.38) 53 (71.62) Female 43 15 (34.88) 28 (65.12)Tumor differentiation
0.049
Well 5 1 (20.00) 4 (80.00) Moderate 34 16 (47.06) 18 (52.94) Poor 78 19 (24.36) 59 (75.64)Tumor stage 0.001 Ⅰ and Ⅱ 27 16 (59.26) 11 (40.74) Ⅲ 51 14 (27.45) 37 (72.55) Ⅳ 39 6 (15.38) 33 (84.62)T stage 0.034 T1 and T2 14 8 (57.14) 6 (42.86) T3 75 23 (30.67) 52 (69.33) T4 28 5 (17.86) 23 (82.14)Lymph node metastasis
0.001
No (N0) 24 16 (66.67) 8 (33.33) Yes (Nx) 93 20 (21.51) 73 (78.49)Distant metastasis 0.564 M0 99 32 (32.32) 67 (67.68) M1 18 4 (22.22) 14 (77.78)
1χ 2 test; 2Median age.
He LJ et al . MIF in gastric cancer
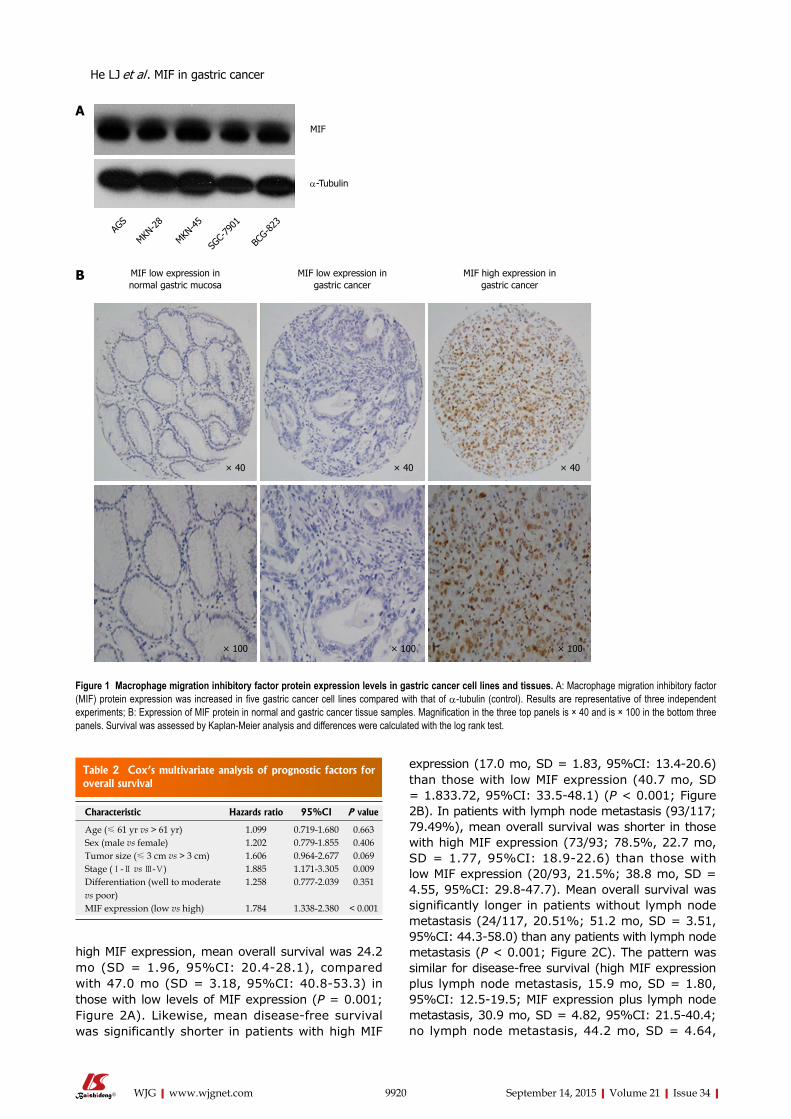
Table 2 Cox’s multivariate analysis of prognostic factors for overall survival
9920 September 14, 2015|Volume 21|Issue 34|WJG|www.wjgnet.com
high MIF expression, mean overall survival was 24.2 mo (SD = 1.96, 95%CI: 20.4-28.1), compared with 47.0 mo (SD = 3.18, 95%CI: 40.8-53.3) in those with low levels of MIF expression (P = 0.001; Figure 2A). Likewise, mean disease-free survival was significantly shorter in patients with high MIF
expression (17.0 mo, SD = 1.83, 95%CI: 13.4-20.6) than those with low MIF expression (40.7 mo, SD = 1.833.72, 95%CI: 33.5-48.1) (P < 0.001; Figure 2B). In patients with lymph node metastasis (93/117; 79.49%), mean overall survival was shorter in those with high MIF expression (73/93; 78.5%, 22.7 mo, SD = 1.77, 95%CI: 18.9-22.6) than those with low MIF expression (20/93, 21.5%; 38.8 mo, SD = 4.55, 95%CI: 29.8-47.7). Mean overall survival was significantly longer in patients without lymph node metastasis (24/117, 20.51%; 51.2 mo, SD = 3.51, 95%CI: 44.3-58.0) than any patients with lymph node metastasis (P < 0.001; Figure 2C). The pattern was similar for disease-free survival (high MIF expression plus lymph node metastasis, 15.9 mo, SD = 1.80, 95%CI: 12.5-19.5; MIF expression plus lymph node metastasis, 30.9 mo, SD = 4.82, 95%CI: 21.5-40.4; no lymph node metastasis, 44.2 mo, SD = 4.64,
MIF low expression in normal gastric mucosa
MIF low expression in gastric cancer
MIF high expression in gastric cancer
× 40 × 40× 40
× 100 × 100 × 100
MIF
α-Tubulin
AGS
MKN-2
8
MKN-4
5
SGC-
7901
BCG-8
23
A
B
Figure 1 Macrophage migration inhibitory factor protein expression levels in gastric cancer cell lines and tissues. A: Macrophage migration inhibitory factor (MIF) protein expression was increased in five gastric cancer cell lines compared with that of α-tubulin (control). Results are representative of three independent experiments; B: Expression of MIF protein in normal and gastric cancer tissue samples. Magnification in the three top panels is × 40 and is × 100 in the bottom three panels. Survival was assessed by Kaplan-Meier analysis and differences were calculated with the log rank test.
Characteristic Hazards ratio 95%CI P value
Age (≤ 61 yr vs > 61 yr) 1.099 0.719-1.680 0.663Sex (male vs female) 1.202 0.779-1.855 0.406Tumor size (≤ 3 cm vs > 3 cm) 1.606 0.964-2.677 0.069Stage (Ⅰ-Ⅱ vs Ⅲ-Ⅴ) 1.885 1.171-3.305 0.009Differentiation (well to moderate vs poor)
1.258 0.777-2.039 0.351
MIF expression (low vs high) 1.784 1.338-2.380 < 0.001
He LJ et al . MIF in gastric cancer
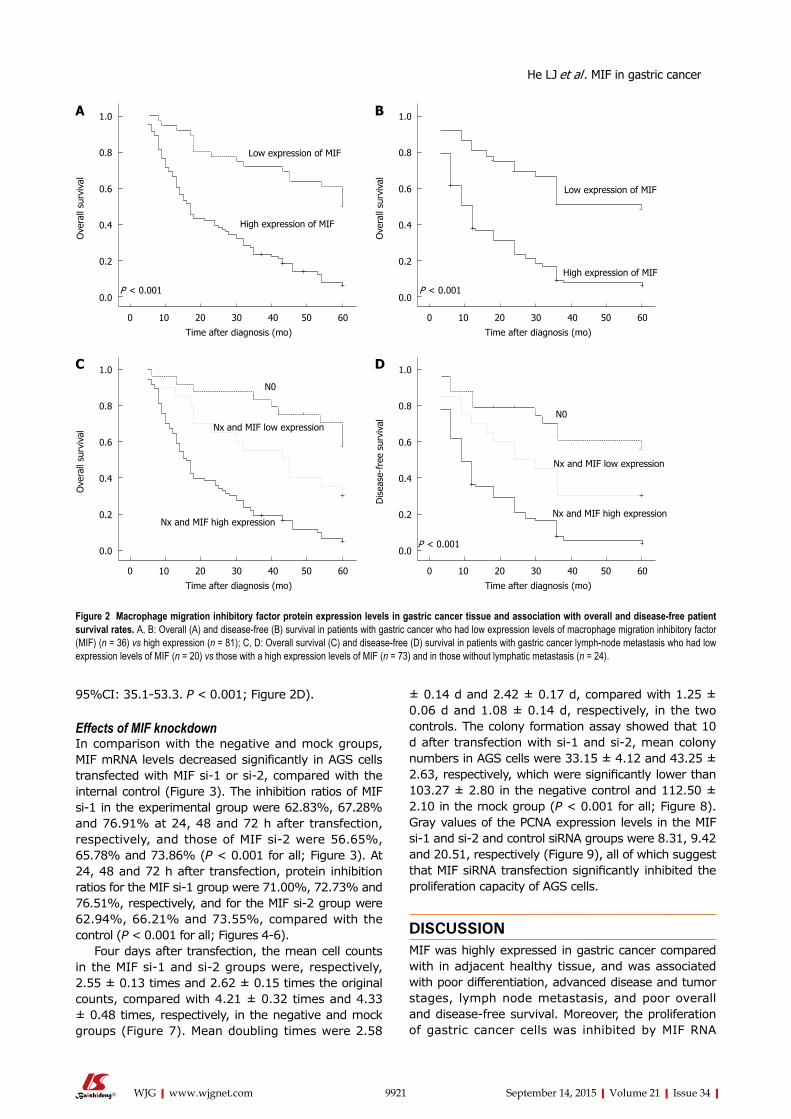
9921 September 14, 2015|Volume 21|Issue 34|WJG|www.wjgnet.com
95%CI: 35.1-53.3. P < 0.001; Figure 2D).
Effects of MIF knockdown In comparison with the negative and mock groups, MIF mRNA levels decreased significantly in AGS cells transfected with MIF si-1 or si-2, compared with the internal control (Figure 3). The inhibition ratios of MIF si-1 in the experimental group were 62.83%, 67.28% and 76.91% at 24, 48 and 72 h after transfection, respectively, and those of MIF si-2 were 56.65%, 65.78% and 73.86% (P < 0.001 for all; Figure 3). At 24, 48 and 72 h after transfection, protein inhibition ratios for the MIF si-1 group were 71.00%, 72.73% and 76.51%, respectively, and for the MIF si-2 group were 62.94%, 66.21% and 73.55%, compared with the control (P < 0.001 for all; Figures 4-6).
Four days after transfection, the mean cell counts in the MIF si-1 and si-2 groups were, respectively, 2.55 ± 0.13 times and 2.62 ± 0.15 times the original counts, compared with 4.21 ± 0.32 times and 4.33 ± 0.48 times, respectively, in the negative and mock groups (Figure 7). Mean doubling times were 2.58
± 0.14 d and 2.42 ± 0.17 d, compared with 1.25 ± 0.06 d and 1.08 ± 0.14 d, respectively, in the two controls. The colony formation assay showed that 10 d after transfection with si-1 and si-2, mean colony numbers in AGS cells were 33.15 ± 4.12 and 43.25 ± 2.63, respectively, which were significantly lower than 103.27 ± 2.80 in the negative control and 112.50 ± 2.10 in the mock group (P < 0.001 for all; Figure 8). Gray values of the PCNA expression levels in the MIF si-1 and si-2 and control siRNA groups were 8.31, 9.42 and 20.51, respectively (Figure 9), all of which suggest that MIF siRNA transfection significantly inhibited the proliferation capacity of AGS cells.
DISCUSSIONMIF was highly expressed in gastric cancer compared with in adjacent healthy tissue, and was associated with poor differentiation, advanced disease and tumor stages, lymph node metastasis, and poor overall and disease-free survival. Moreover, the proliferation of gastric cancer cells was inhibited by MIF RNA
Low expression of MIF
1.0
0.8
0.6
0.4
0.2
0.0
Ove
rall
surv
ival
0 10 20 30 40 50 60
High expression of MIF
Time after diagnosis (mo)
P < 0.001
Low expression of MIF
1.0
0.8
0.6
0.4
0.2
0.0
Ove
rall
surv
ival
0 10 20 30 40 50 60
High expression of MIF
Time after diagnosis (mo)
P < 0.001
1.0
0.8
0.6
0.4
0.2
0.0
Ove
rall
surv
ival
0 10 20 30 40 50 60
Nx and MIF high expression
Time after diagnosis (mo)
Nx and MIF low expression
N0
1.0
0.8
0.6
0.4
0.2
0.0
Dis
ease
-fre
e su
rviv
al
0 10 20 30 40 50 60
Nx and MIF high expression
Time after diagnosis (mo)
Nx and MIF low expression
N0
P < 0.001
Figure 2 Macrophage migration inhibitory factor protein expression levels in gastric cancer tissue and association with overall and disease-free patient survival rates. A, B: Overall (A) and disease-free (B) survival in patients with gastric cancer who had low expression levels of macrophage migration inhibitory factor (MIF) (n = 36) vs high expression (n = 81); C, D: Overall survival (C) and disease-free (D) survival in patients with gastric cancer lymph-node metastasis who had low expression levels of MIF (n = 20) vs those with a high expression levels of MIF (n = 73) and in those without lymphatic metastasis (n = 24).
A B
C D
He LJ et al . MIF in gastric cancer
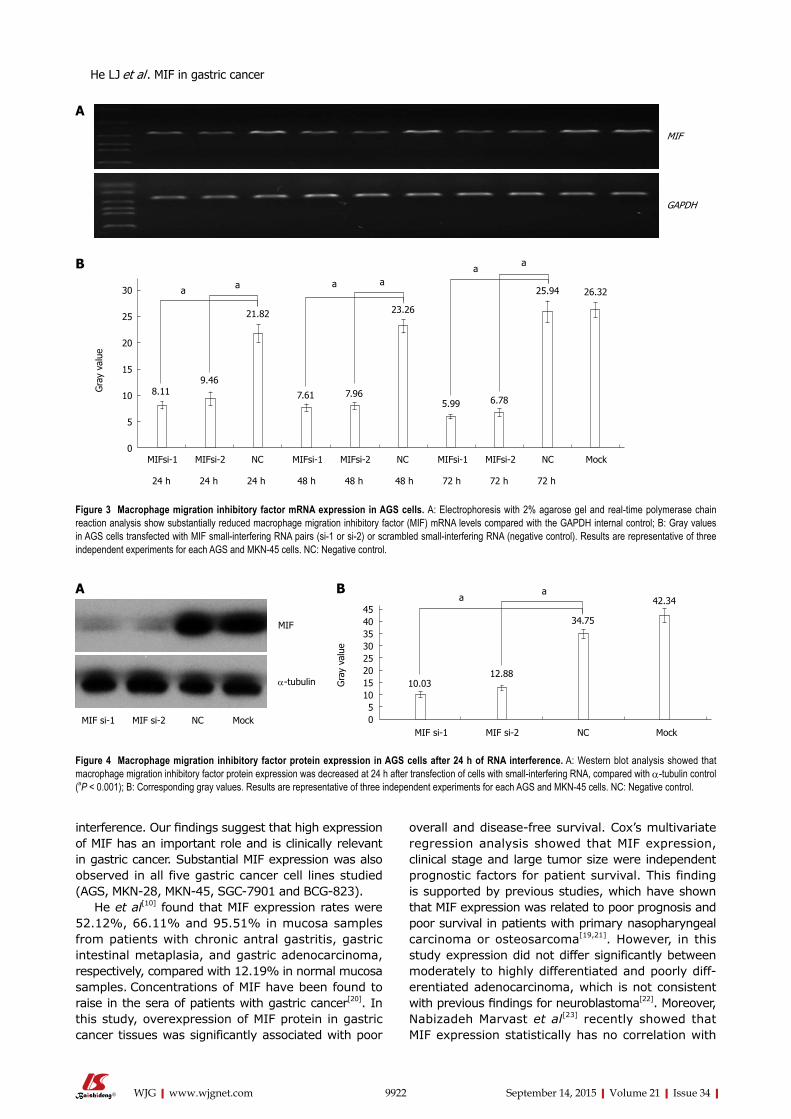
9922 September 14, 2015|Volume 21|Issue 34|WJG|www.wjgnet.com
interference. Our findings suggest that high expression of MIF has an important role and is clinically relevant in gastric cancer. Substantial MIF expression was also observed in all five gastric cancer cell lines studied (AGS, MKN-28, MKN-45, SGC-7901 and BCG-823).
He et al[10] found that MIF expression rates were 52.12%, 66.11% and 95.51% in mucosa samples from patients with chronic antral gastritis, gastric intestinal metaplasia, and gastric adenocarcinoma, respectively, compared with 12.19% in normal mucosa samples. Concentrations of MIF have been found to raise in the sera of patients with gastric cancer[20]. In this study, overexpression of MIF protein in gastric cancer tissues was significantly associated with poor
overall and disease-free survival. Cox’s multivariate regression analysis showed that MIF expression, clinical stage and large tumor size were independent prognostic factors for patient survival. This finding is supported by previous studies, which have shown that MIF expression was related to poor prognosis and poor survival in patients with primary nasopharyngeal carcinoma or osteosarcoma[19,21]. However, in this study expression did not differ significantly between moderately to highly differentiated and poorly diff-erentiated adenocarcinoma, which is not consistent with previous findings for neuroblastoma[22]. Moreover, Nabizadeh Marvast et al[23] recently showed that MIF expression statistically has no correlation with
MIF
GAPDH
A
B
Figure 4 Macrophage migration inhibitory factor protein expression in AGS cells after 24 h of RNA interference. A: Western blot analysis showed that macrophage migration inhibitory factor protein expression was decreased at 24 h after transfection of cells with small-interfering RNA, compared with α-tubulin control (aP < 0.001); B: Corresponding gray values. Results are representative of three independent experiments for each AGS and MKN-45 cells. NC: Negative control.
a30
25
20
15
10
5
0
Gra
y va
lue
MIFsi-1 MIFsi-2 NC MIFsi-1 MIFsi-2 NC MIFsi-1 MIFsi-2 NC Mock
24 h 24 h 24 h 48 h 48 h 48 h 72 h 72 h 72 h
a aa
aa
8.119.46
21.82
7.61 7.965.99 6.78
23.26
25.94 26.32
Figure 3 Macrophage migration inhibitory factor mRNA expression in AGS cells. A: Electrophoresis with 2% agarose gel and real-time polymerase chain reaction analysis show substantially reduced macrophage migration inhibitory factor (MIF) mRNA levels compared with the GAPDH internal control; B: Gray values in AGS cells transfected with MIF small-interfering RNA pairs (si-1 or si-2) or scrambled small-interfering RNA (negative control). Results are representative of three independent experiments for each AGS and MKN-45 cells. NC: Negative control.
A B
MIF
α-tubulin Gra
y va
lue
454035302520151050
MIF si-1 MIF si-2 NC Mock
a
34.75
12.8810.03
42.34a
MIF si-1 MIF si-2 NC Mock
He LJ et al . MIF in gastric cancer
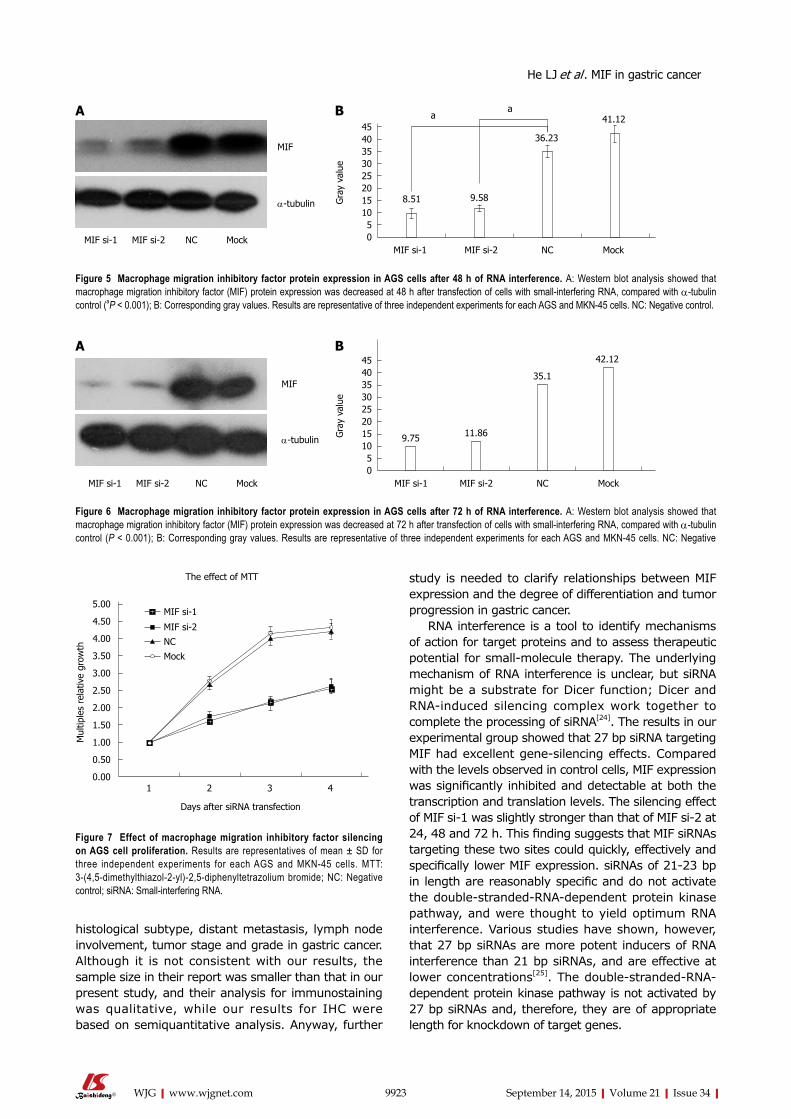
9923 September 14, 2015|Volume 21|Issue 34|WJG|www.wjgnet.com
histological subtype, distant metastasis, lymph node involvement, tumor stage and grade in gastric cancer. Although it is not consistent with our results, the sample size in their report was smaller than that in our present study, and their analysis for immunostaining was qualitative, while our results for IHC were based on semiquantitative analysis. Anyway, further
study is needed to clarify relationships between MIF expression and the degree of differentiation and tumor progression in gastric cancer.
RNA interference is a tool to identify mechanisms of action for target proteins and to assess therapeutic potential for small-molecule therapy. The underlying mechanism of RNA interference is unclear, but siRNA might be a substrate for Dicer function; Dicer and RNA-induced silencing complex work together to complete the processing of siRNA[24]. The results in our experimental group showed that 27 bp siRNA targeting MIF had excellent gene-silencing effects. Compared with the levels observed in control cells, MIF expression was significantly inhibited and detectable at both the transcription and translation levels. The silencing effect of MIF si-1 was slightly stronger than that of MIF si-2 at 24, 48 and 72 h. This finding suggests that MIF siRNAs targeting these two sites could quickly, effectively and specifically lower MIF expression. siRNAs of 21-23 bp in length are reasonably specific and do not activate the double-stranded-RNA-dependent protein kinase pathway, and were thought to yield optimum RNA interference. Various studies have shown, however, that 27 bp siRNAs are more potent inducers of RNA interference than 21 bp siRNAs, and are effective at lower concentrations[25]. The double-stranded-RNA-dependent protein kinase pathway is not activated by 27 bp siRNAs and, therefore, they are of appropriate length for knockdown of target genes.
MIF
α-tubulin
MIF si-1 MIF si-2 NC Mock
454035302520151050
Gra
y va
lue
MIF si-1 MIF si-2 NC Mock
a
36.23
9.588.51
41.12a
Figure 5 Macrophage migration inhibitory factor protein expression in AGS cells after 48 h of RNA interference. A: Western blot analysis showed that macrophage migration inhibitory factor (MIF) protein expression was decreased at 48 h after transfection of cells with small-interfering RNA, compared with α-tubulin control (aP < 0.001); B: Corresponding gray values. Results are representative of three independent experiments for each AGS and MKN-45 cells. NC: Negative control.
A B
Figure 6 Macrophage migration inhibitory factor protein expression in AGS cells after 72 h of RNA interference. A: Western blot analysis showed that macrophage migration inhibitory factor (MIF) protein expression was decreased at 72 h after transfection of cells with small-interfering RNA, compared with α-tubulin control (P < 0.001); B: Corresponding gray values. Results are representative of three independent experiments for each AGS and MKN-45 cells. NC: Negative
MIF
α-tubulin
MIF si-1 MIF si-2 NC Mock
454035302520151050
Gra
y va
lue
MIF si-1 MIF si-2 NC Mock
35.1
11.869.75
42.12A B
He LJ et al . MIF in gastric cancer
MIF si-1
MIF si-2
NC
Mock
5.00
4.50
4.00
3.50
3.00
2.50
2.00
1.50
1.00
0.50
0.00
Mul
tiple
s re
lativ
e gr
owth
1 2 3 4
Days after siRNA transfection
The effect of MTT
Figure 7 Effect of macrophage migration inhibitory factor silencing on AGS cell proliferation. Results are representatives of mean ± SD for three independent experiments for each AGS and MKN-45 cells. MTT: 3-(4,5-dimethylthiazol-2-yl)-2,5-diphenyltetrazolium bromide; NC: Negative control; siRNA: Small-interfering RNA.
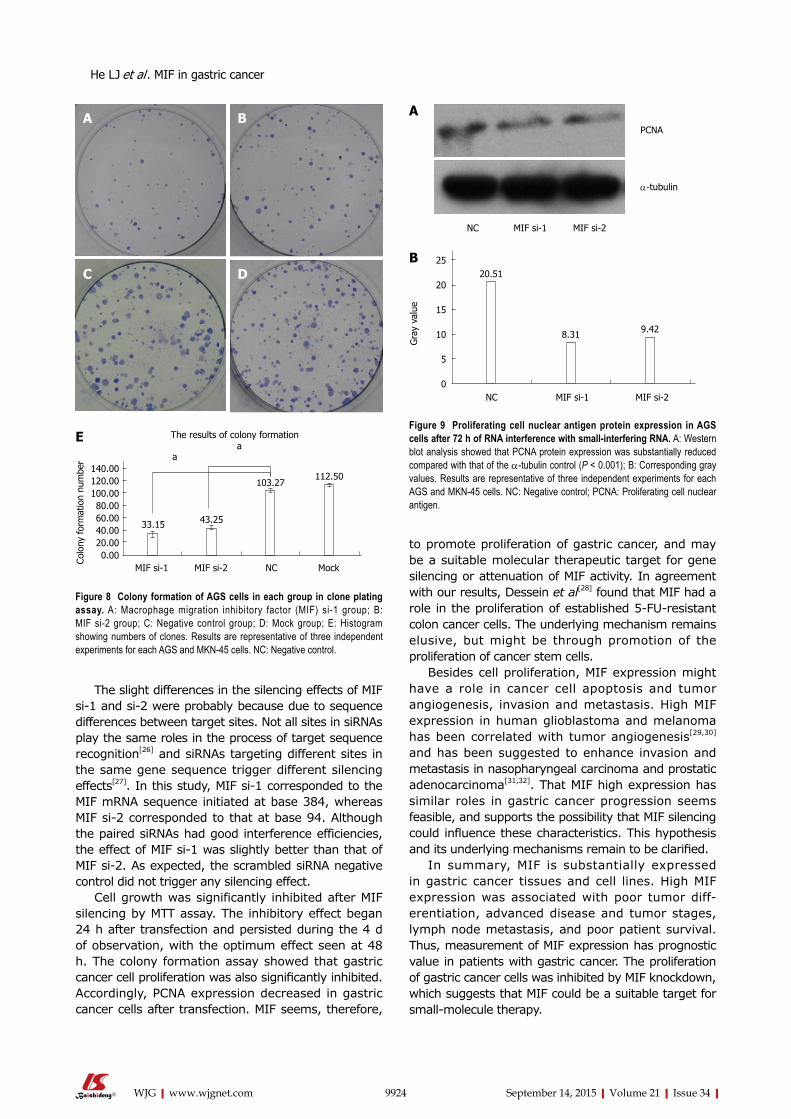
9924 September 14, 2015|Volume 21|Issue 34|WJG|www.wjgnet.com
The slight differences in the silencing effects of MIF si-1 and si-2 were probably because due to sequence differences between target sites. Not all sites in siRNAs play the same roles in the process of target sequence recognition[26] and siRNAs targeting different sites in the same gene sequence trigger different silencing effects[27]. In this study, MIF si-1 corresponded to the MIF mRNA sequence initiated at base 384, whereas MIF si-2 corresponded to that at base 94. Although the paired siRNAs had good interference efficiencies, the effect of MIF si-1 was slightly better than that of MIF si-2. As expected, the scrambled siRNA negative control did not trigger any silencing effect.
Cell growth was significantly inhibited after MIF silencing by MTT assay. The inhibitory effect began 24 h after transfection and persisted during the 4 d of observation, with the optimum effect seen at 48 h. The colony formation assay showed that gastric cancer cell proliferation was also significantly inhibited. Accordingly, PCNA expression decreased in gastric cancer cells after transfection. MIF seems, therefore,
to promote proliferation of gastric cancer, and may be a suitable molecular therapeutic target for gene silencing or attenuation of MIF activity. In agreement with our results, Dessein et al[28] found that MIF had a role in the proliferation of established 5-FU-resistant colon cancer cells. The underlying mechanism remains elusive, but might be through promotion of the proliferation of cancer stem cells.
Besides cell proliferation, MIF expression might have a role in cancer cell apoptosis and tumor angiogenesis, invasion and metastasis. High MIF expression in human glioblastoma and melanoma has been correlated with tumor angiogenesis[29,30] and has been suggested to enhance invasion and metastasis in nasopharyngeal carcinoma and prostatic adenocarcinoma[31,32]. That MIF high expression has similar roles in gastric cancer progression seems feasible, and supports the possibility that MIF silencing could influence these characteristics. This hypothesis and its underlying mechanisms remain to be clarified.
In summary, MIF is substantially expressed in gastric cancer tissues and cell lines. High MIF expression was associated with poor tumor diff-erentiation, advanced disease and tumor stages, lymph node metastasis, and poor patient survival. Thus, measurement of MIF expression has prognostic value in patients with gastric cancer. The proliferation of gastric cancer cells was inhibited by MIF knockdown, which suggests that MIF could be a suitable target for small-molecule therapy.
Figure 8 Colony formation of AGS cells in each group in clone plating assay. A: Macrophage migration inhibitory factor (MIF) si-1 group; B: MIF si-2 group; C: Negative control group; D: Mock group; E: Histogram showing numbers of clones. Results are representative of three independent experiments for each AGS and MKN-45 cells. NC: Negative control.
DC
BA
E
140.00120.00100.0080.0060.0040.0020.000.00Co
lony
form
atio
n nu
mbe
r
MIF si-1 MIF si-2 NC Mock
103.27
43.2533.15
112.50
aa
The results of colony formation
He LJ et al . MIF in gastric cancer
PCNA
α-tubulin
NC MIF si-1 MIF si-2
Figure 9 Proliferating cell nuclear antigen protein expression in AGS cells after 72 h of RNA interference with small-interfering RNA. A: Western blot analysis showed that PCNA protein expression was substantially reduced compared with that of the α-tubulin control (P < 0.001); B: Corresponding gray values. Results are representative of three independent experiments for each AGS and MKN-45 cells. NC: Negative control; PCNA: Proliferating cell nuclear antigen.
A
25
20
15
10
5
0
Gra
y va
lue
NC MIF si-1 MIF si-2
20.51
8.31 9.42
B
9925 September 14, 2015|Volume 21|Issue 34|WJG|www.wjgnet.com
COMMENTSBackgroundMigration inhibitory factor (MIF) is a pluripotent cytokine that can inhibit macrophage migration in vitro and promote the accumulation of macrophages in delayed skin hypersensitivity, which is highly expressed in a variety of tumors. Previous study by He et al demonstrated that MIF knockout mice are protected against Helicobacter pylori induced gastritis. Moreover, MIF stimulates the proliferation of cancer cells, as well as inhibits the apoptosis of cancer cells by paracrine pathway. These findings would imply that MIF might play an essential role in the development of chronic inflammation and cancer, and even carcinogenesis related to chronic inflammation.
Research frontiersThe authors investigated MIF expression and its clinical relevance in gastric cancer, and effects of MIF knockdown on proliferation of gastric cancer cells. MIF expression was assessed by immunohistochemistry in a tissue microarray containing samples taken from 117 patients and its prognostic association was analysed. After siRNA transfection, MIF mRNA was measured by real-time PCR, MIF protein and proliferating cell nuclear antigen proliferating cell nuclear antigen were assessed by Western blot analysis, and the MTT assay, colony forming assay and cell counting were also performed.
Innovations and breakthroughsThis study demonstrates for the first time that MIF was highly expressed in gastric cancer compared with in adjacent healthy tissue, and was associated with poor differentiation, advanced disease and tumor stages, lymph node metastasis, and poor overall and disease-free survival. Moreover, the proliferation of gastric cancer cells was inhibited by MIF RNA interference.
ApplicationsMeasurement of MIF expression has prognostic value in patients with gastric cancer. The proliferation of gastric cancer cells was inhibited by MIF knockdown, which suggests that MIF could be a suitable target for small-molecule therapy.
TerminologyMacrophage migration inhibitory factor is a multi-functional cytokine, which is associated with inflammation and plays a significant role in tumorigenesis.
Peer-reviewThis study, consisting of clinical and experimental data, further explored the role of MIF in gastric carcinogenesis. Whereas the clinical data confirmed the previous findings, the experimental data in AGS cells using siRNAs provided novel evidence that MIF plays a critical role in the development of gastric cancer and MIF may be a potential therapeutic target.
REFERENCES1 David JR. Delayed hypersensitivity in vitro: its mediation by
cell-free substances formed by lymphoid cell-antigen interaction. Proc Natl Acad Sci USA 1966; 56: 72-77 [PMID: 5229858 DOI: 10.1073/pnas.56.1.72]
2 Bloom BR, Bennett B. Mechanism of a reaction in vitro associated with delayed-type hypersensitivity. Science 1966; 153: 80-82 [PMID: 5938421 DOI: 10.1126/science.153.3731.80]
3 Yu T, Morita I, Shimokado K, Iwai T, Yoshida M. Amlodipine modulates THP-1 cell adhesion to vascular endothelium via inhibition of protein kinase C signal transduction. Hypertension 2003; 42: 329-334 [PMID: 12900427 DOI: 10.1161/01.HYP.0000087199.34071.4F]
4 Huang XR, Chun Hui CW, Chen YX, Wong BC, Fung PC, Metz C, Cho CH, Hui WM, Bucala R, Lam SK, Lan HY. Macrophage migration inhibitory factor is an important mediator in the pathogenesis of gastric inflammation in rats. Gastroenterology 2001; 121: 619-630 [PMID: 11522746 DOI: 10.1053/gast.2001.27205]
5 Xia HH, Lam SK, Huang XR, Wong WM, Leung SY, Yuen ST, Lan HY, Wong BC. Helicobacter pylori infection is associated
with increased expression of macrophage migratory inhibitory factor--by epithelial cells, T cells, and macrophages--in gastric mucosa. J Infect Dis 2004; 190: 293-302 [PMID: 15216464 DOI: 10.1086/421915]
6 Wong BL, Zhu SL, Huang XR, Ma J, Xia HH, Bucala R, Wong BC, Lan HY. Essential role for macrophage migration inhibitory factor in gastritis induced by Helicobacter pylori. Am J Pathol 2009; 174: 1319-1328 [PMID: 19286569 DOI: 10.2353/ajpath.2009.080708]
7 White ES, Flaherty KR, Carskadon S, Brant A, Iannettoni MD, Yee J, Orringer MB, Arenberg DA. Macrophage migration inhibitory factor and CXC chemokine expression in non-small cell lung cancer: role in angiogenesis and prognosis. Clin Cancer Res 2003; 9: 853-860 [PMID: 12576459 DOI: 10.1158/1078-0432.CCR-08-0360]
8 Akbar SM, Abe M, Murakami H, Tanimoto K, Kumagi T, Yamashita Y, Michitaka K, Horiike N, Onji M. Macrophage migration inhibitory factor in hepatocellular carcinoma and liver cirrhosis; relevance to pathogenesis. Cancer Lett 2001; 171: 125-132 [PMID: 11520595 DOI: 10.1016/S0304-3835(01)00606-1]
9 Bando H, Matsumoto G, Bando M, Muta M, Ogawa T, Funata N, Nishihira J, Koike M, Toi M. Expression of macrophage migration inhibitory factor in human breast cancer: association with nodal spread. Jpn J Cancer Res 2002; 93: 389-396 [PMID: 11985788 DOI: 10.1111/j.1349-7006.2002.tb01269.x]
10 He XX, Yang J, Ding YW, Liu W, Shen QY, Xia HH. Increased epithelial and serum expression of macrophage migration inhibitory factor (MIF) in gastric cancer: potential role of MIF in gastric carcinogenesis. Gut 2006; 55: 797-802 [PMID: 16488898 DOI: 10.1136/gut.2005.078113]
11 Legendre H, Decaestecker C, Nagy N, Hendlisz A, Schüring MP, Salmon I, Gabius HJ, Pector JC, Kiss R. Prognostic values of galectin-3 and the macrophage migration inhibitory factor (MIF) in human colorectal cancers. Mod Pathol 2003; 16: 491-504 [PMID: 12748256 DOI: 10.1097/01.MP.0000068235.45178.C1]
12 del Vecchio MT, Tripodi SA, Arcuri F, Pergola L, Hako L, Vatti R, Cintorino M. Macrophage migration inhibitory factor in prostatic adenocarcinoma: correlation with tumor grading and combination endocrine treatment-related changes. Prostate 2000; 45: 51-57 [PMID: 10960842 DOI: 10.1002/1097-0045]
13 Mitchell RA, Bucala R. Tumor growth-promoting properties of macrophage migration inhibitory factor (MIF). Semin Cancer Biol 2000; 10: 359-366 [PMID: 11100884 DOI: 10.1006/scbi.2000.0328]
14 Hudson JD, Shoaibi MA, Maestro R, Carnero A, Hannon GJ, Beach DH. A proinflammatory cytokine inhibits p53 tumor suppressor activity. J Exp Med 1999; 190: 1375-1382 [PMID: 10562313 DOI: 10.1084/jem.190.10.1375]
15 Takahashi N, Nishihira J, Sato Y, Kondo M, Ogawa H, Ohshima T, Une Y, Todo S. Involvement of macrophage migration inhibitory factor (MIF) in the mechanism of tumor cell growth. Mol Med 1998; 4: 707-714 [PMID: 9932108]
16 Meyer-Siegler KL, Iczkowski KA, Leng L, Bucala R, Vera PL. Inhibition of macrophage migration inhibitory factor or its receptor (CD74) attenuates growth and invasion of DU-145 prostate cancer cells. J Immunol 2006; 177: 8730-8739 [PMID: 17142775 DOI: 10.4049/jimmunol.177.12.8730]
17 He LJ, Cai MY, Xu GL, Li JJ, Weng ZJ, Xu DZ, Luo GY, Zhu SL, Xie D. Prognostic significance of overexpression of EZH2 and H3k27me3 proteins in gastric cancer. Asian Pac J Cancer Prev 2012; 13: 3173-3178 [PMID: 22994729 DOI: 10.7314/APJCP.2012.13.7.3173]
18 Boltze C, Riecke A, Ruf CG, Port M, Nizze H, Kügler C, Miethke C, Wiest N, Abend M. Sporadic and radiation-associated papillary thyroid cancers can be distinguished using routine immuno-histochemistry. Oncol Rep 2009; 22: 459-467 [PMID: 19639189 DOI: 10.3892/or_00000457]
19 Liao B, Zhong BL, Li Z, Tian XY, Li Y, Li B. Macrophage migration inhibitory factor contributes angiogenesis by up-regulating IL-8 and correlates with poor prognosis of patients with primary nasopharyngeal carcinoma. J Surg Oncol 2010; 102: 844-851 [PMID: 20872800 DOI: 10.1002/jso.21728]
20 Xia HH, Yang Y, Chu KM, Gu Q, Zhang YY, He H, Wong
He LJ et al . MIF in gastric cancer
COMMENTS
9926 September 14, 2015|Volume 21|Issue 34|WJG|www.wjgnet.com
WM, Leung SY, Yuen ST, Yuen MF, Chan AO, Wong BC. Serum macrophage migration-inhibitory factor as a diagnostic and prognostic biomarker for gastric cancer. Cancer 2009; 115: 5441-5449 [PMID: 19685530 DOI: 10.1002/cncr.24609]
21 Han I, Lee MR, Nam KW, Oh JH, Moon KC, Kim HS. Expression of macrophage migration inhibitory factor relates to survival in high-grade osteosarcoma. Clin Orthop Relat Res 2008; 466: 2107-2113 [PMID: 18563508 DOI: 10.1007/s11999-008-0333-1]
22 Ren Y, Chan HM, Li Z, Lin C, Nicholls J, Chen CF, Lee PY, Lui V, Bacher M, Tam PK. Upregulation of macrophage migration inhibitory factor contributes to induced N-Myc expression by the activation of ERK signaling pathway and increased expression of interleukin-8 and VEGF in neuroblastoma. Oncogene 2004; 23: 4146-4154 [PMID: 15064733 DOI: 10.1038/sj.onc.1207490]
23 Nabizadeh Marvast M, Sima HR, Ghaffarzadehgan K, Taghizadeh Kermani A, Norouzi N. Clinicopathological significance of macrophage migration inhibitory factor and its relation with p53 in gastric cancer. J Gastrointest Cancer 2011; 42: 5-10 [PMID: 20922580 DOI: 10.1007/s12029-010-9215-3]
24 Czauderna F, Fechtner M, Dames S, Aygün H, Klippel A, Pronk GJ, Giese K, Kaufmann J. Structural variations and stabilising modifications of synthetic siRNAs in mammalian cells. Nucleic Acids Res 2003; 31: 2705-2716 [PMID: 12771196 DOI: 10.1093/nar/gkg393]
25 Reynolds A, Anderson EM, Vermeulen A, Fedorov Y, Robinson K, Leake D, Karpilow J, Marshall WS, Khvorova A. Induction of the interferon response by siRNA is cell type- and duplex length-dependent. RNA 2006; 12: 988-993 [PMID: 16611941 DOI: 10.1261/rna.2340906]
26 Kim DH, Behlke MA, Rose SD, Chang MS, Choi S, Rossi JJ. Synthetic dsRNA Dicer substrates enhance RNAi potency and efficacy. Nat Biotechnol 2005; 23: 222-226 [PMID: 15619617
DOI: 10.1038/nbt1051]27 Holen T, Amarzguioui M, Wiiger MT, Babaie E, Prydz H.
Positional effects of short interfering RNAs targeting the human coagulation trigger Tissue Factor. Nucleic Acids Res 2002; 30: 1757-1766 [PMID: 11937629 DOI: 10.1093/nar/30.8.1757]
28 Dessein AF, Stechly L, Jonckheere N, Dumont P, Monté D, Leteurtre E, Truant S, Pruvot FR, Figeac M, Hebbar M, Lecellier CH, Lesuffleur T, Dessein R, Grard G, Dejonghe MJ, de Launoit Y, Furuichi Y, Prévost G, Porchet N, Gespach C, Huet G. Autocrine induction of invasive and metastatic phenotypes by the MIF-CXCR4 axis in drug-resistant human colon cancer cells. Cancer Res 2010; 70: 4644-4654 [PMID: 20460542 DOI: 10.1158/0008-5472.CAN-09-3828]
29 Munaut C, Boniver J, Foidart JM, Deprez M. Macrophage migration inhibitory factor (MIF) expression in human gliobla-stomas correlates with vascular endothelial growth factor (VEGF) expression. Neuropathol Appl Neurobiol 2002; 28: 452-460 [PMID: 12445161 DOI: 10.1046/j.1365-2990.2002.00416.x]
30 Shimizu T, Abe R, Nakamura H, Ohkawara A, Suzuki M, Nishihira J. High expression of macrophage migration inhibitory factor in human melanoma cells and its role in tumor cell growth and angiogenesis. Biochem Biophys Res Commun 1999; 264: 751-758 [PMID: 10544003 DOI: 10.1006/bbrc.1999.1584]
31 Li Z, Ren Y, Wu QC, Lin SX, Liang YJ, Liang HZ. Macrophage migration inhibitory factor enhances neoplastic cell invasion by inducing the expression of matrix metalloproteinase 9 and interleukin-8 in nasopharyngeal carcinoma cell lines. Chin Med J (Engl) 2004; 117: 107-114 [PMID: 14733785]
32 Meyer-Siegler K, Hudson PB. Enhanced expression of macrophage migration inhibitory factor in prostatic adenocarcinoma metastases. Urology 1996; 48: 448-452 [PMID: 8804500 DOI: 10.1016/S0090-4295(96)00207-5]
P- Reviewer: Carulli L, Matsui H S- Editor: Yu J L- Editor: Wang TQ E- Editor: Liu XM
He LJ et al . MIF in gastric cancer
Submit a Manuscript: http://www.wjgnet.com/esps/Help Desk: http://www.wjgnet.com/esps/helpdesk.aspxDOI: 10.3748/wjg.v21.i34.9927
World J Gastroenterol 2015 September 14; 21(34): 9927-9935 ISSN 1007-9327 (print) ISSN 2219-2840 (online)
© 2015 Baishideng Publishing Group Inc. All rights reserved.
9927 September 14, 2015|Volume 21|Issue 34|WJG|www.wjgnet.com
Development of a rat model of D-galactosamine/lipopolysaccharide induced hepatorenal syndrome
Jing-Bo Wang, Hai-Tao Wang, Lu-Ping Li, Ying-Chun Yan, Wei Wang, Jing-Yang Liu, Yi-Tong Zhao, Wei-Shu Gao, Ming-Xiang Zhang
Jing-Bo Wang, Lu-Ping Li, Ying-Chun Yan, Wei Wang, Jing-Yang Liu, Yi-Tong Zhao, Wei-Shu Gao, Ming-Xiang Zhang, Cirrhosis Treatment Center, the Sixth People′s Hospital of Shenyang, Shenyang 110006, Liaoning Province, China
Hai-Tao Wang, Department of General Surgery, the Affiliated Shenzhou Hospital of Shenyang Medical College, Shenyang 110001, Liaoning Province, China
Author contributions: Wang JB, Wang HT and Zhang MX contributed equally to this work, and all of them were involved in the design and performing of the experiment, data analysis and drafting of the article; Li LP, Yan YC and Gao WS participated in the design and performing of the study and biochemical test; Wang W, Liu JY and Zhao YT the completed hepatic and renal pathological examination, data analysis and drafting of the paper.
Institutional animal care and use committee statement: This study was approved by the Ethical Committee of Shenyang Sixth People’s Hospital.
Conflict-of-interest statement: The authors declare no conflicts of interest.
Data sharing statement: No additional data are available.
Open-Access: This article is an open-access article which was selected by an in-house editor and fully peer-reviewed by external reviewers. It is distributed in accordance with the Creative Commons Attribution Non Commercial (CC BY-NC 4.0) license, which permits others to distribute, remix, adapt, build upon this work non-commercially, and license their derivative works on different terms, provided the original work is properly cited and the use is non-commercial. See: http://creativecommons.org/licenses/by-nc/4.0/
Correspondence to: Ming-Xiang Zhang, Professor, Cirrhosis Treatment Center, the Sixth People′s Hospital of Shenyang, 85 Hepingnan Street, Heping District, Shenyang 110006, Liaoning Province, China. [email protected]: +86-24-23387410-116
Received: March 15, 2015
Peer-review started: March 15, 2015First decision: April 13, 2015Revised: June 3, 2015Accepted: June 26, 2015Article in press: June 26, 2015Published online: September 14, 2015
AbstractAIM: To develop a practical and reproducible rat model of hepatorenal syndrome for further study of the pathophysiology of human hepatorenal syndrome.
METHODS: Sprague-Dawley rats were intravenously injected with D-galactosamine and lipopolysaccharide (LPS) via the tail vein to induce fulminant hepatic failure to develop a model of hepatorenal syndrome. Liver and kidney function tests and plasma cytokine levels were measured after D-galactosamine/LPS administration, and hepatic and renal pathology was studied. Glomerular filtration rate was detected in conscious rats using micro-osmotic pump technology with fluorescein isothiocyanate-labelled inulin as a surrogate marker.
RESULTS: Serum levels of biochemical indicators including liver and kidney function indexes and cytokines all significantly changed, especially at 12 h after D-galactosamine/LPS administration [alanine aminotransferase, 3389.5 ± 499.5 IU/L; blood urea nitrogen, 13.9 ± 1.3 mmol/L; Cr, 78.1 ± 2.9 µmol/L; K+, 6.1 ± 0.5 mmol/L; Na+, 130.9 ± 1.9 mmol/L; Cl-, 90.2 ± 1.9 mmol/L; tumor necrosis factor-α, 1699.6 ± 599.1 pg/mL; endothelin-1, 95.9 ± 25.9 pg/mL; P < 0.05 compared with normal saline control group]. Hepatocyte necrosis was aggravated gradually, which was most significant at 12 h after treatment with D-galactosamine/LPS, and was characterized by massive hepatocyte necrosis, while the structures of glomeruli,
Basic Study
ORIGINAL ARTICLE
proximal and distal tubules were normal. Glomerular filtration rate was significantly decreased to 30%-35% of the control group at 12 h after D-galactosamine/LPS administration [Glomerular filtration rate (GFR)1, 0.79 ± 0.11 mL/min; GFR2, 3.58 ± 0.49 mL/min·kgBW-1; GFR3, 0.39 ± 0.99 mL/min·gKW-1]. The decreasing timing of GFR was consistent with that of the presence of hepatocyte necrosis and liver and kidney dysfunction.
CONCLUSION: The joint use of D-galactosamine and LPS can induce liver and kidney dysfunction and decline of glomerular filtration rate in rats which is a successful rat model of hepatorenal syndrome.
Key words: Hepatorenal syndrome; Animal model; Rat; D-galactosamine; Lipopolysaccharide
© The Author(s) 2015. Published by Baishideng Publishing Group Inc. All rights reserved.
Core tip: In this article, D-galactosamine was injected into SD rats via the caudal vein to establish a model of hepatorenal syndrome (HRS). Twelve hours after injection, serum level of tumor necrosis factor-alpha was significantly elevated while the glomerular filtration rate was significantly lowered. Hepatorenal function became obviously abnormal. Pathological findings showed massive necrosis of liver cells but normal kidney structure. Our animal model provided a good simulation of partial pathophysiological process of human HRS.
Wang JB, Wang HT, Li LP, Yan YC, Wang W, Liu JY, Zhao YT, Gao WS, Zhang MX. Development of a rat model of D-galactosamine/lipopolysaccharide induced hepatorenal syndrome. World J Gastroenterol 2015; 21(34): 9927-9935 Available from: URL: http://www.wjgnet.com/1007-9327/full/v21/i34/9927.htm DOI: http://dx.doi.org/10.3748/wjg.v21.i34.9927
INTRODUCTIONHepatorenal syndrome (HRS) is a condition consisting of functional renal failure, progressive decline in glomerular filtration rate (GFR), sodium retention, azotemia and oliguria, and functional but not morphological kidney dysfunction, which often develops in patients with endstage liver disease[13]. Approximately 40%80% of patients with endstage liver disease, such as late fulminant hepatitis, advanced liver cirrhosis and liver malignant tumors, develop HRS in the presence of liver decompensation[4,5]. Due to the lack of effective treatments[69], the mortality rate of HRS is as high as 60%80%[10,11]. Therefore, there is an urgent need to develop a practical and reproducible animal model of HRS that can simulate the pathological process and biochemical changes of human HRS in order to explore the pathophysiology of HRS, provide
new targets for clinical prevention and treatment of HRS, and reduce its morbidity and mortality.
MATERIALS AND METHODSMaterialsAnimals: One hundred and ninety male SpragueDawley (SD) rats of SPF grade, weighing 220 ± 20 g, were purchased form the Laboratory Animal Center of Academy of Military Medical Sciences Of Chinese PLA (certification number: SCXK20070040). Before the start of experiments, the rats were reared in separated cages.
Drugs and reagents: Dgalactosamine (DGalN), lipopolysaccharide (LPS), and fluorescein isothiocyanate (FITC) labelled inulin (FITCinulin) were purchased from Sigma. Alzet miniosmotic pumps (model 2001) were purchased from Durect. Regenerated cellulose membrane dialysis tubing (MWCO1000) was purchased from Union Carbide Corporation. Rat tumor necrosis factor (TNF)α and endothelin1 (ET1) detection kits were obtained from R&D.
MethodsDoses of D-GalN and LPS for animal modeling: As previously described[1215], 30 male SD rats under ether anesthesia were intravenously injected with 400 mg/kg DGalN and 32 µg/kg LPS in normal saline via the tail vein. Twentyone rats died within 24 h of drug delivery, and the survival rate at 24 h was 30%. Thus, 400 mg/kg and 32 µg/kg were considered toxic doses of DGalN and LPS for modeling, respectively.
Animal groups and treatments: One hundred and forty male SD rats were randomly divided into a normal saline control group (NS group), a DGalN plus LPS group (G/L group), a DGalN group (G group), and an LPS group (L group). Rats in the G/L group, G group and L group were anaesthetized with 0.8% pentobarbital sodium (40 mg/kg, intraperitoneal injection) 1, 3, 6, 9, 16, 12, and 24 h after drug delivery. The dead rats were excluded from the experiment. Except that 10 rats each at 12 and 16 h and 15 rats at 24 h were used in the G/L group, 5 rats were used at other time points in the G/L group and all time points in the other groups. Heart blood samples were taken for biochemical indicator and cytokine measurements. The abdominal cavity was opened, and a tissue sample measuring about 1.0 cm × 0.8 cm × 0.3 cm was taken from the right liver lobe and fixed in 10% formalin, and another tissue sample measuring 1 mm × 1 mm × 1 mm was taken from the renal cortex and fixed in 2.5% glutaraldehyde. The control group was intravenously injected with equal volume of normal saline via the tail vein.
Serum biochemical indicator and cytokine measurements: Blood samples were centrifuged, and
Wang JB et al . Development of a rat model of hepatorenal syndrome
9928 September 14, 2015|Volume 21|Issue 34|WJG|www.wjgnet.com
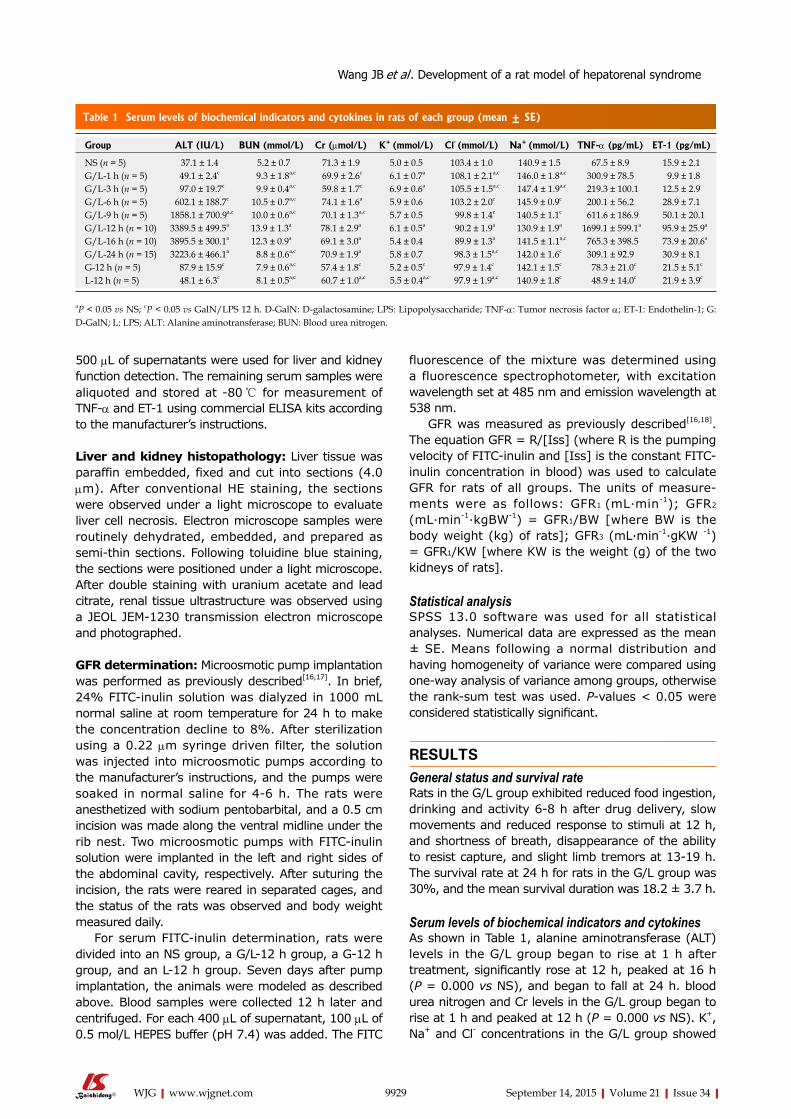
500 µL of supernatants were used for liver and kidney function detection. The remaining serum samples were aliquoted and stored at 80 ℃ for measurement of TNFα and ET1 using commercial ELISA kits according to the manufacturer’s instructions.
Liver and kidney histopathology: Liver tissue was paraffin embedded, fixed and cut into sections (4.0 µm). After conventional HE staining, the sections were observed under a light microscope to evaluate liver cell necrosis. Electron microscope samples were routinely dehydrated, embedded, and prepared as semithin sections. Following toluidine blue staining, the sections were positioned under a light microscope. After double staining with uranium acetate and lead citrate, renal tissue ultrastructure was observed using a JEOL JEM1230 transmission electron microscope and photographed.
GFR determination: Microosmotic pump implantation was performed as previously described[16,17]. In brief, 24% FITCinulin solution was dialyzed in 1000 mL normal saline at room temperature for 24 h to make the concentration decline to 8%. After sterilization using a 0.22 µm syringe driven filter, the solution was injected into microosmotic pumps according to the manufacturer’s instructions, and the pumps were soaked in normal saline for 46 h. The rats were anesthetized with sodium pentobarbital, and a 0.5 cm incision was made along the ventral midline under the rib nest. Two microosmotic pumps with FITCinulin solution were implanted in the left and right sides of the abdominal cavity, respectively. After suturing the incision, the rats were reared in separated cages, and the status of the rats was observed and body weight measured daily.
For serum FITCinulin determination, rats were divided into an NS group, a G/L12 h group, a G12 h group, and an L12 h group. Seven days after pump implantation, the animals were modeled as described above. Blood samples were collected 12 h later and centrifuged. For each 400 µL of supernatant, 100 µL of 0.5 mol/L HEPES buffer (pH 7.4) was added. The FITC
fluorescence of the mixture was determined using a fluorescence spectrophotometer, with excitation wavelength set at 485 nm and emission wavelength at 538 nm.
GFR was measured as previously described[16,18]. The equation GFR = R/[Iss] (where R is the pumping velocity of FITCinulin and [Iss] is the constant FITCinulin concentration in blood) was used to calculate GFR for rats of all groups. The units of measurements were as follows: GFR1 (mL·min1); GFR2 (mL·min1·kgBW1) = GFR1/BW [where BW is the body weight (kg) of rats]; GFR3 (mL·min1·gKW 1) = GFR1/KW [where KW is the weight (g) of the two kidneys of rats].
Statistical analysis SPSS 13.0 software was used for all statistical analyses. Numerical data are expressed as the mean ± SE. Means following a normal distribution and having homogeneity of variance were compared using oneway analysis of variance among groups, otherwise the ranksum test was used. Pvalues < 0.05 were considered statistically significant.
RESULTSGeneral status and survival rateRats in the G/L group exhibited reduced food ingestion, drinking and activity 68 h after drug delivery, slow movements and reduced response to stimuli at 12 h, and shortness of breath, disappearance of the ability to resist capture, and slight limb tremors at 1319 h. The survival rate at 24 h for rats in the G/L group was 30%, and the mean survival duration was 18.2 ± 3.7 h.
Serum levels of biochemical indicators and cytokinesAs shown in Table 1, alanine aminotransferase (ALT) levels in the G/L group began to rise at 1 h after treatment, significantly rose at 12 h, peaked at 16 h (P = 0.000 vs NS), and began to fall at 24 h. blood urea nitrogen and Cr levels in the G/L group began to rise at 1 h and peaked at 12 h (P = 0.000 vs NS). K+, Na+ and Cl concentrations in the G/L group showed
9929 September 14, 2015|Volume 21|Issue 34|WJG|www.wjgnet.com
Table 1 Serum levels of biochemical indicators and cytokines in rats of each group (mean ± SE)
Group ALT (IU/L) BUN (mmol/L) Cr (µmol/L) K+ (mmol/L) Cl- (mmol/L) Na+ (mmol/L) TNF-α (pg/mL) ET-1 (pg/mL)
NS (n = 5) 37.1 ± 1.4 5.2 ± 0.7 71.3 ± 1.9 5.0 ± 0.5 103.4 ± 1.0 140.9 ± 1.5 67.5 ± 8.9 15.9 ± 2.1G/L-1 h (n = 5) 49.1 ± 2.4c 9.3 ± 1.8a,c 69.9 ± 2.6c 6.1 ± 0.7a 108.1 ± 2.1a,c 146.0 ± 1.8a,c 300.9 ± 78.5 9.9 ± 1.8G/L-3 h (n = 5) 97.0 ± 19.7c 9.9 ± 0.4a,c 59.8 ± 1.7c 6.9 ± 0.6a 105.5 ± 1.5a,c 147.4 ± 1.9a,c 219.3 ± 100.1 12.5 ± 2.9G/L-6 h (n = 5) 602.1 ± 188.7c 10.5 ± 0.7a,c 74.1 ± 1.6a 5.9 ± 0.6 103.2 ± 2.0c 145.9 ± 0.9c 200.1 ± 56.2 28.9 ± 7.1G/L-9 h (n = 5) 1858.1 ± 700.9a,c 10.0 ± 0.6a,c 70.1 ± 1.3a,c 5.7 ± 0.5 99.8 ± 1.4c 140.5 ± 1.1c 611.6 ± 186.9 50.1 ± 20.1G/L-12 h (n = 10) 3389.5 ± 499.5a 13.9 ± 1.3a 78.1 ± 2.9a 6.1 ± 0.5a 90.2 ± 1.9a 130.9 ± 1.9a 1699.1 ± 599.1a 95.9 ± 25.9a
G/L-16 h (n = 10) 3895.5 ± 300.1a 12.3 ± 0.9a 69.1 ± 3.0a 5.4 ± 0.4 89.9 ± 1.3a 141.5 ± 1.1a,c 765.3 ± 398.5 73.9 ± 20.6a
G/L-24 h (n = 15) 3223.6 ± 466.1a 8.8 ± 0.6a,c 70.9 ± 1.9a 5.8 ± 0.7 98.3 ± 1.5a,c 142.0 ± 1.6c 309.1 ± 92.9 30.9 ± 8.1G-12 h (n = 5) 87.9 ± 15.9c 7.9 ± 0.6a,c 57.4 ± 1.8c 5.2 ± 0.5c 97.9 ± 1.4c 142.1 ± 1.5c 78.3 ± 21.0c 21.5 ± 5.1c
L-12 h (n = 5) 48.1 ± 6.3c 8.1 ± 0.5a,c 60.7 ± 1.0a,c 5.5 ± 0.4a,c 97.9 ± 1.9a,c 140.9 ± 1.8c 48.9 ± 14.0c 21.9 ± 3.9c
aP < 0.05 vs NS; cP < 0.05 vs GalN/LPS 12 h. D-GalN: D-galactosamine; LPS: Lipopolysaccharide; TNF-α: Tumor necrosis factor α; ET-1: Endothelin-1; G: D-GalN; L: LPS; ALT: Alanine aminotransferase; BUN: Blood urea nitrogen.
Wang JB et al . Development of a rat model of hepatorenal syndrome
the mechanisms of development and progression of HRS and use of multitargeted combination treatment are of great importance for reducing the morbidity and mortality of HRS. The development of an animal model with good stability and reproducibility is the basis for these studies, and for this reason, we sought to develop a rat model of HRS in this study.
LPS is a toxic component of the Gramnegative (G) bacterial cell wall, and DGalN[20,21] can increase the sensitivity of liver cells to LPS[8,9] and induce liver cell apoptosis. Therefore, in the presence of low dose LPS, DGalN can cause liver cell necrosis and result in FHF[2224] as well as abnormally elevated serum TNFα. TNFα is therefore considered to be a trigger of the cascade of inflammatory mediators and be closed related to the pathophysiology of FHF[2527]. In the present study, after rats were treated with DGalN plus LPS, liver and kidney damage was most significant at 12 h after treatment and ALT was as high as 30004000 IU/L. Renal damage was parallel to the liver damage. Of note, potassium concentration showed an obvious rise at 3 h after treatment, which may be due to the renal tubular ion exchange dysfunction in early renal damage.
HRS is characterized by a progressive decline in GFR[28]. Therefore, GFR is an important index for judging whether an HRS model is developed successfully or not. Clearance of inulin is the gold standard for GFR estimation, and labelling of inulin with FITC allows for detection of trace amounts of inulin and significantly improves the detection sensitivity. In previous studies, FITCinulin has been used successfully to determine GFR in rats under anesthesia[29,30]. There are two main types of GFR detection: (1) determination of urinary excretion rate of inulin[31]; and (2) determination of inulin clearance rate based on plasma clearance kinetics[32,33]. The present study adopted the urinary excretion rate method (without need of urine collection) to determine GFR as previously described by Qi et al[16] This method requires the implantation of two microosmotic pumps (Alzet microosmotic pump is an onetime sterile pump with a volume of 200 ± 8 µL, a pumping velocity of 1 µL/h, and a service life of 7 d) in the abdominal cavity of rats, and they can continuously to pump FITCinulin solution into the abdominal cavity, where it can enter into the bloodstream via peritoneal absorption. On day 7 after pump implantation when blood concentrations of inulin were stable, FITC fluorescence was measured to calculate GFR using the formula GFR = R/GFR (Iss) to ensure the accuracy of results.
GFR reported in previous studies varied greatly, and the present study calculated three different forms of GFR, to exclude the possible influence of body weight and kidney weight on GFR. GFR is a kinetic parameter that changes along with the change of physiological factors. The GFR for rats in the waking state was only 60% of the GFR for the same group of rats
obvious abnormalities at 12 h. Serum TNFα and ET1 levels peaked at 12 h in the G/L group (P = 0.003, 0.000 vs NS).
Gross morphological changes in the liverGrossly, the liver of rats in the NS control group had a normal morphology. The surface of the liver was fine granular, the liver had a ruddy color, and the texture was slightly tough. For rats in the G/L group, scattered bleeding spots were visible on the liver surface at 6 h; the liver was congested, showed a deep red color and had more bleeding spots at 9 h; at 16, 12, and 24 h, the liver showed a deep purple color, and had significant congestion, swelling, and diffused bleeding spots, and the section plane of the liver showed dark red congestion or overflow of yellow chylous necrotic fluid.
Histopathological changes of the liver and kidneyFor rats in the NS group, hepatocytes were arranged in chords under a light microscope, cell nuclei were clearly visible, cell membrane was intact, and the portal area and central veins were normal. For the G/L group, hepatocytes around the central veins showed focal necrosis and cell nuclei disappeared at 6 h; focal hepatocyte necrosis around the central veins became more significant and was fused together, and cell nuclei dissolved and disappeared at 9 h; at 12 h, hepatocytes showed massive necrosis, cords disappeared, fibrous septa collapsed, and there were no degenerated hepatocytes but there was massive red blood cell infiltration; at 16 and 24 h, massive hemorrhagic hepatic necrosis was visible (Figures 1 and 2).
Glomerular basement membrane was intact, and the pedicles of podocytes could be clearly seen. The base of cuboidal epithelial cells of the proximal and distal tubules showed plasma membrane infolds, in which mitochondria with intact cristae were visible. The microvilli on the luminal surface of proximal tubules were long and thick, while those on the luminal surface of distal tubules were short and sparse (Figure 3).
GFR for rats in the NS, G/L-12 h, G-12 h and L-12 h groupsGFR1, GFR2 and GFR3 in the G/L group decreased most significantly compared with the NS group (P < 0.05), suggesting that GFR decreased significantly in HRS. GFR in the G/L group also differed significantly from those in the G and L groups (P < 0.05), which excluded the possible effect of DGalN and LPS on GFR (Figure 4AC).
DISCUSSIONThe pathogenesis of HRS associated with fulminant hepatic failure (FHF) is complex and remains unclear[19]. Because of the lack of effective treatments, the mortality of HRS is high. Therefore, understanding
9930 September 14, 2015|Volume 21|Issue 34|WJG|www.wjgnet.com
Wang JB et al . Development of a rat model of hepatorenal syndrome
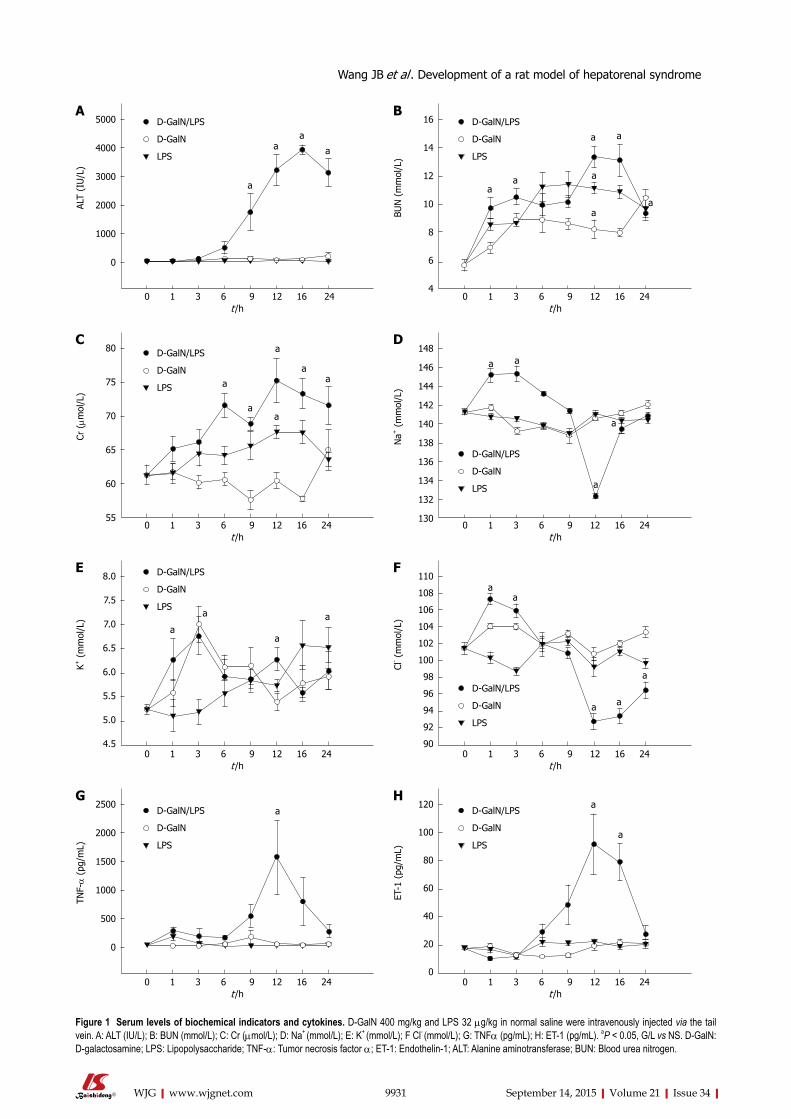
9931 September 14, 2015|Volume 21|Issue 34|WJG|www.wjgnet.com
Figure 1 Serum levels of biochemical indicators and cytokines. D-GalN 400 mg/kg and LPS 32 µg/kg in normal saline were intravenously injected via the tail vein. A: ALT (IU/L); B: BUN (mmol/L); C: Cr (µmol/L); D: Na+ (mmol/L); E: K+ (mmol/L); F Cl- (mmol/L); G: TNFα (pg/mL); H: ET-1 (pg/mL). aP < 0.05, G/L vs NS. D-GalN: D-galactosamine; LPS: Lipopolysaccharide; TNF-α: Tumor necrosis factor α; ET-1: Endothelin-1; ALT: Alanine aminotransferase; BUN: Blood urea nitrogen.
a
aa
a
5000
4000
3000
2000
1000
0
ALT
(IU
/L)
8.0
7.5
7.0
6.5
6.0
5.5
5.0
4.5
K+ (
mm
ol/L
)
a
aa
a
16
14
12
10
8
6
4
BUN
(m
mol
/L)
aa
a
a
a
aa
110
108
106
104
102
100
98
96
94
92
90
Cl- (
mm
ol/L
)
aa
a a
a
2500
2000
1500
1000
500
0
TNF-α
(pg
/mL)
a
80
75
70
65
60
55
Cr (µm
ol/L
)
a
aa
a
aa
0 1 3 6 9 12 16 24 t /h
0 1 3 6 9 12 16 24 t /h
0 1 3 6 9 12 16 24 t /h
0 1 3 6 9 12 16 24 t /h
0 1 3 6 9 12 16 24 t /h
0 1 3 6 9 12 16 24 t /h
148
146
144
142
140
138
136
134
132
130
Na+
(m
mol
/L)
a a
a
a
0 1 3 6 9 12 16 24 t /h
DC
BA
FE
120
100
80
60
40
20
0
ET-1
(pg
/mL)
a
a
0 1 3 6 9 12 16 24 t /h
HG
Wang JB et al . Development of a rat model of hepatorenal syndrome
D-GalN/LPS
D-GalN
LPS
D-GalN/LPS
D-GalN
LPS
D-GalN/LPS
D-GalN
LPS
D-GalN/LPS
D-GalN
LPS
D-GalN/LPS
D-GalN
LPS
D-GalN/LPS
D-GalN
LPS
D-GalN/LPS
D-GalN
LPS
D-GalN/LPS
D-GalN
LPS
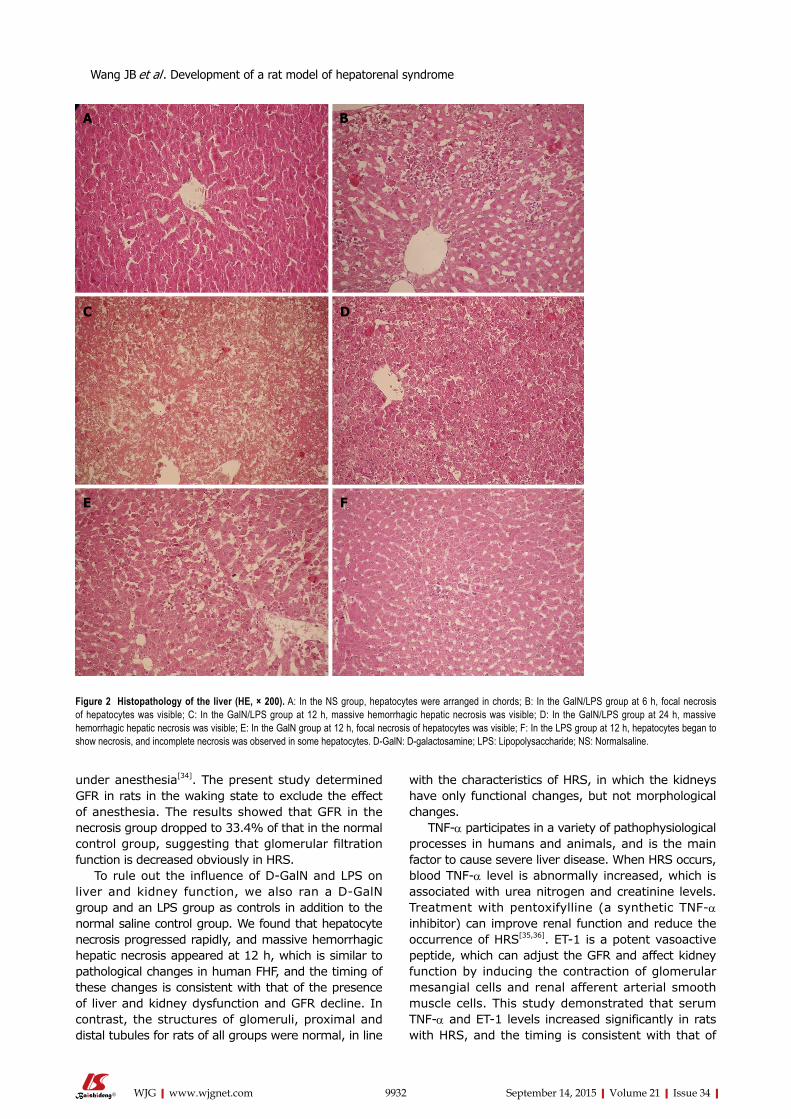
under anesthesia[34]. The present study determined GFR in rats in the waking state to exclude the effect of anesthesia. The results showed that GFR in the necrosis group dropped to 33.4% of that in the normal control group, suggesting that glomerular filtration function is decreased obviously in HRS.
To rule out the influence of DGalN and LPS on liver and kidney function, we also ran a DGalN group and an LPS group as controls in addition to the normal saline control group. We found that hepatocyte necrosis progressed rapidly, and massive hemorrhagic hepatic necrosis appeared at 12 h, which is similar to pathological changes in human FHF, and the timing of these changes is consistent with that of the presence of liver and kidney dysfunction and GFR decline. In contrast, the structures of glomeruli, proximal and distal tubules for rats of all groups were normal, in line
with the characteristics of HRS, in which the kidneys have only functional changes, but not morphological changes.
TNFα participates in a variety of pathophysiological processes in humans and animals, and is the main factor to cause severe liver disease. When HRS occurs, blood TNFα level is abnormally increased, which is associated with urea nitrogen and creatinine levels. Treatment with pentoxifylline (a synthetic TNFα inhibitor) can improve renal function and reduce the occurrence of HRS[35,36]. ET1 is a potent vasoactive peptide, which can adjust the GFR and affect kidney function by inducing the contraction of glomerular mesangial cells and renal afferent arterial smooth muscle cells. This study demonstrated that serum TNFα and ET1 levels increased significantly in rats with HRS, and the timing is consistent with that of
9932 September 14, 2015|Volume 21|Issue 34|WJG|www.wjgnet.com
Figure 2 Histopathology of the liver (HE, × 200). A: In the NS group, hepatocytes were arranged in chords; B: In the GalN/LPS group at 6 h, focal necrosis of hepatocytes was visible; C: In the GalN/LPS group at 12 h, massive hemorrhagic hepatic necrosis was visible; D: In the GalN/LPS group at 24 h, massive hemorrhagic hepatic necrosis was visible; E: In the GalN group at 12 h, focal necrosis of hepatocytes was visible; F: In the LPS group at 12 h, hepatocytes began to show necrosis, and incomplete necrosis was observed in some hepatocytes. D-GalN: D-galactosamine; LPS: Lipopolysaccharide; NS: Normalsaline.
DC
BA
FE
Wang JB et al . Development of a rat model of hepatorenal syndrome
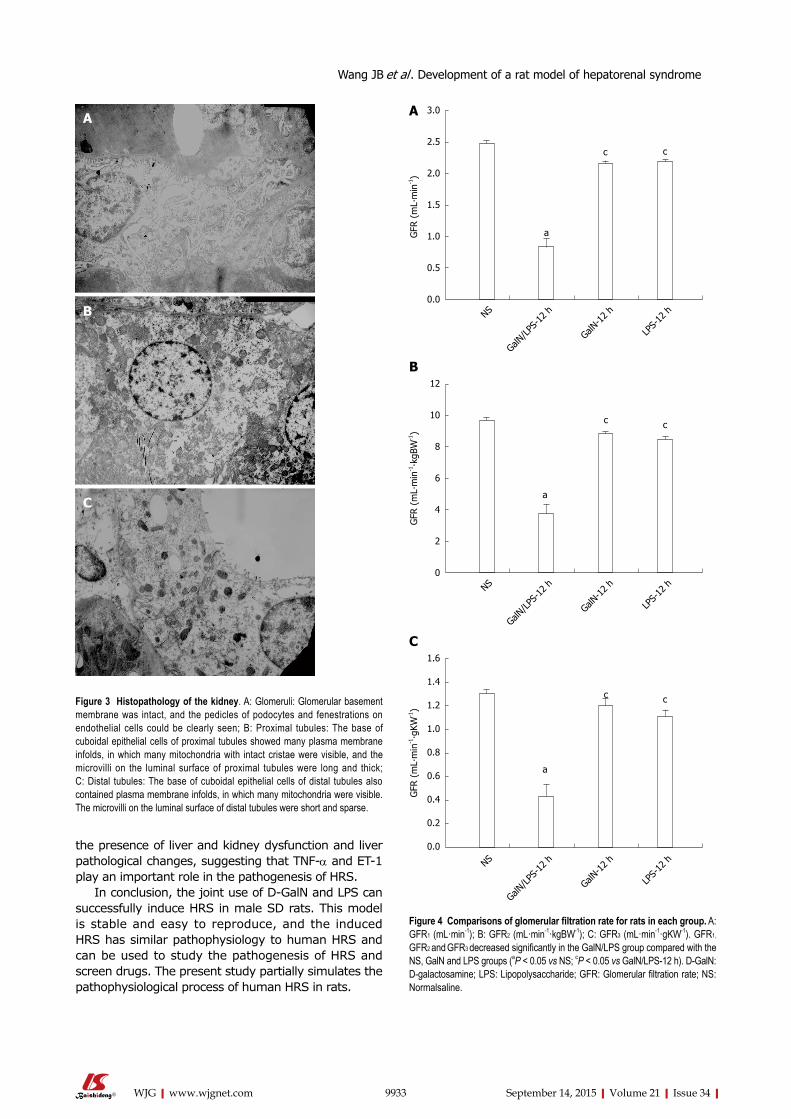
the presence of liver and kidney dysfunction and liver pathological changes, suggesting that TNFα and ET1 play an important role in the pathogenesis of HRS.
In conclusion, the joint use of DGalN and LPS can successfully induce HRS in male SD rats. This model is stable and easy to reproduce, and the induced HRS has similar pathophysiology to human HRS and can be used to study the pathogenesis of HRS and screen drugs. The present study partially simulates the pathophysiological process of human HRS in rats.
9933 September 14, 2015|Volume 21|Issue 34|WJG|www.wjgnet.com
Figure 3 Histopathology of the kidney. A: Glomeruli: Glomerular basement membrane was intact, and the pedicles of podocytes and fenestrations on endothelial cells could be clearly seen; B: Proximal tubules: The base of cuboidal epithelial cells of proximal tubules showed many plasma membrane infolds, in which many mitochondria with intact cristae were visible, and the microvilli on the luminal surface of proximal tubules were long and thick; C: Distal tubules: The base of cuboidal epithelial cells of distal tubules also contained plasma membrane infolds, in which many mitochondria were visible. The microvilli on the luminal surface of distal tubules were short and sparse.
Figure 4 Comparisons of glomerular filtration rate for rats in each group. A: GFR1 (mL·min-1); B: GFR2 (mL·min-1·kgBW-1); C: GFR3 (mL·min-1·gKW-1). GFR1,
GFR2 and GFR3 decreased significantly in the GalN/LPS group compared with the NS, GalN and LPS groups (aP < 0.05 vs NS; cP < 0.05 vs GalN/LPS-12 h). D-GalN: D-galactosamine; LPS: Lipopolysaccharide; GFR: Glomerular filtration rate; NS: Normalsaline.
C
B
A3.0
2.5
2.0
1.5
1.0
0.5
0.0
GFR
(m
L∙m
in-1)
a
c c
NS
GalN/LPS
-12 h
GalN-1
2 h
LPS-
12 h
12
10
8
6
4
2
0
GFR
(m
L∙m
in-1∙k
gBW
-1)
a
c c
NS
GalN/LPS
-12 h
GalN-1
2 h
LPS-
12 h
1.6
1.4
1.2
1.0
0.8
0.6
0.4
0.2
0.0
GFR
(m
L∙m
in-1∙g
KW-1)
a
c c
NS
GalN/LPS
-12 h
GalN-1
2 h
LPS-
12 h
C
B
A
Wang JB et al . Development of a rat model of hepatorenal syndrome
COMMENTSBackgroundHepatorenal syndrome (HRS), usually occurs in patients with end-stage liver disease, is a condition consisting of functional renal failure, progressive decline in glomerular filtration rate (GFR), sodium retention, azotemia and oliguria, and functional but not morphological kidney dysfunction. In the presence of liver decompensation, HRS may occur in about 40%-80% of patients. Due to lack of effective therapeutics, the mortality rate of HRS patients may reach 60%-80%. Therefore, an animal model of HRS is urgently needed to investigate the pathogenic mechanism of human HRS, which will provide new targets for clinical treatment.
Research frontiersCurrently, the mechanism of HRS remains unclear. Some studies considered that tumor necrosis factor-alpha is the initiation factor of HRS. It causes high expression of type I IP3R, renal vascular contraction, and decreases in GFR by TNFR1/PC-PLC/PKCΧ signal transduction pathway. There are relevantly few studies focusing on establishment of animal models and determination of GFR by abdominal implantation of miniosmotic pumps is internationally advanced.
Innovations and breakthroughsDetermination of GFR by abdominal implantation of miniosmotic pumps is the main innovative point in this article. In comparison with previous methods, this technique was simple and operable, and there was no need to collect 24-h urine samples. Meanwhile, the determination was performed without anaesthesia, which avoided influences on the renal blood flow and GFR. Therefore, the result was very close to that under normal conditions.
ApplicationsFurther studies on the mechanisms of HRS using our animal model may provide new targets for clinical treatments, so as to achieve early diagnosis and multiple target inventions for HRS and decrease the morbidity and mortality rates.
Peer-reviewThis is a very good study about D-galactosamine/lipopolysaccharide (LPS) induced hepatorenal syndrome. The study is well designed. In this study, the authors developed a practical and reproducible rat model of hepatorenal syndrome for further study of the pathophysiology of human hepatorenal syndrome. Rat models were intravenously injected with D-galactosamine and LPS to induce fulminant hepatic failure, and develop a model of hepatorenal syndrome. The results are interesting.
REFERENCES1 Schrier RW, Shchekochikhin D, Ginès P. Renal failure in
cirrhosis: prerenal azotemia, hepatorenal syndrome and acute tubular necrosis. Nephrol Dial Transplant 2012; 27: 2625-2628 [PMID: 22492830 DOI: 10.1093/ndt/gfs067]
2 European Association for the Study of the Liver. EASL clinical practice guidelines on the management of ascites, spontaneous bacterial peritonitis, and hepatorenal syndrome in cirrhosis. J Hepatol 2010; 53: 397-417 [PMID: 20633946 DOI: 10.1016/j.jhep.2010.05.004]
3 Martín-Llahí M, Guevara M, Torre A, Fagundes C, Restuccia T, Gilabert R, Solá E, Pereira G, Marinelli M, Pavesi M, Fernández J, Rodés J, Arroyo V, Ginès P. Prognostic importance of the cause of renal failure in patients with cirrhosis. Gastroenterology 2011; 140: 488-496.e4 [PMID: 20682324 DOI: 10.1053/j.gastro.2010.07.043]
4 Montoliu S, Ballesté B, Planas R, Alvarez MA, Rivera M, Miquel M, Masnou H, Cirera I, Morillas RM, Coll S, Sala M, García-Retortillo M, Cañete N, Solà R. Incidence and prognosis of different types of functional renal failure in cirrhotic patients with ascites. Clin Gastroenterol Hepatol 2010; 8: 616-22; quiz e80 [PMID: 20399905 DOI: 10.1016/j.cgh.2010.03.029]
5 Fagundes C, Ginès P. Hepatorenal syndrome: a severe, but
treatable, cause of kidney failure in cirrhosis. Am J Kidney Dis 2012; 59: 874-885 [PMID: 22480795 DOI: 10.1053/j.ajkd.2011.12.032]
6 Angeli P, Morando F. Optimal management of hepatorenal syndrome in patients with cirrhosis. Hepat Med 2010; 2: 87-98 [PMID: 24367209 DOI: 10.2147/HMER.S6918]
7 Rössle M, Gerbes AL. TIPS for the treatment of refractory ascites, hepatorenal syndrome and hepatic hydrothorax: a critical update. Gut 2010; 59: 988-1000 [PMID: 20581246 DOI: 10.1136/gut.2009.193227]
8 Caraceni P, Santi L, Mirici F, Montanari G, Bevilacqua V, Pinna AD, Bernardi M. Long-term treatment of hepatorenal syndrome as a bridge to liver transplantation. Dig Liver Dis 2011; 43: 242-245 [PMID: 20833118 DOI: 10.1016/j.dld.2010.08.001]
9 Gonwa TA, Wadei HM. The challenges of providing renal replacement therapy in decompensated liver cirrhosis. Blood Purif 2012; 33: 144-148 [PMID: 22269395 DOI: 10.1159/000334149]
10 Nadim MK, Kellum JA, Davenport A, Wong F, Davis C, Pannu N, Tolwani A, Bellomo R, Genyk YS. Hepatorenal syndrome: the 8th International Consensus Conference of the Acute Dialysis Quality Initiative (ADQI) Group. Crit Care 2012; 16: R23 [PMID: 22322077 DOI: 10.1186/cc11188]
11 Lee JP, Kwon HY, Park JI, Yi NJ, Suh KS, Lee HW, Kim M, Oh YK, Lim CS, Kim YS. Clinical outcomes of patients with hepatorenal syndrome after living donor liver transplantation. Liver Transpl 2012; 18: 1237-1244 [PMID: 22714872 DOI: 10.1002/lt.23493]
12 Saracyn M, Wesołowski P, Nowak Z, Patera J, Kozłowski W, Wańkowicz Z. [Role of nitric oxide system in pathogenesis of experimental model of hepatorenal syndrome]. Pol Merkur Lekarski 2008; 24: 293-297 [PMID: 18634358]
13 Hijikawa T, Kaibori M, Uchida Y, Yamada M, Matsui K, Ozaki T, Kamiyama Y, Nishizawa M, Okumura T. Insulin-like growth factor 1 prevents liver injury through the inhibition of TNF-alpha and iNOS induction in D-galactosamine and LPS-treated rats. Shock 2008; 29: 740-747 [PMID: 18004231]
14 Tanaka H, Uchida Y, Kaibori M, Hijikawa T, Ishizaki M, Yamada M, Matsui K, Ozaki T, Tokuhara K, Kamiyama Y, Nishizawa M, Ito S, Okumura T. Na+/H+ exchanger inhibitor, FR183998, has protective effect in lethal acute liver failure and prevents iNOS induction in rats. J Hepatol 2008; 48: 289-299 [PMID: 18096265 DOI: 10.1016/j.jhep.2007.09.017]
15 Uchida Y, Kaibori M, Hijikawa T, Ishizaki M, Ozaki T, Tanaka H, Matsui K, Tokuhara K, Kwon AH, Kamiyama Y, Okumura T. Protective effect of neutrophil elastase inhibitor (FR136706) in lethal acute liver failure induced by D-galactosamine and lipopolysaccharide in rats. J Surg Res 2008; 145: 57-65 [PMID: 17936791 DOI: 10.1016/j.jss.2007.04.001]
16 Qi Z, Whitt I, Mehta A, Jin J, Zhao M, Harris RC, Fogo AB, Breyer MD. Serial determination of glomerular filtration rate in conscious mice using FITC-inulin clearance. Am J Physiol Renal Physiol 2004; 286: F590-F596 [PMID: 14600035 DOI: 10.1152/ajprenal.00324.2003]
17 Wang E, Sandoval RM, Campos SB, Molitoris BA. Rapid diagnosis and quantification of acute kidney injury using fluorescent ratio-metric determination of glomerular filtration rate in the rat. Am J Physiol Renal Physiol 2010; 299: F1048-F1055 [PMID: 20685826 DOI: 10.1152/ajprenal.00691.2009]
18 Soveri I, Berg UB, Björk J, Elinder CG, Grubb A, Mejare I, Sterner G, Bäck SE. Measuring GFR: a systematic review. Am J Kidney Dis 2014; 64: 411-424 [PMID: 24840668 DOI: 10.1053/j.ajkd.2014.04.010]
19 Hartleb M, Gutkowski K. Kidneys in chronic liver diseases. World J Gastroenterol 2012; 18: 3035-3049 [PMID: 22791939 DOI: 10.3748/wjg.v18.i24.3035]
20 Kim SJ , Kim JK, Lee DU, Kwak JH, Lee SM. Genipin protects lipopolysaccharide-induced apoptotic liver damage in D-galactosamine-sensitized mice. Eur J Pharmacol 2010; 635: 188-193 [PMID: 20303938 DOI: 10.1016/j.ejphar.2010.03.007]
21 Wang LK, Wang LW, Li X, Han XQ, Gong ZJ. Ethyl pyruvate prevents inflammatory factors release and decreases intestinal
9934 September 14, 2015|Volume 21|Issue 34|WJG|www.wjgnet.com
COMMENTS
Wang JB et al . Development of a rat model of hepatorenal syndrome
permeability in rats with D-galactosamine-induced acute liver failure. Hepatobiliary Pancreat Dis Int 2013; 12: 180-188 [PMID: 23558073 DOI: 10.1016/S1499-3872(13)60029-6]
22 Jambekar AA, Palma E, Nicolosi L, Rasola A, Petronilli V, Chiara F, Bernardi P, Needleman R, Brusilow WS. A glutamine synthetase inhibitor increases survival and decreases cytokine response in a mouse model of acute liver failure. Liver Int 2011; 31: 1209-1221 [PMID: 21745296 DOI: 10.1111/j.1478-3231.2011.02553.x]
23 Wright G, Soper R, Brooks HF, Stadlbauer V, Vairappan B, Davies NA, Andreola F, Hodges S, Moss RF, Davies DC, Jalan R. Role of aquaporin-4 in the development of brain oedema in liver failure. J Hepatol 2010; 53: 91-97 [PMID: 20451280 DOI: 10.1016/j.jhep.2010.02.020]
24 Zeashan H, Amresh G, Singh S, Rao CV. Protective effect of Amaranthus spinosus against D-galactosamine/lipopolysaccharide-induced hepatic failure. Pharm Biol 2010; 48: 1157-1163 [PMID: 20860438 DOI: 10.3109/13880200903168023]
25 Ghabril M, Bonkovsky HL, Kum C, Davern T, Hayashi PH, Kleiner DE, Serrano J, Rochon J, Fontana RJ, Bonacini M. Liver injury from tumor necrosis factor-α antagonists: analysis of thirty-four cases. Clin Gastroenterol Hepatol 2013; 11: 558-564.e3 [PMID: 23333219 DOI: 10.1016/j.cgh.2012.12.025]
26 Arshad MI, Piquet-Pellorce C, L’Helgoualc’h A, Rauch M, Patrat-Delon S, Ezan F, Lucas-Clerc C, Nabti S, Lehuen A, Cubero FJ, Girard JP, Trautwein C, Samson M. TRAIL but not FasL and TNFα, regulates IL-33 expression in murine hepatocytes during acute hepatitis. Hepatology 2012; 56: 2353-2362 [PMID: 22961755 DOI: 10.1002/hep.25893]
27 Lu J, Jones AD, Harkema JR, Roth RA, Ganey PE. Amiodarone exposure during modest inflammation induces idiosyncrasy-like liver injury in rats: role of tumor necrosis factor-alpha. Toxicol Sci 2012; 125: 126-133 [PMID: 21984482 DOI: 10.1093/toxsci/kfr266]
28 Deshpande P, Rausa K, Turner J, Johnson M, Golestaneh L. Acute kidney injury as a causal factor in mortality associated with hepatorenal syndrome. Hepatol Int 2011; 5: 751-758 [PMID:
21484115 DOI: 10.1007/s12072-011-9269-8]29 Brooks HL, Sorensen AM, Terris J, Schultheis PJ, Lorenz JN,
Shull GE, Knepper MA. Profiling of renal tubule Na+ transporter abundances in NHE3 and NCC null mice using targeted proteomics. J Physiol 2001; 530: 359-366 [PMID: 11158268 DOI: 10.1111/j.1469-7793.2001.0359k.x]
30 Takahashi N, Boysen G, Li F, Li Y, Swenberg JA. Tandem mass spectrometry measurements of creatinine in mouse plasma and urine for determining glomerular filtration rate. Kidney Int 2007; 71: 266-271 [PMID: 17149371 DOI: 10.1038/sj.ki.5002033]
31 Kasiske BL, Keane WF. Laboratory Assessment of Renal Disease: Clearance, Urinalysis, and Renal Biopsy. Philadelphia, PA: Saunders, 1996
32 Poola NR, Bhuiyan D, Ortiz S, Savant IA, Sidhom M, Taft DR, Kirschenbaum H, Kalis M. A novel HPLC assay for pentamidine: comparative effects of creatinine and inulin on GFR estimation and pentamidine renal excretion in the isolated perfused rat kidney. J Pharm Pharm Sci 2002; 5: 135-145 [PMID: 12207866]
33 Horio M, Imai E, Yasuda Y, Hishida A, Matsuo S. Simple sampling strategy for measuring inulin renal clearance. Clin Exp Nephrol 2009; 13: 50-54 [PMID: 18827963 DOI: 10.1007/s10157-008-0084-z]
34 Ahloulay M, Déchaux M, Laborde K, Bankir L. Influence of glucagon on GFR and on urea and electrolyte excretion: direct and indirect effects. Am J Physiol 1995; 269: F225-F235 [PMID: 7653596]
35 Garcia FA, Pinto SF, Cavalcante AF, Lucetti LT, Menezes SM, Felipe CF, Alves AP, Brito GA, Cerqueira GS, Viana GS. Pentoxifylline decreases glycemia levels and TNF-alpha, iNOS and COX-2 expressions in diabetic rat pancreas. Springerplus 2014; 3: 283 [PMID: 24991532 DOI: 10.1186/2193-1801-3-283]
36 Martino RB, Coelho AM, Kubrusly MS, Leitão R, Sampietre SN, Machado MC, Bacchella T, D’Albuquerque LA. Pentoxifylline improves liver regeneration through down-regulation of TNF-α synthesis and TGF-β1 gene expression. World J Gastrointest Surg 2012; 4: 146-151 [PMID: 22816029 DOI: 10.4240/wjgs.v4.i6.146]
P- Reviewer: Park J, Voigt M S- Editor: Ma YJ L- Editor: Wang TQ E- Editor: Zhang DN
9935 September 14, 2015|Volume 21|Issue 34|WJG|www.wjgnet.com
Wang JB et al . Development of a rat model of hepatorenal syndrome
Jun-Ping Li, Ting Zhang, Chang-Jun Gao, Zhen-Zhen Kou, Xu-Wen Jiao, Lian-Xiang Zhang, Zhen-Yu Wu, Zhong-Yi He, Yun-Qing Li
Jun-Ping Li, Ting Zhang, Zhen-Zhen Kou, Zhen-Yu Wu, Yun-Qing Li, Department of Anatomy, Histology and Embryology, K.K. Leung Brain Research Centre, The Fourth Military Medical University, Xi’an 710032, Shaanxi Province, China
Jun-Ping Li, Xu-Wen Jiao, Lian-Xiang Zhang, Zhong-Yi He, Department of Anatomy, Histology and Embryology, Ningxia Medical University, Yinchuan 750004, Ningxia Hui Nationality Autonomous Region, China
Chang-Jun Gao, Department of Anesthesiology, Tangdu Hospital, The Fourth Military Medical University, Xi’an 710038, Shaanxi Province, China
Author contributions: Li JP, Zhang T and Gao CJ performed the majority of experiments and analyzed the data; Kou ZZ and Wu ZY participated in tissue preparation and whole-mount preparations; Jiao XW and Zhang LX performed immunofluorescence histochemical double-staining and cell quantification; He ZY and Li YQ designed and coordinated the research; Li JP wrote the paper.
Supported by Grants from the National Natural Science Foundation of China, No. 30971123 and No. 81371239.
Institutional review board statement: The study was reviewed and approved by the Fourth Military Medical University Institutional Review Board (Xi’an, China).
Institutional animal care and use committee statement: All procedures involving animals were reviewed and approved by the Institutional Animal Care and Use Committee of the Fourth Military Medical University (Xi’an, China).
Animal care and use statement: The animal protocol was designed to minimize pain or discomfort to the animals. The animals were acclimatized to laboratory conditions (23 ℃, 12 h/12 h light/dark, 50% humidity, ad libitum access to food and water) for two weeks prior to experimentation. All animals were euthanized by barbiturate overdose (intravenous injection, 150 mg/kg pentobarbital sodium) for tissue collection.
Conflict-of-interest statement: The authors declare no
competing financial interests.
Data sharing statement: No additional data are available.
Open-Access: This article is an open-access article which was selected by an in-house editor and fully peer-reviewed by external reviewers. It is distributed in accordance with the Creative Commons Attribution Non Commercial (CC BY-NC 4.0) license, which permits others to distribute, remix, adapt, build upon this work non-commercially, and license their derivative works on different terms, provided the original work is properly cited and the use is non-commercial. See: http://creativecommons.org/licenses/by-nc/4.0/
Correspondence to: Dr. Yun-Qing Li, Department of Anatomy, Histology and Embryology, K.K. Leung Brain Research Centre, The Fourth Military Medical University, No. 169 Changle West Road, Xi’an 710032, Shaanxi Province, China. [email protected]: +86-29-84774501Fax: +86-29-83283229
Received: January 14, 2015Peer-review started: January 15, 2015First decision: March 26, 2015Revised: April 10, 2015Accepted: June 10, 2015Article in press: June 10, 2015Published online: September 14, 2015
AbstractAIM: To investigate the distribution and neurochemical phenotype of endomorphin-2 (EM-2)-containing neurons in the submucosal plexus of the rat colon.
METHODS: The mid-colons between the right and left flexures were removed from rats, and transferred into Kreb’s solution. For whole-mount preparations, the mucosal, outer longitudinal muscle and inner circular
ORIGINAL ARTICLE
Submit a Manuscript: http://www.wjgnet.com/esps/Help Desk: http://www.wjgnet.com/esps/helpdesk.aspxDOI: 10.3748/wjg.v21.i34.9936
World J Gastroenterol 2015 September 14; 21(34): 9936-9944 ISSN 1007-9327 (print) ISSN 2219-2840 (online)
© 2015 Baishideng Publishing Group Inc. All rights reserved.
9936 September 14, 2015|Volume 21|Issue 34|WJG|www.wjgnet.com
Basic Study
Neurochemical features of endomorphin-2-containing neurons in the submucosal plexus of the rat colon
Li JP, Zhang T, Gao CJ, Kou ZZ, Jiao XW, Zhang LX, Wu ZY, He ZY, Li YQ. Neurochemical features of endomorphin-2-containing neurons in the submucosal plexus of the rat colon. World J Gastroenterol 2015; 21(34): 9936-9944 Available from: URL: http://www.wjgnet.com/1007-9327/full/v21/i34/9936.htm DOI: http://dx.doi.org/10.3748/wjg.v21.i34.9936
INTRODUCTIONIt is well known that morphine is a selective exogenous agonist of the μ-opioid receptor (MOR) and is a widely used analgesic drug in the clinic. Unfortunately, morphine can cause gastrointestinal disorders, such as constipation, nausea and emesis, when used for a long period of time[1-4]. To explore the mechanism of the gastrointestinal disorders caused by morphine and endogenous opioid peptides, pharmacological and morphological studies have been performed in the gastrointestinal tract; however, the regulatory mechanisms of morphine and endogenous opioid peptides relating to gastrointestinal activity remain unclear.
The results of many previous studies have shown that there are at least three types of opioid receptors, i.e., MORs, δ-opioid receptors (DORs) and κ-opioid receptors (KORs), and the endogenous ligands of these receptors, including endomorphin (EM), enkephalin and dynorphin, are widely distributed in the gastrointestinal tract[5-8]. In the gastrointestinal tract, MOR immunoreactivity is the most abundant compared to other opioid receptors, particularly in the colon[1,9,10]. After the MOR was knocked out in the mouse, the effects of both MOR agonists and DOR or KOR agonists on gastrointestinal disorders nearly disappeared[11]. Endomorphin-1 (EM-1) and endomorphin-2 (EM-2), two endogenous ligands for the MOR, selectively bind to the MOR with high affinity[12]. The distribution of EM-immunoreactive (IR) structures is generally similar to that of the MOR[13] in the nervous system, including the myenteric plexus[14], but not the submucosal plexus[14,15] of the enteric nervous system (ENS). Exploring the distribution and chemical nature of the EM-IR structures in the submucosal plexus is fundamental to clarifying the regulatory mechanisms of morphine and opioid peptides. In our previous study, we reported that only EM-2-containing neurons, but not EM-1-IR neurons, were present in the submucosal plexus of the rat colon. Therefore, we examined the distribution patterns and neurochemical phenotypes of submucosal EM-2-containing neurons in the rat colon with immunofluorescence histochemical staining of whole-mount preparations of the rat mid-colon.
MATERIALS AND METHODSExperimental proceduresMale Sprague-Dawley rats, weighing 220-250 g, were
Li JP et al . EM-2-containing neurons in submucosal plexus of rat colon
9937 September 14, 2015|Volume 21|Issue 34|WJG|www.wjgnet.com
muscle layers of the tissues were separated from the submucosal layer attached to the submucosal plexus. The whole-mount preparations from each rat mid-colon were mounted onto seven gelatin-coated glass slides, and processed for immunofluorescence histochemical double-staining of EM-2 with calcitonin gene-related peptide (CGRP), choline acetyltransferase (ChAT), nitric oxide synthetase (NOS), neuron-specific enolase (NSE), substance P (SP) and vasoactive intestinal peptide (VIP). After staining, all the fluorescence-labeled sections were observed with a confocal laser scanning microscope. To estimate the extent of the co-localization of EM-2 with CGRP, ChAT, NOS, NSE, SP and VIP, ganglia, which have a clear boundary and neuronal cell outline, were randomly selected from each specimen for this analysis.
RESULTS: In the submucosal plexus of the mid-colon, many EM-2-immunoreactive (IR) and NSE-IR neuronal cell bodies were found in the submucosal plexus of the rat mid-colon. Approximately 6 ± 4.2 EM-2-IR neurons aggregated within each ganglion and a few EM-2-IR neurons were also found outside the ganglia. The EM-2-IR neurons were also immunopositive for ChAT, SP, VIP or NOS. EM-2-IR nerve fibers coursed near ChAT-IR neurons, and some of these fibers were even distributed around ChAT-IR neuronal cell bodies. Some EM-2-IR neuronal cell bodies were surrounded by SP-IR nerve fibers, but many long processes connecting adjacent ganglia were negative for EM-2 immunostaining. Long VIP-IR processes with many branches coursed through the ganglia and surrounded the EM-2-IR neurons. The percentages of the EM-2-IR neurons that were also positive for ChAT, SP, VIP or NOS were approximately 91% ± 2.6%, 36% ± 2.4%, 44% ± 2.5% and 44% ± 4.7%, respectively, but EM-2 did not co-localize with CGRP.
CONCLUSION: EM-2-IR neurons are present in the submucosal plexus of the rat colon and express distinct neurochemical markers.
Key words: Endomorphin-2; Submucosal plexus; Enteric neuron; Colon; μ-opioid receptor
© The Author(s) 2015. Published by Baishideng Publishing Group Inc. All rights reserved.
Core tip: Previous studies have showed that morphine can cause gastrointestinal disorders via μ-opioid receptor (MOR). However, the regulatory mechanisms of MOR relating to gastrointestinal activity remain unclear. Endomorphin-2 (EM-2) is the endogenous ligand for the MOR. The distribution of EM-immunoreactive (IR) structures is generally similar to that of the MOR in the nervous system, but not the submucosal plexus of the enteric nervous system. This study demonstrates for the first time that EM-2-IR neurons are present in the submucosal plexus of the rat colon, and EM-2 co-localized with several neurochemical makers in distinct populations of submucosal neurons.
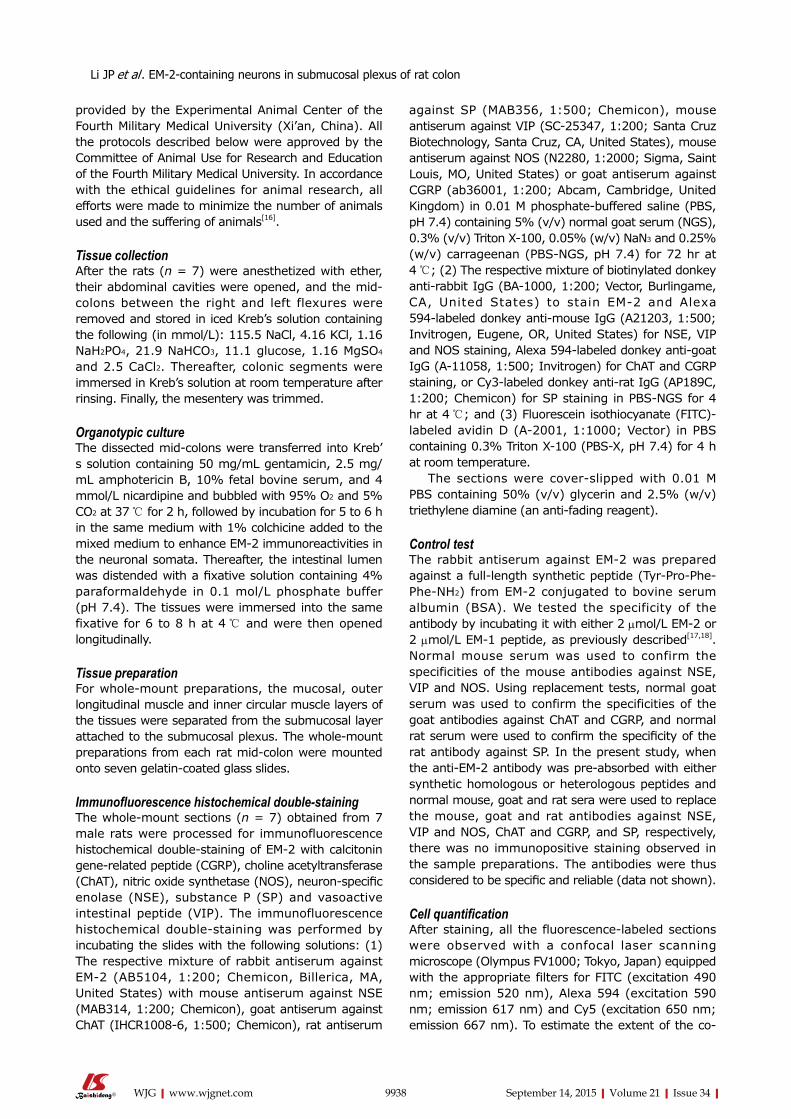
provided by the Experimental Animal Center of the Fourth Military Medical University (Xi’an, China). All the protocols described below were approved by the Committee of Animal Use for Research and Education of the Fourth Military Medical University. In accordance with the ethical guidelines for animal research, all efforts were made to minimize the number of animals used and the suffering of animals[16].
Tissue collectionAfter the rats (n = 7) were anesthetized with ether, their abdominal cavities were opened, and the mid-colons between the right and left flexures were removed and stored in iced Kreb’s solution containing the following (in mmol/L): 115.5 NaCl, 4.16 KCl, 1.16 NaH2PO4, 21.9 NaHCO3, 11.1 glucose, 1.16 MgSO4 and 2.5 CaCl2. Thereafter, colonic segments were immersed in Kreb’s solution at room temperature after rinsing. Finally, the mesentery was trimmed.
Organotypic cultureThe dissected mid-colons were transferred into Kreb’s solution containing 50 mg/mL gentamicin, 2.5 mg/mL amphotericin B, 10% fetal bovine serum, and 4 mmol/L nicardipine and bubbled with 95% O2 and 5% CO2 at 37 ℃ for 2 h, followed by incubation for 5 to 6 h in the same medium with 1% colchicine added to the mixed medium to enhance EM-2 immunoreactivities in the neuronal somata. Thereafter, the intestinal lumen was distended with a fixative solution containing 4% paraformaldehyde in 0.1 mol/L phosphate buffer (pH 7.4). The tissues were immersed into the same fixative for 6 to 8 h at 4 ℃ and were then opened longitudinally.
Tissue preparation For whole-mount preparations, the mucosal, outer longitudinal muscle and inner circular muscle layers of the tissues were separated from the submucosal layer attached to the submucosal plexus. The whole-mount preparations from each rat mid-colon were mounted onto seven gelatin-coated glass slides.
Immunofluorescence histochemical double-staining The whole-mount sections (n = 7) obtained from 7 male rats were processed for immunofluorescence histochemical double-staining of EM-2 with calcitonin gene-related peptide (CGRP), choline acetyltransferase (ChAT), nitric oxide synthetase (NOS), neuron-specific enolase (NSE), substance P (SP) and vasoactive intestinal peptide (VIP). The immunofluorescence histochemical double-staining was performed by incubating the slides with the following solutions: (1) The respective mixture of rabbit antiserum against EM-2 (AB5104, 1:200; Chemicon, Billerica, MA, United States) with mouse antiserum against NSE (MAB314, 1:200; Chemicon), goat antiserum against ChAT (IHCR1008-6, 1:500; Chemicon), rat antiserum
against SP (MAB356, 1:500; Chemicon), mouse antiserum against VIP (SC-25347, 1:200; Santa Cruz Biotechnology, Santa Cruz, CA, United States), mouse antiserum against NOS (N2280, 1:2000; Sigma, Saint Louis, MO, United States) or goat antiserum against CGRP (ab36001, 1:200; Abcam, Cambridge, United Kingdom) in 0.01 M phosphate-buffered saline (PBS, pH 7.4) containing 5% (v/v) normal goat serum (NGS), 0.3% (v/v) Triton X-100, 0.05% (w/v) NaN3 and 0.25% (w/v) carrageenan (PBS-NGS, pH 7.4) for 72 hr at 4 ℃; (2) The respective mixture of biotinylated donkey anti-rabbit IgG (BA-1000, 1:200; Vector, Burlingame, CA, United States) to stain EM-2 and Alexa 594-labeled donkey anti-mouse IgG (A21203, 1:500; Invitrogen, Eugene, OR, United States) for NSE, VIP and NOS staining, Alexa 594-labeled donkey anti-goat IgG (A-11058, 1:500; Invitrogen) for ChAT and CGRP staining, or Cy3-labeled donkey anti-rat IgG (AP189C, 1:200; Chemicon) for SP staining in PBS-NGS for 4 hr at 4 ℃; and (3) Fluorescein isothiocyanate (FITC)-labeled avidin D (A-2001, 1:1000; Vector) in PBS containing 0.3% Triton X-100 (PBS-X, pH 7.4) for 4 h at room temperature.
The sections were cover-slipped with 0.01 M PBS containing 50% (v/v) glycerin and 2.5% (w/v) triethylene diamine (an anti-fading reagent).
Control test The rabbit antiserum against EM-2 was prepared against a full-length synthetic peptide (Tyr-Pro-Phe-Phe-NH2) from EM-2 conjugated to bovine serum albumin (BSA). We tested the specificity of the antibody by incubating it with either 2 μmol/L EM-2 or 2 μmol/L EM-1 peptide, as previously described[17,18]. Normal mouse serum was used to confirm the specificities of the mouse antibodies against NSE, VIP and NOS. Using replacement tests, normal goat serum was used to confirm the specificities of the goat antibodies against ChAT and CGRP, and normal rat serum were used to confirm the specificity of the rat antibody against SP. In the present study, when the anti-EM-2 antibody was pre-absorbed with either synthetic homologous or heterologous peptides and normal mouse, goat and rat sera were used to replace the mouse, goat and rat antibodies against NSE, VIP and NOS, ChAT and CGRP, and SP, respectively, there was no immunopositive staining observed in the sample preparations. The antibodies were thus considered to be specific and reliable (data not shown).
Cell quantification After staining, all the fluorescence-labeled sections were observed with a confocal laser scanning microscope (Olympus FV1000; Tokyo, Japan) equipped with the appropriate filters for FITC (excitation 490 nm; emission 520 nm), Alexa 594 (excitation 590 nm; emission 617 nm) and Cy5 (excitation 650 nm; emission 667 nm). To estimate the extent of the co-
9938 September 14, 2015|Volume 21|Issue 34|WJG|www.wjgnet.com
Li JP et al . EM-2-containing neurons in submucosal plexus of rat colon
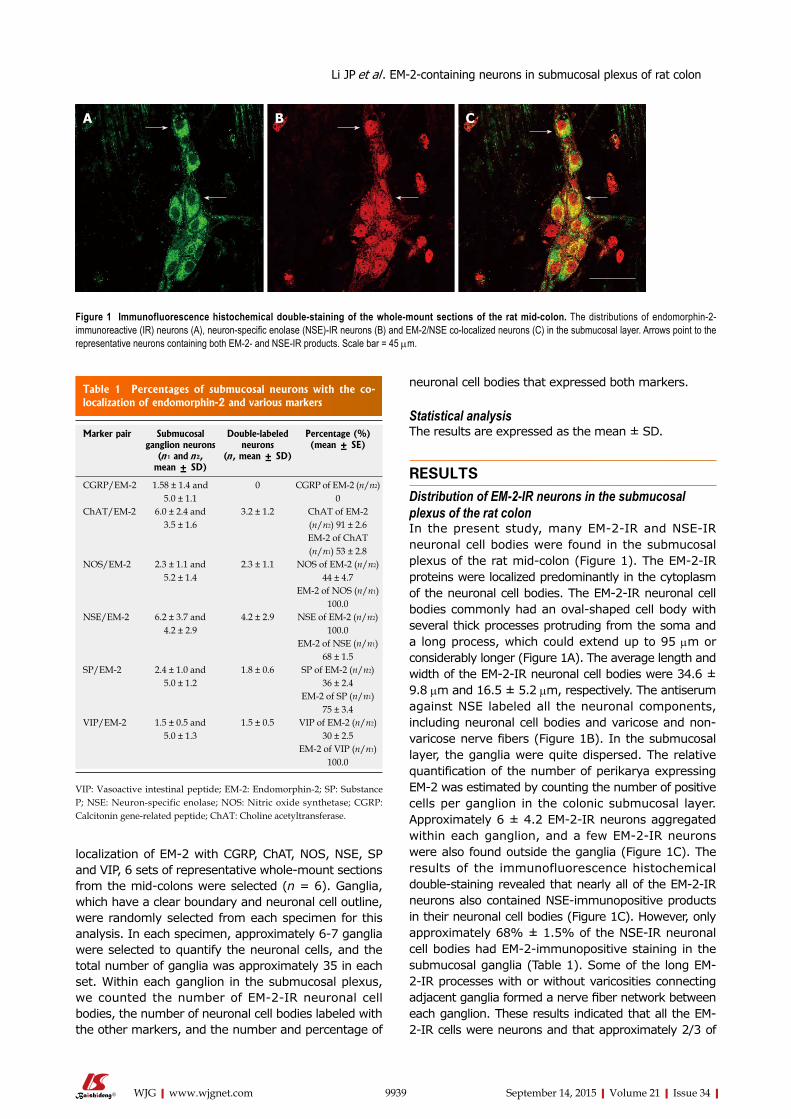
neuronal cell bodies that expressed both markers.
Statistical analysisThe results are expressed as the mean ± SD.
RESULTSDistribution of EM-2-IR neurons in the submucosal plexus of the rat colon In the present study, many EM-2-IR and NSE-IR neuronal cell bodies were found in the submucosal plexus of the rat mid-colon (Figure 1). The EM-2-IR proteins were localized predominantly in the cytoplasm of the neuronal cell bodies. The EM-2-IR neuronal cell bodies commonly had an oval-shaped cell body with several thick processes protruding from the soma and a long process, which could extend up to 95 μm or considerably longer (Figure 1A). The average length and width of the EM-2-IR neuronal cell bodies were 34.6 ± 9.8 μm and 16.5 ± 5.2 μm, respectively. The antiserum against NSE labeled all the neuronal components, including neuronal cell bodies and varicose and non-varicose nerve fibers (Figure 1B). In the submucosal layer, the ganglia were quite dispersed. The relative quantification of the number of perikarya expressing EM-2 was estimated by counting the number of positive cells per ganglion in the colonic submucosal layer. Approximately 6 ± 4.2 EM-2-IR neurons aggregated within each ganglion, and a few EM-2-IR neurons were also found outside the ganglia (Figure 1C). The results of the immunofluorescence histochemical double-staining revealed that nearly all of the EM-2-IR neurons also contained NSE-immunopositive products in their neuronal cell bodies (Figure 1C). However, only approximately 68% ± 1.5% of the NSE-IR neuronal cell bodies had EM-2-immunopositive staining in the submucosal ganglia (Table 1). Some of the long EM-2-IR processes with or without varicosities connecting adjacent ganglia formed a nerve fiber network between each ganglion. These results indicated that all the EM-2-IR cells were neurons and that approximately 2/3 of
localization of EM-2 with CGRP, ChAT, NOS, NSE, SP and VIP, 6 sets of representative whole-mount sections from the mid-colons were selected (n = 6). Ganglia, which have a clear boundary and neuronal cell outline, were randomly selected from each specimen for this analysis. In each specimen, approximately 6-7 ganglia were selected to quantify the neuronal cells, and the total number of ganglia was approximately 35 in each set. Within each ganglion in the submucosal plexus, we counted the number of EM-2-IR neuronal cell bodies, the number of neuronal cell bodies labeled with the other markers, and the number and percentage of
9939 September 14, 2015|Volume 21|Issue 34|WJG|www.wjgnet.com
A B C
Figure 1 Immunofluorescence histochemical double-staining of the whole-mount sections of the rat mid-colon. The distributions of endomorphin-2-immunoreactive (IR) neurons (A), neuron-specific enolase (NSE)-IR neurons (B) and EM-2/NSE co-localized neurons (C) in the submucosal layer. Arrows point to the representative neurons containing both EM-2- and NSE-IR products. Scale bar = 45 μm.
Table 1 Percentages of submucosal neurons with the co-localization of endomorphin-2 and various markers
Marker pair Submucosal ganglion neurons
(n 1 and n 2, mean ± SD)
Double-labeled neurons
(n , mean ± SD)
Percentage (%) (mean ± SE)
CGRP/EM-2 1.58 ± 1.4 and 5.0 ± 1.1
0 CGRP of EM-2 (n/n2) 0
ChAT/EM-2 6.0 ± 2.4 and 3.5 ± 1.6
3.2 ± 1.2 ChAT of EM-2 (n/n2) 91 ± 2.6EM-2 of ChAT (n/n1) 53 ± 2.8
NOS/EM-2 2.3 ± 1.1 and 5.2 ± 1.4
2.3 ± 1.1 NOS of EM-2 (n/n2) 44 ± 4.7
EM-2 of NOS (n/n1) 100.0
NSE/EM-2 6.2 ± 3.7 and 4.2 ± 2.9
4.2 ± 2.9 NSE of EM-2 (n/n2) 100.0
EM-2 of NSE (n/n1) 68 ± 1.5
SP/EM-2 2.4 ± 1.0 and 5.0 ± 1.2
1.8 ± 0.6 SP of EM-2 (n/n2) 36 ± 2.4
EM-2 of SP (n/n1) 75 ± 3.4
VIP/EM-2 1.5 ± 0.5 and 5.0 ± 1.3
1.5 ± 0.5 VIP of EM-2 (n/n2) 30 ± 2.5
EM-2 of VIP (n/n1) 100.0
VIP: Vasoactive intestinal peptide; EM-2: Endomorphin-2; SP: Substance P; NSE: Neuron-specific enolase; NOS: Nitric oxide synthetase; CGRP: Calcitonin gene-related peptide; ChAT: Choline acetyltransferase.
Li JP et al . EM-2-containing neurons in submucosal plexus of rat colon
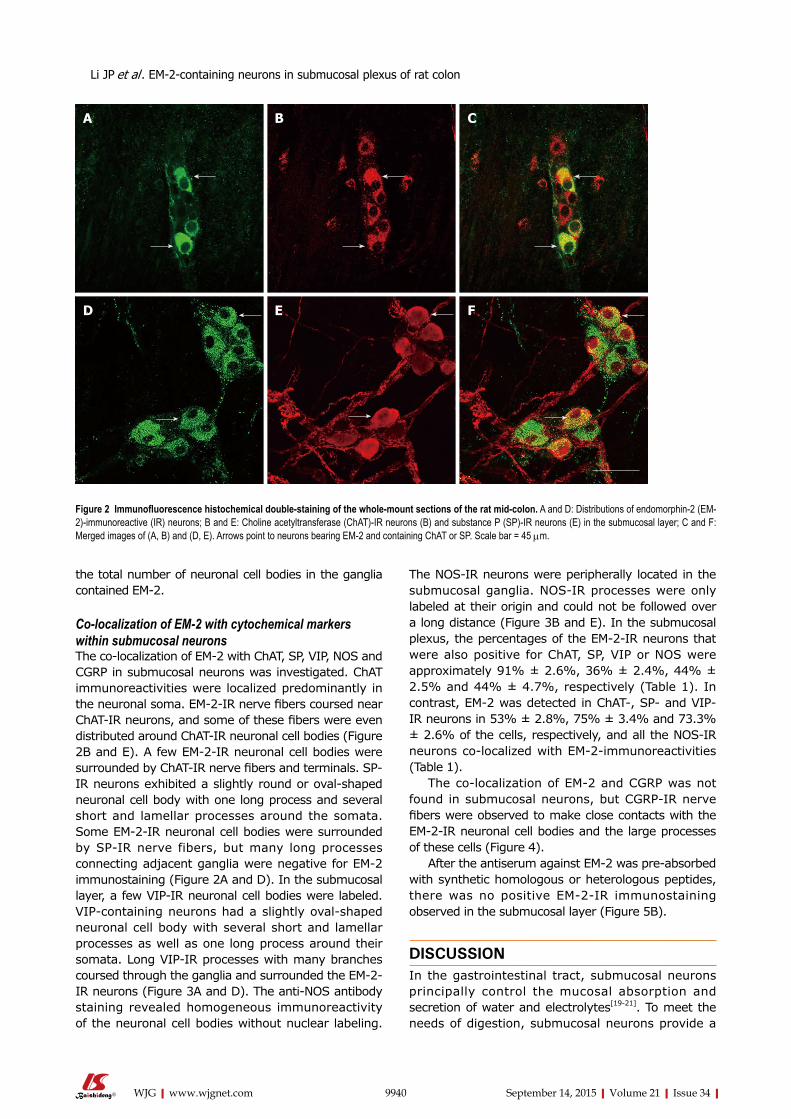
the total number of neuronal cell bodies in the ganglia contained EM-2.
Co-localization of EM-2 with cytochemical markers within submucosal neuronsThe co-localization of EM-2 with ChAT, SP, VIP, NOS and CGRP in submucosal neurons was investigated. ChAT immunoreactivities were localized predominantly in the neuronal soma. EM-2-IR nerve fibers coursed near ChAT-IR neurons, and some of these fibers were even distributed around ChAT-IR neuronal cell bodies (Figure 2B and E). A few EM-2-IR neuronal cell bodies were surrounded by ChAT-IR nerve fibers and terminals. SP-IR neurons exhibited a slightly round or oval-shaped neuronal cell body with one long process and several short and lamellar processes around the somata. Some EM-2-IR neuronal cell bodies were surrounded by SP-IR nerve fibers, but many long processes connecting adjacent ganglia were negative for EM-2 immunostaining (Figure 2A and D). In the submucosal layer, a few VIP-IR neuronal cell bodies were labeled. VIP-containing neurons had a slightly oval-shaped neuronal cell body with several short and lamellar processes as well as one long process around their somata. Long VIP-IR processes with many branches coursed through the ganglia and surrounded the EM-2-IR neurons (Figure 3A and D). The anti-NOS antibody staining revealed homogeneous immunoreactivity of the neuronal cell bodies without nuclear labeling.
The NOS-IR neurons were peripherally located in the submucosal ganglia. NOS-IR processes were only labeled at their origin and could not be followed over a long distance (Figure 3B and E). In the submucosal plexus, the percentages of the EM-2-IR neurons that were also positive for ChAT, SP, VIP or NOS were approximately 91% ± 2.6%, 36% ± 2.4%, 44% ± 2.5% and 44% ± 4.7%, respectively (Table 1). In contrast, EM-2 was detected in ChAT-, SP- and VIP-IR neurons in 53% ± 2.8%, 75% ± 3.4% and 73.3% ± 2.6% of the cells, respectively, and all the NOS-IR neurons co-localized with EM-2-immunoreactivities (Table 1).
The co-localization of EM-2 and CGRP was not found in submucosal neurons, but CGRP-IR nerve fibers were observed to make close contacts with the EM-2-IR neuronal cell bodies and the large processes of these cells (Figure 4).
After the antiserum against EM-2 was pre-absorbed with synthetic homologous or heterologous peptides, there was no positive EM-2-IR immunostaining observed in the submucosal layer (Figure 5B).
DISCUSSIONIn the gastrointestinal tract, submucosal neurons principally control the mucosal absorption and secretion of water and electrolytes[19-21]. To meet the needs of digestion, submucosal neurons provide a
9940 September 14, 2015|Volume 21|Issue 34|WJG|www.wjgnet.com
Figure 2 Immunofluorescence histochemical double-staining of the whole-mount sections of the rat mid-colon. A and D: Distributions of endomorphin-2 (EM-2)-immunoreactive (IR) neurons; B and E: Choline acetyltransferase (ChAT)-IR neurons (B) and substance P (SP)-IR neurons (E) in the submucosal layer; C and F: Merged images of (A, B) and (D, E). Arrows point to neurons bearing EM-2 and containing ChAT or SP. Scale bar = 45 μm.
A B C
D E F
Li JP et al . EM-2-containing neurons in submucosal plexus of rat colon
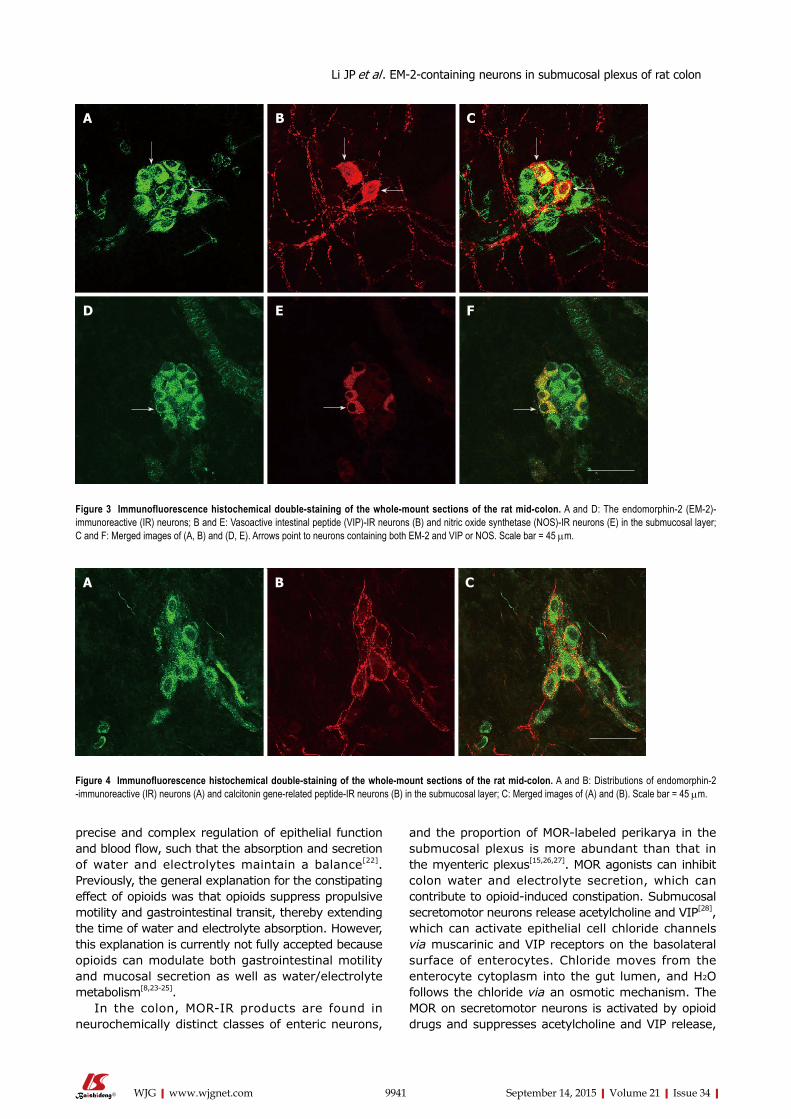
precise and complex regulation of epithelial function and blood flow, such that the absorption and secretion of water and electrolytes maintain a balance[22]. Previously, the general explanation for the constipating effect of opioids was that opioids suppress propulsive motility and gastrointestinal transit, thereby extending the time of water and electrolyte absorption. However, this explanation is currently not fully accepted because opioids can modulate both gastrointestinal motility and mucosal secretion as well as water/electrolyte metabolism[8,23-25].
In the colon, MOR-IR products are found in neurochemically distinct classes of enteric neurons,
and the proportion of MOR-labeled perikarya in the submucosal plexus is more abundant than that in the myenteric plexus[15,26,27]. MOR agonists can inhibit colon water and electrolyte secretion, which can contribute to opioid-induced constipation. Submucosal secretomotor neurons release acetylcholine and VIP[28], which can activate epithelial cell chloride channels via muscarinic and VIP receptors on the basolateral surface of enterocytes. Chloride moves from the enterocyte cytoplasm into the gut lumen, and H2O follows the chloride via an osmotic mechanism. The MOR on secretomotor neurons is activated by opioid drugs and suppresses acetylcholine and VIP release,
9941 September 14, 2015|Volume 21|Issue 34|WJG|www.wjgnet.com
A B C
D E F
Figure 3 Immunofluorescence histochemical double-staining of the whole-mount sections of the rat mid-colon. A and D: The endomorphin-2 (EM-2)-immunoreactive (IR) neurons; B and E: Vasoactive intestinal peptide (VIP)-IR neurons (B) and nitric oxide synthetase (NOS)-IR neurons (E) in the submucosal layer; C and F: Merged images of (A, B) and (D, E). Arrows point to neurons containing both EM-2 and VIP or NOS. Scale bar = 45 μm.
Figure 4 Immunofluorescence histochemical double-staining of the whole-mount sections of the rat mid-colon. A and B: Distributions of endomorphin-2 -immunoreactive (IR) neurons (A) and calcitonin gene-related peptide-IR neurons (B) in the submucosal layer; C: Merged images of (A) and (B). Scale bar = 45 μm.
A B C
Li JP et al . EM-2-containing neurons in submucosal plexus of rat colon
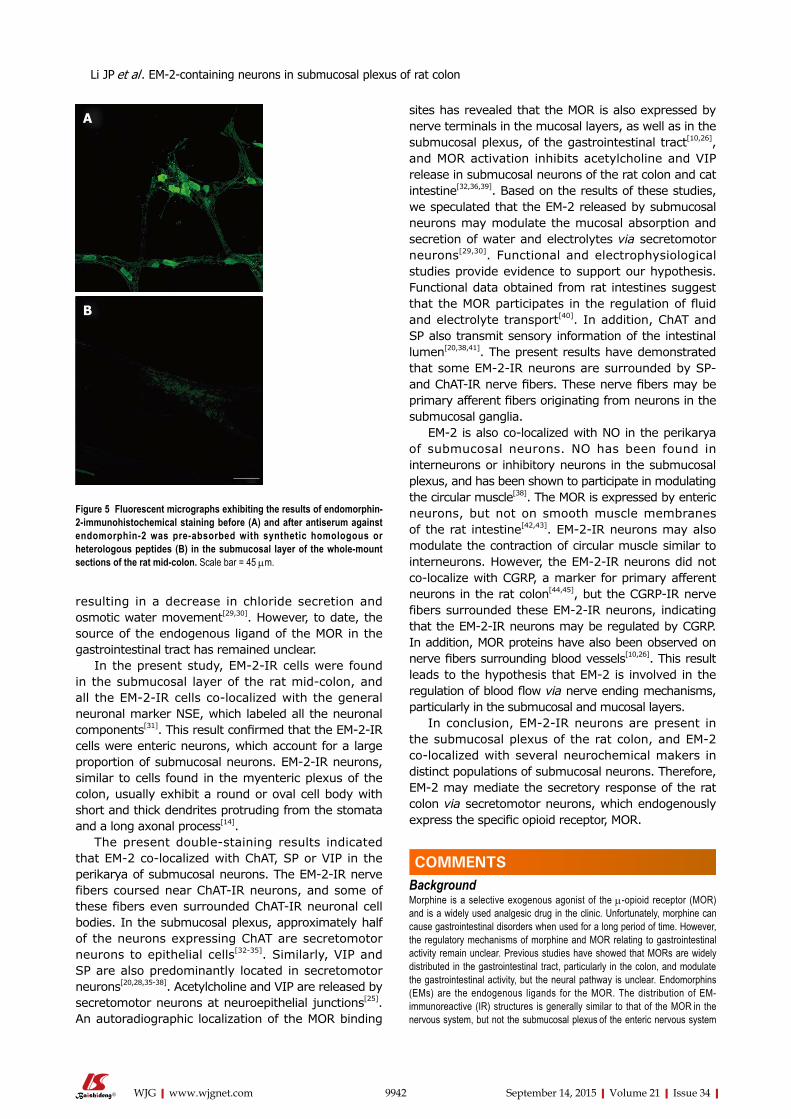
resulting in a decrease in chloride secretion and osmotic water movement[29,30]. However, to date, the source of the endogenous ligand of the MOR in the gastrointestinal tract has remained unclear.
In the present study, EM-2-IR cells were found in the submucosal layer of the rat mid-colon, and all the EM-2-IR cells co-localized with the general neuronal marker NSE, which labeled all the neuronal components[31]. This result confirmed that the EM-2-IR cells were enteric neurons, which account for a large proportion of submucosal neurons. EM-2-IR neurons, similar to cells found in the myenteric plexus of the colon, usually exhibit a round or oval cell body with short and thick dendrites protruding from the stomata and a long axonal process[14].
The present double-staining results indicated that EM-2 co-localized with ChAT, SP or VIP in the perikarya of submucosal neurons. The EM-2-IR nerve fibers coursed near ChAT-IR neurons, and some of these fibers even surrounded ChAT-IR neuronal cell bodies. In the submucosal plexus, approximately half of the neurons expressing ChAT are secretomotor neurons to epithelial cells[32-35]. Similarly, VIP and SP are also predominantly located in secretomotor neurons[20,28,35-38]. Acetylcholine and VIP are released by secretomotor neurons at neuroepithelial junctions[25]. An autoradiographic localization of the MOR binding
sites has revealed that the MOR is also expressed by nerve terminals in the mucosal layers, as well as in the submucosal plexus, of the gastrointestinal tract[10,26], and MOR activation inhibits acetylcholine and VIP release in submucosal neurons of the rat colon and cat intestine[32,36,39]. Based on the results of these studies, we speculated that the EM-2 released by submucosal neurons may modulate the mucosal absorption and secretion of water and electrolytes via secretomotor neurons[29,30]. Functional and electrophysiological studies provide evidence to support our hypothesis. Functional data obtained from rat intestines suggest that the MOR participates in the regulation of fluid and electrolyte transport[40]. In addition, ChAT and SP also transmit sensory information of the intestinal lumen[20,38,41]. The present results have demonstrated that some EM-2-IR neurons are surrounded by SP- and ChAT-IR nerve fibers. These nerve fibers may be primary afferent fibers originating from neurons in the submucosal ganglia.
EM-2 is also co-localized with NO in the perikarya of submucosal neurons. NO has been found in interneurons or inhibitory neurons in the submucosal plexus, and has been shown to participate in modulating the circular muscle[38]. The MOR is expressed by enteric neurons, but not on smooth muscle membranes of the rat intestine[42,43]. EM-2-IR neurons may also modulate the contraction of circular muscle similar to interneurons. However, the EM-2-IR neurons did not co-localize with CGRP, a marker for primary afferent neurons in the rat colon[44,45], but the CGRP-IR nerve fibers surrounded these EM-2-IR neurons, indicating that the EM-2-IR neurons may be regulated by CGRP. In addition, MOR proteins have also been observed on nerve fibers surrounding blood vessels[10,26]. This result leads to the hypothesis that EM-2 is involved in the regulation of blood flow via nerve ending mechanisms, particularly in the submucosal and mucosal layers.
In conclusion, EM-2-IR neurons are present in the submucosal plexus of the rat colon, and EM-2 co-localized with several neurochemical makers in distinct populations of submucosal neurons. Therefore, EM-2 may mediate the secretory response of the rat colon via secretomotor neurons, which endogenously express the specific opioid receptor, MOR.
COMMENTSBackgroundMorphine is a selective exogenous agonist of the μ-opioid receptor (MOR) and is a widely used analgesic drug in the clinic. Unfortunately, morphine can cause gastrointestinal disorders when used for a long period of time. However, the regulatory mechanisms of morphine and MOR relating to gastrointestinal activity remain unclear. Previous studies have showed that MORs are widely distributed in the gastrointestinal tract, particularly in the colon, and modulate the gastrointestinal activity, but the neural pathway is unclear. Endomorphins (EMs) are the endogenous ligands for the MOR. The distribution of EM-immunoreactive (IR) structures is generally similar to that of the MOR in the nervous system, but not the submucosal plexus of the enteric nervous system
9942 September 14, 2015|Volume 21|Issue 34|WJG|www.wjgnet.com
Figure 5 Fluorescent micrographs exhibiting the results of endomorphin-2-immunohistochemical staining before (A) and after antiserum against endomorphin-2 was pre-absorbed with synthetic homologous or heterologous peptides (B) in the submucosal layer of the whole-mount sections of the rat mid-colon. Scale bar = 45 μm.
A
B
COMMENTS
Li JP et al . EM-2-containing neurons in submucosal plexus of rat colon
(ENS).
Research frontiersThe authors aimed to explore the distribution and chemical nature of the EM-IR structures in the submucosal plexus to clarify the regulatory mechanisms of MOR.
Innovations and breakthroughsThis study demonstrates for the first time that EM-2-IR neurons are present in the submucosal plexus of the rat colon, and EM-2 co-localized with several neurochemical makers in distinct populations of submucosal neurons.
ApplicationsThe authors hypothesize that EM-2 may mediate the secretory response of the rat colon via secretomotor neurons, which endogenously express the specific opioid receptor, MOR.
TerminologyThe ENS is an intrinsic neuronal network within the gut wall, extending over the entire length of the gastrointestinal tract. The ENS is responsible for the intrinsic control and coordination of motility, blood flow and secretion to support normal digestion. It consists of two ganglionated plexuses: the submucosal plexus is located near the luminal side between the mucosa and circular muscle layer, and the myenteric plexus is embedded between the outer longitudinal and inner circular muscle layer of the intestine.
Peer-reviewThis is a good descriptive study in which the authors explored the distribution and chemical nature of the EM-IR structures in the submucosal plexus. To clarify the regulatory mechanisms of MOR, it provides the morphological foundation.
REFERENCES1 Arhan P, Devroede G, Jehannin B, Lanza M, Faverdin C, Dornic
C, Persoz B, Tétreault L, Perey B, Pellerin D. Segmental colonic transit time. Dis Colon Rectum 1981; 24: 625-629 [PMID: 7318630 DOI: 10.1007/BF02605761]
2 Coyne KS, LoCasale RJ, Datto CJ, Sexton CC, Yeomans K, Tack J. Opioid-induced constipation in patients with chronic noncancer pain in the USA, Canada, Germany, and the UK: descriptive analysis of baseline patient-reported outcomes and retrospective chart review. Clinicoecon Outcomes Res 2014; 6: 269-281 [PMID: 24904217 DOI: 10.2147/CEOR.S61602]
3 Loh HH, Smith AP. Molecular characterization of opioid receptors. Annu Rev Pharmacol Toxicol 1990; 30: 123-147 [PMID: 2160790 DOI: 10.1146/annurev.pa.30.040190.001011]
4 Wein S. Opioid-induced constipation. J Pain Palliat Care Pharmacother 2012; 26: 382-384 [PMID: 23216186 DOI: 10.3109/15360288.2012.734907]
5 Sosa RP, McKnight AT, Hughes J, Kosterlitz HW. Incorporation of labelled amino acids into the enkephalins. FEBS Lett 1977; 84: 195-198 [PMID: 590521 DOI: 10.1016/0014-5793(77)81088-0]
6 Orwoll ES, Kendall JW. Beta-endorphin and adrenocorticotropin in extrapituitary sites: gastrointestinal tract. Endocrinology 1980; 107: 438-442 [PMID: 6248323 DOI: 10.1210/endo-107-2-438]
7 Kromer W, Höllt V, Schmidt H, Herz A. Release of immuno-reactive-dynorphin from the isolated guinea-pig small intestine is reduced during peristaltic activity. Neurosci Lett 1981; 25: 53-56 [PMID: 6116215 DOI: 10.1016/0304-3940(81)90100-2]
8 Holzer P. Opioid receptors in the gastrointestinal tract. Regul Pept 2009; 155: 11-17 [PMID: 19345246 DOI: 10.1016/j.regpep.2009.03.012]
9 Banta CA, Clemens ET, Krinsky MM, Sheffy BE. Sites of organic acid production and patterns of digesta movement in the gastrointestinal tract of dogs. J Nutr 1979; 109: 1592-1600 [PMID: 39123 DOI: 10.1016/j.ejphar.2014.05.025]
10 Nishimura E, Buchan AM, McIntosh CH. Autoradiographic localization of mu- and delta-type opioid receptors in the gastrointestinal tract of the rat and guinea pig. Gastroenterology 1986; 91 : 1084-1094 [PMID: 3019816 DOI: 10 .1016/s0016-5085(86)80002-6]
11 Roy S, Liu HC, Loh HH. mu-Opioid receptor-knockout mice: the role of mu-opioid receptor in gastrointestinal transit. Brain Res Mol Brain Res 1998; 56: 281-283 [PMID: 9602153 DOI: 10.1016/S0169-328X]
12 Zadina JE, Hackler L, Ge LJ, Kastin AJ. A potent and selective endogenous agonist for the mu-opiate receptor. Nature 1997; 386: 499-502 [PMID: 9087409 DOI: 10.1038/386499a0]
13 Martin-Schild S, Gerall AA, Kastin AJ, Zadina JE. Differential distribution of endomorphin 1- and endomorphin 2-like immunoreactivities in the CNS of the rodent. J Comp Neurol 1999; 405: 450-471 [PMID: 10098939]
14 Li JP, Wang XY, Gao CJ, Liao YH, Qu J, He ZY, Zhang T, Wang GD, Li YQ. Neurochemical phenotype and function of endomorphin 2-immunopositive neurons in the myenteric plexus of the rat colon. Front Neuroanat 2014; 8: 149 [PMID: 25565974 DOI: 10.3389/fnana.2014.00149]
15 Sternini C, Patierno S, Selmer IS, Kirchgessner A. The opioid system in the gastrointestinal tract. Neurogastroenterol Motil 2004; 16 Suppl 2: 3-16 [PMID: 15357847 DOI: 10.1111/j.1365-2982.2003.00492.x]
16 Zimmermann M. Ethical guidelines for investigations of experimental pain in conscious animals. Pain 1983; 16: 109-110 [PMID: 6877845 DOI: 10.1016/0304-3959(83)90201-4]
17 Niu L, Chen T, Wang YY, Li YQ. Neurochemical phenotypes of endomorphin-2-containing neurons in vagal nodose neurons of the adult rat. Neurochem Int 2009; 55: 542-551 [PMID: 19463881 DOI: 10.1016/j.neuint.2009.05.010]
18 Hui R, Chen T, Li YQ. The reciprocal connections of endomorphin 1- and endomorphin 2-containing neurons between the hypothalamus and nucleus tractus solitarii in the rat. Neuroscience 2006; 138: 171-181 [PMID: 16360287 DOI: 10.1016/j.neuroscience.2005.10.039]
19 Wood JD . Intracellular study of effects of morphine on electrical activity of myenteric neurons in cat small intestine. Gastroenterology 1980; 79: 1222-1230 [PMID: 7439630 DOI: 10.1139/y85-168]
20 Cooke HJ. “Enteric Tears”: Chloride Secretion and Its Neural Regulation. News Physiol Sci 1998; 13: 269-274 [PMID: 11390802]
21 Foong JP, Tough IR, Cox HM, Bornstein JC. Properties of cholinergic and non-cholinergic submucosal neurons along the mouse colon. J Physiol 2014; 592: 777-793 [PMID: 24344165 DOI: 10.1113/jphysiol.2013.265686]
22 Vanner S, Macnaughton WK. Submucosal secretomotor and vasodilator reflexes. Neurogastroenterol Motil 2004; 16 Suppl 1: 39-43 [PMID: 15066003 DOI: 10.1046/j.1365-2982.2003.00461.x]
23 Warhurst G, Smith GS, Higgs N, Tonge A, Turnberg LA. Influence of morphine tolerance and withdrawal on intestinal salt and water transport in the rat in vivo and in vitro. Gastroenterology 1984; 87 : 1035-1041 [PMID: 6541171 DOI: 10 .1016/S0016-5085(84)80062-1]
24 De Luca A, Coupar IM. Insights into opioid action in the intestinal tract. Pharmacol Ther 1996; 69: 103-115 [PMID: 8984506 DOI: 10.1016/0163-7258(95)02053-5]
25 Wood JD, Galligan JJ. Function of opioids in the enteric nervous system. Neurogastroenterol Motil 2004; 16 Suppl 2: 17-28 [PMID: 15357848 DOI: 10.1111/j.1743-3150.2004.00554.x]
26 Bagnol D, Mansour A, Akil H, Watson SJ. Cellular localization and distribution of the cloned mu and kappa opioid receptors in rat gastrointestinal tract. Neuroscience 1997; 81: 579-591 [PMID: 9300443 DOI: 10.1016/S0306-4522(97)00227-3]
27 Ho A, Lievore A, Patierno S, Kohlmeier SE, Tonini M, Sternini C. Neurochemically distinct classes of myenteric neurons express the mu-opioid receptor in the guinea pig ileum. J Comp Neurol 2003; 458: 404-411 [PMID: 12619074 DOI: 10.1002/cne.10606]
9943 September 14, 2015|Volume 21|Issue 34|WJG|www.wjgnet.com
Li JP et al . EM-2-containing neurons in submucosal plexus of rat colon
28 Brookes SJ. Classes of enteric nerve cells in the guinea-pig small intestine. Anat Rec 2001; 262: 58-70 [PMID: 11146429]
29 Fei G, Raehal K, Liu S, Qu MH, Sun X, Wang GD, Wang XY, Xia Y, Schmid CL, Bohn LM, Wood JD. Lubiprostone reverses the inhibitory action of morphine on intestinal secretion in guinea pig and mouse. J Pharmacol Exp Ther 2010; 334: 333-340 [PMID: 20406855 DOI: 10.1124/jpet.110.166116]
30 Galligan JJ, Akbarali HI. Molecular Physiology of Enteric Opioid Receptors. Am J Gastroenterol 2014; 2: 17-21 [PMID: 25207608 DOI: 10.1038/ajgsup.2014.5]
31 Mulderry PK, Ghatei MA, Spokes RA, Jones PM, Pierson AM, Hamid QA, Kanse S, Amara SG, Burrin JM, Legon S. Differential expression of alpha-CGRP and beta-CGRP by primary sensory neurons and enteric autonomic neurons of the rat. Neuroscience 1988; 25: 195-205 [PMID: 2839796 DOI: 10.1016/0306-4522(88)90018-8]
32 Wu ZC, Kisslinger SD, Gaginella TS. Functional evidence for the presence of cholinergic nerve endings in the colonic mucosa of the rat. J Pharmacol Exp Ther 1982; 221: 664-669 [PMID: 7086680]
33 Yau WM, Dorsett JA, Youther ML. Modulation of submucosal cholinergic neurons by 5-hydroxytryptamine and neuropeptides. Am J Physiol 1990; 259: G1019-G1024 [PMID: 1701972]
34 Lesko S, Wessler I, Gäbel G, Petto C, Pfannkuche H. Cholinergic modulation of epithelial integrity in the proximal colon of pigs. Cells Tissues Organs 2013; 197: 411-420 [PMID: 23407109 DOI: 10.1159/000345437]
35 Beyer J, Jabari S, Rau TT, Neuhuber W, Brehmer A. Substance P- and choline acetyltransferase immunoreactivities in somatostatin-containing, human submucosal neurons. Histochem Cell Biol 2013; 140: 157-167 [PMID: 23361835 DOI: 10.1007/s00418-013-1078-9]
36 Eklund S, Sjöqvist A, Fahrenkrug J, Jodal M, Lundgren O. Somatostatin and methionine-enkephalin inhibit cholera toxin-induced jejunal net fluid secretion and release of vasoactive intestinal polypeptide in the cat in vivo. Acta Physiol Scand 1988; 133: 551-557 [PMID: 2906512 DOI: 10.1111/j.1748-1716.1988.tb08440.x]
37 Mourad FH, Nassar CF. Effect of vasoactive intestinal polypeptide (VIP) antagonism on rat jejunal fluid and electrolyte secretion induced by cholera and Escherichia coli enterotoxins. Gut 2000; 47: 382-386 [PMID: 10940276 DOI: 10.1136/gut.47.3.382]
38 Timmermans JP, Hens J, Adriaensen D. Outer submucous plexus: an intrinsic nerve network involved in both secretory and motility processes in the intestine of large mammals and humans. Anat Rec 2001; 262: 71-78 [PMID: 11146430 DOI: 10.1002/1097-0185(20010101)262:1<71]
39 Coupar IM. Opioid action of the intestine: the importance of the intestinal mucosa. Life Sci 1987; 41: 917-925 [PMID: 3039278 DOI: 10.1016/0024-3205(87)90677-1]
40 Kromer W. Endogenous and exogenous opioids in the control of gastrointestinal motility and secretion. Pharmacol Rev 1988; 40: 121-162 [PMID: 3070578]
41 Mann PT, Furness JB, Southwell BR. Choline acetyltransferase immunoreactivity of putative intrinsic primary afferent neurons in the rat ileum. Cell Tissue Res 1999; 297: 241-248 [PMID: 10470494 DOI: 10.1007/s004410051352]
42 Fickel J, Bagnol D, Watson SJ, Akil H. Opioid receptor expression in the rat gastrointestinal tract: a quantitative study with comparison to the brain. Brain Res Mol Brain Res 1997; 46: 1-8 [PMID: 9191072 DOI: 10.1016/S0169-328X]
43 Porcher C , Bagnol D, Watson SJ. Opioid peptide mRNA expression in the colon of the rat. Neurosci Lett 1999; 272: 111-114 [PMID: 10507554 DOI: 10.1016/S0304-3940(99)00549-2]
44 Furness JB, Robbins HL, Xiao J, Stebbing MJ, Nurgali K. Projections and chemistry of Dogiel type II neurons in the mouse colon. Cell Tissue Res 2004; 317: 1-12 [PMID: 15170562 DOI: 10.1007/s00441-004-0895-5]
45 Chiocchetti R, Grandis A, Bombardi C, Lucchi ML, Dal Lago DT, Bortolami R, Furness JB. Extrinsic and intrinsic sources of calcitonin gene-related peptide immunoreactivity in the lamb ileum: a morphometric and neurochemical investigation. Cell Tissue Res 2006; 323: 183-196 [PMID: 16228232 DOI: 10.1007/s00441-005-0075-2]
P- Reviewer: Kuwahara A S- Editor: Yu J L- Editor: Wang TQ E- Editor: Ma S
9944 September 14, 2015|Volume 21|Issue 34|WJG|www.wjgnet.com
Li JP et al . EM-2-containing neurons in submucosal plexus of rat colon
Jun-Song Liu, Xiang-Ming Che, Shuai Chang, Guang-Lin Qiu, Shi-Cai He, Lin Fan, Wei Zhao, Zheng-Liang Zhang, Shu-Feng Wang, Department of General Surgery, First Affiliated Hospital of Xi’an Jiaotong University School of Medicine, Xi’an 710061, Shaanxi Province, China
Author contributions: Liu JS and Che XM contributed equally to this work and should be regarded as co-first authors; Liu JS and Che XM performed the majority of experiments and wrote the manuscript; Chang S, Qiu GL, He SC and Zhang ZL performed some of the experiments and helped edit the figures; Fan L and Zhao W provided analytical tools and analyzed the data; Wang SF designed the study and approved the final version of the manuscript.
Supported by National Nature Science Foundation of China, No. 81172357.
Biostatistics statement: The statistical methods of this study were reviewed by Prof. Shao-Nong Dang from Department of Epidemiology and Health Statistics, School of Public Health, Xi’an Jiaotong University.
Conflict-of-interest statement: We have no conflicts of interest to declare.
Data sharing statement: We agree the data sharing. Technical appendix, statistical code and dataset are available from the corresponding author at [email protected].
Open-Access: This article is an open-access article which was selected by an in-house editor and fully peer-reviewed by external reviewers. It is distributed in accordance with the Creative Commons Attribution Non Commercial (CC BY-NC 4.0) license, which permits others to distribute, remix, adapt, build upon this work non-commercially, and license their derivative works on different terms, provided the original work is properly cited and the use is non-commercial. See: http://creativecommons.org/licenses/by-nc/4.0/
Correspondence to: Shu-Feng Wang, MD, Department of General Surgery, First Affiliated Hospital of Xi’an Jiaotong University School of Medicine, Yanta West Road 277, Xi’an
710061, Shaanxi Province, China. [email protected]: +86-29-82653900Fax: +86-29-82653905
Received: March 5, 2015 Peer-review started: March 7, 2015First decision: April 24, 2015Revised: May 12, 2015 Accepted: July 18, 2015 Article in press: July 18, 2015Published online: September 14, 2015
AbstractAIM: To explore the potential of β-elemene as a radiosensitizer for gastric cancer cells and the underlying mechanisms.
METHODS: SGC7901, MKN45, MKN28, N87, and AGS human gastric cancer cell lines were used to screen for radioresistant gastric cancer cell lines. A 3-(4,5-dimeth-ylthiazol-2-yl)-2,5-diphenyltetrazolium (MTT) assay was used to determine the effects of β-elemene and IPA-3 on cell viability in MKN45 and SGC7901 gastric cancer cell lines. A clonogenic survival assay and annexin V-FITC/PI apoptosis detection assay were used to evaluate cellular radiosensitivity and radiation-induced cell death, respectively. A proteomic method, isobaric tags for relative and absolute quantitation (iTRAQ), was employed to screen the proteins regulated by β-elemene pretreatment prior to ionizing radiation (IR) in SGC7901 gastric cancer cell line. IPA-3 was used as a specific small molecule inhibitor of p21-activated protein kinase 1 (Pak1) to target Pak1 signaling. Protein levels of PAK1IP1 (p21-activated protein kinase-interacting protein 1), total Pak1 (t-Pak1), phospho-Pak1 (T423), phospho-ERK1/2 (Thr202/Tyr204), and cleaved caspase-3 (17 kDa) were assessed by western blotting.
Submit a Manuscript: http://www.wjgnet.com/esps/Help Desk: http://www.wjgnet.com/esps/helpdesk.aspxDOI: 10.3748/wjg.v21.i34.9945
9945 September 14, 2015|Volume 21|Issue 34|WJG|www.wjgnet.com
World J Gastroenterol 2015 September 14; 21(34): 9945-9956 ISSN 1007-9327 (print) ISSN 2219-2840 (online)
© 2015 Baishideng Publishing Group Inc. All rights reserved.
ORIGINAL ARTICLE
β-elemene enhances the radiosensitivity of gastric cancer cells by inhibiting Pak1 activation
Basic Study
Jun-Song Liu, Xiang-Ming Che, Shuai Chang, Guang-Lin Qiu, Shi-Cai He, Lin Fan, Wei Zhao, Zheng-Liang Zhang, Shu-Feng Wang
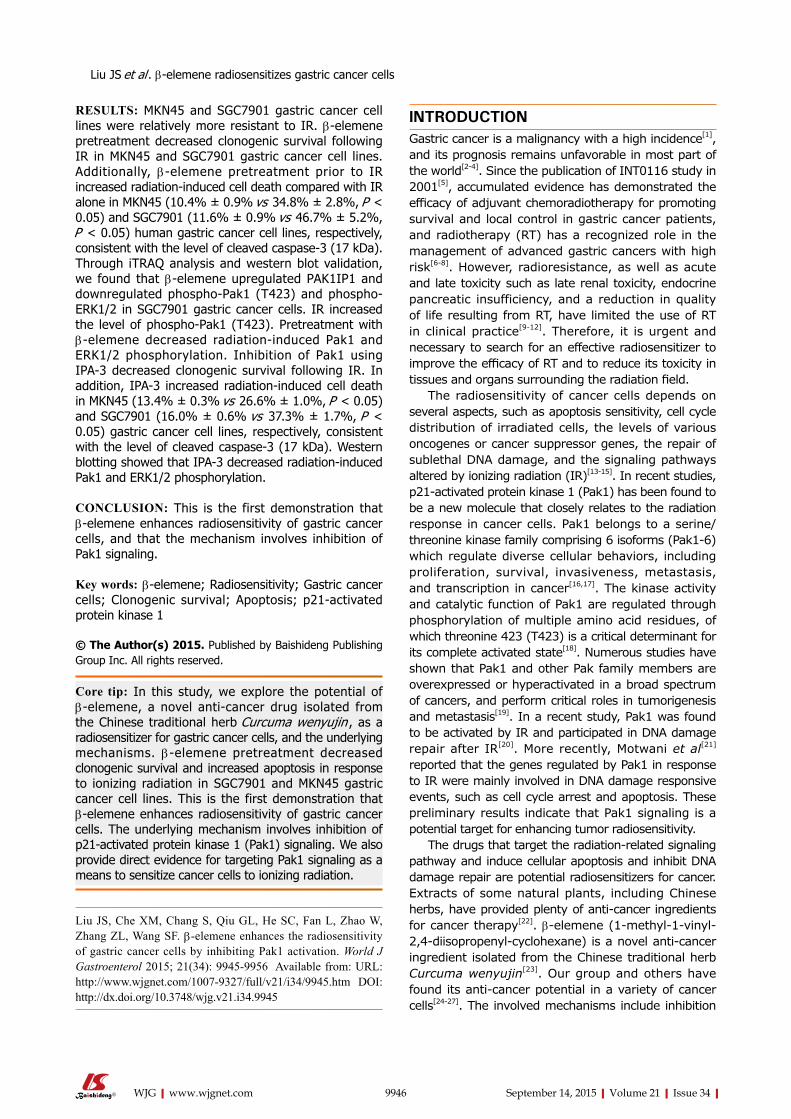
RESULTS: MKN45 and SGC7901 gastric cancer cell lines were relatively more resistant to IR. β-elemene pretreatment decreased clonogenic survival following IR in MKN45 and SGC7901 gastric cancer cell lines. Additionally, β-elemene pretreatment prior to IR increased radiation-induced cell death compared with IR alone in MKN45 (10.4% ± 0.9% vs 34.8% ± 2.8%, P < 0.05) and SGC7901 (11.6% ± 0.9% vs 46.7% ± 5.2%, P < 0.05) human gastric cancer cell lines, respectively, consistent with the level of cleaved caspase-3 (17 kDa). Through iTRAQ analysis and western blot validation, we found that β-elemene upregulated PAK1IP1 and downregulated phospho-Pak1 (T423) and phospho-ERK1/2 in SGC7901 gastric cancer cells. IR increased the level of phospho-Pak1 (T423). Pretreatment with β-elemene decreased radiation-induced Pak1 and ERK1/2 phosphorylation. Inhibition of Pak1 using IPA-3 decreased clonogenic survival following IR. In addition, IPA-3 increased radiation-induced cell death in MKN45 (13.4% ± 0.3% vs 26.6% ± 1.0%, P < 0.05) and SGC7901 (16.0% ± 0.6% vs 37.3% ± 1.7%, P < 0.05) gastric cancer cell lines, respectively, consistent with the level of cleaved caspase-3 (17 kDa). Western blotting showed that IPA-3 decreased radiation-induced Pak1 and ERK1/2 phosphorylation.
CONCLUSION: This is the first demonstration that β-elemene enhances radiosensitivity of gastric cancer cells, and that the mechanism involves inhibition of Pak1 signaling.
Key words: β-elemene; Radiosensitivity; Gastric cancer cells; Clonogenic survival; Apoptosis; p21-activated protein kinase 1
© The Author(s) 2015. Published by Baishideng Publishing Group Inc. All rights reserved.
Core tip: In this study, we explore the potential of β-elemene, a novel anti-cancer drug isolated from the Chinese traditional herb Curcuma wenyujin , as a radiosensitizer for gastric cancer cells, and the underlying mechanisms. β-elemene pretreatment decreased clonogenic survival and increased apoptosis in response to ionizing radiation in SGC7901 and MKN45 gastric cancer cell lines. This is the first demonstration that β-elemene enhances radiosensitivity of gastric cancer cells. The underlying mechanism involves inhibition of p21-activated protein kinase 1 (Pak1) signaling. We also provide direct evidence for targeting Pak1 signaling as a means to sensitize cancer cells to ionizing radiation.
Liu JS, Che XM, Chang S, Qiu GL, He SC, Fan L, Zhao W, Zhang ZL, Wang SF. β-elemene enhances the radiosensitivity of gastric cancer cells by inhibiting Pak1 activation. World J Gastroenterol 2015; 21(34): 9945-9956 Available from: URL: http://www.wjgnet.com/1007-9327/full/v21/i34/9945.htm DOI: http://dx.doi.org/10.3748/wjg.v21.i34.9945
INTRODUCTIONGastric cancer is a malignancy with a high incidence[1], and its prognosis remains unfavorable in most part of the world[2-4]. Since the publication of INT0116 study in 2001[5], accumulated evidence has demonstrated the efficacy of adjuvant chemoradiotherapy for promoting survival and local control in gastric cancer patients, and radiotherapy (RT) has a recognized role in the management of advanced gastric cancers with high risk[6-8]. However, radioresistance, as well as acute and late toxicity such as late renal toxicity, endocrine pancreatic insufficiency, and a reduction in quality of life resulting from RT, have limited the use of RT in clinical practice[9-12]. Therefore, it is urgent and necessary to search for an effective radiosensitizer to improve the efficacy of RT and to reduce its toxicity in tissues and organs surrounding the radiation field.
The radiosensitivity of cancer cells depends on several aspects, such as apoptosis sensitivity, cell cycle distribution of irradiated cells, the levels of various oncogenes or cancer suppressor genes, the repair of sublethal DNA damage, and the signaling pathways altered by ionizing radiation (IR)[13-15]. In recent studies, p21-activated protein kinase 1 (Pak1) has been found to be a new molecule that closely relates to the radiation response in cancer cells. Pak1 belongs to a serine/threonine kinase family comprising 6 isoforms (Pak1-6) which regulate diverse cellular behaviors, including proliferation, survival, invasiveness, metastasis, and transcription in cancer[16,17]. The kinase activity and catalytic function of Pak1 are regulated through phosphorylation of multiple amino acid residues, of which threonine 423 (T423) is a critical determinant for its complete activated state[18]. Numerous studies have shown that Pak1 and other Pak family members are overexpressed or hyperactivated in a broad spectrum of cancers, and perform critical roles in tumorigenesis and metastasis[19]. In a recent study, Pak1 was found to be activated by IR and participated in DNA damage repair after IR[20]. More recently, Motwani et al[21] reported that the genes regulated by Pak1 in response to IR were mainly involved in DNA damage responsive events, such as cell cycle arrest and apoptosis. These preliminary results indicate that Pak1 signaling is a potential target for enhancing tumor radiosensitivity.
The drugs that target the radiation-related signaling pathway and induce cellular apoptosis and inhibit DNA damage repair are potential radiosensitizers for cancer. Extracts of some natural plants, including Chinese herbs, have provided plenty of anti-cancer ingredients for cancer therapy[22]. β-elemene (1-methyl-1-vinyl-2,4-diisopropenyl-cyclohexane) is a novel anti-cancer ingredient isolated from the Chinese traditional herb Curcuma wenyujin[23]. Our group and others have found its anti-cancer potential in a variety of cancer cells[24-27]. The involved mechanisms include inhibition
9946 September 14, 2015|Volume 21|Issue 34|WJG|www.wjgnet.com
Liu JS et al . β-elemene radiosensitizes gastric cancer cells
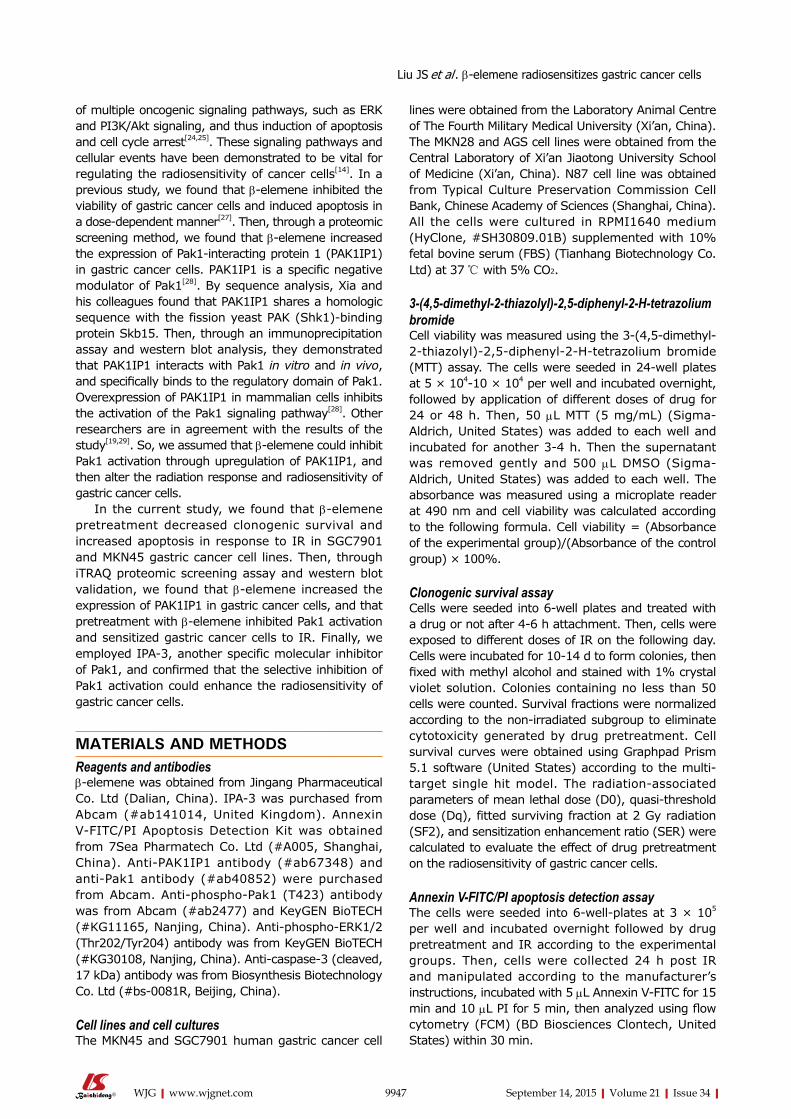
of multiple oncogenic signaling pathways, such as ERK and PI3K/Akt signaling, and thus induction of apoptosis and cell cycle arrest[24,25]. These signaling pathways and cellular events have been demonstrated to be vital for regulating the radiosensitivity of cancer cells[14]. In a previous study, we found that β-elemene inhibited the viability of gastric cancer cells and induced apoptosis in a dose-dependent manner[27]. Then, through a proteomic screening method, we found that β-elemene increased the expression of Pak1-interacting protein 1 (PAK1IP1) in gastric cancer cells. PAK1IP1 is a specific negative modulator of Pak1[28]. By sequence analysis, Xia and his colleagues found that PAK1IP1 shares a homologic sequence with the fission yeast PAK (Shk1)-binding protein Skb15. Then, through an immunoprecipitation assay and western blot analysis, they demonstrated that PAK1IP1 interacts with Pak1 in vitro and in vivo, and specifically binds to the regulatory domain of Pak1. Overexpression of PAK1IP1 in mammalian cells inhibits the activation of the Pak1 signaling pathway[28]. Other researchers are in agreement with the results of the study[19,29]. So, we assumed that β-elemene could inhibit Pak1 activation through upregulation of PAK1IP1, and then alter the radiation response and radiosensitivity of gastric cancer cells.
In the current study, we found that β-elemene pretreatment decreased clonogenic survival and increased apoptosis in response to IR in SGC7901 and MKN45 gastric cancer cell lines. Then, through iTRAQ proteomic screening assay and western blot validation, we found that β-elemene increased the expression of PAK1IP1 in gastric cancer cells, and that pretreatment with β-elemene inhibited Pak1 activation and sensitized gastric cancer cells to IR. Finally, we employed IPA-3, another specific molecular inhibitor of Pak1, and confirmed that the selective inhibition of Pak1 activation could enhance the radiosensitivity of gastric cancer cells.
MATERIALS AND METHODSReagents and antibodiesβ-elemene was obtained from Jingang Pharmaceutical Co. Ltd (Dalian, China). IPA-3 was purchased from Abcam (#ab141014, United Kingdom). Annexin V-FITC/PI Apoptosis Detection Kit was obtained from 7Sea Pharmatech Co. Ltd (#A005, Shanghai, China). Anti-PAK1IP1 antibody (#ab67348) and anti-Pak1 antibody (#ab40852) were purchased from Abcam. Anti-phospho-Pak1 (T423) antibody was from Abcam (#ab2477) and KeyGEN BioTECH (#KG11165, Nanjing, China). Anti-phospho-ERK1/2 (Thr202/Tyr204) antibody was from KeyGEN BioTECH (#KG30108, Nanjing, China). Anti-caspase-3 (cleaved, 17 kDa) antibody was from Biosynthesis Biotechnology Co. Ltd (#bs-0081R, Beijing, China).
Cell lines and cell culturesThe MKN45 and SGC7901 human gastric cancer cell
lines were obtained from the Laboratory Animal Centre of The Fourth Military Medical University (Xi’an, China). The MKN28 and AGS cell lines were obtained from the Central Laboratory of Xi’an Jiaotong University School of Medicine (Xi’an, China). N87 cell line was obtained from Typical Culture Preservation Commission Cell Bank, Chinese Academy of Sciences (Shanghai, China). All the cells were cultured in RPMI1640 medium (HyClone, #SH30809.01B) supplemented with 10% fetal bovine serum (FBS) (Tianhang Biotechnology Co. Ltd) at 37 ℃ with 5% CO2.
3-(4,5-dimethyl-2-thiazolyl)-2,5-diphenyl-2-H-tetrazolium bromideCell viability was measured using the 3-(4,5-dimethyl-2-thiazolyl)-2,5-diphenyl-2-H-tetrazolium bromide (MTT) assay. The cells were seeded in 24-well plates at 5 × 10⁴-10 × 104 per well and incubated overnight, followed by application of different doses of drug for 24 or 48 h. Then, 50 μL MTT (5 mg/mL) (Sigma-Aldrich, United States) was added to each well and incubated for another 3-4 h. Then the supernatant was removed gently and 500 μL DMSO (Sigma-Aldrich, United States) was added to each well. The absorbance was measured using a microplate reader at 490 nm and cell viability was calculated according to the following formula. Cell viability = (Absorbance of the experimental group)/(Absorbance of the control group) × 100%.
Clonogenic survival assayCells were seeded into 6-well plates and treated with a drug or not after 4-6 h attachment. Then, cells were exposed to different doses of IR on the following day. Cells were incubated for 10-14 d to form colonies, then fixed with methyl alcohol and stained with 1% crystal violet solution. Colonies containing no less than 50 cells were counted. Survival fractions were normalized according to the non-irradiated subgroup to eliminate cytotoxicity generated by drug pretreatment. Cell survival curves were obtained using Graphpad Prism 5.1 software (United States) according to the multi-target single hit model. The radiation-associated parameters of mean lethal dose (D0), quasi-threshold dose (Dq), fitted surviving fraction at 2 Gy radiation (SF2), and sensitization enhancement ratio (SER) were calculated to evaluate the effect of drug pretreatment on the radiosensitivity of gastric cancer cells.
Annexin V-FITC/PI apoptosis detection assayThe cells were seeded into 6-well-plates at 3 × 10⁵ per well and incubated overnight followed by drug pretreatment and IR according to the experimental groups. Then, cells were collected 24 h post IR and manipulated according to the manufacturer’s instructions, incubated with 5 μL Annexin V-FITC for 15 min and 10 μL PI for 5 min, then analyzed using flow cytometry (FCM) (BD Biosciences Clontech, United States) within 30 min.
9947 September 14, 2015|Volume 21|Issue 34|WJG|www.wjgnet.com
Liu JS et al . β-elemene radiosensitizes gastric cancer cells
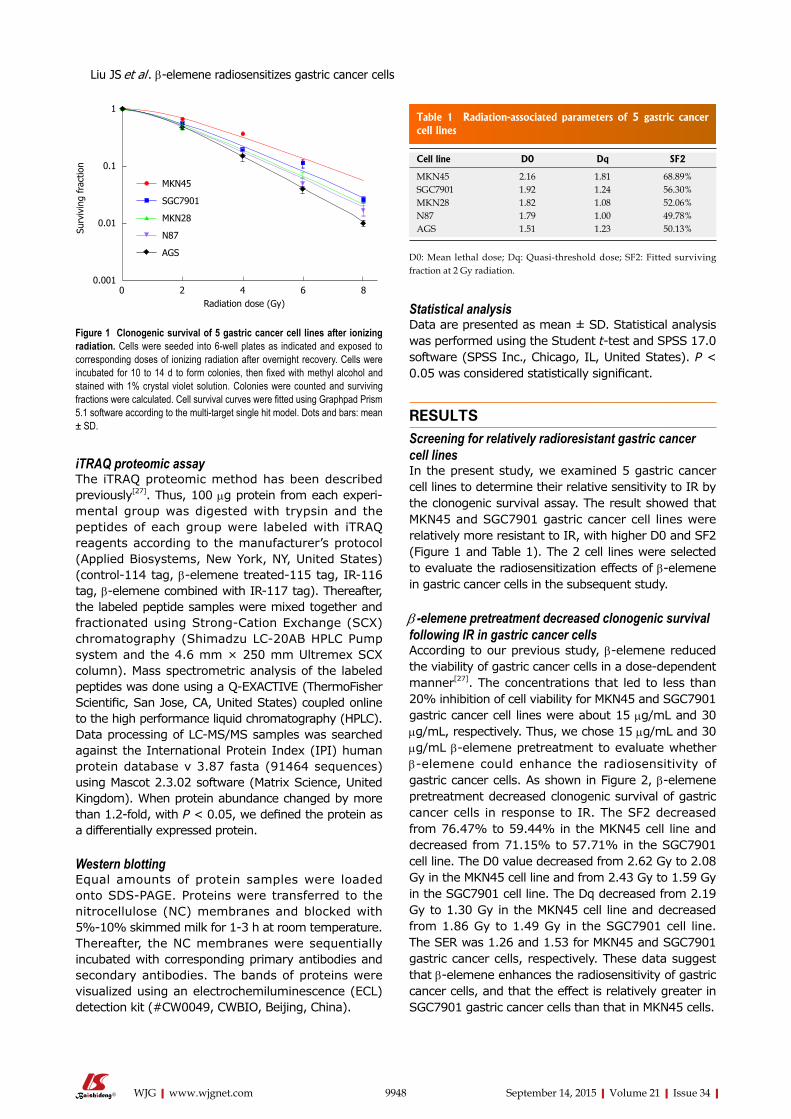
9948 September 14, 2015|Volume 21|Issue 34|WJG|www.wjgnet.com
Statistical analysisData are presented as mean ± SD. Statistical analysis was performed using the Student t-test and SPSS 17.0 software (SPSS Inc., Chicago, IL, United States). P < 0.05 was considered statistically significant.
RESULTSScreening for relatively radioresistant gastric cancer cell linesIn the present study, we examined 5 gastric cancer cell lines to determine their relative sensitivity to IR by the clonogenic survival assay. The result showed that MKN45 and SGC7901 gastric cancer cell lines were relatively more resistant to IR, with higher D0 and SF2 (Figure 1 and Table 1). The 2 cell lines were selected to evaluate the radiosensitization effects of β-elemene in gastric cancer cells in the subsequent study.
β -elemene pretreatment decreased clonogenic survival following IR in gastric cancer cellsAccording to our previous study, β-elemene reduced the viability of gastric cancer cells in a dose-dependent manner[27]. The concentrations that led to less than 20% inhibition of cell viability for MKN45 and SGC7901 gastric cancer cell lines were about 15 μg/mL and 30 μg/mL, respectively. Thus, we chose 15 μg/mL and 30 μg/mL β-elemene pretreatment to evaluate whether β-elemene could enhance the radiosensitivity of gastric cancer cells. As shown in Figure 2, β-elemene pretreatment decreased clonogenic survival of gastric cancer cells in response to IR. The SF2 decreased from 76.47% to 59.44% in the MKN45 cell line and decreased from 71.15% to 57.71% in the SGC7901 cell line. The D0 value decreased from 2.62 Gy to 2.08 Gy in the MKN45 cell line and from 2.43 Gy to 1.59 Gy in the SGC7901 cell line. The Dq decreased from 2.19 Gy to 1.30 Gy in the MKN45 cell line and decreased from 1.86 Gy to 1.49 Gy in the SGC7901 cell line. The SER was 1.26 and 1.53 for MKN45 and SGC7901 gastric cancer cells, respectively. These data suggest that β-elemene enhances the radiosensitivity of gastric cancer cells, and that the effect is relatively greater in SGC7901 gastric cancer cells than that in MKN45 cells.
iTRAQ proteomic assayThe iTRAQ proteomic method has been described previously[27]. Thus, 100 μg protein from each experi-mental group was digested with trypsin and the peptides of each group were labeled with iTRAQ reagents according to the manufacturer’s protocol (Applied Biosystems, New York, NY, United States) (control-114 tag, β-elemene treated-115 tag, IR-116 tag, β-elemene combined with IR-117 tag). Thereafter, the labeled peptide samples were mixed together and fractionated using Strong-Cation Exchange (SCX) chromatography (Shimadzu LC-20AB HPLC Pump system and the 4.6 mm × 250 mm Ultremex SCX column). Mass spectrometric analysis of the labeled peptides was done using a Q-EXACTIVE (ThermoFisher Scientific, San Jose, CA, United States) coupled online to the high performance liquid chromatography (HPLC). Data processing of LC-MS/MS samples was searched against the International Protein Index (IPI) human protein database v 3.87 fasta (91464 sequences) using Mascot 2.3.02 software (Matrix Science, United Kingdom). When protein abundance changed by more than 1.2-fold, with P < 0.05, we defined the protein as a differentially expressed protein.
Western blottingEqual amounts of protein samples were loaded onto SDS-PAGE. Proteins were transferred to the nitrocellulose (NC) membranes and blocked with 5%-10% skimmed milk for 1-3 h at room temperature. Thereafter, the NC membranes were sequentially incubated with corresponding primary antibodies and secondary antibodies. The bands of proteins were visualized using an electrochemiluminescence (ECL) detection kit (#CW0049, CWBIO, Beijing, China).
1
0.1
0.01
0.0010 2 4 6 8 Radiation dose (Gy)
Surv
ivin
g fr
actio
n
MKN45
SGC7901
MKN28
N87
AGS
Figure 1 Clonogenic survival of 5 gastric cancer cell lines after ionizing radiation. Cells were seeded into 6-well plates as indicated and exposed to corresponding doses of ionizing radiation after overnight recovery. Cells were incubated for 10 to 14 d to form colonies, then fixed with methyl alcohol and stained with 1% crystal violet solution. Colonies were counted and surviving fractions were calculated. Cell survival curves were fitted using Graphpad Prism 5.1 software according to the multi-target single hit model. Dots and bars: mean ± SD.
Table 1 Radiation-associated parameters of 5 gastric cancer cell lines
Cell line D0 Dq SF2
MKN45 2.16 1.81 68.89%SGC7901 1.92 1.24 56.30%MKN28 1.82 1.08 52.06%N87 1.79 1.00 49.78%AGS 1.51 1.23 50.13%
D0: Mean lethal dose; Dq: Quasi-threshold dose; SF2: Fitted surviving fraction at 2 Gy radiation.
Liu JS et al . β-elemene radiosensitizes gastric cancer cells
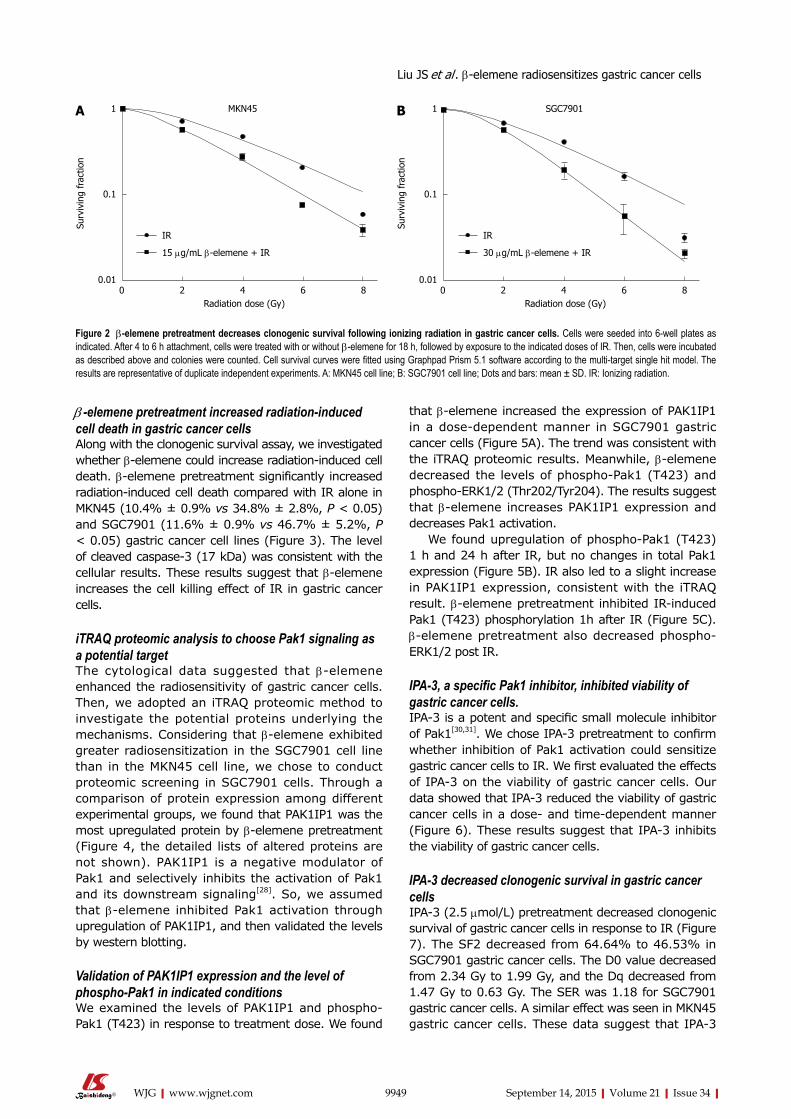
9949 September 14, 2015|Volume 21|Issue 34|WJG|www.wjgnet.com
β -elemene pretreatment increased radiation-induced cell death in gastric cancer cellsAlong with the clonogenic survival assay, we investigated whether β-elemene could increase radiation-induced cell death. β-elemene pretreatment significantly increased radiation-induced cell death compared with IR alone in MKN45 (10.4% ± 0.9% vs 34.8% ± 2.8%, P < 0.05) and SGC7901 (11.6% ± 0.9% vs 46.7% ± 5.2%, P < 0.05) gastric cancer cell lines (Figure 3). The level of cleaved caspase-3 (17 kDa) was consistent with the cellular results. These results suggest that β-elemene increases the cell killing effect of IR in gastric cancer cells.
iTRAQ proteomic analysis to choose Pak1 signaling as a potential targetThe cytological data suggested that β-elemene enhanced the radiosensitivity of gastric cancer cells. Then, we adopted an iTRAQ proteomic method to investigate the potential proteins underlying the mechanisms. Considering that β-elemene exhibited greater radiosensitization in the SGC7901 cell line than in the MKN45 cell line, we chose to conduct proteomic screening in SGC7901 cells. Through a comparison of protein expression among different experimental groups, we found that PAK1IP1 was the most upregulated protein by β-elemene pretreatment (Figure 4, the detailed lists of altered proteins are not shown). PAK1IP1 is a negative modulator of Pak1 and selectively inhibits the activation of Pak1 and its downstream signaling[28]. So, we assumed that β-elemene inhibited Pak1 activation through upregulation of PAK1IP1, and then validated the levels by western blotting.
Validation of PAK1IP1 expression and the level of phospho-Pak1 in indicated conditionsWe examined the levels of PAK1IP1 and phospho-Pak1 (T423) in response to treatment dose. We found
that β-elemene increased the expression of PAK1IP1 in a dose-dependent manner in SGC7901 gastric cancer cells (Figure 5A). The trend was consistent with the iTRAQ proteomic results. Meanwhile, β-elemene decreased the levels of phospho-Pak1 (T423) and phospho-ERK1/2 (Thr202/Tyr204). The results suggest that β-elemene increases PAK1IP1 expression and decreases Pak1 activation.
We found upregulation of phospho-Pak1 (T423) 1 h and 24 h after IR, but no changes in total Pak1 expression (Figure 5B). IR also led to a slight increase in PAK1IP1 expression, consistent with the iTRAQ result. β-elemene pretreatment inhibited IR-induced Pak1 (T423) phosphorylation 1h after IR (Figure 5C). β-elemene pretreatment also decreased phospho-ERK1/2 post IR.
IPA-3, a specific Pak1 inhibitor, inhibited viability of gastric cancer cells.IPA-3 is a potent and specific small molecule inhibitor of Pak1[30,31]. We chose IPA-3 pretreatment to confirm whether inhibition of Pak1 activation could sensitize gastric cancer cells to IR. We first evaluated the effects of IPA-3 on the viability of gastric cancer cells. Our data showed that IPA-3 reduced the viability of gastric cancer cells in a dose- and time-dependent manner (Figure 6). These results suggest that IPA-3 inhibits the viability of gastric cancer cells.
IPA-3 decreased clonogenic survival in gastric cancer cellsIPA-3 (2.5 μmol/L) pretreatment decreased clonogenic survival of gastric cancer cells in response to IR (Figure 7). The SF2 decreased from 64.64% to 46.53% in SGC7901 gastric cancer cells. The D0 value decreased from 2.34 Gy to 1.99 Gy, and the Dq decreased from 1.47 Gy to 0.63 Gy. The SER was 1.18 for SGC7901 gastric cancer cells. A similar effect was seen in MKN45 gastric cancer cells. These data suggest that IPA-3
1
0.1
0.010 2 4 6 8 Radiation dose (Gy)
Surv
ivin
g fr
actio
n
IR
15 μg/mL β-elemene + IR
1
0.1
0.010 2 4 6 8 Radiation dose (Gy)
Surv
ivin
g fr
actio
n
IR
30 μg/mL β-elemene + IR
SGC7901MKN45
Figure 2 β-elemene pretreatment decreases clonogenic survival following ionizing radiation in gastric cancer cells. Cells were seeded into 6-well plates as indicated. After 4 to 6 h attachment, cells were treated with or without β-elemene for 18 h, followed by exposure to the indicated doses of IR. Then, cells were incubated as described above and colonies were counted. Cell survival curves were fitted using Graphpad Prism 5.1 software according to the multi-target single hit model. The results are representative of duplicate independent experiments. A: MKN45 cell line; B: SGC7901 cell line; Dots and bars: mean ± SD. IR: Ionizing radiation.
A B
Liu JS et al . β-elemene radiosensitizes gastric cancer cells
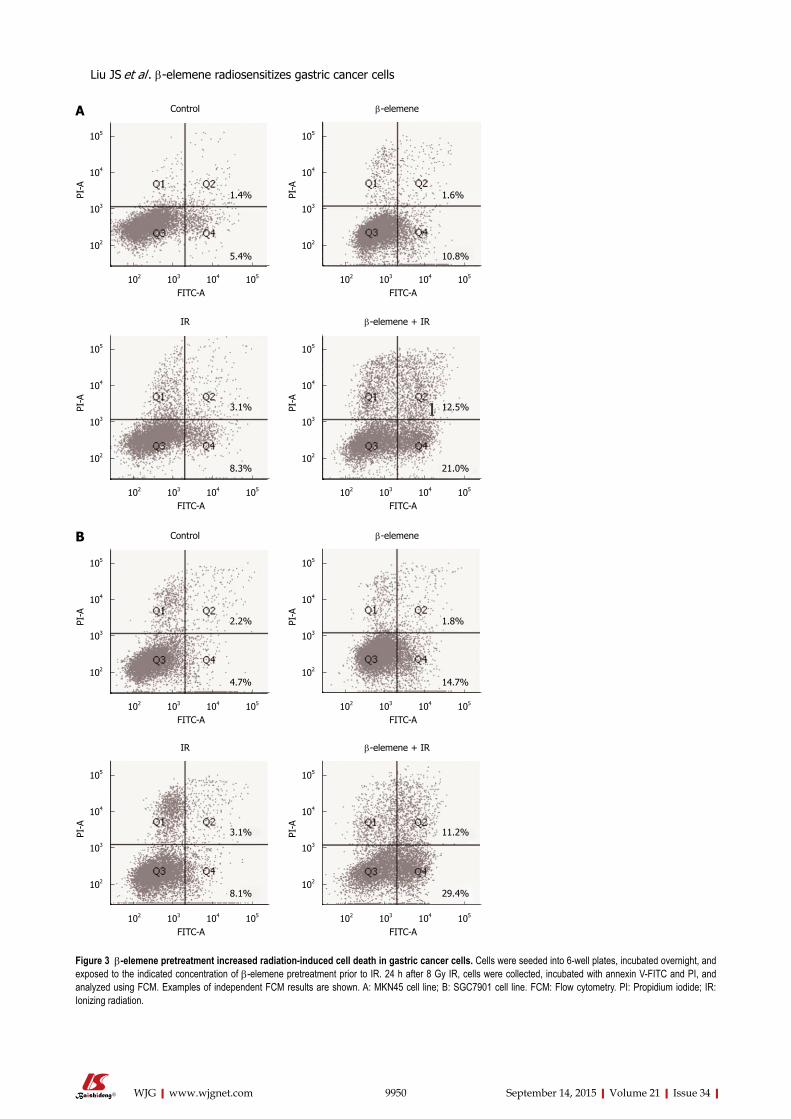
9950 September 14, 2015|Volume 21|Issue 34|WJG|www.wjgnet.com
Figure 3 β-elemene pretreatment increased radiation-induced cell death in gastric cancer cells. Cells were seeded into 6-well plates, incubated overnight, and exposed to the indicated concentration of β-elemene pretreatment prior to IR. 24 h after 8 Gy IR, cells were collected, incubated with annexin V-FITC and PI, and analyzed using FCM. Examples of independent FCM results are shown. A: MKN45 cell line; B: SGC7901 cell line. FCM: Flow cytometry. PI: Propidium iodide; IR: Ionizing radiation.
102 103 104 105
FITC-A
105
104
103
102
PI-A
102 103 104 105
FITC-A
105
104
103
102
PI-A
102 103 104 105
FITC-A
105
104
103
102
PI-A
102 103 104 105
FITC-A
105
104
103
102
PI-A
102 103 104 105
FITC-A
105
104
103
102
PI-A
102 103 104 105
FITC-A
105
104
103
102
PI-A
102 103 104 105
FITC-A
105
104
103
102
PI-A
102 103 104 105
FITC-A
105
104
103
102
PI-A
Control β-elemene
IR β-elemene + IR
Control β-elemene
IR β-elemene + IR
1.4%
5.4%
1.6%
10.8%
3.1%
8.3%
12.5%
21.0%
2.2%
4.7%
1.8%
14.7%
3.1%
8.1%
11.2%
29.4%
A
B
Liu JS et al . β-elemene radiosensitizes gastric cancer cells
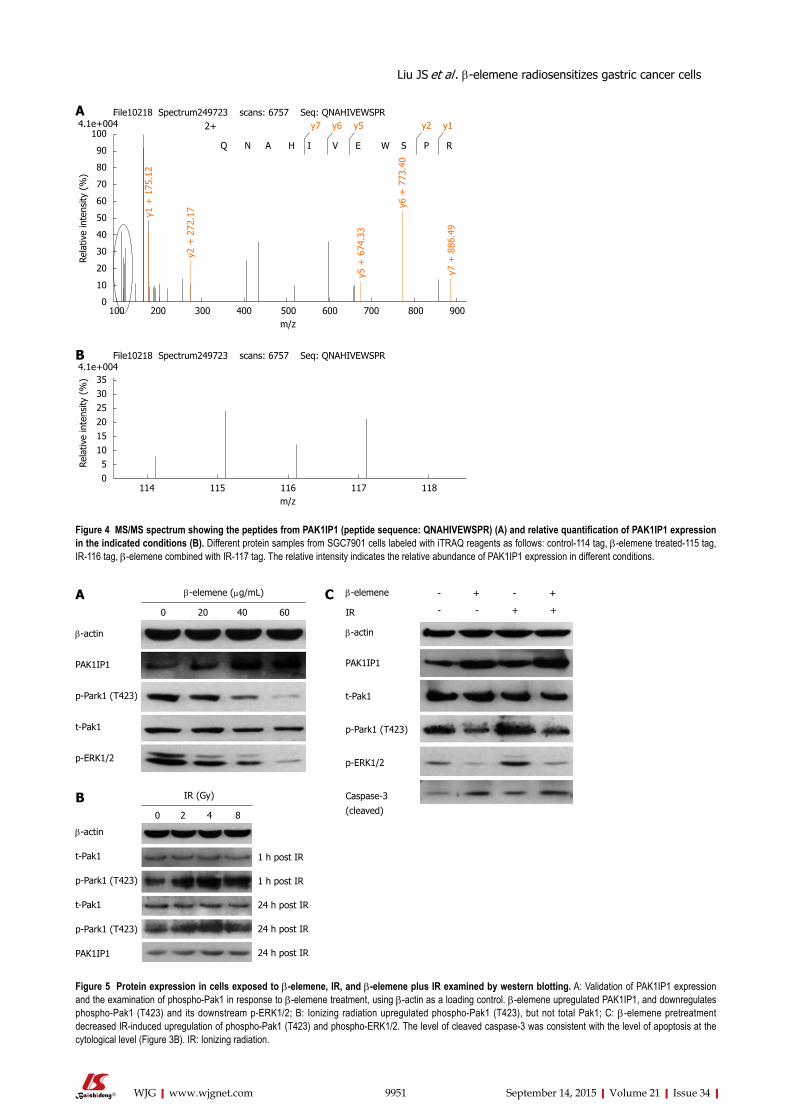
9951 September 14, 2015|Volume 21|Issue 34|WJG|www.wjgnet.com
100
90
80
70
60
50
40
30
20
10
0100 200 300 400 500 600 700 800 900 m/z
Rela
tive
inte
nsity
(%
)
y1 +
175
.12
y2 +
272
.17
y5 +
674
.33
y6 +
773
.40
y7 +
886
.49
2+ y7 y6 y5 y2 y1
Q N A H I V E W S P R
File10218 Spectrum249723 scans: 6757 Seq: QNAHIVEWSPR4.1e+004
35302520151050
114 115 116 117 118 m/z
Rela
tive
inte
nsity
(%
)
File10218 Spectrum249723 scans: 6757 Seq: QNAHIVEWSPR4.1e+004
A
B
Figure 4 MS/MS spectrum showing the peptides from PAK1IP1 (peptide sequence: QNAHIVEWSPR) (A) and relative quantification of PAK1IP1 expression in the indicated conditions (B). Different protein samples from SGC7901 cells labeled with iTRAQ reagents as follows: control-114 tag, β-elemene treated-115 tag, IR-116 tag, β-elemene combined with IR-117 tag. The relative intensity indicates the relative abundance of PAK1IP1 expression in different conditions.
β-actin
PAK1IP1
p-Park1 (T423)
t-Pak1
p-ERK1/2
β-elemene (μg/mL)
0 20 40 60
β-actin
t-Pak1
p-Park1 (T423)
t-Pak1
p-Park1 (T423)
PAK1IP1
IR (Gy)
0 2 4 8
1 h post IR
1 h post IR
24 h post IR
24 h post IR
24 h post IR
β-elemene
IR
β-actin
PAK1IP1
t-Pak1
p-Park1 (T423)
p-ERK1/2
Caspase-3
(cleaved)
- + - +
- - + +
Figure 5 Protein expression in cells exposed to β-elemene, IR, and β-elemene plus IR examined by western blotting. A: Validation of PAK1IP1 expression and the examination of phospho-Pak1 in response to β-elemene treatment, using β-actin as a loading control. β-elemene upregulated PAK1IP1, and downregulates phospho-Pak1 (T423) and its downstream p-ERK1/2; B: Ionizing radiation upregulated phospho-Pak1 (T423), but not total Pak1; C: β-elemene pretreatment decreased IR-induced upregulation of phospho-Pak1 (T423) and phospho-ERK1/2. The level of cleaved caspase-3 was consistent with the level of apoptosis at the cytological level (Figure 3B). IR: Ionizing radiation.
A
B
C
Liu JS et al . β-elemene radiosensitizes gastric cancer cells
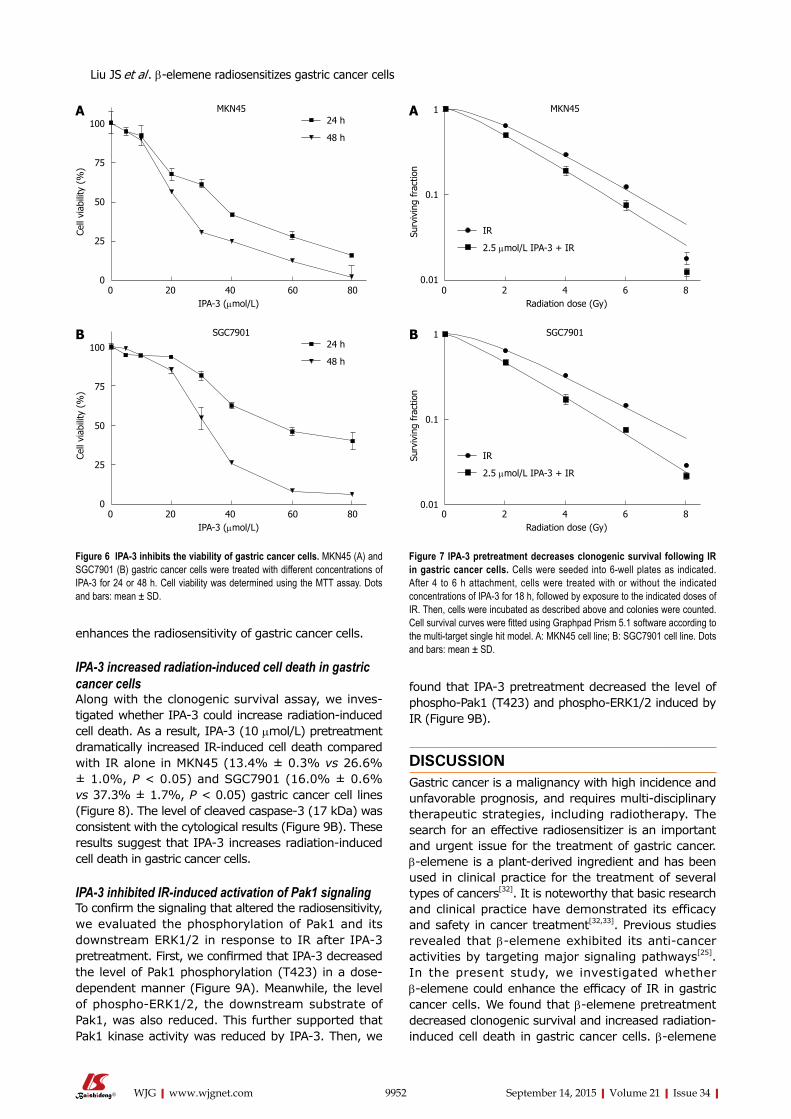
9952 September 14, 2015|Volume 21|Issue 34|WJG|www.wjgnet.com
enhances the radiosensitivity of gastric cancer cells.
IPA-3 increased radiation-induced cell death in gastric cancer cellsAlong with the clonogenic survival assay, we inves-tigated whether IPA-3 could increase radiation-induced cell death. As a result, IPA-3 (10 μmol/L) pretreatment dramatically increased IR-induced cell death compared with IR alone in MKN45 (13.4% ± 0.3% vs 26.6% ± 1.0%, P < 0.05) and SGC7901 (16.0% ± 0.6% vs 37.3% ± 1.7%, P < 0.05) gastric cancer cell lines (Figure 8). The level of cleaved caspase-3 (17 kDa) was consistent with the cytological results (Figure 9B). These results suggest that IPA-3 increases radiation-induced cell death in gastric cancer cells.
IPA-3 inhibited IR-induced activation of Pak1 signalingTo confirm the signaling that altered the radiosensitivity, we evaluated the phosphorylation of Pak1 and its downstream ERK1/2 in response to IR after IPA-3 pretreatment. First, we confirmed that IPA-3 decreased the level of Pak1 phosphorylation (T423) in a dose-dependent manner (Figure 9A). Meanwhile, the level of phospho-ERK1/2, the downstream substrate of Pak1, was also reduced. This further supported that Pak1 kinase activity was reduced by IPA-3. Then, we
found that IPA-3 pretreatment decreased the level of phospho-Pak1 (T423) and phospho-ERK1/2 induced by IR (Figure 9B).
DISCUSSIONGastric cancer is a malignancy with high incidence and unfavorable prognosis, and requires multi-disciplinary therapeutic strategies, including radiotherapy. The search for an effective radiosensitizer is an important and urgent issue for the treatment of gastric cancer. β-elemene is a plant-derived ingredient and has been used in clinical practice for the treatment of several types of cancers[32]. It is noteworthy that basic research and clinical practice have demonstrated its efficacy and safety in cancer treatment[32,33]. Previous studies revealed that β-elemene exhibited its anti-cancer activities by targeting major signaling pathways[25]. In the present study, we investigated whether β-elemene could enhance the efficacy of IR in gastric cancer cells. We found that β-elemene pretreatment decreased clonogenic survival and increased radiation-induced cell death in gastric cancer cells. β-elemene
1
0.1
0.010 2 4 6 8 Radiation dose (Gy)
Surv
ivin
g fr
actio
n
IR
2.5 μmol/L IPA-3 + IR
MKN45A
1
0.1
0.010 2 4 6 8 Radiation dose (Gy)
Surv
ivin
g fr
actio
n
SGC7901 B
Figure 7 IPA-3 pretreatment decreases clonogenic survival following IR in gastric cancer cells. Cells were seeded into 6-well plates as indicated. After 4 to 6 h attachment, cells were treated with or without the indicated concentrations of IPA-3 for 18 h, followed by exposure to the indicated doses of IR. Then, cells were incubated as described above and colonies were counted. Cell survival curves were fitted using Graphpad Prism 5.1 software according to the multi-target single hit model. A: MKN45 cell line; B: SGC7901 cell line. Dots and bars: mean ± SD.
100
75
50
25
00 20 40 60 80 IPA-3 (μmol/L)
Cell
viab
ility
(%
)
24 h
48 h
MKN45A
100
75
50
25
00 20 40 60 80 IPA-3 (μmol/L)
Cell
viab
ility
(%
)
24 h
48 h
SGC7901 B
Figure 6 IPA-3 inhibits the viability of gastric cancer cells. MKN45 (A) and SGC7901 (B) gastric cancer cells were treated with different concentrations of IPA-3 for 24 or 48 h. Cell viability was determined using the MTT assay. Dots and bars: mean ± SD.
IR
2.5 μmol/L IPA-3 + IR
Liu JS et al . β-elemene radiosensitizes gastric cancer cells
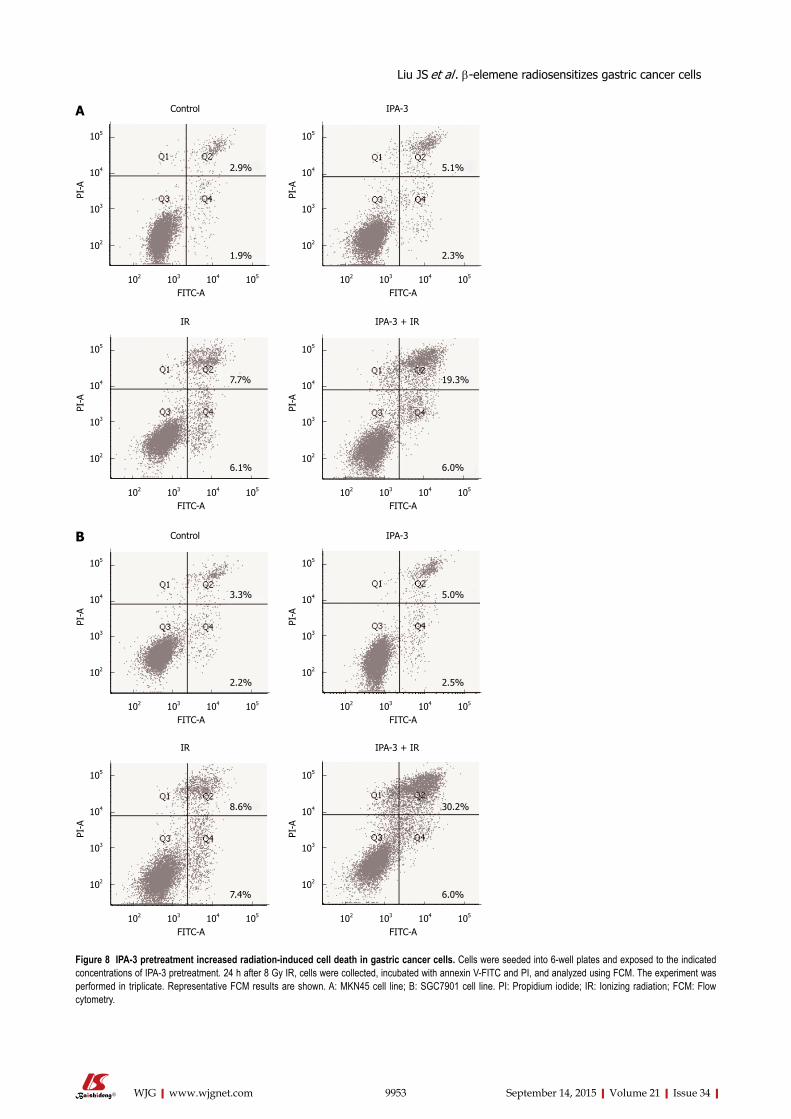
9953 September 14, 2015|Volume 21|Issue 34|WJG|www.wjgnet.com
102 103 104 105
FITC-A
105
104
103
102
PI-A
102 103 104 105
FITC-A
105
104
103
102
PI-A
102 103 104 105
FITC-A
105
104
103
102
PI-A
102 103 104 105
FITC-A
105
104
103
102
PI-A
102 103 104 105
FITC-A
105
104
103
102
PI-A
102 103 104 105
FITC-A
105
104
103
102
PI-A
102 103 104 105
FITC-A
105
104
103
102
PI-A
102 103 104 105
FITC-A
105
104
103
102
PI-A
Control IPA-3
IR IPA-3 + IR
Control IPA-3
IR IPA-3 + IR
2.9%
1.9%
5.1%
2.3%
7.7%
6.1%
19.3%
6.0%
3.3%
2.2%
5.0%
2.5%
8.6%
7.4%
30.2%
6.0%
A
B
Figure 8 IPA-3 pretreatment increased radiation-induced cell death in gastric cancer cells. Cells were seeded into 6-well plates and exposed to the indicated concentrations of IPA-3 pretreatment. 24 h after 8 Gy IR, cells were collected, incubated with annexin V-FITC and PI, and analyzed using FCM. The experiment was performed in triplicate. Representative FCM results are shown. A: MKN45 cell line; B: SGC7901 cell line. PI: Propidium iodide; IR: Ionizing radiation; FCM: Flow cytometry.
Liu JS et al . β-elemene radiosensitizes gastric cancer cells
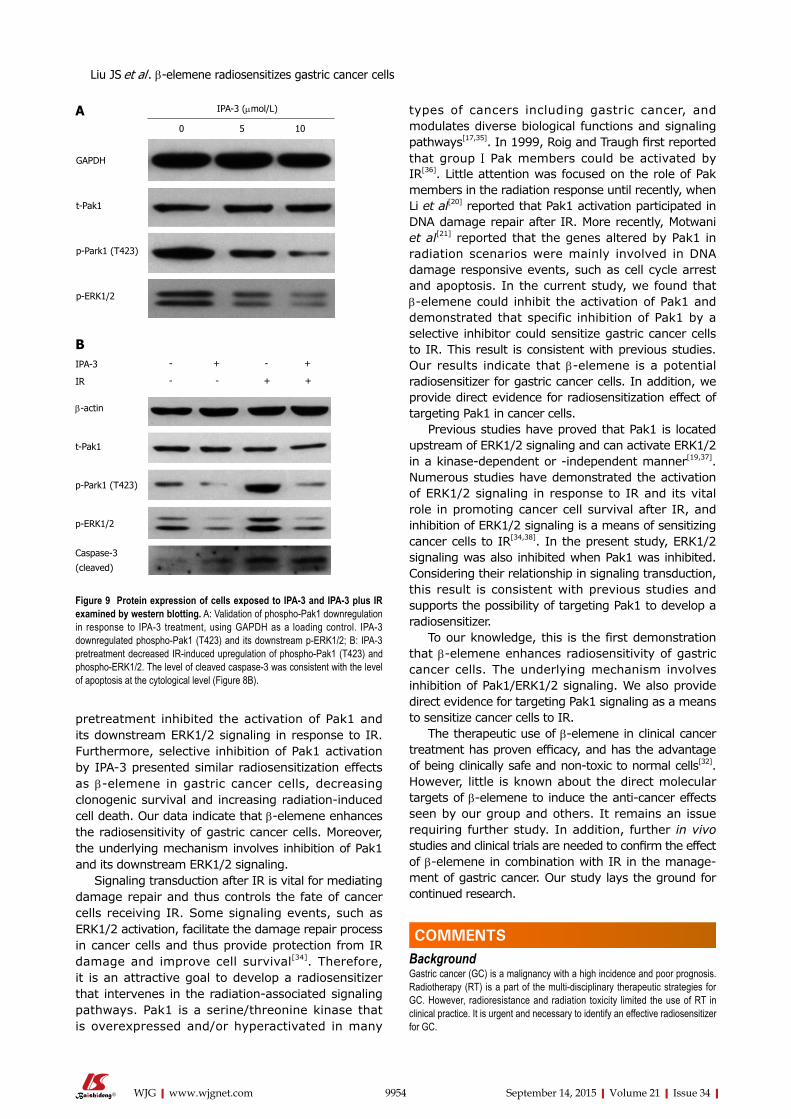
9954 September 14, 2015|Volume 21|Issue 34|WJG|www.wjgnet.com
pretreatment inhibited the activation of Pak1 and its downstream ERK1/2 signaling in response to IR. Furthermore, selective inhibition of Pak1 activation by IPA-3 presented similar radiosensitization effects as β-elemene in gastric cancer cells, decreasing clonogenic survival and increasing radiation-induced cell death. Our data indicate that β-elemene enhances the radiosensitivity of gastric cancer cells. Moreover, the underlying mechanism involves inhibition of Pak1 and its downstream ERK1/2 signaling.
Signaling transduction after IR is vital for mediating damage repair and thus controls the fate of cancer cells receiving IR. Some signaling events, such as ERK1/2 activation, facilitate the damage repair process in cancer cells and thus provide protection from IR damage and improve cell survival[34]. Therefore, it is an attractive goal to develop a radiosensitizer that intervenes in the radiation-associated signaling pathways. Pak1 is a serine/threonine kinase that is overexpressed and/or hyperactivated in many
types of cancers including gastric cancer, and modulates diverse biological functions and signaling pathways[17,35]. In 1999, Roig and Traugh first reported that group Ⅰ Pak members could be activated by IR[36]. Little attention was focused on the role of Pak members in the radiation response until recently, when Li et al[20] reported that Pak1 activation participated in DNA damage repair after IR. More recently, Motwani et al[21] reported that the genes altered by Pak1 in radiation scenarios were mainly involved in DNA damage responsive events, such as cell cycle arrest and apoptosis. In the current study, we found that β-elemene could inhibit the activation of Pak1 and demonstrated that specific inhibition of Pak1 by a selective inhibitor could sensitize gastric cancer cells to IR. This result is consistent with previous studies. Our results indicate that β-elemene is a potential radiosensitizer for gastric cancer cells. In addition, we provide direct evidence for radiosensitization effect of targeting Pak1 in cancer cells.
Previous studies have proved that Pak1 is located upstream of ERK1/2 signaling and can activate ERK1/2 in a kinase-dependent or -independent manner[19,37]. Numerous studies have demonstrated the activation of ERK1/2 signaling in response to IR and its vital role in promoting cancer cell survival after IR, and inhibition of ERK1/2 signaling is a means of sensitizing cancer cells to IR[34,38]. In the present study, ERK1/2 signaling was also inhibited when Pak1 was inhibited. Considering their relationship in signaling transduction, this result is consistent with previous studies and supports the possibility of targeting Pak1 to develop a radiosensitizer.
To our knowledge, this is the first demonstration that β-elemene enhances radiosensitivity of gastric cancer cells. The underlying mechanism involves inhibition of Pak1/ERK1/2 signaling. We also provide direct evidence for targeting Pak1 signaling as a means to sensitize cancer cells to IR.
The therapeutic use of β-elemene in clinical cancer treatment has proven efficacy, and has the advantage of being clinically safe and non-toxic to normal cells[32]. However, little is known about the direct molecular targets of β-elemene to induce the anti-cancer effects seen by our group and others. It remains an issue requiring further study. In addition, further in vivo studies and clinical trials are needed to confirm the effect of β-elemene in combination with IR in the manage-ment of gastric cancer. Our study lays the ground for continued research.
COMMENTSBackgroundGastric cancer (GC) is a malignancy with a high incidence and poor prognosis. Radiotherapy (RT) is a part of the multi-disciplinary therapeutic strategies for GC. However, radioresistance and radiation toxicity limited the use of RT in clinical practice. It is urgent and necessary to identify an effective radiosensitizer for GC.
GAPDH
t-Pak1
p-Park1 (T423)
p-ERK1/2
IPA-3
IR
β-actin
t-Pak1
p-Park1 (T423)
p-ERK1/2
Caspase-3
(cleaved)
IPA-3 (μmol/L)
0 5 10
- + - +
- - + +
A
B
Figure 9 Protein expression of cells exposed to IPA-3 and IPA-3 plus IR examined by western blotting. A: Validation of phospho-Pak1 downregulation in response to IPA-3 treatment, using GAPDH as a loading control. IPA-3 downregulated phospho-Pak1 (T423) and its downstream p-ERK1/2; B: IPA-3 pretreatment decreased IR-induced upregulation of phospho-Pak1 (T423) and phospho-ERK1/2. The level of cleaved caspase-3 was consistent with the level of apoptosis at the cytological level (Figure 8B).
Liu JS et al . β-elemene radiosensitizes gastric cancer cells
COMMENTS
9955 September 14, 2015|Volume 21|Issue 34|WJG|www.wjgnet.com
Research frontiersRecent studies have shown that β-elemene has diverse anti-cancer activities, such as inhibiting proliferation and inducing apoptosis of cancer cells, enhancing tumor chemosensitivity, and overcoming drug resistance in a variety of cancers. The involved mechanisms include interacting with various oncogenic signaling pathways.
Innovations and breakthroughsThis is the first demonstration that β-elemene enhances the radiosensitivity of gastric cancer cells. The underlying mechanism involved inhibition of Pak1 signaling, which was confirmed by targeting Pak1 using the selective small molecule inhibitor, IPA-3. This also provided direct evidence that targeting Pak1 signaling is a means of sensitizing cancer cells to ionizing radiation.
ApplicationsThis study highlights a new therapeutic possibility for improving the efficacy of RT and for reducing radiation toxicity, and may contribute to prolongation of patient survival and improvement in their quality of life.
Terminologyβ-elemene (1-methyl-1-vinyl-2,4-diisopropenyl-cyclohexane) is a novel anti-cancer compound isolated from the Chinese traditional herb Curcuma wenyujin and has diverse anti-cancer activities. Radiosensitivity is a key determinant of the radiation response and affects the efficacy of radiotherapy in cancer.
Peer-reviewThis is an interesting work. The authors present data suggesting that β-elemene enhances the radiosensitivity of gastric cancer cells via upregulation of PAK1IP1 (p21-activated protein kinase-interacting protein 1) and downregulation of phospho-Pak1 (T423) and phospho-ERK1/2. The therapeutic potential of β-elemene as a radiosensitizer for gastric cancer may be worth pursuing.
REFERENCES1 Ferlay J, Shin HR, Bray F, Forman D, Mathers C, Parkin DM.
Estimates of worldwide burden of cancer in 2008: GLOBOCAN 2008. Int J Cancer 2010; 127: 2893-2917 [PMID: 21351269 DOI: 10.1002/ijc.25516]
2 Verdecchia A, Francisci S, Brenner H, Gatta G, Micheli A, Mangone L, Kunkler I. Recent cancer survival in Europe: a 2000-02 period analysis of EUROCARE-4 data. Lancet Oncol 2007; 8: 784-796 [PMID: 17714993 DOI: 10.1016/S1470-2045(07)70246-2]
3 Dassen AE, Lemmens VE, van de Poll-Franse LV, Creemers GJ, Brenninkmeijer SJ, Lips DJ, Vd Wurff AA, Bosscha K, Coebergh JW. Trends in incidence, treatment and survival of gastric adenocarcinoma between 1990 and 2007: a population-based study in the Netherlands. Eur J Cancer 2010; 46: 1101-1110 [PMID: 20219351 DOI: 10.1016/j.ejca.2010.02.013]
4 Zhang H, Sun LL, Meng YL, Song GY, Hu JJ, Lu P, Ji B. Survival trends in gastric cancer patients of Northeast China. World J Gastroenterol 2011; 17: 3257-3262 [PMID: 21912476 DOI: 10.3748/wjg.v17.i27.3257]
5 Macdonald JS, Smalley SR, Benedetti J, Hundahl SA, Estes NC, Stemmermann GN, Haller DG, Ajani JA, Gunderson LL, Jessup JM, Martenson JA. Chemoradiotherapy after surgery compared with surgery alone for adenocarcinoma of the stomach or gastroesophageal junction. N Engl J Med 2001; 345: 725-730 [PMID: 11547741 DOI: 10.1056/NEJMoa010187]
6 Macdonald JS. Clinical overview: adjuvant therapy of gastro-intestinal cancer. Cancer Chemother Pharmacol 2004; 54 Suppl 1: S4-11 [PMID: 15309508 DOI: 10.1007/s00280-004-0880-4]
7 Kim S, Lim DH, Lee J, Kang WK, MacDonald JS, Park CH, Park SH, Lee SH, Kim K, Park JO, Kim WS, Jung CW, Park YS, Im YH, Sohn TS, Noh JH, Heo JS, Kim YI, Park CK, Park K. An observational study suggesting clinical benefit for adjuvant postoperative chemoradiation in a population of over 500 cases after gastric resection with D2 nodal dissection for adenocarcinoma of the stomach. Int J Radiat Oncol Biol Phys 2005; 63: 1279-1285 [PMID:
16099596 DOI: 10.1016/j.ijrobp.2005.05.005]8 Coburn NG, Govindarajan A, Law CH, Guller U, Kiss A, Ringash
J, Swallow CJ, Baxter NN. Stage-specific effect of adjuvant therapy following gastric cancer resection: a population-based analysis of 4,041 patients. Ann Surg Oncol 2008; 15: 500-507 [PMID: 18026800 DOI: 10.1245/s10434-007-9640-0]
9 Takahashi T, Saikawa Y, Fukuda K, Wada N, Kawakubo H, Takeuchi H, Fukada J, Kawaguchi O, Takaishi H, Shigematsu N, Kitagawa Y. [Chemoradiotherapy for advanced gastric cancer]. Gan To Kagaku Ryoho 2012; 39: 2464-2468 [PMID: 23235166]
10 Jansen EP, Saunders MP, Boot H, Oppedijk V, Dubbelman R, Porritt B, Cats A, Stroom J, Valdés Olmos R, Bartelink H, Verheij M. Prospective study on late renal toxicity following postoperative chemoradiotherapy in gastric cancer. Int J Radiat Oncol Biol Phys 2007; 67: 781-785 [PMID: 17157445 DOI: 10.1016/j.ijrobp.2006.09.012]
11 Kassam Z, Mackay H, Buckley CA, Fung S, Pintile M, Kim J, Ringash J. Evaluating the impact on quality of life of chemoradiation in gastric cancer. Curr Oncol 2010; 17: 77-84 [PMID: 20697519]
12 Gemici C, Sargin M, Uygur-Bayramicli O, Mayadagli A, Yaprak G, Dabak R, Kocak M. Risk of endocrine pancreatic insufficiency in patients receiving adjuvant chemoradiation for resected gastric cancer. Radiother Oncol 2013; 107: 195-199 [PMID: 23647754 DOI: 10.1016/j.radonc.2013.04.013]
13 Peltenburg LT. Radiosensitivity of tumor cells. Oncogenes and apoptosis. Q J Nucl Med 2000; 44: 355-364 [PMID: 11302264]
14 Ding M, Zhang E, He R, Wang X. Newly developed strategies for improving sensitivity to radiation by targeting signal pathways in cancer therapy. Cancer Sci 2013; 104: 1401-1410 [PMID: 23930697 DOI: 10.1111/cas.12252]
15 Pawlik TM, Keyomarsi K. Role of cell cycle in mediating sensitivity to radiotherapy. Int J Radiat Oncol Biol Phys 2004; 59: 928-942 [PMID: 15234026 DOI: 10.1016/j.ijrobp.2004.03.005]
16 Manser E, Leung T, Salihuddin H, Zhao ZS, Lim L. A brain serine/threonine protein kinase activated by Cdc42 and Rac1. Nature 1994; 367: 40-46 [PMID: 8107774 DOI: 10.1038/367040a0]
17 Kumar R, Gururaj AE, Barnes CJ. p21-activated kinases in cancer. Nat Rev Cancer 2006; 6: 459-471 [PMID: 16723992 DOI: 10.1038/nrc1892]
18 Zenke FT, King CC, Bohl BP, Bokoch GM. Identification of a central phosphorylation site in p21-activated kinase regulating autoinhibition and kinase activity. J Biol Chem 1999; 274: 32565-32573 [PMID: 10551809]
19 Dummler B, Ohshiro K, Kumar R, Field J. Pak protein kinases and their role in cancer. Cancer Metastasis Rev 2009; 28: 51-63 [PMID: 19165420 DOI: 10.1007/s10555-008-9168-1]
20 Li DQ, Nair SS, Ohshiro K, Kumar A, Nair VS, Pakala SB, Reddy SD, Gajula RP, Eswaran J, Aravind L, Kumar R. MORC2 signaling integrates phosphorylation-dependent, ATPase-coupled chromatin remodeling during the DNA damage response. Cell Rep 2012; 2: 1657-1669 [PMID: 23260667 DOI: 10.1016/j.celrep.2012.11.018]
21 Motwani M, Li DQ, Horvath A, Kumar R. Identification of novel gene targets and functions of p21-activated kinase 1 during DNA damage by gene expression profiling. PLoS One 2013; 8: e66585 [PMID: 23950862 DOI: 10.1371/journal.pone.0066585]
22 Gan T, Wu Z, Tian L, Wang Y. Chinese herbal medicines for induction of remission in advanced or late gastric cancer. Cochrane Database Syst Rev 2010; (1): CD005096 [PMID: 20091570 DOI: 10.1002/14651858.CD005096.pub2]
23 Tan W, Lu J, Huang M, Li Y, Chen M, Wu G, Gong J, Zhong Z, Xu Z, Dang Y, Guo J, Chen X, Wang Y. Anti-cancer natural products isolated from chinese medicinal herbs. Chin Med 2011; 6: 27 [PMID: 21777476 DOI: 10.1186/1749-8546-6-27]
24 Zhang F, Xu L, Qu X, Zhao M, Jin B, Kang J, Liu Y, Hu X. Synergistic antitumor effect of β-elemene and etoposide is mediated via induction of cell apoptosis and cell cycle arrest in non-small cell lung carcinoma cells. Mol Med Rep 2011; 4: 1189-1193 [PMID: 21904777 DOI: 10.3892/mmr.2011.537]
25 Zhan YH, Liu J, Qu XJ, Hou KZ, Wang KF, Liu YP, Wu B. β-Elemene induces apoptosis in human renal-cell carcinoma 786-0 cells through inhibition of MAPK/ERK and PI3K/Akt/ mTOR
Liu JS et al . β-elemene radiosensitizes gastric cancer cells
9956 September 14, 2015|Volume 21|Issue 34|WJG|www.wjgnet.com
signalling pathways. Asian Pac J Cancer Prev 2012; 13: 2739-2744 [PMID: 22938451]
26 Liu J, Zhang Y, Qu J, Xu L, Hou K, Zhang J, Qu X, Liu Y. β-Elemene-induced autophagy protects human gastric cancer cells from undergoing apoptosis. BMC Cancer 2011; 11: 183 [PMID: 21595977 DOI: 10.1186/1471-2407-11-183]
27 Liu JS, He SC, Zhang ZL, Chen R, Fan L, Qiu GL, Chang S, Li L, Che XM. Anticancer effects of β-elemene in gastric cancer cells and its potential underlying proteins: a proteomic study. Oncol Rep 2014; 32: 2635-2647 [PMID: 25333415 DOI: 10.3892/or.2014.3490]
28 Xia C, Ma W, Stafford LJ, Marcus S, Xiong WC, Liu M. Regulation of the p21-activated kinase (PAK) by a human Gbeta -like WD-repeat protein, hPIP1. Proc Natl Acad Sci USA 2001; 98: 6174-6179 [PMID: 11371639 DOI: 10.1073/pnas.101137298]
29 Bokoch GM. Biology of the p21-activated kinases. Annu Rev Biochem 2003; 72: 743-781 [PMID: 12676796 DOI: 10.1146/annurev.biochem.72.121801.161742]
30 Deacon SW, Beeser A, Fukui JA, Rennefahrt UE, Myers C, Chernoff J, Peterson JR. An isoform-selective, small-molecule inhibitor targets the autoregulatory mechanism of p21-activated kinase. Chem Biol 2008; 15: 322-331 [PMID: 18420139 DOI: 10.1016/j.chembiol.2008.03.005]
31 Wong LL, Lam IP, Wong TY, Lai WL, Liu HF, Yeung LL, Ching YP. IPA-3 inhibits the growth of liver cancer cells by suppressing PAK1 and NF-κB activation. PLoS One 2013; 8: e68843 [PMID: 23894351 DOI: 10.1371/journal.pone.0068843]
32 Xu HB, Zheng LP, Li L, Xu LZ, Fu J. Elemene, one ingredient of
a Chinese herb, against malignant tumors: a literature-based meta-analysis. Cancer Invest 2013; 31: 156-166 [PMID: 23286531 DOI: 10.3109/07357907.2012.756108]
33 Wang G, Li X, Huang F, Zhao J, Ding H, Cunningham C, Coad JE, Flynn DC, Reed E, Li QQ. Antitumor effect of beta-elemene in non-small-cell lung cancer cells is mediated via induction of cell cycle arrest and apoptotic cell death. Cell Mol Life Sci 2005; 62: 881-893 [PMID: 15868411 DOI: 10.1007/s00018-005-5017-3]
34 Dent P, Yacoub A, Fisher PB, Hagan MP, Grant S. MAPK pathways in radiation responses. Oncogene 2003; 22: 5885-5896 [PMID: 12947395 DOI: 10.1038/sj.onc.1206701]
35 He H, Baldwin GS. p21-activated kinases and gastrointestinal cancer. Biochim Biophys Acta 2013; 1833: 33-39 [PMID: 23092728 DOI: 10.1016/j.bbamcr.2012.10.015]
36 Roig J, Traugh JA. p21-activated protein kinase gamma-PAK is activated by ionizing radiation and other DNA-damaging agents. Similarities and differences to alpha-PAK. J Biol Chem 1999; 274: 31119-31122 [PMID: 10531298]
37 Wang Z, Fu M, Wang L, Liu J, Li Y, Brakebusch C, Mei Q. p21-activated kinase 1 (PAK1) can promote ERK activation in a kinase-independent manner. J Biol Chem 2013; 288: 20093-20099 [PMID: 23653349 DOI: 10.1074/jbc.M112.426023]
38 Qiao L, Yacoub A, McKinstry R, Park JS, Caron R, Fisher PB, Hagan MP, Grant S, Dent P. Pharmocologic inhibitors of the mitogen activated protein kinase cascade have the potential to interact with ionizing radiation exposure to induce cell death in carcinoma cells by multiple mechanisms. Cancer Biol Ther 2002; 1: 168-176 [PMID: 12170777]
P- Reviewer: Gao SY, Wei Q, Wu XP S- Editor: Ma YJ L- Editor: Cant MR E- Editor: Wang CH
Liu JS et al . β-elemene radiosensitizes gastric cancer cells
Rui Huang, Chen-Chen Yang, Yong Liu, Juan Xia, Ran Su, Ya-Li Xiong, Gui-Yang Wang, Zhen-Hua Sun, Xiao-Min Yan, Shan Lu, Chao Wu
Rui Huang, Juan Xia, Ran Su, Ya-Li Xiong, Gui-Yang Wang, Zhen-Hua Sun, Xiao-Min Yan, Chao Wu, Department of Infectious Diseases, Nanjing Drum Tower Hospital, Nanjing University Medical School, Nanjing 210008, Jiangsu Province, China
Chen-Chen Yang, Department of Infectious Diseases, Qidong People’s Hospital, Qidong 226200, Jiangsu Province, China
Yong Liu, Department of Laboratory Medicine, Nanjing Drum Tower Hospital, Nanjing University Medical School, Nanjing 210008, Jiangsu Province, China
Shan Lu, Department of Medicine, University of Massachusetts Medical School, Worcester, MA 01605, United States
Author contributions: Wu C and Lu S designed the research; Huang R, Yang CC, Liu Y, Xia J, Su R, Xiong YL, Wang GY, Sun ZH, and Yan XM performed the research; Huang R and Yang CC analyzed the data; Huang R wrote the paper; all authors have read and approved the final version for submission.
Supported by National Natural Science Foundation of China, No. 81470093; Jiangsu Provincial Outstanding Medical Academic Leader Program, No. LJ201154; and Jiangsu Provincial Clinical Medicine and Technology Special Program, No. BL2012034.
Institutional review board statement: This study was conducted in accordance with the principles of the Declaration of Helsinki and approved by the Ethics Committee of Nanjing Drum Tower Hospital (Nanjing, China).
Informed consent statement: None.
Conflict-of-interest statement: The authors declare no conflicts of interest associated with the publication of the study.
Data sharing statement: None.
Open-Access: This article is an open-access article which was selected by an in-house editor and fully peer-reviewed by external reviewers. It is distributed in accordance with the Creative Commons Attribution Non Commercial (CC BY-NC 4.0) license,
which permits others to distribute, remix, adapt, build upon this work non-commercially, and license their derivative works on different terms, provided the original work is properly cited and the use is non-commercial. See: http://creativecommons.org/licenses/by-nc/4.0/
Correspondence to: Chao Wu, MD, PhD, Department of Infectious Diseases, Nanjing Drum Tower Hospital, Nanjing University Medical School, 321 Zhongshan Road, Nanjing 210008, Jiangsu Province, China. [email protected]: +86-25-83105890 Fax: +86-25-83307115
Received: March 30, 2015 Peer-review started: March 31, 2015First decision: May 18, 2015Revised: June 7, 2015Accepted: July 8, 2015 Article in press: July 8, 2015Published online: September 14, 2015
AbstractAIM: To investigate the association of serum gamma-glutamyl transferase (GGT) levels with chronic hepatitis B infection and hepatitis B e antigen (HBeAg) seroconversion.
METHODS: A retrospective study was performed on clinical data collected from patients who had been positive for hepatitis B surface antigen for > 6 mo and who were antiviral-treatment naïve (n = 215) attending the Hepatitis Clinic at Nanjing Drum Tower Hospital between August 2010 and December 2013. Healthy individuals without liver disease (n = 83) were included as controls. Patients were categorized into four groups based on disease status as recommended by the European Association for the Study of the Liver: immune tolerance (IT; n = 47), HBeAg-positive hepatitis (EPH; n = 93), HBeAg-negative hepatitis (ENH;
ORIGINAL ARTICLE
Submit a Manuscript: http://www.wjgnet.com/esps/Help Desk: http://www.wjgnet.com/esps/helpdesk.aspxDOI: 10.3748/wjg.v21.i34.9957
World J Gastroenterol 2015 September 14; 21(34): 9957-9965 ISSN 1007-9327 (print) ISSN 2219-2840 (online)
© 2015 Baishideng Publishing Group Inc. All rights reserved.
9957 September 14, 2015|Volume 21|Issue 34|WJG|www.wjgnet.com
Retrospective Cohort Study
Association of serum gamma-glutamyl transferase with treatment outcome in chronic hepatitis B patients
INTRODUCTIONHepatitis B virus (HBV) infection remains one of the most serious health problems worldwide despite the widespread availability of safe and effective vaccines. Individuals with chronic HBV infection (CHB) are at an increased risk for developing hepatic cirrhosis, hepatocellular carcinoma (HCC), and even death[1]. As more than 2 billion people have been infected with HBV, and an estimated 350-400 million are chronically infected[1,2], advances in the detection of biomarkers specifically associated with the development of HBV-related diseases might impact patient treatment and outcome.
Recently, gamma-glutamyl transferase (GGT) has emerged as a potential biomarker in the diagnosis and treatment of HBV infection. GGT, a key enzyme in glutathione metabolism, is a cell-surface heterodimeric glycoprotein that is highly expressed in the biliary epithelium, kidney tubules, and brain capillaries[3]. To date, serum GGT levels have been routinely used as a biomarker for hepatobiliary diseases and as an indicator of alcohol intake[4], and yet, its diagnostic value remains unclear[5]. Results from several recent studies, however, have indicated that serum GGT might be of diagnostic value[5,6]. First, elevated GGT has been shown to be associated with increased mortality in liver diseases, cancer, and diabetes in the general population of the United States[6]. Second, serum GGT levels are elevated in patients with chronic hepatitis C[5,7-10]. In some studies, low baseline GGT levels have been shown to be an independent predictor of a sustained virologic response to therapy in chronic hepatitis C[11-15]. Finally, serum GGT might also be associated with the development of HCC more generally, as well as specifically, in patients with chronic hepatitis C. Therefore, GGT might be predictive in the development of HCC in non-cirrhotic patients even after successful eradication of hepatitis C virus[16-18].
Whether serum GGT levels are associated with CHB is less well understood. Here, serum GGT levels during various phases of CHB in a cohort of Chinese patients were retrospectively analyzed and investigated as a potential serum marker predictive for hepatitis B e antigen (HBeAg) seroconversion in response to nucleos(t)ide analogue (NA) therapy for CHB.
MATERIALS AND METHODSEthics statementThis study was approved by the Ethics Committee of Nanjing Drum Tower Hospital (Nanjing, China) and conducted in accordance with the principles of the Declaration of Helsinki. Written informed consent was obtained from all participating individuals.
Huang R et al . Serum GGT and chronic hepatitis B
9958 September 14, 2015|Volume 21|Issue 34|WJG|www.wjgnet.com
n = 20), and inactive carrier (IC; n = 55). Prediction of complete response (CR) based on serum GGT was also examined in EPH patients (n = 33) treated for 48 wk with nucleos(t)ide analogue (NA) therapy, including lamivudine plus adefovir combination therapy (n = 20) or entecavir monotherapy (n = 13). CR was defined as a serum hepatitis B virus DNA level < 500 copies/mL and HBeAg seroconversion by 48 wk of treatment.
RESULTS: Serum GGT levels were significantly increased in EPH and ENH patients relative to the IT, IC, and healthy control groups (P < 0.01 for all). However, no significant difference in serum GGT levels was found between the EPH and ENH groups. Baseline serum GGT levels were significantly higher in patients who achieved CR (7/33; 21.2%) compared to patients in the non-CR group (26/33; 78.8%; P = 0.011). In addition, the decline in serum GGT was greater in CR patients compared to non-CR patients after 24 wk and 48 wk of treatment (P = 0.012 and P = 0.008, respectively). The receiver operating characteristic curve yielded a sensitivity of 85.71% and a specificity of 61.54% at a threshold value of 0.89 times the upper limit of normal for baseline serum GGT in the prediction of CR following NA therapy.
CONCLUSION: Serum GGT is significantly elevated in EPH and ENH patients and is a potential biomarker for the prediction of HBeAg seroconversion following NA therapy.
Key words: Gamma-glutamyl transferase; Hepatitis B e antigen; Hepatitis B; Natural history; Nucleos(t)ide analogues; Seroconversion
© The Author(s) 2015. Published by Baishideng Publishing Group Inc. All rights reserved.
Core tip: Serum gamma-glutamyl transferase (GGT) levels have been associated with treatment response in chronic hepatitis C patients. However, whether serum GGT levels are associated with chronic hepatitis B infection is unknown. This study provides evidence that serum GGT levels are significantly elevated in patients with hepatitis B e antigen (HBeAg)-positive and HBeAg-negative hepatitis patients. Furthermore, serum GGT levels were investigated as a potential biomarker for the prediction of HBeAg seroconversion in patients with HBeAg-positive hepatitis following a 48-wk course of nucleos(t)ide analogue treatment.
Huang R, Yang CC, Liu Y, Xia J, Su R, Xiong YL, Wang GY, Sun ZH, Yan XM, Lu S, Wu C. Association of serum gamma-glutamyl transferase with treatment outcome in chronic hepatitis B patients. World J Gastroenterol 2015; 21(34): 9957-9965 Available from: URL: http://www.wjgnet.com/1007-9327/full/v21/i34/9957.htm DOI: http://dx.doi.org/10.3748/wjg.v21.i34.9957
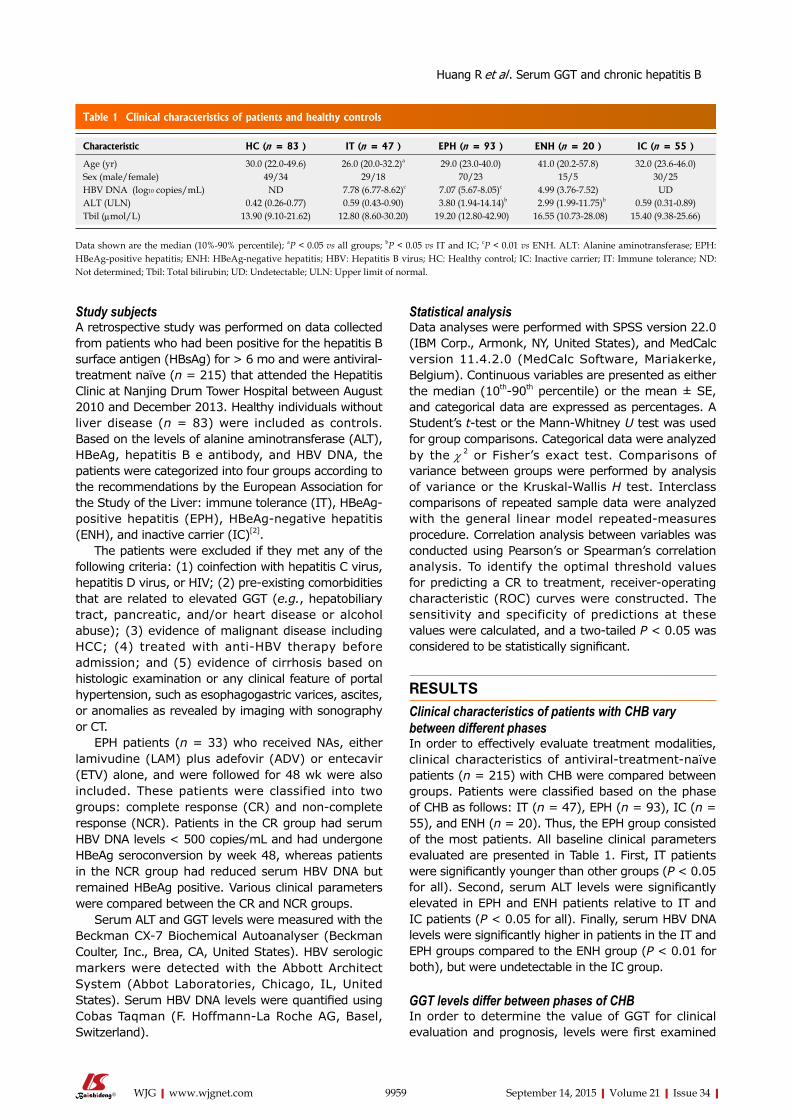
Study subjectsA retrospective study was performed on data collected from patients who had been positive for the hepatitis B surface antigen (HBsAg) for > 6 mo and were antiviral-treatment naïve (n = 215) that attended the Hepatitis Clinic at Nanjing Drum Tower Hospital between August 2010 and December 2013. Healthy individuals without liver disease (n = 83) were included as controls. Based on the levels of alanine aminotransferase (ALT), HBeAg, hepatitis B e antibody, and HBV DNA, the patients were categorized into four groups according to the recommendations by the European Association for the Study of the Liver: immune tolerance (IT), HBeAg-positive hepatitis (EPH), HBeAg-negative hepatitis (ENH), and inactive carrier (IC)[2].
The patients were excluded if they met any of the following criteria: (1) coinfection with hepatitis C virus, hepatitis D virus, or HIV; (2) pre-existing comorbidities that are related to elevated GGT (e.g., hepatobiliary tract, pancreatic, and/or heart disease or alcohol abuse); (3) evidence of malignant disease including HCC; (4) treated with anti-HBV therapy before admission; and (5) evidence of cirrhosis based on histologic examination or any clinical feature of portal hypertension, such as esophagogastric varices, ascites, or anomalies as revealed by imaging with sonography or CT.
EPH patients (n = 33) who received NAs, either lamivudine (LAM) plus adefovir (ADV) or entecavir (ETV) alone, and were followed for 48 wk were also included. These patients were classified into two groups: complete response (CR) and non-complete response (NCR). Patients in the CR group had serum HBV DNA levels < 500 copies/mL and had undergone HBeAg seroconversion by week 48, whereas patients in the NCR group had reduced serum HBV DNA but remained HBeAg positive. Various clinical parameters were compared between the CR and NCR groups.
Serum ALT and GGT levels were measured with the Beckman CX-7 Biochemical Autoanalyser (Beckman Coulter, Inc., Brea, CA, United States). HBV serologic markers were detected with the Abbott Architect System (Abbot Laboratories, Chicago, IL, United States). Serum HBV DNA levels were quantified using Cobas Taqman (F. Hoffmann-La Roche AG, Basel, Switzerland).
Statistical analysisData analyses were performed with SPSS version 22.0 (IBM Corp., Armonk, NY, United States), and MedCalc version 11.4.2.0 (MedCalc Software, Mariakerke, Belgium). Continuous variables are presented as either the median (10th-90th percentile) or the mean ± SE, and categorical data are expressed as percentages. A Student’s t-test or the Mann-Whitney U test was used for group comparisons. Categorical data were analyzed by the χ 2 or Fisher’s exact test. Comparisons of variance between groups were performed by analysis of variance or the Kruskal-Wallis H test. Interclass comparisons of repeated sample data were analyzed with the general linear model repeated-measures procedure. Correlation analysis between variables was conducted using Pearson’s or Spearman’s correlation analysis. To identify the optimal threshold values for predicting a CR to treatment, receiver-operating characteristic (ROC) curves were constructed. The sensitivity and specificity of predictions at these values were calculated, and a two-tailed P < 0.05 was considered to be statistically significant.
RESULTSClinical characteristics of patients with CHB vary between different phasesIn order to effectively evaluate treatment modalities, clinical characteristics of antiviral-treatment-naïve patients (n = 215) with CHB were compared between groups. Patients were classified based on the phase of CHB as follows: IT (n = 47), EPH (n = 93), IC (n = 55), and ENH (n = 20). Thus, the EPH group consisted of the most patients. All baseline clinical parameters evaluated are presented in Table 1. First, IT patients were significantly younger than other groups (P < 0.05 for all). Second, serum ALT levels were significantly elevated in EPH and ENH patients relative to IT and IC patients (P < 0.05 for all). Finally, serum HBV DNA levels were significantly higher in patients in the IT and EPH groups compared to the ENH group (P < 0.01 for both), but were undetectable in the IC group.
GGT levels differ between phases of CHBIn order to determine the value of GGT for clinical evaluation and prognosis, levels were first examined
9959 September 14, 2015|Volume 21|Issue 34|WJG|www.wjgnet.com
Table 1 Clinical characteristics of patients and healthy controls
Characteristic HC (n = 83 ) IT (n = 47 ) EPH (n = 93 ) ENH (n = 20 ) IC (n = 55 )
Age (yr) 30.0 (22.0-49.6) 26.0 (20.0-32.2)a 29.0 (23.0-40.0) 41.0 (20.2-57.8) 32.0 (23.6-46.0)Sex (male/female) 49/34 29/18 70/23 15/5 30/25HBV DNA (log10 copies/mL) ND 7.78 (6.77-8.62)c 7.07 (5.67-8.05)c 4.99 (3.76-7.52) UDALT (ULN) 0.42 (0.26-0.77) 0.59 (0.43-0.90) 3.80 (1.94-14.14)b 2.99 (1.99-11.75)b 0.59 (0.31-0.89)Tbil (μmol/L) 13.90 (9.10-21.62) 12.80 (8.60-30.20) 19.20 (12.80-42.90) 16.55 (10.73-28.08) 15.40 (9.38-25.66)
Data shown are the median (10%-90% percentile); aP < 0.05 vs all groups; bP < 0.05 vs IT and IC; cP < 0.01 vs ENH. ALT: Alanine aminotransferase; EPH: HBeAg-positive hepatitis; ENH: HBeAg-negative hepatitis; HBV: Hepatitis B virus; HC: Healthy control; IC: Inactive carrier; IT: Immune tolerance; ND: Not determined; Tbil: Total bilirubin; UD: Undetectable; ULN: Upper limit of normal.
Huang R et al . Serum GGT and chronic hepatitis B
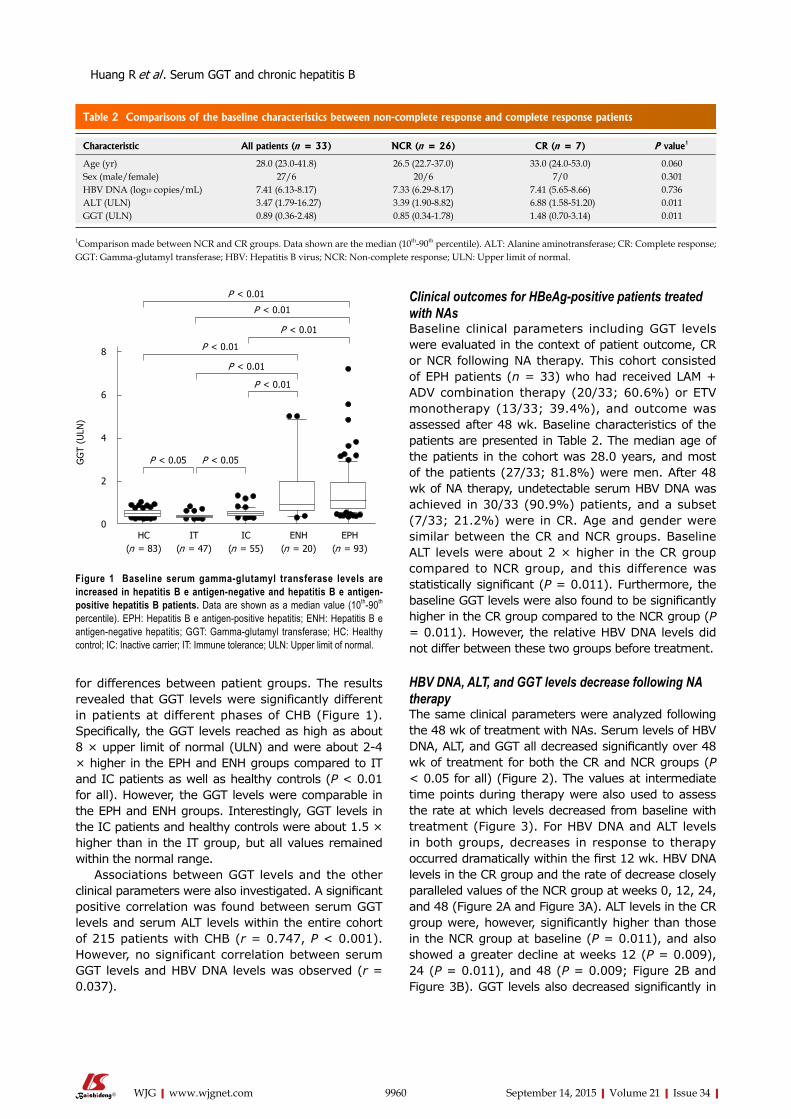
Clinical outcomes for HBeAg-positive patients treated with NAsBaseline clinical parameters including GGT levels were evaluated in the context of patient outcome, CR or NCR following NA therapy. This cohort consisted of EPH patients (n = 33) who had received LAM + ADV combination therapy (20/33; 60.6%) or ETV monotherapy (13/33; 39.4%), and outcome was assessed after 48 wk. Baseline characteristics of the patients are presented in Table 2. The median age of the patients in the cohort was 28.0 years, and most of the patients (27/33; 81.8%) were men. After 48 wk of NA therapy, undetectable serum HBV DNA was achieved in 30/33 (90.9%) patients, and a subset (7/33; 21.2%) were in CR. Age and gender were similar between the CR and NCR groups. Baseline ALT levels were about 2 × higher in the CR group compared to NCR group, and this difference was statistically significant (P = 0.011). Furthermore, the baseline GGT levels were also found to be significantly higher in the CR group compared to the NCR group (P = 0.011). However, the relative HBV DNA levels did not differ between these two groups before treatment.
HBV DNA, ALT, and GGT levels decrease following NA therapyThe same clinical parameters were analyzed following the 48 wk of treatment with NAs. Serum levels of HBV DNA, ALT, and GGT all decreased significantly over 48 wk of treatment for both the CR and NCR groups (P < 0.05 for all) (Figure 2). The values at intermediate time points during therapy were also used to assess the rate at which levels decreased from baseline with treatment (Figure 3). For HBV DNA and ALT levels in both groups, decreases in response to therapy occurred dramatically within the first 12 wk. HBV DNA levels in the CR group and the rate of decrease closely paralleled values of the NCR group at weeks 0, 12, 24, and 48 (Figure 2A and Figure 3A). ALT levels in the CR group were, however, significantly higher than those in the NCR group at baseline (P = 0.011), and also showed a greater decline at weeks 12 (P = 0.009), 24 (P = 0.011), and 48 (P = 0.009; Figure 2B and Figure 3B). GGT levels also decreased significantly in
for differences between patient groups. The results revealed that GGT levels were significantly different in patients at different phases of CHB (Figure 1). Specifically, the GGT levels reached as high as about 8 × upper limit of normal (ULN) and were about 2-4 × higher in the EPH and ENH groups compared to IT and IC patients as well as healthy controls (P < 0.01 for all). However, the GGT levels were comparable in the EPH and ENH groups. Interestingly, GGT levels in the IC patients and healthy controls were about 1.5 × higher than in the IT group, but all values remained within the normal range.
Associations between GGT levels and the other clinical parameters were also investigated. A significant positive correlation was found between serum GGT levels and serum ALT levels within the entire cohort of 215 patients with CHB (r = 0.747, P < 0.001). However, no significant correlation between serum GGT levels and HBV DNA levels was observed (r = 0.037).
9960 September 14, 2015|Volume 21|Issue 34|WJG|www.wjgnet.com
Figure 1 Baseline serum gamma-glutamyl transferase levels are increased in hepatitis B e antigen-negative and hepatitis B e antigen-positive hepatitis B patients. Data are shown as a median value (10th-90th
percentile). EPH: Hepatitis B e antigen-positive hepatitis; ENH: Hepatitis B e antigen-negative hepatitis; GGT: Gamma-glutamyl transferase; HC: Healthy control; IC: Inactive carrier; IT: Immune tolerance; ULN: Upper limit of normal.
Table 2 Comparisons of the baseline characteristics between non-complete response and complete response patients
Characteristic All patients (n = 33) NCR (n = 26) CR (n = 7) P value1
Age (yr) 28.0 (23.0-41.8) 26.5 (22.7-37.0) 33.0 (24.0-53.0) 0.060Sex (male/female) 27/6 20/6 7/0 0.301HBV DNA (log10 copies/mL) 7.41 (6.13-8.17) 7.33 (6.29-8.17) 7.41 (5.65-8.66) 0.736ALT (ULN) 3.47 (1.79-16.27) 3.39 (1.90-8.82) 6.88 (1.58-51.20) 0.011GGT (ULN) 0.89 (0.36-2.48) 0.85 (0.34-1.78) 1.48 (0.70-3.14) 0.011
1Comparison made between NCR and CR groups. Data shown are the median (10th-90th percentile). ALT: Alanine aminotransferase; CR: Complete response; GGT: Gamma-glutamyl transferase; HBV: Hepatitis B virus; NCR: Non-complete response; ULN: Upper limit of normal.
Huang R et al . Serum GGT and chronic hepatitis B
P < 0.05 P < 0.05
P < 0.01
P < 0.01
P < 0.01
P < 0.01
P < 0.01
P < 0.01
HC(n = 83)
IT(n = 47)
IC(n = 55)
ENH(n = 20)
EPH(n = 93)
GG
T (U
LN)
8
6
4
2
0
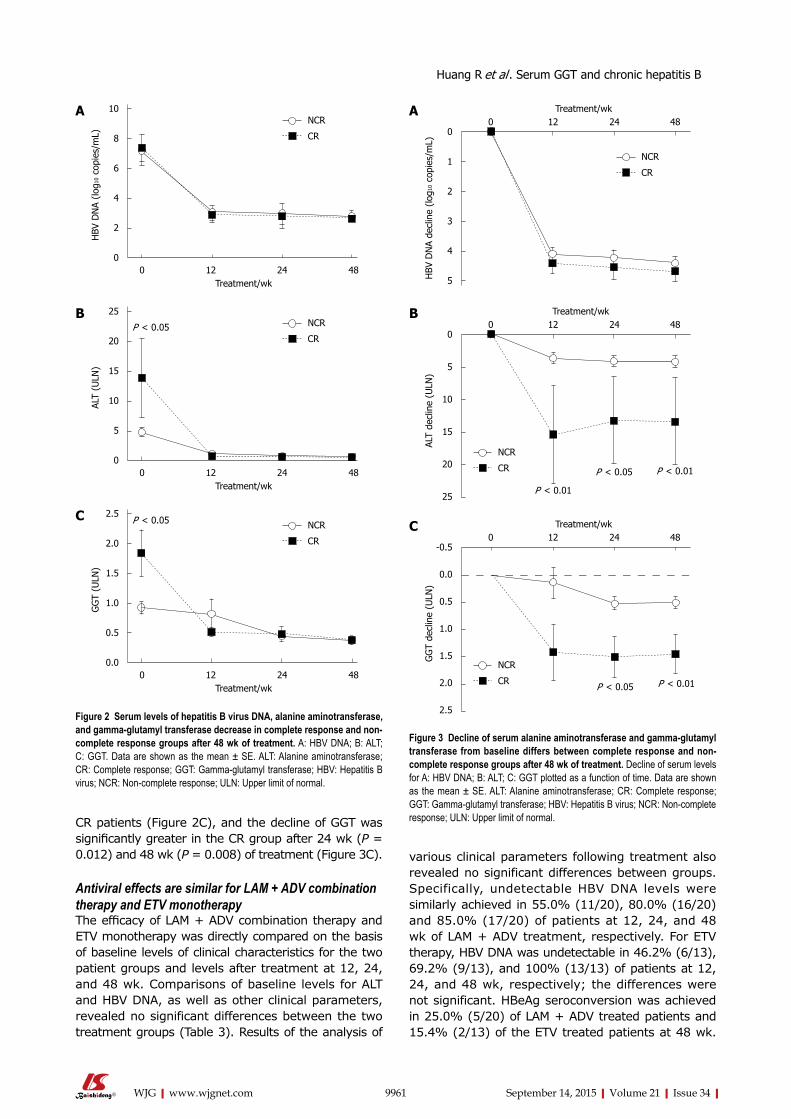
CR patients (Figure 2C), and the decline of GGT was significantly greater in the CR group after 24 wk (P = 0.012) and 48 wk (P = 0.008) of treatment (Figure 3C).
Antiviral effects are similar for LAM + ADV combination therapy and ETV monotherapyThe efficacy of LAM + ADV combination therapy and ETV monotherapy was directly compared on the basis of baseline levels of clinical characteristics for the two patient groups and levels after treatment at 12, 24, and 48 wk. Comparisons of baseline levels for ALT and HBV DNA, as well as other clinical parameters, revealed no significant differences between the two treatment groups (Table 3). Results of the analysis of
various clinical parameters following treatment also revealed no significant differences between groups. Specifically, undetectable HBV DNA levels were similarly achieved in 55.0% (11/20), 80.0% (16/20) and 85.0% (17/20) of patients at 12, 24, and 48 wk of LAM + ADV treatment, respectively. For ETV therapy, HBV DNA was undetectable in 46.2% (6/13), 69.2% (9/13), and 100% (13/13) of patients at 12, 24, and 48 wk, respectively; the differences were not significant. HBeAg seroconversion was achieved in 25.0% (5/20) of LAM + ADV treated patients and 15.4% (2/13) of the ETV treated patients at 48 wk.
9961 September 14, 2015|Volume 21|Issue 34|WJG|www.wjgnet.com
0 12 24 48 Treatment/wk
10
8
6
4
2
0
HBV
DN
A (lo
g10
copi
es/m
L)
NCR
CR
0 12 24 48 Treatment/wk
2.5
2.0
1.5
1.0
0.5
0.0
GG
T (U
LN)
NCR
CR
P < 0.05
A
0 12 24 48 Treatment/wk
25
20
15
10
5
0
ALT
(ULN
)
NCR
CRP < 0.05
B
C
Figure 2 Serum levels of hepatitis B virus DNA, alanine aminotransferase, and gamma-glutamyl transferase decrease in complete response and non-complete response groups after 48 wk of treatment. A: HBV DNA; B: ALT; C: GGT. Data are shown as the mean ± SE. ALT: Alanine aminotransferase; CR: Complete response; GGT: Gamma-glutamyl transferase; HBV: Hepatitis B virus; NCR: Non-complete response; ULN: Upper limit of normal.
Treatment/wk0 12 24 48
0
1
2
3
4
5HBV
DN
A de
clin
e (lo
g10
copi
es/m
L)
NCR
CR
A
Treatment/wk0 12 24 48
0
5
10
15
20
25
ALT
decl
ine
(ULN
)
NCR
CR
B
P < 0.01
P < 0.05 P < 0.01
Treatment/wk0 12 24 48
-0.5
0.0
0.5
1.0
1.5
2.0
2.5
GG
T de
clin
e (U
LN)
NCR
CR
C
P < 0.01P < 0.05
Figure 3 Decline of serum alanine aminotransferase and gamma-glutamyl transferase from baseline differs between complete response and non-complete response groups after 48 wk of treatment. Decline of serum levels for A: HBV DNA; B: ALT; C: GGT plotted as a function of time. Data are shown as the mean ± SE. ALT: Alanine aminotransferase; CR: Complete response; GGT: Gamma-glutamyl transferase; HBV: Hepatitis B virus; NCR: Non-complete response; ULN: Upper limit of normal.
Huang R et al . Serum GGT and chronic hepatitis B
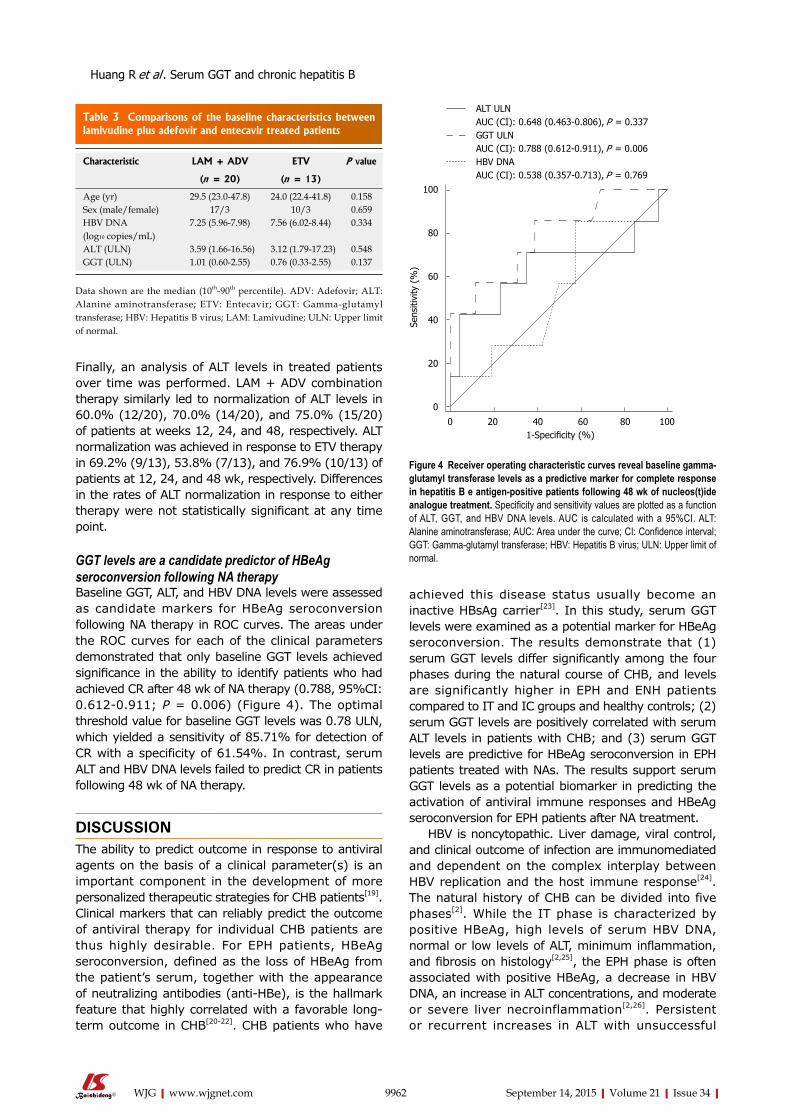
Finally, an analysis of ALT levels in treated patients over time was performed. LAM + ADV combination therapy similarly led to normalization of ALT levels in 60.0% (12/20), 70.0% (14/20), and 75.0% (15/20) of patients at weeks 12, 24, and 48, respectively. ALT normalization was achieved in response to ETV therapy in 69.2% (9/13), 53.8% (7/13), and 76.9% (10/13) of patients at 12, 24, and 48 wk, respectively. Differences in the rates of ALT normalization in response to either therapy were not statistically significant at any time point.
GGT levels are a candidate predictor of HBeAg seroconversion following NA therapyBaseline GGT, ALT, and HBV DNA levels were assessed as candidate markers for HBeAg seroconversion following NA therapy in ROC curves. The areas under the ROC curves for each of the clinical parameters demonstrated that only baseline GGT levels achieved significance in the ability to identify patients who had achieved CR after 48 wk of NA therapy (0.788, 95%CI: 0.612-0.911; P = 0.006) (Figure 4). The optimal threshold value for baseline GGT levels was 0.78 ULN, which yielded a sensitivity of 85.71% for detection of CR with a specificity of 61.54%. In contrast, serum ALT and HBV DNA levels failed to predict CR in patients following 48 wk of NA therapy.
DISCUSSIONThe ability to predict outcome in response to antiviral agents on the basis of a clinical parameter(s) is an important component in the development of more personalized therapeutic strategies for CHB patients[19]. Clinical markers that can reliably predict the outcome of antiviral therapy for individual CHB patients are thus highly desirable. For EPH patients, HBeAg seroconversion, defined as the loss of HBeAg from the patient’s serum, together with the appearance of neutralizing antibodies (anti-HBe), is the hallmark feature that highly correlated with a favorable long-term outcome in CHB[20-22]. CHB patients who have
achieved this disease status usually become an inactive HBsAg carrier[23]. In this study, serum GGT levels were examined as a potential marker for HBeAg seroconversion. The results demonstrate that (1) serum GGT levels differ significantly among the four phases during the natural course of CHB, and levels are significantly higher in EPH and ENH patients compared to IT and IC groups and healthy controls; (2) serum GGT levels are positively correlated with serum ALT levels in patients with CHB; and (3) serum GGT levels are predictive for HBeAg seroconversion in EPH patients treated with NAs. The results support serum GGT levels as a potential biomarker in predicting the activation of antiviral immune responses and HBeAg seroconversion for EPH patients after NA treatment.
HBV is noncytopathic. Liver damage, viral control, and clinical outcome of infection are immunomediated and dependent on the complex interplay between HBV replication and the host immune response[24]. The natural history of CHB can be divided into five phases[2]. While the IT phase is characterized by positive HBeAg, high levels of serum HBV DNA, normal or low levels of ALT, minimum inflammation, and fibrosis on histology[2,25], the EPH phase is often associated with positive HBeAg, a decrease in HBV DNA, an increase in ALT concentrations, and moderate or severe liver necroinflammation[2,26]. Persistent or recurrent increases in ALT with unsuccessful
9962 September 14, 2015|Volume 21|Issue 34|WJG|www.wjgnet.com
Table 3 Comparisons of the baseline characteristics between lamivudine plus adefovir and entecavir treated patients
Characteristic LAM + ADV ETV P value
(n = 20) (n = 13)
Age (yr) 29.5 (23.0-47.8) 24.0 (22.4-41.8) 0.158Sex (male/female) 17/3 10/3 0.659HBV DNA (log10 copies/mL)
7.25 (5.96-7.98) 7.56 (6.02-8.44) 0.334
ALT (ULN) 3.59 (1.66-16.56) 3.12 (1.79-17.23) 0.548GGT (ULN) 1.01 (0.60-2.55) 0.76 (0.33-2.55) 0.137
Data shown are the median (10th-90th percentile). ADV: Adefovir; ALT: Alanine aminotransferase; ETV: Entecavir; GGT: Gamma-glutamyl transferase; HBV: Hepatitis B virus; LAM: Lamivudine; ULN: Upper limit of normal.
100
80
60
40
20
0
0 20 40 60 80 100 1-Specificity (%)
Sens
itivi
ty (
%)
ALT ULNAUC (CI): 0.648 (0.463-0.806), P = 0.337GGT ULNAUC (CI): 0.788 (0.612-0.911), P = 0.006HBV DNAAUC (CI): 0.538 (0.357-0.713), P = 0.769
Figure 4 Receiver operating characteristic curves reveal baseline gamma-glutamyl transferase levels as a predictive marker for complete response in hepatitis B e antigen-positive patients following 48 wk of nucleos(t)ide analogue treatment. Specificity and sensitivity values are plotted as a function of ALT, GGT, and HBV DNA levels. AUC is calculated with a 95%CI. ALT: Alanine aminotransferase; AUC: Area under the curve; CI: Confidence interval; GGT: Gamma-glutamyl transferase; HBV: Hepatitis B virus; ULN: Upper limit of normal.
Huang R et al . Serum GGT and chronic hepatitis B
immune clearance increase the risk of liver cirrhosis and HCC[27]. However, patients in the IC phase usually exhibit very low (generally < 2000 IU/mL) or undetectable serum HBV DNA levels, but normal serum ALT[2]. After HBeAg seroconversion, some patients may experience reactivation of HBV infection with a pattern of fluctuating levels of HBV DNA and serum ALT, developing into the ENH phase[2,24]. It is known that ENH patients have increased risk of liver cirrhosis and HCC[27]. As indications for treatment are based largely on serum HBV DNA and ALT levels and the severity of liver disease[2], EPH and ENH patients are often considered for NA treatment. In the case of EPH patients, HBV DNA levels above 2000 IU/mL, serum ALT levels above the ULN, and complication of other liver diseases are considered as indicators for treatment[2].
Currently available treatments for CHB include conventional interferon-alpha, pegylated interferon-alpha, and six NAs[2]. The NAs ETV and tenofovir disoproxil are potent HBV inhibitors, and are recommended as first-line monotherapies as resistance to the drugs is slow to develop[2]. However, tenofovir disoproxil has not been approved for CHB treatment in China. Thus, initial therapies involving either a monotherapy or a combination of NA therapies are reasonable strategies for preventing the development of resistance[28]. Both LAM + ADV combination therapy and ETV monotherapy have been demonstrated to be effective in naïve (HBeAg-positive and HBeAg-negative) CHB patients[29,30]. Moreover, the cost of LAM + ADV is less than ETV monotherapy in China. Efficacy of the two treatment strategies was found to be similar in the cohort of 33 EPH patients analyzed in this study. The results are consistent with previous findings, and thus further support this approach in the treatment of CHB patients in China[29,30].
Pretreatment factors previously found to be predictive of HBeAg seroconversion in response to NA treatment were low viral load and high serum ALT levels[2,31-34]. In the present study, serum ALT levels are relatively higher in the CR group compared to the NCR group. However, ROC analysis indicated that serum ALT levels are not predictive for response to NA therapy. This result is possibly due to the relatively small sample size (n = 33) of our cohort. Serum GGT levels of EPH patients at baseline are also significantly higher in the CR group compared to the NCR group. Levels did decrease after NA treatment, and at 24 and 48 wk of treatment, the decline in serum GGT levels was significantly greater in the CR group. High baseline GGT levels thus appeared to be associated with response to NA treatment after 48 wk as well as predictive for HBeAg seroconversion. Therefore, the GGT levels may be an additional predictor of treatment outcome in EPH patients.
Baseline and early decline of HBeAg and HBsAg levels have previously exhibited a high predictive value
for virologic response and HBeAg seroconversion in NA-treated EPH patients[35-39]. HBeAg and HBsAg, however, were not quantitated in some of the EPH patients in our study, and therefore, we were unable to evaluate the relative predictive value of GGT and/or quantitative HBeAg and HBsAg.
Why serum GGT levels are linked to NA treatment-induced HBeAg seroconversion in CHB is unclear. It has been reported that elevated serum GGT levels may be related to bile duct damage, severe necroinflammatory activity, advanced fibrosis, or hepatic steatosis[8,40-42]. Elevated serum GGT levels have also been found to be associated with advanced histologic liver damage in patients with HBV[43]. High activity scores on liver biopsy have been reported to be a pretreatment predictor of anti-HBe seroconversion for NA treatment[2]. However, the association between serum GGT levels and activity scores in liver biopsies requires further study.
In conclusion, the results presented here support serum GGT as a potential new biomarker for the design of personalized antiviral therapy for EPH patients. Thus, serum GGT levels should be included in the diagnosis and management of more CHB patients in order to establish the clinical utility of the parameter.
ACKNOWLEDGMENTSThe authors are grateful to all patients who partici-pated in the study, and Prof. Zhigang He (Children’s Hospital Boston, Harvard Medical School, Boston, MA, United States) for critical reading and editing of the manuscript.
COMMENTSBackgroundSerum gamma-glutamyl transferase (GGT) has been demonstrated to be associated with treatment response for chronic hepatitis C. However, whether a relationship also exists between serum GGT levels and chronic hepatitis B virus infection (CHB) that could improve the selection of therapeutic modalities remains unclear.
Research frontiersPredicting outcome with antiviral agents in CHB patients is under intense investigation, as the approach might improve the selection of therapeutic methods. Thus, it is desirable to identify parameters that can reliably predict the outcome of antiviral therapy for individual patients with CHB.
Innovations and breakthroughsSerum GGT increased significantly in hepatitis B e antigen (HBeAg)-positive hepatitis (EPH) and HBeAg-negative hepatitis patients compared to immune tolerance, inactive carrier, and healthy control groups. High baseline serum GGT levels exhibited a high predictive value for HBeAg seroconversion in EPH patients after 48 wk of treatment with nucleos(t)ide analogues.
ApplicationsThe results indicate that serum GGT is a candidate biomarker for prediction of HBeAg seroconversion in EPH patients treated with nucleos(t)ide analogues. Evaluation of serum GGT may provide additional information critical for improvement in the clinical management of CHB patients.
9963 September 14, 2015|Volume 21|Issue 34|WJG|www.wjgnet.com
COMMENTS
Huang R et al . Serum GGT and chronic hepatitis B
TerminologyGGT, a key enzyme involved in glutathione metabolism, is a cell surface heterodimeric glycoprotein that is highly expressed in the biliary epithelium, kidney tubules, and brain capillaries.
Peer-reviewThis is a very interesting manuscript with potential clinical implications for improving the management of hepatitis B virus infection through the use of an inexpensive, noninvasive, easy-to-perform test for serum GGT levels. The manuscript is of interest to the field and well presented. The study design is well constructed, and the results contribute novel insight into the development of more personalized therapy for hepatitis B virus patients.
REFERENCES1 Liaw YF, Chu CM. Hepatitis B virus infection. Lancet 2009; 373:
582-592 [PMID: 19217993 DOI: 10.1016/S0140-6736(09)60207-5]2 European Association For The Study Of The Liver. EASL
clinical practice guidelines: Management of chronic hepatitis B virus infection. J Hepatol 2012; 57: 167-185 [PMID: 22436845 DOI: 10.1016/j.jhep.2012.02.010]
3 Whitfield JB. Gamma glutamyl transferase. Crit Rev Clin Lab Sci 2001; 38: 263-355 [PMID: 11563810]
4 Griffith OW, Bridges RJ, Meister A. Transport of gamma-glutamyl amino acids: role of glutathione and gamma-glutamyl transpeptidase. Proc Natl Acad Sci USA 1979; 76: 6319-6322 [PMID: 42913]
5 Everhart JE, Wright EC. Association of γ-glutamyl transferase (GGT) activity with treatment and clinical outcomes in chronic hepatitis C (HCV). Hepatology 2013; 57: 1725-1733 [PMID: 23258530 DOI: 10.1002/hep.26203]
6 Ruhl CE, Everhart JE. Elevated serum alanine aminotransferase and gamma-glutamyltransferase and mortality in the United States population. Gastroenterology 2009; 136: 477-85.e11 [PMID: 19100265 DOI: 10.1053/j.gastro.2008.10.052]
7 Villela-Nogueira CA, Perez RM, de Segadas Soares JA, Coelho HS. Gamma-glutamyl transferase (GGT) as an independent predictive factor of sustained virologic response in patients with hepatitis C treated with interferon-alpha and ribavirin. J Clin Gastroenterol 2005; 39: 728-730 [PMID: 16082285]
8 Silva IS, Ferraz ML, Perez RM, Lanzoni VP, Figueiredo VM, Silva AE. Role of gamma-glutamyl transferase activity in patients with chronic hepatitis C virus infection. J Gastroenterol Hepatol 2004; 19: 314-318 [PMID: 14748879]
9 Forns X, Ampurdanès S, Llovet JM, Aponte J, Quintó L, Martínez-Bauer E, Bruguera M, Sánchez-Tapias JM, Rodés J. Identification of chronic hepatitis C patients without hepatic fibrosis by a simple predictive model. Hepatology 2002; 36: 986-992 [PMID: 12297848]
10 Güzelbulut F, Sezikli M, Cetinkaya ZA, Ozkara S, Gönen C, Ovünç AO. A lower serum gamma-glutamyltransferase level does not predict a sustained virological response in patients with chronic hepatitis C genotype 1. Gut Liver 2013; 7: 74-81 [PMID: 23423958 DOI: 10.5009/gnl.2013.7.1.74]
11 Grasso A, Malfatti F, De Leo P, Martines H, Fabris P, Toscanini F, Anselmo M, Menardo G. Insulin resistance predicts rapid virological response in non-diabetic, non-cirrhotic genotype 1 HCV patients treated with peginterferon alpha-2b plus ribavirin. J Hepatol 2009; 51: 984-990 [PMID: 19695729 DOI: 10.1016/j.jhep.2009.07.008]
12 Kau A, Vermehren J, Sarrazin C. Treatment predictors of a sustained virologic response in hepatitis B and C. J Hepatol 2008; 49: 634-651 [PMID: 18715665 DOI: 10.1016/j.jhep.2008.07.013]
13 Dogan UB, Akin MS, Yalaki S. A low serum γ-glutamyltransferase level predicts a sustained virological response in patients with chronic hepatitis C genotype 1. Gut Liver 2014; 8: 113-115 [PMID: 24516710 DOI: 10.5009/gnl.2014.8.1.113]
14 Bergmann JF, Vrolijk JM, van der Schaar P, Vroom B, van Hoek B, van der Sluys Veer A, de Vries RA, Verhey E, Hansen BE, Brouwer JT, Janssen HL, Schalm SW, de Knegt RJ. Gamma-
glutamyltransferase and rapid virological response as predictors of successful treatment with experimental or standard peginterferon-alpha-2b in chronic hepatitis C non-responders. Liver Int 2007; 27: 1217-1225 [PMID: 17919233]
15 Akuta N, Suzuki F, Kawamura Y, Yatsuji H, Sezaki H, Suzuki Y, Hosaka T, Kobayashi M, Kobayashi M, Arase Y, Ikeda K, Kumada H. Predictive factors of early and sustained responses to peginterferon plus ribavirin combination therapy in Japanese patients infected with hepatitis C virus genotype 1b: amino acid substitutions in the core region and low-density lipoprotein cholesterol levels. J Hepatol 2007; 46: 403-410 [PMID: 17126448]
16 Huang CF, Yeh ML, Tsai PC, Hsieh MH, Yang HL, Hsieh MY, Yang JF, Lin ZY, Chen SC, Wang LY, Dai CY, Huang JF, Chuang WL, Yu ML. Baseline gamma-glutamyl transferase levels strongly correlate with hepatocellular carcinoma development in non-cirrhotic patients with successful hepatitis C virus eradication. J Hepatol 2014; 61: 67-74 [PMID: 24613362 DOI: 10.1016/j.jhep.2014.02.022]
17 Hu G, Tuomilehto J, Pukkala E, Hakulinen T, Antikainen R, Vartiainen E, Jousilahti P. Joint effects of coffee consumption and serum gamma-glutamyltransferase on the risk of liver cancer. Hepatology 2008; 48: 129-136 [PMID: 18537182 DOI: 10.1002/hep.22320]
18 Van Hemelrijck M, Jassem W, Walldius G, Fentiman IS, Hammar N, Lambe M, Garmo H, Jungner I, Holmberg L. Gamma-glutamyltransferase and risk of cancer in a cohort of 545,460 persons - the Swedish AMORIS study. Eur J Cancer 2011; 47: 2033-2041 [PMID: 21486691 DOI: 10.1016/j.ejca.2011.03.010]
19 Janssen HL, Reijnders JG. Treatment with nucleos(t)ide analogues in chronic hepatitis B: where does the road map lead us? J Hepatol 2009; 51: 1-3 [PMID: 19443071 DOI: 10.1016/j.jhep.2009.04.007]
20 Chen CJ, Yang HI, Su J, Jen CL, You SL, Lu SN, Huang GT, Iloeje UH; REVEAL-HBV Study Group. Risk of hepatocellular carcinoma across a biological gradient of serum hepatitis B virus DNA level. JAMA 2006; 295: 65-73 [PMID: 16391218]
21 Yang HI, Lu SN, Liaw YF, You SL, Sun CA, Wang LY, Hsiao CK, Chen PJ, Chen DS, Chen CJ; Taiwan Community-Based Cancer Screening Project Group. Hepatitis B e antigen and the risk of hepatocellular carcinoma. N Engl J Med 2002; 347: 168-174 [PMID: 12124405 DOI: 10.1056/NEJM00013215]
22 Hui CK, Leung N, Shek TW, Yao H, Lee WK, Lai JY, Lai ST, Wong WM, Lai LS, Poon RT, Lo CM, Fan ST, Lau GK; Hong Kong Liver Fibrosis Study Group. Sustained disease remission after spontaneous HBeAg seroconversion is associated with reduction in fibrosis progression in chronic hepatitis B Chinese patients. Hepatology 2007; 46: 690-698 [PMID: 17680649 DOI: 10.1002/hep.21758]
23 Lok AS, McMahon BJ. Chronic hepatitis B: update 2009. Hepatology 2009; 50: 661-662 [PMID: 19714720 DOI: 10.1002/hep.23190]
24 Trépo C, Chan HL, Lok A. Hepatitis B virus infection. Lancet 2014; 384: 2053-2063 [PMID: 24954675 DOI: 10.1016/S0140-6736(14)60220-8]
25 Hui CK, Leung N, Yuen ST, Zhang HY, Leung KW, Lu L, Cheung SK, Wong WM, Lau GK; Hong Kong Liver Fibrosis Study Group. Natural history and disease progression in Chinese chronic hepatitis B patients in immune-tolerant phase. Hepatology 2007; 46: 395-401 [PMID: 17628874 DOI: 10.1002/hep.21724]
26 Chan HL, Wong VW, Wong GL, Tse CH, Chan HY, Sung JJ. A longitudinal study on the natural history of serum hepatitis B surface antigen changes in chronic hepatitis B. Hepatology 2010; 52: 1232-1241 [PMID: 20648555 DOI: 10.1002/hep.23803]
27 Fattovich G, Olivari N, Pasino M, D’Onofrio M, Martone E, Donato F. Long-term outcome of chronic hepatitis B in Caucasian patients: mortality after 25 years. Gut 2008; 57: 84-90 [PMID: 17715267 DOI: 10.1136/gut.2007.128496]
28 Ayoub WS, Keeffe EB. Review article: current antiviral therapy of chronic hepatitis B. Aliment Pharmacol Ther 2008; 28: 167-177 [PMID: 18466358 DOI: 10.1111/j.1365-2036.2008.03731.x]
29 Wang LC, Chen EQ, Cao J, Liu L, Zheng L, Li DJ, Xu L, Lei XZ,
9964 September 14, 2015|Volume 21|Issue 34|WJG|www.wjgnet.com
Huang R et al . Serum GGT and chronic hepatitis B
Liu C, Tang H. De novo combination of lamivudine and adefovir versus entecavir monotherapy for the treatment of naïve HBeAg-negative chronic hepatitis B patients. Hepatol Int 2011; 5: 671-676 [PMID: 21484140 DOI: 10.1007/s12072-010-9243-x]
30 Du QW, Ding JG, Sun QF, Hong L, Cai FJ, Zhou QQ, Wu YH, Fu RQ. Combination lamivudine and adefovir versus entecavir for the treatment of naïve chronic hepatitis B patients: a pilot study. Med Sci Monit 2013; 19: 751-756 [PMID: 24019010 DOI: 10.12659/MSM.889443]
31 Marcellin P, Chang TT, Lim SG, Tong MJ, Sievert W, Shiffman ML, Jeffers L, Goodman Z, Wulfsohn MS, Xiong S, Fry J, Brosgart CL; Adefovir Dipivoxil 437 Study Group. Adefovir dipivoxil for the treatment of hepatitis B e antigen-positive chronic hepatitis B. N Engl J Med 2003; 348: 808-816 [PMID: 12606735 DOI: 10.1056/NEJMoa020681]
32 Marcellin P, Heathcote EJ, Buti M, Gane E, de Man RA, Krastev Z, Germanidis G, Lee SS, Flisiak R, Kaita K, Manns M, Kotzev I, Tchernev K, Buggisch P, Weilert F, Kurdas OO, Shiffman ML, Trinh H, Washington MK, Sorbel J, Anderson J, Snow-Lampart A, Mondou E, Quinn J, Rousseau F. Tenofovir disoproxil fumarate versus adefovir dipivoxil for chronic hepatitis B. N Engl J Med 2008; 359: 2442-2455 [PMID: 19052126 DOI: 10.1056/NEJMoa0802878]
33 Liaw YF, Gane E, Leung N, Zeuzem S, Wang Y, Lai CL, Heathcote EJ, Manns M, Bzowej N, Niu J, Han SH, Hwang SG, Cakaloglu Y, Tong MJ, Papatheodoridis G, Chen Y, Brown NA, Albanis E, Galil K, Naoumov NV. 2-Year GLOBE trial results: telbivudine Is superior to lamivudine in patients with chronic hepatitis B. Gastroenterology 2009; 136: 486-495 [PMID: 19027013 DOI: 10.1053/j.gastro.2008.10.026]
34 Perrillo RP, Lai CL, Liaw YF, Dienstag JL, Schiff ER, Schalm SW, Heathcote EJ, Brown NA, Atkins M, Woessner M, Gardner SD. Predictors of HBeAg loss after lamivudine treatment for chronic hepatitis B. Hepatology 2002; 36: 186-194 [PMID: 12085364 DOI: 10.1053/jhep.2002.34294]
35 Cai W, Xie Q, An B, Wang H, Zhou X, Zhao G, Guo Q, Gu R, Bao S. On-treatment serum HBsAg level is predictive of sustained off-treatment virologic response to telbivudine in HBeAg-positive chronic hepatitis B patients. J Clin Virol 2010; 48: 22-26 [PMID: 20233672 DOI: 10.1016/j.jcv.2010.02.014]
36 Martinot-Peignoux M, Lapalus M, Asselah T, Marcellin P.
HBsAg quantification: useful for monitoring natural history and treatment outcome. Liver Int 2014; 34 Suppl 1: 97-107 [PMID: 24373085 DOI: 10.1111/liv.12403]
37 Zhang X, Lin SM, Ye F, Chen TY, Liu M, Chen YR, Zheng SQ, Zhao YR, Zhang SL. An early decrease in serum HBeAg titre is a strong predictor of virological response to entecavir in HBeAg-positive patients. J Viral Hepat 2011; 18: e184-e190 [PMID: 21692931 DOI: 10.1111/j.1365-2893.2010.01423.x]
38 Lee JM, Ahn SH, Kim HS, Park H, Chang HY, Kim do Y, Hwang SG, Rim KS, Chon CY, Han KH, Park JY. Quantitative hepatitis B surface antigen and hepatitis B e antigen titers in prediction of treatment response to entecavir. Hepatology 2011; 53: 1486-1493 [PMID: 21520167 DOI: 10.1002/hep.24221]
39 Shin JW, Jung SW, Park BR, Kim CJ, Eum JB, Kim BG, Jeong ID, Bang SJ, Lee SH, Kim SR, Park NH. Prediction of response to entecavir therapy in patients with HBeAg-positive chronic hepatitis B based on on-treatment HBsAg, HBeAg and HBV DNA levels. J Viral Hepat 2012; 19: 724-731 [PMID: 22967104 DOI: 10.1111/j.1365-2893.2012.01599.x]
40 Giannini E, Botta F, Fasoli A, Romagnoli P, Mastracci L, Ceppa P, Comino I, Pasini A, Risso D, Testa R. Increased levels of gammaGT suggest the presence of bile duct lesions in patients with chronic hepatitis C: absence of influence of HCV genotype, HCV-RNA serum levels, and HGV infection on this histological damage. Dig Dis Sci 2001; 46: 524-529 [PMID: 11318526 DOI: 10.1023/A:1005534929304]
41 Berg T, Kronenberger B, Hinrichsen H, Gerlach T, Buggisch P, Herrmann E, Spengler U, Goeser T, Nasser S, Wursthorn K, Pape GR, Hopf U, Zeuzem S. Triple therapy with amantadine in treatment-naive patients with chronic hepatitis C: a placebo-controlled trial. Hepatology 2003; 37: 1359-1367 [PMID: 12774015 DOI: 10.1053/jhep.2003.50219]
42 Hwang SJ, Luo JC, Chu CW, Lai CR, Lu CL, Tsay SH, Wu JC, Chang FY, Lee SD. Hepatic steatosis in chronic hepatitis C virus infection: prevalence and clinical correlation. J Gastroenterol Hepatol 2001; 16: 190-195 [PMID: 11207900]
43 Eminler AT, Irak K, Ayyildiz T, Keskin M, Kiyici M, Gurel S, Gulten M, Dolar E, Nak SG. The relation between liver histopathology and GGT levels in viral hepatitis: more important in hepatitis B. Turk J Gastroenterol 2014; 25: 411-415 [PMID: 25254524 DOI: 10.5152/tjg.2014.3693]
P- Reviewer: Aghakhani A, Antonakopoulos N S- Editor: Ma YJ L- Editor: Wang TQ E- Editor: Ma S
9965 September 14, 2015|Volume 21|Issue 34|WJG|www.wjgnet.com
Huang R et al . Serum GGT and chronic hepatitis B

9966 September 14, 2015|Volume 21|Issue 34|WJG|www.wjgnet.com
ORIGINAL ARTICLE
Masatsune Shibutani, Kiyoshi Maeda, Hisashi Nagahara, Hiroshi Ohtani, Katsunobu Sakurai, Sadaaki Yamazoe, Kenjiro Kimura, Takahiro Toyokawa, Ryosuke Amano, Hiroaki Tanaka, Kazuya Muguruma, Kosei Hirakawa, Department of Surgical Oncology, Osaka City University Graduate School of Medicine, Osaka 5458585, Japan
Author contributions: Shibutani M, Maeda K and Hirakawa K designed the research; Shibutani M and Maeda K performed the research; Shibutani M, Maeda K, Nagahara H, Ohtani H, Sakurai K, Yamazoe S, Kimura K, Toyokawa T, Amano R, Tanaka H and Muguruma K collected and analyzed the data; Shibutani M drafted the article; all authors read and approved the final version to be published.
Institutional review board statement: The study was reviewed and approved by the Osaka City University Institutional Review Board.
Informed consent statement: All study participants, or their legal guardians, provided informed written consent prior to study enrollment.
Conflict-of-interest statement: There are no conflicts of interest to report for any of the authors.
Data sharing statement: No additional data are available.
Open-Access: This article is an open-access article which was selected by an in-house editor and fully peer-reviewed by external reviewers. It is distributed in accordance with the Creative Commons Attribution Non Commercial (CC BY-NC 4.0) license, which permits others to distribute, remix, adapt, build upon this work non-commercially, and license their derivative works on different terms, provided the original work is properly cited and the use is non-commercial. See: http://creativecommons.org/licenses/by-nc/4.0/
Correspondence to: Masatsune Shibutani, MD, PhD, Department of Surgical Oncology, Osaka City University Graduate School of Medicine, 1-4-3 Asahi-machi, Abeno-Ku, Osaka City, Osaka Prefecture, Osaka 5458585, Japan. [email protected]
Telephone: +81-6-66453838Fax: +81-6-66466450
Received: February 20, 2015Peer-review started: February 23, 2015First decision: March 10, 2015Revised: April 9, 2015Accepted: May 7, 2015Article in press: May 7, 2015Published online: September 14, 2015
AbstractAIM: To evaluate the prognostic significance of the lymphocyte to monocyte ratio (LMR) in patients with unresectable metastatic colorectal cancer who received palliative chemotherapy.
METHODS: A total of 104 patients with unresectable metastatic colorectal cancer who underwent palliative chemotherapy were enrolled. The LMR was calculated from blood samples by dividing the absolute lym-phocyte count by the absolute monocyte count. Pre-treatment LMR values were measured within one week before the initiation of chemotherapy, while post-treatment LMR values were measured eight weeks after the initiation of chemotherapy.
RESULTS: The median pre-treatment LMR was 4.16 (range: 0.58-14.06). We set 3.38 as the cut-off level based on the receiver operating characteristic curve. Based on the cut-off level of 3.38, 66 patients were classified into the high pre-treatment LMR group and 38 patients were classified into the low pre-treatment LMR group. The low pre-treatment LMR group had a significantly worse overall survival rate (P = 0.0011). Moreover, patients who demonstrated low pre-treatment LMR and normalization after treatment
Retrospective Study
Prognostic significance of the lymphocyte-to-monocyte ratio in patients with metastatic colorectal cancer
Masatsune Shibutani, Kiyoshi Maeda, Hisashi Nagahara, Hiroshi Ohtani, Katsunobu Sakurai, Sadaaki Yamazoe, Kenjiro Kimura, Takahiro Toyokawa, Ryosuke Amano, Hiroaki Tanaka, Kazuya Muguruma, Kosei Hirakawa
Submit a Manuscript: http://www.wjgnet.com/esps/Help Desk: http://www.wjgnet.com/esps/helpdesk.aspxDOI: 10.3748/wjg.v21.i34.9966
World J Gastroenterol 2015 September 14; 21(34): 9966-9973 ISSN 1007-9327 (print) ISSN 2219-2840 (online)
© 2015 Baishideng Publishing Group Inc. All rights reserved.
Shibutani M et al . The lymphocyte to monocyte ratio
9967 September 14, 2015|Volume 21|Issue 34|WJG|www.wjgnet.com
exhibited a better overall survival rate than the patients with low pre-treatment and post-treatment LMR values.
CONCLUSION: The lymphocyte to monocyte ratio is a useful prognostic marker in patients with unresectable metastatic colorectal cancer who receive palliative chemotherapy.
Key words: Colorectal cancer; Prognosis; Unresectable; Chemotherapy; Lymphocyte to monocyte ratio
© The Author(s) 2015. Published by Baishideng Publishing Group Inc. All rights reserved.
Core tip: We retrospectively analyzed 104 patients who had unresectable metastatic colorectal cancer. This study indicated that patients with a low pre-treatment lymphocyte to monocyte ratio (LMR) had a significantly worse overall survival rate. Moreover, patients who demonstrated low pre-treatment LMR and normalization after chemotherapy exhibited a better overall survival rate than patients with low pre-treatment and post-treatment LMR values.
Shibutani M, Maeda K, Nagahara H, Ohtani H, Sakurai K, Yamazoe S, Kimura K, Toyokawa T, Amano R, Tanaka H, Muguruma K, Hirakawa K. Prognostic significance of the lymphocyte-to-monocyte ratio in patients with metastatic colorectal cancer. World J Gastroenterol 2015; 21(34): 9966-9973 Available from: URL: http://www.wjgnet.com/1007-9327/full/v21/i34/9966.htm DOI: http://dx.doi.org/10.3748/wjg.v21.i34.9966
INTRODUCTIONColorectal cancer (CRC) is the third leading cause of cancer-related death worldwide[1]. Patients with unresectable metastatic CRC have a particularly poor prognosis. Despite the recent major advances in new cytotoxic and molecular targeted therapies for unresectable CRC that have been developed within the last 10 years[2-5], the median survival time of patients with unresectable metastatic CRC is approximately only 30 mo[6,7]. According to the guidelines of the European Society for Medical Oncology (ESMO), it is recommended to individualize the treatment of patients with metastatic CRC based on their tumor- and disease-related characteristics[8]. Therefore, it is necessary to detect biomarkers for predicting survival.
It is well known that the systemic inflammatory response plays an important role in cancer pro-gression[9]. Markers based on systemic inflammation, such as the neutrophil to lymphocyte ratio (NLR) and Glasgow prognostic score, have been reported to be useful for predicting the prognosis in patients with various types of cancer[10-14]. Recently, the lymphocyte to monocyte ratio (LMR), which also reflects the
degree of systemic inflammation, has been reported to correlate with survival in various types of malignancies. However, the prognostic value of the LMR has been investigated mainly in patients with hematological malignancies and there have been only a few reports focusing on patients with solid tumors, such as colon, bladder, and lung cancers[15-22]. Moreover, to the best of our knowledge, no studies regarding the prognostic significance of the LMR in patients with unresectable metastatic CRC are available. The aim of this retrospective study was to evaluate the prognostic significance of the LMR in patients with unresectable metastatic CRC.
MATERIALS AND METHODSPatientsWe retrospectively reviewed a database of 104 patients who underwent palliative combination chemotherapy for unresectable metastatic colorectal cancer at the Department of Surgical Oncology of Osaka City University between 2005 and 2010.
The patient characteristics are listed in Table 1. The patient population consisted of 59 males and 45 females, with a median age of 64 years (range: 27-86). According to the definition of the Eastern Cooperative Oncology Group performance status (PS), 96 patients were classified as having a PS of 0, 6 patients were classified as having a PS of 1, and 2 patients was classified as having a PS of 2. Sixty patients had primary tumors located in the colon and 44 had primary tumors located in the rectum. A total of 42 patients had metachronous unresectable cancer, and 62 patients had synchronous unresectable cancer. Fifty-eight patients had only one organ affected by metastasis and 46 patients had more than one organ affected by metastasis. Among the 104 patients, 88 underwent resection of a primary tumor. All patients underwent combination chemotherapy with oxaliplatin or irinotecan plus 5-fluorouracil/leucovorin or a prodrug of 5-fluorouracil as first-line chemotherapy. There was no initiation of palliative chemotherapy for recurrence while undergoing adjuvant chemotherapy. 64 patients received 5-fluorouracil + leucovorin + oxaliplatin (FOLFOX), 26 patients received capecitabine + oxaliplatin (CapeOX), nine patients received 5-fluorouracil + leucovorin + irinotecan (FOLFIRI), and five patients received S-1 + oxaliplatin (SOX). Seventy-six patients underwent chemotherapy combined with molecular targeted therapy. The median follow-up period in the survivors was 22.4 mo (range: 2.6-69.5). During the follow-up period, a total of 67 patients died.
EvaluationResponse evaluations were performed every eight weeks. A variation of approximately one week was regarded as an allowable error. All patients were
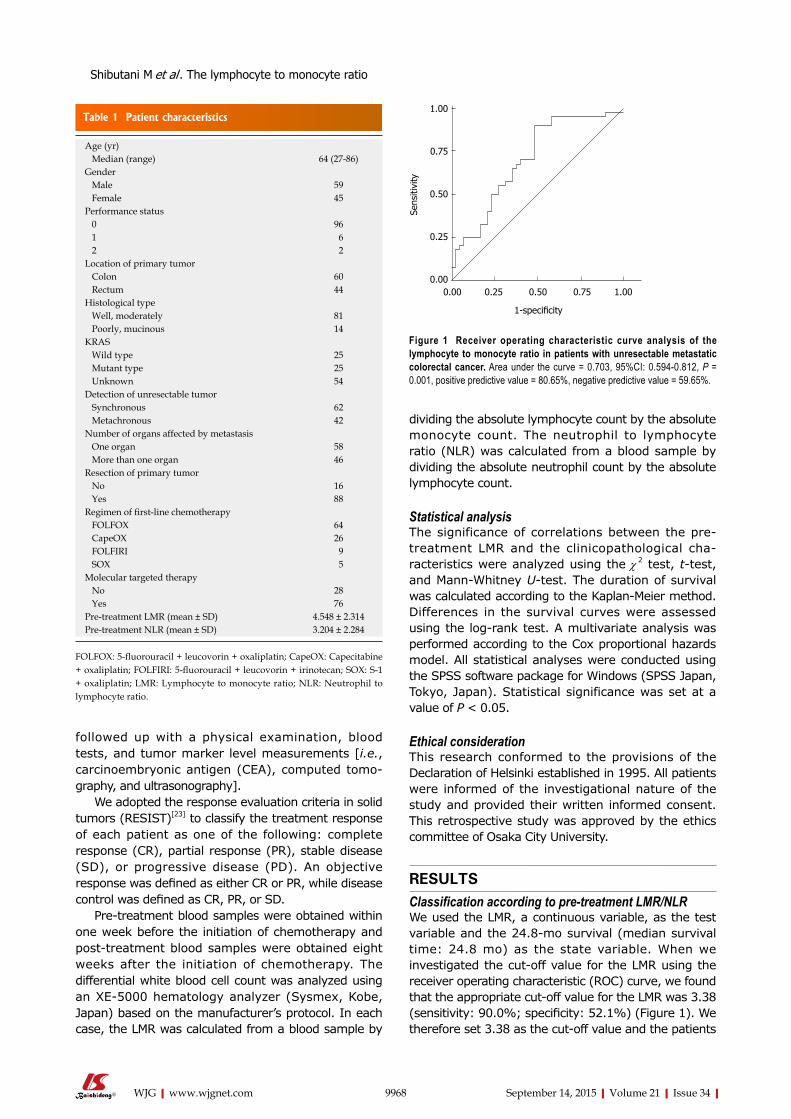
Table 1 Patient characteristics
9968 September 14, 2015|Volume 21|Issue 34|WJG|www.wjgnet.com
followed up with a physical examination, blood tests, and tumor marker level measurements [i.e., carcinoembryonic antigen (CEA), computed tomo-graphy, and ultrasonography].
We adopted the response evaluation criteria in solid tumors (RESIST)[23] to classify the treatment response of each patient as one of the following: complete response (CR), partial response (PR), stable disease (SD), or progressive disease (PD). An objective response was defined as either CR or PR, while disease control was defined as CR, PR, or SD.
Pre-treatment blood samples were obtained within one week before the initiation of chemotherapy and post-treatment blood samples were obtained eight weeks after the initiation of chemotherapy. The differential white blood cell count was analyzed using an XE-5000 hematology analyzer (Sysmex, Kobe, Japan) based on the manufacturer’s protocol. In each case, the LMR was calculated from a blood sample by
dividing the absolute lymphocyte count by the absolute monocyte count. The neutrophil to lymphocyte ratio (NLR) was calculated from a blood sample by dividing the absolute neutrophil count by the absolute lymphocyte count.
Statistical analysisThe significance of correlations between the pre-treatment LMR and the clinicopathological cha-racteristics were analyzed using the χ 2 test, t-test, and Mann-Whitney U-test. The duration of survival was calculated according to the Kaplan-Meier method. Differences in the survival curves were assessed using the log-rank test. A multivariate analysis was performed according to the Cox proportional hazards model. All statistical analyses were conducted using the SPSS software package for Windows (SPSS Japan, Tokyo, Japan). Statistical significance was set at a value of P < 0.05.
Ethical considerationThis research conformed to the provisions of the Declaration of Helsinki established in 1995. All patients were informed of the investigational nature of the study and provided their written informed consent. This retrospective study was approved by the ethics committee of Osaka City University.
RESULTSClassification according to pre-treatment LMR/NLRWe used the LMR, a continuous variable, as the test variable and the 24.8-mo survival (median survival time: 24.8 mo) as the state variable. When we investigated the cut-off value for the LMR using the receiver operating characteristic (ROC) curve, we found that the appropriate cut-off value for the LMR was 3.38 (sensitivity: 90.0%; specificity: 52.1%) (Figure 1). We therefore set 3.38 as the cut-off value and the patients
Age (yr) Median (range) 64 (27-86)Gender Male 59 Female 45Performance status 0 96 1 6 2 2Location of primary tumor Colon 60 Rectum 44Histological type Well, moderately 81 Poorly, mucinous 14KRAS Wild type 25 Mutant type 25 Unknown 54Detection of unresectable tumor Synchronous 62 Metachronous 42Number of organs affected by metastasis One organ 58 More than one organ 46Resection of primary tumor No 16 Yes 88Regimen of first-line chemotherapy FOLFOX 64 CapeOX 26 FOLFIRI 9 SOX 5Molecular targeted therapy No 28 Yes 76Pre-treatment LMR (mean ± SD) 4.548 ± 2.314Pre-treatment NLR (mean ± SD) 3.204 ± 2.284
FOLFOX: 5-fluorouracil + leucovorin + oxaliplatin; CapeOX: Capecitabine + oxaliplatin; FOLFIRI: 5-fluorouracil + leucovorin + irinotecan; SOX: S-1 + oxaliplatin; LMR: Lymphocyte to monocyte ratio; NLR: Neutrophil to lymphocyte ratio.
1.00
0.75
0.50
0.25
0.00
Sens
itivi
ty
0.00 0.25 0.50 0.75 1.00
1-specificity
Figure 1 receiver operating characteristic curve analysis of the lymphocyte to monocyte ratio in patients with unresectable metastatic colorectal cancer. Area under the curve = 0.703, 95%ci: 0.594-0.812, P = 0.001, positive predictive value = 80.65%, negative predictive value = 59.65%.
Shibutani M et al . The lymphocyte to monocyte ratio
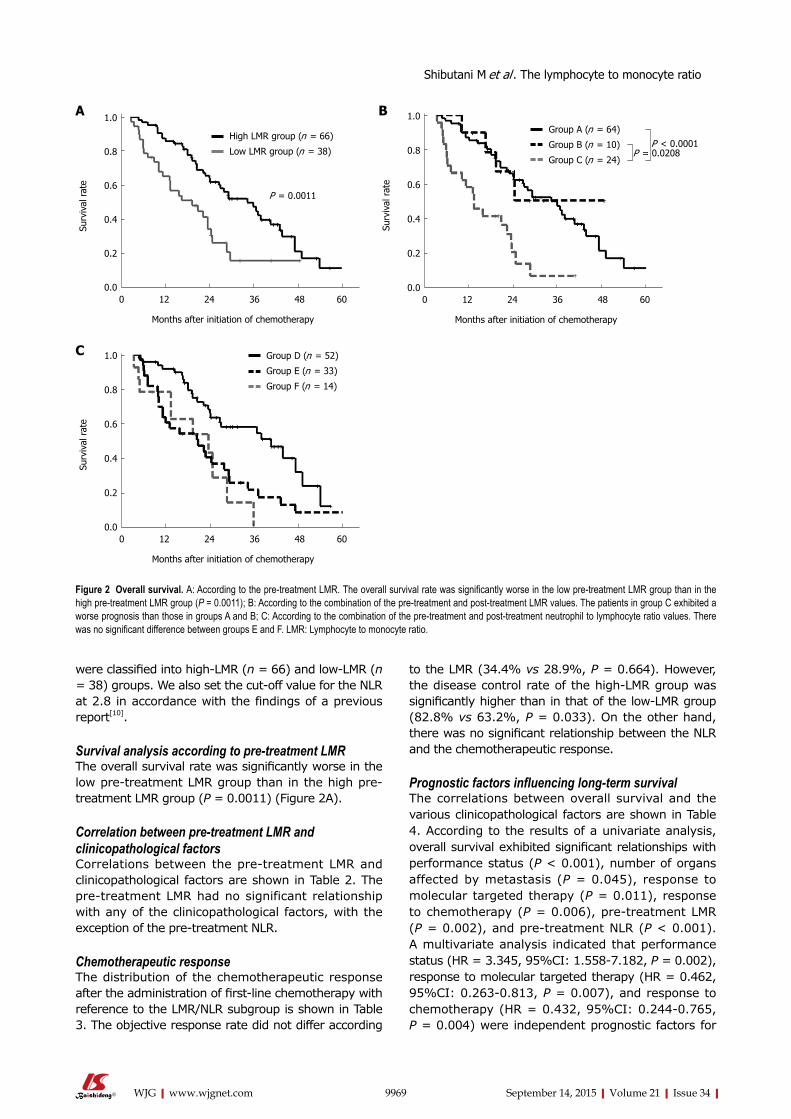
9969 September 14, 2015|Volume 21|Issue 34|WJG|www.wjgnet.com
were classified into high-LMR (n = 66) and low-LMR (n = 38) groups. We also set the cut-off value for the NLR at 2.8 in accordance with the findings of a previous report[10].
Survival analysis according to pre-treatment LMRThe overall survival rate was significantly worse in the low pre-treatment LMR group than in the high pre-treatment LMR group (P = 0.0011) (Figure 2A).
Correlation between pre-treatment LMR and clinicopathological factorsCorrelations between the pre-treatment LMR and clinicopathological factors are shown in Table 2. The pre-treatment LMR had no significant relationship with any of the clinicopathological factors, with the exception of the pre-treatment NLR.
Chemotherapeutic responseThe distribution of the chemotherapeutic response after the administration of first-line chemotherapy with reference to the LMR/NLR subgroup is shown in Table 3. The objective response rate did not differ according
to the LMR (34.4% vs 28.9%, P = 0.664). However, the disease control rate of the high-LMR group was significantly higher than in that of the low-LMR group (82.8% vs 63.2%, P = 0.033). On the other hand, there was no significant relationship between the NLR and the chemotherapeutic response.
Prognostic factors influencing long-term survivalThe correlations between overall survival and the various clinicopathological factors are shown in Table 4. According to the results of a univariate analysis, overall survival exhibited significant relationships with performance status (P < 0.001), number of organs affected by metastasis (P = 0.045), response to molecular targeted therapy (P = 0.011), response to chemotherapy (P = 0.006), pre-treatment LMR (P = 0.002), and pre-treatment NLR (P < 0.001). A multivariate analysis indicated that performance status (HR = 3.345, 95%CI: 1.558-7.182, P = 0.002), response to molecular targeted therapy (HR = 0.462, 95%CI: 0.263-0.813, P = 0.007), and response to chemotherapy (HR = 0.432, 95%CI: 0.244-0.765, P = 0.004) were independent prognostic factors for
Figure 2 Overall survival. A: According to the pre-treatment LMR. The overall survival rate was significantly worse in the low pre-treatment LMR group than in the high pre-treatment LMR group (P = 0.0011); b: According to the combination of the pre-treatment and post-treatment LMR values. The patients in group c exhibited a worse prognosis than those in groups A and b; c: According to the combination of the pre-treatment and post-treatment neutrophil to lymphocyte ratio values. There was no significant difference between groups E and F. LMR: Lymphocyte to monocyte ratio.
1.0
0.8
0.6
0.4
0.2
0.0
Surv
ival
rat
e
0 12 24 36 48 60
Months after initiation of chemotherapy
P = 0.0011
High LMR group (n = 66)
Low LMR group (n = 38)
1.0
0.8
0.6
0.4
0.2
0.0
Surv
ival
rat
e
0 12 24 36 48 60
Months after initiation of chemotherapy
Group A (n = 64)
Group B (n = 10)
Group C (n = 24)
P < 0.0001P = 0.0208
1.0
0.8
0.6
0.4
0.2
0.0
Surv
ival
rat
e
0 12 24 36 48 60
Months after initiation of chemotherapy
Group D (n = 52)
Group E (n = 33)
Group F (n = 14)
A B
C
Shibutani M et al . The lymphocyte to monocyte ratio
Table 2 Correlations between the pre-treatment lymphocyte to monocyte ratio and clinicopathological factors
9970 September 14, 2015|Volume 21|Issue 34|WJG|www.wjgnet.com
survival.
Correlation between normalization of LMR/NLR eight weeks after chemotherapy and survivalWe evaluated the prognostic significance of nor-malization of the LMR/NLR eight weeks after the initiation of chemotherapy. We categorized the patients into three groups according to the combination of their pre-treatment and post-treatment LMR values. Patients with high pre-treatment LMR were categorized into group A. Patients with low pre-treatment LMR and normalization of the LMR eight weeks after the initiation of chemotherapy were categorized into group B. Patients with low pre-treatment and post-treatment LMR value were categorized into group C. The patients in group C exhibited a worse prognosis than those in groups A and B (A vs C, P < 0.0001; B vs C, P = 0.0308) (Figure 2B). We categorized the patients into three groups according to the combination of their pre-treatment and post-treatment NLR values.
Patients with low pre-treatment LMR were categorized into group D. Patients with high pre-treatment NLR and normalization of the NLR eight weeks after the initiation of chemotherapy were categorized into group E. Patients with high pre-treatment and post-treatment NLR value were categorized into group F. There was no significant difference between groups E and F (Figure 2C).
Pre-treatment and post-treatment absolute neutrophil/lymphocyte/monocyte countsThe absolute neutrophil count tended to decrease after chemotherapy. However, the absolute lymphocyte count did not change after chemotherapy, while the absolute monocyte count tended to increase after chemotherapy (Table 5).
DISCUSSIONIn this study, we investigated the prognostic sign-ificance of pre-treatment LMR as a marker for predicting chemotherapeutic response and survival time in patients with unresectable metastatic CRC. Moreover, we demonstrated that normalization of the LMR after chemotherapy resulted in improved overall survival. Recently, systemic inflammation has been recognized to correlate with tumor progression and inflammatory markers have been reported to be useful for predicting the prognosis[9-13]. The LMR is an inflammatory marker, and a correlation between the LMR and survival has been reported[14-21]. However, most analyses in previous studies targeted patients with hematological malignancies[14-18]. To the best of our knowledge, this is the first study to assess the prognostic significance of the LMR in patients with unresectable metastatic CRC who received palliative chemotherapy.
Lymphocytes play an important role in the anti-tumor immunity of the host, including cytotoxic cell death and the inhibition of tumor cell proliferation and migration[9,24-26]. The absolute lymphocyte count is assumed to reflect the degree of responsiveness of the immune system of the host[26-28]. A decreased number of lymphocytes is therefore considered to be responsible for an insufficient immunologic reaction to the tumor, thus promoting tumor progression and metastasis[20].
On the other hand, monocytes play an important role in tumor progression and metastasis[9,29]. Tumor-associated macrophages (TAMs), which are derived from circulating monocytes, suppress adaptive immunity and promote angiogenesis, invasion, migration, and tumor growth[9,30-32]. The circulating level of monocytes in the peripheral blood is reported to reflect the formation and/or presence of TAMs[20,22]. Therefore, an increased level of monocytes reflects a high tumor burden in patients with cancer.
As mentioned above, the LMR reflects both the immune status of the host and the degree of tumor
Pre-treatment LMR
High Low P valuePerformance status 0 62 34 1, 2 4 4 0.459Location of primary tumor Colon 39 21 Rectum 27 17 0.837Detection of unresectable tumor Synchronous 39 23 Metachronous 27 15 1.000Resection of primary tumor No 8 8 Yes 58 30 0.264Histological type Well, moderately 51 30 Poorly, mucinous 10 4 0.764KRAS Wild type 15 10 Mutant type 15 10 1.000Peritoneal dissemination Negative 53 32 Positive 13 6 0.793Number of organs affected by metastasis One organ 39 19 More than one organ 27 19 0.416Pre-treatment CEA (ng/mL) ≤ 5 10 3 > 5 54 35 0.362Average relative dose intensity (%) Median (range) 100
(60.0-100)96.2
(50.0-100)0.697
Molecular targeted therapy No 15 13 Yes 51 25 0.253Pre-treatment NLR < 2.8 48 5 ≥ 2.8 18 33 < 0.001
CEA: Carcinoembryonic antigen; LMR: Lymphocyte to monocyte ratio; NLR: Neutrophil to lymphocyte ratio.
Shibutani M et al . The lymphocyte to monocyte ratio
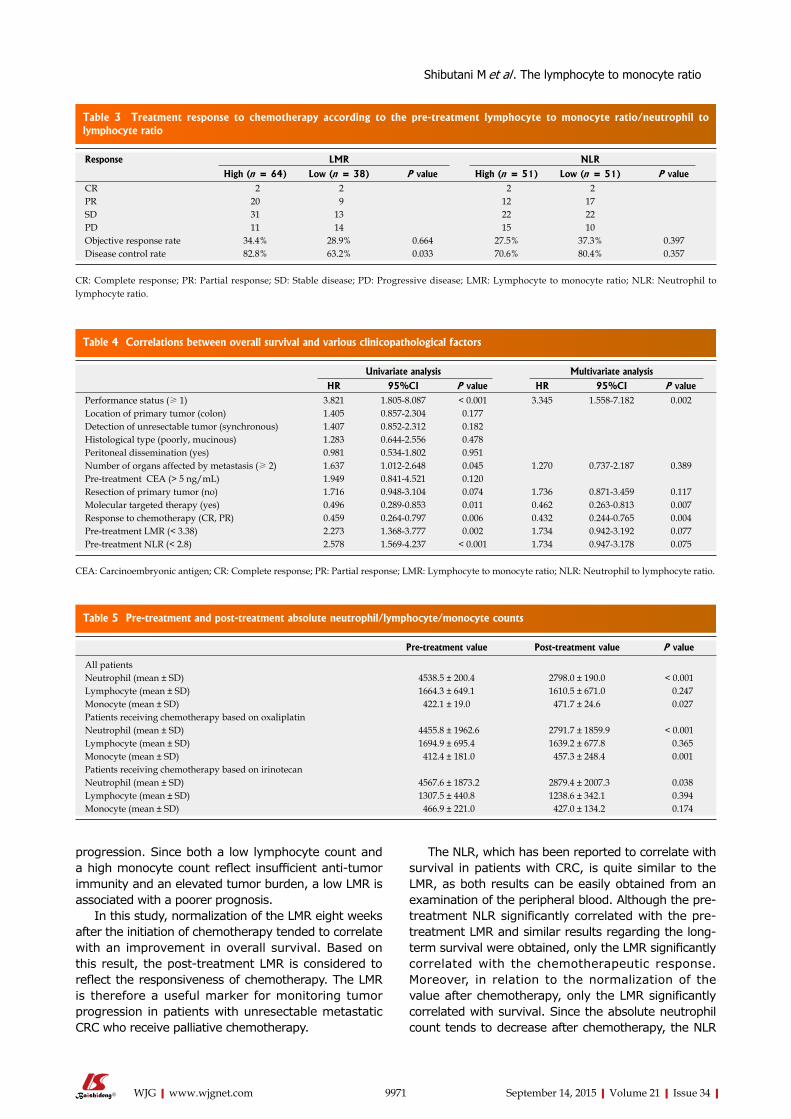
Table 5 Pre-treatment and post-treatment absolute neutrophil/lymphocyte/monocyte counts
Table 4 Correlations between overall survival and various clinicopathological factors
Table 3 Treatment response to chemotherapy according to the pre-treatment lymphocyte to monocyte ratio/neutrophil to lymphocyte ratio
9971 September 14, 2015|Volume 21|Issue 34|WJG|www.wjgnet.com
progression. Since both a low lymphocyte count and a high monocyte count reflect insufficient anti-tumor immunity and an elevated tumor burden, a low LMR is associated with a poorer prognosis.
In this study, normalization of the LMR eight weeks after the initiation of chemotherapy tended to correlate with an improvement in overall survival. Based on this result, the post-treatment LMR is considered to reflect the responsiveness of chemotherapy. The LMR is therefore a useful marker for monitoring tumor progression in patients with unresectable metastatic CRC who receive palliative chemotherapy.
The NLR, which has been reported to correlate with survival in patients with CRC, is quite similar to the LMR, as both results can be easily obtained from an examination of the peripheral blood. Although the pre-treatment NLR significantly correlated with the pre-treatment LMR and similar results regarding the long-term survival were obtained, only the LMR significantly correlated with the chemotherapeutic response. Moreover, in relation to the normalization of the value after chemotherapy, only the LMR significantly correlated with survival. Since the absolute neutrophil count tends to decrease after chemotherapy, the NLR
Response LMR NLR
High (n = 64) Low (n = 38) P value High (n = 51) Low (n = 51) P valueCR 2 2 2 2PR 20 9 12 17SD 31 13 22 22PD 11 14 15 10Objective response rate 34.4% 28.9% 0.664 27.5% 37.3% 0.397Disease control rate 82.8% 63.2% 0.033 70.6% 80.4% 0.357
CR: Complete response; PR: Partial response; SD: Stable disease; PD: Progressive disease; LMR: Lymphocyte to monocyte ratio; NLR: Neutrophil to lymphocyte ratio.
Univariate analysis Multivariate analysis
HR 95%CI P value HR 95%CI P valuePerformance status (≥ 1) 3.821 1.805-8.087 < 0.001 3.345 1.558-7.182 0.002Location of primary tumor (colon) 1.405 0.857-2.304 0.177Detection of unresectable tumor (synchronous) 1.407 0.852-2.312 0.182Histological type (poorly, mucinous) 1.283 0.644-2.556 0.478Peritoneal dissemination (yes) 0.981 0.534-1.802 0.951Number of organs affected by metastasis (≥ 2) 1.637 1.012-2.648 0.045 1.270 0.737-2.187 0.389Pre-treatment CEA (> 5 ng/mL) 1.949 0.841-4.521 0.120Resection of primary tumor (no) 1.716 0.948-3.104 0.074 1.736 0.871-3.459 0.117Molecular targeted therapy (yes) 0.496 0.289-0.853 0.011 0.462 0.263-0.813 0.007Response to chemotherapy (CR, PR) 0.459 0.264-0.797 0.006 0.432 0.244-0.765 0.004Pre-treatment LMR (< 3.38) 2.273 1.368-3.777 0.002 1.734 0.942-3.192 0.077Pre-treatment NLR (< 2.8) 2.578 1.569-4.237 < 0.001 1.734 0.947-3.178 0.075
CEA: Carcinoembryonic antigen; CR: Complete response; PR: Partial response; LMR: Lymphocyte to monocyte ratio; NLR: Neutrophil to lymphocyte ratio.
Pre-treatment value Post-treatment value P value
All patientsNeutrophil (mean ± SD) 4538.5 ± 200.4 2798.0 ± 190.0 < 0.001Lymphocyte (mean ± SD) 1664.3 ± 649.1 1610.5 ± 671.0 0.247Monocyte (mean ± SD) 422.1 ± 19.0 471.7 ± 24.6 0.027Patients receiving chemotherapy based on oxaliplatinNeutrophil (mean ± SD) 4455.8 ± 1962.6 2791.7 ± 1859.9 < 0.001Lymphocyte (mean ± SD) 1694.9 ± 695.4 1639.2 ± 677.8 0.365Monocyte (mean ± SD) 412.4 ± 181.0 457.3 ± 248.4 0.001Patients receiving chemotherapy based on irinotecanNeutrophil (mean ± SD) 4567.6 ± 1873.2 2879.4 ± 2007.3 0.038Lymphocyte (mean ± SD) 1307.5 ± 440.8 1238.6 ± 342.1 0.394Monocyte (mean ± SD) 466.9 ± 221.0 427.0 ± 134.2 0.174
Shibutani M et al . The lymphocyte to monocyte ratio
9972 September 14, 2015|Volume 21|Issue 34|WJG|www.wjgnet.com
tends to improve regardless of whether the tumor is controlled. On the other hand, because the absolute monocyte count tends to increase, the LMR tends to worsen, regardless of whether the tumor progresses. The normalization of the LMR after chemotherapy despite such situations is considered to reflect tumor control. This is because the prognostic significance of normalization after chemotherapy varied between the LMR and NLR. Therefore, the LMR is considered to be superior to the NLR.
There are some possible limitations associated with this study. First, we evaluated a relatively small number of patients and the study design was retrospective. Second, factors such as infection, ischemia, and coronary syndrome, which may affect the white blood cell count, were not taken into consideration. Third, the appropriate cut-off value for the LMR was not uniform in previous studies, although we set 3.38 as the cut-off value in the current study based on the ROC curve. Large prospective studies should therefore be performed to confirm our findings.
COMMENTSBackgroundDespite recent major advances in the development of new cytotoxic and molecular targeted therapies, patients with unresectable metastatic colorectal cancer (cRc) still have a poor prognosis. According to the guidelines of the European Society for Medical Oncology, it is recommended that the treatment of patients with metastatic cRc be individualized based on their tumor- and disease-related characteristics. It is therefore necessary to detect biomarkers for predicting survival.
Research frontiersThe lymphocyte to monocyte ratio (LMR) is a useful marker for predicting survival and chemotherapeutic response. This marker can therefore be used for the individualization of treatment in patients with unresectable metastatic cRc. By using this marker, the authors can identify patients with a high risk of a poor prognosis, and thereby choose the most appropriate intensive therapy.
Innovations and breakthroughsIt is difficult to predict the prognosis of patients with unresectable metastatic CRC. A few markers for predicting patient survival have been reported previously. Survival prediction is important for planning an appropriate course of treatment. The LMR was revealed to correlate with both survival and the chemotherapeutic response in the present study. The LMR makes a useful clinical biological marker because its measurement by peripheral blood cell count is a quick and easy assay to perform.
ApplicationsThe results of the present study suggest that the LMR is a useful prognostic marker for predicting survival and chemotherapeutic response in patients with unresectable metastatic CRC who undergo palliative chemotherapy.
TerminologyThe LMR was calculated from a blood sample by dividing the absolute lymphocyte count by the absolute monocyte count. The LMR reflects the immune status and systemic inflammatory response of the host. Immune status and systemic inflammation have been reported to correlate with tumor progression, invasion, and metastasis. The LMR is thus considered to correlate with the survival of patients with cRc.
Peer-reviewThis is a good descriptive study in which the authors evaluated the prognostic significance of the lymphocyte to monocyte ratio in patients with unresectable metastatic colorectal cancer who underwent palliative chemotherapy. The study is well structured and the subject is clear and interesting. The manuscript is correctly written and the conclusions are justified by the results found in the study.
REFERENCES1 Parkin DM, Bray F, Ferlay J, Pisani P. Global cancer statistics,
2002. CA Cancer J Clin 2005; 55: 74-108 [PMID: 15761078]2 Douillard JY, Cunningham D, Roth AD, Navarro M, James RD,
Karasek P, Jandik P, Iveson T, Carmichael J, Alakl M, Gruia G, Awad L, Rougier P. Irinotecan combined with fluorouracil compared with fluorouracil alone as first-line treatment for metastatic colorectal cancer: a multicentre randomised trial. Lancet 2000; 355: 1041-1047 [PMID: 10744089 DOI: 10.1016/S0140-6736(00)02034-1]
3 de Gramont A, Figer A, Seymour M, Homerin M, Hmissi A, Cassidy J, Boni C, Cortes-Funes H, Cervantes A, Freyer G, Papamichael D, Le Bail N, Louvet C, Hendler D, de Braud F, Wilson C, Morvan F, Bonetti A. Leucovorin and fluorouracil with or without oxaliplatin as first-line treatment in advanced colorectal cancer. J Clin Oncol 2000; 18: 2938-2947 [PMID: 10944126]
4 Saltz LB, Clarke S, Díaz-Rubio E, Scheithauer W, Figer A, Wong R, Koski S, Lichinitser M, Yang TS, Rivera F, Couture F, Sirzén F, Cassidy J. Bevacizumab in combination with oxaliplatin-based chemotherapy as first-line therapy in metastatic colorectal cancer: a randomized phase III study. J Clin Oncol 2008; 26: 2013-2019 [PMID: 18421054 DOI: 10.1200/JCO.2007.14.9930]
5 Bokemeyer C, Bondarenko I, Makhson A, Hartmann JT, Aparicio J, de Braud F, Donea S, Ludwig H, Schuch G, Stroh C, Loos AH, Zubel A, Koralewski P. Fluorouracil, leucovorin, and oxaliplatin with and without cetuximab in the first-line treatment of metastatic colorectal cancer. J Clin Oncol 2009; 27: 663-671 [PMID: 19114683 DOI: 10.1200/JCO.2008.20.8397]
6 Heinemann V, von Weikersthal LF, Decker T, Kiani A, Vehling-Kaiser U, Al-Batran SE, Heintges T, Lerchenmüller C, Kahl C, Seipelt G, Kullmann F, Stauch M, Scheithauer W, Hielscher J, Scholz M, Müller S, Link H, Niederle N, Rost A, Höffkes HG, Moehler M, Lindig RU, Modest DP, Rossius L, Kirchner T, Jung A, Stintzing S. FOLFIRI plus cetuximab versus FOLFIRI plus bevacizumab as first-line treatment for patients with metastatic colorectal cancer (FIRE-3): a randomised, open-label, phase 3 trial. Lancet Oncol 2014; 15: 1065-1075 [PMID: 25088940 DOI: 10.1016/S1470-2045(14)70330-4]
7 Grothey A, Sugrue MM, Purdie DM, Dong W, Sargent D, Hedrick E, Kozloff M. Bevacizumab beyond first progression is associated with prolonged overall survival in metastatic colorectal cancer: results from a large observational cohort study (BRiTE). J Clin Oncol 2008; 26: 5326-5334 [PMID: 18854571 DOI: 10.1200/JCO.2008.16.3212]
8 Van Cutsem E, Cervantes A, Nordlinger B, Arnold D. Metastatic colorectal cancer: ESMO Clinical Practice Guidelines for diagnosis, treatment and follow-up. Ann Oncol 2014; 25 Suppl 3: iii1-iii9 [PMID: 25190710 DOI: 10.1093/annonc/mdu260]
9 Mantovani A, Allavena P, Sica A, Balkwill F. Cancer-related inflammation. Nature 2008; 454: 436-444 [PMID: 18650914 DOI: 10.1038/nature07205]
10 Shibutani M , Maeda K, Nagahara H, Noda E, Ohtani H, Nishiguchi Y, Hirakawa K. A high preoperative neutrophil-to-lymphocyte ratio is associated with poor survival in patients with colorectal cancer. Anticancer Res 2013; 33: 3291-3294 [PMID: 23898094]
11 Maeda K, Shibutani M, Otani H, Nagahara H, Sugano K, Ikeya T, Amano R, Kimura K, Sakurai K, Kubo N, Muguruma K, Tanaka H, Inoue T, Hirakawa K. Prognostic value of preoperative inflammation-based prognostic scores in patients with stage IV
COMMENTS
Shibutani M et al . The lymphocyte to monocyte ratio
9973 September 14, 2015|Volume 21|Issue 34|WJG|www.wjgnet.com
colorectal cancer who undergo palliative resection of asymptomatic primary tumors. Anticancer Res 2013; 33: 5567-5573 [PMID: 24324099]
12 Shimada H, Takiguchi N, Kainuma O, Soda H, Ikeda A, Cho A, Miyazaki A, Gunji H, Yamamoto H, Nagata M. High preoperative neutrophil-lymphocyte ratio predicts poor survival in patients with gastric cancer. Gastric Cancer 2010; 13: 170-176 [PMID: 20820986 DOI: 10.1007/s10120-010-0554-3]
13 Xue P, Kanai M, Mori Y, Nishimura T, Uza N, Kodama Y, Kawaguchi Y, Takaori K, Matsumoto S, Uemoto S, Chiba T. Neutrophil-to-lymphocyte ratio for predicting palliative chemotherapy outcomes in advanced pancreatic cancer patients. Cancer Med 2014; 3: 406-415 [PMID: 24519894 DOI: 10.1002/cam4.204]
14 Tomita M , Ayabe T, Chosa E, Nakamura K. Prognostic significance of pre- and postoperative glasgow prognostic score for patients with non-small cell lung cancer. Anticancer Res 2014; 34: 3137-3140 [PMID: 24922684]
15 Li YL, Gu KS, Pan YY, Jiao Y, Zhai ZM. Peripheral blood lymphocyte/monocyte ratio at the time of first relapse predicts outcome for patients with relapsed or primary refractory diffuse large B-cell lymphoma. BMC Cancer 2014; 14: 341 [PMID: 24884604 DOI: 10.1186/1471-2407-14-341]
16 Koh YW, Park CS, Yoon DH, Suh C, Huh J. Should the cut-off values of the lymphocyte to monocyte ratio for prediction of prognosis in diffuse large B-cell lymphoma be changed in elderly patients? Eur J Haematol 2014; 93: 340-348 [PMID: 24766257]
17 Kumagai S, Tashima M, Fujikawa J, Iwasaki M, Iwamoto Y, Sueki Y, Fukunaga A, Yanagita S, Nishikori M, Takaori-Kondo A, Arima N. Ratio of peripheral blood absolute lymphocyte count to absolute monocyte count at diagnosis is associated with progression-free survival in follicular lymphoma. Int J Hematol 2014; 99: 737-742 [PMID: 24756873 DOI: 10.1007/s12185-014-1576-0]
18 Porrata LF, Ristow KM, Habermann TM, Witzig TE, Colgan JP, Inwards DJ, Ansell SM, Micallef IN, Johnston PB, Nowakowski G, Thompson CA, Markovic SN. Peripheral blood absolute lymphocyte/monocyte ratio during rituximab, cyclophosphamide, doxorubicin, vincristine and prednisone treatment cycles predicts clinical outcomes in diffuse large B-cell lymphoma. Leuk Lymphoma 2014; 55: 2728-2738 [PMID: 24547705 DOI: 10.3109/10428194.2014.893313]
19 Koh YW, Kang HJ, Park C, Yoon DH, Kim S, Suh C, Go H, Kim JE, Kim CW, Huh J. The ratio of the absolute lymphocyte count to the absolute monocyte count is associated with prognosis in Hodgkin’s lymphoma: correlation with tumor-associated macrophages. Oncologist 2012; 17: 871-880 [PMID: 22588324 DOI: 10.1634/theoncologist.2012-0034]
20 Stotz M, Pichler M, Absenger G, Szkandera J, Arminger F, Schaberl-Moser R, Samonigg H, Stojakovic T, Gerger A. The preoperative lymphocyte to monocyte ratio predicts clinical outcome in patients with stage III colon cancer. Br J Cancer 2014; 110: 435-440 [PMID: 24357796 DOI: 10.1038/bjc.2013.785]
21 Temraz S, Mukherji D, Farhat ZA, Nasr R, Charafeddine M, Shahait M, Wehbe MR, Ghaida RA, Gheida IA, Shamseddine A. Preoperative lymphocyte-to-monocyte ratio predicts clinical outcome in patients undergoing radical cystectomy for transitional cell carcinoma of the bladder: a retrospective analysis. BMC Urol 2014; 14: 76 [PMID: 25234356 DOI: 10.1186/1471-2490-14-76]
22 Hu P, Shen H, Wang G, Zhang P, Liu Q, Du J. Prognostic significance of systemic inflammation-based lymphocyte- monocyte ratio in patients with lung cancer: based on a large cohort study. PLoS One 2014; 9: e108062 [PMID: 25275631 DOI: 10.1371/journal.pone.0108062]
23 Eisenhauer EA, Therasse P, Bogaerts J, Schwartz LH, Sargent D, Ford R, Dancey J, Arbuck S, Gwyther S, Mooney M, Rubinstein L, Shankar L, Dodd L, Kaplan R, Lacombe D, Verweij J. New response evaluation criteria in solid tumours: revised RECIST guideline (version 1.1). Eur J Cancer 2009; 45: 228-247 [PMID: 19097774 DOI: 10.1016/j.ejca.2008.10.026]
24 Terzić J, Grivennikov S, Karin E, Karin M. Inflammation and colon cancer. Gastroenterology 2010; 138: 2101-2114.e5 [PMID: 20420949 DOI: 10.1053/j.gastro.2010.01.058]
25 Lin EY, Pollard JW. Role of infiltrated leucocytes in tumour growth and spread. Br J Cancer 2004; 90: 2053-2058 [PMID: 15164120 DOI: 10.1038/sj.bjc.6601705]
26 Hoffmann TK, Dworacki G, Tsukihiro T, Meidenbauer N, Gooding W, Johnson JT, Whiteside TL. Spontaneous apoptosis of circulating T lymphocytes in patients with head and neck cancer and its clinical importance. Clin Cancer Res 2002; 8: 2553-2562 [PMID: 12171883]
27 Kitayama J, Yasuda K, Kawai K, Sunami E, Nagawa H. Circulating lymphocyte is an important determinant of the effectiveness of preoperative radiotherapy in advanced rectal cancer. BMC Cancer 2011; 11: 64 [PMID: 21306650 DOI: 10.1186/1471-2407-11-64]
28 Cézé N, Thibault G, Goujon G, Viguier J, Watier H, Dorval E, Lecomte T. Pre-treatment lymphopenia as a prognostic biomarker in colorectal cancer patients receiving chemotherapy. Cancer Chemother Pharmacol 2011; 68: 1305-1313 [PMID: 21448592 DOI: 10.1007/s00280-011-1610-3]
29 Evani SJ, Prabhu RG, Gnanaruban V, Finol EA, Ramasubramanian AK. Monocytes mediate metastatic breast tumor cell adhesion to endothelium under flow. FASEB J 2013; 27: 3017-3029 [PMID: 23616566 DOI: 10.1096/fj.12-224824]
30 Mantovani A, Bottazzi B, Colotta F, Sozzani S, Ruco L. The origin and function of tumor-associated macrophages. Immunol Today 1992; 13: 265-270 [PMID: 1388654 DOI: 10.1016/0167-5699(92)90008-U]
31 Pollard JW. Tumour-educated macrophages promote tumour progression and metastasis. Nat Rev Cancer 2004; 4: 71-78 [PMID: 14708027 DOI: 10.1038/nrc1256]
32 Condeelis J, Pollard JW. Macrophages: obligate partners for tumor cell migration, invasion, and metastasis. Cell 2006; 124: 263-266 [PMID: 16439202 DOI: 10.1016/j.cell.2006.01.007]
P- Reviewer: Lakatos PL, Liu XE, Nishida T, Wang G S- Editor: Ma YJ L- Editor: Rutherford A E- Editor: Liu XM
Shibutani M et al . The lymphocyte to monocyte ratio
Kazuhiro Morise, Takafumi Ando, Osamu Watanabe, Masanao Nakamura, Ryoji Miyahara, Osamu Maeda, Kazuhiro Ishiguro, Yoshiki Hirooka, Hidemi Goto
Kazuhiro Morise, Takafumi Ando, Osamu Watanabe, Masanao Nakamura, Ryoji Miyahara, Osamu Maeda, Kazuhiro Ishiguro, Hidemi Goto, Department of Gastroenterology and Hepatology, Nagoya University Graduate School of Medicine, Nagoya, Aichi 466-8550, Japan
Yoshiki Hirooka, Hidemi Goto, Department of Endoscopy, Nagoya University Hospital, Nagoya, Aichi 466-8550, Japan
Author contributions: Morise K, Ando T, and Watanabe O designed the research; Nakamura M, Miyahara R, Maeda O, Ishiguro K, and Hirooka Y collected the data; Morise K and Ando T wrote the paper; Goto H provided a critical review of the manuscript.
Institutional review board statement: The study was approved by the Ethical Review Committee of Nagoya University Hospital.
Conflict-of-interest statement: The authors declare that they have no conflicts of interest.
Open-Access: This article is an open-access article which was selected by an in-house editor and fully peer-reviewed by external reviewers. It is distributed in accordance with the Creative Commons Attribution Non Commercial (CC BY-NC 4.0) license, which permits others to distribute, remix, adapt, build upon this work non-commercially, and license their derivative works on different terms, provided the original work is properly cited and the use is non-commercial. See: http://creativecommons.org/licenses/by-nc/4.0/
Correspondence to: Takafumi Ando, MD, PhD, Department of Gastroenterology and Hepatology, Nagoya University Graduate School of Medicine, 65 Tsurumai-cho, Showa-ku, Nagoya, Aichi 466-8550, Japan. [email protected]: +81-52-744-2144 Fax: +81-52-744-2175
Received: March 6, 2015Peer-review started: March 10, 2015First decision: April 13, 2015Revised: May 12, 2015Accepted: July 15, 2015
Article in press: July 15, 2015Published online: September 14, 2015
AbstractAIM: To evaluate the clinical value of the newly modified Simple Endoscopic Score for Crohn’s disease (mSES-CD).
METHODS: Seventy-six Crohn’s disease (CD) patients who underwent transanal double balloon endoscopy (DBE) in our hospital between 2003 and 2012 were retrospectively reviewed. DBE is defined as small intestinal endoscopy using two attached balloons. We included patients with stenosis which hampered passage of the scope and those who underwent DBE with observation for at least 80 cm from the ileocecal valve. Our new mSES-CD assesses the endoscopic activity of two consecutive small intestinal segments located 0-40 cm and 40-80 cm from the ileocecal valve by DBE, in addition to the activity of four colorectal segments. To compare the usefulness of mSES-CD with SES-CD, we similarly divided the patients into two groups according to total mSES-CD score (low disease activity group, < 4; high disease activity group, ≥ 4). The clinical value of mSES-CD in predicting clinical outcome in patients with CD was evaluated using the occurrence of surgery after DBE as an endpoint.
RESULTS: Median age of the 76 CD patients was 36 years (range, 16-71). Thirty-nine patients had stenosis which hampered passage of the DBE to 80 cm on the proximal side from the ileocecal valve. Median evaluable length of small intestine by DBE was 80 cm (range, 3-200). A total of 74 patients had one or more small intestinal lesions detected by DBE, of which 62 (83.8%) were within 80 cm of the ileocecal valve on the proximal side. Only two patients (2.7%) with proximal-
ORIGINAL ARTICLE
Submit a Manuscript: http://www.wjgnet.com/esps/Help Desk: http://www.wjgnet.com/esps/helpdesk.aspxDOI: 10.3748/wjg.v21.i34.9974
World J Gastroenterol 2015 September 14; 21(34): 9974-9981 ISSN 1007-9327 (print) ISSN 2219-2840 (online)
© 2015 Baishideng Publishing Group Inc. All rights reserved.
9974 September 14, 2015|Volume 21|Issue 34|WJG|www.wjgnet.com
Retrospective Study
Clinical utility of a new endoscopic scoring system for Crohn’s disease
surgery during long-term follow-up in patients treated with infliximab (IFX). To evaluate MH, several conventional endoscopic scoring methods for CD have been proposed, including the Crohn’s Disease Endoscopic Index of Severity (CDEIS) and Simple Endoscopic Score for Crohn’s Disease (SES-CD)[6,7]. The SES-CD scores four variables - ulcer size, extent of ulcerated surface, extent of affected surface, and stenosis - from 0 to 3 in the five segments of the ileum, right colon, transverse colon, left colon, and rectum. Daperno et al[8] reported that the SES-CD is a simple, reproducible, and easily used endoscopic scoring system for CD, and showed a strong correlation with CDEIS (r = 0.920).
The recent availability of double balloon endoscopy (DBE) allows evaluation of the activity of small intestinal lesions as well as colorectal lesions by an endoscopic procedure. Although a number of incidents have been reported, serious complications with DBE are rare, particularly with diagnostic DBE[9-11]. To date, however, a method of evaluating MH in CD which includes the small intestine has not been established. To date, capsule endoscopy (CE) and magnetic resonance enterography (MRE) have both been shown to be capable of assessing mucosal healing[12-16]. However, a method of evaluating MH which includes small intestinal lesions in patients with CD using DBE has not been established.
Here, we assessed the importance of evaluating the endoscopic activity of small intestinal lesions by DBE. We also propose a newly modified Simple Endoscopic Score for Crohn’s disease (mSES-CD), which includes assessment of the endoscopic activity of small intestinal lesions, and evaluate its usefulness in predicting the prognosis of CD.
MATERIALS AND METHODSPatientsThe study was approved by the ethical review committee of Nagoya University Hospital. CD was diagnosed on the basis of standard clinical, endoscopic, and histological criteria. Between 2003 and 2012, the medical records of 76 patients with CD who underwent transanal DBE in our hospital were retrospectively reviewed. We included patients with stenosis which hampered passage of the scope and those who underwent DBE with observation for at least 80 cm from the ileocecal valve. Median age was 36 years (range, 16-71 years) and 60 of 76 were male. Patient characteristics are summarized in Table 1.
Double balloon endoscopyDBE was first performed in humans by Yamamoto et al[17] in 2000, and has been available for the clinical care of CD patients in Japan since 2003. In brief, DBE is performed using two balloons, one attached to the tip of the endoscope and the second at the distal
Morise K et al . Useful endoscopic score for Crohn's disease
9975 September 14, 2015|Volume 21|Issue 34|WJG|www.wjgnet.com
side lesions more than 80 cm from the ileocecal valve did not have lesions within 80 cm. Patients with high mSES-CD scores showed significantly shorter surgery-free survival than those with low scores (P < 0.05). In contrast, surgery-free survival did not significantly differ between the low and high SES-CD groups (P > 0.05). Multivariate analysis by a Cox proportional hazards model identified mSES-CD as an independent factor for surgery-free survival.
CONCLUSION: mSES-CD is useful in evaluating the risk of surgery-free survival in patients with CD.
Key words: Crohn’s disease; Modified Simple Endoscopic Score; Mucosal healing; Double balloon endoscopy; Surgery-free survival
© The Author(s) 2015. Published by Baishideng Publishing Group Inc. All rights reserved.
Core tip: Modified Simple Endoscopic Score for Crohn’s disease (mSES-CD) is a new scoring method which includes assessment of the endoscopic activity of small intestinal as well as colorectal lesions by double balloon endoscopy. mSES-CD is useful in evaluating the risk of salvage surgery-free survival in patients with Crohn’s disease.
Morise K, Ando T, Watanabe O, Nakamura M, Miyahara R, Maeda O, Ishiguro K, Hirooka Y, Goto H. Clinical utility of a new endoscopic scoring system for Crohn’s disease. World J Gastroenterol 2015; 21(34): 9974-9981 Available from: URL: http://www.wjgnet.com/1007-9327/full/v21/i34/9974.htm DOI: http://dx.doi.org/10.3748/wjg.v21.i34.9974
INTRODUCTIONCrohn’s disease (CD) is an inflammatory bowel disease of unknown etiology. In Japan, the Research Committee of Inflammatory Bowel Disease, established by the Japanese Ministry of Health and Welfare, estimates that the number of patients with CD is increasing by 1500 every year. CD is characterized as a chronic process with repeating recurrence and recrudescence, and can affect any part of the gastrointestinal tract. Many CD patients require surgery, with Solberg et al[1] reporting a cumulative probability of surgery over 10 years of 37.9%.
The traditional goal of CD therapy has been the induction and maintenance of clinical remission. With the availability of monoclonal antibodies, however, the goal of treatment has switched to mucosal healing (MH). Previous reports showed that, because of its association with the prognosis of CD, MH is more important than clinical remission[2-4]. For example, Schnitzler et al[5] reported that MH was significantly associated with a lower need for major abdominal
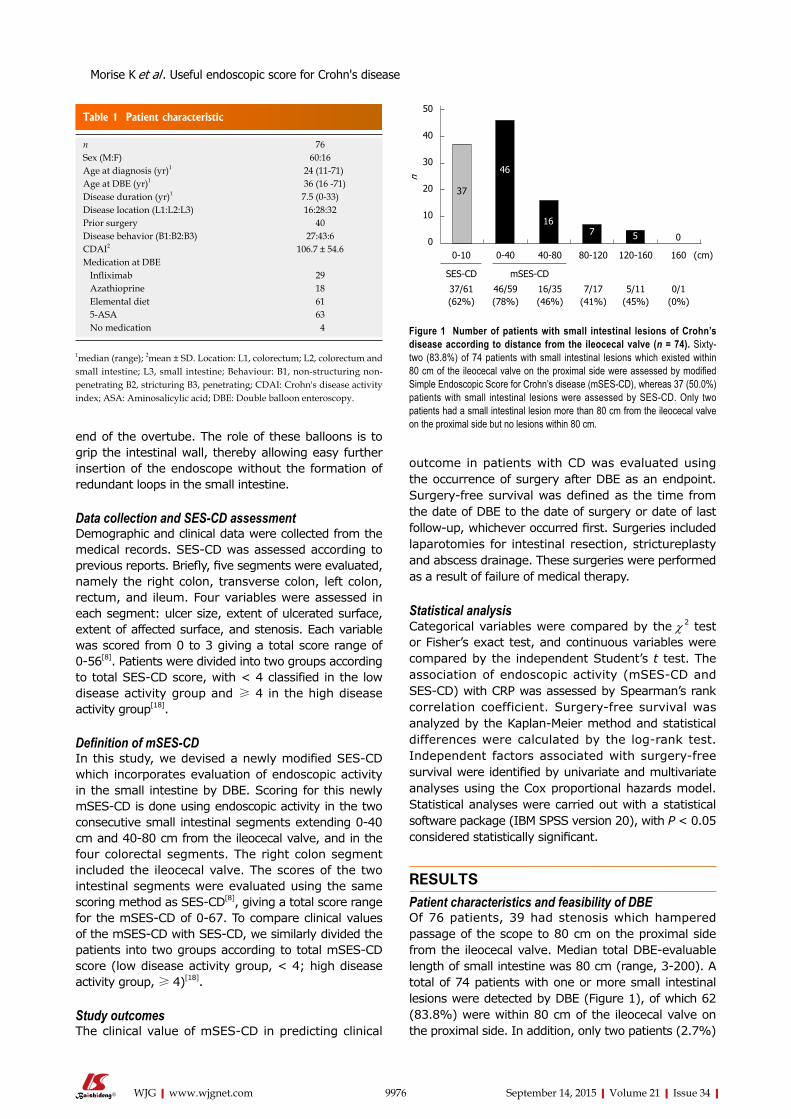
end of the overtube. The role of these balloons is to grip the intestinal wall, thereby allowing easy further insertion of the endoscope without the formation of redundant loops in the small intestine.
Data collection and SES-CD assessmentDemographic and clinical data were collected from the medical records. SES-CD was assessed according to previous reports. Briefly, five segments were evaluated, namely the right colon, transverse colon, left colon, rectum, and ileum. Four variables were assessed in each segment: ulcer size, extent of ulcerated surface, extent of affected surface, and stenosis. Each variable was scored from 0 to 3 giving a total score range of 0-56[8]. Patients were divided into two groups according to total SES-CD score, with < 4 classified in the low disease activity group and ≥ 4 in the high disease activity group[18].
Definition of mSES-CDIn this study, we devised a newly modified SES-CD which incorporates evaluation of endoscopic activity in the small intestine by DBE. Scoring for this newly mSES-CD is done using endoscopic activity in the two consecutive small intestinal segments extending 0-40 cm and 40-80 cm from the ileocecal valve, and in the four colorectal segments. The right colon segment included the ileocecal valve. The scores of the two intestinal segments were evaluated using the same scoring method as SES-CD[8], giving a total score range for the mSES-CD of 0-67. To compare clinical values of the mSES-CD with SES-CD, we similarly divided the patients into two groups according to total mSES-CD score (low disease activity group, < 4; high disease activity group, ≥ 4)[18].
Study outcomes The clinical value of mSES-CD in predicting clinical
outcome in patients with CD was evaluated using the occurrence of surgery after DBE as an endpoint. Surgery-free survival was defined as the time from the date of DBE to the date of surgery or date of last follow-up, whichever occurred first. Surgeries included laparotomies for intestinal resection, strictureplasty and abscess drainage. These surgeries were performed as a result of failure of medical therapy.
Statistical analysisCategorical variables were compared by the χ 2 test or Fisher’s exact test, and continuous variables were compared by the independent Student’s t test. The association of endoscopic activity (mSES-CD and SES-CD) with CRP was assessed by Spearman’s rank correlation coefficient. Surgery-free survival was analyzed by the Kaplan-Meier method and statistical differences were calculated by the log-rank test. Independent factors associated with surgery-free survival were identified by univariate and multivariate analyses using the Cox proportional hazards model. Statistical analyses were carried out with a statistical software package (IBM SPSS version 20), with P < 0.05 considered statistically significant.
RESULTSPatient characteristics and feasibility of DBEOf 76 patients, 39 had stenosis which hampered passage of the scope to 80 cm on the proximal side from the ileocecal valve. Median total DBE-evaluable length of small intestine was 80 cm (range, 3-200). A total of 74 patients with one or more small intestinal lesions were detected by DBE (Figure 1), of which 62 (83.8%) were within 80 cm of the ileocecal valve on the proximal side. In addition, only two patients (2.7%)
9976 September 14, 2015|Volume 21|Issue 34|WJG|www.wjgnet.com
Table 1 Patient characteristic
n 76Sex (M:F) 60:16Age at diagnosis (yr)1 24 (11-71)Age at DBE (yr)1 36 (16 -71)Disease duration (yr)1 7.5 (0-33)Disease location (L1:L2:L3) 16:28:32Prior surgery 40Disease behavior (B1:B2:B3) 27:43:6CDAI2 106.7 ± 54.6Medication at DBE Infliximab 29 Azathioprine 18 Elemental diet 61 5-ASA 63 No medication 4
1median (range); 2mean ± SD. Location: L1, colorectum; L2, colorectum and small intestine; L3, small intestine; Behaviour: B1, non-structuring non-penetrating B2, stricturing B3, penetrating; CDAI: Crohn's disease activity index; ASA: Aminosalicylic acid; DBE: Double balloon enteroscopy.
n
50
40
30
20
10
0
37
0
46
167 5
0-10 0-40 40-80 80-120 120-160 160 (cm)
SES-CD mSES-CD
37/61 46/59 16/35 7/17 5/11 0/1(62%) (78%) (46%) (41%) (45%) (0%)
Figure 1 Number of patients with small intestinal lesions of Crohn’s disease according to distance from the ileocecal valve (n = 74). Sixty-two (83.8%) of 74 patients with small intestinal lesions which existed within 80 cm of the ileocecal valve on the proximal side were assessed by modified Simple Endoscopic Score for Crohn’s disease (mSES-CD), whereas 37 (50.0%) patients with small intestinal lesions were assessed by SES-CD. Only two patients had a small intestinal lesion more than 80 cm from the ileocecal valve on the proximal side but no lesions within 80 cm.
Morise K et al . Useful endoscopic score for Crohn's disease
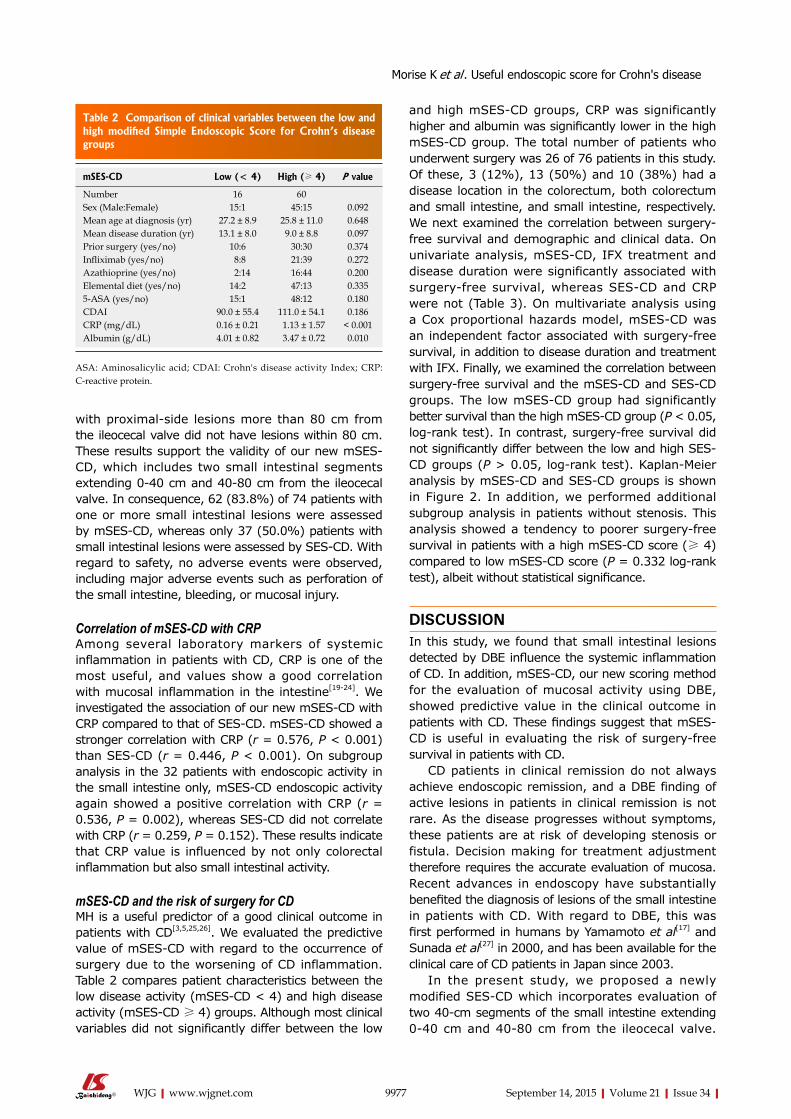
and high mSES-CD groups, CRP was significantly higher and albumin was significantly lower in the high mSES-CD group. The total number of patients who underwent surgery was 26 of 76 patients in this study. Of these, 3 (12%), 13 (50%) and 10 (38%) had a disease location in the colorectum, both colorectum and small intestine, and small intestine, respectively. We next examined the correlation between surgery-free survival and demographic and clinical data. On univariate analysis, mSES-CD, IFX treatment and disease duration were significantly associated with surgery-free survival, whereas SES-CD and CRP were not (Table 3). On multivariate analysis using a Cox proportional hazards model, mSES-CD was an independent factor associated with surgery-free survival, in addition to disease duration and treatment with IFX. Finally, we examined the correlation between surgery-free survival and the mSES-CD and SES-CD groups. The low mSES-CD group had significantly better survival than the high mSES-CD group (P < 0.05, log-rank test). In contrast, surgery-free survival did not significantly differ between the low and high SES-CD groups (P > 0.05, log-rank test). Kaplan-Meier analysis by mSES-CD and SES-CD groups is shown in Figure 2. In addition, we performed additional subgroup analysis in patients without stenosis. This analysis showed a tendency to poorer surgery-free survival in patients with a high mSES-CD score (≥ 4) compared to low mSES-CD score (P = 0.332 log-rank test), albeit without statistical significance.
DISCUSSIONIn this study, we found that small intestinal lesions detected by DBE influence the systemic inflammation of CD. In addition, mSES-CD, our new scoring method for the evaluation of mucosal activity using DBE, showed predictive value in the clinical outcome in patients with CD. These findings suggest that mSES-CD is useful in evaluating the risk of surgery-free survival in patients with CD.
CD patients in clinical remission do not always achieve endoscopic remission, and a DBE finding of active lesions in patients in clinical remission is not rare. As the disease progresses without symptoms, these patients are at risk of developing stenosis or fistula. Decision making for treatment adjustment therefore requires the accurate evaluation of mucosa. Recent advances in endoscopy have substantially benefited the diagnosis of lesions of the small intestine in patients with CD. With regard to DBE, this was first performed in humans by Yamamoto et al[17] and Sunada et al[27] in 2000, and has been available for the clinical care of CD patients in Japan since 2003.
In the present study, we proposed a newly modified SES-CD which incorporates evaluation of two 40-cm segments of the small intestine extending 0-40 cm and 40-80 cm from the ileocecal valve.
with proximal-side lesions more than 80 cm from the ileocecal valve did not have lesions within 80 cm. These results support the validity of our new mSES-CD, which includes two small intestinal segments extending 0-40 cm and 40-80 cm from the ileocecal valve. In consequence, 62 (83.8%) of 74 patients with one or more small intestinal lesions were assessed by mSES-CD, whereas only 37 (50.0%) patients with small intestinal lesions were assessed by SES-CD. With regard to safety, no adverse events were observed, including major adverse events such as perforation of the small intestine, bleeding, or mucosal injury.
Correlation of mSES-CD with CRPAmong several laboratory markers of systemic inflammation in patients with CD, CRP is one of the most useful, and values show a good correlation with mucosal inflammation in the intestine[19-24]. We investigated the association of our new mSES-CD with CRP compared to that of SES-CD. mSES-CD showed a stronger correlation with CRP (r = 0.576, P < 0.001) than SES-CD (r = 0.446, P < 0.001). On subgroup analysis in the 32 patients with endoscopic activity in the small intestine only, mSES-CD endoscopic activity again showed a positive correlation with CRP (r = 0.536, P = 0.002), whereas SES-CD did not correlate with CRP (r = 0.259, P = 0.152). These results indicate that CRP value is influenced by not only colorectal inflammation but also small intestinal activity.
mSES-CD and the risk of surgery for CD MH is a useful predictor of a good clinical outcome in patients with CD[3,5,25,26]. We evaluated the predictive value of mSES-CD with regard to the occurrence of surgery due to the worsening of CD inflammation. Table 2 compares patient characteristics between the low disease activity (mSES-CD < 4) and high disease activity (mSES-CD ≥ 4) groups. Although most clinical variables did not significantly differ between the low
9977 September 14, 2015|Volume 21|Issue 34|WJG|www.wjgnet.com
Table 2 Comparison of clinical variables between the low and high modified Simple Endoscopic Score for Crohn’s disease groups
mSES-CD Low (< 4) High (≥ 4) P value
Number 16 60Sex (Male:Female) 15:1 45:15 0.092Mean age at diagnosis (yr) 27.2 ± 8.9 25.8 ± 11.0 0.648Mean disease duration (yr) 13.1 ± 8.0 9.0 ± 8.8 0.097Prior surgery (yes/no) 10:6 30:30 0.374Infliximab (yes/no) 8:8 21:39 0.272Azathioprine (yes/no) 2:14 16:44 0.200Elemental diet (yes/no) 14:2 47:13 0.3355-ASA (yes/no) 15:1 48:12 0.180CDAI 90.0 ± 55.4 111.0 ± 54.1 0.186CRP (mg/dL) 0.16 ± 0.21 1.13 ± 1.57 < 0.001Albumin (g/dL) 4.01 ± 0.82 3.47 ± 0.72 0.010
ASA: Aminosalicylic acid; CDAI: Crohn's disease activity Index; CRP: C-reactive protein.
Morise K et al . Useful endoscopic score for Crohn's disease
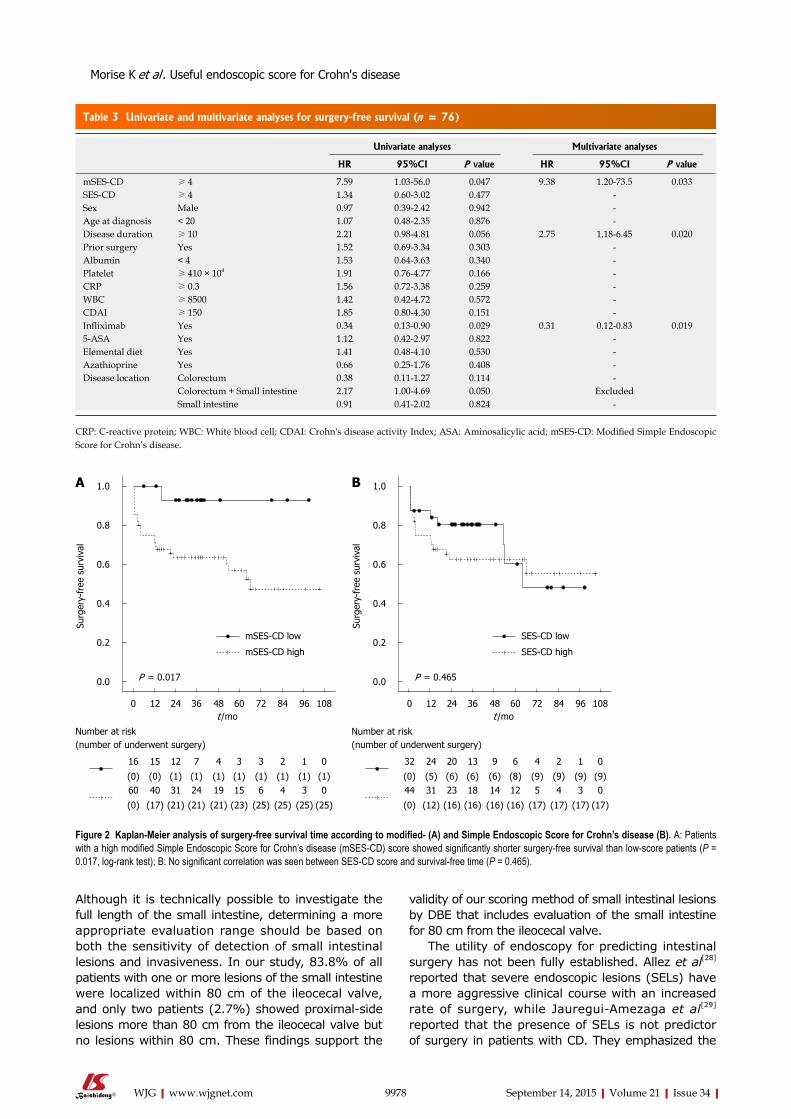
Although it is technically possible to investigate the full length of the small intestine, determining a more appropriate evaluation range should be based on both the sensitivity of detection of small intestinal lesions and invasiveness. In our study, 83.8% of all patients with one or more lesions of the small intestine were localized within 80 cm of the ileocecal valve, and only two patients (2.7%) showed proximal-side lesions more than 80 cm from the ileocecal valve but no lesions within 80 cm. These findings support the
validity of our scoring method of small intestinal lesions by DBE that includes evaluation of the small intestine for 80 cm from the ileocecal valve.
The utility of endoscopy for predicting intestinal surgery has not been fully established. Allez et al[28] reported that severe endoscopic lesions (SELs) have a more aggressive clinical course with an increased rate of surgery, while Jauregui-Amezaga et al[29] reported that the presence of SELs is not predictor of surgery in patients with CD. They emphasized the
9978 September 14, 2015|Volume 21|Issue 34|WJG|www.wjgnet.com
CRP: C-reactive protein; WBC: White blood cell; CDAI: Crohn's disease activity Index; ASA: Aminosalicylic acid; mSES-CD: Modified Simple Endoscopic Score for Crohn’s disease.
Table 3 Univariate and multivariate analyses for surgery-free survival (n = 76)
Univariate analyses Multivariate analyses
HR 95%CI P value HR 95%CI P value
mSES-CD ≥ 4 7.59 1.03-56.0 0.047 9.38 1.20-73.5 0.033SES-CD ≥ 4 1.34 0.60-3.02 0.477 -Sex Male 0.97 0.39-2.42 0.942 -Age at diagnosis < 20 1.07 0.48-2.35 0.876 -Disease duration ≥ 10 2.21 0.98-4.81 0.056 2.75 1.18-6.45 0.020Prior surgery Yes 1.52 0.69-3.34 0.303 -Albumin < 4 1.53 0.64-3.63 0.340 -Platelet ≥ 410 × 104 1.91 0.76-4.77 0.166 -CRP ≥ 0.3 1.56 0.72-3.38 0.259 -WBC ≥ 8500 1.42 0.42-4.72 0.572 -CDAI ≥ 150 1.85 0.80-4.30 0.151 -Infliximab Yes 0.34 0.13-0.90 0.029 0.31 0.12-0.83 0.0195-ASA Yes 1.12 0.42-2.97 0.822 -Elemental diet Yes 1.41 0.48-4.10 0.530 -Azathioprine Yes 0.66 0.25-1.76 0.408 -Disease location Colorectum 0.38 0.11-1.27 0.114 -
Colorectum + Small intestine 2.17 1.00-4.69 0.050 ExcludedSmall intestine 0.91 0.41-2.02 0.824 -
mSES-CD low
mSES-CD high
P = 0.017
1.0
0.8
0.6
0.4
0.2
0.0
Surg
ery-
free
sur
viva
l
0 12 24 36 48 60 72 84 96 108t /mo
16 15 12 7 4 3 3 2 1 0
Number at risk (number of underwent surgery)
(0) (0) (1) (1) (1) (1) (1) (1) (1) (1)60 40 31 24 19 15 6 4 3 0
(0) (17) (21) (21) (21) (23) (25) (25) (25) (25)
SES-CD low
SES-CD high
P = 0.465
1.0
0.8
0.6
0.4
0.2
0.0
Surg
ery-
free
sur
viva
l
0 12 24 36 48 60 72 84 96 108t /mo
32 24 20 13 9 6 4 2 1 0
Number at risk (number of underwent surgery)
(0) (5) (6) (6) (6) (8) (9) (9) (9) (9)44 31 23 18 14 12 5 4 3 0
(0) (12) (16) (16) (16) (16) (17) (17) (17) (17)
A B
Figure 2 Kaplan-Meier analysis of surgery-free survival time according to modified- (A) and Simple Endoscopic Score for Crohn’s disease (B). A: Patients with a high modified Simple Endoscopic Score for Crohn’s disease (mSES-CD) score showed significantly shorter surgery-free survival than low-score patients (P = 0.017, log-rank test); B: No significant correlation was seen between SES-CD score and survival-free time (P = 0.465).
Morise K et al . Useful endoscopic score for Crohn's disease
importance of stenosis and/or intra-abdominal fistulae on MRI for predicting an increased risk of surgery. We agree with their discussion of the clinical importance of evaluating stenosis, which is consistent with the present study. To determine the benefit of DBE more clearly, we performed additional subgroup analysis in patients without stenosis. The analysis showed a tendency to poorer surgery-free survival in patients with a high mSES-CD score (≥ 4) compared to low mSES-CD score, albeit without statistical significance, probably due to the small sample size. These results and previously reported evidence might suggest that the evaluation of lesions other than stenosis is also potentially useful in predicting the event of surgery. On this basis, evaluation of lesions other than stenosis using DBE would provide more accurate risk estimation for the event of surgery, although further validation studies are warranted. In addition, infliximab therapy and disease duration were significantly associated with the event of surgery. Jauregui-Amezaga et al[29] reported that immunosuppressants and anti-TNF therapy reduce the risk of the event of surgery, whereas prolonged disease duration significantly increases the risk of this event. Similar to these previous results, both infliximab and duration of disease were independent factors associated with surgery-free survival in this study.
Vermeire et al[19] reported that CRP is an objec-tive marker of inflammation and showed good correlation with disease activity in CD compared to ESR, leucocytes, platelet count, and albumin. In our study, mSES-CD showed a better correlation with CRP than SES-CD in both the total study cohort and in a subgroup limited to those with small intestinal lesions only. Of note, the traditional SES-CD showed no correlation with CRP in this subgroup with small intestinal lesions only. These findings suggest that small intestinal lesions influence the systematic inflammation of CD. Although CRP value was not directly associated with clinical outcome (surgery-free survival in our study), we consider that CRP is useful as a non-invasive biomarker for decision making on whether to perform follow-up DBE in patients with CD. More specifically, elevated CRP may indicate the need for DBE evaluation of the inflammatory activity of not only colorectal but also small intestinal lesions.
When patients were divided into two groups by total mSES-CD score, surgery-free survival was significantly better in the low score group than in the high group. In contrast, the low and high SES-CD score groups did not significantly differ. Moreover, mSES-CD score was an independent factor for surgery-free survival in multivariate analysis. Frøslie et al[25] reported that MH was significantly associated with a low risk of future colectomy in UC patients (P = 0.02), and MH was significantly associated with less inflammation after 5 years in CD patients (P = 0.02) in a Norwegian population-based inflammatory bowel disease cohort.
Our observation of inflammatory activity in both the
colorectum and small intestine in CD suggests that our mSES-CD scoring, which includes evaluation of the small intestine, might be more useful in predicting the clinical outcome of CD than the conventional scoring system.
Recent reports have described the new modality of capsule endoscopy (CE) for the evaluation of small intestinal activity of CD. CE appears relatively non-invasive compared to DBE, but is contraindicated in the presence of small intestinal stenosis because of the risk of retention of the capsule endoscope. The major adverse events of CE involve capsule retention. Cheifetz et al[30] reported a retention rate of 13% in patients with known CD, but only 1.6% in those with suspected CD. The retained capsule has to be removed by endoscopy or surgical intervention. By contrast, there were no complications in the 76 DBEs in our study, while Oshitani et al[31] reported a single case of ileal perforation because of overtube balloon pressure in 53 examinations in patients with CD (1.9%). Further, Bourreille et al[32] reported that although CE had lower sensitivity than ileocolonoscopy in detecting recurrence in the neoterminal ileum, CE detected lesions outside the scope of ileocolonoscopy in more than two-thirds of patients. We consider that the combination of these two methods might provide more accurate evaluation of MH in patients with CD than either modality alone. Further prospective studies to compare the efficacy and safety of these procedures are needed.
Several limitations of this study warrant mention. First, it was conducted under a retrospective design and with a small sample size. Confirmation of the findings awaits larger prospective studies. Second, we identified the location of small intestinal lesions by the insertion length of DBE and radiography. However, precise determination of insertion length is hindered by expansion and contraction of the small intestine. Third, we assessed endoscopic activity in two small intestinal segments of 40 cm each, at 0-40 cm and 40-80 cm from the ileocecal valve, in addition to the four traditional colorectal segments of right colon, transverse colon, left colon, and rectum. However, whether assessment of these two segments represents the inflammatory status of the whole small intestine has not been confirmed. Fourth, a definition of mucosal healing has still not been established. In patients with a low endoscopic score, CD activity might be lower than in those with a high score. However, we were unable to diagnose whether mucosal healing was obtained, and therefore defined “endoscopic score < 4” as the “low disease activity group”, and “endoscopic score ≥ 4” as the “high disease activity group”. Fifth, physicians who recommended surgery were not blinded to information on endoscopic assessment. Surgery-free survival is a surrogate endpoint for evaluating the clinical course of patients with CD. Because of its surrogate nature, selection bias from the assessment of endoscopy influences the clinical decision for surgical treatment.
9979 September 14, 2015|Volume 21|Issue 34|WJG|www.wjgnet.com
Morise K et al . Useful endoscopic score for Crohn's disease
Finally, we included all patients with CD who underwent transanal DBE in our hospital, which happened to include only a small number of L1 patients compared to L2 and L3. If more L1 patients had been included, SES-CD might have been more predictive.
In conclusion, this retrospective study showed that mSES-CD, our new scoring method for mucosal activity evaluated using DBE, has predictive value for clinical outcome in patients with CD. Further validation studies of mSES-CD are warranted.
COMMENTSBackgroundSeveral conventional endoscopic scoring methods for Crohn’s disease (CD) have been proposed, including ‘Simple Endoscopic Score for Crohn’s Disease (SES-CD)’. The recent availability of double balloon endoscopy (DBE) allows evaluation of the activity of small intestinal lesions as well as colorectal lesions by an endoscopic procedure. The importance of evaluating the endoscopic activity of small intestinal lesions by DBE was assessed.
Innovations and breakthroughsCD patients with high scores by modified Simple Endoscopic Score for Crohn’s disease (mSES-CD), this new scoring method for mucosal activity evaluated using DBE, showed significantly shorter surgery-free survival than those with low scores, while surgery-free survival did not significantly differ between the low and high SES-CD groups.
ApplicationsmSES-CD could offer predictive value for clinical outcome in patients with CD. The authors recommend the use of mSES-CD in evaluating the risk of salvage surgery-free survival in patients with CD
TerminologyThe newly mSES-CD is a new scoring method which includes assessment of the endoscopic activity of small intestinal as well as colorectal lesions by DBE.
Peer-reviewThis study’s efforts to validate an endoscopic scoring system using newer technology is important. It is somewhat limited by its retrospective nature that only includes those patients who have been pre-selected to undergo DBE.
REFERENCES1 Solberg IC, Vatn MH, Høie O, Stray N, Sauar J, Jahnsen J,
Moum B, Lygren I. Clinical course in Crohn’s disease: results of a Norwegian population-based ten-year follow-up study. Clin Gastroenterol Hepatol 2007; 5: 1430-1438 [PMID: 18054751]
2 Castiglione F, Testa A, Rea M, De Palma GD, Diaferia M, Musto D, Sasso F, Caporaso N, Rispo A. Transmural healing evaluated by bowel sonography in patients with Crohn’s disease on maintenance treatment with biologics. Inflamm Bowel Dis 2013; 19: 1928-1934 [PMID: 23835441 DOI: 10.1097/MIB.0b013e31829053ce]
3 af Björkesten CG, Nieminen U, Sipponen T, Turunen U, Arkkila P, Färkkilä M. Mucosal healing at 3 months predicts long-term endoscopic remission in anti-TNF-treated luminal Crohn’s disease. Scand J Gastroenterol 2013; 48: 543-551 [PMID: 23477356 DOI: 10.3109/00365521.2013.772230]
4 Paul S , Del Tedesco E, Marotte H, Rinaudo-Gaujous M, Moreau A, Phelip JM, Genin C, Peyrin-Biroulet L, Roblin X. Therapeutic drug monitoring of infliximab and mucosal healing in inflammatory bowel disease: a prospective study. Inflamm Bowel Dis 2013; 19: 2568-2576 [PMID: 24013361 DOI: 10.1097/MIB.0b013e3182a77b41]
5 Schnitzler F, Fidder H, Ferrante M, Noman M, Arijs I, Van Assche
G, Hoffman I, Van Steen K, Vermeire S, Rutgeerts P. Mucosal healing predicts long-term outcome of maintenance therapy with infliximab in Crohn’s disease. Inflamm Bowel Dis 2009; 15: 1295-1301 [PMID: 19340881 DOI: 10.1002/ibd.20927]
6 Mary JY, Modigliani R. Development and validation of an endoscopic index of the severity for Crohn’s disease: a prospective multicentre study. Groupe d’Etudes Thérapeutiques des Affections Inflammatoires du Tube Digestif (GETAID). Gut 1989; 30: 983-989 [PMID: 2668130]
7 De Cruz P, Kamm MA, Prideaux L, Allen PB, Moore G. Mucosal healing in Crohn’s disease: a systematic review. Inflamm Bowel Dis 2013; 19: 429-444 [PMID: 22539420 DOI: 10.1002/ibd.22977]
8 Daperno M, D’Haens G, Van Assche G, Baert F, Bulois P, Maunoury V, Sostegni R, Rocca R, Pera A, Gevers A, Mary JY, Colombel JF, Rutgeerts P. Development and validation of a new, simplified endoscopic activity score for Crohn’s disease: the SES-CD. Gastrointest Endosc 2004; 60: 505-512 [PMID: 15472670]
9 Mensink PB, Haringsma J, Kucharzik T, Cellier C, Pérez-Cuadrado E, Mönkemüller K, Gasbarrini A, Kaffes AJ, Nakamura K, Yen HH, Yamamoto H. Complications of double balloon enteroscopy: a multicenter survey. Endoscopy 2007; 39: 613-615 [PMID: 17516287]
10 Gerson LB, Tokar J, Chiorean M, Lo S, Decker GA, Cave D, Bouhaidar D, Mishkin D, Dye C, Haluszka O, Leighton JA, Zfass A, Semrad C. Complications associated with double balloon enteroscopy at nine US centers. Clin Gastroenterol Hepatol 2009; 7: 1177-1182, 1182.e1-3 [PMID: 19602453 DOI: 10.1016/j.cgh.2009.07.005]
11 Möschler O, May A, Müller MK, Ell C. Complications in and performance of double-balloon enteroscopy (DBE): results from a large prospective DBE database in Germany. Endoscopy 2011; 43: 484-489 [PMID: 21370220 DOI: 10.1055/s-0030-1256249]
12 Ordás I, Rimola J, Rodríguez S, Paredes JM, Martínez-Pérez MJ, Blanc E, Arévalo JA, Aduna M, Andreu M, Radosevic A, Ramírez-Morros AM, Pinó S, Gallego M, Jauregui-Amezaga A, Ricart E, Panés J. Accuracy of magnetic resonance enterography in assessing response to therapy and mucosal healing in patients with Crohn’s disease. Gastroenterology 2014; 146: 374-82.e1 [PMID: 24177375 DOI: 10.1053/j.gastro.2013.10.055]
13 Papadia C, Maffei E, Del Rio P, Taylor S, Caini S, Montana C, Coruzzi A, Franzè A, Cademartiri F, Forbes A. Sensitivity and specificity of magnetic resonance enterography in the clinical management of fistulizing Crohn’s disease. Inflamm Bowel Dis 2013; 19: 1896-1903 [PMID: 23759996 DOI: 10.1097/MIB.0b013e31828f19a5]
14 Hall B, Holleran G, Chin JL, Smith S, Ryan B, Mahmud N, McNamara D. A prospective 52 week mucosal healing assessment of small bowel Crohn’s disease as detected by capsule endoscopy. J Crohns Colitis 2014; 8: 1601-1609 [PMID: 25257546 DOI: 10.1016/j.crohns.2014.09.005]
15 Niv E, Fishman S, Kachman H, Arnon R, Dotan I. Sequential capsule endoscopy of the small bowel for follow-up of patients with known Crohn’s disease. J Crohns Colitis 2014; 8: 1616-1623 [PMID: 24666976 DOI: 10.1016/j.crohns.2014.03.003]
16 Tillack C, Seiderer J, Brand S, Göke B, Reiser MF, Schaefer C, Diepolder H, Ochsenkühn T, Herrmann KA. Correlation of magnetic resonance enteroclysis (MRE) and wireless capsule en-doscopy (CE) in the diagnosis of small bowel lesions in Crohn’s disease. Inflamm Bowel Dis 2008; 14: 1219-1228 [PMID: 18484672 DOI: 10.1002/ibd.20466]
17 Yamamoto H, Sekine Y, Sato Y, Higashizawa T, Miyata T, Iino S, Ido K, Sugano K. Total enteroscopy with a nonsurgical steerable double-balloon method. Gastrointest Endosc 2001; 53: 216-220 [PMID: 11174299]
18 Schoepfer AM, Beglinger C, Straumann A, Trummler M, Vavricka SR, Bruegger LE, Seibold F. Fecal calprotectin correlates more closely with the Simple Endoscopic Score for Crohn’s disease (SES-CD) than CRP, blood leukocytes, and the CDAI. Am J Gastroenterol 2010; 105: 162-169 [PMID: 19755969 DOI: 10.1038/ajg.2009.545]
19 Vermeire S, Van Assche G, Rutgeerts P. Laboratory markers in
9980 September 14, 2015|Volume 21|Issue 34|WJG|www.wjgnet.com
COMMENTS
Morise K et al . Useful endoscopic score for Crohn's disease
IBD: useful, magic, or unnecessary toys? Gut 2006; 55: 426-431 [PMID: 16474109]
20 Filik L, Dagli U, Ulker A. C-reactive protein and monitoring the activity of Crohn’s disease. Adv Ther 2006; 23: 655-662 [PMID: 17050508]
21 Denis MA, Reenaers C, Fontaine F, Belaïche J, Louis E. Assessment of endoscopic activity index and biological inflammatory markers in clinically active Crohn’s disease with normal C-reactive protein serum level. Inflamm Bowel Dis 2007; 13: 1100-1105 [PMID: 17508418]
22 Kiss LS, Szamosi T, Molnar T, Miheller P, Lakatos L, Vincze A, Palatka K, Barta Z, Gasztonyi B, Salamon A, Horvath G, Tóth GT, Farkas K, Banai J, Tulassay Z, Nagy F, Szenes M, Veres G, Lovasz BD, Vegh Z, Golovics PA, Szathmari M, Papp M, Lakatos PL. Early clinical remission and normalisation of CRP are the strongest predictors of efficacy, mucosal healing and dose escalation during the first year of adalimumab therapy in Crohn’s disease. Aliment Pharmacol Ther 2011; 34: 911-922 [PMID: 21883326 DOI: 10.1111/j.1365-2036.2011.04827.x]
23 Jürgens M, Mahachie John JM, Cleynen I, Schnitzler F, Fidder H, van Moerkercke W, Ballet V, Noman M, Hoffman I, van Assche G, Rutgeerts PJ, van Steen K, Vermeire S. Levels of C-reactive protein are associated with response to infliximab therapy in patients with Crohn’s disease. Clin Gastroenterol Hepatol 2011; 9: 421-7.e1 [PMID: 21334460 DOI: 10.1016/j.cgh.2011.02.008]
24 Jones J, Loftus EV, Panaccione R, Chen LS, Peterson S, McConnell J, Baudhuin L, Hanson K, Feagan BG, Harmsen SW, Zinsmeister AR, Helou E, Sandborn WJ. Relationships between disease activity and serum and fecal biomarkers in patients with Crohn’s disease. Clin Gastroenterol Hepatol 2008; 6: 1218-1224 [PMID: 18799360 DOI: 10.1016/j.cgh.2008.06.010]
25 Frøslie KF, Jahnsen J, Moum BA, Vatn MH. Mucosal healing in inflammatory bowel disease: results from a Norwegian population-based cohort. Gastroenterology 2007; 133: 412-422 [PMID: 17681162]
26 Baert F, Moortgat L, Van Assche G, Caenepeel P, Vergauwe P, De Vos M, Stokkers P, Hommes D, Rutgeerts P, Vermeire S, D’Haens G; Belgian Inflammatory Bowel Disease Research Group; North-Holland Gut Club. Mucosal healing predicts sustained clinical remission in patients with early-stage Crohn’s disease. Gastroenterology 2010; 138: 463-48; quiz e10-1 [PMID: 19818785 DOI: 10.1053/j.gastro.2009.09.056]
27 Sunada K, Yamamoto H. Double-balloon endoscopy: past, present, and future. J Gastroenterol 2009; 44: 1-12 [PMID: 19159069 DOI: 10.1007/s00535-008-2292-4]
28 Allez M, Lemann M, Bonnet J, Cattan P, Jian R, Modigliani R. Long term outcome of patients with active Crohn’s disease exhibiting extensive and deep ulcerations at colonoscopy. Am J Gastroenterol 2002; 97: 947-953 [PMID: 12003431]
29 Jauregui-Amezaga A, Rimola J, Ordás I, Rodríguez S, Ramírez-Morros A, Gallego M, Masamunt MC, Llach J, González-Suárez B, Ricart E, Panés J. Value of endoscopy and MRI for predicting intestinal surgery in patients with Crohn’s disease in the era of biologics. Gut 2015; 64: 1397-1402 [PMID: 25516418 DOI: 10.1136/gutjnl-2014-308101]
30 Cheifetz AS, Kornbluth AA, Legnani P, Schmelkin I, Brown A, Lichtiger S, Lewis BS. The risk of retention of the capsule endoscope in patients with known or suspected Crohn’s disease. Am J Gastroenterol 2006; 101: 2218-2222 [PMID: 16848804]
31 Oshitani N, Yukawa T, Yamagami H, Inagawa M, Kamata N, Watanabe K, Jinno Y, Fujiwara Y, Higuchi K, Arakawa T. Evaluation of deep small bowel involvement by double-balloon enteroscopy in Crohn’s disease. Am J Gastroenterol 2006; 101: 1484-1489 [PMID: 16863550]
32 Bourreille A, Jarry M, D’Halluin PN, Ben-Soussan E, Maunoury V, Bulois P, Sacher-Huvelin S, Vahedy K, Lerebours E, Heresbach D, Bretagne JF, Colombel JF, Galmiche JP. Wireless capsule endoscopy versus ileocolonoscopy for the diagnosis of postoperative recurrence of Crohn’s disease: a prospective study. Gut 2006; 55: 978-983 [PMID: 16401689]
P- Reviewer: Boirivant M, Hall BJ, Zimmerman LA S- Editor: Yu J L- Editor: A E- Editor: Ma S
9981 September 14, 2015|Volume 21|Issue 34|WJG|www.wjgnet.com
Morise K et al . Useful endoscopic score for Crohn's disease
Submit a Manuscript: http://www.wjgnet.com/esps/Help Desk: http://www.wjgnet.com/esps/helpdesk.aspxDOI: 10.3748/wjg.v21.i34.9982
World J Gastroenterol 2015 September 14; 21(34): 9982-9992 ISSN 1007-9327 (print) ISSN 2219-2840 (online)
© 2015 Baishideng Publishing Group Inc. All rights reserved.
9982 September 14, 2015|Volume 21|Issue 34|WJG|www.wjgnet.com
Novel 3-dimensional virtual hepatectomy simulation combined with real-time deformation
Yukio Oshiro, Hiroaki Yano, Jun Mitani, Sangtae Kim, Jaejeong Kim, Kiyoshi Fukunaga, Nobuhiro Ohkohchi
Yukio Oshiro, Hiroaki Yano, Jun Mitani, Sangtae Kim, Jaejeong Kim, Kiyoshi Fukunaga, Nobuhiro Ohkohchi, Department of Surgery, Division of Gastroenterological and Hepatobiliary Surgery and Organ Transplantation, Faculty of Medicine, University of Tsukuba, Tsukuba 305-8575, Japan
Hiroaki Yano, Jun Mitani, Department of Computer Science, Graduate School of System Information Engineering, University of Tsukuba, Tsukuba 305-8575, Japan
Sangtae Kim, Jaejeong Kim, School of Informatics, College of Media Arts Science and Technology, Faculty of Library Information and Media Science, University of Tsukuba, Tsukuba 305-8575, Japan
Author contributions: All of the authors made substantial contributions to the acquisition, analysis, and interpretation of data and participated in writing the paper; Ohkohchi N gave final approval to the version to be published; all of the authors have read and approved the final version to be published.
Institutional review board statement: This study was approved by a research ethics committee at University of Tsukuba Hospital.
Informed consent statement: This study was conducted in accordance with the patients’ informed consent.
Conflict-of-interest statement: All authors indicated no potential conflicts of interest.
Data sharing statement: The corresponding author had full access to all the data in the study and takes responsibility for the integrity of the data and the accuracy of the data analysis.
Open-Access: This article is an open-access article which was selected by an in-house editor and fully peer-reviewed by external reviewers. It is distributed in accordance with the Creative Commons Attribution Non Commercial (CC BY-NC 4.0) license, which permits others to distribute, remix, adapt, build upon this work non-commercially, and license their derivative works on different terms, provided the original work is properly cited and the use is non-commercial. See: http://creativecommons.org/licenses/by-nc/4.0/
Correspondence to: Nobuhiro Ohkohchi, MD, PhD, Department of Surgery, Division of Gastroenterological and Hepatobiliary Surgery and Organ Transplantation, Faculty of Medicine, University of Tsukuba, 1-1-1 Tennodai, Tsukuba 305-8575, Japan. [email protected]: +81-29-8533221Fax: +81-29-8533222
Received: March 11, 2015Peer-review started: March 13, 2015First decision: April 13, 2015Revised: May 7, 2015Accepted: July 3, 2015Article in press: July 3, 2015Published online: September 14, 2015
AbstractAIM: To develop a novel 3-dimensional (3D) virtual hepatectomy simulation software, Liversim, to visualize the real-time deformation of the liver.
METHODS: We developed a novel real-time virtual hepatectomy simulation software program called Liversim. The software provides 4 basic functions: viewing 3D models from arbitrary directions, changing the colors and opacities of the models, deforming the models based on user interaction, and incising the liver parenchyma and intrahepatic vessels based on user operations. From April 2010 through 2013, 99 patients underwent virtual hepatectomies that used the conventional software program SYNAPSE VINCENT preoperatively. Between April 2012 and October 2013, 11 patients received virtual hepatectomies using the novel software program Liversim; these hepatectomies were performed both preoperatively and at the same that the actual hepatectomy was performed in an operating room. The perioperative outcomes were analyzed between the patients for whom SYNAPSE VINCENT was used and those for whom Liversim was
Retrospective Study
ORIGINAL ARTICLE
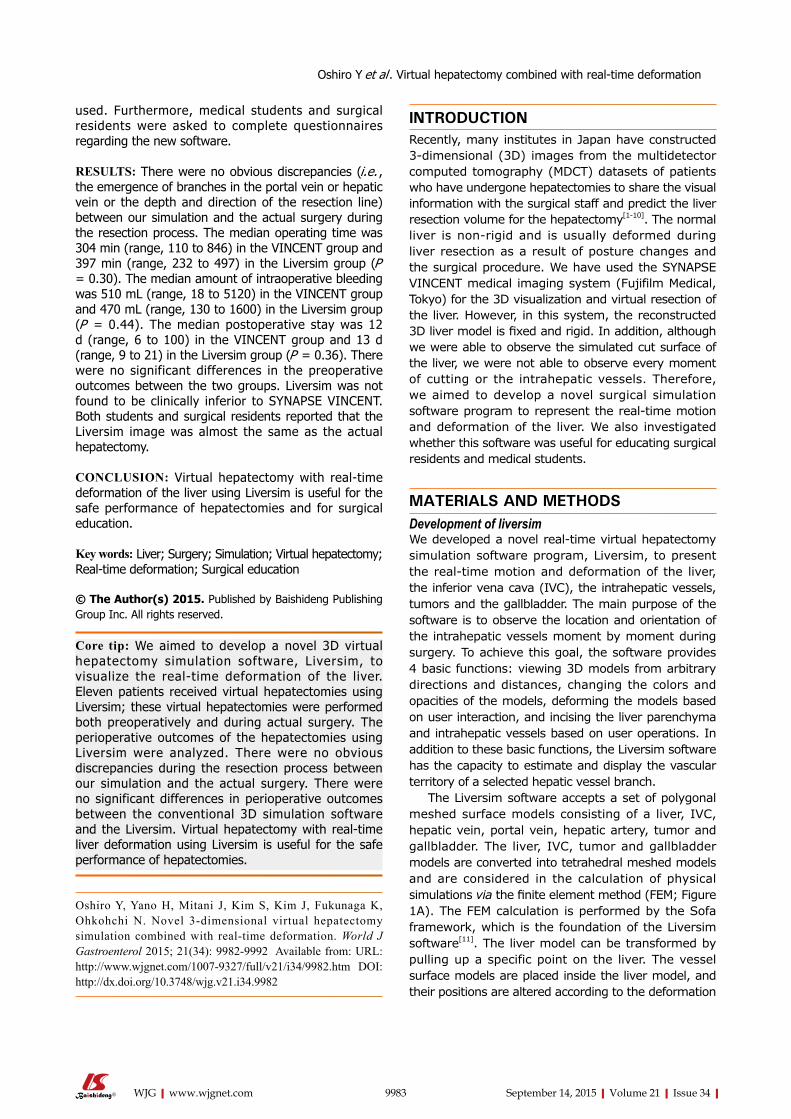
used. Furthermore, medical students and surgical residents were asked to complete questionnaires regarding the new software.
RESULTS: There were no obvious discrepancies (i.e. , the emergence of branches in the portal vein or hepatic vein or the depth and direction of the resection line) between our simulation and the actual surgery during the resection process. The median operating time was 304 min (range, 110 to 846) in the VINCENT group and 397 min (range, 232 to 497) in the Liversim group (P = 0.30). The median amount of intraoperative bleeding was 510 mL (range, 18 to 5120) in the VINCENT group and 470 mL (range, 130 to 1600) in the Liversim group (P = 0.44). The median postoperative stay was 12 d (range, 6 to 100) in the VINCENT group and 13 d (range, 9 to 21) in the Liversim group (P = 0.36). There were no significant differences in the preoperative outcomes between the two groups. Liversim was not found to be clinically inferior to SYNAPSE VINCENT. Both students and surgical residents reported that the Liversim image was almost the same as the actual hepatectomy.
CONCLUSION: Virtual hepatectomy with real-time deformation of the liver using Liversim is useful for the safe performance of hepatectomies and for surgical education.
Key words: Liver; Surgery; Simulation; Virtual hepatectomy; Real-time deformation; Surgical education
© The Author(s) 2015. Published by Baishideng Publishing Group Inc. All rights reserved.
Core tip: We aimed to develop a novel 3D virtual hepatectomy simulation software, Liversim, to visualize the real-time deformation of the liver. Eleven patients received virtual hepatectomies using Liversim; these virtual hepatectomies were performed both preoperatively and during actual surgery. The perioperative outcomes of the hepatectomies using Liversim were analyzed. There were no obvious discrepancies during the resection process between our simulation and the actual surgery. There were no significant differences in perioperative outcomes between the conventional 3D simulation software and the Liversim. Virtual hepatectomy with real-time liver deformation using Liversim is useful for the safe performance of hepatectomies.
Oshiro Y, Yano H, Mitani J, Kim S, Kim J, Fukunaga K, Ohkohchi N. Novel 3-dimensional virtual hepatectomy simulation combined with real-time deformation. World J Gastroenterol 2015; 21(34): 9982-9992 Available from: URL: http://www.wjgnet.com/1007-9327/full/v21/i34/9982.htm DOI: http://dx.doi.org/10.3748/wjg.v21.i34.9982
INTRODUCTIONRecently, many institutes in Japan have constructed 3-dimensional (3D) images from the multidetector computed tomography (MDCT) datasets of patients who have undergone hepatectomies to share the visual information with the surgical staff and predict the liver resection volume for the hepatectomy[1-10]. The normal liver is non-rigid and is usually deformed during liver resection as a result of posture changes and the surgical procedure. We have used the SYNAPSE VINCENT medical imaging system (Fujifilm Medical, Tokyo) for the 3D visualization and virtual resection of the liver. However, in this system, the reconstructed 3D liver model is fixed and rigid. In addition, although we were able to observe the simulated cut surface of the liver, we were not able to observe every moment of cutting or the intrahepatic vessels. Therefore, we aimed to develop a novel surgical simulation software program to represent the real-time motion and deformation of the liver. We also investigated whether this software was useful for educating surgical residents and medical students.
MATERIALS AND METHODSdevelopment of liversimWe developed a novel real-time virtual hepatectomy simulation software program, Liversim, to present the real-time motion and deformation of the liver, the inferior vena cava (IVC), the intrahepatic vessels, tumors and the gallbladder. The main purpose of the software is to observe the location and orientation of the intrahepatic vessels moment by moment during surgery. To achieve this goal, the software provides 4 basic functions: viewing 3D models from arbitrary directions and distances, changing the colors and opacities of the models, deforming the models based on user interaction, and incising the liver parenchyma and intrahepatic vessels based on user operations. In addition to these basic functions, the Liversim software has the capacity to estimate and display the vascular territory of a selected hepatic vessel branch.
The Liversim software accepts a set of polygonal meshed surface models consisting of a liver, IVC, hepatic vein, portal vein, hepatic artery, tumor and gallbladder. The liver, IVC, tumor and gallbladder models are converted into tetrahedral meshed models and are considered in the calculation of physical simulations via the finite element method (FEM; Figure 1A). The FEM calculation is performed by the Sofa framework, which is the foundation of the Liversim software[11]. The liver model can be transformed by pulling up a specific point on the liver. The vessel surface models are placed inside the liver model, and their positions are altered according to the deformation
Oshiro Y et al . Virtual hepatectomy combined with real-time deformation
9983 September 14, 2015|Volume 21|Issue 34|WJG|www.wjgnet.com
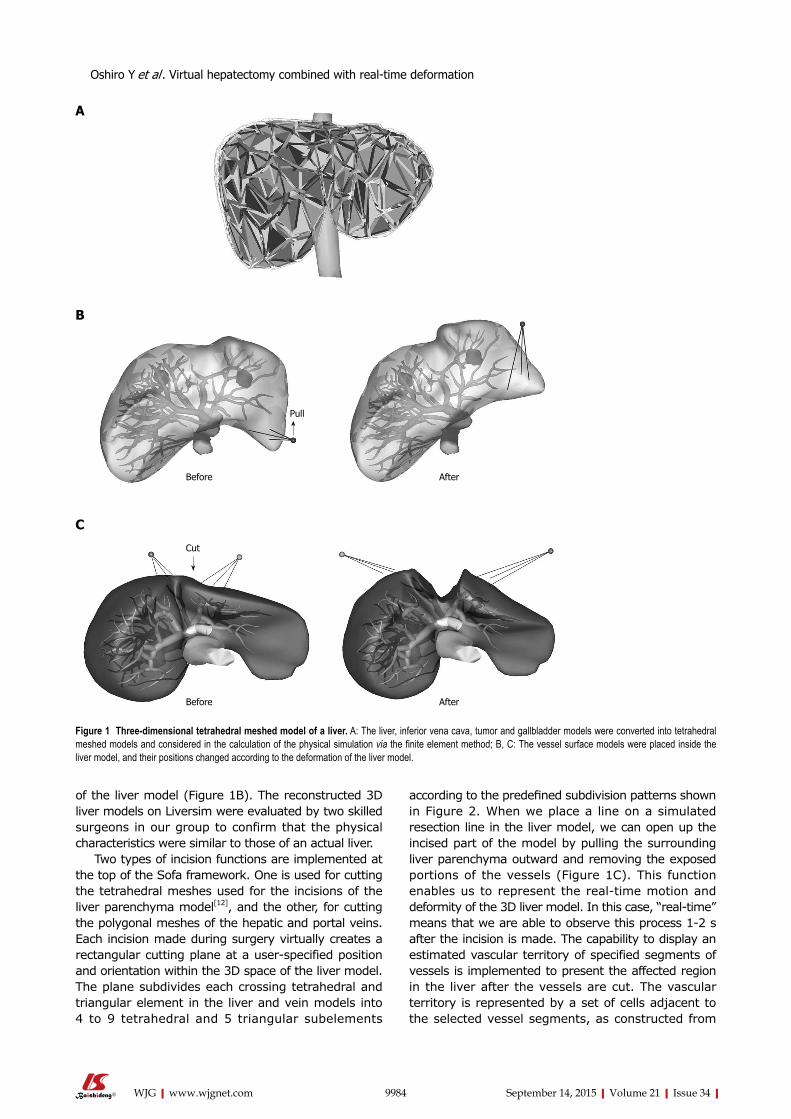
of the liver model (Figure 1B). The reconstructed 3D liver models on Liversim were evaluated by two skilled surgeons in our group to confirm that the physical characteristics were similar to those of an actual liver.
Two types of incision functions are implemented at the top of the Sofa framework. One is used for cutting the tetrahedral meshes used for the incisions of the liver parenchyma model[12], and the other, for cutting the polygonal meshes of the hepatic and portal veins. Each incision made during surgery virtually creates a rectangular cutting plane at a user-specified position and orientation within the 3D space of the liver model. The plane subdivides each crossing tetrahedral and triangular element in the liver and vein models into 4 to 9 tetrahedral and 5 triangular subelements
according to the predefined subdivision patterns shown in Figure 2. When we place a line on a simulated resection line in the liver model, we can open up the incised part of the model by pulling the surrounding liver parenchyma outward and removing the exposed portions of the vessels (Figure 1C). This function enables us to represent the real-time motion and deformity of the 3D liver model. In this case, “real-time” means that we are able to observe this process 1-2 s after the incision is made. The capability to display an estimated vascular territory of specified segments of vessels is implemented to present the affected region in the liver after the vessels are cut. The vascular territory is represented by a set of cells adjacent to the selected vessel segments, as constructed from
9984 September 14, 2015|Volume 21|Issue 34|WJG|www.wjgnet.com
Pull
Before After
Cut
Before After
Figure 1 Three-dimensional tetrahedral meshed model of a liver. A: The liver, inferior vena cava, tumor and gallbladder models were converted into tetrahedral meshed models and considered in the calculation of the physical simulation via the finite element method; B, C: The vessel surface models were placed inside the liver model, and their positions changed according to the deformation of the liver model.
C
B
A
Oshiro Y et al . Virtual hepatectomy combined with real-time deformation
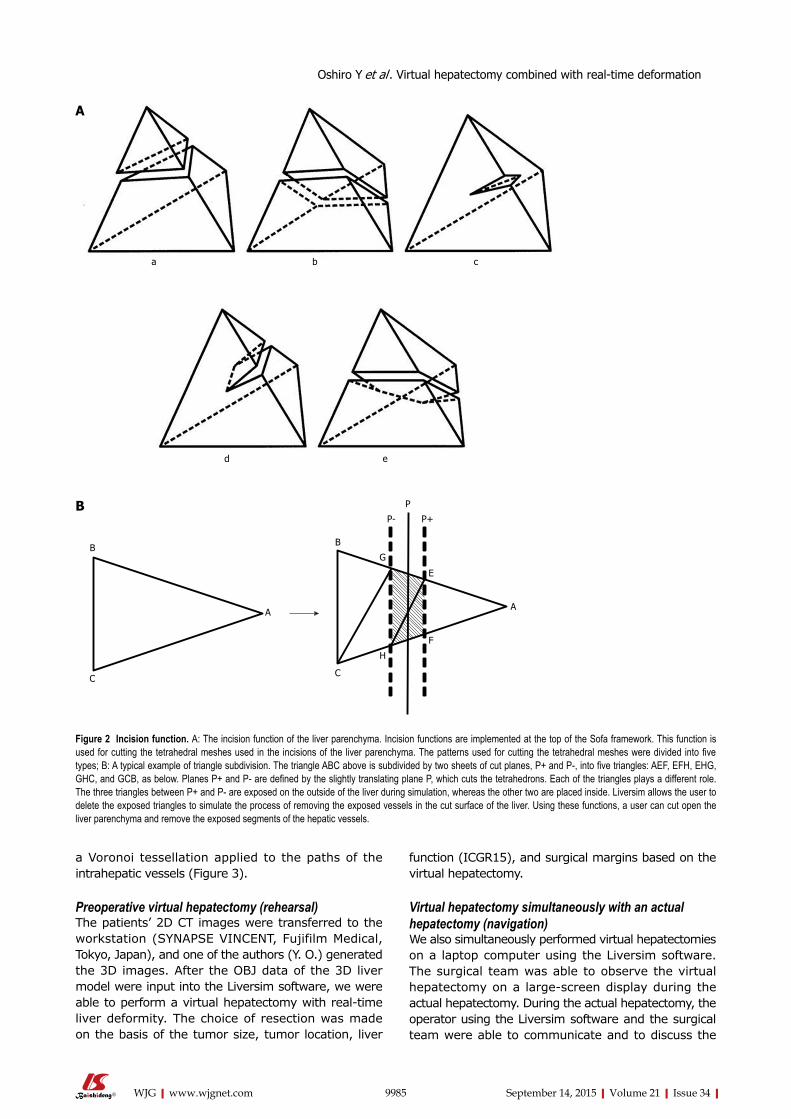
function (ICGR15), and surgical margins based on the virtual hepatectomy.
Virtual hepatectomy simultaneously with an actual hepatectomy (navigation)We also simultaneously performed virtual hepatectomies on a laptop computer using the Liversim software. The surgical team was able to observe the virtual hepatectomy on a large-screen display during the actual hepatectomy. During the actual hepatectomy, the operator using the Liversim software and the surgical team were able to communicate and to discuss the
a Voronoi tessellation applied to the paths of the intrahepatic vessels (Figure 3).
Preoperative virtual hepatectomy (rehearsal)The patients’ 2D CT images were transferred to the workstation (SYNAPSE VINCENT, Fujifilm Medical, Tokyo, Japan), and one of the authors (Y. O.) generated the 3D images. After the OBJ data of the 3D liver model were input into the Liversim software, we were able to perform a virtual hepatectomy with real-time liver deformity. The choice of resection was made on the basis of the tumor size, tumor location, liver
9985 September 14, 2015|Volume 21|Issue 34|WJG|www.wjgnet.com
Figure 2 incision function. A: The incision function of the liver parenchyma. Incision functions are implemented at the top of the Sofa framework. This function is used for cutting the tetrahedral meshes used in the incisions of the liver parenchyma. The patterns used for cutting the tetrahedral meshes were divided into five types; B: A typical example of triangle subdivision. The triangle ABC above is subdivided by two sheets of cut planes, P+ and P-, into five triangles: AEF, EFH, EHG, GHC, and GCB, as below. Planes P+ and P- are defined by the slightly translating plane P, which cuts the tetrahedrons. Each of the triangles plays a different role. The three triangles between P+ and P- are exposed on the outside of the liver during simulation, whereas the other two are placed inside. Liversim allows the user to delete the exposed triangles to simulate the process of removing the exposed vessels in the cut surface of the liver. Using these functions, a user can cut open the liver parenchyma and remove the exposed segments of the hepatic vessels.
a b c
ed
A
B
C
A
B
C
P
P- P+
G
E
H
F
B
A
Oshiro Y et al . Virtual hepatectomy combined with real-time deformation
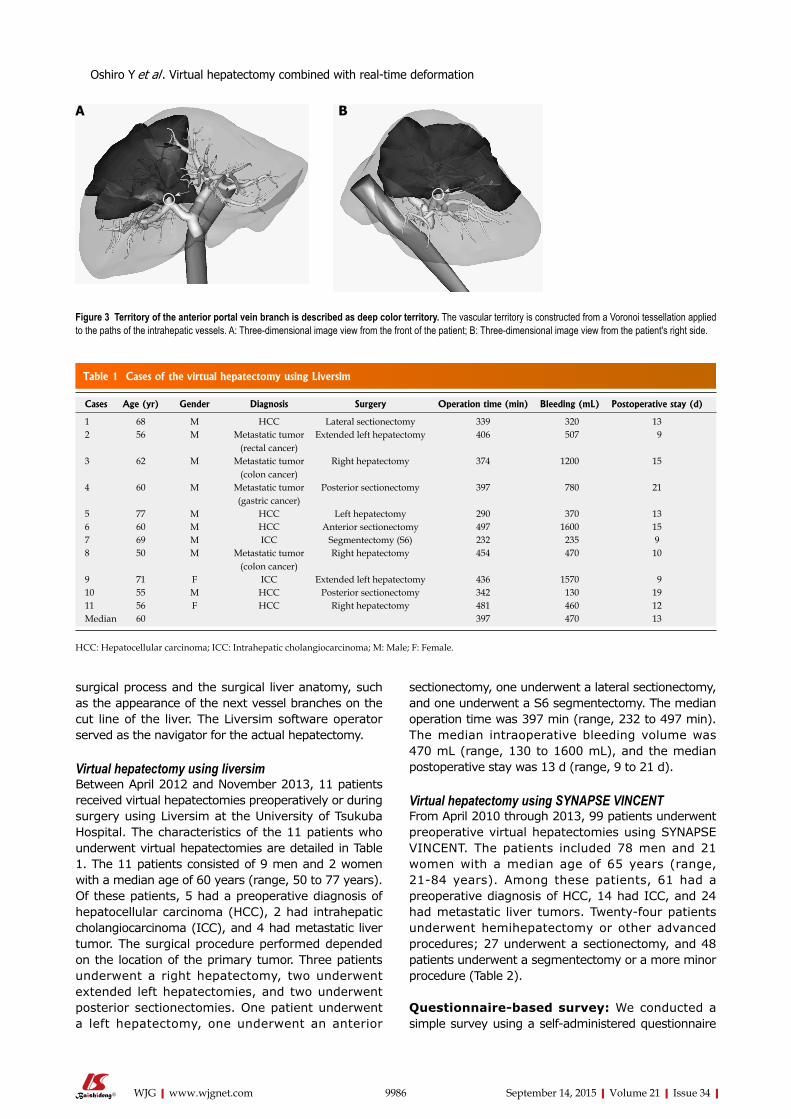
surgical process and the surgical liver anatomy, such as the appearance of the next vessel branches on the cut line of the liver. The Liversim software operator served as the navigator for the actual hepatectomy.
Virtual hepatectomy using liversimBetween April 2012 and November 2013, 11 patients received virtual hepatectomies preoperatively or during surgery using Liversim at the University of Tsukuba Hospital. The characteristics of the 11 patients who underwent virtual hepatectomies are detailed in Table 1. The 11 patients consisted of 9 men and 2 women with a median age of 60 years (range, 50 to 77 years). Of these patients, 5 had a preoperative diagnosis of hepatocellular carcinoma (HCC), 2 had intrahepatic cholangiocarcinoma (ICC), and 4 had metastatic liver tumor. The surgical procedure performed depended on the location of the primary tumor. Three patients underwent a right hepatectomy, two underwent extended left hepatectomies, and two underwent posterior sectionectomies. One patient underwent a left hepatectomy, one underwent an anterior
sectionectomy, one underwent a lateral sectionectomy, and one underwent a S6 segmentectomy. The median operation time was 397 min (range, 232 to 497 min). The median intraoperative bleeding volume was 470 mL (range, 130 to 1600 mL), and the median postoperative stay was 13 d (range, 9 to 21 d).
Virtual hepatectomy using SYNAPSE VINCENTFrom April 2010 through 2013, 99 patients underwent preoperative virtual hepatectomies using SYNAPSE VINCENT. The patients included 78 men and 21 women with a median age of 65 years (range, 21-84 years). Among these patients, 61 had a preoperative diagnosis of HCC, 14 had ICC, and 24 had metastatic liver tumors. Twenty-four patients underwent hemihepatectomy or other advanced procedures; 27 underwent a sectionectomy, and 48 patients underwent a segmentectomy or a more minor procedure (Table 2).
Questionnaire-based survey: We conducted a simple survey using a self-administered questionnaire
9986 September 14, 2015|Volume 21|Issue 34|WJG|www.wjgnet.com
BA
Figure 3 Territory of the anterior portal vein branch is described as deep color territory. The vascular territory is constructed from a Voronoi tessellation applied to the paths of the intrahepatic vessels. A: Three-dimensional image view from the front of the patient; B: Three-dimensional image view from the patient's right side.
Table 1 Cases of the virtual hepatectomy using Liversim
Cases Age (yr) Gender Diagnosis Surgery Operation time (min) Bleeding (mL) Postoperative stay (d)
1 68 M HCC Lateral sectionectomy 339 320 132 56 M Metastatic tumor
(rectal cancer)Extended left hepatectomy 406 507 9
3 62 M Metastatic tumor(colon cancer)
Right hepatectomy 374 1200 15
4 60 M Metastatic tumor(gastric cancer)
Posterior sectionectomy 397 780 21
5 77 M HCC Left hepatectomy 290 370 136 60 M HCC Anterior sectionectomy 497 1600 157 69 M ICC Segmentectomy (S6) 232 235 98 50 M Metastatic tumor
(colon cancer)Right hepatectomy 454 470 10
9 71 F ICC Extended left hepatectomy 436 1570 910 55 M HCC Posterior sectionectomy 342 130 1911 56 F HCC Right hepatectomy 481 460 12Median 60 397 470 13
HCC: Hepatocellular carcinoma; ICC: Intrahepatic cholangiocarcinoma; M: Male; F: Female.
Oshiro Y et al . Virtual hepatectomy combined with real-time deformation
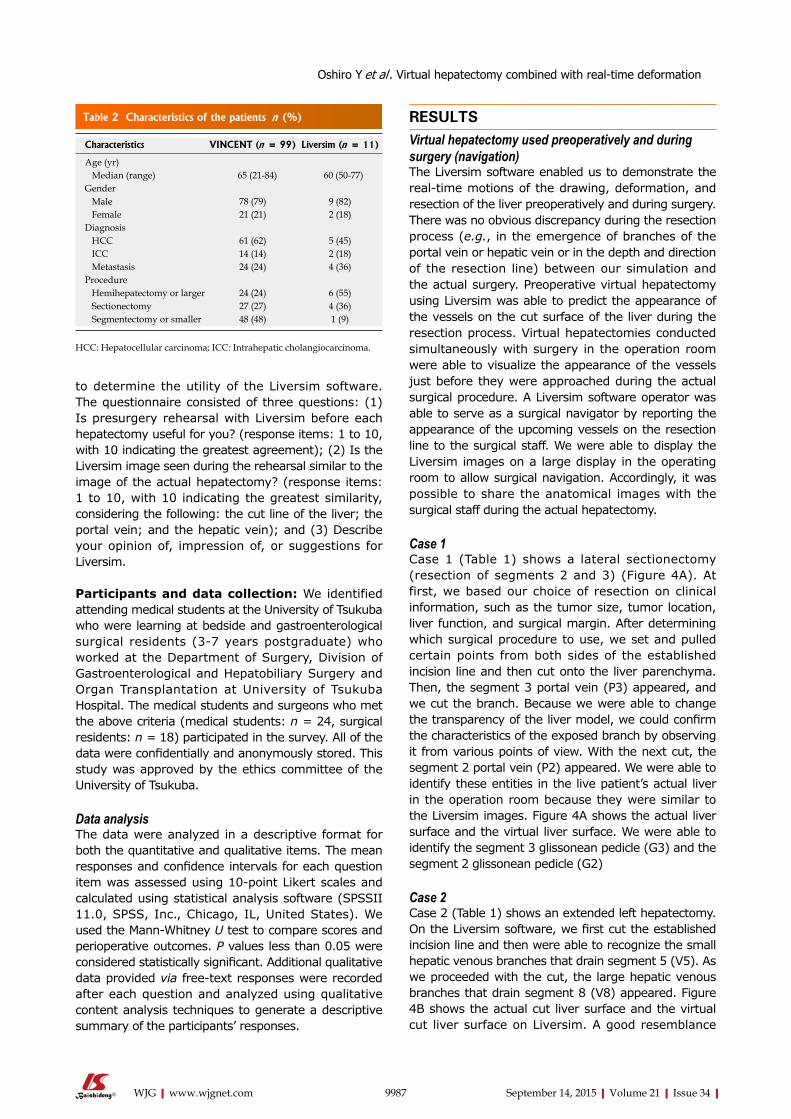
to determine the utility of the Liversim software. The questionnaire consisted of three questions: (1) Is presurgery rehearsal with Liversim before each hepatectomy useful for you? (response items: 1 to 10, with 10 indicating the greatest agreement); (2) Is the Liversim image seen during the rehearsal similar to the image of the actual hepatectomy? (response items: 1 to 10, with 10 indicating the greatest similarity, considering the following: the cut line of the liver; the portal vein; and the hepatic vein); and (3) Describe your opinion of, impression of, or suggestions for Liversim.
Participants and data collection: We identified attending medical students at the University of Tsukuba who were learning at bedside and gastroenterological surgical residents (3-7 years postgraduate) who worked at the Department of Surgery, Division of Gastroenterological and Hepatobiliary Surgery and Organ Transplantation at University of Tsukuba Hospital. The medical students and surgeons who met the above criteria (medical students: n = 24, surgical residents: n = 18) participated in the survey. All of the data were confidentially and anonymously stored. This study was approved by the ethics committee of the University of Tsukuba.
data analysis The data were analyzed in a descriptive format for both the quantitative and qualitative items. The mean responses and confidence intervals for each question item was assessed using 10-point Likert scales and calculated using statistical analysis software (SPSSII 11.0, SPSS, Inc., Chicago, IL, United States). We used the Mann-Whitney U test to compare scores and perioperative outcomes. P values less than 0.05 were considered statistically significant. Additional qualitative data provided via free-text responses were recorded after each question and analyzed using qualitative content analysis techniques to generate a descriptive summary of the participants’ responses.
RESULTSVirtual hepatectomy used preoperatively and during surgery (navigation)The Liversim software enabled us to demonstrate the real-time motions of the drawing, deformation, and resection of the liver preoperatively and during surgery. There was no obvious discrepancy during the resection process (e.g., in the emergence of branches of the portal vein or hepatic vein or in the depth and direction of the resection line) between our simulation and the actual surgery. Preoperative virtual hepatectomy using Liversim was able to predict the appearance of the vessels on the cut surface of the liver during the resection process. Virtual hepatectomies conducted simultaneously with surgery in the operation room were able to visualize the appearance of the vessels just before they were approached during the actual surgical procedure. A Liversim software operator was able to serve as a surgical navigator by reporting the appearance of the upcoming vessels on the resection line to the surgical staff. We were able to display the Liversim images on a large display in the operating room to allow surgical navigation. Accordingly, it was possible to share the anatomical images with the surgical staff during the actual hepatectomy.
Case 1Case 1 (Table 1) shows a lateral sectionectomy (resection of segments 2 and 3) (Figure 4A). At first, we based our choice of resection on clinical information, such as the tumor size, tumor location, liver function, and surgical margin. After determining which surgical procedure to use, we set and pulled certain points from both sides of the established incision line and then cut onto the liver parenchyma. Then, the segment 3 portal vein (P3) appeared, and we cut the branch. Because we were able to change the transparency of the liver model, we could confirm the characteristics of the exposed branch by observing it from various points of view. With the next cut, the segment 2 portal vein (P2) appeared. We were able to identify these entities in the live patient’s actual liver in the operation room because they were similar to the Liversim images. Figure 4A shows the actual liver surface and the virtual liver surface. We were able to identify the segment 3 glissonean pedicle (G3) and the segment 2 glissonean pedicle (G2)
Case 2 Case 2 (Table 1) shows an extended left hepatectomy. On the Liversim software, we first cut the established incision line and then were able to recognize the small hepatic venous branches that drain segment 5 (V5). As we proceeded with the cut, the large hepatic venous branches that drain segment 8 (V8) appeared. Figure 4B shows the actual cut liver surface and the virtual cut liver surface on Liversim. A good resemblance
9987 September 14, 2015|Volume 21|Issue 34|WJG|www.wjgnet.com
Table 2 Characteristics of the patients n (%)
Characteristics VINCENT (n = 99) Liversim (n = 11)
Age (yr) Median (range) 65 (21-84) 60 (50-77)Gender Male 78 (79) 9 (82) Female 21 (21) 2 (18)Diagnosis HCC 61 (62) 5 (45) ICC 14 (14) 2 (18) Metastasis 24 (24) 4 (36)Procedure Hemihepatectomy or larger 24 (24) 6 (55) Sectionectomy 27 (27) 4 (36) Segmentectomy or smaller 48 (48) 1 (9)
HCC: Hepatocellular carcinoma; ICC: Intrahepatic cholangiocarcinoma.
Oshiro Y et al . Virtual hepatectomy combined with real-time deformation
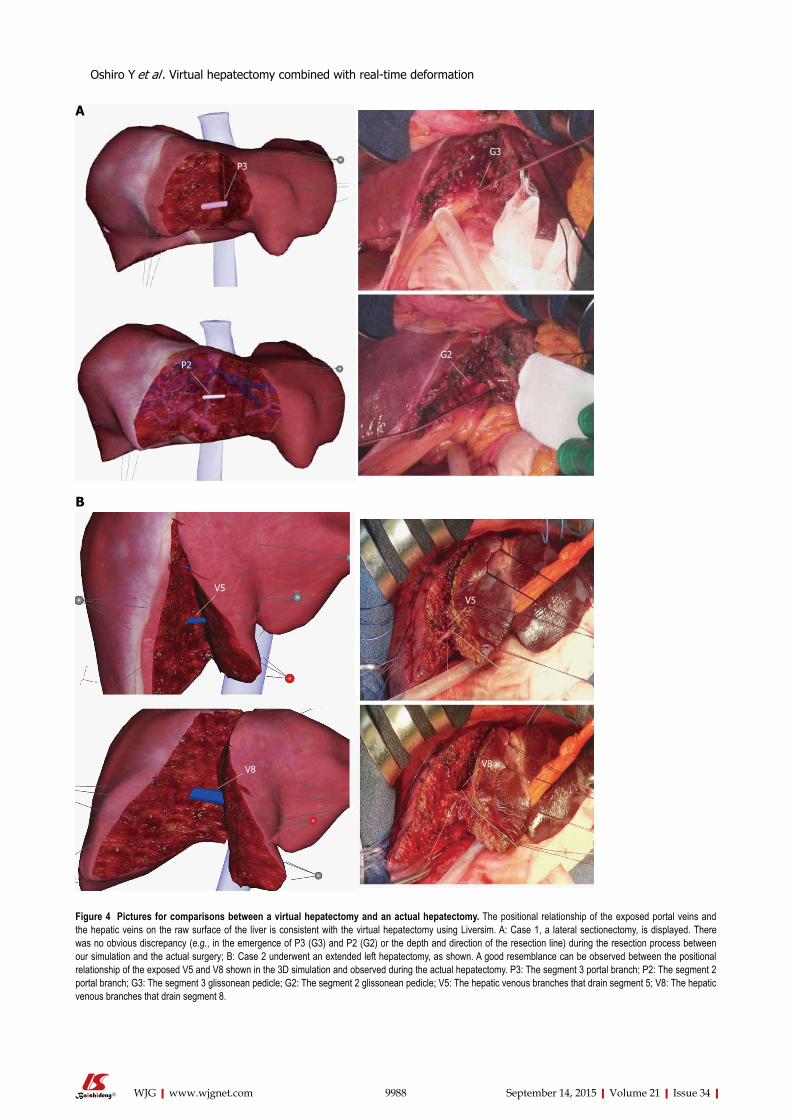
9988 September 14, 2015|Volume 21|Issue 34|WJG|www.wjgnet.com
B
A
P3
P2
G3
G2
V5V5
V8 V8
Figure 4 Pictures for comparisons between a virtual hepatectomy and an actual hepatectomy. The positional relationship of the exposed portal veins and the hepatic veins on the raw surface of the liver is consistent with the virtual hepatectomy using Liversim. A: Case 1, a lateral sectionectomy, is displayed. There was no obvious discrepancy (e.g., in the emergence of P3 (G3) and P2 (G2) or the depth and direction of the resection line) during the resection process between our simulation and the actual surgery; B: Case 2 underwent an extended left hepatectomy, as shown. A good resemblance can be observed between the positional relationship of the exposed V5 and V8 shown in the 3D simulation and observed during the actual hepatectomy. P3: The segment 3 portal branch; P2: The segment 2 portal branch; G3: The segment 3 glissonean pedicle; G2: The segment 2 glissonean pedicle; V5: The hepatic venous branches that drain segment 5; V8: The hepatic venous branches that drain segment 8.
Oshiro Y et al . Virtual hepatectomy combined with real-time deformation
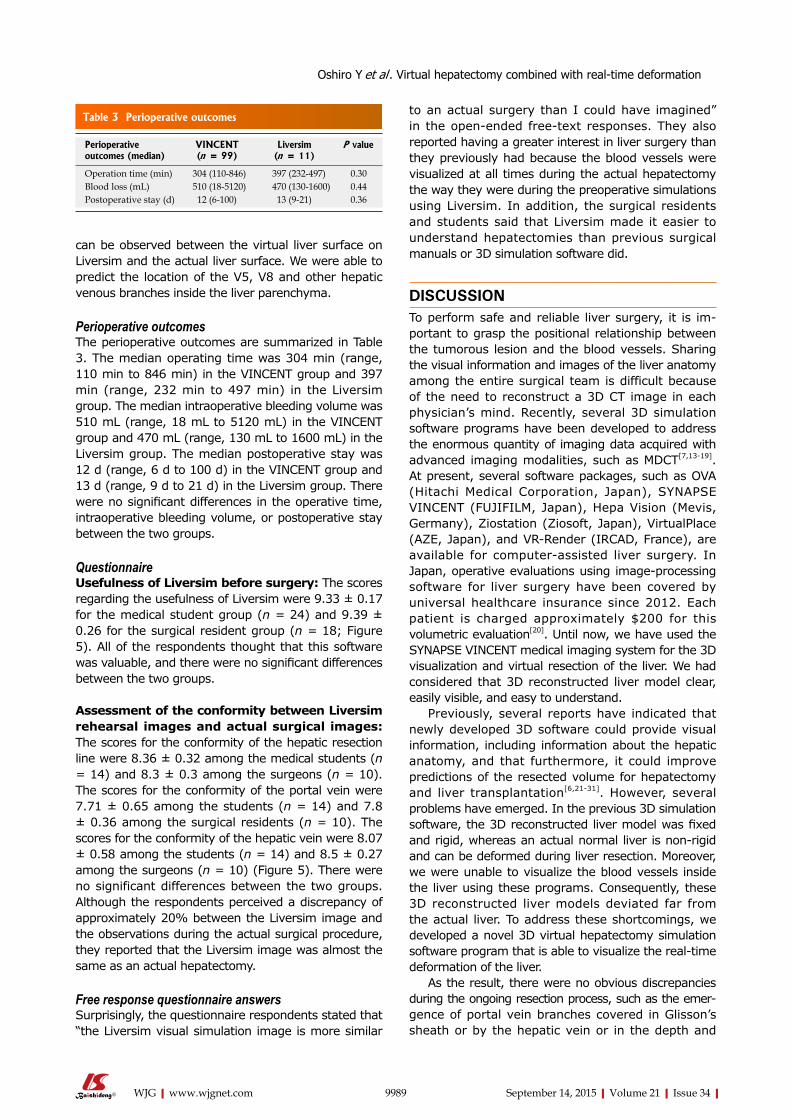
can be observed between the virtual liver surface on Liversim and the actual liver surface. We were able to predict the location of the V5, V8 and other hepatic venous branches inside the liver parenchyma.
Perioperative outcomesThe perioperative outcomes are summarized in Table 3. The median operating time was 304 min (range, 110 min to 846 min) in the VINCENT group and 397 min (range, 232 min to 497 min) in the Liversim group. The median intraoperative bleeding volume was 510 mL (range, 18 mL to 5120 mL) in the VINCENT group and 470 mL (range, 130 mL to 1600 mL) in the Liversim group. The median postoperative stay was 12 d (range, 6 d to 100 d) in the VINCENT group and 13 d (range, 9 d to 21 d) in the Liversim group. There were no significant differences in the operative time, intraoperative bleeding volume, or postoperative stay between the two groups.
QuestionnaireUsefulness of liversim before surgery: The scores regarding the usefulness of Liversim were 9.33 ± 0.17 for the medical student group (n = 24) and 9.39 ± 0.26 for the surgical resident group (n = 18; Figure 5). All of the respondents thought that this software was valuable, and there were no significant differences between the two groups.
Assessment of the conformity between liversim rehearsal images and actual surgical images: The scores for the conformity of the hepatic resection line were 8.36 ± 0.32 among the medical students (n = 14) and 8.3 ± 0.3 among the surgeons (n = 10). The scores for the conformity of the portal vein were 7.71 ± 0.65 among the students (n = 14) and 7.8 ± 0.36 among the surgical residents (n = 10). The scores for the conformity of the hepatic vein were 8.07 ± 0.58 among the students (n = 14) and 8.5 ± 0.27 among the surgeons (n = 10) (Figure 5). There were no significant differences between the two groups. Although the respondents perceived a discrepancy of approximately 20% between the Liversim image and the observations during the actual surgical procedure, they reported that the Liversim image was almost the same as an actual hepatectomy.
Free response questionnaire answersSurprisingly, the questionnaire respondents stated that “the Liversim visual simulation image is more similar
to an actual surgery than I could have imagined” in the open-ended free-text responses. They also reported having a greater interest in liver surgery than they previously had because the blood vessels were visualized at all times during the actual hepatectomy the way they were during the preoperative simulations using Liversim. In addition, the surgical residents and students said that Liversim made it easier to understand hepatectomies than previous surgical manuals or 3D simulation software did.
DISCUSSIONTo perform safe and reliable liver surgery, it is im-portant to grasp the positional relationship between the tumorous lesion and the blood vessels. Sharing the visual information and images of the liver anatomy among the entire surgical team is difficult because of the need to reconstruct a 3D CT image in each physician’s mind. Recently, several 3D simulation software programs have been developed to address the enormous quantity of imaging data acquired with advanced imaging modalities, such as MDCT[7,13-19]. At present, several software packages, such as OVA (Hitachi Medical Corporation, Japan), SYNAPSE VINCENT (FUJIFILM, Japan), Hepa Vision (Mevis, Germany), Ziostation (Ziosoft, Japan), VirtualPlace (AZE, Japan), and VR-Render (IRCAD, France), are available for computer-assisted liver surgery. In Japan, operative evaluations using image-processing software for liver surgery have been covered by universal healthcare insurance since 2012. Each patient is charged approximately $200 for this volumetric evaluation[20]. Until now, we have used the SYNAPSE VINCENT medical imaging system for the 3D visualization and virtual resection of the liver. We had considered that 3D reconstructed liver model clear, easily visible, and easy to understand.
Previously, several reports have indicated that newly developed 3D software could provide visual information, including information about the hepatic anatomy, and that furthermore, it could improve predictions of the resected volume for hepatectomy and liver transplantation[6,21-31]. However, several problems have emerged. In the previous 3D simulation software, the 3D reconstructed liver model was fixed and rigid, whereas an actual normal liver is non-rigid and can be deformed during liver resection. Moreover, we were unable to visualize the blood vessels inside the liver using these programs. Consequently, these 3D reconstructed liver models deviated far from the actual liver. To address these shortcomings, we developed a novel 3D virtual hepatectomy simulation software program that is able to visualize the real-time deformation of the liver.
As the result, there were no obvious discrepancies during the ongoing resection process, such as the emer-gence of portal vein branches covered in Glisson’s sheath or by the hepatic vein or in the depth and
9989 September 14, 2015|Volume 21|Issue 34|WJG|www.wjgnet.com
Table 3 Perioperative outcomes
Perioperative outcomes (median)
VINCENT (n = 99)
Liversim (n = 11)
P value
Operation time (min) 304 (110-846) 397 (232-497) 0.30Blood loss (mL) 510 (18-5120) 470 (130-1600) 0.44Postoperative stay (d) 12 (6-100) 13 (9-21) 0.36
Oshiro Y et al . Virtual hepatectomy combined with real-time deformation
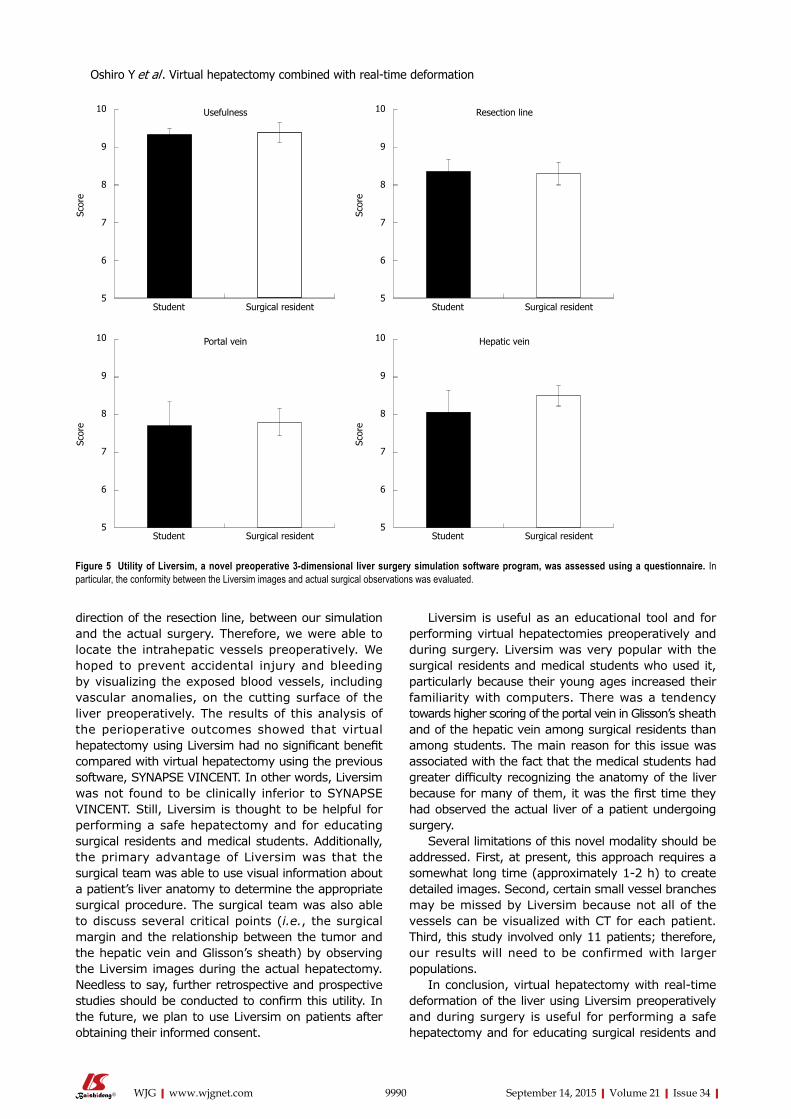
direction of the resection line, between our simulation and the actual surgery. Therefore, we were able to locate the intrahepatic vessels preoperatively. We hoped to prevent accidental injury and bleeding by visualizing the exposed blood vessels, including vascular anomalies, on the cutting surface of the liver preoperatively. The results of this analysis of the perioperative outcomes showed that virtual hepatectomy using Liversim had no significant benefit compared with virtual hepatectomy using the previous software, SYNAPSE VINCENT. In other words, Liversim was not found to be clinically inferior to SYNAPSE VINCENT. Still, Liversim is thought to be helpful for performing a safe hepatectomy and for educating surgical residents and medical students. Additionally, the primary advantage of Liversim was that the surgical team was able to use visual information about a patient’s liver anatomy to determine the appropriate surgical procedure. The surgical team was also able to discuss several critical points (i.e., the surgical margin and the relationship between the tumor and the hepatic vein and Glisson’s sheath) by observing the Liversim images during the actual hepatectomy. Needless to say, further retrospective and prospective studies should be conducted to confirm this utility. In the future, we plan to use Liversim on patients after obtaining their informed consent.
Liversim is useful as an educational tool and for performing virtual hepatectomies preoperatively and during surgery. Liversim was very popular with the surgical residents and medical students who used it, particularly because their young ages increased their familiarity with computers. There was a tendency towards higher scoring of the portal vein in Glisson’s sheath and of the hepatic vein among surgical residents than among students. The main reason for this issue was associated with the fact that the medical students had greater difficulty recognizing the anatomy of the liver because for many of them, it was the first time they had observed the actual liver of a patient undergoing surgery.
Several limitations of this novel modality should be addressed. First, at present, this approach requires a somewhat long time (approximately 1-2 h) to create detailed images. Second, certain small vessel branches may be missed by Liversim because not all of the vessels can be visualized with CT for each patient. Third, this study involved only 11 patients; therefore, our results will need to be confirmed with larger populations.
In conclusion, virtual hepatectomy with real-time deformation of the liver using Liversim preoperatively and during surgery is useful for performing a safe hepatectomy and for educating surgical residents and
9990 September 14, 2015|Volume 21|Issue 34|WJG|www.wjgnet.com
10
9
8
7
6
5
Scor
e
Usefulness
Student Surgical resident
10
9
8
7
6
5
Scor
e
Portal vein
Student Surgical resident
10
9
8
7
6
5
Scor
e
Resection line
Student Surgical resident
10
9
8
7
6
5
Scor
e
Hepatic vein
Student Surgical resident
Figure 5 utility of Liversim, a novel preoperative 3-dimensional liver surgery simulation software program, was assessed using a questionnaire. In particular, the conformity between the Liversim images and actual surgical observations was evaluated.
Oshiro Y et al . Virtual hepatectomy combined with real-time deformation
medical students.
ACKNOWLEDGMENTSThe authors thank Mr. Itoh M and Karasawa T of LEXI Co., Ltd., for their kind support.
COMMENTSBackgroundThe shape of the liver changes during liver resection due to the posture change and the surgical procedure. However, in conventional software, 3-dimensional (3D) liver models are fixed and rigid. In addition, the authors were not able to observe every moment of the cutting of the liver and intrahepatic vessels.
Research frontiersNew innovative softwares in virtual system will be created step by step in the future. No surgical simulation software to represent the real-time motion and deformation of the liver.
Innovations and breakthroughsThe main purpose of the novel software is to observe the location and orientation of the intrahepatic vessels moment by moment during surgery. To achieve this goal, the software provides 4 basic functions: viewing 3D models from arbitrary directions and distances, changing the colors and opacities of the models, deforming the models based on user interaction, and incising the liver parenchyma and intrahepatic vessels based on user operations.
ApplicationsLiversim is useful for educating surgical residents and medical students about performing a safe hepatectomy. Additionally, the primary advantage of Liversim is that the surgical team is able to use visual information that is identical to the patient’s liver anatomy to determine the appropriate surgical procedure.
TerminologyThe finite element method (FEM) calculation is performed by the Sofa framework, which is the foundation of the Liversim software. The liver, inferior vena cava, tumor and gallbladder models are converted into tetrahedral meshed models and are considered in the calculation of physical simulations via the FEM.
Peer-reviewLiversim system provides specialized functions for liver surgery planning. This function enables us to represent the real time motion and display an estimated vascular territory of segments.
REFERENCES1 Sasaki R, Kondo T, Oda T, Murata S, Wakabayashi G, Ohkohchi
N. Impact of three-dimensional analysis of multidetector row computed tomography cholangioportography in operative planning for hilar cholangiocarcinoma. Am J Surg 2011; 202: 441-448 [PMID: 21861978 DOI: 10.1016/j.amjsurg.2010.06.034]
2 Oshiro Y, Sasaki R, Nasu K, Ohkohchi N. A novel preoperative fusion analysis using three-dimensional MDCT combined with three-dimensional MRI for patients with hilar cholangiocarcinoma. Clin Imaging 2013; 37: 772-774 [PMID: 23583285 DOI: 10.1016/j.clinimag.2013.02.002]
3 Takahashi K, Sasaki R, Kondo T, Oda T, Murata S, Ohkohchi N. Preoperative 3D volumetric analysis for liver congestion applied in a patient with hilar cholangiocarcinoma. Langenbecks Arch Surg 2010; 395: 761-765 [PMID: 19924432 DOI: 10.1007/s00423-009-0572-y]
4 Saito S, Yamanaka J, Miura K, Nakao N, Nagao T, Sugimoto T, Hirano T, Kuroda N, Iimuro Y, Fujimoto J. A novel 3D
hepatectomy simulation based on liver circulation: application to liver resection and transplantation. Hepatology 2005; 41: 1297-1304 [PMID: 15846773 DOI: 10.1002/hep.20684]
5 Endo I, Shimada H, Sugita M, Fujii Y, Morioka D, Takeda K, Sugae S, Tanaka K, Togo S, Bourquain H, Peitgen HO. Role of three-dimensional imaging in operative planning for hilar cholangiocarcinoma. Surgery 2007; 142: 666-675 [PMID: 17981186 DOI: 10.1016/j.surg.2007.05.018]
6 Ariizumi S, Takahashi Y, Kotera Y, Omori A, Yoneda G, Mu H, Katagiri S, Egawa H, Yamamoto M. Novel virtual hepatectomy is useful for evaluation of the portal territory for anatomical sectionectomy, segmentectomy, and hemihepatectomy. J Hepatobiliary Pancreat Sci 2013; 20: 396-402 [PMID: 23179558 DOI: 10.1007/s00534-012-0573-z]
7 Takamoto T, Hashimoto T, Ogata S, Inoue K, Maruyama Y, Miyazaki A, Makuuchi M. Planning of anatomical liver segmentectomy and subsegmentectomy with 3-dimensional simulation software. Am J Surg 2013; 206: 530-538 [PMID: 23809675 DOI: 10.1016/j.amjsurg.2013.01.041]
8 Fujimoto J, Yamanaka J. Liver resection and transplantation using a novel 3D hepatectomy simulation system. Adv Med Sci 2006; 51: 7-14 [PMID: 17357270]
9 Yamanaka J, Saito S, Fujimoto J. Impact of preoperative planning using virtual segmental volumetry on liver resection for hepatocellular carcinoma. World J Surg 2007; 31: 1249-1255 [PMID: 17440774]
10 Endo K, Sata N, Ishiguro Y, Miki A, Sasanuma H, Sakuma Y, Shimizu A, Hyodo M, Alan L, Yasuda Y. A patient-specific surgical simulator using preoperative imaging data: an interactive simulator using a three-dimensional tactile mouse. J Comput Surg 2014; 3: 10 [DOI: 10.1186/s40244-014-0010-5]
11 Allard J, Cotin S, Faure F, Bensoussan PJ, Poyer F, Duriez C, Delingette H, Grisoni L. SOFA--an open source framework for medical simulation. Stud Health Technol Inform 2007; 125: 13-18 [PMID: 17377224]
12 Mor A. Progressive Cutting with Minimal New Element Creation of Soft Tissue Models for Interactive Surgical Simulation. Doctoral dissertation, Tech. Report CMU-RI-TR-01-29. Pittsburgh: Robotics Institute, Carnegie Mellon University, 2001
13 Lamadé W, Glombitza G, Fischer L, Chiu P, Cárdenas CE, Thorn M, Meinzer HP, Grenacher L, Bauer H, Lehnert T, Herfarth C. The impact of 3-dimensional reconstructions on operation planning in liver surgery. Arch Surg 2000; 135: 1256-1261 [PMID: 11074877 DOI: 10.1001/archsurg.135.11.1256]
14 Selle D, Preim B, Schenk A, Peitgen HO. Analysis of vasculature for liver surgical planning. IEEE Trans Med Imaging 2002; 21: 1344-1357 [PMID: 12575871 DOI: 10.1109/TMI.2002.801166]
15 Hiroshige S, Shimada M, Harada N, Shiotani S, Ninomiya M, Minagawa R, Soejima Y, Suehiro T, Honda H, Hashizume M, Sugimachi K. Accurate preoperative estimation of liver-graft volumetry using three-dimensional computed tomography. Transplantation 2003; 75: 1561-1564 [PMID: 12792515 DOI: 10.1097/01.TP.0000053755.08825.12]
16 Miyamoto R, Oshiro Y, Hashimoto S, Kohno K, Fukunaga K, Oda T, Ohkohchi N. Three-dimensional imaging identified the accessory bile duct in a patient with cholangiocarcinoma. World J Gastroenterol 2014; 20: 11451-11455 [PMID: 25170235 DOI: 10.3748/wjg.v20.i32.1145]
17 Enkhbold Ch, Shimada M, Utsunomiya T, Ishibashi H, Yamada S, Kanamoto M, Arakawa Y, Ikemoto Z, Morine E, Imura S. One-stop shop for 3-dimensional anatomy of hepatic vasculature and bile duct with special reference to biliary image reconstruction. Hepatogastroenterology 2013; 60: 1861-1864 [PMID: 24088317]
18 Xiang C, Liu Z, Dong J, Sano K, Makuuchi M. Precise anatomical resection of the ventral part of Segment VIII. Int J Surg Case Rep 2014; 5: 924-926 [PMID: 25460437 DOI: 10.1016/j.ijscr.2014.10.041]
19 Shindoh J, Mise Y, Satou S, Sugawara Y, Kokudo N. The intersegmental plane of the liver is not always flat--tricks for anatomical liver resection. Ann Surg 2010; 251: 917-922 [PMID:
9991 September 14, 2015|Volume 21|Issue 34|WJG|www.wjgnet.com
COMMENTS
Oshiro Y et al . Virtual hepatectomy combined with real-time deformation
20395853 DOI: 10.1097/SLA.0b013e3181d773ae]20 Mise Y, Tani K, Aoki T, Sakamoto Y, Hasegawa K, Sugawara Y,
Kokudo N. Virtual liver resection: computer-assisted operation planning using a three-dimensional liver representation. J Hepatobiliary Pancreat Sci 2013; 20: 157-164 [PMID: 23135735 DOI: 10.1007/s00534-012-0574-y]
21 Rau HG, Schauer R, Helmberger T, Holzknecht N, von Rückmann B, Meyer L, Buttler E, Kessler M, Zahlmann G, Schuhmann D, Schildberg FW. Impact of virtual reality imaging on hepatic liver tumor resection: calculation of risk. Langenbecks Arch Surg 2000; 385: 162-170 [PMID: 10857486 DOI: 10.1007/s004230050260]
22 Wigmore SJ, Redhead DN, Yan XJ, Casey J, Madhavan K, Dejong CH, Currie EJ, Garden OJ. Virtual hepatic resection using three-dimensional reconstruction of helical computed tomography angioportograms. Ann Surg 2001; 233: 221-226 [PMID: 11176128 DOI: 10.1097/00000658-200102000-00011]
23 Lang H, Radtke A, Hindennach M, Schroeder T, Frühauf NR, Malagó M, Bourquain H, Peitgen HO, Oldhafer KJ, Broelsch CE. Impact of virtual tumor resection and computer-assisted risk analysis on operation planning and intraoperative strategy in major hepatic resection. Arch Surg 2005; 140: 629-638; discussion 638 [PMID: 16027326 DOI: 10.1001/archsurg.140.7.629]
24 Yamanaka J, Saito S, Iimuro Y, Hirano T, Okada T, Kuroda N, Sugimoto T, Fujimoto J. The impact of 3-D virtual hepatectomy simulation in living-donor liver transplantation. J Hepatobiliary Pancreat Surg 2006; 13: 363-369 [PMID: 17013708 DOI: 10.1007/s00534-005-1075-z]
25 Radtke A, Sotiropoulos GC, Molmenti EP, Schroeder T, Peitgen HO, Frilling A, Broering DC, Broelsch CE, Malago’ M. Computer-assisted surgery planning for complex liver resections: when is it helpful? A single-center experience over an 8-year period.
Ann Surg 2010; 252: 876-883 [PMID: 21037445 DOI: 10.1097/SLA.0b013e3181fdd012]
26 Karlo C, Reiner CS, Stolzmann P, Breitenstein S, Marincek B, Weishaupt D, Frauenfelder T. CT- and MRI-based volumetry of resected liver specimen: comparison to intraoperative volume and weight measurements and calculation of conversion factors. Eur J Radiol 2010; 75: e107-e111 [PMID: 19782490 DOI: 10.1016/j.ejrad.2009.09.005]
27 van der Vorst JR, van Dam RM, van Stiphout RS, van den Broek MA, Hollander IH, Kessels AG, Dejong CH. Virtual liver resection and volumetric analysis of the future liver remnant using open source image processing software. World J Surg 2010; 34: 2426-2433 [PMID: 20652701 DOI: 10.1007/s00268-010-0663-5]
28 Dello SA, Stoot JH, van Stiphout RS, Bloemen JG, Wigmore SJ, Dejong CH, van Dam RM. Prospective volumetric assessment of the liver on a personal computer by nonradiologists prior to partial hepatectomy. World J Surg 2011; 35: 386-392 [PMID: 21136056 DOI: 10.1007/s00268-010-0877-6]
29 Hashimoto D, Dohi T, Tsuzuki M, Horiuchi T, Ohta Y, Chinzei K, Suzuki M, Idezuki Y. Development of a computer-aided surgery system: three-dimensional graphic reconstruction for treatment of liver cancer. Surgery 1991; 109: 589-596 [PMID: 1850556]
30 van Leeuwen MS, Noordzij J, Fernandez MA, Hennipman A, Feldberg MA, Dillon EH. Portal venous and segmental anatomy of the right hemiliver: observations based on three-dimensional spiral CT renderings. AJR Am J Roentgenol 1994; 163: 1395-1404 [PMID: 7992736]
31 Marescaux J, Clément JM, Tassetti V, Koehl C, Cotin S, Russier Y, Mutter D, Delingette H, Ayache N. Virtual reality applied to hepatic surgery simulation: the next revolution. Ann Surg 1998; 228: 627-634 [PMID: 9833800]
P- Reviewer: Boscá L, Hibi T, Wang CC, Wang DS S- Editor: Ma YJ L- Editor: A E- Editor: Zhang DN
9992 September 14, 2015|Volume 21|Issue 34|WJG|www.wjgnet.com
Oshiro Y et al . Virtual hepatectomy combined with real-time deformation
An-Liang Chen, Ai-Lian Liu, Sheng Wang, Jing-Hong Liu, Ye Ju, Mei-Yu Sun, Yi-Jun Liu
An-Liang Chen, Ai-Lian Liu, Sheng Wang, Jing-Hong Liu, Ye Ju, Mei-Yu Sun, Yi-Jun Liu, Department of Radiology, The First Affiliated Hospital of Dalian Medical University, Dalian 116011, Liaoning Province, China
Author contributions: Chen AL, Liu AL, and Wang S designed the research; Chen AL, Wang S, Ju Y, and Liu YJ performed the research; Liu JH and Sun MY analyzed the data; Chen AL, Liu AL, and Wang S wrote the paper; all authors have read and approved the final version to be published.
Institutional review board statement: This retrospective study was approved by the Ethics Committee in The First Affiliated Hospital of Dalian Medical University.
Conflict-of-interest statement: There is no conflict of interest in this study.
Data sharing statement: Technical appendix, statistical code, and dataset available from the corresponding author at [email protected]. No additional data are available.
Open-Access: This article is an open-access article which was selected by an in-house editor and fully peer-reviewed by external reviewers. It is distributed in accordance with the Creative Commons Attribution Non Commercial (CC BY-NC 4.0) license, which permits others to distribute, remix, adapt, build upon this work non-commercially, and license their derivative works on different terms, provided the original work is properly cited and the use is non-commercial. See: http://creativecommons.org/licenses/by-nc/4.0/
Correspondence to: Ai-Lian Liu, PhD, Department of Radiology, The First Affiliated Hospital of Dalian Medical University, No. 222 Zhongshan Road, Dalian 116011, Liaoning Province, China. [email protected]: +86-411-83635963Fax: +86-411-83622844
Received: March 25, 2015Peer-review started: March 27, 2015First decision: May 18, 2015Revised: June 2, 2015Accepted: June 26, 2015
Article in press: June 26, 2015Published online: September 14, 2015
AbstractAIM: To evaluate the detectability of gallbladder stones by dual-energy spectral computed tomography (CT) imaging.
METHODS: Totally 217 patients with surgically confirmed gallbladder stones were retrospectively analyzed who underwent single-source dual-energy CT scanning from August 2011 to December 2013. Polychromatic images were acquired. And post-processing software was used to reconstruct monochromatic (40 keV and 140 keV) images, and calcium-lipid pair-wise base substance was selected to acquire calcium base images and lipid base images. The above 5 groups of images were evaluated by two radiologists separately with 10-year experience in CT image reading. In the 5 groups of images, the cases in the positive group and negative group were counted and then the detection rate was calculated. The inter-observer agreement on the scoring results was analyzed by Kappa test, and the scoring results were analyzed by Wilcoxon test, with P < 0.05 indicating that the difference was statistically significant. The stone detection results of the 5 groups of images were analyzed by χ 2 test.
RESULTS: There was good inter-observer agreement (k = 0.772). In 217 patients with gallbladder stones, there was a statistically significant difference in stone visualization between spectral images (40 keV, 140 keV, calcium base and lipid base images) and polychromatic images (P < 0.05). 40 keV monochromatic images were better than 140 keV monochromatic images (4.90 ± 0.35 vs 4.53 ± 1.15, P < 0.05), and calcium base images were superior to lipid base images (4.91 ± 0.43 vs 4.77 ± 0.63, P < 0.05), but there was no statistically
ORIGINAL ARTICLE
Submit a Manuscript: http://www.wjgnet.com/esps/Help Desk: http://www.wjgnet.com/esps/helpdesk.aspxDOI: 10.3748/wjg.v21.i34.9993
World J Gastroenterol 2015 September 14; 21(34): 9993-9998 ISSN 1007-9327 (print) ISSN 2219-2840 (online)
© 2015 Baishideng Publishing Group Inc. All rights reserved.
9993 September 14, 2015|Volume 21|Issue 34|WJG|www.wjgnet.com
Retrospective Study
Detection of gallbladder stones by dual-energy spectral computed tomography imaging
stones are variable in shape, size and number. Solitary gallbladder stones or multiple gallbladder stones may occur. Gallbladder stones may have different sizes and a non-uniform density. Solitary stones are generally big; partial stones have a low density in the center and a high density in the peripheral area, demonstrating concentric circle changes; sandy stones are often deposited at the bottom of gallbladder, have a high density, and form the fluid level with bile at the upper part, and their diagnosis can be made by stone shift in the scanning with a changeable position. In a part of patients, gallbladder is enlarged with a long diameter > 5 cm, the gallbladder wall is thickened to be > 0.3 cm, and there is a low-density ring surrounding the gallbladder, which is the manifestation of secondary inflammatory edema[2]. However, it is difficult to diagnose iso-density gallbladder stones, because gallbladder stones and bile are difficultly distinguished by traditional CT due to a same density, which is troublesome for clinical treatment[3]. The development of spectral imaging recoups the defects of traditional CT in the diagnosis of iso-density stones. In spectral imaging, base substance images and low keV images are both promising to improve the detection rate of gallbladder stones; they provide a new approach for the differential diagnosis of gallbladder stones, and the reliable information for the clinical treatment of gallbladder stones.
MATERIALS AND METHODSPatient characteristicsThis retrospective study was approved by the Ethics Committee in our hospital. Totally 217 patients with surgically confirmed gallbladder stones were retro-spectively analyzed who underwent HDCT scanning for suspected gallbladder stones according to clinical symptoms and ultrasonic reports at our hospital from August 2011 to December 2013. There were 97 males and 120 females, with a mean age of 62 ± 15 (10-96) years.
Scanning methodsHD CT750 Discovery was used for plain scanning under spectral imaging mode. The patients was in ≥ 6 h fasting before scanning. CT plain scanning was performed routinely in a dorsal position. After acquisition of anterior-posterior positioning images, the upper abdomen plain scanning was performed with a range from the top of the liver to the middle poles of bilateral kidneys. The scanning parameters were as follows: instantaneous 40-140 kVp rapid switching; tube current: 550 mA; slice thickness and interval: 5 mm; rotation speed: 0.8 r/s; and pitch: 1.375.
Image post-processing and evaluation The image post-processing and evaluation were both performed with post-processing software on
Chen AL et al . Dual-energy spectral CT imaging for gallbladder stones
9994 September 14, 2015|Volume 21|Issue 34|WJG|www.wjgnet.com
significant difference between 40 keV monochromatic images and calcium base images (4.90 ± 0.35 vs 4.91 ± 0.43, P > 0.05). In 217 gallbladder stone patients, there were 21, 3, 28, 5 and 12 negative stone cases in polychromatic images, 40 keV images, 140 keV images, calcium base images and lipid base images, respectively, and the differences among the five groups were statistically significant (P < 0.05).
CONCLUSION: Monochromatic images and base substance images have a good clinical prospect in the iso-density stone detection.
Key words: Gallbladder stone; Computed tomography; Spectral imaging
© The Author(s) 2015. Published by Baishideng Publishing Group Inc. All rights reserved.
Core tip: In traditional computed tomography (CT), gallbladder stones are indicated directly by high-density or low-density stones and indirectly by dilation of the intrahepatic biliary duct, left and right hepatic ducts, biliary duct and gallbladder. However, it is difficult to diagnose iso-density gallbladder stones, because gallbladder stones and bile are difficultly distinguished by tradit ional CT due to a same density. The development of spectral imaging recoups the defects of traditional CT in the diagnosis of iso-density stones. In spectral imaging, base substance images and low keV images are both promising to improve the detection rate of gallbladder stones; they provide a new approach for the differential diagnosis of gallbladder stones, and the reliable information for the clinical treatment of gallbladder stones.
Chen AL, Liu AL, Wang S, Liu JH, Ju Y, Sun MY, Liu YJ. Detection of gallbladder stones by dual-energy spectral computed tomography imaging. World J Gastroenterol 2015; 21(34): 9993-9998 Available from: URL: http://www.wjgnet.com/1007-9327/full/v21/i34/9993.htm DOI: http://dx.doi.org/10.3748/wjg.v21.i34.9993
INTRODUCTIONGallbladder stone disease is a common disorder and often accompanied by biliary stenosis or variation, and it seriously threatens the public health and quality of life. With the improvement of people’s living level, the morbidity of gallbladder stones trends to increase continuously[1]. In traditional computed tomography (CT), gallbladder stones are indicated directly by high-density or low-density stones and indirectly by dilation of the intrahepatic biliary duct, left and right hepatic ducts, biliary duct and gallbladder. Based on density, gallbladder stones are classified into: (1) high-density stones; (2) iso-density stones; (3) low-density stones; and (4) mixed-density stones[2]. Gallbladder
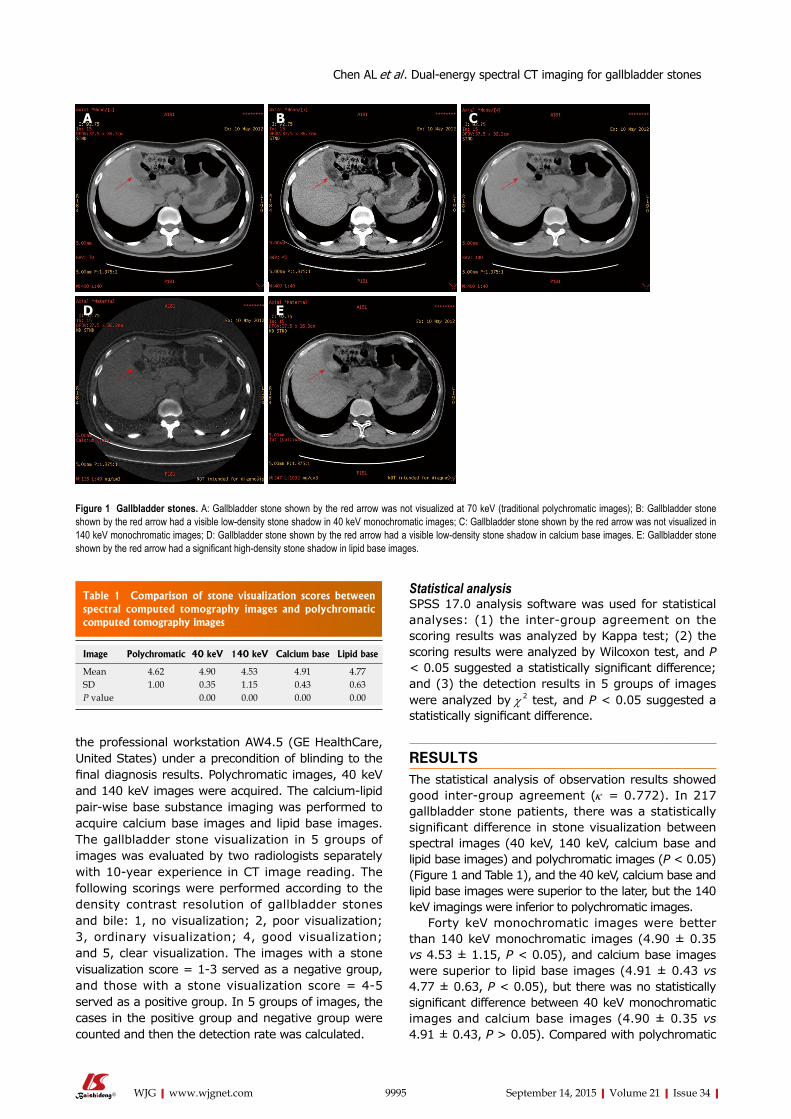
the professional workstation AW4.5 (GE HealthCare, United States) under a precondition of blinding to the final diagnosis results. Polychromatic images, 40 keV and 140 keV images were acquired. The calcium-lipid pair-wise base substance imaging was performed to acquire calcium base images and lipid base images. The gallbladder stone visualization in 5 groups of images was evaluated by two radiologists separately with 10-year experience in CT image reading. The following scorings were performed according to the density contrast resolution of gallbladder stones and bile: 1, no visualization; 2, poor visualization; 3, ordinary visualization; 4, good visualization; and 5, clear visualization. The images with a stone visualization score = 1-3 served as a negative group, and those with a stone visualization score = 4-5 served as a positive group. In 5 groups of images, the cases in the positive group and negative group were counted and then the detection rate was calculated.
Statistical analysisSPSS 17.0 analysis software was used for statistical analyses: (1) the inter-group agreement on the scoring results was analyzed by Kappa test; (2) the scoring results were analyzed by Wilcoxon test, and P < 0.05 suggested a statistically significant difference; and (3) the detection results in 5 groups of images were analyzed by χ 2 test, and P < 0.05 suggested a statistically significant difference.
RESULTSThe statistical analysis of observation results showed good inter-group agreement (k = 0.772). In 217 gallbladder stone patients, there was a statistically significant difference in stone visualization between spectral images (40 keV, 140 keV, calcium base and lipid base images) and polychromatic images (P < 0.05) (Figure 1 and Table 1), and the 40 keV, calcium base and lipid base images were superior to the later, but the 140 keV imagings were inferior to polychromatic images.
Forty keV monochromatic images were better than 140 keV monochromatic images (4.90 ± 0.35 vs 4.53 ± 1.15, P < 0.05), and calcium base images were superior to lipid base images (4.91 ± 0.43 vs 4.77 ± 0.63, P < 0.05), but there was no statistically significant difference between 40 keV monochromatic images and calcium base images (4.90 ± 0.35 vs 4.91 ± 0.43, P > 0.05). Compared with polychromatic
9995 September 14, 2015|Volume 21|Issue 34|WJG|www.wjgnet.com
A B C
D E
Figure 1 Gallbladder stones. A: Gallbladder stone shown by the red arrow was not visualized at 70 keV (traditional polychromatic images); B: Gallbladder stone shown by the red arrow had a visible low-density stone shadow in 40 keV monochromatic images; C: Gallbladder stone shown by the red arrow was not visualized in 140 keV monochromatic images; D: Gallbladder stone shown by the red arrow had a visible low-density stone shadow in calcium base images. E: Gallbladder stone shown by the red arrow had a significant high-density stone shadow in lipid base images.
Table 1 Comparison of stone visualization scores between spectral computed tomography images and polychromatic computed tomography images
Image Polychromatic 40 keV 140 keV Calcium base Lipid base
Mean 4.62 4.90 4.53 4.91 4.77SD 1.00 0.35 1.15 0.43 0.63P value 0.00 0.00 0.00 0.00
Chen AL et al . Dual-energy spectral CT imaging for gallbladder stones
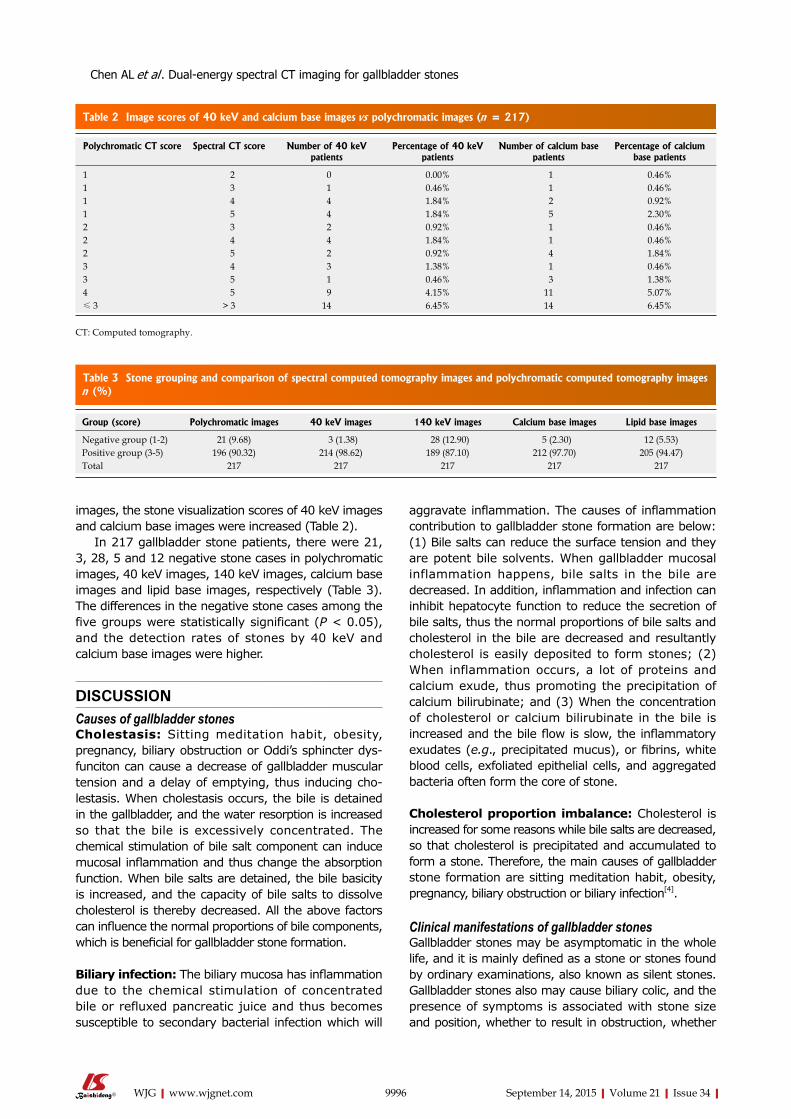
aggravate inflammation. The causes of inflammation contribution to gallbladder stone formation are below: (1) Bile salts can reduce the surface tension and they are potent bile solvents. When gallbladder mucosal inflammation happens, bile salts in the bile are decreased. In addition, inflammation and infection can inhibit hepatocyte function to reduce the secretion of bile salts, thus the normal proportions of bile salts and cholesterol in the bile are decreased and resultantly cholesterol is easily deposited to form stones; (2) When inflammation occurs, a lot of proteins and calcium exude, thus promoting the precipitation of calcium bilirubinate; and (3) When the concentration of cholesterol or calcium bilirubinate in the bile is increased and the bile flow is slow, the inflammatory exudates (e.g., precipitated mucus), or fibrins, white blood cells, exfoliated epithelial cells, and aggregated bacteria often form the core of stone.
Cholesterol proportion imbalance: Cholesterol is increased for some reasons while bile salts are decreased, so that cholesterol is precipitated and accumulated to form a stone. Therefore, the main causes of gallbladder stone formation are sitting meditation habit, obesity, pregnancy, biliary obstruction or biliary infection[4].
Clinical manifestations of gallbladder stonesGallbladder stones may be asymptomatic in the whole life, and it is mainly defined as a stone or stones found by ordinary examinations, also known as silent stones. Gallbladder stones also may cause biliary colic, and the presence of symptoms is associated with stone size and position, whether to result in obstruction, whether
images, the stone visualization scores of 40 keV images and calcium base images were increased (Table 2).
In 217 gallbladder stone patients, there were 21, 3, 28, 5 and 12 negative stone cases in polychromatic images, 40 keV images, 140 keV images, calcium base images and lipid base images, respectively (Table 3). The differences in the negative stone cases among the five groups were statistically significant (P < 0.05), and the detection rates of stones by 40 keV and calcium base images were higher.
DISCUSSIONCauses of gallbladder stonesCholestasis: Sitting meditation habit, obesity, pregnancy, biliary obstruction or Oddi’s sphincter dys-funciton can cause a decrease of gallbladder muscular tension and a delay of emptying, thus inducing cho-lestasis. When cholestasis occurs, the bile is detained in the gallbladder, and the water resorption is increased so that the bile is excessively concentrated. The chemical stimulation of bile salt component can induce mucosal inflammation and thus change the absorption function. When bile salts are detained, the bile basicity is increased, and the capacity of bile salts to dissolve cholesterol is thereby decreased. All the above factors can influence the normal proportions of bile components, which is beneficial for gallbladder stone formation.
Biliary infection: The biliary mucosa has inflammation due to the chemical stimulation of concentrated bile or refluxed pancreatic juice and thus becomes susceptible to secondary bacterial infection which will
9996 September 14, 2015|Volume 21|Issue 34|WJG|www.wjgnet.com
Table 2 Image scores of 40 keV and calcium base images vs polychromatic images (n = 217)
Polychromatic CT score Spectral CT score Number of 40 keV patients
Percentage of 40 keV patients
Number of calcium base patients
Percentage of calcium base patients
1 2 0 0.00% 1 0.46%1 3 1 0.46% 1 0.46%1 4 4 1.84% 2 0.92%1 5 4 1.84% 5 2.30%2 3 2 0.92% 1 0.46%2 4 4 1.84% 1 0.46%2 5 2 0.92% 4 1.84%3 4 3 1.38% 1 0.46%3 5 1 0.46% 3 1.38%4 5 9 4.15% 11 5.07%≤ 3 > 3 14 6.45% 14 6.45%
CT: Computed tomography.
Table 3 Stone grouping and comparison of spectral computed tomography images and polychromatic computed tomography images n (%)
Group (score) Polychromatic images 40 keV images 140 keV images Calcium base images Lipid base images
Negative group (1-2) 21 (9.68) 3 (1.38) 28 (12.90) 5 (2.30) 12 (5.53)Positive group (3-5) 196 (90.32) 214 (98.62) 189 (87.10) 212 (97.70) 205 (94.47)Total 217 217 217 217 217
Chen AL et al . Dual-energy spectral CT imaging for gallbladder stones
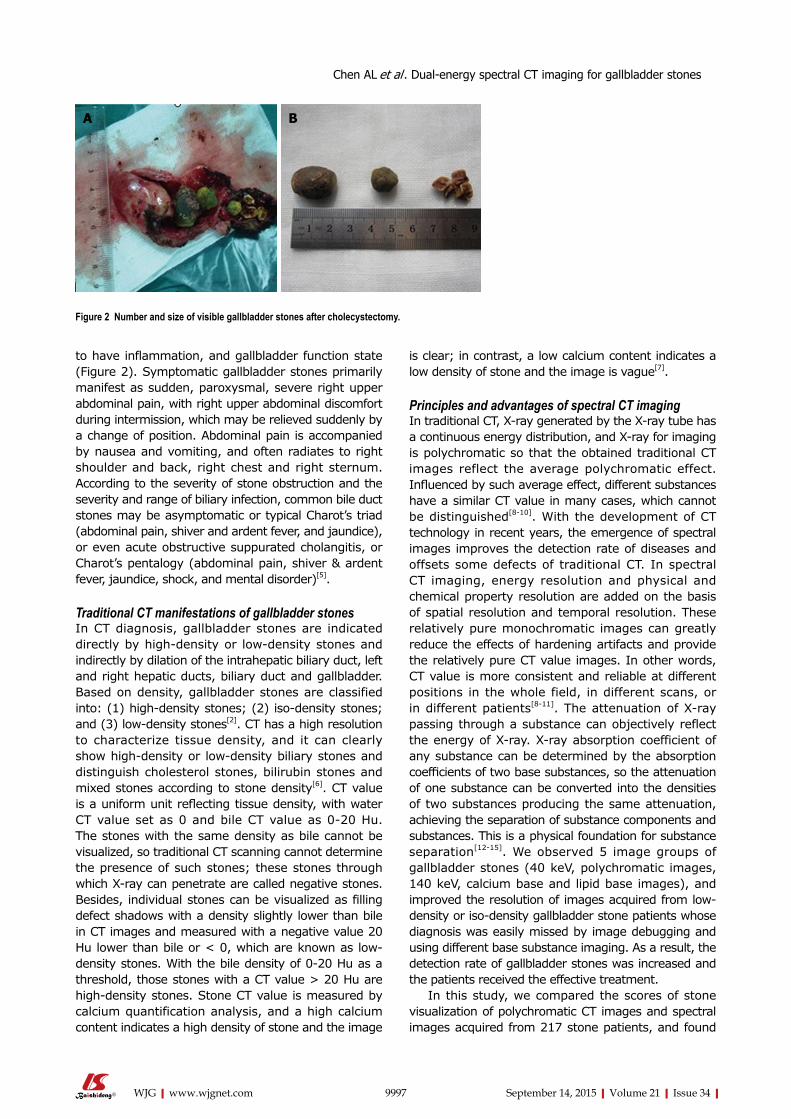
to have inflammation, and gallbladder function state (Figure 2). Symptomatic gallbladder stones primarily manifest as sudden, paroxysmal, severe right upper abdominal pain, with right upper abdominal discomfort during intermission, which may be relieved suddenly by a change of position. Abdominal pain is accompanied by nausea and vomiting, and often radiates to right shoulder and back, right chest and right sternum. According to the severity of stone obstruction and the severity and range of biliary infection, common bile duct stones may be asymptomatic or typical Charot’s triad (abdominal pain, shiver and ardent fever, and jaundice), or even acute obstructive suppurated cholangitis, or Charot’s pentalogy (abdominal pain, shiver & ardent fever, jaundice, shock, and mental disorder)[5].
Traditional CT manifestations of gallbladder stonesIn CT diagnosis, gallbladder stones are indicated directly by high-density or low-density stones and indirectly by dilation of the intrahepatic biliary duct, left and right hepatic ducts, biliary duct and gallbladder. Based on density, gallbladder stones are classified into: (1) high-density stones; (2) iso-density stones; and (3) low-density stones[2]. CT has a high resolution to characterize tissue density, and it can clearly show high-density or low-density biliary stones and distinguish cholesterol stones, bilirubin stones and mixed stones according to stone density[6]. CT value is a uniform unit reflecting tissue density, with water CT value set as 0 and bile CT value as 0-20 Hu. The stones with the same density as bile cannot be visualized, so traditional CT scanning cannot determine the presence of such stones; these stones through which X-ray can penetrate are called negative stones. Besides, individual stones can be visualized as filling defect shadows with a density slightly lower than bile in CT images and measured with a negative value 20 Hu lower than bile or < 0, which are known as low-density stones. With the bile density of 0-20 Hu as a threshold, those stones with a CT value > 20 Hu are high-density stones. Stone CT value is measured by calcium quantification analysis, and a high calcium content indicates a high density of stone and the image
is clear; in contrast, a low calcium content indicates a low density of stone and the image is vague[7].
Principles and advantages of spectral CT imagingIn traditional CT, X-ray generated by the X-ray tube has a continuous energy distribution, and X-ray for imaging is polychromatic so that the obtained traditional CT images reflect the average polychromatic effect. Influenced by such average effect, different substances have a similar CT value in many cases, which cannot be distinguished[8-10]. With the development of CT technology in recent years, the emergence of spectral images improves the detection rate of diseases and offsets some defects of traditional CT. In spectral CT imaging, energy resolution and physical and chemical property resolution are added on the basis of spatial resolution and temporal resolution. These relatively pure monochromatic images can greatly reduce the effects of hardening artifacts and provide the relatively pure CT value images. In other words, CT value is more consistent and reliable at different positions in the whole field, in different scans, or in different patients[8-11]. The attenuation of X-ray passing through a substance can objectively reflect the energy of X-ray. X-ray absorption coefficient of any substance can be determined by the absorption coefficients of two base substances, so the attenuation of one substance can be converted into the densities of two substances producing the same attenuation, achieving the separation of substance components and substances. This is a physical foundation for substance separation[12-15]. We observed 5 image groups of gallbladder stones (40 keV, polychromatic images, 140 keV, calcium base and lipid base images), and improved the resolution of images acquired from low-density or iso-density gallbladder stone patients whose diagnosis was easily missed by image debugging and using different base substance imaging. As a result, the detection rate of gallbladder stones was increased and the patients received the effective treatment.
In this study, we compared the scores of stone visualization of polychromatic CT images and spectral images acquired from 217 stone patients, and found
9997 September 14, 2015|Volume 21|Issue 34|WJG|www.wjgnet.com
Figure 2 Number and size of visible gallbladder stones after cholecystectomy.
A B
Chen AL et al . Dual-energy spectral CT imaging for gallbladder stones
that the scores of spectral images were higher than those of polychromatic CT images. It suggests that spectral imaging can visualize stones better. According to the comparison between the negative group and positive group of stones, the detection rate of negative stones was greater by spectral images than by polychromatic CT. In the present study, high-density stones and low-density stones could be well visualized in polychromatic CT images, so the stones in the positive group were mainly high-density stones and low-density stones, and the stones in the negative group were isodensity stones. Therefore, spectral imaging can improve the detection rate of negative stones (isodensity stones).
In conclusion, monochromatic images and base substance images are advantageous over polychromatic CT images in gallbladder stone visualization, especially negative stones (iso-density stones), which cannot be shown in polychromatic CT images. Therefore, base substance images and optimal low keV images have a good clinical prospect in the detection of iso-density stones. However, iso-density stones have a low incidence and only a few of cases are available, so future studies with a big sample size of iso-density stones are needed.
COMMENTSBackgroundIt is difficult to diagnose iso-density gallbladder stones, because gallbladder stones and bile are difficultly distinguished by traditional computed tomography (CT) due to a same density.
Research frontiersThe development of spectral imaging recoups the defects of traditional CT in the diagnosis of iso-density stones.
Innovations and breakthroughsIn spectral imaging, base substance images and low keV images are both promising to improve the detection rate of gallbladder stones.
ApplicationsAuthors provide a new approach for the differential diagnosis of gallbladder stones, and the reliable information for the clinical treatment of gallbladder stones.
TerminologyGallbladder stone disease is a common disorder and often accompanied by biliary stenosis or variation, and it seriously threatens the public health and quality of life. In traditional CT, gallbladder stones are indicated directly by high-density or low-density stones and indirectly by dilation of the intrahepatic biliary duct, left and right hepatic ducts, biliary duct and gallbladder.
Peer-reviewThis article is interesting. There are 1.3%-13% of false-negatives because X-ray
do not contrast with pure cholesterol gallstones and also with black pigment gallstones and some brown pigment stones. Gallstone disease has afflicted humans since the time of Egyptian kings, and gallstones have been found during autopsies on mummies. Gallstone prevalence in adult population ranges from 10% to 15%. Ultrastructural analysis by scanning electron microscopy is useful in the classification and study of pigment gallstones. Moreover, X-ray diffractometry analysis and infrared spectroscopy of gallstones are of fundamental importance for an accurate stone analysis. An accurate study of gallstones is useful to understand gallstone pathogenesis.
REFERENCES1 Cui Y, Li Z, Zhao E, Cui N. Risk factors in patients with
hereditary gallstones in Chinese pedigrees. Med Princ Pract 2012; 21: 467-471 [PMID: 22473058 DOI: 10.1159/000337437]
2 Xu SQ, Zhao LF. CT Diagnosis of Cholelithiasis. Shiyong Linchuang Yiyao Zazhi 2009; 13: 128-130
3 Bang BW, Hong JT, Choi YC, Jeong S, Lee DH, Kim HK, Park SG, Jeon YS. Is endoscopic ultrasound needed as an add-on test for gallstone diseases without choledocholithiasis on multidetector computed tomography? Dig Dis Sci 2012; 57: 3246-3251 [PMID: 22729595 DOI: 10.1007/s10620-012-2261-x]
4 Liu XJ. Causes and Prevention of Gallbladder Stone. Henan Yufang Yixue Zazhi 2003; 14: 90
5 Li GZ, Dai JP, Wang YS. Clinical CT Diagnostics. Beijing: China Science and Technology Press, 1997: 448
6 Anderson SW, Lucey BC, Varghese JC, Soto JA. Accuracy of MDCT in the diagnosis of choledocholithiasis. AJR Am J Roentgenol 2006; 187: 174-180 [PMID: 16794173 DOI: 10.2214/AJR.05.0459]
7 Zhang YL . Study on Relationship between CT Imaging Manifestations and Chemical Type of Gallbladder Stone. Zhongguo Linchuang Yixue Yingxiang 1998; 9: 209-210
8 Karçaaltıncaba M, Aktaş A. Dual-energy CT revisited with multidetector CT: review of principles and clinical applications. Diagn Interv Radiol 2011; 17: 181-194 [PMID: 20945292 DOI: 10.4261/1305-3825.DIR.3860-10.0]
9 Remy-Jardin M, Faivre JB, Pontana F, Molinari F, Tacelli N, Remy J. Thoracic applications of dual energy. Semin Respir Crit Care Med 2014; 35: 64-73 [PMID: 24481760 DOI: 10.1055/s-0033-1363452]
10 Kang MJ, Park CM, Lee CH, Goo JM, Lee HJ. Dual-energy CT: clinical applications in various pulmonary diseases. Radiographics 2010; 30: 685-698 [PMID: 20462988 DOI: 10.1148/rg.303095101]
11 Ren QG, Hua YQ, Li JY. The basic principle and clinical applications of CT spectral imaging. Guoji Yixue Fangshexue Zazhi 2011; 34: 559-563
12 Lin XZ, Shen Y, Chen KM. Basic Principle and Research Progress of Clinical Application of CT Spectral Imaging. Zhonghua Fangshexue Zazhi 2011; 45: 798-800
13 Lin XZ, Wu ZY, Li WX, Zhang J, Xu XQ, Chen KM, Yan FH. Differential diagnosis of pancreatic serous oligocystic adenoma and mucinous cystic neoplasm with spectral CT imaging: initial results. Clin Radiol 2014; 69: 1004-1010 [PMID: 24919983 DOI: 10.1016/j.crad.2014.05.003]
14 Hao L, Liu AL, Wang HQ, Zhang T, Liu JH, Wang S. Spectral CT imaging in differential diagnosis of posterior bladder wall cancer and prostatic hyperplasia into bladder. Zhongguo Yixue Yingxiang Jishu 2013; 29: 269-272.
15 Lv P, Lin XZ, Li J, Li W, Chen K. Differentiation of small hepatic hemangioma from small hepatocellular carcinoma: recently introduced spectral CT method. Radiology 2011; 259: 720-729 [PMID: 21357524 DOI: 10.1148/radiol.11101425]
P- Reviewer: Cariati A, Wang YF S- Editor: Yu J L- Editor: Wang TQ E- Editor: Ma S
9998 September 14, 2015|Volume 21|Issue 34|WJG|www.wjgnet.com
COMMENTS
Chen AL et al . Dual-energy spectral CT imaging for gallbladder stones
Jiang-Wei Xiao, Zi-Lin Liu, Peng-Cheng Ye, Ya-Jun Luo, Zhi-Ming Fu, Qin Zou, Shou-Jiang Wei
Jiang-Wei Xiao, Zi-Lin Liu, Peng-Cheng Ye, Ya-Jun Luo, Zhi-Ming Fu, Shou-Jiang Wei, Department of General Surgery, the Affiliated Hospital of North Sichuan Medical College, Nanchong 637000, Sichuan Province, China
Qin Zou, West China Hospital/West China School of Nursing, Sichuan University, Chengdu 610041, Sichuan Province, China
Author contributions: Xiao JW, Liu ZL and Wei SJ designed the study; Xiao JW, Liu ZL, Ye PC, Luo YJ, Fu ZM and Wei SJ performed the research; Xiao JW, Liu ZL and Zou Q analyzed the data; Liu ZL and Xiao JW wrote the manuscript; Liu ZL and Xiao JW contributed equally to this study and shared the first authorship.
Supported by Grants from Sichuan Provincial Department of Education Research Project, No. 14ZA0192; and National Natural Science Foundation of China, No. 30700773, No. 81070378, and No. 81270561.
Open-Access: This article is an open-access article which was selected by an in-house editor and fully peer-reviewed by external reviewers. It is distributed in accordance with the Creative Commons Attribution Non Commercial (CC BY-NC 4.0) license, which permits others to distribute, remix, adapt, build upon this work non-commercially, and license their derivative works on different terms, provided the original work is properly cited and the use is non-commercial. See: http://creativecommons.org/licenses/by-nc/4.0/
Correspondence to: Jiang-Wei Xiao, MD, PhD, Professor, Department of General Surgery, the Affiliated Hospital of North Sichuan Medical College, Nanchong 637000, Sichuan province, China. [email protected]: +86-13890868466Fax: +86-817-2262417
Received: February 27, 2015 Peer-review started: March 1, 2015 First decision: April 13, 2015
Revised: April 23, 2015 Accepted: July 15, 2015 Article in press: July 15, 2015Published online: September 14, 2015
AbstractAIM: To explore a reasonable method of digestive tract reconstruction, namely, antrum-preserving double-tract reconstruction (ADTR), for patients with adenocarcinoma of the esophagogastric junction (AEG) and to assess its efficacy and safety in terms of long-term survival, complications, morbidity and mortality.
METHODS: A total of 55 cases were retrospectively collected, including 18 cases undergoing ADTR and 37 cases of Roux-en-Y reconstruction (RY) for AEG (Siewert types Ⅱ and Ⅲ) at North Sichuan Medical College. The cases were divided into two groups. The clinicopathological characteristics, perioperative outcomes, postoperative complications, morbidity and overall survival (OS) were compared for the two different reconstruction methods.
RESULTS: Basic characteristics including sex, age, body mass index (BMI), Siewert type, pT status, pN stage, and lymph node metastasis were similar in the two groups. No significant differences were found between the two groups in terms of perioperative outcomes (including the length of postoperative hospital stay, operating time, and intraoperative blood loss) and postoperative complications (consisting of anastomosis-related complications, wound infection, respiratory infection, pleural effusion, lymphorrhagia, and cholelithiasis). For the ADTR group, perioperative
ORIGINAL ARTICLE
Submit a Manuscript: http://www.wjgnet.com/esps/Help Desk: http://www.wjgnet.com/esps/helpdesk.aspxDOI: 10.3748/wjg.v21.i34.9999
World J Gastroenterol 2015 September 14; 21(34): 9999-10007 ISSN 1007-9327 (print) ISSN 2219-2840 (online)
© 2015 Baishideng Publishing Group Inc. All rights reserved.
9999 September 14, 2015|Volume 21|Issue 34|WJG|www.wjgnet.com
Retrospective Study
Clinical comparison of antrum-preserving double tract reconstruction vs roux-en-Y reconstruction after gastrectomy for Siewert types Ⅱ and Ⅲ adenocarcinoma of the esophagogastric junction
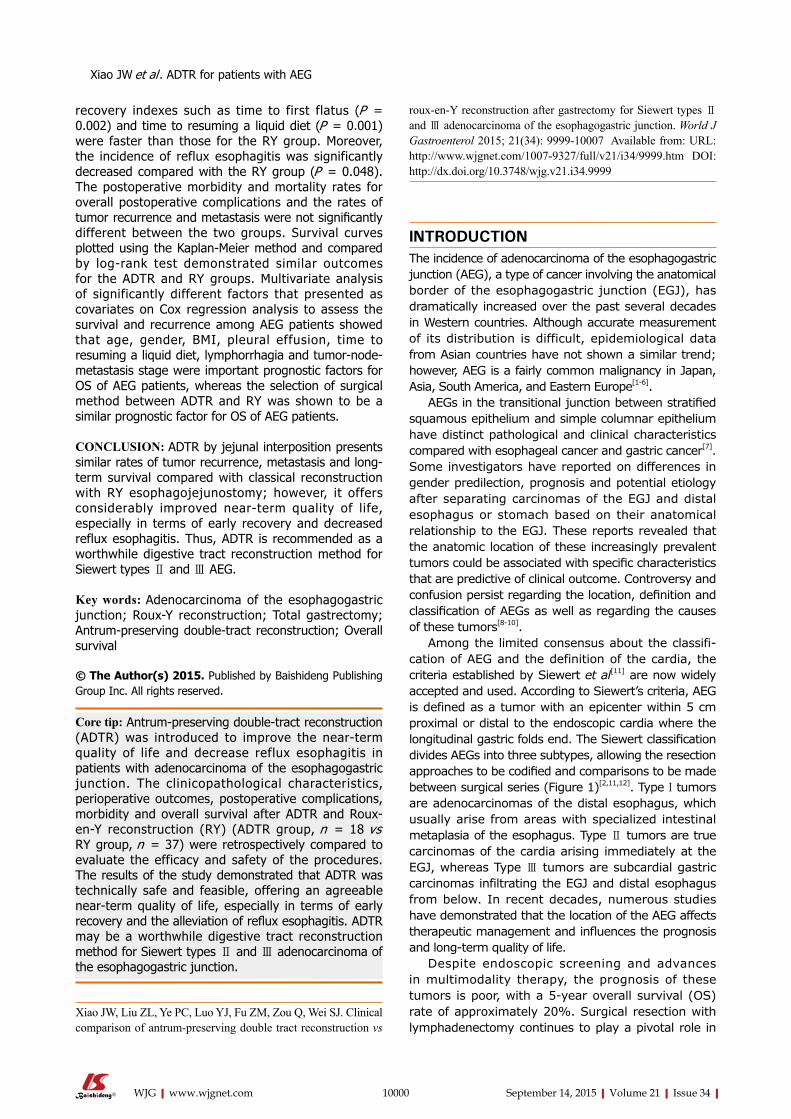
roux-en-Y reconstruction after gastrectomy for Siewert types Ⅱ and Ⅲ adenocarcinoma of the esophagogastric junction. World J Gastroenterol 2015; 21(34): 9999-10007 Available from: URL: http://www.wjgnet.com/1007-9327/full/v21/i34/9999.htm DOI: http://dx.doi.org/10.3748/wjg.v21.i34.9999
INTRODUCTIONThe incidence of adenocarcinoma of the esophagogastric junction (AEG), a type of cancer involving the anatomical border of the esophagogastric junction (EGJ), has dramatically increased over the past several decades in Western countries. Although accurate measurement of its distribution is difficult, epidemiological data from Asian countries have not shown a similar trend; however, AEG is a fairly common malignancy in Japan, Asia, South America, and Eastern Europe[1-6].
AEGs in the transitional junction between stratified squamous epithelium and simple columnar epithelium have distinct pathological and clinical characteristics compared with esophageal cancer and gastric cancer[7]. Some investigators have reported on differences in gender predilection, prognosis and potential etiology after separating carcinomas of the EGJ and distal esophagus or stomach based on their anatomical relationship to the EGJ. These reports revealed that the anatomic location of these increasingly prevalent tumors could be associated with specific characteristics that are predictive of clinical outcome. Controversy and confusion persist regarding the location, definition and classification of AEGs as well as regarding the causes of these tumors[8-10].
Among the limited consensus about the classifi-cation of AEG and the definition of the cardia, the criteria established by Siewert et al[11] are now widely accepted and used. According to Siewert’s criteria, AEG is defined as a tumor with an epicenter within 5 cm proximal or distal to the endoscopic cardia where the longitudinal gastric folds end. The Siewert classification divides AEGs into three subtypes, allowing the resection approaches to be codified and comparisons to be made between surgical series (Figure 1)[2,11,12]. Type Ⅰ tumors are adenocarcinomas of the distal esophagus, which usually arise from areas with specialized intestinal metaplasia of the esophagus. Type Ⅱ tumors are true carcinomas of the cardia arising immediately at the EGJ, whereas Type Ⅲ tumors are subcardial gastric carcinomas infiltrating the EGJ and distal esophagus from below. In recent decades, numerous studies have demonstrated that the location of the AEG affects therapeutic management and influences the prognosis and long-term quality of life.
Despite endoscopic screening and advances in multimodality therapy, the prognosis of these tumors is poor, with a 5-year overall survival (OS) rate of approximately 20%. Surgical resection with lymphadenectomy continues to play a pivotal role in
Xiao JW et al . ADTR for patients with AEG
10000 September 14, 2015|Volume 21|Issue 34|WJG|www.wjgnet.com
recovery indexes such as time to first flatus (P = 0.002) and time to resuming a liquid diet (P = 0.001) were faster than those for the RY group. Moreover, the incidence of reflux esophagitis was significantly decreased compared with the RY group (P = 0.048). The postoperative morbidity and mortality rates for overall postoperative complications and the rates of tumor recurrence and metastasis were not significantly different between the two groups. Survival curves plotted using the Kaplan-Meier method and compared by log-rank test demonstrated similar outcomes for the ADTR and RY groups. Multivariate analysis of significantly different factors that presented as covariates on Cox regression analysis to assess the survival and recurrence among AEG patients showed that age, gender, BMI, pleural effusion, time to resuming a liquid diet, lymphorrhagia and tumor-node-metastasis stage were important prognostic factors for OS of AEG patients, whereas the selection of surgical method between ADTR and RY was shown to be a similar prognostic factor for OS of AEG patients.
CONCLUSION: ADTR by jejunal interposition presents similar rates of tumor recurrence, metastasis and long-term survival compared with classical reconstruction with RY esophagojejunostomy; however, it offers considerably improved near-term quality of life, especially in terms of early recovery and decreased reflux esophagitis. Thus, ADTR is recommended as a worthwhile digestive tract reconstruction method for Siewert types Ⅱ and Ⅲ AEG.
Key words: Adenocarcinoma of the esophagogastric junction; Roux-Y reconstruction; Total gastrectomy; Antrum-preserving double-tract reconstruction; Overall survival
© The Author(s) 2015. Published by Baishideng Publishing Group Inc. All rights reserved.
Core tip: Antrum-preserving double-tract reconstruction (ADTR) was introduced to improve the near-term quality of life and decrease reflux esophagitis in patients with adenocarcinoma of the esophagogastric junction. The clinicopathological characteristics, perioperative outcomes, postoperative complications, morbidity and overall survival after ADTR and Roux-en-Y reconstruction (RY) (ADTR group, n = 18 vs RY group, n = 37) were retrospectively compared to evaluate the efficacy and safety of the procedures. The results of the study demonstrated that ADTR was technically safe and feasible, offering an agreeable near-term quality of life, especially in terms of early recovery and the alleviation of reflux esophagitis. ADTR may be a worthwhile digestive tract reconstruction method for Siewert types Ⅱ and Ⅲ adenocarcinoma of the esophagogastric junction.
Xiao JW, Liu ZL, Ye PC, Luo YJ, Fu ZM, Zou Q, Wei SJ. Clinical comparison of antrum-preserving double tract reconstruction vs
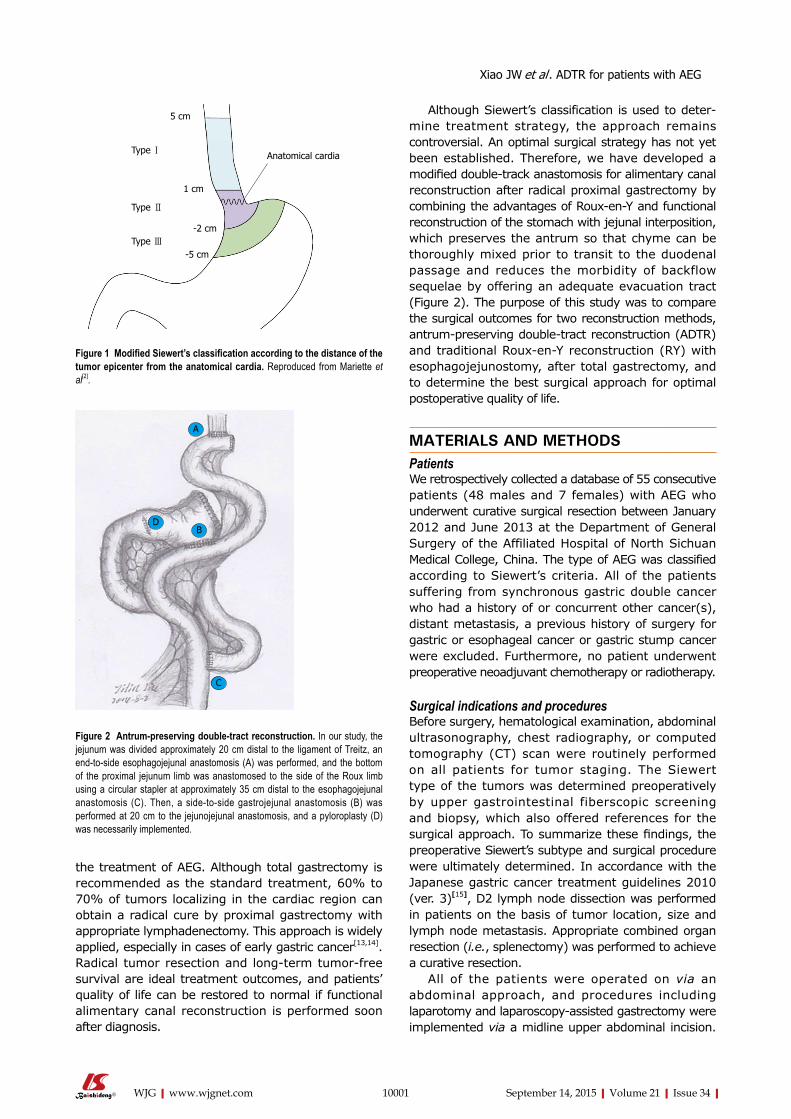
the treatment of AEG. Although total gastrectomy is recommended as the standard treatment, 60% to 70% of tumors localizing in the cardiac region can obtain a radical cure by proximal gastrectomy with appropriate lymphadenectomy. This approach is widely applied, especially in cases of early gastric cancer[13,14]. Radical tumor resection and long-term tumor-free survival are ideal treatment outcomes, and patients’ quality of life can be restored to normal if functional alimentary canal reconstruction is performed soon after diagnosis.
Although Siewert’s classification is used to deter-mine treatment strategy, the approach remains controversial. An optimal surgical strategy has not yet been established. Therefore, we have developed a modified double-track anastomosis for alimentary canal reconstruction after radical proximal gastrectomy by combining the advantages of Roux-en-Y and functional reconstruction of the stomach with jejunal interposition, which preserves the antrum so that chyme can be thoroughly mixed prior to transit to the duodenal passage and reduces the morbidity of backflow sequelae by offering an adequate evacuation tract (Figure 2). The purpose of this study was to compare the surgical outcomes for two reconstruction methods, antrum-preserving double-tract reconstruction (ADTR) and traditional Roux-en-Y reconstruction (RY) with esophagojejunostomy, after total gastrectomy, and to determine the best surgical approach for optimal postoperative quality of life.
MATERIALS AND METHODSPatientsWe retrospectively collected a database of 55 consecutive patients (48 males and 7 females) with AEG who underwent curative surgical resection between January 2012 and June 2013 at the Department of General Surgery of the Affiliated Hospital of North Sichuan Medical College, China. The type of AEG was classified according to Siewert’s criteria. All of the patients suffering from synchronous gastric double cancer who had a history of or concurrent other cancer(s), distant metastasis, a previous history of surgery for gastric or esophageal cancer or gastric stump cancer were excluded. Furthermore, no patient underwent preoperative neoadjuvant chemotherapy or radiotherapy.
Surgical indications and proceduresBefore surgery, hematological examination, abdominal ultrasonography, chest radiography, or computed tomography (CT) scan were routinely performed on all patients for tumor staging. The Siewert type of the tumors was determined preoperatively by upper gastrointestinal fiberscopic screening and biopsy, which also offered references for the surgical approach. To summarize these findings, the preoperative Siewert’s subtype and surgical procedure were ultimately determined. In accordance with the Japanese gastric cancer treatment guidelines 2010 (ver. 3)[15], D2 lymph node dissection was performed in patients on the basis of tumor location, size and lymph node metastasis. Appropriate combined organ resection (i.e., splenectomy) was performed to achieve a curative resection.
All of the patients were operated on via an abdominal approach, and procedures including laparotomy and laparoscopy-assisted gastrectomy were implemented via a midline upper abdominal incision.
10001 September 14, 2015|Volume 21|Issue 34|WJG|www.wjgnet.com
5 cm
1 cm
-2 cm
-5 cm
Anatomical cardiaType Ⅰ
Type Ⅱ
Type Ⅲ
Figure 1 Modified Siewert’s classification according to the distance of the tumor epicenter from the anatomical cardia. Reproduced from Mariette et al[2].
A
DB
C
Figure 2 Antrum-preserving double-tract reconstruction. In our study, the jejunum was divided approximately 20 cm distal to the ligament of Treitz, an end-to-side esophagojejunal anastomosis (A) was performed, and the bottom of the proximal jejunum limb was anastomosed to the side of the Roux limb using a circular stapler at approximately 35 cm distal to the esophagojejunal anastomosis (C). Then, a side-to-side gastrojejunal anastomosis (B) was performed at 20 cm to the jejunojejunal anastomosis, and a pyloroplasty (D) was necessarily implemented.
Xiao JW et al . ADTR for patients with AEG
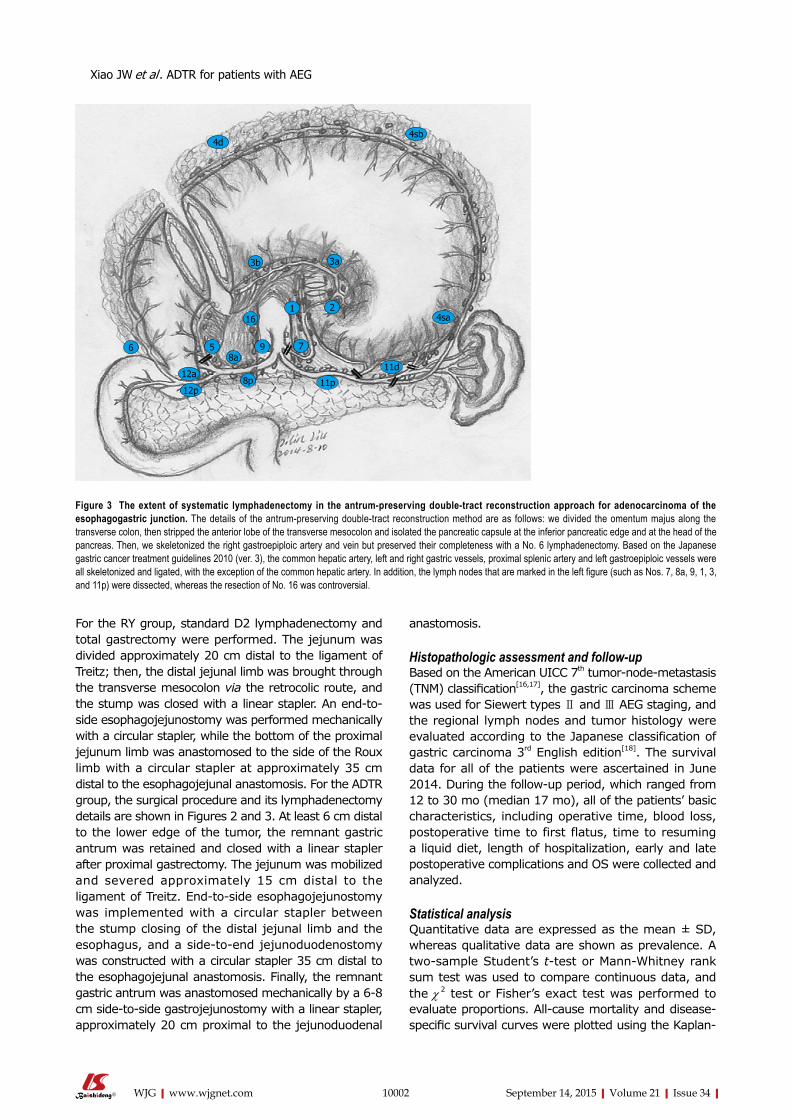
anastomosis.
Histopathologic assessment and follow-upBased on the American UICC 7th tumor-node-metastasis (TNM) classification[16,17], the gastric carcinoma scheme was used for Siewert types Ⅱ and Ⅲ AEG staging, and the regional lymph nodes and tumor histology were evaluated according to the Japanese classification of gastric carcinoma 3rd English edition[18]. The survival data for all of the patients were ascertained in June 2014. During the follow-up period, which ranged from 12 to 30 mo (median 17 mo), all of the patients’ basic characteristics, including operative time, blood loss, postoperative time to first flatus, time to resuming a liquid diet, length of hospitalization, early and late postoperative complications and OS were collected and analyzed.
Statistical analysisQuantitative data are expressed as the mean ± SD, whereas qualitative data are shown as prevalence. A two-sample Student’s t-test or Mann-Whitney rank sum test was used to compare continuous data, and the χ 2 test or Fisher’s exact test was performed to evaluate proportions. All-cause mortality and disease-specific survival curves were plotted using the Kaplan-
For the RY group, standard D2 lymphadenectomy and total gastrectomy were performed. The jejunum was divided approximately 20 cm distal to the ligament of Treitz; then, the distal jejunal limb was brought through the transverse mesocolon via the retrocolic route, and the stump was closed with a linear stapler. An end-to-side esophagojejunostomy was performed mechanically with a circular stapler, while the bottom of the proximal jejunum limb was anastomosed to the side of the Roux limb with a circular stapler at approximately 35 cm distal to the esophagojejunal anastomosis. For the ADTR group, the surgical procedure and its lymphadenectomy details are shown in Figures 2 and 3. At least 6 cm distal to the lower edge of the tumor, the remnant gastric antrum was retained and closed with a linear stapler after proximal gastrectomy. The jejunum was mobilized and severed approximately 15 cm distal to the ligament of Treitz. End-to-side esophagojejunostomy was implemented with a circular stapler between the stump closing of the distal jejunal limb and the esophagus, and a side-to-end jejunoduodenostomy was constructed with a circular stapler 35 cm distal to the esophagojejunal anastomosis. Finally, the remnant gastric antrum was anastomosed mechanically by a 6-8 cm side-to-side gastrojejunostomy with a linear stapler, approximately 20 cm proximal to the jejunoduodenal
10002 September 14, 2015|Volume 21|Issue 34|WJG|www.wjgnet.com
Figure 3 The extent of systematic lymphadenectomy in the antrum-preserving double-tract reconstruction approach for adenocarcinoma of the esophagogastric junction. The details of the antrum-preserving double-tract reconstruction method are as follows: we divided the omentum majus along the transverse colon, then stripped the anterior lobe of the transverse mesocolon and isolated the pancreatic capsule at the inferior pancreatic edge and at the head of the pancreas. Then, we skeletonized the right gastroepiploic artery and vein but preserved their completeness with a No. 6 lymphadenectomy. Based on the Japanese gastric cancer treatment guidelines 2010 (ver. 3), the common hepatic artery, left and right gastric vessels, proximal splenic artery and left gastroepiploic vessels were all skeletonized and ligated, with the exception of the common hepatic artery. In addition, the lymph nodes that are marked in the left figure (such as Nos. 7, 8a, 9, 1, 3, and 11p) were dissected, whereas the resection of No. 16 was controversial.
Xiao JW et al . ADTR for patients with AEG
4d4sb
12a
12p11p
11d
4sa
3b 3a
16
58a
9 7
1 2
6
8p
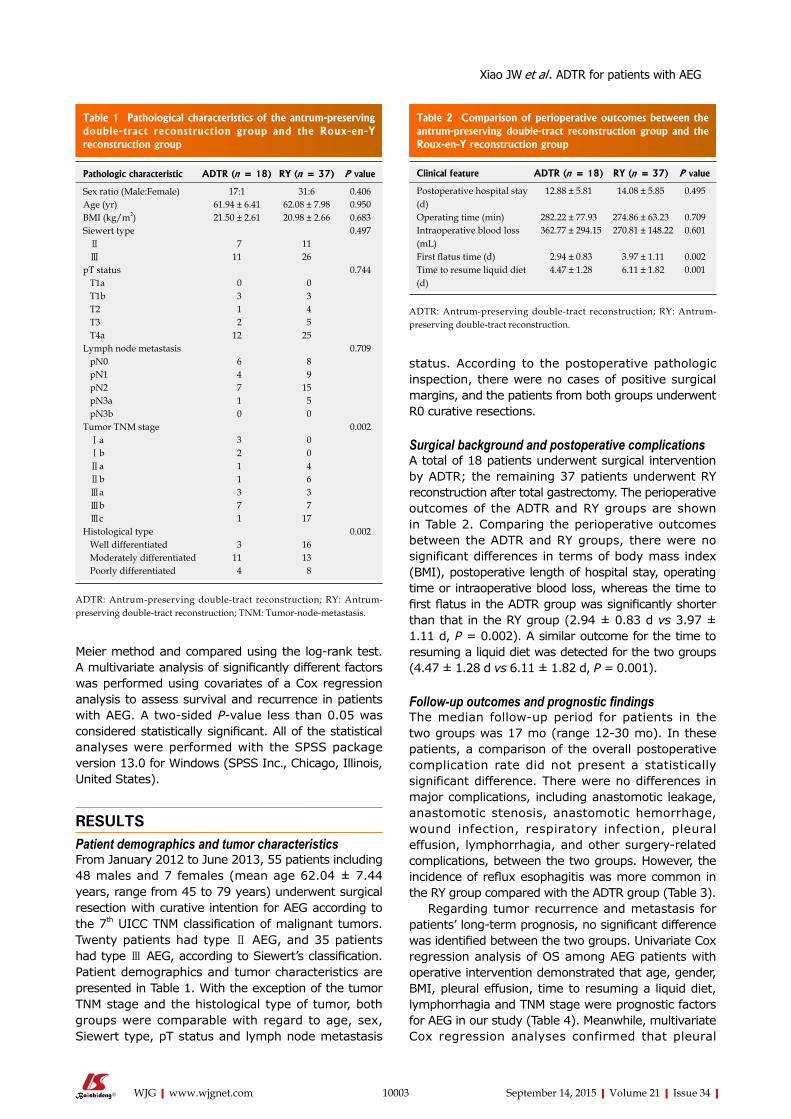
Meier method and compared using the log-rank test. A multivariate analysis of significantly different factors was performed using covariates of a Cox regression analysis to assess survival and recurrence in patients with AEG. A two-sided P-value less than 0.05 was considered statistically significant. All of the statistical analyses were performed with the SPSS package version 13.0 for Windows (SPSS Inc., Chicago, Illinois, United States).
RESULTSPatient demographics and tumor characteristicsFrom January 2012 to June 2013, 55 patients including 48 males and 7 females (mean age 62.04 ± 7.44 years, range from 45 to 79 years) underwent surgical resection with curative intention for AEG according to the 7th UICC TNM classification of malignant tumors. Twenty patients had type Ⅱ AEG, and 35 patients had type Ⅲ AEG, according to Siewert’s classification. Patient demographics and tumor characteristics are presented in Table 1. With the exception of the tumor TNM stage and the histological type of tumor, both groups were comparable with regard to age, sex, Siewert type, pT status and lymph node metastasis
status. According to the postoperative pathologic inspection, there were no cases of positive surgical margins, and the patients from both groups underwent R0 curative resections.
Surgical background and postoperative complicationsA total of 18 patients underwent surgical intervention by ADTR; the remaining 37 patients underwent RY reconstruction after total gastrectomy. The perioperative outcomes of the ADTR and RY groups are shown in Table 2. Comparing the perioperative outcomes between the ADTR and RY groups, there were no significant differences in terms of body mass index (BMI), postoperative length of hospital stay, operating time or intraoperative blood loss, whereas the time to first flatus in the ADTR group was significantly shorter than that in the RY group (2.94 ± 0.83 d vs 3.97 ± 1.11 d, P = 0.002). A similar outcome for the time to resuming a liquid diet was detected for the two groups (4.47 ± 1.28 d vs 6.11 ± 1.82 d, P = 0.001).
Follow-up outcomes and prognostic findingsThe median follow-up period for patients in the two groups was 17 mo (range 12-30 mo). In these patients, a comparison of the overall postoperative complication rate did not present a statistically significant difference. There were no differences in major complications, including anastomotic leakage, anastomotic stenosis, anastomotic hemorrhage, wound infection, respiratory infection, pleural effusion, lymphorrhagia, and other surgery-related complications, between the two groups. However, the incidence of reflux esophagitis was more common in the RY group compared with the ADTR group (Table 3).
Regarding tumor recurrence and metastasis for patients’ long-term prognosis, no significant difference was identified between the two groups. Univariate Cox regression analysis of OS among AEG patients with operative intervention demonstrated that age, gender, BMI, pleural effusion, time to resuming a liquid diet, lymphorrhagia and TNM stage were prognostic factors for AEG in our study (Table 4). Meanwhile, multivariate Cox regression analyses confirmed that pleural
10003 September 14, 2015|Volume 21|Issue 34|WJG|www.wjgnet.com
Table 1 Pathological characteristics of the antrum-preserving double-tract reconstruction group and the Roux-en-Y reconstruction group
Pathologic characteristic ADTR (n = 18) RY (n = 37) P value
Sex ratio (Male:Female) 17:1 31:6 0.406Age (yr) 61.94 ± 6.41 62.08 ± 7.98 0.950BMI (kg/m2) 21.50 ± 2.61 20.98 ± 2.66 0.683Siewert type 0.497 Ⅱ 7 11 Ⅲ 11 26pT status 0.744 T1a 0 0 T1b 3 3 T2 1 4 T3 2 5 T4a 12 25Lymph node metastasis 0.709 pN0 6 8 pN1 4 9 pN2 7 15 pN3a 1 5 pN3b 0 0Tumor TNM stage 0.002 Ⅰa 3 0 Ⅰb 2 0 Ⅱa 1 4 Ⅱb 1 6 Ⅲa 3 3 Ⅲb 7 7 Ⅲc 1 17Histological type 0.002 Well differentiated 3 16 Moderately differentiated 11 13 Poorly differentiated 4 8
ADTR: Antrum-preserving double-tract reconstruction; RY: Antrum-preserving double-tract reconstruction; TNM: Tumor-node-metastasis.
Table 2 Comparison of perioperative outcomes between the antrum-preserving double-tract reconstruction group and the Roux-en-Y reconstruction group
Clinical feature ADTR (n = 18) RY (n = 37) P value
Postoperative hospital stay (d)
12.88 ± 5.81 14.08 ± 5.85 0.495
Operating time (min) 282.22 ± 77.93 274.86 ± 63.23 0.709Intraoperative blood loss (mL)
362.77 ± 294.15 270.81 ± 148.22 0.601
First flatus time (d) 2.94 ± 0.83 3.97 ± 1.11 0.002Time to resume liquid diet (d)
4.47 ± 1.28 6.11 ± 1.82 0.001
ADTR: Antrum-preserving double-tract reconstruction; RY: Antrum-preserving double-tract reconstruction.
Xiao JW et al . ADTR for patients with AEG
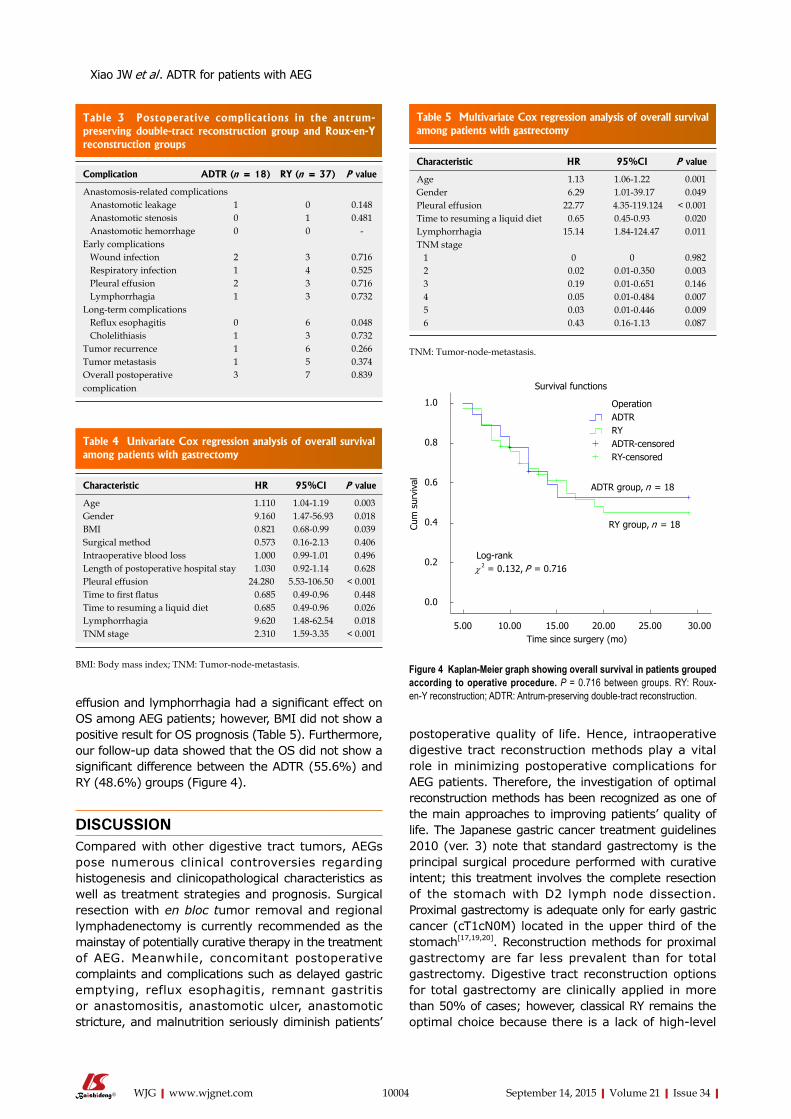
effusion and lymphorrhagia had a significant effect on OS among AEG patients; however, BMI did not show a positive result for OS prognosis (Table 5). Furthermore, our follow-up data showed that the OS did not show a significant difference between the ADTR (55.6%) and RY (48.6%) groups (Figure 4).
DISCUSSIONCompared with other digestive tract tumors, AEGs pose numerous clinical controversies regarding histogenesis and clinicopathological characteristics as well as treatment strategies and prognosis. Surgical resection with en bloc tumor removal and regional lymphadenectomy is currently recommended as the mainstay of potentially curative therapy in the treatment of AEG. Meanwhile, concomitant postoperative complaints and complications such as delayed gastric emptying, reflux esophagitis, remnant gastritis or anastomositis, anastomotic ulcer, anastomotic stricture, and malnutrition seriously diminish patients’
postoperative quality of life. Hence, intraoperative digestive tract reconstruction methods play a vital role in minimizing postoperative complications for AEG patients. Therefore, the investigation of optimal reconstruction methods has been recognized as one of the main approaches to improving patients’ quality of life. The Japanese gastric cancer treatment guidelines 2010 (ver. 3) note that standard gastrectomy is the principal surgical procedure performed with curative intent; this treatment involves the complete resection of the stomach with D2 lymph node dissection. Proximal gastrectomy is adequate only for early gastric cancer (cT1cN0M) located in the upper third of the stomach[17,19,20]. Reconstruction methods for proximal gastrectomy are far less prevalent than for total gastrectomy. Digestive tract reconstruction options for total gastrectomy are clinically applied in more than 50% of cases; however, classical RY remains the optimal choice because there is a lack of high-level
10004 September 14, 2015|Volume 21|Issue 34|WJG|www.wjgnet.com
Table 3 Postoperative complications in the antrum-preserving double-tract reconstruction group and Roux-en-Y reconstruction groups
Complication ADTR (n = 18) RY (n = 37) P value
Anastomosis-related complications Anastomotic leakage 1 0 0.148 Anastomotic stenosis 0 1 0.481 Anastomotic hemorrhage 0 0 -Early complications Wound infection 2 3 0.716 Respiratory infection 1 4 0.525 Pleural effusion 2 3 0.716 Lymphorrhagia 1 3 0.732Long-term complications Reflux esophagitis 0 6 0.048 Cholelithiasis 1 3 0.732Tumor recurrence 1 6 0.266Tumor metastasis 1 5 0.374Overall postoperative complication
3 7 0.839
Table 4 Univariate Cox regression analysis of overall survival among patients with gastrectomy
Characteristic HR 95%CI P value
Age 1.110 1.04-1.19 0.003Gender 9.160 1.47-56.93 0.018BMI 0.821 0.68-0.99 0.039Surgical method 0.573 0.16-2.13 0.406Intraoperative blood loss 1.000 0.99-1.01 0.496Length of postoperative hospital stay 1.030 0.92-1.14 0.628Pleural effusion 24.280 5.53-106.50 < 0.001Time to first flatus 0.685 0.49-0.96 0.448Time to resuming a liquid diet 0.685 0.49-0.96 0.026Lymphorrhagia 9.620 1.48-62.54 0.018TNM stage 2.310 1.59-3.35 < 0.001
BMI: Body mass index; TNM: Tumor-node-metastasis.
Table 5 Multivariate Cox regression analysis of overall survival among patients with gastrectomy
Characteristic HR 95%CI P value
Age 1.13 1.06-1.22 0.001Gender 6.29 1.01-39.17 0.049Pleural effusion 22.77 4.35-119.124 < 0.001Time to resuming a liquid diet 0.65 0.45-0.93 0.020Lymphorrhagia 15.14 1.84-124.47 0.011TNM stage 1 0 0 0.982 2 0.02 0.01-0.350 0.003 3 0.19 0.01-0.651 0.146 4 0.05 0.01-0.484 0.007 5 0.03 0.01-0.446 0.009 6 0.43 0.16-1.13 0.087
TNM: Tumor-node-metastasis.
Survival functions
ADTR group, n = 18
RY group, n = 18
Log-rankχ 2 = 0.132, P = 0.716
5.00 10.00 15.00 20.00 25.00 30.00 Time since surgery (mo)
1.0
0.8
0.6
0.4
0.2
0.0
Cum
sur
viva
lOperationADTRRYADTR-censoredRY-censored
Figure 4 Kaplan-Meier graph showing overall survival in patients grouped according to operative procedure. P = 0.716 between groups. RY: Roux-en-Y reconstruction; ADTR: Antrum-preserving double-tract reconstruction.
Xiao JW et al . ADTR for patients with AEG
multi-center randomized controlled studies to generate evidence-based support for other methods. Whether RY with esophagojejunal anastomosis for total gastrectomy is the best solution for AEG remains controversial, and numerous problems must be addressed[21-24]. First, total gastrectomy implemented for AEG may be classified in the excessive resection range. For example, “the 13th Japanese Gastric Cancer statute” advocated that lymph nodes Nos. 5, 6, 12a, 12b and 14v should be regarded as third station lymph nodes (D3) that do not need to be removed for proximal gastric tumors. Second, it is important to determine whether the incidence of cholelithiasis and postoperative malnutrition will increase or whether bile secretion will decrease when the duodenal pathway is absent[25]. Third, total gastrectomy not only prevents gastric juice secretion from affecting the assimilation of iron and causing iron deficiency anemia (IDA) but also decreases intrinsic factor secretion, which impedes vitamin B12 absorption and causes megaloblastic anemia (MA), which ultimately results in post-gastrectomy malabsorption syndrome. Hence, we explored and improved a new method of digestive tract reconstruction involving ADTR and compared it to the classical Roux-en-Y esophagojejunostomy for total gastrectomy. We found that ADTR could commendably overcome the disadvantages of the RY method and enhance patients’ postoperative quality of life[12,26].
ADTR was first reported for proximal gastrectomy by Aikou et al[27] in 1988 and was confirmed to offer numerous advantages. ADTR offers a more reasonable resection region and lymphadenectomy, especially for the majority of patients undergoing total gastrectomy. The duodenal chymus pathway remains intact during ADTR, which stimulates gastrointestinal hormone secretion (such as pancreozymin, cholecystokinin, and insulin). As a result, ADTR retains the primordial digestive function and reduces the incidence of postoperative malnutrition and cholelithiasis[28].
Furthermore, the remnant gastric antrum provides the capacity for food storage, which not only delays emptying time to ensure the efficient mixing of food with the digestive juices but also promotes gastrin (GAS) secretion for adequate chymus digestion, ultimately enhancing patients’ long-term quality of life[29]. Moreover, ADTR provides double output channels for food transit, and this split transit approach can effectively prevent and reduce the incidence of esophageal reflux and dumping syndrome[29-31]. Additionally, the remnant gastric antrum maintains gastric hormone secretion, which partially aids in the absorption of iron and prevents malabsorption of vitamin B12, decreasing the incidence of post gastrectomy malabsorption syndrome.
The data for 55 AEG patients were retrospectively analyzed. Comparing the pathological characteristics between the ADTR and RY groups revealed no signifi-cant difference in terms of Siewert type, pT status or lymph node metastasis (pN). An advanced tumor TNM
stage usually indicated a worse prognosis, whereas a well-differentiated histological type predicted a better prognosis. Although significant differences were shown with respect to the TNM stage and the degree of histological differentiation in our study, they had opposite trends and their effects could not be confirmed. In the ADTR group, the obvious advantages were observed for the time to first flatus (2.94 ± 0.83 d vs 3.97 ± 1.11 d, P = 0.002) and the time to resuming a liquid diet (4.47 ± 1.28 d vs 6.11 ± 1.82 d, P = 0.001). However, no differences were found with respect to perioperative outcomes, anastomosis-related complications or early complications between the two groups. Similarly, there were no statistically significant differences with respect to tumor recurrence or metastasis during the follow-up period (range, 12-30 mo). The Kaplan-Meier graph showing OS according to operative procedure between the two groups also demonstrated similar outcomes (Figure 4), which confirmed that ADTR was technically safe and feasible, compared with conventional Roux-en-Y esophagojejunostomy after total gastrectomy.
Based on the outcome of the Cox regression analysis, our study revealed that age, gender, BMI, pleural effusion, time to resuming a liquid diet, lymphorrhagia, and TNM stage were important prognostic factors for OS in this setting. Hence, we conclude that ADTR may be suitable to improve the quality of life and OS of AEG patients. It was found that pleural effusion and lymphorrhagia play an important role in prognosis and OS, and extensive surgical intervention is required to decrease these complications. In our opinion, redundant or rough posterior mediastinum anatomy might cause pleura injury and result in pleural effusion, which together with lymphorrhagia, mainly caused by uncompleted lymph-vessel ligature, seriously affected the OS of AEG patients. Therefore, elaborate anatomy around the cardia and sufficient ligature were recommended to improve the OS of AEG patients. In addition, we observed that an early return to a liquid diet could afford patients better quality of life. Notably, intraoperative blood loss did not affect the prognosis of AEG. One possible explanation is that we transfused sufficient blood products to avoid hypovolemia and its corresponding factors. With respect to tumor recurrence, metastasis and long-term survival, there were no differences between the ADTR group and the RY group. These results confirmed that the ADTR method is a safe and reasonable reconstruction procedure.
In conclusion, the ADTR approach is recommended over traditional Roux-en-Y esophagojejunostomy for Siewert types Ⅱ and Ⅲ AEG. Although ADTR provides similar rates of tumor recurrence, metastasis and long-term survival, this approach considerably improves the near-term quality of life, especially in terms of early recovery and decreased reflux esophagitis. Therefore, ADTR is recommended as a worthwhile digestive tract
10005 September 14, 2015|Volume 21|Issue 34|WJG|www.wjgnet.com
Xiao JW et al . ADTR for patients with AEG
reconstruction approach.
ACKNOWLEDGMENTSWe are grateful to our patients and the staff involved in managing the patients for making this study possible.
COMMENTSBackgroundThe incidence of adenocarcinoma of the esophagogastric junction (AEG) is rising rapidly and surgery remains the only established curative treatment for AEG in its resectable stages. However, the alimentary canal reconstruction method, which plays a determining factor in postgastrectomy quality of life among AEG patients, has not been established. To explore a reasonable reconstruction method for AEG patient, the authors developed a new reconstruction method, antrum-preserving double tract reconstruction (ADTR), and assessed its efficacy and safety in terms of long-term survival, complication morbidity, and mortality retrospectively at our institution since January 2012.
Research frontiersWith the development of standard surgery for AEG, gastrointestinal surgeons have taken an increased interest in optimal digestive tract reconstruction pattern which not only provides radical tumor removal but also alleviates the surgery-related complications as soon as possible and offers satisfying quality of life.
Innovations and breakthroughsThe present study modified the double-track anastomosis for alimentary canal reconstruction after radical proximal gastrectomy by combining the advantages of Roux-en-Y and functional reconstruction of the stomach with jejunal interposition, which preserves the antrum so that chyme can be thoroughly mixed prior to transit to the duodenal passage and reduces the morbidity of backflow sequelae by offering an adequate evacuation tract. Thus, the procedure ADTR obviously shortened the perioperative recovery indexes such as time to first flatus and time to resuming a liquid diet. The postoperative morbidity and mortality rates for overall postoperative complications and the rates of tumor recurrence and metastasis were not significantly different between the two groups.
ApplicationsThe study suggests that ADTR is technically safe and feasible, offering an agreeable near-term quality of life, especially in terms of early recovery and the alleviation of reflux esophagitis. ADTR may be a worthwhile digestive tract reconstruction method for Siewert types Ⅱ and Ⅲ AEG.
Peer-reviewThe present study provides a practical and well-illustrated review of the safety and feasiblility of ADTR for AEG. Based on the experience with 55 AEG patients, the conclusion is that ADTR is technically safe and feasible, with acceptable surgical outcomes.
REFERENCES1 Buas MF, Vaughan TL. Epidemiology and risk factors for
gastroesophageal junction tumors: understanding the rising incidence of this disease. Semin Radiat Oncol 2013; 23: 3-9 [PMID: 23207041 DOI: 10.1016/j.semradonc.2012.09.008]
2 Mariette C, Piessen G, Briez N, Gronnier C, Triboulet JP. Oesophagogastric junction adenocarcinoma: which therapeutic approach? Lancet Oncol 2011; 12: 296-305 [PMID: 21109491 DOI: 10.1016/S1470-2045(10)70125-X]
3 H a s e g a w a S , Yo s h i k a w a T. A d e n o c a r c i n o m a o f t h e esophagogastric junction: incidence, characteristics, and treatment strategies. Gastric Cancer 2010; 13: 63-73 [PMID: 20602191 DOI:
10.1007/s10120-010-0555-2]4 Chung JW, Lee GH, Choi KS, Kim DH, Jung KW, Song HJ, Choi
KD, Jung HY, Kim JH, Yook JH, Kim BS, Jang SJ. Unchanging trend of esophagogastric junction adenocarcinoma in Korea: experience at a single institution based on Siewert’s classification. Dis Esophagus 2009; 22: 676-681 [PMID: 19222529 DOI: 10.1111/j.1442-2050.2009.00946.x]
5 Huang Q. Carcinoma of the gastroesophageal junction in Chinese patients. World J Gastroenterol 2012; 18: 7134-7140 [PMID: 23326117 DOI: 10.3748/wjg.v18.i48.7134]
6 Deans C, Yeo MS, Soe MY, Shabbir A, Ti TK, So JB. Cancer of the gastric cardia is rising in incidence in an Asian population and is associated with adverse outcome. World J Surg 2011; 35: 617-624 [PMID: 21203759 DOI: 10.1007/s00268-010-0935-0]
7 MacDonald WC . C l in ica l and pa thologic fea tures of adenocarcinoma of the gastric cardia. Cancer 1972; 29: 724-732 [PMID: 5060650]
8 Stein HJ, Feith M, Siewert JR. Cancer of the esophagogastric junction. Surg Oncol 2000; 9: 35-41 [PMID: 11525305 DOI: 10.1016/S0960-7404(00)00021-9]
9 McColl KE , Going JJ . Aetiology and classif icat ion of adenocarcinoma of the gastro-oesophageal junction/cardia. Gut 2010; 59: 282-284 [PMID: 20207629 DOI: 10.1136/gut.2009.186825]
10 Whitson BA, Groth SS, Li Z, Kratzke RA, Maddaus MA. Survival of patients with distal esophageal and gastric cardia tumors: a population-based analysis of gastroesophageal junction carcinomas. J Thorac Cardiovasc Surg 2010; 139: 43-48 [PMID: 19660401 DOI: 10.1016/j.jtcvs.2009.04.011]
11 Siewert JR, Stein HJ. Classification of adenocarcinoma of the oesophagogastric junction. Br J Surg 1998; 85: 1457-1459 [PMID: 9823902 DOI: 10.1046/j.1365-2168.1998.00940.x]
12 Maksimovic S. Double tract reconstruction after total gastrectomy in patients with gastric cancer: our experience. Med Arh 2010; 64: 116-118 [PMID: 20514781]
13 Jiang X, Hiki N, Nunobe S, Fukunaga T, Kumagai K, Nohara K, Katayama H, Ohyama S, Sano T, Yamaguchi T. Long-term outcome and survival with laparoscopy-assisted pylorus-preserving gastrectomy for early gastric cancer. Surg Endosc 2011; 25: 1182-1186 [PMID: 20844895 DOI: 10.1007/s00464-010-1336-z]
14 Yoo CH, Sohn BH, Han WK, Pae WK. Proximal gastrectomy reconstructed by jejunal pouch interposition for upper third gastric cancer: prospective randomized study. World J Surg 2005; 29: 1592-1599 [PMID: 16311849 DOI: 10.1007/s00268-005-7793-1]
15 Japanese Gastric Cancer Association. Japanese gastric cancer treatment guidelines 2010 (ver. 3). Gastric Cancer 2011; 14: 113-123 [PMID: 21573742 DOI: 10.1007/s10120-011-0042-4]
16 Biondi A, Hyung WJ. Seventh edition of TNM classification for gastric cancer. J Clin Oncol 2011; 29: 4338-4339; author reply 4340-4342 [PMID: 22010017 DOI: 10.1200/JCO.2011.36.9900]
17 Japanese Gastric Cancer Association. Japanese classification of gastric carcinoma: 3rd English edition. Gastric Cancer 2011; 14: 101-112 [PMID: 21573743 DOI: 10.1007/s10120-011-0041-5]
18 Sobin LH, Gospodarowicz MK, Wittekind C. TNM classification of malignant tumours. 7th ed. New York: Wiley-Blackwell, 2009
19 Matsuda T, Takeuchi H, Tsuwano S, Nakahara T, Mukai M, Kitagawa Y. Sentinel node mapping in adenocarcinoma of the esophagogastric junction. World J Surg 2014; 38: 2337-2344 [PMID: 24752362 DOI: 10.1007/s00268-014-2573-4]
20 Hasegawa S, Yoshikawa T, Rino Y, Oshima T, Aoyama T, Hayashi T, Sato T, Yukawa N, Kameda Y, Sasaki T, Ono H, Tsuchida K, Cho H, Kunisaki C, Masuda M, Tsuburaya A. Priority of lymph node dissection for Siewert type II/III adenocarcinoma of the esophagogastric junction. Ann Surg Oncol 2013; 20: 4252-4259 [PMID: 23943020 DOI: 10.1245/s10434-013-3036-0]
21 Hiki N, Nunobe S, Kubota T, Jiang X. Function-preserving gastrectomy for early gastric cancer. Ann Surg Oncol 2013; 20: 2683-2692 [PMID: 23504120 DOI: 10.1245/s10434-013-2931-8]
22 Barbour AP, Lagergren P, Hughes R, Alderson D, Barham CP, Blazeby JM. Health-related quality of life among patients with
10006 September 14, 2015|Volume 21|Issue 34|WJG|www.wjgnet.com
COMMENTS
Xiao JW et al . ADTR for patients with AEG
adenocarcinoma of the gastro-oesophageal junction treated by gastrectomy or oesophagectomy. Br J Surg 2008; 95: 80-84 [PMID: 17849373 DOI: 10.1002/bjs.5912]
23 Sch ie s ser M , Schne ide r PM. Su rg i ca l s t r a t eg i e s fo r adenocarcinoma of the esophagogastric junction. Recent Results Cancer Res 2010; 182: 93-106 [PMID: 20676874 DOI: 10.1007/978-3-540-70579-6_8]
24 Amenabar A, Hoppo T, Jobe BA. Surgical management of gastroesophageal junction tumors. Semin Radiat Oncol 2013; 23: 16-23 [PMID: 23207043 DOI: 10.1016/j.semradonc.2012.09.002]
25 Nomura E, Lee SW, Kawai M, Yamazaki M, Nabeshima K, Nakamura K, Uchiyama K. Functional outcomes by reconstruction technique following laparoscopic proximal gastrectomy for gastric cancer: double tract versus jejunal interposition. World J Surg Oncol 2014; 12: 20 [PMID: 24468278 DOI: 10.1186/1477-7819-12-20]
26 Namikawa T, Kitagawa H, Okabayashi T, Sugimoto T, Kobayashi M, Hanazaki K. Double tract reconstruction after distal gastrectomy for gastric cancer is effective in reducing reflux esophagitis and remnant gastritis with duodenal passage preservation. Langenbecks Arch Surg 2011; 396: 769-776 [PMID: 21448727 DOI: 10.1007/s00423-011-0777-8]
27 Aikou T, Natsugoe S, Shimazu H, Nishi M. Antrum preserving double tract method for reconstruction following proximal gastrectomy. Jpn J Surg 1988; 18: 114-115 [PMID: 3386066 DOI:
10.1007/BF02470857]28 Sakuramoto S, Yamashita K, Kikuchi S, Futawatari N, Katada
N, Moriya H, Hirai K, Watanabe M. Clinical experience of laparoscopy-assisted proximal gastrectomy with Toupet-like partial fundoplication in early gastric cancer for preventing reflux esophagitis. J Am Coll Surg 2009; 209: 344-351 [PMID: 19717038 DOI: 10.1016/j.jamcollsurg.2009.04.011]
29 Cordesmeyer S, Lodde S, Zeden K, Kabar I, Hoffmann MW. Prevention of delayed gastric emptying after pylorus-preserving pancreatoduodenectomy with antecolic reconstruction, a long jejunal loop, and a jejuno-jejunostomy. J Gastrointest Surg 2014; 18: 662-673 [PMID: 24553874 DOI: 10.1007/s11605-013-2446-4]
30 Cook MB, Corley DA, Murray LJ, Liao LM, Kamangar F, Ye W, Gammon MD, Risch HA, Casson AG, Freedman ND, Chow WH, Wu AH, Bernstein L, Nyrén O, Pandeya N, Whiteman DC, Vaughan TL. Gastroesophageal reflux in relation to adenocarcinomas of the esophagus: a pooled analysis from the Barrett’s and Esophageal Adenocarcinoma Consortium (BEACON). PLoS One 2014; 9: e103508 [PMID: 25075959 DOI: 10.1371/journal.pone.0103508]
31 Kim J, Kim S, Min YD. Consideration of cardia preserving proximal gastrectomy in early gastric cancer of upper body for prevention of gastroesophageal reflux disease and stenosis of anastomosis site. J Gastric Cancer 2012; 12: 187-193 [PMID: 23094231 DOI: 10.5230/jgc.2012.12.3.187]
P- Reviewer: Tiberio G S- Editor: Yu J L- Editor: Wang TQ E- Editor: Ma S
10007 September 14, 2015|Volume 21|Issue 34|WJG|www.wjgnet.com
Xiao JW et al . ADTR for patients with AEG
Yoshihiko Fukukura, Toshikazu Shindo, Michiyo Higashi, Koji Takumi, Tomokazu Umanodan, Tomohide Yoneyama, Takashi Yoshiura
Yoshihiko Fukukura, Toshikazu Shindo, Koji Takumi, Tomokazu Umanodan, Tomohide Yoneyama, Takashi Yoshiura, Department of Radiology, Kagoshima University Graduate School of Medical and Dental Sciences, Kagoshima City 8908544, Japan
Michiyo Higashi, Department of Human Pathology, Kagoshima University Graduate School of Medical and Dental Sciences, Kagoshima City 8908544, Japan
Author contributions: Fukukura Y designed the research and wrote the paper; Shindo T, Takumi K, Umanodan T, Yoneyama T and Higashi M analyzed and interpreted the data; Yoshiura T revised the article critically for important intellectual content; all authors participated in drafting or revising the article, and approved the submitted manuscript.
Institutional review board statement: This study was institutionally approved by Kagoshima University Graduate School of Medical and Dental Sciences.
Informed consent statement: The institutional review board did not require informed consent for a retrospective study using medical records or imaging examinations.
Conflict-of-interest statement: There are no competing interests to disclose in relation to this study.
Data sharing statement: No additional data are available.
Open-Access: This article is an openaccess article which was selected by an inhouse editor and fully peerreviewed by external reviewers. It is distributed in accordance with the Creative Commons Attribution Non Commercial (CC BYNC 4.0) license, which permits others to distribute, remix, adapt, build upon this work noncommercially, and license their derivative works on different terms, provided the original work is properly cited and the use is noncommercial. See: http://creativecommons.org/licenses/bync/4.0/
Correspondence to: Yoshihiko Fukukura, MD, PhD, Department of Radiology, Kagoshima University Graduate School of Medical
and Dental Sciences, 8351 Sakuragaoka, Kagoshima City 8908544, Japan. [email protected]u.ac.jpTelephone: +81992755417 Fax: +81992651106
Received: March 19, 2015Peer-review started: March 25, 2015First decision: April 13, 2015Revised: April 26, 2015Accepted: July 15, 2015Article in press: July 15, 2015Published online: September 14, 2015
AbstractAIM: To clarify the computed tomography (CT) and magnetic resonance imaging (MRI) characteristics of lipid-rich pancreatic neuroendocrine tumors (PanNETs).
METHODS: Enhanced CT and MRI performed before pancreatectomy in 29 patients with 34 histologically-confirmed PanNETs was retrospectively reviewed. Tumor attenuation on CT and signal intensities on conventional (T1- and T2-weighted) and chemical shift MRI were qualitatively analyzed and compared alongside adipose differentiation-related protein (ADRP) immunostaining (ADRP-positive: lipid-rich; ADRP-negative: non-lipid-rich) results using Fisher’s exact test or the Mann-Whitney U test. Signal intensity index on chemical shift MRI was quantitatively assessed.
RESULTS: There were 15 lipid-rich PanNETs (44.1%) in 12 patients (41.4%). Tumor attenuation during the early, portal venous, and delayed phases of enhanced CT (P = 0.888, 0.443, and 0.359, respectively) and signal intensities on conventional MRI (P = 0.698 and 0.798, respectively) were not significantly different
ORIGINAL ARTICLE
Submit a Manuscript: http://www.wjgnet.com/esps/Help Desk: http://www.wjgnet.com/esps/helpdesk.aspxDOI: 10.3748/wjg.v21.i34.10008
World J Gastroenterol 2015 September 14; 21(34): 10008-10017 ISSN 1007-9327 (print) ISSN 2219-2840 (online)
© 2015 Baishideng Publishing Group Inc. All rights reserved.
10008 September 14, 2015|Volume 21|Issue 34|WJG|www.wjgnet.com
Observational Study
Computed tomography and magnetic resonance imaging features of lipid-rich neuroendocrine tumors of the pancreas
tumors are a distinct histological variant of PanNET that have cells characterized by an abundant, clear, and vacuolated cytoplasm; this substantial deviation from the usual appearance can pose diagnostic problems at biopsy[3-7]. However, the clinicopathological characteristics of lipid-rich PanNET and its difference from the usual PanNET remain unclear.
Diagnostic imaging is important for differentiating PanNETs from other pancreatic lesions in order to guide therapeutic strategy. Enhanced computed tomography (CT) and magnetic resonance imaging (MRI) are widely accepted techniques for detecting and characterizing pancreatic lesions. Due to their rich blood capillary network, typical PanNETs hyperattenuate relative to the surrounding pancreatic parenchyma during the early or portal venous phase of contrast enhanced CT[8,9]. PanNET appears as a relatively hypointense mass on T1-weighted images and most PanNETs demonstrate much higher signal intensities than normal pancreas on T2-weighted images[9,10]. However, the CT and MRI features of lipid-rich PanNETs have not yet been described.
Chemical shift MRI has been clinically applied in the field of body imaging to detect small amounts of lipids based on the inherent difference in the resonant frequencies of water and fat protons[11,12]. Radiologic detection of lipid components within pancreatic lesions has been evaluated for a variety of pancreatic lesions, and this information has been reported to enable radiologists to differentiate lipid-containing pancreatic lesions from PanNETs[13-18]. However, there have been no reports regarding the utility of chemical shift MRI for the detection of intracytoplasmic lipids associated with lipid-rich PanNETs.
Therefore, the purpose of the current study was to clarify the CT and MRI characteristics of lipid-rich PanNETs.
MATERIALS AND METHODSStudy populationApproval from the institutional ethics review board of the Kagoshima University Graduate School of Medical and Dental Sciences (Kagoshima City, Japan) was obtained and informed consent was waived for this retrospective study. Via review of clinical charts and records from the Department of Human Pathology, a total of 51 patients with pathologically-confirmed PanNET following surgical resection between April 2001 and June 2013 were retrospectively identified. Among these patients, 30 underwent three-phase enhanced CT (including early, portal venous, and delayed phases) and chemical shift MRI before pancreatectomy. The mean interval between imaging and surgical resection was 36.4 d (range, 4-77 d). Twenty-seven patients had unifocal PanNETs. One patient with a PanNET measuring 7 mm in diameter that was not visualized on CT and MRI was excluded. In three patients with
Fukukura Y et al . CT and MRI of Lipid-rich PanNETs
10009 September 14, 2015|Volume 21|Issue 34|WJG|www.wjgnet.com
between lipid-rich and non-lipid-rich PanNETs. Four of the 15 lipid-rich PanNETs exhibited high signal intensity on subtraction chemical shift MRI, and the association of high signal intensity on subtraction imaging with lipid-rich PanNETs was significant (4 of 15 lipid-rich PanNETs, 26.73%, vs 0 of 19 non-lipid-rich PanNETs, 0%, P = 0.029). Lipid-rich PanNETs showed a significantly higher signal intensity index than non-lipid-rich PanNETs (0.6% ± 14.1% vs -10.4% ± 14.4%, P = 0.004). Eight of 15 lipid-rich PanNETs, vs 0 of 19 non-lipid-rich PanNETs, had positive signal intensity index values in concordance with lipid contents.
CONCLUSION: CT contrast enhancement and conventional MR signal intensities are similar in lipid-rich and non-lipid-rich PanNETs. Chemical shift MRI can demonstrate cytoplasmic lipids in PanNETs.
Key words: Neoplasms; Chemical shift magnetic resonance imaging; Pancreas; Computed tomography; Neuroendocrine tumors
© The Author(s) 2015. Published by Baishideng Publishing Group Inc. All rights reserved.
Core tip: Little is known about lipid-rich pancreatic neuroendocrine tumors (PanNETs). In the current study, we clarify computed tomography (CT) and magnetic resonance imaging (MRI) characteristics of lipid-rich PanNETs. Adipose differentiation-related protein antibody positive lipid-rich cells were observed in 15 of 34 tumors (44.1%). Lipid-rich PanNETs had a similar appearance to usual PanNETs on enhanced CT. On chemical shift MRI, positive signal intensity index values in concordance with lipid contents were observed in eight of 34 tumors (23.5%). Lipid-rich PanNETs should be included in differential diagnosis whenever chemical shift MRI demonstrates lipid components within hypervascular pancreatic tumors.
Fukukura Y, Shindo T, Higashi M, Takumi K, Umanodan T, Yoneyama T, Yoshiura T. Computed tomography and magnetic resonance imaging features of lipidrich neuroendocrine tumors of the pancreas. World J Gastroenterol 2015; 21(34): 1000810017 Available from: URL: http://www.wjgnet.com/10079327/full/v21/i34/10008.htm DOI: http://dx.doi.org/10.3748/wjg.v21.i34.10008
INTRODUCTIONPancreatic neuroendocrine tumors (PanNETs) originate from pluripotent ductal stem cells and show endocrine differentiation[1]. The estimated prevalence of PanNET is 2.2 per million persons per year[2]. Microscopically, these tumors are usually composed of small, relatively uniform cuboidal cells with a finely granular eosinophilic or amphophilic cytoplasm that may be arranged into trabeculae, festoons, or solid nests[3]. Lipid-rich
multifocal tumors, tumors with a maximum diameter < 10 mm were excluded because they were too small to evaluate on CT or MRI. One of the patients with multifocal PanNETs had one tumor ≥ 10 mm, while another two patients had three and four, respectively. Thus, the final study population was comprised of 29 patients (13 men, 16 women; mean age, 55.8 years; range, 18-76 years) with 34 PanNETs. All clinical data, morphologic imaging findings (three-phase enhanced CT and MRI), and pathologic records for all patients were collected by the study coordinator, who had 20 years of abdominal radiology experience. Two patients had multiple endocrine neoplasia type 1 (MEN-1) and one had von Hippel-Lindau disease. Fourteen patients had hyperfunctioning endocrine tumors (9 insulinomas, 2 gastrinomas, and 3 glucagonomas). Tumor sizes ranged from 11 to 119 mm (mean, 24.1 mm), and tumors were located in the head (n = 14), body (n = 10), or tail (n = 10) of the pancreas.
Histopathological analysisFollowing surgical resection, the final diagnosis was confirmed by a pathologist with 20 years of experience in pathological evaluation. The pathologist evaluated pathological tumor grade on the basis of the World Health Organization (WHO) classification[19], and reported the percentages of clear cells (based on findings of an abundant, clear, and vacuolated cytoplasm after hematoxylin-eosin staining of surgical specimens) and lipid-rich cells in each tumor. Lipid-rich cells were identified by immunohistochemical staining for adipose differentiation-related protein (ADRP) antibody (monoclonal antibody ADFP/AP125, 1:100, mouse IgG, NOVUS Biologicals, Littleton, CO, United States). All sections were stained on a Benchmark XT automated slide stainer using a diaminobenzidine detection kit (Ventana Medical Systems, Tucson, AZ, United States).
CT imaging techniqueCT was performed on single- or multi-detector (16 or 64) row CT scanners using any of three CT units (Xvigor or Aquilion; Toshiba Medical Systems, Tokyo, Japan). All scans began at the top of the liver and continued through to the end of the pancreas. Imaging parameters for all phases of single-detector row CT (n = 7) included: 3 mm collimation, 3 mm reconstruction intervals using 120 kVp and 250 mA, and a 1:1 table pitch. Imaging parameters for multi-detector row CT (n = 22) were as follows: tube voltage, 120 kVp; gantry rotation speed, 0.5 s; maximum allowable tube current, 440 mA; detector row configuration, 16 mm × 1 mm for 16-detector row CT (n = 6) or 64 mm × 0.5 mm for 64-detector row CT (n = 16); and table increment, 15 mm/rotation for 16-detector row CT or 26.5 mm/rotation for 64-detector row CT. Early and portal venous phase scans were obtained at 30 and 70 s after starting infusion of contrast medium with
single-detector row CT. With multi-detector row CT, they were obtained at delays of 23 s and 50 s after the bolus-tracking program detected the threshold aortic enhancement of 50 Hounsfield units. Scan delay for the delayed phase was fixed at 180 s after contrast injection. In each contrast-enhanced CT examination, a 100 mL or 2 mL/kg body weight of non-ionic contrast material with an iodine concentration of 300 mg I/mL (Iopamiron, Bayer Schering Pharma, Osaka, Japan or Omnipaque, Daiichi Sankyo, Tokyo, Japan) was intravenously injected at a fixed duration of 30 s.
MRI techniqueMR images were obtained with 1.5-T [Magnetom Vision, Siemens, Erlangen, Germany (n = 9) or Excelart Vantage, Toshiba Medical Systems, Otawara, Japan (n = 6)] or 3.0-T system [Magnetom Trio, Siemens AG, Erlangen, Germany (n = 10) or Ingenia, Philips, Best, the Netherlands (n = 4)]. Chemical shift MRI was performed with a breath-hold 2D sequence with the 1.5-T (n = 15) and one of the 3.0-T MR systems (n = 4), and with a 3D dual gradient-echo sequence with the other 3.0-T MR system (n = 10). The MRI protocol and pulse sequence parameters are reported in Table 1. The subtraction chemical shift MR images were obtained by subtracting the series of out-of-phase images from the series of in-phase images using commercially available software integrated in the MR system.
Fat-suppressed T2-weighted images were obtained with a breath-hold single-shot turbo spin-echo (n = 9) or a respiratory-triggered multi-shot turbo spin-echo sequence (n = 20).
Qualitative image analysisTwo board-certified radiologists with 13 and 15 years of experience in abdominal radiology, respectively, independently assessed tumor-node-metastasis (TNM) stage according to the European Neuroendocrine Tumor Society of PanNETs [20] on CT and MRI. Tumor involvement of the celiac axis or superior mesenteric artery was considered if the artery showed that more than a half of its circumference was contiguous with the tumor[21]. The presence of lymph nodes with a short-axis diameter > 10 mm was regarded as lymph node metastases[22]. Tumor margins (sharp or irregular) and interruption of the main pancreatic duct with upstream ductal dilatation (≥ 3 mm) was also evaluated on enhanced CT and MRI.
The degree of tumor attenuation relative to the surrounding pancreatic parenchyma during each CT phase was evaluated using a 4-point scale where grade 1 indicated low attenuation, grade 2 indicated iso-attenuation, grade 3 indicated mildly high attenuation, and grade 4 indicated high attenuation. Homogeneity (homogenous or heterogeneous) of tumor contrast enhancement during early phase enhanced CT was evaluated.
10010 September 14, 2015|Volume 21|Issue 34|WJG|www.wjgnet.com
Fukukura Y et al . CT and MRI of Lipid-rich PanNETs
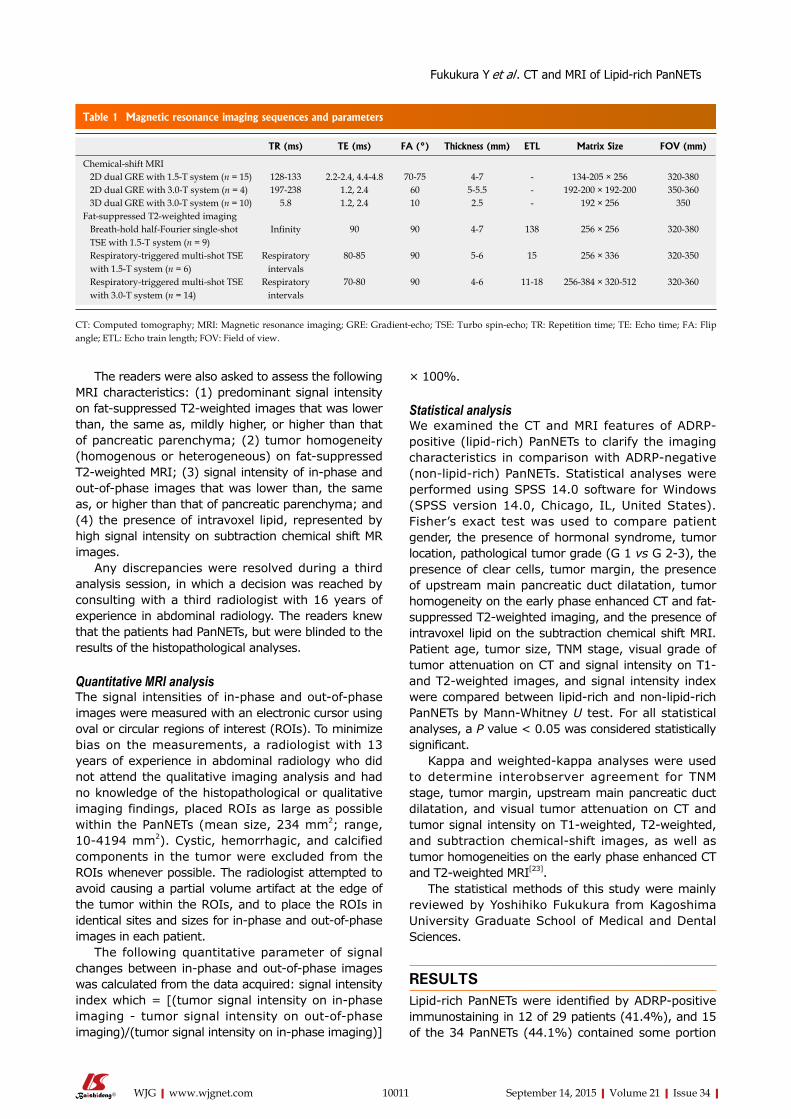
× 100%.
Statistical analysisWe examined the CT and MRI features of ADRP-positive (lipid-rich) PanNETs to clarify the imaging characteristics in comparison with ADRP-negative (non-lipid-rich) PanNETs. Statistical analyses were performed using SPSS 14.0 software for Windows (SPSS version 14.0, Chicago, IL, United States). Fisher’s exact test was used to compare patient gender, the presence of hormonal syndrome, tumor location, pathological tumor grade (G 1 vs G 2-3), the presence of clear cells, tumor margin, the presence of upstream main pancreatic duct dilatation, tumor homogeneity on the early phase enhanced CT and fat-suppressed T2-weighted imaging, and the presence of intravoxel lipid on the subtraction chemical shift MRI. Patient age, tumor size, TNM stage, visual grade of tumor attenuation on CT and signal intensity on T1- and T2-weighted images, and signal intensity index were compared between lipid-rich and non-lipid-rich PanNETs by Mann-Whitney U test. For all statistical analyses, a P value < 0.05 was considered statistically significant.
Kappa and weighted-kappa analyses were used to determine interobserver agreement for TNM stage, tumor margin, upstream main pancreatic duct dilatation, and visual tumor attenuation on CT and tumor signal intensity on T1-weighted, T2-weighted, and subtraction chemical-shift images, as well as tumor homogeneities on the early phase enhanced CT and T2-weighted MRI[23].
The statistical methods of this study were mainly reviewed by Yoshihiko Fukukura from Kagoshima University Graduate School of Medical and Dental Sciences.
RESULTSLipid-rich PanNETs were identified by ADRP-positive immunostaining in 12 of 29 patients (41.4%), and 15 of the 34 PanNETs (44.1%) contained some portion
The readers were also asked to assess the following MRI characteristics: (1) predominant signal intensity on fat-suppressed T2-weighted images that was lower than, the same as, mildly higher, or higher than that of pancreatic parenchyma; (2) tumor homogeneity (homogenous or heterogeneous) on fat-suppressed T2-weighted MRI; (3) signal intensity of in-phase and out-of-phase images that was lower than, the same as, or higher than that of pancreatic parenchyma; and (4) the presence of intravoxel lipid, represented by high signal intensity on subtraction chemical shift MR images.
Any discrepancies were resolved during a third analysis session, in which a decision was reached by consulting with a third radiologist with 16 years of experience in abdominal radiology. The readers knew that the patients had PanNETs, but were blinded to the results of the histopathological analyses.
Quantitative MRI analysisThe signal intensities of in-phase and out-of-phase images were measured with an electronic cursor using oval or circular regions of interest (ROIs). To minimize bias on the measurements, a radiologist with 13 years of experience in abdominal radiology who did not attend the qualitative imaging analysis and had no knowledge of the histopathological or qualitative imaging findings, placed ROIs as large as possible within the PanNETs (mean size, 234 mm2; range, 10-4194 mm2). Cystic, hemorrhagic, and calcified components in the tumor were excluded from the ROIs whenever possible. The radiologist attempted to avoid causing a partial volume artifact at the edge of the tumor within the ROIs, and to place the ROIs in identical sites and sizes for in-phase and out-of-phase images in each patient.
The following quantitative parameter of signal changes between in-phase and out-of-phase images was calculated from the data acquired: signal intensity index which = [(tumor signal intensity on in-phase imaging - tumor signal intensity on out-of-phase imaging)/(tumor signal intensity on in-phase imaging)]
10011 September 14, 2015|Volume 21|Issue 34|WJG|www.wjgnet.com
Table 1 Magnetic resonance imaging sequences and parameters
TR (ms) TE (ms) FA (°) Thickness (mm) ETL Matrix Size FOV (mm)
Chemical-shift MRI 2D dual GRE with 1.5-T system (n = 15) 128-133 2.2-2.4, 4.4-4.8 70-75 4-7 - 134-205 × 256 320-380 2D dual GRE with 3.0-T system (n = 4) 197-238 1.2, 2.4 60 5-5.5 - 192-200 × 192-200 350-360 3D dual GRE with 3.0-T system (n = 10) 5.8 1.2, 2.4 10 2.5 - 192 × 256 350Fat-suppressed T2-weighted imaging Breath-hold half-Fourier single-shot TSE with 1.5-T system (n = 9)
Infinity 90 90 4-7 138 256 × 256 320-380
Respiratory-triggered multi-shot TSE with 1.5-T system (n = 6)
Respiratory intervals
80-85 90 5-6 15 256 × 336 320-350
Respiratory-triggered multi-shot TSE with 3.0-T system (n = 14)
Respiratory intervals
70-80 90 4-6 11-18 256-384 × 320-512 320-360
CT: Computed tomography; MRI: Magnetic resonance imaging; GRE: Gradient-echo; TSE: Turbo spin-echo; TR: Repetition time; TE: Echo time; FA: Flip angle; ETL: Echo train length; FOV: Field of view.
Fukukura Y et al . CT and MRI of Lipid-rich PanNETs
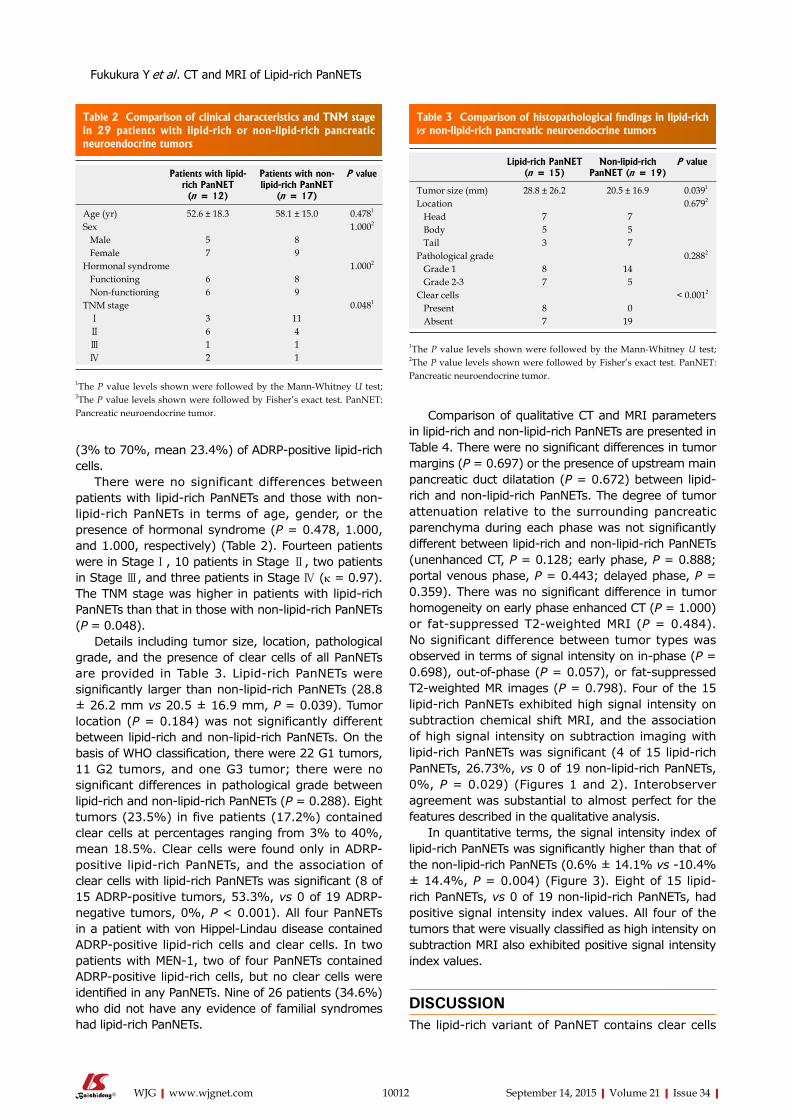
(3% to 70%, mean 23.4%) of ADRP-positive lipid-rich cells.
There were no significant differences between patients with lipid-rich PanNETs and those with non-lipid-rich PanNETs in terms of age, gender, or the presence of hormonal syndrome (P = 0.478, 1.000, and 1.000, respectively) (Table 2). Fourteen patients were in Stage Ⅰ, 10 patients in Stage Ⅱ, two patients in Stage Ⅲ, and three patients in Stage Ⅳ (κ = 0.97). The TNM stage was higher in patients with lipid-rich PanNETs than that in those with non-lipid-rich PanNETs (P = 0.048).
Details including tumor size, location, pathological grade, and the presence of clear cells of all PanNETs are provided in Table 3. Lipid-rich PanNETs were significantly larger than non-lipid-rich PanNETs (28.8 ± 26.2 mm vs 20.5 ± 16.9 mm, P = 0.039). Tumor location (P = 0.184) was not significantly different between lipid-rich and non-lipid-rich PanNETs. On the basis of WHO classification, there were 22 G1 tumors, 11 G2 tumors, and one G3 tumor; there were no significant differences in pathological grade between lipid-rich and non-lipid-rich PanNETs (P = 0.288). Eight tumors (23.5%) in five patients (17.2%) contained clear cells at percentages ranging from 3% to 40%, mean 18.5%. Clear cells were found only in ADRP-positive lipid-rich PanNETs, and the association of clear cells with lipid-rich PanNETs was significant (8 of 15 ADRP-positive tumors, 53.3%, vs 0 of 19 ADRP-negative tumors, 0%, P < 0.001). All four PanNETs in a patient with von Hippel-Lindau disease contained ADRP-positive lipid-rich cells and clear cells. In two patients with MEN-1, two of four PanNETs contained ADRP-positive lipid-rich cells, but no clear cells were identified in any PanNETs. Nine of 26 patients (34.6%) who did not have any evidence of familial syndromes had lipid-rich PanNETs.
Comparison of qualitative CT and MRI parameters in lipid-rich and non-lipid-rich PanNETs are presented in Table 4. There were no significant differences in tumor margins (P = 0.697) or the presence of upstream main pancreatic duct dilatation (P = 0.672) between lipid-rich and non-lipid-rich PanNETs. The degree of tumor attenuation relative to the surrounding pancreatic parenchyma during each phase was not significantly different between lipid-rich and non-lipid-rich PanNETs (unenhanced CT, P = 0.128; early phase, P = 0.888; portal venous phase, P = 0.443; delayed phase, P = 0.359). There was no significant difference in tumor homogeneity on early phase enhanced CT (P = 1.000) or fat-suppressed T2-weighted MRI (P = 0.484). No significant difference between tumor types was observed in terms of signal intensity on in-phase (P = 0.698), out-of-phase (P = 0.057), or fat-suppressed T2-weighted MR images (P = 0.798). Four of the 15 lipid-rich PanNETs exhibited high signal intensity on subtraction chemical shift MRI, and the association of high signal intensity on subtraction imaging with lipid-rich PanNETs was significant (4 of 15 lipid-rich PanNETs, 26.73%, vs 0 of 19 non-lipid-rich PanNETs, 0%, P = 0.029) (Figures 1 and 2). Interobserver agreement was substantial to almost perfect for the features described in the qualitative analysis.
In quantitative terms, the signal intensity index of lipid-rich PanNETs was significantly higher than that of the non-lipid-rich PanNETs (0.6% ± 14.1% vs -10.4% ± 14.4%, P = 0.004) (Figure 3). Eight of 15 lipid-rich PanNETs, vs 0 of 19 non-lipid-rich PanNETs, had positive signal intensity index values. All four of the tumors that were visually classified as high intensity on subtraction MRI also exhibited positive signal intensity index values.
DISCUSSIONThe lipid-rich variant of PanNET contains clear cells
10012 September 14, 2015|Volume 21|Issue 34|WJG|www.wjgnet.com
Table 2 Comparison of clinical characteristics and TNM stage in 29 patients with lipid-rich or non-lipid-rich pancreatic neuroendocrine tumors
Patients with lipid-rich PanNET (n = 12)
Patients with non-lipid-rich PanNET
(n = 17)
P value
Age (yr) 52.6 ± 18.3 58.1 ± 15.0 0.4781
Sex 1.0002
Male 5 8 Female 7 9Hormonal syndrome 1.0002
Functioning 6 8 Non-functioning 6 9TNM stage 0.0481
Ⅰ 3 11 Ⅱ 6 4 Ⅲ 1 1 Ⅳ 2 1
1The P value levels shown were followed by the Mann-Whitney U test; 2The P value levels shown were followed by Fisher’s exact test. PanNET: Pancreatic neuroendocrine tumor.
Table 3 Comparison of histopathological findings in lipid-rich vs non-lipid-rich pancreatic neuroendocrine tumors
Lipid-rich PanNET (n = 15)
Non-lipid-rich PanNET (n = 19)
P value
Tumor size (mm) 28.8 ± 26.2 20.5 ± 16.9 0.0391
Location 0.6792
Head 7 7 Body 5 5 Tail 3 7Pathological grade 0.2882
Grade 1 8 14 Grade 2-3 7 5Clear cells < 0.0012
Present 8 0 Absent 7 19
1The P value levels shown were followed by the Mann-Whitney U test; 2The P value levels shown were followed by Fisher’s exact test. PanNET: Pancreatic neuroendocrine tumor.
Fukukura Y et al . CT and MRI of Lipid-rich PanNETs
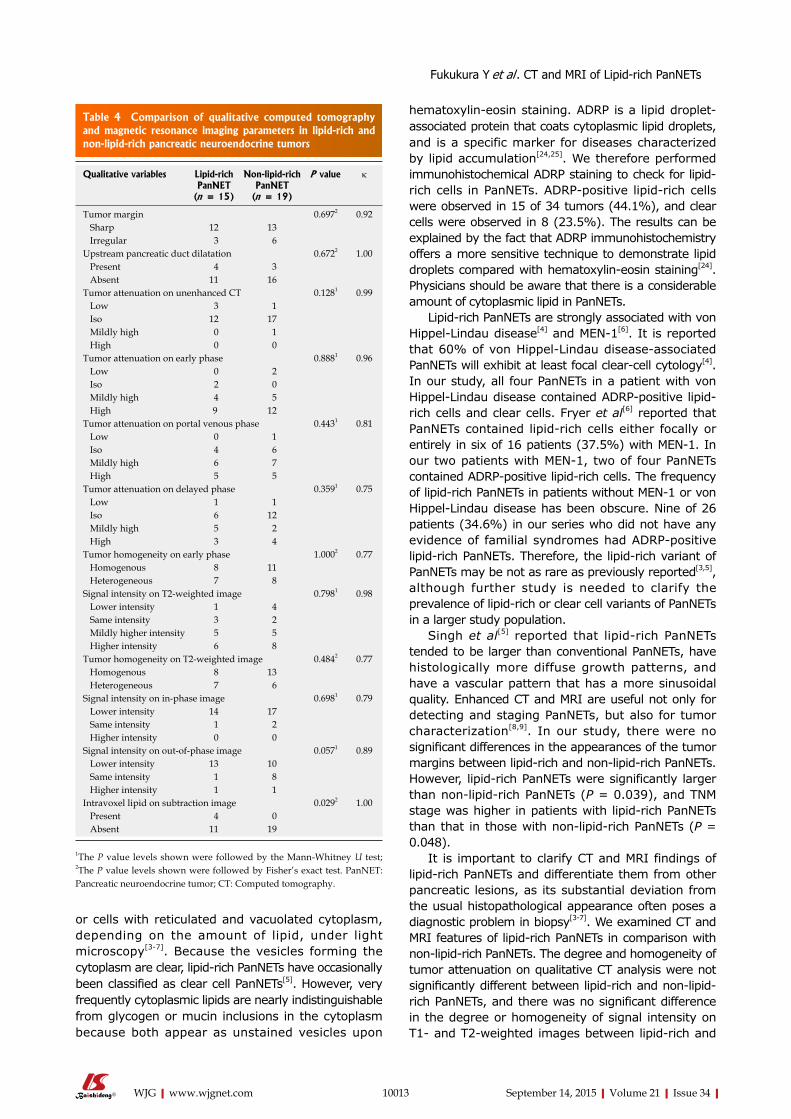
or cells with reticulated and vacuolated cytoplasm, depending on the amount of lipid, under light microscopy[3-7]. Because the vesicles forming the cytoplasm are clear, lipid-rich PanNETs have occasionally been classified as clear cell PanNETs[5]. However, very frequently cytoplasmic lipids are nearly indistinguishable from glycogen or mucin inclusions in the cytoplasm because both appear as unstained vesicles upon
hematoxylin-eosin staining. ADRP is a lipid droplet-associated protein that coats cytoplasmic lipid droplets, and is a specific marker for diseases characterized by lipid accumulation[24,25]. We therefore performed immunohistochemical ADRP staining to check for lipid-rich cells in PanNETs. ADRP-positive lipid-rich cells were observed in 15 of 34 tumors (44.1%), and clear cells were observed in 8 (23.5%). The results can be explained by the fact that ADRP immunohistochemistry offers a more sensitive technique to demonstrate lipid droplets compared with hematoxylin-eosin staining[24]. Physicians should be aware that there is a considerable amount of cytoplasmic lipid in PanNETs.
Lipid-rich PanNETs are strongly associated with von Hippel-Lindau disease[4] and MEN-1[6]. It is reported that 60% of von Hippel-Lindau disease-associated PanNETs will exhibit at least focal clear-cell cytology[4]. In our study, all four PanNETs in a patient with von Hippel-Lindau disease contained ADRP-positive lipid-rich cells and clear cells. Fryer et al[6] reported that PanNETs contained lipid-rich cells either focally or entirely in six of 16 patients (37.5%) with MEN-1. In our two patients with MEN-1, two of four PanNETs contained ADRP-positive lipid-rich cells. The frequency of lipid-rich PanNETs in patients without MEN-1 or von Hippel-Lindau disease has been obscure. Nine of 26 patients (34.6%) in our series who did not have any evidence of familial syndromes had ADRP-positive lipid-rich PanNETs. Therefore, the lipid-rich variant of PanNETs may be not as rare as previously reported[3,5], although further study is needed to clarify the prevalence of lipid-rich or clear cell variants of PanNETs in a larger study population.
Singh et al[5] reported that lipid-rich PanNETs tended to be larger than conventional PanNETs, have histologically more diffuse growth patterns, and have a vascular pattern that has a more sinusoidal quality. Enhanced CT and MRI are useful not only for detecting and staging PanNETs, but also for tumor characterization[8,9]. In our study, there were no significant differences in the appearances of the tumor margins between lipid-rich and non-lipid-rich PanNETs. However, lipid-rich PanNETs were significantly larger than non-lipid-rich PanNETs (P = 0.039), and TNM stage was higher in patients with lipid-rich PanNETs than that in those with non-lipid-rich PanNETs (P = 0.048).
It is important to clarify CT and MRI findings of lipid-rich PanNETs and differentiate them from other pancreatic lesions, as its substantial deviation from the usual histopathological appearance often poses a diagnostic problem in biopsy[3-7]. We examined CT and MRI features of lipid-rich PanNETs in comparison with non-lipid-rich PanNETs. The degree and homogeneity of tumor attenuation on qualitative CT analysis were not significantly different between lipid-rich and non-lipid-rich PanNETs, and there was no significant difference in the degree or homogeneity of signal intensity on T1- and T2-weighted images between lipid-rich and
10013 September 14, 2015|Volume 21|Issue 34|WJG|www.wjgnet.com
Table 4 Comparison of qualitative computed tomography and magnetic resonance imaging parameters in lipid-rich and non-lipid-rich pancreatic neuroendocrine tumors
Qualitative variables Lipid-rich PanNET
(n = 15)
Non-lipid-rich PanNET
(n = 19)
P value κ
Tumor margin 0.6972 0.92 Sharp 12 13 Irregular 3 6Upstream pancreatic duct dilatation 0.6722 1.00 Present 4 3 Absent 11 16Tumor attenuation on unenhanced CT 0.1281 0.99 Low 3 1 Iso 12 17 Mildly high 0 1 High 0 0Tumor attenuation on early phase 0.8881 0.96 Low 0 2 Iso 2 0 Mildly high 4 5 High 9 12Tumor attenuation on portal venous phase 0.4431 0.81 Low 0 1 Iso 4 6 Mildly high 6 7 High 5 5Tumor attenuation on delayed phase 0.3591 0.75 Low 1 1 Iso 6 12 Mildly high 5 2 High 3 4Tumor homogeneity on early phase 1.0002 0.77 Homogenous 8 11 Heterogeneous 7 8Signal intensity on T2-weighted image 0.7981 0.98 Lower intensity 1 4 Same intensity 3 2 Mildly higher intensity 5 5 Higher intensity 6 8Tumor homogeneity on T2-weighted image 0.4842 0.77 Homogenous 8 13 Heterogeneous 7 6Signal intensity on in-phase image 0.6981 0.79 Lower intensity 14 17 Same intensity 1 2 Higher intensity 0 0Signal intensity on out-of-phase image 0.0571 0.89 Lower intensity 13 10 Same intensity 1 8 Higher intensity 1 1Intravoxel lipid on subtraction image 0.0292 1.00 Present 4 0 Absent 11 19
1The P value levels shown were followed by the Mann-Whitney U test; 2The P value levels shown were followed by Fisher’s exact test. PanNET: Pancreatic neuroendocrine tumor; CT: Computed tomography.
Fukukura Y et al . CT and MRI of Lipid-rich PanNETs
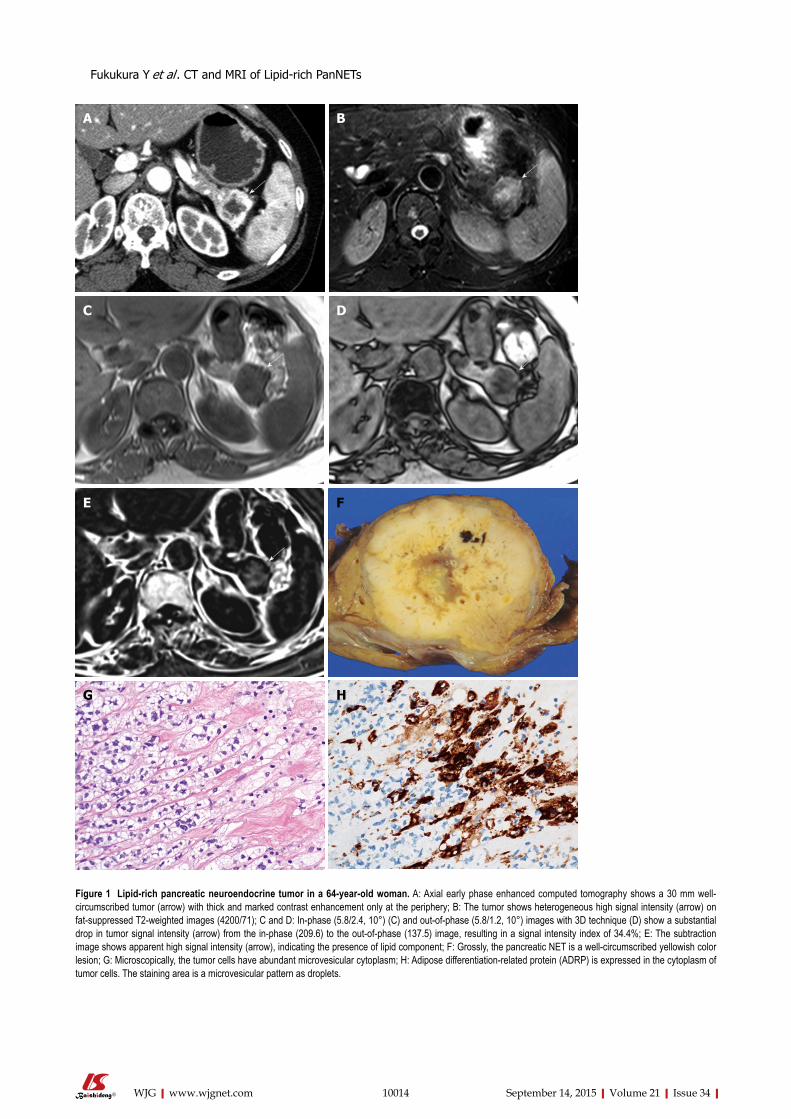
10014 September 14, 2015|Volume 21|Issue 34|WJG|www.wjgnet.com
Figure 1 Lipid-rich pancreatic neuroendocrine tumor in a 64-year-old woman. A: Axial early phase enhanced computed tomography shows a 30 mm well-circumscribed tumor (arrow) with thick and marked contrast enhancement only at the periphery; B: The tumor shows heterogeneous high signal intensity (arrow) on fat-suppressed T2-weighted images (4200/71); C and D: In-phase (5.8/2.4, 10°) (C) and out-of-phase (5.8/1.2, 10°) images with 3D technique (D) show a substantial drop in tumor signal intensity (arrow) from the in-phase (209.6) to the out-of-phase (137.5) image, resulting in a signal intensity index of 34.4%; E: The subtraction image shows apparent high signal intensity (arrow), indicating the presence of lipid component; F: Grossly, the pancreatic NET is a well-circumscribed yellowish color lesion; G: Microscopically, the tumor cells have abundant microvesicular cytoplasm; H: Adipose differentiation-related protein (ADRP) is expressed in the cytoplasm of tumor cells. The staining area is a microvesicular pattern as droplets.
A B
C D
F
G H
E
Fukukura Y et al . CT and MRI of Lipid-rich PanNETs
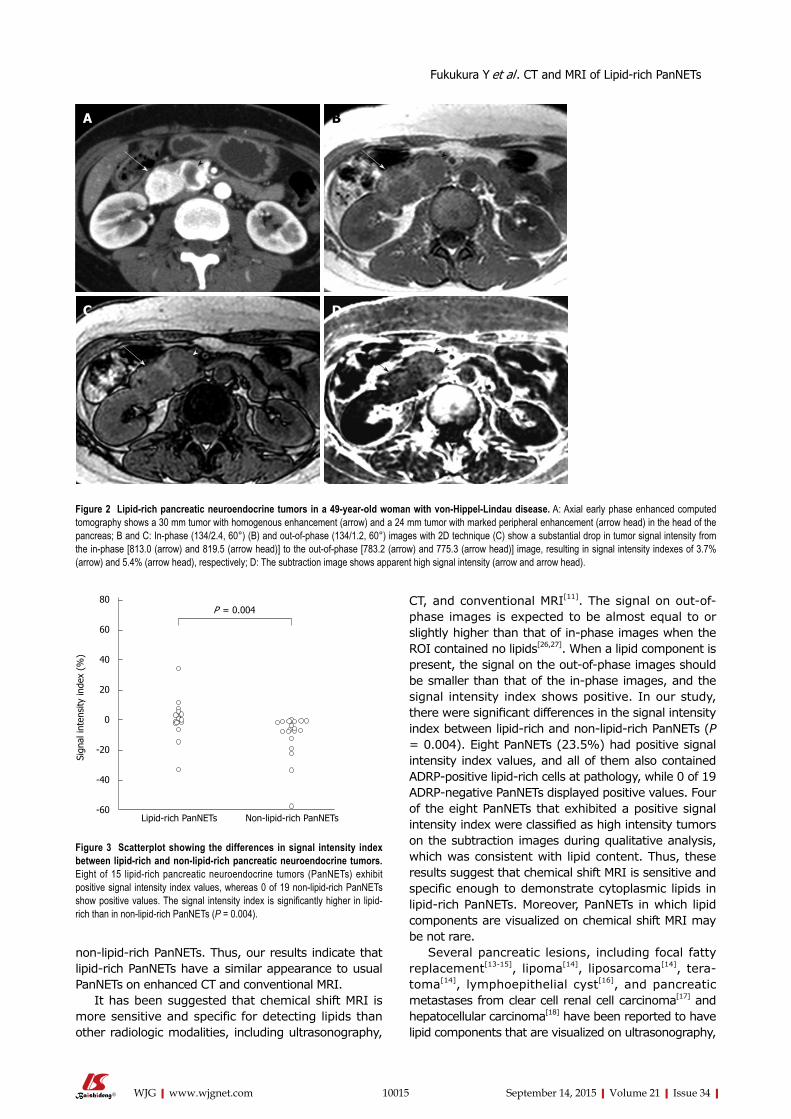
non-lipid-rich PanNETs. Thus, our results indicate that lipid-rich PanNETs have a similar appearance to usual PanNETs on enhanced CT and conventional MRI.
It has been suggested that chemical shift MRI is more sensitive and specific for detecting lipids than other radiologic modalities, including ultrasonography,
CT, and conventional MRI[11]. The signal on out-of-phase images is expected to be almost equal to or slightly higher than that of in-phase images when the ROI contained no lipids[26,27]. When a lipid component is present, the signal on the out-of-phase images should be smaller than that of the in-phase images, and the signal intensity index shows positive. In our study, there were significant differences in the signal intensity index between lipid-rich and non-lipid-rich PanNETs (P = 0.004). Eight PanNETs (23.5%) had positive signal intensity index values, and all of them also contained ADRP-positive lipid-rich cells at pathology, while 0 of 19 ADRP-negative PanNETs displayed positive values. Four of the eight PanNETs that exhibited a positive signal intensity index were classified as high intensity tumors on the subtraction images during qualitative analysis, which was consistent with lipid content. Thus, these results suggest that chemical shift MRI is sensitive and specific enough to demonstrate cytoplasmic lipids in lipid-rich PanNETs. Moreover, PanNETs in which lipid components are visualized on chemical shift MRI may be not rare.
Several pancreatic lesions, including focal fatty replacement[13-15], lipoma[14], liposarcoma[14], tera-toma[14], lymphoepithelial cyst[16], and pancreatic metastases from clear cell renal cell carcinoma[17] and hepatocellular carcinoma[18] have been reported to have lipid components that are visualized on ultrasonography,
10015 September 14, 2015|Volume 21|Issue 34|WJG|www.wjgnet.com
B
C
A
D
Figure 2 Lipid-rich pancreatic neuroendocrine tumors in a 49-year-old woman with von-Hippel-Lindau disease. A: Axial early phase enhanced computed tomography shows a 30 mm tumor with homogenous enhancement (arrow) and a 24 mm tumor with marked peripheral enhancement (arrow head) in the head of the pancreas; B and C: In-phase (134/2.4, 60°) (B) and out-of-phase (134/1.2, 60°) images with 2D technique (C) show a substantial drop in tumor signal intensity from the in-phase [813.0 (arrow) and 819.5 (arrow head)] to the out-of-phase [783.2 (arrow) and 775.3 (arrow head)] image, resulting in signal intensity indexes of 3.7% (arrow) and 5.4% (arrow head), respectively; D: The subtraction image shows apparent high signal intensity (arrow and arrow head).
P = 0.00480
60
40
20
0
-20
-40
-60Lipid-rich PanNETs Non-lipid-rich PanNETs
Sign
al in
tens
ity in
dex
(%)
Figure 3 Scatterplot showing the differences in signal intensity index between lipid-rich and non-lipid-rich pancreatic neuroendocrine tumors. Eight of 15 lipid-rich pancreatic neuroendocrine tumors (PanNETs) exhibit positive signal intensity index values, whereas 0 of 19 non-lipid-rich PanNETs show positive values. The signal intensity index is significantly higher in lipid-rich than in non-lipid-rich PanNETs (P = 0.004).
Fukukura Y et al . CT and MRI of Lipid-rich PanNETs
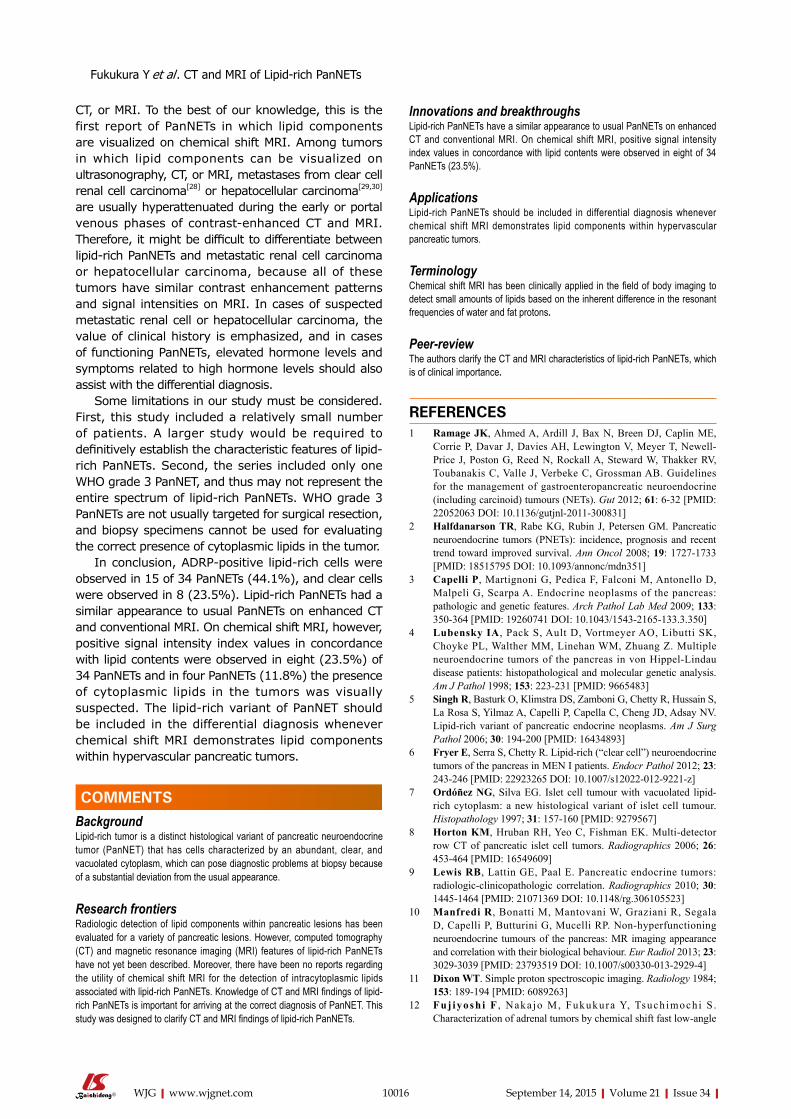
CT, or MRI. To the best of our knowledge, this is the first report of PanNETs in which lipid components are visualized on chemical shift MRI. Among tumors in which lipid components can be visualized on ultrasonography, CT, or MRI, metastases from clear cell renal cell carcinoma[28] or hepatocellular carcinoma[29,30] are usually hyperattenuated during the early or portal venous phases of contrast-enhanced CT and MRI. Therefore, it might be difficult to differentiate between lipid-rich PanNETs and metastatic renal cell carcinoma or hepatocellular carcinoma, because all of these tumors have similar contrast enhancement patterns and signal intensities on MRI. In cases of suspected metastatic renal cell or hepatocellular carcinoma, the value of clinical history is emphasized, and in cases of functioning PanNETs, elevated hormone levels and symptoms related to high hormone levels should also assist with the differential diagnosis.
Some limitations in our study must be considered. First, this study included a relatively small number of patients. A larger study would be required to definitively establish the characteristic features of lipid-rich PanNETs. Second, the series included only one WHO grade 3 PanNET, and thus may not represent the entire spectrum of lipid-rich PanNETs. WHO grade 3 PanNETs are not usually targeted for surgical resection, and biopsy specimens cannot be used for evaluating the correct presence of cytoplasmic lipids in the tumor.
In conclusion, ADRP-positive lipid-rich cells were observed in 15 of 34 PanNETs (44.1%), and clear cells were observed in 8 (23.5%). Lipid-rich PanNETs had a similar appearance to usual PanNETs on enhanced CT and conventional MRI. On chemical shift MRI, however, positive signal intensity index values in concordance with lipid contents were observed in eight (23.5%) of 34 PanNETs and in four PanNETs (11.8%) the presence of cytoplasmic lipids in the tumors was visually suspected. The lipid-rich variant of PanNET should be included in the differential diagnosis whenever chemical shift MRI demonstrates lipid components within hypervascular pancreatic tumors.
COMMENTSBackgroundLipid-rich tumor is a distinct histological variant of pancreatic neuroendocrine tumor (PanNET) that has cells characterized by an abundant, clear, and vacuolated cytoplasm, which can pose diagnostic problems at biopsy because of a substantial deviation from the usual appearance.
Research frontiersRadiologic detection of lipid components within pancreatic lesions has been evaluated for a variety of pancreatic lesions. However, computed tomography (CT) and magnetic resonance imaging (MRI) features of lipid-rich PanNETs have not yet been described. Moreover, there have been no reports regarding the utility of chemical shift MRI for the detection of intracytoplasmic lipids associated with lipid-rich PanNETs. Knowledge of CT and MRI findings of lipid-rich PanNETs is important for arriving at the correct diagnosis of PanNET. This study was designed to clarify CT and MRI findings of lipid-rich PanNETs.
Innovations and breakthroughsLipid-rich PanNETs have a similar appearance to usual PanNETs on enhanced CT and conventional MRI. On chemical shift MRI, positive signal intensity index values in concordance with lipid contents were observed in eight of 34 PanNETs (23.5%).
ApplicationsLipid-rich PanNETs should be included in differential diagnosis whenever chemical shift MRI demonstrates lipid components within hypervascular pancreatic tumors.
TerminologyChemical shift MRI has been clinically applied in the field of body imaging to detect small amounts of lipids based on the inherent difference in the resonant frequencies of water and fat protons.
Peer-reviewThe authors clarify the CT and MRI characteristics of lipid-rich PanNETs, which is of clinical importance.
REFERENCES1 Ramage JK, Ahmed A, Ardill J, Bax N, Breen DJ, Caplin ME,
Corrie P, Davar J, Davies AH, Lewington V, Meyer T, NewellPrice J, Poston G, Reed N, Rockall A, Steward W, Thakker RV, Toubanakis C, Valle J, Verbeke C, Grossman AB. Guidelines for the management of gastroenteropancreatic neuroendocrine (including carcinoid) tumours (NETs). Gut 2012; 61: 632 [PMID: 22052063 DOI: 10.1136/gutjnl2011300831]
2 Halfdanarson TR, Rabe KG, Rubin J, Petersen GM. Pancreatic neuroendocrine tumors (PNETs): incidence, prognosis and recent trend toward improved survival. Ann Oncol 2008; 19: 17271733 [PMID: 18515795 DOI: 10.1093/annonc/mdn351]
3 Capelli P, Martignoni G, Pedica F, Falconi M, Antonello D, Malpeli G, Scarpa A. Endocrine neoplasms of the pancreas: pathologic and genetic features. Arch Pathol Lab Med 2009; 133: 350364 [PMID: 19260741 DOI: 10.1043/15432165133.3.350]
4 Lubensky IA, Pack S, Ault D, Vortmeyer AO, Libutti SK, Choyke PL, Walther MM, Linehan WM, Zhuang Z. Multiple neuroendocrine tumors of the pancreas in von HippelLindau disease patients: histopathological and molecular genetic analysis. Am J Pathol 1998; 153: 223231 [PMID: 9665483]
5 Singh R, Basturk O, Klimstra DS, Zamboni G, Chetty R, Hussain S, La Rosa S, Yilmaz A, Capelli P, Capella C, Cheng JD, Adsay NV. Lipidrich variant of pancreatic endocrine neoplasms. Am J Surg Pathol 2006; 30: 194200 [PMID: 16434893]
6 Fryer E, Serra S, Chetty R. Lipidrich (“clear cell”) neuroendocrine tumors of the pancreas in MEN I patients. Endocr Pathol 2012; 23: 243246 [PMID: 22923265 DOI: 10.1007/s120220129221z]
7 Ordóñez NG, Silva EG. Islet cell tumour with vacuolated lipidrich cytoplasm: a new histological variant of islet cell tumour. Histopathology 1997; 31: 157160 [PMID: 9279567]
8 Horton KM, Hruban RH, Yeo C, Fishman EK. Multidetector row CT of pancreatic islet cell tumors. Radiographics 2006; 26: 453464 [PMID: 16549609]
9 Lewis RB, Lattin GE, Paal E. Pancreatic endocrine tumors: radiologicclinicopathologic correlation. Radiographics 2010; 30: 14451464 [PMID: 21071369 DOI: 10.1148/rg.306105523]
10 Manfredi R, Bonatti M, Mantovani W, Graziani R, Segala D, Capelli P, Butturini G, Mucelli RP. Nonhyperfunctioning neuroendocrine tumours of the pancreas: MR imaging appearance and correlation with their biological behaviour. Eur Radiol 2013; 23: 30293039 [PMID: 23793519 DOI: 10.1007/s0033001329294]
11 Dixon WT. Simple proton spectroscopic imaging. Radiology 1984; 153: 189194 [PMID: 6089263]
12 Fuj iyoshi F , Naka jo M, Fukukura Y, Tsuchimochi S . Characterization of adrenal tumors by chemical shift fast lowangle
10016 September 14, 2015|Volume 21|Issue 34|WJG|www.wjgnet.com
COMMENTS
Fukukura Y et al . CT and MRI of Lipid-rich PanNETs
shot MR imaging: comparison of four methods of quantitative evaluation. AJR Am J Roentgenol 2003; 180: 16491657 [PMID: 12760936]
13 Matsumoto S, Mori H, Miyake H, Takaki H, Maeda T, Yamada Y, Oga M. Uneven fatty replacement of the pancreas: evaluation with CT. Radiology 1995; 194: 453458 [PMID: 7824726]
14 Katz DS, Hines J, Math KR, Nardi PM, Mindelzun RE, Lane MJ. Using CT to reveal fatcontaining abnormalities of the pancreas. AJR Am J Roentgenol 1999; 172: 393396 [PMID: 9930790]
15 Kim HJ, Byun JH, Park SH, Shin YM, Kim PN, Ha HK, Lee MG. Focal fatty replacement of the pancreas: usefulness of chemical shift MRI. AJR Am J Roentgenol 2007; 188: 429432 [PMID: 17242252]
16 Fukukura Y, Inoue H, Miyazono N, Kajiya Y, Fujiyoshi F, Yano T, Sakoda K, Tanaka S, Aiko T, Nakajo M. Lymphoepithelial cysts of the pancreas: demonstration of lipid component using CT and MRI. J Comput Assist Tomogr 1998; 22: 311313 [PMID: 9530401]
17 Carucci LR, Siegelman ES, Feldman MD. Pancreatic metastasis from clear cell renal carcinoma: diagnosis with chemical shift MRI. J Comput Assist Tomogr 1999; 23: 934936 [PMID: 10589569]
18 Nishiofuku H, Marugami N, Tanaka T, Anai H, Maeda S, Masada T, Takano M, Mitoro A, Kichikawa K. Isolated fatcontaining pancreatic metastasis from hepatocellular carcinoma. Jpn J Radiol 2013; 31: 408411 [PMID: 23539254 DOI: 10.1007/s1160401301939]
19 Klimstra DS, Arnold R, Capella C, Hrunan RH, Klöppel G. Neuroendocrine neoplasms of the pancreas. In: Bosman FT, Carneiro F, Hruban RH, Theise ND, editors. WHO classification of tumours of the digestive system. Lyon: IARC, 2010: 322326
20 Rindi G, Klöppel G, Alhman H, Caplin M, Couvelard A, de Herder WW, Erikssson B, Falchetti A, Falconi M, Komminoth P, Körner M, Lopes JM, McNicol AM, Nilsson O, Perren A, Scarpa A, Scoazec JY, Wiedenmann B. TNM staging of foregut (neuro)endocrine tumors: a consensus proposal including a grading system. Virchows Arch 2006; 449: 395401 [PMID: 16967267]
21 Lu DS, Reber HA, Krasny RM, Kadell BM, Sayre J. Local staging of pancreatic cancer: criteria for unresectability of major vessels as revealed by pancreaticphase, thinsection helical CT. AJR Am J Roentgenol 1997; 168: 14391443 [PMID: 9168704]
22 Roche CJ, Hughes ML, Garvey CJ, Campbell F, White DA, Jones L, Neoptolemos JP. CT and pathologic assessment of prospective
nodal staging in patients with ductal adenocarcinoma of the head of the pancreas. AJR Am J Roentgenol 2003; 180: 475480 [PMID: 12540455]
23 Landis JR, Koch GG. An application of hierarchical kappatype statistics in the assessment of majority agreement among multiple observers. Biometrics 1977; 33: 363374 [PMID: 884196]
24 Mak KM, Ren C, Ponomarenko A, Cao Q, Lieber CS. Adipose differentiationrelated protein is a reliable lipid droplet marker in alcoholic fatty liver of rats. Alcohol Clin Exp Res 2008; 32: 683689 [PMID: 18341646 DOI: 10.1111/j.15300277.2008.00624.x]
25 Imai Y, Varela GM, Jackson MB, Graham MJ, Crooke RM, Ahima RS. Reduction of hepatosteatosis and lipid levels by an adipose differentiationrelated protein antisense oligonucleotide. Gastroenterology 2007; 132: 19471954 [PMID: 17484887]
26 Schindera ST, Soher BJ, Delong DM, Dale BM, Merkle EM. Effect of echo time pair selection on quantitative analysis for adrenal tumor characterization with inphase and opposedphase MR imaging: initial experience. Radiology 2008; 248: 140147 [PMID: 18566172 DOI: 10.1148/radiol.2481071069]
27 Marin D, Soher BJ, Dale BM, Boll DT, Youngblood RS, Merkle EM. Characterization of adrenal lesions: comparison of 2D and 3D dual gradientecho MR imaging at 3 Tpreliminary results. Radiology 2010; 254: 179187 [PMID: 20032151 DOI: 10.1148/radiol.09090486]
28 Ng CS, Loyer EM, Iyer RB, David CL, DuBrow RA, Charnsangavej C. Metastases to the pancreas from renal cell carcinoma: findings on threephase contrastenhanced helical CT. AJR Am J Roentgenol 1999; 172: 15551559 [PMID: 10350288]
29 Choi BI, Han JK, Cho JM, Choi DS, Han MC, Lee HS, Kim CY. Characterization of focal hepatic tumors. Value of twophase scanning with spiral computed tomography. Cancer 1995; 76: 24342442 [PMID: 8625068]
30 Luca A, Caruso S, Milazzo M, Mamone G, Marrone G, Miraglia R, Maruzzelli L, Carollo V, Minervini MI, Vizzini G, Gruttadauria S, Gridelli B. Multidetectorrow computed tomography (MDCT) for the diagnosis of hepatocellular carcinoma in cirrhotic candidates for liver transplantation: prevalence of radiological vascular patterns and histological correlation with liver explants. Eur Radiol 2010; 20: 898907 [PMID: 19802612 DOI: 10.1007/s0033000916220]
P- Reviewer: Shen J, Storto G S- Editor: Yu J L- Editor: Rutherford A E- Editor: Ma S
10017 September 14, 2015|Volume 21|Issue 34|WJG|www.wjgnet.com
Fukukura Y et al . CT and MRI of Lipid-rich PanNETs
10018 September 14, 2015|Volume 21|Issue 34|WJG|www.wjgnet.com
ORIGINAL ARTICLE
Birger Michael Breum, Thomas Kirkegaard, Tyge Nordentoft, Department of Surgical Gastroenterology 360, Hvidovre University Hospital, DK-2650 Hvidovre, Denmark
Bo Rud, Department of Surgery K, Bispebjerg University Hospital, Bispebjerg Bakke 23, DK-2400 Copenhagen NV, Denmark
Author contributions: Nordentoft T conceived the original idea; Breum BM designed research and programming; Breum BM, Kirkegaard T and Nordentoft T performed research; Rud B analyzed data; Breum BM, Rud B and Nordentoft T wrote the paper; Breum BM, Rud B, Kirkegaard T and Nordentoft T all revised and approved the paper.
Institutional review board statement: The study design was presented to the local research ethics committee before study start. The committee did not consider a formal assessment procedure necessary.
Clinical trial registration statement: Not an intervention study, no registration needed at the time.
Informed consent statement: Verbal informed consent was obtained from patients prior to inclusion.
Conflict-of-interest statement: None.
Data sharing statement: No additional data available, except raw data. Consent was not obtained for data sharing.
Open-Access: This article is an open-access article which was selected by an in-house editor and fully peer-reviewed by external reviewers. It is distributed in accordance with the Creative Commons Attribution Non Commercial (CC BY-NC 4.0) license, which permits others to distribute, remix, adapt, build upon this work non-commercially, and license their derivative works on different terms, provided the original work is properly cited and the use is non-commercial. See: http://creativecommons.org/licenses/by-nc/4.0/
Correspondence to: Birger Michael Breum, MD, Department of Surgical Gastroenterology 360, Hvidovre University Hospital, DK-2650 Hvidovre, Denmark. [email protected]: +45-38-622108Fax: +45-38-623797
Received: October 5, 2014Peer-review started: October 6, 2014First decision: October 29, 2014Revised: March 16, 2015Accepted: April 9, 2015Article in press: April 9, 2015Published online: September 14, 2015
AbstractAIM: To investigate the accuracy and inter-observer variation of bowel sound assessment in patients with clinically suspected bowel obstruction.
METHODS: Bowel sounds were recorded in patients with suspected bowel obstruction using a Littmann® Electronic Stethoscope. The recordings were pro-cessed to yield 25-s sound sequences in random order on PCs. Observers, recruited from doctors within the department, classified the sound sequences as either normal or pathological. The reference tests for bowel obstruction were intraoperative and endoscopic findings and clinical follow up. Sensitivity and specificity were calculated for each observer and compared between junior and senior doctors. Interobserver variation was measured using the Kappa statistic.
RESULTS: Bowel sound sequences from 98 patients were assessed by 53 (33 junior and 20 senior) doctors. Laparotomy was performed in 47 patients, 35 of whom had bowel obstruction. Two patients underwent colorectal stenting due to large bowel obstruction. The median sensitivity and specificity was 0.42 (range: 0.19-0.64) and 0.78 (range: 0.35-0.98), respectively. There was no significant difference in accuracy between junior and senior doctors. The median fre-quency with which doctors classified bowel sounds as abnormal did not differ significantly between patients with and without bowel obstruction (26% vs 23%, P = 0.08). The 53 doctors made up 1378 unique pairs and the median Kappa value was 0.29 (range: -0.15-0.66).
Prospective Study
Accuracy of abdominal auscultation for bowel obstruction
Birger Michael Breum, Bo Rud, Thomas Kirkegaard, Tyge Nordentoft
Submit a Manuscript: http://www.wjgnet.com/esps/Help Desk: http://www.wjgnet.com/esps/helpdesk.aspxDOI: 10.3748/wjg.v21.i34.10018
World J Gastroenterol 2015 September 14; 21(34): 10018-10024 ISSN 1007-9327 (print) ISSN 2219-2840 (online)
© 2015 Baishideng Publishing Group Inc. All rights reserved.
Breum BM et al . Accuracy of abdominal auscultation for bowel obstruction
10019 September 14, 2015|Volume 21|Issue 34|WJG|www.wjgnet.com
CONCLUSION: Accuracy and inter-observer agree-ment was generally low. Clinical decisions in patients with possible bowel obstruction should not be based on auscultatory assessment of bowel sounds.
Key words: Bowel obstruction; Auscultation; Bowel sounds; Diagnostic test; Accuracy; Observer variation; Multi-observer; Prospective
© The Author(s) 2015. Published by Baishideng Publishing Group Inc. All rights reserved.
Core tip: Abdominal auscultation is often used in clinical practice when bowel obstruction is suspected; the usefulness is poorly documented. Early diagnosis and treatment of bowel obstruction is imperative to reduce the risk of intestinal strangulation, necrosis and perforation. Clinicians must know which components to focus on in the physical examination. The present study shows a generally low accuracy and inter-observer agreement when recorded bowel sounds from 98 patients were assessed by 53 doctors. No difference in accuracy was observed between junior and senior doctors. Clinical decisions in patients with possible bowel obstruction should not depend on auscultatory assessment of bowel sounds.
Breum BM, Rud B, Kirkegaard T, Nordentoft T. Accuracy of abdominal auscultation for bowel obstruction. World J Gastroenterol 2015; 21(34): 10018-10024 Available from: URL: http://www.wjgnet.com/1007-9327/full/v21/i34/10018.htm DOI: http://dx.doi.org/10.3748/wjg.v21.i34.10018
INTRODUCTIONBowel obstruction is a common emergency condition in abdominal surgery[1]. The risk of complications of bowel obstruction such as intestinal strangulation, necrosis and perforation are reported to be as high as 5%-16%[2,3]. Early diagnosis and treatment of bowel obstruction are imperative in reducing these risks. Because of the need for prompt and reliable assessment of patients suspected of having bowel obstruction, clinicians must know which components to focus on in the history and the physical examination. Auscultation of bowel sounds is a quick and low-cost examination, and has been used for more than 150 years to assess various abdominal conditions[4]. Contemporary textbooks often state that hyperactive, tinkling, metallic or high-pitched bowel sounds are characteristic clinical findings in patients with bowel obstruction[5-8], but the evidence supporting the clinical utility of these findings is sparse. Two prospective studies in patients with acute abdominal pain found that increased[9] or abnormal[10] bowel sounds were independent markers of bowel obstruction. However, these studies did not assess the influence
of observer variation in bowel sound assessments. In clinical practice, the description and assessment of bowel sounds is often vague and inconclusive[11]. Hence, previous studies have demonstrated low to moderate inter-observer agreement for bowel sound assessment[12-16].
Had abdominal auscultation not been such a cheap investigation, it would probably not have survived for more than 150 years[4]-given the very limited documentation of its clinical value.
The aim of this study was to investigate the accuracy and inter-observer agreement for bowel sound assessment in patients suspected of intestinal obstruction.
MATERIALS AND METHODSPatients aged 16 years or older admitted with suspected intestinal obstruction or constipation to the Department of Surgery, Hvidovre University Hospital, Denmark were included. No exclusion criteria were considered relevant. Within 24 h of admission, bowel sounds were recorded by one of the authors using a 3M Littmann® Electronic Model 3000 Stethoscope. The stethoscope can record six sound sequences, each of eight seconds duration. The recording is continuous and the final eight seconds of each sequence are saved once the recording is stopped.
The protocol for recording bowel sounds was as follows: the abdomen was auscultated in quadrants until bowel sounds were heard in any quadrant. Six sound sequences of eight seconds were then recorded in this quadrant.
Sound preparation For each patient, three of the six sound sequences considered superior in respect of volume and noise were selected by one of the authors (BB), who was blinded to the patient data. These three sequences were then joined into a single sound sequence lasting 25 s, with half a second pause between the three sequences. The duration of the joined sequences was assessed as being representative of the time taken to perform auscultation in clinical practice. Because the native file format of the stethoscope is not directly playable on a regular PC, the files were converted into playable .wav files.
Hence, for each patient a 25 s sound sequence was created and used for assessment.
Sound assessmentFollowing acquisition of this data, all doctors working in the department from November 2007 to November 2008 were invited to evaluate the bowel sounds as described below. In order to evaluate the impact of experience, doctors were divided into junior and senior groups. Consultants and senior registrars were considered seniors. A website was designed (English
10020 September 14, 2015|Volume 21|Issue 34|WJG|www.wjgnet.com
version available at http://www.bowel-sounds.com) where the participating doctors accessed and evaluated the bowel sounds. Each participating doctor received a personal log-on to the website and the sound files were arranged in a randomized order unique to the log-on.
In order to achieve uniformity in respect of the listening environment, doctors were instructed to use headphones (supplied) during their evaluation.
After each bowel sound sequence, doctors were asked to evaluate whether the sound sequence was either pathological or normal. The sequence was repeated until it was evaluated. It was possible to listen to all the sound sequences in a row or to log in at a later date and listen to the remaining sequences. Evaluations could not be revised once complete.
Doctors were considered to be included in the study when they logged-in to the study website for the first time. Doctors were considered excluded if they did not evaluate all sounds.
Outcome assessmentThe final diagnosis for each patient was extracted from medical records six months after recording of the bowel sounds. Bowel obstruction was defined in three ways: (1) based on laparotomy findings; (2) endoscopic therapy with attempted or successful colorectal stenting; and (3) bowel obstruction found at autopsy. The discharge diagnoses were extracted for patients who recovered without laparotomy or stenting, and in patients who died from causes other than bowel obstruction.
Statistical analysisTo determine accuracy, sensitivity, specificity, positive predictive value and negative predictive value were calculated for each doctor’s bowel sound assessments (pathological or normal sounds vs bowel obstruction or no bowel obstruction).
Median, quartiles and range were used to describe the distribution of accuracy estimates across doctors. Cochran’s test for equality of proportions in matched samples was used to assess homogeneity between doctor’s frequencies of finding pathological bowel sounds assessments[17].
Accuracy between junior and senior doctors was compared in order to determine the influence of experience. For this analysis the diagnostic odds ratio (DOR) was used as a single measure of accuracy[18]. The DOR is calculated as (tp × tn)/(fn × fp), where tp, tn, fn, fp is the number of patients with true-positive, true-negative, false-negative and false-positive bowel sound assessments, respectively.
A paired t-test was used to compare mean values of DOR between junior and senior doctors, and the Mann-Whitney U-test was used to compare across doctors the median proportion with pathological bowel sounds between patients with and without bowel obstruction.
Inter-observer agreement was assessed using the Kappa statistic (k), which is calculated as observed agreement (po) beyond chance agreement (pc) divided by perfect agreement beyond chance agreement: Κ = (po-pc)/(1-pc). In the common interpretation, Kappa is a measure of inter-observer agreement adjusted for chance agreement. Landis and Koch have proposed the following classification of k values[19]: less than zero signifies poor agreement, 0-0.20 slight agreement, 0.21-0.40 fair agreement, 0.41-0.60 moderate agreement, 0.61-0.80 substantial agreement and 0.81-1 excellent agreement. k was calculated for all possible pairs of doctors, and for pairs of junior as well as senior doctors. The resulting distributions of Kappa values were described by median, quartiles and range. Due to the influence of prevalence on the Kappa estimate, no tests of statistical significance were performed as part of the sensitivity analyses for inter-observer agreement. All analyses were performed using STATA 9 software.
EthicsThe study design was presented to the local research ethics committee before study start. The committee did not consider a formal assessment procedure necessary. Verbal informed consent was obtained from patients prior to inclusion.
RESULTSBowel sounds from 102 patients were recorded between October 2005 and September 2006. Four patients were excluded: The final diagnoses were missing in three patients because insufficient data was registered to identify the patients’ files, and in one case bowel sounds were recorded after surgery. Therefore, the analyses are limited to 98 patients. Of these patients, the median age was 66 years (range: 19-96 years) and 53 were women. Between November 2007 and October 2008 fifty-four doctors were included in the study, of these 34 were junior and 20 were senior doctors. One junior doctor was subsequently excluded due to incomplete assessment of all the bowel sound sequences.
Forty-seven patients underwent laparotomy and 35 had intraoperative findings consistent with bowel obstruction. 20 patients had small bowel obstruction and 15 large bowel obstruction. In addition, two patients underwent colorectal stenting due to large bowel obstruction. No findings of bowel obstruction were revealed on autopsy. Laparotomies and endo-scopies were performed within two days of the bowel sound recordings in 46 patients (94%) and within five days in the remaining three patients. Discharge diagnoses in patients without bowel obstruction are summarized in Table 1.
AccuracyThe proportion of patients in which doctors evaluated
Breum BM et al . Accuracy of abdominal auscultation for bowel obstruction
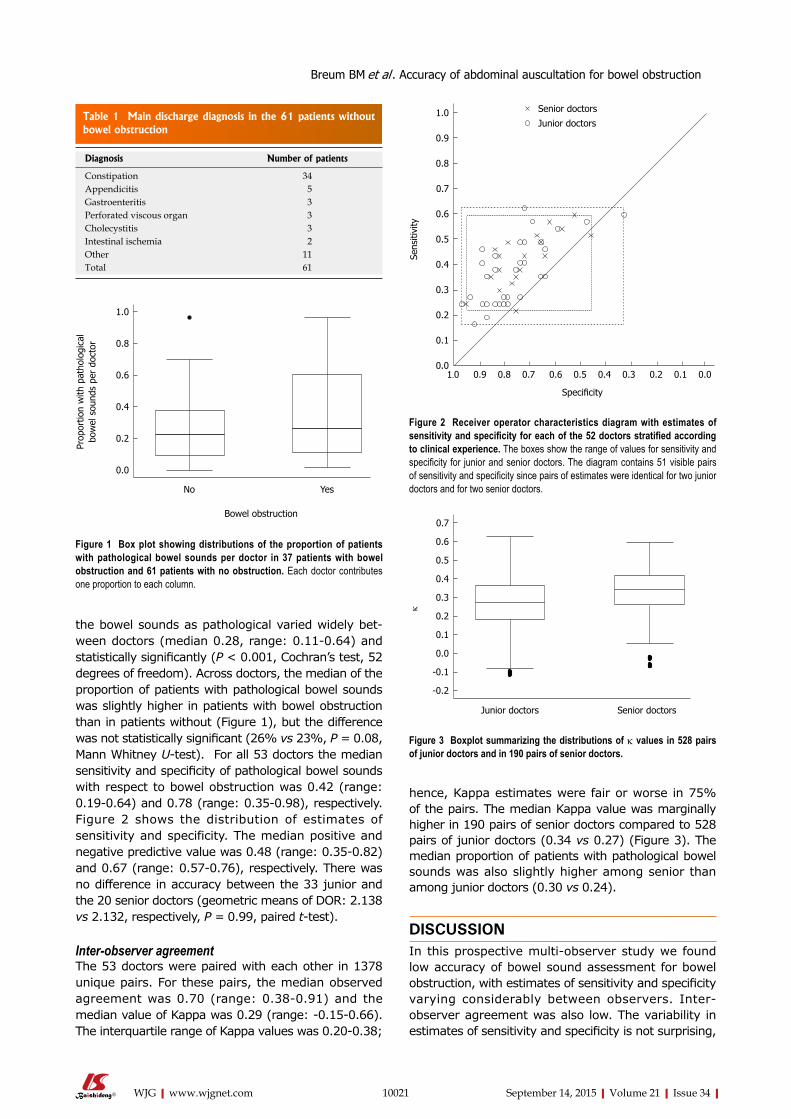
Table 1 Main discharge diagnosis in the 61 patients without bowel obstruction
10021 September 14, 2015|Volume 21|Issue 34|WJG|www.wjgnet.com
the bowel sounds as pathological varied widely bet-ween doctors (median 0.28, range: 0.11-0.64) and statistically significantly (p < 0.001, Cochran’s test, 52 degrees of freedom). Across doctors, the median of the proportion of patients with pathological bowel sounds was slightly higher in patients with bowel obstruction than in patients without (Figure 1), but the difference was not statistically significant (26% vs 23%, p = 0.08, Mann Whitney U-test). For all 53 doctors the median sensitivity and specificity of pathological bowel sounds with respect to bowel obstruction was 0.42 (range: 0.19-0.64) and 0.78 (range: 0.35-0.98), respectively. Figure 2 shows the distribution of estimates of sensitivity and specificity. The median positive and negative predictive value was 0.48 (range: 0.35-0.82) and 0.67 (range: 0.57-0.76), respectively. There was no difference in accuracy between the 33 junior and the 20 senior doctors (geometric means of DOR: 2.138 vs 2.132, respectively, p = 0.99, paired t-test).
Inter-observer agreementThe 53 doctors were paired with each other in 1378 unique pairs. For these pairs, the median observed agreement was 0.70 (range: 0.38-0.91) and the median value of Kappa was 0.29 (range: -0.15-0.66). The interquartile range of Kappa values was 0.20-0.38;
hence, Kappa estimates were fair or worse in 75% of the pairs. The median Kappa value was marginally higher in 190 pairs of senior doctors compared to 528 pairs of junior doctors (0.34 vs 0.27) (Figure 3). The median proportion of patients with pathological bowel sounds was also slightly higher among senior than among junior doctors (0.30 vs 0.24).
DISCUSSIONIn this prospective multi-observer study we found low accuracy of bowel sound assessment for bowel obstruction, with estimates of sensitivity and specificity varying considerably between observers. Inter-observer agreement was also low. The variability in estimates of sensitivity and specificity is not surprising,
Diagnosis Number of patients
Constipation 34Appendicitis 5Gastroenteritis 3Perforated viscous organ 3Cholecystitis 3Intestinal ischemia 2Other 11Total 61
1.0
0.8
0.6
0.4
0.2
0.0
Prop
ortio
n w
ith p
atho
logi
cal
bow
el s
ound
s pe
r do
ctor
No Yes
Bowel obstruction
Figure 1 Box plot showing distributions of the proportion of patients with pathological bowel sounds per doctor in 37 patients with bowel obstruction and 61 patients with no obstruction. Each doctor contributes one proportion to each column.
0.7
0.6
0.5
0.4
0.3
0.2
0.1
0.0
-0.1
-0.2
k
Junior doctors Senior doctors
Figure 2 Receiver operator characteristics diagram with estimates of sensitivity and specificity for each of the 52 doctors stratified according to clinical experience. The boxes show the range of values for sensitivity and specificity for junior and senior doctors. The diagram contains 51 visible pairs of sensitivity and specificity since pairs of estimates were identical for two junior doctors and for two senior doctors.
Figure 3 Boxplot summarizing the distributions of k values in 528 pairs of junior doctors and in 190 pairs of senior doctors.
1.0
0.9
0.8
0.7
0.6
0.5
0.4
0.3
0.2
0.1
0.0
Sens
itivi
ty
1.0 0.9 0.8 0.7 0.6 0.5 0.4 0.3 0.2 0.1 0.0
Specificity
Senior doctors
Junior doctors
Breum BM et al . Accuracy of abdominal auscultation for bowel obstruction
10022 September 14, 2015|Volume 21|Issue 34|WJG|www.wjgnet.com
since there is no validated classification of bowel sounds. The variation in the proportion of patients with pathological sounds across doctors indicates that the threshold of abnormality varied between observers. Some of this variation could be due to observers focusing on different qualitative aspects of the sounds (high pitched, metallic tinkling, roaring, loud etc.). A liberal threshold (i.e., a higher proportion with pathological sounds) will lead to higher sensitivity and lower specificity, whereas a more stringent threshold will lead to lower sensitivity and higher specificity.
Variation in threshold for abnormality is probably also an important factor in explaining the poor inter-observer agreement. Observer agreement was slightly higher between senior than between junior doctors (Kappa: 0.34 vs 0.27). However, comparison of Kappa values is challenging, because Kappa varies with the prevalence of abnormality[20]. Hence, a part of the difference is accounted for by the higher median frequency of pathological assessments among senior doctors. Previous studies of inter-observer variation in bowel sound assessment have reported moderate or low Kappa values[12,14,15], but none of these values are directly comparable to ours. For comparison, studies on inter-observer agreement for heart and lung auscultation have found mean Kappa values of -0.02-0.55 for findings such as systolic murmurs, bronchial breath sounds and prolonged expiration[21,22].
Three previous studies have reported accuracy estimates for the clinical assessment of bowel sounds in patients with possible bowel obstruction. In a study similar to the present study, Gu et al[14] presented 20 physicians with 60-s sequences of digitally recorded bowel sounds from 20 healthy volunteers, nine patients with ileus and seven patients with bowel obstruction. The average proportion of correctly identified sound sequences from patients with bowel obstruction was 0.42, which is similar to the median sensitivity (0.42) in our study. No estimate of average specificity was reported by Gu et al[14]. In another study, 100 physicians were presented with 60-s sequences of bowel sounds from four healthy volunteers and eight emergency patients from the surgical ward[13]. Digitally recorded bowel sounds were played on a hearing aid loudspeaker in a wooden dummy with a linoleum covering. Physicians auscultated the covering and evaluated bowel sounds as either normal or pathological. In six patients with bowel obstruction and the four volunteers, average sensitivity and specificity were 64% and 72%, respectively. Compared with our results, sensitivity was substantially higher and specificity slightly lower. However, accuracy is generally higher in studies with separate sampling of cases and healthy controls than in cohort studies, such as ours, that include grey-zone patients with clinical findings that mimic the condition of interest[23]. In the third study, information from history and clinical examination was recorded prospectively in 1254 patients presenting with acute abdominal pain[9]. The prevalence of bowel
obstruction was 4%, and sensitivity and specificity of increased bowel sounds were 40% and 89%, respectively. Again, sensitivity is close to the median sensitivity in the present study, whereas specificity is higher than our median specificity (0.78). However, improved performance is unsurprising since the observers were aware of other markers of bowel obstruction such as distended abdomen, history of vomiting, and previous surgery. This knowledge is likely to be incorporated in the assessment of the bowel sounds and improve accuracy[24].
A recent study into evaluation of bowel sounds found inter-observer agreement among physicians which was slight to fair; however, this study involved only four healthy volunteers and eight emergency patients from a surgical gastroenterological ward[16].
The main strengths of the present study lie in the high number of both patients and observers, the prospective cohort design and the use of digital bowel sound recorded from a relevant study population in a typical clinical setting. These recordings ensured that all observers assessed exactly the same bowel sounds and eliminated assessment bias from other clinical findings. It could be argued that our model is poorly representative of the clinical situation because the length of the sound sequences was too short, because auscultation was limited to a single abdominal quadrant and because the bowel sounds were selected and processed to reduce noise artefacts before presentation to the observers. Pathological bowel sounds could be missed during the relatively short sound sequences, particularly in patients with bowel obstruction of longer duration, where bowel sounds may occur less frequently[8]. Hence, the short duration of the sound sequences may explain the generally low sensitivity. On the other hand, in the study by Gu et al[14] referred to above, average sensitivity was comparable to ours, although the length of the sound sequences was more than twice as long (25 s vs 60 s). Thus, the low sensitivity in our study is not necessarily attributable to the length of the sound sequences. Auscultation was limited to a single quadrant, which appears to be equivalent to auscultating all four abdominal quadrants[25]. Lastly, by selecting and processing the bowel sound recordings to improve the signal to noise ratio we may have introduced a bias that exaggerates accuracy and observer agreement. However, processing was minimal, so the potential overestimation, if such exists, is small.
The results of the present study question the usefulness of abdominal auscultation in patients with suspected bowel obstruction. Likewise, a recent study of spectral analysis of bowel sounds recorded with an electronic stethoscope in patients with possible bowel obstruction concluded that auscultation of bowel sounds is non-specific and of limited significance in diagnosing bowel obstruction[26]. We are aware of no systematic account of surgeons use of bowel sound assessment in patients with suspected bowel obstruction. In
Breum BM et al . Accuracy of abdominal auscultation for bowel obstruction
10023 September 14, 2015|Volume 21|Issue 34|WJG|www.wjgnet.com
our experience, some surgeons incorporate bowel sound assessment in their clinical evaluation of such patients, others do not. Furthermore, textbooks state that abnormal bowel sounds are characteristic findings in patients with bowel obstruction and medical students are trained in abdominal auscultation. Our results indicate that assessment of bowel sounds is subjective and inaccurate. Thus, the tradition for bowel sound assessment in patients with suspected bowel obstruction is not supported by our results.
Only obstructive bowel disease was assessed and not, e.g., paralytic ileus or other conditions. No repeated assessments on the same patients were performed, to reveal pathology if there was a change in bowel sounds over time.
The present study does not examine the possibility of improvements by training. There is a possibility that the diagnostic value increases with the addition of patient history and other findings.
In conclusion, the accuracy and inter-observer agreement of bowel sound assessment in patients with possible bowel obstruction was low in both senior and junior doctors in a surgical department. Clinical decisions in patients with possible bowel obstruction should not be based on auscultatory assessment of bowel sounds.
COMMENTSBackgroundAbdominal auscultation is regularly used when bowel obstruction is suspected, but its usefulness is poorly documented.
Research frontiersCorrelation between abdominal auscultation and bowel obstruction has been reported, but the extent of the clinical value has not.
Innovations and breakthroughsImaging technologies are continuously improved. Since abdominal auscultaton is useless it should be abandoned in countries with access to imaging technologies.
Applications Since abdominal auscultation is useless, it should be abandoned in order to avoid delayed diagnosis or even misjudgement of patients with suspected bowel obstruction.
TerminologyAbdominal auscultation has no validated terminology. The authors chose to use broad terms “pathological” and “normal” and let each observer decide what constitutes pathological.
Peer-reviewOnly obstructive bowel disease was assessed and not e.g., paralytic ileus or other conditions. No repeated assessments on the same patients were performed, to reveal pathology if there is a change in bowel sounds over time. The present study does not examine the possibility of improvements by training. There is a possibility that the diagnostic value increases with the addition of patient history and other findings.
REFERENCES1 Irvin TT. Abdominal pain: a surgical audit of 1190 emergency
admissions. Br J Surg 1989; 76: 1121-1125 [PMID: 2597964 DOI: 10.1002/bjs.1800761105]
2 Fevang BT, Fevang J, Stangeland L, Soreide O, Svanes K, Viste A. Complications and death after surgical treatment of small bowel obstruction: A 35-year institutional experience. Ann Surg 2000; 231: 529-537 [PMID: 10749614 DOI: 10.1097/00000658-200004000-00012]
3 Markogiannakis H, Messaris E, Dardamanis D, Pararas N, Tzertzemelis D, Giannopoulos P, Larentzakis A, Lagoudianakis E, Manouras A, Bramis I. Acute mechanical bowel obstruction: clinical presentation, etiology, management and outcome. World J Gastroenterol 2007; 13: 432-437 [PMID: 17230614 DOI: 10.3748/wjg.v13.i3.432]
4 Hooker C. An Essay on Intestinal Auscultation. Boston Med Surg J 1849; 1439-1440
5 Chang GJ, Shelton AA, Welton ML. Current Diagnosis & Treatment Surgery. 13th ed. In: Doherty G, editor. McGraw Hill Professional, 2009: 647-697. Available from: URL: http://books.google.com/books?id=a14yDQKv4vMC&pgis=1
6 Houghton SG, De la Medina AR, Sarr MG. Maingot’s Abdominal Operations. 11th ed. In: Zinner M, Ashley SW, editors. New York: McGraw-Hill, 2007: 479-507. Available from: URL: http://books.google.com/books?id=EanJv7mvip0C&pgis=1
7 Tavakkolizadeh A, Whang EE, Ashley SW, Zinner MJ. Schwartz’s Principles of Surgery. 9th ed. In: Brunicardi F, Andersen D, Billiar T, Dunn D, Hunter J, Matthews J, editors. McGraw Hill Professional, 2009: 979-1012. Available from: URL:http://books.google.com/books?id=zGVIyHiqL5wC&pgis=1
8 Welch JP . General considerations and mortality. Bowel obstruction: differential diagnosis and clinical management. 1th ed. W.B. Saunders Company, 1990: 59-95. Available from: URL:http://books.google.com/books?id=YBxsAAAAMAAJ&pgis=1
9 Böhner H, Yang Q, Franke C, Verreet PR, Ohmann C. Simple data from history and physical examination help to exclude bowel obstruction and to avoid radiographic studies in patients with acute abdominal pain. Eur J Surg 1998; 164: 777-784 [PMID: 9840308 DOI: 10.1080/1102415987500054359]
10 Eskelinen M, Ikonen J, Lipponen P. Contributions of history-taking, physical examination, and computer assistance to diagnosis of acute small-bowel obstruction. A prospective study of 1333 patients with acute abdominal pain. Scand J Gastroenterol 1994; 29: 715-721 [PMID: 7973431 DOI: 10.3109/00365529409092499]
11 Dombal FT De. The physical examination revisited. Diagnosis of acute abdominal pain. 2nd ed. Churchill Livingstone; 1991; 47-62. Available from: URL: http://books.google.com/books?id=IXhsAAAAMAAJ&pgis=1
12 Bjerregaard B, Brynitz S, Holst-Christensen J, Jess P, Kalaja E, Lund-Kristensen J, Thomsen C. The reliability of medical history and physical examination in patients with acute abdominal pain. Methods Inf Med 1983; 22: 15-18 [PMID: 6339868]
13 Gade J , Kruse P, Andersen OT, Pedersen SB, Boesby S. Physicians’ abdominal auscultation. A multi-rater agreement study. Scand J Gastroenterol 1998; 33: 773-777 [PMID: 9712245]
14 Gu Y, Lim HJ, Moser MA. How useful are bowel sounds in assessing the abdomen? Dig Surg 2010; 27: 422-426 [PMID: 20948217 DOI: 10.1159/000319372]
15 Yen K, Karpas A, Pinkerton HJ, Gorelick MH. Interexaminer reliability in physical examination of pediatric patients with abdominal pain. Arch Pediatr Adolesc Med 2005; 159: 373-376 [PMID: 15809393 DOI: 10.1001/archpedi.159.4.373]
16 Durup-Dickenson M, Christensen MK, Gade J. Abdominal auscultation does not provide clear clinical diagnoses. Dan Med J 2013; 60: A4620 [PMID: 23673260]
17 Fleiss JL, Levin B, Myunghee CP. The Analysis of Data from Matched Samples. Statistical Methods for Rates and Proportions.
COMMENTS
Breum BM et al . Accuracy of abdominal auscultation for bowel obstruction
10024 September 14, 2015|Volume 21|Issue 34|WJG|www.wjgnet.com
3th ed. New York: Wiley, 2003: 373-406. Available from: URL:http://books.google.com/books?id=a5LwdxF2d10C&pgis=1 [DOI: 10.1002/0471445428.ch13]
18 Glas AS, Lijmer JG, Prins MH, Bonsel GJ, Bossuyt PM. The diagnostic odds ratio: a single indicator of test performance. J Clin Epidemiol 2003; 56: 1129-1135 [PMID: 14615004 DOI: 10.1016/S0895-4356(03)00177-X]
19 Landis JR, Koch GG. The measurement of observer agreement for categorical data. Biometrics 1977; 33: 159-174 [PMID: 843571]
20 Gjørup T. The kappa coefficient and the prevalence of a diagnosis. Methods Inf Med 1988; 27: 184-186 [PMID: 3226333]
21 Iversen K, Greibe R, Timm HB, Skovgaard LT, Dalsgaard M, Hendriksen KV, Hrobjartsson A. A randomized trial comparing electronic and conventional stethoscopes. Am J Med 2005; 118: 1289 [PMID: 16271920 DOI: 10.1016/j.amjmed.2005.06.016]
22 Iversen K, Søgaard Teisner A, Dalsgaard M, Greibe R, Timm HB, Skovgaard LT, Hróbjartsson A, Copenhagen O, Copenhagen S, Copenhagen K. Effect of teaching and type of stethoscope on
cardiac auscultatory performance. Am Heart J 2006; 152: 85.e1-85.e7 [PMID: 16824835]
23 Lijmer JG, Mol BW, Heisterkamp S, Bonsel GJ, Prins MH, van der Meulen JH, Bossuyt PM. Empirical evidence of design-related bias in studies of diagnostic tests. JAMA 1999; 282: 1061-1066 [PMID: 10493205 DOI: 10.1001/jama.282.11.1061]
24 Loy CT, Irwig L. Accuracy of diagnostic tests read with and without clinical information: a systematic review. JAMA 2004; 292: 1602-1609 [PMID: 15467063 DOI: 10.1001/jama.292.13.1602]
25 Hepburn MJ, Dooley DP, Fraser SL, Purcell BK, Ferguson TM, Horvath LL. An examination of the transmissibility and clinical utility of auscultation of bowel sounds in all four abdominal quadrants. J Clin Gastroenterol 2004; 38: 298-299 [PMID: 15128083 DOI: 10.1097/00004836-200403000-00022]
26 Ching SS, Tan YK. Spectral analysis of bowel sounds in intestinal obstruction using an electronic stethoscope. World J Gastroenterol 2012; 18: 4585-4592 [PMID: 22969233 DOI: 10.3748/wjg.v18.i33.4585]
P- Reviewer: Decorti G, Grundmann O, Sadik R S- Editor: Ma YJ L- Editor: Logan S E- Editor: Liu XM
Breum BM et al . Accuracy of abdominal auscultation for bowel obstruction
10025 September 14, 2015|Volume 21|Issue 34|WJG|www.wjgnet.com
Jia-Jun Zhao, Di Wang, Hui Yao, Da-Wei Sun, Hong-Yu Li, Department of Gastroenterology, the General Hospital of Shenyang Military Region, Shenyang 110016, Liaoning Province, China
Author contributions: Zhao JJ and Wang D performed the majority of experiments; Yao H provided vital reagents and analytical tools and were also involved in editing the manuscript; Sun DW co-ordinated and provided the collection of all the human material in addition to providing financial support for this work; Li HY designed the study and wrote the manuscript.
Conflict-of-interest statement: The declaration of the authors reveals that they have not received any financial payments or other benefits from any commercial entity associated with the subject of this article.
Data sharing statement: No additional data are available.
Open-Access: This article is an open-access article which was selected by an in-house editor and fully peer-reviewed by external reviewers. It is distributed in accordance with the Creative Commons Attribution Non Commercial (CC BY-NC 4.0) license, which permits others to distribute, remix, adapt, build upon this work non-commercially, and license their derivative works on different terms, provided the original work is properly cited and the use is non-commercial. See: http://creativecommons.org/licenses/by-nc/4.0/
Correspondence to: Dr. Hong-Yu Li, Department of Gastroenterology, the General Hospital of Shenyang Military Region, No. 83, Wenhua Road, Shenhe District, Shenyang 110016, Liaoning Province, China. [email protected]: +86-24-28851113Fax: +86-24-28851113
Received: January 6, 2015 Peer-review started: January 7, 2015First decision: January 22, 2015Revised: February 26, 2015 Accepted: May 4, 2015Article in press: May 4, 2015Published online: September 14, 2015
AbstractAIM: To evaluate the correlations between cytotoxic T lymphocyte-associated antigen-4 (CTLA-4 ) and multi-drug resistance 1 (MDR1 ) genes polymorphisms with ulcerative colitis (UC) risk.
METHODS: PubMed, EMBASE, Web of Science, Cochrane Library, CBM databases, Springerlink, Wiley, EBSCO, Ovid, Wanfang database, VIP database, China National Knowledge Infrastructure, and Weipu Journal databases were exhaustively searched using combinations of keywords relating to CTLA-4, MDR1 and UC. The published studies were filtered using our stringent inclusion and exclusion criteria, the quality assessment for each eligible study was conducted using Critical Appraisal Skill Program and the resultant high-quality data from final selected studies were analyzed using Comprehensive Meta-analysis 2.0 (CMA 2.0) software. The correlations between SNPs of CTLA-4 gene, MDR1 gene and the risk of UC were evaluated by OR at 95%CI. Z test was carried out to evaluate the significance of overall effect values. Cochran’s Q -statistic and I 2 tests were applied to quantify heterogeneity among studies. Funnel plots, classic fail-safe N and Egger’s linear regression test were inspected for indication of publication bias.
RESULTS: A total of 107 studies were initially retrieved and 12 studies were eventually selected for meta-analysis. These 12 case-control studies involved 1860 UC patients and 2663 healthy controls. Our major result revealed that single nucleotide polymorphisms (SNPs) of CTLA-4 gene rs3087243 G > A and rs231775 G > A may increase the risk of UC (rs3087243 G > A: allele model: OR = 1.365, 95%CI: 1.023-1.822, P = 0.035; dominant model: OR = 1.569, 95%CI: 1.269-1.940, P < 0.001; rs231775 G > A: allele model: OR = 1.583, 95%CI: = 1.306-1.918, P < 0.001; dominant model: OR = 1.805,
META-ANALYSIS
CTLA-4 and MDR1 polymorphisms increase the risk for ulcerative colitis: A meta-analysis
Jia-Jun Zhao, Di Wang, Hui Yao, Da-Wei Sun, Hong-Yu Li
Submit a Manuscript: http://www.wjgnet.com/esps/Help Desk: http://www.wjgnet.com/esps/helpdesk.aspxDOI: 10.3748/wjg.v21.i34.10025
World J Gastroenterol 2015 September 14; 21(34): 10025-10040 ISSN 1007-9327 (print) ISSN 2219-2840 (online)
© 2015 Baishideng Publishing Group Inc. All rights reserved.
Zhao JJ et al . CTLA-4 and MDR1 SNPs with UC
10026 September 14, 2015|Volume 21|Issue 34|WJG|www.wjgnet.com
95%CI: 1.393-2.340, P < 0.001). In addition, based on our result, SNPs of MDR1 gene rs1045642 C > T might also confer a significant increases for the risk of UC (allele model: OR = 1.389, 95%CI: 1.214-1.590, P < 0.001; dominant model: OR = 1.518, 95%CI: 1.222-1.886, P < 0.001).
CONCLUSION: CTLA-4 gene rs3087243 G > A and rs231775 G > A, and MDR1 gene rs1045642 C > T might confer an increase for UC risk.
Key words: Ulcerative colitis; Cytotoxic T lymphocyte-associated antigen-4; Multi-drug resistance 1; rs3087243 G > A; rs231775 G > A; rs1045642 C > T; Polymorphism; Meta-analysis
© The Author(s) 2015. Published by Baishideng Publishing Group Inc. All rights reserved.
Core tip: To evaluate the correlations between cytotoxic T lymphocyte-associated antigen-4 (CTLA-4) and multi-drug resistance 1 (MDR1 ) genes polymorphisms with ulcerative colitis (UC) risk. CTLA-4 gene rs3087243 G > A and rs231775 G > A, and MDR1 gene rs1045642 C > T might confer an increases for UC risk.
Zhao JJ, Wang D, Yao H, Sun DW, Li HY. CTLA-4 and MDR1 polymorphisms increase the risk for ulcerative colitis: A meta-analysis. World J Gastroenterol 2015; 21(34): 10025-10040 Available from: URL: http://www.wjgnet.com/1007-9327/full/v21/i34/10025.htm DOI: http://dx.doi.org/10.3748/wjg.v21.i34.10025
INTRODUCTIONUlcerative colitis (UC) is known as an idiopathic, chronic inflammatory disease of the large intestine, frequently involving the rectum, and characterized by continuous inflammation and ulceration of intestinal mucosa and submucosa[1]. In the United States, UC affects approximately 500000 individuals with an incidence of 8-12 per 100000 populations per year and the incidence has remained relatively constant over the last five decades[2]. Crohn’s disease (CD) and UC are two forms of inflammatory bowel diseases (IBD), and while CD can impact any segment of the gastrointestinal tract, UC pathology is restricted to the colon[3]. The precise etiology of UC remains unknown, but factors such as the host immune system, other genetic factors, and environmental factors, contribute to the occurrence of UC[4,5]. Typical symptoms of UC include abdominal cramping, rectal bleeding and persistent bloody diarrhea, and other symptoms such as severe fecal urgency resulting from reduced rectal compliance, irritability, general malaise, incontinence, and weight loss are also common[6]. UC is treated in clinics with azathioprine,
mesalamine, glucocorticoids, and anti-tumor necrosis factor agents (infliximab and adalimumab)[7]. Recently, single nucleotide polymorphisms (SNPs) of Cytotoxic T lymphocyte-associated antigen-4 (CTLA-4) and multi-drug resistance 1 (MDR1) genes were found to be associated with the pathogenesis of UC[8,9].
CTLA-4 plays a crucial role in the immune system inducing immune tolerance and is an essential negative regulator of T cell-mediated immune response[10]. CTLA-4 usually functions as a co-inhibitory molecule interacting with B7.1 (CD80) and B7.2 (CD86) expressed on antigen-presenting cells[11]. CTLA-4 gene encodes a 40-kDa transmembrane CTLA-4 glycoprotein and the gene is located on chromosome 2q33 in humans[12]. CTLA-4 dampens the signal transduction in T cells in the presence of antigen presenting cells, and downregulation of CTLA-4 expression is implicated in T cell associated autoimmunity and lymphoproliferative diseases[13]. MDR1, also called ATP-binding cassette subfamily B member 1 (ABCB1), is extremely important in multidrug resistance of cancer cells and therapy effectiveness in several other disorders[14]. The MDR1 gene is located on chromosome 7q21.1 and encodes a glycoprotein of 170 kDa[15]. MDR1 was originally identified as a gene amplified in multiple drug-resistant cells, and its product, P-gp, plays an important role in drug resistance[16]. Previous studies have proposed that some SNPs of CTLA-4 gene, such as rs3087243 G > A and rs231775 G > A, and SNPs of MDR1 gene rs1045642 C > T may increase the risk of UC[17,18]. However, these associations have not been confirmed, and contradictory data exists in different populations[19,20]. In order to address this relationship further, we undertook a meta-analysis based approach to evaluate the associations of SNPs of CTLA-4 and MDR1 genes with the risk of UC, by pooling all relevant published data.
MATERIALS AND METHODSSearch strategyAn extensive literature search for relevant studies was conducted on PubMed, EMBASE, Web of Science, Cochrane Library, CBM databases, Springerlink, Wiley, EBSCO, Ovid, Wanfang database, VIP database, China National Knowledge Infrastructure (CNKI), and Weipu Journal databases from their inception through to October 1st, 2014. We used the following keywords and MeSH terms: “costimulatory and inhibitory t-cell receptors” or “CTLA-4 antigen” or “cytotoxic t-lymphocyte-associated antigen 4” or “CD152 antigen” or “cytotoxic t lymphocyte antigen 4” OR “CTLA-4” and (“colitis, ulcerative” or “idiopathic proctocolitis” or “ulcerative colitis” or “Colitis gravis” or “inflammatory bowel disease, ulcerative colitis type”); “genes, MDR” or “ABCB1” or “MDR1” or “multidrug resistance 1” or “ABCB1 protein, human” or “MDR” and (“colitis, ulcerative” or “idiopathic proctocolitis” or
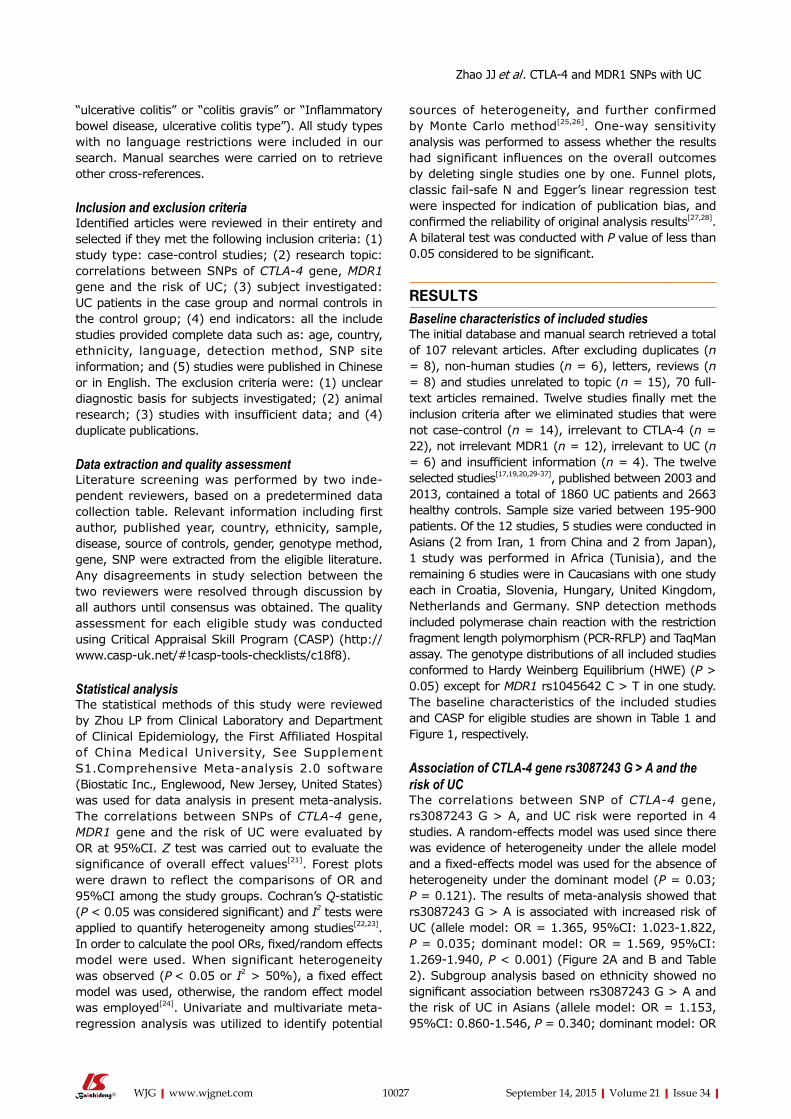
10027 September 14, 2015|Volume 21|Issue 34|WJG|www.wjgnet.com
“ulcerative colitis” or “colitis gravis” or “Inflammatory bowel disease, ulcerative colitis type”). All study types with no language restrictions were included in our search. Manual searches were carried on to retrieve other cross-references.
Inclusion and exclusion criteriaIdentified articles were reviewed in their entirety and selected if they met the following inclusion criteria: (1) study type: case-control studies; (2) research topic: correlations between SNPs of CTLA-4 gene, MDR1 gene and the risk of UC; (3) subject investigated: UC patients in the case group and normal controls in the control group; (4) end indicators: all the include studies provided complete data such as: age, country, ethnicity, language, detection method, SNP site information; and (5) studies were published in Chinese or in English. The exclusion criteria were: (1) unclear diagnostic basis for subjects investigated; (2) animal research; (3) studies with insufficient data; and (4) duplicate publications.
Data extraction and quality assessmentLiterature screening was performed by two inde-pendent reviewers, based on a predetermined data collection table. Relevant information including first author, published year, country, ethnicity, sample, disease, source of controls, gender, genotype method, gene, SNP were extracted from the eligible literature. Any disagreements in study selection between the two reviewers were resolved through discussion by all authors until consensus was obtained. The quality assessment for each eligible study was conducted using Critical Appraisal Skill Program (CASP) (http://www.casp-uk.net/#!casp-tools-checklists/c18f8).
Statistical analysisThe statistical methods of this study were reviewed by Zhou LP from Clinical Laboratory and Department of Clinical Epidemiology, the First Affiliated Hospital of China Medical University, See Supplement S1.Comprehensive Meta-analysis 2.0 software (Biostatic Inc., Englewood, New Jersey, United States) was used for data analysis in present meta-analysis. The correlations between SNPs of CTLA-4 gene, MDR1 gene and the risk of UC were evaluated by OR at 95%CI. Z test was carried out to evaluate the significance of overall effect values[21]. Forest plots were drawn to reflect the comparisons of OR and 95%CI among the study groups. Cochran’s Q-statistic (P < 0.05 was considered significant) and I2 tests were applied to quantify heterogeneity among studies[22,23]. In order to calculate the pool ORs, fixed/random effects model were used. When significant heterogeneity was observed (P < 0.05 or I2 > 50%), a fixed effect model was used, otherwise, the random effect model was employed[24]. Univariate and multivariate meta-regression analysis was utilized to identify potential
sources of heterogeneity, and further confirmed by Monte Carlo method[25,26]. One-way sensitivity analysis was performed to assess whether the results had significant influences on the overall outcomes by deleting single studies one by one. Funnel plots, classic fail-safe N and Egger’s linear regression test were inspected for indication of publication bias, and confirmed the reliability of original analysis results[27,28]. A bilateral test was conducted with P value of less than 0.05 considered to be significant.
RESULTSBaseline characteristics of included studiesThe initial database and manual search retrieved a total of 107 relevant articles. After excluding duplicates (n = 8), non-human studies (n = 6), letters, reviews (n = 8) and studies unrelated to topic (n = 15), 70 full-text articles remained. Twelve studies finally met the inclusion criteria after we eliminated studies that were not case-control (n = 14), irrelevant to CTLA-4 (n = 22), not irrelevant MDR1 (n = 12), irrelevant to UC (n = 6) and insufficient information (n = 4). The twelve selected studies[17,19,20,29-37], published between 2003 and 2013, contained a total of 1860 UC patients and 2663 healthy controls. Sample size varied between 195-900 patients. Of the 12 studies, 5 studies were conducted in Asians (2 from Iran, 1 from China and 2 from Japan), 1 study was performed in Africa (Tunisia), and the remaining 6 studies were in Caucasians with one study each in Croatia, Slovenia, Hungary, United Kingdom, Netherlands and Germany. SNP detection methods included polymerase chain reaction with the restriction fragment length polymorphism (PCR-RFLP) and TaqMan assay. The genotype distributions of all included studies conformed to Hardy Weinberg Equilibrium (HWE) (P > 0.05) except for MDR1 rs1045642 C > T in one study. The baseline characteristics of the included studies and CASP for eligible studies are shown in Table 1 and Figure 1, respectively.
Association of CTLA-4 gene rs3087243 G > A and the risk of UCThe correlations between SNP of CTLA-4 gene, rs3087243 G > A, and UC risk were reported in 4 studies. A random-effects model was used since there was evidence of heterogeneity under the allele model and a fixed-effects model was used for the absence of heterogeneity under the dominant model (P = 0.03; P = 0.121). The results of meta-analysis showed that rs3087243 G > A is associated with increased risk of UC (allele model: OR = 1.365, 95%CI: 1.023-1.822, P = 0.035; dominant model: OR = 1.569, 95%CI: 1.269-1.940, P < 0.001) (Figure 2A and B and Table 2). Subgroup analysis based on ethnicity showed no significant association between rs3087243 G > A and the risk of UC in Asians (allele model: OR = 1.153, 95%CI: 0.860-1.546, P = 0.340; dominant model: OR
Zhao JJ et al . CTLA-4 and MDR1 SNPs with UC
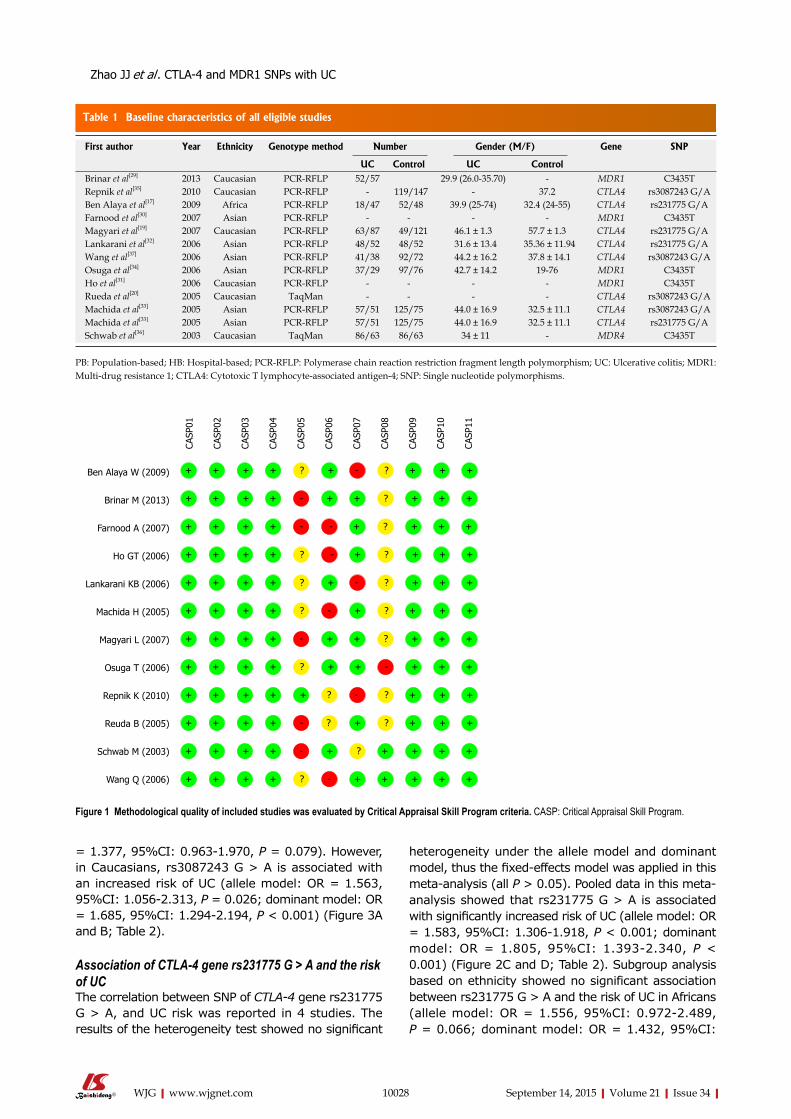
Table 1 Baseline characteristics of all eligible studies
10028 September 14, 2015|Volume 21|Issue 34|WJG|www.wjgnet.com
= 1.377, 95%CI: 0.963-1.970, P = 0.079). However, in Caucasians, rs3087243 G > A is associated with an increased risk of UC (allele model: OR = 1.563, 95%CI: 1.056-2.313, P = 0.026; dominant model: OR = 1.685, 95%CI: 1.294-2.194, P < 0.001) (Figure 3A and B; Table 2).
Association of CTLA-4 gene rs231775 G > A and the risk of UCThe correlation between SNP of CTLA-4 gene rs231775 G > A, and UC risk was reported in 4 studies. The results of the heterogeneity test showed no significant
heterogeneity under the allele model and dominant model, thus the fixed-effects model was applied in this meta-analysis (all P > 0.05). Pooled data in this meta-analysis showed that rs231775 G > A is associated with significantly increased risk of UC (allele model: OR = 1.583, 95%CI: 1.306-1.918, P < 0.001; dominant model: OR = 1.805, 95%CI: 1.393-2.340, P < 0.001) (Figure 2C and D; Table 2). Subgroup analysis based on ethnicity showed no significant association between rs231775 G > A and the risk of UC in Africans (allele model: OR = 1.556, 95%CI: 0.972-2.489, P = 0.066; dominant model: OR = 1.432, 95%CI:
First author Year Ethnicity Genotype method Number Gender (M/F) Gene SNP
UC Control UC ControlBrinar et al[29] 2013 Caucasian PCR-RFLP 52/57 29.9 (26.0-35.70) - MDR1 C3435TRepnik et al[35] 2010 Caucasian PCR-RFLP - 119/147 - 37.2 CTLA4 rs3087243 G/ABen Alaya et al[17] 2009 Africa PCR-RFLP 18/47 52/48 39.9 (25-74) 32.4 (24-55) CTLA4 rs231775 G/AFarnood et al[30] 2007 Asian PCR-RFLP - - - - MDR1 C3435TMagyari et al[19] 2007 Caucasian PCR-RFLP 63/87 49/121 46.1 ± 1.3 57.7 ± 1.3 CTLA4 rs231775 G/ALankarani et al[32] 2006 Asian PCR-RFLP 48/52 48/52 31.6 ± 13.4 35.36 ± 11.94 CTLA4 rs231775 G/AWang et al[37] 2006 Asian PCR-RFLP 41/38 92/72 44.2 ± 16.2 37.8 ± 14.1 CTLA4 rs3087243 G/AOsuga et al[34] 2006 Asian PCR-RFLP 37/29 97/76 42.7 ± 14.2 19-76 MDR1 C3435THo et al[31] 2006 Caucasian PCR-RFLP - - - - MDR1 C3435TRueda et al[20] 2005 Caucasian TaqMan - - - - CTLA4 rs3087243 G/AMachida et al[33] 2005 Asian PCR-RFLP 57/51 125/75 44.0 ± 16.9 32.5 ± 11.1 CTLA4 rs3087243 G/AMachida et al[33] 2005 Asian PCR-RFLP 57/51 125/75 44.0 ± 16.9 32.5 ± 11.1 CTLA4 rs231775 G/ASchwab et al[36] 2003 Caucasian TaqMan 86/63 86/63 34 ± 11 - MDR4 C3435T
PB: Population-based; HB: Hospital-based; PCR-RFLP: Polymerase chain reaction restriction fragment length polymorphism; UC: Ulcerative colitis; MDR1: Multi-drug resistance 1; CTLA4: Cytotoxic T lymphocyte-associated antigen-4; SNP: Single nucleotide polymorphisms.
Ben Alaya W (2009)
Brinar M (2013)
Farnood A (2007)
Ho GT (2006)
Lankarani KB (2006)
Machida H (2005)
Magyari L (2007)
Osuga T (2006)
Repnik K (2010)
Reuda B (2005)
Schwab M (2003)
Wang Q (2006)
CASP
01
CASP
02
CASP
03
CASP
04
CASP
05
CASP
06
CASP
07
CASP
08
CASP
09
CASP
10
CASP
11+ + + + ? + - ? + + +
+ + + + - + + ? + + +
+ + + + - - + ? + + +
+ + + + ? - + ? + + +
+ + + + ? + - ? + + +
+ + + + ? - + ? + + +
+ + + + - + + ? + + +
+ + + + ? + + - + + +
+ + + + + ? - ? + + +
+ + + + - ? + ? + + +
+ + + + - + ? + + + +
+ + + + ? - + + + + +
Figure 1 Methodological quality of included studies was evaluated by Critical Appraisal Skill Program criteria. CASP: Critical Appraisal Skill Program.
Zhao JJ et al . CTLA-4 and MDR1 SNPs with UC
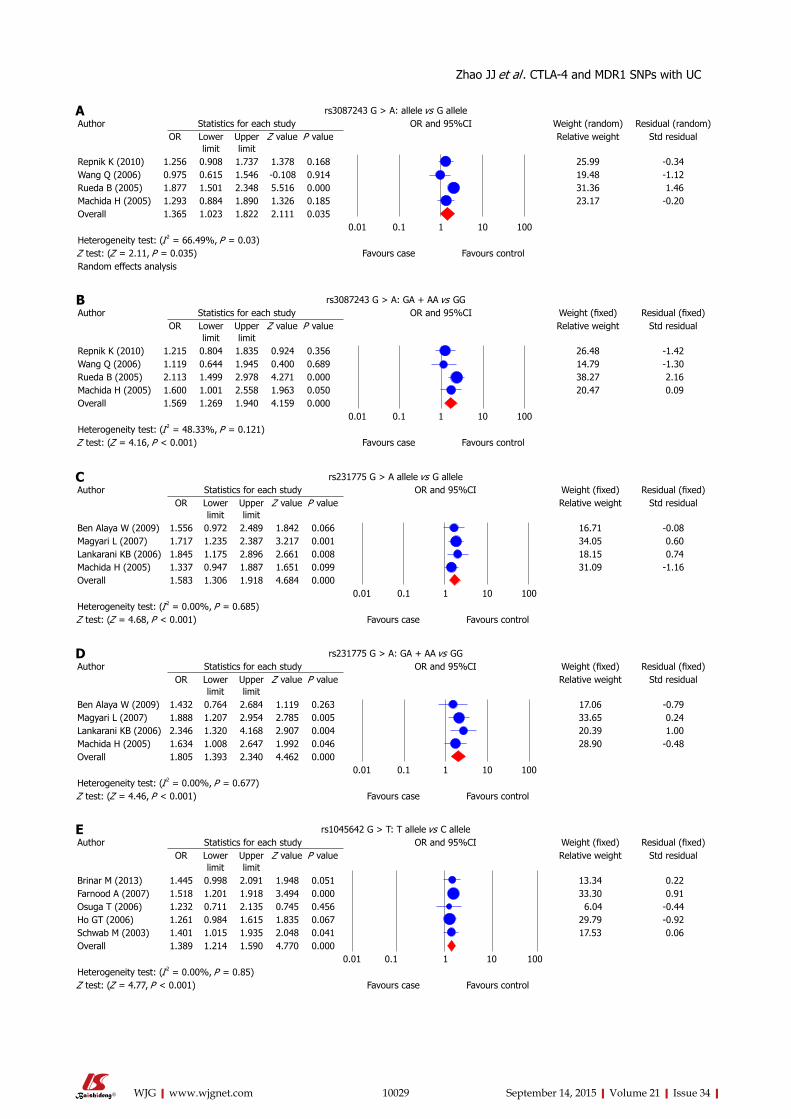
rs231775 G > A: GA + AA vs GGAuthor Statistics for each study OR and 95%CI Weight (fixed) Residual (fixed)
OR Lower limit
Upper limit
Z value P value Relative weight Std residual
Ben Alaya W (2009) 1.432 0.764 2.684 1.119 0.263 17.06 -0.79Magyari L (2007) 1.888 1.207 2.954 2.785 0.005 33.65 0.24Lankarani KB (2006) 2.346 1.320 4.168 2.907 0.004 20.39 1.00Machida H (2005) 1.634 1.008 2.647 1.992 0.046 28.90 -0.48Overall 1.805 1.393 2.340 4.462 0.000
0.01 0.1 1 10 100Heterogeneity test: (I 2 = 0.00%, P = 0.677)Z test: (Z = 4.46, P < 0.001) Favours case Favours control
rs3087243 G > A: GA + AA vs GGAuthor Statistics for each study OR and 95%CI Weight (fixed) Residual (fixed)
OR Lower limit
Upper limit
Z value P value Relative weight Std residual
Repnik K (2010) 1.215 0.804 1.835 0.924 0.356 26.48 -1.42Wang Q (2006) 1.119 0.644 1.945 0.400 0.689 14.79 -1.30Rueda B (2005) 2.113 1.499 2.978 4.271 0.000 38.27 2.16Machida H (2005) 1.600 1.001 2.558 1.963 0.050 20.47 0.09Overall 1.569 1.269 1.940 4.159 0.000
0.01 0.1 1 10 100Heterogeneity test: (I 2 = 48.33%, P = 0.121)Z test: (Z = 4.16, P < 0.001) Favours case Favours control
10029 September 14, 2015|Volume 21|Issue 34|WJG|www.wjgnet.com
rs231775 G > A allele vs G alleleAuthor Statistics for each study OR and 95%CI Weight (fixed) Residual (fixed)
OR Lower limit
Upper limit
Z value P value Relative weight Std residual
Ben Alaya W (2009) 1.556 0.972 2.489 1.842 0.066 16.71 -0.08Magyari L (2007) 1.717 1.235 2.387 3.217 0.001 34.05 0.60Lankarani KB (2006) 1.845 1.175 2.896 2.661 0.008 18.15 0.74Machida H (2005) 1.337 0.947 1.887 1.651 0.099 31.09 -1.16Overall 1.583 1.306 1.918 4.684 0.000
0.01 0.1 1 10 100Heterogeneity test: (I 2 = 0.00%, P = 0.685)Z test: (Z = 4.68, P < 0.001) Favours case Favours control
rs3087243 G > A: allele vs G alleleAuthor Statistics for each study OR and 95%CI Weight (random) Residual (random)
OR Lower limit
Upper limit
Z value P value Relative weight Std residual
Repnik K (2010) 1.256 0.908 1.737 1.378 0.168 25.99 -0.34Wang Q (2006) 0.975 0.615 1.546 -0.108 0.914 19.48 -1.12Rueda B (2005) 1.877 1.501 2.348 5.516 0.000 31.36 1.46Machida H (2005) 1.293 0.884 1.890 1.326 0.185 23.17 -0.20Overall 1.365 1.023 1.822 2.111 0.035
0.01 0.1 1 10 100Heterogeneity test: (I 2 = 66.49%, P = 0.03)Z test: (Z = 2.11, P = 0.035) Favours case Favours controlRandom effects analysis
rs1045642 G > T: T allele vs C alleleAuthor Statistics for each study OR and 95%CI Weight (fixed) Residual (fixed)
OR Lower limit
Upper limit
Z value P value Relative weight Std residual
Brinar M (2013) 1.445 0.998 2.091 1.948 0.051 13.34 0.22Farnood A (2007) 1.518 1.201 1.918 3.494 0.000 33.30 0.91Osuga T (2006) 1.232 0.711 2.135 0.745 0.456 6.04 -0.44Ho GT (2006) 1.261 0.984 1.615 1.835 0.067 29.79 -0.92Schwab M (2003) 1.401 1.015 1.935 2.048 0.041 17.53 0.06Overall 1.389 1.214 1.590 4.770 0.000
0.01 0.1 1 10 100Heterogeneity test: (I 2 = 0.00%, P = 0.85)Z test: (Z = 4.77, P < 0.001) Favours case Favours control
A
C
B
D
E
Zhao JJ et al . CTLA-4 and MDR1 SNPs with UC
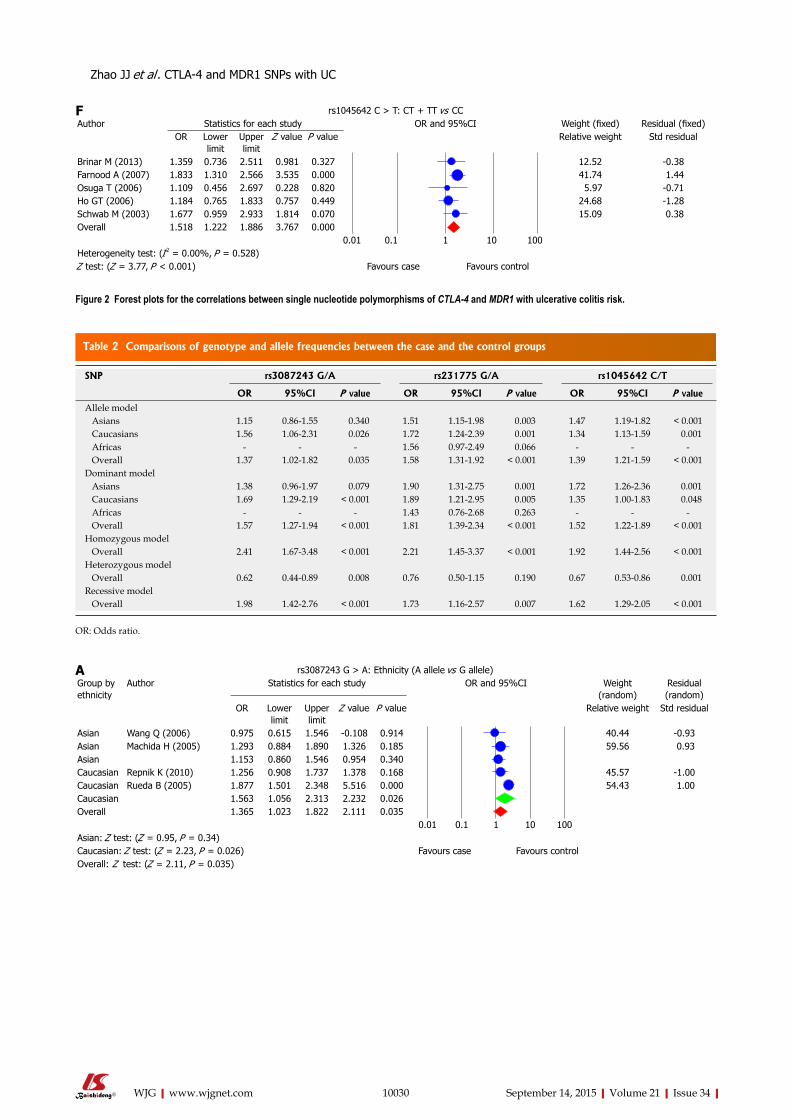
Table 2 Comparisons of genotype and allele frequencies between the case and the control groups
10030 September 14, 2015|Volume 21|Issue 34|WJG|www.wjgnet.com
rs1045642 C > T: CT + TT vs CCAuthor Statistics for each study OR and 95%CI Weight (fixed) Residual (fixed)
OR Lower limit
Upper limit
Z value P value Relative weight Std residual
Brinar M (2013) 1.359 0.736 2.511 0.981 0.327 12.52 -0.38Farnood A (2007) 1.833 1.310 2.566 3.535 0.000 41.74 1.44Osuga T (2006) 1.109 0.456 2.697 0.228 0.820 5.97 -0.71Ho GT (2006) 1.184 0.765 1.833 0.757 0.449 24.68 -1.28Schwab M (2003) 1.677 0.959 2.933 1.814 0.070 15.09 0.38Overall 1.518 1.222 1.886 3.767 0.000
0.01 0.1 1 10 100Heterogeneity test: (I 2 = 0.00%, P = 0.528)Z test: (Z = 3.77, P < 0.001) Favours case Favours control
F
Figure 2 Forest plots for the correlations between single nucleotide polymorphisms of CTLA-4 and MDR1 with ulcerative colitis risk.
SNP rs3087243 G/A rs231775 G/A rs1045642 C/T
OR 95%CI P value OR 95%CI P value OR 95%CI P valueAllele model Asians 1.15 0.86-1.55 0.340 1.51 1.15-1.98 0.003 1.47 1.19-1.82 < 0.001 Caucasians 1.56 1.06-2.31 0.026 1.72 1.24-2.39 0.001 1.34 1.13-1.59 0.001 Africas - - - 1.56 0.97-2.49 0.066 - - - Overall 1.37 1.02-1.82 0.035 1.58 1.31-1.92 < 0.001 1.39 1.21-1.59 < 0.001Dominant model Asians 1.38 0.96-1.97 0.079 1.90 1.31-2.75 0.001 1.72 1.26-2.36 0.001 Caucasians 1.69 1.29-2.19 < 0.001 1.89 1.21-2.95 0.005 1.35 1.00-1.83 0.048 Africas - - - 1.43 0.76-2.68 0.263 - - - Overall 1.57 1.27-1.94 < 0.001 1.81 1.39-2.34 < 0.001 1.52 1.22-1.89 < 0.001Homozygous model Overall 2.41 1.67-3.48 < 0.001 2.21 1.45-3.37 < 0.001 1.92 1.44-2.56 < 0.001Heterozygous model Overall 0.62 0.44-0.89 0.008 0.76 0.50-1.15 0.190 0.67 0.53-0.86 0.001Recessive model Overall 1.98 1.42-2.76 < 0.001 1.73 1.16-2.57 0.007 1.62 1.29-2.05 < 0.001
OR: Odds ratio.
A
Zhao JJ et al . CTLA-4 and MDR1 SNPs with UC
rs3087243 G > A: Ethnicity (A allele vs G allele)Group by ethnicity
Author Statistics for each study OR and 95%CI Weight (random)
Residual (random)
OR Lower limit
Upper limit
Z value P value Relative weight Std residual
Asian Wang Q (2006) 0.975 0.615 1.546 -0.108 0.914 40.44 -0.93Asian Machida H (2005) 1.293 0.884 1.890 1.326 0.185 59.56 0.93Asian 1.153 0.860 1.546 0.954 0.340Caucasian Repnik K (2010) 1.256 0.908 1.737 1.378 0.168 45.57 -1.00Caucasian Rueda B (2005) 1.877 1.501 2.348 5.516 0.000 54.43 1.00Caucasian 1.563 1.056 2.313 2.232 0.026Overall 1.365 1.023 1.822 2.111 0.035
0.01 0.1 1 10 100Asian: Z test: (Z = 0.95, P = 0.34)Caucasian: Z test: (Z = 2.23, P = 0.026) Favours case Favours controlOverall: Z test: (Z = 2.11, P = 0.035)
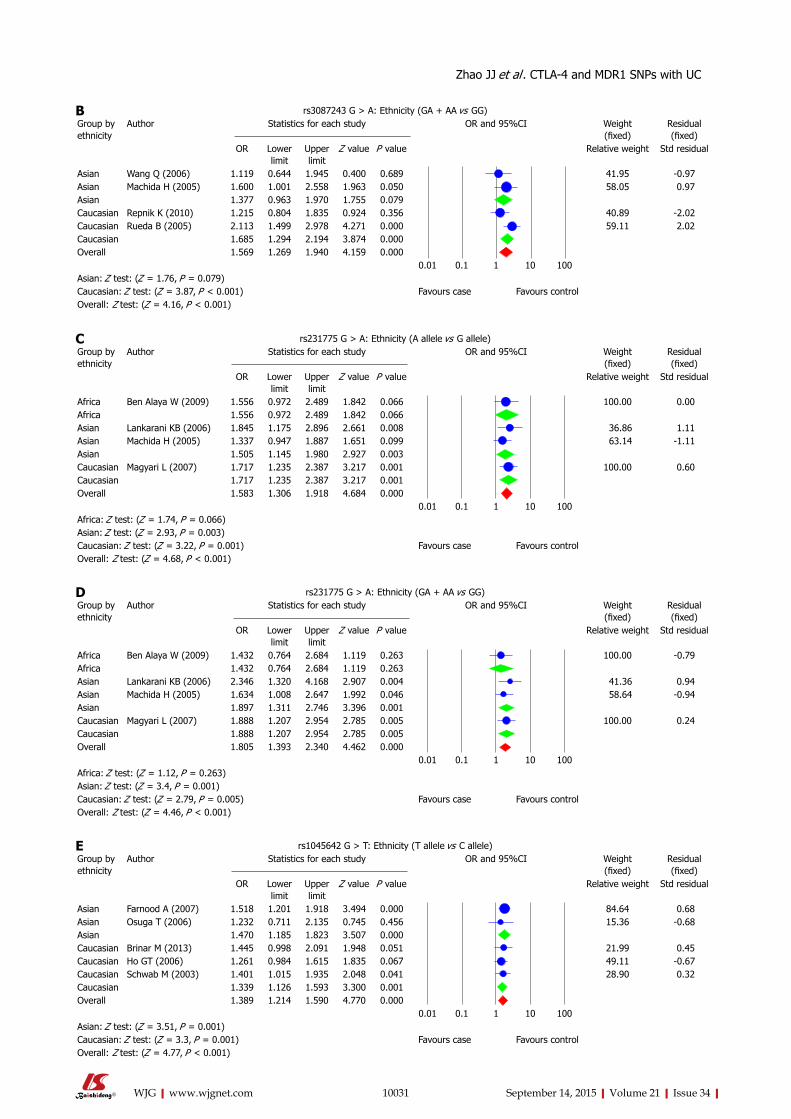
10031 September 14, 2015|Volume 21|Issue 34|WJG|www.wjgnet.com
rs231775 G > A: Ethnicity (A allele vs G allele)Group by ethnicity
Author Statistics for each study OR and 95%CI Weight (fixed)
Residual (fixed)
OR Lower limit
Upper limit
Z value P value Relative weight Std residual
Africa Ben Alaya W (2009) 1.556 0.972 2.489 1.842 0.066 100.00 0.00Africa 1.556 0.972 2.489 1.842 0.066Asian Lankarani KB (2006) 1.845 1.175 2.896 2.661 0.008 36.86 1.11Asian Machida H (2005) 1.337 0.947 1.887 1.651 0.099 63.14 -1.11Asian 1.505 1.145 1.980 2.927 0.003Caucasian Magyari L (2007) 1.717 1.235 2.387 3.217 0.001 100.00 0.60Caucasian 1.717 1.235 2.387 3.217 0.001Overall 1.583 1.306 1.918 4.684 0.000
0.01 0.1 1 10 100Africa: Z test: (Z = 1.74, P = 0.066)Asian: Z test: (Z = 2.93, P = 0.003)Caucasian: Z test: (Z = 3.22, P = 0.001) Favours case Favours controlOverall: Z test: (Z = 4.68, P < 0.001)
C
rs1045642 G > T: Ethnicity (T allele vs C allele)Group by ethnicity
Author Statistics for each study OR and 95%CI Weight (fixed)
Residual (fixed)
OR Lower limit
Upper limit
Z value P value Relative weight Std residual
Asian Farnood A (2007) 1.518 1.201 1.918 3.494 0.000 84.64 0.68Asian Osuga T (2006) 1.232 0.711 2.135 0.745 0.456 15.36 -0.68Asian 1.470 1.185 1.823 3.507 0.000Caucasian Brinar M (2013) 1.445 0.998 2.091 1.948 0.051 21.99 0.45Caucasian Ho GT (2006) 1.261 0.984 1.615 1.835 0.067 49.11 -0.67Caucasian Schwab M (2003) 1.401 1.015 1.935 2.048 0.041 28.90 0.32Caucasian 1.339 1.126 1.593 3.300 0.001Overall 1.389 1.214 1.590 4.770 0.000
0.01 0.1 1 10 100Asian: Z test: (Z = 3.51, P = 0.001)Caucasian: Z test: (Z = 3.3, P = 0.001) Favours case Favours controlOverall: Z test: (Z = 4.77, P < 0.001)
E
rs3087243 G > A: Ethnicity (GA + AA vs GG)Group by ethnicity
Author Statistics for each study OR and 95%CI Weight (fixed)
Residual (fixed)
OR Lower limit
Upper limit
Z value P value Relative weight Std residual
Asian Wang Q (2006) 1.119 0.644 1.945 0.400 0.689 41.95 -0.97Asian Machida H (2005) 1.600 1.001 2.558 1.963 0.050 58.05 0.97Asian 1.377 0.963 1.970 1.755 0.079Caucasian Repnik K (2010) 1.215 0.804 1.835 0.924 0.356 40.89 -2.02Caucasian Rueda B (2005) 2.113 1.499 2.978 4.271 0.000 59.11 2.02Caucasian 1.685 1.294 2.194 3.874 0.000Overall 1.569 1.269 1.940 4.159 0.000
0.01 0.1 1 10 100Asian: Z test: (Z = 1.76, P = 0.079)Caucasian: Z test: (Z = 3.87, P < 0.001) Favours case Favours controlOverall: Z test: (Z = 4.16, P < 0.001)
B
rs231775 G > A: Ethnicity (GA + AA vs GG)Group by ethnicity
Author Statistics for each study OR and 95%CI Weight (fixed)
Residual (fixed)
OR Lower limit
Upper limit
Z value P value Relative weight Std residual
Africa Ben Alaya W (2009) 1.432 0.764 2.684 1.119 0.263 100.00 -0.79Africa 1.432 0.764 2.684 1.119 0.263Asian Lankarani KB (2006) 2.346 1.320 4.168 2.907 0.004 41.36 0.94Asian Machida H (2005) 1.634 1.008 2.647 1.992 0.046 58.64 -0.94Asian 1.897 1.311 2.746 3.396 0.001Caucasian Magyari L (2007) 1.888 1.207 2.954 2.785 0.005 100.00 0.24Caucasian 1.888 1.207 2.954 2.785 0.005Overall 1.805 1.393 2.340 4.462 0.000
0.01 0.1 1 10 100Africa: Z test: (Z = 1.12, P = 0.263)Asian: Z test: (Z = 3.4, P = 0.001)Caucasian: Z test: (Z = 2.79, P = 0.005) Favours case Favours controlOverall: Z test: (Z = 4.46, P < 0.001)
D
Zhao JJ et al . CTLA-4 and MDR1 SNPs with UC
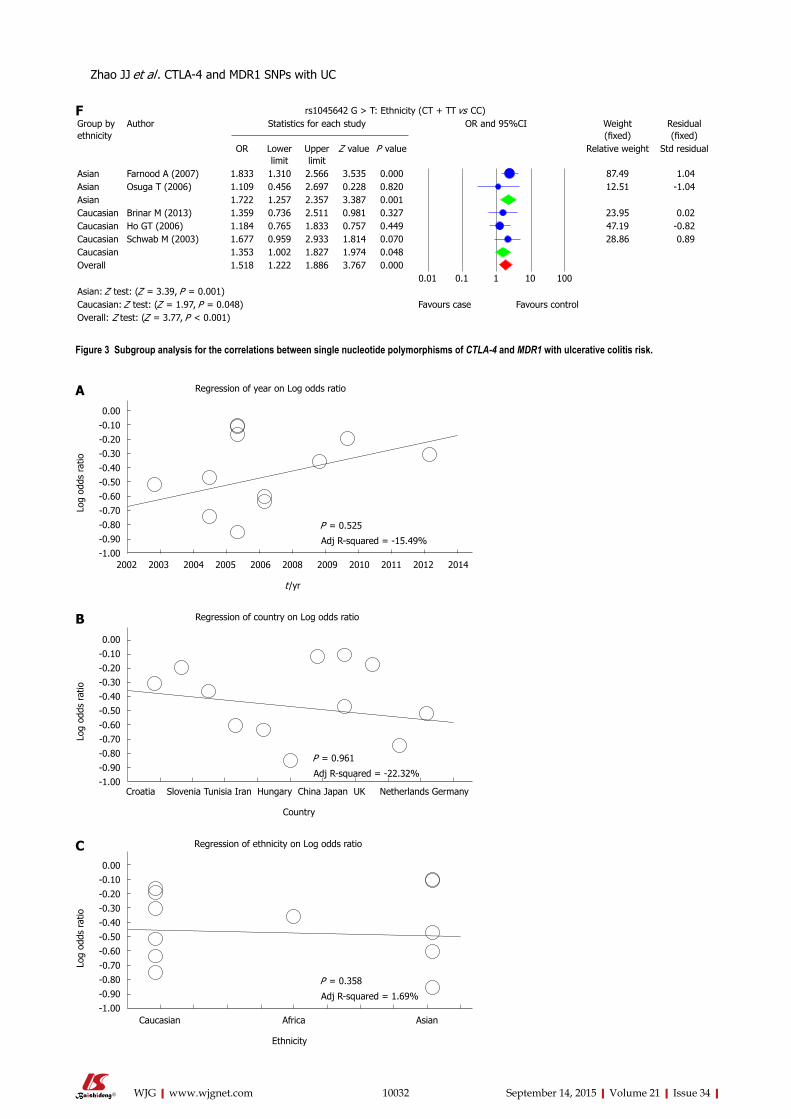
10032 September 14, 2015|Volume 21|Issue 34|WJG|www.wjgnet.com
Figure 3 Subgroup analysis for the correlations between single nucleotide polymorphisms of CTLA-4 and MDR1 with ulcerative colitis risk.
Regression of year on Log odds ratio
0.00-0.10-0.20-0.30-0.40-0.50-0.60-0.70-0.80-0.90-1.00
Log
odds
rat
io
2002 2003 2004 2005 2006 2008 2009 2010 2011 2012 2014
t /yr
P = 0.525
Adj R-squared = -15.49%
A
Regression of ethnicity on Log odds ratio
0.00-0.10-0.20-0.30-0.40-0.50-0.60-0.70-0.80-0.90-1.00
Log
odds
rat
io
Caucasian Africa Asian
Ethnicity
P = 0.358
Adj R-squared = 1.69%
C
Regression of country on Log odds ratio
0.00-0.10-0.20-0.30-0.40-0.50-0.60-0.70-0.80-0.90-1.00
Log
odds
rat
io
Croatia Slovenia Tunisia Iran Hungary China Japan UK Netherlands Germany
P = 0.961
Adj R-squared = -22.32%
Country
B
rs1045642 G > T: Ethnicity (CT + TT vs CC)Group by ethnicity
Author Statistics for each study OR and 95%CI Weight (fixed)
Residual (fixed)
OR Lower limit
Upper limit
Z value P value Relative weight Std residual
Asian Farnood A (2007) 1.833 1.310 2.566 3.535 0.000 87.49 1.04Asian Osuga T (2006) 1.109 0.456 2.697 0.228 0.820 12.51 -1.04Asian 1.722 1.257 2.357 3.387 0.001Caucasian Brinar M (2013) 1.359 0.736 2.511 0.981 0.327 23.95 0.02Caucasian Ho GT (2006) 1.184 0.765 1.833 0.757 0.449 47.19 -0.82Caucasian Schwab M (2003) 1.677 0.959 2.933 1.814 0.070 28.86 0.89Caucasian 1.353 1.002 1.827 1.974 0.048Overall 1.518 1.222 1.886 3.767 0.000
0.01 0.1 1 10 100Asian: Z test: (Z = 3.39, P = 0.001)Caucasian: Z test: (Z = 1.97, P = 0.048) Favours case Favours controlOverall: Z test: (Z = 3.77, P < 0.001)
F
Zhao JJ et al . CTLA-4 and MDR1 SNPs with UC
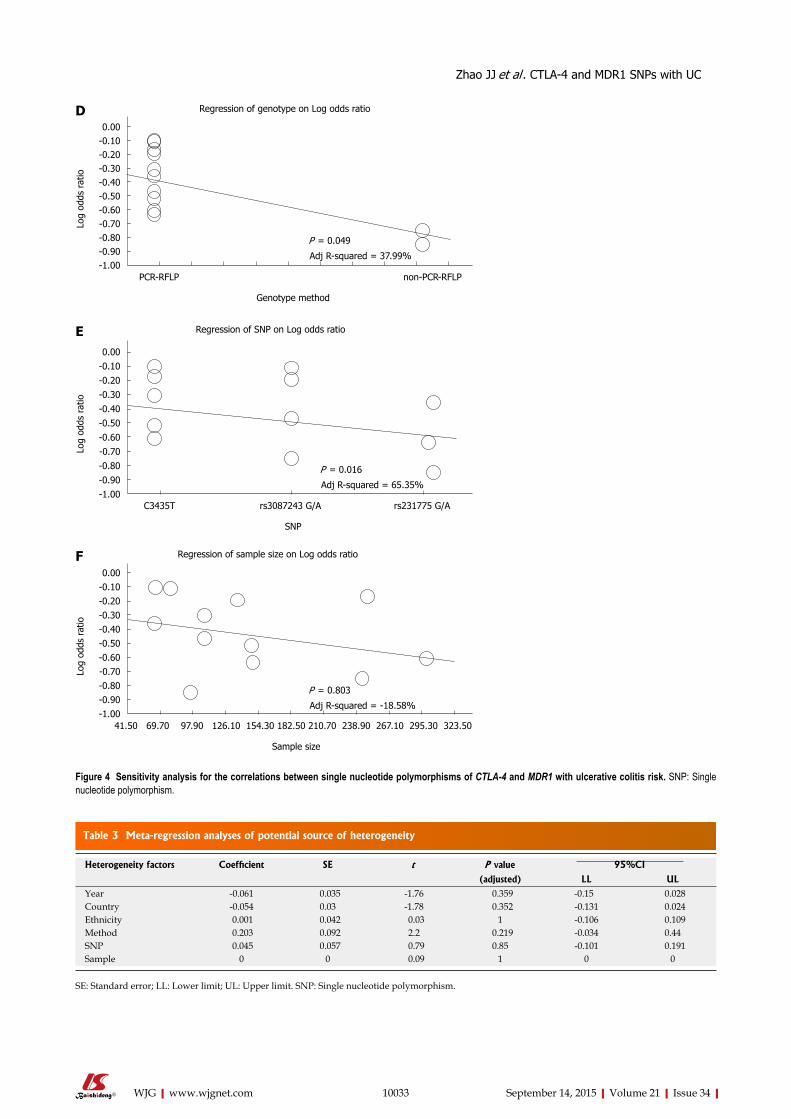
10033 September 14, 2015|Volume 21|Issue 34|WJG|www.wjgnet.com
Table 3 Meta-regression analyses of potential source of heterogeneity
Heterogeneity factors Coefficient SE t P value 95%CI
(adjusted) LL ULYear -0.061 0.035 -1.76 0.359 -0.15 0.028Country -0.054 0.03 -1.78 0.352 -0.131 0.024Ethnicity 0.001 0.042 0.03 1 -0.106 0.109Method 0.203 0.092 2.2 0.219 -0.034 0.44SNP 0.045 0.057 0.79 0.85 -0.101 0.191Sample 0 0 0.09 1 0 0
SE: Standard error; LL: Lower limit; UL: Upper limit. SNP: Single nucleotide polymorphism.
Figure 4 Sensitivity analysis for the correlations between single nucleotide polymorphisms of CTLA-4 and MDR1 with ulcerative colitis risk. SNP: Single nucleotide polymorphism.
Regression of genotype on Log odds ratio
0.00-0.10-0.20-0.30-0.40-0.50-0.60-0.70-0.80-0.90-1.00
Log
odds
rat
io
PCR-RFLP non-PCR-RFLP
Genotype method
P = 0.049
Adj R-squared = 37.99%
D
Regression of sample size on Log odds ratio
0.00-0.10-0.20-0.30-0.40-0.50-0.60-0.70-0.80-0.90-1.00
Log
odds
rat
io
41.50 69.70 97.90 126.10 154.30 182.50 210.70 238.90 267.10 295.30 323.50
Sample size
P = 0.803
Adj R-squared = -18.58%
F
SNP
Regression of SNP on Log odds ratio
0.00-0.10-0.20-0.30-0.40-0.50-0.60-0.70-0.80-0.90-1.00
Log
odds
rat
io
C3435T rs3087243 G/A rs231775 G/A
P = 0.016
Adj R-squared = 65.35%
E
Zhao JJ et al . CTLA-4 and MDR1 SNPs with UC
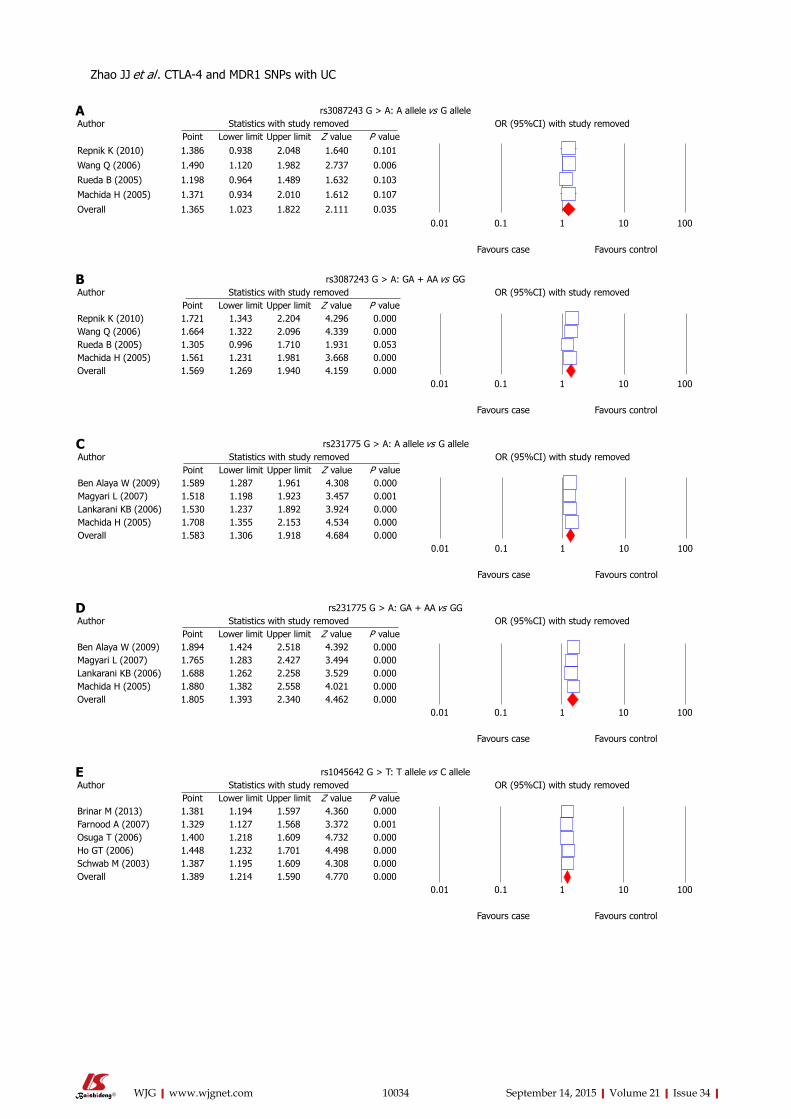
10034 September 14, 2015|Volume 21|Issue 34|WJG|www.wjgnet.com
rs3087243 G > A: A allele vs G alleleAuthor Statistics with study removed OR (95%CI) with study removed
Point Lower limit Upper limit Z value P valueRepnik K (2010) 1.386 0.938 2.048 1.640 0.101
Wang Q (2006) 1.490 1.120 1.982 2.737 0.006
Rueda B (2005) 1.198 0.964 1.489 1.632 0.103
Machida H (2005) 1.371 0.934 2.010 1.612 0.107
Overall 1.365 1.023 1.822 2.111 0.0350.01 0.1 1 10 100
Favours case Favours control
A
rs231775 G > A: A allele vs G alleleAuthor Statistics with study removed OR (95%CI) with study removed
Point Lower limit Upper limit Z value P valueBen Alaya W (2009) 1.589 1.287 1.961 4.308 0.000Magyari L (2007) 1.518 1.198 1.923 3.457 0.001Lankarani KB (2006) 1.530 1.237 1.892 3.924 0.000Machida H (2005) 1.708 1.355 2.153 4.534 0.000Overall 1.583 1.306 1.918 4.684 0.000
0.01 0.1 1 10 100
Favours case Favours control
C
rs3087243 G > A: GA + AA vs GGAuthor Statistics with study removed OR (95%CI) with study removed
Point Lower limit Upper limit Z value P valueRepnik K (2010) 1.721 1.343 2.204 4.296 0.000Wang Q (2006) 1.664 1.322 2.096 4.339 0.000Rueda B (2005) 1.305 0.996 1.710 1.931 0.053Machida H (2005) 1.561 1.231 1.981 3.668 0.000Overall 1.569 1.269 1.940 4.159 0.000
0.01 0.1 1 10 100
Favours case Favours control
B
rs231775 G > A: GA + AA vs GGAuthor Statistics with study removed OR (95%CI) with study removed
Point Lower limit Upper limit Z value P valueBen Alaya W (2009) 1.894 1.424 2.518 4.392 0.000Magyari L (2007) 1.765 1.283 2.427 3.494 0.000Lankarani KB (2006) 1.688 1.262 2.258 3.529 0.000Machida H (2005) 1.880 1.382 2.558 4.021 0.000Overall 1.805 1.393 2.340 4.462 0.000
0.01 0.1 1 10 100
Favours case Favours control
D
rs1045642 G > T: T allele vs C alleleAuthor Statistics with study removed OR (95%CI) with study removed
Point Lower limit Upper limit Z value P valueBrinar M (2013) 1.381 1.194 1.597 4.360 0.000Farnood A (2007) 1.329 1.127 1.568 3.372 0.001Osuga T (2006) 1.400 1.218 1.609 4.732 0.000Ho GT (2006) 1.448 1.232 1.701 4.498 0.000Schwab M (2003) 1.387 1.195 1.609 4.308 0.000Overall 1.389 1.214 1.590 4.770 0.000
0.01 0.1 1 10 100
Favours case Favours control
E
Zhao JJ et al . CTLA-4 and MDR1 SNPs with UC
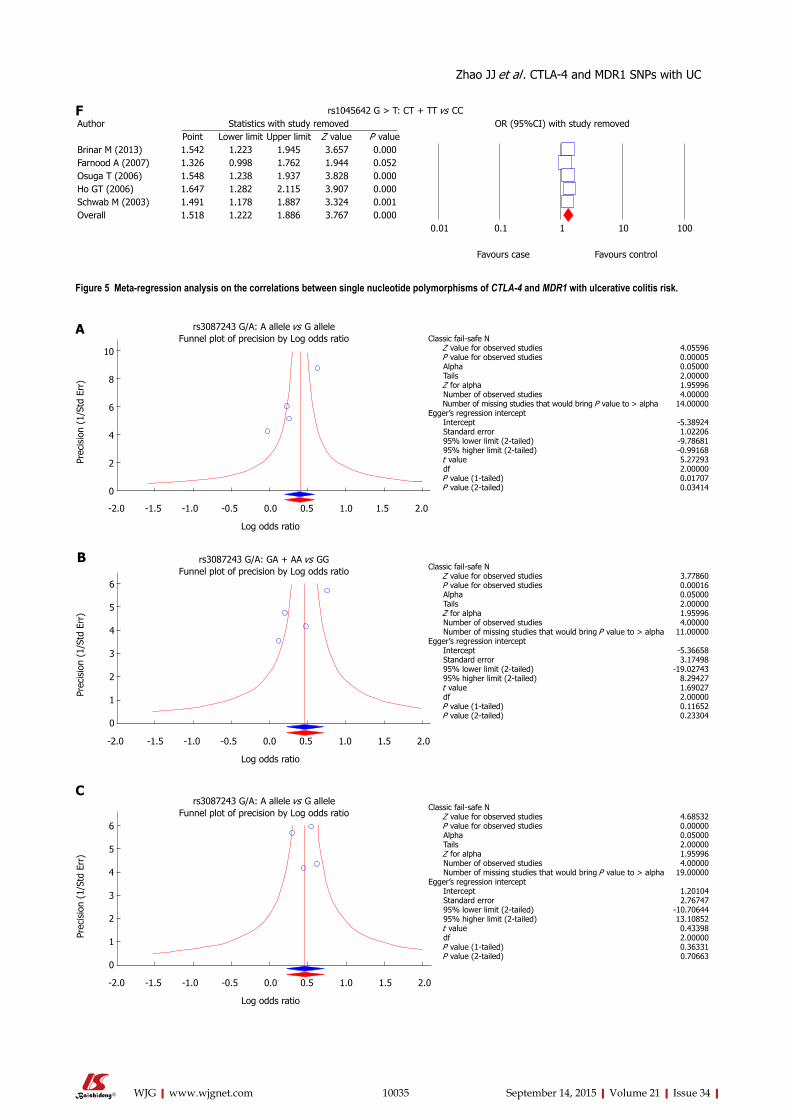
10035 September 14, 2015|Volume 21|Issue 34|WJG|www.wjgnet.com
Figure 5 Meta-regression analysis on the correlations between single nucleotide polymorphisms of CTLA-4 and MDR1 with ulcerative colitis risk.
rs1045642 G > T: CT + TT vs CCAuthor Statistics with study removed OR (95%CI) with study removed
Point Lower limit Upper limit Z value P valueBrinar M (2013) 1.542 1.223 1.945 3.657 0.000Farnood A (2007) 1.326 0.998 1.762 1.944 0.052Osuga T (2006) 1.548 1.238 1.937 3.828 0.000Ho GT (2006) 1.647 1.282 2.115 3.907 0.000Schwab M (2003) 1.491 1.178 1.887 3.324 0.001Overall 1.518 1.222 1.886 3.767 0.000
0.01 0.1 1 10 100
Favours case Favours control
F
10
8
6
4
2
0
Prec
isio
n (1
/Std
Err
)
-2.0 -1.5 -1.0 -0.5 0.0 0.5 1.0 1.5 2.0
Log odds ratio
rs3087243 G/A: A allele vs G alleleFunnel plot of precision by Log odds ratio Classic fail-safe N
Z value for observed studies P value for observed studies Alpha Tails Z for alpha Number of observed studies Number of missing studies that would bring P value to > alphaEgger’s regression intercept Intercept Standard error 95% lower limit (2-tailed) 95% higher limit (2-tailed) t value df P value (1-tailed) P value (2-tailed)
4.055960.000050.050002.000001.959964.00000
14.00000
-5.389241.02206
-9.78681-0.991685.272932.000000.017070.03414
A
Prec
isio
n (1
/Std
Err
)
-2.0 -1.5 -1.0 -0.5 0.0 0.5 1.0 1.5 2.0
Log odds ratio
rs3087243 G/A: A allele vs G alleleFunnel plot of precision by Log odds ratio
Classic fail-safe N Z value for observed studies P value for observed studies Alpha Tails Z for alpha Number of observed studies Number of missing studies that would bring P value to > alphaEgger’s regression intercept Intercept Standard error 95% lower limit (2-tailed) 95% higher limit (2-tailed) t value df P value (1-tailed) P value (2-tailed)
4.685320.000000.050002.000001.959964.00000
19.00000
1.201042.76747
-10.7064413.108520.433982.000000.363310.70663
C
6
5
4
3
2
1
0
Prec
isio
n (1
/Std
Err
)
-2.0 -1.5 -1.0 -0.5 0.0 0.5 1.0 1.5 2.0
Log odds ratio
rs3087243 G/A: GA + AA vs GGFunnel plot of precision by Log odds ratio Classic fail-safe N
Z value for observed studies P value for observed studies Alpha Tails Z for alpha Number of observed studies Number of missing studies that would bring P value to > alphaEgger’s regression intercept Intercept Standard error 95% lower limit (2-tailed) 95% higher limit (2-tailed) t value df P value (1-tailed) P value (2-tailed)
3.778600.000160.050002.000001.959964.00000
11.00000
-5.366583.17498
-19.027438.294271.690272.000000.116520.23304
6
5
4
3
2
1
0
B
Zhao JJ et al . CTLA-4 and MDR1 SNPs with UC
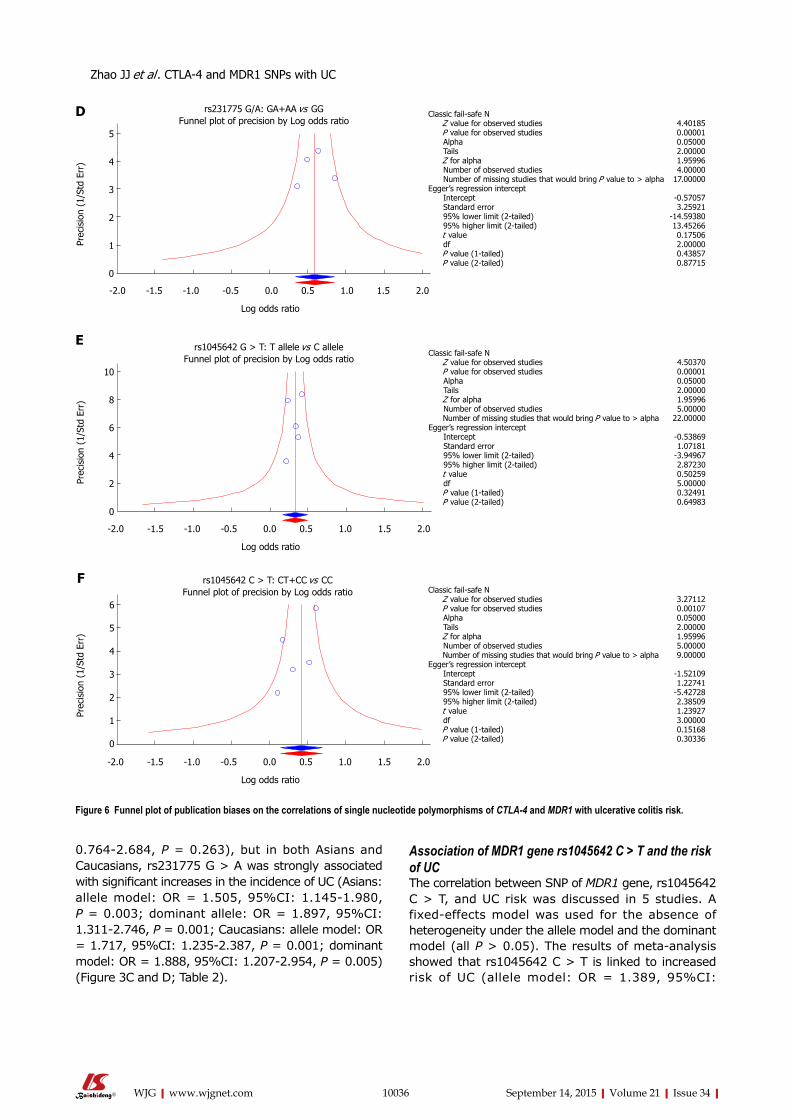
10036 September 14, 2015|Volume 21|Issue 34|WJG|www.wjgnet.com
0.764-2.684, P = 0.263), but in both Asians and Caucasians, rs231775 G > A was strongly associated with significant increases in the incidence of UC (Asians: allele model: OR = 1.505, 95%CI: 1.145-1.980, P = 0.003; dominant allele: OR = 1.897, 95%CI: 1.311-2.746, P = 0.001; Caucasians: allele model: OR = 1.717, 95%CI: 1.235-2.387, P = 0.001; dominant model: OR = 1.888, 95%CI: 1.207-2.954, P = 0.005) (Figure 3C and D; Table 2).
Association of MDR1 gene rs1045642 C > T and the risk of UCThe correlation between SNP of MDR1 gene, rs1045642 C > T, and UC risk was discussed in 5 studies. A fixed-effects model was used for the absence of heterogeneity under the allele model and the dominant model (all P > 0.05). The results of meta-analysis showed that rs1045642 C > T is linked to increased risk of UC (allele model: OR = 1.389, 95%CI:
Figure 6 Funnel plot of publication biases on the correlations of single nucleotide polymorphisms of CTLA-4 and MDR1 with ulcerative colitis risk.
5
4
3
2
1
0
Prec
isio
n (1
/Std
Err
)
-2.0 -1.5 -1.0 -0.5 0.0 0.5 1.0 1.5 2.0
Log odds ratio
rs231775 G/A: GA+AA vs GGFunnel plot of precision by Log odds ratio
Classic fail-safe N Z value for observed studies P value for observed studies Alpha Tails Z for alpha Number of observed studies Number of missing studies that would bring P value to > alphaEgger’s regression intercept Intercept Standard error 95% lower limit (2-tailed) 95% higher limit (2-tailed) t value df P value (1-tailed) P value (2-tailed)
4.401850.000010.050002.000001.959964.00000
17.00000
-0.570573.25921
-14.5938013.452660.175062.000000.438570.87715
D
Prec
isio
n (1
/Std
Err
)
-2.0 -1.5 -1.0 -0.5 0.0 0.5 1.0 1.5 2.0
Log odds ratio
rs1045642 C > T: CT+CC vs CCFunnel plot of precision by Log odds ratio Classic fail-safe N
Z value for observed studies P value for observed studies Alpha Tails Z for alpha Number of observed studies Number of missing studies that would bring P value to > alphaEgger’s regression intercept Intercept Standard error 95% lower limit (2-tailed) 95% higher limit (2-tailed) t value df P value (1-tailed) P value (2-tailed)
3.271120.001070.050002.000001.959965.000009.00000
-1.521091.22741
-5.427282.385091.239273.000000.151680.30336
6
5
4
3
2
1
0
F
E
10
8
6
4
2
0
Prec
isio
n (1
/Std
Err
)
-2.0 -1.5 -1.0 -0.5 0.0 0.5 1.0 1.5 2.0
Log odds ratio
rs1045642 G > T: T allele vs C alleleFunnel plot of precision by Log odds ratio
Classic fail-safe N Z value for observed studies P value for observed studies Alpha Tails Z for alpha Number of observed studies Number of missing studies that would bring P value to > alphaEgger’s regression intercept Intercept Standard error 95% lower limit (2-tailed) 95% higher limit (2-tailed) t value df P value (1-tailed) P value (2-tailed)
4.503700.000010.050002.000001.959965.00000
22.00000
-0.538691.07181
-3.949672.872300.502595.000000.324910.64983
Zhao JJ et al . CTLA-4 and MDR1 SNPs with UC
10037 September 14, 2015|Volume 21|Issue 34|WJG|www.wjgnet.com
1.214-1.590, P < 0.001; dominant model: OR = 1.518, 95%CI: 1.222-1.886, P < 0.001) (Figure 2E and F and Table 2). Subgroup analysis based on ethnicity showed a significant association between rs1045642 C > T and the risk of UC in both Asians and Caucasians (Asians: allele model: OR = 1.470, 95%CI: 1.185-1.823, P < 0.001; dominant model: OR = 1.722, 95%CI: 1.257-2.357, P = 0.001; Caucasians: allele model: OR = 1.339, 95%CI: 1.126-1.593, P = 0.001; dominant model: OR = 1.353, 95%CI: 1.002-1.827, P = 0.048) (Figure 3E and F; Table 2).
Sensitivity analysis and publication biasThe results of sensitivity analysis demonstrated that any single study had no significant effect on pooled ORs of correlations between SNPs of CTLA-4 gene rs3087243 G > A, rs231775 G > A and MDR1 gene rs1045642 C > T, and the risk of UC (Figure 4). Univariate meta-regression analysis suggested that publication year, country, ethnicity, sample size, SNP, and detection methods were not the main sources for heterogeneity or the key factors affecting the overall effect values (P > 0.05). Multivariate meta-regression analysis further confirmed that the published year, country, ethnicity, sample size, SNP, and detection methods are not the sources of heterogeneity (Figure 5 and Table 3). Funnel plots for rs3087243 G > A under the allele model were asymmetric, suggesting the existence of publication bias. Classic fail-safe N and Egger’s linear regression tests further confirmed there was publication bias. However, funnel plots for rs3087243 G > A under the dominant model, rs231775 G > A and rs1045642 C > T both under the allele model and dominant model were symmetrical, revealing no significant publication bias. Classic fail-safe N and Egger’s linear regression tests further confirmed there was no publication bias (Figure 6).
DISCUSSIONUC is a non-specific chronic inflammatory disorder which, together with CD, is known as IBD, and it is characterized by diffuse mucosal inflammation confined to the colon[8]. Evidence has revealed that genetic factors and immune dysregulation may be two main important components in the etiology and pathogenesis of UC[38]. Recent genome-wide association studies (GWAS) have discovered multiple genes and loci for UC risk factors; for example, GWAS meta-analyses have established more than 30 loci in CD, and several of these loci have also been found to be correlated to UC[39]. The GWAS that evaluated the correlation between UC and the variants of the CTLA-4 gene and MDR1 genes produced contradictory or inconclusive results; we found that associations have been found in some, but not all populations[40]. Therefore, in order to investigate the correlations between SNPs of the CTLA-4 gene, MDR1 gene and
the risk of UC, a meta-analysis was conducted.Our meta-analysis demonstrated that CTLA-4 gene
polymorphisms, rs3087243 G > A and rs231775 G > A, are closely associated with the increased risk of UC. CTLA-4 is primarily expressed in activated T cells, and it also plays an inhibitory role in the regulation of self-tolerance and T-cell functions, suggesting that CTLA-4, by virtue of its influence on T-cell regulation, may potentially influence UC disease susceptibility[17]. CTLA-4 is described as a vital downregulator of T-cell activation resulting in peripheral tolerance, and is also a negative regulator of T/B, T-cell activation and T/monocyte-macrophage cognate interaction. Thus, CTLA-4 has been recognized as a good candidate gene for the susceptibility to UC[41]. In this context, downregulation of CTLA-4 may contribute to an exaggerated T cell response, along with a persistent inflammation response in the gastrointestinal mucosa, possibly initiating the development of UC[42]. Data from a previous study showed that the CTLA-4 gene is involved in the pathogenesis of IBD and UC among Slovenian patients and that CT60 (rs3087243 G > A) polymorphism is an important target regulating CTLA-4 gene expression[35].
Our meta-analysis also revealed a significant association between MDR1 gene polymorphism, rs1045642 C > T, and the risk of UC. As an energy-dependent efflux pump, MDR1 (P-gp) plays a crucial role in the bioavailability and cytotoxicity of a large number of drugs, substances, and xeno-biotics including sugars, glycans, ions, proteins, phospholipids, antibiotics, corticosteroids, anticancer drugs, immunosuppressants, calcium-channel blocker agents and anti- (human immunodeficiency virus) HIV protease inhibitors[43]. UC patients frequently exhibit reduced P-gp expression levels, and MDR1 mRNA expression might also be reduced in the colonic tissue of UC patients. G2677T/A (Ala893Ser/Thr, rs2032582) and C3435T (Ile1145Ile, rs1045642) are two common polymorphisms (variants) in MDR1 gene, and correlate with the function and activity of P-gp[44]. Data from a previous study revealed a 2-fold increased OR for the development of UC in patients with the MDR1 rs1045642 C > T genotype, supporting the notion that P-gp expression plays an essential role in defense against intestinal bacteria and low P-gp expression, as a result of an rs1045642 C > T genotype, contributes to the development of UC[34]. Based on our results and previous studies supporting our conclusions, we propose that individuals with the rs1045642 C > T have a reduced intestinal barrier function, and thus are at a significantly higher risk for developing UC.
To further explore the effect of other influential factors like ethnicity on the correlation between SNPs of CTLA-4 gene, MDR1 gene and the risk of UC, a subsequent subgroup meta-analysis was conducted. Subgroup analysis based on ethnicity showed that in Asians, there was no significant association between
Zhao JJ et al . CTLA-4 and MDR1 SNPs with UC
10038 September 14, 2015|Volume 21|Issue 34|WJG|www.wjgnet.com
rs3087243 G > A and the risk of UC. However, in Caucasians, rs3087243 G > A may increase the risk of UC. In Africans, no significant association was found between rs231775 G > A and the risk of UC. But both in Asians and Caucasians, rs231775 G > A was likely to increase the incidence of UC. Furthermore, both in Asians and Caucasians, there was a significant association between rs1045642 C > T and the risk of UC. Our overall results are consistent with previous studies, which suggested a significant association of SNPs of the CTLA-4 gene and the MDR1 gene with the pathogenesis of UC.
Limitations of this meta-analysis need to be addressed. First, the sample size is relatively small. Second, all eligible studies were written in English and Chinese indexed by the selected databases. It is possible that published studies in other languages or unpublished studies could be missed, which might bias the results. Third, the genotyping methods were not uniform and might increase the deviation of outcomes. Therefore, more studies with larger sample sizes are still needed to provide a more accurate statistical analysis.
This meta-analysis provides strong evidence that SNPs of CTLA-4 gene rs3087243 G > A and rs231775 G > A, and MDR1 gene polymorphism rs1045642 C > T significantly increase the risk of UC, and the polymorphisms can be used as important biological indicators for early diagnosis of UC.
COMMENTSBackgroundUlcerative colitis (UC) is known as an idiopathic, chronic inflammatory disease of the large intestine, frequently involving the rectum, and characterized by continuous inflammation and ulceration of intestinal mucosa and submucosa.
Research frontiersRecently, single nucleotide polymorphisms (SNPs) of Cytotoxic T lymphocyte-associated antigen-4 (CTLA-4) and multi-drug resistance 1 (MDR1) genes were found to be associated with the pathogenesis of UC.
Innovations and breakthroughsThe authors undertook a meta-analysis based approach to evaluate the associations of SNPs of CTLA-4 and MDR1 genes with the risk of UC, by pooling all relevant published data.
ApplicationsThis meta-analysis provides strong evidence that SNPs of CTLA-4 gene rs3087243 G > A and rs231775 G > A, and MDR1 gene polymorphism rs1045642 C > T significantly increase the risk of UC, and the polymorphisms can be used as important biological indicators for early diagnosis of UC
Peer-reviewThe authors address, with their meta-analysis, the risk of ulcerative colitis in the presence of genetic polymorphisms of CTLA and MDR1.
REFERENCES1 Reinisch W, Sandborn WJ, Hommes DW, D’Haens G, Hanauer
S, Schreiber S, Panaccione R, Fedorak RN, Tighe MB, Huang
B, Kampman W, Lazar A, Thakkar R. Adalimumab for induction of clinical remission in moderately to severely active ulcerative colitis: results of a randomised controlled trial. Gut 2011; 60: 780-787 [PMID: 21209123 DOI: 10.1136/gut.2010.221127]
2 Kornbluth A, Sachar DB. Ulcerative colitis practice guidelines in adults: American College Of Gastroenterology, Practice Parameters Committee. Am J Gastroenterol 2010; 105: 501-523; quiz 524 [PMID: 20068560 DOI: 10.1038/ajg.2009.727]
3 Krishnan K, Arnone B, Buchman A. Intestinal growth factors: potential use in the treatment of inflammatory bowel disease and their role in mucosal healing. Inflamm Bowel Dis 2011; 17: 410-422 [PMID: 20848489 DOI: 10.1002/ibd.21316]
4 Maloy KJ, Powrie F. Intestinal homeostasis and its breakdown in inflammatory bowel disease. Nature 2011; 474: 298-306 [PMID: 21677746 DOI: 10.1038/nature10208]
5 Salim SY, Söderholm JD. Importance of disrupted intestinal barrier in inflammatory bowel diseases. Inflamm Bowel Dis 2011; 17: 362-381 [PMID: 20725949 DOI: 10.1002/ibd.21403]
6 Colombel JF, Rutgeerts P, Reinisch W, Esser D, Wang Y, Lang Y, Marano CW, Strauss R, Oddens BJ, Feagan BG, Hanauer SB, Lichtenstein GR, Present D, Sands BE, Sandborn WJ. Early mucosal healing with infliximab is associated with improved long-term clinical outcomes in ulcerative colitis. Gastroenterology 2011; 141: 1194-1201 [PMID: 21723220 DOI: 10.1053/j.gastro.2011.06.054]
7 Sandborn WJ, Ghosh S, Panes J, Vranic I, Su C, Rousell S, Niezychowski W. Tofacitinib, an oral Janus kinase inhibitor, in active ulcerative colitis. N Engl J Med 2012; 367: 616-624 [PMID: 22894574 DOI: 10.1056/NEJMoa1112168]
8 Jiang T, Ge LQ, Chen ZT, Li C, Zhou F, Luo Y, Xia B. Effect of cytotoxic T lymphocyte-associated molecule 4 1661 gene polymorphism on its expression and transcription in ulcerative colitis. J Dig Dis 2010; 11: 369-375 [PMID: 21091900 DOI: 10.1111/j.1751-2980.2010.00462.x]
9 Herrlinger KR, Koc H, Winter S, Teml A, Stange EF, Fellermann K, Fritz P, Schwab M, Schaeffeler E. ABCB1 single-nucleotide polymorphisms determine tacrolimus response in patients with ulcerative colitis. Clin Pharmacol Ther 2011; 89: 422-428 [PMID: 21289623 DOI: 10.1038/clpt.2010.348]
10 Gao JW, Guo YF, Fan Y, Qiu JX, Bao ED, Liu Y, Qin Y, Zhang F. Polymorphisms in cytotoxic T lymphocyte associated antigen-4 influence the rate of acute rejection after renal transplantation in 167 Chinese recipients. Transpl Immunol 2012; 26: 207-211 [PMID: 22418270 DOI: 10.1016/j.trim.2012.02.005]
11 Li M, Zheng H, Li T, Gao P, Zhang XL, Liu DW. Cytotoxic T-lymphocyte associated antigen-4 gene polymorphisms and primary biliary cirrhosis: a systematic review. J Gastroenterol Hepatol 2012; 27: 1159-1166 [PMID: 22414241 DOI: 10.1111/j.1440-1746.2012.07118.x]
12 Wells AD, Walsh MC, Bluestone JA, Turka LA. Signaling through CD28 and CTLA-4 controls two distinct forms of T cell anergy. J Clin Invest 2001; 108: 895-903 [PMID: 11560959 DOI: 10.1172/JCI13220]
13 Tang ST, Tang HQ, Zhang Q, Wang CJ, Wang YM, Peng WJ. Association of cytotoxic T-lymphocyte associated antigen 4 gene polymorphism with type 1 diabetes mellitus: a meta-analysis. Gene 2012; 508: 165-187 [PMID: 22964358 DOI: 10.1016/j.gene.2012.07.044]
14 Ni LN, Li JY, Miao KR, Qiao C, Zhang SJ, Qiu HR, Qian SX. Multidrug resistance gene (MDR1) polymorphisms correlate with imatinib response in chronic myeloid leukemia. Med Oncol 2011; 28: 265-269 [PMID: 20204543 DOI: 10.1007/s12032-010-9456-9]
15 Bodor M, Kelly EJ, Ho RJ. Characterization of the human MDR1 gene. AAPS J 2005; 7: E1-E5 [PMID: 16146331 DOI: 10.1208/aapsj070101]
16 Takakura Y, Hinoi T, Oue N, Sasada T, Kawaguchi Y, Okajima M, Akyol A, Fearon ER, Yasui W, Ohdan H. CDX2 regulates multidrug resistance 1 gene expression in malignant intestinal epithelium. Cancer Res 2010; 70: 6767-6778 [PMID: 20699370 DOI: 10.1158/0008-5472.CAN-09-4701]
COMMENTS
Zhao JJ et al . CTLA-4 and MDR1 SNPs with UC
10039 September 14, 2015|Volume 21|Issue 34|WJG|www.wjgnet.com
17 Ben Alaya W, Sfar I, Aouadi H, Jendoubi S, Najjar T, Filali A, Gorgi Y, Ben Abdallah T, Mouelhi L, Matri S, Ayed K. Association between CTLA-4 gene promoter (49 A/G) in exon 1 polymorphisms and inflammatory bowel disease in the Tunisian population. Saudi J Gastroenterol 2009; 15: 29-34 [PMID: 19568552 DOI: 10.4103/1319-3767.43285]
18 Zintzaras E. Is there evidence to claim or deny association between variants of the multidrug resistance gene (MDR1 or ABCB1) and inflammatory bowel disease? Inflamm Bowel Dis 2012; 18: 562-572 [PMID: 21887726 DOI: 10.1002/ibd.21728]
19 Magyari L, Faragó B, Bene J, Horvatovich K, Lakner L, Varga M, Figler M, Gasztonyi B, Mózsik G, Melegh B. No association of the cytotoxic T-lymphocyte associated gene CTLA4 +49A/G polymorphisms with Crohn’s disease and ulcerative colitis in Hungarian population samples. World J Gastroenterol 2007; 13: 2205-2208 [PMID: 17465502 DOI: 10.3748/wjg.v13.i15.2205]
20 Rueda B, Zhernakova A, López-Nevot MA, Gomez-Garcia M, Ortega E, Piñero A, Correro F, Brieva JA, Nieto A, Koeleman BP, Martín J. CTLA4/CT60 polymorphism is not relevant in susceptibility to autoimmune inflammatory intestinal disorders. Hum Immunol 2005; 66: 321-325 [PMID: 15784471 DOI: 10.1016/j.humimm.2004.11.005]
21 Chen H, Manning AK, Dupuis J. A method of moments estimator for random effect multivariate meta-analysis. Biometrics 2012; 68: 1278-1284 [PMID: 22551393 DOI: 10.1111/j.1541-0420.2012.01761.x]
22 Jackson D, White IR, Riley RD. Quantifying the impact of between-study heterogeneity in multivariate meta-analyses. Stat Med 2012; 31: 3805-3820 [PMID: 22763950 DOI: 10.1002/sim.5453]
23 Peters JL, Sutton AJ, Jones DR, Abrams KR, Rushton L. Comparison of two methods to detect publication bias in meta-analysis. JAMA 2006; 295: 676-680 [PMID: 16467236 DOI: 10.1001/jama.295.6.676]
24 Zintzaras E, Ioannidis JP. Heterogeneity testing in meta-analysis of genome searches. Genet Epidemiol 2005; 28: 123-137 [PMID: 15593093 DOI: 10.1002/gepi.20048]
25 Huizenga HM, Visser I, Dolan CV. Testing overall and moderator effects in random effects meta-regression. Br J Math Stat Psychol 2011; 64: 1-19 [PMID: 21506942 DOI: 10.1348/000711010X522687]
26 Ferrenberg AM, Swendsen RH. New Monte Carlo technique for studying phase transitions. Phys Rev Lett 1988; 61: 2635-2638 [PMID: 10039183]
27 Wikstrom EA , Naik S, Lodha N, Cauraugh JH. Balance capabilities after lateral ankle trauma and intervention: a meta-analysis. Med Sci Sports Exerc 2009; 41: 1287-1295 [PMID: 19461536 DOI: 10.1249/MSS.0b013e318196cbc6]
28 Egger M, Davey Smith G, Schneider M, Minder C. Bias in meta-analysis detected by a simple, graphical test. BMJ 1997; 315: 629-634 [PMID: 9310563]
29 Brinar M, Cukovic-Cavka S, Bozina N, Ravic KG, Markos P, Ladic A, Cota M, Krznaric Z, Vucelic B. MDR1 polymorphisms are associated with inflammatory bowel disease in a cohort of Croatian IBD patients. BMC Gastroenterol 2013; 13: 57 [PMID: 23537364 DOI: 10.1186/1471-230x-13-57]
30 Farnood A, Naderi N, Moghaddam SJ, Noorinayer B, Firouzi F, Aghazadeh R, daryani NE, Zali MR. The frequency of C3435T MDR1 gene polymorphism in Iranian patients with ulcerative colitis. Int J Colorectal Dis 2007; 22: 999-1003 [PMID: 17242936 DOI: 10.1007/s00384-007-0270-6]
31 Ho GT, Soranzo N, Nimmo ER, Tenesa A, Goldstein DB, Satsangi J. ABCB1/MDR1 gene determines susceptibility and phenotype in ulcerative colitis: discrimination of critical variants using a gene-wide haplotype tagging approach. Hum Mol Genet 2006; 15: 797-805 [PMID: 16434479 DOI: 10.1093/hmg/ddi494]
32 Lankarani KB, Karbasi A, Kalantari T, Yarmohammadi H, Saberi-Firoozi M, Alizadeh-Naeeni M, Taghavi AR, Fattahi MR, Ghaderi A. Analysis of cytotoxic T lymphocyte associated antigen 4 gene
polymorphisms in patients with ulcerative colitis. J Gastroenterol Hepatol 2006; 21: 449-453 [PMID: 16509873 DOI: 10.1111/j.1440-1746.2005.03956.x]
33 Machida H, Tsukamoto K, Wen CY, Narumi Y, Shikuwa S, Isomoto H, Takeshima F, Mizuta Y, Niikawa N, Murata I, Kohno S. Association of polymorphic alleles of CTLA4 with inflammatory bowel disease in the Japanese. World J Gastroenterol 2005; 11: 4188-4193 [PMID: 16015687]
34 Osuga T, Sakaeda T, Nakamura T, Yamada T, Koyama T, Tamura T, Aoyama N, Okamura N, Kasuga M, Okumura K. MDR1 C3435T polymorphism is predictive of later onset of ulcerative colitis in Japanese. Biol Pharm Bull 2006; 29: 324-329 [PMID: 16462040]
35 Repnik K , Potocnik U. CTLA4 CT60 single-nucleotide polymorphism is associated with Slovenian inflammatory bowel disease patients and regulates expression of CTLA4 isoforms. DNA Cell Biol 2010; 29: 603-610 [PMID: 20491567 DOI: 10.1089/dna.2010.1021]
36 Schwab M, Schaeffeler E, Marx C, Fromm MF, Kaskas B, Metzler J, Stange E, Herfarth H, Schoelmerich J, Gregor M, Walker S, Cascorbi I, Roots I, Brinkmann U, Zanger UM, Eichelbaum M. Association between the C3435T MDR1 gene polymorphism and susceptibility for ulcerative colitis. Gastroenterology 2003; 124: 26-33 [PMID: 12512026 DOI: 10.1053/gast.2003.50010]
37 Wang Q, Xia B. Association between the cytotoxic T lymphocyte associated antigen 4/CT60 gene polymorphism and ulcerative colitis in the Chinese. Zhonghua Weichangbingxue Yu Ganbingxue Zazhi 2006; 15: 158-160 [DOI: 10.3969/j.issn.1006-5709.2006.02.019]
38 Vermeire S, Rutgeerts P. Current status of genetics research in inflammatory bowel disease. Genes Immun 2005; 6: 637-645 [PMID: 16107869 DOI: 10.1038/sj.gene.6364257]
39 Rioux JD, Xavier RJ, Taylor KD, Silverberg MS, Goyette P, Huett A, Green T, Kuballa P, Barmada MM, Datta LW, Shugart YY, Griffiths AM, Targan SR, Ippoliti AF, Bernard EJ, Mei L, Nicolae DL, Regueiro M, Schumm LP, Steinhart AH, Rotter JI, Duerr RH, Cho JH, Daly MJ, Brant SR. Genome-wide association study identifies new susceptibility loci for Crohn disease and implicates autophagy in disease pathogenesis. Nat Genet 2007; 39: 596-604 [PMID: 17435756 DOI: 10.1038/ng2032]
40 Barrett JC, Hansoul S, Nicolae DL, Cho JH, Duerr RH, Rioux JD, Brant SR, Silverberg MS, Taylor KD, Barmada MM, Bitton A, Dassopoulos T, Datta LW, Green T, Griffiths AM, Kistner EO, Murtha MT, Regueiro MD, Rotter JI, Schumm LP, Steinhart AH, Targan SR, Xavier RJ, Libioulle C, Sandor C, Lathrop M, Belaiche J, Dewit O, Gut I, Heath S, Laukens D, Mni M, Rutgeerts P, Van Gossum A, Zelenika D, Franchimont D, Hugot JP, de Vos M, Vermeire S, Louis E, Cardon LR, Anderson CA, Drummond H, Nimmo E, Ahmad T, Prescott NJ, Onnie CM, Fisher SA, Marchini J, Ghori J, Bumpstead S, Gwilliam R, Tremelling M, Deloukas P, Mansfield J, Jewell D, Satsangi J, Mathew CG, Parkes M, Georges M, Daly MJ. Genome-wide association defines more than 30 distinct susceptibility loci for Crohn’s disease. Nat Genet 2008; 40: 955-962 [PMID: 18587394 DOI: 10.1038/ng.175]
41 Chen Z, Brant SR, Li C, Shrestha UK, Jiang T, Zhou F, Jiang Y, Shi X, Zhao Y, Li J, Xia B. CTLA4 -1661A/G and 3’UTR long repeat polymorphisms are associated with ulcerative colitis and influence CTLA4 mRNA and protein expression. Genes Immun 2010; 11: 573-583 [PMID: 20445568 DOI: 10.1038/gene.2010.16]
42 Berman D, Parker SM, Siegel J, Chasalow SD, Weber J, Galbraith S, Targan SR, Wang HL. Blockade of cytotoxic T-lymphocyte antigen-4 by ipilimumab results in dysregulation of gastrointestinal immunity in patients with advanced melanoma. Cancer Immun 2010; 10: 11 [PMID: 21090563]
43 Yang QF, Chen BL, Zhang QS, Zhu ZH, Hu B, He Y, Gao X, Wang YM, Hu PJ, Chen MH, Zeng ZR. Contribution of MDR1 gene polymorphisms on IBD predisposition and response to glucocorticoids in IBD in a Chinese population. J Dig Dis 2015; 16: 22-30 [PMID: 25346426 DOI: 10.1111/1751-2980.12205]
44 Krupoves A, Mack D, Seidman E, Deslandres C, Amre D.
Zhao JJ et al . CTLA-4 and MDR1 SNPs with UC

10040 September 14, 2015|Volume 21|Issue 34|WJG|www.wjgnet.com
Associations between variants in the ABCB1 (MDR1) gene and corticosteroid dependence in children with Crohn’s disease.
Inflamm Bowel Dis 2011; 17: 2308-2317 [PMID: 21987299 DOI: 10.1002/ibd.21608]
P- Reviewer: Kapischke M, Karatapanis S, Pessi T S- Editor: Qi Y L- Editor: O’Neill M E- Editor: Liu XM
Zhao JJ et al . CTLA-4 and MDR1 SNPs with UC
10041 September 14, 2015|Volume 21|Issue 34|WJG|www.wjgnet.com
Hideaki Harada, Satoshi Suehiro, Takanori Shimizu, Yasushi Katsuyama, Kenji Hayasaka, Department of Gastroenterology, New Tokyo Hospital, Chiba 270-2232, Japan
Hideto Ito, Department of Surgery, New Tokyo Hospital, Chiba 270-2232, Japan
Author contributions: Harada H wrote the manuscript and performed the endoscopic procedure; Suehiro S, Shimizu T, Katsuyama Y, Hayasaka K and Ito H managed the patient and provided valuable help on comments.
Supported by New Tokyo Hospital, Chiba, Japan.
Institutional review board statement: This procedure was reviewed and approved by the New Tokyo Hospital Institutional Review Committee.
Informed consent statement: The procedure participant provided informed written consent.
Conflict-of-interest statement: The authors declare no conflict of interest.
Open-Access: This article is an open-access article which was selected by an in-house editor and fully peer-reviewed by external reviewers. It is distributed in accordance with the Creative Commons Attribution Non Commercial (CC BY-NC 4.0) license, which permits others to distribute, remix, adapt, build upon this work non-commercially, and license their derivative works on different terms, provided the original work is properly cited and the use is non-commercial. See: http://creativecommons.org/licenses/by-nc/4.0/
Correspondence to: Hideaki Harada, MD, Director, Department of Gastroenterology, New Tokyo Hospital, 1271 Wanagaya, Matsudo, Chiba 270-2232, Japan. [email protected]: +81-47-7118700Fax: +81-47-3928718
Received: February 21, 2015Peer-review started: March 3, 2015
First decision: April 13, 2015Revised: April 27, 2015Accepted: June 10, 2015Article in press: June 10, 2015Published online: September 14, 2015
AbstractHere we present the case of a 64-year-old female with a duodenal carcinoid tumor treated by ligation-assisted endoscopic submucosal resection (ESMR-L) with cir-cumferential mucosal incision (CMI). Band ligation was effective in resecting the duodenal carcinoid tumor after CMI, with an uneventful post-procedural course. Histopathological examination showed clear tumor margins at deeper tissue levels. Thus, in the present case, ESMR-L with CMI was useful for the treatment of duodenal carcinoid tumor.
Key words: Carcinoid tumor; Submucosal tumor; Duodenum; Ligation-assisted endoscopic submucosal resection; Endoscopic mucosal resection; Endoscopic submucosal dissection; Ligation device
© The Author(s) 2015. Published by Baishideng Publishing Group Inc. All rights reserved.
Core tip: This report presents the case of a 64-year-old female with duodenal carcinoid tumor treated by ligation-assisted endoscopic submucosal resection (ESMR-L) with circumferential mucosal incision (CMI). Band ligation was effective in resecting the duodenal carcinoid tumor after CMI. The post-procedural course was uneventful without bleeding and perforation. Histopathological examination showed clear tumor margins at deeper tissue levels. Thus, ESMR-L with CMI can be effective for the management of duodenal
CASE REPORT
Ligation-assisted endoscopic submucosal resection with circumferential mucosal incision for duodenal carcinoid tumor
Hideaki Harada, Satoshi Suehiro, Takanori Shimizu, Yasushi Katsuyama, Kenji Hayasaka, Hideto Ito
Submit a Manuscript: http://www.wjgnet.com/esps/Help Desk: http://www.wjgnet.com/esps/helpdesk.aspxDOI: 10.3748/wjg.v21.i34.10041
World J Gastroenterol 2015 September 14; 21(34): 10041-10044 ISSN 1007-9327 (print) ISSN 2219-2840 (online)
© 2015 Baishideng Publishing Group Inc. All rights reserved.
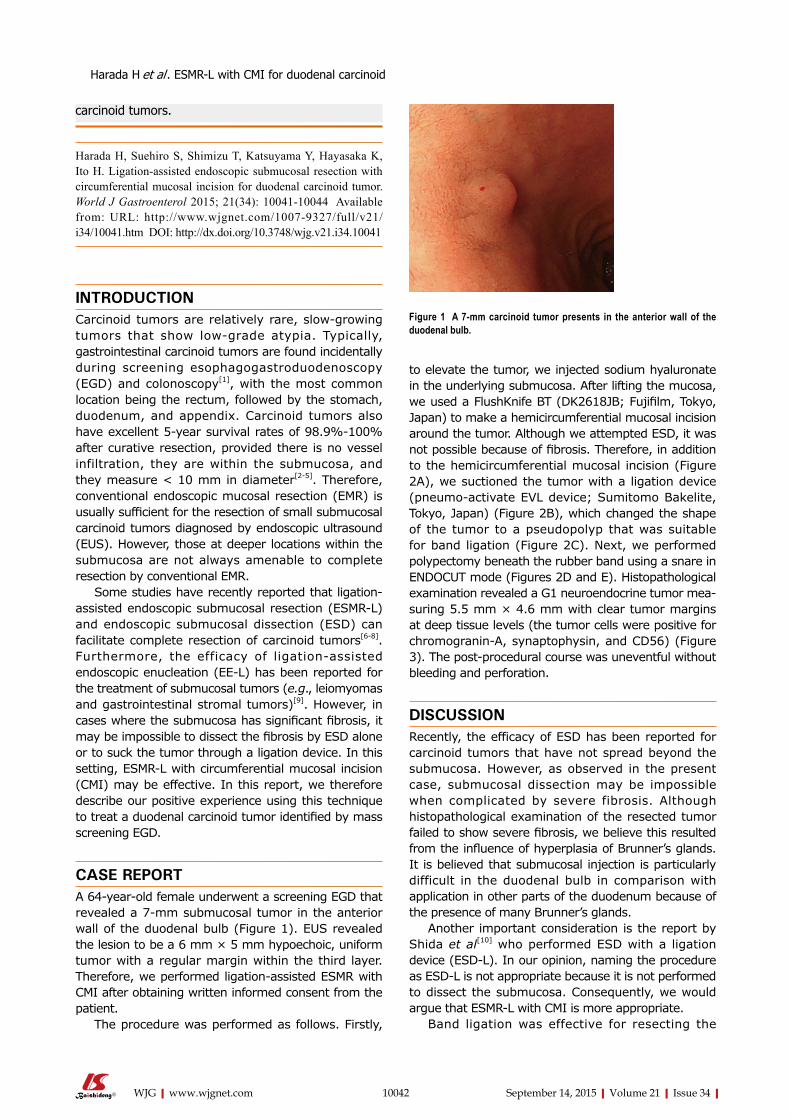
Harada H et al . ESMR-L with CMI for duodenal carcinoid
10042 September 14, 2015|Volume 21|Issue 34|WJG|www.wjgnet.com
to elevate the tumor, we injected sodium hyaluronate in the underlying submucosa. After lifting the mucosa, we used a FlushKnife BT (DK2618JB; Fujifilm, Tokyo, Japan) to make a hemicircumferential mucosal incision around the tumor. Although we attempted ESD, it was not possible because of fibrosis. Therefore, in addition to the hemicircumferential mucosal incision (Figure 2A), we suctioned the tumor with a ligation device (pneumo-activate EVL device; Sumitomo Bakelite, Tokyo, Japan) (Figure 2B), which changed the shape of the tumor to a pseudopolyp that was suitable for band ligation (Figure 2C). Next, we performed polypectomy beneath the rubber band using a snare in ENDOCUT mode (Figures 2D and E). Histopathological examination revealed a G1 neuroendocrine tumor measuring 5.5 mm × 4.6 mm with clear tumor margins at deep tissue levels (the tumor cells were positive for chromograninA, synaptophysin, and CD56) (Figure 3). The postprocedural course was uneventful without bleeding and perforation.
DISCUSSIONRecently, the efficacy of ESD has been reported for carcinoid tumors that have not spread beyond the submucosa. However, as observed in the present case, submucosal dissection may be impossible when complicated by severe fibrosis. Although histopathological examination of the resected tumor failed to show severe fibrosis, we believe this resulted from the influence of hyperplasia of Brunner’s glands. It is believed that submucosal injection is particularly difficult in the duodenal bulb in comparison with application in other parts of the duodenum because of the presence of many Brunner’s glands.
Another important consideration is the report by Shida et al[10] who performed ESD with a ligation device (ESDL). In our opinion, naming the procedure as ESDL is not appropriate because it is not performed to dissect the submucosa. Consequently, we would argue that ESMRL with CMI is more appropriate.
Band ligation was effective for resecting the
Figure 1 A 7-mm carcinoid tumor presents in the anterior wall of the duodenal bulb.
carcinoid tumors.
Harada H, Suehiro S, Shimizu T, Katsuyama Y, Hayasaka K, Ito H. Ligation-assisted endoscopic submucosal resection with circumferential mucosal incision for duodenal carcinoid tumor. World J Gastroenterol 2015; 21(34): 10041-10044 Available from: URL: http://www.wjgnet.com/1007-9327/full/v21/i34/10041.htm DOI: http://dx.doi.org/10.3748/wjg.v21.i34.10041
INTRODUCTIONCarcinoid tumors are relatively rare, slowgrowing tumors that show lowgrade atypia. Typically, gastrointestinal carcinoid tumors are found incidentally during screening esophagogastroduodenoscopy (EGD) and colonoscopy[1], with the most common location being the rectum, followed by the stomach, duodenum, and appendix. Carcinoid tumors also have excellent 5year survival rates of 98.9%100% after curative resection, provided there is no vessel infiltration, they are within the submucosa, and they measure < 10 mm in diameter[25]. Therefore, conventional endoscopic mucosal resection (EMR) is usually sufficient for the resection of small submucosal carcinoid tumors diagnosed by endoscopic ultrasound (EUS). However, those at deeper locations within the submucosa are not always amenable to complete resection by conventional EMR.
Some studies have recently reported that ligationassisted endoscopic submucosal resection (ESMRL) and endoscopic submucosal dissection (ESD) can facilitate complete resection of carcinoid tumors[68]. Furthermore, the efficacy of ligationassisted endoscopic enucleation (EEL) has been reported for the treatment of submucosal tumors (e.g., leiomyomas and gastrointestinal stromal tumors)[9]. However, in cases where the submucosa has significant fibrosis, it may be impossible to dissect the fibrosis by ESD alone or to suck the tumor through a ligation device. In this setting, ESMRL with circumferential mucosal incision (CMI) may be effective. In this report, we therefore describe our positive experience using this technique to treat a duodenal carcinoid tumor identified by mass screening EGD.
CASE REPORTA 64yearold female underwent a screening EGD that revealed a 7mm submucosal tumor in the anterior wall of the duodenal bulb (Figure 1). EUS revealed the lesion to be a 6 mm × 5 mm hypoechoic, uniform tumor with a regular margin within the third layer. Therefore, we performed ligationassisted ESMR with CMI after obtaining written informed consent from the patient.
The procedure was performed as follows. Firstly,
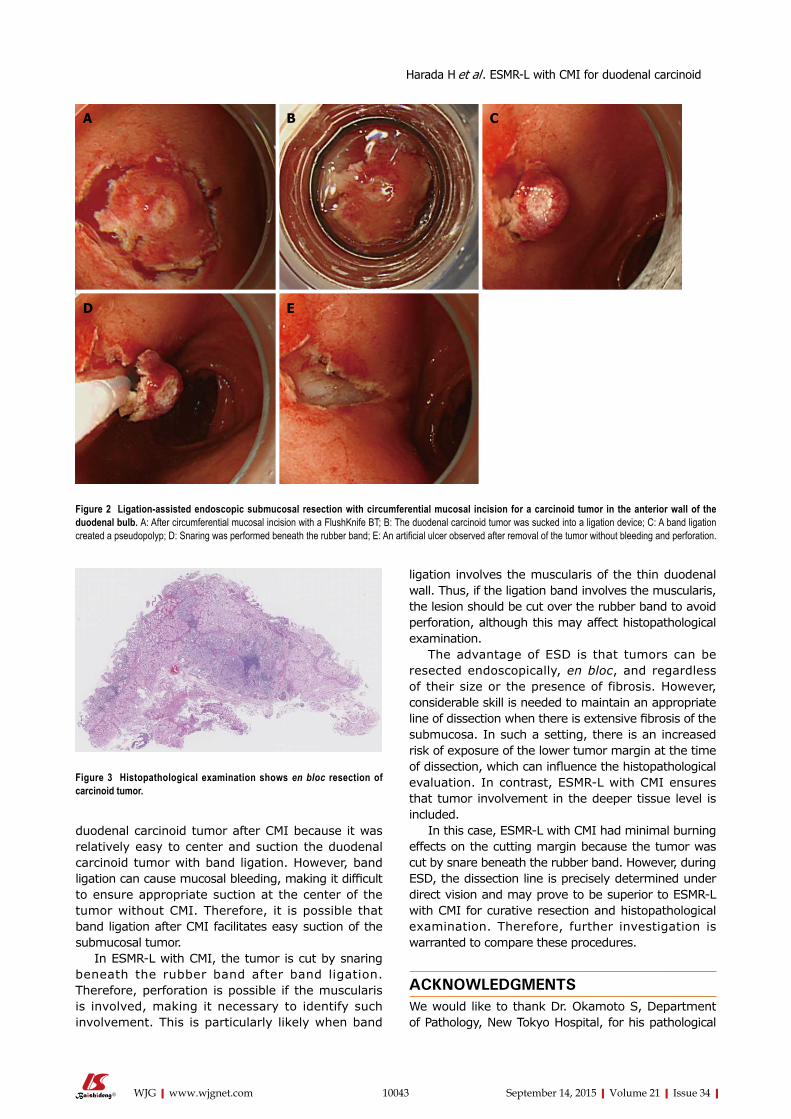
10043 September 14, 2015|Volume 21|Issue 34|WJG|www.wjgnet.com
duodenal carcinoid tumor after CMI because it was relatively easy to center and suction the duodenal carcinoid tumor with band ligation. However, band ligation can cause mucosal bleeding, making it difficult to ensure appropriate suction at the center of the tumor without CMI. Therefore, it is possible that band ligation after CMI facilitates easy suction of the submucosal tumor.
In ESMRL with CMI, the tumor is cut by snaring beneath the rubber band after band ligation. Therefore, perforation is possible if the muscularis is involved, making it necessary to identify such involvement. This is particularly likely when band
ligation involves the muscularis of the thin duodenal wall. Thus, if the ligation band involves the muscularis, the lesion should be cut over the rubber band to avoid perforation, although this may affect histopathological examination.
The advantage of ESD is that tumors can be resected endoscopically, en bloc, and regardless of their size or the presence of fibrosis. However, considerable skill is needed to maintain an appropriate line of dissection when there is extensive fibrosis of the submucosa. In such a setting, there is an increased risk of exposure of the lower tumor margin at the time of dissection, which can influence the histopathological evaluation. In contrast, ESMRL with CMI ensures that tumor involvement in the deeper tissue level is included.
In this case, ESMRL with CMI had minimal burning effects on the cutting margin because the tumor was cut by snare beneath the rubber band. However, during ESD, the dissection line is precisely determined under direct vision and may prove to be superior to ESMRL with CMI for curative resection and histopathological examination. Therefore, further investigation is warranted to compare these procedures.
ACKNOWLEDGMENTSWe would like to thank Dr. Okamoto S, Department of Pathology, New Tokyo Hospital, for his pathological
Figure 2 Ligation-assisted endoscopic submucosal resection with circumferential mucosal incision for a carcinoid tumor in the anterior wall of the duodenal bulb. A: After circumferential mucosal incision with a FlushKnife BT; B: The duodenal carcinoid tumor was sucked into a ligation device; C: A band ligation created a pseudopolyp; D: Snaring was performed beneath the rubber band; E: An artificial ulcer observed after removal of the tumor without bleeding and perforation.
A B C
D E
Figure 3 Histopathological examination shows en bloc resection of carcinoid tumor.
Harada H et al . ESMR-L with CMI for duodenal carcinoid
10044 September 14, 2015|Volume 21|Issue 34|WJG|www.wjgnet.com
advice.
COMMENTSCase characteristicsA 64-year-old female with a submucosal tumor in the duodenal bulb on the anterior wall.
Clinical diagnosisA submucosal tumor was incidentally found by screening esophagogas-troduodenoscopy.
Differential diagnosisGastrointestinal stromal tumor, liposarcoma, angiosarcoma, granular cell tumor, and Brunner’s glands.
Laboratory diagnosisWBC 6.8 k/μL; HGB 13.50 g/dL; Gastrin 115 pg/mL; no remarkable findings for the other laboratory tests.
Imaging diagnosisEsophagogastroduodenoscopy revealed a submucosal tumor in the duodenal bulb on the anterior wall. Endoscopic ultrasound revealed a hypoechoic and uniform tumor, 6 mm × 5 mm diameter, with a regular margin within the third layer.
Pathological diagnosisHistopathological examination showed carcinoid of duodenum, positive for chromogranin-A, synaptophysin, and CD56.
TreatmentThe patient was treated by ligation-assisted endoscopic submucosal resection with circumferential mucosal incision.
Related reportsFew cases of ligation-assisted endoscopic submucosal resection with circumferential mucosal incision for carcinoid tumor have been reported in the literature.
Term explanationCarcinoid tumor, also called neuroendocrine tumor, is a relatively rare tumor which is occasionally found during screening endoscopy.
Experiences and lessonsThis case report described ligation-assisted endoscopic submucosal resection with circumferential mucosal incision for duodenal carcinoid. Band ligation was effective in resecting the duodenal carcinoid tumor after circumferential mucosal incision.
Peer-reviewThe authors have described a case of endoscopic resection for duodenal carcinoid tumor. The article highlights that band ligation facilitated complete resection with sucking the tumor after circumferential mucosal incision.
REFERENCES1 Caldarola VT, Jackman RJ, Moertel CG, Dockerty MB. Carcinoid
tumors of the rectum. Am J Surg 1964; 107: 844-849 [PMID: 14169012 DOI: 10.1016/0002-9610(64)90172-2]
2 Soga J. Early-stage carcinoids of the gastrointestinal tract: an analysis of 1914 reported cases. Cancer 2005; 103: 1587-1595 [PMID: 15742328 DOI: 10.1002/cncr.20939]
3 Konishi T, Watanabe T, Kishimoto J, Kotake K, Muto T, Nagawa H. Prognosis and risk factors of metastasis in colorectal carcinoids: results of a nationwide registry over 15 years. Gut 2007; 56: 863-868 [PMID: 17213340 DOI: 10.1136/gut.2006.109157]
4 Modlin IM, Oberg K, Chung DC, Jensen RT, de Herder WW, Thakker RV, Caplin M, Delle Fave G, Kaltsas GA, Krenning EP, Moss SF, Nilsson O, Rindi G, Salazar R, Ruszniewski P, Sundin A. Gastroenteropancreatic neuroendocrine tumours. Lancet Oncol 2008; 9: 61-72 [PMID: 18177818 DOI: 10.1016/S1470-2045(07)70410-2]
5 Onozato Y, Kakizaki S, Iizuka H, Sohara N, Mori M, Itoh H. Endoscopic treatment of rectal carcinoid tumors. Dis Colon Rectum 2010; 53: 169-176 [PMID: 20087092 DOI: 10.1007/DCR.0b013e3181b9db7b]
6 Ono A, Fujii T, Saito Y, Matsuda T, Lee DT, Gotoda T, Saito D. Endoscopic submucosal resection of rectal carcinoid tumors with a ligation device. Gastrointest Endosc 2003; 57: 583-587 [PMID: 12665777 DOI: 10.1067/S0016-5107(03)00008-7]
7 Lee DS, Jeon SW, Park SY, Jung MK, Cho CM, Tak WY, Kweon YO, Kim SK. The feasibility of endoscopic submucosal dissection for rectal carcinoid tumors: comparison with endoscopic mucosal resection. Endoscopy 2010; 42: 647-651 [PMID: 20669076 DOI: 10.1055/s-0030-1255591]
8 Yamaguchi N, Isomoto H, Nishiyama H, Fukuda E, Ishii H, Nakamura T, Ohnita K, Hayashi T, Kohno S, Nakao K, Shikuwa S. Endoscopic submucosal dissection for rectal carcinoid tumors. Surg Endosc 2010; 24: 504-508 [PMID: 19585069 DOI: 10.1007/s00464-009-0606-0]
9 Guo J, Liu Z, Sun S, Wang S, Ge N, Liu X, Wang G, Yang X. Ligation-assisted endoscopic enucleation for the diagnosis and resection of small gastrointestinal tumors originating from the muscularis propria: a preliminary study. BMC Gastroenterol 2013; 13: 88 [PMID: 23679863 DOI: 10.1186/1471-230X-13-88]
10 Shida T, Aminaka M, Shirai Y, Okimoto K, Tsuruta S, Kita E, Tsuchiya S, Kato K, Takahashi M. Endoscopic submucosal dissection with a ligation device for the treatment of rectal carcinoid tumor. Endoscopy 2012; 44 Suppl 2 UCTN: E4-E5 [PMID: 22396268 DOI: 10.1055/s-0030-1256960]
P- Reviewer: Kirsaclioglu CT, Niimi K S- Editor: Yu J L- Editor: Logan S E- Editor: Liu XM
COMMENTS
Harada H et al . ESMR-L with CMI for duodenal carcinoid
Endoscopic ultrasound-guided biliary drainage: Bilateral systems drainage via left duct approach
Varayu Prachayakul, Pitulak Aswakul
Varayu Prachayakul, Siriraj GI Endoscopy Center, Division of Gastroenterology, Department of Internal Medicine, Siriraj Hospital, Mahidol University, Bangkok 10700, Thailand
Pitulak Aswakul, Liver and Digestive Institute, Samitivej Sukhumvit Hospital, Bangkok 10120, Thailand
Author contributions: Prachayakul V and Aswakul P contributed equally to the conception and writing of the article, and approved the final version to be published.
Institutional review board statement: Approval was obtained from the ethical committee of the Siriraj Internal Review Board.
Informed consent statement: Informed consent was obtained from the patient.
Conflict-of-interest statement: The authors have no conflicts of interest related to this article.
Open-Access: This article is an open-access article which was selected by an in-house editor and fully peer-reviewed by external reviewers. It is distributed in accordance with the Creative Commons Attribution Non Commercial (CC BY-NC 4.0) license, which permits others to distribute, remix, adapt, build upon this work non-commercially, and license their derivative works on different terms, provided the original work is properly cited and the use is non-commercial. See: http://creativecommons.org/licenses/by-nc/4.0/
Correspondence to: Varayu Prachayakul, Associate Professor, Siriraj GI Endoscopy Center, Division of Gastroenterology, Department of Internal Medicine, Siriraj Hospital, Mahidol University, Bangkok 10700, Thailand. [email protected]: +66-818654646Fax: +66-24115013
Received: March 5, 2015Peer-review started: March 7, 2015First decision: April 13, 2015Revised: May 5, 2015Accepted: June 26, 2015Article in press: June 26, 2015Published online: September 14, 2015
CASE REPORT
Submit a Manuscript: http://www.wjgnet.com/esps/Help Desk: http://www.wjgnet.com/esps/helpdesk.aspxDOI: 10.3748/wjg.v21.i34.10045
World J Gastroenterol 2015 September 14; 21(34): 10045-10048 ISSN 1007-9327 (print) ISSN 2219-2840 (online)
© 2015 Baishideng Publishing Group Inc. All rights reserved.
10045 September 14, 2015|Volume 21|Issue 34|WJG|www.wjgnet.com
AbstractEndoscopic ultrasound (EUS)-guided biliary drainage is accepted as a less invasive, alternative treatment for pat ients in whom endoscopic retrograde cholangiopancreatography has failed. Most patients with malignant hilar obstruction undergo EUS-guided hepaticogastrostomy. The authors present the case of a 77-year-old man with advanced hilar cholangiocarcinoma who had undergone a roux-en-Y hepaticojejunostomy several months prior. He developed progressive jaundice and a low-grade fever that persisted for one week. The enteroscopic-assisted endoscopic retrograde cholangiopancreatography failed, thus the patient was scheduled for EUS-guided biliary drainage. In order to obtain adequate drainage, both intrahepatic systems were drained. This report describes the technique used for bilateral drainage via a transgastric approach. Currently, only a few different techniques for EUS-guided right system drainage have been reported in the literature. This case demonstrates that bilateral EUS-guided biliary drainage is feasible and effective in patients with hilar cholangiocarcinoma, and thus can be used as an alternative to percutaneous biliary drainage.
Key words: Biliary drainage; Endoscopic ultrasound-guided; Bilateral systems; Transmural drainage
© The Author(s) 2015. Published by Baishideng Publishing Group Inc. All rights reserved.
Core tip: Endoscopic ultrasound-guided left system drainage via hepaticogastrostomy can be performed with > 90% technical and clinical success in patients with obstructive jaundice. A transgastric approach for endoscopic ultrasound-guided hepaticogastrostomy to drain both intrahepatic systems was successfully performed by manipulating the guidewire until it passed across the stricture point; the two systems were then bridged with a metal stent. The authors propose
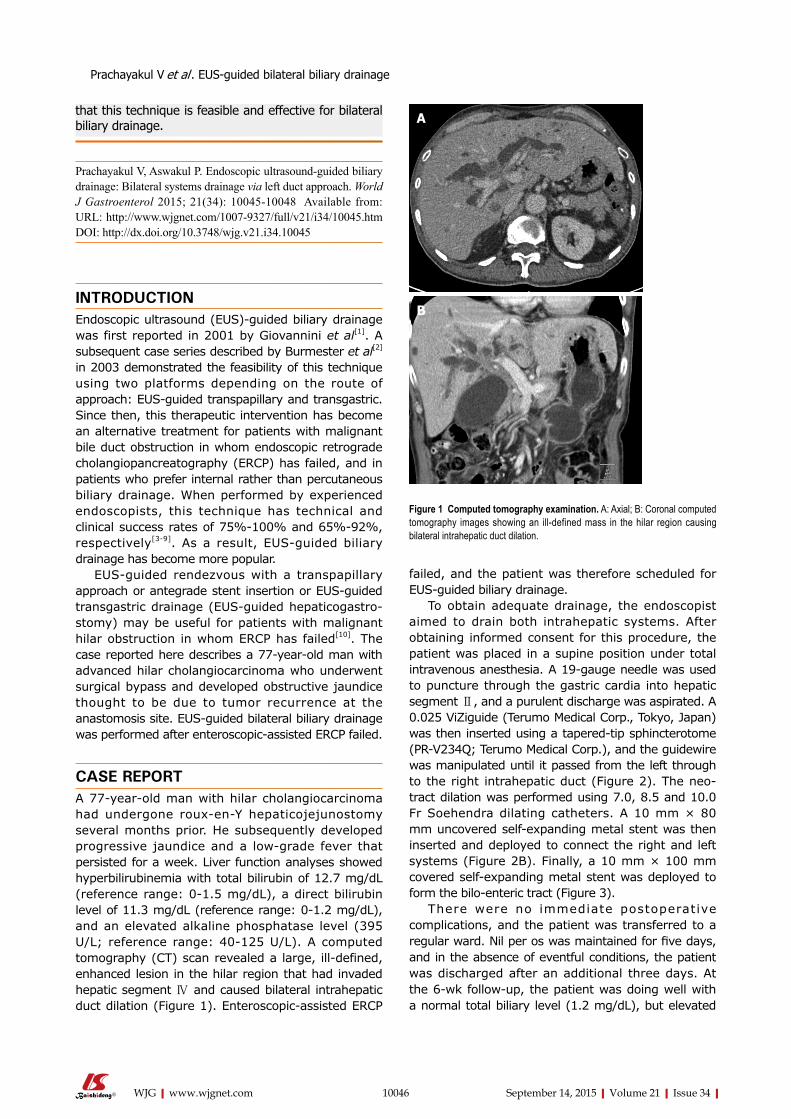
failed, and the patient was therefore scheduled for EUS-guided biliary drainage.
To obtain adequate drainage, the endoscopist aimed to drain both intrahepatic systems. After obtaining informed consent for this procedure, the patient was placed in a supine position under total intravenous anesthesia. A 19-gauge needle was used to puncture through the gastric cardia into hepatic segment Ⅱ, and a purulent discharge was aspirated. A 0.025 ViZiguide (Terumo Medical Corp., Tokyo, Japan) was then inserted using a tapered-tip sphincterotome (PR-V234Q; Terumo Medical Corp.), and the guidewire was manipulated until it passed from the left through to the right intrahepatic duct (Figure 2). The neo-tract dilation was performed using 7.0, 8.5 and 10.0 Fr Soehendra dilating catheters. A 10 mm × 80 mm uncovered self-expanding metal stent was then inserted and deployed to connect the right and left systems (Figure 2B). Finally, a 10 mm × 100 mm covered self-expanding metal stent was deployed to form the bilo-enteric tract (Figure 3).
There were no immediate postoperative complications, and the patient was transferred to a regular ward. Nil per os was maintained for five days, and in the absence of eventful conditions, the patient was discharged after an additional three days. At the 6-wk follow-up, the patient was doing well with a normal total biliary level (1.2 mg/dL), but elevated
Prachayakul V et al . EUS-guided bilateral biliary drainage
10046 September 14, 2015|Volume 21|Issue 34|WJG|www.wjgnet.com
Figure 1 Computed tomography examination. A: Axial; B: Coronal computed tomography images showing an ill-defined mass in the hilar region causing bilateral intrahepatic duct dilation.
A
B
that this technique is feasible and effective for bilateral biliary drainage.
Prachayakul V, Aswakul P. Endoscopic ultrasound-guided biliary drainage: Bilateral systems drainage via left duct approach. World J Gastroenterol 2015; 21(34): 10045-10048 Available from: URL: http://www.wjgnet.com/1007-9327/full/v21/i34/10045.htm DOI: http://dx.doi.org/10.3748/wjg.v21.i34.10045
INTRODUCTIONEndoscopic ultrasound (EUS)-guided biliary drainage was first reported in 2001 by Giovannini et al[1]. A subsequent case series described by Burmester et al[2] in 2003 demonstrated the feasibility of this technique using two platforms depending on the route of approach: EUS-guided transpapillary and transgastric. Since then, this therapeutic intervention has become an alternative treatment for patients with malignant bile duct obstruction in whom endoscopic retrograde cholangiopancreatography (ERCP) has failed, and in patients who prefer internal rather than percutaneous biliary drainage. When performed by experienced endoscopists, this technique has technical and clinical success rates of 75%-100% and 65%-92%, respectively[3-9]. As a result, EUS-guided biliary drainage has become more popular.
EUS-guided rendezvous with a transpapillary approach or antegrade stent insertion or EUS-guided transgastric drainage (EUS-guided hepaticogastro-stomy) may be useful for patients with malignant hilar obstruction in whom ERCP has failed[10]. The case reported here describes a 77-year-old man with advanced hilar cholangiocarcinoma who underwent surgical bypass and developed obstructive jaundice thought to be due to tumor recurrence at the anastomosis site. EUS-guided bilateral biliary drainage was performed after enteroscopic-assisted ERCP failed.
CASE REPORTA 77-year-old man with hilar cholangiocarcinoma had undergone roux-en-Y hepaticojejunostomy several months prior. He subsequently developed progressive jaundice and a low-grade fever that persisted for a week. Liver function analyses showed hyperbilirubinemia with total bilirubin of 12.7 mg/dL (reference range: 0-1.5 mg/dL), a direct bilirubin level of 11.3 mg/dL (reference range: 0-1.2 mg/dL), and an elevated alkaline phosphatase level (395 U/L; reference range: 40-125 U/L). A computed tomography (CT) scan revealed a large, ill-defined, enhanced lesion in the hilar region that had invaded hepatic segment Ⅳ and caused bilateral intrahepatic duct dilation (Figure 1). Enteroscopic-assisted ERCP
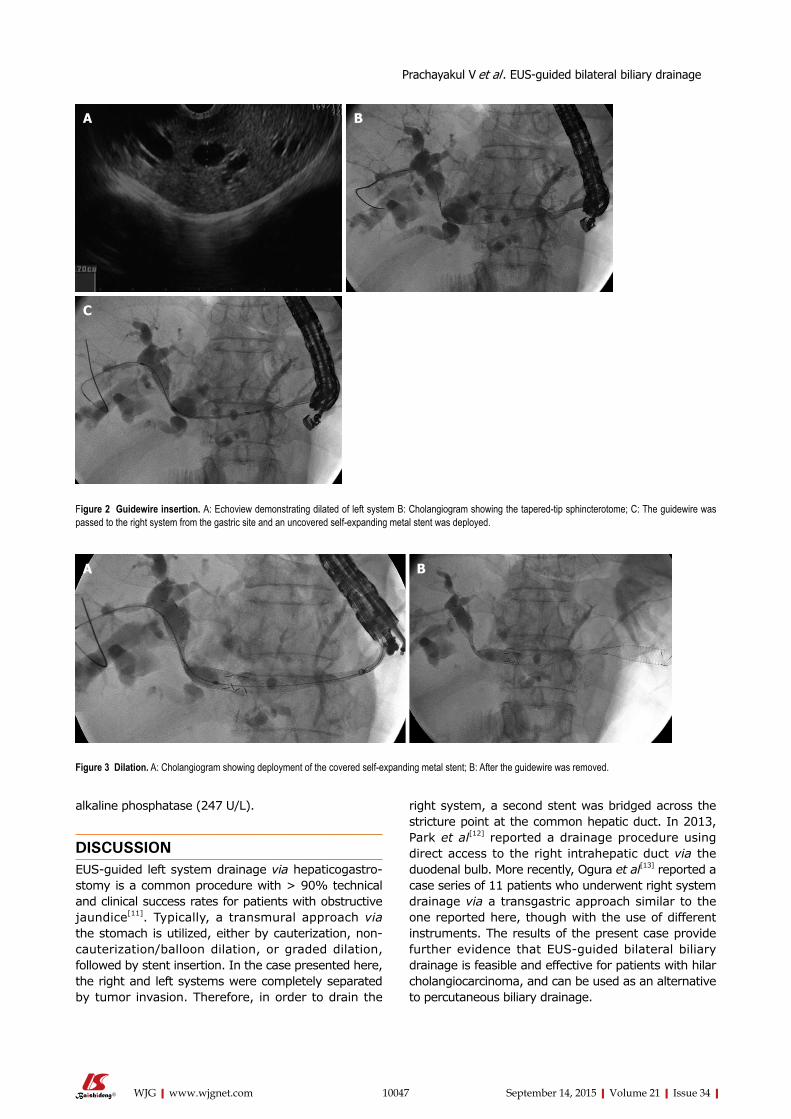
alkaline phosphatase (247 U/L).
DISCUSSIONEUS-guided left system drainage via hepaticogastro-stomy is a common procedure with > 90% technical and clinical success rates for patients with obstructive jaundice[11]. Typically, a transmural approach via the stomach is utilized, either by cauterization, non-cauterization/balloon dilation, or graded dilation, followed by stent insertion. In the case presented here, the right and left systems were completely separated by tumor invasion. Therefore, in order to drain the
right system, a second stent was bridged across the stricture point at the common hepatic duct. In 2013, Park et al[12] reported a drainage procedure using direct access to the right intrahepatic duct via the duodenal bulb. More recently, Ogura et al[13] reported a case series of 11 patients who underwent right system drainage via a transgastric approach similar to the one reported here, though with the use of different instruments. The results of the present case provide further evidence that EUS-guided bilateral biliary drainage is feasible and effective for patients with hilar cholangiocarcinoma, and can be used as an alternative to percutaneous biliary drainage.
10047 September 14, 2015|Volume 21|Issue 34|WJG|www.wjgnet.com
A B
C
Figure 2 Guidewire insertion. A: Echoview demonstrating dilated of left system B: Cholangiogram showing the tapered-tip sphincterotome; C: The guidewire was passed to the right system from the gastric site and an uncovered self-expanding metal stent was deployed.
Figure 3 Dilation. A: Cholangiogram showing deployment of the covered self-expanding metal stent; B: After the guidewire was removed.
Prachayakul V et al . EUS-guided bilateral biliary drainage
A B
2001; 33: 898-900 [PMID: 11571690]2 Burmester E, Niehaus J, Leineweber T, Huetteroth T. EUS-
cholangio-drainage of the bile duct: report of 4 cases. Gastrointest Endosc 2003; 57: 246-251 [PMID: 12556796]
3 Artifon EL , Aparicio D, Paione JB, Lo SK, Bordini A, Rabello C, Otoch JP, Gupta K. Biliary drainage in patients with unresectable, malignant obstruction where ERCP fails: endoscopic ultrasonography-guided choledochoduodenostomy versus percutaneous drainage. J Clin Gastroenterol 2012; 46: 768-774 [PMID: 22810111 DOI: 10.1097/MCG.0b013e31825f264c]
4 Khashab MA, Valeshabad AK, Afghani E, Singh VK, Kumbhari V, Messallam A, Saxena P, El Zein M, Lennon AM, Canto MI, Kalloo AN. A comparative evaluation of EUS-guided biliary drainage and percutaneous drainage in patients with distal malignant biliary obstruction and failed ERCP. Dig Dis Sci 2015; 60: 557-565 [PMID: 25081224 DOI: 10.1007/s10620-014-3300-6]
5 Dhir V, Artifon EL, Gupta K, Vila JJ, Maselli R, Frazao M, Maydeo A. Multicenter study on endoscopic ultrasound-guided expandable biliary metal stent placement: choice of access route, direction of stent insertion, and drainage route. Dig Endosc 2014; 26: 430-435 [PMID: 23941261 DOI: 10.1111/den.12153]
6 Gupta K, Perez-Miranda M, Kahaleh M, Artifon EL, Itoi T, Freeman ML, de-Serna C, Sauer B, Giovannini M. Endoscopic ultrasound-assisted bile duct access and drainage: multicenter, long-term analysis of approach, outcomes, and complications of a technique in evolution. J Clin Gastroenterol 2014; 48: 80-87 [PMID: 23632351 DOI: 10.1097/MCG.0b013e31828c6822]
7 Iqbal S, Friedel DM, Grendell JH, Stavropoulos SN. Outcomes of endoscopic-ultrasound-guided cholangiopancreatography: a literature review. Gastroenterol Res Pract 2013; 2013: 869214 [PMID: 23573080 DOI: 10.1155/2013/869214]
8 Artifon EL, Ferreira FC, Sakai P. Endoscopic ultrasound-guided biliary drainage. Korean J Radiol 2012; 13 Suppl 1: S74-S82 [PMID: 22563291 DOI: 10.3348/kjr.2012.13.S1.S74]
9 Song TJ, Lee SS, Park do H, Seo DW, Lee SK, Kim MH. Preliminary report on a new hybrid metal stent for EUS-guided biliary drainage (with videos). Gastrointest Endosc 2014; 80: 707-711 [PMID: 25053527 DOI: 10.1016/j.gie.2014.05.327]
10 Prachayakul V, Aswakul P. Endoscopic ultrasound-guided biliary drainage as an alternative to percutaneous drainage and surgical bypass. World J Gastrointest Endosc 2015; 7: 37-44 [PMID: 25610532 DOI: 10.4253/wjge.v7.i1.37]
11 Fabbri C, Luigiano C, Lisotti A, Cennamo V, Virgilio C, Caletti G, Fusaroli P. Endoscopic ultrasound-guided treatments: are we getting evidence based--a systematic review. World J Gastroenterol 2014; 20: 8424-8448 [PMID: 25024600 DOI: 10.3748/wjg.v20.i26.8424]
12 Park SJ, Choi JH, Park do H, Choi JH, Lee SS, Seo DW, Lee SK, Kim MH. Expanding indication: EUS-guided hepatico-duodenostomy for isolated right intrahepatic duct obstruction (with video). Gastrointest Endosc 2013; 78: 374-380 [PMID: 23711555 DOI: 10.1016/j.gie.2013.04.183]
13 Ogura T, Sano T, Onda S, Imoto A, Masuda D, Yamamoto K, Kitano M, Takeuchi T, Inoue T, Higuchi K. Endoscopic ultrasound-guided biliary drainage for right hepatic bile duct obstruction: novel technical tips. Endoscopy 2015; 47: 72-75 [PMID: 25264761 DOI: 10.1055/s-0034-1378111]
P- Reviewer: Galasso D, Steinbruck K, Xu Y S- Editor: Yu J L- Editor: A E- Editor: Ma S
COMMENTSCase characteristicsA 77-year-old male patient with type Ⅳ malignant hilar obstruction who presented with jaundice and fever.
Clinical diagnosisMalignant tumor obstructing the hilar area causing bilateral biliary system blockage.
Differential diagnosisCholangiocarcinoma, hepatocellular carcinoma, or mixed cholangio-hepatocellular carcinoma.
Laboratory diagnosisHyperbilirubinemia with a total bilirubin level of 12.7 mg/dL and direct bilirubin of 11.3 mg/dL, and an elevated alkaline phosphatase level (395 U/L).
Imaging diagnosisComputed tomography revealed a soft tissue mass involving the common hepatic duct and portions of the left intrahepatic duct resulting in upstream dilation of both systems.
TreatmentEndoscopic ultrasound (EUS)-guided bilateral biliary drainage via a transgastric approach.
Related reportsEUS-guided hepaticogastrostomy is commonly performed to drain the left system. In contrast, there are few reports demonstrating techniques to drain both intrahepatic systems via a single puncture site.
Term explanation EUS-guided hepaticogastrostomy is a novel alternative treatment for biliary drainage in patients for whom endoscopic retrograde cholangiopancreatography has failed and who prefer internal rather than percutaneous biliary drainage or surgical bypass procedures.
Experiences and lessonsEUS-guided hepaticogastrostomy for bilateral drainage of both hepatic systems is feasible if the guidewire is successfully manipulated to pass the stricture point from the left system across to the right.
Peer-reviewThis case report describes the successful use of EUS-guided bilateral biliary drainage in a patient with malignant hilar obstruction.
REFERENCES1 Giovannini M, Moutardier V, Pesenti C, Bories E, Lelong
B, Delpero JR. Endoscopic ultrasound-guided bilioduodenal anastomosis: a new technique for biliary drainage. Endoscopy
10048 September 14, 2015|Volume 21|Issue 34|WJG|www.wjgnet.com
COMMENTS
Prachayakul V et al . EUS-guided bilateral biliary drainage
10049 September 14, 2015|Volume 21|Issue 34|WJG|www.wjgnet.com
Tai-Long Chien, Division of Gastroenterology, Department of Internal Medicine, Pin-Tung An-Tai Hospital, Pintung County 92842, Taiwan
Kung-Ming Rau, Chia-Che Wu, Yen-Hao Chen, Division of Oncology, Department of Internal Medicine, Kaohsiung Chang Gung Memorial Hospital and Chang Gung University College of Medicine, Kaohsiung 833, Taiwan
Wen-Jung Chung, Division of Cardiology, Department of Internal Medicine, Kaohsiung Chang Gung Memorial Hospital and Chang Gung University College of Medicine, Kaohsiung 833, Taiwan
Wei-Chen Tai, Yi-Chun Chiu, Keng-Liang Wu, Yeh-Pin Chou, Seng-Kee Chuah, Division of Hepatogastroenterology, Department of Internal Medicine, Kaohsiung Chang Gung Memorial Hospital and Chang Gung University College of Medicine, Kaohsiung 833, Taiwan
Shih-Ho Wang, Division of General Surgery, Department of Surgery, Kaohsiung Chang Gung Memorial Hospital and Chang Gung University College of Medicine, Kaohsiung 833, Taiwan
Author contributions: Chien TL wrote the paper; Chung WJ, Tai WC, Chiu YC, Wu KL, Chou YP, Wu CC, Chen YH and Chuah SK designed the concept, drafted the article and revised it; Rau KM and Wang SH designed the concept and finally approved the paper.
Institutional review board statement: This study was approved by both the Institutional Review Board and Ethics Committee of Chang Gung Memorial Hospital, Taiwan (IRB104-0636B).
Informed consent statement: The Ethics Committee waived the requirement for informed consent, and each patient’s medical records was anonymized and de-identified prior to access.
Conflict-of-interest statement: The authors have no conflict of interest related to the manuscript.
Open-Access: This article is an open-access article which was selected by an in-house editor and fully peer-reviewed by external
reviewers. It is distributed in accordance with the Creative Commons Attribution Non Commercial (CC BY-NC 4.0) license, which permits others to distribute, remix, adapt, build upon this work non-commercially, and license their derivative works on different terms, provided the original work is properly cited and the use is non-commercial. See: http://creativecommons.org/licenses/by-nc/4.0/
Correspondence to: Dr. Shih-Ho Wang, Division of General Surgery and Oncology, Kaohsiung Chang Gung Memorial Hospital, 123, Ta-Pei Road, Niao-Sung Hsiang, Kaohsiung 833, Taiwan. [email protected]: +886-7-7317123Fax: +886-7-7322402
Received: March 3, 2015Peer-review started: March 5, 2015First decision: April 24, 2015Revised: May 9, 2015Accepted: July 3, 2015Article in press: July 3, 2015Published online: September 14, 2015
AbstractPatients with cancer are at high risk for thrombotic events, which are known collectively as Trousseau’s syndrome. Herein, we report a 66-year-old male patient who was diagnosed with terminal stage gastric cancer and liver metastasis and who had an initial clinical presentation of upper gastrointestinal bleeding. Acute ischemia of the left lower leg that resulted in gangrenous changes occurred during admission. Subsequent angiography of the left lower limb was then performed. This procedure revealed arterial thrombosis of the left common iliac artery with extension to the external iliac artery, the left common iliac artery, the posterior tibial artery, and the peroneal artery, which were occluded by thrombi. Aspiration of the thrombi demonstrated that these were not tumor thrombi. The interesting aspect of
CASE REPORT
Trousseau’s syndrome in a patient with advanced stage gastric cancer
Tai-Long Chien, Kung-Ming Rau, Wen-Jung Chung, Wei-Chen Tai, Shih-Ho Wang, Yi-Chun Chiu, Keng-Liang Wu, Yeh-Pin Chou, Chia-Che Wu, Yen-Hao Chen, Seng-Kee Chuah; Gastric Cancer Team
Submit a Manuscript: http://www.wjgnet.com/esps/Help Desk: http://www.wjgnet.com/esps/helpdesk.aspxDOI: 10.3748/wjg.v21.i34.10049
World J Gastroenterol 2015 September 14; 21(34): 10049-10053 ISSN 1007-9327 (print) ISSN 2219-2840 (online)
© 2015 Baishideng Publishing Group Inc. All rights reserved.
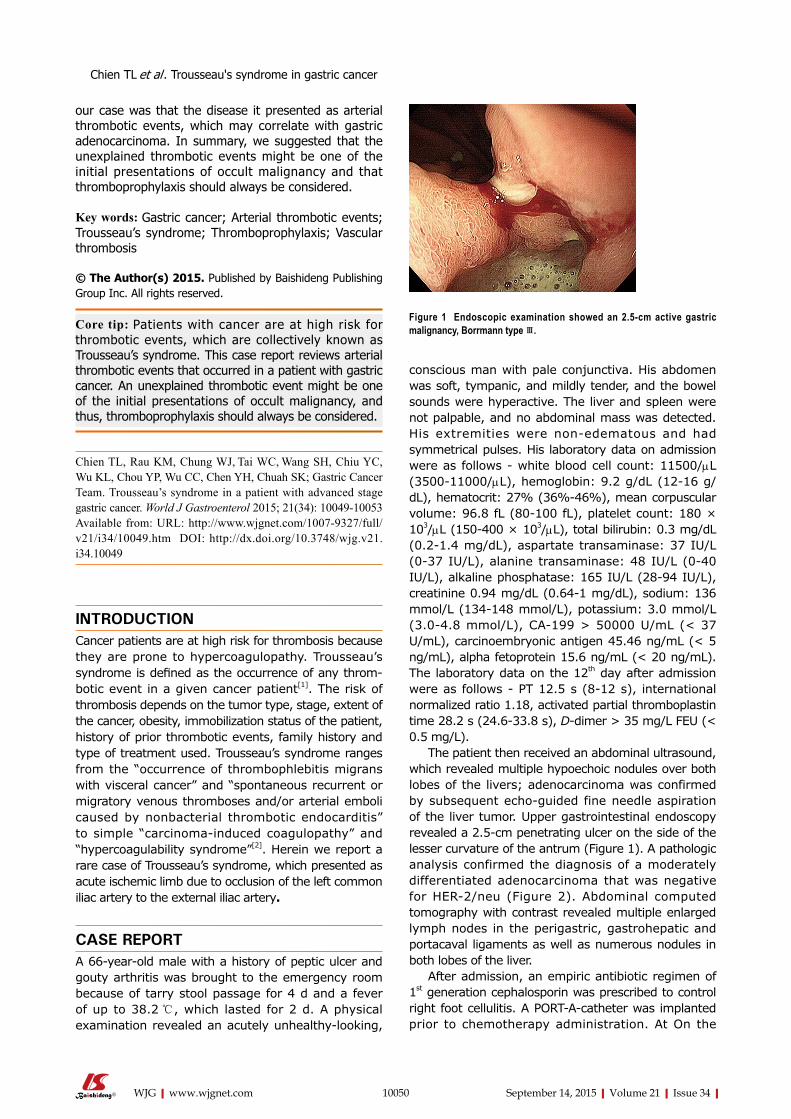
Chien TL et al . Trousseau's syndrome in gastric cancer
10050 September 14, 2015|Volume 21|Issue 34|WJG|www.wjgnet.com
our case was that the disease it presented as arterial thrombotic events, which may correlate with gastric adenocarcinoma. In summary, we suggested that the unexplained thrombotic events might be one of the initial presentations of occult malignancy and that thromboprophylaxis should always be considered.
Key words: Gastric cancer; Arterial thrombotic events; Trousseau’s syndrome; Thromboprophylaxis; Vascular thrombosis
© The Author(s) 2015. Published by Baishideng Publishing Group Inc. All rights reserved.
Core tip: Patients with cancer are at high risk for thrombotic events, which are collectively known as Trousseau’s syndrome. This case report reviews arterial thrombotic events that occurred in a patient with gastric cancer. An unexplained thrombotic event might be one of the initial presentations of occult malignancy, and thus, thromboprophylaxis should always be considered.
Chien TL, Rau KM, Chung WJ, Tai WC, Wang SH, Chiu YC, Wu KL, Chou YP, Wu CC, Chen YH, Chuah SK; Gastric Cancer Team. Trousseau’s syndrome in a patient with advanced stage gastric cancer. World J Gastroenterol 2015; 21(34): 10049-10053 Available from: URL: http://www.wjgnet.com/1007-9327/full/v21/i34/10049.htm DOI: http://dx.doi.org/10.3748/wjg.v21.i34.10049
INTRODUCTIONCancer patients are at high risk for thrombosis because they are prone to hypercoagulopathy. Trousseau’s syndrome is defined as the occurrence of any thrombotic event in a given cancer patient[1]. The risk of thrombosis depends on the tumor type, stage, extent of the cancer, obesity, immobilization status of the patient, history of prior thrombotic events, family history and type of treatment used. Trousseau’s syndrome ranges from the “occurrence of thrombophlebitis migrans with visceral cancer” and “spontaneous recurrent or migratory venous thromboses and/or arterial emboli caused by nonbacterial thrombotic endocarditis” to simple “carcinomainduced coagulopathy” and “hypercoagulability syndrome”[2]. Herein we report a rare case of Trousseau’s syndrome, which presented as acute ischemic limb due to occlusion of the left common iliac artery to the external iliac artery.
CASE REPORTA 66yearold male with a history of peptic ulcer and gouty arthritis was brought to the emergency room because of tarry stool passage for 4 d and a fever of up to 38.2 ℃, which lasted for 2 d. A physical examination revealed an acutely unhealthylooking,
conscious man with pale conjunctiva. His abdomen was soft, tympanic, and mildly tender, and the bowel sounds were hyperactive. The liver and spleen were not palpable, and no abdominal mass was detected. His extremities were nonedematous and had symmetrical pulses. His laboratory data on admission were as follows white blood cell count: 11500/μL (350011000/μL), hemoglobin: 9.2 g/dL (1216 g/dL), hematocrit: 27% (36%46%), mean corpuscular volume: 96.8 fL (80100 fL), platelet count: 180 × 103/μL (150400 × 103/μL), total bilirubin: 0.3 mg/dL (0.21.4 mg/dL), aspartate transaminase: 37 IU/L (037 IU/L), alanine transaminase: 48 IU/L (040 IU/L), alkaline phosphatase: 165 IU/L (2894 IU/L), creatinine 0.94 mg/dL (0.641 mg/dL), sodium: 136 mmol/L (134148 mmol/L), potassium: 3.0 mmol/L (3.04.8 mmol/L), CA199 > 50000 U/mL (< 37 U/mL), carcinoembryonic antigen 45.46 ng/mL (< 5 ng/mL), alpha fetoprotein 15.6 ng/mL (< 20 ng/mL). The laboratory data on the 12th day after admission were as follows PT 12.5 s (812 s), international normalized ratio 1.18, activated partial thromboplastin time 28.2 s (24.633.8 s), Ddimer > 35 mg/L FEU (< 0.5 mg/L).
The patient then received an abdominal ultrasound, which revealed multiple hypoechoic nodules over both lobes of the livers; adenocarcinoma was confirmed by subsequent echoguided fine needle aspiration of the liver tumor. Upper gastrointestinal endoscopy revealed a 2.5cm penetrating ulcer on the side of the lesser curvature of the antrum (Figure 1). A pathologic analysis confirmed the diagnosis of a moderately differentiated adenocarcinoma that was negative for HER2/neu (Figure 2). Abdominal computed tomography with contrast revealed multiple enlarged lymph nodes in the perigastric, gastrohepatic and portacaval ligaments as well as numerous nodules in both lobes of the liver.
After admission, an empiric antibiotic regimen of 1st generation cephalosporin was prescribed to control right foot cellulitis. A PORTAcatheter was implanted prior to chemotherapy administration. At On the
Figure 1 Endoscopic examination showed an 2.5-cm active gastric malignancy, Borrmann type Ⅲ.
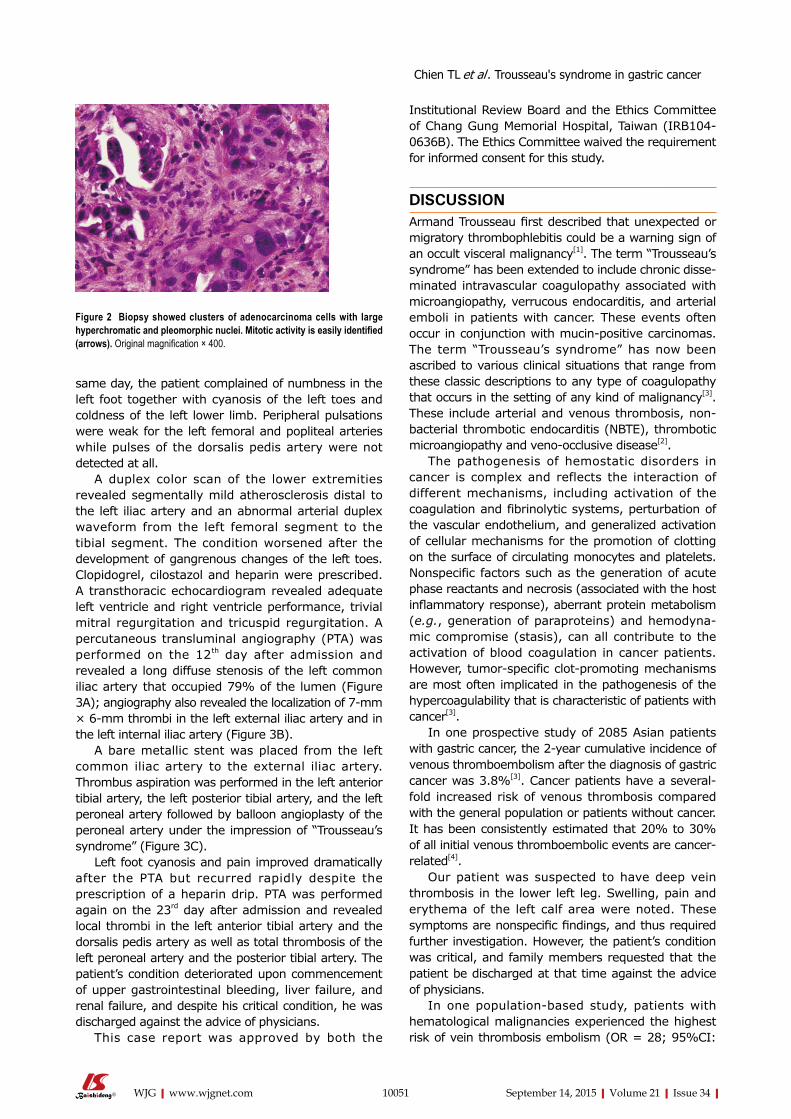
10051 September 14, 2015|Volume 21|Issue 34|WJG|www.wjgnet.com
same day, the patient complained of numbness in the left foot together with cyanosis of the left toes and coldness of the left lower limb. Peripheral pulsations were weak for the left femoral and popliteal arteries while pulses of the dorsalis pedis artery were not detected at all.
A duplex color scan of the lower extremities revealed segmentally mild atherosclerosis distal to the left iliac artery and an abnormal arterial duplex waveform from the left femoral segment to the tibial segment. The condition worsened after the development of gangrenous changes of the left toes. Clopidogrel, cilostazol and heparin were prescribed. A transthoracic echocardiogram revealed adequate left ventricle and right ventricle performance, trivial mitral regurgitation and tricuspid regurgitation. A percutaneous transluminal angiography (PTA) was performed on the 12th day after admission and revealed a long diffuse stenosis of the left common iliac artery that occupied 79% of the lumen (Figure 3A); angiography also revealed the localization of 7mm × 6mm thrombi in the left external iliac artery and in the left internal iliac artery (Figure 3B).
A bare metallic stent was placed from the left common iliac artery to the external iliac artery. Thrombus aspiration was performed in the left anterior tibial artery, the left posterior tibial artery, and the left peroneal artery followed by balloon angioplasty of the peroneal artery under the impression of “Trousseau’s syndrome” (Figure 3C).
Left foot cyanosis and pain improved dramatically after the PTA but recurred rapidly despite the prescription of a heparin drip. PTA was performed again on the 23rd day after admission and revealed local thrombi in the left anterior tibial artery and the dorsalis pedis artery as well as total thrombosis of the left peroneal artery and the posterior tibial artery. The patient’s condition deteriorated upon commencement of upper gastrointestinal bleeding, liver failure, and renal failure, and despite his critical condition, he was discharged against the advice of physicians.
This case report was approved by both the
Institutional Review Board and the Ethics Committee of Chang Gung Memorial Hospital, Taiwan (IRB1040636B). The Ethics Committee waived the requirement for informed consent for this study.
DISCUSSIONArmand Trousseau first described that unexpected or migratory thrombophlebitis could be a warning sign of an occult visceral malignancy[1]. The term “Trousseau’s syndrome” has been extended to include chronic disseminated intravascular coagulopathy associated with microangiopathy, verrucous endocarditis, and arterial emboli in patients with cancer. These events often occur in conjunction with mucinpositive carcinomas. The term “Trousseau’s syndrome” has now been ascribed to various clinical situations that range from these classic descriptions to any type of coagulopathy that occurs in the setting of any kind of malignancy[3]. These include arterial and venous thrombosis, nonbacterial thrombotic endocarditis (NBTE), thrombotic microangiopathy and venoocclusive disease[2].
The pathogenesis of hemostatic disorders in cancer is complex and reflects the interaction of different mechanisms, including activation of the coagulation and fibrinolytic systems, perturbation of the vascular endothelium, and generalized activation of cellular mechanisms for the promotion of clotting on the surface of circulating monocytes and platelets. Nonspecific factors such as the generation of acute phase reactants and necrosis (associated with the host inflammatory response), aberrant protein metabolism (e.g., generation of paraproteins) and hemodynamic compromise (stasis), can all contribute to the activation of blood coagulation in cancer patients. However, tumorspecific clotpromoting mechanisms are most often implicated in the pathogenesis of the hypercoagulability that is characteristic of patients with cancer[3].
In one prospective study of 2085 Asian patients with gastric cancer, the 2year cumulative incidence of venous thromboembolism after the diagnosis of gastric cancer was 3.8%[3]. Cancer patients have a severalfold increased risk of venous thrombosis compared with the general population or patients without cancer. It has been consistently estimated that 20% to 30% of all initial venous thromboembolic events are cancerrelated[4].
Our patient was suspected to have deep vein thrombosis in the lower left leg. Swelling, pain and erythema of the left calf area were noted. These symptoms are nonspecific findings, and thus required further investigation. However, the patient’s condition was critical, and family members requested that the patient be discharged at that time against the advice of physicians.
In one populationbased study, patients with hematological malignancies experienced the highest risk of vein thrombosis embolism (OR = 28; 95%CI:
Figure 2 Biopsy showed clusters of adenocarcinoma cells with large hyperchromatic and pleomorphic nuclei. Mitotic activity is easily identified (arrows). Original magnification × 400.
Chien TL et al . Trousseau's syndrome in gastric cancer
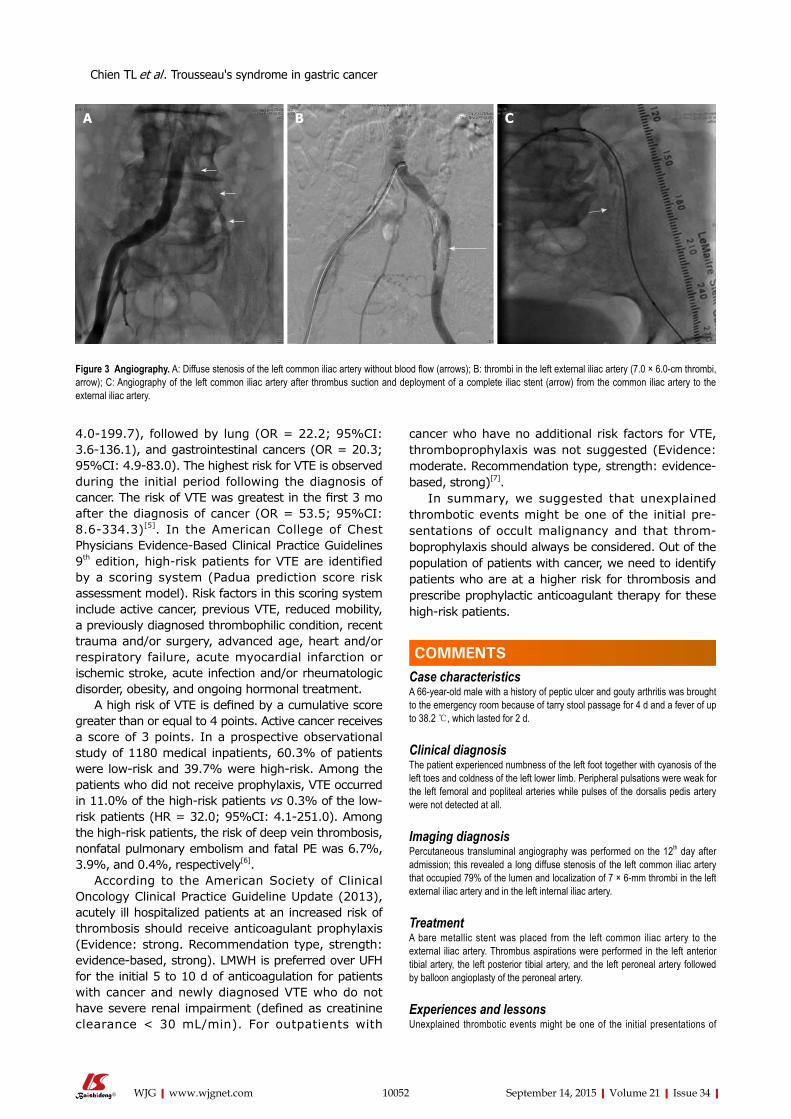
10052 September 14, 2015|Volume 21|Issue 34|WJG|www.wjgnet.com
4.0199.7), followed by lung (OR = 22.2; 95%CI: 3.6136.1), and gastrointestinal cancers (OR = 20.3; 95%CI: 4.983.0). The highest risk for VTE is observed during the initial period following the diagnosis of cancer. The risk of VTE was greatest in the first 3 mo after the diagnosis of cancer (OR = 53.5; 95%CI: 8.6334.3)[5]. In the American College of Chest Physicians EvidenceBased Clinical Practice Guidelines 9th edition, highrisk patients for VTE are identified by a scoring system (Padua prediction score risk assessment model). Risk factors in this scoring system include active cancer, previous VTE, reduced mobility, a previously diagnosed thrombophilic condition, recent trauma and/or surgery, advanced age, heart and/or respiratory failure, acute myocardial infarction or ischemic stroke, acute infection and/or rheumatologic disorder, obesity, and ongoing hormonal treatment.
A high risk of VTE is defined by a cumulative score greater than or equal to 4 points. Active cancer receives a score of 3 points. In a prospective observational study of 1180 medical inpatients, 60.3% of patients were lowrisk and 39.7% were highrisk. Among the patients who did not receive prophylaxis, VTE occurred in 11.0% of the highrisk patients vs 0.3% of the lowrisk patients (HR = 32.0; 95%CI: 4.1251.0). Among the highrisk patients, the risk of deep vein thrombosis, nonfatal pulmonary embolism and fatal PE was 6.7%, 3.9%, and 0.4%, respectively[6].
According to the American Society of Clinical Oncology Clinical Practice Guideline Update (2013), acutely ill hospitalized patients at an increased risk of thrombosis should receive anticoagulant prophylaxis (Evidence: strong. Recommendation type, strength: evidencebased, strong). LMWH is preferred over UFH for the initial 5 to 10 d of anticoagulation for patients with cancer and newly diagnosed VTE who do not have severe renal impairment (defined as creatinine clearance < 30 mL/min). For outpatients with
cancer who have no additional risk factors for VTE, thromboprophylaxis was not suggested (Evidence: moderate. Recommendation type, strength: evidencebased, strong)[7].
In summary, we suggested that unexplained thrombotic events might be one of the initial presentations of occult malignancy and that thromboprophylaxis should always be considered. Out of the population of patients with cancer, we need to identify patients who are at a higher risk for thrombosis and prescribe prophylactic anticoagulant therapy for these highrisk patients.
COMMENTSCase characteristicsA 66-year-old male with a history of peptic ulcer and gouty arthritis was brought to the emergency room because of tarry stool passage for 4 d and a fever of up to 38.2 ℃, which lasted for 2 d.
Clinical diagnosisThe patient experienced numbness of the left foot together with cyanosis of the left toes and coldness of the left lower limb. Peripheral pulsations were weak for the left femoral and popliteal arteries while pulses of the dorsalis pedis artery were not detected at all.
Imaging diagnosisPercutaneous transluminal angiography was performed on the 12th day after admission; this revealed a long diffuse stenosis of the left common iliac artery that occupied 79% of the lumen and localization of 7 × 6-mm thrombi in the left external iliac artery and in the left internal iliac artery.
TreatmentA bare metallic stent was placed from the left common iliac artery to the external iliac artery. Thrombus aspirations were performed in the left anterior tibial artery, the left posterior tibial artery, and the left peroneal artery followed by balloon angioplasty of the peroneal artery.
Experiences and lessonsUnexplained thrombotic events might be one of the initial presentations of
Figure 3 Angiography. A: Diffuse stenosis of the left common iliac artery without blood flow (arrows); B: thrombi in the left external iliac artery (7.0 × 6.0-cm thrombi, arrow); C: Angiography of the left common iliac artery after thrombus suction and deployment of a complete iliac stent (arrow) from the common iliac artery to the external iliac artery.
COMMENTS
CBA
Chien TL et al . Trousseau's syndrome in gastric cancer
10053 September 14, 2015|Volume 21|Issue 34|WJG|www.wjgnet.com
occult malignancy, and thus thromboprophylaxis should always be considered.
Peer-reviewThis case report demonstrates very interesting presentation of gastric cancer, and well written.
REFERENCES1 Varki A. Trousseau’s syndrome: multiple definitions and multiple
mechanisms. Blood 2007; 110: 1723-1729 [PMID: 17496204 DOI: 10.1182/blood-2006-10-053736]
2 Falanga A, Marchetti M, Vignoli A. Coagulation and cancer: biological and clinical aspects. J Thromb Haemost 2013; 11: 223-233 [PMID: 23279708 DOI: 10.1111/jth.12075]
3 Lee KW, Bang SM, Kim S, Lee HJ, Shin DY, Koh Y, Lee YG, Cha Y, Kim YJ, Kim JH, Park DJ, Kim HH, Oh D, Lee JS. The incidence, risk factors and prognostic implications of venous thromboembolism in patients with gastric cancer. J Thromb Haemost 2010; 8: 540-547 [PMID: 20040044 DOI: 10.1111/j.1538-7836.2009.03731.x]
4 Timp JF , Braekkan SK, Versteeg HH, Cannegieter SC.
Epidemiology of cancer-associated venous thrombosis. Blood 2013; 122 : 1712-1723 [PMID: 23908465 DOI: 10.1182/blood-2013-04-460121]
5 Blom JW, Doggen CJ, Osanto S, Rosendaal FR. Malignancies, prothrombotic mutations, and the risk of venous thrombosis. JAMA 2005; 293: 715-722 [PMID: 15701913 DOI: 10.1001/jama.293.6.715]
6 Kahn SR, Lim W, Dunn AS, Cushman M, Dentali F, Akl EA, Cook DJ, Balekian AA, Klein RC, Le H, Schulman S, Murad MH. Prevention of VTE in nonsurgical patients: Antithrombotic Therapy and Prevention of Thrombosis, 9th ed: American College of Chest Physicians Evidence-Based Clinical Practice Guidelines. Chest 2012; 141: e195S-e226S [PMID: 22315261 DOI: 10.1378/chest.11-2296]
7 Lyman GH, Khorana AA, Kuderer NM, Lee AY, Arcelus JI, Balaban EP, Clarke JM, Flowers CR, Francis CW, Gates LE, Kakkar AK, Key NS, Levine MN, Liebman HA, Tempero MA, Wong SL, Prestrud AA, Falanga A. Venous thromboembolism prophylaxis and treatment in patients with cancer: American Society of Clinical Oncology clinical practice guideline update. J Clin Oncol 2013; 31: 2189-2204 [PMID: 23669224 DOI: 10.1200/JCO.2013.49.1118]
P- Reviewer: Takeda H S- Editor: Yu J L- Editor: A E- Editor: Liu XM
Chien TL et al . Trousseau's syndrome in gastric cancer

Submit a Manuscript: http://www.wjgnet.com/esps/Help Desk: http://www.wjgnet.com/esps/helpdesk.aspxDOI: 10.3748/wjg.v21.i34.10054
World J Gastroenterol 2015 September 14; 21(34): 10054-10056 ISSN 1007-9327 (print) ISSN 2219-2840 (online)
© 2015 Baishideng Publishing Group Inc. All rights reserved.
10054 September 14, 2015|Volume 21|Issue 34|WJG|www.wjgnet.com
LETTERS TO THE EDITOR
PNPLA3 I148M variant affects non-alcoholic fatty liver disease in liver transplant recipients
Zheng-Tao Liu, Tian-Chi Chen, Xiao-Xiao Lu, Jun Cheng, Hai-Yang Xie, Lin Zhou, Shu-Sen Zheng
Zheng-Tao Liu, Tian-Chi Chen, Xiao-Xiao Lu, Hai-Yang Xie, Lin Zhou, Shu-Sen Zheng, Key Laboratory of Combined Multi-Organ Transplantation, Ministry of Public Health and Key Laboratory of Organ Transplantation of Zhejiang Province, Hangzhou 310003, Zhejiang Province, China
Zheng-Tao Liu, Tian-Chi Chen, Xiao-Xiao Lu, Hai-Yang Xie, Lin Zhou, Shu-Sen Zheng, Collaborative Innovation Center for Diagnosis and Treatment of Infectious Diseases, Hangzhou 310003, Zhejiang Province, China
Jun Cheng, Shu-Sen Zheng, Division of Hepatobiliary and Pancreatic Surgery, Department of Surgery, First Affiliated Hospital, School of Medicine, Zhejiang University, Hangzhou 310003, Zhejiang Province, China
Author contributions: Zhou L and Zheng SS designed research; Liu ZT, Chen TC and Lu XX performed research; Xie HY, Zhou L and Zheng SS contributed reagents and analytic tools; Chen TC, Lu XX and Cheng J analyzed data; Liu ZT wrote the paper; and Xie HY, Zhou L and Zheng SS reviewed the paper.
Supported by National S and T Major Project, No. 2012ZX 10002017; Foundation for Innovative Research Groups of the National Natural Science Foundation of China, Grant No. 81421062; and China Postdoctoral Science Foundation Project, No. 2015M570518.
Conflict-of-interest statement: Nothing to report.
Open-Access: This article is an open-access article which was selected by an in-house editor and fully peer-reviewed by external reviewers. It is distributed in accordance with the Creative Commons Attribution Non Commercial (CC BY-NC 4.0) license, which permits others to distribute, remix, adapt, build upon this work non-commercially, and license their derivative works on different terms, provided the original work is properly cited and the use is non-commercial. See: http://creativecommons.org/licenses/by-nc/4.0/
Correspondence to: Shu-Sen Zheng, Professor, Division of Hepatobiliary and Pancreatic Surgery, Department of Surgery, First Affiliated Hospital, School of Medicine, Zhejiang University, 79 QingChun Road, Hangzhou 310003, Zhejiang Province, China. [email protected]
Telephone: +86-571-87236570 Fax: +86-571-87236570
Received: April 5, 2015 Peer-review started: April 7, 2015First decision: May 18, 2015Revised: June 3, 2015Accepted: July 8, 2015 Article in press: July 8, 2015Published online: September 14, 2015
AbstractDe novo non-alcoholic fatty liver disease (NAFLD) is a common late complication for long-term survivors after liver transplantation. Genomic studies confirmed that PNPLA3 I148M and TM6SF2 E167K polymorphisms affected NAFLD susceptibility in the general population. However, this association was not validated in survivors after liver transplantation (LT). We performed a cross-sectional survey to investigate this relationship. A comprehensive survey, including anthropometric mea-surements, fasting venous blood sampling, ultrasound, and questionnaires was performed in the short-term. The clinical indications and patient’s steatosis status before LT were collected from inpatient medical records. Sixty-five long-term recipients with a survival exceeding 10 years were enrolled in the final analysis. De novo NAFLD was more frequent in PNPLA3 GG carriers (0.33 vs 0.10 for GG vs CC + CG carriers, P = 0.018), while the genetic impact on NAFLD susceptibility was insignificant when categorized by the TM6SF2 polymorphism (0.19 in CC vs 0.14 in CT + TT carriers, P = 0.883). Multi-covariate analysis revealed that PNPLA3 exerted a significant genetic effect on de novo NAFLD following a recessive model (GG vs CC + CG, OR = 14.2, 95%CI: 1.78-113, P = 0.012). Compared to recipients with only the PNPLA3 GG allele or obesity (defined as body mass index > 25 kg/m2), steatosis was highly prevalent (71.4%) in PNPLA3 GG carriers
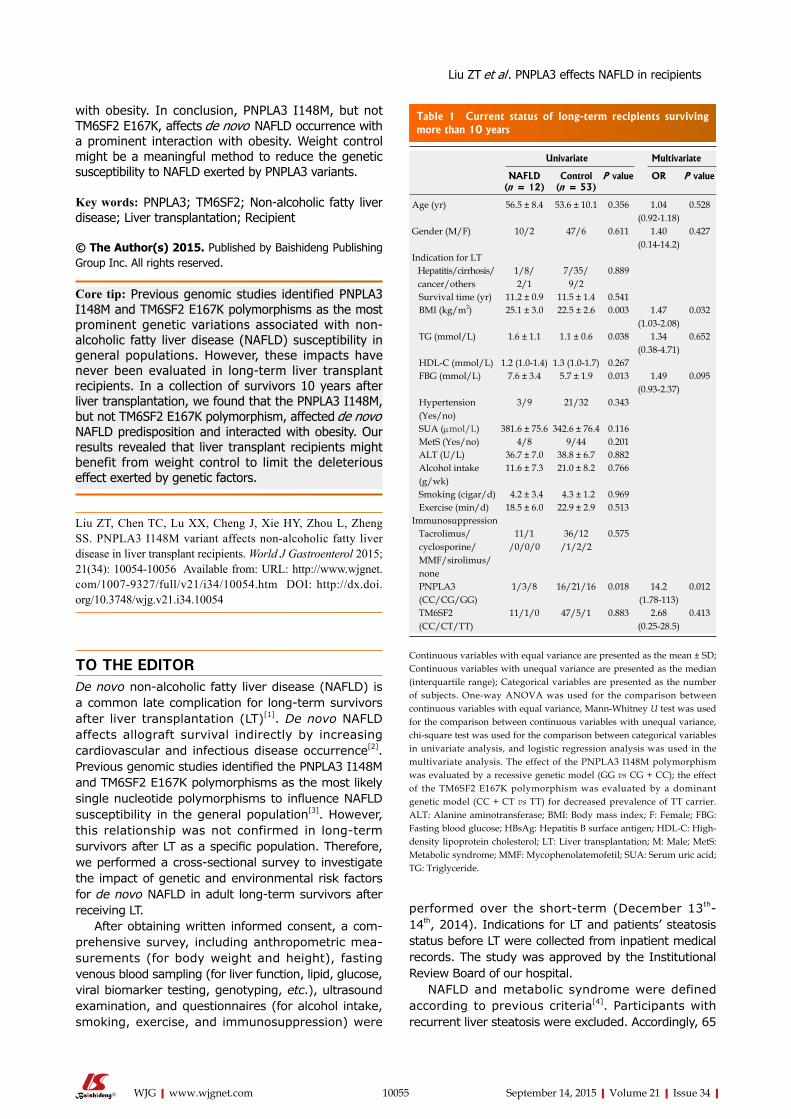
with obesity. In conclusion, PNPLA3 I148M, but not TM6SF2 E167K, affects de novo NAFLD occurrence with a prominent interaction with obesity. Weight control might be a meaningful method to reduce the genetic susceptibility to NAFLD exerted by PNPLA3 variants.
Key words: PNPLA3; TM6SF2; Non-alcoholic fatty liver disease; Liver transplantation; Recipient
© The Author(s) 2015. Published by Baishideng Publishing Group Inc. All rights reserved.
Core tip: Previous genomic studies identified PNPLA3 I148M and TM6SF2 E167K polymorphisms as the most prominent genetic variations associated with non-alcoholic fatty liver disease (NAFLD) susceptibility in general populations. However, these impacts have never been evaluated in long-term liver transplant recipients. In a collection of survivors 10 years after liver transplantation, we found that the PNPLA3 I148M, but not TM6SF2 E167K polymorphism, affected de novo NAFLD predisposition and interacted with obesity. Our results revealed that liver transplant recipients might benefit from weight control to limit the deleterious effect exerted by genetic factors.
Liu ZT, Chen TC, Lu XX, Cheng J, Xie HY, Zhou L, Zheng SS. PNPLA3 I148M variant affects non-alcoholic fatty liver disease in liver transplant recipients. World J Gastroenterol 2015; 21(34): 10054-10056 Available from: URL: http://www.wjgnet.com/1007-9327/full/v21/i34/10054.htm DOI: http://dx.doi.org/10.3748/wjg.v21.i34.10054
TO THE EDITORDe novo non-alcoholic fatty liver disease (NAFLD) is a common late complication for long-term survivors after liver transplantation (LT)[1]. De novo NAFLD affects allograft survival indirectly by increasing cardiovascular and infectious disease occurrence[2]. Previous genomic studies identified the PNPLA3 I148M and TM6SF2 E167K polymorphisms as the most likely single nucleotide polymorphisms to influence NAFLD susceptibility in the general population[3]. However, this relationship was not confirmed in long-term survivors after LT as a specific population. Therefore, we performed a cross-sectional survey to investigate the impact of genetic and environmental risk factors for de novo NAFLD in adult long-term survivors after receiving LT.
After obtaining written informed consent, a com-prehensive survey, including anthropometric mea-surements (for body weight and height), fasting venous blood sampling (for liver function, lipid, glucose, viral biomarker testing, genotyping, etc.), ultrasound examination, and questionnaires (for alcohol intake, smoking, exercise, and immunosuppression) were
performed over the short-term (December 13th-14th, 2014). Indications for LT and patients’ steatosis status before LT were collected from inpatient medical records. The study was approved by the Institutional Review Board of our hospital.
NAFLD and metabolic syndrome were defined according to previous criteria[4]. Participants with recurrent liver steatosis were excluded. Accordingly, 65
Liu ZT et al . PNPLA3 effects NAFLD in recipients
10055 September 14, 2015|Volume 21|Issue 34|WJG|www.wjgnet.com
Table 1 Current status of long-term recipients surviving more than 10 years
Univariate Multivariate
NAFLD (n = 12)
Control (n = 53)
P value OR P value
Age (yr) 56.5 ± 8.4 53.6 ± 10.1 0.356 1.04 (0.92-1.18)
0.528
Gender (M/F) 10/2 47/6 0.611 1.40 (0.14-14.2)
0.427
Indication for LT Hepatitis/cirrhosis/ cancer/others
1/8/2/1
7/35/9/2
0.889
Survival time (yr) 11.2 ± 0.9 11.5 ± 1.4 0.541 BMI (kg/m2) 25.1 ± 3.0 22.5 ± 2.6 0.003 1.47
(1.03-2.08)0.032
TG (mmol/L) 1.6 ± 1.1 1.1 ± 0.6 0.038 1.34 (0.38-4.71)
0.652
HDL-C (mmol/L) 1.2 (1.0-1.4) 1.3 (1.0-1.7) 0.267 FBG (mmol/L) 7.6 ± 3.4 5.7 ± 1.9 0.013 1.49
(0.93-2.37)0.095
Hypertension (Yes/no)
3/9 21/32 0.343
SUA (µmol/L) 381.6 ± 75.6 342.6 ± 76.4 0.116 MetS (Yes/no) 4/8 9/44 0.201 ALT (U/L) 36.7 ± 7.0 38.8 ± 6.7 0.882 Alcohol intake (g/wk)
11.6 ± 7.3 21.0 ± 8.2 0.766
Smoking (cigar/d) 4.2 ± 3.4 4.3 ± 1.2 0.969 Exercise (min/d) 18.5 ± 6.0 22.9 ± 2.9 0.513Immunosuppression Tacrolimus/ cyclosporine/ MMF/sirolimus/ none
11/1/0/0/0
36/12/1/2/2
0.575
PNPLA3 (CC/CG/GG)
1/3/8 16/21/16 0.018 14.2 (1.78-113)
0.012
TM6SF2 (CC/CT/TT)
11/1/0 47/5/1 0.883 2.68 (0.25-28.5)
0.413
Continuous variables with equal variance are presented as the mean ± SD; Continuous variables with unequal variance are presented as the median (interquartile range); Categorical variables are presented as the number of subjects. One-way ANOVA was used for the comparison between continuous variables with equal variance, Mann-Whitney U test was used for the comparison between continuous variables with unequal variance, chi-square test was used for the comparison between categorical variables in univariate analysis, and logistic regression analysis was used in the multivariate analysis. The effect of the PNPLA3 I148M polymorphism was evaluated by a recessive genetic model (GG vs CG + CC); the effect of the TM6SF2 E167K polymorphism was evaluated by a dominant genetic model (CC + CT vs TT) for decreased prevalence of TT carrier. ALT: Alanine aminotransferase; BMI: Body mass index; F: Female; FBG: Fasting blood glucose; HBsAg: Hepatitis B surface antigen; HDL-C: High-density lipoprotein cholesterol; LT: Liver transplantation; M: Male; MetS: Metabolic syndrome; MMF: Mycophenolatemofetil; SUA: Serum uric acid; TG: Triglyceride.
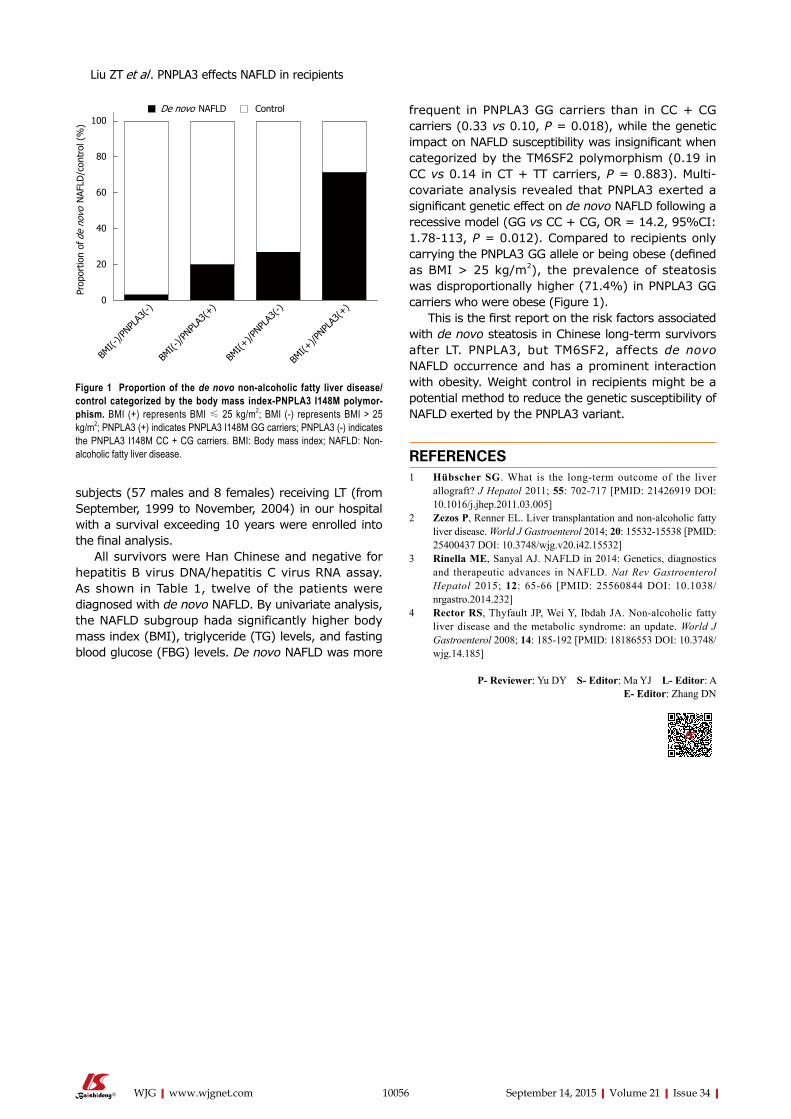
subjects (57 males and 8 females) receiving LT (from September, 1999 to November, 2004) in our hospital with a survival exceeding 10 years were enrolled into the final analysis.
All survivors were Han Chinese and negative for hepatitis B virus DNA/hepatitis C virus RNA assay. As shown in Table 1, twelve of the patients were diagnosed with de novo NAFLD. By univariate analysis, the NAFLD subgroup hada significantly higher body mass index (BMI), triglyceride (TG) levels, and fasting blood glucose (FBG) levels. De novo NAFLD was more
frequent in PNPLA3 GG carriers than in CC + CG carriers (0.33 vs 0.10, P = 0.018), while the genetic impact on NAFLD susceptibility was insignificant when categorized by the TM6SF2 polymorphism (0.19 in CC vs 0.14 in CT + TT carriers, P = 0.883). Multi-covariate analysis revealed that PNPLA3 exerted a significant genetic effect on de novo NAFLD following a recessive model (GG vs CC + CG, OR = 14.2, 95%CI: 1.78-113, P = 0.012). Compared to recipients only carrying the PNPLA3 GG allele or being obese (defined as BMI > 25 kg/m2), the prevalence of steatosis was disproportionally higher (71.4%) in PNPLA3 GG carriers who were obese (Figure 1).
This is the first report on the risk factors associated with de novo steatosis in Chinese long-term survivors after LT. PNPLA3, but TM6SF2, affects de novo NAFLD occurrence and has a prominent interaction with obesity. Weight control in recipients might be a potential method to reduce the genetic susceptibility of NAFLD exerted by the PNPLA3 variant.
REFERENCES1 Hübscher SG. What is the long-term outcome of the liver
allograft? J Hepatol 2011; 55: 702-717 [PMID: 21426919 DOI: 10.1016/j.jhep.2011.03.005]
2 Zezos P, Renner EL. Liver transplantation and non-alcoholic fatty liver disease. World J Gastroenterol 2014; 20: 15532-15538 [PMID: 25400437 DOI: 10.3748/wjg.v20.i42.15532]
3 Rinella ME, Sanyal AJ. NAFLD in 2014: Genetics, diagnostics and therapeutic advances in NAFLD. Nat Rev Gastroenterol Hepatol 2015; 12: 65-66 [PMID: 25560844 DOI: 10.1038/nrgastro.2014.232]
4 Rector RS, Thyfault JP, Wei Y, Ibdah JA. Non-alcoholic fatty liver disease and the metabolic syndrome: an update. World J Gastroenterol 2008; 14: 185-192 [PMID: 18186553 DOI: 10.3748/wjg.14.185]
P- Reviewer: Yu DY S- Editor: Ma YJ L- Editor: A E- Editor: Zhang DN
10056 September 14, 2015|Volume 21|Issue 34|WJG|www.wjgnet.com
100
80
60
40
20
0
Prop
ortio
n of
de
novo
NAF
LD/c
ontr
ol (
%)
BMI(-
)/PNPL
A3(-)
BMI(-
)/PNPL
A3(+
)
BMI(+
)/PNPL
A3(-)
BMI(+
)/PNPL
A3(+
)
Figure 1 proportion of the de novo non-alcoholic fatty liver disease/control categorized by the body mass index-pNpLA3 I148M polymor-phism. BMI (+) represents BMI ≤ 25 kg/m2; BMI (-) represents BMI > 25 kg/m2; PNPLA3 (+) indicates PNPLA3 I148M GG carriers; PNPLA3 (-) indicates the PNPLA3 I148M CC + CG carriers. BMI: Body mass index; NAFLD: Non-alcoholic fatty liver disease.
De novo NAFLD Control
Liu ZT et al . PNPLA3 effects NAFLD in recipients

© 2015 Baishideng Publishing Group Inc. All rights reserved.
Published by Baishideng Publishing Group Inc8226 Regency Drive, Pleasanton, CA 94588, USA
Telephone: +1-925-223-8242Fax: +1-925-223-8243
E-mail: [email protected] Desk: http://www.wjgnet.com/esps/helpdesk.aspx
http://www.wjgnet.com
I S S N 1 0 0 7 - 9 3 2 7
9 7 7 1 0 07 9 3 2 0 45
3 4