Embed Size (px)
Citation preview
WORLD METEOROLOGICAL ORGANIZATION
OPERATIONAL HYDROLOGY REPORT No. 28
HYDROLOGICAL INFORMATION REFERRAL SERVICE - INFOHYDRO
SERVICE DE REFERENCE CONCERNANT UINFORMATION HYDROLOGIQUE - INFOHYDRO
INFOHYDRO MANUAL
1995 edition
rM,lJ,POJIOnIlIECKAJI MHfIlOPMAUMOHHO-CnPABOqHAJI CJIY)I(IiA - MHfIlOrM,lJ,PO
SERVICIO DE INFORMACION Y REFERENCIAS HIDROLOGICAS - L.,,<FOHYDRO
WMO-No.683
Secretariat of the World Meteorological Organization - Geneva· Switzerland1995

© 1994, World Meteorological Organization
ISBN 92-63-02683-1
NOTE
The designations employed and the presentation of material in this publication do not imply theexpression of any opinion whatsoever on the part of the Secretariat of the World MeteorologicalOrganization concerning the legal status of any country, territory, city or area, or of its authorities,or concerning the delimitation of its frontiers or boundaries.
INFOHYDRO Manual
FOREWORD TO THE SECOND EDITION
One of the functions of the World Meteorological Organization is "to promote activities inoperational hydrology and to further close cooperation among Meteorological andHydrological Services of Members". This function is fulfilled largely through the Hydrologyand Water Resources Programme (HWRP) of WMO. Promotion of the exchange ofinformation on the status of activities of the Hydrological Services/Agencies of Members isthe aim of one of the long-term projects within the Operational Hydrology Programme(OHP-Basic Systems).
The WMO Tenth Congress (1987) welcomed the initiation of the HydrologicalInformation Referral Service (INFOHYDRO) as an important contribution to the promotion ofinformation exchange. The first edition of the INFOHYDRO Manual was published in 1987.
Clearly, INFOHYDRO can only remain useful if it is continually updated to reflect theextension of hydrological records and changes in political and institutional realities. To thisend, the WMO Eleventh Congress (May 1991) urged Members to respond to requests forupdated information for INFOHYDRO. Accordingly, by the end of 1993 many Members hadprovided the Secretariat with updated information.
The WMO Commission for Hydrology, at its ninth session (January 1993), recognizedthat the recent changes in a number of countries would require modifications in Section I International Organizations Dealing with Hydrology and Water Resources, and inSection II - Principal River and Lake Basins, particularly regarding WMO codes andcountries shares in the areas of river basins, as well as on institutional cooperation withinthese basins. However, these changes are still continuing and, so as not to delay thepublication of this second edition, the information given, while not always completely up todate, reflects the situation as close to the present as possible.
Thus, the second edition of the INFOHYDRO Manual contains the most recentinformation the Secretariat has received from Members. In addition to improvements in themaps of international river basins this edition contains three innovations:
(a) The addition of a Section VI with information on International Data Banksrelated to Hydrology and Water Resources;
(h) The inclusion of two maps for each of the six WMO Regions showing thedensity of precipitation and discharge stations in countries of the region;
(c) The translation of the explanatory notes preceding the tables in French,Russian and Spanish.
As proposed by the WMO Commission for Hydrology (1988) and welcomed,by the EleventhCongress (1991), the next step will be the incorporation in INFOHYDRO of a geographicalinformation system (GIS) capability. This has been included as part of Project 3.5,18 of theapproved Programme and Budget for 1992-995, It is expected that this capability shouldassist Members in the application of the new opportunities provided by GIS for networkplanning and management purposes.
I wish to record my gratitude to all those who have contributed to this importantreference publication. Their continued assistance through comments, suggestions andupdated information will be most welcome. I trust that Members, international organizationsand others involved in hydrology will benefit fully from facilities provided by INFOHYDRO.
(G. O. P. Obasi)Secretary-General

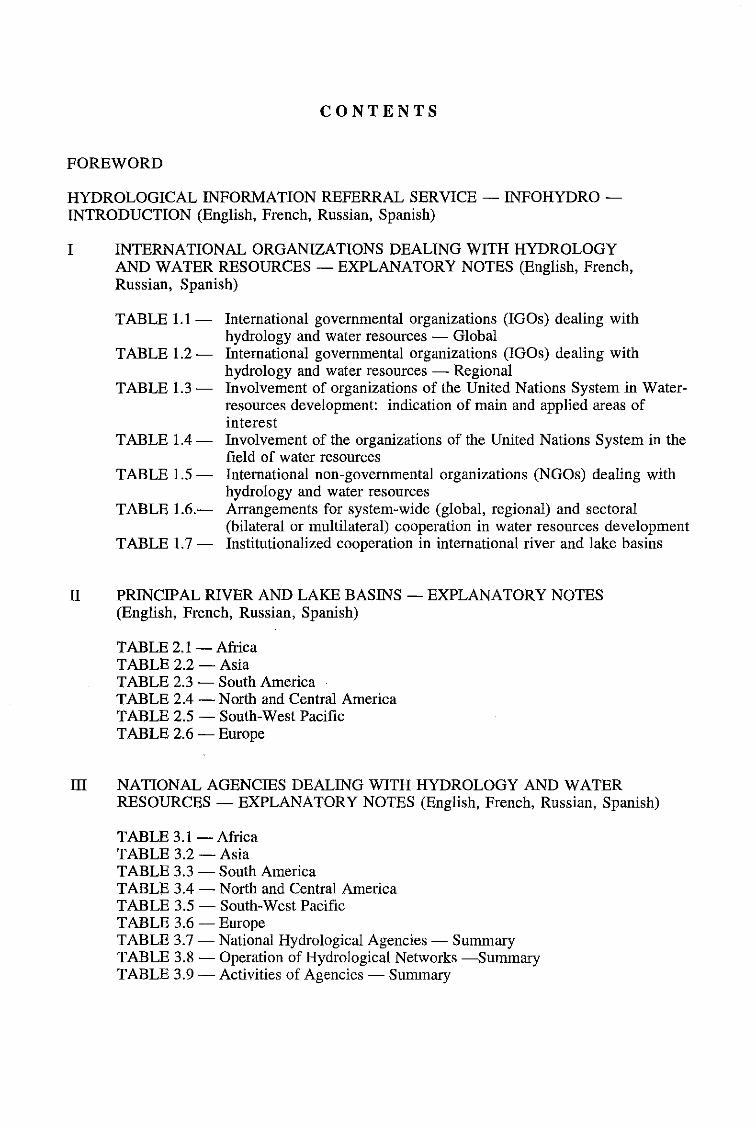
CONTENTS
FOREWORD
HYDROLOGICAL INFORMATION REFERRAL SERVICE - INFOHYDRO INTRODUCTION (English, French, Russian, Spanish)
I INTERNATIONAL ORGANIZATIONS DEALING WITH HYDROLOGYAND WATER RESOURCES - EXPLANATORY NOTES (English, French,Russian, Spanish)
TABLE 1.1- International governmental organizations (IGOs) dealing withhydrology and water resources - Global
TABLE 1.2 - International governmental organizations (IGOs) dealing withhydrology and water resources - Regional
TABLE 1.3 - Involvement of organizations of the United Nations System in Waterresources development: indication of main and applied areas ofinterest
TABLE 1.4 - Involvement of the organizations of the United Nations System in thefield of water resources
TABLE 1.5 - International non-governmental organizations (NGOs) dealing withhydrology and water resources
TABLE 1.6.- Arrangements for system-wide (global, regional) and sectoral(bilateral or multilateral) cooperation in water resources development
TABLE 1.7 - Institutionalized cooperation in international river and lake basins
II PRINCIPAL RIVER AND LAKE BASINS - EXPLANATORY NOTES(English, French, Russian, Spanish)
TABLE 2.1-AfricaTABLE 2.2 - AsiaTABLE 2.3 - South AmericaTABLE 2.4 - North and Central AmericaTABLE 2.5 - South-West PacificTABLE 2.6 - Europe
III NATIONAL AGENCIES DEALING WITH HYDROLOGY AND WATERRESOURCES - EXPLANATORY NOTES (English, French, Russian, Spanish)
TABLE 3.1-AfricaTABLE 3.2 - AsiaTABLE 3.3 - South AmericaTABLE 3.4 - North and Central AmericaTABLE 3.5 - South-West PacificTABLE 3.6 -EuropeTABLE 3.7 - National Hydrological Agencies - SummaryTABLE 3.8 - Operation of Hydrological Networks -SummaryTABLE 3.9 - Activities of Agencies - Summary
IV CONTENTS
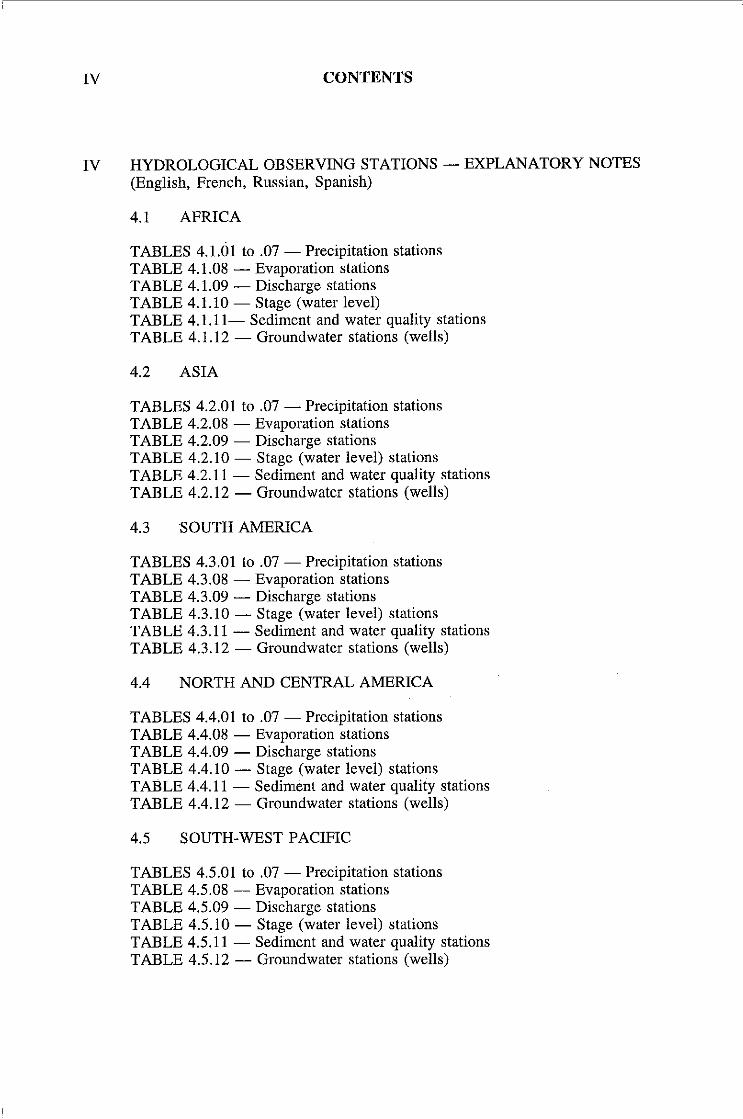
IV HYDROLOGICAL OBSERVING STATIONS - EXPLANATORY NOTES(English, French, Russian, Spanish)
4.1 AFRICA
TABLES 4.1.01 to .07 - Precipitation stationsTABLE 4.1.08 - Evaporation stationsTABLE 4.1.09 - Discharge stationsTABLE 4.1.10 - Stage (water level)TABLE 4.1.11- Sediment and water quality stationsTABLE 4.1.12 - Groundwater stations (wells)
4.2 ASIA
TABLES 4.2.01 to .07 - Precipitation stationsTABLE 4.2.08 - Evaporation stationsTABLE 4.2.09 - Discharge stationsTABLE 4.2.10 - Stage (water level) stationsTABLE 4.2.11 - Sediment and water quality stationsTABLE 4.2.12 - Groundwater stations (wells)
4.3 SOUTH AMERICA
TABLES 4.3.01 to .07 - Precipitation stationsTABLE 4.3.08 - Evaporation stationsTABLE 4.3.09 - Discharge stationsTABLE 4.3.10 - Stage (water level) stationsTABLE 4.3.11 - Sediment and water quality stationsTABLE 4.3.12 - Groundwater stations (wells)
4.4 NORTH AND CENTRAL AMERICA
TABLES 4.4.01 to .07 - Precipitation stationsTABLE 4.4.08 - Evaporation stationsTABLE 4.4.09 - Discharge stationsTABLE 4.4.10 - Stage (water level) stationsTABLE 4.4.11 - Sediment and water quality stationsTABLE 4.4.12 - Groundwater stations (wells)
4.5 SOUTH-WEST PACIFIC
TABLES 4.5.01 to .07 - Precipitation stationsTABLE 4.5.08 - Evaporation stationsTABLE 4.5.09 - Discharge stationsTABLE 4.5.10 - Stage (water level) stationsTABLE 4.5.11 - Sediment and water quality stationsTABLE 4.5.12 - Groundwater stations (wells)
CONTENTS
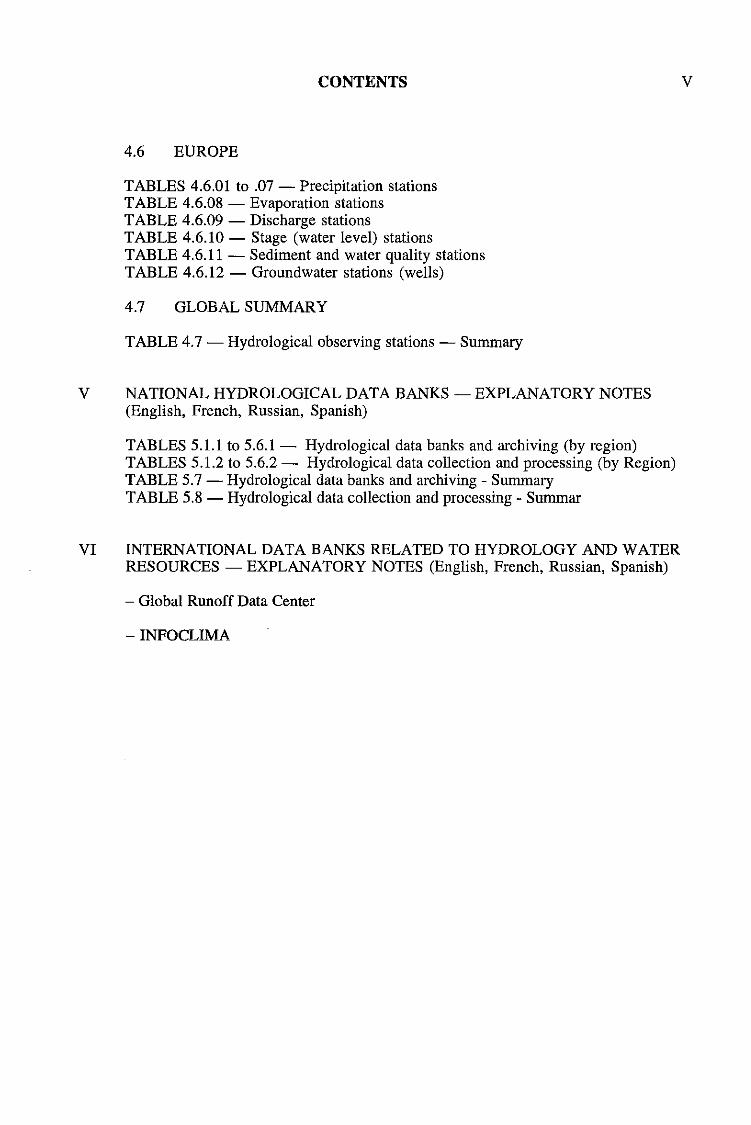
4.6 EUROPE
TABLES 4.6.01 to .07 - Precipitation stationsTABLE 4.6.08 - Evaporation stationsTABLE 4.6.09 - Discharge stationsTABLE 4.6.10 - Stage (water level) stationsTABLE 4.6.11 - Sediment and water quality stationsTABLE 4.6.12 - Groundwater stations (wells)
4.7 GLOBAL SUMMARY
TABLE 4.7 - Hydrological observing stations - Summary
V NATIONAL HYDROLOGICAL DATA BANKS - EXPLANATORY NOTES(English, French, Russian, Spanish)
TABLES 5.1.1 to 5.6.1- Hydrological data banks and archiving (by region)TABLES 5.1.2 to 5.6.2 - Hydrological data collection and processing (by Region)TABLE 5.7 - Hydrological data banks and archiving - SummaryTABLE 5.8 - Hydrological data collection and processing - Summar
VI INTERNATIONAL DATA BANKS RELATED TO HYDROLOGY AND WATERRESOURCES - EXPLANATORY NOTES (English, French, Russian, Spanish)
- Global Runoff Data Center
-INFOCLIMA
v

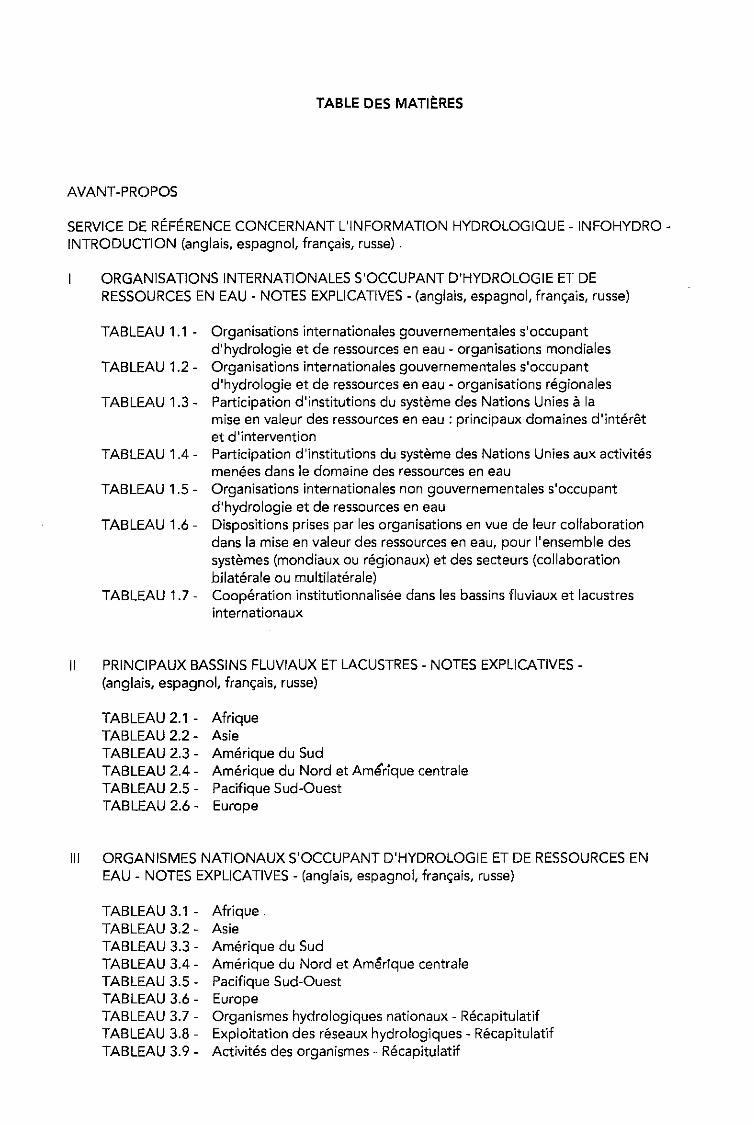
TABLE DES MATIERES
AVANT-PROPOS
SERVICE DE REFERENCE CONCERNANT L'INFORMATION HYDROLOGIQUE - INFOHYDROINTRODUCTION (anglais, espagnol, fran~ais, russel .
ORGANISATIONS INTERNATIONALES S'OCCUPANT D'HYDROLOGIE ET DERESSOURCES EN EAU - NOTES EXPLICATIVES - (anglais, espagnol, fran~ais, russel
TABLEAU 1.1 - Organisations internationales gouvernementales s'occupantd'hydrologie et de ressources en eau - organisations mondiales
TABLEAU 1.2 - Organisations internationales gouvernementales s'occupantd'hydrologie et de ressources en eau - organisations regionales
TABLEAU 1.3 - Participation d'institutions du systeme des Nations Unies alamise en valeur des ressources en eau : principaux domaines d'interetet d'intervention
TABLEAU 1.4 - Participation d'institutions du systeme des Nations Unies aux activitesmenees dans Ie domaine des ressources en eau
TABLEAU 1.5 - Organisations internationales non gouvernementales s'occupantd'hydrologie et de ressources en eau
TABLEAU 1.6 - Dispositions prises par les organisations en vue de leur collaborationdans la mise en valeur des ressources en eau, pour I'ensemble dessystemes (mondiaux ou regionaux) et des secteurs (collaborationbilaterale ou multilaterale)
TABLEAU 1.7 - Cooperation institutionnalisee dans les bassins fluviaux et lacustresinternationaux
II PRINCIPAUX BASSINS FLUVIAUX ET LACUSTRES - NOTES EXPLICATIVES(anglais, espagnol, fran~ais, russel
TABLEAU 2.1 - AfriqueTABLEAU 2.2 - AsieTABLEAU 2.3 - Amerique du SudTABLEAU 2.4 - Amerique du Nord et Amerique centraleTABLEAU 2.5 - Pacifique Sud-OuestTABLEAU 2.6 - Europe
III ORGANISMES NATIONAUX S'OCCUPANT D'HYDROLOGIE ET DE RESSOURCES ENEAU - NOTES EXPLICATIVES - (anglais, espagnol, fran~ais, russel
TABLEAU 3.1 - Afrique.TABLEAU 3.2 - AsieTABLEAU 3.3 - Amerique du SudTABLEAU 3.4 - Amerique du Nord et AmerIque centraleTABLEAU 3.5 - Pacifique Sud-OuestTABLEAU 3.6 - EuropeTABLEAU 3.7 - Organismes hydrologiques nationaux - RecapitulatifTABLEAU 3.8 - Exploitation des reseaux hydrologiques - RecapitulatifTABLEAU 3.9 - Activites des organismes - Recapitulatif
IV TABLE DES MATIERES
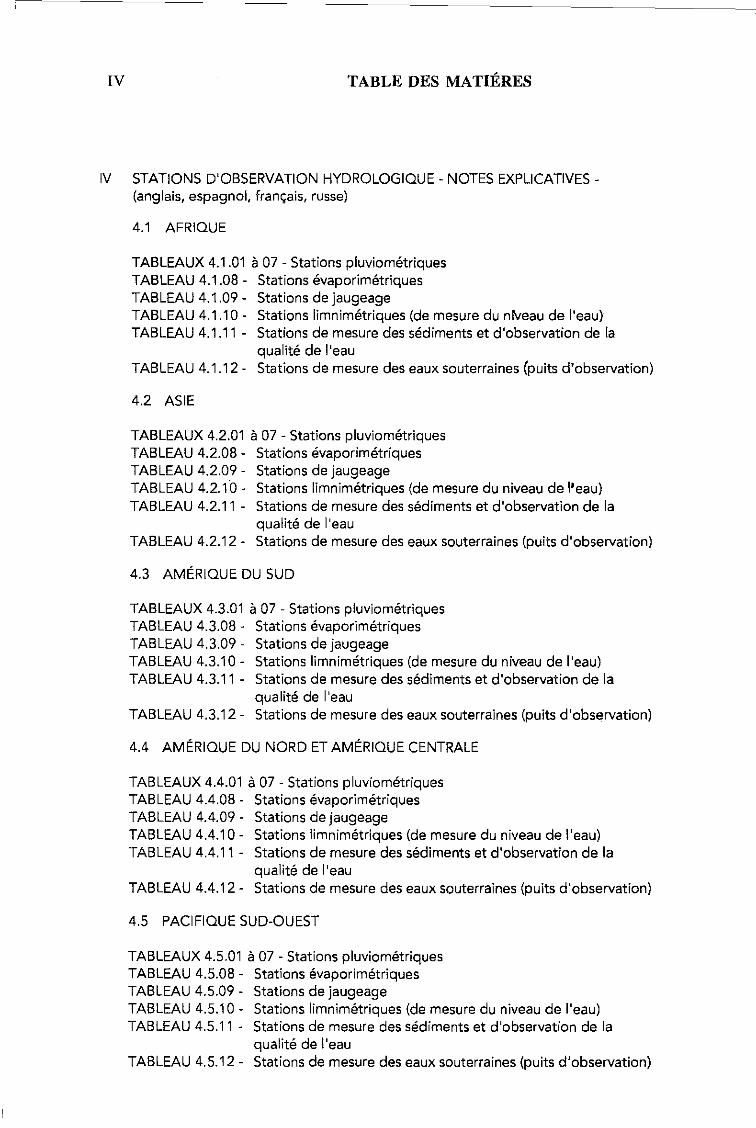
IV STATIONS D'OBSERVATION HYDROLOGIQUE - NOTES EXPLICATIVES(anglais, espagnol, fran~ais, russel
4.1 AFRIQUE
TABLEAUX 4.1.01 a07 - Stations pluviometriquesTABLEAU 4.1.08 - Stations evaporimetriquesTABLEAU 4.1.09 - Stations de jaugeageTABLEAU 4.1.10 - Stations Iimnimetriques (de mesure du n1veau de I'eau)TABLEAU 4.1.11 - Stations de mesure des sediments et d'observation de la
qualite de I'eauTABLEAU 4.1.12 - Stations de mesure des eaux souterraines (puits d'observation)
4.2 ASIE
TABLEAUX 4.2.01 a07 - Stations pluviometriquesTABLEAU 4.2.08 - Stations evaporimetriquesTABLEAU 4.2.09 - Stations de jaugeageTABLEAU 4.2.10 - Stations Iimnimetriques (de mesure du niveau de "eau)TABLEAU 4.2.11 - Stations de mesure des sediments et d'observation de la
qualite de I'eauTABLEAU 4.2.12 - Stations de mesure des eaux souterraines (puits d'observation)
4.3 AMERIQUE DU SUD
TABLEAUX 4.3.01 a07 - Stations pluviometriquesTABLEAU 4.3.08 - Stations evaporimetriquesTABLEAU 4.3.09 - Stations de jaugeageTABLEAU 4.3.10 - Stations limnimetriques (de mesure du niveau de I'eau)TABLEAU 4.3.11 - Stations de mesure des sediments et d'observation de la
qualite de I'eauTABLEAU 4.3.12 - Stations de mesure des eaux souterraines (puits d'observation)
4.4 AMERIQUE DU NORD ET AMERIQUE CENTRALE
TABLEAUX 4.4.01 a07 - Stations pluviometriquesTABLEAU 4.4.08 - Stations evaporimetriquesTABLEAU 4.4.09 - Stations de jaugeageTABLEAU 4.4.10 - Stations Iimnimetriques (de mesure du niveau de I'eau)TABLEAU 4.4.11 - Stations de mesure des sediments et d'observation de la
qualite de I'eauTABLEAU 4.4.12 - Stations de mesure des eaux souterraines (puits d'observation)
4.5 PACIFIQUE SUD-OUEST
TABLEAUX 4.5.01 a07 - Stations pluviometriquesTABLEAU 4.5.08 - Stations evaporimetriquesTABLEAU 4.5.09 - Stations de jaugeageTABLEAU 4.5.10 - Stations Iimnimetriques (de mesure du niveau de I'eau)TABLEAU 4.5.11 - Stations de mesure des sediments et d'observation de la
qualite de I'eauTABLEAU 4.5.12 - Stations de mesure des eaux souterraines (puits d'observation)
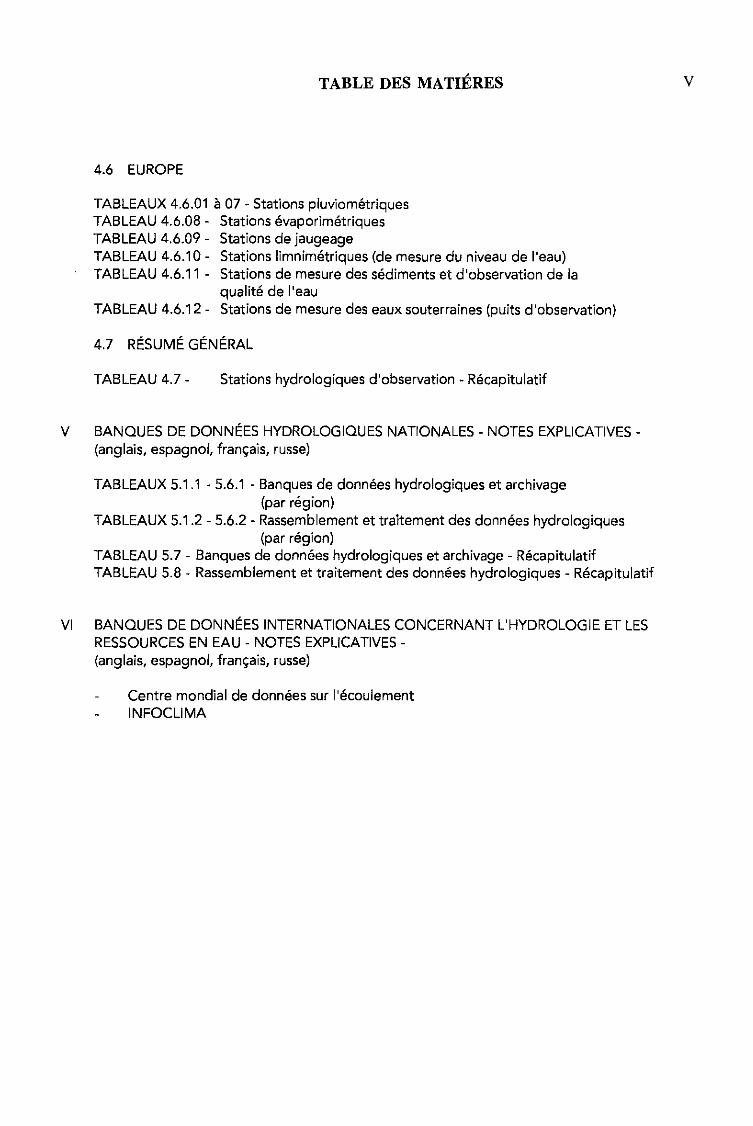
TABLE DES MATIERES
4.6 EUROPE
TABLEAUX 4.6.01 a07 • Stations pfuviometriquesTABLEAU 4.6.08· Stations evaporimetriquesTABLEAU 4.6.09· Stations de jaugeageTABLEAU 4.6.10· Stations Iimnimetriques (de mesure du niveau de I'eau)TABLEAU 4.6.11· Stations de mesure des sediments et d'observation de fa
qualite de I'eauTABLEAU 4.6.12· Stations de mesure des eaux souterraines (puits d'observation)
4.7 RESUME GENERAL
v
TABLEAU 4.7 . Stations hydrologiques d'observation • Recapitulatif
V BANQUES DE DONNEES HYDROLOGIQUES NATIONALES· NOTES EXPLICATIVES·(anglais, espagnof, fran<;ais, russel
TABLEAUX 5.1.1 ·5.6.1 . Banques de donnees hydrologiques et archivage(par region)
TABLEAUX 5.1 .2 - 5.6.2 - Rassemblement et traitement des donnees hydrologiques(par region)
TABLEAU 5.7 - Banques de donnees hydrologiques et archivage - RecapitulatifTABLEAU 5.8 - Rassemblement et traitement des donnees hydrologiques - Recapitulatif
VI BANQUES DE DONNEES INTERNATIONALES CONCERNANT L'HYDROLOGfE ET LESRESSOURCES EN EAU - NOTES EXPLICATIVES-(anglais, espagnof, fran~ais, russel
Centre mondial de donnees sur I'ecoulementINFOCLIMA

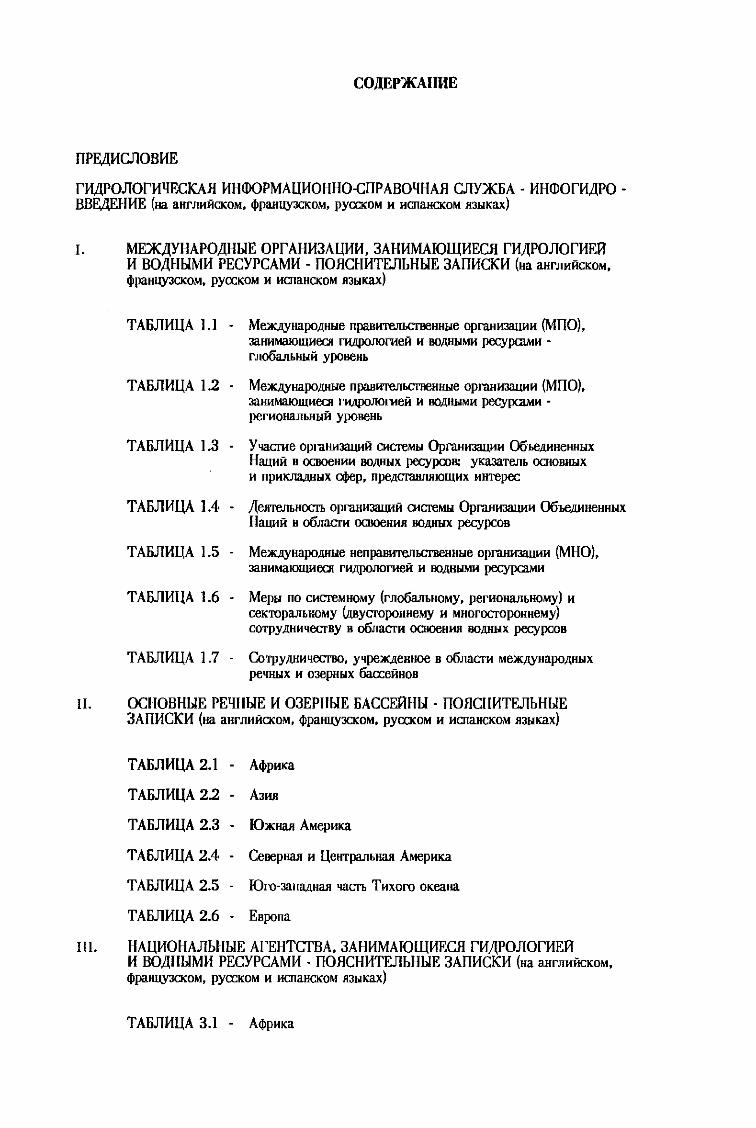
CO,1lEPJKAIIUE
fiPE,L{HCJlOBHE
r\1,L\POJIOrWIECKAH HHlDOPMAUHOHHO-efiPABOlffiAH CJlY)f(6A • HHlDOrH.lIPO BBE.l\EHHE (00 aHrnHHCKOM. cjlPaHuy.JCKOM. pyaxOM H HCIlaHCKOM J13b11GlX)
I. ME)f(,l\YHAPO.llHblE OprAHH3AUHH. 3AHHMAIOlUHECH rH.lIPOJIOmEllH BO.lIllblMH PECYPCAMH - fiOHCHHTEJIbHblE 3AfiHCKH (Ha anrnHHcICOM,cjlpaHuy.JCKOM, PYCCICOM H HCI1aHCKOM J13b11GlX)
TA6JIHUA l.I - MeJK.l\Ynapo.lUlbie npaBlITe!lLCrBeHHble OpnUlIlJaWtH (MfiO),JaHHMaIOWHeca fl\llIlOJIOrHeH HBO.IUIbIMH pecypcaMH -rJI06aJ1hHblH ypoueHh
TA6JIHUA 1.2 - MeJK.l\Yllllpo.lUlbie npaBlITe!lLCrBeHHble 0PJ'aHIl3aUHH (MfiO).JaHHMaIOWHeca fl\llIlOJIOrHeH H BO,/\IIbIMH pecypcaMH perHOHa1lhHblH ypoueHh
TA6JIHUA 1.3 - Y'llICl'lIe OpraHH33llHH CllCreMbl OpI'3Hll3aUHH 06W.IUIHeHHblXHauHH BOCBOeHHH BO.lUlbiX pecypooB: YICBJaTeJJh OCHOBHblXH npHlCJlllJ\IIblX ajlep, npe.llcraBJUlIOWHX HHTepec
TA6JIHUA 1.4 .lIeJlTeJJhHOCI'h opraHIl3aUHH CIIcreMbl OPI'3Hll3aUHH 06W)lHHeHHblXHBUHH BOOJlacrH OCBOeHHB BO)lHbIX pecyPCOB
TA6JIHUA 1.5 MeJK.l\YHapo.lUlbie Henpa8llTe!lhCI'ueHHble 0PJ'aHIl3aUHH (MHO),JaHHMBIOWHeca rH.llpDJlOrHeH H BO.lUlblMH pecypcaMH
TA6JIHUA 1.6 Mepbl no CHcreMIIOMY (rJlooaJIhHoMY. pemOHa1lhllOMy) HCelCTOpaJIhllOMY UlBycropoHHeMY H MHorocropoHHeMY)COTpY.IUIHqecrBY B06JIacrH ornoeHHB BO.lUlbiX pecypooB
TA6JlHUA 1.7 - CoTpY.IUIHqecroo, yqpeJlC,lleHHOe BOOJlacrH MeJK.l\YHapo.lUlbiXpeqHblX HOJepHblX 6acceHHoB
II. OCHOBHblE PElJllbiE H 03EPHblE 6ACCEllllbi - fiOHCHHTEJIbHblE3AfiHCKH (na aHrJlHHCKOM. cjlpaHI\Y3CKOM, PyaxOM H HCIlaHCICOM J13b1KaX)
TA6J1HUA 2.1 AcjlPHKa
TA6JIHUA 2.2 A3HB
TA6JIHUA 2.3 IOxHBJI AMepHKa
TA6JIHUA 2.4 CeoepHBJI H UeHTpaJIhHBJI AMepHlCa
TA6JlHUA 2.5 IOro-JanB)lHaB qaCTh THXOro olCeaoo
TA6JIHUA 2.6 EBpona
Ill. HAUHOHAJIbHblE ArEHTCTBA. 3AHHMAIOlUHECH r\1,L\POJlOmEllH BO.lIllblMH PECYPCAMH - fiOHCHHTEJIbHblE 3AfiHCKH (Ha aHrJlHHcICOM,cjlpaHI\Y3ClCOM, PYCCICOM H HCI1aHCKOM J13b1KaX)
TA6JlHUA 3.1 - AcjlpHlCa
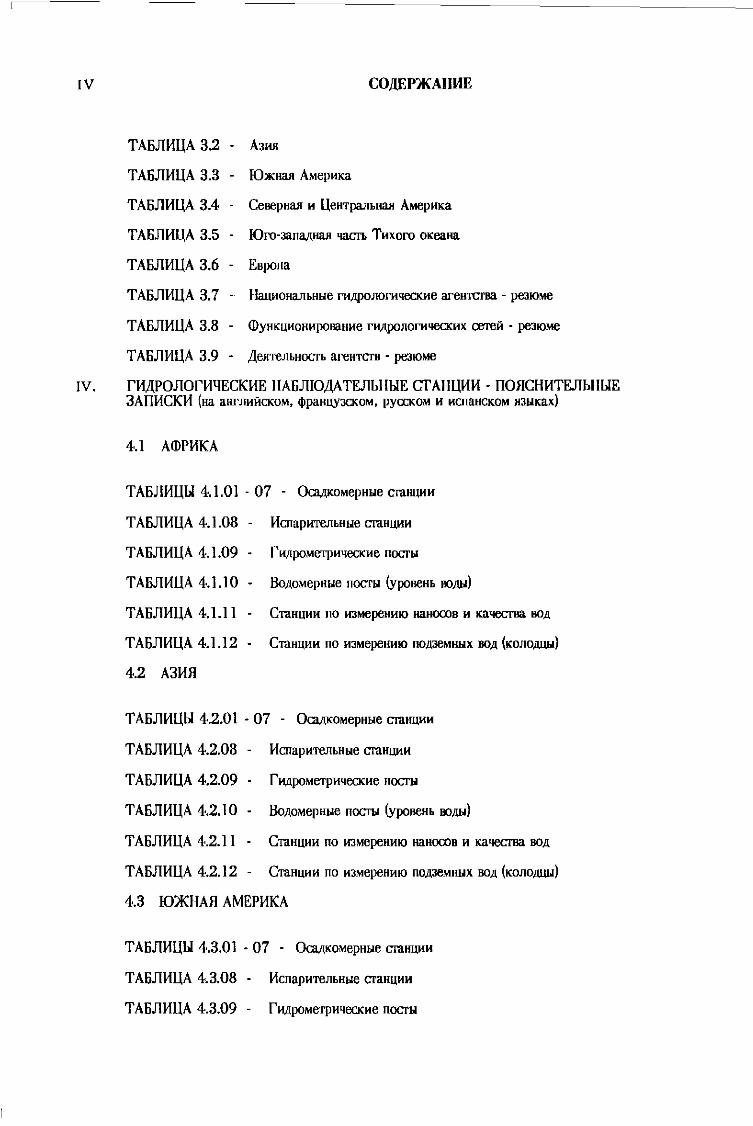
IV COllEPJKAIUlE
TA6Jll1UA 3.2 AJItH
TA6JlI1UA 3.3 IOJlCuaa AMeplllffi
TA6Jll1UA 3.4 Ceoepuaa H UeHTpa.1Ibuaa AMePlllffi
TA6Jll1UA 3.5 IOro-Jan3,l\llllJl 'llICTh THXOro OKeaJIll
TA6JlI1UA 3.6 Eopona
TA6Jll1UA 3.7 H3l\HOH3J1bHlle rHJJPOJIOrHqeome areHTCTIlll - peJlOMe
TA6Jll1UA 3.8 lDYHKUIIOHHpooaHlie rll)(poJlOrH'IOCICIiX cereii • peJIOMe
TA6Jll1UA 3.9 .lleIlTeJlbHOCTh areHTCI'll • peJlOMe
IV. fl1.llPOJlOfI1QECKI1E HA6JlIO.llATEJlbHblE crAHUI1I1 • 1l0RCHl1TEJlbHblE3AIll1CKl1 (Ha aHrJllliiCKoM. ",paHuYJCKOM. pyaxOM 11 HcnaHCKoM IlJIlKaX)
4.1 AlDPI1KA
TA6Jll1UbI 4.1.01 - 07 - OGlilKoMepHlle CTaHllllH
TA6Jll1UA 4.1.08 I1cnapHTeJlbHlle CTaHUHH
TA6Jll1UA 4.1.09 flf,l{POMeTpllqeCKHe nocrll
TA6Jll1UA 4.1.1 0 Bo,/\oMepHlle nOCfll (ypooeHb 1lO,/\Il)
TA6Jll1UA 4.1.11 CTaHUHH no I1JMepeHHIO HaHOCOO HKa'lOCl1lll 110,/\
TA6Jll1UA 4.1.12 CTaHUHH no HJMepeHHIO IIO,/\JeMHIlX 110,/\ (KOJlO.llUll)
4.2 A3l1R
TA6Jll1UbI 4.2.01 . 07 - OGlilKoMepHlle CTaHUHH
TA6Jll1UA 4.2.08 I1cnapHTeJlbHlle CTaHUHH
TA6Jll1UA 4.2.09 fll)(POMeTpHqeCKHe nocrll
TA6Jll1UA 4.2.10 Bo,/\oMepHlle nOCfll (ypooeHb 1lO,/\Il)
TA6Jll1UA 4.2.11 CTaHUHH no I1JMepeHHIO HaHOCOO HKa'lOCl1lll 80,/\
TA6Jll1UA 4.2.12 CTaHUHH no HJMepeHHIO nO,/\JeMHIlX 80,/\ (KOJlO.llUll)
4.3 IO)KHAR AMEPl1KA
TA6Jll1UbI 4.3.01 . 07 . OGlilKoMepHlle CTaHUHH
TA6Jll1UA 4.3.08
TA6Jll1UA 4.3.09
I1cnapHTeJlbHlle craHuHH
COllEPXAIUlE
TA6JUlUA 4.3.1 0 BoiloMepHue nocru (YPOOOHL OOi\U)
TA6JUIUA 4.3.1 1 CTIlHIUlIt no IfJMepeHlt10 HaHOCOB It Ka'leCI'Ba BOil
TA6JUlUA 4.3.1 2 CTIlHIUlIt no 1t3MepeHltlO noilJeMHUX BOil (KOJlOJUU,l)
4.4 CEBEPHAJI H UEHTPAJ1hHAJI AMEPHKA
TA6J1HUhI 4.4.01 - 07 . Oa!.n.xoMepHue eraHlUlIt
TA6J1HUA 4.4.08 HcnapltTeJlLHUe eraMU1t1t
TA6J1HUA 4.4.09 flti\poMeT)lltqeOClte nocru
TA6J1HUA 4.4.1 0 BoiloMepHble nocru (YPOOOHL OOi\U)
TA6J1HUA 4.4.1 1 CTIlHIUlIt no IfJMepeHlt10 HaHOCOB H Ka'lOCI'Ba BOil
TA6J1HUA 4.4.12 CTIlHIUlH no H3MepeHHlO nOilJeMHUX BOil (KOJlOJUU,l)
4.5 IOfo-3AnA,L\HAJllIACTh THXOro OKEAHA
TA6J1HUhI 4·.5.01 . 07 - Oa!.n.xoMepHue eraHlUlH
TA6J1HUA 4.5.08 HcnapltTeJlLHUe eraHUHH
TA6J1HUA 4.5.09 fIti\POMeT)lHqOCXHe nocru
TA6J1HUA 4.5.10 BoiloMepHue nocru (YPOOOHL OOi\U)
TA6J1HUA 4.5.1 1 CTIlHIUlH no IfJMepeHHIO HaHOCOB H Ka'leCI'Ba BOil
TA6J1HUA 4.5.12 CTIlHIUlH no H3MepeHHlO noilJeMHUX BOil (KOJlOJUU,l)
4.6 EBPOnA
TA6J1HUhI 4.6.01 - 07 - Oa!.n.xoMepHble eraHIUlH
TA6J1HUA 4.6.08 HcnapHTeJlLHble eraMUHH
TA6J1HUA 4.6.09 fH.ilPOMeT)lHqOCXHe nocru
TA6J1HUA 4.6.10 BoiloMepHble (ypoOOHL BOi\U) nocru
TA6J1HUA 4.6.1 1 CTIlHIUlH no IfJMepeHlt10 HaHOCOB H Ka'leCI'Ba BOil
TA6J1HUA 4.6.1 2 CTIlHUItIt no 1t3MepeHltlO noilJeMHUX BOil (KOJlOiU-U>l)
4.7 06IUEE PE3IOME
v
TA6J1HUA 4.7 .
VI COllEPiKAllnE
V. HAUHOHAJlhllbiE IiAHKH rH,l\POJlOrHlJECKHX ,l\AHIIblX ITOJlCHHTEJlhHblE 3AITHCKH (ua aHrJlHiiCKoM, 4lpaHuY3CKOM, pya::KOMHHCIlaHCKOM HJblKaX)
TAIiJlHUbi 5.1.1 • 5.6.1 • IiaHKH rHJlllOJKJrHqeaCllX )\HHHbIX HapXH8Hl\HlI(no PerHoHaM)
TAIiJlHUbi 5.1.2-5.6.2
TAIiJlHUA 5.7
TAIiJlHUA 5.8
COOp H06pa60TKll rHJljlOJIOrnqeCKHX i\HHHblX(no PerHoHaM)
IiaHKH rHJlllOJIOrH'IOCKHX i\HHHblX HapXH8Hl\HlI pe3IOMe
COOp H06pa6oTKll rHJlpoJlOrHqecKHx i\HHHblX pe3IOMe
VI. ME')I()\YHAPO,l\HblE IiAHKH ,l\AHllblX, OTHOCJIll\HXCJI K rH,l\POJlOrHHH BO,l\HblM PECYPCAM - ITOJlCIIHTEJlhHblE 3AITHCKH (ua aHrJlHiicKOM,4lpaHUYJCKOM, pya::KOM HHCIIaHCKOM HJblKllX)
r J106a.nbHblii ueHTp )\HHHblX no CTOKy
HlIlDOKJlHMA
[NDICE
PREAMBULO
SERVICIO DE REFERENCIAS E INFORMACI6N SOBRE DATOS HIDROL6GICOS- INFOHYDRO - INTRODUCCI6N (espanol, frances, ingles, ruso)
ORGANIZACIONES INTERNACIONALES QUE SE OCUPAN DE HIDROLOGfA Y DERECURSOS H[DRICOS - NOTAS EXPLICATIVAS (espanol, frances, ingles, ruso)
CUADRO 1.1 - Organizaciones internacionales gubernamentales que se ocupan dehidrologfa y de recursos hfdricos - Mundiales
CUADRO 1.2 - Organizaciones internacionales gubernamentales que se ocupan dehidrologfa y de recursos hfdricos - Regionales
CUADRO 1.3 - Intervenci6n de las organizaciones del sistema de las Naciones Unidasen el desarrollo de recursos hidricos: indicaci6n de las esferas principales y aplicadas de interes
CUADRO 1.4 - Intervenci6n de las organizaciones del sistema de las Naciones Unidasen materia de recursos hfdricos
CUADRO 1.5 - Organizaciones internacionales no gubernamentales que se ocupan dehidrologfa y de recursos hfdricos
CUADRO 1.6 - Acuerdos de cooperaci6n a nivel del sistema (mundial, regional) y sectorial (bilateral 0 multilateral) para el desarrollo de recursos hfdricos
CUADRO 1.7 - Cooperaci6n institucionalizada en cuencas fluviales. y lacustresinternacionales
II PRINCIPALES CUENCAS FLUVIALES Y LACUSTRES - NOTASEXPLICATIVAS (espanol,frances, ingles, ruso)
CUADRO 2.1 - AfricaCUADRO 2.2 - AsiaCUADRO 2.3 - America del SurCUADRO 2.4 - America del Norte y America CentralCUADRO 2.5 - Suroeste del PacificoCUADRO 2.6 - Europa
III ORGANISMOS NACIONALES QUE SE OCUPAN DE LA HIDROLOGIA Y DE RECURSOSHfDRICOS - NOTAS EXPLICATIVAS (espanol, frances, ingles, ruso)
CUADRO 3.1 - AfricaCUADRO 3.2 - AsiaCUADRO 3.3 - America del SurCUADRO 3.4 - America del Norte y America CentralCUADRO 3.5 - Suroeste del PacificoCUADRO 3.6 - EuropaCUADRO 3.7 - Organismos hidrol6gicos nacionales - ResumenCUADRO 3.8 - Funcionamiento de redes hidrol6gicas - ResumenCUADRO 3.9 - Actividades de organismos - Resumen
IV INDICE
IV ESTACIONES DE OBSERVACI6N HIDROL6GICA - NOTAS EXPLICATIVAS (espanol,frances, ingles. ruso)
4.1 AFRICA
CUADROS 4.1.01 a .07 - Estaciones de medici6n de la precipitaci6nCUADRO 4.1.08 - Estaciones de medici6n de la evaporaci6nCUADRO 4.1.09 - Estaciones de medici6n del caudalCUADRO 4.1.10 - Estaciones de medici6n de la altura (nivel del agua)CUADRO 4.1.11 - Estaciones de medici6n de sedimentos y de la calidad del aguaCUADRO 4.1.12 - Estaciones de medici6n de aguas subtemlneas (pozos)
4.2 ASIA
CUADROS 4.2.01 a .07 - Estaciones de medici6n de la precipitaci6nCUADRO 4.2.08 - Estaciones de medici6n de la evaporaci6nCUADRO 4.2.09 - Estaciones de medici6n del caudalCUADRO 4.2.10 - Estaciones de medici6n de la altura (nivel del agua)CUADRO 4.2.11 - Estaciones de medici6n de sedimentos y de la calidad del aguaCUADRO 4.2.12 - Estaciones de medici6n de aguas subtemlneas (pozos)
4.3 AMERICA DEL SUR
CUADROS 4.3.01 a .07 - Estaciones de medici6n de la precipitaci6nCUADRO 4.3.08 - Estaciones de medici6n de la evaporaci6nCUADRO 4.3.09 - Estaciones de medici6n del caudalCUADRO 4.3.10 - Estaciones de medici6n de la altura (nivel del agualCUADRO 4.3.11 - Estaciones de medici6n de sedimentos y de la calidad del aguaCUADRO 4.3.12 - Estaciones de medici6n de aguas subtemlneas (pozos)
4.4 AMERICA DEL NORTE Y AMERICA CENTRAL
CUADROS 4.4.01 a .07 - Estaciones de medici6n de la precipitaci6n'CUADRO 4.4.08 - Estaciones de medici6n de la evaporaci6nCUADRO 4.4.09 - Estaciones de medici6n del caudalCUADRO 4.4.10 - Estaciones de medici6n de la altura (nivel del agua)CUADRO 4.4.11 - Estaciones de medici6n de sedimentos y de la calidad del aguaCUADRO 4.4.12 - Estaciones de medici6n de aguas subtemlneas (pozos)
4.5 SUROESTE DEL PAC[FICO
CUADROS 4.5.01 a .07 - Estaciones de medici6n de la precipitaci6nCUADRO 4.5.08 - Estaciones de medici6n de la evaporaci6nCUADRO 4.5.09 - Estaciones de medici6n del caudalCUADRO 4.5.10 - Estaciones de medici6n de la altura (nivel del agua)CUADRO 4.5.11 - Estaciones de medici6n de sedimentos y de la calidad del aguaCUADRO 4.5.12 - Estaciones de medici6n de aguas subterraneas (pozos)
INDICE
4.6 EUROPA
CUADROS 4.6.01 a .07 - Estaciones de medicion de la precipitacionCUADRO 4.6.08 - Estaciones de medicion de la evaporacionCUADRO 4.6.09 - Estaciones de medicion del caudalCUADRO 4.6.10 - Estaciones de medicion de la altura (nivel del agua)CUADRO 4.6.11 - Estaciones de medicion de sedimentos y de la calidad del aguaCUADRO 4.6.12 - Estaciones de medicion de aguas subterraneas (pozos)
4.7 RESUMEN MUNDIAL
CUADRO 4.7 - Estaciones de observacion hidrologica - Resumen
V BANCOS DE DATOS HIDROLOGICOS NACIONALES - NOTAS EXPLICATIVAS (espanol,frances, ingles, ruso)
CUADROS 5.1.1. a 5.6.1 - Bancos y archivo de datos hidrologicos (por Regiones)CUADROS 5.1.2 a 5.6.2 - Concentracion y proceso de datos hidrologicos (por Re
giones)CUADRO 5.7 - Bancos y archivo de datos hidrologicos - ResumenCUADRO 5.8 - Concentracion y proceso de datos hidrologicos - Resumen
VI BANCOS DE DATOS INTERNACIONALES RELACIONADOS CON LA HIDROLOGfA YLOS RECURSOS HfDRICOS - NOTAS EXPLICATIVAS (espanol, frances, ingles, ruso)
Centro Mundial de Datos de Escorrentfa
INFOCLIMA
v

HYDROLOGICAL INFORMATION REFERRAL SERVICE· INFOHYDRO .INTRODUCTION
PURPOSE AND SCOPE
1. The Hydrological Infonnation Referral Service - INFOHYDRO - is a service for thedissemination of infonnation on:
(a) National and international (governmental and non-governmental) organizations,institutions and agencies dealing with hydrology;
(b) Hydrological and related activities of these bodies;
(c) Principal international river and lake basins of the world;
(d) Networks of hydrological observing stations of countries - numbers of stations andduration of records;
(e) National hydrological data banks - status of collection, processing and archiving ofdata;
(f) International data banks related to hydrology and water resources.
2. INFOHYDRO is a metadata base and therefore does not contain or handleactual hydrological data, nor does it duplicate national referral systems. It isdesigned to facilitate the prompt dissemination of continually updated hydrological information aslisted above to Member countries, particularly for the benefit of their experts, agencies andenterprises engaged in activities or projects related to water-resource assessment, development andmanagement requiring support from national, regional or international agencies dealing withoperational hydrology. The infonnation available in INFOHYDRO provides a good indication ofwater-resources assessment activities of Members. As a computerized service, INFOHYDRO isexpected to be developed gradually into an "on-line" system which will be made available toMembers and other users.
COMPONENTS AND FUNCTIONS OF INFOHYDRO
3. INFOHYDRO consists of the two components described below.
A. INFOHYDRO Manual
4. The INFOHYDRO Manual contains infonnation concerning the entire INFOHYDRO andits operation. It also contains all hydrological information available at present in INFOHYDRO.Thus, the Mannal comprises in a single volume comprehensive information on the HydrologicalServices of the countries of the world and their data-collection activities.
XXII INFOHYDRO - INTRODUCTION
5. The Manual is distributed according to WMO procedures for hydrological publicationsof the Organization supplied to:
(a) Permanent representatives of Members with WMO or Directors ofMeteorological and Hydrometeorological Services of Members;
(b) Hydrological advisers to permanent representatives, or Hydrological Agenciesof Members;
(c) United Nations and specialized agencies involved in hydrology and waterresources;
(d) International river basin commissions and non-governmental organizationswith whom WMO has working agreements.
6. Others users may purchase the Manual from WMO.
B. Computer services
7. INFOHYDRO is maintained as a computerized data base, and data can also besupplied on diskette. Requests should be addressed to:
The Secretary-GeneralWorld Meteorological Organization
41 , Avenue Giuseppe MottaP.O. Box 2300
CH-1211 GENEVA 2Switzerland
Telephone: (+41 22) 730 81 11Telegramme: METEOMOND GENEVE
Telex: 23 260 OMM CHFacsimile: (+41 22) 734 2326
C. Sources of information
8. The information in INFOHYDRO was collected from Members by means ofquestionnaires, supplemented where appropriate by published information and that availablethrough the UN system. INFOHYDRO was first published in 1977 as OperationalHydrology Report No. 10 - Statistical Information on Activities in Operational Hydrology(WMO-No. 464). This publication forms the basis of the INFOHYDRO Manual and thecomputer service. The computerized information pertaining to each country was reviewed,updated and/or completed by the country concerned.
D. Updating
9. The information stored is updated continually, as new information becomes availablethrough different channels such as WMO experts' reports, missions of Secretariat officers,
INFOHYDRO . INTRODUCTION XXIII
WMO Commission for Hydrology and the working groups on hydrology of the WMO regionalassociations*. However, for purposes of completion, verification and authentification of theupdated information, the co-operation of Member countries will be sought at appropriateintervals.
10. However it may not be necessary to update and reprint the entire INFOHYDROManual because major revisions will tend to pertain to information concerning hydrologicalobserving stations and data banks. Therefore chapters IV, V and VI-Hydrological observingstations, Data banks and International data banks related to hydrology and water resourceswill require more frequent updating, and will be reissued as necessary.
* The Regional Associations of the World Meteorological Organization established byCongress are as follows:
Region I - MricaRegion II - AsiaRegion III - South AmericaRegion IV - North and Central AmericaRegion V - South-West PacificRegion VI - Europe

SERVICE DE REFERENCE CONCERNANT L'INFORMATION HYDROLOGIQUE - INFOHYDRO INTRODUCTION
OBJET ET PORTEE
1. Le Service de reference concernant I'information hydrologique - INFOHYDRO - est unservice de diffusion de donnees sur:
a) les organisations, institutions et organismes nationaux et internationaux (gouvernementauxet non gouvernementaux) qui s'occupent d'hydrologie;
b) les activites hydrologiques et apparentees de ces organismes;
c) les principaux bassins fluviaux et lacustres internationaux du monde;
d) les reseaux nationaux de stations hydrologiques d'observation (nombre de stations etduree des releves);
e) les banques de donnees hydrologiques nationales (etat du rassemblement, du traitementet de I'archivage des donnees);
f) les banques de donnees internationales concernant I'hydrologie et les ressources en eau.
2. INFOHYDRO est une base globale de donnees. C'est-il-dire qu'elle ne contient pas dedonnees hydrologiques iI proprement parler et ne fait donc pas double emploi avec les systemesde reference nationaux. Son objet est d'aider a communiquer rapidement des renseignementshydrologiques continuel/ement actualises aux pays Membres, en particulier au profit de leurs experts,organismes et entreprises charges d'activites au de prajets lies a I'evaluation, a la mise en valeur et ala gestion des ressources en eau et necessitant I'appui d'organismes nationaux, regionaux ouinternationaux qui s'occupent d'hydrologie operationnel/e. Les renseignements figurant dansINFOHYDRO dannent une bonne indication des activites d'evaluation des ressources en eau meneespar les Membres. En tant que systeme informatise, INFOHYDRO devrait etre transformeprogressivement en un service directement accessible aux pays Membres et autres utilisateurs.
COMPOSANTES ET FONCTIONS DU SYSTE:ME INFOHYDRO
3. Le systeme INFOHYDRO comprend les deux composantes decrites ci-dessaus.
A. Manuel INFOHYDRO
4. La manuellNFOHYDRO contient des renseignements sur I'ensemble du systeme et sur sonfonctionnement. On y trouve aussi tous les renseignements hydrologiques actuel/ement disponiblesdans ce systeme. Le manuei regroupe done en un seul volume des informations completes sur lesservices hydrologiques des divers pays et leurs operations de rassemblement de donnees.
XXVI INFOHYDRO - INTRODUCTION
5. Le manuel est diffuse conformement aux procedures de I'OMM applicables auxpublications hydrologiques; iI a donc ete adresse aux personnes et organismes suivants :
a) representants permanents ou directeurs des Services meteorologiques ethydrometeorologiques des pays Membres de I'OMM;
b) conseillers en hydroiogie aupres des representants permanents, ou organismeshydrologiques des pays Membres;
c) Organisation des Nations Unies (ONU) et institutions specialisees s'occupant d'hydrologieet de ressources en eau;
d) commissions des bassins fluviaux internationaux et organisations non gouvernementalesavec lesquelles I'OMM a passe des accords de travail.
6. Les autres personnes ou organismes interesses peuvent acheter Ie manuel a I'OMM.
B. Service informatise
7. INFOHYDRO est exploite comme une base de donnees informatisee, et les donneespeuvent etre communiquees sur disquette. Toute demande de renseignements sera envoyee aI'adresse suivante :
Monsieur Ie Secretaire generalOrganisation meteorologique mondiale41, avenue Giuseppe MottaCase postaIe N° 2300CH-1211 GENEVE 2Suisse
Telephone: (+41 22) 73081 11Telegramme: METEOMOND GENEVETelex: 23260 OMM CHTelecopie: (+41 22) 734 2326
C. Sources d'information
8. Les renseignements figurant dans INFOHYDRO ont ete rassembles aupres des paysMembres, grace ades questionnaires, et completes s'llle fallait par des renseignements publies oudes donnees disponibles dans Ie systeme des Nations Unies. Le premier document du genre a etepublie en 1977; iI s'agissait du Rapport N° 10 de la serie consacree a I'hydrologie operationnelle Statistical Information on Activities in Operational Hydrology (Information statistique sur lesactivites d'hydrologie operationnelle, OMM - W 464). Cette publication constitue la base du manuelet du service informatise INFOHYDRO. Chaque pays a examine, mis a jour et/ou complete lesrenseignements informatises Ie concernant.
D. Mise it jour
INFOHYDRO - INTRODUCTION XXVII
9. Les renseignements en memoire seront mis a jour en permanence, a mesure que lesdonnees nouvelles parviendront a I'OMM par des circuits tels que les rapports d'experts de I'OMM,les missions des responsables du Secretariat, la Commission d'hydrologie de I'OMM et les groupesde travail de I'hydrologie des associations regionales de I'OMM*. Toutefois, I'OMM demandera auxpays Membres de completer, de verifier et d'authentifier les renseignements actualises, a intervallesappropries.
10. Toutefois, iI ne sera peut-etre pas necessaire de mettre ajour et de reediter I'ensemble duManuel INFOHYDRO car les principales revisions porteront en general sur des renseignementsconcernant les stations hydrologiques d'observation et les banques de donnees. Aussi, les sectionsIV, Vet VI - "Hydrological observing stations" (Stations hydrologiques d'observation), "Nationalhydrological data banks" (Banques de donnees hydrologiques nationales) et "International databanks related to hydrology and water resources" (Banques de donnees internationales concernantI'hydrologie et les ressources en eau) - devraient etre mises a jour plus frequemment. Elles serontreeditees selon les besoins.
* Les associations regionales de l'Organisation meteorologique mondiale, telles qu'elles ont eteetablies par Ie Congres, sont les suivantes :
Region IRegion IIRegion III Region IV Region VRegion VI
AfriqueAsieAmerique du SudAmerique du Nord et Amerique centralePacifique Sud-OuestEurope

flfllPOJlOflfqECKAJI IfWIlOPMAUIfOlIIIO-CnPABOqIlAJI CJlYJKIiA - IfWIlOflfllPO •
BBEl{EIlIfE
UEJIL If OIlEPA nPIfMEllElIlfJl
1. flfApononm:CK3JI IIH<P!JpMaUlloHHo-cnpallOqlffiJl cnyJK6a - MJltDOfH.L\PO - flBJUleTCH O,l\HOH 113 cnyJK6
no pacnpocrpllHeHIIIO IIH<P!JpMaQllll 0:
a) HaulloHanLHhlX II MeJK,l\YHapolUlhlx (npaBIlTeJlbCfOOHHhlX II HenpaBIITMLCTOOHHhlX) opraHIlJaUIIflX,
yqpeJK,i\eHIIflX II RreHTCTBaX, JaHIlMaIOlUIIXCH rHilponorlleH;
b) ,l\eJlTMLHOCTIl opraHOB, ynoMJIHyTHX B nyHKTe (a), B 06naCTil rlfAponOrHll II CMeJKHhlX C HelO
06naCTJlx;
C) OCHOBHhlX MeJK)IYuapolUlhlX peqHhlX II 03epHhlX 6acceHHax Mllpa;
d) oeTflX rlfAponorllqecKlIX Ha6mo.MTenLHhlX CTaHUIlH. npIIHtI,llJ!e)IGlIUIIX crpauaM - qllcno CTaHUIIH II
)lnIlTenLHOCTL Ha6mo,l\eHIIH;
e) HaUIlOHanLHhlX 6aHKax rH,l\ponorllqecKllx .MHHhlX - COCTOflHlle c6opa, 06pa60TKIl II apXIlBaUll1l
){aHHblX;
f) MeJK)IYHapo,l\HhlX 6auKax .MHHhlX, OTHOCflIUIIXCH K TlfAponorllll II OOlUlhlM pecypcaM.
2. HHtDOfH.L\PO flBnfleTCH 6a30H MeTa,l\aHHhlX II, cne)(OBaTenLHO, He CO,l\epJKIIT II He 3aHilMaeTCfl
4>aKTllqeCKIlMII rll,l\ponOrllqeCKIlMIl )(aHHhlMII II He ,l\y6nllpyeT HaUIIOHaJlLHhle CnpaOOqHhle CIlCTeMhI. OHa
pa3pa60TaHa ,l\nfl 06nerQeHllfl 6HCTpol'() pacnpOCTpaHeHIIJI HenpephlBBO OOBOBnfleMOH rll,l\ponOl'lIqeCKOH
H"ljK:>pMalJ,HH, KOTOpaH nepeqHCJleHa Bblllle, CTpUHaM-lfJleHaM, B qacrHocTH, B nOMOLUh 3KcnepTaM, areHTCfBaM "
npe)(HpllflTIIflM, BooneqeHHhlM B i\eflTeJILHOCTL IInll llpoeKThI, OTHOCflIUlleCH K OI1eHKe. pa3BIITllIO II ynpaoneHll1O
HOi\HhIMIl pecypcaMlI, QTO Tpe6yeT nOiU\epJKKIl co CTOPOHhI HaUIlOHanLHhlX, pel'1I0HanLHHX IIJIII MeJKJIYHapoI\HHX
areHTCTB, JauIlMaJOllllIXCH onepaTIIBHOH I-IIi\poJIOrlleH. HH<P!JPMaullfl, HMelOIUMCH B pacnOpflJKeHllH HHOOfl1.L\PO•
.MeT xopolllee npei\CTaoneHlle 0 i\eflTenLHOCTII 'U!eBOH B 06naCTII oueHKII OO,l\BhlX pecypcoB. OJKII.MeTCH. 'ITO
I1HtDOfl1.L\PO KaK CJlyJK6a, OCHOBaHH3JI Ha IICIIonL30BaHIIII 3HM, nOCTeneHHO npeHpaTHTCH B CIICTeMY,
pa60TaJOll\Y1O B peJKIIMe IIOCTynneHllfl IIH<P!JPMal.(III1. KOTOpM 6Y,l\eT )(OCTyllHa queHaM II i\PyrllM nOnLJOBaTeHJIM.
KOMnOIlEIIThllf lIlYIIKUIfJl IflltllOflfllPO
3. HHOOfl1.L\PO COC!'OIlT 113 ,IlByX KOMnOHeHTOB. OllllcaHHhlX HIIJKe.
A. lIacTao..eHHe 110 IflltllOfJlllPO
4. lIaCTaJlJleHHe 110 IflltDOflfllPO CO,llep:lKllT I1H<P!JPMaI1I1IO. KacalOlllYIOCH 111100fl1.L\PO B uenOM 11 ee
4>YHKUIIOHIlPOBaHIlfl. OHO TaK:lKe CO,llep:lKllT BCIO l'Hi\ponOmqecKYIO I1H<P!JpMaUlllO, IIMelOIUYIOCH B HaCTOJlIUee HpeMJI
B pacnOpJlJKeHIlII I1HtDOfl1.L\PO. TaKI1M 06pa30M, B e,llllHCTBeHHOM TOMe IIaCTaBneHIIJI c06paHa 06rnllpH3JI
IIH<P!JPMal.(llJl no rll)(poHOrllqecKl1M cny:lK6aM CTpaH Mllpa II IIX i\eJlTenLHOCTII no c60py .MHHHX.
5. HaCTaoneHlle pacnpocrpaHJleTCH B COOToeTCTBlI1I C IIpaKTIIKoH HMO. npIIMeHJleMOH B OTHorneHllH
mi\ponorHqecKllx ny6nllKaUIIH OpraHllJaI1I1I1, T.e. OHO 6YJieT HanpaonJlTLCH:
a) nOCTOJlHHhlM npei\CTaBIITenJlM CTpaH-queHOO npll HMO IInll i\lIpeKTOpaM MeTeoponOmqecKllx II
rll)\poMeTeoponorllqecKllx cny:lKO queHOD;
XXII
b)
c)
d)
Y1IHDOfYlj(PO - BBFj\EHYIE
COBeTHHKaM no rHJ\poJIOrHqeCKHM BOllpocaM nocrOJlHHhlX npe,l\<:raHHTeJ1eH HJIII rHJ\poIlorHqecKHM
areHTCTBaM 'UieHOB;
OpratlH3aIlHH 06W,I\HHeHHhlX HauHH (0011) H cnel\HllJlH3HPOBaHHhlM areHTCTBaM, JailHMaIOlUHMCH
rHJ\pDIlorHeH H BO,l\HhlMH pecypcaMH:
KOMHCCHJlM no MeJK.uyHapo,l\HhlM peqHhlM 6acceHHaM H HenpaBHTeJ1bCTBeHHhlM opraHH3al\HJlM, C
KOTOPhlMH BMO HMeeT pa60qHe corIlaWeHHJl.
6. .l\pyrne nOIlb30BaTeJ1H M()ryT npH06peTaTb IlacraB.lleHHe y BMO.
B. KOMnLlOTepHLle yGJIyrH
7. Y1WDOrYlj(PO npe,l\<:raBJ1JleT co6oH KOMnLIOTepH3HpoBaHHylO 6a3Y ,l\aHHblX, npH aTOM ,l\aHHble MoryT
I1OC\'llB1UlTbCH Ha ,l\HCKere. 3allpocLl-3aJlBKH Ole.uyeT HanpaB.llJlTb 110 a,I\IJCGy:
The Secretary-GeneralWorld Meteorological Organisation
41, Avenue Giuseppe MottaP.O. Box 2300
CH-1211 GENEVA 2Switzeland
Telephone: (+41 22) 730 81 11Telegramme: METEOMOND GENEVE
Telex: 23260 OMM CHFacsimile: (+41 22) 734 23 26
C. IfcroqHHKH HH~PMaJ'HH
H11<DOrH.L\PO - BBE,L\EHHE XXIII
8. HH~pMaUHJI. HMelOUjaJICJI B paCnOpJllKeHHH HH<DOrHl\PO. 6WTa nOJlyqeHa OT qJleHOB Ha OCBOue
BOnpocHHKOB H 1l0nOJlHeHa npH He06xoIlHMOCTH ony6J1HKOBaHHOH HH~pMauHeH H TOH HH~pMauHeH. KOTOpaJI
llocTynHa B CHCTeMe OOH. :Oha HH<!>opMaUHJI BnepBble 6b1J1a ony6J1HKOBana B 1977 r. B Kaqecrue o~eTa no
onepaTHBHoH rHl\POJlOrHH NQ 10 - CTaTHCfHqecKIlJI HHl)OpMaUHH 0 ,t,eHTe.JILHOCTH B 06J1aCfH onepaTHBHoii
rH,t,pOJlOrHH (ny6J1HKaUHJI BMO NQ 464). 3Ta ny6J1HKaUHJI nOJlOlKeHa B OCHOBy lIacTaBJleHHH no
IfIl<DOflfllPO H KOMnLIOTepHoH CJ1YlK6b1. BuelleHHaJI B KOMHbIOTep HH~pMaUHJI no KalK)(OH CTpaHe 6b1Jla
nepecMOTpena. 06HoBJIena u/HJlH 1l0nOJlHeHa COOTOOTCTBYIOUjeH CTpauOH.
D. 06HOBJIeHHe
9. HH~pMaUHJI. xpaHJIUjaJICJI B KOMnLlOTepe. 1l0nOJlHJIeTCJI na HenpepblBHoH OCBOue no Mepe nOCTynJleHHJI
HOBOH HH<!>opMaUHH no TaKHM PllJJlHqHblM KaHaJIaM, KaK: OTqeTbI 3KcnepTOB BMO, KOMaHl\HpoBKH COTPYI\HHKOB
CeKpeTapHam, KOMHCCHJI BMO no rHl\poJlOrMH H pa60qHe rpynnbl no rHl\poJlOrMH perMOHaJIhHblX accoUHauHH
BMO·. Ol\HaKO c UeJlhlO KOMnJleKTaUHH. npouepKH H YCTaHOBJIeHHJI nOI\J1HHHOCTH 06HoBJIeHHoH HH<!>opMaUHH.
6YlleT npel\YCMOTpeHO YCTaIlOBJIeHHe COTPYI\HHqecTBa crpau-qneHOB qepeJ COOTueTCTBYIOUjHe HHTepBaJIbI BpeMeHH.
10. Ol\HaKO HaI\06HOCTH B 06HoBJIeHHH H nepeneqaTKe BCero lIacTaBJIeHHH 110 IfllalOfUllPO MOlKeT He
6b1Th no TOH IIpHqHHe, qTO OCHOBHOii lIepecMOTp 6YlleT KacaThCJI HH<!>opMaUHH. OTHOCJIUjeiiCJI K rHllpoJlorHqecKHM
lIa6J1lOllaTeJlLllblM CTaIlUHJlM H 6allKaM llaHHblX. CJleIlOBaTeJlLHO. rJlaBbI IV. V H VI - "rHllpoJlOrMqecKHe
Ha6J1IOIlHTeJILllble CTaHUHH", "6aHKH IlHHHblX" H "MelKl\YHapol\Hble 6aHKH IlHHHblX, OTHOCJIUjHXCJI K rHllpoJlOrMH H
BOl\HblM pecypcaM", 1I0Tpe6YlOT 60Jlee qacroro 06HoBJIeHHJI. OHH 6YI\YT nepelfJllHBaTLCJI no Mepe HeOOXOI\llMOCTH.
PerMOH IPerHoH IIPentOH IIIPerMOH IVPerMOH V
PerMOH VI
A<!,pHKa
A3HJIlOlKHaH AMepHKa
CeuepHaH H UeHTpailLHaH AMepHKa
lOro-JallaMaH qacrh THXOro oKeaHa
EBpona

SERVICIO DE REFERENCIAS E INFORMACION SOBRE DATOS HIDROLOGICOS INFOHYDRO - INTRODUCCION
FINALIDAD Y ALCANCE
1. EI Servicio de Referencias e Informaci6n sobre Datos Hidrol6gicos - INFOHYDRO - tienepor cometido difundir informaci6n sobre:
a) organizaciones, instituciones y organismos, nacionales e internacionales(gubernamentales y no gubernamentalesl que se ocupande hidrologia;
b) actividades hidrol6gicas y conexas de que se ocupan;
c) principales cuencas fluviales y lacustres internacionales del mundo;
d) redes de estaciones de observaci6n hidrol6gica de paises -numero de las estacionesy duraci6n de los registros;
e) bancos de datos hidrol6gicos nacionales - situaci6n de la concentraci6n, proceso yarchivo de datos;
f) bancos de datos internacionales relativos ala hidrologia y a 105 recursos hidricos.
2. EI INFOHYDRO es una base de metadatos, por 10 que no contiene ni trata datoshidrol6gicos reales y tampoco se solapa con los sistemas nacionales de referencia. Esta destinado afacilitar una pronta difusi6n de informaci6n hidrol6gica, actualizada de manera permanente, a lospaises Miembros, en especial a sus expertos, organismos y empresas que se ocupan de actividades 0
proyectos relacionados con la evaluaci6n, explotaci6n y gesti6n de recursos hidricos, para los que serequiere apoyo de organismos nacionales, regionales 0 internacionales que se ocupan de hidrologiaoperativa. La informaci6n contenida en el INFOHYDRO proporciona un buen indicio de lasactividades de evaluaci6n de recursos hidricos de los Miembros. Como el INFOHYDRO es unservicio automatizado, se espera convertirlo gradualmente en un sistema "en linea", a disposici6n delos Miembros y de otros usuarios.
COMPONENTES Y FUNCIONES DEL INFOHYDRO
3. EIINFOHYDRO consta de los dos componentes que se describen a continuaci6n:
A. Manual del INFOHYDRO
4. EI Manual dellNFOHYDRO contiene informaci6n relativa al sistema total dellNFOHYDROy su funcionamiento. Tambien engloba toda la informaci6n hidrol6gica disponible actualmente en elINFOHYDRO. Asi pues, el Manual comprende, en un unico volumen, informaci6n global relativa alos servicios hidrol6gicos de los paises y a sus actividades de concentraci6n de datos.
5. EI Manual se distribuye de acuerdo con 105 procedimientos aplicados por la OMM para ladistribuci6n de publicaciones hidrol6gicas de la Organizaci6n, par 10 que se suministra a:
a) los Representantes Permanentes de los Miembros ante la OMM 0 Directores de losServicios Meteorol6gicos e Hidrometeorol6gicos de los Miembros;
b) los Asesores hidrol6gicos de los Representantes Permanentes u organlsmoshidrol6gicos de 105 Miembros;
c) las Naciones Unidas (NUl y organismos especializados que se ocupan de hidrologia yrecursos hidricos;
d) las Comisiones y organizaciones no gubernamentales encargadas de cuencas fluvialesinternacionales con las que la OMM tiene concertados acuerdos de trabajo.
6. Otros usuarios pueden adquirir el Manual en la OMM.
XXII INFOHYDRO .INTRODUCCION
B. Servicios informatizados
7. EI INFOHYDRO se mantiene como base de datos informatizada, pudiendo suministrarselos datos tambien en disquete. Las peticiones de informaci6n deberan cursarse a.la siguientedirecci6n:
EI Secretario Generalde la Organizaci6n Meteorol6gica Mundial
41, Avenue Giuseppe MottaP.O. Box 2300
CH-1211 GINEBRA 2, SuizaTelefono: (+41 22) 73081 11
Telegrama: METEOMOND GENEVETelex: 23260 OMM CHFax: (+41 22}734 23 26
C. FUENTES DE INFORMACI6N
8. La informaci6n que contiene ellNFOHYDRO procede de la que los Miembros aportan pormedio de cuestionarios, completada, segun corresponda, con informaci6n publicada y con la que seproporciona por conducto del sistema de las Naciones Unidas. La informaci6n se public6 porprimera vez en 1977 en ellnforme N° 10 de Hidrologia Operativa - Informaci6n estadfstica sobreactividades de hidrologfa operativa (OMM N° 464). Esta publicaci6n constituye la base del Manualdel INFOHYDRO y el servicio informatizado. Se ha revisado, actualizado y/o completado por cadauno de ios parses interesados la informaci6n computarizada correspondiente a cada uno de ellos.
D. ACTUALIZACI6N
9. La informaci6n almacenada se actualiza continuamente, a medida que se dispone de nuevainformaci6n a traves de diferentes canales, como informes de expertos de la OMM, misiones defuncionarios de la Secretarfa, la Comisi6n de Hidrologfa de la OMM y los grupos de trabajo sobrehidrologfa de las Asociaciones Regionales de la OMM*. Sin embargo, con el fin de completar,verificar y autentificar la informaci6n actualizada, se solicitara la cooperaci6n de los pafses Miembrosa intervaios apropiados.
10. No obstante, tal vez no sea necesario actualizar y reimprimir la totalidad del ManualINFOHYDRO, ya que las principales revisiones corresponderan a la informaci6n relativa a lasestaciones de observaci6n hidrol6gica y los bancos de datos. Por tanto, los Capftulos IV, V Y VI Estaciones de observaci6n hidrol6gicas, los bancos de datos y los bancos de datos internacionalesrelativos a hidrologfa y recursos hfdricos habra que actualizarlos mas frecuentemente. Estos sevolveran a publicar en la medida necesaria.
* Las Asociaciones Regionales de la Organizaci6n Meteorol6gica Mundial establecidas por elCongreso son las siguientes:
Regi6n IRegi6n IIRegi6n IIIRegi6n IVRegi6n VRegi6n VI
AfricaAsiaAmerica del SurAmerica del Norte y America CentralSuroeste del PacificoEuropa
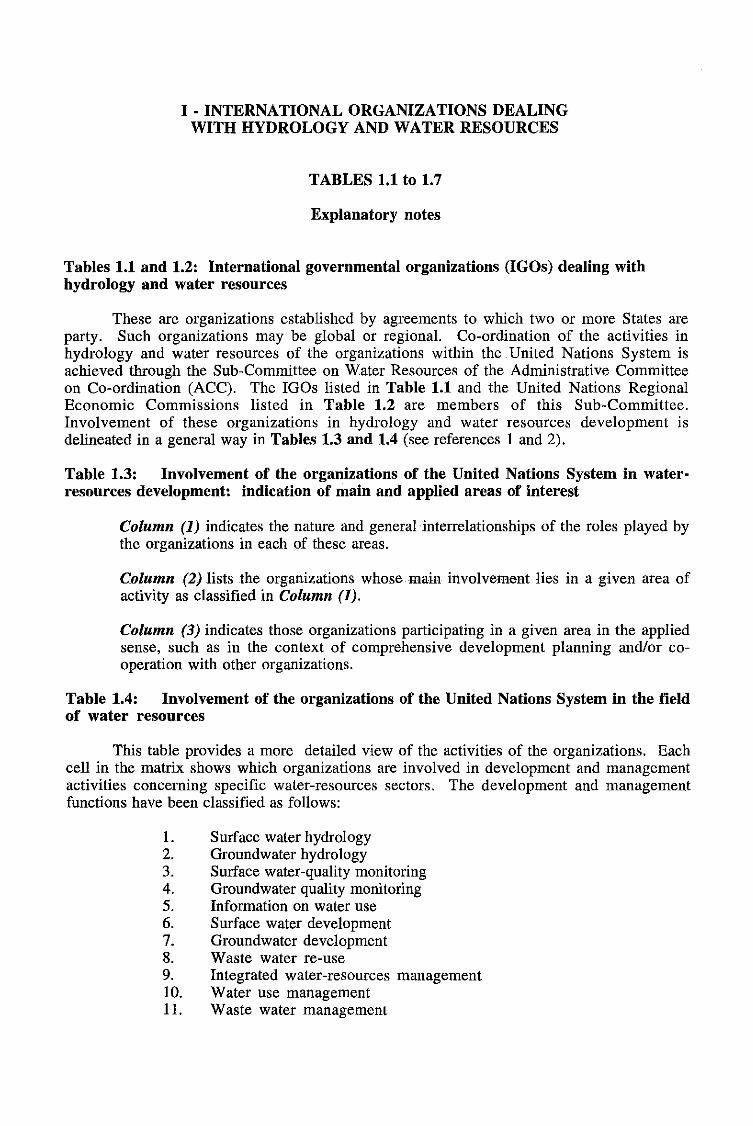
I - INTERNATIONAL ORGANIZATIONS DEALINGWITH HYDROLOGY AND WATER RESOURCES
TABLES 1.1 to 1.7
Explanatory notes
Tables 1.1 and 1.2: International governmental organizations (IGOs) dealing withhydrology and water resources
These are organizations established by agreements to which two or more States areparty. Such organizations may be global or regional. Co-ordination of the activities inhydrology and water resources of the organizations within the United Nations System isachieved through the Sub-Committee on Water Resources of the Administrative Committeeon Co-ordination (ACC). The IGOs listed in Table 1.1 and the United Nations RegionalEconomic Commissions listed in Table 1.2 are members of this Sub-Committee.Involvement of these organizations in hydrology and water resources development isdelineated in a general way in Tables 1.3 and 1.4 (see references land 2).
Table 1.3: Involvement of the organizations of the United Nations System in water-resources development: indication of main and applied areas of interest
Column (1) indicates the nature and general interrelationships of the roles played bythe organizations in each of these areas.
Column (2) lists the organizations whose main involvement lies in a given area ofactivity as classified in Column (1).
Column (3) indicates those organizations participating in a given area in the appliedsense, such as in the context of comprehensive development planning and/or cooperation with other organizations.
Table 1.4: Involvement of the organizations of the United Nations System in the fieldof water resources
This table provides a more detailed view of the activities of the organizations. Eachcell in the matrix shows which organizations are involved in development and managementactivities concerning specific water-resources sectors. The development and managementfunctions have been classified as follows:
1. Surface water hydrology2. Groundwater hydrology3. Surface water-quality monitoring4. Groundwater quality monitoring5. Information on water use6. Surface water development7. Groundwater development8. Waste water re-use9. Integrated water-resources management10. Water use management11. Waste water management
1.2
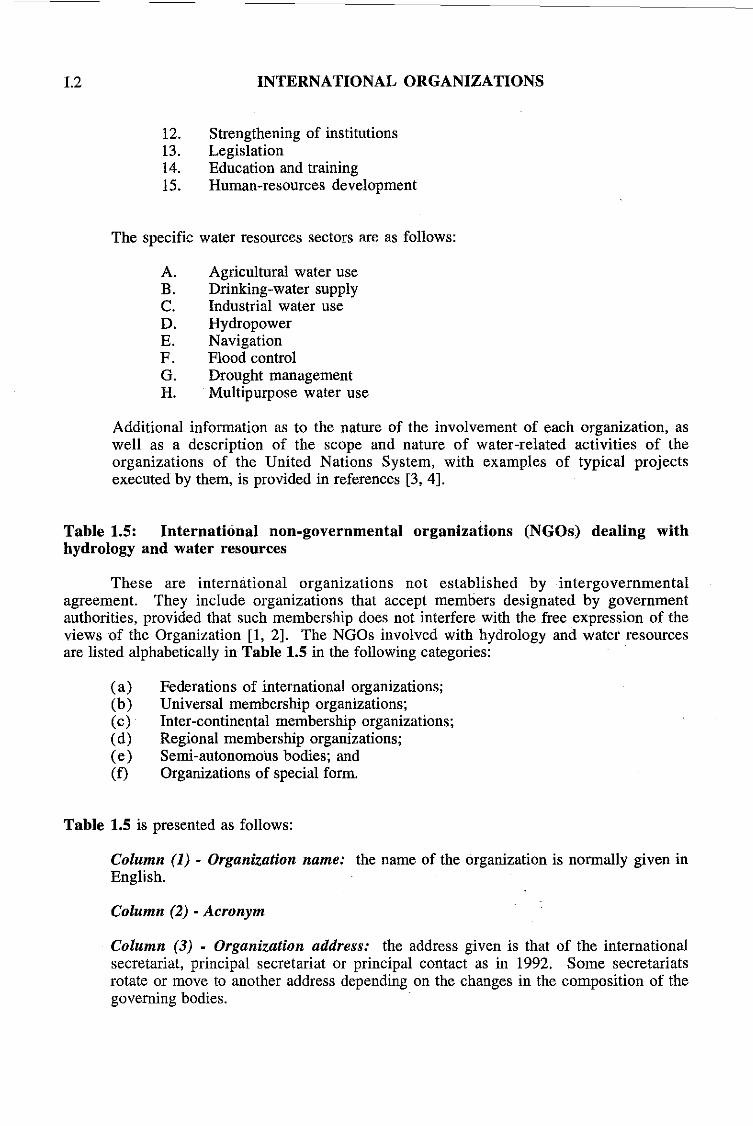
12.13.14.15.
INTERNATIONAL ORGANIZATIONS
Strengthening of institutionsLegislationEducation and trainingHuman-resources development
The specific water resources sectors are as follows:
A. Agricultural water useB. Drinking-water supplyC. Industrial water useD. HydropowerE. NavigationF. Flood controlG. Drought managementH. Multipurpose water use
Additional information as to the nature of the involvement of each organization, aswell as a description of the scope and nature of water-related activities of theorganizations of the United Nations System, with examples of typical projectsexecuted by them, is provided in references [3, 4].
Table 1.5: International non-governmental organizations (NGOs) dealing withhydrology and water resources
These are international organizations not established by intergovernmentalagreement. They include organizations that accept members designated by governmentauthorities, provided that such membership does not interfere with the free expression of theviews of the Organization [1, 2]. The NGOs involved with hydrology and water resourcesare listed alphabetically in Table 1.5 in the following categories:
(a) Federations of international organizations;(b) Universal membership organizations;(c) Inter-continental membership organizations;(d) Regional membership organizations;(e) Semi-autonomous bodies; and(f) Organizations of special form.
Table 1.5 is presented as follows:
Column (1) - Organization name: the name of the organization is normally given inEnglish.
Column (2) - Acronym
Column (3) - Organization address: the address given is that of the internationalsecretariat, principal secretariat or principal contact as in 1992. Some secretariatsrotate or move to another address depending on the changes in the composition of thegoverning bodies.
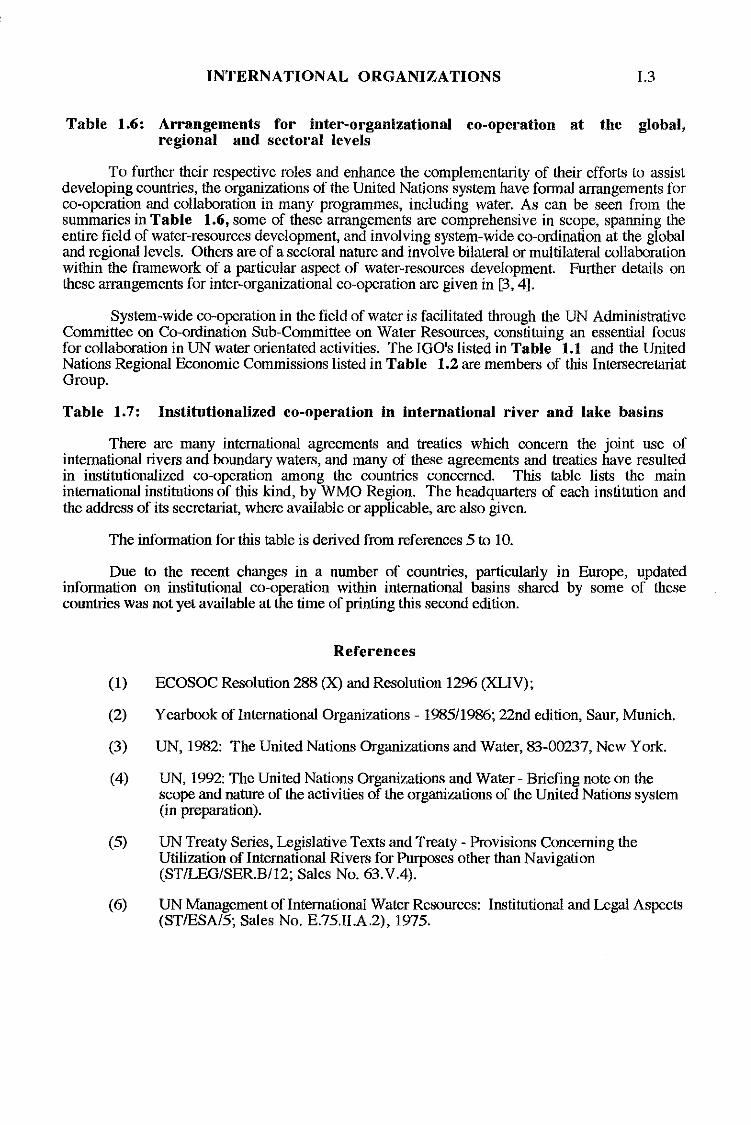
INTERNATIONAL ORGANIZATIONS 1.3
Table 1.6: Arrangements for inter-organizational co-operation at the global,regional and sectoral levels
To further their respective roles and enhance the complementarity of their efforts to assistdeveloping countries, the organizations of the United Nations system have formal arrangements forco-operation and collaboration in many programmes, including water. As can be seen from thesummaries in Table 1.6, some of these arrangements are comprehensive in scope, spanning theentire field of water-resources development, and involving system-wide co-ordination at the globaland regional levels. Others are of a sectoral nature and involve bilateral or multilateral collaborationwithin the framework of a particular aspect of water-resources development. Further details onthese arrangements for inter-organizational co-operation are given in [3,4].
System-wide co-operation in the field of water is facilitated through the UN AdministrativeCommittee on Co-ordination Sub-Committee on Water Resources, constituing an essential focusfor collaboration in UN water orientated activities. The IGO's listed in Table 1.1 and the UnitedNations Regional Economic Commissions listed in Table 1.2 are members of this IntersecretariatGroup.
Table 1.7: Institutionalized co-operation in international river and lake basins
There are many international agreements and treaties which concern the joint use ofinternational rivers and boundary waters, and many of these agreements and treaties have resultedin institutionalized co-operation among the countries concerned. This table lists the maininternational institutions of this kind, by WMO Region. The headquarters of each institution andthe address of its secretariat, where available or applicable, are also given.
The information for this table is derived from references 5 to ro.
Due to the recent changes in a number of countries, particularly in Europe, updatedinformation on institutional co-operation within international basins shared by some of thesecountries was not yet available at the time of printing this second edition.
References
(1) ECOSOC Resolution 288 (X) and Resolution 1296 (XLIV);
(2) Yearbook of International Organizations - 1985/1986; 22nd edition, Saur, Munich.
(3) UN, 1982: The United Nations Organizations and Water, 83-00237, New York.
(4) UN, 1992: The United Nations Organizations and Water - Briefing note on thescope and nature of the activities of the organizations of the United Nations system(in preparation).
(5) UN Treaty Series, Legislative Texts and Treaty - Provisions Concerning theUtilization of International Rivers for Purposes other than Navigation(ST/lEG/SERB/12; Sales No. 63.VA).
(6) UN Management of International Water Resources: Institutional and Legal Aspects(ST/ESA/5; Sales No. E.75.IIA.2), 1975.
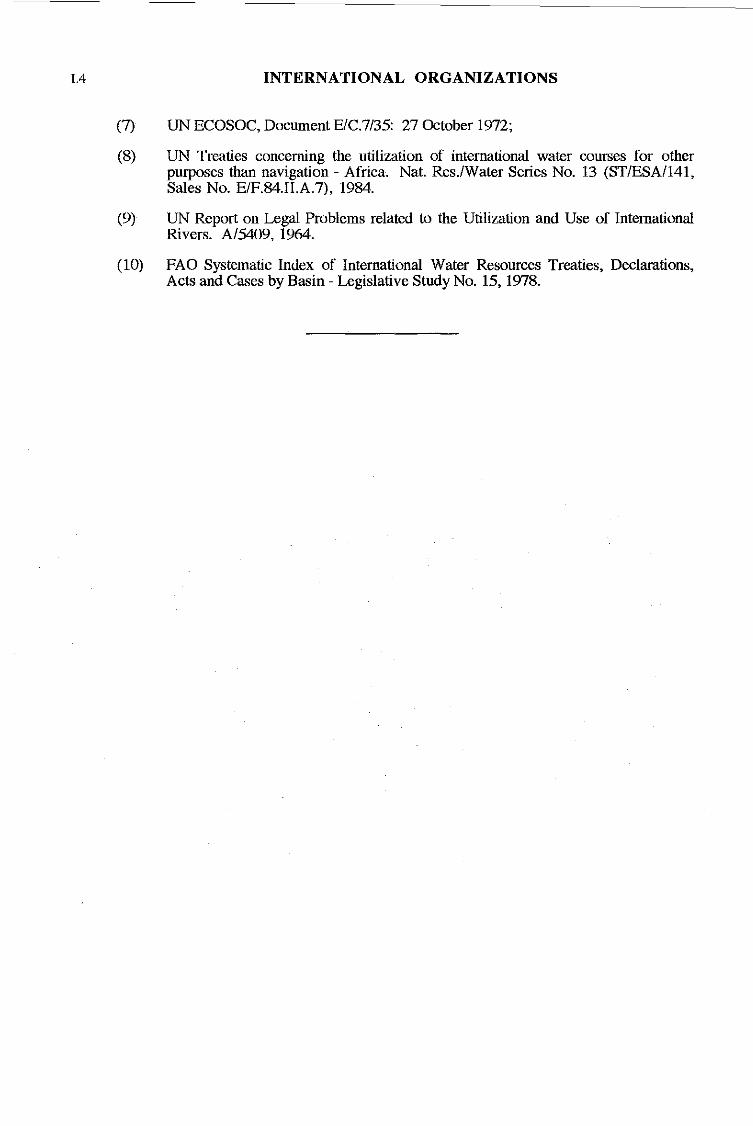
1.4 INTERNATIONAL ORGANIZATIONS
(7) UN ECOSOC, Document E1C.7/3S: 27 October 1972;
(8) UN Treaties concerning the utilization of international water courses for otherpurposes than navigation - Africa. Nat. Res.lWater Series No. 13 (ST/ESA/141,Sales No. E/F.84.II.A.7), 1984.
(9) UN Report on Legal Problems related to the Utilization and Use of InternationalRivers. A/5409, 1964.
(10) FAO Systematic Index of International Water Resources Treaties, Declarations,Acts and Cases by Basin - Legislative Study No. 15, 1978.
10 ORGANISATIONS INTERNATIONALESS'OCCUPANT D'HYDROLOGIE ET DE RESSOURCES EN EAU
TABLEAUX 1.1 A 1.7
Notes explicatives
Tableaux 1.1 et 1.2 : Organisations internationales gouvernementales s'occupant d'hydrologie etde ressources en eau
II s'agit d'organisations, mondiales ou regionales, etablies par Ie biais d'accords conclusentre au moins deux Etats. La coordination des activites Menees dans Ie domaine de I'hydrologie etdes ressources en eau par les organisations faisant partie du systeme des Nations Unies est assureepar Ie Sous-Comite des ressources en eau du Comite administratif de coordination (CAC). Lesorganisations internationales gouvernementales enumerees au Tableau 1.1 et les commissionseconomiques regionales des Nations Unies enumerees au Tableau 1.2 sont membres du SousComite. L'engagement de ces organisations dans Ie domaine de I'hydrologie et de la mise en valeurdes ressources en eau est decrit dans ses grandes lignes aux Tableaux 1.3 et 1.4, comme indique ddessous (voir references 1 et 2).
Tableau 1.3: Participation d'institutions du systeme des Nations Unies a la mise en valeur desressources en eau : principaux domaines d'interet et d'intervention
La co/onne 1) indique en quoi consiste la participation des institutions dans chacun desdomaines cites et specifie les liens existant entre les institutions dans ces domaines.
La co/onne 2) enumere les institutions dont la principale occupation s'inscrit dans Ie cadrede I'un des domaines d'activite enumeres dansla colonne 1).
La colonne 3) indique les institutions qui participent dans la pratique aun domaine donne,par exemple dans Ie cadre de projets globaux de mise en valeur et/ou de cooperationavec d'autres institutions.
Tableau 1.4 : Participation d'institutions du systeme des Nations Unies aux activites Meneesdans Ie domaine des ressources en eau
Ce tableau fournit une description plus detail lee des activites Menees par les institutions.A I'interieur de chaque colonne sont indiquees les institutions qui.participent ades activites de miseen valeur et de gestion pour des secteurs specifiques des ressources en eau. Les fonctions de miseen valeur et de gestion ont ete c1assees comme suit:
1. Hydrologie (eaux de surface)2: Hydrologie (eaux souterraines)3. Surveillance de la qualite des eaux de surface4. Surveillance de la qualite des eaux souterraines5. Renseignements sur I'utilisation de I'eau6. Mise en valeur des ressources en eau de surface7. Mise en valeur des ressources en eau souterraineB. Reutilisation des eaux usees9. Gestion globale des ressources en eau10. Gestion de I'utilisation de I'eau
1-2 ORGANISATIONS INTERNATIONALES
11. Gestion de I'utilisation des eaux usees12. Renforcement des institutions13. Legislation14. Enseignement et formation professionnelle15. Mise en valeur des ressources humaines
Les secteurs specifiques des ressources en eau sont les suivants :
A. Utilisation de I'eau pour I'agricultureB. Alimentation en eau potableC. Utilisation de I'eau pour I'industrieD. Hydro-electriciteE. NavigationF. Defense contre les inondationsG. Gestion de la secheresseH. Utilisation de I'eau ades fins multiples
On trouvera dans les references [3, 411es renseignements supplementaires sur la nature dela participation de chaque institution, ainsi qu'une description des activites menees par lesinstitutions du systeme des Nations Unies dans Ie domaine de I'eau (leur portee et leurnature), i1lustree d'exemples de projets types qu'elles ont executes.
Tableaux 1.5: Organisations internationales non gouvernementales (ONG) s'occupantd'hydrologie et de ressources en eau
II s'agit d'organisations internationales qui n'ont pas ete etablies par Ie biais d'un accordintergouvernemental. En font partie les organisations qui acceptent des membres designes par desadministrations gouvernementales, sous reserve que I'adhesion de ces membres ne soit pas un freina la Iibre expression des opinions de l'Organisation [1, 21. Les ONG s'occupant d'hydrologie et deressources en eau sont enumerees, par ordre alphabetique, au Tableau 1.5. Elles appartiennent aI'une ou I'autre des categories suivantes :
a) federations d'organisations internationalesb) organisations dont I'adhesion est universelle;c) organisations dont I'adhesion est intercontinentale;d) organisations dont I'adhesion est regionale;e) organes semi-autonomes; etf) organisations de type specifique.
Le Tableau 1.5 est presente comme suit:
Co/onne 1) - Nom de I'organisation :Ie nom de I'organisation est indique normalementen anglais.
Colonne 2) - Acronyme
Co/onne 3) - Adresse de I'organisation: I'adresse indiquee est celie du secretariatinternational ou du secretariat principal, on encore celie du principal centre de liaison, pour1992. Certains secretariats assurent leurs fonctions a tour de role ou changent d'adresseselon les changements intervenus dans la composition des organes directeurs.
ORGANISATIONS INTERNATIONALES 1-3
Tableau 1.6: Dispositions prises par les organisations en vue de leur collaboration dans la miseen valeur des ressources en eau, pour I'ensemble des systemes (mondiaux ouregionaux) et des secteurs (collaboration bilaterale ou multilaterale)
Afin d'ameliorer leurs roles respectifs et de favoriser la complementarite des effortsqu'elles deploient pour aider les pays en developpement, les institutions du systeme des NationsUnies prennent des dispositions officielles de cooperation et de collaboration dans de nombreuxprogrammes, y compris dans les programmes relatifs a I'eau. Comme Ie montrent les resumesfigurant au Tableau 1.6, certaines de ces dispositions ont une portee tres etendue, dans la mesureou elles couvrent I'ensemble de la question de la mise en valeur des ressources en eau et englobentune coordination de toute Ie systeme, a I'echelle aussi bien mondiale que regionale. D'autres, plussectorielles, portent sur une collaboration bilaterale ou multilaterale s'effectuant dans Ie cadre d'unaspect specifique de la mise en valeur des ressources en eau. On trouvera aux references [3, 4] plusde details sur ces dispositions de cooperation entre institutions.
La cooperation dans Ie domaine de I'eau est facilitee par Ie Sous-Comite des ressources eneau, du Comite administratif de coordination des Nations Unies, qui constitue un axe essentiel decollaboration des activites menees par les Nations Unies dans ce domaine. Les organisationsintergouvernementales enumerees au Tableau 1.1 et les commissions economiques regionales desNations Unies enumerees au Tableau 1.2, sont membres de ce Sous-Comite.
Tableau 1.7: Cooperation institutionnalisee dans les bassins f1uviaux et lacustres internationaux
II existe beaucoup d'accords et de traites internationaux concernant I'utilisation communede fleuves internationaux et d'eaux limitrophes. Bon nombre d'entre eux ont donne lieu a unecooperation institutionnalisee entre les pays concernes. Ce tableau enumere les principalesinstitutions internationales de ce type, c1assees par Region de I'OMM. Le Siege de chaque institutionet I'adresse de son secretariat sont egalement indiques, Ie cas echeant.
Les renseignements fournis dans ce tableau sont tires des references 5 a10.
En raison des changements recents survenus dans un certain nombre de pays, enparticulier en Europe, la version actualisee des renseignements concernant la cooperationinstitutionnelle a I'interieur des bassins internationaux que certains de ces pays se partagent n'etaitpas encore disponible au moment ou cette deuxieme edition etait imprimee.
References
1) ECOSOC Resolution 288 (X) and Resolution 1296 (XLIV)
2) Yearbook of International Organizations - 1985/1986; 22nd edition, Saur, Munich
3) UN, 1982: The United Nations Organizations and Water, 83-00237, New York
4) UN, 1992: The United Nations Organizations and Water - Briefing note on the scopeand nature of the activities of the organizations of the United Nations system (inpreparation)
1-4 ORGANISATIONS INTERNATIONALES
5) UN Treaty Series, Legislative Texts and Treaty - Provisions Concerning the Utilizationof International Rivers fo Purposes other than Navigation(ST/LEG/SER.B/12; Sales N° 63.v.4).
6) UN Management of International Water Ressources: Institutional and Legal Aspects(ST-ESA/5 ; Sales N° E.75.11.A.2), 1975
7) UN ECOSOC, Document E/C.7/35: 27 October 1972
B) UN Treaties concerning the utilization of international water courses for otherpurposes than navigation - Africa. Nat. Res./Water Series N° 13 (ST/ESA/141, SalesN° E/F.B4.11.A.7), 1984
9) UN Report on Legal Problems related to the Utilization and Use of InternationalRivers. A/5409, 1964
10) FAO Systematic Index of International Water Resources Treaties, Declarations, Actsand Cases by Basin - Legislative Study No. 15, 1978.
I . ME)J(llYIIAPOllllhlE OPfAHIf3AUIfIf, 3AIlIfMAIOrn:IfECH flfllPOJlOflfEA If BOllllhlMIfPECYPCAMIf
TAJ)JIIfUhI 1.1 . 1.7
OOJlCHHTeJILHLle JanHCKH
TaWtHI\LI 1.1 H 1.2: MelKJl.YHapOJl.HLle npaOHTeJILCTOeHHLle opraHHJallHH (MOO), aaHHMaHlI/lHeCJI
rHJI.poJIorHeii H BOJl.HLlMH peCypcaMH
3T0 Opraull3al.lllll, yqpeJK.lleHHhle Ha OCHOOO COrJlarneHllii. CTOpomlMlI ICOTOPhlX JlBJlJlIOTCH IlHe WIll 60Jlee
CTpaHhI. 3TII opraHllaaUHH MoryT 6h1Tb ICaIC rJl06aJJbHhlMH. TalC II perHOHaJJbHhlMH. .lleJlTeJJbHOCTb B 06JlaCTH
m,llpoJlOrHH H BO,llHhlX pecyPCOB opraHHaaUHii. BXO,ll,JllllHX H CIICTeMY OpraHH3aUHII 06"e,llHHeHHhlx HaUHii,
KOOp,llHHHpyeTCH nO,llICOMIITeTOM no BO,IIHhlM pecypcaM A,IIMIIHIICTpaTHHHoro ICOMIITeTa OOH no ICOOp,llIlHaUHII
(AKK). MIlO. nepeqllCJleHHhle B Ta6.'Hlle 1.1 II pemOHaJJbHhle 3ICOHOMHqeCIClle ICOMIICCIIH OpraHHaaUlI1I
06"eJI.IIHeHHblX HaUllii, nepeqllCJleHHhle B Ta6JIHlle 1.2, RBJlJlIOTCH qneHaMII 3TOrO nO,llKOMIITeTa. YqaCTlle 3TIIX
opraHII3aUllii B m,llpoJlomqeclCoii ,IIeJlTeJlbHOCTII II OCBOeRlI1I BO,IIHhlX pecypcoB onllcaHo B 06mllx qepmx B
Ta6JIHI\ax 1.3 II 1.4 B HaJlO:>KeHHOM HlI:>Ke nOpR)(ICe (CM. CChlJlICII I II 2).
Ta6JIHI\a 1.3: Y..aCTHe oprallHaal\Hii CHCTeMLI OprallHJaI\HH 06l.ei\HlleHHLlx lIallHii 0 ocooeHHH
OOJl.HLlX pecypcOH: yKaJaTeJIL OCHOBIlLlX H "PHKJIaAHLlX Cl)ep, npeJl.CTaBJIJllOll\HX
HHTepec
KOJIOI/Ka (J) MeT npe,llCTaBJleHlle 0 xapaICTepe II OOllleii oaallMOCBHall )(eJlTeJlbHOCTII opraHIlJaUllii H
KaJK,lIoii 113 3TIIX O/leP.
KOJIOI/Ka (2) CO,llep:>KIIT cnllCOIC opraHlI3aUllii. IIrpalOlIlHX OCHOBHylO POJlb B ICoHICpeTHoii ojlepe
,IIeJITMbHOCTII. onllcaHHoii B KOJlOllJaJ (J).
KOJlOI/Ka (3) MeT npe)(CTaBJleHlle 0 Tex opraHIlJaUIIJlX, ICoTophle 3aHHThI B ICOHICpeTHoii cl/lepe B
npHICJla)(HOM nJlaHe. B qaCTHOCTII, B ICOHTeICCTe OCeOOl.eMJllOlIlerO nJJaHllpooaHIIJI npouecca paaBIITIIJI
WWlH COTPYiUlllqeTCBa C )(pyrHMH OpraHII3al.lIlJlMH.
lleJlTeJILHOCTL oprallHJallHii CHCTeMLI OpraHHJallHH 06l.eJl.HHeHHLlx Hal\Hii 0
06JIaCTH OCODeHHJI OOJl.HLlX pecypcoo
.llaHHaH Ta6Jlllua CO,lleplKlIT 60Jlee TlO,llp06Hoe onllcaHHe ,IIeJlTeJlbHOCTII opraHH3aUllii. B ICaJK.lloii
OT,IIeJlbHOii rpa</Je yICaaaHo, ICaIClle opraHH3aUI1II yqaCTHYIOT H ,IIeJlTeJlbHOCTII no pa3BHTllIO II ynpaBJleHHIO
KOHICpeTHblMH ceICTopaMH 1IO)(HhlX peCYJlCOB. 3a)(aqH no OCHoeHHIO H ynpaBJleHll10 ICBaCCII</JIIUIlPOBaHhI CJlei\YlOlIllIM
06paJOM:
1. rllJlllOJlOrHJI nooepxHOCTHhlX BO,II
2. rH.ilpoJlorllJl nO,llJeMHhlX 110,11
3. MOHHTOplIHr ICaqecrBa nooopXHOCTHhlX BO,II
4. MOHIITopHHr ICaqecroa nO,llJeMHhlX 110,11
5. I1H</JOpMaUIIJl TlO BO)(OTlOJlbJOBaHIlIO
6. OcooeHlle nooepxHOCTHhlX BO,II
7. OcHoeHlle nO,llJeMHhlX BO,II
8. IlOBTOpHoe HcnOJlbJOBaHlle CTOqHhlX 110,11
9. KOMnJleICcHoe ynpaHJleHlle BO)(HhlMII pecypcaMII
10. YnpaBJleHlle HO,IIOnOJlbJOBaHlleM
1.2
]1.]2.]3.] 4.]5.
ME:)K.L\YIIAPO.L\IIh1E oprA11113Alll111
YnpaMeHHe croqHblMH IIO,lJ)lMH
YKpenlleHHe OpraHH3aUHOHHOH CfpyKTYPbl
3aKOHO,lJ)lTeJ1bCTlIO
06paJOBaHHe H nO!U'OTOBKa Ka,llJ)()B
Pll3BHTHe JIIOI\CKHX pecypm8
K 'lHCUy KOHKpeTHblX ceKTOpoB 1I01\8b1X pecypmB OTHOClITCH cue)lylOlllHe:
A. I1cnollhwBaHHe CeJ1hCKOXOJHHCfueHHblX 1101\
B. CHa6"ceHHe nHThellOH IIOI\OH
C. I1cnoJlhwBaHHe IlpoMblllllleHHbIX 1101\
D. rHi\po3HeprHH
E. CYI\OXOI\CfOO
F. PeryJlHpoBaHHe lIaOOi\KOB
G. Ynpa811eHHe 3aCYXOH
H. Mllorouelleuoe "cnOJlbWBaHHe OOllHblX pecypcoB
B CCblllKax (3. 4.] COl\epJKHTCH 1\01l0llHHTeJlbHaJl HH<j>opMaU"H 0 xapaKTepe yqacr"H KaJKI\OH
OpraH"JaUHH, a TaKJKe ollHcaHHe C<!JePbl OXBaTa " xapaKTepa BOI\OXOJHHCTBeHHOH l\eHTellhHOCTH
OpraHHJallHH CHCTeMbI OpraHHJaUHH 06WI\HHeHIlblx lIaUHH llapH)ly C npHMepaMH THnOBblX npoeKTOB,
KOTOpble 6b1JlH OCYlllecrHlleHbI HMH.
Ta6mUla 1.5: Me)l(j\yHapo,'Hhie HellpaO"TeJILCTOeHHhle OpraHUJallUU (MilO), JaUUMalOlI\UeCU
rHi\po"orueii U OOj\HhlMU pecypcaMU
K qUCllY 3THX OpraHHJaUHH OTHOCHTCH Te, KOTopble 6b1JIH COJl\aHbI He Ha OCHOBe
MexnpaBHTeJILCfOOHHblX corJ1aWemIH. OHM BKJ1lOlJalOT opraHH3aUH", IIpHHHMalOllU1e B COOK CQCTaH IfJleHOH,
HaJHaqaeMUX rocYl\apcTBeHHblM" BllaCTHMH npH yCUOBHH, qTO 3TO qlleHCTBO He IIpellHTcTByeT CBo601\1l0MY
BUpaJKeHHIO MHeHHH OprallHJaUHH [1, 21. B Ta6JlHue 1.5 lIepeqHCJleHbI B aJllllaBHTHoM 1I0pHI\Ke MilO,
JaHHMaIOlll"eCH rHJqJOllorHeH " OOI\HblMH pecypcaMH. I1x MOJKHO OTHecrH K QlIHOH HJ cuellYlOlllHX KaTeropHH:
a) <!Jel\epauHH MelK,l\yHapoilHblX OpraHH3aUHH:
b) BrnMHpHble OpraHH3aUHH:
c) MeJKKOHTI1HeHTallbHble OpraHHJallHH;
d) pernOHaJIbHble OpraHH3aUHH;
e) 1I0llyasTOHoMHble OpraHH3aUH";
o cneUHaJIhHble OpraHHJallHH.
KOllOHKa (Jj - 1/G360J1ue O[JW1lU3al{U~ Hll3BaHHe OPraHHJallHH 06b1qHO ,lJ)leTCH Ha aHrllHHCKOM HJblKe.
KOJIOlllca (2j • COICJXlUJ,e1Iue
KOllOl/lea (3j • O;IIpeG 0p2aI/U3al{UU: YKll3b1BaeTCH aApec MelKilYHapOI\HOrO CeKpeTapHaTa, 11H60
r11aBHoro CeKpeTapHaTa, JIH60 OCHOBHoro lIyHKTa CBHJ" 110 COCTOHHHIO Ha ] 992 r. HeKoTOpble
ceKpempHaTbI lIepeeJJKalOT 11,,60 MeHHIOT COOH aAPec B CBHJH C "JMeHeHHHMH B cocraBe PYKOllOilHlllHX
oprallOB.
ME)I(.L\YHAPO.LlHblE oprAHH3AUHH 1.3
Ta6J1Hl\a 1.6: MepLl no Me>KOpraHH:laIIHOHHoMy COTpYJJ.HH'IeCTOy Ha rJI06aJJLHOM, perHOHaJJLHOM H
ceKTopaJJLHOM ypoOHHX
OpraHII3aullll CIICTeMhI OpraHII3aUIIII 061>eJJ.IIHeHHhlx HaUllii IIMelOT 04'IIUlIlIJlLHhle cornarneHIIH nO
COTpYI\HII'1OCTBY B paMIGlX MHorllX nporpaMM, BlOIlO'Ian BOl\Hble peCYPCbl, B uenHX COl\eiiCTBIIH OCYUleCTBneHll1O IIXCOOTueTCTBYIOUleii ponll II aKTIIBII3aUIIII IIX 1\0nOnHIITenbHblX YCllnllii B I\ene OKaJaHIIH nOMOUlII PaJBIlBaIOUlIIMCH
CTpauaM. .L\aoHble, COl\epJKaUllleCH B Ta6nllue 1.6, CBllJJ.erenbCTBYIOT 0 TOM, 'ITO HeKOTophle 113 ::ITIIX cornarneHlliiHWlHIOTCH uceo6l>eMnIOUlIIMII no cl/lepe np"MeHeHIIH II OXBaTblBaIOT BCIO 06naCTb OCBOeHIIH BOl\HblX pecYPCOB, a
TaKJKe BKnIO'la1OT 3JIeMeHTJ,l 06UleCIICTeMHoii KOOPl\IIHaQlllI ua rn06l1JlbHoM II perllOHlIJlbHOM ypoBHHX. .L\pyrlle JKe
HOCHT CeKTOplIJlbHblii xapaKTep II OXBaTblBaIOT Cl/lePY MyCTopoHHero IInll MHorOCTopoHHero COTpYI\HII'IeCTBa BpaMKax KOHKpeTHoro acneKTa OCBoeHIIH HOI\HblX pecypcoB. .LlononHIITenbHhle CBel\eHIIH OTHOCIITenbHO 3TIIX
cornarneHllii no MeJKOpraullJaUIlOHHOMY COTPYI\HII'IecrBY COl\epJKaTCH B [3, 41.
06UleCIICTeMHoe COTpyI\HII'IecTBO B 06naCTII BOI\HhlX pecypcoB HlIJlaJKllBaeTCH 'Iepw nOI\KOMIITeT nOBOI\HblM pecypcaM AI\MIIHIICTpaTIIBHoro KOMIITeTa OOH no KOOPl\IIHaUIIII, HBnHIOUllliiCH BaJKHhlM ueHTpOM
COTpYI\HII'IecrBa no OCYUlecrwTeHll1O ,l\eHTenbHOCTII OOH B 06JTaCTII BO,l\HblX pecypcOB. MIlO, nepe'lllcneHHble BTa6nllue I.I, II perllOHlIJlbHble 3KOHOMII'IOCKlle KOMIICCllII OOH, lIepe'lllcneHHble B Ta6nllue 1.2, HBJlHIOTCH '!JleHaMlI
3TOii MeJKceKpeTapllaTCKoii rpynllbl.
Ta6JIHI\a 1.7: COTpYJJ.HH'IeCTHO, y'lpe>KJJ.eHHoe H 06J1aCTH MelKJJ.YHapoJJ.HLlX pe'lHLlX H 03epHLlX
6acceilHoo
CYUlecTByeT MIIOJKeCTRO MeJKl\y"ap0,l\HblX corJTarneHllil II 1\0ro80POB, KacalOUlllxCH CORMecTHoro
HCIIOnb30BaHIIH MelKl\YHapollHblX peK H nOrpaHH'IHblX BOI\, npll'leM MHOrlle 113 3TIIX cornarneHllii H 1\0ro80poB
cnOOJ6CTBOBaJIH jlaJRIITIlIOCOTPYJlHII'IecrBa, y'IpelK,l\eHHoro MelKl\Y JaIlHTepecoBaHHblMII CTpaHaMII. B amii Ta6nlluenepe'lllcneHbl OCHOBHhle MelKl\YHapol\Hble opraullJaUlI1I TaKOIU po/la no perllOHaM BMO. KpoMe TOro, IIpll HlIJllI'lllll
unll B COOTBeTCTBYIOUlIIX c/lY'lanx, YKaJblBaeTCll rnTa6-KBapTllpa KalKAoii opraHllJaWIII II 3,l\pec ee ceKpeTapllaTIl.
HHI!IOPMaUIIH MH ::IToii Ta6nllUbl nO)lJ'OTOuneBa Ha OCHOue CChlnOK 5-1 O.
B CBH311 C nocneJJ.HIIMII 113MeHeHIIHMII B pH,l\e CTpaB, oc06eHHo B EBpone, 06HouneHHaH IIH4><>pMaUIIH no
COTpYI\HII'IeCTBY, Y'IpelK,l\eHHOMY B 06naCTII MelK,l\YHapol\HblX 6acceiiHoB, MelKl\Y HeKOTOpblMII 113 3T11X CTpaH, He
nOCTynuna I( MOMeHTy ny6nlllGlUIIII I(aHHOro HToporo 1I3I(aH1IH.
CCWIKH
(1) ECOSOC Resolution 288 (X) and Resolution 1296 (XLIV).
(2) Yearbook ofInternational Organizations - 1985/1986; 22nd edition, Saur, Munich.
(3) UN, 1982: The United Nations Organizations and Water, 83-00237, New York.
(4) UN, 1992: The United Nations Organizations and Water - Briefing note on the scope and natureof the activities of the organizations of the United Nations system (in preparation).
(5) UN Treaty Series, Legislative Texts and Treaty - Provisions Concerning the Utilization ofInternational Rivers for Purposes other than Navigation (ST/LEG/SER.BI12; Sales No.63.V.4).
(6) UN Management of International Water Resources: Institutional and Legal Aspects (STIESAl5;Sales No. E.75.II.A.2), 1975.
(7) UN ECOSOC, Document E/C.7/35: 27 October 1972.
1.4
(8)
(9)
(10)
ME)f(){YIIAPO){lIbIE oprAII113Alll111
UN Treaties concerning the utilization of international water courses for other purposes thannavigation - Africa. Nat. Res./Water Series No 13 (ST/ESA/141, Sales No. E/F.84.II.A.7),1984.
UN Report on Legal Problems related to the Utilization and Use of International Rivers. A/5409,1964.
FAO Systematic Index of International Water Resources Treaties, Declarations, Acts and Casesby Basin - Legislative Study No. 15,1978.
1- ORGANIZACIONES INTERNACIONALES GUBERNAMENTALES QUE SEOCUPAN DE HIDROLOGfA Y DE RECURSOS HfDRICOS
CUADROS 1.1 a 1.7
Notas explicativas
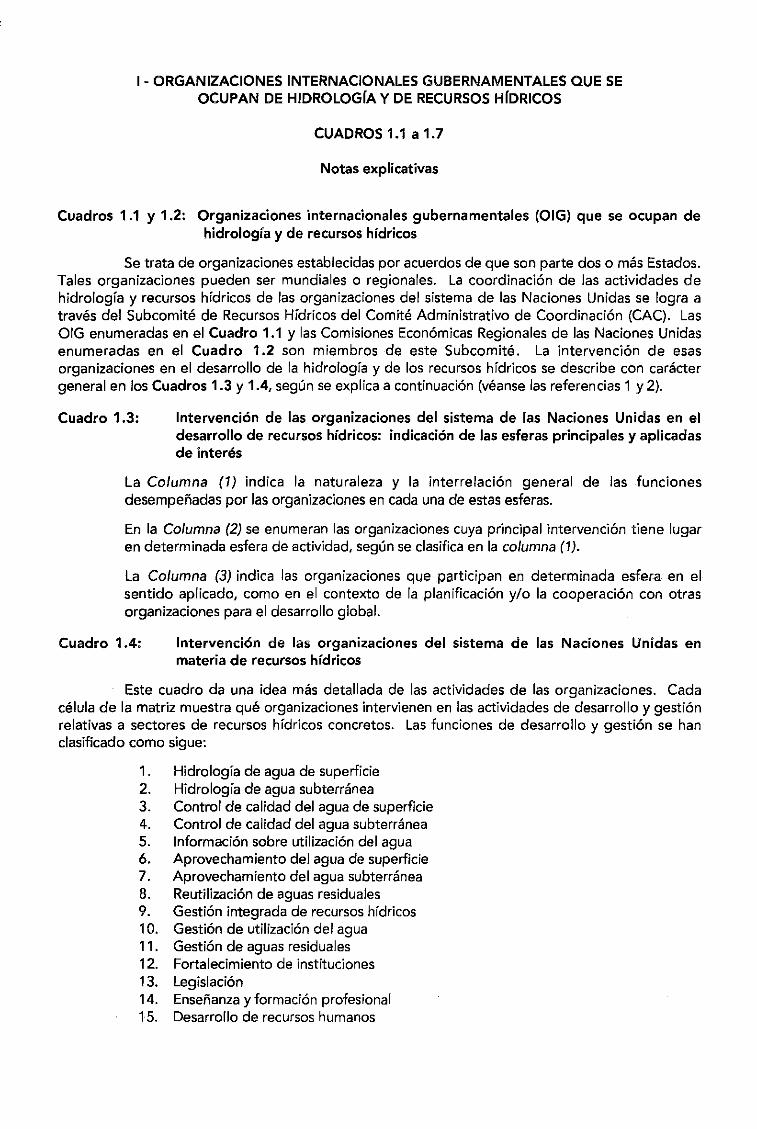
Cuadros 1.1 Y 1.2: Organizaciones internacionales gubernamentales (OIG) que se ocupan dehidrologia y de recursos hidricos
Se trata de organizaciones establecidas por acuerdos de que son parte dos 0 mas Estados.Tales organizaciones pueden ser mundiales 0 regionales. La coordinacion de las actividades dehidrologia y recursos hidricos de las organizaciones del sistema de las Naciones Unidas se logra atraves del Subcomite de Recursos Hfdricos del Comite Administrativo de Coordinacion (CAC). LasOIG enumeradas en el Cuadro 1.1 y las Comisiones Economicas Regionales de las Naciones Unidasenumeradas en el Cuadro 1.2 son miembros de este Subcomite. La intervencion de esasorganizaciones en el desarrollo de la hidrologfa y de los recursos hfdricos se describe con caraetergeneral en los Cuadros 1.3 y 1.4, segun se explica a continuacion (veanse las referencias 1 y 2).
Cuadro 1.3: Intervencion de las organizaciones del sistema de las Naciones Unidas en eldesarrollo de recursos hfdricos: indicacion de las esferas principales yaplicadasde interes
La Columna (1) indica la naturaleza y la interrelacion general de las funcionesdesempenadas por las organizaciones en cada una de estas esferas.
En la Columna (2) se enumeran las organizaciones cuya principal intervencion tiene lugaren determinada esfera de aetividad, segun se c1asifica en la columna (1).
La Columna (3) indica las organizaciones que participan en determinada esferaen elsentido aplicado, como en el contexto de la planificacion y/o la cooperacion con otrasorganizaciones para el desarrollo global.
Cuadro 1.4: Intervenci6n de las organizaciones del sistema de las Naciones Unidas enmateria de recursos hfdricos
Este cuadro da una idea mas detallada de las actividades de las organizaciones. Cadacelula de la matriz muestra que organizaciones intervienen en las aetividades de desarrollo y gestionrelativas a sectores de recursos hfdricos concretos. Las funciones de desarrollo y gestion se hanc1asificado como sigue:
1. Hidrologfa de agua de superficie2. Hidrologfa de agua subtemlnea3. Control de calidad del agua de superficie4. Control de calidad del agua subtemlnea5. Informacion sobre utilizacion del agua6. Aprovechamiento del agua de superficie7. Aprovechamiento del agua subtemlneaB. Reutilizacion de aguas residuales9. Gestion integrada de recursos hfdricos10. Gestion de utilizacion del agua11. Gestion de aguas residuales12. Fortalecimiento de instituciones13. Legislacion14. Ensenanza y formacion profesional15. Desarrollo de recursos humanos
1.2 ORGANIZACIONES INTERNACIONALES
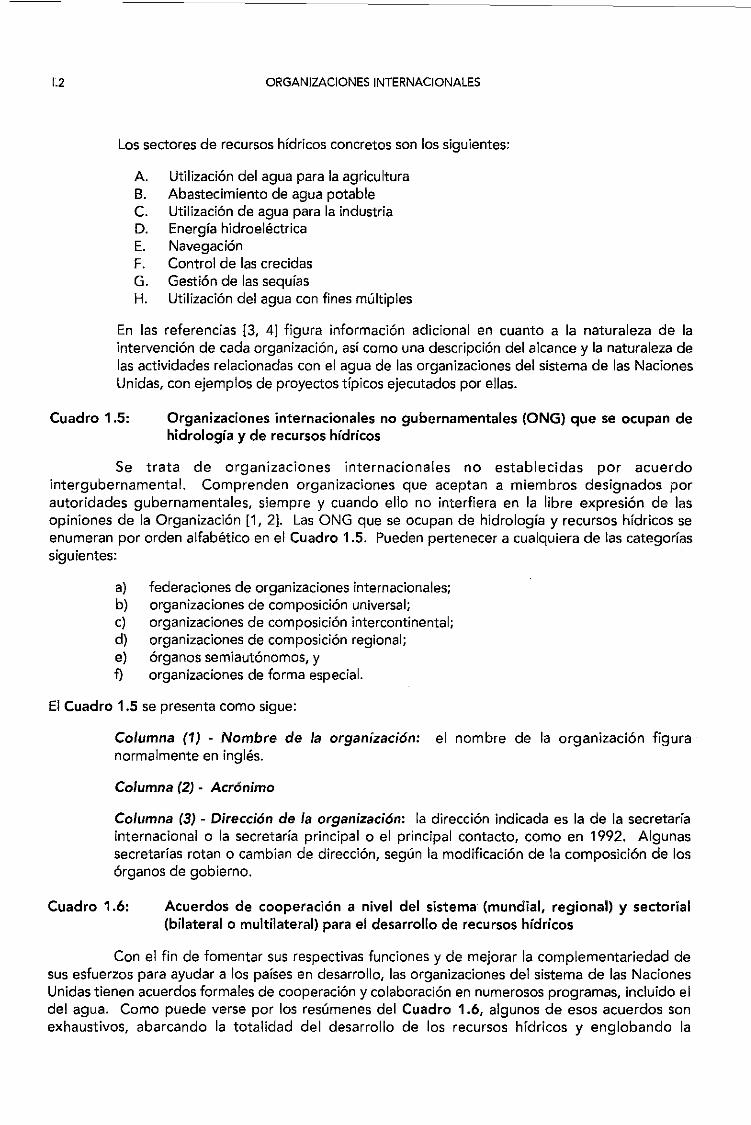
Los sectares de recursos hidricos concretos son los siguientes:
A. Utilizacion del agua para la agriculturaB. Abastecimiento de agua potableC. Utilizacion de agua para la industriaD. Energia hidroelectricaE. Navegaci6nF. Control de las crecidasG. Gestion de las sequiasH. Utilizacion del agua con fines multiples
En las referencias [3, 4J figura informacion adicional en cuanto a la naturaleza de laintervencion de cada organizacion, asi como una descripcion del alcance y la naturaleza delas actividades relacionadas con el agua de las organizaciones del sistema de las NacionesUnidas, con ejemplos de proyectos tipicos ejecutados por elias.
Cuadro 1.5: Organizaciones internacionales no gubernamentales (ONG) que se ocupan dehidrologfa y de recursos hfdricos
Se trata de organizaciones internacionales no establecidas por acuerdointergubernamental. Comprenden organizaciones que aceptan a miembros designados porautoridades gubernamentales, siempre y cuando ello no interfiera en la Iibre expresi6n de lasopiniones de la Organizacion [1, 2]. Las ONG que se ocupan de hidrologia y recursos hfdricos seenumeran par orden alfabetico en el Cuadro 1.5. Pueden pertenecer a cualquiera de las categoriassiguientes:
a) federaciones de organizaciones internacionales;b) organizaciones de composicion universal;c) organizaciones de composicion intercontinental;d) organizaciones de composicion regional;e) organos semiautonomos, yf) organizaciones de forma especial.
EI Cuadro 1.5 se presenta como sigue:
Columna (1) - Nombre de la organizaci6n: el nombre de la organizacion figuranormalmente en ingles.
Columna (2) - Acr6nimo
Columna (3) - Direcci6n de la organizaci6n: la direccion indicada es la de la secretariainternacional 0 la secretaria principal 0 el principal contacto, como en 1992. Algunassecretarias rotan 0 cambian de direccion, segun la modificacion de la composicion de losorganos de gobierno.
Cuadro 1.6: Acuerdos de cooperaclon a nivel del sistema (mundial, regional) y sectorial(bilateral 0 multilateral) para el desarrollo de recursos hfdricos
Con el fin de fomentar sus respectivas funciones y de mejorar la complementariedad desus esfuerzos para ayudar a los paises en desarrollo, las organizaciones del sistema de las NacionesUnidas tienen acuerdos formales de cooperacion y colaboracion en numerosos programas, incluido eldel agua. Como puede verse por los resumenes del Cuadro 1.6, algunos de esos acuerdos sonexhaustivos, abarcando la totalidad del desarrollo de los recursos hidricos y englobando la
ORGANIZACIONES INTERNACIONALES 1.3
coordinaci6n en todo el sistema a nivel mundial y regional. Otros tienen cankter sectorial y abarcanla coordinaci6n bilateral 0 multilateral en el marco de determinado aspecto del desarrollo de losrecursos hfdricos. En [3, 4] figuran mas detalles sobre tales acuerdos de cooperaci6n entreorganizaciones.
La cooperaci6n a nivel del sistema por 10 que se refiere al agua se facilita a traves delSubcomite de Recursos Hrdricos del Comite Administrativo de Coordinaci6n de las Naciones Unidas,que constituye una parte esencial de la colaboraci6n en las actividades relacionadas con el agua enlas Naciones Unidas. Las OIG enumeradas en el Cuadra 1.1 y ias Comisiones Econ6micas Regionalesde las Naciones Unidas enumeradas en el Cuadra 1.2 son miembros de este Grupo Intersecretarras.
Cuadra 1.7: Cooperacion institucianalizada en cuencas fluviales y lacustres internacionales
Hay numerosos acuerdos y tratados internacionales sobre la utilizaci6n conjunta de lasaguas fluviales Iimftrofes internacionales, y muchos de estes acuerdos y tratados han dado lugar auna cooperaci6n institucionalizada entre los parses interesados. En este cuadro se enumeran lasprincipales instituciones internacionales de este tipo, por Regiones de la OMM. Tambien se indica lasede de cada instituci6n y la direcci6n de su secretarra, cuando se dispone de ella 0 es aplicable.
La informaci6n para confeccionar este cuadro se ha obtenido de las referencias 5 a 10.
Debido a recientes cambios en varios parses, sobre todo en Europa, en el momento deimprirnirse esta segunda edici6n no se disponia aun de informaci6n actualizada sobre la cooperaci6ninstitucional en las cuencas internacionales compartidas por algunos de esos pafses.
Referencias
1) Resoluci6n 288 (X) YResoluci6n 1296 (XLIV) del ECOSOC.
2) Anuario de Organizaciones Internacionales - 1985/1986; 228 edici6n, Saur, Munich.
3) UN, 1982: The United Nations Organizations and Water, 83-00237, Nueva York.
4) UN, 1992: The United Nations Organizations and Water - Briefing note on the scopeand nature of the activities of the organizations of the United Nations system (enpreparaci6n).
5) UN Treaty Series, Legislative Texts and Treaty - Provisions Concerning the Utilizationof International Rivers for Purposes other than Navigation (ST/LEG/SER.B/12;Sales N° 63.V.4).
6) UN Management of Internacional Water Resources: Institutional and Legal Aspects(ST/ESAl5; Sales N° E.75.11,A,2), 1975.
7) ECOSOC NU, Documento E/C.7/35: 27 de octubre de 1972.
8) UN Treaties concerning the utilization of international water courses for otherpurposes than navigation - Africa. Nat. Res.lWater Series N° 13 (ST/ESA&141,Sales N° E/F.84.1I,A,7), 1984.
9) UN Report on Legal Problems related to the Utilization and Use of InternationalRivers. Al5409, 1964.
10) FAO Systematic Index of International Water Resources Treaties, Declarations, Actsand Cases by Basin - Legislative Study N" 15, 1978.

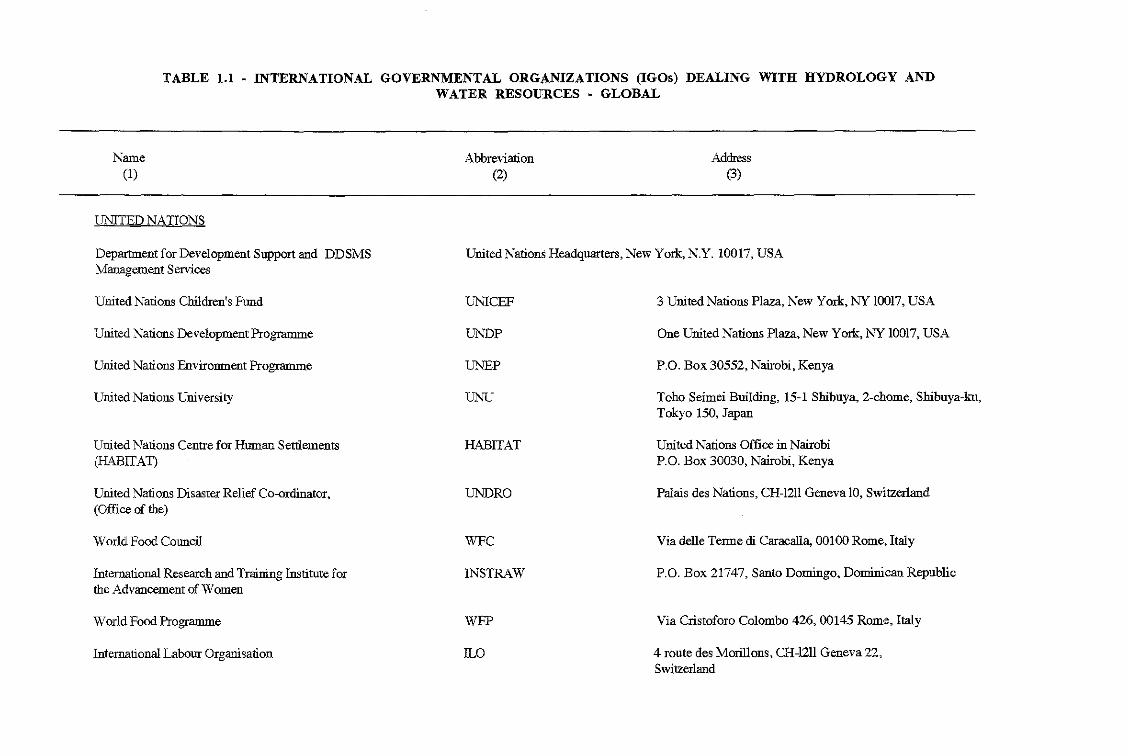
TABLE 1.1 . INTERNATIONAL GOVERNMENTAL ORGANIZATIONS (IGOs) DEALING WITH HYDROLOGY ANDWATER RESOURCES· GLOBAL
Kame(1)
IJNITED NATIONS
Abbreviation(2)
Address(3)
Department for Development Snpport and DDSMSIvlanagement Services
United Nations Headquarters, New York, NY. 10017, USA
United Nations Children's Fund
United Nations Development Programme
United Nations Environment Programme
United Nations University
United Nations Centre for Human Settlements(HABITAT)
United Nations Disaster Relief CO-<Jrdiuator,(Office of fue)
World Food Council
International Research and Training Institute forthe Advancement of Women
World Food Programme
International Labour Organisation
lJNCEF
ill\'DP
UNEP
UNU
HABITAT
UNDRO
WFC
INSTRAW
WFP
ILO
3 United Nations Plaza, New York, NY 10017, USA
One United Nations Plaza, New York, NY 10017, USA
P.O. Box 30552, Nairobi, Kenya
Toho Seimei Bni1ding, 15-1 Sbibuya, 2-chome, Sbibuya-kn,Tokyo 150, Japan
United Nations Office in NairobiP.O. Box 30030, Nairobi, Kenya
Palais des Nations, CH-12ll Geneva 10, Switzerland
Via delle Tenne eli Caracalla, 00100 Rome, Italy
P.O. Box 21747, Santo Domingo, Dominican Republic
Via Cristoforo Colombo 426, 00145 Rome, Italy
4 route des Morillons, CH-12ll Geneva 22,Switzerland
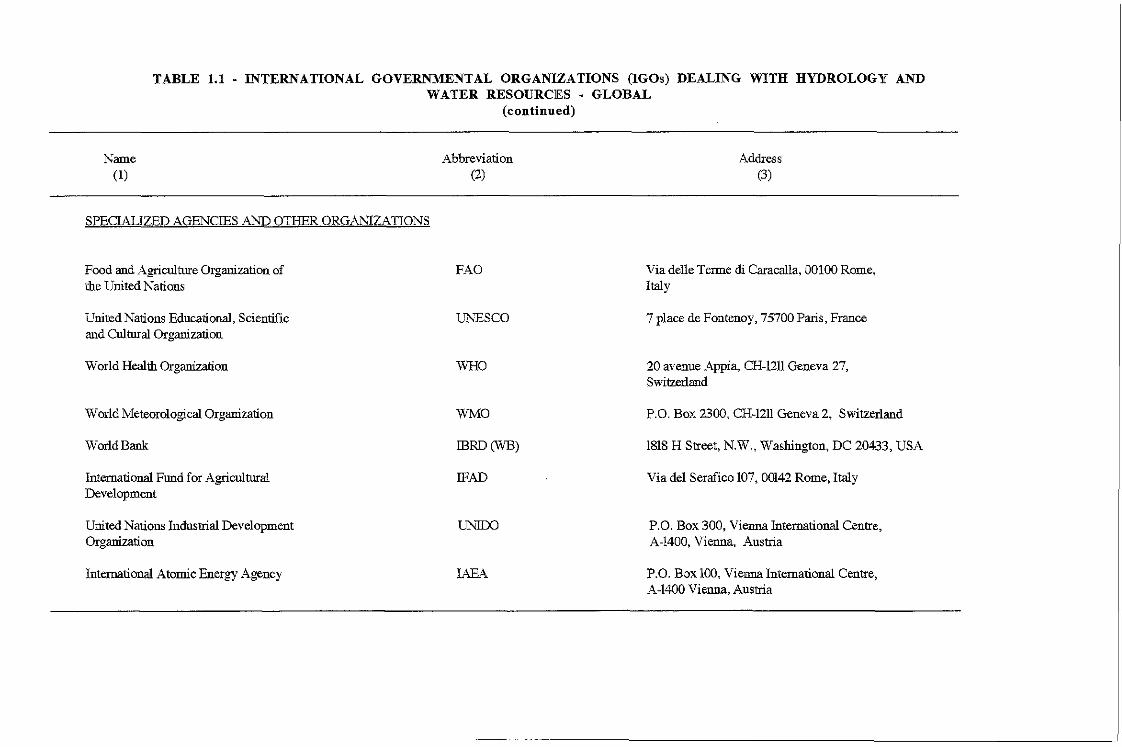
TABLE 1.1 . INTERNATIONAL GOVERNMENTAL ORGANIZATIONS (lGOs) DEALING WITH HYDROLOGY ANDWATER RESOURCES· GLOBAL
(continued)
Name(1)
SPECIALIZED AGENCIES A1'.'P OTHER ORGA1'.1ZATIONS
Food and Agriculture Organization ofthe United Nations
United Nations Educational. Scientificand CUltural Organizatiou
World Health Organization
World Meteorological Organization
World Bank
International Fund for AgriculturalDevelopment
United Nations Industrial DevelopmentOrganization
International Atomic Energy Agency
Abbreviation(2)
FAO
UNESCO
WHO
WMO
ffiRD(WB)
!FAD
u"NIDO
IAEA
Address(3)
Via delle Tenne di Caracalla, 00100 Rome,Italy
7 place de Fontenoy, 75700 Paris, France
20 avenue Appia, CH-1211 Geneva 27,Switzerland
P.O. Box 2300, CH-1211 Geneva 2, Switzerland
1818 H Street, N.W., Washington, DC 20433, USA
Via del Serafico 107,00142 Rome, Italy
P.O. Box 300, Vienna International Centre,A-1400, Vienna, Austria
P.O. Box 100, Vienna International Centre,A-I400 Vienna, Austria
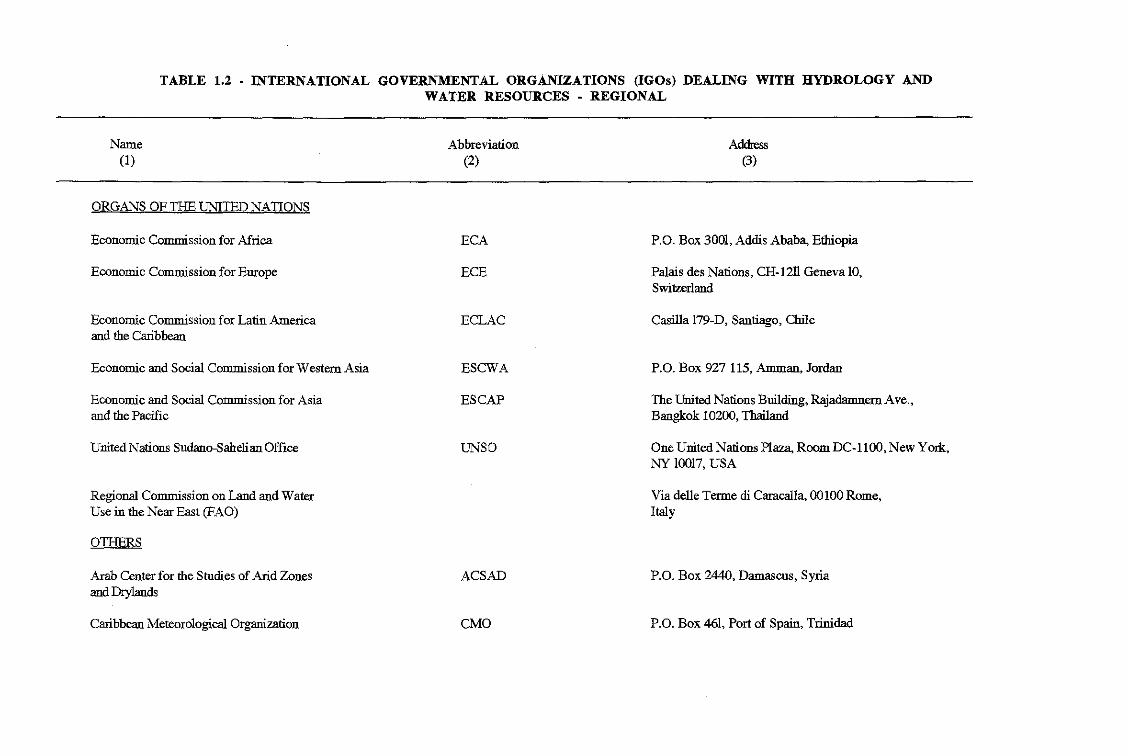
TABLE 1.2 . INTERNATIONAL GOVERNMENTAL ORGANIZATIONS (IGOs) DEALING WITH HYDROLOGY ANDWATER RESOURCES· REGIONAL
Name(I)
ORGANS OF THE UNITED NATIONS
Economic Commission for Africa
Economic Commission for Europe
Economic Commission for Latin Americaand the Catibbean
Economic and Social Commission for Western Asia
Economic and Social Commission for Asiaand the Pacific
United Nations Sndano-'sahelian Office
Regional Commission on Land and WaterUse in the Near East (FAO)
OTHERS
Arab Center for the Stndies of Arid Zonesand Dry1ands
Catibbean Meteorological Organization
Abbreviation(2)
ECA
ECE
ECLAC
ESCWA
ESCAP
UNSO
ACSAD
CMO
Address(3)
P.O. Box 3001, Addis Ababa, Ethiopia
Palais des Nations, CH-12l1 Geneva 10,SwilZerland
Casi11a 179-D, Santiago, Chile
P.O. Box 927 115, Annnan, Jordan
The United Nations Building, ~adamnernAve.,Bangkok 10200, Thailand
One United Nations Plaza, Room DC-1I00, New York,NY 10017, USA
Via delle Terme di Caracalla, 00100 Rome,Italy
P.O. Box 2440, Damascus, Syria
P.O. Box 461, Port of Spain, Triuidad
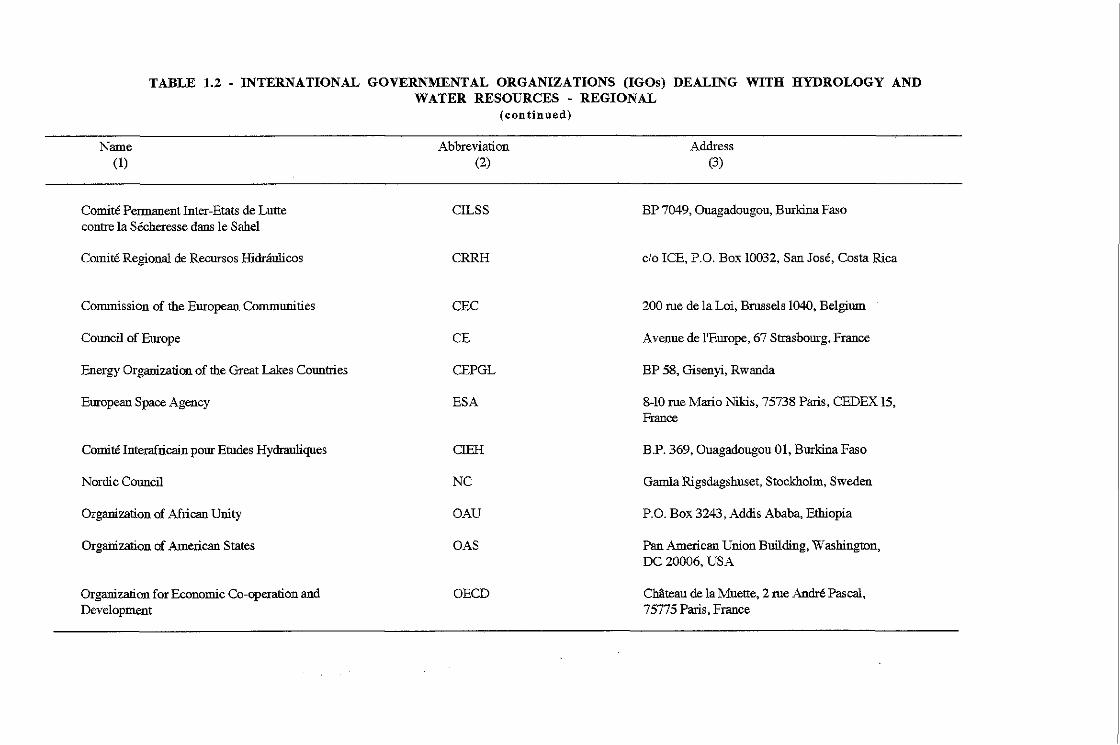
TABLE 1.2 . INTERNATIONAL GOVERNMENTAL ORGANIZATIONS (IGOs) DEALING WITH HYDROLOGY ANDWATER RESOURCES· REGIONAL
(continued)
Name(1)
Comite Permanent Inter-Etats de LuttecontrelaSecher~sedansleSahcl
Comire Regional de Recursos Hidraulicos
Commission of the European Communities
Council of Europe
Energy Organization of the GTeat Lakes Countries
European Space Agency
Comire Interafricain pour Etudes Hydrauliques
Nordic Council
Organization of Mrican Unity
Organization of American States
Organization for Economic Co-operation andDevelopment
Abbreviation(2)
CILSS
CRRH
CEC
CE
CEPGL
ESA
CIEH
NC
OAU
OAS
OECD
Address(3)
BP 7049, Ouagadougou, Burkina Faso
clo ICE, P.O. Box 10032, San Jose, Costa Rica
200 rue de la Loi, Brussels 1040, Bclgium
Avenue de l'Europe, 67 Strasbourg, France
BP 58, Gisenyi, Rwanda
8-10 rue Mario Nikis, 75738 Paris, CEDEX 15,France
B.P. 369, Ouagadougou 01, Burkina Faso
Gamla Rigsdagshuset, Stockholm, Sweden
P.O. Box 3243, Addis Ababa, Ethiopia
Pan American Union Bnildiug, Washington,DC 20006, USA
CMteau de la Muette, 2 rue Andre Pascal,75775 Paris, France
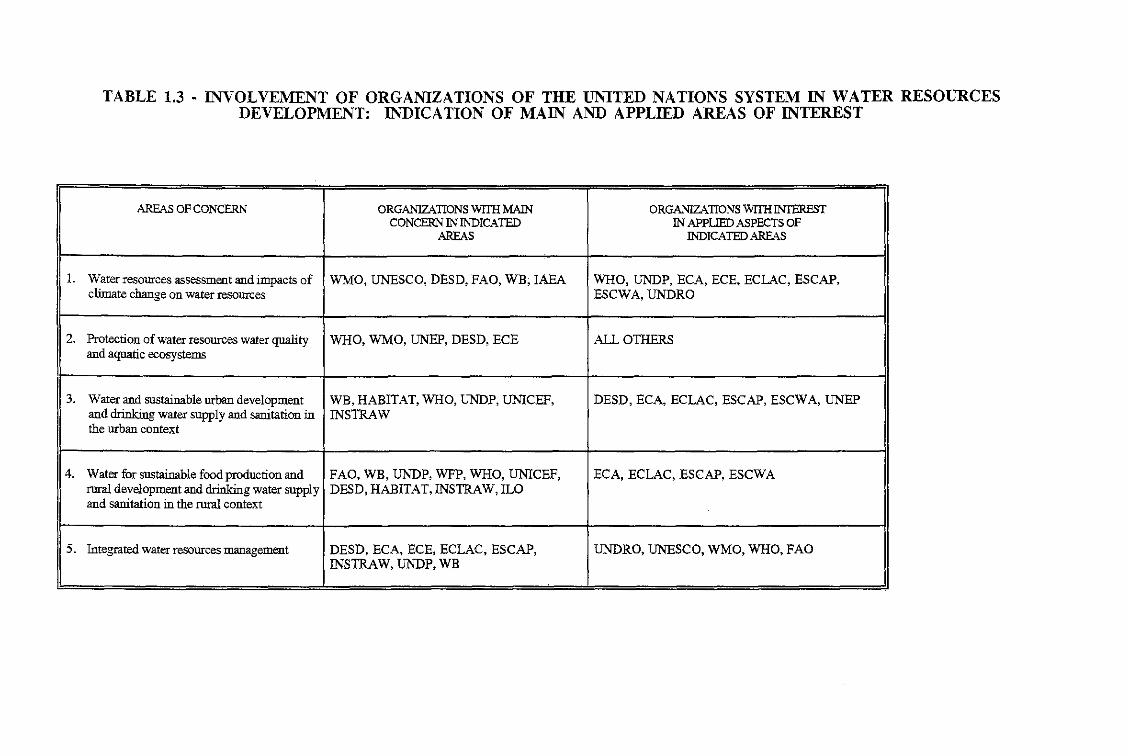
TABLE 1.3 - INVOLVEMENT OF ORGANIZATIONS OF THE UNITED NATIONS SYSTEM IN WATER RESOURCESDEVELOPMENT: INDICATION OF MAIN AND APPLIED AREAS OF INTEREST
AREAS OF CONCERN ORGANIZATIONS WITH MAIN ORGANIZATIONS WITH INTERESTCONCERN IN INDICATED IN APPLIED ASPECTS OF
AREAS INDICATED AREAS
1. Water resources assessment and impacts of WMO, UNESCO, DESD, FAO, WB, IAEA WHO, UNDP, ECA, ECE, ECLAC, ESCAP,climate change on water resources ESCWA, UNDRO
2. Protection of water resources water quality WHO,WMO,UNEP,DESD,ECE ALL OTHERSand aquatic ecosystems
3. Water and sustainable urban development WB, HABITAT, WHO, UNDP, UNICEF, DESD,ECA, ECLAC, ESCAP,ESCWA, UNEPand drinking water supply and sanitation in INSTRAWthe urban context
4. Water for sustainable food production and FAO, WB, UNDP, WFP, WHO, UNICEF, ECA, ECLAC, ESCAP, ESCWArural development and drinking water supply DESD, HABITAT, INSTRAW,ILOand sanitation in the rural context
5. Integrated water resources management DESD, ECA, ECE, ECLAC, ESCAP, UNDRO, UNESCO, WMO, WHO, FAOINSTRAW, UNDP, WB

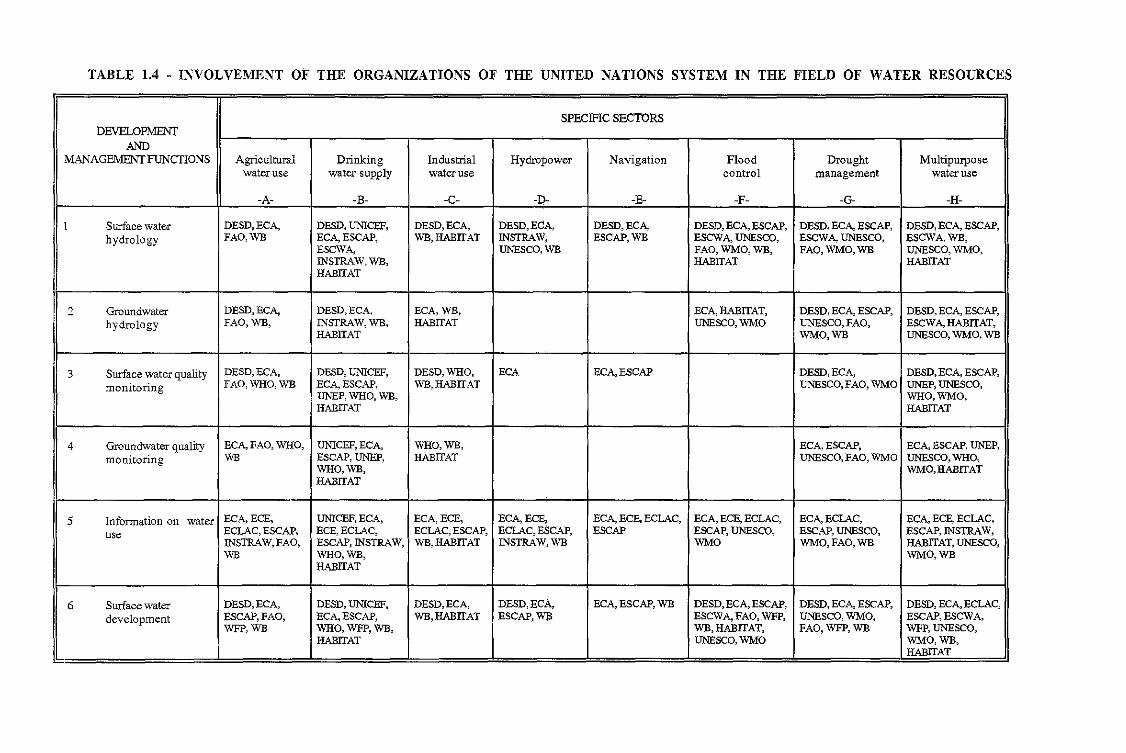
TABLE 1.4 - INVOLVEMENT OF THE ORGANIZATIONS OF THE UNITED NATIONS SYSTEM IN THE FIELD OF WATER RESOURCES
SPECIFIC SECTORSDEVELOPMENT
ANDMANAGEMENT FUNCTIONS Agricultural Drinking Industrial Hydropower Navigation Flood Drought Multipurpose
water use water supply water use control management water use
-A- -B- -C- -0- -E- -F- -G- -H-
I Surface water DESD,ECA, DESD, UNICEF, DESD,ECA, DESD, ECA, DESD,ECA, DESD, ECA, ESCAP, DESD, ECA, ESCAP, DESD, ECA, ESCAP,hydrology FAO,WB ECA,ESCAP, WB,HABITAT INSTRAW, ESCAP,WB ESCWA, UNESOO, ESCWA, UNESCO, ESCWA,WB,
ESCWA, UNESCO,WB FAO, WMO, WB, FAO,WMO,WB UNESCO, WMO,INSTRAW, WB, HABITAT HABITATHABITAT
2 Groundwater DESD,RCA, DESD,ECA, ECA, WE, ECA,HABITAT, DESD, ECA, ESCAP, DESD, ECA, ESCAP,hydrology FAD, \VB, INSTRAW, WB, HABITAT UNESCO,WMO UNESCO,FAO, ESCWA,HABITAT,
HABITAT WMO,WB UNESCO, WMO, WB
3 SUrface water quality DESD, ECA, DESD, UNICEF, DESD,WHO, ECA ECA,ESCAP DESD,ECA, DESD, ECA, ESCAP,
monitoring FAO,WHO,WB ECA,ESCAP, WB,HABITAT UNESCO,FAO, WMO UNEP, UNESCO,UNEP, WHO, WB, 'WHO,"WMO,HABITAT HABITAT
4 Groundwater quality ECA, FAO, WHO, UNICEF, ECA, WHO, WE, ECA, ESCAP, ECA, ESCAP, UNEP,monitoring WB ESCAP, UNEP, HABITAT UNESCO,FAO, WMO UNESCO, WHO,
WHO, WE, WMO,HABITATHABITAT
5 Information on water ECA,ECE, UNICEF, ECA, ECA,ECE, ECA,ECE, ECA, ECE, ECLAC, ECA, ECE, ECLAC, ECA,ECLAC, ECA, ECE, EcLAC,
use ECLAC, ESCAP, ECE,ECLAC, ECLAC, ESCAP, ECLAC, ESCAP, ESCAP ESCAP, UNESCO, ESCAP, UNESCO, ESCAP, INSTRAW,INSTRAW, FAO, ESCAP, INSTRAW, WB,HABITAT INSTRAW,WB WMO WMO,FAO,WB HABITAT, UNESCO,WB WHO, WE, WMO,WB
HABITAT
6 Surface water DESD,ECA, DESD, UNICEF, DESD,ECA, DESD, ECA, ECA, ESCAP, WB DESD, ECA, ESCAP, DESD, ECA, ESCAP, DESD, ECA, ECLAC,
development ESCAP,FAO, ECA,ESCAP, WB,HABITAT ESCAP,WB ESCWA,FAO, WFP, UNESCO, WMO, ESCAP, ESCWA,WFP,WB WHO, WFP, WE, \VB,HABITAT, FAO,WFP,WB WFP, UNESCO,
HABITAT UNESCO,WMO WMO,WB,HABITAT
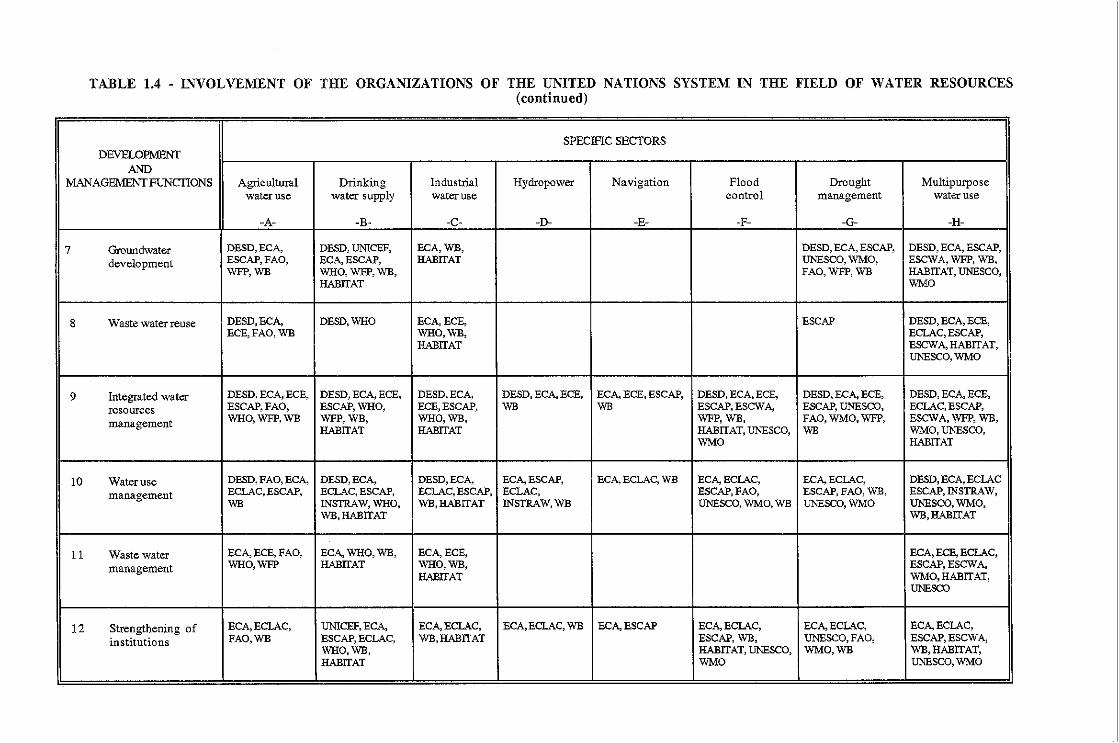
TABLE 1.4 - INVOLVEMENT OF THE ORGANIZATIONS OF THE UNITED NATIONS SYSTEM IN THE FIELD OF WATER RESOURCES(continued)
SPECIFIC SECTORSDEVELOPMENT
ANDMANAGEMENT FUNCTIONS Agricultural Drinking Industrial Hydropower Navigation Flood Drought Multipurpose
water use water supply water use control management water use
-A- -B- -C- -D- -E- -F- -G- -H-
7 GroWldwater DESD,ECA, DESD, UNICEF, RCA, WE, DESD, ECA, ESCAP, DESD, ECA, ESCAP,
development ESCAP,FAO, ECA,ESCAP, HABITAT UNESCO, WMO, ESCWA, WFP, WE,WFP,WB WHO, WFP, WB, FAO,WFP,WB HABITAT, UNESCO,
HABITAT WMO
8 Waste water reuse DESD,ECA, DESD,WHO ECA,ECE, ESCAP DESD, ECA, ECE,ECE,FAC,WB WHO, WE, ECLAC, ESCAP,
HABITAT ESCWA,HABITAT,UNESCO,WMO
9 Integrated water DESD, RCA, ECE, DESD, ECA, ECE, DESD,ECA, DESD, ECA, ECE, ECA, BCE, ESCAP, DESO, RCA, ECE, DESD, ECA, ECE, DESD, RCA, ECE,
resources ESCAP,FAO, ESCAP,WHO, ECE,ESCAP, WB \VB ESCAP, ESCWA, ESCAP, UNESCO, ECLAC, ESCAP,
management WHO,WFP,WB WFP, WB, WHO,WB, WFP, WB, FAO, WMO, WFP, ESCWA, WFP, WE,HABITAT HABITAT HABITAT, UNESCO, \VB WMO, UNESCO,
WMO HABITAT
10 Water use DESD, FAO, ECA, DESO, RCA, DESD,RCA, ECA,ESCAP, ECA, ECLAC, WB ECA,ECLAC, ECA,ECLAC, DESD, ECA, ECLAC
management ECLAC, ESCAP, ECLAC, ESCAP, ECLAC, ESCAP, ECLAC, ESCAP,FAO, ESCAP,FAO, WE, ESCAP, INSTRAW,\VB INSTRAW, WHO, WB,HABITAT INSTRAW,WB UNESCO, WMO, \VB UNESCO,WMO UNESCO, WMO,
WB,HABITAT WB,HABITAT
II Waste water ECA, ECE, FAO, ECA, WHO, WB, ECA, ECE, RCA, ECE, ECLAC,
management WHO,WFP HABITAT WHO,WB, ESCAP, ESCWA,HABITAT WMO, HABITAT,
UNESCO
12 Strengthening of ECA,ECLAC, UNICEF, ECA, ECA,ECLAC, ECA,ECLAC, WB ECA,ESCAP ECA,ECLAC, ECA,ECLAC, ECA,ECLAC,
institutions FAO,WB ESCAP, ECLAC, WB,HABITAT ESCAP, WB, UNESCO,FAO, ESCAP, ESCWA,WHO,WB, HABITAT, UNESCO, WMO,WB WB,HABITAT,HABITAT WMO UNESCO,WMO
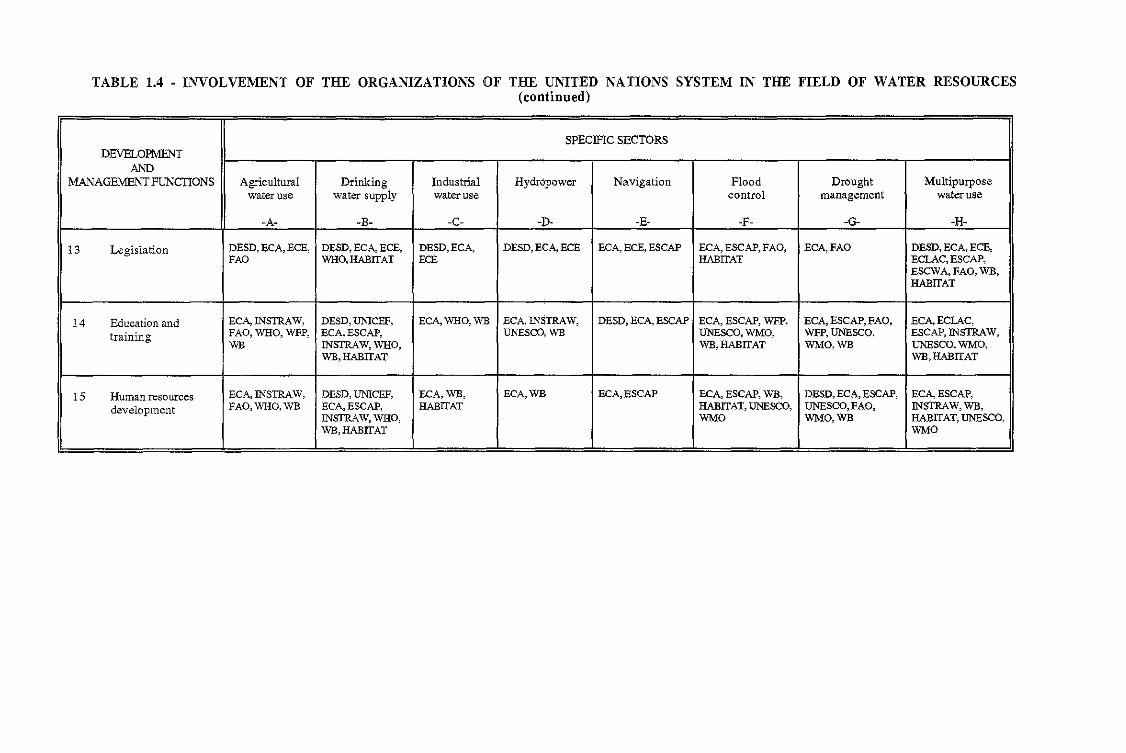
TABLE 1.4 - INVOLVEMENT OF THE ORGANIZATIONS OF THE UNITED NATIONS SYSTEM IN THE FIELD OF WATER RESOURCES(colltinned)
SPECIFIC SECTORSDEVELOPMENT
ANDMANAGEMENT FUNCTIONS Agricultural Drinking Industrial HydrGpower Navigation Flood Drought Multipurpose
water use water supply water use control management water use
-A- -B- -C- -D- -E- -F- -G- -H-
13 Legislation DESD, ECA, ECE, DESD, ECA, ECE, DESD,ECA, DESD, ECA, ECE ECA, ECE, ESCAP ECA, ESCAP, FAO, ECA,FAO DESD, ECA, ECE,FAO WHO, HABITAT ECE HABITAT ECLAC, ESCAP,
ESCWA, FAG, WB,HABITAT
14 Education and ECA, INSTRAW, DESD, UNICEF, ECA, WHO, WE ECA, INSTRAW, DESD, ECA, ESCAP ECA, ESCAP, WFP, ECA, ESCAP, FAO, ECA,ECLAC,
training FAO, WHO, WFP, ECA,ESCAP, UNESCO,WE UNESCO, WMO, WFP, UNESCO, ESCAP, INSTRAW,WB INSTRAW, WHO, WE, HABITAT WMO,WB UNESCO, WMO,
WE, HABITAT WE, HABITAT
15 Human resources ECA, INSTRAW, DESD, UNICEF, EeA,WE, ECA, WE ECA,ESCAP ECA, ESCAP, WE, DESD, ECA, ESCAP, ECA,ESCAP,
development FAO, WHO, WB ECA,ESCAP, HABITAT HABITAT, UNESCO, UNESCO,FAO, INsTRAW, WE,INSTRAW, WHO, WMO WMO,WE HABITAT, UNESCO,WB,HABITAT WMO

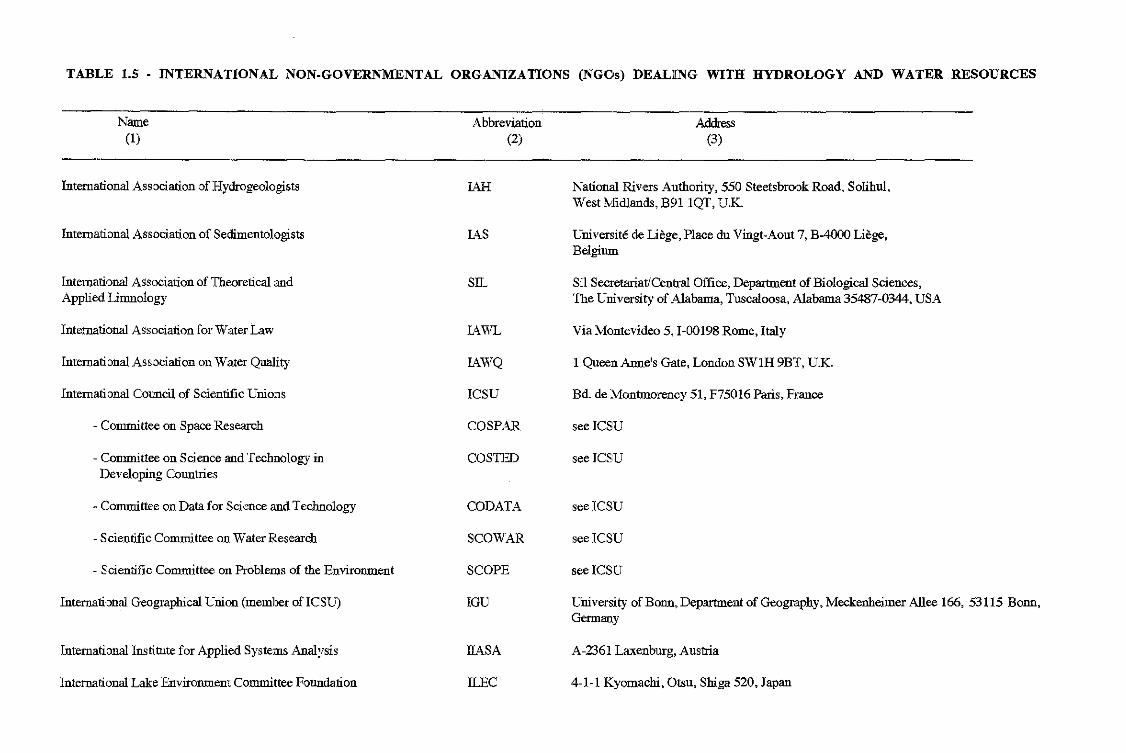
TABLE 1.5 - INTERNATIONAL NON-GOVERNMENTAL ORGANIZATIONS (NGOs) DEALING WITH HYDROLOGY AND WATER RESOURCES
Name(1)
Inte1national Association of Hydrogeologists
International Association of Sedimentologists
International Association of Theoretical andApplied Lintnology
International Association for Water Law
International Association on Water Quality
International Council of Scientific Unions
- Committee on Space Research
- Committee on Scieoce and Techuology inDeveloping Coootries
- Committee on Data for Science and Techoology
- Scientific Committee on Water Research
- Scieotific Committee on Problems of ilie Enviromnent
International Geographical Lnion (member of ICSU)
Intetnational Institute for Applied Systems Analysis
International Lake Enviromnent Committee Foundation
Abbreviation(2)
IAH
LI\.S
SIL
LI\.WL
IAWQ
ICSU
CaSPAR
CaSTED
CODATA
SCOWAR
SCOPE
IGU
IIASA
ILEC
Address(3)
National Rivers Auiliority, 550 Steetsbrook Road, Solihul,WestJ\!Iidlands,B911QT, UK.
Universite de Lieg", Place du Vingt-Aout 7, B-4000 Liege,Belgium
Sil Secretariat/Central Office, Departuteot of Biological Sciences,The University of Alabama, Tuscaloosa, Alabama 35487-0344, USA
Via :Y!ontevideo 5, 1-00198 Rome, Italy
1 Queen Anne's Gate, London SWIH 9BT, UK.
Bd. de S1onllnorency 51, F75016 Paris, France
see ICSU
see ICSU
see ICSU
see ICSU
see ICSU
University of Bonn, Departutent of Geography, Meckenheimer Allee 166, 53115 Bonn,Germany
A-2361 Laxenburg, Austria
4-1-1 Kyomachi, Otsu, Shiga 520, Japan
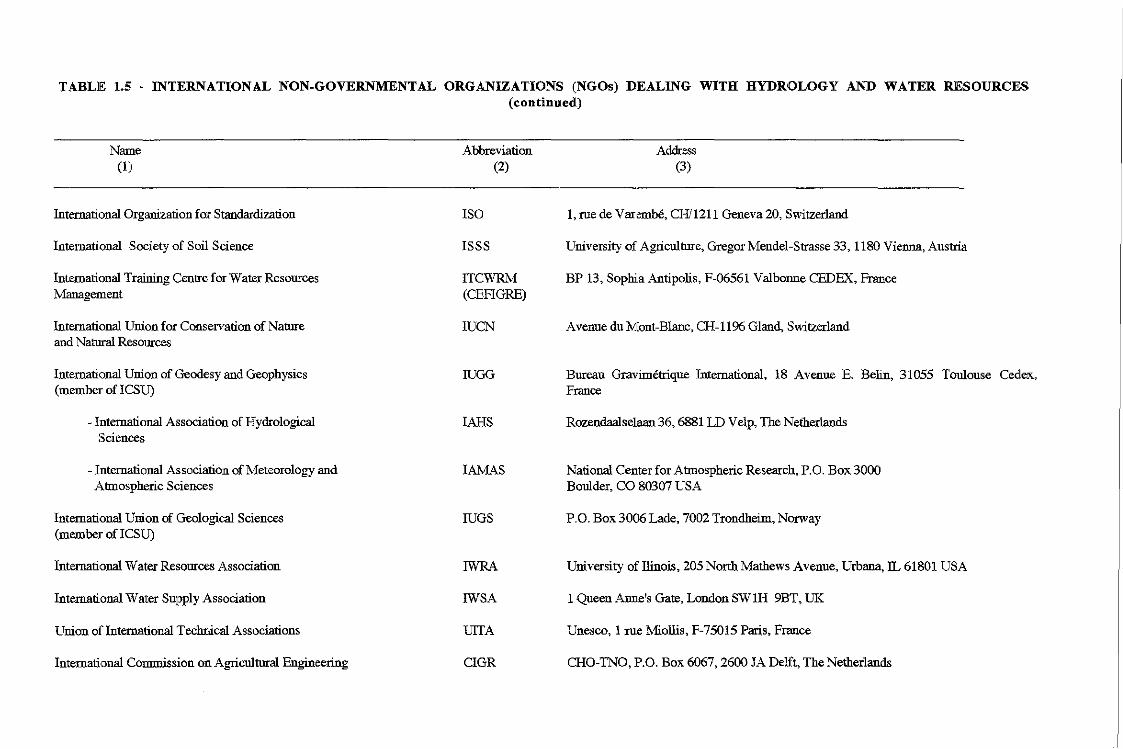
TABLE 1.5 . INTERNATIONAL NON-GOVERNMENTAL ORGANIZATIONS (NGOs) DEALING WITH HYDROLOGY AND WATER RESOURCES(continued)
Name(I)
International OrganizariLon for Standardization
International Society of Soil Science
International Training Centre for Water ResourcesManagement
International Union for Conservation of Natureand Natural Resources
International Union of Geodesy and Geophysics(member of ICSU)
- International Association of HydrologicalSciences
- International Association of Meteorology andAtmospheric Sciences
International Union of Geological Sciences(member of ICSU)
International Water Resources Association
International Water Supply Association
Union of International Technical Associations
International Commission on Agricultural Engineering
Abbreviation(2)
ISO
ISSS
ITCWRM(CEFIGRE)
IUCN
IUoo
IAHS
lAMAS
IUGS
IWRA
IWSA
VITA
CIGR
Addl'ess(3)
I, rue de Vanombe, CHi 1211 Geneva 20, Switzerland
University of Agriculture, Gregor Mendel-Strasse 33, 1180 Vienna, Austria
BP 13, Sophia Antipolis, F-06561 VaibOlme CEDEX, France
Avenue du Mout-Blanc, CH-ll% Gland, Switzerland
Bureau Gravirnetrique International, 18 Avenue E. Belin, 31055 Toulouse Cedex,France
Rozendaa1selaan 36, 6881 LD Velp, The Netherlands
National Center for Atmospheric Research, P.O. Box 3000Boulder, CO 80307 CSA
P.O. Box 3006 Lade, 7002 Trondheim, Norway
University of Ilinois, 205 North Mathews Avenue, Urbana, IL 61801 USA
1 Queen Anne's G'dte, London SWlH 9BT, UK
Unesco, I rue Miollis, F-75015 Paris, Frnnce
CHO-TNO, P.O. Box 6067, 2600 JA Delft, The Netherlands
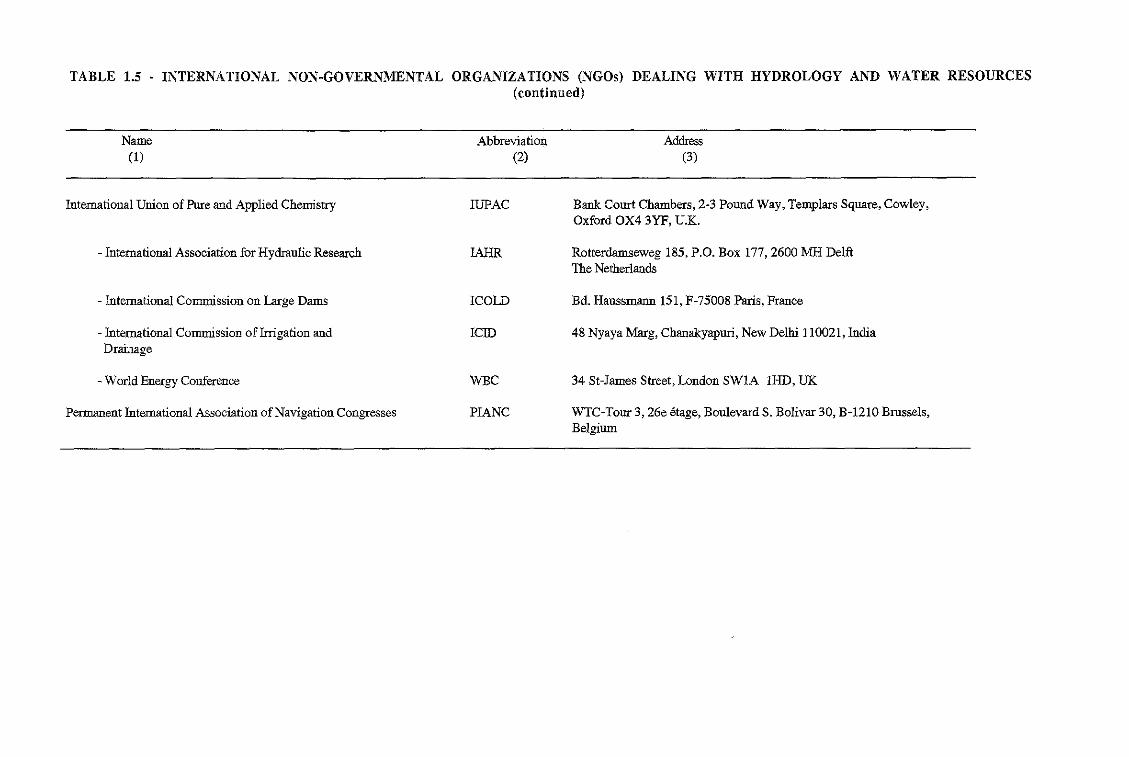
TABLE 1.5 - INTERNATIONAL NON-GOVERNMENTAL ORGANIZATIONS (NGOs) DEALING WITH HYDROLOGY AND WATER RESOURCES(continued)
Name(1)
International Union of Pure and Applied Chemistry
- International Association for Hydranlic Research
- International Commission on Large Dams
- International Commission of Irrigation andDrainage
- World Energy Conference
Permanent International Association of Navigation Congresses
Abbreviation(2)
IUPAC
IAHR
ICOLD
ICID
WBC
PIANC
Address(3)
Bank Court Chambers, 2-3 Pound Way, Templars Square, Cowley,Oxford OX4 3YF, U.K.
Rotterdamseweg 185, P.O. Box 177,2600 MH DelftThe Netherlands
Bd. Haussmann 151, F-75008 Paris, France
48 Nyaya Marg, Chanakyapuri, New Delhi 110021, India
34 St-Jarnes Street, London SW1A 1HD, UK
WTC-Tour 3, 26e "!age, Boulevard S. Bolivar 30, B-121O Brnssels,Belgium

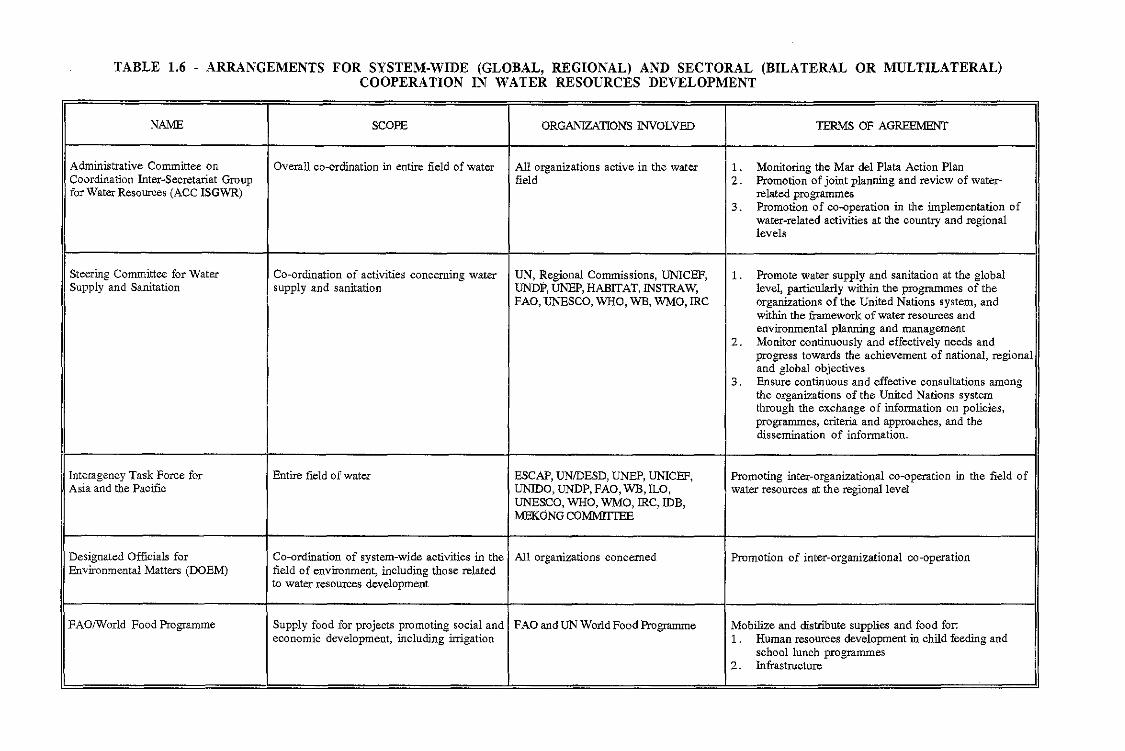
TABLE 1.6 - ARRANGEMENTS FOR SYSTEM-WIDE (GLOBAL, REGIONAL) AND SECTORAL (BILATERAL OR MULTILATERAL)COOPERATION IN WATER RESOURCES DEVELOPMENT
NAME SCOPE ORGANIZATIONS INVOLVED TERMS OF AGREEMENT
Administrative Committee on Overall co-ordination in entire field of water All organizations active in the water l. Monitoring the Mar del Plata Action PlanCoordination Inter-Secretariat Group field 2. Promotion of joint planning and review of water-for Water Resources (ACC ISGWR) related programmes
3. Promotion of co-operation in the implementation ofwater-related activities at the country and regionallevels
Steering Committee for Water Co-ordination of activities concerning water UN, Regional Commissions, UNICEF, l. Promote water supply and sanitation at the globalSupply and Sanitation supply and sanitation UNDP, UNEP, HABITAT, INSTRAW, level, particularly within the programmes of the
FAO, UNESCO, WHO, WB, WMO, IRC organizations of the United Nations system, andwithin the framework of water resources andenvironmental planning and management
2. Monitor continuously and effectively needs andprogress towards the achievement of national, regionaland global objectives
3. Ensure continuous and effective consultations amongthe organizations of the United Nations systemthrough the exchange of information on policies,programmes, criteria and approaches, and thedissemination of information.
Interagency Ta'Sk Force for Entire field of water ESCA)', UNIDESD, UNEP, UNICEF, Promoting inter-organizational co-operation in the field ofAsia and the Pacific UNIDO, UNDP, FAO, WB, ILO, water resources at the regional level
UNESCO, WHO, WMO, IRC, IDB,MEKONG COMMlTIEE
Designated Officials for Co-ordination of system-wide activities in the All organizations concerned Promotion of inter-organizational co-operationEnvironmental Matters (DOEM) field of environment, including those related
to water resources development
FAOIWorld Food Programme Supply food for projects promoting social and FAO and UN World Food Programme Mobilize and distribute supplies and food for:economic development, including irrigation 1. Human resources development in child feeding and
school lunch programmes2. Infrastructure
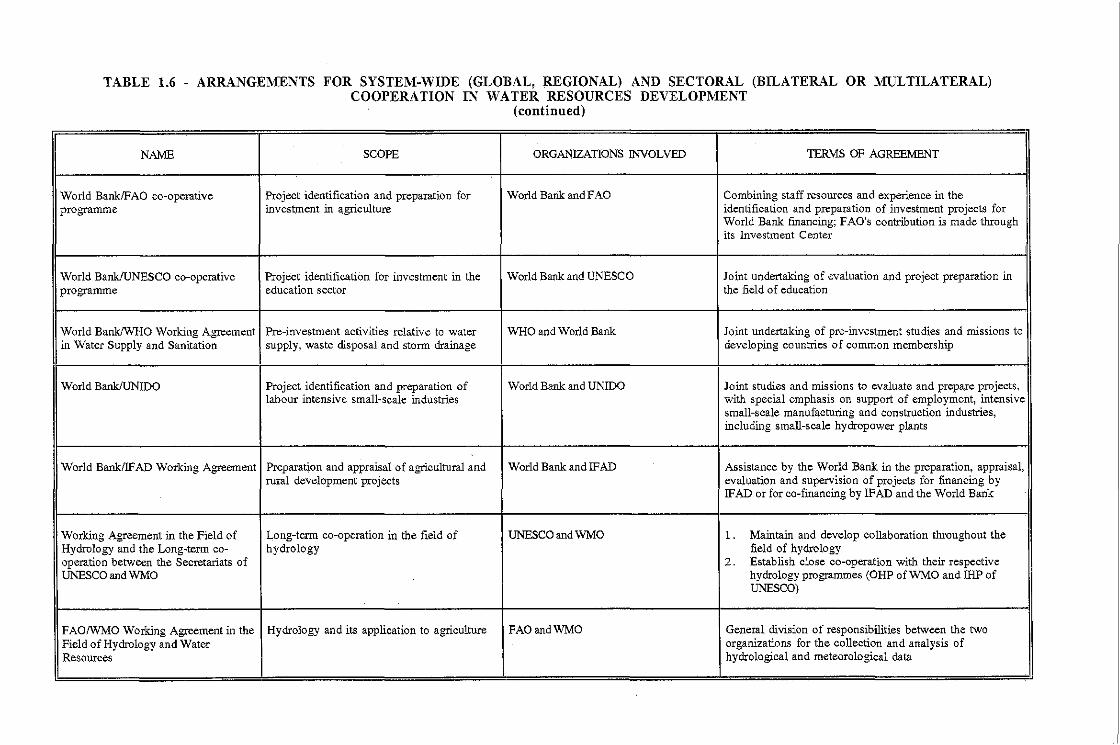
TABLE 1.6 - ARRANGEMENTS FOR SYSTEM-WIDE (GLOBAL, REGIONAL) AND SECTORAL (BILATERAL OR MULTILATERAL)COOPERATION IN WATER RESOURCES DEVELOPMENT
(continued)
NAME SCOPE ORGANIZATIONS INVOLVED TERMS OP AGREEMENT
World BanklFAO co-operative Project identification and preparation for World Bank andFAO Combining staff resources and experience in theprogramme investment in agriculture identification and preparation of investment projects for
World Bank financing; FAG'g contribution is made throughits Investment Center
I
World BanklUNESCO co-operative Proje"ct identification for investment in the World Bank and UNESCO Joint undertaking of evaluation and project preparation inprogramme education sector the field of education
World BanklWHO Working Agreement Pre-investment activities relative to water WHO and World Bank Joint undertaking of pre-investment studies and missions toin Water Supply and Sanitation supply, waste disposal and stonn drainage developing countries of common membership
World BanklUNIDO Project identification and preparation of World Bank and UNIDO Joint studies and missions to evaluate and prepare projects,labour intensive small-scale industries with special emphasis on support of employment, intensive
small-scale manufacturing and construction industries,including small-scale hydropower plants
World BankfIFAD Working Agreement Preparation and appraisal of agricultural and World Bank and IFAD Assistance by the World Bank in the preparation, appraisal,rural development projects evaluation and supervision of projects for financing by
IFAD or for co-financing by IFAD and the World Bank
Working Agreement in the Field of Long-term co-operation in the field of UNESCO and WMO 1. Maintain and develop collaboration throughout theHydrology and the Long-term co- hydrology field of hydrologyoperation between the Secretariats of 2. Establish close co-operation with their respectiveUNESCO and WMO hydrology programmes (OHP of WMO and IHP of
UNESCO)
FAOIWMO Working Agreement in the Hydrology and its application to agriculture FAOandWMO General division of responsibilities between the twoField of Hydrology and Water organizations for the collection and analysis ofResources hydrological and meteorological data
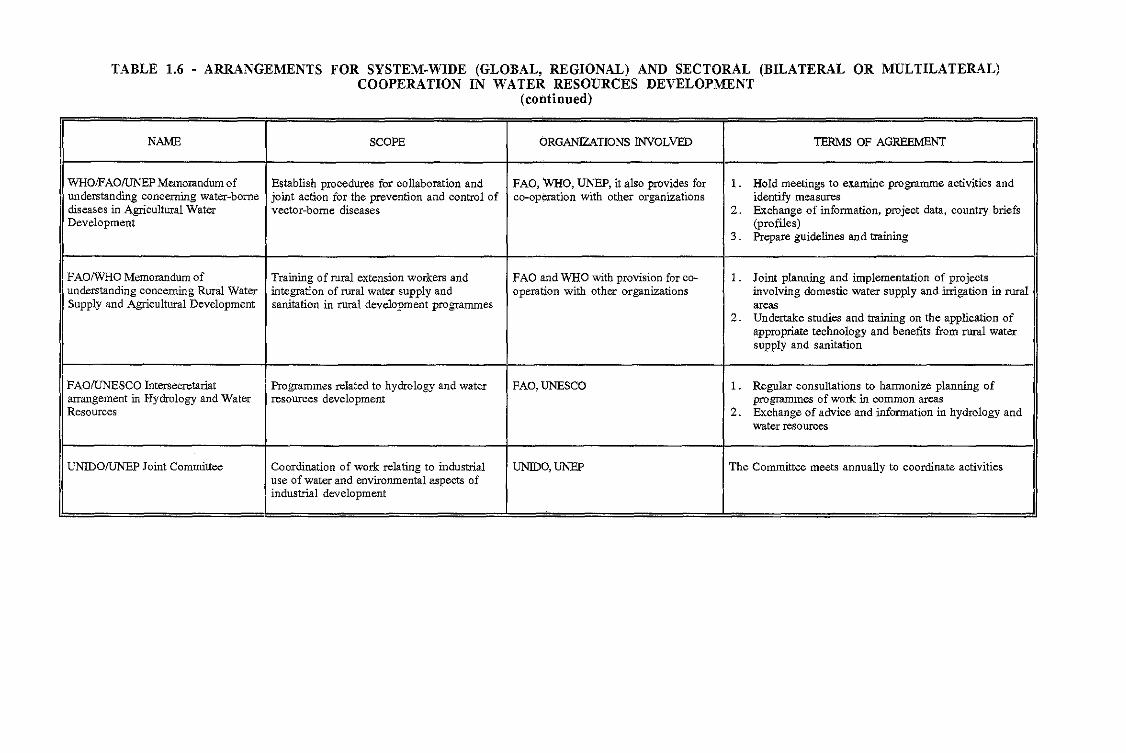
TABLE 1.6 " ARRANGEMENTS FOR SYSTEM-WIDE (GLOBAL, REGIONAL) AND SECTORAL (BILATERAL OR MULTILATERAL)COOPERATION IN WATER RESOURCES DEVELOPMENT
(continued)
NAME SCOPE ORGANIZATIONS lNVOLVED TERMS OF AGREEMENT
WHOIFAOIUNEP Memozandum of Establish procedures for collaboration and FAG, WHo, UNEP, it also provides for I. Hold meetings to examine programme activities andunderstanding concerning water-borne joint action for the prevention and control of co-operation with other organizations identify measuresdiseases in Agricultural Water vector-borne diseases 2. Exchange of infonnation, project data, country briefsDevelopment (profiles)
3. Prepare guidelines and training
FAOIWHO Memozandum of Training of rural extension workers and FAO and WHO with provision for co- l. Joint planning and implementation of projectsunderstanding concerning Rural Water integration of rural water supply and operation with other organizations involving domestic water supply and irrigation in ruralSupply and Agricultural Development sanitation in rural development programmes areas
2. Undertake studies and training on the application ofappropriate technology and benefits from rural watersupply and sanitation
FAOiUNESCO Intersecrelariat Programmes related to hydrology and water FAO, \JNESCO I. Regular consultations to harmonize planning ofarrangement in Hydrology and Water resources development programmes of worle in common areasResources 2. Exchange of advice and infonnation in hydrology and
water resources
UNIDOiUNEP Joint Committee Coordination of work relating to industrial UNIDO,UNEP The Committee meets annually to coordinate activitiesuse of water and environmental aspects ofindustrial development

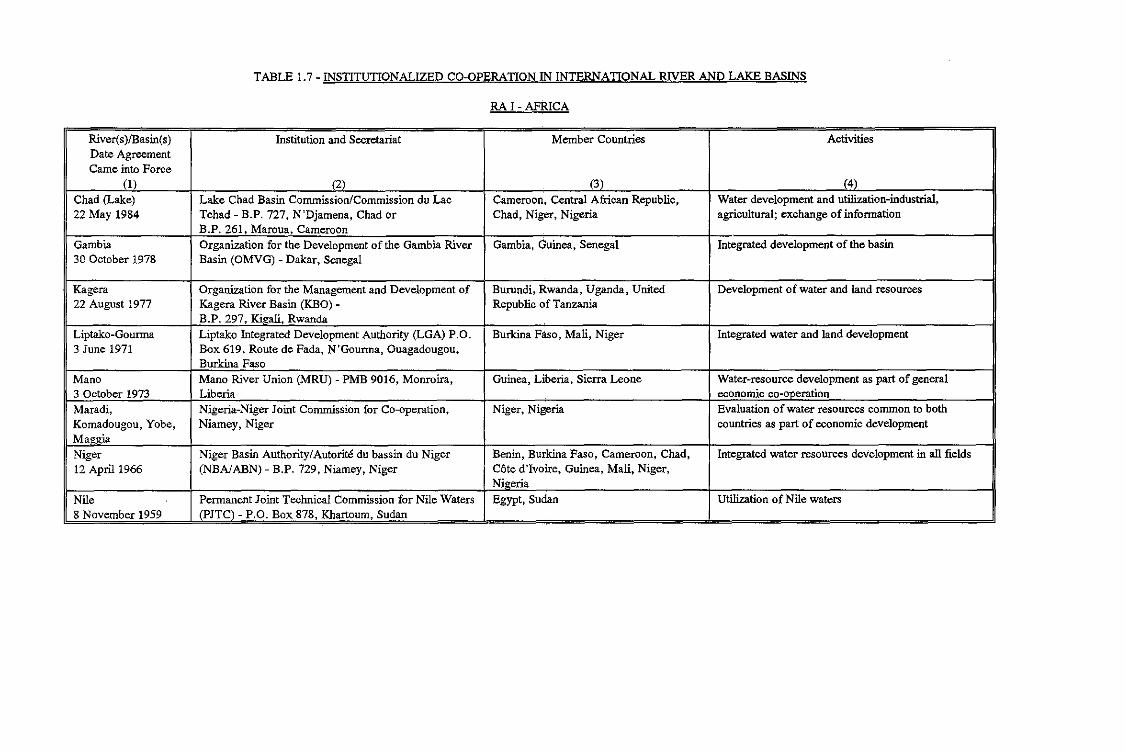
TABLE 1.7 - INSTITUTIONALIZED CO-oPERATION IN INTERNATIONAL RNER AND LAKE BASINS
RAI - AFRICA
River(s)/Basin(s) Institution and Secretariat Member Countries ActivitiesDate AgreementCame into Force
(I) (2) (3) (4)
Chad (Lake) Lake Chad Basin Commission/Commission du Lac Cameroon, Central African Republic, Water development and utilization-industrial,22 May 1984 Tchad - B.P. 727, N'Djamena, Chad or Chad, Niger, Nigeria agricultural; exchange of infonnation
B.P. 261, Maraua, CameroonGambia Organization for the Development of the Gambia River Gambia, Guinea, Senegal Integrated development of the basin30 October 1978 Basin (OMVG) - Dakar, Senegal
Kagera Organization for the Management and Development of Burundi, Rwanda, Uganda, United Development of water and land resources22 August 1977 Kagera River Basin (KBO) - Republic of Tanzania
B.P. 297, Kioali, RwandaLiptako-Gounna Liptako Integrated Development Authority (LGA) P.O. Burkina Faso, Mali, Niger Integrated water and land development3 June 1971 Box 619, Route de Fada, N'Gounna, Ouagadougou.
Burkina FasoMano Mano River Union (MRU) - PMB 9016. Monroira, Guinea, Liberia, Sierra Leone Water-resource development as part of general3 October 1973 Liberia economic co-o-oeration
Maradi, Nigeria-Niger Joint Commission for Co-operation, Niger. Nigeria Evaluation of water resources common to bothKomadougou, Yobe, Niamey, Niger countries as part of economic developmentMag:gia
Niger Niger Basin Authority/Autorite du bassin du Niger Benin, Burkina Paso, Cameroon, Chad, Integrated water resources development in all fields
12 Apri11966 (NBA/ABN) - B.P. 729, Niamey, Niger Cote d'Ivoire, Guinea, Mali. Niger,Nil!eria
Nile Permanent Joint Technical Commission for Nile Waters Egypt, Sudan UtiIization of Nile waters8 November 1959 IPITC) - P.O. Box 878, Khartoum, Sudan
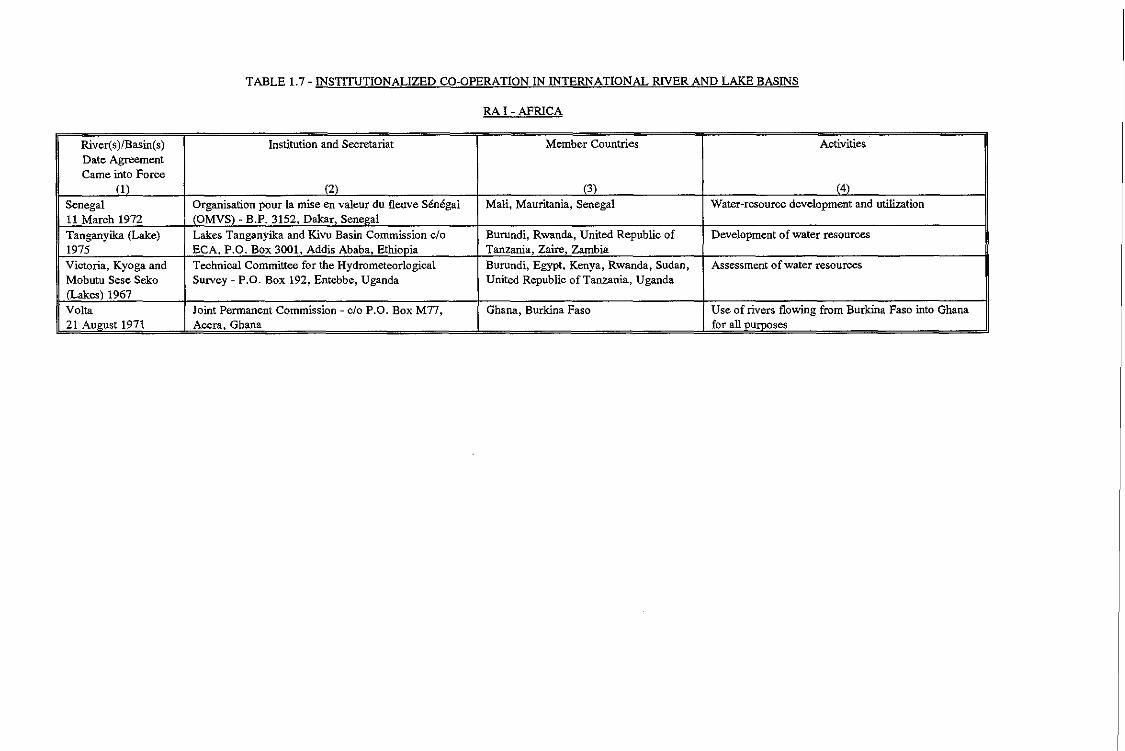
TABLE 1.7 - INSTITUTIONALIZED CO-OPERATION IN INTERNATIONAL RIVER AND LAKE BASINS
RAI-AFRICA
River(s)/Basin(s) Institution and Secretariat Member Countries ActivitiesDate AgreementCame into Force
(I) (2) (3) (4)
Senegal Organisation pour la mise en valeur du fIeuve Senegal Mali, Mauritania, Senegal Water-resource development and utilization11 March 1972 (OMVS) - B.P. 3152, Dakar, Sene~alTanganyika (Lake) Lakes Tanganyika and Kivu Basin Commission cIa Burundi, Rwanda, United Republic of Development of water resources1975 ECA, P.O. Box 3001, Addis Ababa, Ethiopia Tanzania, Zaire, ZambiaVictoria, Kyoga and Technical Committee for the Hydrometeorlogical Burundi, Egypt, Kenya, Rwanda, Sudan, Assessment of water resourcesMobutu Sese Seko Survey - P.o. Box 192, Entebbe, Uganda United Republic of Tanzania, Uganda(Lakes) 1967Volta Joint Permanent Commission - cia P.O. Box M77. Ghana, Burkina Faso Use of rivers flowing from Burkina Paso into Ghana21 Au~ust 1971 Accra, Ghana for all purposes
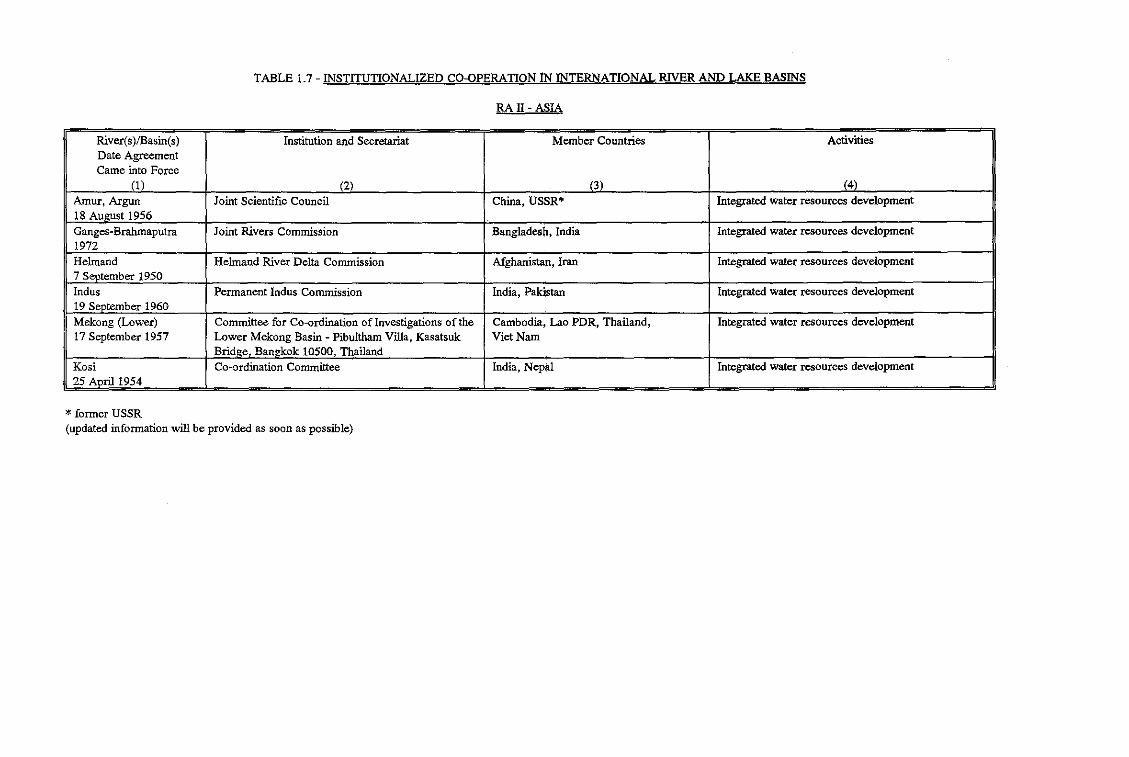
TABLE 1.7 - INSTITUTIONALIZED CO-OPERATION iN INTERNATIONAL RNER AND LAKE BASINS
RAIl - ASIA
River(s)/Basin(s) Institution and Secretariat Member Countries ActivitiesDate AgreementCame into Force
(I) (2) (3) (4)
Arnur, Argun Joint Scientific Council China, USSR- Integrated water resources development18 August 1956Ganges-Brahmaputra Joint Rivers Commission Bangladesh, India Integrated water resources development1972Helmand Helmand River Delta Commission Afghanistan, Iran Integrated water resources development7 September 1950Indus Permanent Indus Commission India, Pakistan Integrated water resources development19 September 1960Mekong (Lower) Committee for Co-ordination of Investigations of the Cambodia, Lao PDR, Thailand, Integrated water resources development17 September 1957 Lower Mekong Basin - Pibultham Villa, Kasatsuk VietNam
Brid.e Ban.kok 10500, ThailandKosi Co-ordination Committee India, Nep~l Integrated water resources development25 Aoril 1954
* former USSR(updated information will be provided as soon as possible)
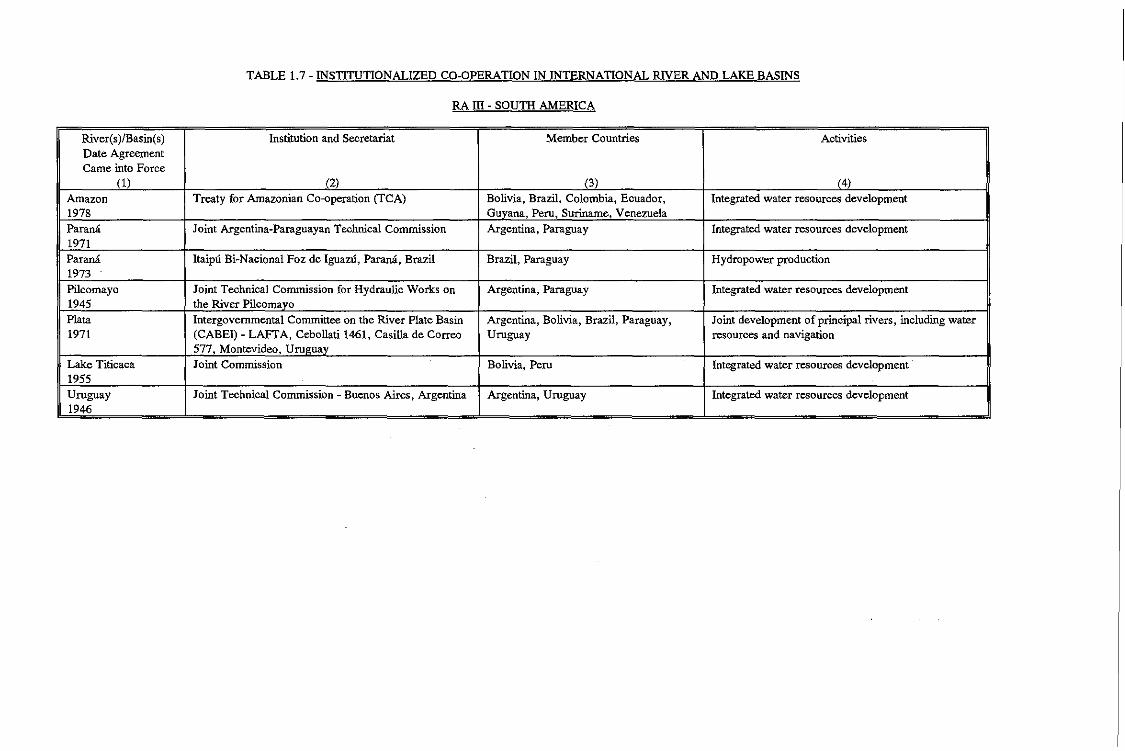
TABLE 1.7 - INSTITUTIONALIZED CO-OPERATION IN INTERNATIONAL RNER AND LAKE BASINS
RA ill - SOUTH AMERICA
River(s)/Basin(s) Institution and Secretariat Member Countries ActivitiesDate AgreementCame into Force
(1) (2) (3) (4)Amazon Treaty for Amazonian Co-operation (TeA) Bolivia, Brazil, Colombia, Ecuador, Integrated water resources development1978 Guvana, Peru, Suriname, Venezuela
Parana Joint Argentina-Paraguayan Technical Commission Argentina, Paraguay Integrated water resources development1971Parana ltaipu Bi-Nacional Foz de [guazu, Parana, Brazil Brazil, Paraguay Hydropower production1973Pilcomayo Joint Technical Commission for Hydraulic Works on Argentina, Paraguay Integrated water resources development1945 the River PilcomavoPlata Intergovernmental Committee on the River Plate Basin Argentina, Bolivia, Brazil, Paraguay, Joint development of principal rivers, including water1971 (CABEI) - LAFTA, Cebollati 1461, Casilla de Corre<> Uruguay resources and navigation
577, Montevideo, Uru.uavLake Titicaca Joint Commission Bolivia, Peru Integrated water resources development1955Uruguay Joint Technical Commission - Buenos Aires, Argentina Argentina, Uruguay Integrated water resources development1946
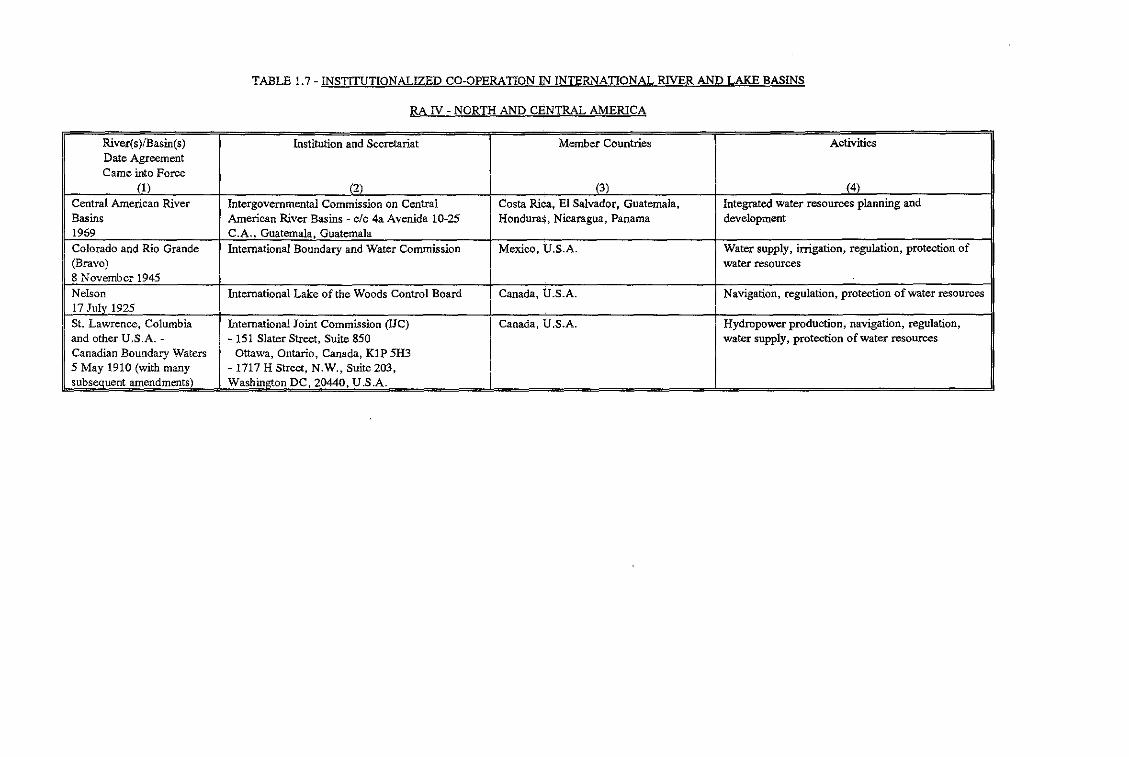
TABLE 1.7 - INSTITUTIONALiZED CO-OPERATION IN INTERNATIONAL RNER AND LAKE BASINS
RA IV - NORTH AND CENTRAL AMERICA
River(s)/Basin(s) Institution and Secretariat Member Countries ActivitiesDate AgreementCame into Force
(I) (2) (3) (4)Central American River Intergovernmental Commission on Central Costa Rica, El Salvador, Guatemala, Integrated water resources planning andBasins American River Basins - c/o 4a Avenida 10-25 Honduras, Nicaragua, Panama development1969 C.A., Guatemala, GuatemalaColorado and Rio Grande International Boundary and Water Commission Mexico, U.S.A. Water supply, irrigation, regulation, protection of(Bravo) water resources8 November 1945Nelson International Lake of the Woods Control Board Canada, U.S.A. Navigation, regulation, protection afwater resources17 Julv 1925$1. Lawrence, Columbia International Joint Commission (UC) Canada, U.S.A. Hydropower production, navigation, regulation,and other U.S.A. - - lSI Slater Street, Suite 850 water supply, protection of water resourcesCanadian Boundary Waters Ottawa, Ontario, Canada, KIP 5H35 May 1910 (with many - 1717 H Street, N.W., Suite 203,subseauent amendments) Washington DC, 20440, U.S.A.
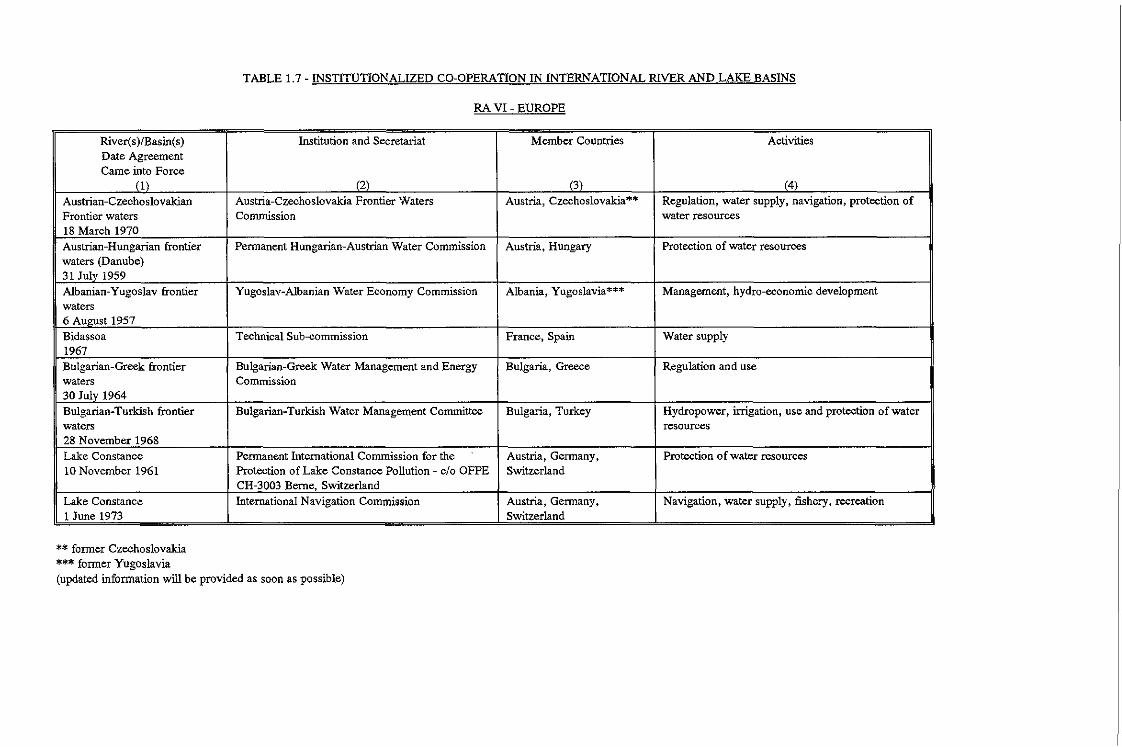
TABLE 1.7 -INSTITUTIONALIZED CO-OPERATION IN INTERNATIONAL RNER AND LAKE BASINS
RA VI - EUROPE
River(s)fBasin(s) Institution and Secretariat Member Countries Activities
Date AgreementCame into Force
(I) (2) (3) (4)
Plustrian-Czechoslovakian Austria-Czechoslovakia Frontier Waters Austria, Czechoslovakia""'" Regulation, water supply, navigation, protection ofFrontier waters Commission water resources18 March 1970Austrian-Hungarian frontier Pennanent Hungarian-Austrian Water Commission Austria, Hungary Protection of water resourceswaters (Danube)31 July 1959Albanian-Yugoslav frontier Yugoslav-Albanian Water Economy Commission Albania, Yugoslavia*** Management, hydro-economic developmentwaters6 Aua-ust 1957Bidassoa Technical Sub-commission France, Spain Water supply1967Bulgarian-Greek frontier Bulgarian-Greek Water Management and Energy Bulgaria, Greece Regulation and usewaters Commission30 Julv 1964Bulgarian-Turkish frontier Bulgarian-Turkish Water Management Committee Bulgaria, Turkey Hydropower, irrigation, use and protection of waterwaters resources28 November 1968
Lake Constance Pennanent International Commission for the Austria, Gennany, Protection of water resources10 November 1961 Protection of Lake Constance Pollution - c/o OFPE Switzerland
CH-3003 Berne, Switzerland
Lake Constance International Navigation Commission Austria, Gennany. Navigation. water supply, fishery, recreation1 June 1973 Switzerland
** former Czechoslovakia*** fonner Yugoslavia(updated infonnation will be provided as soon as possible)
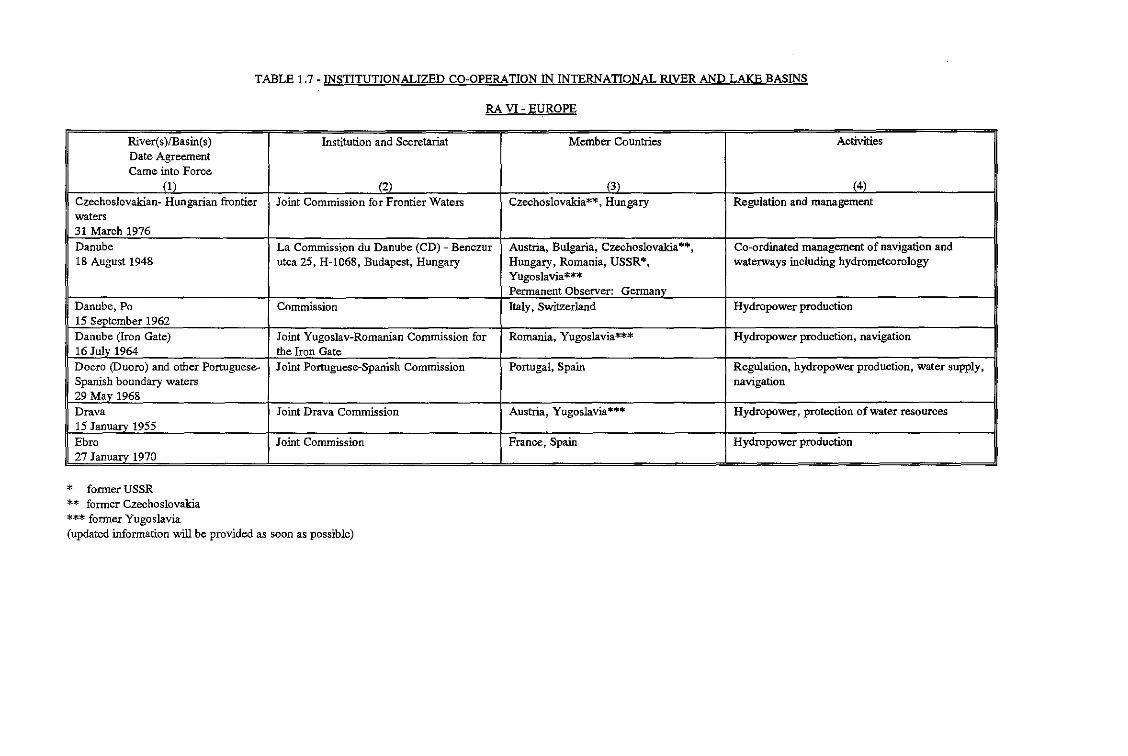
TABLE 1.7 -INSTITUTIONALIZED CO-OPERATION IN INTERNATIONAL RNER AND LAKE BASINS
RA VI - EUROPE
River(s)/Basin(s) Institution and Secretariat Member Countries ActivitiesDate AgreementCame into Force
(I) (2) (3) (4)
Czechoslovakian- Hungarian frontier Joint Commission for Frontier Waters Czechoslovakia**, Hungary Regulation and managementwaters31 March 1976Danube La Commission du Danube (CD) - Benczur Austria, Bulgaria, Czechoslovakia"""', Co-ordinated management of navigation and18 August 1948 utea 25, H-1068, Budapest, Hungary Hungary, Romania, USSR"', waterways including hydrometeorology
Yugoslavia***Pennanent Observer: Gennanv
Danube, Po Commission Italy, Switzerland Hydropower production15 SePtember 1962Danube (Iron Gate) Joint Yugoslav-Romanian Commission for Romania, Yugoslavia*** Hydropower production, navigation16 July 1964 the Iron GateDoera (DuaIc) and other Portuguese- Joint Portuguese-Spanish Commission Portugal, Spain Regulation, hydropower production, water supply,Spanish boundary waters navigation29 Mav 1968Drava Joint Drava Commission Austria, Yugoslavia"'·'" Hydropower, protection of water resources15 Januarv 1955Ebro Joint Commission France, Spain Hydropower production27 January 1970
* fonner USSR** former Czechoslovakia*** former Yugoslavia(updated information will be provided as soon as possible)
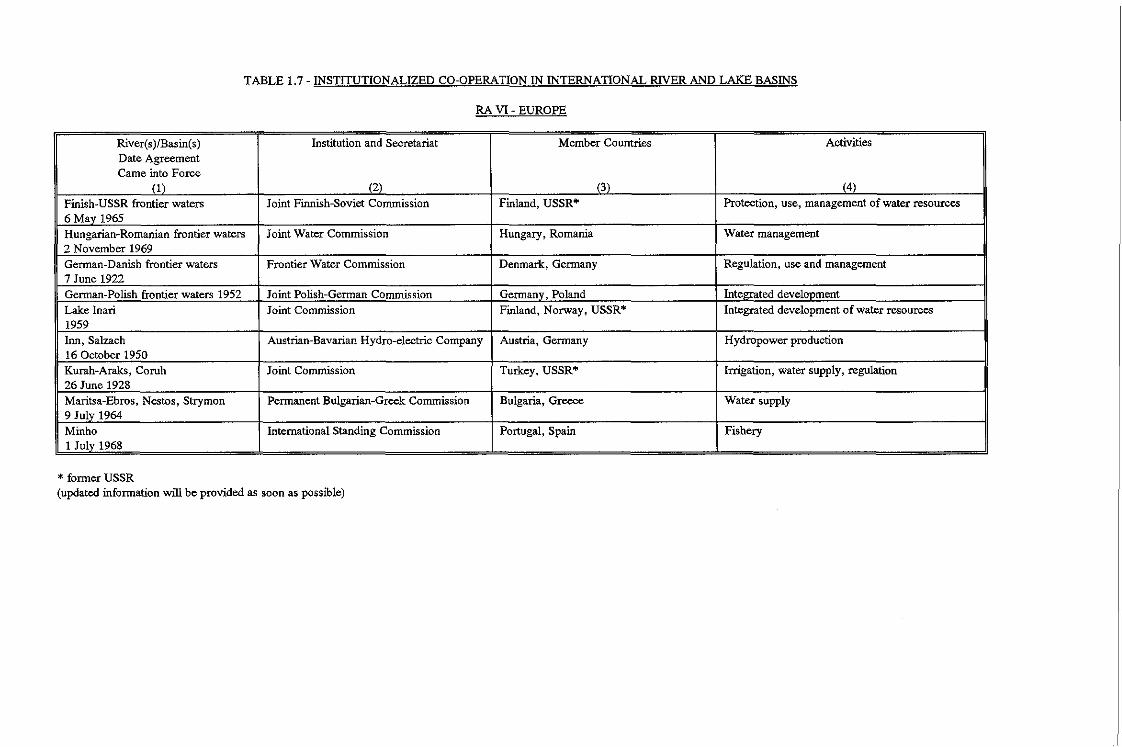
TABLE 1.7 - INSTITUTIONALIZED CO-OPERATION IN INTERNATIONAL RIVER AND LAKE BASINS
RA VI - EUROPE
Riyer(s)iBasin(s) Institution and Secretariat Member Countries ActivitiesDate AgreementCame into Force
(I) (2) (3) (4)
Finish-USSR frontier waters Joint Finnish-Soviet Commission Finland, USSR- Protection, use, management of water resources6 May 1965Hungarian-Romanian frontier waters Joint Water Commission Hungary, Romania Water management2 November 1969German-Danish frontier waters Frontier Water Commission Denmark, Germany Regulation, use and management7 June 1922German-Polish frontier waters 1952 Joint Polish-German Commission Germanv, Poland Integrated develoomentLake Inari Joint Commission Finland, Norway, USSR- Integrated development of water resources1959Inn, Salzach Austrian-Bavarian Hydro-electric Company Austria, Germany Hydropower production16 October 1950Kurah-Araks, Coroh Joint Commission Turkey. USSR- Irrigation, water supply, regulation26 June 1928Maritsa-Ebros, Nestos, Strymon Pennanent Bulgarian-Greek Commission Bulgaria, Greece Water supply9 July 1964Minho International Standing Commission Portugal, Spain Fishery1 July 1968
• former USSR(updated information will be provided as soon as possible)
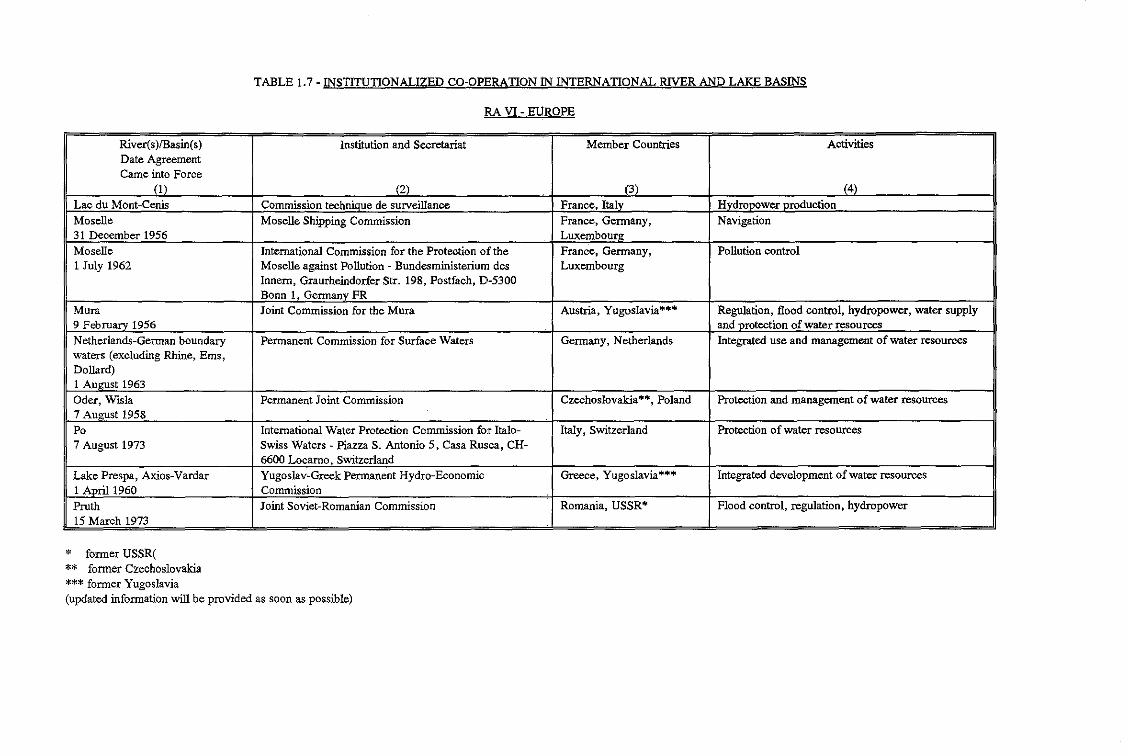
TABLE 1.7 - INSTITUTIONALIZED CO-OPERATION IN INTERNATIONAL RIVER AND LAKE BASINS
RA VI - EUROPE
River(s)fBasin(s) Institution and Secretariat Member Countries ActivitiesDate AgreementCame into Force
11) (2) (3) (4)
Lac du Mont-Cenis Commission technique de surveillance France, Italv Hvdrcoower Drcduction
Moselle Moselle Shipping Commission France, Gennany, Navigation31 December 1956 Luxembourl!:Moselle International Commission for the Protection of the France, Germany, Pollution control1 July 1962 Moselle against Pollution - Bundesministerium des Luxembourg
lonern, Graurheindorfer Str. 198. Postfach, D-5300Bonn 1, GennanV' FR
Mura Joint Commission for the Mura Austria, yugoslavia......... Regulation, flood control, hydropower. water supply9 Februarv 1956 and protection of water resourcesNetherlands-Gennan boundary Permanent Commission for Surface Waters Gennany, Netherlands Integrated use and management of water resourceswaters (excluding Rhine, Ems,Dollard)1 AUi!Ust 1963Oder, Wisla Permanent Joint Commission Czechoslovakia**, Poland Protection and management of water resources7 AuO"ust 1958
Po International Water Protection Commission for Italo- Italy, Switzerland Protection of water resources7 August 1973 Swiss Waters - Piazza S. Antonio 5, Casa Rusca, CH-
6600 Locarno, Switzerland
Lake Prespa, Axios-Vardar Yugoslav-Greek Permanent Hydro-Economic Greece, Yugoslavia*"'* Integrated development of water resources1 Apri11960 Commission
Pruth Joint Soviet-Romanian Commission Romania, USSR* Flood control, regulation, hydropower15 March 1973
* former USSR(** fonner Czechoslovakia*** former Yugoslavia(updated information will be provided as soon as possible)
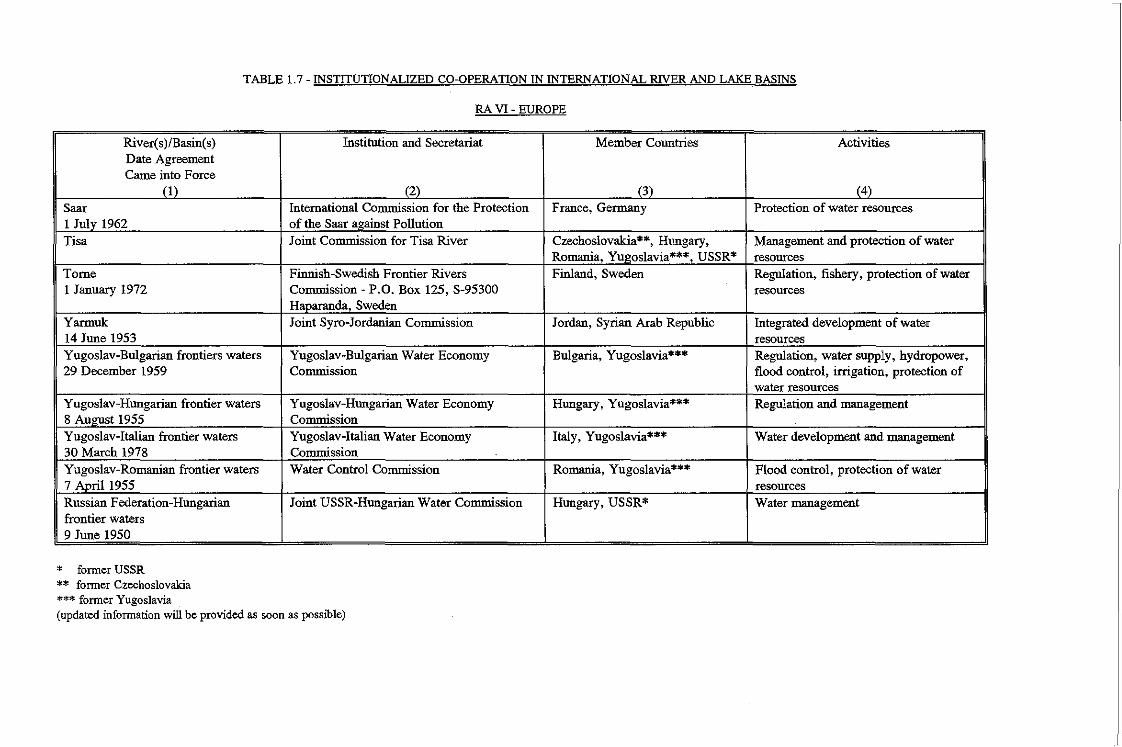
TABLE 1.7 - INSTITUTIONALIZED CO-OPERATION IN INTERNATIONAL RIVER AND LAKE BASINS
RA VI - EUROPE
River(s)/Basin(s) Institution and Secretariat Member Countries ActivitiesDate AgreementCame into Force
(I) (2) (3) (4)
Saar International Commission for the Protection France, Germany Protection of water resources1 Julv 1962 of the Saar a~ainst PollutionTisa Joint Commission for Tisa River Czechoslovakia**, Hungary, Management and protection of water
Romania, Yugoslavia***, USSR* resourcesTome Finnish-Swedish Frontier Rivers Finland, Sweden Regulation, fishery, protection of water1 January 1972 Commission - P.O. Box 125, S-95300 resources
Haparanda, SwedenYarmuk Joint Syro-Jordanian Commission Jordan, Syrian Arab Republic Integrated development of water14 June 1953 resourcesYugoslav-Bulgarian frontiers waters Yugoslav-Bulgarian Water Economy Bulgaria, Yugoslavia*** Regulation, water supply, hydropower,29 December 1959 Commission flood control, irrigation, protection of
water resourcesYugoslav-Hungarian frontier waters Yugoslav-Hungarian Water Economy Hungary, Yugoslavia*** Regulation and management8 August 1955 CommissionYugoslav-Italian frontier waters Yugoslav-Italian Water Economy Italy, Yugoslavia*** Water development and management30 March 1978 CommissionYugoslav-Romanian frontier waters Water Control Commission Romania, Yugoslavia*** Flood control, protection of water7 Aoril1955 resourcesRussian Federation-Hungarian Joint USSR-Hungarian Water Commission Hungary, USSR* Water managementfrontier waters9 June 1950
* former USSR** fonner Czechoslovakia*** fonner Yugoslavia(updated information will be provided as soon as possible)
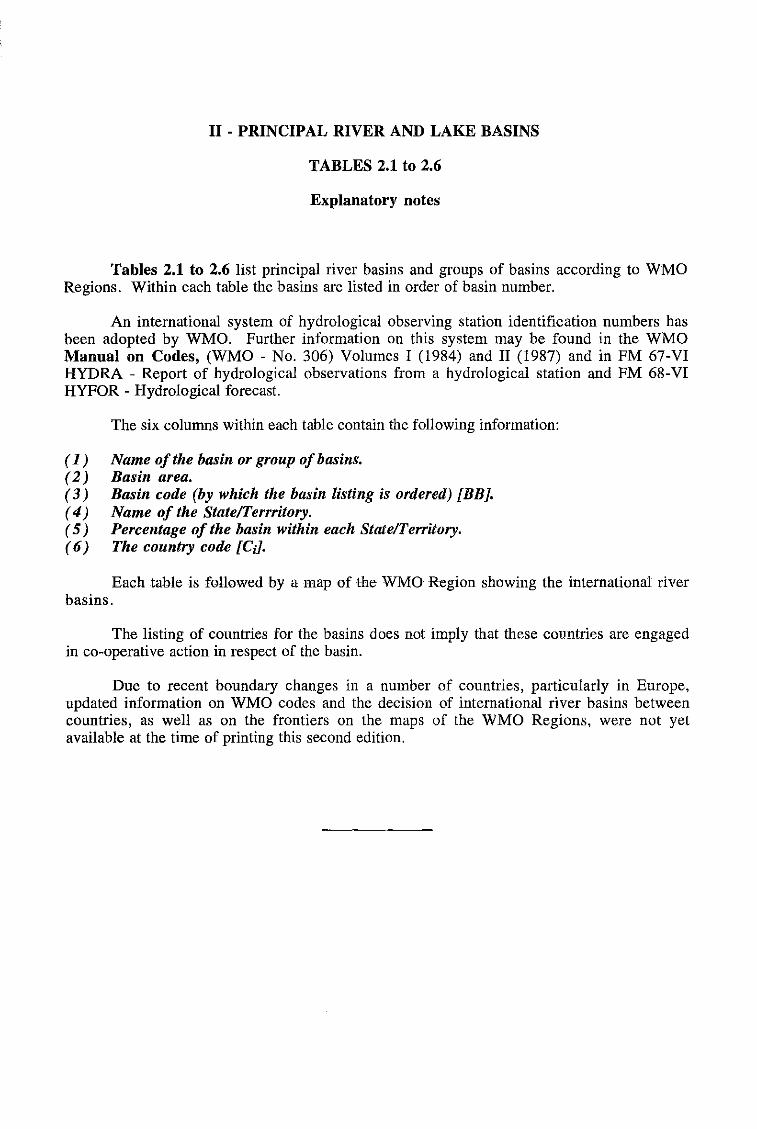
II - PRINCIPAL RIVER AND LAKE BASINS
TABLES 2.1 to 2.6
Explanatory notes
Tables 2.1 to 2.6 list principal river basins and groups of basins according to WMORegions. Within each table the basins are listed in order of basin number.
An international system of hydrological observing station identification numbers hasbeen adopted by WMO. Further information on this system may be found in the WMOManual on Codes, (WMO - No. 306) Volumes I (1984) and II (1987) and in FM 67-VIHYDRA - Report of hydrological observations from a hydrological station and FM 68-VIHYFOR - Hydrological forecast.
The six columns within each table contain the following information:
(1) Name of the basin or group ofbasins.(2) Basin area.(3) Basin code (by which the basin listing is ordered) [BBl.( 4 ) Name of the State/Terrritory.(5) Percentage of the basin within each State/Territory.(6) The country code [CJ.
Each table is followed by a map of the WMO Region showing the international riverbasins.
The listing of countries for the basins does not imply that these countries are engagedin co-operative action in respect of the basin.
Due to recent boundary changes in a number of countries, particularly in Europe,updated information on WMO codes and the decision of international river basins betweencountries, as well as on the frontiers on the maps of the WMO Regions, were not yetavailable at the time of printing this second edition.

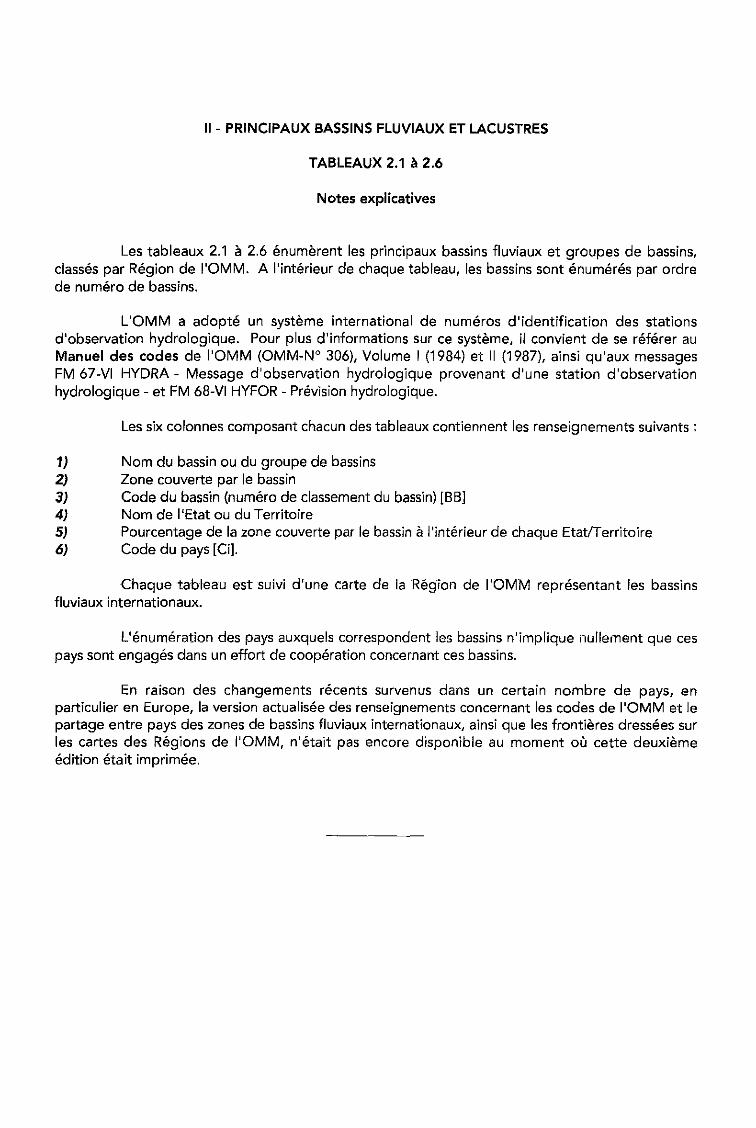
II - PRINCIPAUX BASSINS FLUVIAUX ET LACUSTRES
TABLEAUX 2.1 a 2.6
Notes explicatives
Les tableaux 2.1 11 2.6 enumerent les principaux bassins fluviaux et groupes de bassins,classes par Region de I'OMM. A I'interieur de chaque tableau, les bassins sont enumeres par ordrede numero de bassins.
L'OMM a adopte un systeme international de numeros d'identification des stationsd'observation hydrologique. Pour plus d'informations sur ce systeme, il convient de se referer auManuel des codes de I'OMM (OMM-N° 306), Volume I (1984) et II (1987), ainsi qu'aux messagesFM 67-VI HYDRA - Message d'observation hydrologique provenant d'une station d'observationhydrologique - et FM 68-VI HYFOR - Prevision hydrologique.
Les six colonnes composant chacun des tableaux contiennent les renseignements suivants :
1) Nom du bassin ou du groupe de bassins2) Zone couverte par Ie bassin3) Code du bassin (numero de c1assement du bassin) [BB]4) Nom de l'Etat ou du Territoire5) Pourcentage de la zone couverte par Ie bassin 11 I'interieur de chaque EtatlTerritoire6) Code du pays [Gi].
Chaque tableau est suivi d'une carte dela Region de I'OMM representant les bassinsfluviaux internationaux.
L'enumeration des pays auxquels correspondent les bassins n'implique nullernent que cespays sont engages dans un effort de cooperation concernant ces bassins.
En raison des changements recents survenus dans un certain nombre de pays, enparticulier en Europe, la version actualisee des renseignements concernant les codes de I'OMM et Iepartage entre pays des zones de bassins fluviaux internationaux, ainsi que les frontieres dressees surles cartes des Regions de I'OMM, n'etait pas encore disponible au moment OU cette deuxiemeedition etait imprimee.

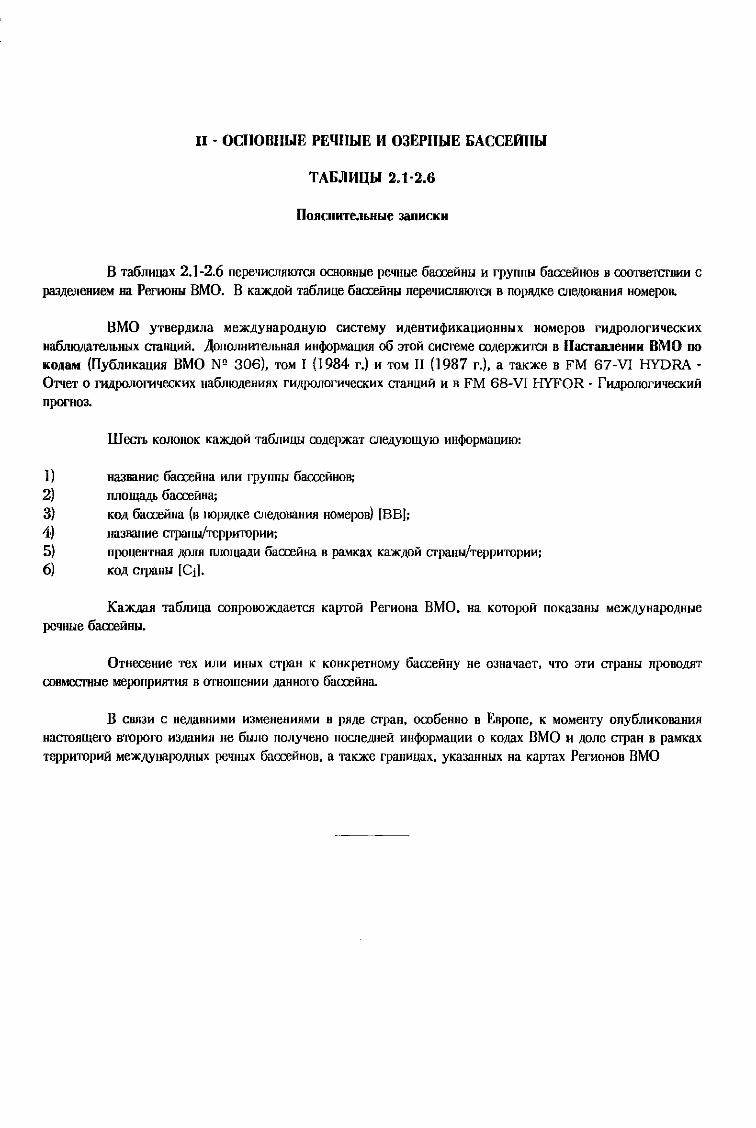
II - OCIIOBIIhlE PEQIlhlE H 03EPllhlE I>ACCERIIhI
TAI>JJHUhI 2.1-2.6
I10JlCHHTeJlLHLle JaJlHCKH
B Ta6J1HuaX 2.1 -2.6 nepeqHCllHIOTCII OCHOBHye peqnye 6aa::eiiHY H rpynny 6aa::eiiHOB B COOTBeTCI'BHH C
paJl\eJJeHHeM Ha PernOHY BMO. B K<UKI\oii Ta6J1Hue 6aa::eiiHY nepeqHCllHlOTCII B nopHI\Ke CIIt:l\OIIDlHB HOMepoB.
BMO YTBepl\HJla MeJKI\YHapOI\HYIO CHCTeMY Hl\eHTHq,HKaUHOHHYX HOMepoB rHl\pOJlOrHqeCKHX
Ha6J1lO11aTeJJLHYX craHUHii. .L\onOJlHHTeJJbHaH HHq,opMaUHH 06 3Toii CHCTeMe COl\epJKHTCII B lIaCT8llJleHHH BMO 110
KOJlaM (ny6J1HKauHB BMO N° 306). TOM I (1984 r.) H TOM II (1987 r.). a TaKJKe B FM 67-VI HYDRAOTqeT 0 rHllpoJlOrnqecKHX Ha6J1lOl\eHHBX rHl\poJlOrnqeCKHX CTaHUHii H B FM 68-VI HYFOR - fHl\poJlOmqecKHii
nporu03.
1lIeCTL KOJlOHOK KaJKl\oii Ta6J1HUY COl\epJKaT GJlel\YlOlI\Y1O HHq,opMaUHIO:
I) HaJHaHHe 6aa::eiiHa HJIH rpynny 6aa::eiiHOB;
2) nJlOll\BI\L 6acceiiHa;
3) KOI\ 6aa;eiiHa (H nOplI/\Ke GJlel\OIIDlHH HOMepoB) [BBI;4) HaJlIDIHe CTpaHbl/reppHTOpHH:
5) npoueHTHaH I\OJIH lUIOll\3J\H 6acceiiHa B paMlGlX K<UKI\oii CTpaubl/TeppHTOpHH;
6) KQl\ CTpaHY le;l.
KalK)l,aH m6J1Hua conpolJOJKI\aeTCH KapTOii PemoHa HMO. Ha KOTOpoii nOKa3aHY MelKl\YHapol\Hye
peqHye 6acceiiHY.
OTHeceHHe Tex HJlH HHYX CT\JaH K KOHKpeTHOMy 6acceiiHY He 03HaqaeT. qTO 3TH CTpaHY npolJOl\HT
COBMeCTHye MeponpHHTHH B OTHOllIeIlHH I\8HHOI'O OOcceiiHa.
B CHH3H C Hel\aBHHMH H3MeHeHHHMH B pHl\e CTpaH. 0c06eHHO B EBpone. K MOMeHTy ony6J1HKOHaHHH
HaCTOHll\el'O BTOPOI'O H31\811HH He 6WlO nOJlyqeHO nOGJ1el\Heii Hllq,opMaUHH 0 KOI\8X BMO H I\OJle CTpaH B paMKax
reppHTOpHii MelKl\YHapol\IIYX peqHYX 6acceiiHoB. a TaKJKe rpanHU8X. YKaJaHIlYX Ha Kapmx PemoHoB HMO

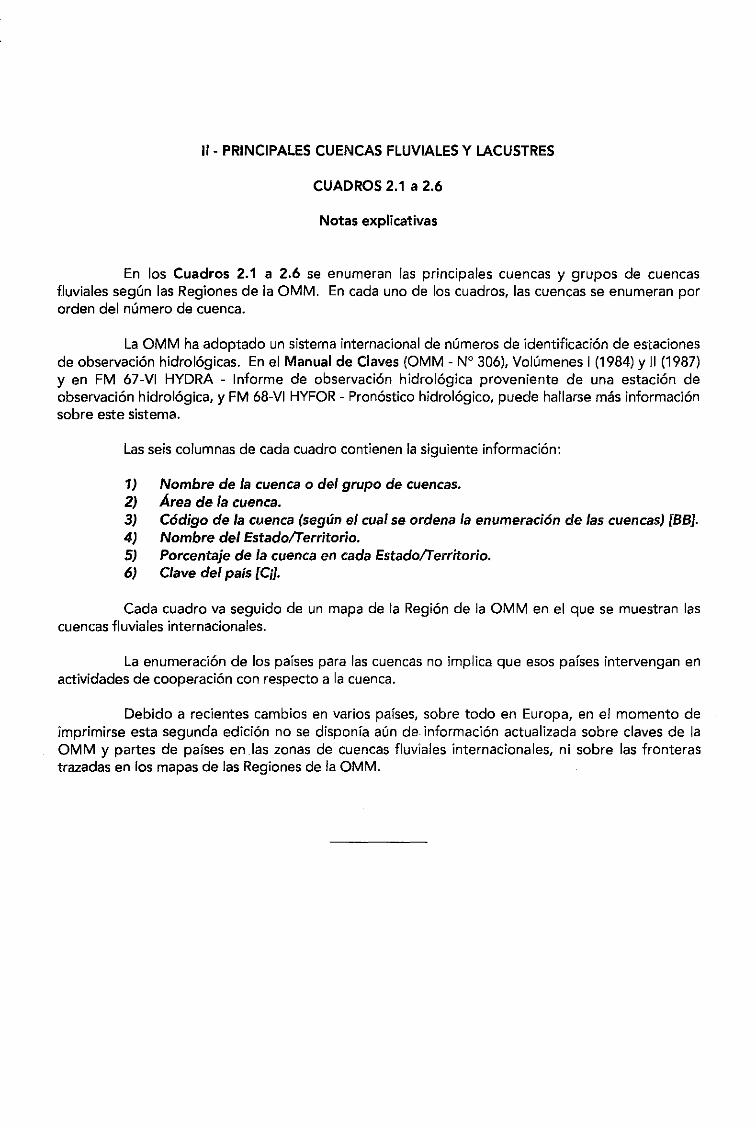
II - PRINCIPALES CUENCAS FLUVIALES Y LACUSTRES
CUADROS 2.1 a 2.6
Notas explicativas
En los Cuadros 2.1 a 2.6 se enumeran las principales cuencas y grupos de cuencasfluviales segun las Regiones de fa OMM. En cada uno de los cuadros, las cuencas se enumeran parorden del numero de cuenca.
La OMM ha adoptado un sistema internacional de numeros de identificaci6n de estacionesde observaci6n hidrol6gicas. En el Manual de Claves (OMM - N° 306), Volumenes f (1984) Y II (1987)Y en FM 67-VI HYDRA - Informe de abservaci6n hidrol6gica proveniente de una estaci6n deobservaci6n hidrol6gica, y FM 68-VI HYFOR - Pron6stico hidrol6gico, puede hallarse mas informaci6nsobre este sistema.
Las seis columnas de cada cuadro contienen la siguiente informaci6n:
1) Nombre de la cuenca 0 del grupo de cuencas.2) Area de la cuenca.3) C6digo de la cuenca (segun el cual se ordena la enumeraci6n de las cuencas) [BBJ.4) Nombre del EstadolTerritorio.5) Porcentaje de la cuenca en cada EstadolTerritorio.6) Clave del palS [CiJ.
Cada cuadro va seguido de un mapa de la Regi6n de la OMM en el que se muestran lascuencas fluviales internacionales.
La enumeraci6n de los paTses para las cuencas no implica que esos pafses intervengan enactividades de cooperacion con respecto a la cuenca.
Debido a recientes cambios en varios pafses, sobre todo en Europa, en el momento deimprimirse esta segunda edici6n no se dispanfa aun de informaci6n actualizada sobre c1aves de laOMM y partes de pafses en las zonas de cuencas fluviales internacionales, ni sobre las fronterastrazadas en los mapas de las Regiones de la OMM.

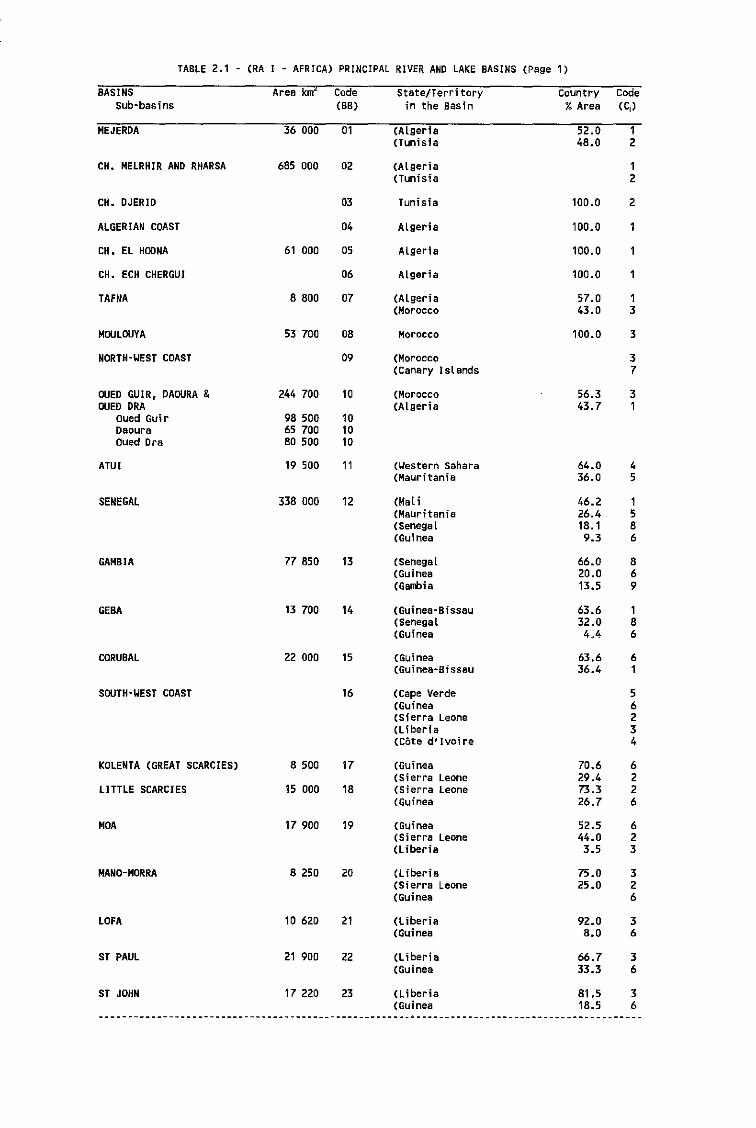
TABLE 2.1 - (RA I - AFRICA) PRINCIPAL RIVER AND LAKE BASINS (Page 1)
BASINS Area kmz Code State/Territory country CodeSub-basins (BB) in the Basin %Area (C,)
MEJEROA 36 000 01 (ALgeria 52.0 1(Tunisia 4B.0 2
CH. MELRHIR AND RHARSA 6B5 000 02 (Algeria 1(Tunisia 2
CH. OJERIO 03 Tunisia 100.0 2
ALGERIAN COAST 04 Algeria 100.0
CH. EL HDONA 61 000 05 ALgeria 100.0
CH. ECH CHERGUI 06 Algeria 100.0
TAFNA 8 800 07 (Algeria 57.0 1(Morocco 43.0 3
MOULOUYA 53 700 08 Morocco 100.0 3
NORTH-WEST COAST 09 (Morocco 3(Canary Islands 7
OUEO GUIR, OAOURA & 244 700 10 (Morocco 56.3 3OUEO ORA (ALgeria 43.7 1
oued Gui r 98 500 10Daoura 65 700 10Oued Ora 80 500 10
ATUI 19 500 11 (Western sahara 64.0 4(Mauritania 36.0 5
SENEGAL 338 000 12 (Mal i 46.2 1(Mauritania 26.4 5(Senegal 18.1 8(Guinea 9.3 6
GAMBIA 77 850 13 (SenegaL 66.0 8(Guinea 20.0 6(GaRbia 13.5 9
GEBA 13 700 14 (Guinea-Bissau 63.6 1(Senegal 32.0 8(Guinea 4.4 6
CORUBAL 22 000 15 (Guinea 63.6 6(Guinea-Bissau 36.4 1
SOUTH-WEST COAST 16 (Cape Verde 5(Guinea 6(Sierra Leone 2(liberia 3(Cote d'lvoi re 4
KOLENTA (GREAT SCARCIES) 8 500 17 (Guinea 70.6 6(Sierra Leone 29.4 2
LITTLE SCARCIES 15 000 18 (Sierra Leone 73.3 2(Guinea 26.7 6
MOA 17 900 19 (Guinea 52.5 6(Sierra Leone 44.0 2(Liberia 3.5 3
MANO-MORRA 8 250 20 (Liberia 75.0 3(Sferra Leone 25.0 2(Guinea 6
LOfA 10 620 21 (Liberia 92.0 3(Guinea 8.0 6
ST PAUL 21 900 22 (liberia 66.7 3(Guinea 33.3 6
ST JOHN 17 220 23 (Liberia 81.5 3(Guinea 18.5 6
----------------------------------------------------,~ .------------._--------------------------
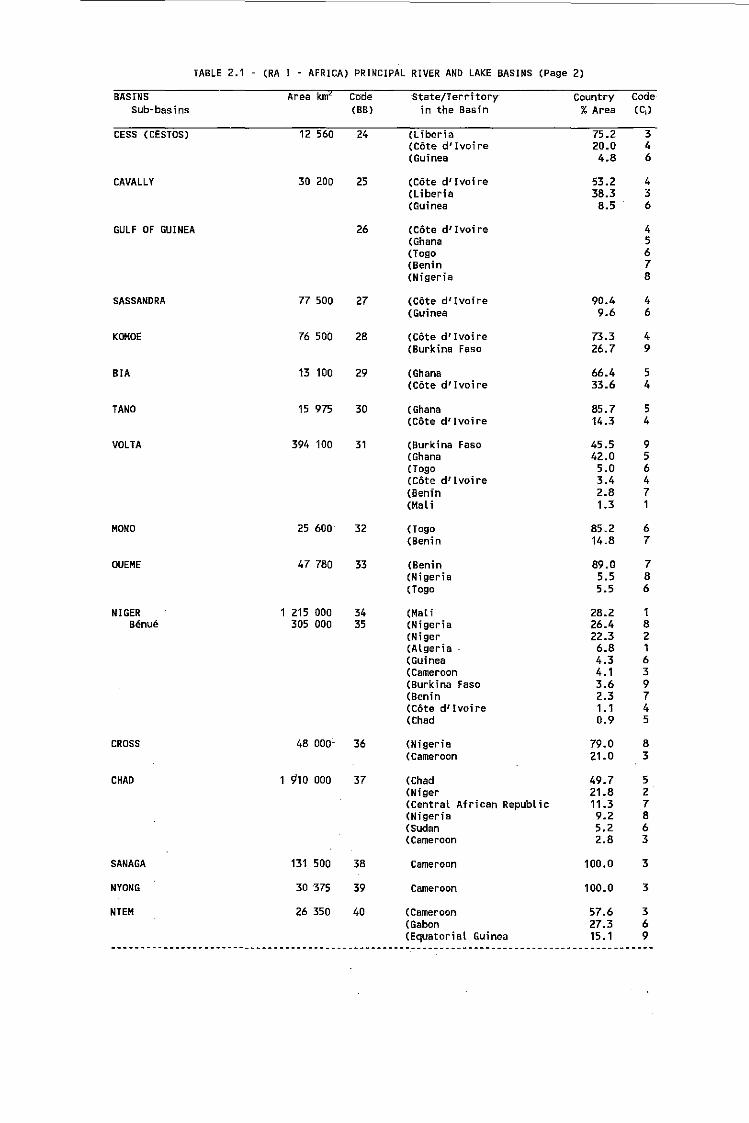
TABLE 2.1 - (RA I - AFRICA) PRINCIPAL RIVER AND LAKE BASINS (Page 2)
BASINS AreakmL Co-de State-/Terri-tory Country CodeSub-basins (BB) in the Basin %Area (Gl )
CESS (CESTOS) 12 560 24 (liberia 75.2 3(Cote d'lvoire 20.0 4(Guinea 4.8 6
CAVALLY 30 200 25 (Cote d'Ivoire 53.2 4(Liberia 38.3 3(Guinea 8.5 6
GULF OF GUINEA 26 (Cote d' Ivai re 4(Ghana 5(Togo 6(Benin 7(Nigeria 8
SASSANDRA 77 500 27 (Cote d' Ivai re 90.4 4(Guinea 9.6 6
KOMOE 76 500 28 (Cote d' Ivai re 73.3 4(Burkina Faso 26.7 9
81A 13 100 29 (Ghana 66.4 5(Cote d t Ivai re 33.6 4
TANO 15 975 30 (Ghana 85.7 5(Cote d' Ivai re 14.3 4
VOLTA 394 100 31 (Burkina Faso 45.5 9(Ghana 42.0 5(Togo 5.0 6(Cote d'lvoire 3.4 4(Benin 2.8 7(Mali 1.3 1
MONO 25 600 32 (Togo 85.2 6(Benin 14.8 7
OUEME 47 780 33 (Benin 89.0 7(Nigeria 5.5 8(Togo 5.5 6
NIGER 215 000 34 (Mali 28.2 1Benue 305 000 35 (Nigeria 26.4 8
(Niger 22.3 2(Algeria· 6.8 1(Guinea 4.3 6(Cameroon 4.1 3(Burkina Faso 3.6 9(Benin 2.3 7(Cote d'lvoire 1.1 4(Chad 0.9 5
CROSS 48 000- 36 (Nigeria 79.0 8(Cameroon 21.0 3
CHAO 910 000 37 (Chad 49.7 5(Niger 21.8 2(Central African Republic 11.3 7(Nigeria 9.2 8(Sudan 5.2 6(Cameroon 2.8 3
SANAGA 131 500 38 Cameroon 100.0 3
NYONG 30 -375 39 Cameroon 100.0 3
NTEM 26 350 40 (Cameroon 57.6 3(Gabon 27.3 6(Equatorial Guinea 15.1 9
----~------------------------------------------------- ----------------------------------------
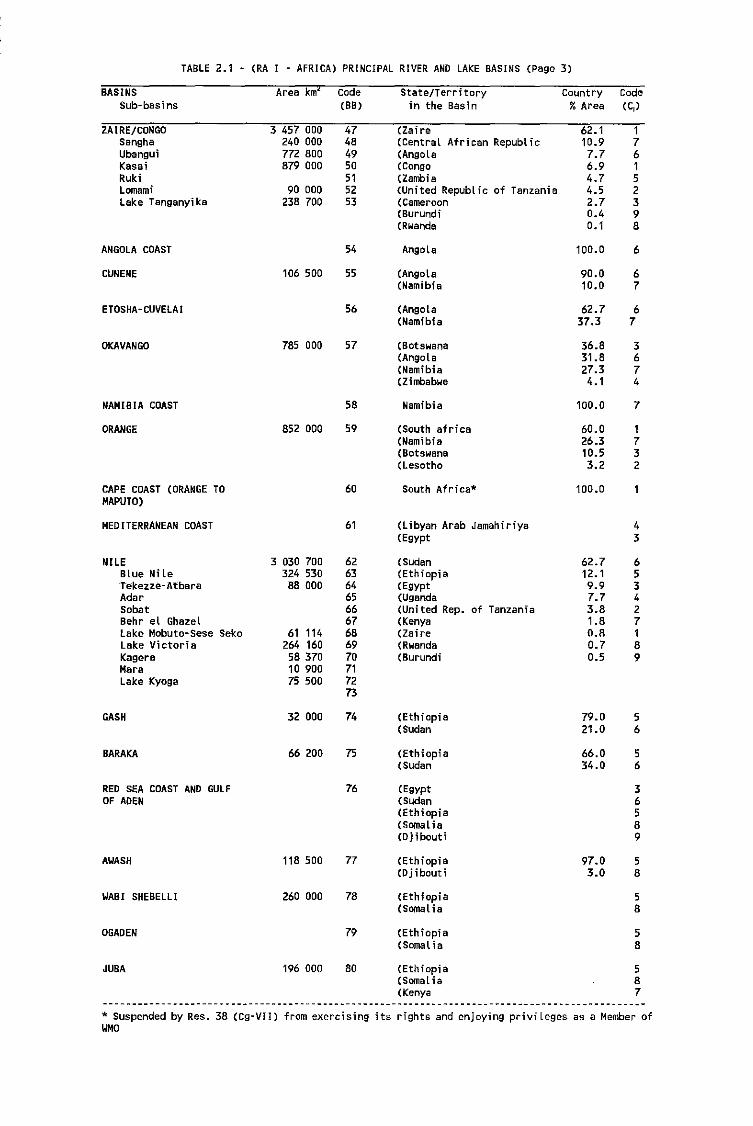
TABLE 2.1 - (RA I - AFRICA) PRINCIPAL RIVER AND LAKE BASINS (Page 3)
BASINSSub-basins
ZAIRE/CONGOSanghaUbangu;KasaiRukiLomamilake Tanganyika
ANGOLA COAST
CUNENE
ETOSHA-CUVELAI
OKAVAHGO
NAMIBIA COAST
ORANGE
CAPE COAST (ORANGE TOMAPUTO)
MEDITERRANEAN COAST
NILEBlue Nileiekezze-AtbBraAdarSobatBehr el GhazeLlake Mobuto-Sese SekoLake Victor; aKageraMaraLake Kyoge
GASH
BARAKA
RED SEA COAST AND GULFOF ADEN
AWASH
WABI SHEBELLI
OGADEN
JUBA
Area km2
3 457 000240 000772 800879 000
90 000238 700
106 500
785 000
852 000
3 030 700324 53088 000
61 114264 16058 37010 90075 500
32 000
66 200
118 500
260 000
196 000
code(BB)
47484950515253
54
55
56
57
58
59
60
61
626364656667686970717273
74
75
76
77
78
79
80
State/Terri toryin the Basin
(Zaire(Central African Republic(Angola(Congo(2amb; a(United Republic of Tanzania(Cameroon(Burundi(Rwanda
Angola
(Angola(Namibia
(Angola(Namibia
(Botswana(Angola(Namibia(Zimbabwe
Namibia
(South africa(Namibia(Botswana(Lesotho
South Africa*
(Libyan Arab Jamahiriya(Egypt
(Sudan(Ethiopia(Egypt(Uganda(United Rep. of Tanzania(Kenya(Zaire(Rwanda(Burundi
(Ethiopia(Sudan
(Ethiopia(Sudan
(Egypt(Sudan(Ethiopia(Somal ia(Djibouti
(Ethiopia(Djibouti
(Ethiopia(Somal ia
(Ethiopia(Somalia
(Ethiopia(Somal ia(Kenya
Country% Area
62.110.97.76.94.74.52.70_40.1
100.0
90.010.0
62.737.3
36_831.827.34.1
100.0
60.026.310_53.2
100.0
62.712.19.97.73.81.80.80.70.5
79.021.0
66.034.0
97.03.0
176152398
6
67
67
3674
7
1732
43
653427189
56
56
36589
58
58
58
587
* Suspended by Res. 38 (eg-VII) from exercising its rights and enjoying privileges as a Member ofWMO
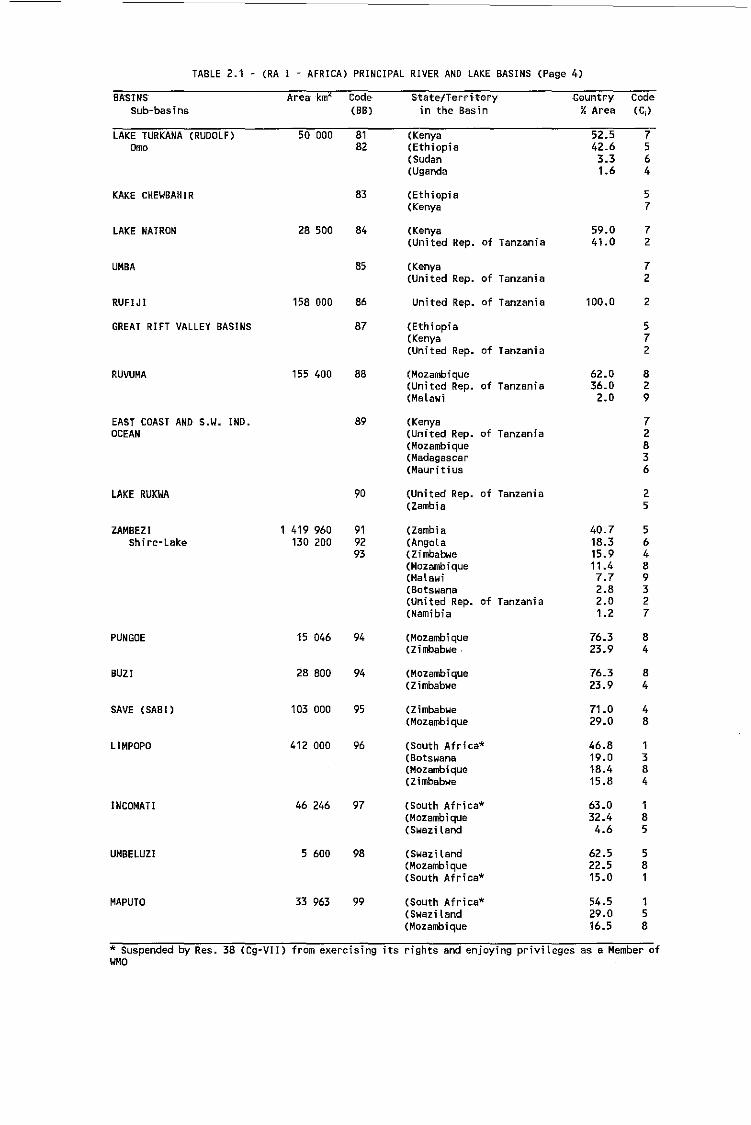
TABLE 2.1 . (RA I . AFRICA) PRINCIPAL RIVER AND LAKE BASINS (PaBe 4)
BASINS Area-kml Code State/Terri-tory Country CodeSub-basins (BB) in the Basin %Area eel)
LAKE TURKANA (RUDOLF) 50 DOD B1 (Kenya 52.5 7Orno 82 (Ethiopia 42.6 5
(Sudan 3.3 6(Uganda 1.6 4
KAKE CHEWBAHIR 83 (Ethiopia 5(Kenya 7
LAKE NATRON 28 500 84 (Kenya 59.0 7(United Rep. of lanzan; a 41.0 2
UMBA 85 (Kenya 7(United Rep. of Tanzania 2
RUFIJI 158 DOD 86 United Rep. of lanzan; a 100.0 2
GREAT RIFT VALLEY BASINS 87 (Ethiopia 5(Kenya 7(United Rep. of Tanzan; a 2
RUVUMA 155 400 88 (Mozambique 62.0 8(United Rep. of Tanzania 36.0 2(Malawi 2.0 9
EAST COAST AND s.w. IND. 89 (Kenya 7OCEAN (United Rep. of Tanzania 2
(Mozambique 8(Madagascar 3(Mauritius 6
LAKE RUKWA 90 (United Rep. of Tanzania 2(Zambia 5
ZAMBEZI 419 960 91 (Zambia 40.7 5Shire-Lake 130 200 92 (Angola 18.3 6
93 (Zimbabwe 15.9 4(Mozamb; que 11.4 8(Malawi 7.7 9(Botswana 2.8 3(United Rep. of Tanzania 2.0 2(Namibia 1.2 7
PUNGOE 15 046 94 (Mozambique 76.3 8(Zimbabwe. 23.9 4
BUZI 28 800 94 (Mozambique 76.3 8(Zimbabwe 23.9 4
SAVE (SABI) 103 000 95 (Zimbabwe 71.0 4(Mozambique 29.0 8
LIMPOPO 412 DOD 96 (South Afr; ca* 46.8 1(Botswana 19.0 3(Mozambique 18.4 8(Zimbabwe 15.8 4
INCOMATI 46 246 97 (South Africa* 63.0 1(Mozambi que 32.4 8(Swazi land 4.6 5
UMBELUZI 5 600 98 (Swaziland 62.5 5(Mozambique 22.5 8(South Africa* 15.0 1
MAPUTO 33 963 99 (South Africa* 54.5 1(Swaziland 29.0 5(Mozambique 16.5 8
* Suspended by Res. 38 (eg-VII) from exercising its rights and enjoying privileges as a Member ofWHO
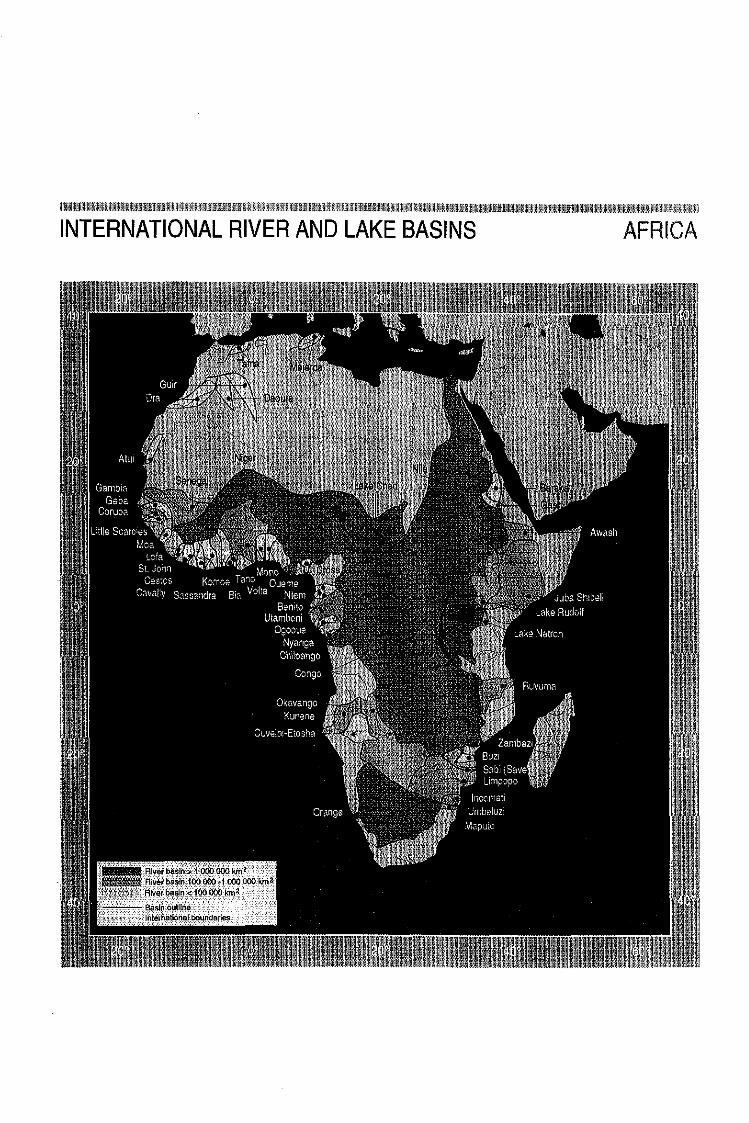
INTERNATIONAL RIVER AND LAKE BASINS AFRICA

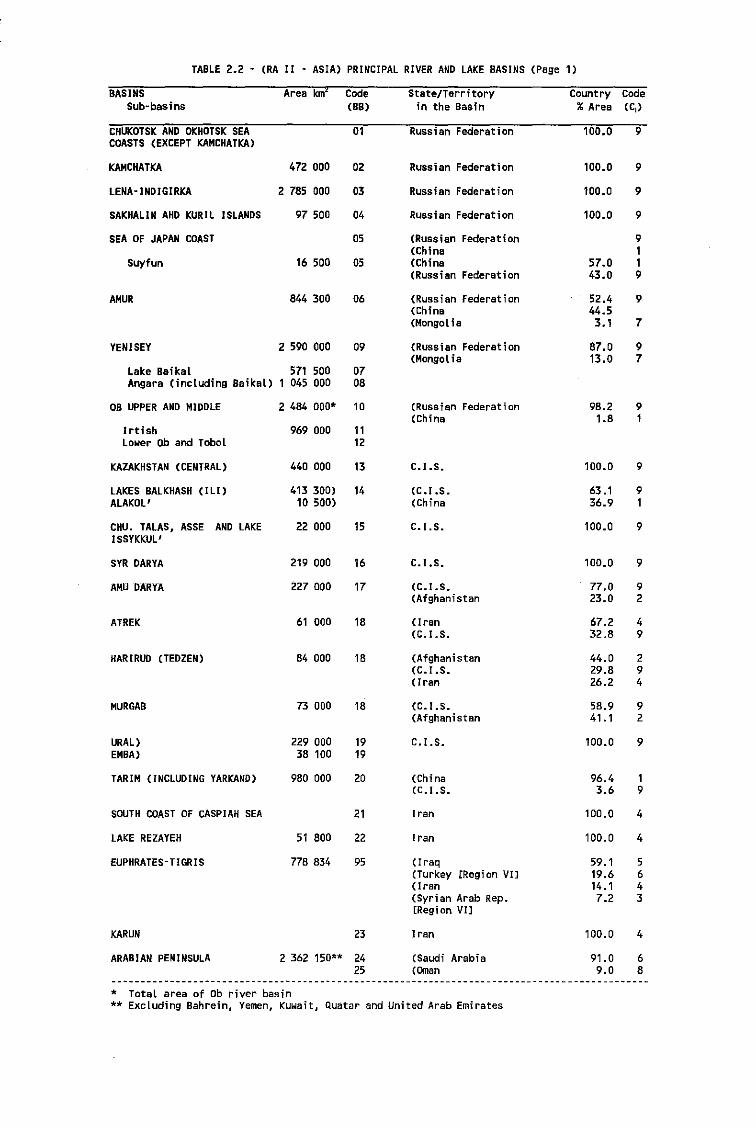
TABLE 2.2 - (RA II - ASIA) PRINCIPAL RIVER AND LAKE BASINS (Page 1)
BASINSSub~basins
Area krn2 Code(BB)
State/Territoryin the Basin
Country Code% Area eel)
Lake Baikal 571 500 07Angara (including Baikal) 1 045 ODD 08
CHUKOTSK AND OKHOTSK SEACOASTS (EXCEPT KAMCHATKA)
KAMCHATKA 472 ODD
LENA-INOIGIRKA 2 785 ODD
SAKHALIN AHO KURIL ISLANDS 97 SOD
SEA OF JAPAN COAST
Suyfun 16 500
AMUR 844 300
YENISEY 2 590 000
01
02
03
04
05
05
06
09
Russian Federation
Russian Federation
Russian Federation
Russian Federation
(Russian Federation(China(China(Russian Federation
(Russian Federation(China(MongoL ia
(Russian Federation(Mongol ia
100.0
100.0
100.0
100.0
57.043.0
52.444.53.1
87.013.0
9
9
9
9
9119
9
7
97
2 484 ODD' 10OB UPPER AND MIDDLE
IrtishLower Ob and rebaL
969 000 1112
(Russian Federation(China
9B.21.8
91
KAZAKHSTAN (CENTRAL)
LAKES BALKMASH (ILl)ALAKOL'
CHU. TALAS, ASSE AND LAKEISSYKKUL'
SYR OARYA
AMU OARYA
ATREK
HARIRUO (TEOZEN)
MURGAB
URAL)EMBA)
440 000 13
413 300) 1410 500)
22 000 15
219 000 16
227 ODD 17
61 ODD lB
B4 000 18
73 000 18
229 000 1938 100 19
C. I .S.
(C.I.S.(China
C. I.S.
C. I.S.
(C.I.S.(Afghanistan
(Iran(C. I.S.
(Afghanistan(C. I .S.( Iran
(C.I.S.(Afghanistan
C.I.S.
100.0
63.136.9
100.0
100.0
77.023.0
67.232.8
44.029.826.2
58.941.1
100.0
9
91
9
9
92
49
294
92
9
9BO 000 20TARIM (INCLUDING YARKANO)
SOUTH COAST OF CASPIAH SEA
LAKE REZAYEH
EUPHRATES-TIGRIS
51 800
77B 834
21
22
95
(China(C.I.S.
Iran
Iran
(Iraq(Turkey [Region VI](Iran(Syrian Arab Rep.[Region VI]
96.43.6
100.0
100.0
59.119.614.17.2
19
4
4
5643
KARUN
ARABIAN PENINSULA
23
2 362 150" 2425
Iran
(Saudi Arabia(Oman
100.0
91.09.0
4
68
* Total area of Db river basin** ExcLuding Bahrein, Yemen, Kuwait, Quater and United Arab Emirates
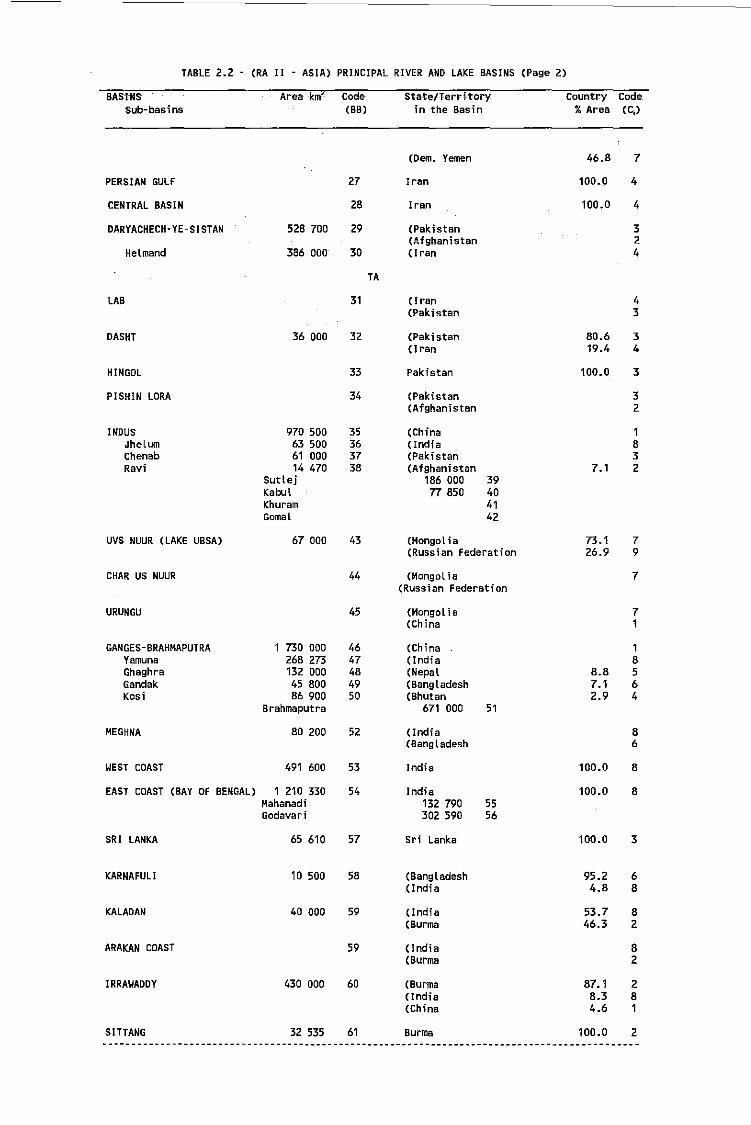
TABLE 2.2 - (RA II - ASIA) PRINCIPAL RIVER AND LAKE BASINS (Page 2)
BASINSSub-basins
Areakm02. Code(BB)
State/Terri-toryin the Basin
Country Code.%Area (Cj )
(Oem. Yemen 46.8 7
PERSIAN GULF
CENTRAL BASIN
DARYACHECH-YE-SISTAN
Helmand
LAB
52B 700
386 000
27
28
29
30
31
TA
Iran
Iran
(Pakistan(Afghanistan(Iran
(Iran(Pakistan
100.0 4
100.0 4
324
43
DASHT
HINGOL
PISHIN LORA
INDUSJhelumChenabRavi
UVS NUUR (LAKE UBSA)
CHAR US NUUR
URUNGU
GANGES-BRAHMAPUTRAYamunaGhaghraGandakKosi
MEGHNA
WEST COAST
36 000
970 50063 50061 00014 470
SutlejKabulKhuramGamel
67 000
730 000268 273132 00045 80086 900
Brahmaputra
80 200
491 600
32
33
34
35363738
43
44
45
4647484950
52
53
(Pakistan(Iran
Pakistan
(Pakistan(Afghanistan
(China(India(Pakistan(Afghanistan
186 000 3977 850 40
4142
(Mongol ia(Russian Federation
(Mongol ia(Russian Federation
(MongoL ia(China
(China(India(Nepal(Bangladesh(Bhutan
671 000 51
(India(Bangladesh
India
80.619.4
100.0
7.1
73.126.9
8.87.12.9
100.0
34
3
32
1832
79
7
71
18564
86
8
EAST COAST (8AY OF BENGAL) 1 210 330MahanadiGodavari
54 India132 790302 590
5556
100.0 8
SRI LANKA
KARNAFULI
KALADAN
ARAKAN COAST
IRRAWADDY
SITTANG
65 610
10 500
40 000
430 000
32 535
57
58
59
59
60
61
Sri Lanka
(Bangladesh(India
(lneI; a(Burma
(India(Burma
(Burma(India(China
Burma
100.0
95.24.8
53.746.3
87.18.34.6
100.0
3
68
82
82
281
2
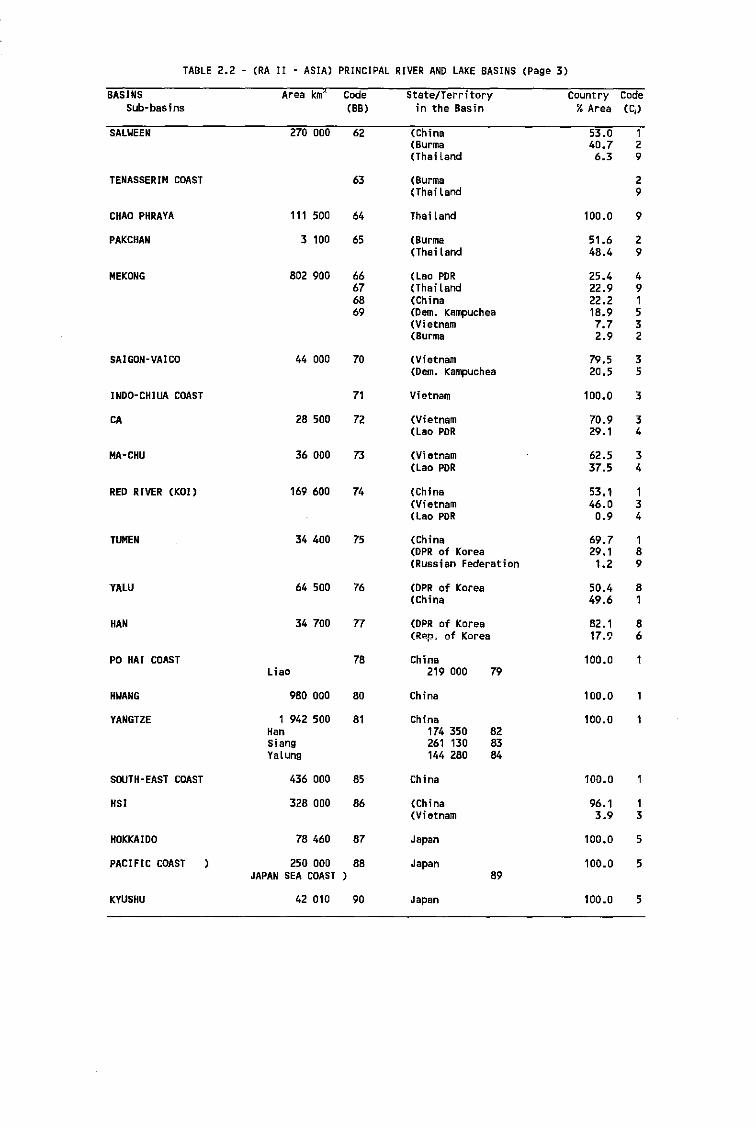
TABLE 2.2 - (RA II - ASIA) PRINCIPAL RIVER AND LAKE BASINS (Page 3)
BASINS Area km2 Code State/Territory Country CodeSub-basins (BB) in the Basin % Area (C,)
SALWEEN 270 DDO 62 (China 53.0 1(Burma 40.7 2(Thai land 6.3 9
TENASSERIM COAST 63 (Burma 2(Thailand 9
CHAD PHRAYA 111 500 64 Tha; land 100.0 9
PAKCHAN 3 100 65 (Burma 51.6 2(Tha; land 4B.4 9
MEKONG B02 900 66 (Lao POR 25.4 467 (Tha; land 22.9 968 (China 22.2 169 (Oem. Ka~chea 18.9 5
(Vietnam 7.7 3(Burma 2.9 2
SAIGON-VAICO 44 000 70 (Vietnam 79.5 3(Oem. KBfIlJUchea 20.5 5
INDO-CHIUA COAST 71 Vietnam 100.0 3
CA 28 500 72 (Vietnam 70.9 3(Lao PDR 29.1 4
MA-CHU 36 000 73 (Vietnam 62.5 3(Lao POR 37.5 4
RED RIVER (KOf) 169 600 74 (China 53.1 1(Vietnam 46.0 3(lao PDR 0.9 4
TUMEN 34 400 75 (China 69.7 1(DPR of Korea 29.1 8(Russian Federation 1.2 9
YALU 64 500 76 COPR of Korea 50.4 8(China 49.6 1
HAN 34700 77 (OPR of Korea 82.1 8(Rep. of Korea 17.9 6
PO HAl COAST 78 China 100.0Liea 219 000 79
HWANG 980 000 80 China 100.0
YANGTZE 1 942 500 81 China 100.0Han 174 350 82Siang 261 130 83YaLung 144 280 84
SOUTH-EAST COAST 436 000 85 China 100.0
HSI 328 000 86 (China 96.1 1(Vietnam 3.9 3
HOKKAIOO 78 460 87 Japan 100.0 5
PACIFIC COAST 250 000 88 Japan 100.0 5JAPAN SEA COAST ) 89
KYUSHU 42 010 90 Japan 100.0 5

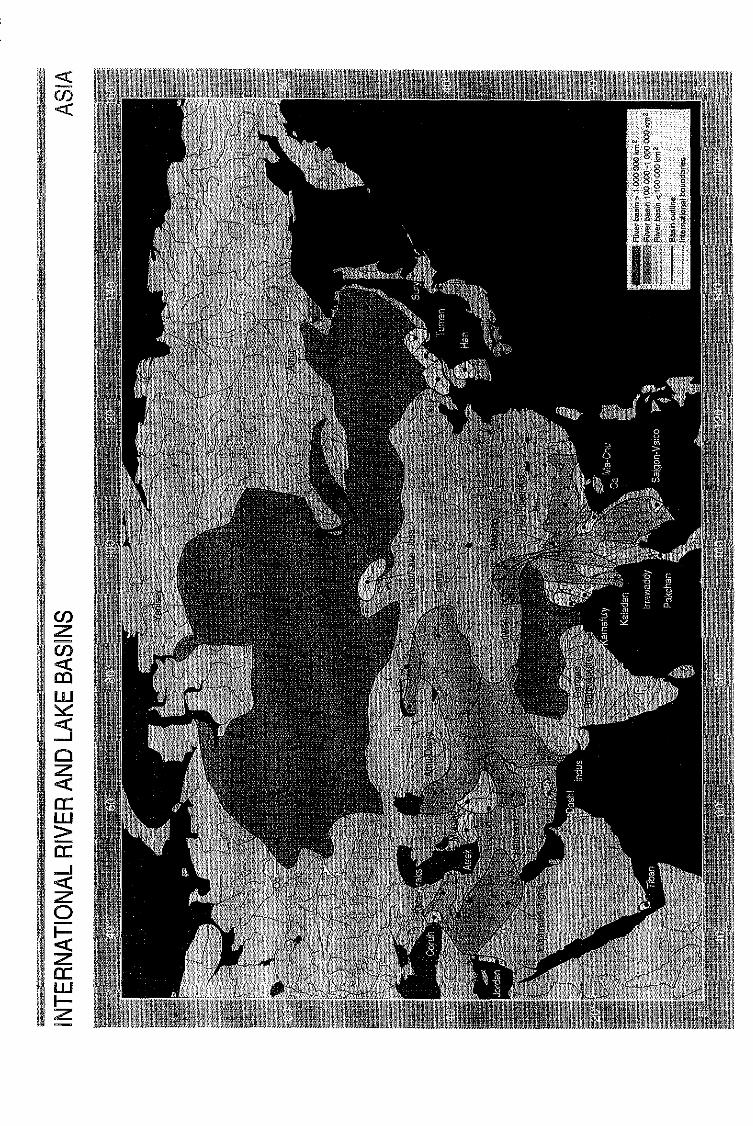
, .i'
:,

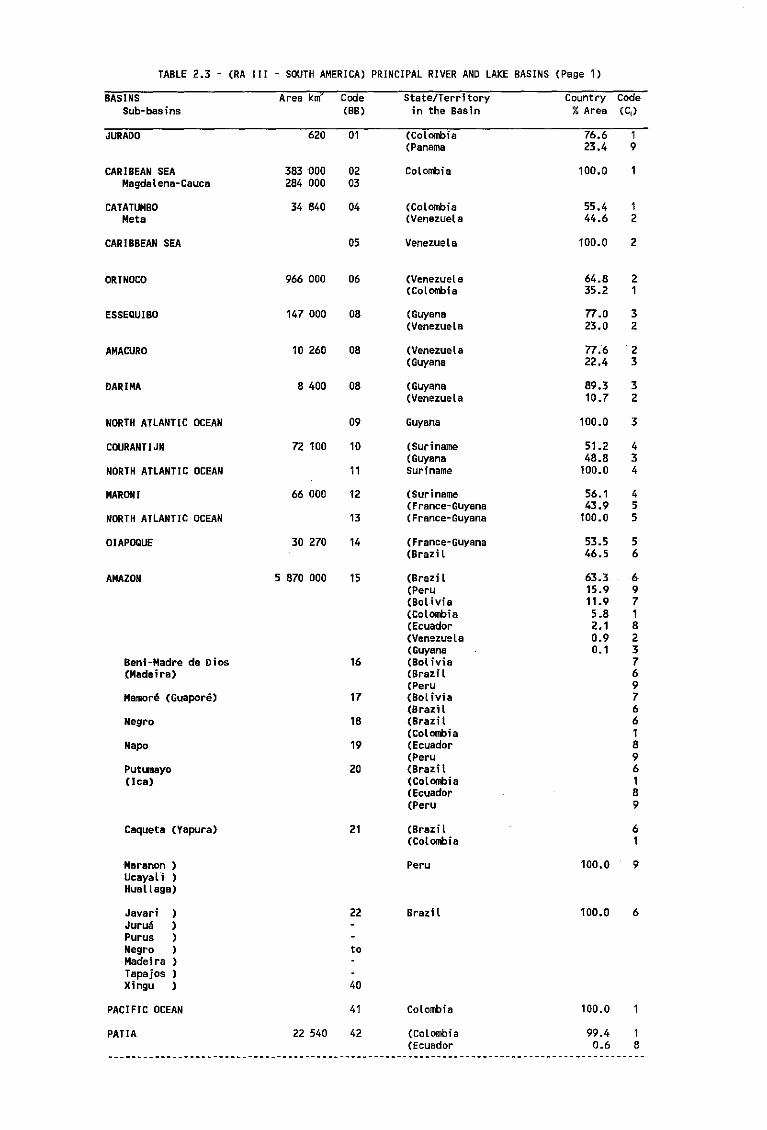
TABLE 2.3 - (RA I II - SOUTH AMERICA) PRINCIPAL RIVER AND LAKE BASINS (Page 1)
BASINS Area kmz Code State/Territory Country CodeSub-basins (BB) in the Basin %Area eel)
JURADO 620 01 (CoLoobia 76.6 1(Panama 23.4 9
CAR !BEAN SEA 383 1)00 02 Cotanilla 100.0Magdalena-Cauca 284 000 03
CATATUMBO 34 840 04 (CoLonbi8 55.4 1Meta (Venezuela 44.6 2
CARIBBEAN SEA 05 Venezuela 100.0 2
ORINOCO 966 000 06 (Venezuela 64.8 2(Colorrbia 35.2 1
ESSEQUIBO 147 000 08 (Guyana 77.0 3(VenezueLa 23.0 2
AMACURO 10 260 08 (VenezueLa 77.6 2(Guyana 22.4 3
DARIMA 8 400 08 (Guyana 89.3 3(VenezueLa 10.7 2
NORTH ATLANTIC OCEAN 09 Guyana 100.0 3
COURANT! JN 72 100 10 (Suriname 51.2 4(Guyana 48.8 3
NORTH ATLANTIC OCEAN 11 Suriname 100.0 4
MAllON I 66 000 12 (Suriname 56.1 4(France- Guyana 43.9 5
NORTH ATLANTIC OCEAN 13 (France-Guyana 100.0 5
OJAPOQUE 30 270 14 (France-Guyana 53.5 5(Brazil 46.5 6
AMAZON 5 870 000 15 (Brazi 1 63.3 6(Peru 15.9 9(BoL ivie 11.9 7(Coloobia 5.8 1(Ecuador 2.1 8(Venezuela 0.9 2(Guyana 0.1 3
Beni-Madre de Dios 16 (Bolivia 7(Madeira) (Brazil 6
(Peru 9Mamore (Guapore) 17 (Bolivia 7
(Brazil 6Negro 18 (Brazil 6
(Colombia 1Napa 19 (Ecuador 8
(Peru 9Putunayo 20 (Brazil 6(lea) (Colombia 1
(Ecuador 8(Peru 9
Caqueta (Vapura) 21 (Brazi 1 6(Colonbia 1
Maranon Peru 100.0 9Ucayal-i )HuaLlaga)
Javed ) 22 Brazi 1 100.0 6Jurua )
Purus )
Negro ) toMadeira )Tapajos )Xingu ) 40
PAC! FIC OCEAN 41 Colombia 100.0
PAT!A 22 540 42 (CoLombia 99.4 1(Ecuador 0.6 8
---------------------------------------------------------------------------------------------
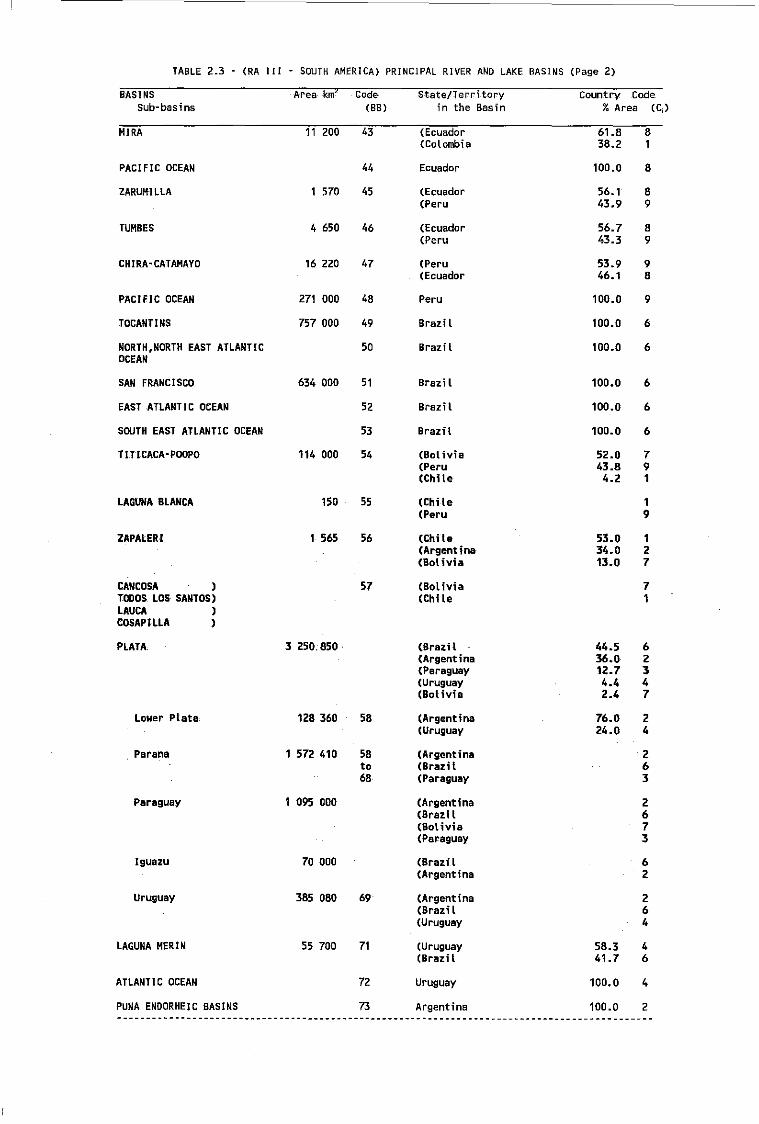
TABLE 2.3 - (RA II I - SOUTH AMERICA) PRINCIPAL RIVER AND LAKE BASINS (Page 2)
BASINS -Ar-ea- km2 Code State/Territory Country CodeSub-basins (BB) in the Basin %Area (C;)
MIRA 11 200 43 (Ecuador 61.8 8(Colombia 38.2 1
PACIFIC OCEAN 44 Ecuador 100.0 8
2ARUMILLA 1 570 45 (Ecuador 56.1 8(Peru 43.9 9
TUMBES 4 650 46 (Ecuador 56.7 8(Peru 43.3 9
CHIRA-CATAMAYO 16 220 47 (Peru 53.9 9(Ecuador 46.1 8
PACIFIC OCEAN 271 000 48 Peru 100.0 9
TOCANTINS 757 000 49 Brazil 100.0 6
NORTH,NORTH EAST ATLANTIC 50 Brazi l 100.0 6OCEAN
SAN FRANCISCO 634 000 51 Brazil 100.0 6
EAST ATLANTIC OcEAN 52 Brazil 100.0 6
SOUTH EAST ATLANTIC OCEAN 53 Brazil 100.0 6
TlTICACA'POOPO 114 000 54 (Bol ivi a 52.0 7(Peru 43.8 9(Chile 4.2 1
LAGUNA BLANCA 150 55 (Chile 1(Peru 9
ZAPALERI 1~ 565 56 (Chile 53.0 1(Argent ina- 34.0 2(Bol iviB 13.0 7
CANCOSA ) 57 (Bolivia 7TODOS LOS SANTOS) (Chile 1LAUCA )COSAPILLA )
PLATA, 3 250.850· (Brazil 44.5 6(Argentina 36.0 2(Paraguay 12.7 3(Uruguay 4.4 4(Bolivia 2.4 7
Lower Plata 128 360 58 (Argentina 76.0 2(Uruguay 24.0 4
Parana 1 572 410 58 (Argentina 2to (Brazil 668 (Paraguay 3
Paraguay 1 095 000 (Argentina 2(Brazi l 6(Bolivia 7(Paraguay 3
Iguazu 70 000 (BrazU 6(Argentina 2
Uruguay 385 080 69 (Argentina 2(Brazil 6(Uruguay 4
LAGUNA MERIN 55 700 71 (Uruguay 58.3 4(Brazil 41.7 6
ATLANTIC OCEAN 72 Uruguay 100.0 4
PUNA ENOORHEIC BASiNS 73 Argentina 100.0 2--------------------------------------~--------------------------._--~-----------------------
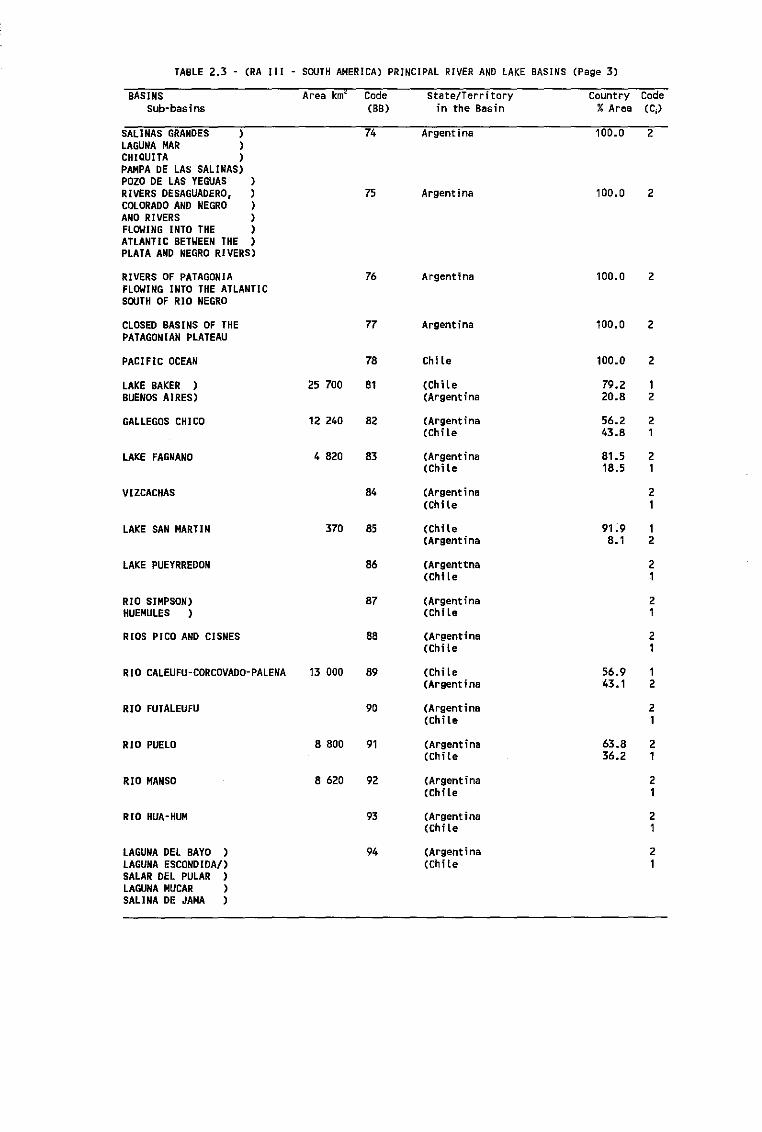
TABLE 2.3 - (RA III - SOUTH AMERICA) PRINCIPAL RIVER AND LAKE BASINS (Page 3)
BASINS Area km2 Code State/Territory Country CodeSub-basins (BB) in the Basin % Area (C;)
SALl NAS GRANDES ) 74 Argentina 100.0 2LAGUNA MAR )CHIQUITA )
PAMPA DE LAS SALINAS)POZO DE LAS YEGUASRIVERS DESAGUADERO, 75 Argentina 100.0 2COLORADO AND NEGROANO RIVERSFLOWING INTO THEATLANTIC BETWEEN THE )PLATA AND NEGRO RIVERS)
RIVERS OF PATAGONIA 76 Argentlna 100.0 2FLOWING INTO THE ATLANTICSOUTH OF RIO NEGRO
CLOSED BASINS OF THE 77 Argentina 100.0 2PATAGONIAN PLATEAU
PACIFIC OCEAN 78 Chile 100.0 2
LAKE BAKER ) 25 700 81 (Chile 79.2 1BUENOS AIRES) (Argentina 20.8 2
GALLEGOS CHICO 12 240 82 (Argentina 56.2 2(Chi Ie 43.8 1
LAKE FAGNANO 4 820 83 (Argentina 81.5 2(Chile 18.5 1
VIZCACNAS 84 (Argentina 2(Chile 1
LAKE SAN MARTIN 370 85 (Chile 91.9 1(Argentina 8.1 2
LAKE PUEYRREDON 86 (Argenttna 2(Chi Ie 1
RIO SIMPSON) 87 (Argentina 2HUEMULES ) (Chile 1
RIOS PICO AND CISNES 88 (Argentina 2(Chile
RIO CALEUFU-CORCOVADO-PALENA 13 ODD 89 (Chi Ie 56.9 1(Argentina 43.1 2
RIO FUTALEUFU 90 (Argentina 2(Chile 1
RIO PUELO 8 800 91 (Argentina 63.8 2(Chile 36.2 1
RIO MANSO 8 620 92 (Argentina 2(Chile 1
RIO HUA-HUM 93 (Argentina 2(Chi Ie 1
LAGUNA DEL BAYO ) 94 (Argentina 2LAGUNA ESCONDIDA!) (Chile 1SALAR DEL PULAR )
LAGUNA MUCAR )
SALl NA DE JAMA )

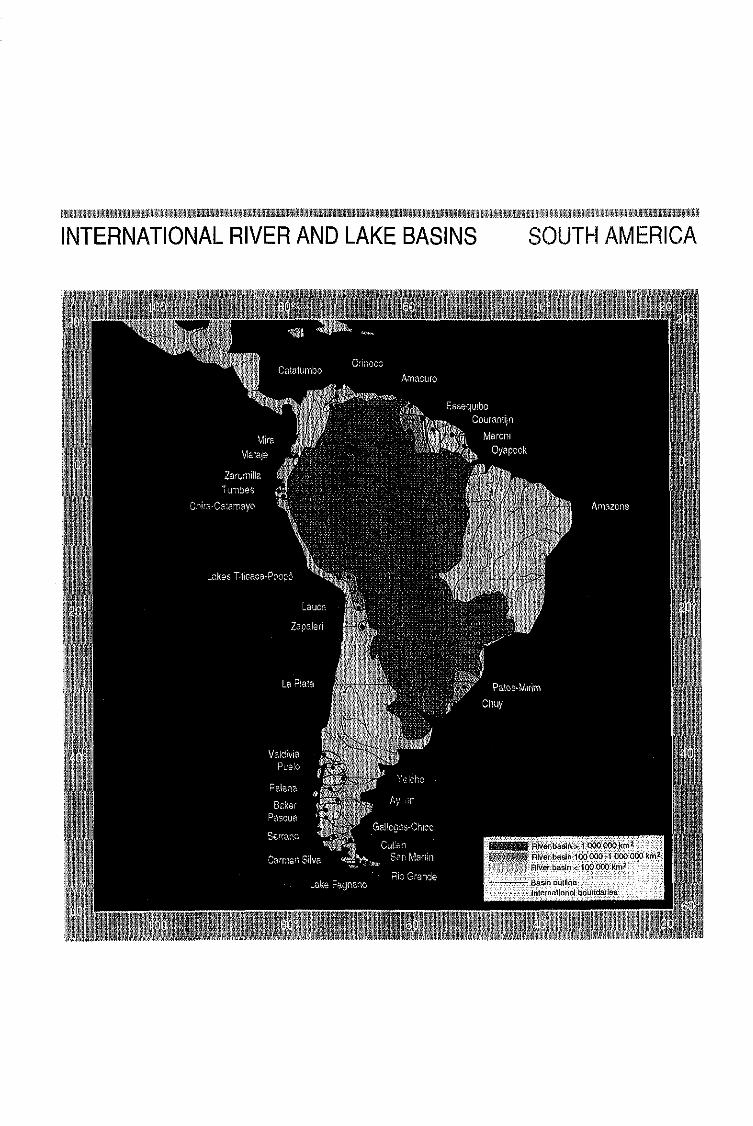
INTERNATIONAL RIVER AND LAKE BASINS SOUTH AMERICA

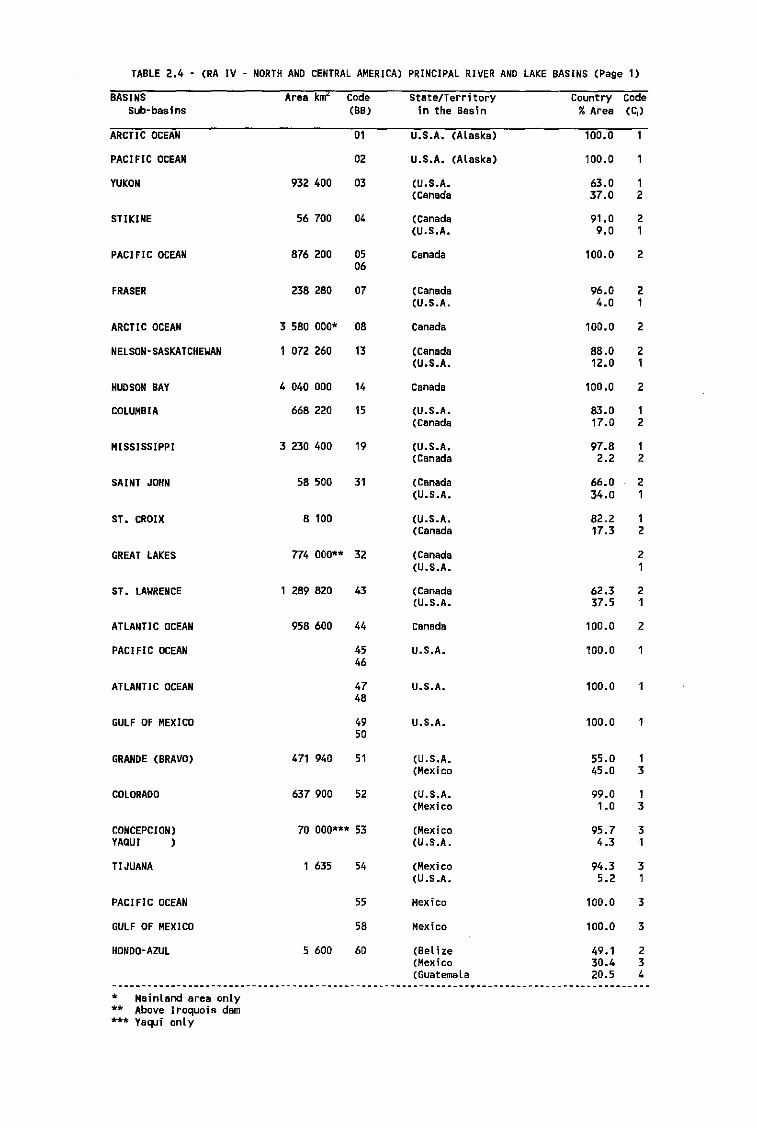
TABLE 2.4 - (RA IV - NORTH AND CENTRAL AMERICA) PRINCIPAL RIVER AND LAKE BASINS (Page 1)
BASiNS Area km2 Code State/Territory Country CodeSub·basins (BB) in the Basin % Area (C,)
ARCTI C OCEAN 01 U.S.A. (Alaska) 100.D
PACIFIC OCEAN 02 U.S.A. (Alaska) 1DO.0
YUKON 932 4DO D3 (U.S.A. 63.0 1(Canada 37.0 2
STIKINE 56 700 04 (Canada 91.0 2(U.S.A. 9.D 1
PACIFIC OCEAN 876 200 as Canada 100.D 2D6
FRASER 238 280 D7 (Canada 96.0 2(U.S.A. 4.0 1
ARCTI C OCEAN 3 580 000' 08 Canada 100.0 2
NELSON, SASKATCHEWAN 1 072 260 13 (Canada 88.0 2(U.S.A. 12.0 1
NUDSON BAY 4 040 000 14 Canada 100.0 2
COLUMBIA 668 220 15 (U.S.A. 83.0 1(Canada 17.0 2
MISSISSIPPI 3 230 400 19 (U.S.A. 97.8 1(Canada 2.2 2
SAINT JOHN 58 500 31 (Canada 66.0 2(U.S.A. 34.0 1
ST. CROIX 8 100 (U.S.A. 82.2 1(Canada 17.3 2
GREAT LAKES 774 000" 32 (Canada 2(U.S.A. 1
ST. LAWRENCE 289 820 43 (Canada 62.3 2(U.S.A. 37.5 1
ATLANTIC OCEAN 958 600 44 canada 100.0 2
PACIFIC OCEAN 45 U.S.A. 100.046
ATLANTIC OCEAN 47 U.S.A. 100.048
GULF OF MEKICO 49 U.S.A. lDO.O50
GRANDE (BRAVO) 471 940 51 (U.S.A. 55.0 1(Mexico 45.0 3
COLORAOO 637 900 52 (U.S.A. 99.0 1(Mexico 1.0 3
CONCEPCION) 70 000'" 53 (Mexico 95.7 3YAQUI ) (U.S.A. 4.3 1
TIJUANA 1 635 54 (Mexico 94.3 3(U.S.A. 5.2 1
PAC IFIC OCEAN 55 Mexico 100.0 3
GULF OF MEXICO 58 Mexico 100.0 3
HONDO-A2UL 5 600 60 (Bel i ze 49.1 2(Mexico 30.4 3(Guatemala 20.5 4
-------------------------------._--------------------------.--.--------------------.-----.---• Mainland area only•• Above Iroquois dam*** Yaqui onLy
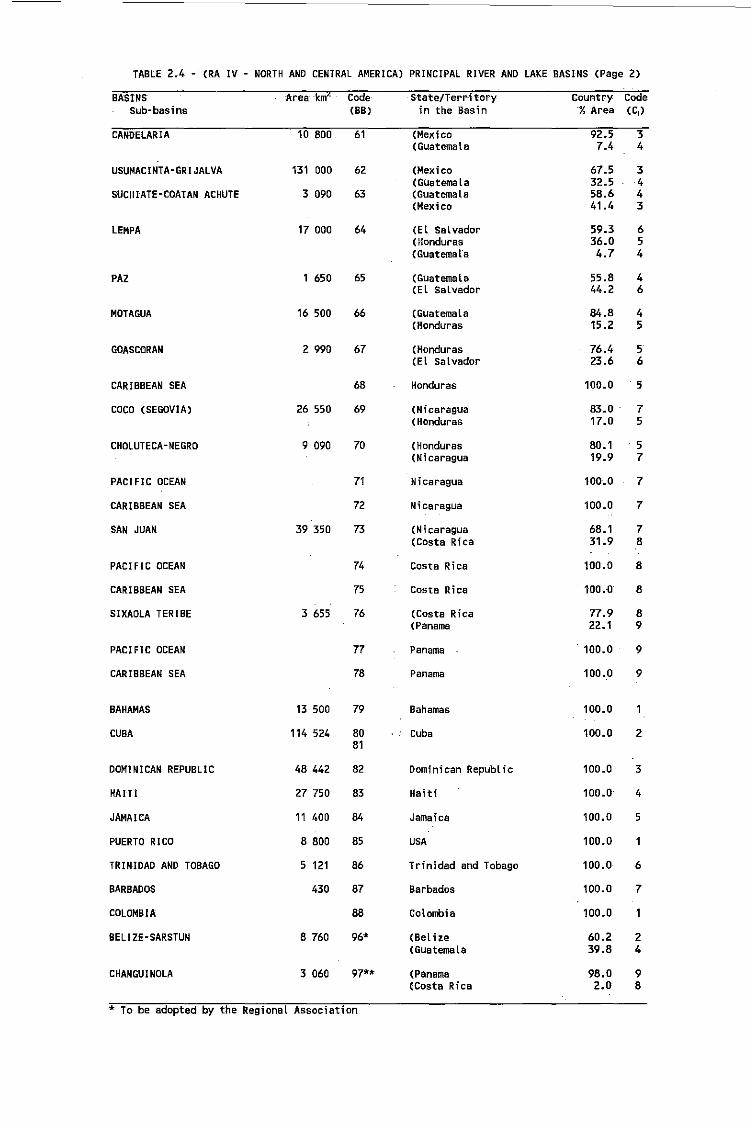
TAB~E 2.4 - (RA IV - NORTH AND CENTRA~ AMERICA) PRINCIPA~ RIVER AND ~AKE BASINS (Page 2)
BASINS -Area -km? Code S-t8te/Ter-ritory Country CodeSub-basins (BB) in the Basin -% Area (e,)
CANDE~ARIA 10 800 61 (Mexico 92.5 3(Guatemala 7.4 4
USUMACINTA-GRIJA~VA 131 000 62 (Mexico 67.5 3(GUatemala 32.5 4
SUCHIATE-COATAN ACHUTE 3 090 63 (GuatemaLa 58.6 4(Mexico 41.4 3
~EMPA 17 000 64 eEL Salvador 59.3 6(Honduras 36.0 5(GuatemaLa 4.7 4
PA2 1 650 65 (Guatemala 55.8 4eEL Salvador 44.2 6
MOTAGUA 16 500 66 (Guatemala 84.8 4(Honduras 15.2 5
GOASCORAN 2 990 67 (Honduras 76.4 5eEL Salvador 23.6 6
CARIBBEAN SEA 68 Honduras 100.0 5
COCO (SEGOVIA) 26 550 69 (Nicaragua 83.0· 7(Honduras 17.0 5
CHO~UTECA-NEGRO 9 090 70 (Honduras 80.1 5(Nicaragua 19.9 7
PACIFIC OCEAN 71 Nicaragua 100.0 7
CARIBBEAN SEA 72 Nicaragua 100.0 7
SAN JUAN 39 350 73 (Nicaragua 68.1 7(Costa Rica 31.9 8
PACIFIC OCEAN 74 Costa Rica 100.0 8
CARIBBEAN SEA 75 Costa Rica 100.1J 8
SIXAO~A TERIBE 3 655 76 (Costa Rica 77.9 8(Panama 22.1 9
PACIFIC OCEAN 77 Panama 100.0 9
CARIBBEAN SEA 78 Panama 100.0 9
BAHAMAS 13 500 79 Bahamas 100.0
CUBA 114 524 80 Cuba 100.0 281
DOMINICAN REPUB~IC 48 442 82 Dominican Republic 100.0 3
HAITI 27 750 83 Haiti 100.0 4
JAMAICA 11 400 84 Jamaica 100.0 5
PUERTO RICO 8 800 85 USA 100.0
TRINIDAD AND TOBAGO 5 121 86 Trinidad and Tobago 100.0 6
BARBAOOS 430 87 Barbados 100.0 7
COLOMBIA 88 Colombia 100.0
8ELI2E -SARSTUN 8760 96' (BeL ize 60.2 2(Guatemala 39.8 4
CHANGUINO~A 3 060 97** (Panama 98.0 9(Costa Rica 2.0 8
* To be adopted by the Regional Association
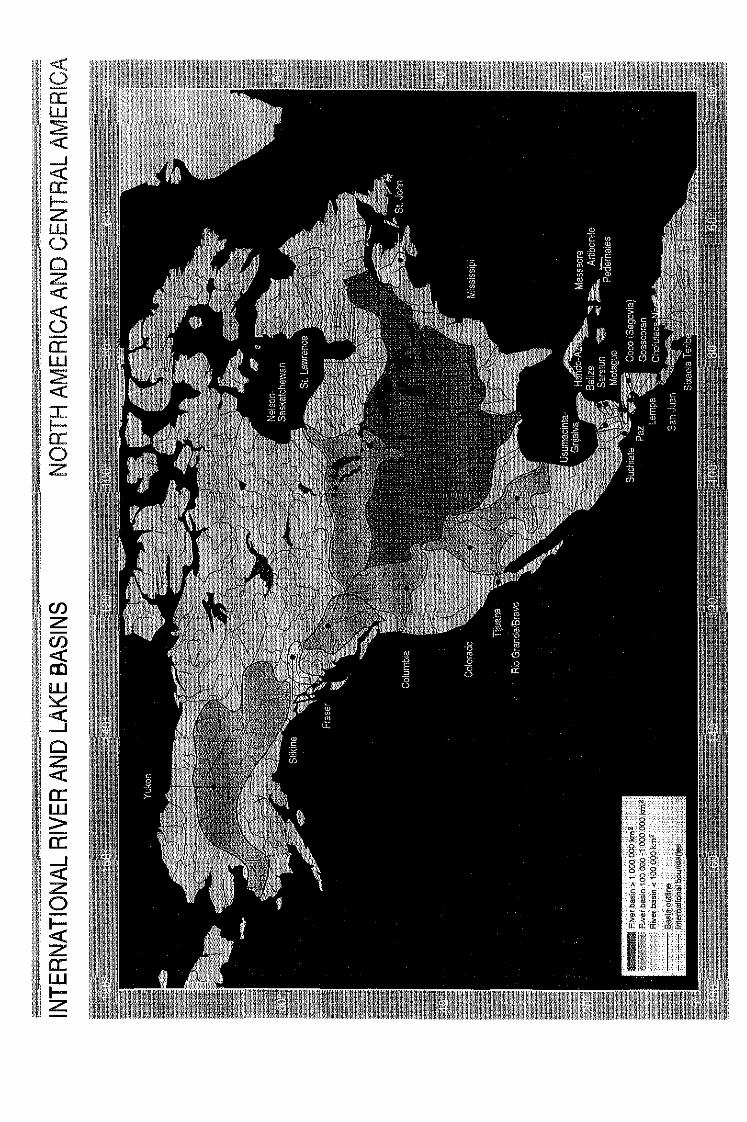

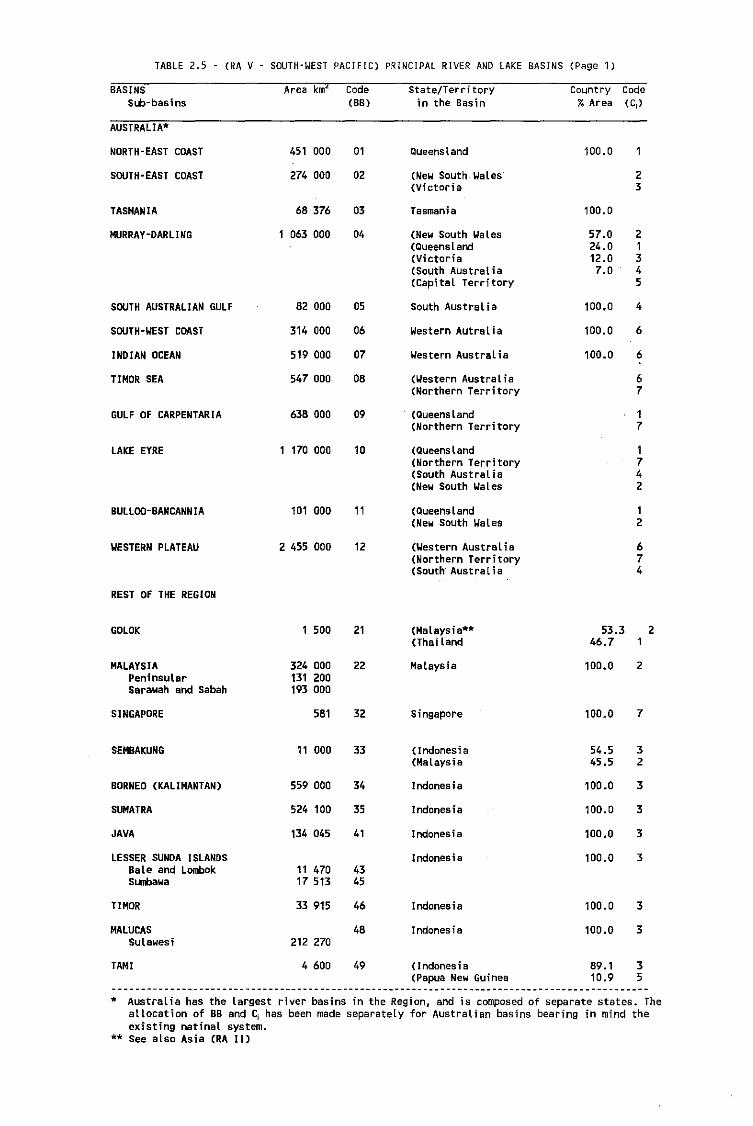
TABLE 2.5 - (RA V SOUTH-WEST PACIFIC) PRINCIPAL RIVER AND LAKE BASINS (Page 1)
BASINS Area km2 Code State/Territory Country CodeSLb-basins (BB) 1n the Basin %Area (C;)
AUSTRALIA>
NORTH-EAST COAST 451 000 01 QueensLand 100.0
SOUTH-EAST COAST 274 000 02 (New South Wales 2(Victoria 3
TASMANIA 68 376 03 Tasmania 100.0
MURRAY-OARLING 063 000 04 (New South Wales 57.0 2(QueensLand 24.0 1(Victoria 12.0 3(South Austral.ia 7.0 4(Capital Territory 5
SOUTH AUSTRALIAN GULF 82 000 05 South Australia 100.0 4
SOUTH-WEST COAST 314 000 06 Western Autralia 100.0 6
INDIAN OCEAN 519 000 07 Western Australia 100.0 6
TIMOR SEA 547 000 08 (Western AustraLia 6(Northern Territory 7
GULF OF CARPENTARIA 638 000 09 . (QueensLand 1(Northern Territory 7
LAKE EYRE 1 170 DOD 10 (Queensland 1(Northern Territory 7(South Australia 4(New South Wales 2
BULLOO-8ANCANNIA 101 000 11 (Queensland 1(New South Wales 2
WESTERN PLATEAU 2455 000 12 (Western AustraLia 6(Northern Territory 7(South· Austral ia 4
REST OF THE REGION
GOLOK 1 500 21 (Malaysia........ 53.3 2(Thai land 46.7
MALAYSIA 324 000 22 Malaysia 100.0 2Peninsular 131 200Sarawah and Sabah 193 000
SINGAPORE 581 32 Singapore 100.0 7
SEMBAKUNG II 000 33 (Indonesia 54.5 3(Malaysia 45.5 2
BORNEO (KALIMANTAN) 559 000 34 Indonesia 100.0 3
SUMATRA 524 100 35 Indonesia 100.0 3
JAVA 134 045 41 Indonesia 100.0 3
LESSER SUNOA ISLANDS Indonesia 100.0 3Bale and Lonbok 11 470 43Sl.IIIbawa 17 513 45
TIMOR 33 915 46 Indonesia 100.0 3
MALUCAS 48 Indonesia 100.0 3Sulawesi 212 270
TAMI 4 600 49 (Indonesi a 89.1 3(Papua New Guinea 10.9 5
---------------------------------------------------------------------------------------------> Australia has the largest river basins in the Region, and is composed of separate states. The
allocation of BB and Cj has been made separately for Australian basins bearing in mind theexisting natinal system.
** See also Asia (RA II)
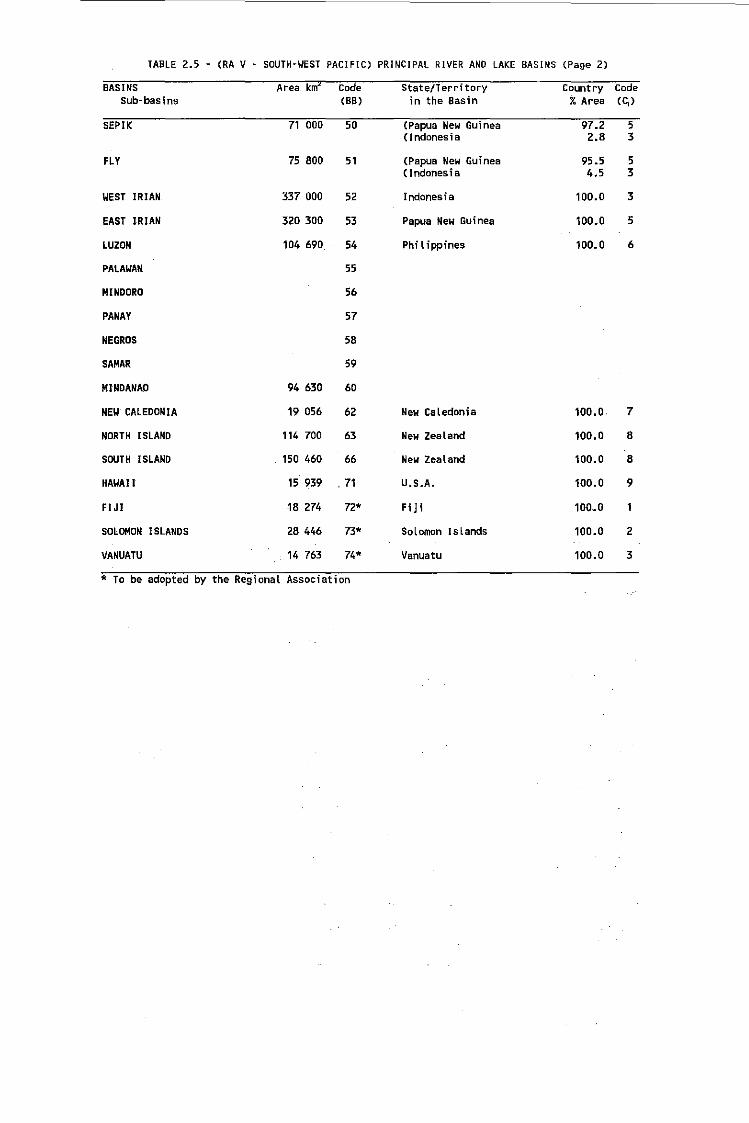
TABLE 2.5 - (RA V - SOUTH-YEST PACIFIC) PRINCIPAL RIVER AND LAKE BASINS (Page 2)
BASINS Area kmL Code StatelTerritory Country CodeSub-basins (BB) in the Basin %Area (C;)
SEPIK 71 000 50 (Papua New Guinea 97.2 5(Indonesia 2.8 3
FLY 75 800 51 (Papua New Guinea 95.5 5(Indonesia 4.5 3
WEST IRIAN 337 000 52 Indonesia 100.0 3
EAST IRIAN 320 300 53 Papua New Guinea 100.0 5
LUZON 104 690 54 Phi l ippines 100.0 6
PALAWAN 55
MINDORO 56
PANAY 57
NEGROS 58
SAMAR 59
MINDANAO 94 630 60
NEW CALEDONIA 19 056 62 New Caledonia 100.0. 7
NORTH ISLANO 114 700 63 New Zealand 100.0 8
SOUTH ISLANO 150 460 66 New Zealand 100.0 8
HAWAII 15 939 . 71 U.S.A. 100.0 9
FIJ I 18 274 72' Fiji 100.0
SOLOMON ISLANOS 28 446 73' Solomon Islands 100.0 2
VANUATU 14 763 74' Vanuatu 100.0 3
* To be adopted by the Regional Association
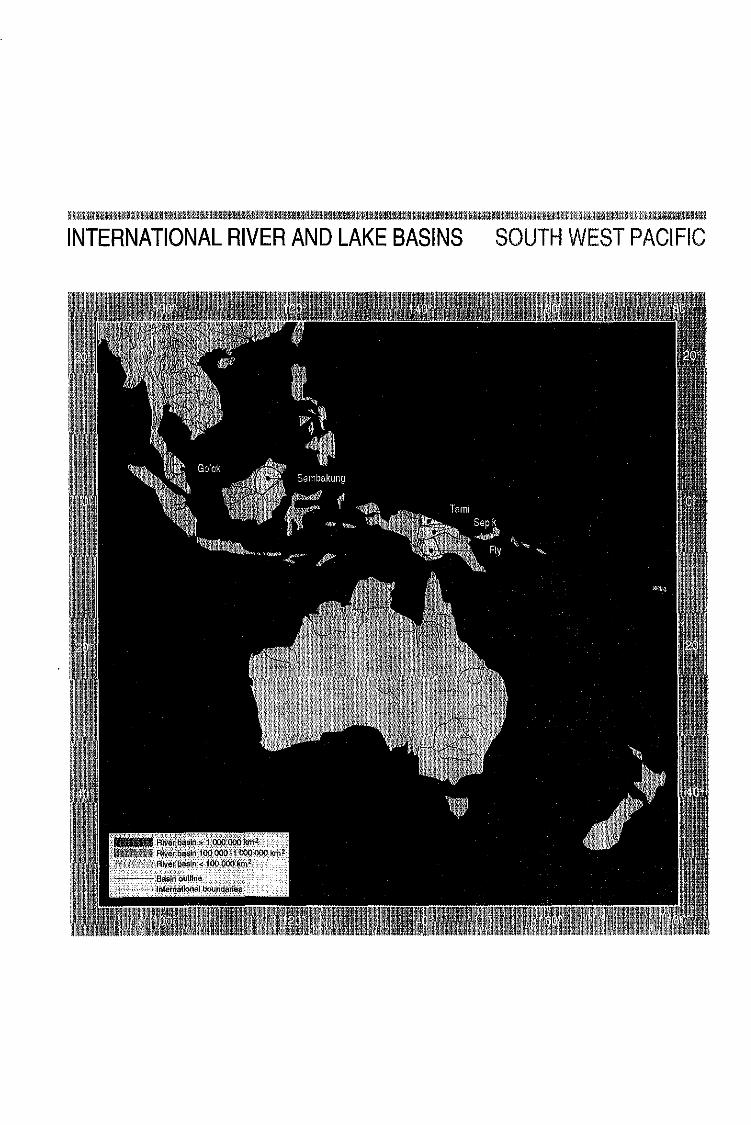
INTERNATIONAL RIVER AND LAKE BASINS SOUTH WEST PACIFIC

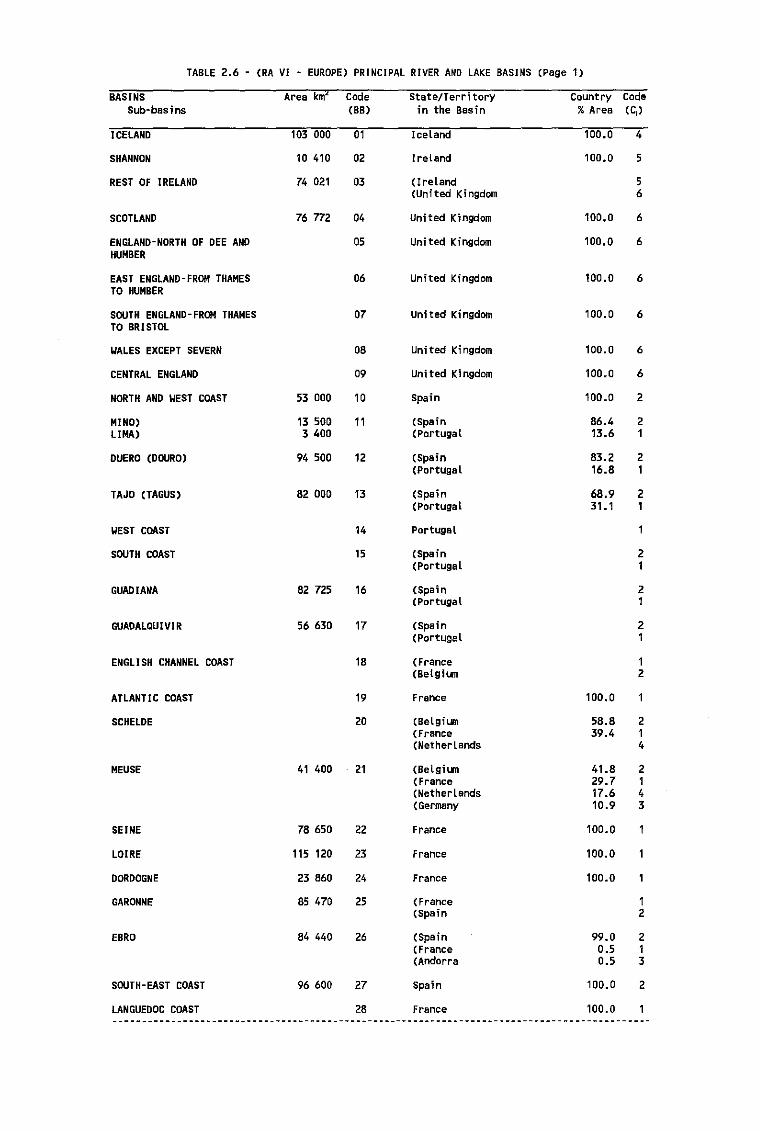
TABLE 2.6 (RA VI - EUROPE) PRINCIPAL RIVER AND LAKE BASINS (page 1)
BASINS Area km2 Code State/Territory Country CodeSub-basins (BB) in the Basin %Area (C,)
ICELAND 103 000 01 IceLand 100.0 4
SHANNON 10 410 02 Ireland 100.0 5
REST OF IRELAND 74 021 03 (l reland 5(United Kingdom 6
SCOTLAND 76772 04 United Kingdom 100.0 6
ENGLAND-NORTH OF DEE AND 05 United Kingdom 100.0 6HUMBER
EAST ENGLAND-FROM THAMES 06 United Kingdom 100.0 6TO HUMBER
SOUTH ENGLAND-FROM THAMES 07 United Kingdom 100.0 6TO BRISTOL
WALES EXCEPT SEVERN 08 United Kingdom 100.0 6
CENTRAL ENGLAND 09 United Ki ngdem 100.0 6
NORTH AND WEST COAST 53 000 10 Spain 100.0 2
MINO) 13 500 11 (Spain 86.4 2LIMA) 3 400 (Portugal 13.6 1
OUERO (OOURO) 94 500 12 (Spain 83.2 2(Portugal 16.8 1
TAJO (TAGUS) 82 ODD 13 (Spain 68.9 2(Portugal 31.1 1
WEST COAST 14 Portugal
SOUTN COAST 15 (Spain 2(PortugaL 1
GUAOIANA 82 725 16 (Spain 2(Portugal 1
GUADALQUIVIR 56 630 17 (Spain 2(Portugal 1
ENGLI SH CHANNEL COAST 18 (France 1(Belgiun 2
ATLANTIC COAST 19 France 100.0
SCHELDE 20 (BelgilJll 58.8 2(France 39.4 1(NetherLands 4
MEUSE 41 400 21 (Belgiun 41.8 2(France 29.7 1(Netherlands 17.6 4(Germany 10.9 3
SEINE 78 650 22 France 100.0
LOiRE 115 120 23 France 100.0
OORDOGNE 23 860 24 France 100.0
GARONNE 85 470 25 (France 1(Spain 2
EBRO 84 440 26 (Spain 99.0 2(France 0.5 1(Andorra 0.5 3
SOUTH-EAST COAST 96 600 27 Spain 100.0 2
LANGUEDOC COAST 28 France 100.0----------------~-----.------------------------------- ---------------------------------------
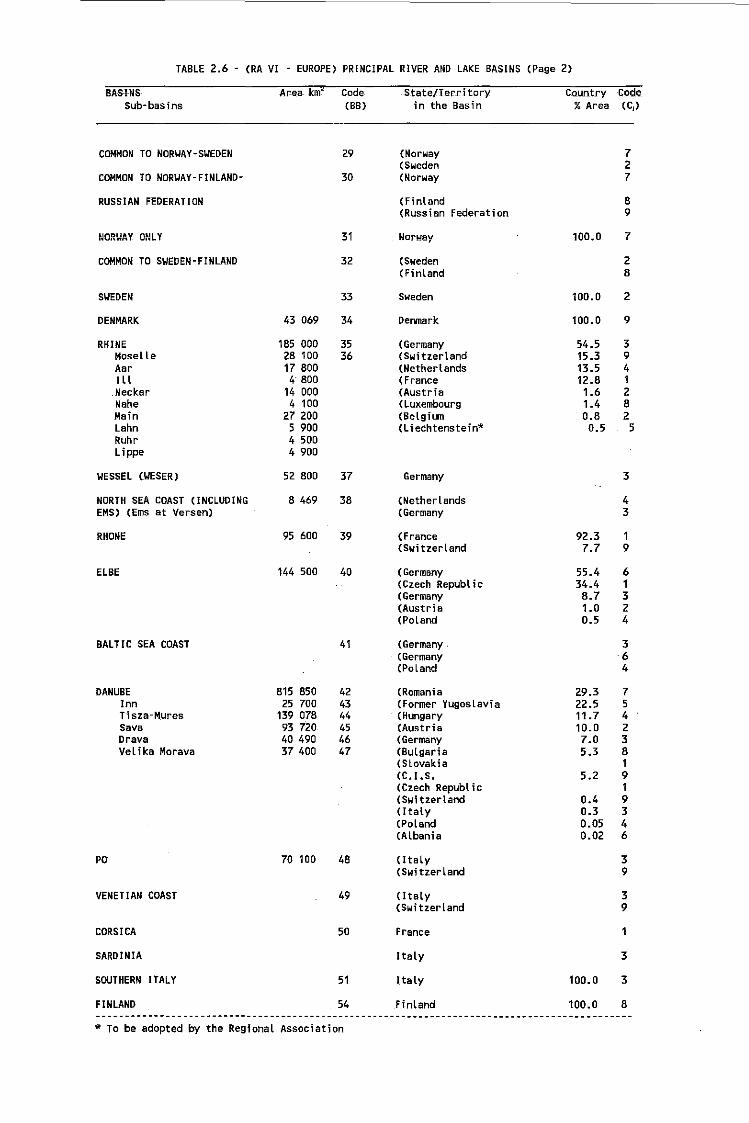
TABLE 2.6 - (RA VI - EUROPE) PRINCIPAL RIVER AND LAKE BASINS (Page 2)
BASINS Ar-ea- kmL Code S-tate/Tef'ritory C.Quntry CodeSub-basins (BB) in the Basin % Area (ej )
COMMON TO NORYAY-SYEDEN 29 (Norway 7(Sweden 2
COMMON TO NORYAY-FINLAND- 30 (Norway 7
RUSSIAN FEDERATION (Finland 8(Russian Federation 9
NORWAY ONLY 31 Norlol'ay 100.0 7
COMMON TO SYEDEN-FINLAND 32 (Sweden 2(Finland 8
SYEDEN 33 Sweden 100.0 2
DENMARK 43 069 34 Dervnark 100.0 9
RHINE 185 000 35 (Germany 54.5 3Moselle 28 100 36 (Switzerland 15.3 9Aar 17 800 (Netherlands 13.5 4III 4 800 ( France 12.8 1Necker 14 000 (Austria 1.6 2Nahe 4 100 (Luxembourg 1.4 8Main 27 200 (Belgiun 0.8 2Lahn 5 900 (Liechtenstein* 0.5 5Ruhr 4 500Lippe 4 900
YESSEL (YESER) 52 800 37 Germany 3
NORTH SEA COAST (INCLUDING 8 469 38 (Netherlands 4EMS) (Ems at Versen) (Germany 3
RHONE 95 600 39 (France 92.3 1(Switzerland 7.7 9
EL8E 144 500 40 (Germany 55.4 6(Czech Republ ie 34.4 1(Germany 8.7 3(Austria 1.0 2(Poland 0.5 4
BALTIC SEA COAST 41 (Germany. 3(Germany 6(Poland 4
DANUBE 815 850 42 (Romania 29.3 7Inn 25 700 43 (Former Yugoslavia 22.5 5Tisza-M,ures 139 078 44 (Hungary 11.7 4Says 93 720 45 (Austria 10.0 2Drava 40 490 46 (Germany 7.0 3Velika Moravs 37 400 47 (Bulgaria 5.3 8
(Slovakia 1(C.I.S. 5.2 9(Czech Republic 1(Switzerland 0.4 9(Italy 0.3 3(Poland 0.05 4(Albania 0.02 6
PO 70 100 48 (Italy 3(Switzerland 9
VENETIAN COAST 49 (Italy 3(Switzer-land 9
CORSICA 50 Fr-ance
SARDINIA Italy 3
SOUTHERN ITALY 51 Italy 100.0 3
FINLAND 54 Finland 100.0 8----_.-------------~---------------------------------- ---------------------------------------
* To be adopted by the Regional Association
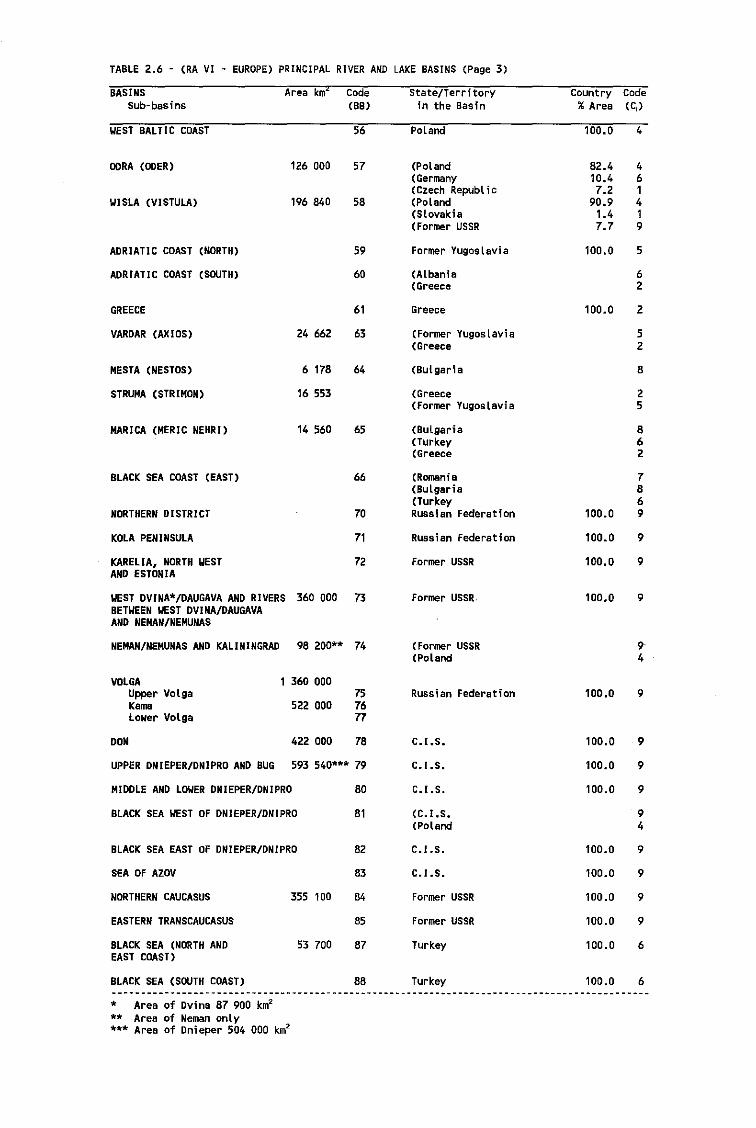
TABLE 2.6 - (RA VI - EUROPE) PRINCIPAL RIVER AND LAKE BASINS (Page 3)
BASINSSub-basins
Area km2 Code(BB)
State/Territoryin the Basin
country Code% Area (C j )
WEST BALTIC COAST
ODRA (ODER)
WISLA (VISTULA)
ADRIATIC COAST (NORTH)
ADRIATIC COAST (SOUTH)
GREECE
VARDAR (AXIOS)
MESTA (NESTOS)
STRUMA (STRIMDN)
MARICA (MERIC NEHRI)
8LACK SEA COAST (EAST)
NORTHERN DISTRICT
KOLA PENINSULA
KARELIA. NORTH WESTAND ESTONIA
126 000
196 840
24 662
6 178
16 553
14 560
56
57
58
59
60
61
63
64
65
66
70
71
72
Poland
(Poland(Germany(Czech Republ ic(Poland(Slovakia(Former USSR
Former Yugoslavia
(ALbania(Greece
Greece
(Former Yugoslavia(Greece
(Bulgaria
(Greece(Former Yugoslavia
(Bulgaria(Turkey(Greece
(Romania(BuLgaria(TurkeyRussian Federation
Russian Federation
Former USSR
100.0
82.410.47.2
90.91.47.7
100.0
100.0
100.0
100.0
100.0
4
461419
5
62
2
52
8
25
862
7869
9
9
WEST DVINA*/DAUGAVA AND RIVERS 360 000 73BETWEEN WEST DVINA/DAUGAVAAND NEMAN/NEMUNAS
NEMAN/NEMUNAS AND KALININGRAD 98 200** 74
Former USSR.
(Former USSR(Poland
100.0 9
9·4
MIDDLE AND LOWER DNIEPER/DNIPRO 80
UPPER DNIEPER/DNIPRD AND 8UG 593 540*** 79
BLACK SEA WEST OF DNIEPER/DNIPRO
VOLGAUpper VolgaKamaLower Volga
DON
360 000
522 000
422 000
757677
78
81
Russian Federation
C.I.S.
C. I .S.
C. I .S.
(C. I .S.(Poland
100.0
100.0
100.0
100.0
9
9
9
9
94
BLACK SEA EAST OF DNIEPER/DNIPRO 82 C.I.S. 100.0 9
SEA OF AZOV
NORTNERN CAUCASUS
EASTERN TRANSCAUCASUS
BLACK SEA (NORTH ANDEAST COAST)
BLACK SEA (SOUTH COAST)
* Area of Dvina 87 900 km2
** Area of Neman only*** Area of Dnieper 504 000 km2
355 100
53 700
83
B4
85
87
88
C.I.S.
Former USSR
Former USSR
Turkey
Turkey
100.0
100.0
100.0
100.0
100.0
9
9
9
6
6
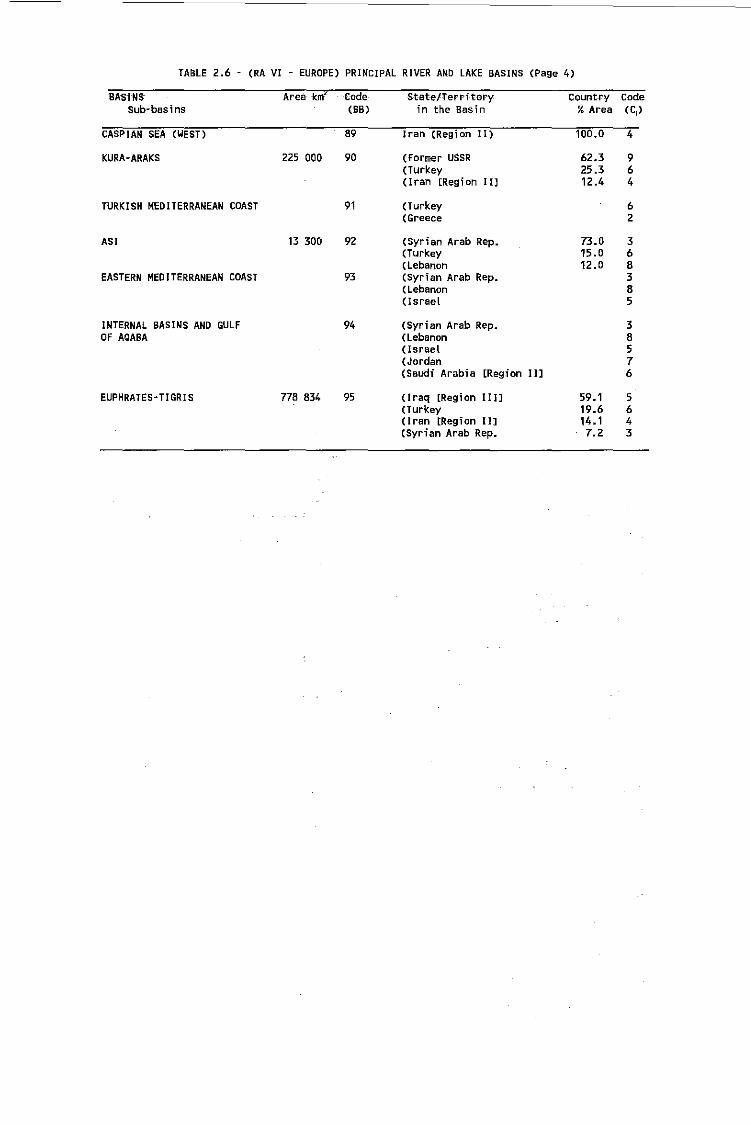
TABLE 2.6 - (RA VI - EUROPE) PRINCIPAL RIVER AND LAKE BASINS (Page 4)
BA,INs AreakmL -Code State/Territory- Country CodeSub-basins (BB) in the Basin %Area (C;)
CASPIAN SEA (WEST) 89 Iran (Region II) 100.0 4
KURA-ARAKS 225 000 90 (Former USSR 62.3 9(Turkey 25.3 6(Iran [Reg; on III 12.4 4
TURKISH MEOITERRANEAN COAST 91 (Turkey 6(Greece 2
ASi 13 300 92 (Syrian Arab Rep. 73.0 3(Turkey 15.0 6(lebanon 12.0 8
EASTERN MEDITERRANEAN COAST 93 (Syrian Arab Rep. 3(Lebanon 8(Israel 5
INTERNAL BASINS AND GULF 94 (Syrian Arab Rep. 3OF AQABA (Lebanon 8
(Israel 5(Jordan 7(Saudi Arabia [Region III 6
EUPHRATES-TIGRIS 778 834 95 (Iraq [Region Illl 59.1 5(Turkey 19.6 6(Iran [Region II] 14.1 4(Syrian Arab Rep. 7.2 3
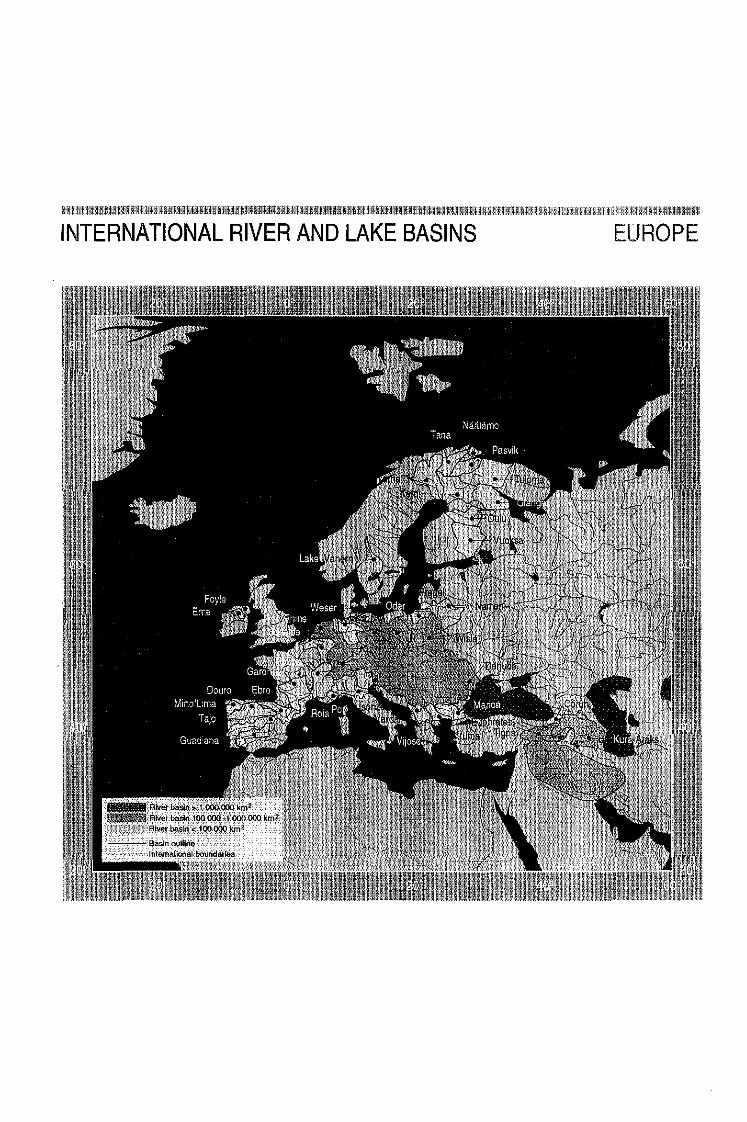
;,I'Ntltl'l'l l'I'I"III'IJI'II'II'~'I'III'I'11 i 1'llfiIIHNllmllllllllliilillll'llllllNmlliil>IIHil.lil'lilll'11'11'111111111'1'111],111'1'11111111111111'11'1'1111111111'[11~111'I'm,I,I'I,1 1·111111011111111','1'1'1'1'1':11 ,'I I:111 Ii 1'1'1'[; I;!·III·IIII'I'I I' II ;'j·IIII'imllllillllYl'll'llllIllll
INTERNATIONAL RIVER AND LAKE BASINS EUROPE

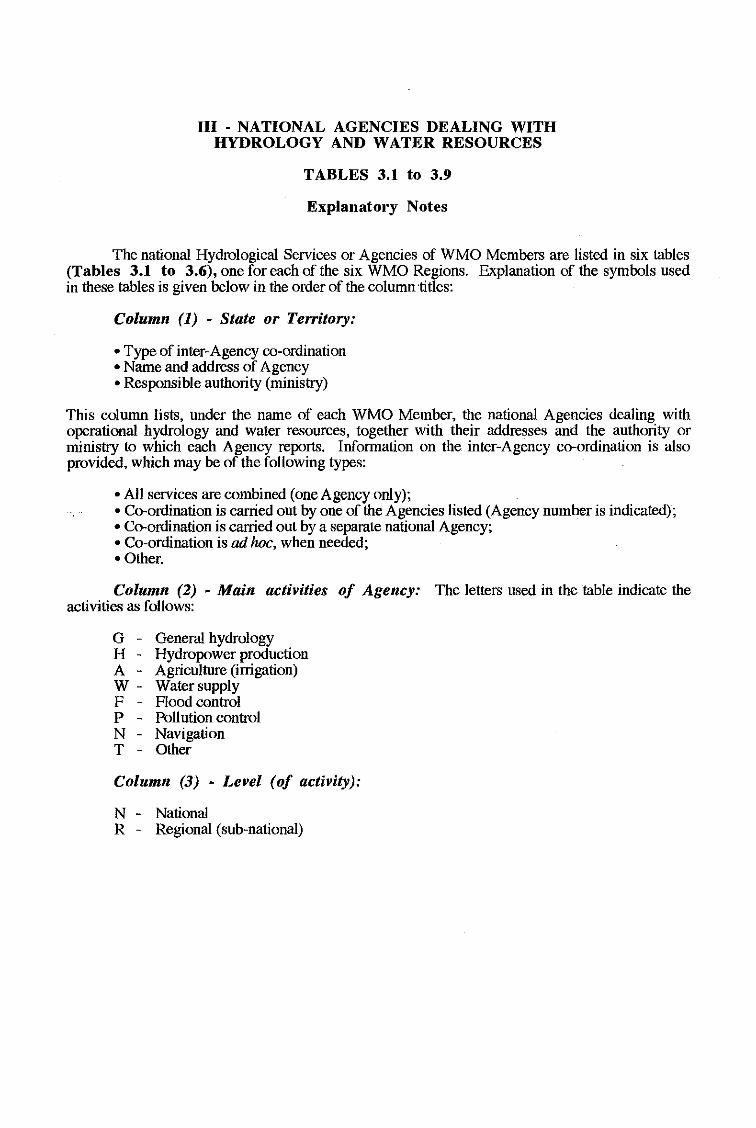
III - NATIONAL AGENCIES DEALING WITHHYDROLOGY AND WATER RESOURCES
TABLES 3.1 to 3.9
Explanatory Notes
The national Hydrological Services or Agencies of WMO Members are listed in six tables(Tables 3.1 to 3.6), one for each of the six WMO Regions. Explanation of the symbols usedin these tables is given below in the order of the column titles:
Column (1) - State or Territory:
• Type of inter-Agency co-ordination• Name and address of Agency• Responsible authority (ministry)
This column lists, under the name of each WMO Member, the national Agencies dealing withoperational hydrology and water resources, together with their addresses and the authority orministry to which each Agency reports. Information on the inter-Agency co-ordination is alsoprovided, which may be of the following types:
• All services are combined (one Agency only);• Co-ordination is carried out by one of the Agencies listed (Agency number is indicated);• Co-ordination is carried out by a separate national Agency;• Co-ordination is ad hoc, when needed;• Other.
Column (2) - Main activities of Agency: The letters used in the table indicate theactivities as follows:
G - Genera! hydrologyH - Hydropower productionA - Agriculture (irrigation)W - Water supplyF - Flood controlP - Pollution controlN - NavigationT - Other
Column (3) - Level (of activity):
N - NationalR - Regional (sub-national)
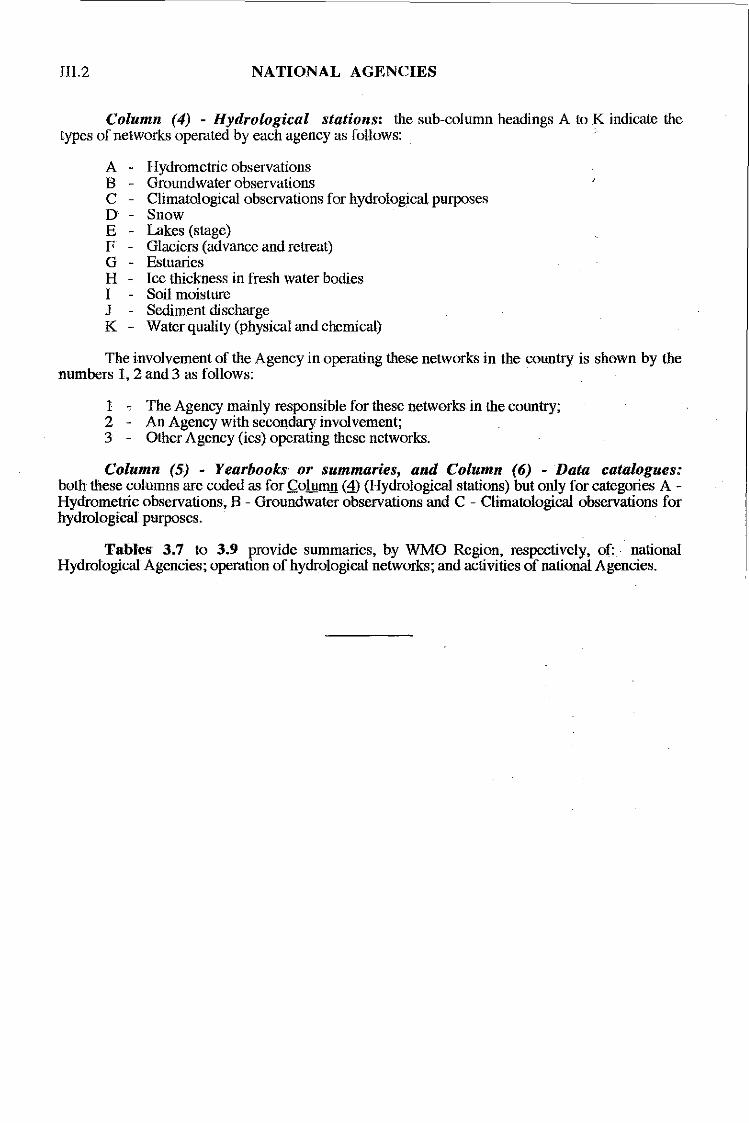
III.2 NATIONAL AGENCIES
Column (4) - Hydrological stations: the sub-column headings A to K indicate thetypes of networks operated by each agency as follows:
A Hydrometric observationsB Groundwater observationsC - Climatological observations for hydrological purposesD - SnowE - Lakes (stage)F - Glaciers (advance and retreat)G - EstuariesH - lee thickness in fresh water bodiesI - Soil moistureJ - Sediment dischargeK - Water quality (physical and chemical)
The involvement of the Agency in operating these networks in the country is shown by thenumbers 1,2 and 3 as follows:
1 " The Agency mainly responsible for these networks in the country;2 - An Agency with secondary involvement;3 - Other Agency (ies) operating these networks.
Column (5) - Yearbooks· or summaries, and Column (6) -Data catalogues:both these columns are coded as for Column W (Hydrological stations) but only for categories A Hydrometric observations, B - Groundwater observations and C - Climatological observations forhydrological purposes.
Tables 3.7 to 3.9 provide summaries, by WMO Region, respectively, of: nationalHydrological Agencies; operation of hydrological networks; and activities of national Agencies.
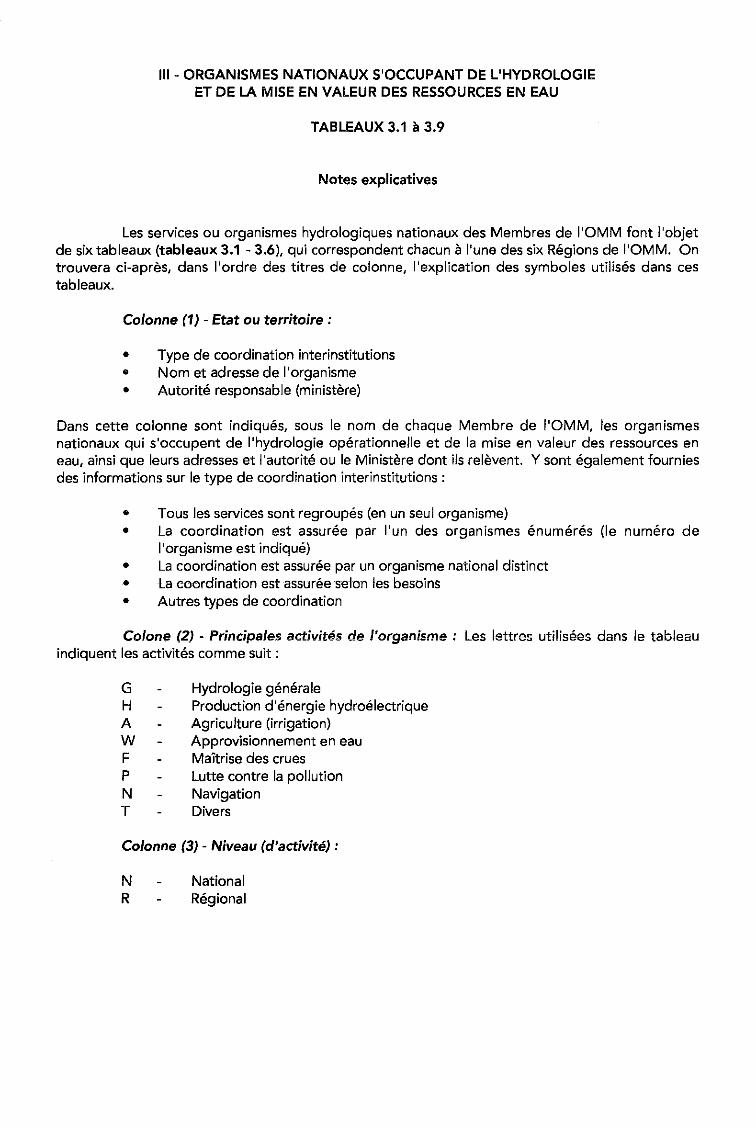
III - ORGANISMES NATIONAUX S'OCCUPANT DE L'HYDROLOGIEET DE LA MISE EN VALEUR DES RESSOURCES EN EAU
TABLEAUX 3.1 11 3.9
Notes explicatives
Les services ou organismes hydrologiques nationaux des Membres de I'OMM font I'objetde six tableaux (tableaux 3.1 - 3.6), qui correspondent chacun 11 I'une des six Regions de I'OMM. Ontrouvera ci-apres, dans I'ordre des titres de colonne, I'explication des symboles utilises dans cestableaux.
Co/anne (1) - Etat au territoire :
• Type de coordination interinstitutions• Nom et adresse de I'organisme• Autorite responsable (ministere)
Dans cette colonne sont indiques, sous Ie nom de chaque Membre de I'OMM, les organismesnationaux qui s'occupent de I'hydrologie operationnelle et de la mise en valeur des ressources eneau, ainsi que leurs adresses et I'autorite ou Ie Ministere dont i1s relevent. Y sont egalement fourniesdes informations sur Ie type de coordination interinstitutions :
• Tous les services sont regroupes (en un seul organisme)• La coordination est assuree par I'un des organismes enumeres (Ie numero de
I'organisme est indique)• La coordination est assuree par un organisme national distinct• La coordination est assureeselonles besoins• Autres types de coordination
C%ne (2) - Principa/es activiMs de /'organisme : Les lettres utilisees dans Ie tableauindiquent les activites comme suit:
G Hydrologie generaleH Production d'energie hydroelectriqueA Agriculture (irrigation)W Approvisionnement en eauF Maitrise des cruesP Lutte contre la pollutionN NavigationT Divers
Co/anne (3) - Niveau (d'activite) :
N NationalR Regional
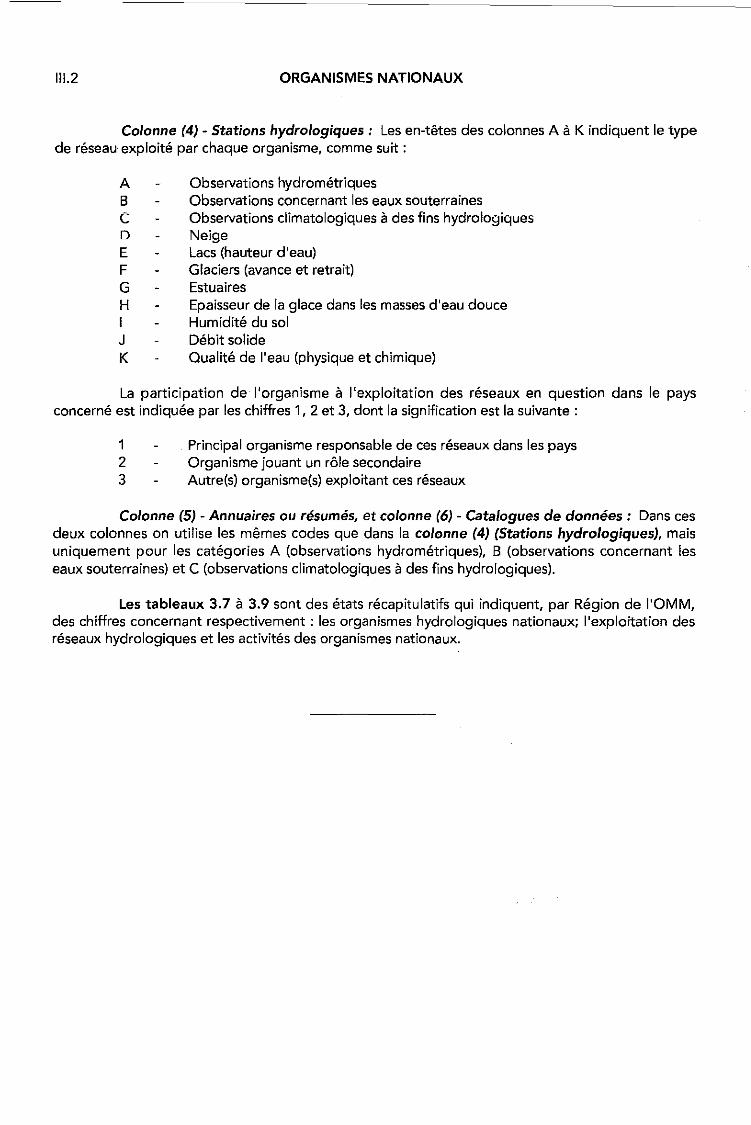
111.2 ORGANISMES NATIONAUX
Colonne (4) - Stations hydrologiques: Les en-tetes des colonnes A aK indiquent Ie typede rElseaU exploite par chaque organisme, comme suit:
A Observations hydrometriquesB Observations concernant les eaux souterrainesC Observations c1imatologiques ades fins hydrologiquesD NeigeE Lacs (hauteur d'eau)F Glaciers (avance et retrait)G EstuairesH Epaisseur de la glace dans les masses d'eau douceI Humidite du 501
J Debit solideK Qualite de I'eau (physique et chimique)
La participation de I'organisme a I'exploitation des reseaux en question dans Ie paysconcerne est indiquee par les chiffres 1, 2 et 3, dont la signification est la suivante :
1 Principal organisme responsable de ces reseaux dans les pays2 Organisme jouant un role secondaire3 Autre(s) organisme(s) exploitant ces reseaux
Colonne (5) - Annuaires ou resumes, et colonne (6) - Catalogues de donnees: Dans cesdeux colonnes on utilise les memes codes que dans la colonne (4) (Stations hydrologiques), maisuniquement pour les categories A (observations hydrometriques), B (observations concernant leseaux souterraines) et C (observations c1imatologiques ades fins hydrologiques).
Les tableaux 3.7 a 3.9 sont des etats recapitulatifs qui indiquent, par Region de I'OMM,des chiffres concernant respectivement : les organismes hydrologiques nationaux; I'exploitation desreseaux hydrologiques et les activites des organismes nationaux.
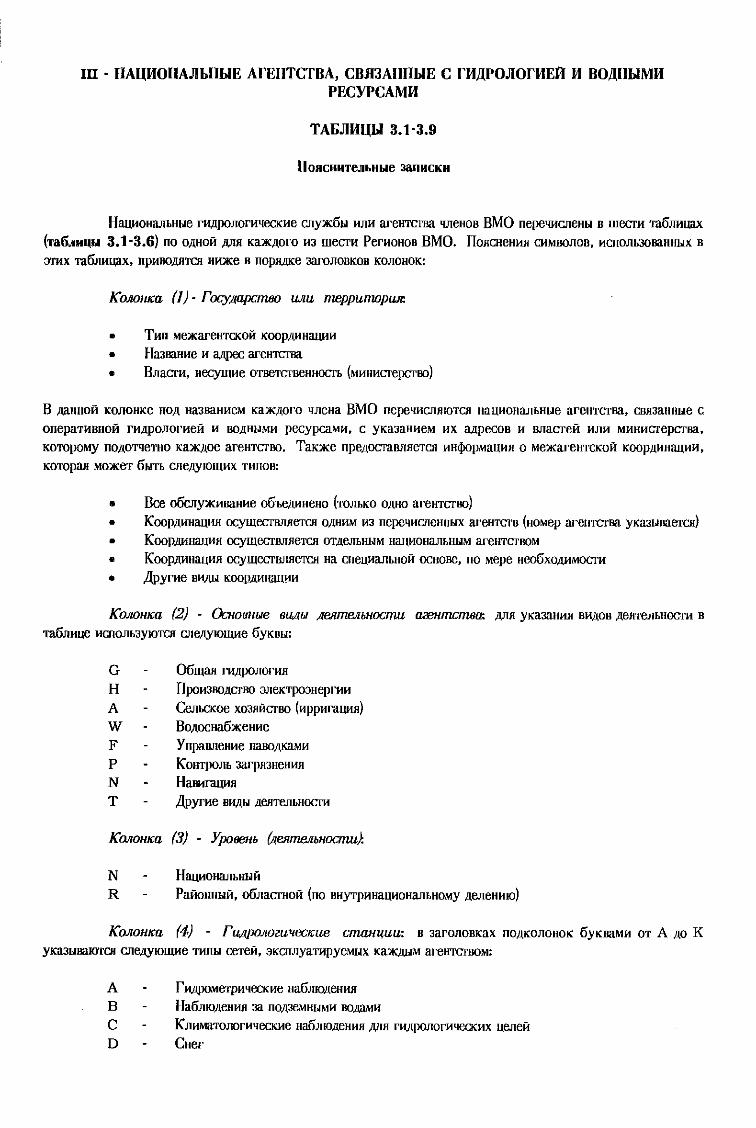
III - I1AUHOIIAJlLlILlE ArEIITCTBA, CBJl3AIIIILlE C rHLlPOJlOrHER H BOLlIILlMHPECYPCAMH
TAIiJlHULI 3.1-3.9
nOJlCHHTeJlLHLle 3aIlHCKH
Haw<OHaJlLHUe rH,llponorHqecKHe cnyx6u HnH areHTcma qneHOB BMO nepeql'fcneHu B lIIecfH TIl6nHll3X
(Taw.HI\L1 3.1-3.6) no O,llHOH ,IlnJI Kax,IlOro HJ lIIecfH PenlOHoH BMO. ITollcoeHlUl CHMBOnOH. HcnonLJODaHHUX B
3Tl!X TIl6nHl\3.x. npHBOMTCJl HHXe B nopJl,llKe JaronOHKOB KonOHOK:
KOJlOlIKa (I) - Focy.aapcfTUJO lLIlU meppumnpwr.
• THn Me:>KareHTCKOH KOOP,llHHal\HH
• HaJDaHHe H <l)lpeC areH1crDa
• BnacfH. HecylliHe OTOOTCrOOHHocrL (MHHHCfepcroo)
B MHHOH KonOHKe no,ll HaJDaHHeM KaX,lloro qneHa BMO nepeqHcnlllOTCIl HaUHOHaJlLHUe areHTCfBa. C8JlJaHHUe C
onepaTHBHoH rH,IlpOnOl'HeH H BO,IlHUMH pecypcaMH. C yKaJaHHeM HX <lilpeCOB H BnaCTeH HJm MHHHCfepcrDa.
KOTOpoMy nO,llOTqeTHO KaX,lloe areHTCfOO, TaKXe npe,llOCTaDnlleTCIl HH</lOpMauHIl 0 MexareHTCKoii KOOP,llHHal\HH.
KOTOpaJI MoxeT 6uTL cne,llylOlIIHX THnOH:
• Bee 06cJJyxHBaHHe 06wi\>lHeHo (TOnLKo O,llHO areHTCfoo)
• KOOP,llHHal\HIl OCYlUecrBnJleTCJl OMHM HJ nepeqHcneHHux areHTCfB (HoMep areHTCfDa YKaJUDaeTCJl)
• KOOPMHal\HIl OCYlUecrDnlleTCJl OT,IlenLHUM HaUHOHaJlLHUM areHTCfBOM
• KOOP,llHHal\HIl OCYlUecrllJlJJeTCJl Ha cneUHaJlLHOii OCHOBe. no Mepe HeoOxO,llHMOCfH
• )\pyme BH,iI,bI KOO!l,llHHJUl"-l1
KOJlOIIKa (2) - OcIIO(1l/ble 61Mbl .aeRmeJlbIIOCf/Ul, U2eIImclTl8~ ,IlJl1l YKa3aHHIl BH,llOB ,IleamnLHOCTH B
TIl6nHUe HCnonLJylOTCJl CJle,IlYlOlUHe 6YKHU:
G 06lUaJI rH,llponorHll
H ITPOHJOO,llCfBO 3JleKTpoJHeprHH
A CenLCKoe XOJaiiCfBO (HppHffiUHIl)
W Bo,llOCHa6:>KeHHe
F YnpaBneHHe naBO,IlKaMH
P KOHTponL 3arpaJHeHHIl
N HaHHlQUHJI
T )\pyrHe HH,iI,bI ,IleJITenLHocrH
KmOIlKa (3) - YpoOOllb f.aeJllTleJlbllocmu}.
N Hal\HOHaJlLHUii
R PaHoHHuii. 06nacrnoii (no BHYTpHHaUHOHaJlLHOMY ,IleneHHIO)
KOJIOIIKa (4) - F1M/JOJl02U'IecKue ClTUlI//{UU: H JarOnOHKax nO,llKOnOHOK 6YKBaMH OT A ,IlO KyKaJUDaIOTC8 cne,llylOlUHe THnu CeTeH. JKmnyaTHpyeMUx KaX,IlUM areHTCfBOM:
A rH,lljlOMeTpHqecKHe Ha6JIIQl\eHHIl
B Ha6nlOl\eHHIl Ja nO,llJeMHUMH BOMMH
C KnHMaTOnorHqecKHe Ha6JIIO,IleHHIl )I.11Jl rH/lpoJlomqecKHX ueneii
D CHer
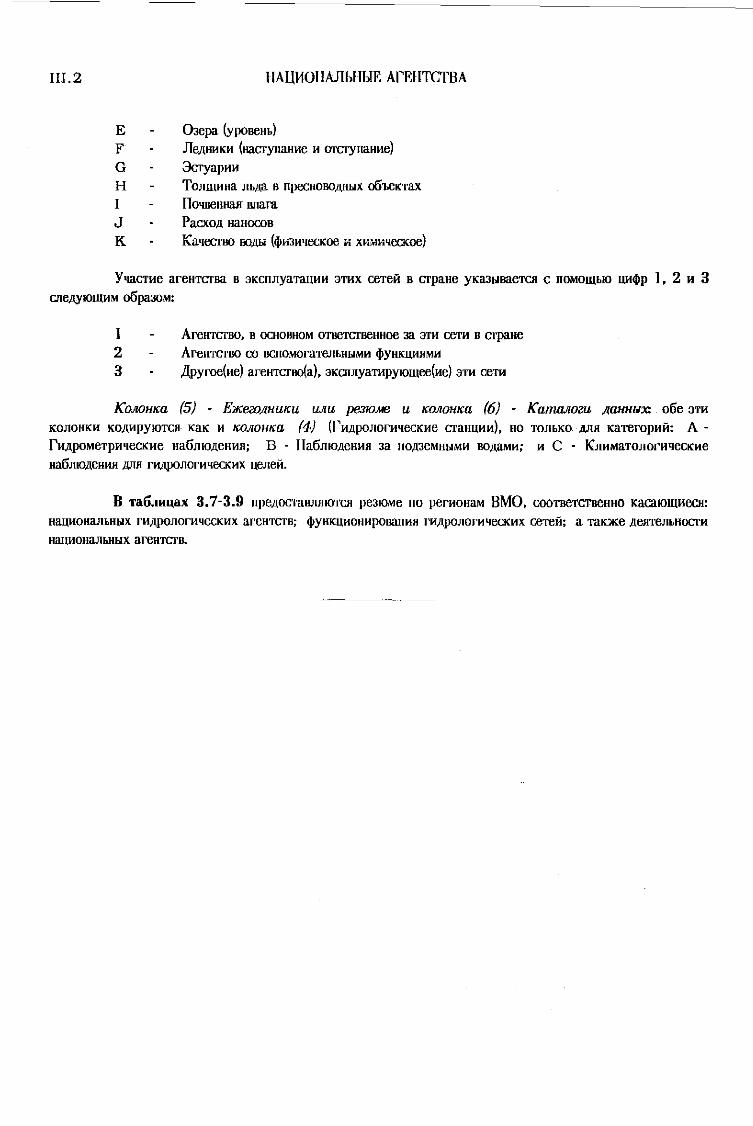
IlI.2
EFGHI
JK
HAUJoiOHAJlbHLlE ArEIITCTBA
OJepa (YPOBCHh)
Jle,J\HHKII (Hacrymullle II OTCrYnaHlle)
3cryaplIlI
TO!llllllHa Jlhi\a B npecnoBOi\HhIX OObeKTaX
HO'IBCHHaJI llJlara
PacxOi\ HaHllCOB
Kaqocroo ooi\1l (<jl1l3I1qeacoe II XIIMllqecKoe)
Y'lllCTlle areHTcrHa B 3KCHJlyaTaUIIII 3T11X ceTeii B crpaHe YKaJhlBaeTCH C nOMOIUhlO UII<jlp I, 2 II 3CJIeJlYlOIUIIM 06pa30M:
1 AreHTCfBO, B OCHOBHOM OTBeTCfBCHHoe Ja 3T1I reTlI B crpaHe
2 AreHTcrBO co BCHOMQraTeJlhHhlMII <jlYHKllIIHMII
3 ,l{pyroe(lIe) areHTCfoo(a), 3KmJlyaTllpYIOIUee(lIe) 3T11 reTlI
KOJlOIlICU (5) - EJlCe20j(/lUICU UJlU pe310Me U ICOJlOIlICU (6) - KuTTULllozu j(aHIlWX ooe 3TII
KOJlOHKII KOi\IIPYIOTCH KaK II ICOJlOIlICU (4) (r1li\poJIOrllqeCKlle craHUIIII), HO TOJlhKO MH KaTeropllii: Arlli\poMeTplI,ecKlle HaOJlIOi\eHIIH: B· HaOJlIOi\eIlIlH 3a 1I0i\3eMHhlMII BOi\aMlI: lie· KJlIIMaTOJlOl'lIQeCKlle
uaOJlIOi\eHIIH )IJIH rIIi\jXlJlOmqecKlIX ueJleii.
B TaOJIHl\aX 3.7-3.9 npei\OCTaIlJlHIOTCH pe310Me no perllOHaM BMO, COOTBCTCTBCIlIlO KacaIOIUIIOCII:
HaUIlOHaJJhllhiX rlli\poJlOrllqeCKIlX al'eHTCfB; <jlYHKUIIOHIlPOHaHIIH I'IIi\poJlOrll,eCKIIX ceTeii: a TalOKe i\eHTeJlhHOCfIl
HaullOHaJJhHhlX areHTCfIl.
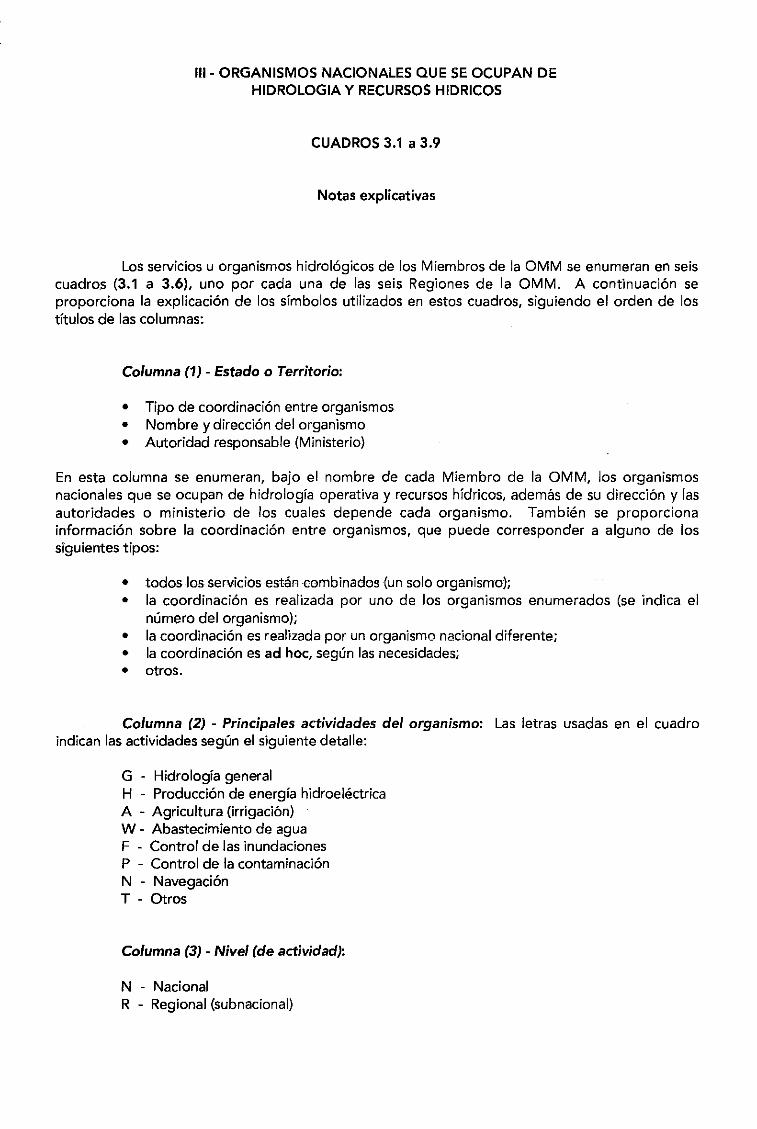
111- ORGANISMOS NACIONALES QUE SE OCUPAN DEHIDROLOGIA Y RECURSOS HIDRICOS
CUADROS 3.1 a 3.9
Notas explicativas
Los servicios u organismos hidrol6gicos de 105 Miembros de la OMM se enumeran en seiscuadros (3.1 a 3.6), uno por cada una de las seis Regiones de la OMM. A continuaci6n seproporciona la explicaci6n de 105 sfmbolos utilizados en estos cuadros, siguiendo el orden de 105
tftulos de las columnas:
Columna (1) - Estado 0 Territorio:
• Tipo de coordinaci6n entre organism05
• Nombre y direcci6n del organismo• Autoridad responsable (Ministerio)
En esta columna se enumeran, bajo el nombre de cada Miembro de la OMM, 105 organismosnacionales que se ocupan de hidrologfa operativa y recursos hfdricos, ademas de su direcei6n y lasautoridades 0 ministerio de 105 cuales depende cada organismo. Tambien se proporeionainformaci6n sobre la coordinaci6n entre organismos, que puede corresponder a alguno de 105
siguientes tipos:
• todoslos servicios estancombinados (un 5010 organismo);• la coordinaci6n es realizada por uno de 105 organismos enumerados (se indica el
numero del organismo);• la coordinaci6n es realizada por un organismo nacional diferente;• la coordinaci6n es ad hoc, segun las neeesidades;• otros.
Columna (2) - Principales ac:tividades del organismo: Las letras usadas en el cuadroindican las actividades segun el siguiente detalle:
G - Hidrologfa generalH - Producci6n de energfa hidroelectricaA - Agricultura (irrigaci6n)W - Abastecimiento de aguaF - Control de las inundacionesP - Control de la contaminaci6nN - Navegaci6nT - Otros
Columna (3) - Nivel (de ac:tividad):
N - NacionalR - Regional (subnacional)
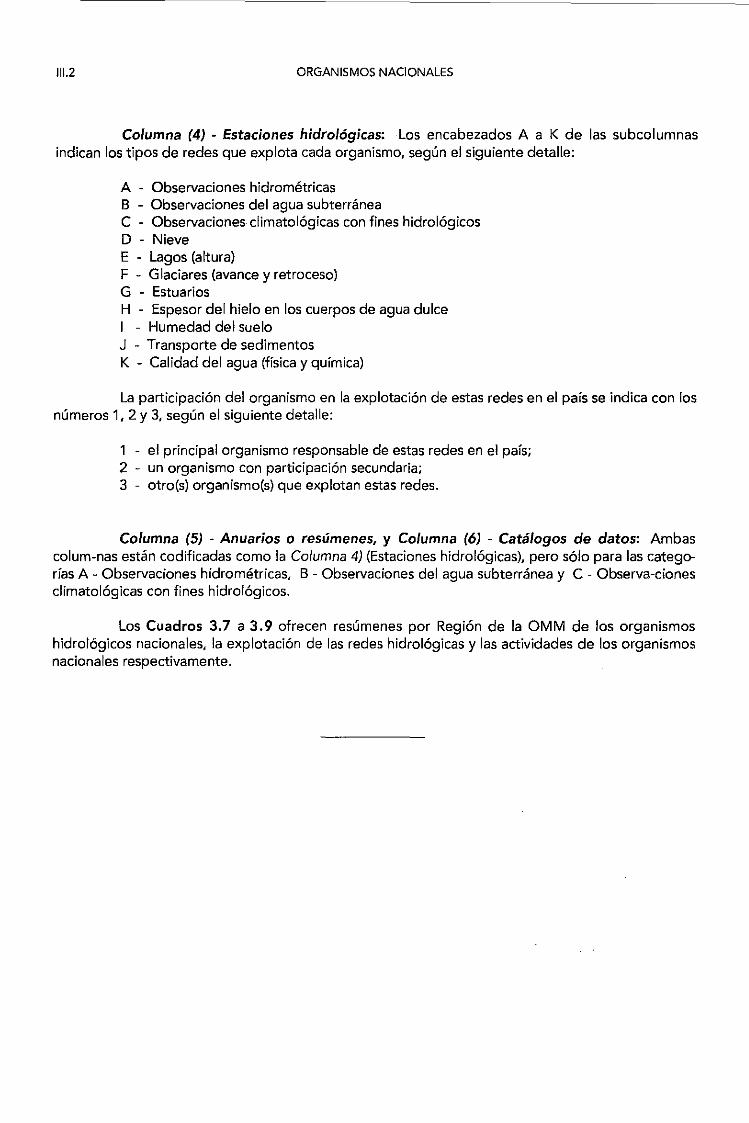
111.2 ORGANISMOS NACIONALES
Columna (4) - Estaciones hidrol6gicas: Los encabezados A a K de las subcolumnasindican los tipos de redes que explota cada organismo, segun el siguiente detalle:
A - Observaciones hidrometricasB - Observaciones del agua subtern3neaC - Observaciones c1imatol6gicas con fines hidrol6gicosD - NieveE - Lagos (altura)F - Glaciares (avance y retroceso)G - EstuariosH - Espesor del hielo en los cuerpos de agua dulceI - Humedad del sueloJ - Transporte de sedimentosK - Calidad del agua (ffsica y quimica)
La participaci6n del organismo en la explotaci6n de estas redes en el pais se indica con losnumeros 1, 2 Y 3, segun el siguiente detalle:
1 el principal organismo responsable de estas redes en el pais;2 - un organismo con participaci6n secundaria;3 otro(s) organismo(s) que explotan estas redes.
Columna (5) - Anuarios 0 resumenes, y Columna (6) - Catalogos de datos: Ambascolum-nas estan codificadas como la Columna 4) (Estaciones hidroI6gicas), pero 5610 para las categorias A - Observaciones hidrometricas, B - Observaciones del agua subterranea y C - Observa-cionesc1imatol6gicas con fines hidrol6gicos.
Los Cuadros 3.7 a 3.9 ofrecen resumenes por Regi6n de la OMM de los organismoshidrol6gicos nacionales, la explotaci6n de las redes hidrol6gicas y las actividades de los organismosnacionales respectivamente.
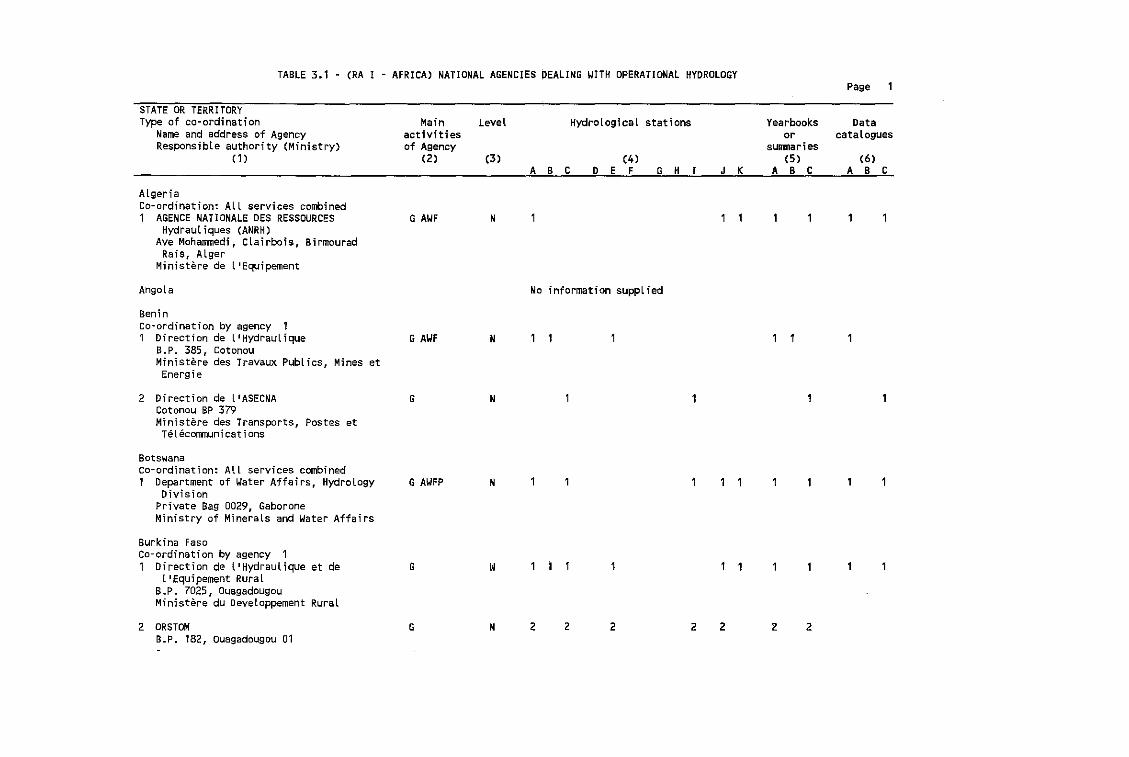
TABLE 3.1 • (RA I - AFRICA) NATIONAL AGENCIES PEALING WITH OPERATIONAL HYDROLOGYPage
STATE OR TERRITORYType of co-ordination
Name and address of AgencyResponsible authority (Ministry)
(1)
Ma;n Level Hydrological stationsactivitiesof Agency
(2) (3) (4)A B C D E F G H J K
Yearbooksor
sURIIlaries(5)
ABC
Datacatalogues
(6)ABC
AlgeriaCo-ordination: All services combined1 AGENCE NATIONALE DES RESSOURCES
Hydrauliques (ANRH)Ave Mohammedi, Clairbois, Birmourad
Rais, AlgerMinistere de l'Equipement
Angola
BeninCo~ord;nation by agency 11 Direction de l'Hydraulique
B.P. 385, CotonouMinistere des Travaux Publics, Mines et
Energie
2 Direction de L'ASECNACotonou BP 379Ministere des Transports, Pastes et
Telecommunications
Botswanaco-ordination: All services combined1 Department of Water Affairs, Hydrology
DivisionPrivate Bag 0029, GaboroneMinistry of Minerals and Water Affairs
Burkina FasoCo-ordination by agency 11 Direction de l'Hydraulique et de
l'Equipement RuralB.P. 7025, OuagadougouMinistere du Developpement Rural
G AWF
G AWF
G
G AWFP
G
N
N
N
N
I~
No information supplied
2 ORSTOMB.P. 182, Ouagadougou 01
G II 2 2 2 2 2 2 2
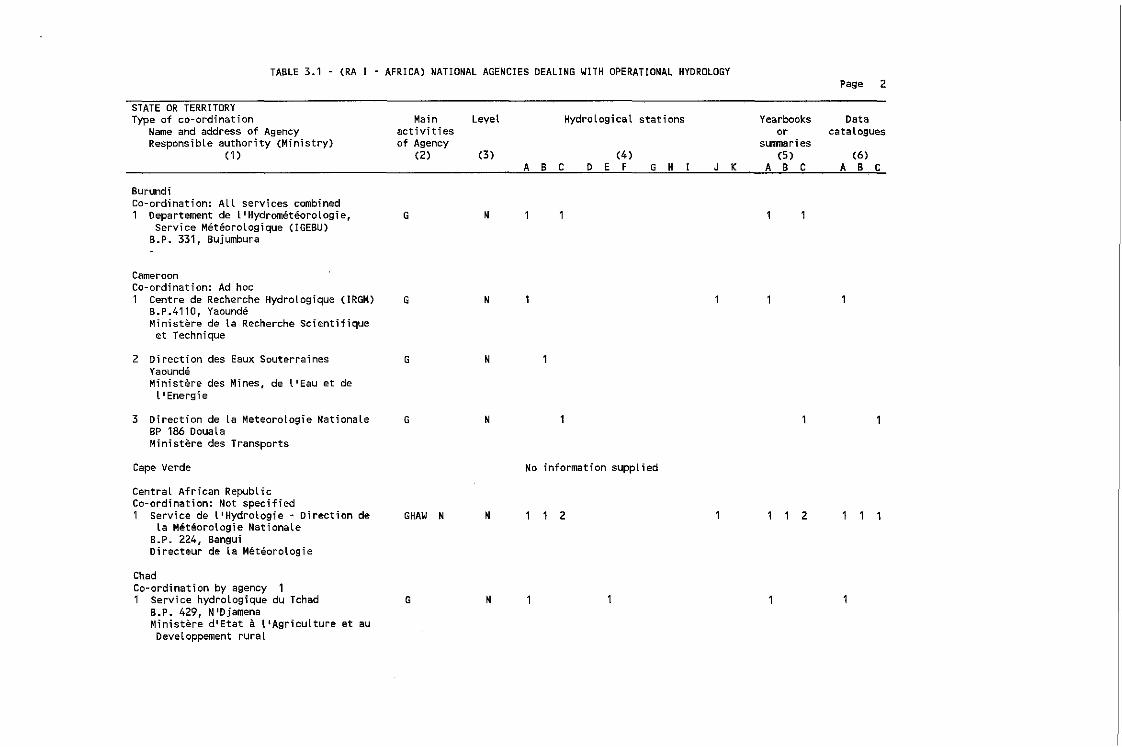
TABLE 3.1 - (RA I - AFRICA) NATIONAL AGENCIES DEALING WITH OPERATIONAL HYDROLOGYPage 2
STATE OR TERRITORYType of co-ordination
Name and address of AgencyResponsibLe authority (Ministry)
(1 )
Main LeveL Hydrological stationsactivitiesof Agency
(2) (3) (4)A B C 0 E F G H
Yearbooks Dataor catalogues
sunmaries(5) (6)
J K A B C A B C
BurundiCo-ordination: ALL services combined1 Departement de llHydrometeoroLogie,
Service MeteoroLogique (IGEBU)B.P. 331, Bujumbura
CameroonCo-ordination: Ad hoc1 Centre de Recherche Hydrologique (IRGM)
S.P.4110, YaoundeMinistere de La Recherche Scientifiqueet Technique
2 Direction des Eaux SouterrainesYaoundeMinistere des Mines. de L'Eau et de
l'Energie
3 Direction de La Meteorotogie NationaleBP 186 DoualaMinistere des Transports
Cape Verde
CentraL African RepubLicCo-ordination: Not specified1 Service de LIHydrologie - Direction de
la Meteorologie NationaLeB.P. 224, BanguiDirecteur de La Meteorologie
ChadCo-ordination by agency 11 Service hydrologique du Tchad
B.P. 429, NIDjamenaMinistere dlEtat a llAgricuLture et auDeveloppernent ruraL
G
G
G
G
GHAW N
G
N
N
N
N
N
N
No information suppLied
2 2
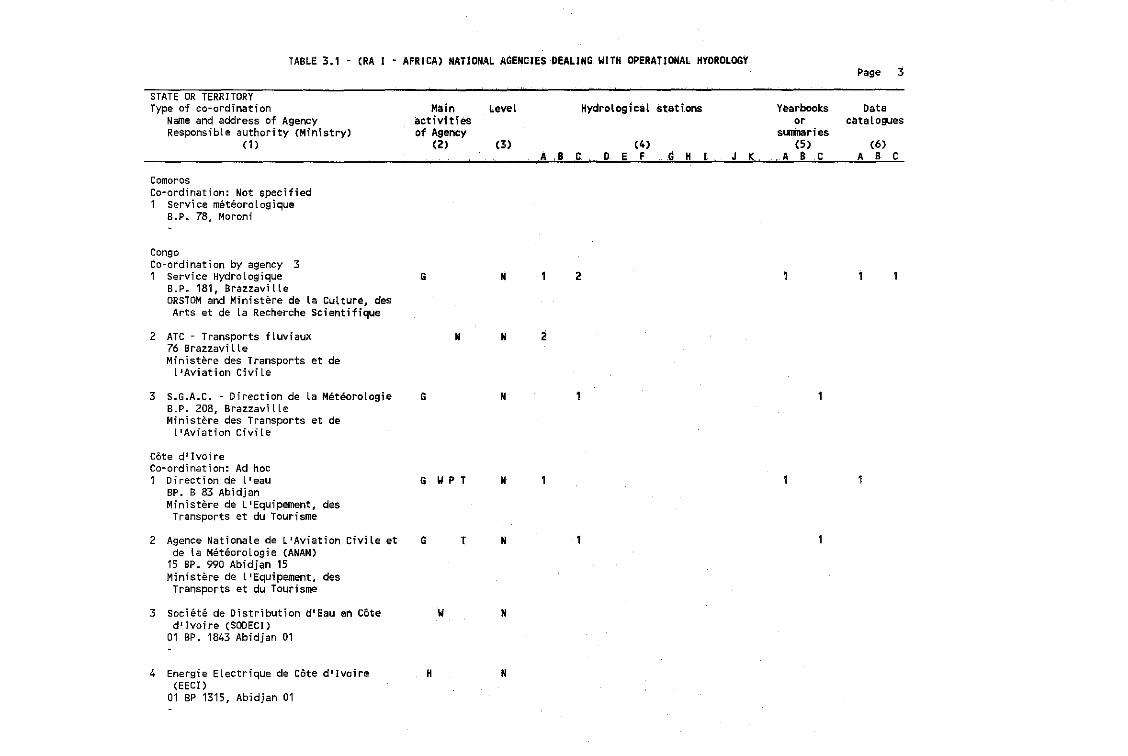
TABLE 3.1 - (RA I • AFRICA) NATIONAL AGENCIE$ DEALING. WITN OPERATIONAL HYDROLOGYPage 3
(6)ABC
Datacatalogues
Hydrological stati.ons Yearbooksor
slIIInaries(3) (4) (5)
A ,BC D E F cl H I J K. ,A II C
LeveLMainact ivit h!'$
of Agency(2)
STATE OR TERRITORYType of co-ordination
Name and address of AgencyResponsible authority (Ministry)
(1)
ComorosCo-ordination: Not specified1 Service meteorologique
B.P. 78, Moroni
CongoCo~ordination by agency 31 Service Hydrologique
B.P. 181, BrazzavilleORSTOM and Ministere de La Culture, desArts et de La Recherche SCientifique
G N 2
2 ATC - Transports fluviaux76 Brazzav; lleMinistere des Transports et de
llAviation eiv; le
N N <I
3 S.G.A.C. - Direction de La MeteorologieB.P. 208, BrazzaviLleMinistere des Transports et de
l'Aviation Civile
G N
Cote d'ivoireCo-ordination: Ad hoc1 Direction de l'eau
BP. B 83 AbidjanMinistere de L'Equipement, des
Transports et du Tourisme
G W P T N
2 Agence Nationale de L'Aviation Civile etde la Meteorologie (ANAM)
15 BP. 990 Abidjan 15Ministere de l'Equipement. des
Transports et du Tourisme
G T N
3 societe de Distribution d'Eau en Coted'Ivoire (SODECI)
01 BP. 1843 Abidjan 01
W N
4 Energie Electrique de Cote dlIvoire(EECI)
01 BP 1315, Abidjan 01
H N
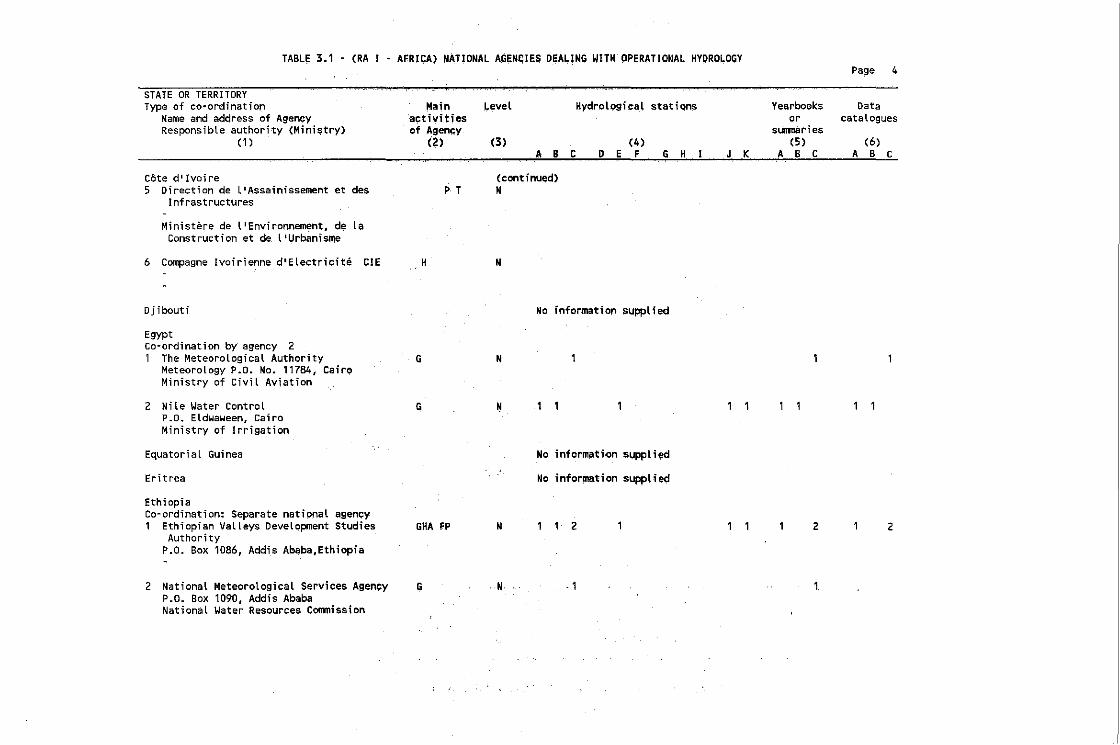
TABL~ 3.1 - (RA I - AFRI~A) NAT!ONALA~~NqI~S D~ALIN~ WITH OPERATIONAL HYDROLO~YPage 4
STATE OR TERRITORYType of co~ordinatior
Name and address of AgencyResponsibte authority (Mini~try)
(1)
Main ~evet
al;=tivitf~s
of AgenC;Y(2) (3)
Hydrological stations
(4)ABC 0 E F ~ H
Yearbooks Dataor catatoglJeS
surmaries(5 ) (6)
J K A B C A B C
Cote d'lvoire5 Direction de l'Assainissement et des
Infrastructures
Ministere de t'Environnern~nt. de laconstruction et de t'Urbanisme
6 Cornpagne Ivoirienne d'Electricite CIE ,H
Djibouti
p. T(continued)N
EgyptCo-ordination by agency 21 The Meteorotogicat Authority
Meteorology P.O. No. 11784. CairQMinistry of Civil Aviation
2 Nile Water ControLP.o. Eldwaween. CairoMinistry of Irrigation
EquatoriaL Guinea
Eritrea
EthiopiaCo-ordination: Separate national agency1 Ethiopian VaLleys Development Studies
Authori tyP.O. Box 1086. Addis Ab~ba.Ethiopia
2 National MeteorotogicaL Services Agen~y
P.O. Box 1090, Addis AbabaNationaL Water Resources commission
~
~
~HA FP
~ ·N - 1
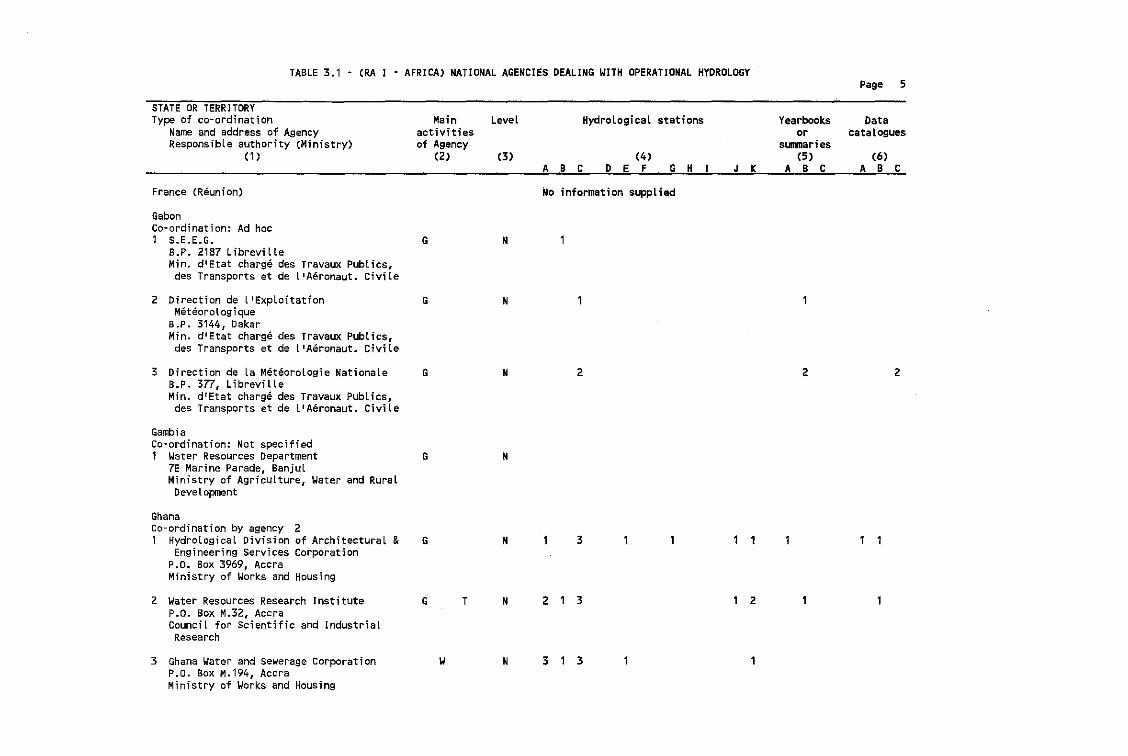
TABLE 3.1 • (RA I • AFRICA) NATIONAL AGENCIES DEALING WITH OPERATIONAL HYDROLOGYPage 5
STATE OR TERRITORYType of co-ordination
Name and address of AgencyResponsible authority (Ministry)
(1)
France (Reunion)
Main Levelactivitiesof Agency
(2) (3)
Hydrological stations
(4)ABC D E F G H
No information supplied
J K
Yearbooksor
sl.m1Daries(5)
ABC
DatacataLogues
(6)ABC
GabonCo-ordination: Ad hoc1 S.E.E.G.
B.P. 2187 LibrevilleMin. dlEtat charge des Travaux Publics,des Transports et de l'Aeronaut. Civile
2 Direction de l'ExploitationMeteorologique
B.P. 3144, DakarMin. dl·Etat charge des Travaux Publ ies,des Transports et de l'Aeronaut. Civile
3 Direction de La Meteorologie NationaLeB.P. 377, LibrevilleMin. d'Etat charge des Travaux Publics,
des Transports et de l'Aeronaut. CiviLe
GambiaCo-ordination: Not specified1 Water Resources Department
7E Marine Parade, BanjulMinistry of Agriculture, Water and Rural
Development
GhanaCo-ordination by agency 21 Hydrological Division of Architectural &
Engineering Services corporationP.O. Box 3969, AccraMinistry of Works and Housing
2 Water Resources Research InstituteP.O. Box M.32, AccraCounciL for Scientific and IndustrialResearch
3 Ghana Water and Sewerage CorporationP.O. Box M.194, AccraMinistry of Works and Housing
G
G
G
G
G
G
W
T
N
N
N
N
N
N
N
2
3
2 1 3
3 1 3
2
2 2
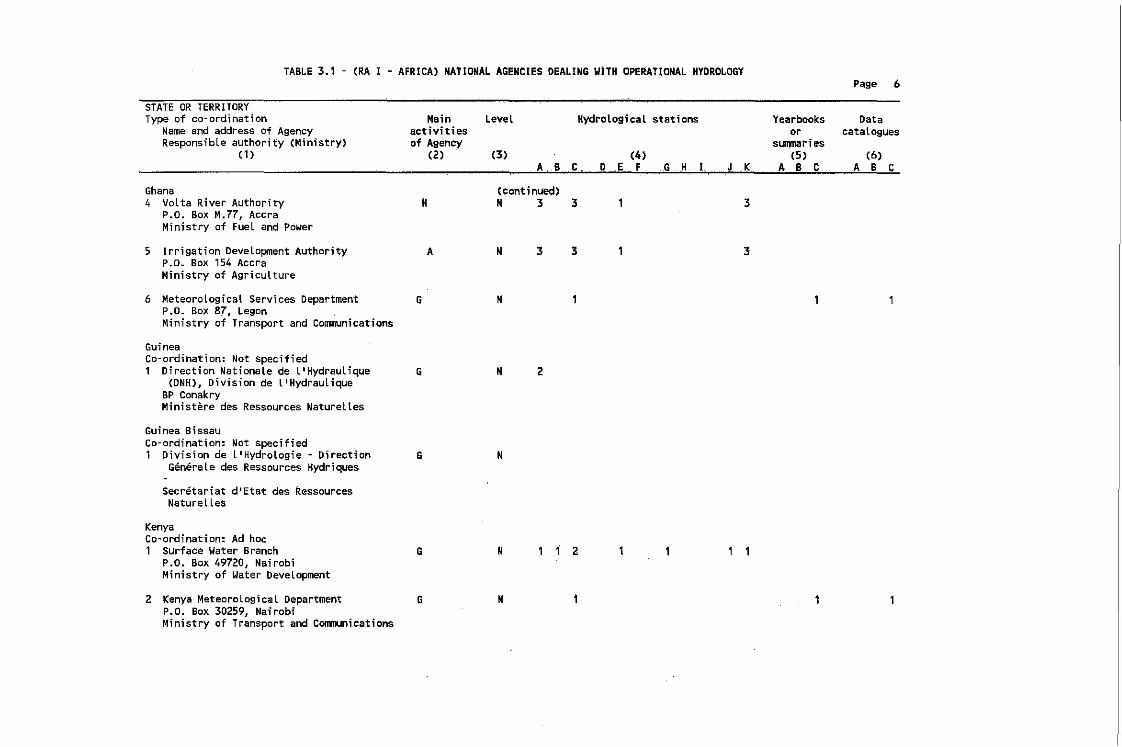
TABLE 3.1 - (RA I - AFRICA) NATIONAL AGENCIES DEALING WITH OPERATIONAL HYDROLOGYPage 6
3
3
Yearbooks Dataor cataLogues
sLIIJMt'ies(5) (6)
J K A B C A B C
Hydrological stations
(3) (4)
A B C D E F G H
(continued)N 3 3
N 3 3A
H
Main Levelactivitiesof Agency
(2)
Ghana4 Volta River Authority
p.o. Box M.7?, AccraMinistry of Fuel and Power
STATE OR TERRITORYType of co-ordination
Name and address of AgencyResponsible authority (Ministry)
(1)
5 Irrigation Development Authorityp.o. Box 154 AccraMinistry of Agriculture
6 Meteorological Services DepartmentP.O. Box 87, LeganMinistry of Transport and Communications
G N
GuineaCo-ordination: Not specified1 Direction Nationale de l'Hydraulique
(ONH), Division de l'HydrauliqueBP ConakryMinistere des Ressources Naturelles
G N 2
Guinea BissauCo-ordination: Not specified1 Division de l'Hydrologie Direction
Generate des Ressources HydriquesG N
Secretariat d'Etat des RessourcesNatureL Les
KenyaCo~ordination: Ad hoc1 Surface Water Branch
P.O. Box 49720, NairobiMinistry of Water DeveLopment
G N 2
2 Kenya MeteoroLogicaL DepartmentP.O. Box 30259, NairobiMinistry of Transport and communications
G N
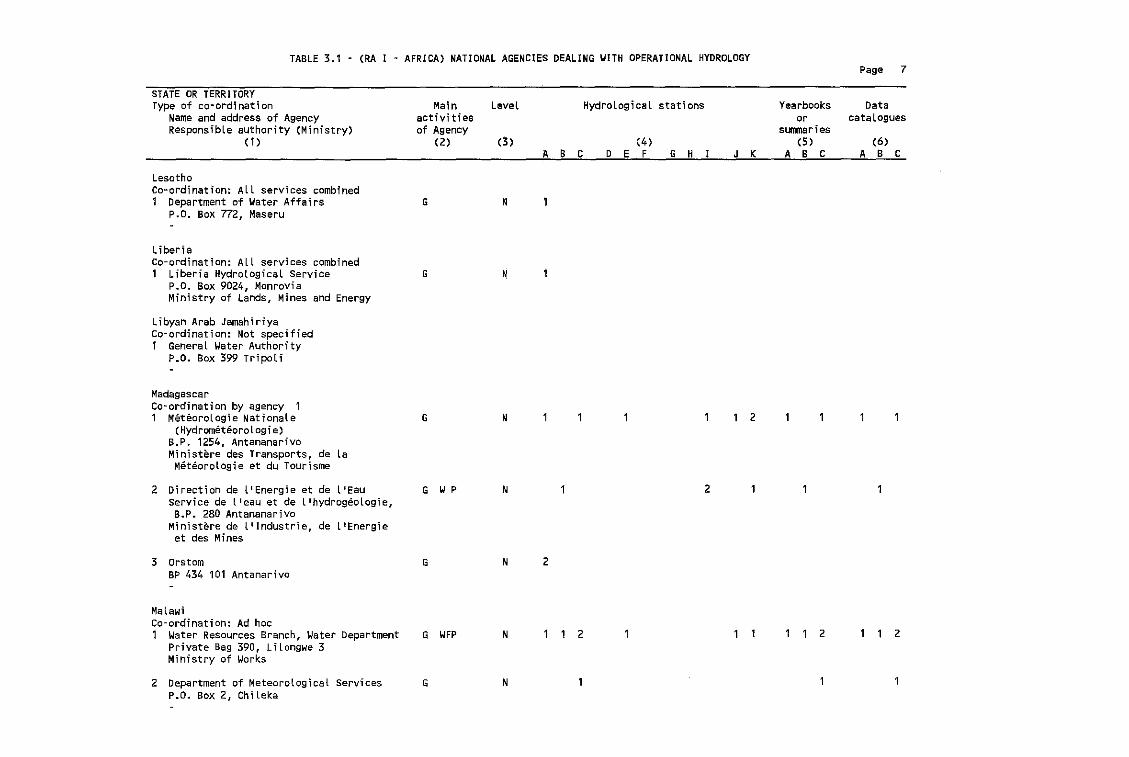
TABLE 3.1 - (RA I - AFRICA) NATIONAL AGENCIE,s OEALING WITH OPERATIONAL HYOROLOGYPage 7
STATE OR TERRITORYType of co-ordination
Name and address of AgencyResponsible authority (Ministry)
(1 )
LesothoCo-ordination: All services combined1 Department of Water Affairs
P.O. Box 772, Maseru
liberiaco-ordination: All services combined1 Liberia Hydrological Service
P.O. Box 9024, MonroviaMinistry of Lands, Mines and Energy
Libyan Arab JamahiriyaCo-ordination: Not specified1 General Water Authority
P.O. Box 399 Tripoli
MadagascarCo-ordination by agency 11 Meteorologie Nationale
(Hydrometeorologie)B.P. 1254, AntananarivoMinistere des Transports, de LaMeteorologie et du Tourisme
2 Directi,on de l'Energ;e et de l'Eauservice de lleau et de L'hydrogeologie,B.P. 280 Antananarivo
Ministere de l'Industrie, de llEnergieet des Mines
3 OrstomBP 434 101 Antanarivo
MaLawiCo-ordination: Ad hoc1 Water Resources Branch, Water Department
Private Bag 390, Lilongwe 3Ministry of Works
2 Department of Meteorological ServicesP.O. Box 2, ChiLeka
Mainactivitiesof Agency
(2)
G
G
G
G WP
G
G WFP
G
Level
(3 )
N
N
N
N
N
N
N
Hydrological stations
(4)ABC 0 E F G H
1
2
2
2
J K
2
Yearbooksor
surnnaries(5 )
ABC
2
Datacatalogues
(6)ABC
2
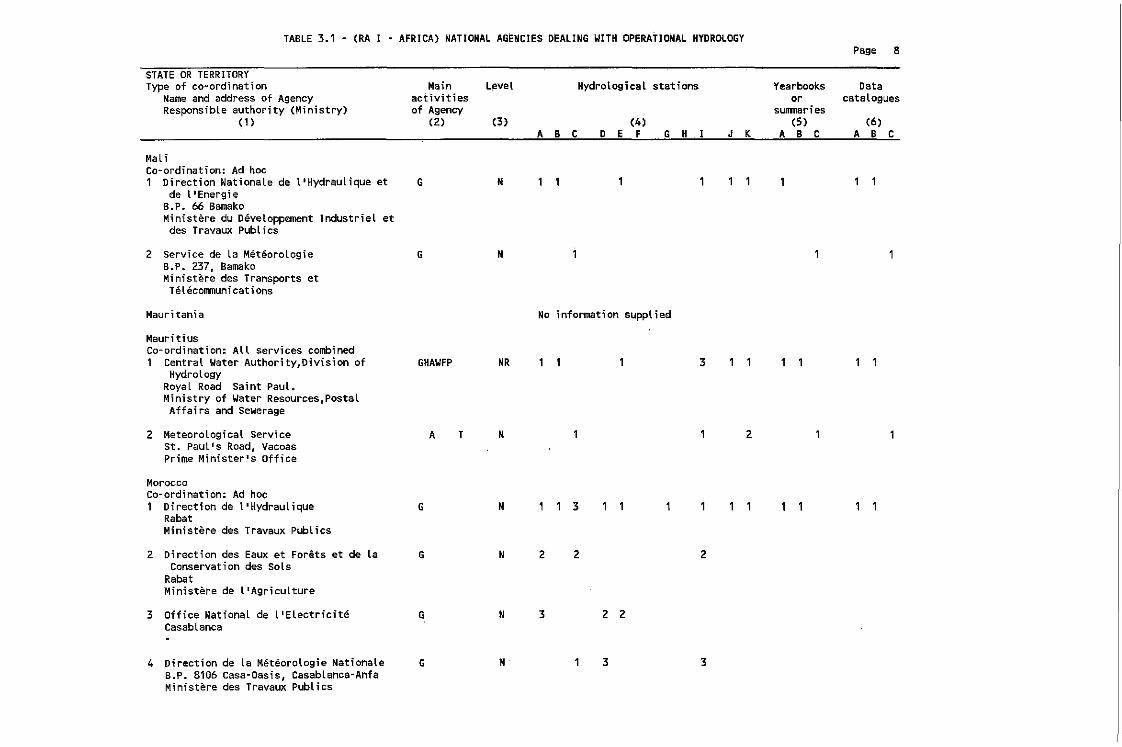
TABLE 3.1 - (RA I • AFRICA) NATIONAL AGENCIES DEALING WITH OPERATIONAL HYDROLOGYPage 8
STATE OR TERRITORYType of co-ordination
Name and address of AgencyResponsible authority (Ministry)
(1)
Main L~vel
activitiesof Agency
(2) (3)
Hydrological stations
(4)ABC D E F G H
Yearbooks Dataor catalogues
surnnaries(5) (6)
J K A B C A B C
MaliCo-ordination: Ad hoc1 Direction Nationale de l'Hydraulique et
de l'EnergieB.P. 66 BamakoMinistere du Developpement IndustrieL etdes Travaux Publics
2 Service de La MeteorologieB.P. 237, BamakoMinistere des Transports etTelecommunications
Mauritania
MauritiusCo-ordination: All services combined1 CentraL Water Authority,O;v;sion of
HydrologyRoyal Road Saint Paul.Ministry of Water Resources,PostalAffairs and Sewerage
2 Meteorological serviceSt. Pautls Road, VacoasPrime Minister's office
MoroccoCo-ordination: Ad hoc1 Direction de llHydraulique
RabatMinistere des Travaux Publics
G
G
GHAWFP
A
G
T
N
N
NR
N
N
No information supplied
3
3
2
2 Direction des Eaux et Forets et de laConservation des Sols
RabatMinistere de l'Agriculture
3 Office NationaL de l'ElectriciteCasabLanca
4 Direction de La Meteorologie NationaleB.P. 8106 Casa-Oasis, Casablanca-AnfaMinistere des Travaux Publics
G
G
G
N
N
N
2
3
2
2 2
3
2
3
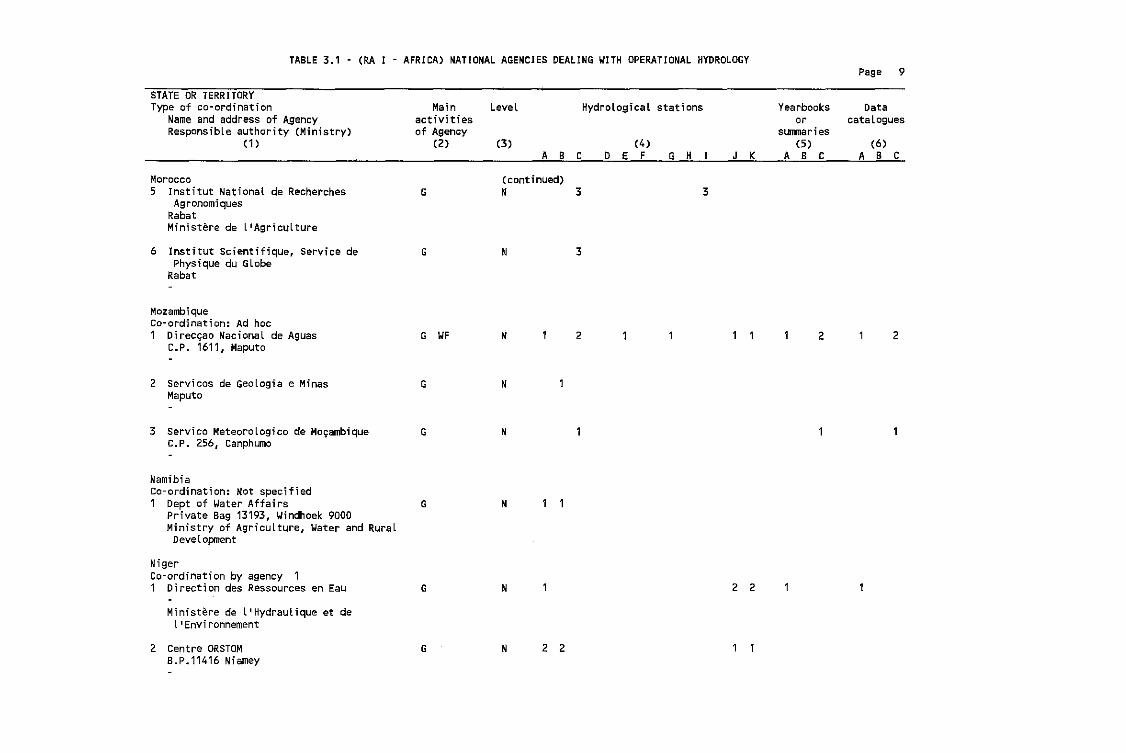
TABLE 3.1 - (RA I - AFRICA) NATIONAL AGENCIES DEALING WITH OPERATIONAL HYDROLOGYPage 9
STATE OR TERRITORYType of co-ordination
Name and address of AgencyResponsible authority (Ministry)
(1)
Morocco5 Institut National de Recherches
AgronomiquesRabatMinistere de llAgriculture
Main Level Hydrological stationsactivitiesof Agency
(2) (3) (4)
A B C D E F G H
(continued)G N 3 3
Yearbooks Dataor catalogues
sumnaries(5 ) (6)
J K A B C A B C
6 Institut Scientifique, Service dePhysique du Globe
Rabat
MozambiqueCo-ordination: Ad hoc1 Direc~ao NacionaL de Aguas
C.P. 1611, Maputo
2 Servicos de Geologia e MinasMaputo
3 Servico Meteorologico de M09ambiqueC.P. 256, Canphumo
Namib; aCo-ordination: Not specified1 Dept of Water Affairs
Private Bag 13193, Windhoek 9000Ministry of Agriculture, Water and Rural
Development
NigerCo·ordination by agency 11 Direction des Ressources en Eau
Ministere de l'Hydraulique et del l Envi ronnement
2 Centre ORSTOMB.P.11416 Niamey
G
G WF
G
G
G
G
G
N
N
N
N
N
N
N 2 2
3
2
2 2
2 2
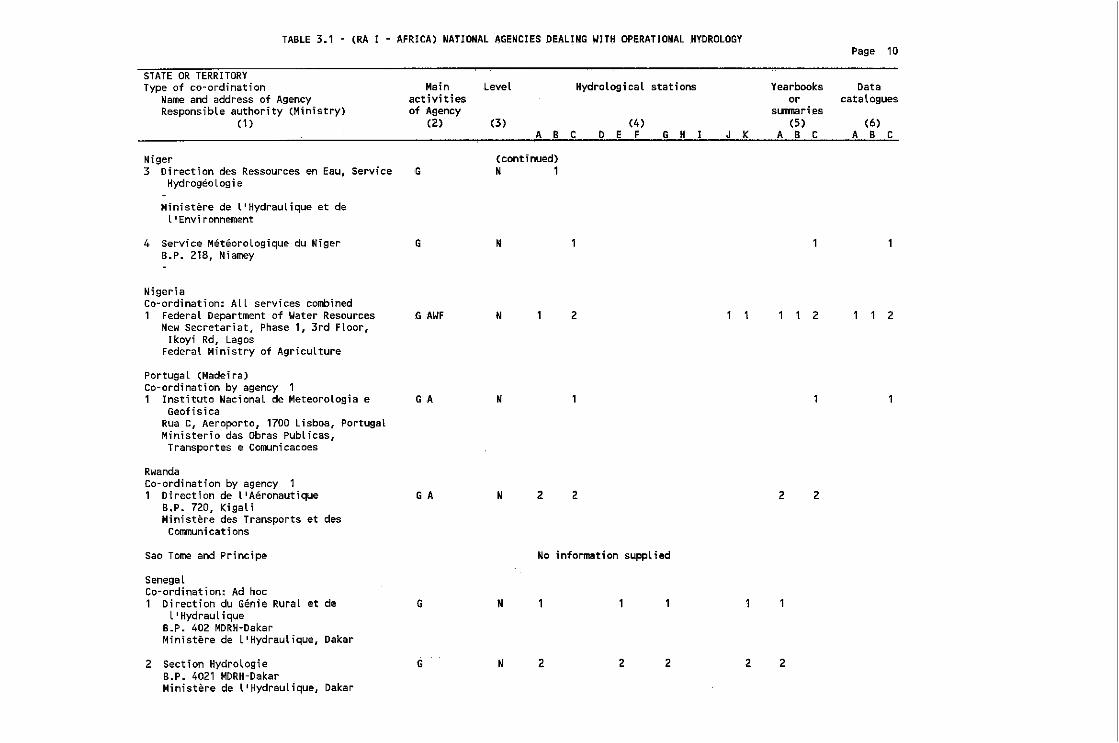
TABLE 3.1 - (RA I - AFRICA) NATIONAL AGENCIES OEALING WIT~ OPERATIONAL .HYDROLOGYPage 10
STATE OR TERRITORYType of co~ordination
Name and address of AgencyResponsible authority (Ministry)
(1)
Niger3 Direction des Ressources en Eau, Service
Hydrogeologie
Ministere de l'HydrauLique et deLI Envi ronnement
Main Level Hydrological stationsactivitiesof Agency
(2) (3) (4)A B C 0 E F G H
(continued)G N 1
Yearbooks Dataor catalogues
s'unmaries(5) (6)
J K A B C A B C
4 Service MeteoroLogique du NigerB.P. 218, Niamey
NigeriaCo-ordination: All services combined1 Federal Department of Water Resources
New Secretariat, Phase 1, 3rd Floor,I kay; Rd, Lagos
Federal Ministry of Agriculture
Portugal (Madeira)Co-ordination by agency 11 Instituto Nacional de Meteorologia e
GeofisicaRua C, Aeroporto, 1700 Lisboa, PortugalMinisterio das Obras Publicas,Transportes e Comunicacoes
RwandaCo-ordination by agency 11 Direction de l'Aeronautique
B.P. 720, KigaliMinistere des Transports et des
COlTlTlunications
G
'G AWF
G A
G A
N
N
N
N 2
2
2 2
2
2
2
Sao Tome and Principe
senegalCo-ordination: Ad hoc1 Direction du Genie Rural et de
l'HydrauliqueB.P. 402 MDRH-DakarMinistere de l'Hydraulique, Dakar
G N
No information supplied
2 Section HydrologieB.P. 4021 MDRH-DakarMinistere de l'Hydraulique, Dakar
G N 2 2 2 2 2
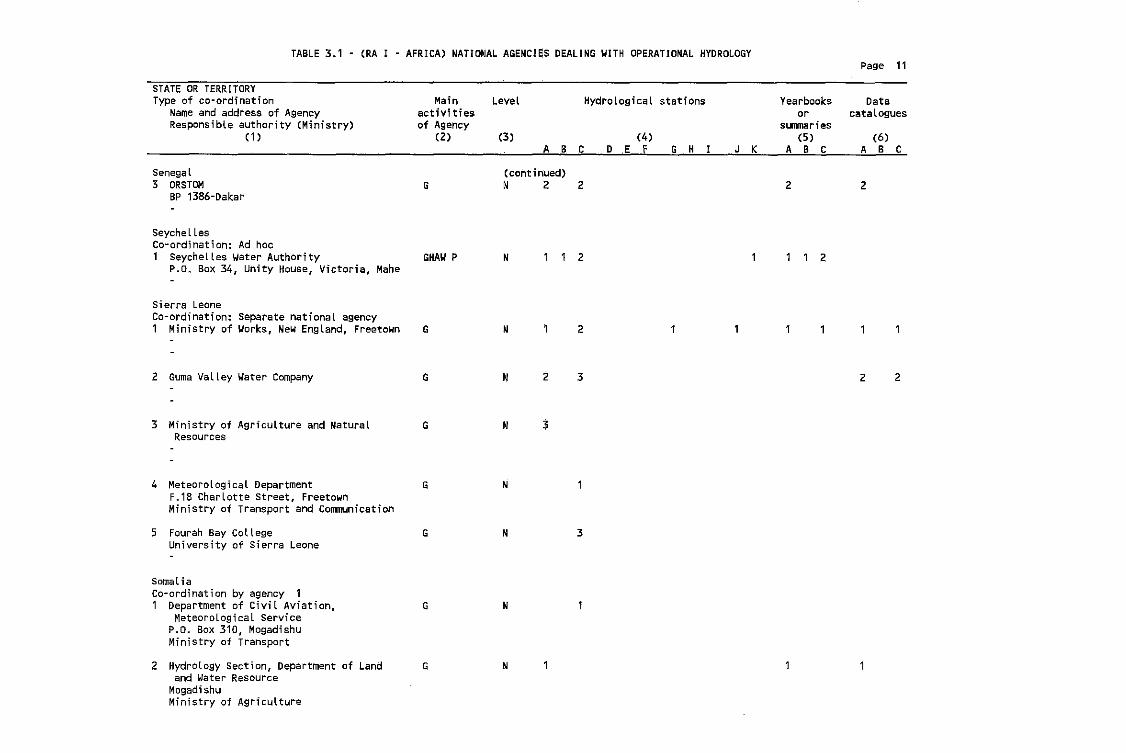
TABLE 3.1 - (RA I - AFRICA) NATIONAL AGENCIES DEALING WITH OPERATIONAL HYDROLOGYPage 11
STATE OR TERRITORYType of co·ordination
Name and address of AgencyResponsible authority (Ministry)
(1)
Main LeYelactivitiesof Agency
(2) (3)
Hydrological stations
(4)ABC DE, G H J K
Yearbooksor
slIIIllar i es(5 )
ABC
DatacataLogues
(6)ABC
Senegal3 ORSTOM
BP 1386-DakarG
(continued)N ,2 2 2 2
SeychellesCo·ordination: Ad hoc1 Seychelles Water Authority
P.o" Box 34, Unity House, Victoria, Mahe
Sierra LeoneCo-ordination: Separate nationaL agency1 Ministry of Works, New England, Freetown
2 Guma Valley Water Company
3 Ministry of Agriculture and NaturalResources
4 Meteorological DepartmentF.18 CharLotte Street, FreetownMinistry of Transport and Communication
5 Fourah Bay CollegeUniversity of Sierra Leone
SomaliaCo-ordination by agency 11 Department of Civil Aviation,
Meteorological ServiceP.o. Box 310, MogadishuMinistry of Transport
2 Hydrology Section, Department of Landand Water Resource
MogadishuMinistry of Agriculture
GHAW P
G
G
G
G
G
G
G
N
N
N
N
N
N
N
N
2
3
2
2
3
3
2
2 2
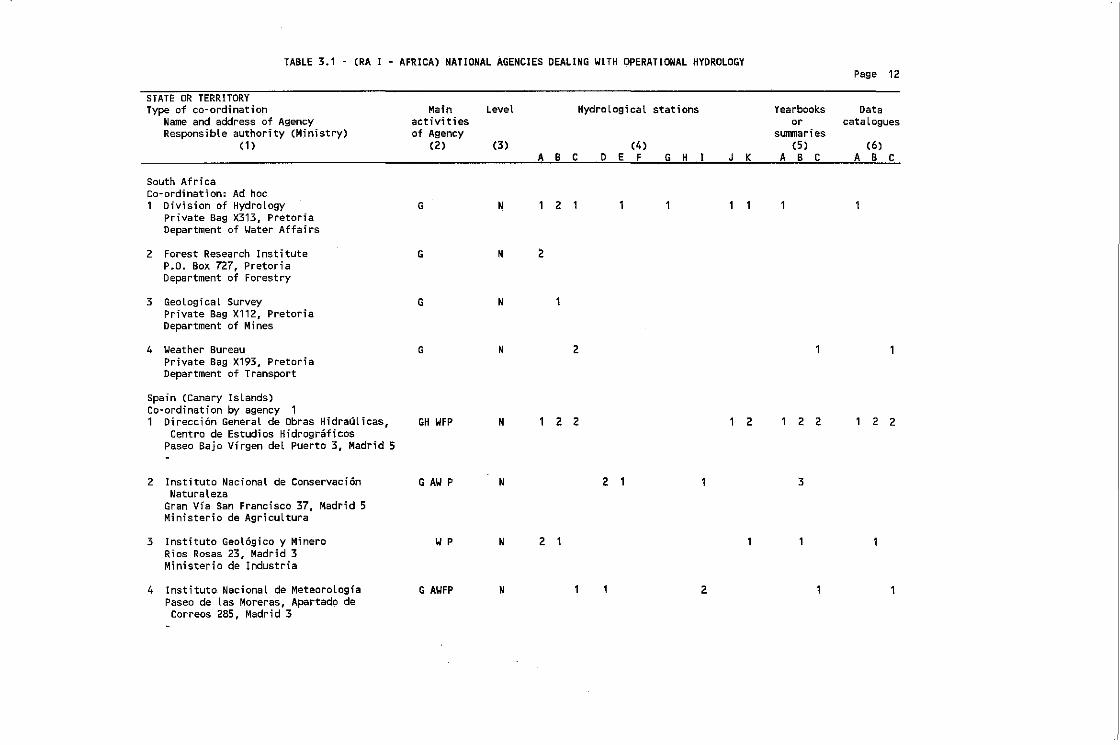
TABLE 3.1 - (RA I - AFRICA) NATIONAL AGENCIES DEALING WITH OPERATIONAL HYDROLOGYPage 12
STATE DR TERRITORYType of co-ordination Main Level Hydrological stations Yearbooks Data
Name and address of Agency activities or cataloguesResponsible authority (Ministry) of Agency sunmaries
(1) (2) (3 ) (4) (5 ) (6)
A B C D E F G H .1 J K A B C A B C
South AfricaCo-ordination: Ad hoc1 Division of Hydrology G N 1 2 1
Private Bag X313, PretoriaDepartment of ~ater Affairs
2 Forest Research Institute G N 2P.O. Box 727, PretoriaDepartment of Forestry
3 Geological Survey G NPrivate Bag X112, PretoriaDepartment of Mines
4 Weather Bureau G N 2Private Bag X193, PretoriaDepartment of Transport
Spain (Canary Islands)Co-ordination by agency 11 Direcci6n General de Obras HidrauLicas, GH WFP N 1 2 2 1 2 1 2 2 1 2 2
Centro de Estudios HidrograficosPaseo Baja Virgen del Puerto 3, Madrid 5
2 Instituto Nacional de Conservacion G AW P N 2 1 1 3Naturaleza
Gran Via San Francisco 37, Madrid 5Ministerio de AgricuLtura
3 Instituto Geologico y Minero WP N 2 1Rios Rosas 23, Madrid 3Ministerio de Industria
4 Instituto NacionaL de Meteorologia G AWFP N 1 1 2Paseo de Las Moreras, Apartado deCorreos 285, Madrid 3
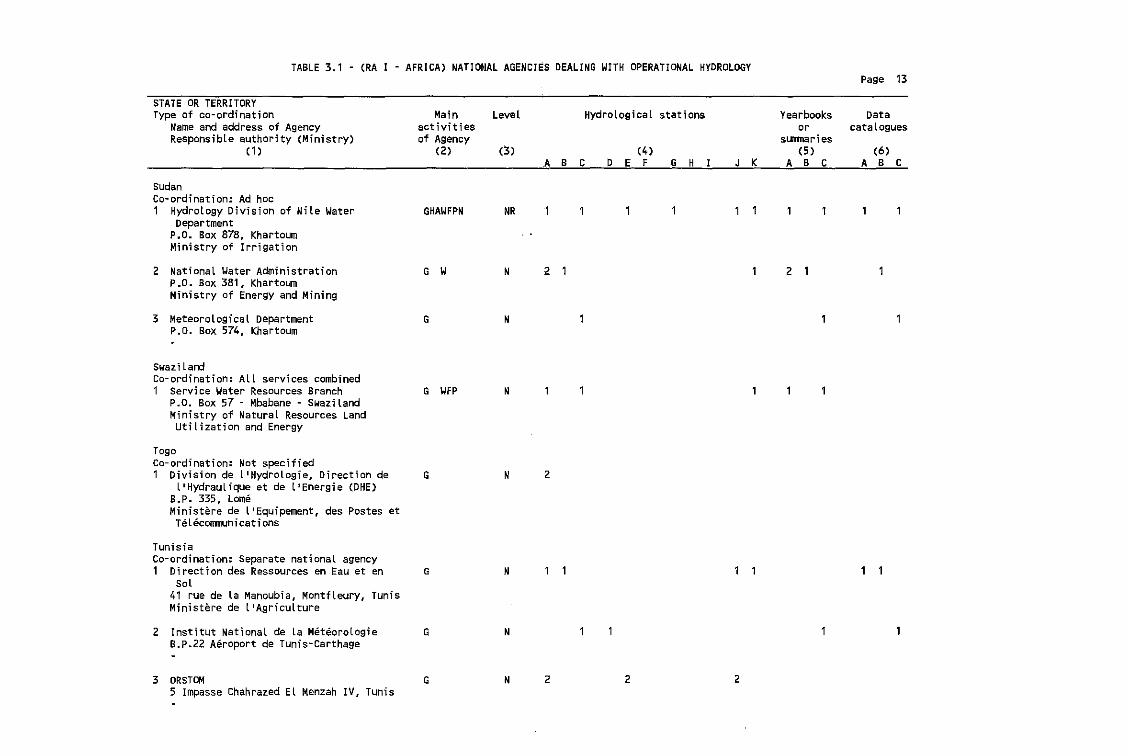
TABLE 3.1 - (RA I - AFRICA) NATIONAL AGENCIES DEALING WITH OPERATIDNAL HYDROLOGYPage 13
STATE OR TERRITORYType of co-ordination Main Level Hydrological stations Yearbooks Data
Name and address of Agency activities or cataloguesResponsible authority (Ministry) of Agency sunmari es
(1 ) (2) (3) (4) (5 ) (6)A B C D E F G H I J K A B C A B C
SudanCo-ordination: Ad hoc1 Hydrology Division of Nile Water GHAWFPN NR
DepartmentP.O. Box 878, KhartoumMinistry of Irrigation
2 National Yater Administration G W N 2 1 1 2P.O. Box 381, KhartoumMinistry of Energy and Mining
3 Meteorological Department G NP.O. Box 574, Khartoum
Swazllardco-ordination: All services combined1 Service Water Resources Branch G WFP N
P.O. Box 57 - Mbabane - SwazilandMinistry of Natural Resources LandUtilization and Energy
TogoCo-ordination: Not specified1 Division de L'Hydrolog;e, Direction de G N 2
l'Hydraulique et de llEnergie (DHE)B.P. 335, LomeMinistere de l'Equipement, des Postes et
Telecommunications
TunisiaCo-ordination: Separate national agency1 Direction des Ressources en Eau et en G N
Sol41 rue de la Manoubia, Montfleury, TunisMinistere de l'Agriculture
2 Institut National de la Meteorologie G NB.P.22 Aeroport de Tunis-Carthage
3 ORSTOM G N 2 2 25 Impasse Chahrazed El Menzah IV, Tunis
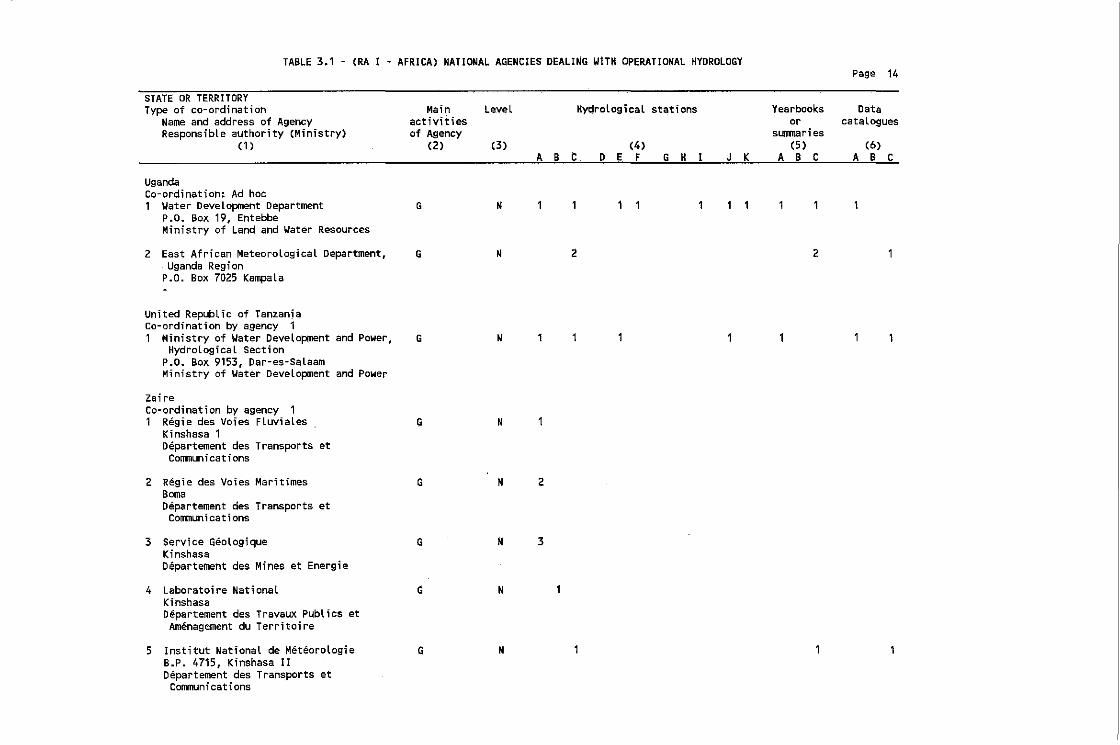
TABLE 3.1 - (RA I - AFRICA) NATIONAL AGENCIES OEALlNG WtTN OPERATIONAL NYDROLOGY
STATE OR TERRITDRYType of co-ordination
Name and address of AgencyResponsible authority (Ministry)
(1)
UgandaCo-ordination: Ad hoc1 Water Development Department
P.O. Box 19, EntebbeMinistry of Land and Water Resources
2 East African Meteorological Department,. Uganda Reg; onP.O. Box 7025 Kampala
Page 14
Main Level Hydrological stations Yearbooks Dataactivities or cataloguesof Agency surnnaries
(2) (3) (4) (5 ) (6)A B C D E F G H I J K A B C A B C
G N
G N 2 2
United Republic of TanzanjaCo-ordination by agency 11 Ministry of Water DeveLopment and Power, G N
Hydrological SectionP.O. Box 9153, Dar-es-SalaamMinistry of Water Development and Power
ZaireCo-ordination by agency 11 Regie des VOles Fluviales G N
Kinshasa 1Departement des Transports et
COnT\1unications
2 Regie des Voies Maritimes G N 2BomaDepartement des Transports et
Corrmuni cati ons
3 Service GeologiqueKinshasaDepartement des Mines et Energie
4 Laboratoire NationalKinshasaDepartement des Travaux Publics et
Amenagement du Territoire
5 Institut National de MeteorologieB.P. 4715, Kinshasa IIDepartement des Transports etConmunications
G
G
G
N
N
N
3
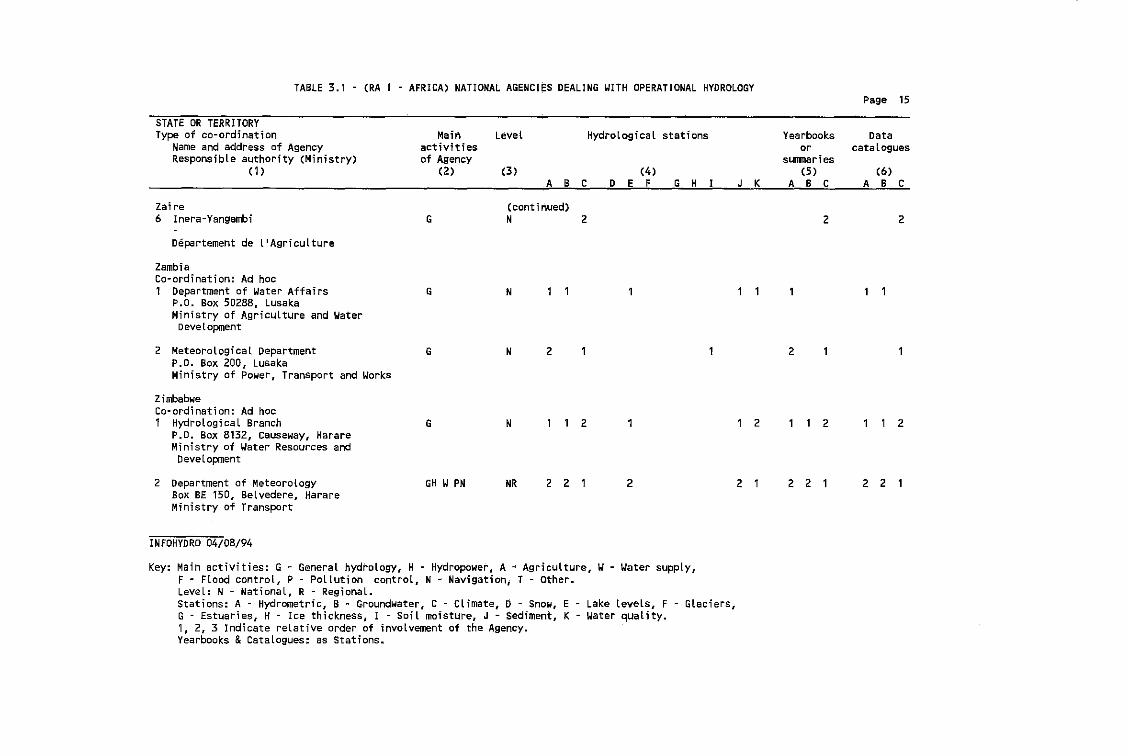
TABLE 3.1 - (RA I - AFRICA) NATIONAL AGENCIES DEALING WITH OPERATIONAL HYDROLOGYPage 15
STATE OR TERRITORYType of co-ordination
Name and address of AgencyResponsible authority (Ministry)
(1)
Zaire6 Inera-Yangambi
Departement de l'AgricuLture
Main Level Hydrological stationsactivitiesof Agency
(2) (3) (4)A B C 0 E F G H
(continued)G N 2
J K
Yearbooksor
sunmaries(5)
ABC
2
Datacatalogues
(6)ABC
2
ZambiaCo-ordination: Ad hoc1 Department of Water Affairs
P.O. Box 50288, LusakaMinistry of Agriculture and Water
Deve l opment
2 Meteorological DepartmentP.O. Box 200, LusakaMinistry of Power, Transport and Works
ZimbabweCo-ordination: Ad hoc1 Hydrological Branch
P.O. Box 8132, Causeway, HarareMinistry of Water Resources and
Deve lopment
2 Department of MeteorologyBox BE 150, Belvedere, HarareMinistry of Transport
INFOHYORO 04/08/94
G
G
G
GH W PN
'N
N
N
NR
2
2
221 2
2
2 1
2
2
221
2
2 2
Key: Main activities: G - General hydrology, H - Hydropower, A ~ Agriculture, W- Water supply,F - Flood control, P - Pollution control, N - Navigation, T - Other.Level: N - National, R - Regional.Stations: A - Hydrometric, B - Groundwater, C - Climate, D Snow, E Lake levels, F - Glaciers,G - Estuaries, H - Ice thickness, I - Soil moisture, J - Sediment, K water quality.1, 2, 3 Indicate relative order of involvement of the Agency.Yearbooks &Catalogues: as Stations.

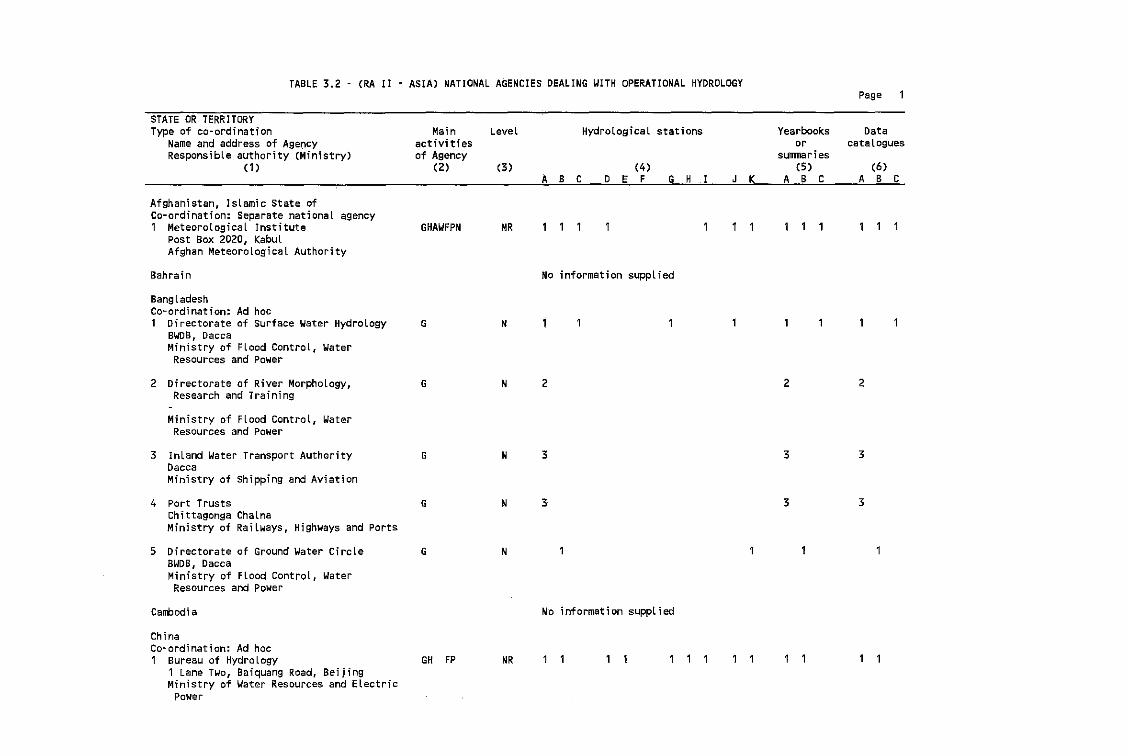
TABLE 3.2 - (RA II - ASIA) NATIONAL AGENCIES DEALING WITH OPERATIONAL HYDROLOGYPage
STATE OR TERRITORYType of co-ordination
Name and address of AgencyResponsible authority (Ministry)
(1)
Main LeveL Hydrological stationsactivitiesof Agency
(2) (3) (4)A B C 0 E F G H J K
Yearbooksor
sunmari es(5 )
ABC
Datacatalogues
(6)ABC
Afghanistan, Islamic State ofCo-ordination: Separate national agency1 MeteorologicaL Institute
Post Box 2020, KabuLAfghan MeteorologicaL Authority
Bahrain
BangladeshCo-ordination: Ad hoc1 Directorate of Surface Water Hydrology
BWDB, DaccaMinistry of Flood Control, Water
Resources and Power
2 Directorate of River Morphology,Research and Training
Ministry of Flood Control, WaterResources and Power
3 InLand Water Transport AuthorityDaccaMinistry of Shipping and Aviation
4 Port TrustsChittagonga ChalnaMinistry of Railways, Highways and Ports
5 Directorate of Ground Water CircleBWDB, DaccaMinistry of Flood Control, Water
Resources and Power
Carmodia
ChinaCo~ordination: Ad hoc1 Bureau of Hydrology
1 Lane Two, Baiquang Road, BeijingMinistry of Water Resources and Electric
Power
GHAWFPN
G
G
G
G
G
GH FP
NR
N
N
N
N
N
NR
No information supplied
2
3
3
No information supplied
2
3
3
2
3
3
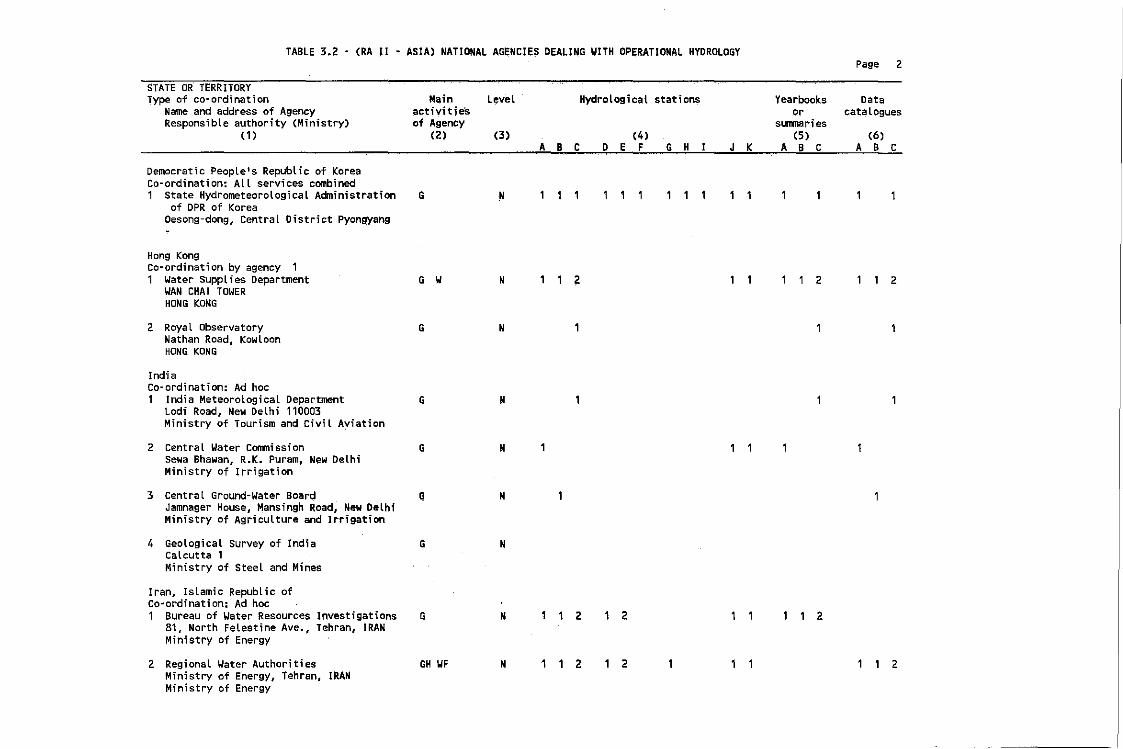
TABLE ~.2 - (RA II • ASIA) NATIONAL AGENCIES DEALING WITH DPERATIONAL HYDROLOGYPage 2
STATE OR TERRITORYType of co-ordination Main L~vel HydrologicaL stations Yearbooks Data
Name and address of Agency activit;e's or ca1;aloguesResponsible authority (Ministry) of Agency sunmaries
(1 ) (2) (3) (4) (5) (6)A B C D E F G H I J K A B C A B C
Democratic PeopLe's Republic of KoreaCo-ordination: ALL services combined1 State Hydrometeorological Administration G N
of DPR of KoreaOesong-dong, Central District Pyongyang
Hong KongCo-ordination by agency 11 Water Supplies Department G W N 1 1 2 1 1 1 1 2 1 1 2
WAN CHAI TOWERHONG KONG
2 Royal Observatory G NNathan Road, KowloonHONG KONG
IndiaCo-ordination: Ad hoc1 India Meteorological Department G N
Lod; Road, New Delhi 110003Ministry of Tourism and Civil Aviation
2 Central Water Commission G NSewa Shawan, R.K. Puram, New DelhiMinistry of Irrigation
3 Central Ground-Water Board G NJamnager House, Mansingh Road, New DelhiMinistry of Agriculture and Irrigation
4 Geological survey of India G NCalcutta 1Ministry of Steel and Mines
Iran, Islamic Republic ofCo~ordination: Ad hoc1 Bureau of Water Resources Investigations G N , 1 2 1 2 1 1 1 1 2
81, North Felestine Ave., Tehran, IRANMinistry of Energy
2 Reg onal Water Authorities GH WF N 1 1 2 1 2 1 1 1 1 1 2Min stry of Energy, Tehran, IRANMin stry of Energy
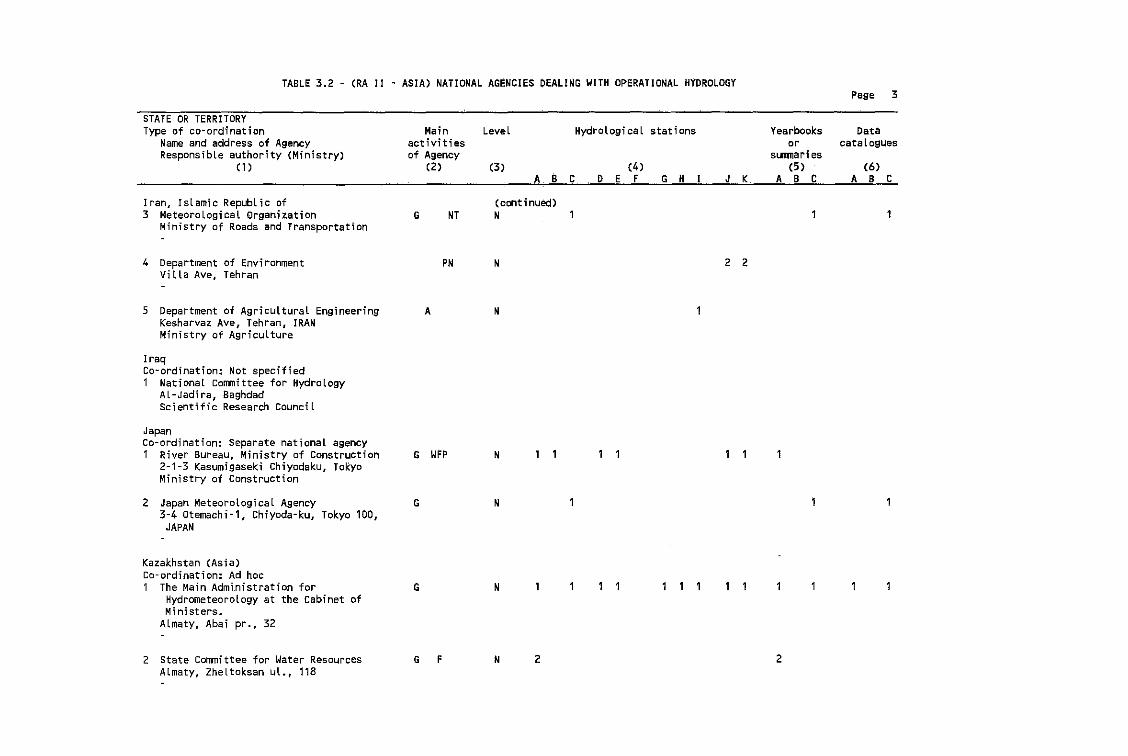
TABLE 3.2 - (RA II - ASIA) NATiONAL AGENCIES DEALING WITH OPERATIONAL HYDROLOGYPage 3
STATE OR TERRITORYType of COM ordination
Name and address of AgencyResponsibLe authority (Ministry)
(1)
Iran, Islamic RepubLic of3 MeteoroLogical Organization
Ministry of Roads and Transportation
4 Department of EnvironmentVilla Ave, Tehran
5 Department of Agricultural EngineeringKesharvaz Ave, Tehran, IRANMinistry of Agriculture
IraqCo-ordination: Not specified1 National committee for Hydrology
Al-Jadira, BaghdadScientific Research Council
Main Level Hydrological stationsactivitiesof Agency
(2) (3) (4)
~B t D E F G H
(continued)G NT N
PN N
A N
Yearbooks Dataor cataLogues
slIIII1ari es(5 ) (6)
J K A B t A B C
2 2
JapanCo-ordination: Separate national agency1 River Bureau, Ministry of Construction
2-1-3 Kasumigaseki Chiyodaku, TokyoMinistry of Construction
2 Japan Meteorological Agency3-4 Otemachi-1, Chiyoda-ku, Tokyo 100,
JAPAN
Kazakhstan (Asia)Co-ordination: Ad hoc1 The Main Admi.nistration for
Hydrometeorology at the cabinet ofMi ni sters.
Almaty, Abai pr., 32
2 State Committee for Water ResourcesAlmaty, Zheltoksan ul., 118
G WFP
G
G
G F
N
N
N
N 2 2
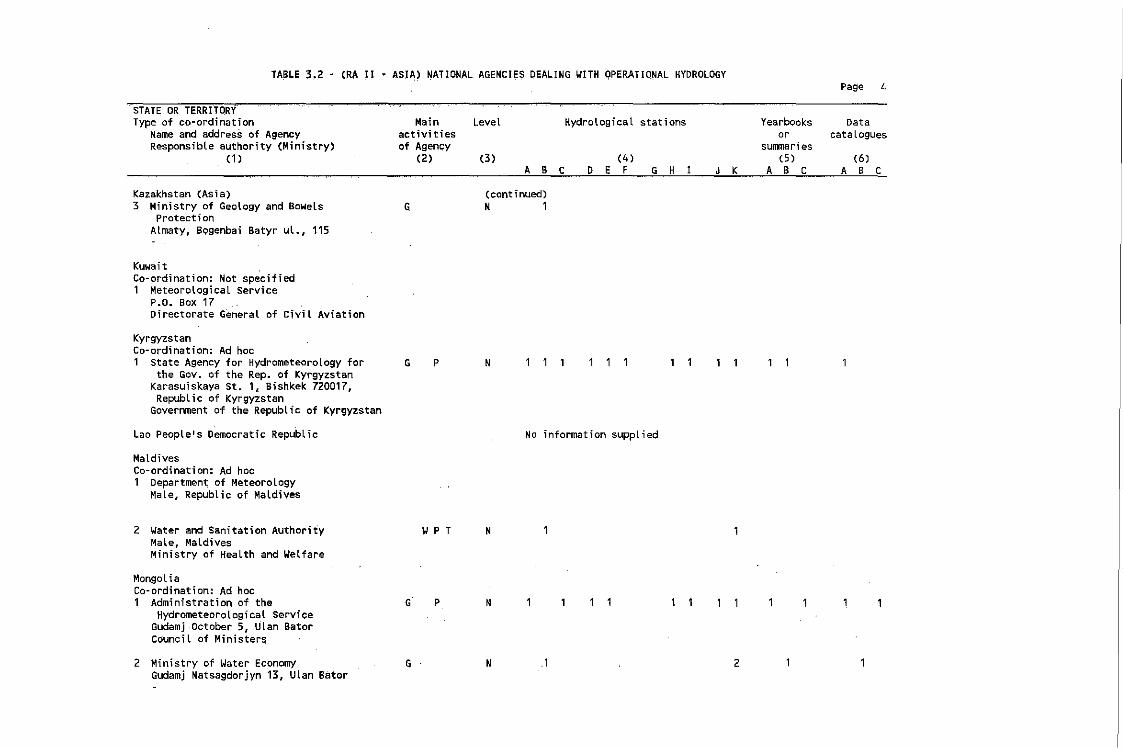
TA~L~ $.2 - (RA II - ASIA) NATIONAL AG~NCIES OEALING WITH OPERATIONAL HYDROLOGYPage Lf
STATE OR TERRItORYType of co-ordination
Name and address of AgencyResponsible authority (Ministry)
(1 )
Main Levelactivitiesof Agenc;y
(2) (3)
Hydrological stations
(4)ABC D E F G H
Yearbooks Dataor cataLogues
surrrnaries(5 ) (6)
J K A B c A B C
Kazakhstan (Asia)3 Ministry of Geology and Bowels
ProtectionAlmaty, BQgenbai satyr ut., 115
KuwaitCo-ordination: Not specified1 Meteorological Service
P.O. Box 17Directorate General of Civil Aviation
KyrgyzstanCo-ordination: Ad hoc1 State Agency for Hydrometeorology for
the Gov. of the Rep. of KyrgyzstanKarasuiskaya St. 1, Bishkek 720017,Republic of Kyrgyzstan
Government of the Republic of Kyrgyzstan
Lao People's Democratic Republic
MaldivesCo-ordination: Ad hoc1 Departmen~ of Meteorology
Male, Republic of Maldives
2 Water and Sanitation AuthorityMale, MaldivesMinistry of Health and Welfare
MongoliaCo-ordination: Ad hoc1 Administration of the
Hydrometeorological ServiceGudamj -October 5, Ulan BatorCouncil of Ministers
G
G
G·
P
WP T
P
(continued)N 1
N
No information supplied
N
N
2 Ministry of Water EconomyGudamj Natsagdorjyn 13, ULan Bator
G N .1 2
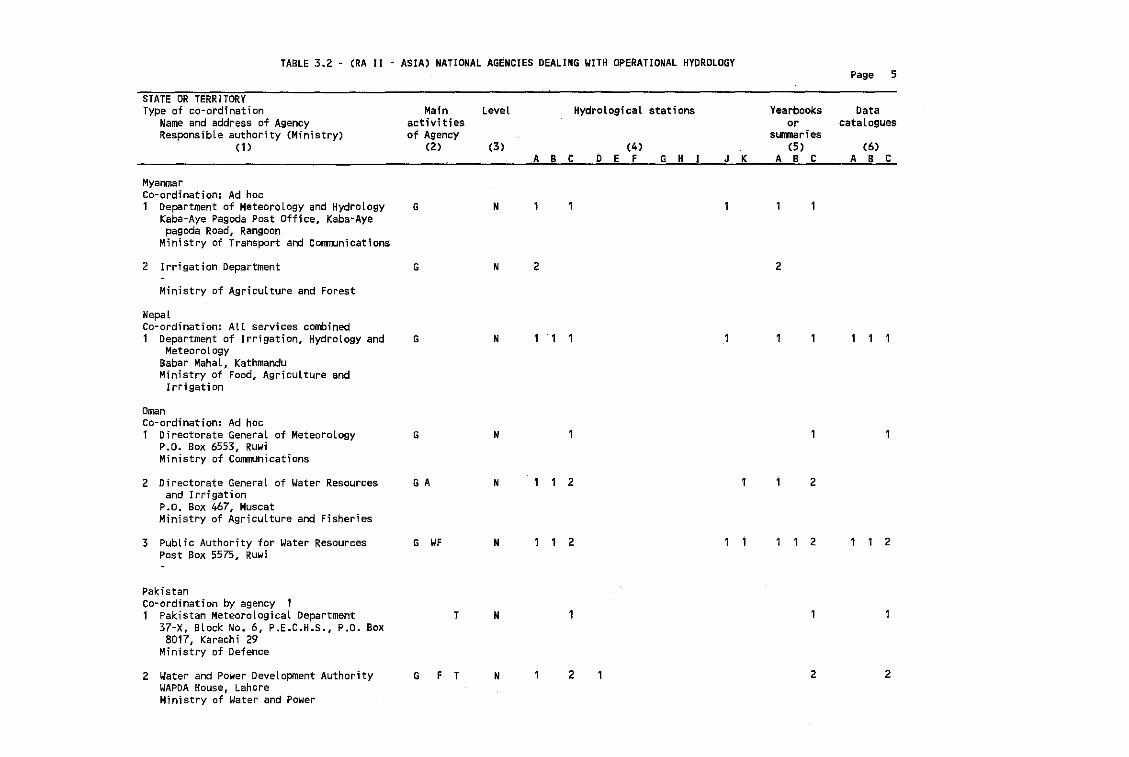
TABLE 3.2 - (RA II - ASIA) NATIONAL AGENCIES DEALING WITH OPERATIONAL HYDROLOGYPage 5
STATE OR TERRITORYType of co-ordination
Name and address of AgencyResponsible authority (Ministry)
(1)
Main Level HydroLogicaL stationsactivitiesof Agency
(2) (3) (4)A B C D E F G H
Yearbooks Dataor catalogues
sunmaries(5 ) (6)
J K A B C A B C
MyanmarCo-ordination: Ad hoc1 Department of Meteorology and Hydrology
Kaba-Aye Pagoda Post Office, Kaba-Ayepagoda Road, Rangoon
Ministry of Transport and Communications
2 Irrigation Department
Ministry of Agriculture and Forest
NepalCo-ordination: All services combined1 Department of Irrigation, Hydrology and
MeteorologyBabar Mahal , KathmanduMinistry of Food, Agriculture and
Irrigation
OmanCo-ordination: Ad hoc1 Directorate General of Meteorology
P.O. Box 6553, RuwiMinistry of Communications
2 Directorate General of Water Resourcesand Irrigation
P.o. Box 467, MuscatMinistry of Agriculture and Fisheries
3 Public Authority for Water ResourcesPost Box 5575~ Ruwi
PakistanCo~ordination by agency 11 Pakistan Meteorological Department
37~X, Block No.6, P.E.C.H.S., P.O. Box8017, Karachi 29
Ministry of Defence
2 Water and Power Development AuthorityWAPDA House, LahoreMinistry of Water and Power
G
G
G
G
G A
G WF
T
G F T
N
N
N
N
N
N
N
N
2
2
2
2
2
2
2
2
2
2
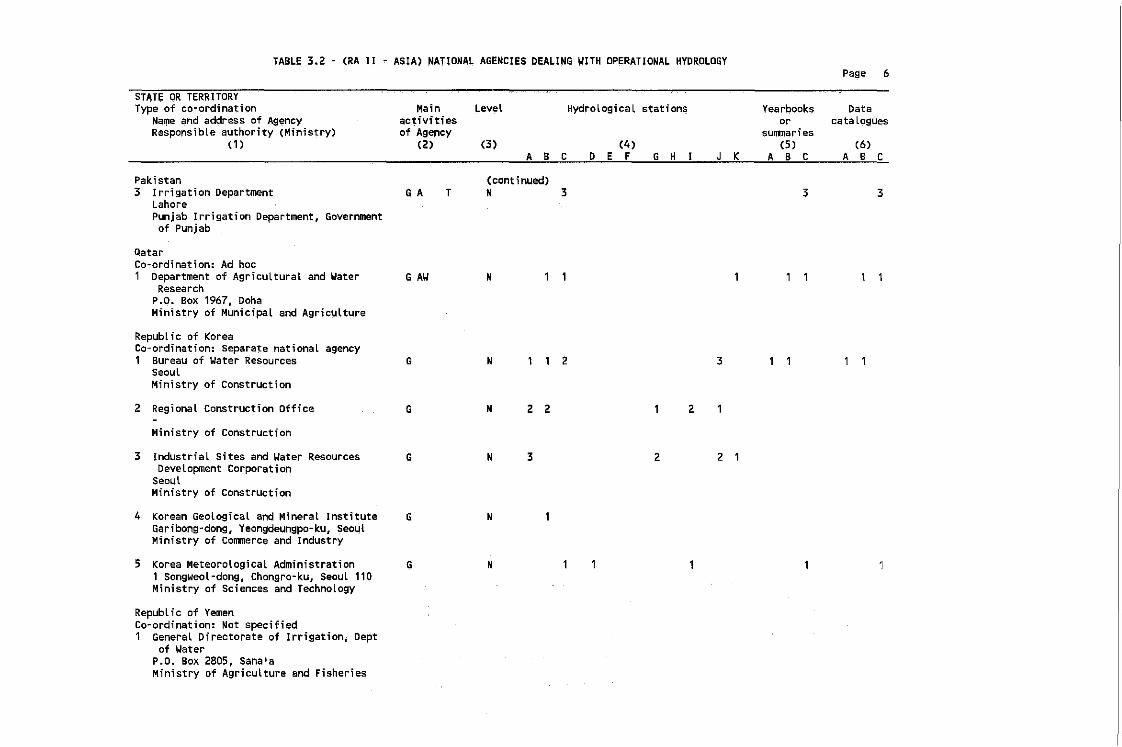
TABLE 3.? - (RA II - ASIA) ~ATIQ~AL ~GE~CIES DEALI~G WITH OPERATIO~AL HYDRQLOGYPage 6
STATE DR TERRITORYType of co~ordination
Na~e and address of Ag~ncy
Responsible authority (Ministry)(1)
Mainactivitiesof Agency
(2)
Level
(3)
HydrologicaL stations
(4)ABC D E F G H K
Yearbooksor
sunmaries(5 )
ABC
Datacatalogues
(6)ABC
Pakistan3 Irrigation Department
LahorePunjab Irrigation Department, Governmentof Punjab
QatarCo-ordination: Ad hoc1 Department of Agricultural and Yater
ResearchP.O. Box 1967, DohaMinistry of Municipal and Agriculture
~ A
G AW
T(continued)~ 3
~
3 3
Republic of KoreaCo-ordination: separate national agency1 Bureau of Water Resources
SeoulMinistry of construction
2 Regional Construction Office
Ministry of Construction
3 Industrial Sites and Water ResourcesDevelopment Corporation
SeoulMinistry of Construction
4 Korean Geological and Mineral InstituteGaribong~dong, Yeongdeungpo-ku, Seo~l
Ministry of Commerce and Industry
5 Korea Meteorological Administration1 Songweol-dong, Chongro-ku, Seoul 110Ministry of Sciences and Technology
Republic of YemenCo-ordination: Not specified1 General Directorate of Irrigation; Dept
of WaterP.O. Box 2805, Sana1aMinistry of Agriculture and Fisheries
G
G
G
G
\>
~
~
~
~
~
2 2
3
2
2
2
3
2 1
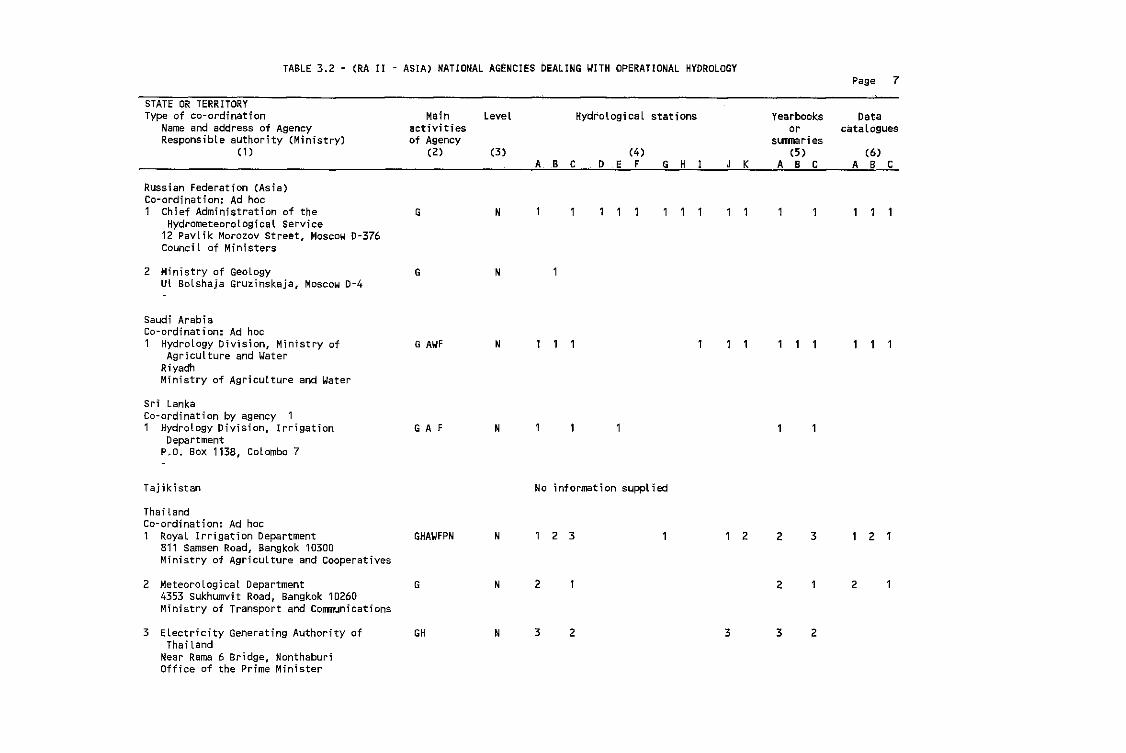
TABLE 3.2 - (RA II - ASIA) NATIONAL AGENCIES DEALING WITH OPERATIONAL HYDROLOGYPage 7
STATE OR TERRITORYType of co-ordination
Name and address of AgencyResponsible authority (Ministry)
(1 )
Main Levelactivitiesof Agency
(2) (3)
Hydrological stations
(4)A. BCD E F G H
yearbooks Dataor catalogues
sunmaries(5 ) (6)
K A B C A B C
Russian Federation (Asia)Co-ordination: Ad hoc1 Chief Administration of the
Hydrometeorological service12 Pavlik Morozov Street, Moscow 0-376Council of Ministers
2 Ministry of GeologyUl Bolshaja Gruzinskaja, Moscow 0-4
Saudi Arabi aCo-ordination: Ad hoc1 Hydrology Division, Ministry of
Agriculture and WaterRiyadhMinistry of Agriculture and Water
Sri LankaCo-ordination by agency 11 Hydrology Division, Irrigation
DepartmentP.o. Box 1138, Colombo 7
Tajikistan
ThailandCo~ordination: Ad hoc1 Royal Irrigation Department
811 Samsen Road t Bangkok 10300Ministry of Agriculture and Cooperatives
2 Meteorological Department4353 Sukhumvit Road, Bangkok 10260Ministry of Transport and Communications
G
G
G AWF
G A F
GHAWFPN
G
N
N
N
N
N
N
No information supplied
2 3
2
2 2
2
3 2 1
2
3 Electricity Generating Authority ofThailand
Near Rama 6 Bridget NonthaburiOffice of the Prime Minister
GH N 3 2 3 3 2
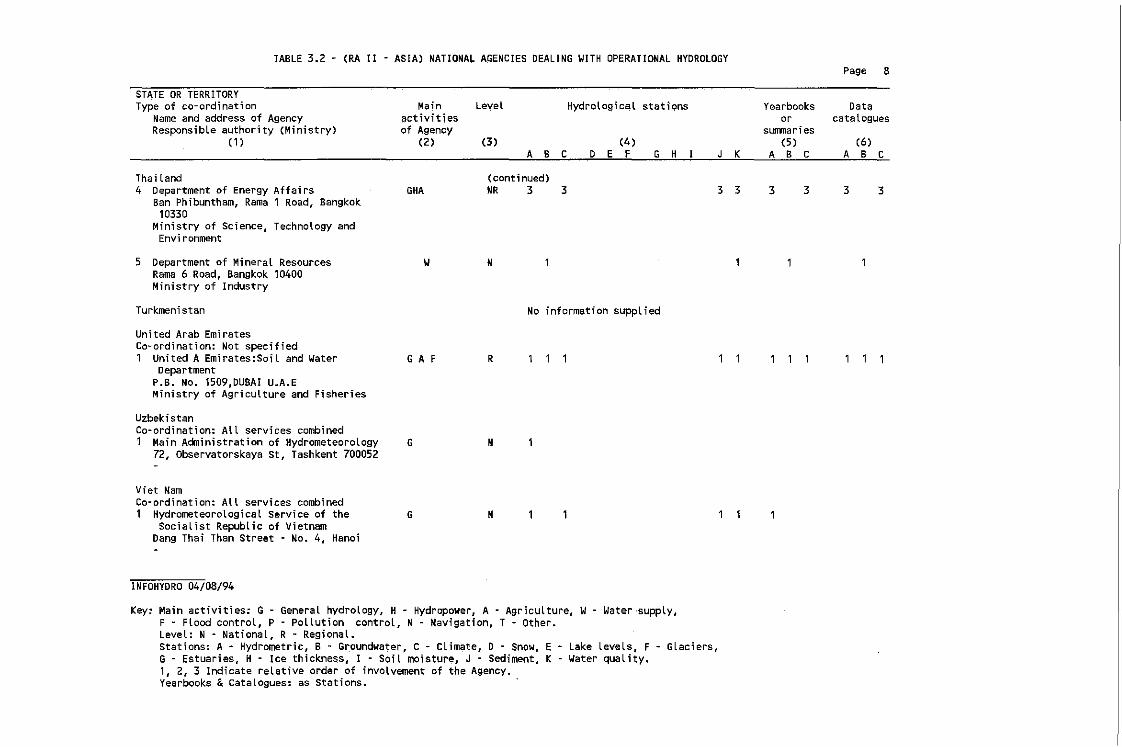
TABLE 3.2 - (RA II - ASIA) NATIONAL A.ENCIES DEALIN. WITH OPERATIONAL HYDROLOGYPage 8
Yearbooks Dataor catalogues
surrmari es(5 ) (6)
J K A B C A B C
STATE OR TERRITORYType of co-ordination
Name and address of AgencyResponsible authority (Ministry)
(1)
Thailand4 Department of Energy Affairs
Ban Phibuntham, Rama 1 Road, Bangkok10330
Ministry of Science, Technology andEnvi ronment
Main Leyel Hydrological stationsactivitiesof Agency
(2) (3 ) (4)A B C D E F • H
(continued).HA NR 3 3 3 3 3 3 3 3
5 Department of Mineral ResourcesRama 6 Road, Bangkok 10400Ministry of Industry
Turkmenistan
United Arab EmiratesCo-ordination: Not specified1 United A Emirates:Soil and Water
DepartmentP.B. No. 1509,DUBAI U.A.EMinistry of Agriculture and Fisheries
UzbekistanCo-ordination: All services combined1 Main Administration of Hydrometeorology
72, Observatorskaya St, Tashkent 700052
Viet NarnCo-ordination: All services combined1 Hydrometeorological Service of the
Socialist Republic of VietnamDang Thai Than Street - No.4, Hanoi
INFOHYORO 04/08/94
W
• A F
G
•
N
R
N
N
No information supplied
Key: Main activities: G - General hydrology, H - Hydropower, A ~ Agriculture, W- Water·supply,F - Flood control, P - Pollution control, N ~ Navigation, T - Other.Level: N - National, R - Regional.Stations: A - Hydrometric, B ~ Groundwater, C - Climate, D Snow, E Lake levels, F - Glaciers,G - Estuaries, H - Ice thickness, I - Soil moisture, J - Sediment, K Water quality.1, 2, 3 Indicate relative order of involvement of the Agency.Yearbooks &Catalogues: as Stations.
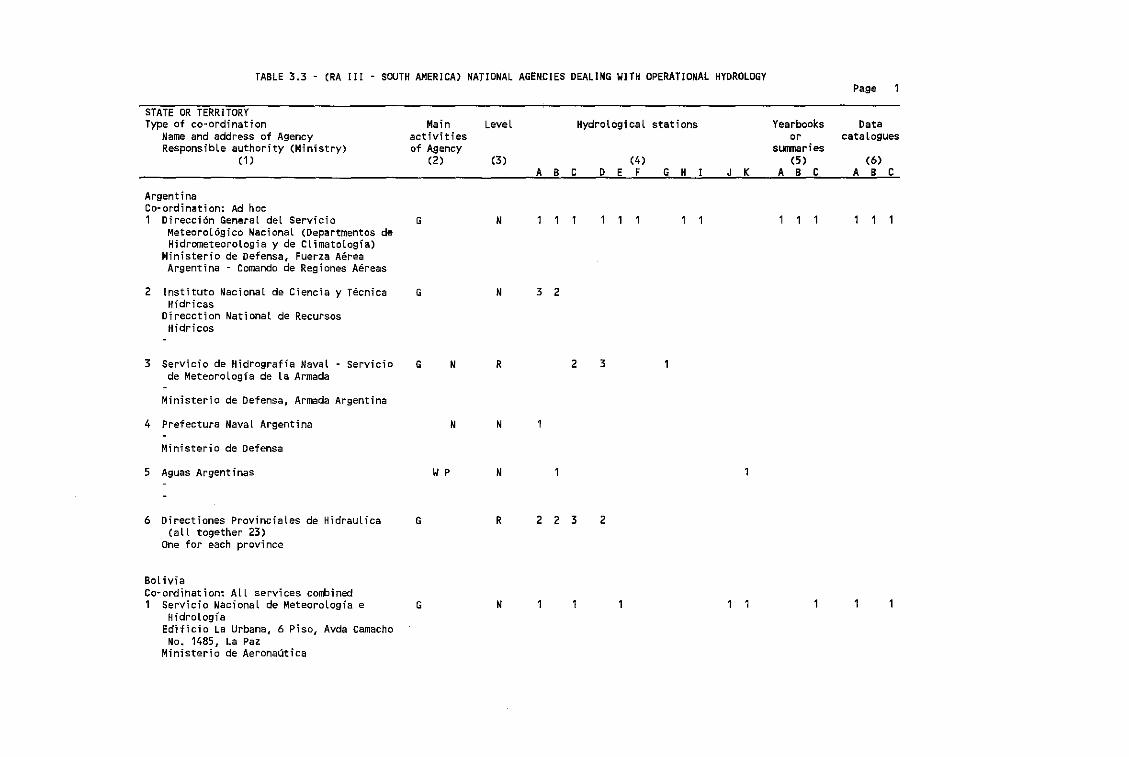
TABLE 3.3 - (RA III - SOUTH AMERICA) NATIONAL AGENCIES DEALING WITH OPERATIONAL HYDROLOGYPage
STATE OR TERRITORYType of co~ordination
Name and address of AgencyResponsible authority (Ministry)
(1)
Main Level Hydrological stationsactivitiesof Agency
(2) (3) (4)
A B C D E F G H J K
Yearbooksor
sLlllllar i es(5 )
ABC
Datacatalogues
(6)ABC
ArgentinaCo· ordination: Ad hoc1 Direcci6n General del Servicio
Meteorol6gico NacionaL (Departmentos deHidrometeorologia y de Climatologia)
Ministerio de Defensa, Fuerza AereaArgentina - Comando de Regiones Aereas
2 Instituto Nacional de Ciencia y TecnicaHfdricas
Direcct;on National de RecursosHidricos
G
G
N
N 3 2
3 Servicio de Hidrografia Naval - Servic;o G N R 2 3de Meteorologia de La Armada
Ministerio de Defensa, Armada Argentina
4 Prefectura Naval Argentina N N
Ministerio de Defensa
5 Aguas Argentinas WP N
6 Directiones Provinciales de HidrauLica G R 2 2 3 2(all together 23)
One for each province
BoLiviaCo-ordination: ALL services combined1 Servicio NacionaL de MeteoroLogfa e G N
HidrologfaEdlflcio La Urbana, 6 Plso, Avda camacho
No. 1485, La PaZMinisterio de Aeronautica
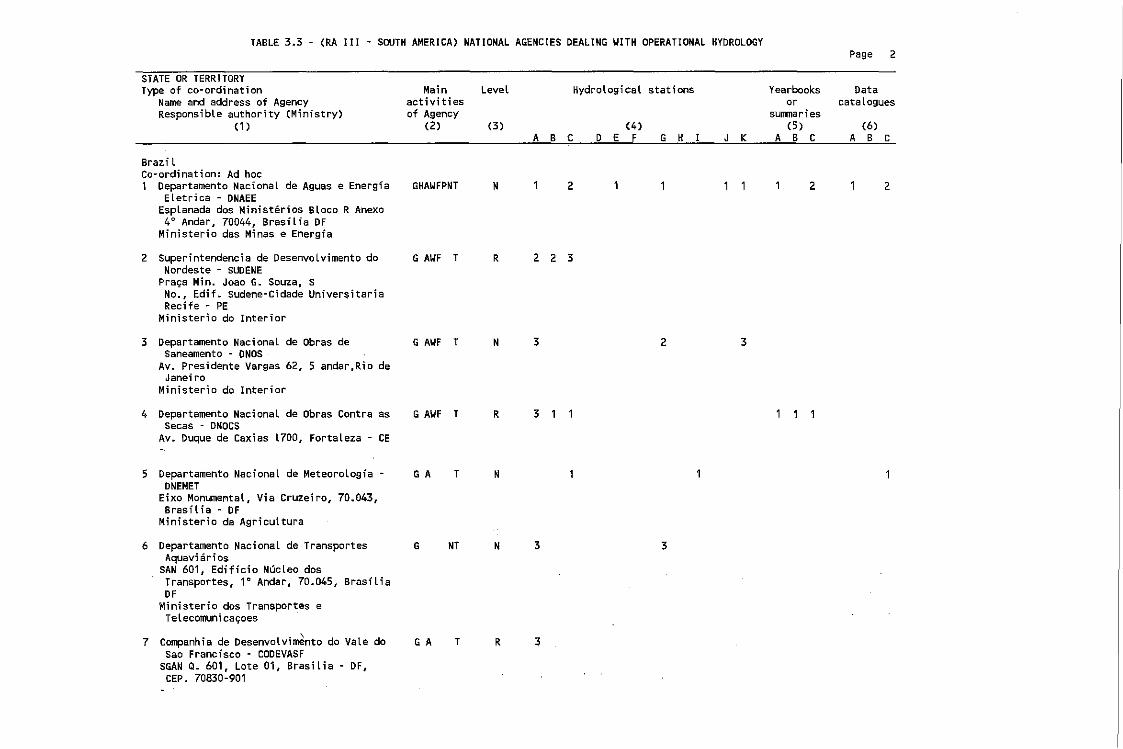
TABLE 3.3 - (RA III - SOUTH AMERICA) NATIONAL AGENCIES DEALING WITH OPERATIONAL HYDROLOGYPage 2
STATE OR TERRITORYType of co-ordination
Name and address of AgencyResponsible authority (Ministry)
(1)
Main LeveL Hydrological stationsactivitiesof Agency
(2) (3) (4)A B C D E F G H
Yearbooks Dataor cataLogues
sunmaries(5) (6)
J K A B C A B C
BrazilCo-ordination: Ad hoc1 Departamento Nacional de Aguas e Energia
Eletrica - DNAEEEsplanada dos Ministerios BLaee R Anexo4° Andar, 70044, Brasilia OF
Ministerio des Minas e Energfa
2 Superintendencia de Desenvolvimento doNordeste - SUO ENE
Praga Min. Joao G. Souza, SNo., Edif. Sudene-Cidade UniversitariaRecife - PE
Ministerio do Interior
3 Departamento Nacionat de Obras deSaneamento - ONOS
Av. Presidente Vargas 62, 5 andar,Rio deJaneiro
Ministerio do Interior
4 Departamento Nacional de Obras Contra asSecas - DNocs
Av. Duque de Caxias l700, Fortaleza - CE
GHAWFPNT
G AWF T
G AWF T
G AWF T
N
R
N
R
2
223
3
3
2 3
2 2
5 Departamento Nacional de Meteorologia ONEMET
Eixo Monume~tal, Via Cruzeiro, 70.043,Brasil ia - OF
Ministerio da Agricultura
6 Departamento Nacional de TransportesAquaviarios
SAN 601, Edificio Nucleo dosTransportes, 1° Andar, 70.045, BrasiliaOF
Ministerio dos Transportes eTelecomunica~oes
7 Companhia de Desenvolvi~nto do Vale doSao Francisco - CODEVASF
SGAN Q. 601, Lote 01, Brasilia - OF,CEP. 70830-901
G A
G
G A
T
NT
T
N
N
R
3
3
3
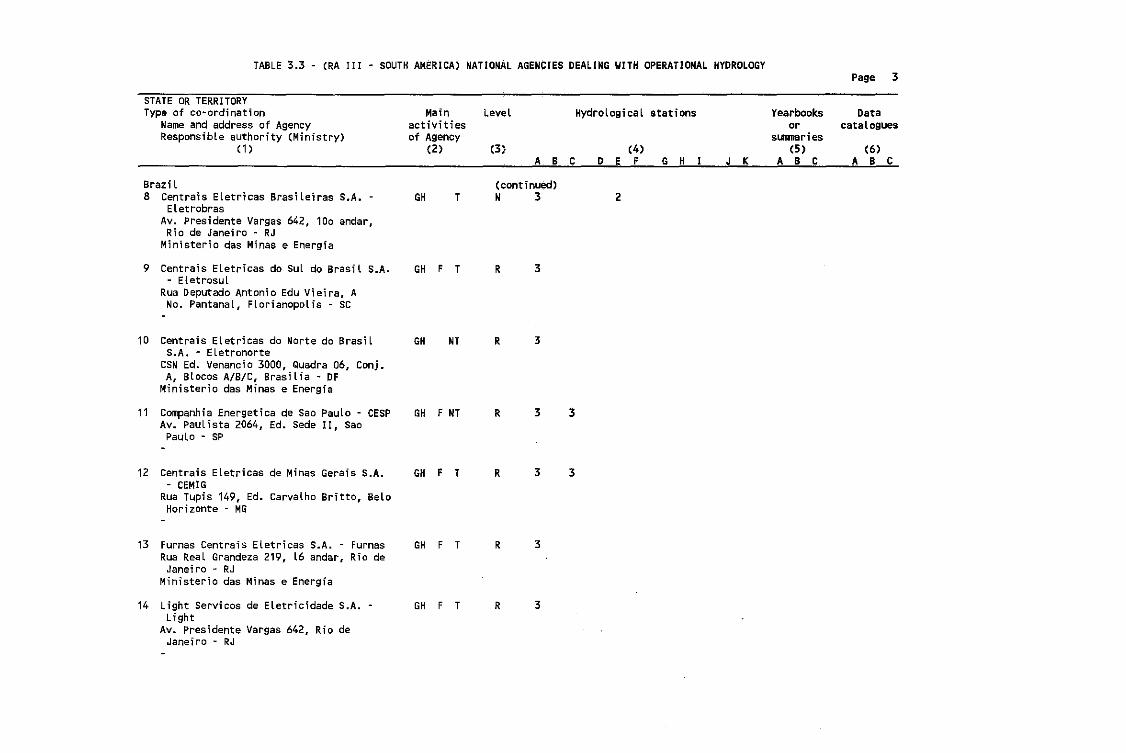
TABLE 3.3 - (RA III - SOUTH AMERICA) NATIONAL AGENCIES DEALING WITH OPERATIONAL HYDROLOGYPage 3
STATE OR TERRITORYType of co~ordination
Name and address of AgencyResponsible authority (Ministry)
(1)
Mainactivitiesof Agency
(2)
level
(3)
HydroLogical stations
(4)ABC 0 E F G H J K
Yearbooksor
sLllmaries(5)
ABC
Datacatalogues
(6)ABC
BraziL8 Centrais Eletrlcas Brasileiras S.A. ~
EletrobrasAv. presidente Vargas 642, 100 andar,
Rio de ·Janeiro - RJMinisterio das Minas e Energia
GH T(continued)N 3 2
9 CentralS Eletricas do sul do BrasiL S.A.- Eletrosul
Rua Deputado Antonio Edu Vieira, ANo. Pantanal, Florianopolis - SC
GH F T R 3
10 Centrais ELetricas do Norte do BrasilS.A. - Eletronorte
CSN Ed. Venancio 3000, Quadra 06, Conj.A, Blaees A/B/C, Brasilia - OF
Ministerio das Minas e Energia
GH NT R 3
11 Companhia Energetica de Sao Paulo - CESPAv. Paulista 2064, Ed. Sede II, Sao
PauLo - SP
12 Centrais ELetricas de Minas Gerais S.A.- CEMIG
Rua Tupis 149, Ed. CarvaLho Britto, BeLaHorizonte ~ MG
13 Furnas Centrais ELetricas S.A. - FurnasRua ReaL Grandeza 219, l6 andar, Rio de
Janeiro - RJMinisterio das Minas e Energia
14 Light Servicos de Eletricidade S.A.Light
Av. Presidente Vargas 642, Rio deJaneiro - RJ
GH F NT
GH F T
GH F T
GH F T
R
R
R
R
3
3
3
3
3
3
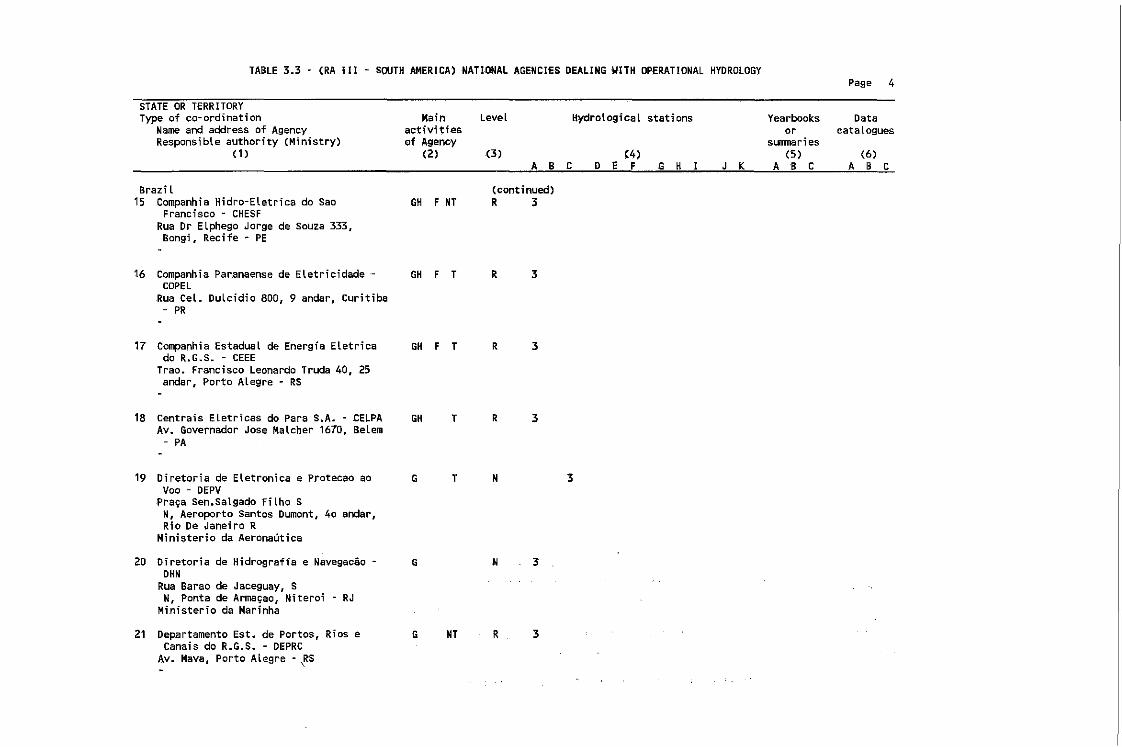
TABLE 3.3 - (RA III - SOUTH AMERICA) NAHONAL AGENCIES OEALlNGWITH OPERATIONAL HYDROLOGYPage 4
STATE OR TERRITORYType of co-ordination
Name and address of AgencyResponsibLe authority (Ministry)
(1 )
Main Leve.Lactivitl·esof Agency
(2) (3)
HydrologicaL stations
(4)ABC 0 E F G H
Yearbooks Dataor catalogues
SLITIJlar1 es(5) (6)
J K A B C A B C
Brazil15 Companhia Hidro-Eletrica do Sao
Francisco - CHESFRUB Dr Elphego Jorge de Souza 333,Bongi, Recife - PE
GH F NT(continued)R 3
16 Companhia Paranaense de ELetricidadeCOPEl
RUB eel. Dulcidio 800, 9 andar, CuritibaPR
GH F T R 3
17 Companhia Estadual de Energfa Eletrica GH F T R 3do R.G.S. - CEEE
Trao. Francisco Leonardo Truda 40, 25andar, Porto Alegre - RS
18 CentralS Eletricas do Para S.A. - CELPA GH T R 3Av. Governador Jose Malcher 1670, Betem
PA
19 Diretoria de Eletronica e Protecao ao G T N 3Vao - DEPV
Pra~a Sen.Salgado Filho SN, Aeroporto Santos Dumont, 40 andar,Rio De Janeiro R
Ministerio daAeronautica
20 Diretoria de Hidrograffa e Navegacao G N 3OHN
Rua Barao de Jaceguay, SN, Ponta de Arma~ao, Niteroi - RJ
Ministerio da Marinha
21 Departamento Est. de Portos, Rios e G NT R 3Canais do R.G.S. - DEPRC
Av. Mava, Porto Alegr,e - \RS
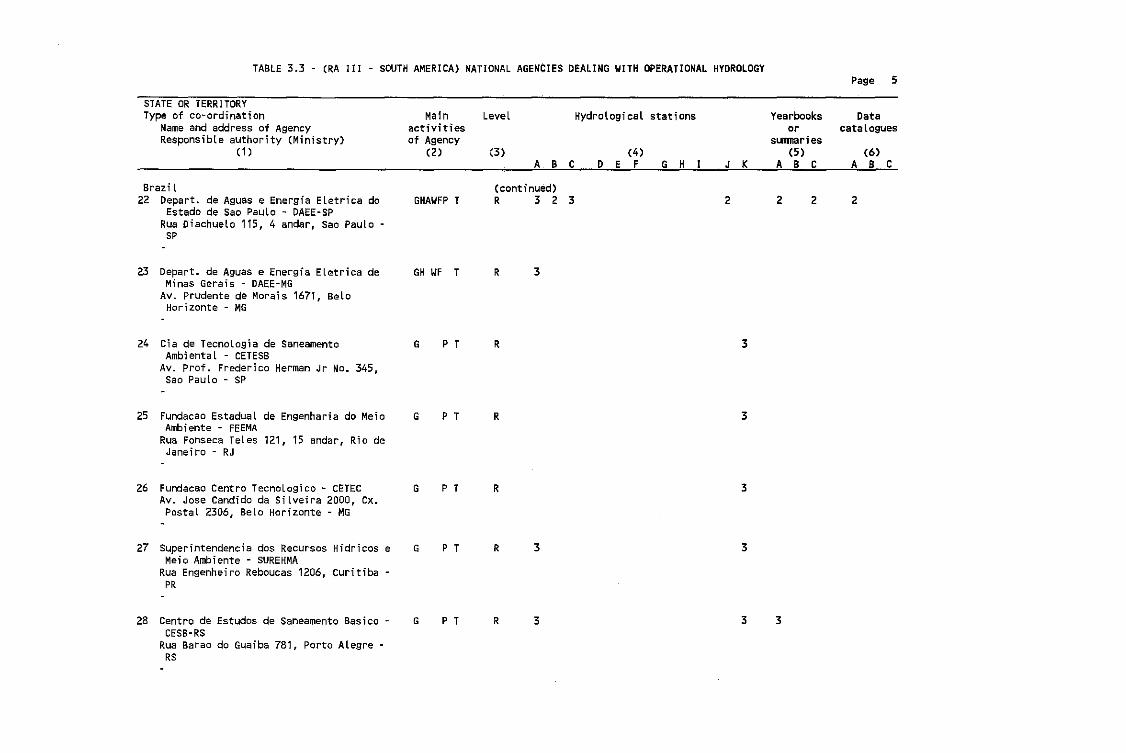
TABLE 3.3 - (RA III - SOUTH AMERICA) NATIONAL AGENCIES DEALING WITH OPERATIONAL HYDROLOGYPage 5
Yearbooksor
slITITIar i es(5 )
ABC
STATE OR TERRITORYType of co-ordination
Name and address of AgencyResponsible authority (Ministry)
(1)
BraziL22 Depart. de AQuas e Energia Eletrica do
Estado de Sao Paulo - DAEE-SPRua Diachuelo 115, 4 andar, Sao Paulo
SP
Main LeveL Hydrological stationsactivitiesof Agency
(2) (3) (4)A B C D E F G H
(continued)GHAWFP T R 3 2 3
J K
2 2 2
Datacatalogues
(6)ABC
2
23 Depart. de Aguas e Energ;a Eletrica deMinas Gerais - DAEE-MG
Av. Prudente de Morais 1671, BelaHorizonte - MG
GH WF T R 3
24 Cia de Tecnologia de SaneamentoAmbiental - CETESB
Av. Prof. Frederico Herman Jr No. 345,Sao Paulo - SP
25 Fundacao Estadual de Engenharia do MeiaAmbiente - FEEMA
Rua Fonseca Teles 121, 15 andar, Rio deJaneiro - RJ
26 Fundacao Centro Tecnologico - CETECAv. Jose Candido da SiLveira 2000, Cx.Postal 2306, Bela Horizonte - MG
27 Superintendencia dos Recursos Hidricos eMeio Ambiente - SUREHMA
Rua Engenheiro Reboucas 1206, curitibaPR
28 Centro de Estudos de Saneamento Basico ~
CESB-RSRua Barao do Guaiba 781, Porto Alegre
RS
G
G
G
G
G
P T
P T
P T
P T
P T
R
R
R
R
R
3
3
3
3
3
3
3 3
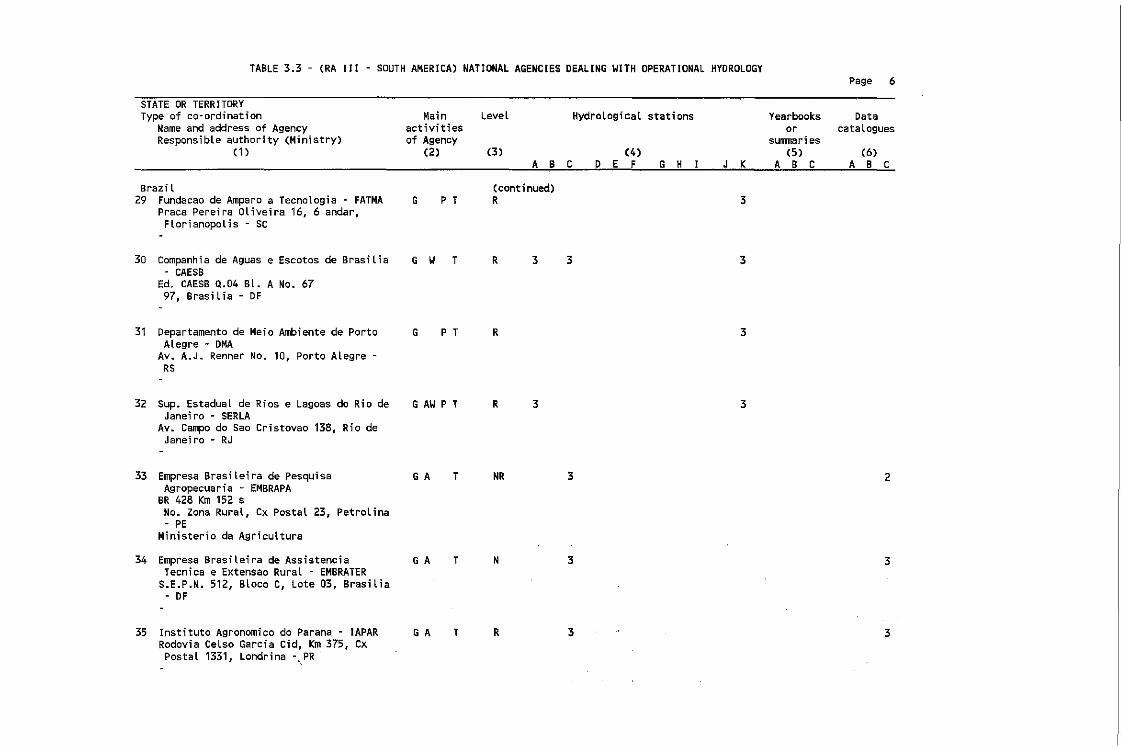
TABLE 3.3 - (RA III - SOUTH AMERICA) NATIONAL AGENCIES OEALING WITH OPERATIONAL HYOROLOGYPage 6
STATE OR TERRITORYType of co· ordination
Name and address of AgencyResponsible authority (Ministry)
(1)
Mainactivitiesof Agency
(2)
LeveL
(3 )
Hydrological stations
(4)ABC 0 E F G H J K
Yearbooksor
sunmari es(5)
ABC
DatacataLogues
(6)ABC
Brazil29 Fundacao de Amparo a Tecnologia - FATMA
Praca Pereira Oliveira 16, 6 andar,Florianopolis - SC
G P T(continued)R 3
30 Companhia de Aguas e Escotos de Brasilia- CAESB
Ed. CAESB 0.04 Bt. A No. 6797, BrasiLia - OF
G W T R 3 3 3
31 Departamento de Meia Ambiente de PortoAlegre - DMA
Av. A.J. Renner No. 10, Porto Alegre RS
G P T R 3
32 Sup. Estadual de Rios e Lagoas do Rio deJaneiro - SERLA
Av. Campo do Sao Cristovao 138, Rio deJaneiro - RJ
G AW P T R 3 3
33 Empresa Brasileira de Pesquisa G A T NR 3 2Agropecuar;a - EMBRAPA
BR 428 Km 152 sNo. Zona Rural, ex PostaL 23, Petrol ina- PE
Ministerio da Agr;cultura
34 Empresa Bras;le;ra de Ass;stenc;a G A T N 3 3Tecnica e Extensao Rural - EMBRATER
S.E.P.N. 512, BLoco e, Lote 03, BrasiliaOF
35 Instituto Agronom;co do Parana - IAPAR G A T R 3 3Rodov;a CeLso Garcia eid, Km 375, exPostaL 1331, Londrina -,.PR .
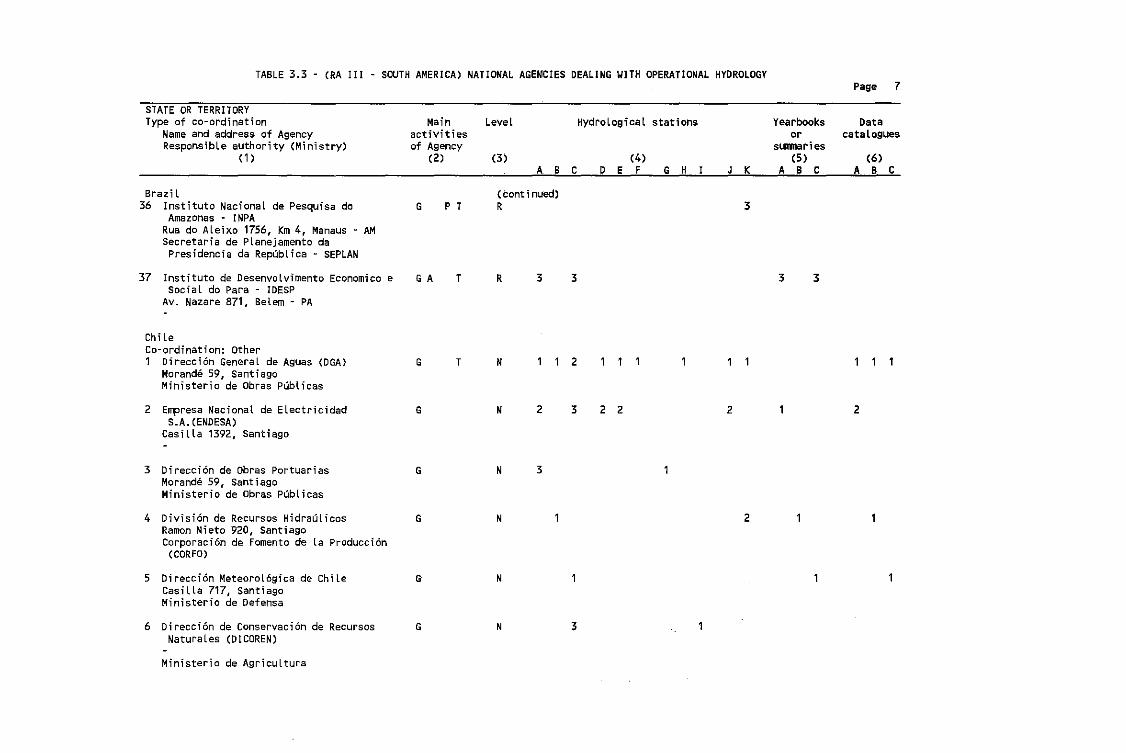
TABLE 3.3 - (RA III - SOUTH AMERICA) NATIONAL AGENCIES DEALING WITH OPERATIONAL HYDROLOGYPage 7
STATE OR TERRITORYType of co-ordination
Name and address of AgencyResponsibLe authority (Ministry)
(1)
Brazi l36 Instituto Nacional de Pesquisa do
Amazonas - I NPARua do Aleixo 1756, Km 4, Manaus - AMSecretaria de Planejamento da
Presidencia da Republica - SEPLAN
Main Level HydrologicaL stationsactivitiesof Agency
(2) (3) (4)A B C D E F G H
(tont ; nued)G P T R
J K
3
Yearbooksor
sUlllllarles(5)
ABC
Datacatalogues
(6)ABC
37 Instituto de Desenvolvimento Economico eSocial do Para - IDESP
Av. Nazare 871, Belem - PA
Chi leCo· ordination: other1 Direcci6nGeneral de AQuas (DGA)
Morande 59, SantiagoMinisterio de Obras PdbLicas
2 Empresa Nacional de ElectricidadS.A. (ENDESA)
Casilla 1392, Santiago
3 Direcci6n de Obras PortuariasMorande 59, SantiagoMinisterio de Obras PdbLicas
4 Division de Recursos HidraulicosRamon Nieto 920, SantiagoCorporaci0n de Fomento de la Produccion
(CORFD)
5 Direccion Meteorol6gica de ChileCasilla 717, SantiagoMinisterio de Defensa
6 Direccion de Conservaci0n de RecursosNaturales (DICOREN)
Ministerio de Agricultura
G A
G
G
G
G
G
G
T
T
R
N
N
N
N
N
N
3
2
3
3
2
3
3
2 2 2
2
3 3
2
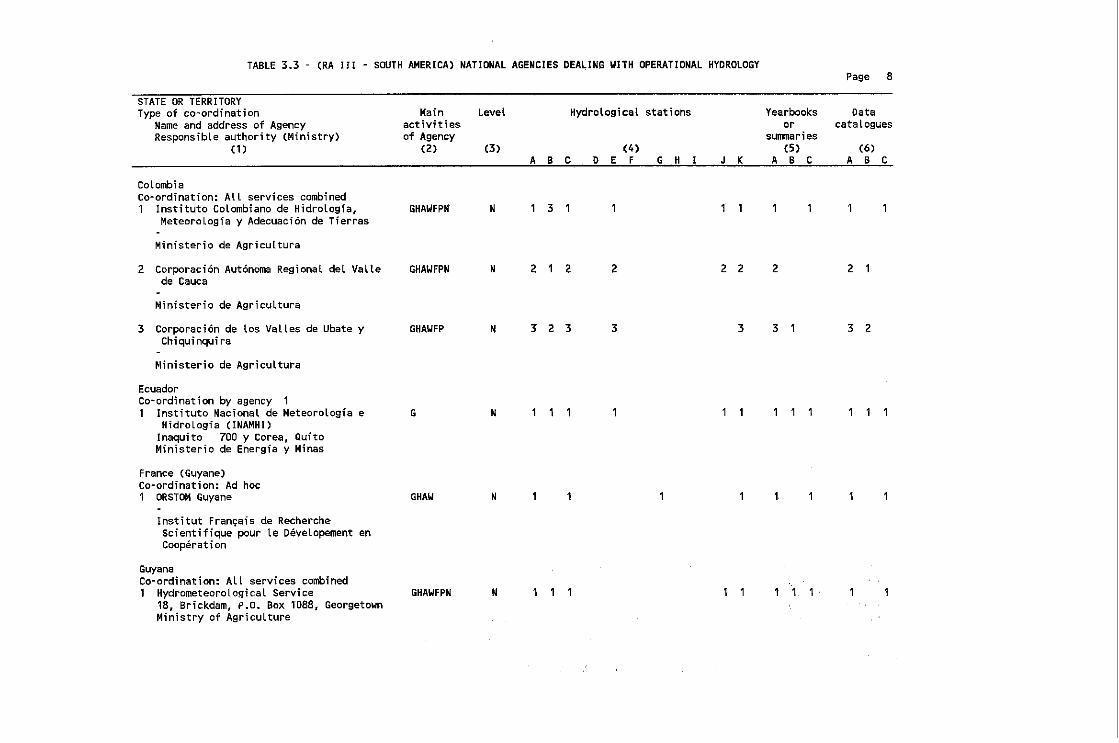
TABLE 3.3 - (RA III - SOUTH AMERICA) NATIONAL AGENCIES DEALING WITH OPERATIONAL HYDROLOGYPage 8
STATE OR TERRITORYType of co-ordination
Name and address of AgencyResponsible authority (Ministry)
(1)
Main Level Hydrological stationsactivitiesof Agency
(2) (3) (4)A B C 0 E F G H
Yearbooks Dataor catalogues
sunmaries(5 ) (6)
J K A B C A B C
ColombiaCo-ordination: All services combined1 Institute Colombiano de Hidrotogfa,
Meteorolog;a y Adecuac;6n de Tierras
Ministerio de Agricultura
2 Corporacion Autonoma Regional del Vallede Cauea
Ministerio de Agricultura
GHAWFPN
GHAWFPN
N
N 2
3 1
2 2 2 2 2 2
3 Corporacion de los Valles de Ubate yChi qui nqui ra
Ministerio de Agr;cultura
EcuadorCo~ord;nation by agency 11 Institute Nacional de Meteorologia e
Hidrologia (INAMHI)I naqui to 700 y Corea, QuitoMinisterio de Energfa y Minas
France (Guyane)Co-ordination: Ad hoc1 ORSTOM Guyane
Institut Fran~ais de RechercheScientifique pour le Developement enCooperation
GuyanaCo-ordination: ALL services combined1 Hydrometeorological Service
18, Brickdam, P.O. Box 1088, GeorgetownMinistry of AgricuLture
GHAWFP
G
GHAW
GHAWFPN
N
N
N
N
3 2 3
1
3 3
1
3 1
1
3 2
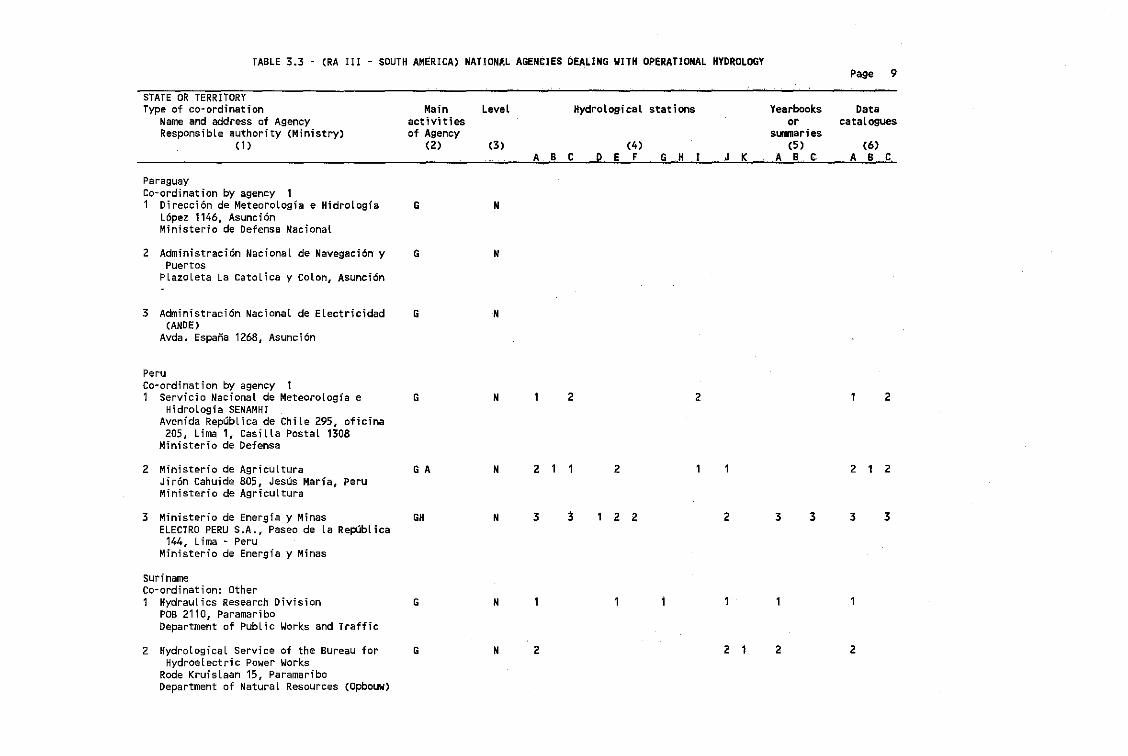
TABLE 3.3 - (RA III - SOUTH AMERICA) NATIONAL AGENCIES OEALING WITH OPERATIONAL HYDROLOGYPage 9
STATE OR TERRITORYType of COM ordination Main Level HydrologicaL stations Yearbooks Data
Name and address of Agency activities or cataloguesResponsible authority (Ministry) of Agency summaries
(1) (2) 0) (4) (5) (6)A. B C 0 E F G .H [ J K A B C A B C
ParaguayCo-ordination by agency 11 Direccion de Meteorologia e Hidrologfa G N
L6pez 1146, AsuncionMinisterio de Defense Nacional
2 Administracion Nacional de Navegaci6n y G NPuertos
Plazoleta La Catoliea y Colon, Asuncion
3 Administracion Nacional de Electricidad G N(ANDE)
Avda. Espana 1268, Asunci6n
PeruCo-ordination by agency 11 Servicio Nacional de Meteorologfa e G N 1 2 2 1 2
Hldrologia SENAMHIAvenida RepubLica de Chile 295, oficina205, Lima 1, Casilla Postal 1308
Ministerio de Defensa
2 Ministerio de Agricultura G A N 2 1 1 2 1 1 2 1 2Jiron Cahuide 805, Jesus Maria, PeruMinisterio de Agricultura
3 Ministerio de Energfa y Minas GH N 3 3 1 2 2 2 3 3 3 3ELECTRO PERU S.A., Paseo de la RepUblica
144, Lima - PeruMinisterio de Energia y Minas
SurinameCo-ordination: Other1 Hydraulics Research Division G N
POB 2110, ParamariboDepartment of Public Works and Traffic
2 Hydrological Service of the Bureau for G N 2 2 1 2 2Hydroelectric Power Works
Rode Kruislaan 15, ParamariboDepartment of Natural Resources (Opbouw)
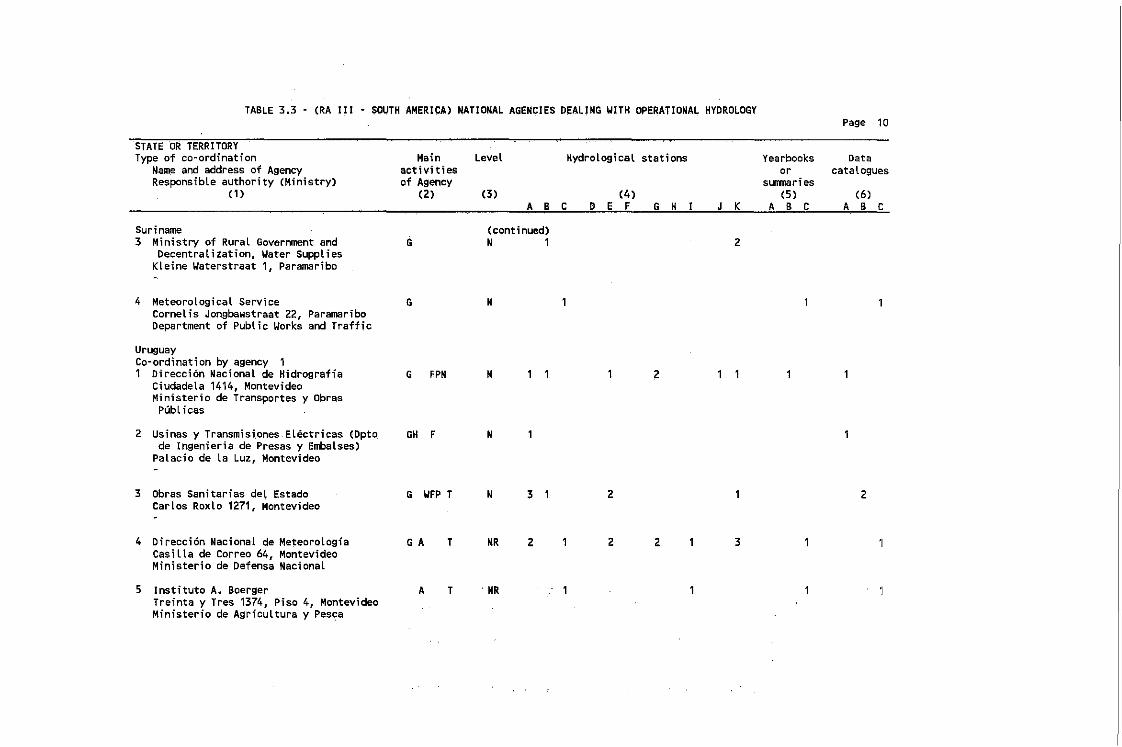
TABLE 3.3 - (RA III • SOUTH AMERICA) NATIONAL AGENCIES DEALING WITH OPERATIONAL HYDROLOGYPage 10
STATE oR TERRITORYType of co-ordination Main LeveL HydrologicaL stations Yearbooks Data
Name and address of Agency activities or cataloguesResponsible authority (Ministry) of Agency sl.IIlJ1aries
(1 ) (2) (3) (4) (5) (6)---------_.._-- A B C D E F G H 1 J K A B C A B C
Suriname (continued)3 Ministry of Rural Government and G N 1 2
Decentralization, Yater SuppliesKLeine Waterstraat 1, Paramaribo
4 Meteorological Service G NCornel is Jongbawstraat 22, ParamariboDepartment of Public works and Traffic
UruguayCo-ordination by agency1 Direcci6n NacionaL de Hidrografia G FPN N 1 1 1 2
Ciudadela 1414, MontevideoMinisterio de Transportes y Obras
Publicas
2 Usinas y Transmisi.ones ELectricas (Opto. GH F Nde Ingenieria de Presas y Embalses)
PaLacio de la Luz, Montevideo
3 Obras Sanitarias del Estado G WFP T N 3 , 2 1 2CarLos RoxLo 1271, Montevideo
4 Direcci6n Nacional de MeteoroLogfa G A T NR 2 , 2 2 1 3CasiLla de Correo 64, MontevideoMinisterio de Defensa NacionaL
5 Instituto A. Boerger A T . NRTreinta y Tres 1374, Piso 4, MontevideoMinisterio de AgricuLtura y Pes~a
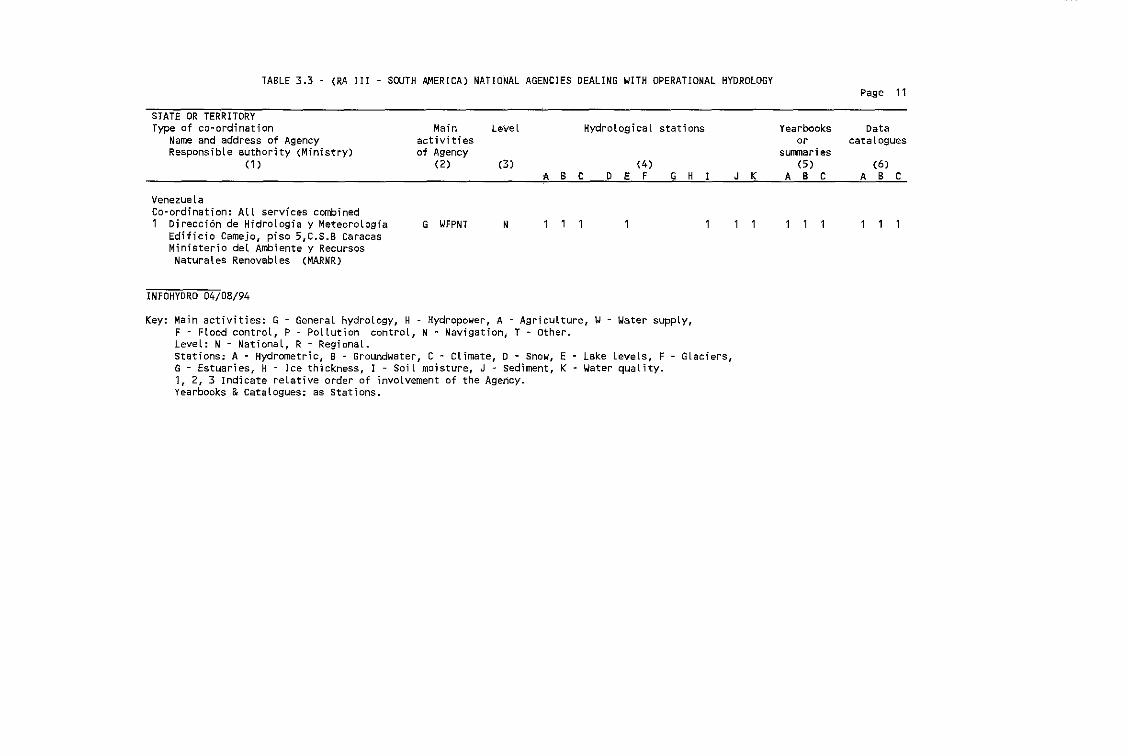
TABLE 3.3 - (RA III - SOUTH AMERICA) NATIONAL AGENCIES DEALING WITH OPERATIONAL HYDROLOGYPage 11
STATE OR TERRITORYType of co~ord;nation
Name and address of AgencyResponsible authority (Ministry)
(1)
Main Level Hydrological stationsactivitiesof Agency
(2) (3) (4)A B C D E F G H
Yearbooks Dataor catalogues
sUlllTlaries(5) (6)
J K A B C A B C
VenezuelaCORordination: All services combined1 Direcc;6n de Hidrologfa y MeteoroLogfa
Edificio Camejo, piso 5,C.S.B CaracasMinisterio del Ambiente y RecursosNaturales Renovables (MARNR)
INFOHYDRO 04/08/94
G WFPNT N
Key: Main activities: G - General hydrology, H - Hydropower, A - Agriculture, W- Water supply,F - Flood control, P - Pollution controL, N - Navigation, T - Other.Level: N - NationaL, R - Regional.Stations: A - Hydrometric, B - Groundwater, C - Climate, 0 Snow, E Lake levels, F - Glaciers,G - Estuaries, H - Ice thlckness, I - SoiL moisture, J ~ sediment, K Water quality.1, 2, 3 Indicate reLative order of involvement of the Agency.Yearbooks &Catalogues: as Stations.

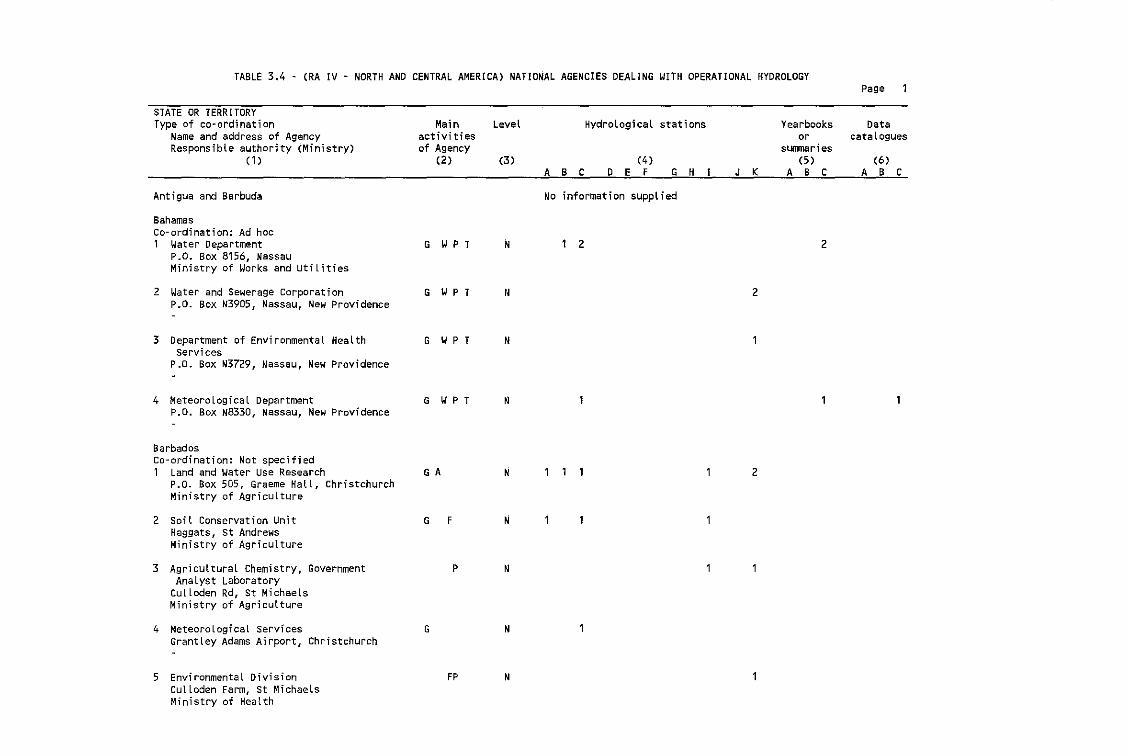
TABLE 3.4 - (RA IV - NORTH AND CENTRAL AMERICA) NATIONAL AGENCIES DEALING WITH OPERATIONAL HYDROLOGY
STATE OR TERRITORYType of cORordination
Name and address of AgencyResponsible authority (Ministry)
(1 )
Antigua and Barbuda
BahamasCo~ordinat;on: Ad hoc1 Water Department
P.O. Box 8156, NassauMinistry of Works and utilities
2 Water and Sewerage CorporationP.O. Box N3905, Nassau, New Providence
3 Department of Environmental Healthservices
P.O. Box N3729, Nassau, New Providence
Page
Main Level Hydrological stations Yearbooks Dataactivities or cataloguesof Agency surrrnaries
(2) (3 ) (4) (5 ) (6)
A B C 0 E F G H I J K A B C A B C
No information supplied
G WP T N 1 2 2
G WP T N 2
G WP T N
4 Meteorological DepartmentP.O. Box N8330, Nassau, New Providence
BarbadosCo-ordination: Not specified1 Land and Water Use Research
P.O. Box 50S, Graeme Hall, ChristchurchMinistry of Agriculture
G WP T
G A
N
~ 2
2 Soil Conservation Unit G F NHaggats, st AndrewsMinistry of Agriculture
3 Agricultural Chemistry, Government P NAnalyst Laboratory
Culloden Rd, St MichaelsMinistry of Agriculture
4 Meteorological ServicesGrantley Adams Airport, Christchurch
5 EnvironmentaL DivisionCulloden Farm, StMichaeLsMinistry of Health
G
FP
N
N
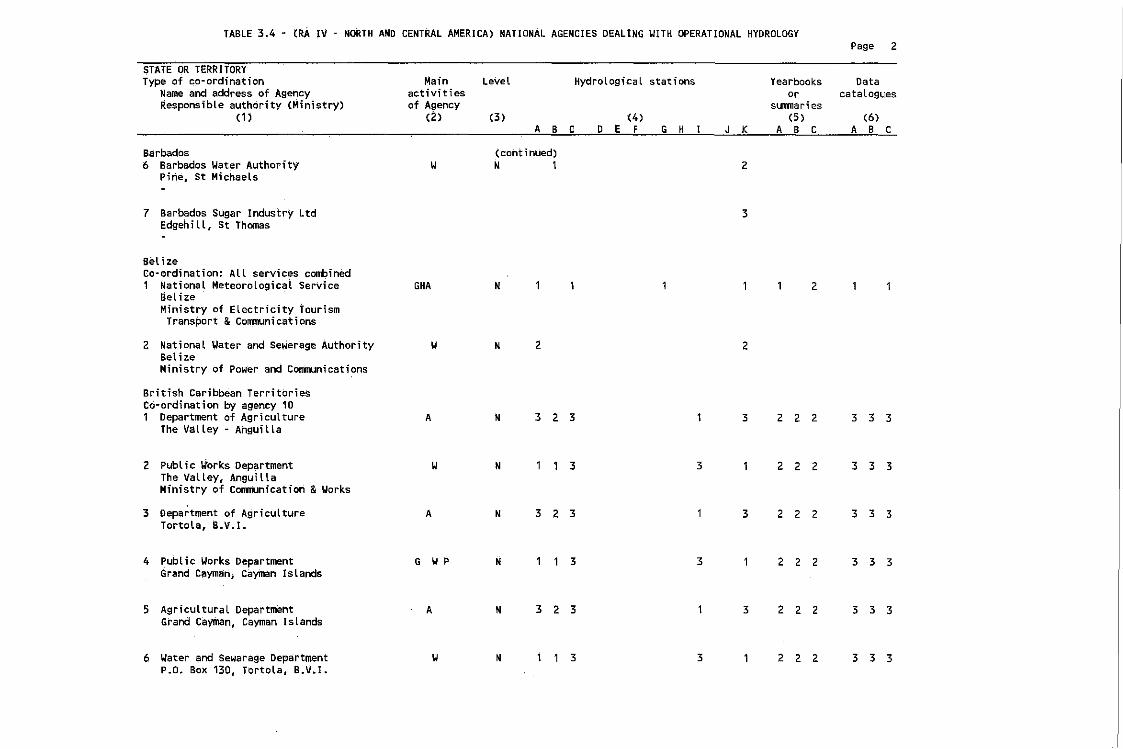
TABLE 3.4 - (RA JV - NORTH AND CENTRAL AMERJCA) NATJONAL AGENCIES DEALING WITH OPERATIONAL HYDROLOGYPage 2
STATE OR TERRITORYType of co-ordination
Name and address of AgencyResponsible authority (Ministry>
(1)
Barbados6 Barbados Water Authority
Pine, St Michaels
7 Barbados Sugar Industry LtdEdgehill, St Thomas
Main Level Hydrological stationsactivitiesof Agency
(2) (3) (4)A B C D E F G H
(continUed)W N 1
Yearbooks Dataor cataLogLies
sUll111aries(5) (6)
J K A B C A B C
2
3
Belizeto-ordination: All services combined1 National Meteorological Service
SelizeMinistry of Electricity tourism
Transport &Communications
2 National Water and Sewerage AuthorityBelizeMinistry of Power and Communicati?ns
British Caribbean TerritoriesCo-ordination by agency 101 Department of Agriculture
The Valley - Anguilla
2 Public Works DepartmentThe Valley, AnguillaMinistry of communication &Works
3 Department of AgricultureTortola, B.V.I.
4 Publ i.e Works DepartmentGrand C~ymah, Cayman Islands
5 Agricultural DepartmentGrand Cayman, Cayman Islands
6 Water and Sewarage DepartmentP.O. Box 130, Tortola, B.V.I.
GHA
W
A
W
A
G W~
A
W
N
N
N
N
N
N
N
N
2
323
3
3 2 3
3
323
3
3
3
3
2
3
3
3
2
222
222
2 2 2
2 2 2
222
222
333
333
333
333
333
333
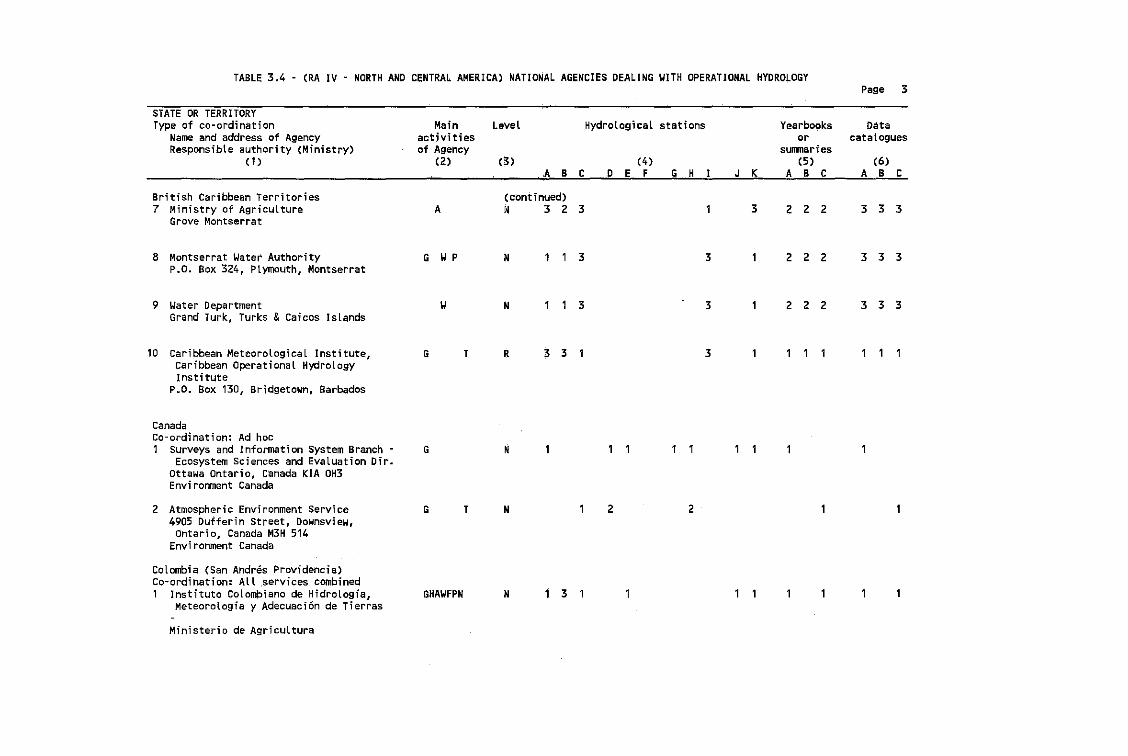
TABLE 3.4 - (RA IV - NORTH AND CENTRAL AMERICA) NATiONAL AGENCIES DEALING WITH OPERATIONAL HYDROLOGY
STATE OR TERRITORYType of co-ordination
Name and address of AgencyResponsible authority (Ministry)
(1 )
British Caribbean Territories7 Ministry of Agriculture
Grove Montserrat
8 Montserrat Water AuthorityP.o. Box 324, Plymouth, Montserrat
Mainactivitiesof Agency
(2)
A
G WP
Page 3
Level Hydrological stations Yearbooks Dataor catalogues
sunmaries(3) (4) (5) (6)
,A B C D E F G H I J K A B C A B C
(continued)N 3 2 3 1 3 2 2 2 3 3 3
N 1 1 3 3 1 2 2 2 3 3 3
9 Water DepartmentGrand Turk, Turks &Caicos Islands
10 Caribbean Meteorological Institute,caribbean Operational HydrologyInstitute
P.O. Box 130, Bridgetown, Barbados
CanadaCo-ordination: Ad hoc1 surveys and Information System Branch
Ecosystem Sciences and Evaluation Oir.Ottawa Ontario, Canada KIA OH3Environment Canada
2 Atmospheric Environment Service4905 Dufferin Street, Downsview,
Ontario, Canada M3H 514Environment Canada
W
G
G
G
T
T
N
R
M
N
1
3 3
3
2 2
3
3
222 333
Colombia (San AndresProvidencia)Co~ordination: All ,services combined1 Instituto Colombiano de Hidrologia,
Meteorologiay Adecuaci6n de Tierras
Ministerio de Agricultura
GHAWFPN N 1 3 1
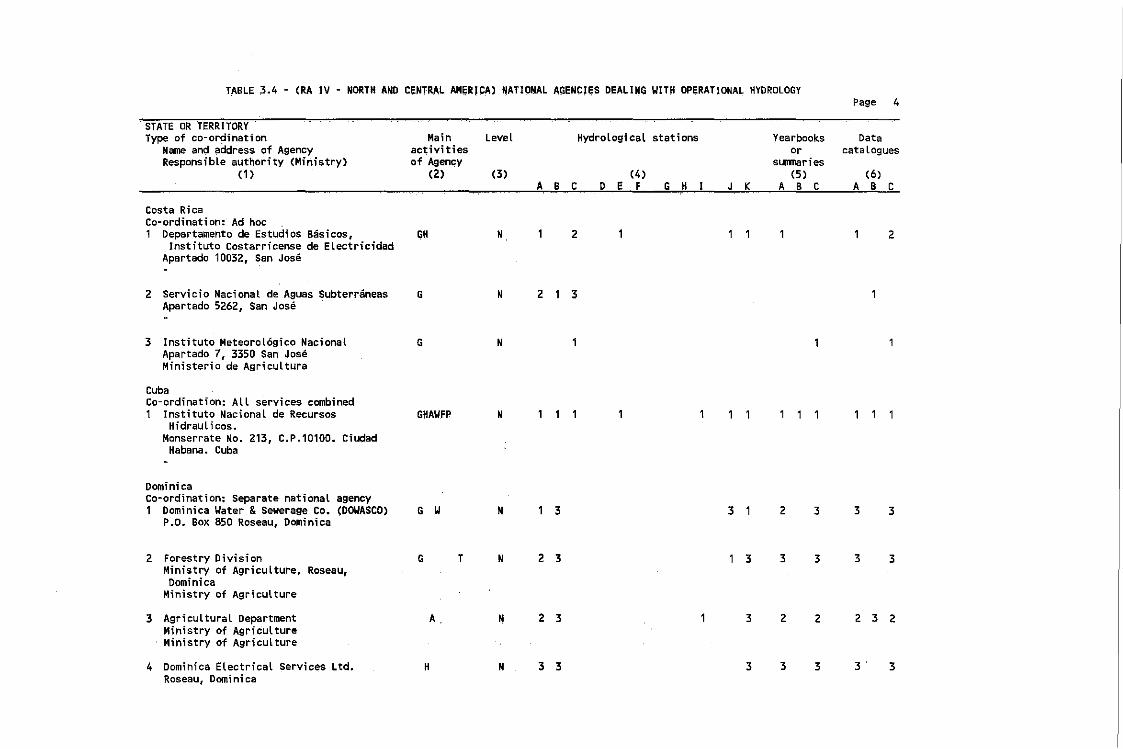
TABL~ ~.4 - (RA IV - NORTH AND C~NTRAL AM.RICA) NATIONAL AqENCI.S OEALINq WITH OPERATIONAL HYDROLOGYPage 4
STATE OR TERRITORYType of co-ordination Main Level Hydrological stations Yearbooks Data
Name and address of Agency activities or cataloguesResponsibLe authority (Ministry) of AgencY sunmaries
( 1) (2) (3) (4) (5) (6)A B C 0 E F G H I J K A B C A B C
Costa RicaCo-ordination: Ad hoc1 bepartamento de Estudios Basicos, GH N 1 2 1 1 1 1 1 2
Instituto Costarricense de ElectricidadApartado 10032, ~an Jose
2 Servicio Nacional de Aguas Subterraneas G N 2 1 3Apartado 5262, San Jose
3 Instituto Meteorol6gico Nacional G NApartado 7, 3350 San JoseMinisterio de Agriculture
CubaCo-ordination: All services combined1 Instituto NacionaL de Recursos GHAWFP N
Hidraulicos.Monserrate No. 213, C.P.10100. eiuded
Habana. Cuba
DominicaCo-ordination: Separate national agency1 Dominica Yater &Sewerage Co. (DOWASCO) G W N 1 3 3 1 2 3 3 3
P.O. Box 850 Roseau, Dominica
2 Forestry Division G T N 2 3 1 3 3 3 3 3Ministry of Agriculture, Roseau,Dominica
Ministry of Agriculture
3 Agricultural Department A. N 2 3 1 3 2 2 2 3 2Ministry of AgricultureMinistry of Agriculture
4 Dominica Electrical Services Ltd. H N 3 3 3 3 3 3 . 3Roseau, Dominica
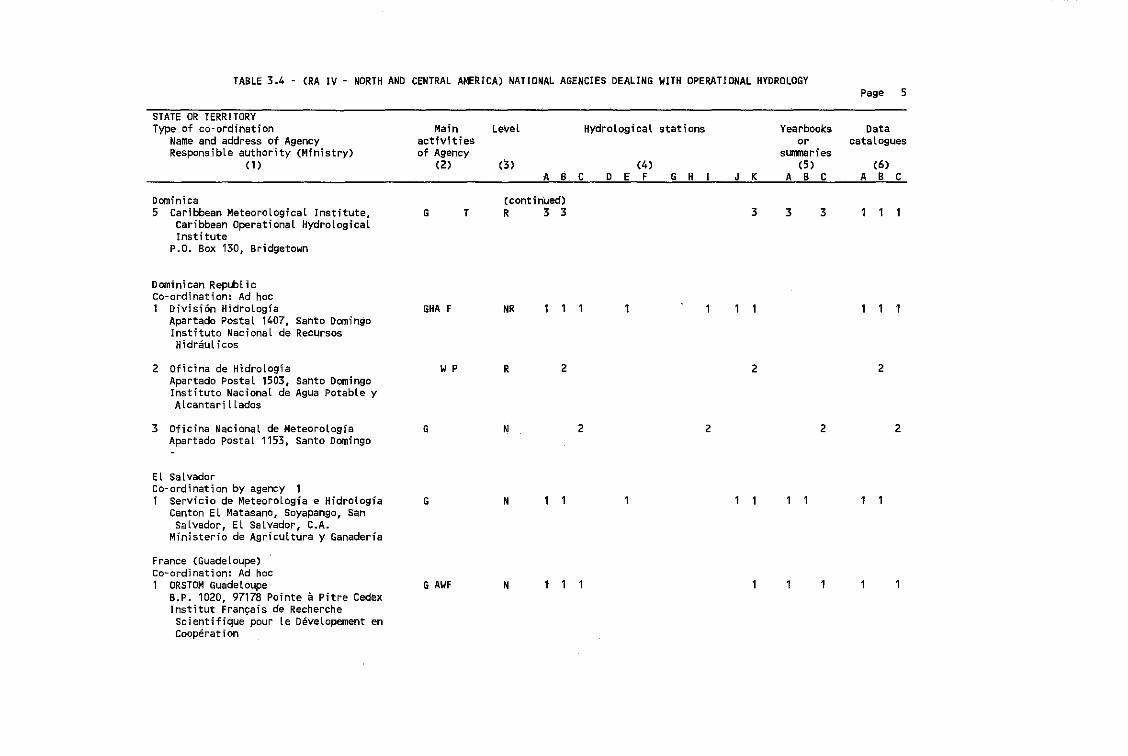
TABLE 3.4 - (RA IV - NORTH AND CENTRAL AMERICA) NATIONAL AGeNCIES DEALING WITH OPERATIONAL HYDROLOGYPage 5
STATE DR TERRITORYType of co· ordination
Name and address of AgencyResponsible authority (Ministry)
(1 )
Mainactivitiesof Agency
(2)
Level
(3)
HydroLogical stations
(4)ABC 0 E F G H J K
Yearbooksor
sunmaries(5 )
ABC
DatacataLogues
(6)ABC
Dominica5 Caribbean MeteoroLogical Institute,
caribbean Operational HydrologicalInstitute
P.O. Box 130, Bridgetown
Dominican RepublicCo-ordination: Ad hoc1 Division Hidrologia
Apartado Postal 1407, Santo DomingoInstitute Nacional de RecursosHidraulicos
G
GHA F
T(continued)R 3 3
NR
3 3 3
2 OficTna de HidrologiaApartado Postal 1503, Santo DomingoInstituto Nacional de Agua Potable yAlcantarillados
3 Oficina Nacional de MeteoroLogiaApartado Postal 1153, Santo Domingo
EL SalvadorCo-ordination by agency 11 Servicio de Meteorologfa e Hidrologfa
CantonEl Matasano, Soyapango, SanSalvador, El Salvador, C.A.
Ministerio de Agricultura y Ganaderfa
France (Guadeloupe)Co-ordination: Ad hoc1 ORSTOM Guadeloupe
B.P. 1020, 97178 Pointe a Pitre CedexInstitut Fran9ais de RechercheScientifique pour le Developement enCooperation
WP
G
G
G A~F
R
N
N
N
2
2 2
2
2
2
2
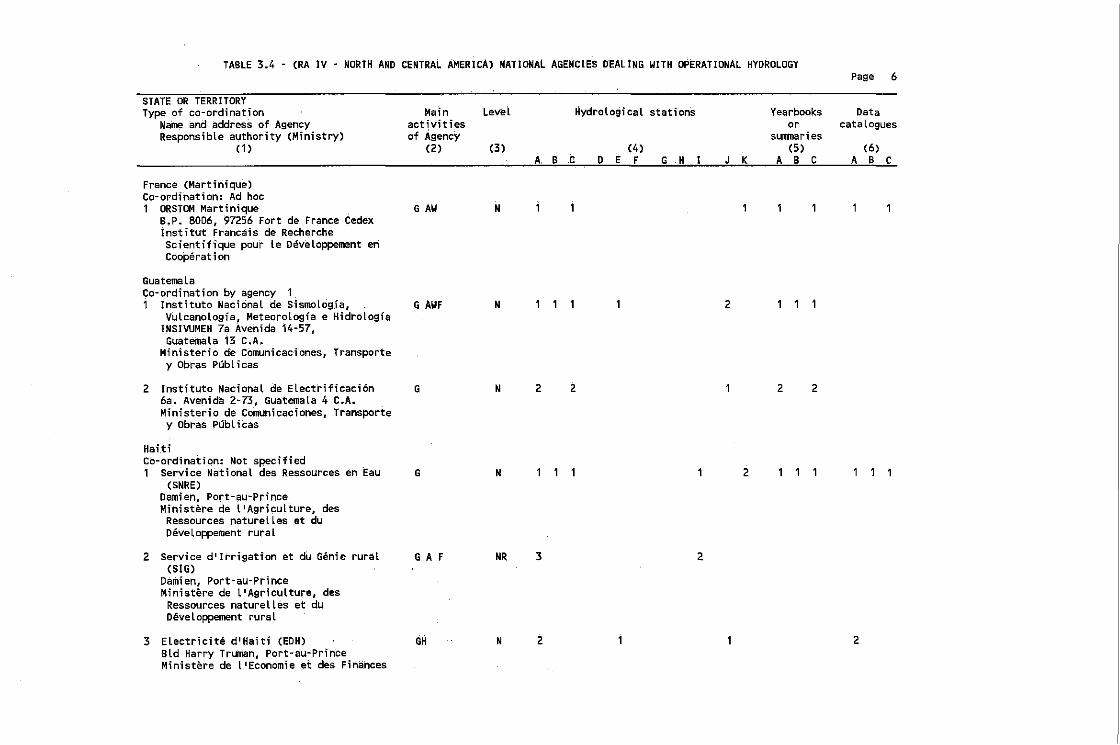
TABLE 3.4 - (RA IV • NORTH AND CENTRAL AMERICA) NAtiONAL AGENCIES DEALING WITH OPERAtIONAL HYDROLOGYPage 6
STATE OR TERRITORYType of co-ordination
Name and address of AgencyResponsible authority (Ministry)
(1)
Main LeveLactivitiesof Agency
(2) (3)
HYdrological stations
(4)A. BC D E F G H
Yearbooks Dataor catalogues
surnnaries(5) (6)
J K A B C A B C
France (Martinique)co-oFdination: Ad hoc1 ORSTOM Martinique ,
B.P. 8006, 97256 Fort de France Cedexinstitut Francais de RechercheScientifique pour ie Developpement enCooperation
GuatemalaCo-ordination by agency 11 Institute Nacional de S;smoLog;a,
Vulcanologia, Meteorologia e Hi'dr-ologiaINSIVUMEH 7a Avenida 14-57,Guatemala 13 C.A.
Ministerio de ComunicaC'iones, Transportey Obras Publicas
2 Instituto Nacional de Electrificaci6n6a. Avenida 2~73, Guatemala 4 C.A.Ministerio de Cornunicaciones, Transporte
y Obras Publlcas
HaitiCo-ordination: Not specified1 Service National des Ressources en Eau
(SNRE)Darnien, Port-au~Prince
Ministere de t'Agriculture, desRessources naturelles et duDeveLoppement rural
2 Service d'lrrigation et du Genie rural(SIG)
Darnien, Port-au-PrinceMinistere de l'Agriculture, des
Ressources naturelles et duDeveloppement rural
3 Electricite d'Haiti (EDH)Bld Harry Truman, Portwau-PrinceMinistere de llEconomie et des Finances
G AW
G AWF
G
G
G A F
GH
N
N
N
N
N~
N
2
3
2
2
2
2
2
2 2
2
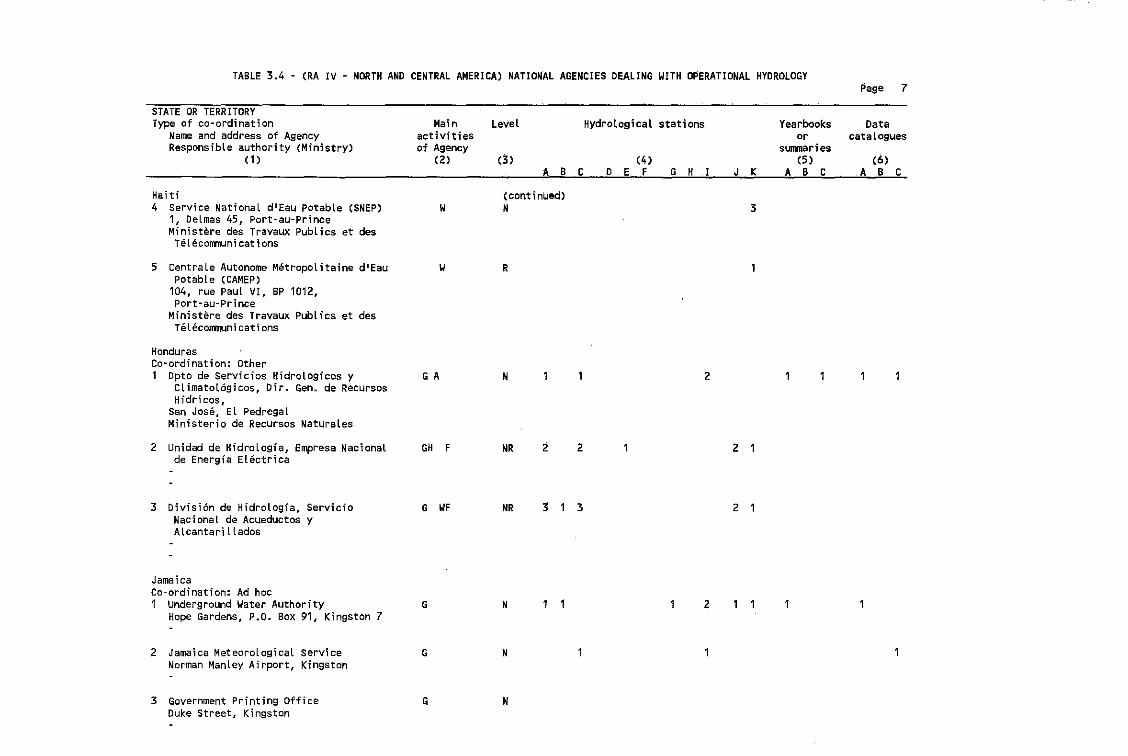
TABLE 3.4 - (RA IV - NORTH AND CENTRAL AMERICA) NATIONAL AGENCIES DEALING WITH OPERATIONAL HYDROLOGYPage 7
STATE OR TERRITORYType of co-ordination
Name and address of AgencyResponsible authority (Ministry)
(1 )
Haiti4 Service NationaL dlEau Potable (SNEP)
1, DeLmas 45, port-au-PrinceMinistere des Travaux Publics et des
TeLecommunications
Main Level Hydrological stationsactivitiesof Agency
(2) (3) (4)A B C D E F G H
(continued)W N
Yearbooks Dataor catalogues
surrmaries(5) (6)
J K A B C A B C
3
5 Centrale Autonome Metropolitaine d'EauPotable (CAMEP)
104, rue Paul VI, BP 1012,Port-au-Prince
Ministere des Travaux Publics et desTelecommunications
HondurasCo-ordination: Other1 Dpto de Servicios Hidrologicos y
CLimatol6gicos, Ofr. Gen. de RecursosHidricos,
San Jose, El PedregalMinisterio de Recursos Naturales
2 Unidad de Hidrologia, Empresa Nacl0nalde Energia Electrica
3 Division de Hidrologfa, ServicioNacional de Acueductos yAlcantarillados
JamaicaCo-ordination: Ad hoc1 Underground Water Authority
Hope Gardens, P.O. Box 91, Kingston 7
2 Jamaica Meteorological serviceNorman Manley Airport, Kingston
3 Government Printing OfficeDuke Street, Kingston
W
G A
GH F
G WF
G
G
G
R
N
NIR
NR
N
N
N
2
3
2
3
2
2
2
2 1
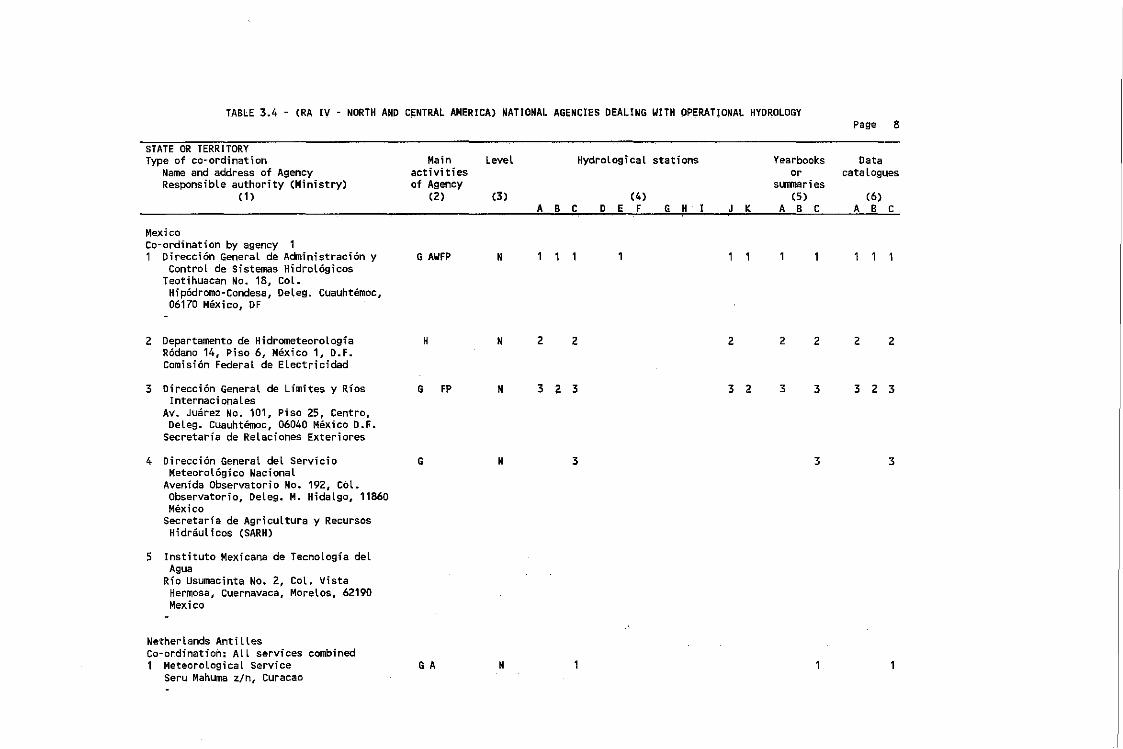
TABLE 3.4 - (RA IV - NORTH AND CENTRAL AMERICA) NATIONAL AGENCIES DEALING WITH OPERATIONAL HYDROLOGYPage 8
STATE OR TERRITORYType of co-ordination
Name and address of AgencyResponsible authority (Ministry)
(1)
Main leveL Hydrological stationsactivitiesof Agency
(2) (3) (4)A B C D E F G H
Yearbooks Dataor catalogues
sunmaries(5) (6)
J K A B C A B C
MexicoCo-ordination by agency 11 Direcci6n General de Administraci6n y
Control de Sistemas Hidrot6gicosTeotihuacan No. 18, CoL.
Hip6dromo-Condesa, Deleg. Cuauhtemoc,06170 Mexico, OF
2 Departamento de HidrometeorologiaR6dano 14, Piso 6, Mexico 1, D.F.Comisi6n Federal de Electricidad
G AWFP
H
N
N 2 2 2 2 2 2 2
3 Direccion General de Limites y RiosInternacionales
Av. Juarez No. 101, Piso 25, Centro,Deteg. Cuauhtemoc, 06040 Mexico D.F.
Secretaria de Relaciones Exteriores
4 Direcci6n GeneraL del ServicioMeteorol6gico Nacional
Avenida Observatorio No. 192, Col.Observatorio, Deleg. M. Hidalgo, 11860Mexico
Secretarfa de Agricultura y RecursosHidraulicos CSARH)
5 Instituto Mexicana de Tecnologfa delAgua
Rfo Usumac;nta No.2, Col. VistaHermosa, Cuernavaca, Morelos, 62190Mexico
Netherlands AntillesCo-ordination: All services combined1 Meteorological Service
Seru Mahuma z/n, Curacao
G FP
G
G A
N
N
N
323
3
3 2 3 3
3
3 2 3
3
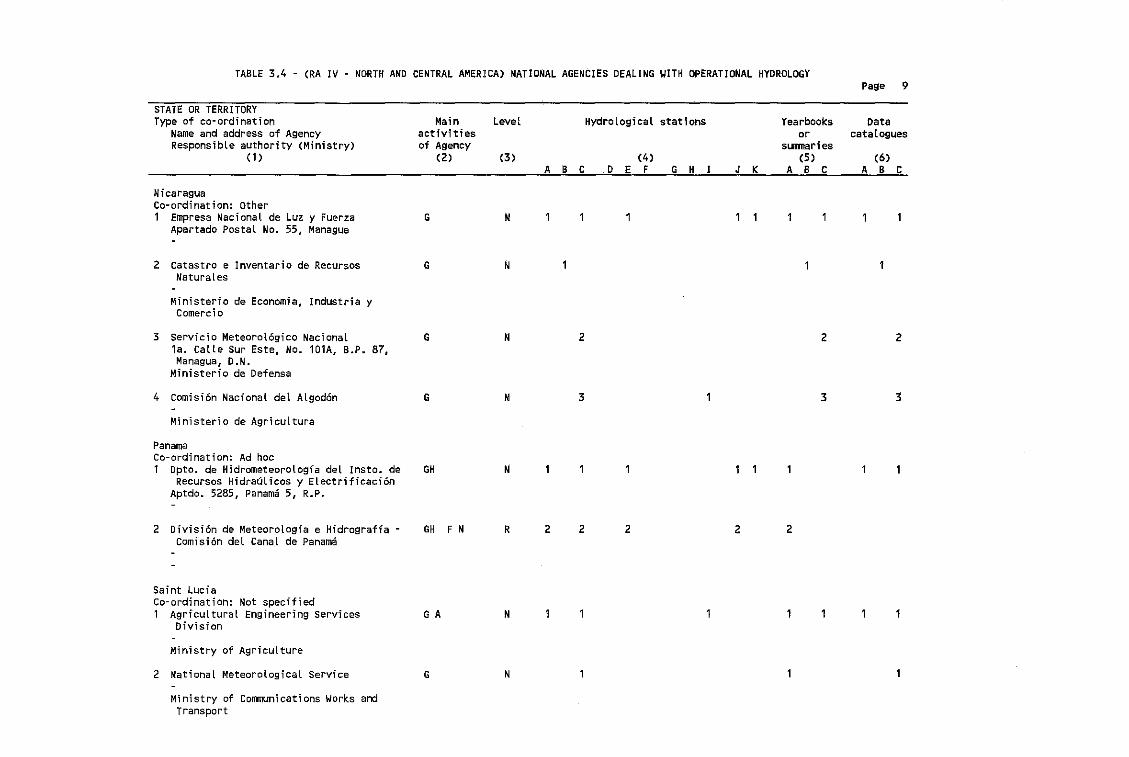
TABLE 3.4 - (RA IV - NORTH AND CENTRAL AMERICA) NATIONAL AGENCIES DEALING WITH OPERATIONAL HYDROLOGYPage 9
STATE OR TERRITORYType of co-ordination
Name and address of AgencyResponsibLe authority (Ministry)
(1)
Main Level HydroLogical stationsactivitiesof Agency
(2) (3) (4)
A B C 0 E F G H
Yearbooks Dataor catalogues
slITITlar i es(5) (6)
J K A B C A B C
NicaraguaCo-ordination: other1 empresa Nacional de Luz y Fuerza
Apartado Postal No. 55, Managua
2 Catastro e Inventario de RecursosNaturales
Ministerio de Economia, Industria yComerci 0
3 servicio Meteoro16gico Nacional1a. Calle Sur Este, No. 101A, B.P. 87,Managua, D.N.
Ministerio de Defensa
4 comisi6n Nacional del ALgod6n
Ministerio de Agricultura
PanamaCo-ordination: Ad hoc1 Dpto. de Hidrometeorologfa del Insta. de
Recursos HidrauLicos y Electrificaci6nAptdo. 5285, Panama 5, R.P.
2 Division de Meteorologfa e HidrograffaComision del Can~l de Panama
Saint LuciaCo-ordination: Not specified1 Agricultural Engineering services
Division
Ministry of Agriculture
2 National Meteorological service
Ministry of Communications Works andTransport
G
G
G
G
GH
GH F N
G A
G
N
N
N
N
N
R
N
N
2
2
3
2 2 2 2
2
3
2
3
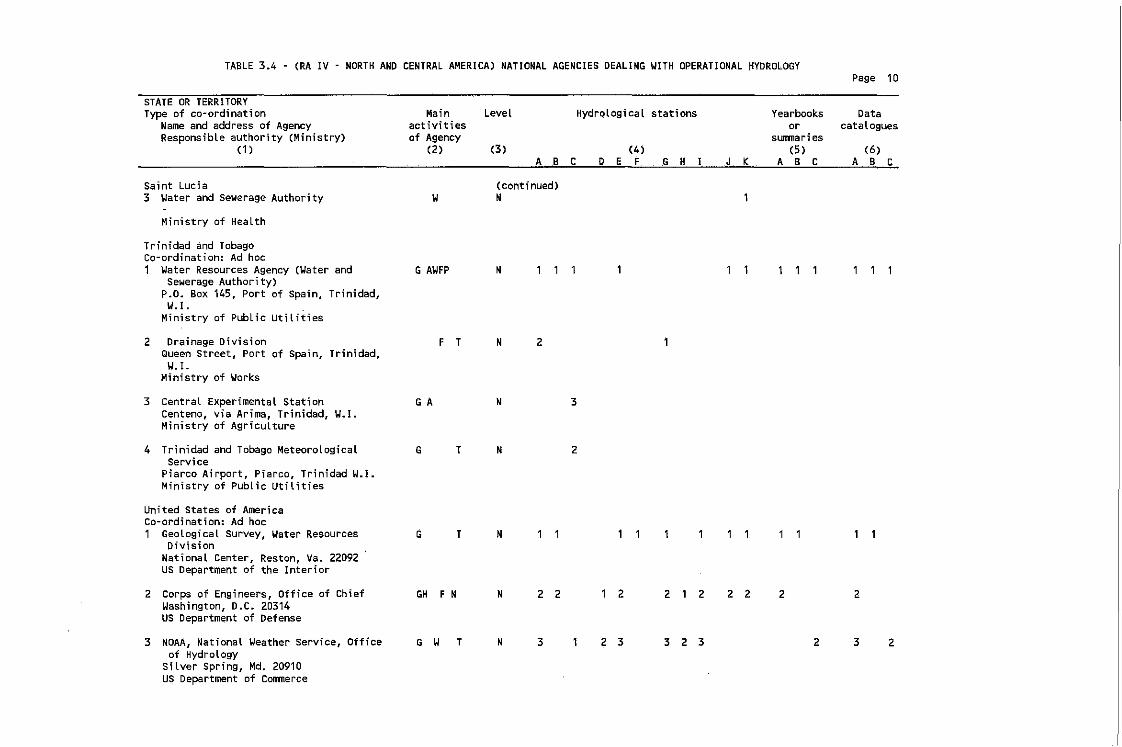
TABLE 3.4 - (RA IV - NORTH AND CENTRAL AMERICA) NATiONAL A"ENCIES DEALING WITH OPERATIONAL HYDROLOGYPage 10
STATE OR TERRITORYType of co-ordination Main Level Hydrological stations Yearbooks Data
Name and address of Agency activities or cataloguesResponsible authority (Ministry) of Agency sunmaries
(1 ) (2) (3) (4) (5) (6)
A B C D E F G H I J K A B C A B C
Saint Lucia (continued)3 Water and Sewerage Authority W N
Ministry of Health
Trinidad and TobagoCo-ordination: Ad hoc, Water Resources Agency (Water and G AWFP N
Sewerage Authority)P.O. Box 145, Port of Spain, Trinidad,
W. I.Ministry of Public Utilities
2 Drainage Division F T N 2Queen Street, Port of Spain, Trinidad,
W. I.Ministry of Works
3 CentraL Experimental Station G A N 3Centeno, via Arima, Trinidad, W.I.Ministry of Agriculture
4 Trinidad and Tobago Meteorological G T N 2Service
Piarco Airport, Piarco, Trinidad W.I.Ministry of Public Utilities
United States of AmericaCo-ordination: Ad hoc, Geological Survey, Water Resources G T N
DivisionNational Center, Reston, Va. 22092us Department of the Interior
2 Corps of Engineers, Office of Chief GH F N N 2 2 , 2 2 1 2 2 2 2 2Washington, D.C. 20314us Department of Defense
3 NOAA, National Weather Service, Office G W T N 3 1 2 3 3 2 3 2 3 2of Hydrology
Silver Spring, Md. 20910US Department of Commerce
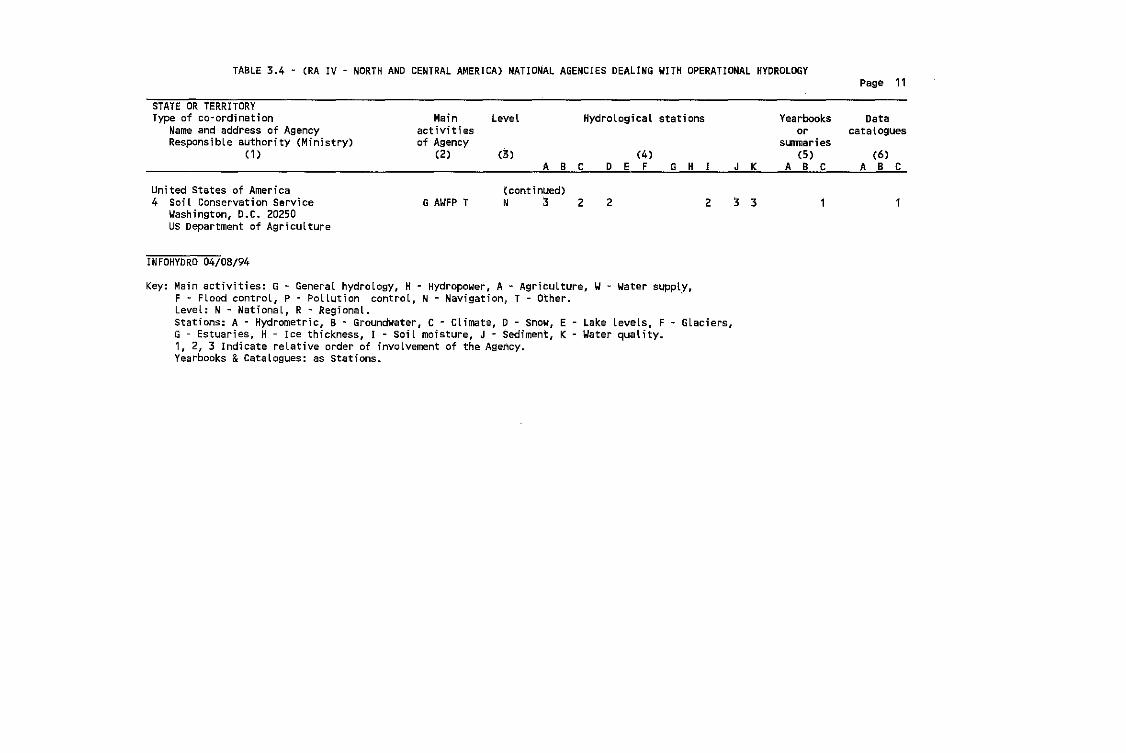
TABLE 3.4 • (RA IV . NORTH AND CENTRAL AMERICA) NATIONAL AGENCIES DEALING WITH OPERATIONAL HYDROLOGY
STATE OR TERRITORYType of co~ordination
Name and address of AgencyResponsibLe authority (Ministry)
(1 )
United States of America4 Soil Conservation Service
Washington, D.C. 20250US Department of Agriculture
INFOHYDRO 04/08/94
Page 11
Main Level HydroLogical stations Yearbooks Dataactivities or cataloguesof Agency slITmaries
(2) (3) (4) (5) (6)A B C D E F G H I J K A B C A B C
(continued)G AWFP T N 3 2 2 2 :3 3
Key: Main activities: G - General hydrology, H - Hydropower, A - Agriculture, W~ Water supply,F - Flood control, P - PoLlution control, N - Navigation, T - Other. .Level: N - National, R - Regional.Stations: A - Hydrometric, B - Groundwater, C - CLimate, D Snow, E Lake levels, F - Glaciers,G - Estuaries, H - Ice thickness, I - Soil moisture, J - Sediment, K Water quaLity.1, 2, 3 Indicate relative order of involvement of the Agency.Yearbooks &Catalogues: as stations.

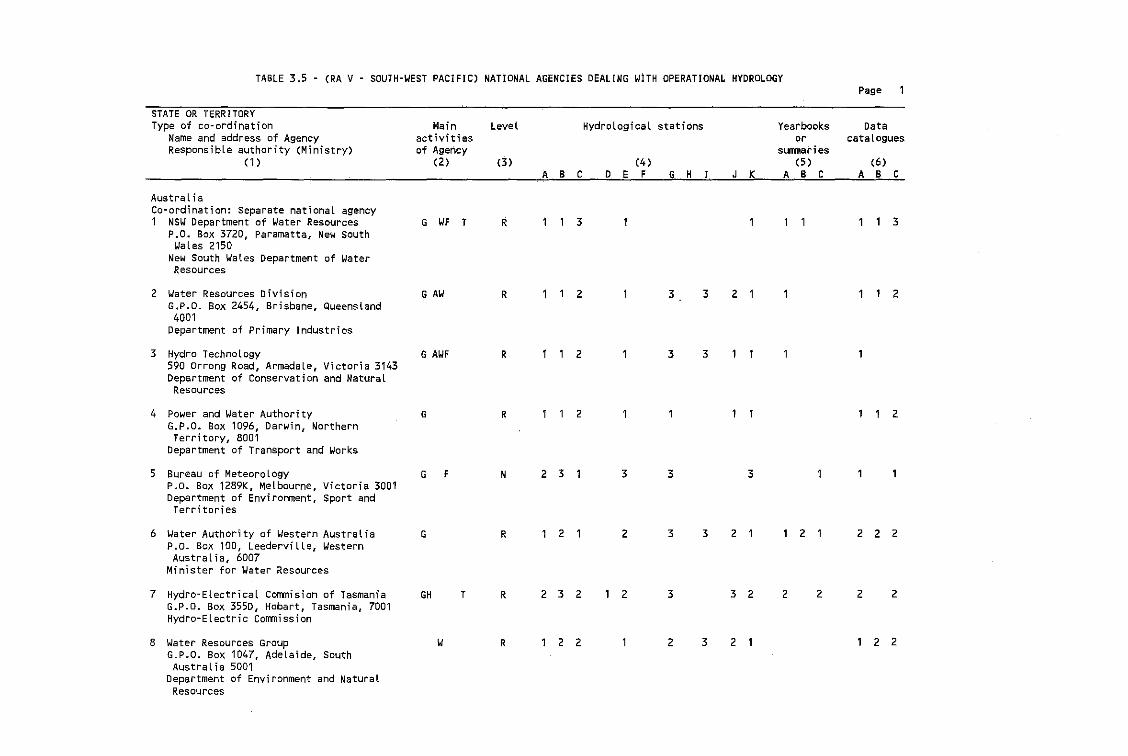
TABLE 3.5 - (RA V - SOUTH-~EST PACIFIC) NATIONAL AGENCIES DEALING ~lTH OPERATIONAL HYDROLOGYPage
STATE OR TERRITORYType of co·ordination Main Level HydroLogical stations Yearbooks Data
Name and address of Agency activities or cataloguesResponsible authority (Ministry) of Agency sLITI1laries
(1 ) (2) (3) (4 ) (5 ) (6)A B C 0 E F G H I J K A B C A B C
Austra l ; aCo-ordination: separate national agency1 NSW Department of Water Resources G ~F T R ~ 1 3 1 1 1 1 1 1 3
P.O. Box 3720, Paramatta, New SouthWaLes 2150
New South Wales Department of WaterResources
2 Water Resources Division G A~ R 1 1 2 1 3 3 2 1 1 1 1 2G,P.D. Box 2454, Brisbane, Queensland4001
Department of Primary Industries
3 Hydro Technology G A~F R 1 1 2 1 3 3590 Orrong Road, ArmadaLe, Victoria 3143Department of Conservation and NaturalResources
4 Power and Water Authority G R 1 1 2 1 1 1 1 1 1 2G.p.a. Box 1096, Darwin, NorthernTerritory, 8001
Department of Transport and Works
5 Bureau of Meteorology G F N 2 3 1 3 3 3P.o. Box 1289K, Melbourne, Victoria 3001Department of Environment, Sport andTerritories
6 Water Authority of Western Australia G R 1 2 1 2 3 3 2 1 1 2 1 2 2 2P.o. Box 100, Leederville, WesternAustral ia, 6007
Minister for Water Resources
7 Hydro·Electrical Commision of Tasmania GH T R 2 3 2 1 2 3 3 2 2 2 2 2G.p.D. Box 355D, Hobart, Tasmania, 7001Hydro-Electric Commission
8 Water Resources Group ~ R 1 2 2 1 2 3 2 1 1 2 2G.P.D. Box 1047, Adelaide, SouthAustral ia 5001
Department of Environment and NaturalResources
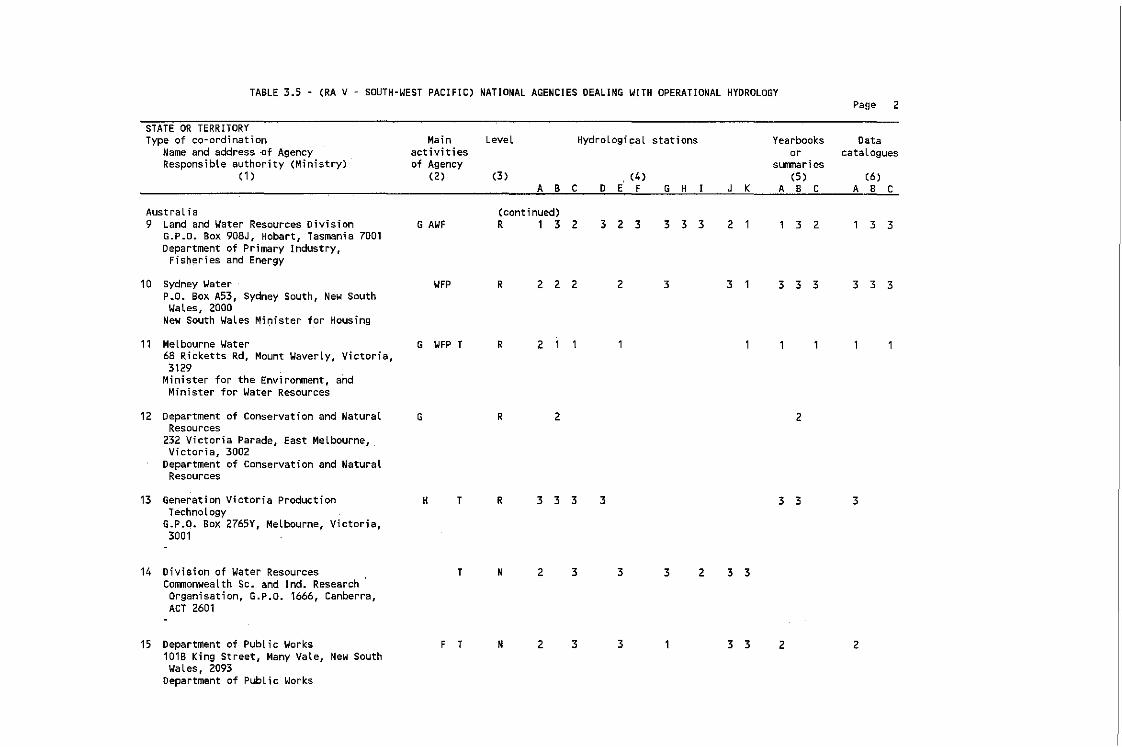
TABLE 3.5 - (RA V . SOUTH-WEST PACIFIC) NATIONAL AGENCIES DEALING WITH OPERATIONAL HYDROLOGYPage 2
STATE OR TERRITORYType of co-ordination Main Level Hydrological stations Yearbooks Data
Name and address -of Agency activities or catal.oguesResponsible authority (Ministry) of Agency sunmaries
(1 ) (2 ) (3) (4) (5 ) (6)A B C D E F G H I J K A B C A B C
Austral ia (continued)9 Land and Water Resources Division G AWF R 1 3 2 3 2 3 3 3 3 2 1 1 3 2 1 3 3
G.P.O. Box 908J, Hobart, Tasmania 7001Department of Primary Industry,
Fisheries and Energy
10 Sydney Water WFP R 2 2 2 2 3 3 1 3 3 3 3 3 3P.,O., Box A53, Sydney South, New SouthWales, 2000
New South WaLes Mi~ister for Housing
11 Melbourne Water G WFP T R 2 168 Ricketts Rd, Mount WaverLy, Victoria,3129
Minister for the Environment, andMinister for Water Resources
12 Department of Conservation and Natural G R 2 2Resources
232 Victoria Parade, East Melbourne,Victoria, 3002
Department of Conservation and NaturalResources
13 Generation Victoria Production H T R 3 3 3 3 3 3 3Technology
G.P.O. Box 2765Y, MeLbourne, Victoria,3001
14 Division of Water Resources T N 2 3 3 3 2 3 3CommonweaLth Sc. and Ind. ResearchOrganisation, G.P.D. 1666, Canberra,ACT 2601
15 Department of Public Works F T N 2 3 3 1 3 3 2 2101B King Street, Many Vale, New SouthWaLes, 2093
Department of PubLic Works
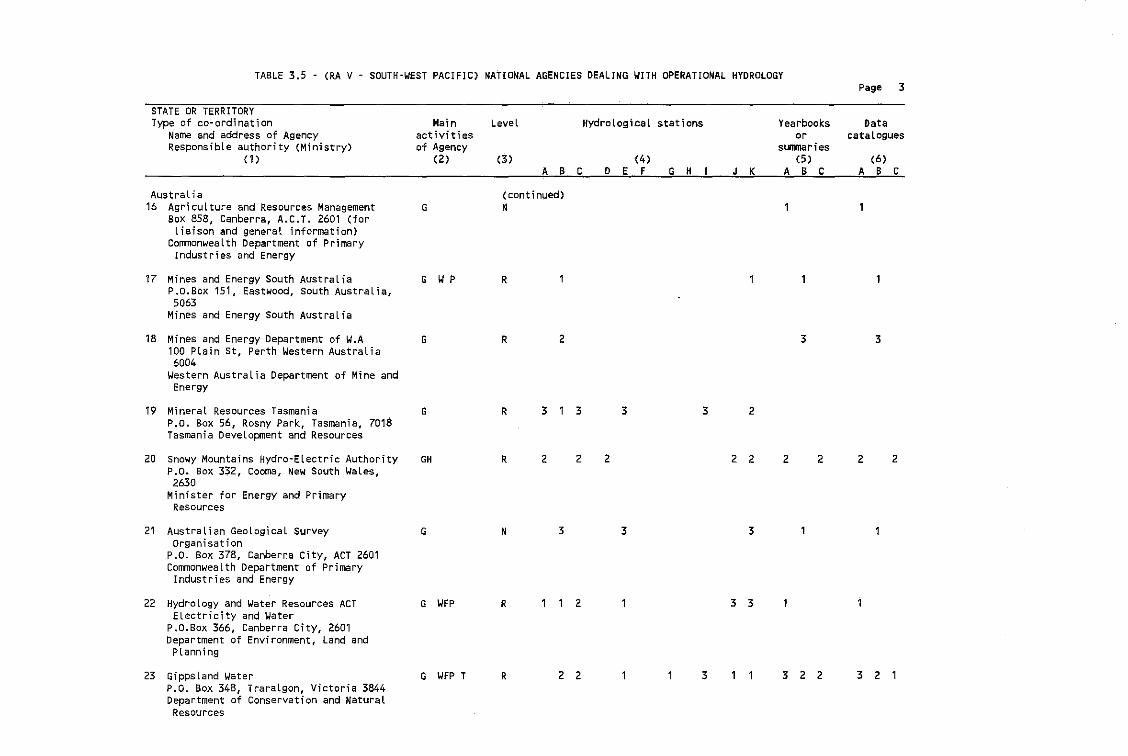
TABLE 3.5 - (RA V - SOUTH-WEST PACIFIC) NATiONAL AGENCIES DEALING WITH OPERATIONAL HYDROLOGYPage 3
STATE OR TERRITORYType of co·ordination Main LeveL HydroLogical stations Yearbooks Data
Name and address of Agency activities or cataloguesResponsible authority (Ministry) of Agency sunrnaries
(1 ) (2) (3) (4) (5 ) (6)A B C D E F G H I J K A B C A B C
AustraLia (continued)16 Agriculture and Resources Management G N
Box 858, Canberra, A.C.T. 2601 (forLiaison and general information)
CommonweaLth Department of PrimaryIndustries and Energy
17 Mines and Energy South Australia G WP RP.D.Box 151, Eastwood, South Australia,5063
Mines and Energy South Australia
18 Mines and Energy Department of W.A G R 2 3 3100 Plain St, Perth Western Australia6004
Western Australia Department of Mine andEnergy
19 Mineral Resources Tasmania G R 3 1 3 3 3 2P.O. Box 56, Rosny Park, Tasmania, 7018Tasmania Development and Resources
20 snowy Mountains Hydro~Electric Authority GH R 2 2 2 2 2 2 2 2 2P.o. Box 332, Cooma, New South Yales,2630
Minister for Energy and PrimaryResources
21 Australian Geological Survey G N 3 3 3organisation
P.o. Box 378, Canberra City, ACT 2601Commonwealth Department of Primary
Industries and Energy
22 Hydrology and Water Resources ACT G WFP R 1 1 2 1 3 3Electricity and Water
P.O.Box 366, Canberra City, 2601Department of Environment, Land andPlanning
23 Gippsland Water G WFP T R 2 2 1 1 3 1 1 3 2 2 3 2 1P.O. Box 348, Traralgon, Victoria 3844Department of Conservation and NaturalResources
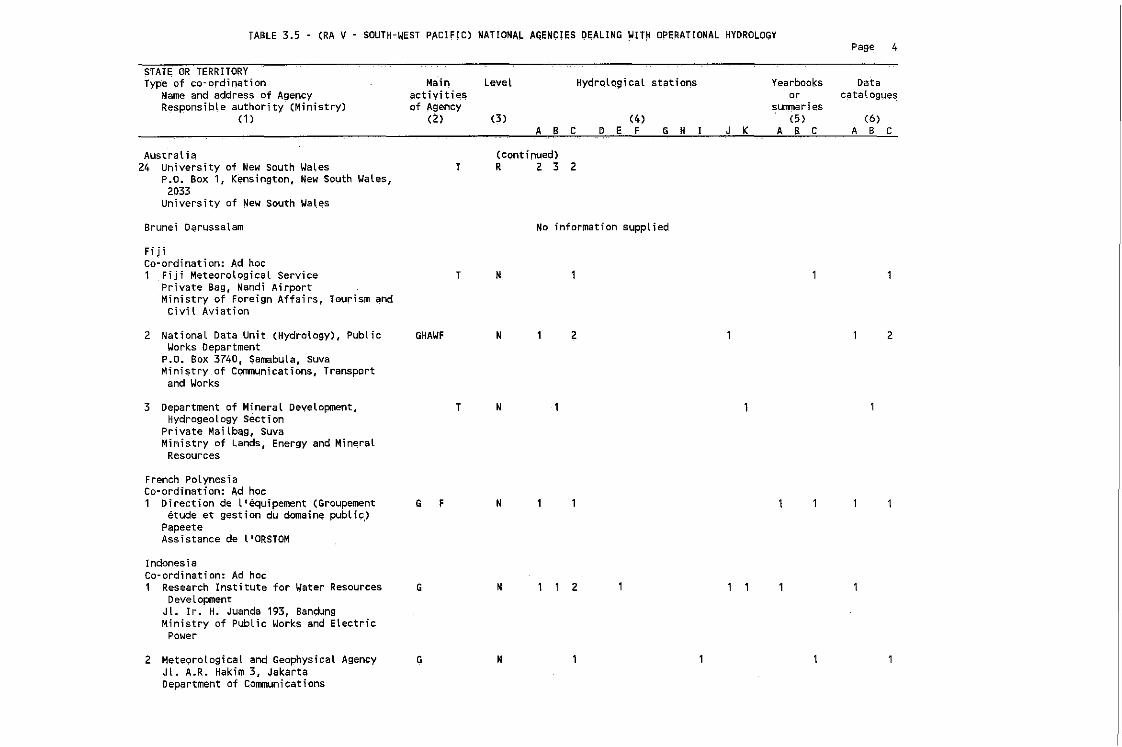
TABLE 3.5 - (RA V - SOUTH-WEST PACIFIC) NATIONAL A~ENCIES DEALING WITH OPERATIONAL HYDROLOGYpage 4
STATE OR TERRITORYType of co-ordination
Name and address of AgencyResponsible authority (Ministry)
(1)
Main Level~ctivitie:~
of Asency(2) (3)
HYdrqlQ~;cal st~tion~
(4)ABC D E F G H K
Yearbooksor
sUfJITlaries(5 )
ABC
Datacatalogues
(6)
ABC
Australia24 University of New South WaLes
P.O. Box 1, Kensington. New South Wales,2033
University of New South Wales
Brunei Darussalam
FijiCo· ordination: Ad hoc1 Fiji MeteorologicaL Service
Private Bag, Nandi AirportMinistry of Foreign Affairs, Tourism andCivil Aviation
T
T
(continued)R 2 3 2
No information suppLied
N
2 NationaL Data Unit (Hydrology), PublicWorks Department
P.O. Box 3740, Samabula, SuvaMinistry,of Communications, Transport
and Works
3 Department of MineraL Development,Hydrogeology Section
Private Mailb~g, SuvaMinistry of Lands, Energy and Min~ral
Resources
French PolynesiaCo· ordination: Ad hoc1 Direction de l'equipement (Groupement
etude et gestion du dornaine public)PapeeteAssistance de llORSTOM
IndonesiaCo· ordination: Ad hoc1 Research Institute for Water Resources
DeveLopmentJ l. I r. H. Juanda 193, BandungMinistry of PubLic Works and Electric
Power
2 Meteorological and Geophysical AgencyJl. A.R. Hakim 3, JakartaDepartment of Communications
GHAWF
G F
G
G
T
N
N
N
N
N
2
2
2
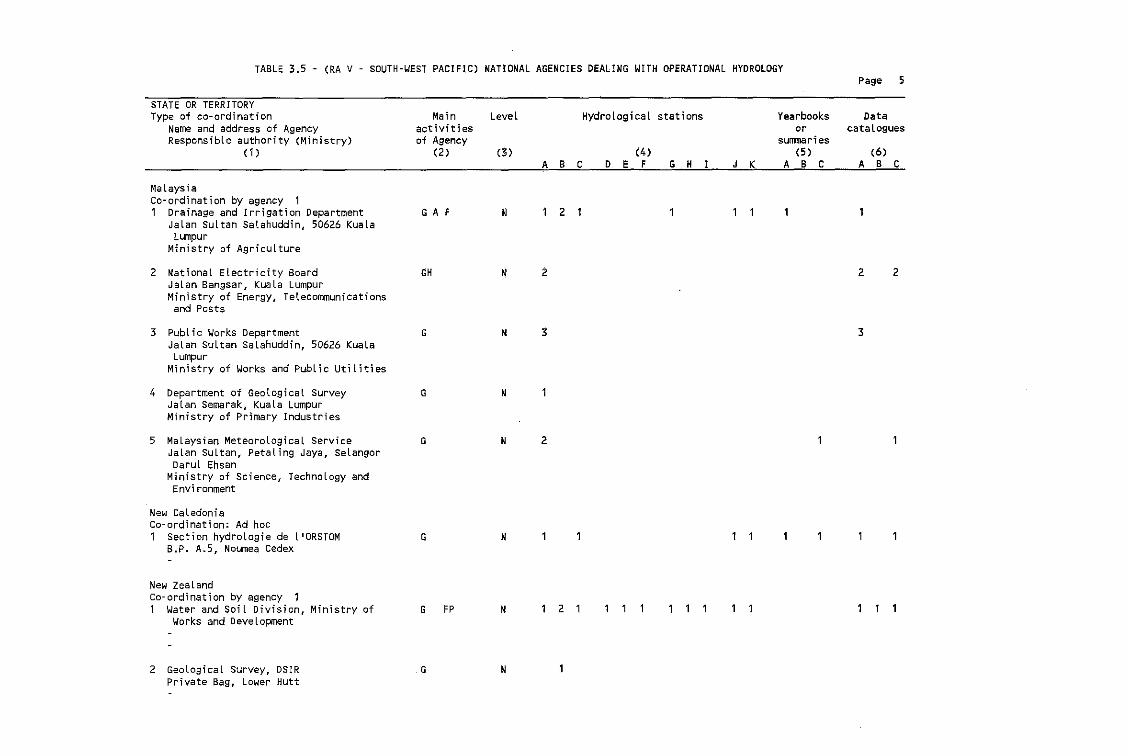
TABLE 3.5 - (RA v - SOUTH-~EST PACIFIC) NATIONAL AGENCIES DEALING ~ITH OPERATIONAL HYDROLOGYPage 5
STATE OR TERRITORYType of co-ordination
Name and address of AgencyResponsible authority (Ministry)
(1 )
Main Level Hydrological stationsactivitiesof Agency
(2 ) (3 ) (4)A B C D E F G H
Yearbooks Dataor catalogues
sunmaries(5 ) (6)
J K A B C A B C
MalaysiaCo-ordination by agency 11 Drainage and Irrigation Department
Jelen sultan Satahuddin, 50626 Kualalumpur
Ministry of Agriculture
2 National Electricity BoardJelen Bangsar, Kuala LumpurMinistry of Energy, Telecommunications
and Posts
3 Public Works DepartmentJeLen Sultan Salahuddin, 50626 KuaLa
LumpurMinistry of Works and Public Utilities
4 Department of Geological SurveyJalen Semarak, Kuala LumpurMinistry of Primary Industries
5 Malaysian Meteorological ServiceJalan Sultan, Petaling Jaya, SelangorDarul Ehsan
Ministry of Science, Technology andEnvi ronment
New CaledoniaCo-ordination: Ad hoc1 Section hydrologie de LIORSTOM
B.P. A.5, Noumea Cedex
New ZealandCo-ordination by agency 11 Water and Soil Division, Ministry of
Works and Development
2 Geological Survey, DSIRPrivate Bag, Lower Hutt
G A F
GH
G
G
G
G
G FP
G
N
N
N
N
N
N
N
N
2
3
2
2
2 1
2
3
2
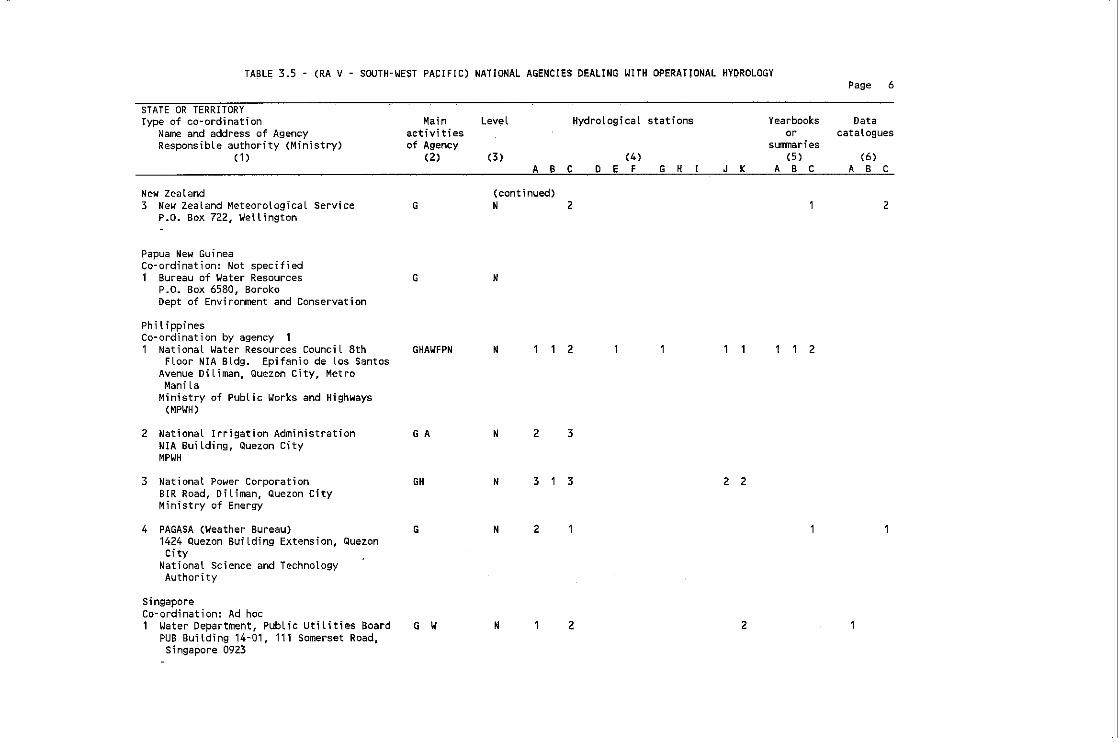
TABLE 3.5 - (RA V - SOUTH-WEST PACIFIC) NATIONAL AGENCIES DEALING WITH OPERATIONAL HYDROLOGYPage 6
STATE OR TERRITORYType of co-ordination
Name and address of AgencyResponsibLe authority (Ministry)
(1)
Main Levelactivitiesof Agency
(2) (3)
Hydrological stations
(4)ABC D E F G H
Yearbooks Dataor catalogues
slIITfTlaries(5 ) (6)
J K A B C A B C
New Zealand3 New Zealand MeteorologicaL Service
P.o. Box 722, WellingtonG
(continued)N 2 2
Papua New GuineaCo· ordination: Not specified1 Bureau of Water Resources G N
P.O. Box 6580, SorokaDept of Environment and Conservation
Phi t ippinesCo-ordination by agency 11 NationaL Water Resources Council 8th GHAWFPN N 1 1 2 1 1 1 1 1 1 2
Floor NIA Bldg. Epifanio de Los SantosAvenue DiLiman, Quezon City, MetroManiLa
Ministry of Public Works and Highways(MPWH)
2 NationaL Irrigation Administration G A N 2 3NIA BuiLding, Quezon CityMPWH
3 National Power Corporation GH N 3 1 3 2 2BIR Road, Diliman, Quezon CityMinistry of Energy
4 PAGASA (Weather Bureau) G N 21424 Quezon BuiLding Extension, QuezonCity
National Science and TechnologyAuthori ty
SingaporeCo· ordination: Ad hoc1 Water Department, PubLic UtiLities Board G W N 1 2 2
PUB Building 14-01, 111 Somerset Road,Singapore 0923
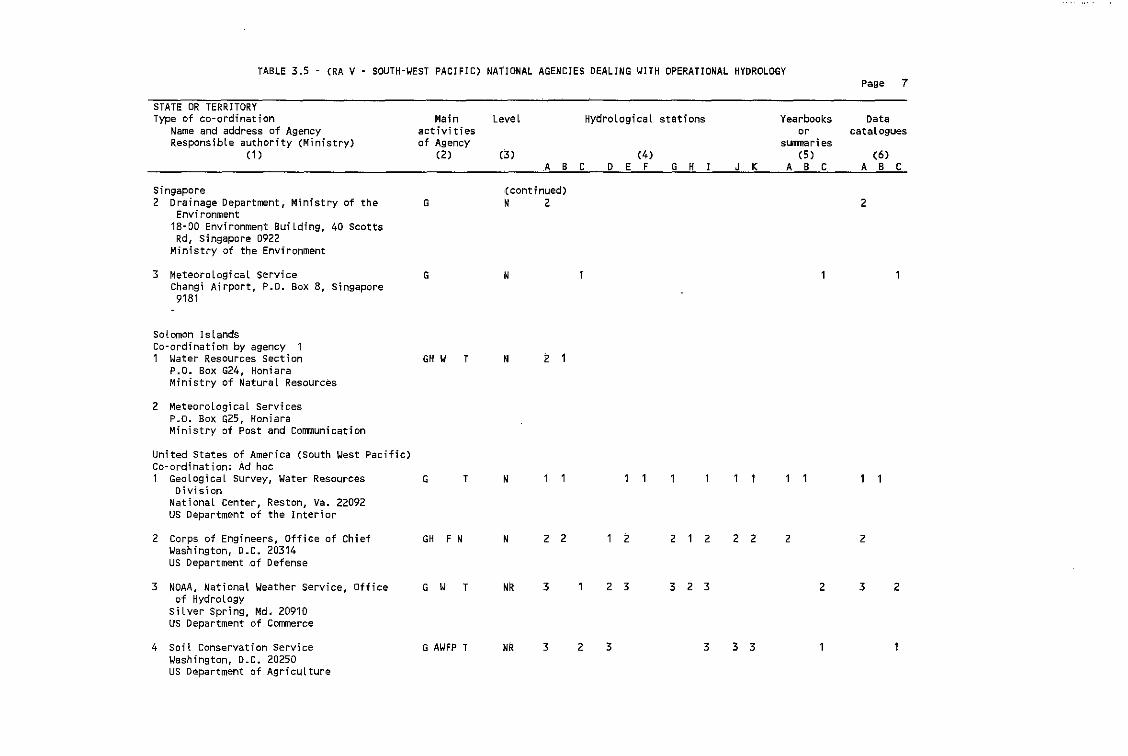
TABLE 3.5 - (RA V - SOUTH-WEST PACIFIC) NATIONAL AGENCIES DEALING WITH OPERATIONAL HYDROLOGYPage 7
STATE OR TERRITORYType of co-ordination Main Level Hydrological stations Yearbooks Data
Name and address of Agency activities or cataloguesResponsible authority (Ministry) of Agency sumner; es
(1 ) (2) (3 ) (4) (5 ) (6)A B C D E F G H I J K A B C A B C
Singapore (continued)2 Drainage Department, Ministry of the G N 2 2
Environment18-00 Environment Building, 40 Scotts
Rd, Singapore 0922Ministry of the Environment
3 MeteoroLogical service G NChang; Airport, P.o. Box 8, Singapore
9181
Solomon IslandsCo·ordination by agency 11 Water Resources Section GH W T ~ 2 1
P.o. Box G24, HoniaraMinistry of NaturaL Resources
2 Meteorological ServicesP.o. Box G25, HoniaraMinistry of Post and communication
United States of America (South West Patific)Co-ordination: Ad hoc1 GeoLogical Survey, Water Resources G T N
DivislonNational Center, Reston, Va. 22092US Department of the Interior
2 Corps of Engineers, Office of Chief GH F N N 2 2 1 2 2 1 2 2 2 2 2Washington, D.C. 20314US Department ,of Defense
3 NOAA, NationaL Weather Service, Office G W T NR 3 1 2 3 3 2 3 2 3 2of HydroLogy
siLver Spring, Md. 20910US Department of Commerce
4 Soil Conservation Service G AWFP T NR 3 2 3 3 3 3Washington, D.C. 20250US Department of Agriculture
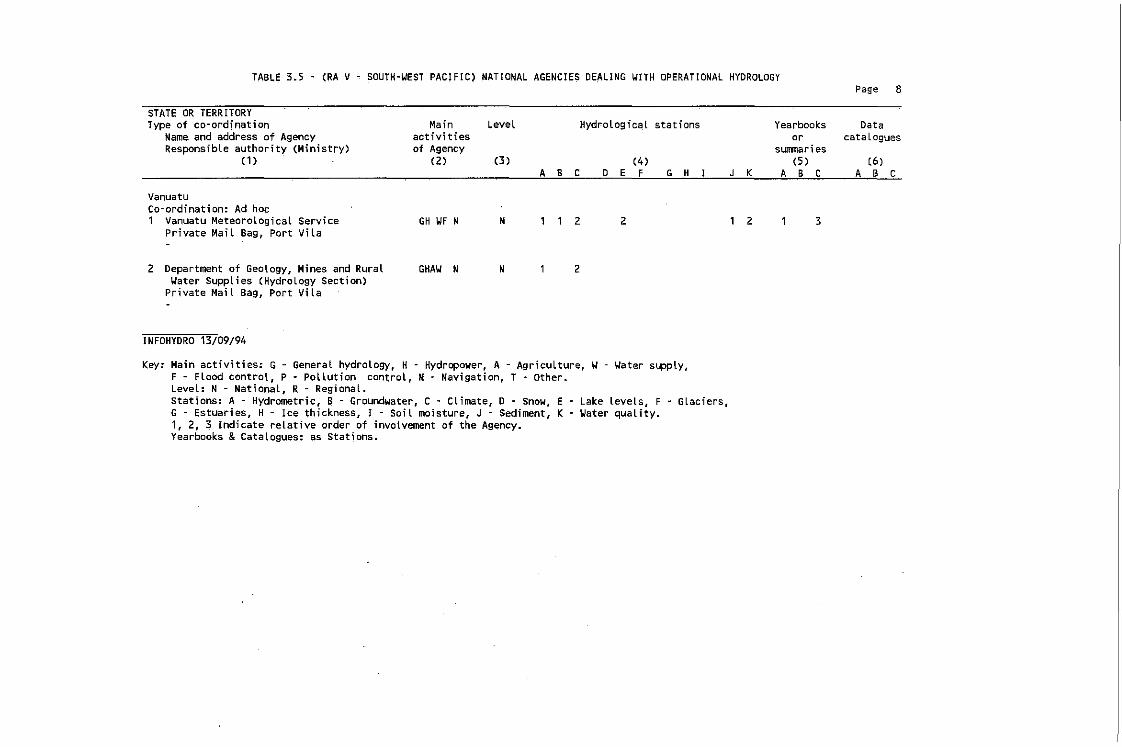
TA~~E 3.5 - (RA V - SOUTH-WEST PACIFIC) NATIONA~ AGENCIES DEA~lNG WITH OPERATIONA~ HYDRO~OGY
STATE OR TERRITORYType of co-ordination
Name and address of AgencyResponsible authority (Ministry)
(1)
VanuatuCo~ordination: Ad hoc1 Vanuatu MeteorologicaL Service
Private Mail Bag, Port Vila
2 Department of Geology, Mines and RuralWater Supplies (Hydrology Section)
Private MaiL Bag, Port Vila
INFOHYDRO 13/09/94
Page 8
Main LeveL Hydrological stations Yearbooks Dataactivities or cataloguesof Agency surrmaries
(2) (3 ) (4) (5 ) (6 )A ~ C D E F G H I J K A ~ C A ~ C
GH WF N N , 1 2 2 1 2 1 3
GHAW N N 1 2
Key: Main activities: G - General hydrology, H - Hydropower, A - Agriculture, W- Water supply,F - Flood control, P • Pollution control, N . Navigation, T - Other.Level: N - National, R - Regional.stations: A - Hydrometric, B - Groundwater, C - Climate, 0 Snow, E Lake levels, F - Glaciers,G - Estuaries, H - lee thickness, I - Soil moisture, J - Sediment, K Water quality.1, 2, 3 Indicate relative order of involvement of the Agency.Yearbooks & Catalogues: as Stations.
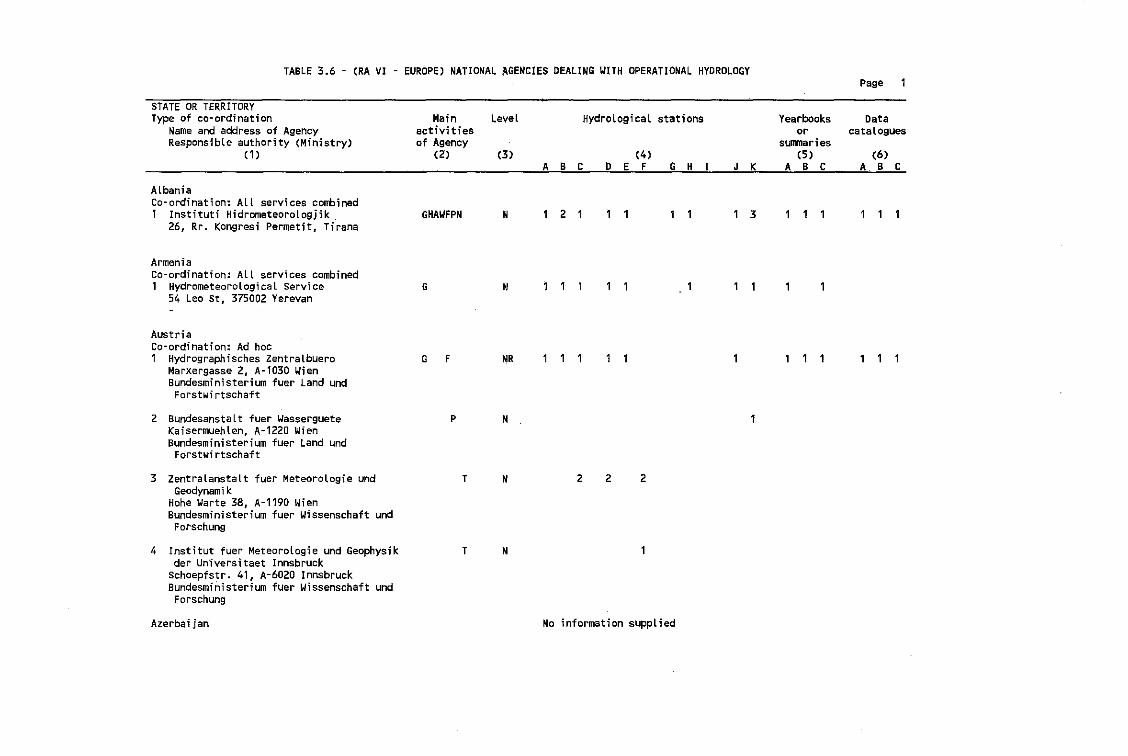
TABLE 3.6 - (RA VI - EUROPE) NATIONAL AGENCIES DEALING WITH OPERATIONAL HYDROLOGYPage
STATE OR TERRITORYType of co·ordination
Name and address of AgencyResponsible authority (Ministry)
(1)
Main Level Hydrological stationsactivitiesof Agency
(2) (3) (4)
A B C .0 E F G H J K
Yearbooksor
SUlrmaries(5)
ABC
Datacatalogues
(6)ABC
AlbaniaCo· ordination: All services combined1 Instituti Hidrometeorologjik .
26, Rr. Kongres; Permetit, Tirana
ArmeniaCo-ordination: ALL services combined1 HydrometeorologicaL Service
54 Leo St, 375002 Yerevan
AustriaCo·ordination: Ad hoc1 Hydrographisches Zentralbuero
Marxergasse 2, A-1030 WienBundesministerium fuer land und
Forstwirtschaft
2 Bundesanstalt fuer WassergueteKaisermuehten, A-1220 WienBundesministerium fuer land unci
Forstwirtschaft
GHAWFPN
G
G F
P
N
N
NR
N
2 1 1 3
3 Zentralanstalt fuer Meteorologie und T N 2 2 2Geodynami k
Hohe Warte 38, A-1190 WienBundesministerium fuer Wissenschaft und
Forschung
4 Institut fuer Meteorologie und Geophysikder Universitaet Innsbruck
Schoepfstr. 41, A-6020 InnsbruckBundesministerium fuer Wissenschaft und
Forschung
Azerbaijan
T N
No information suppLied
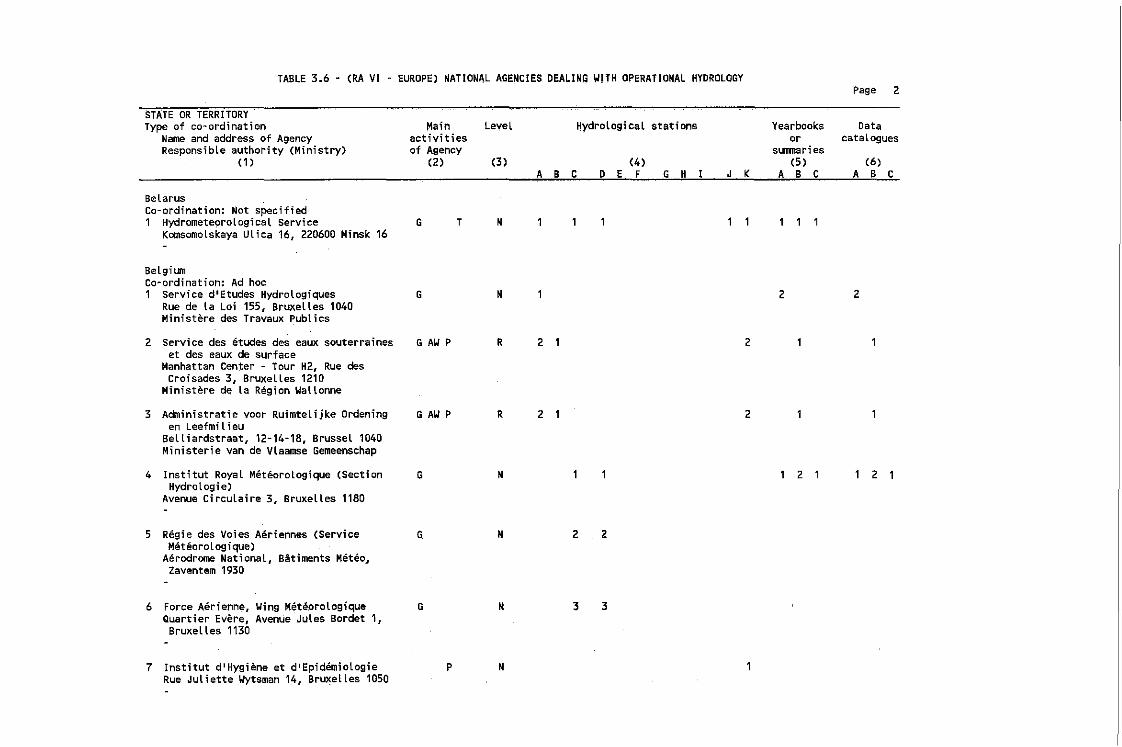
TABLE 3.6 • (RA VI . EUROPE) NATIONAL AGENCIES DEALING WITH OPERATIONAL HYDROLOGYPage 2
STATE OR TERRITORYType of co-ordination
Name and address of AgencyResponsible authority (Ministry)
(1)
Main Level ~ydrological stationsactivitiesof Agency
(2) (3) (4)A B C 0 E F G H J K
Yearbooksor
surrmaries(5 )
ABC
Datacatalogues
(6)
ABC
BelarusCo-ordination: Not specified·1 Hydrometeorological Service
Komsomolskaya Ulica 16, 220600 Minsk 16
BeLgiumCo~ordinat;on: Ad hoc1 service dlEtudes Hydrologiques
Rue de La La; 155, BruxeLLes 1040Ministere des Travaux Publics
2 Service des etudes des eaux souterraineset des eaux de surface
Manhattan Center - Tour H2, Rue desCroisades 3, Bruxelles 1210
Ministere de La Region Wallonne
3 Administratie voar Ruimtelijke Ordeningen Leefmilieu
Belliardstraat, 12-14-18, Brussel 1040Ministerie van de Vlaamse Gemeenschap
4 lnstitut Royal Meteorologique (SectionHydrologie)
Avenue Circulaire 3, Bruxelles 1180
5 Regie des Voies Aeriennes (ServiceMeteoro logi que)
Aerodrome National, Batiments Meteo~
Zaventem 1930
6 Force Aerienne, Wing MeteorologiqueQuartier Evere, Avenue Jules Bordet 1,Bruxelles 1130
7 Institut dlHygiene et dlEpidemiologieRue Juliette Wytsman 14, Bru~elles 1050
G
G
G AW P
G AW P
G
G.
G
P
T N
N
R
R
N
N
N
N
2 1
2 1
2
3
2
3
2
2
2
2 1
2
2 1
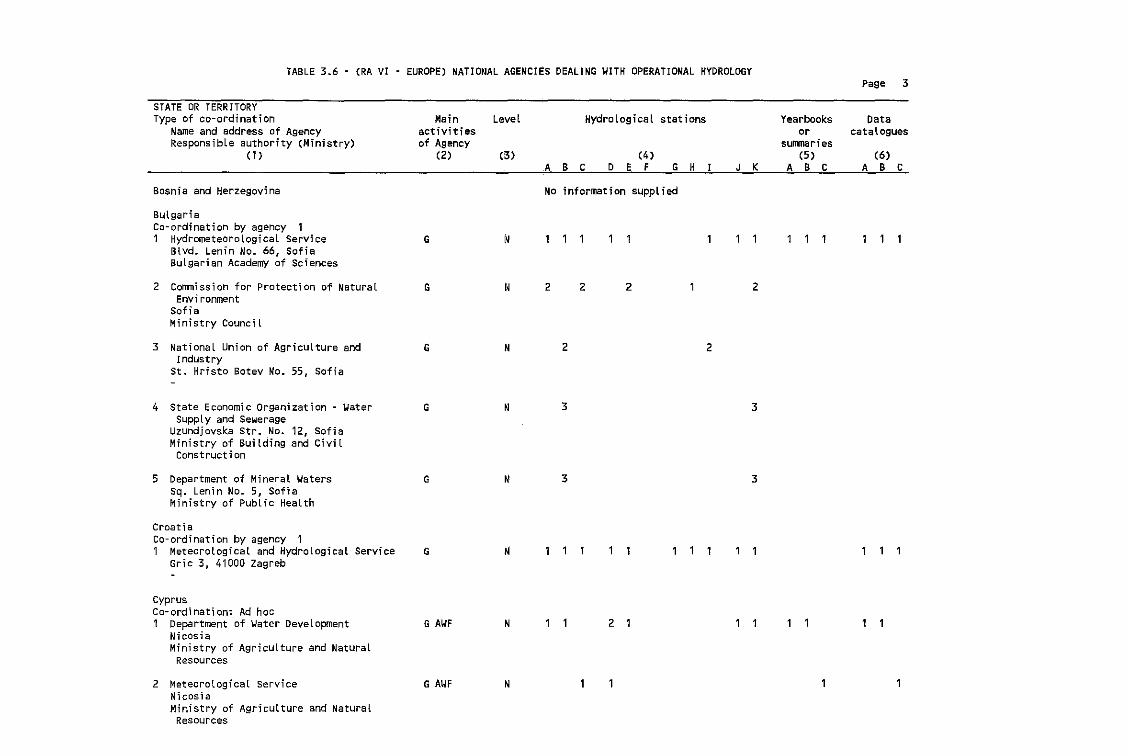
TABLE 3.6 - (RA VI - EUROPE) NATIONAL AGENCIES DEALING WITK OPERATIONAL KYOROLOGYPage 3
STATE OR TERRITORYType of co-ordination
Name and address of AgencyResponsible authority (Ministry)
(1 )
Bosnia and Herzegovina
Main Levelactivitiesof Agency
(2) (3)
Hydrological stations
(4)ABC D E F G K
No information supplied
Yearbooks Dataor catalogues
sunmaries(5 ) (6)
J K A B C A B C
BulgariaCo-ordination by agency 11 Hydrometeorological Service
Blvd. Lenin No. 66, SofiaBuLgarian Academy of Sciences
2 Commission for Protection of NaturalEnvironment
SofiaMinistry Council
3 National Union of Agriculture andIndustry
St" Hristo Botev No. 55, Sofia
4 State Economic Organization - WaterSupply and Sewerage
Uzundjoyska Str. No. 12, SofiaMinistry of Building and Civil
construction
5 Department of Mineral WatersSq. Lenin No.5, SaftaMinistry of Public HeaLth
CroatiaCo~ordination by agency 11 Meteorological and Hydrological Service
Gric 3, 41000 Zagreb
CyprusCo-ordination: Ad hoc1 Department of Water Development
NicosiaMinistry of Agriculture and Natural
Resources
2 Meteorological serviceNlcoslaMinistry of Agriculture and Natural
Resources
G
G
G
G
G
G
G AWF
G AWF
N
N
N
N
N
N
N
N
2
2
3
3
2 2
2 1
2
2
3
3
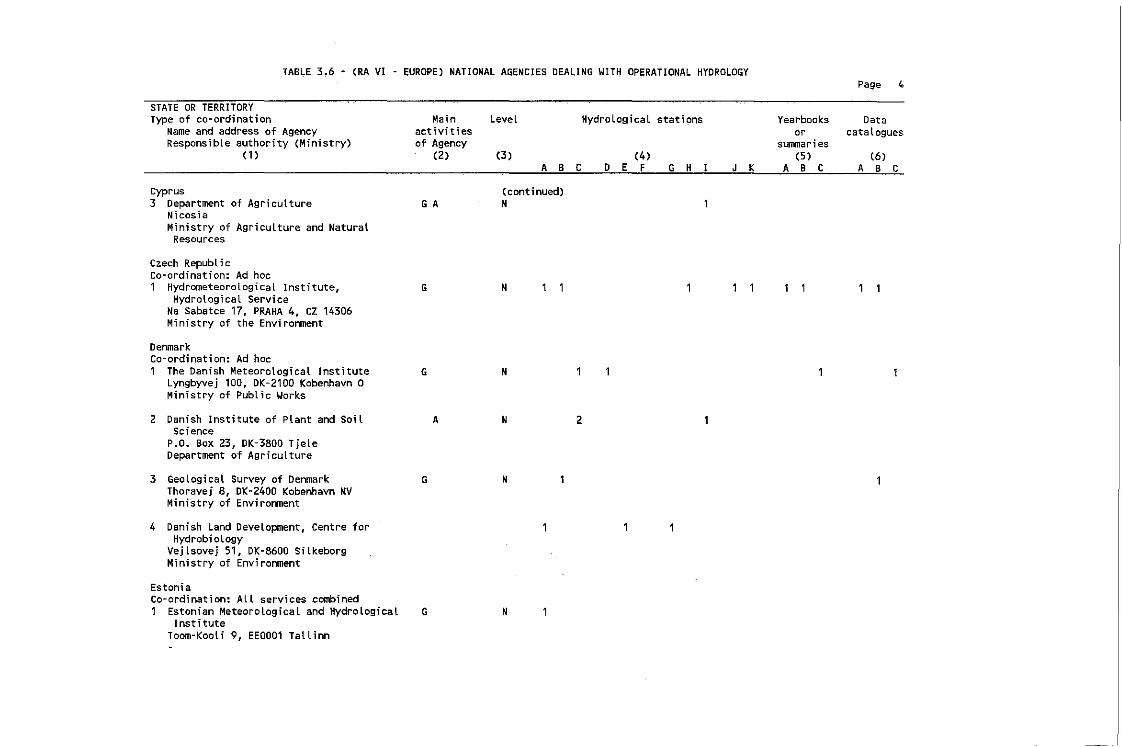
TABLE 3.6 • (RA VI . EUROPE) NATIONAL AGENCIE. DEALING WI TN OPERATIONAL NYDROLOGYPage 4,
STATE OR TERRITORYType of co-ordination
Name and address of AgencyResponsible authority (Ministry)
(1 )
Cyprus3 Department of Agriculture
NicosiaMinistry of Agriculture and NaturaL
Resources
Main LeveL Hydrological stationsactivitiesof Agency
(2) (3 ) (4)A B C D E F G N
(continued)G A N
Yearbooks Dataor cata l ogues-.
surrrnaries(5 ) (6)
J K A B C A B C
Czech Republicco-ordination: Ad hoc1 HydrometeorologicaL Institute,
Hydrological ServiceNa Sabatce 17, PRAHA 4, cz 14306Ministry of the Environment
DenmarkCo-ordination: Ad hoc1 The Danish Meteorological Institute
Lyngbyvej 100, DK-2100 Kobenhavn 0Ministry of Public Works
2 Danish Institute of Plant and SoilScience
P.O. Box 23, DK-3800 TjeleDepartment of AgricuLture
3 GeoLogical Survey of DenmarkThoravej 8, DK-2400 Kobenhavn NVMinistry of Environment
4 Danish Land Development, Centre forHydrobiology
VejLsovej 51, DK-8600 SilkeborgMinistry of Environment
EstoniaCo-ordination: All services combined1 Estonian Meteorological and Hydrological
InstituteToom-Kooli 9, EE0001 Tallinn
G
G
G
G
A
N
N
N
N
N
2
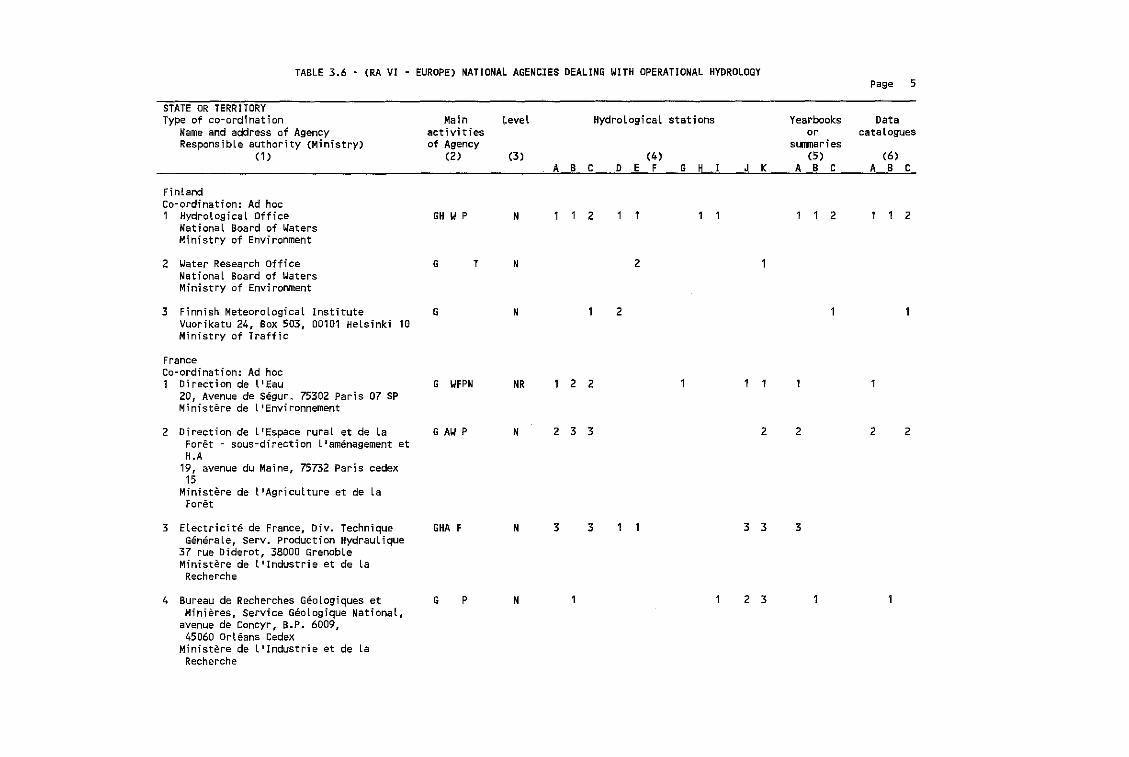
TABLE 3.6 - (RA VI - EUROPE) NATIONAL AGENCIES DEALING WITH OPERATIONAL HYDROLOGYPage 5
STATE OR TERRITDRYType of co-ordination
Name and address of AgencyResponsible authority (Ministry)
(1)
Main Level Hydrological stationsactivitiesof Agency
(2) (3) (4)
A B C D E F G H
Yearbooks Dataor catalogues
sLIffJlaries(5 ) (6)
J K A B C A B C
FinlandCo-ordination: Ad hoc1 Hydrological Office
National Board of WatersMinistry of Environment
2 Water Research officeNational Board of WatersMinistry of Environment
3 Finnish Meteorological InstituteVuorikatu 24, Box 503, 00101 Helsinki 10Ministry of Traffic
FranceCo-ordination: Ad hoc1 Direction de l'Eau
20, Avenue de Segur" 75302 Paris 07 SPMinistere de llEnvironnement
2 Direction de l'Espace rural et de LaForet - sous-direction L'amenagement etH.A
19, avenue du Maine, 75732 Paris cedex15
Ministere de llAgriculture et de LaForet
GH W P
G
G
G WFPN
G AW P
T
N
N
N
NR
N
2
1 2 2
2 3 3
2
2
2 2
2
2
2
2
3 Electricite de France, Div. TechniqueGeneraLe, Servo production HydrauLique
37 rue Diderot, 38000 GrenobLeMinistere de l'Industrie et de LaRecherche
4 Bureau de Recherches Geologiques etMinieres, Service GeoLogique National,
avenue de Concyr, B.P. 6009,45060 Orleans Cedex
Ministere de L'Industrie et de LaRecherche
GHA F
G P
N
N
3 3 3 3
2 3
3
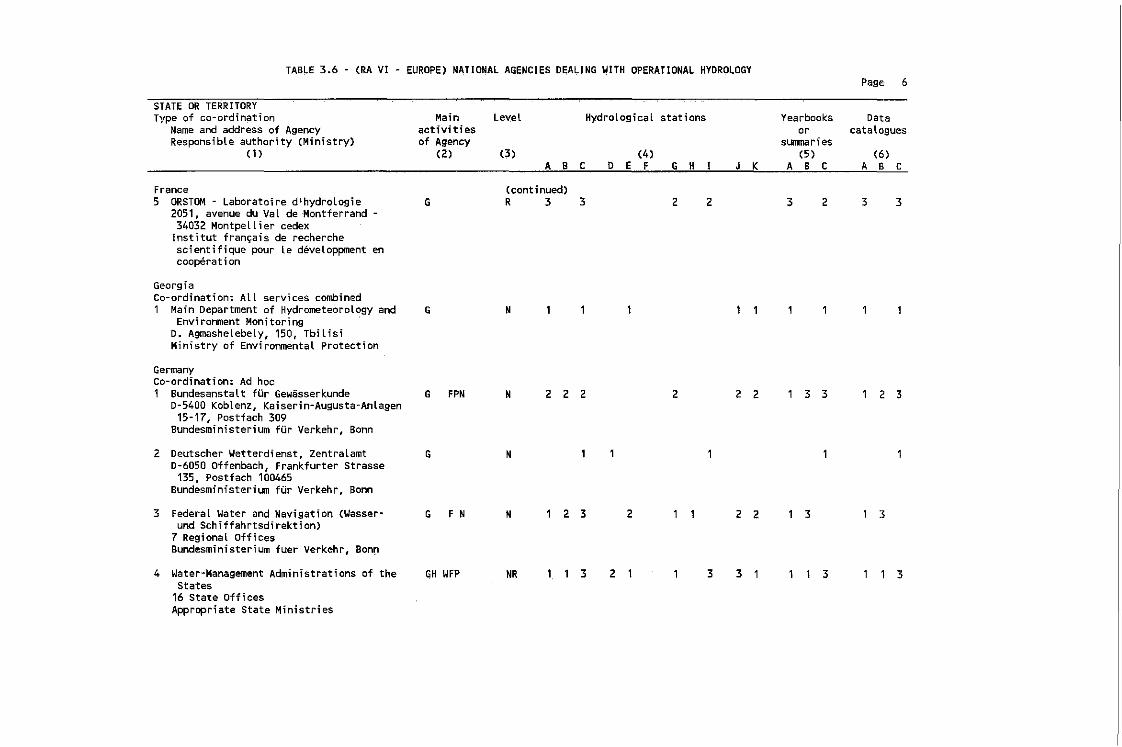
TAB,E 3.6 - (RA VI - EUROPE) NATIONAL AGENCIES DEALING WITH OPERATIONAL HYDROLOGYPage- 6
STATE OR TERRITORYType of co-ordination Main Level Hydrological stations Yearbooks Data
Name and address of Agency activities or catatolguesResponsible authority (Ministry) of Agency sunmari es
(1 ) (2) m (4) (S) (6)A B C D E F G H I J K A B C A B c
France (continued)S ORSTOM - Laboratoire d'hydrologie G R 3 3 2 2 3 2 3 3
2051, avenue du VaL de Montferrand34032 Montpellier cedex
Institut fran~a;s de recherchescientifique pour le developpment encooperat; on
GeorgiaCo-ordination: ALL services combined1 Ma;n Department of Hydrometeorology 'and G N
Environment MonitoringD. AgmasheLebely, 150, Tbilis;Ministry of Environmental Protection
GermanyCo-ordination: Ad hoc1 Bundesanstalt fur Gewasserkunde G FPN N 2 2 2 2 2 2 1 3 3 1 2 3
D-5400 Koblenz, Kaiserin-AuQusta-Anlagen1S-17, Postfach 309
Bundesministerium fur Verkehr, Bonn
2 Deutscher Wetterdienst, Zentralamt G N0-6050 Offenbach, Frankfurter Strasse
13S, Postfach 100465Bundesministerium fur Verkehr, Bonn
3 Federal Water and Navigation (Wasser- G F N N 1 2 3 2 1 1 2 2 1 3 1 3und Schiffahrtsdirektion)
7 Regional OfficesBundesministerium fuer Verkehr, Bon~
4 Water-Management Administrations of the GH WFP NR 1 1 3 2 1 1 3 3 1 1 1 3 1 1 ,.-,States
16 State OfficesAppropriate State Ministries
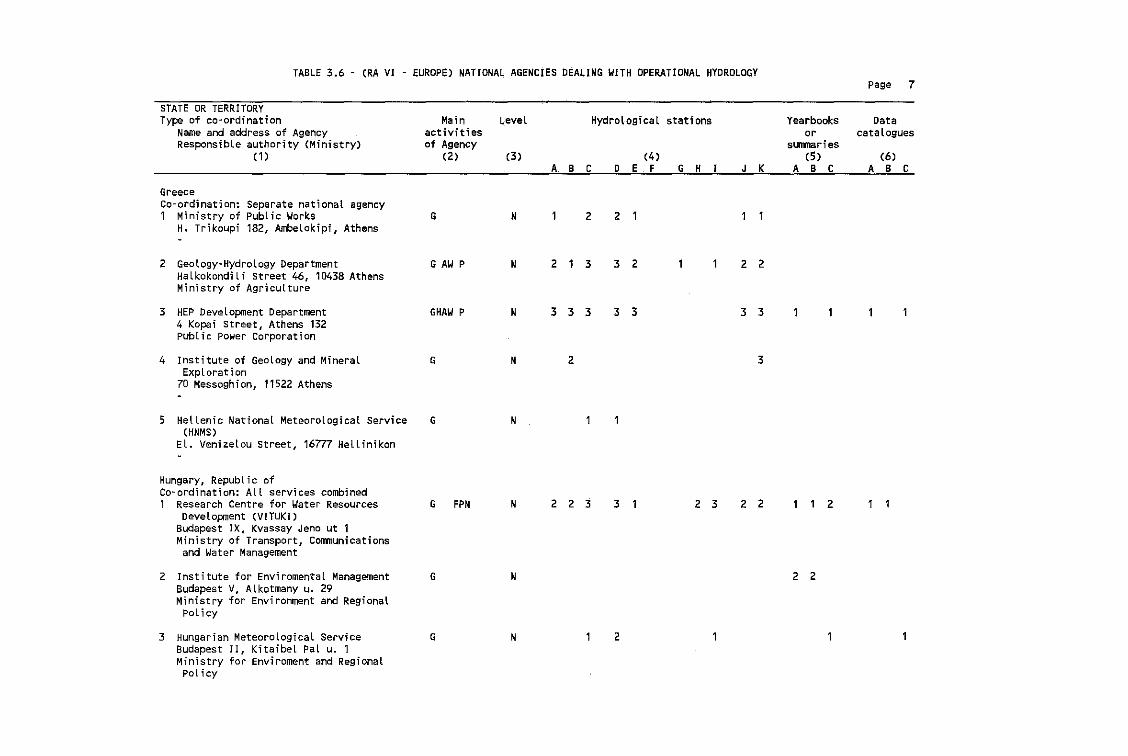
TABLE 3.6 - (RA VI - EUROPE) NATIONAL AGENCIES DEALING WITH OPERATIONAL HYDROLOGYPage 7
STATE OR TERRITORYType of co-ordination Main LeveL Hydrological stations Yearbooks Data
Name and address of Agency activities or cataloguesResponsibLe authority (Ministry) of Agency summaries
(1) (2) (3) (4) (5) (6)A B C D E F G H I J K A B C A B C
GreeceCo-ordination: Separate nationaL agency1 Ministry of Public Works G N 1 2 2
H. Trikoupi 182, Ambelokipi, Athens
2 Geology~Hydrology Department G AW P N 2 1 3 3 2 1 1 2 2Halkokondili Street 46, 10438 AthensMinistry of Agriculture
3 HEP DeveLopment Department GHAW P N 3 3 3 3 3 3 34 Kopai Street, Athens 132Public Power Corporation
4 Institute of GeoLogy and Mineral G N 2 3Exploration
70 Messoghion, 11522 Athens
5 Hellenic National Meteorological service G N(HNMS)
El. Venizelou Street, 16777 Hellinikon
Hungary, Republic ofCo~ordination: All services comblned1 Research Centre for Water Resources G FPN N 2 2 3 3 1 2 3 2 2 1 1 2
Development (VITUKI)Budapest IX. Kvassay Jeno ut 1Ministry of Transport, Communicationsand Water Management
2 Institute for Enviromental Management G N 2 2Budapest V, Alkotmany u. 29Ministry for Environment and Regional
Policy
3 Hungarian Meteorological Service G N 1 2Budapest II, Kitaibel Pal u. 1Ministry for Enviroment and RegionalPolicy
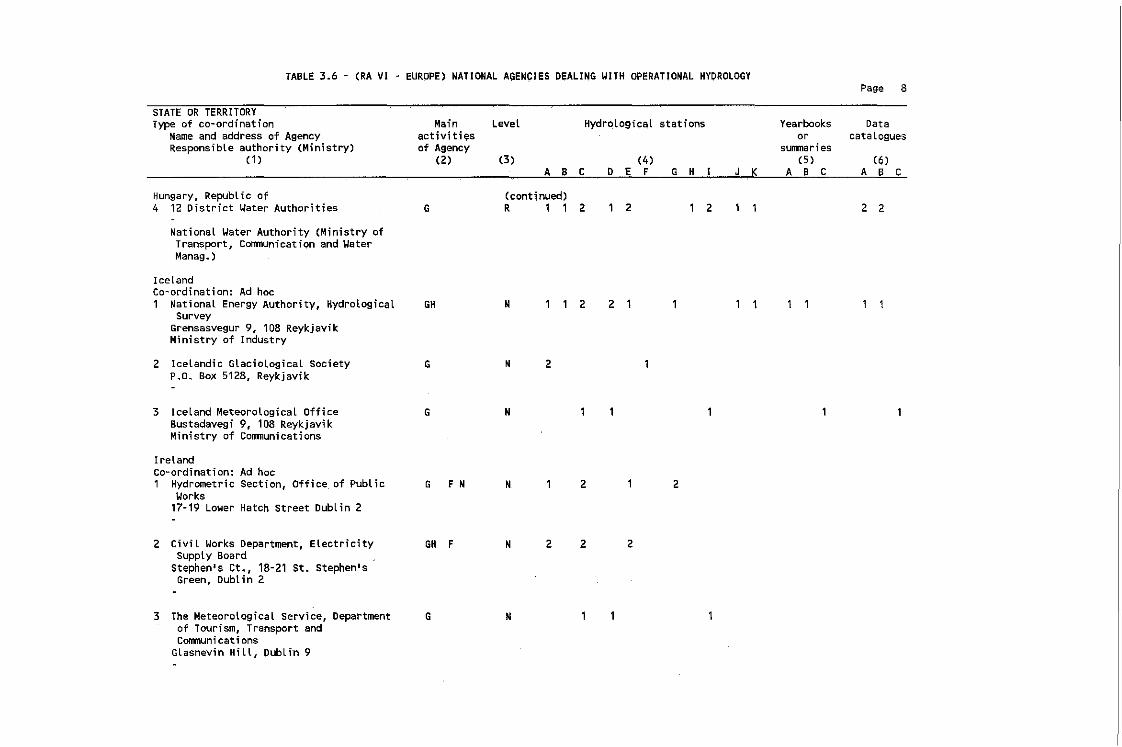
TABLE 3.6 - (RA VI - EUROPE) NATIONAL AGENCIES OEALING WITH OPERATIONAL HypROLOGYPage 8
STATE OR TERRITORYType of co-ordination
Name and address of AgencyResponsible authority (Ministry)
(1)
Hungary, Republic of4 12 District Water Authorities
National Water Authority (Ministry ofTransport, Communication and WaterManag.)
Mainactiviti~s
of Agency(2)
G
LeveL HydrologicqL stations
(3) (4)L.§. c D E F G H
(continued)R 1 1 2 1 2 2
Yearbooks Dataor catalogues
summa r i es(5 ) (6 )
J K A B C A B C
2 2
IcelandCo-ordination: Ad hoc1 National Energy Authority, HydroLogical
SurveyGrensasvegur 9, 108 ReykjavikMinistry of Industry
2 Icelandic GLaciological SocietyP.O. Box 5128, Reykjavik
3 Iceland Meteorological OfficeBustadavegi 9, 108 ReykjavikMinistry of communications
IrelandCo-ordination: Ad hoc1 Hydrometric Section, Office of Public
Works17-19 Lower Hatch Street Dublin 2
2 Civil Works Department, ElectricitySupply Board
Stephen's Ct., 18-21 St. Stephen'sGreen, Dublin 2
3 The Meteorological Service, Departmentof Tourism, Transport andComnunications
GLasnevin Hill, Dublin 9
GH
G
G
G F N
GH F
G
N
N
N
N
N
N
2
2
2
2
2
2
2
2
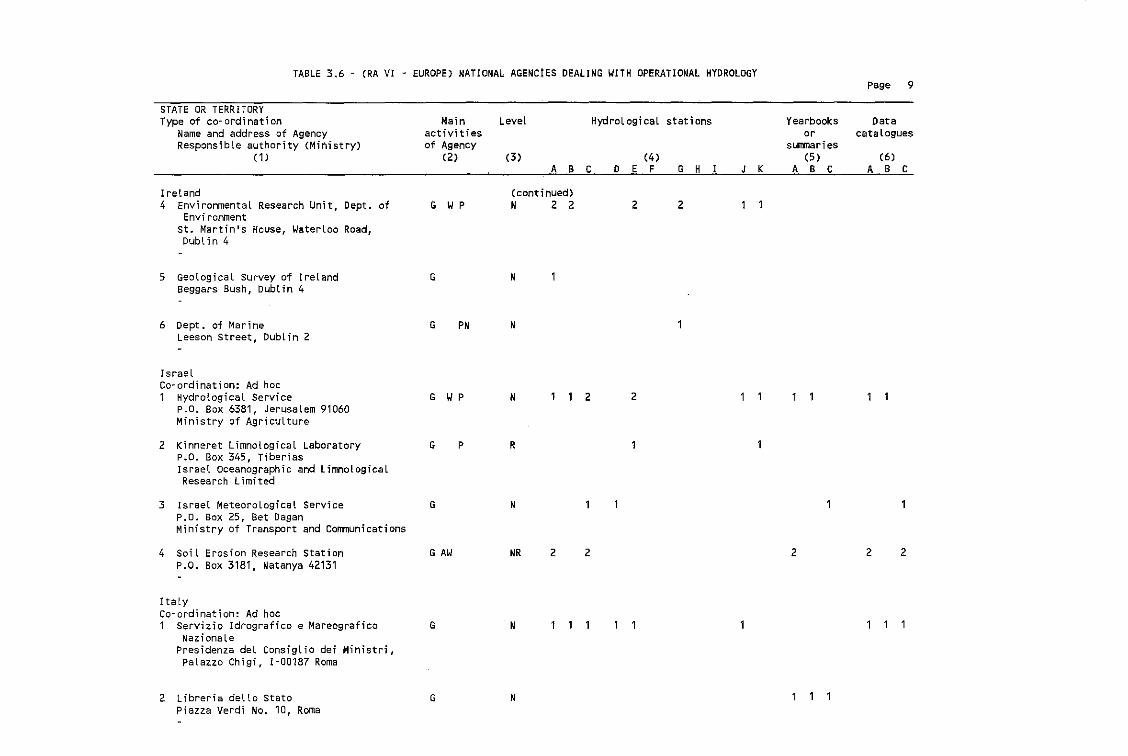
TABLE 3"6 - (RA VI - EUROPE) NATIONAL AGENCIES DEALING WITH OPERATIONAL HYDROLOGYPage 9
HydroLogicaL stations
(4)o E F G H
STATE DR TERRITORYType of co-ordination
Name and address of AgencyResponsible authority (Ministry)
(1)
Ireland4 EnvironmentaL Research Unit, Dept. of
Envi ronmentst. Martinis House, WaterLoo Road,
Dubl in 4
Main Levelactivitiesof Agency
(2) (3)A B C
(continued)I; WP N 2 2 2 2
Yearbooks Dataor catalogues
surrrnaries(5) (6)
J K A B C A B C
5 Geological Survey of IrelandBeggars Bush, Dublin 4
6 Dept. of MarineLeeson Street, Dublin 2
G
G PN
N
N
IsraeLCo~ordination: Ad hoc1 Hydrological Service
P.o. Box 6381, Jerusalem 91060Ministry of Agriculture
G WP N 2 2
2 Kinneret Limnological LaboratoryP.O. Box 345, TiberiasIsraeL Oceanographic and limnologicalResearch limited
3 Israel Meteorological ServiceP.o. Box 25, Bet DaganMinistry of Transport and Communications
4 SoiL Erosion Research StationP.O. Box 3181, Natanya 42131
ItatyCo-ordination: Ad hoc1 Servlzlo Idrografico e Mareografico
NazionaLePresidenza deL ConsigLio dei Ministri,Palazzo Chigi, I-00187 Roma
2 Libreria delto StatoPiazza Verdi No. 10, Roma
G
G
G AW
G
G
P R
N
NR
IN
N
2 2 2 2 2
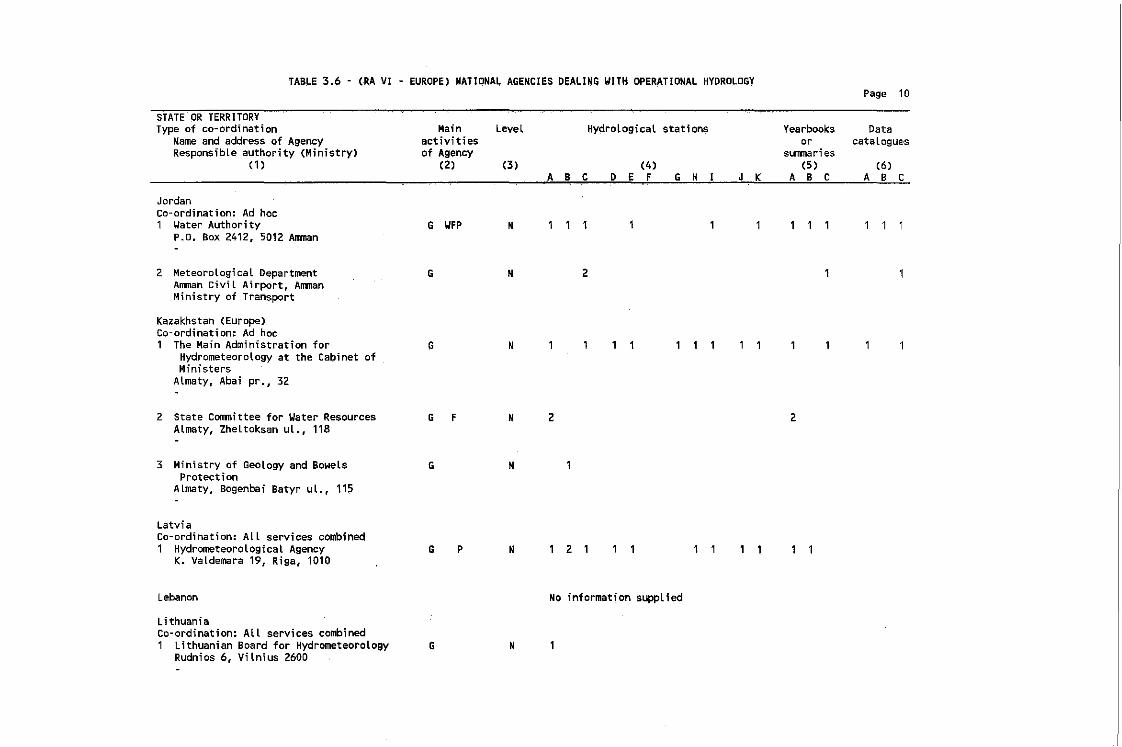
TAB~E 3.6 - (RA YI - EUROPE) NATIONA~ AGENCIES DEALING WITK OPERATIONA~ HYDRO~OGY
Page 10
STATE OR TERRITORYType of co-ordination
Name and address of AgencyResponsible authority (Ministry)
(1 )
Main Level Hyprolosical stationsactivitiesof Agency
(2) (3) (4)A B C D E F G H
Yearbooks Oaitaor catalogues
sunrnar;es(5) (6)
J K A B C A B C
JordanCo-ordination: Ad hoc1 Yater Authority
P.O. Box 2412, 5012 Amman
2 MeteorologicaL DepartmentAmman Civil Airport, AmmanMinistry of Transport
Kazakhstan (Europe)Co-ordination: Ad hoc1 The Main Administration for
Hydrometeorology at the Cabinet ofMinisters
Almaty, Aba; pr., 32
2 State Committee for Yater ResourcesAlmaty, Zheltoksan uL., 118
3 Ministry of Geology and BowelsProtection
Almaty. Bogenbai Batyr ul., 115
G WFP
G
G
G F
G
N
N
N
N
N
2
2 2
LatviaCo-ordination: ALL services combined1 Hydrorneteorologicat Agency
K. Valdemara 19, Riga, 1010
Lebanon
LithuaniaCo-ordination: ALL services combined1 Lithuanian Board for Hydrometeorology
Rudnios 6, Vilnius 2600
G
G
P N
N
2 1
No information supplied
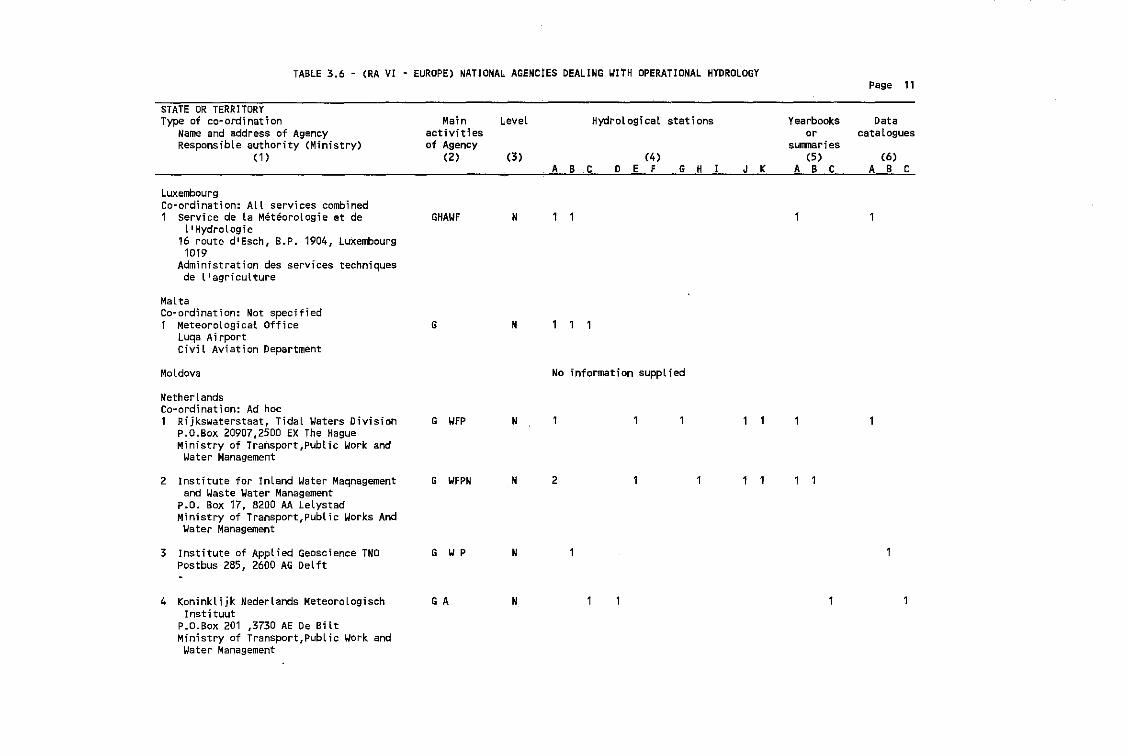
TABLE 3.6 - (RA VI - EUROPE) NATIONAL AGENCiES DEALING WITH OPERATIONAL HYDROLOGYPage 11
STATE OR TERRITORYType of co-ordination
Name and address of AgencyResponsible authority (Ministry)
(1)
Main Level HydroLogical stationsactivitiesof Agency
(2) (3) (4)
A B C D E F G H
Yearbook.s Dataor catalogues
sUlJII1ar;es(5 ) (6)
J K A B C A B C
LuxembourgCo·ordination: All services combined1 Service de La Meteorologie et de
l'Hydrologie16 route d'Esch, B.P. 1904, Luxembourg1019
Administration des services techniquesde l'agriculture
MaltaCo-ordination: Not specified1 Meteorological Office
Luqa AirportCivil Aviation Department
MoLdova
NetherlandsCo-ordination: Ad hoc1 Rijkswaterstaat, Tidal Waters Division
P.D.Box 20907,2500 EX The HagueMinistry of Transport,Public Work and
Water Management
2 Institute for Inland Water Maqnagementand Waste Water Management
P.O. Box 17, 8200 AA LelystadMinistry of Transport,public Works And
Water Management
3 Institute of Applied Geoscience TNOPostbus 285, 2600 AG Delft
4 Koninklijk Nederlands MeteorologischInstituut
P.D.Box 201 ,3730 AE De SiltMinistry of Transport,public Work and
Water Management
GHAWF
G
G WFP
G WFPN
G WP
G A
N
N
N
N
N
N
No information supplied
2
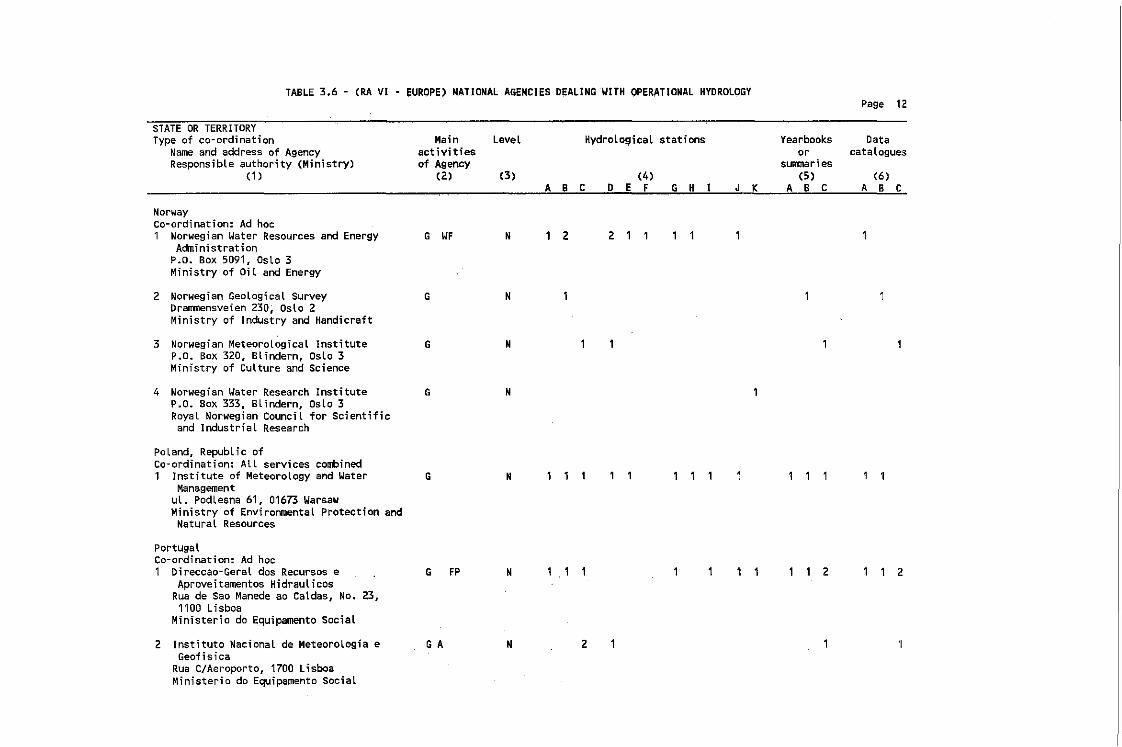
TABLE 3.6 - (RA VI • ~UROPE) ~ATIONAL AGENCIES D~ALINGWITH OPERATIONAL HYDROLOGYPage 1:2
STATE OR TERRITORYType of co-ordination
Name and address of AgencyResponsible authority (Ministry)
(1)
Main Level Hydrolo~ical stationsactivitiesof Agency
(2) (3) (4)A B C D E F G H
Yearbooks Dataor cataLolgues
sUIl1llaries(5 ) (6)
J K A B C A B, C
NorwayCo-ordination: Ad hoc1 Norwegian Water Resources and Energy
AdministrationP.O. Box 5091, Oslo 3Ministry of Oil and Energy
2 Norwegian Geological SurveyDrammensveien 230, Oslo 2Ministry of Industry and Handicraft
3 Norwegian MeteoroLogicaL InstituteP.O. Box 320, Blindern, Oslo 3Ministry of Culture and Science
4 Norwegian Water Research InstituteP.O. Box 333, Blindern, Oslo 3Royal Norwegian Council for Scientificand Industrial Research
PoLand, Republic ofCo-ordination: All services combined1 Institute of Meteorology and Water
Managementul. PodLesna 61, 01673 WarsawMinistry of EnvironmentaL Protection and
Natural Resources
portugalCo-ordination: Ad hoc1 Direccao-GeraL dos Recursos e
Aproveitamentos HidraulicosRua de Sao Manede ao Caldas, No. 23,1100 Lisboa
Ministerio do Equipamento Social
2 Instituto Nacional de MeteoroLogfa eGeofisica
Rua C/Aeroporto, 1700 LisboaMinisterio do Equipamento Social
G WF
G
G
G
G
G FP
G A
N
N
N
N
N
N
N
2
2
2
2 2
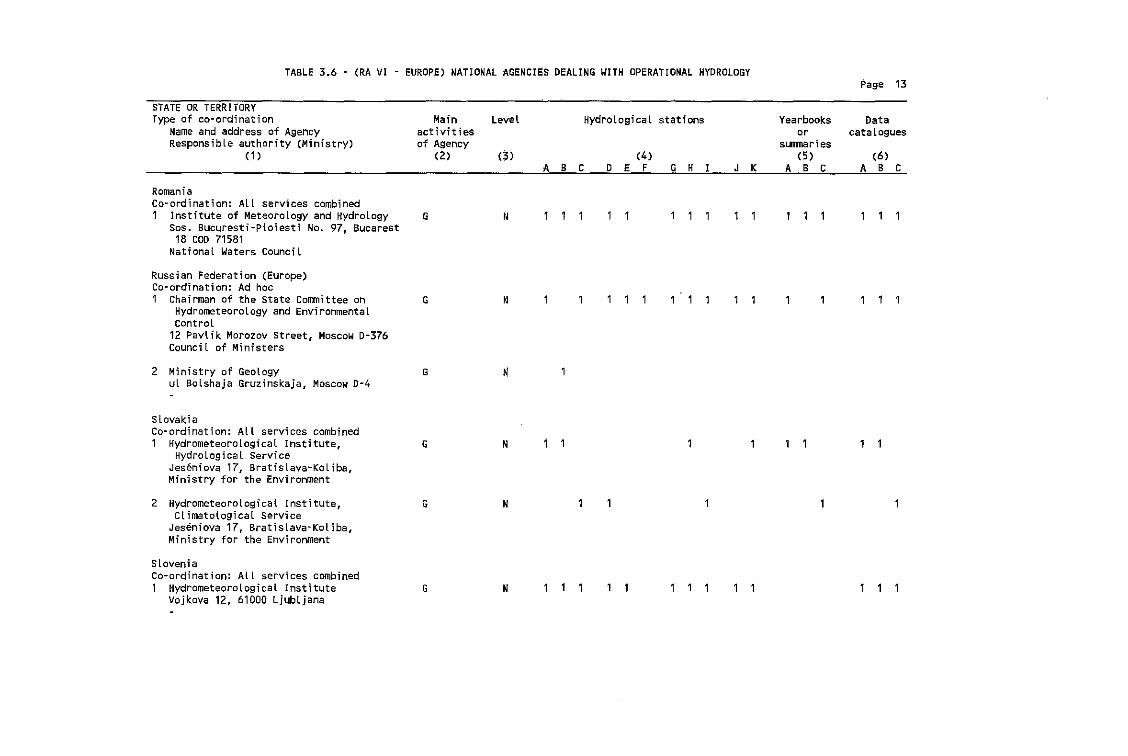
TABLE 3.6 - (RA VI - EUROPE) NATIONAL AGENCieS DEALING WITH OPERATIONAL HYDROLOGYPage 13
STATE OR TERRITORYType of co-ordination
Name and address of AgencyResponsible authority (Ministry)
(1)
Main LeveL Hydrological stationsactivitiesof Agency
(2) (3) (4)A 8 C 0 E F G H
Yearbooks Dataor cataLogues
slITIna.ries(5 ) (6)
J K A 8 C A B C
RomaniaCOMordination: All services combined1 Institute of Meteorology and Hydrology
Sos. Bucuresti-Ploiesti No. 97, Bucarest18 COD 71581
National Waters CounciL
Russian Federation (Europe)Co-ordination: Ad hoc1 Chairman of the State Committee on
Hydrometeorology and EnvironmentalControl
12 Pavlik Morozov Street, Moscow 0-376Council of Ministers
2 Ministry of GeologyuL Bolshaja Gruzinskaja, Moscow 0-4
SlovakiaCo-ordination: All services combined1 Hydrometeorological Institute,
Hydrological ServiceJeseniova 17, Bratislava-Koliba,Ministry for the Environment
2 Hydrometeorological Institute,climatological service
Jeseniova 17, Bratislava-Koliba,Ministry for the Environment
SloveniaCo-ordination: All services combined1 Hydrometeorological Institute
Vojkova 12, 61000 Ljubljana
G
G
G
G
G
G
N
~
N
N
N
N
'1
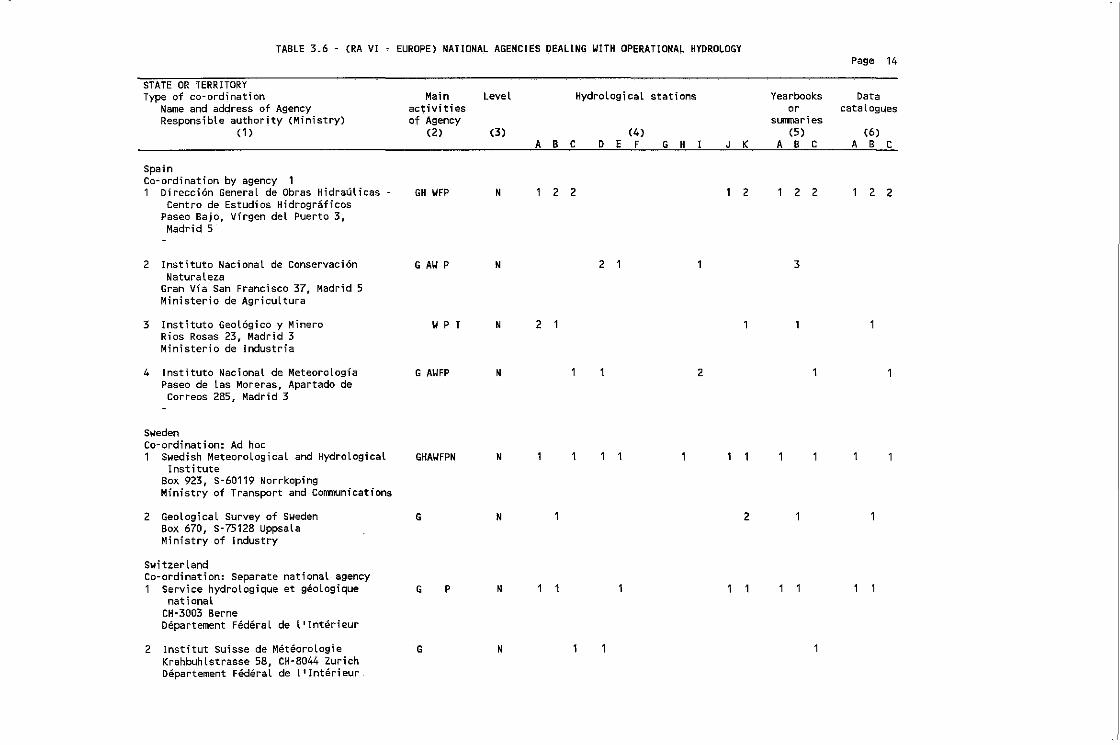
TABLE 3.6 - (RA VI - EUROPE) NATIONAL AGENCIES DEALING WITH OPERATIONAL HYDROLOGY
STATE OR TERRITORYType of co· ordination
Name and address of AgencyResponsible authority (Ministry)
(1 )
SpainCo-ordination by agency 11 Direcci6n GeneraL de Obras HidrauLicas
Centro de Estudios HidrograficosPaseo Baja, Virgen del Puerto 3,Madrid 5
Page 14
Main Level Hydrological stations Yearbooks Dataactivities or cataloguesof Agency surrrnaries
(2) (3) (4) (5 ) (6)A B C D E F G H I J K A B C A B C
GH WFP N 1 2 2 1 2 1 2 2 1 2 2
2 Institute Nacionat de Conservaci6nNaturaleza
Gran Via San Francisco 37, Madrid 5Ministerio de Agricultura
3 Institute GeoLogico y MineroRios Rosas 23, Madrid 3Ministerio de Industria
4 Institute Nacionat de MeteoroLogiaPaseo de Las Moreras, Apartado deCorreos 285, Madrid 3
SwedenCo-ordination: Ad hoc1 Swedish MeteoroLogical and Hydrological
InstituteBox 923, 5-60119 NorrkopingMinistry of Transport and Communications
2 GeologicaL Survey of SwedenBox 670, 5-75128 UppsalaMinistry of Industry
G AW P
WP T
G AWFP
GHAWFPN
G
N
N
N
N
N
2
2 1
2
2
3
SwitzerLandCo-ordination: Separate national agency1 Service hydrologique et geologique
nationalCH-3003 BerneDepartement FederaL de l'Interieur
2 Institut Suisse de MeteoroLogieKrahbuhLstrasse 58, CH-8044 ZurichDepartement Federal de LIInterieur
G
G
P N
N
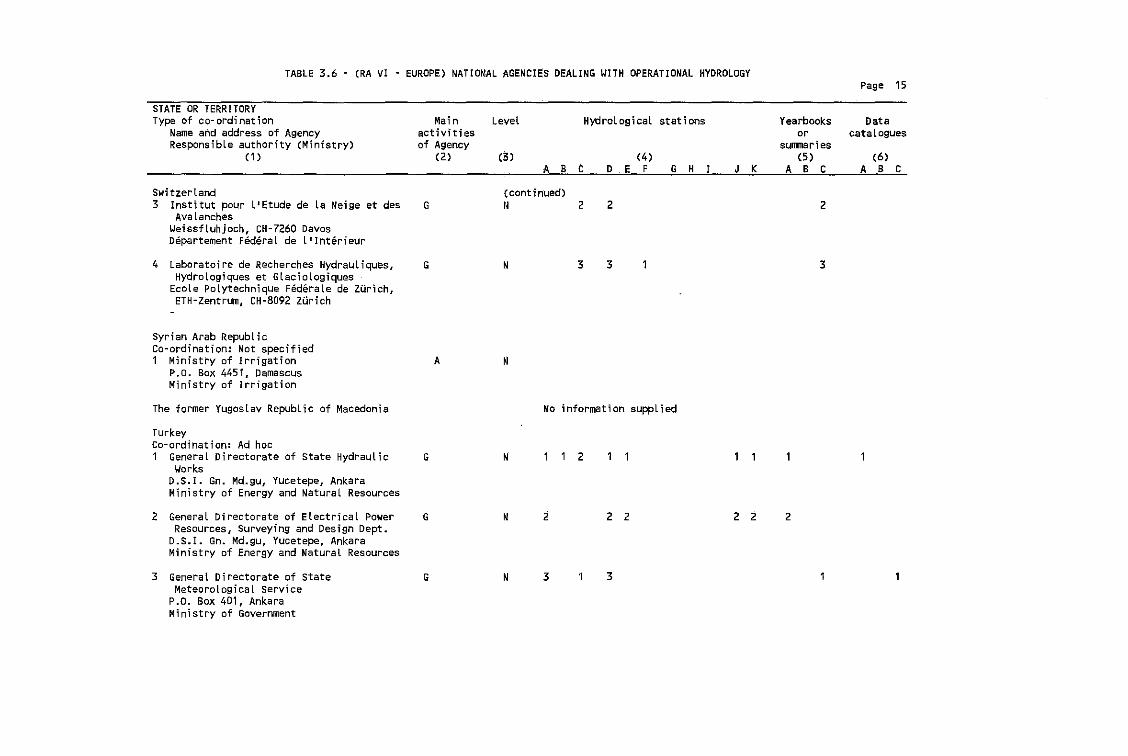
TABLE 3.6 - (RA VI - EUROPE) NATIONAL AGENCieS DEALING WITH OPERATIONAL HYDROLOGYPage 15
STATE OR TERRITORYType of co· ordination
Name and address of AgencyResponsible authority (Ministry)
(1 )
Switzerland3 lnstltut pour L'Etude de La Neige et des
AvalanchesWeissfluhjoch, CH-7260 DavosDepartement Federal de llInterieur
Mainactivitiesof Agency
(2)
G
Level Hydrological stations
(3) (4)
A B C D E F G H
(continued)N 2 2
J K
Yearbooksor
sUJTlTlaries(5)
ABC
2
Datacatalogues
(6)ABC
4 Laboratoire de Recherches Hydrauliques,Hydrologiques et GlacioLogiques
Ecole Polytechnique FederaLe de Zurich,ETH-Zentrum, CH-B092 Zurich
syrian Arab RepublicCo-ordination: Not specified1 Ministry of Irrigation
p"o. Box 4451, DamascusMinistry of Irrigation
G
A
N
N
3 3 3
The former Yugoslav Republic of Macedonia
TurkeyCo· ordination: Ad hoc1 General Directorate of state Hydraulic
WorksD.S.I. Gn. Md.gu, Yucetepe, AnkaraMinistry of Energy and Natural Resources
G N
No information supplied
2
2 General Directorate of Electrical PowerResources, Surveying and Design Dept.
D.S.I. Gn. Md.gu, Yucetepe, AnkaraMinistry of Energy and Natural Resources
3 General Directorate of stateMeteorological Service
P.o. Box 401, AnkaraMinistry of Government
G
G
N
N
2
3
2 2
3
2 :1 2
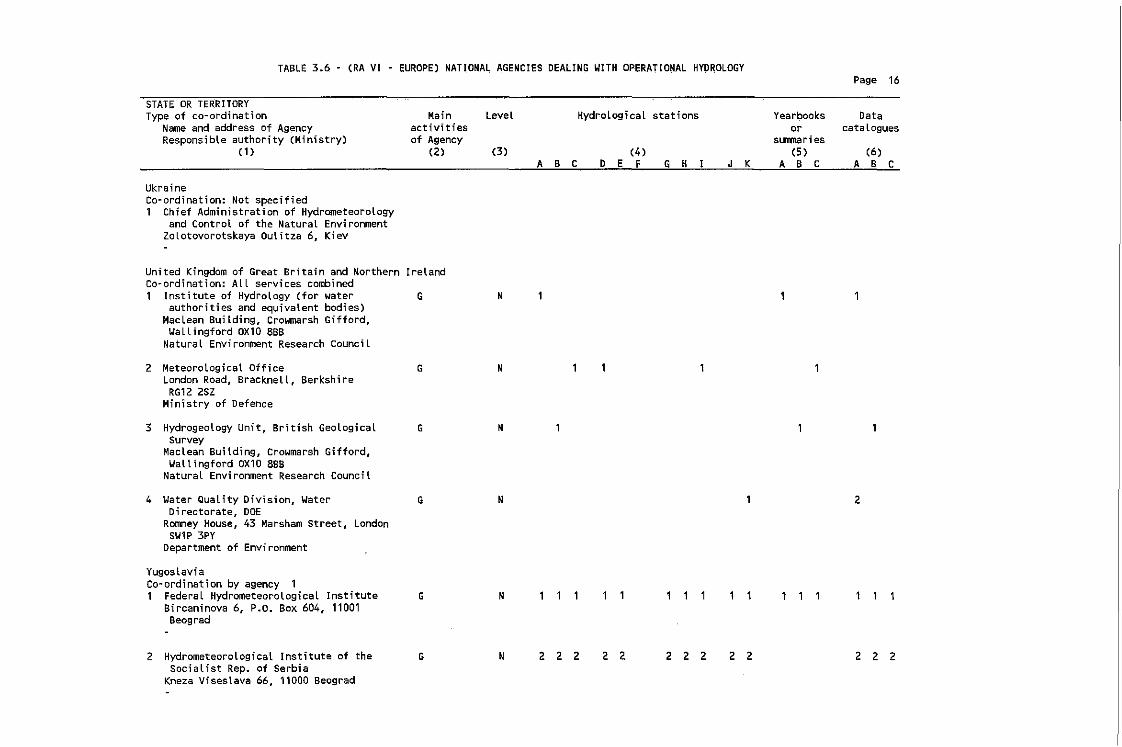
TABLE 3.6 - (RA VI - EUROPE) NATIONAL AGENCIES DEALING WITH OPERATIONAL HYDROLOGYPage 16
STATE OR TERRITORYType of co-ordination Main Level HydroLogical stations Yearbooks Data
Name and address of Agency activities or cataloguesResponsible authority (Ministry) of Agency summaries
(1) (2) (3) (4) (5) (6)A B C D E F G H I J K A B C A B C
UkraineCo-ordination: Not specified1 Chief Administration of Hydrometeorology
and Control of the Natural EnvironmentZoLotovorotskaya Outitza 6, Kiev
United Kingdom of Great Britain and Northern IrelandCo-ordination: ALL services combined1 Institute of Hydrology (for water G N
authorities and equivalent bodies)MacLean Building, Crowmarsh Gifford,WalLingford OX10 BBS
Natural Environment Research council
2 Meteorological Office G NLondon Road, Bracknell, Berkshire
RG12 2SZMinistry of Defence
3 Hydrogeology Unit, British Geological G NSurvey
Maclean Building, Crowmarsh Gifford,Wallingford OX10 8SB
Natural Environment Research Council
4 Water Quality Division, Water G N 1 2Directorate, DOE
Romney House, 43 Marsham Street, LondonSW1P 3PY
Department of Environment
YugoslaviaCOR ordination by agency 11 Federal Hydrometeorological Institute G N
Bircaninova 6, P.O. Box 604, 11001Beograd
2 Hydrometeorological Institute of the G N 2 2 2 2 2 2 2 2 2 2 2 2 2Socialist Rep. of Serbia
Kneza Viseslava 66, 11000 Beograd
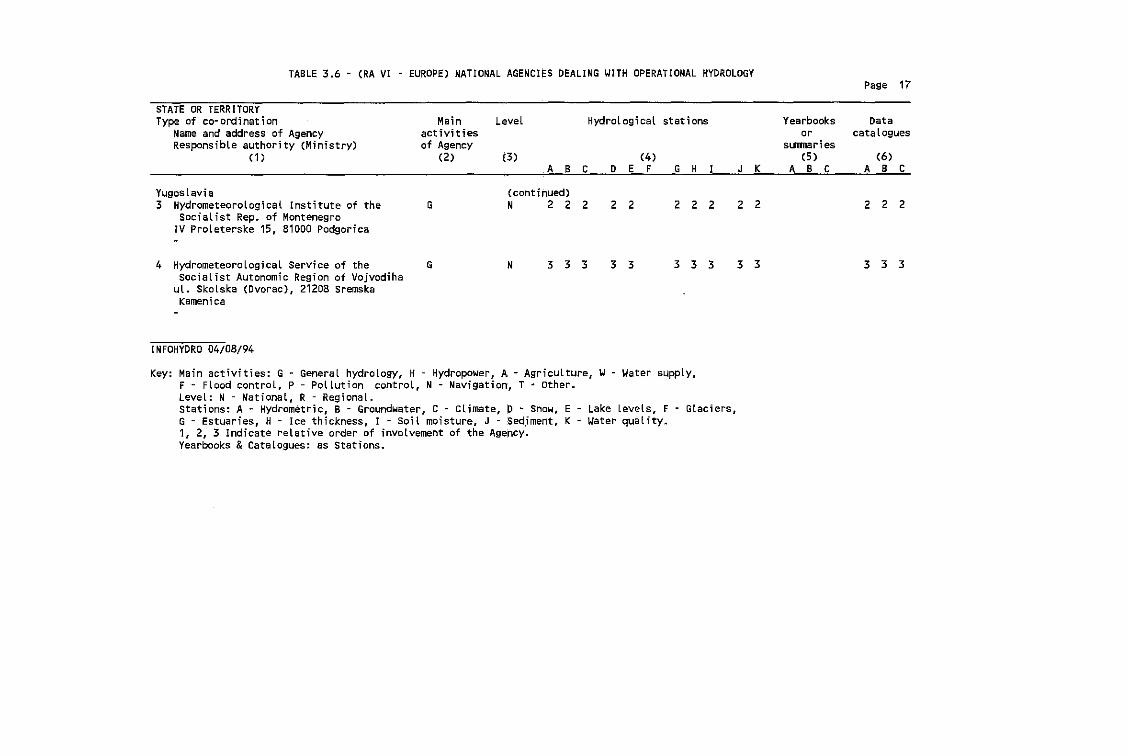
TABLE 3.6 - (RA VI - EUROPE) NATIONAL AGENCI~S DEALING WITH OPERATIONAL HYDROLOGYPage 17
STATE OR TERRITORYType of co-ordination
Name and address of AgencyResponsible authority (Ministry)
(1 )
Hydrological stations
(4)D E F G H J K
Yearbooksor
sunmaries(5 )
ABC
Datacatalogues
(6)ABC
Yugoslavia3 Hydrometeorological Institute of the
Socialist Rep. of MontenegroIV Proleterske 15, 81000 Podgorica
4 Hydrometeorolog;cal Service of theSocialist Autonomic Region of Vojvodiha
ul. Skolska (Ovorae), 21208 SremskaKamenica
INFOHYDRO 04/08/94
G N 333
2 2
3 3
222
3 3 3
2 2
3 3
222
333
Key: Main activities: G - General hydrology, H - Hydropower, A - Agriculture, W- Water supply,F - Flood control, P - Pollution control, N - Navigation, T • other.Level: N - National, R w RegionaL.Stations: A - Hydrometric, B - Groundwater, C - Climate, D Snaw, E Lake levels, F - Glaciers,G - Estuaries, H - Ice thickness, I - Soil moisture, J ~ sedjment, K Water quality.1, 2, 3 Indicate relative order of involvement of the Agency.Yearbooks &Catalogues: as Stations.

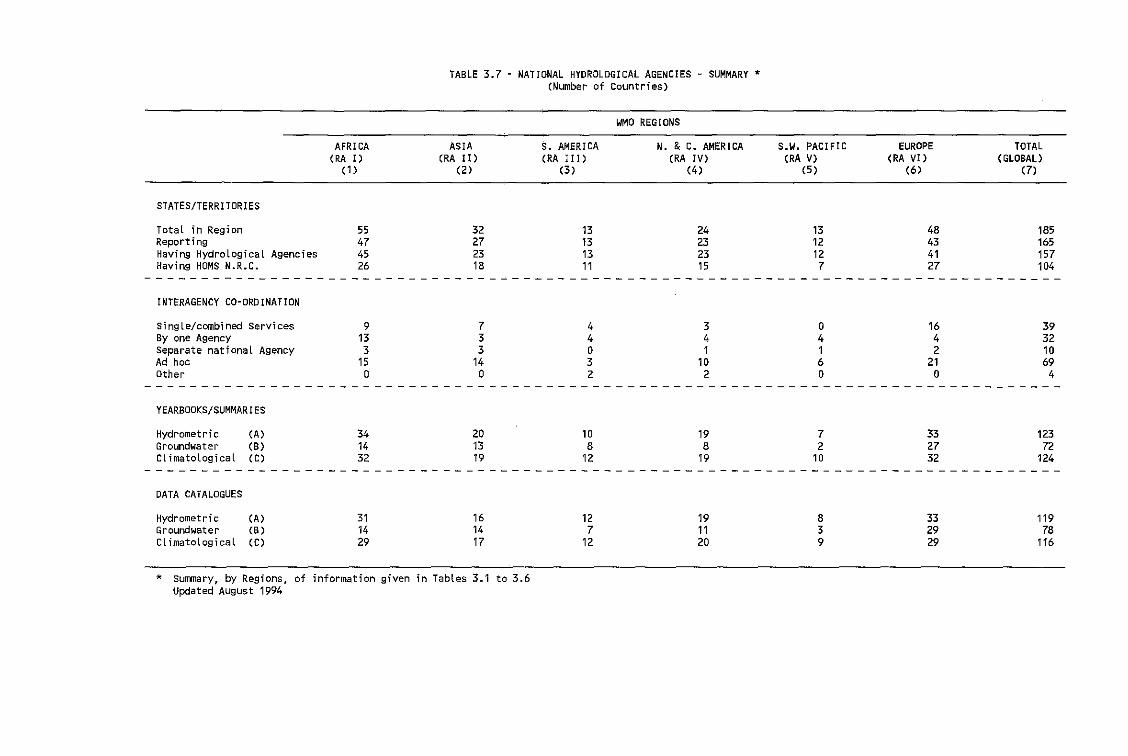
TABLE 3.7 - NATIONAL HYDROLOGICAL AGENCIES - SUMMARY'(Number of Countries)
WMO REGIONS
STATES/TERRITORIES
Total in RegionReportingHaving Hydrological AgenciesHaving HOMS N.R.C.
AFRICA(RA I)
(1 )
55474526
ASIA(RA II)
(2)
32272318
s. AMERICA(RA III)
(3 )
13131311
N. &C. AMERICA(RA IV)
(4)
24232315
S.W. PACIFIC(RA V)
(5 )
1312127
EUROPE(RA VI)
(6)
48434127
TOTAL(GLOBAL)
(7)
185165157104
INTERAGENCY CO-ORDINATION
Single/combined Services 9 7 4 3 0 16 39By one Agency 13 3 4 4 4 4 32Separate national Agency 3 3 0 1 1 2 10Ad hoc 15 14 3 10 6 21 69Other D 0 2 2 0 0 4
YEAR800KS/SUMMARIES
Hydrometric (A)Groundwater (B)ClimatologicaL (C)
DATA CATALOGUES
Hydrometric (A)Groundwater (B)ClimatologicaL (C)
341432
311429
201319
161417
ID8
12
127
12
198
19
191120
72
10
839
332732
332929
12372
124
11978
116
* Summary, by Regions, of information given in Tables 3.1 to 3.6Updated August 1994

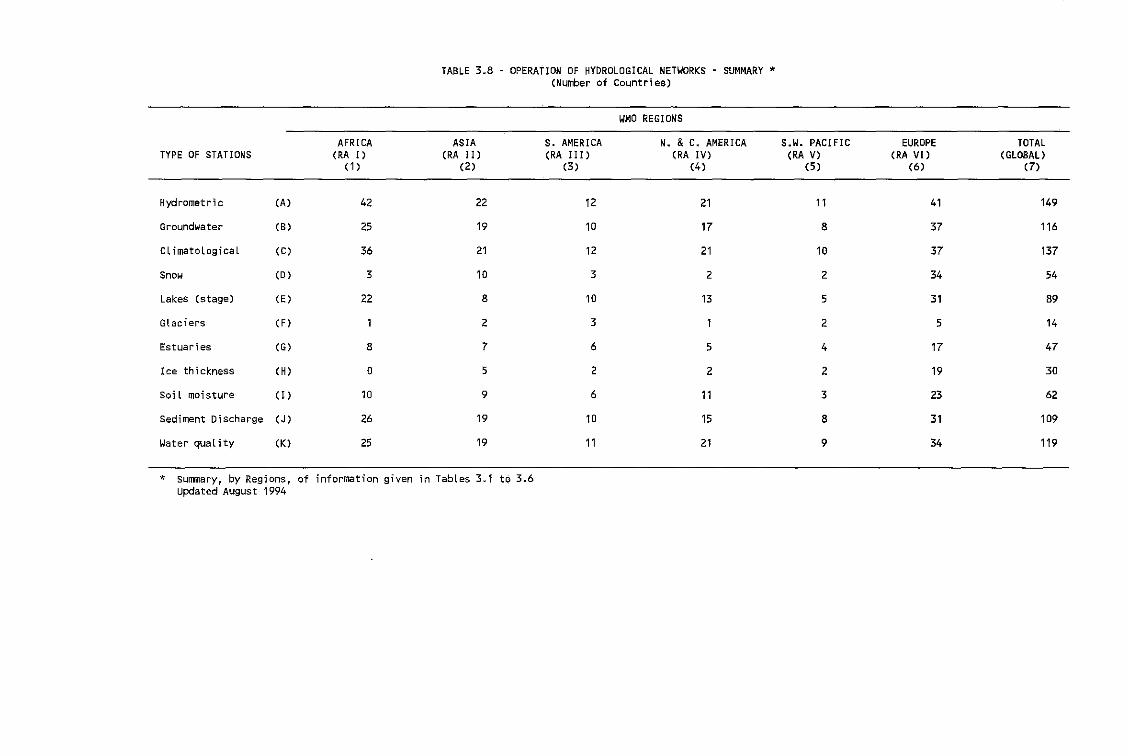
TABLE 3.8 - OPERATION OF HYDROLOGICAL NETWORKS - SUMMARY'(Number of Countries)
WMO REGIONS
AFRICA ASIA S. AMERICA N. &C. AMERICA S.W. PACIFIC EUROPE TOTALTYPE OF STATIONS (RA I) (RA II) (RA III) (RA IV) (RA V) (RA VI) (GLOBAL>
(1 ) (2) (3 ) (4) (5 ) (6) (7)
Hydrometric (A) 42 22 12 21 11 41 149
Groundwater (B) 25 19 10 17 8 37 116
CL imatoLogical (C) 36 21 12 21 10 37 137
Snow (0 ) 3 10 3 2 2 34 54
Lakes (stage) (E) 22 8 10 13 5 31 89
Gladers (F) 1 2 3 1 2 5 14
Estuaries (G) 8 7 6 5 4 17 47
Ice thickness (H) 0 5 2 2 2 19 30
soil moisture (I) 10 9 6 11 3 23 62
Sediment Discharge (J) 26 19 10 15 8 31 109
Water quality (K) 25 19 11 21 9 34 119
• summary, by Regions, of information given in Tables 3.1 t63.6Updated August 1994

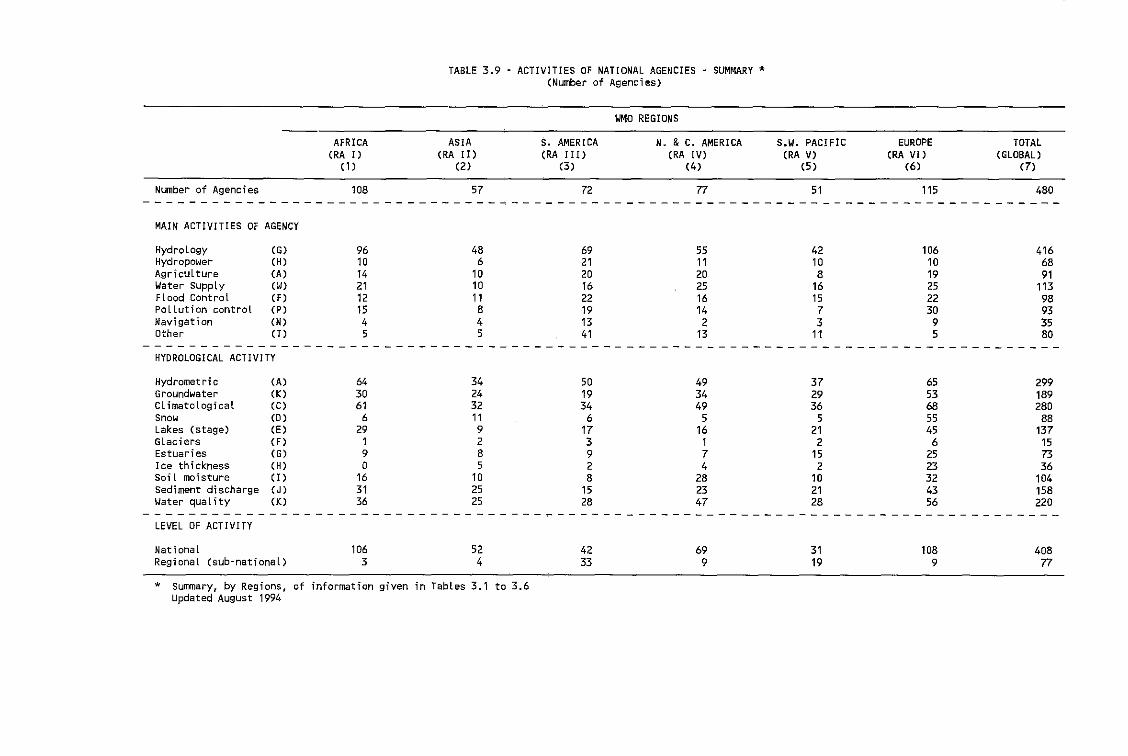
Number of Agencies
TABLE 3.9 - ACTIVITIES OF NATIONAL AGENCIES - SUMMARY *(Number of Agencies)
WMO REGIONS
AFRICA ASIA S. AMERICA N. &C. AMERICA S.W. PACIFIC EUROPE TOTAL(RA I) (RA I I) (RA II I) (RA IV) (RA V) (RA VI) (GLOBAL)
(1 ) (2) (3) (4) (5) (6) (7)
108 57 72 77 51 115 480
MAIN ACTIVITIES OF AGENCY
Hydrology (G) 96 48 69 55 42 106 416Hydropower (H) 10 6 21 11 10 10 68Agriculture (A) 14 10 20 20 8 19 91Water SuppLy (W) 21 10 16 25 16 25 113Flood Control (F) 12 11 22 16 15 22 98Pollution control (P) 15 8 19 14 7 30 93Navigation (N) 4 4 13 2 3 9 35Other (T) 5 5 41 13 11 5 80
--------------------------------------------------------------------------------HYDROLOGICAL ACTIVITY
Hydrometric (A) 64 34 50 49 37 65 299Groundwater (K) 30 24 19 34 29 53 189Cl imatological (C) 61 32 34 49 36 68 280Snow (0 ) 6 11 6 5 5 55 88Lakes (stage) (E) 29 9 17 16 21 45 137Glaciers (F) 1 2 3 1 2 6 15Estuaries (G) 9 8 9 7 15 25 73Ice thickness (H) 0 5 2 4 2 23 36Soil moisture (I) 16 10 8 28 10 32 104Sediment discharge (J) 31 25 15 23 21 43 158Water quality (K) 36 25 28 47 28 56 220
LEVEL OF ACTIVITY
NationalRegional (sub-national)
1063
524
4233
699
3119
1089
40877
* summary, by Regions, of information given in Tables 3.1 to 3.6Updated August 1994

IV • HYDROLOGICAL OBSERVING STATIONS
TABLES 4.1.01 to 4.7
Explanatory Notes
The tables in this chapter show the number of hydrological observing stations operating ineach country by WMO Region as follows:
Table(s) No(s)
4.r.0I to .074.r.084.r.094.r.l04.r.ll4.r.12
Type of station
PrecipitationEvaporationDischargeStage (water level)Sediment and water qualityGroundwater (wells)
The letter "r" above denotes the WMO Region (I to VI as 1 to 6) in the table numbers.
Where possible, the observing stations have been classified by length of record:
• Less than five years;• Five to 10 years;• 10 to 30 years;• Over 30 years.
Thc total number of observing stations is also shown. This total may exceed the sum of theprevious four columns when some stations havc not been classified by length of record. It shouldbe noted that data prior to 1980 have been taken from Operational Hydrology Report No.10 (WMO-No. 4(4) and in that publication all record lengths over 10 years are included in a singlecategory, with no division at 30 years. These data have been arbitrarily included under 10 to 30years in these tables, with the over-30 years column left blank.
In all tables the first three columns are the same:
Column (1) - Country nameColumn (2) - Total area of the countryColumn (3) - Year in which the data were collected.
Details of the individual tables are as follows:
Tables 4.r.01 to 4.r.06 • Precipitation stations for different elevation bands
The elevation bands used are:
4.r.Ol4.r.02
oto 500 m above sea-level501 to 1000m
IV.2
4.r.034.r.044.r.054.r.06
HYDROLOGICAL OBSERVING STATIONS
1001 to 1500m150lt02000m2001 t02500mover 2500 m.
The columns are:
Column (4):% area - the percentage of the area of the country which lies inthis elevation band
Column (5): Number of non-recording precipitation gauges in the countryin this elevation band, classified by length of record asdescribed above
Column (6): Number of recording precipitation gauges [ as for Column (5)]Column (7): The number of telemetering gaugesColumn (8): The number of radars used for rainfall measurement.
Only countries reporting gauges in the relevant elevation range are included in each table. This canresult in a blank table which has not been printed.
The "Totals" row shows totals of the figures in each column. Note in particular that thetotal in Column (2) is the sum of the areas of the countries listed, and not the area of the regionin the elevation band.
Tables 4.r.07: Precipitation observing stations - Totals
This table gives all precipitation gauges, irrespective of elevation. It is set out as Tables4.r.Ol to 4.r.06, except that the "% area" column has been omitted. The numbers in this tablemay exceed the sums of the previous six tables. This arises when not all gauges have beenclassified by elevation.
For each of the six WMO Regions, a map of the non-recording precipitation gauges density(number of gauge per 1000 km2) is included.
Tables 4.r;08: Evaporation stations
Column (4) shows numbers of evaporation pans, of all types: us Class A,GCI-3000 (USSR), etc. The number of pans of various types is available but notpublished here.
Column (5) - Indirect methods - includes energy budget; aerodynamic, combinedand other methods of measuring evaporation.
Tables 4.r.09: Hydrological observing stations - Discharge
These are, generally, water level stations with a mting enabling the calculation of discharge.They are grouped under "recording", Column (4), and "non-recording", Column (5),stations. Column (6) gives the total of these two groups and Column (7) thenumber of telemetring stations.
For each of the six WMO Regions, a map of the discharge measuring station density(number of stations per 1000 km2) is included.
Tables 4.r.lO:
HYDROLOGICAL OBSERVING STATIONS
Hydrological observing stations - Stage (water level)
IV.3
This table, which is presented as in Table 4.r.09, shows the numbers of water levelstations which are not used for discharge computation.
Tables 4.r.ll: Hydrological observing stations - Sediment and water quality
The sediment stations are grouped into suspended sediment (Column (4)), andbed-load (Column (5)), measuring stations. Column (6) shows water qualitystations of all types. No breakdown by parameter measured is available.
Tables 4.r.12: Groundwater stations (wells)
The columns show:
Column (4):
Column (5):
Column (6):Column (7):
Level measurements, either at special observation wells or atproduction wells (Prod). The observation wells are either recording(Rec) or non-recording (N-rec).Temperature measurement stations. Grouped under
.observation wells (Obsn) or production wells (Prod)Water quality measurements (Obsn or Prod)Other groundwater measurements (Obsn or Prod).
Table 4.7 summarizes the total numbers of observing stations in each WMO Region.

IV - STATIONS D'OBSERVATION HYDROLOGIQUE
TABLEAUX 4.1.01 11 4.7
Notes explicatives
Les tableaux de cette section indiquent Ie nombre de stations d'observation hydrologiqueexploitees dans chaque pays, par Region de I'OMM comme suit:
Tableau(x) N°(s)
4.r.01 a .074.r.084.r.094.r.104.r.114.r.12
Type de station
PrecipitationsEvaporationDebitHauteur d'eau (niveau de I'eau)Charge solide et qualite de I'eauEau souterraine (puits)
Dans les numeros de tableauxc ci-dessus, la lettre "r" indique la Region de I'OMM (Ies chiffres 1 a6correspondent aux Regions I aVI).
Dans la mesure du possible, les stations d'observation sont c1assees en fonction de laduree de la periode de releve :
• Moins de cinq ans;• Cinq a10 ans;• 10 a30 ans;• Plus de 30 ans.
Le nombre total de stations d'observation est egalement indique. II peut etre superieur a la sommedes quatre colonnes precedentes, lorsque certaines stations ne figurent pas dans la classification enfonction de la duree de la periode de releve. On notera que les donnees anterieures a 1980 sonttirees du Operational Hydrology Report N° 10 (WMO-N° 464) et que dans ce rapport toutes lesperiodes de releve superieures adix ans sont regroupees en une seule categorie, non Iimitee a trenteans. Dans les tableaux dont iI est question ici, les donnees correspondantes figurent arbitrairementdans la colonne "10 a30 ans", la colonne "plus de 30 ans" restant alors vide.
Dans tous les tableaux, les trois premieres colonnes sont reservees aux indicationssuivantes:
Colonne (1) - Nom du paysColonne (2) - Superficie tota/e du paysColonne (3) - Annee OU les donnees ont ete recueillies
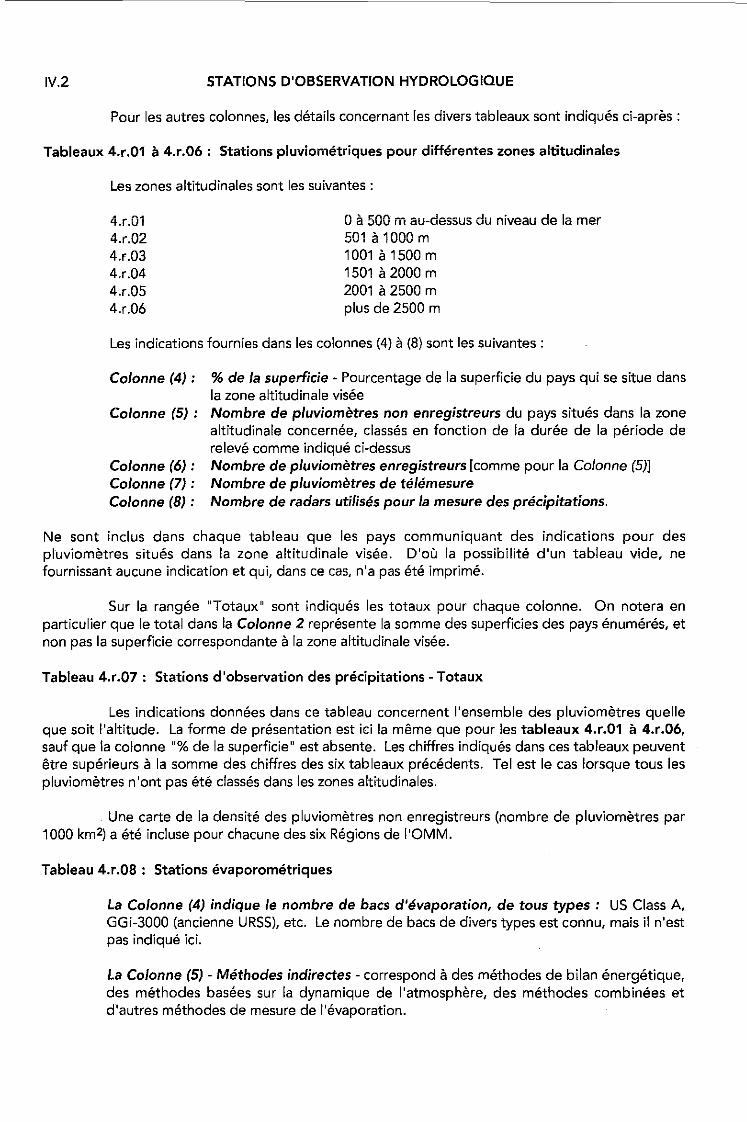
IV.2 STATIONS D'OBSERVATION HYDROLOGIQUE
Pour les autres colonnes, les details concernant les divers tableaux sont indiques ci-apres :
Tableaux 4.r.01 a 4.r.06: Stations pluviometriques pour differentes zones altitudinales
Les zones altitudinales sont les suivantes :
4.r.014.•.024.r.034.r.044.r.054.r.06
o 11 500 m au-dessus du niveau de la mer501 11 1000 m100111 1500 m1501 11 2000 m200111 2500 mplus de 2500 m
Les indications fournies dans les colonnes (4) 11 (8) sont les suivantes :
Colonne (4) :
Colonne (5) :
Colonne (6) :Colonne (7) :Colonne (8) :
% de la superficie - Pourcentage de la superficie du pays qui se situe dansla zone altitudinale viseeNombre de pluviometres non enregistreurs du pays situes dans la zonealtitudinale concernee, classes en fonction de la duree de la periode dereleve comme indique ci-dessusNombre de pluviometres enregistreurs [comme pour la Colonne (5)]Nombre de pluviometres de telemesureNombre de radars utilises pour la mesure des precipitations.
Ne sont inclus dans chaque tableau que les pays communiquant des indications pour despluviometres situes dans la zone altitudinale visee. D'oll la possibilite d'un tableau vide, nefournissant aucune indication et qui, dans ce cas, n'a pas ete imprime.
Sur la rangee "Totaux" sont indiques les totaux pour chaque colonne. On notera enparticulier que Ie total dans la Colonne 2 represente la somme des superficies des pays enumeres, etnon pas la superficie correspondante 11 la zone altitudinale visee.
Tableau 4.r.07: Stations d'observation des precipitations - Totaux
Les indications donnees dans ce tableau concernent I'ensemble des pluviometres quelieque soit I'altitude. La forme de presentation est ici la meme que pour les tableaux 4.r.01 a 4.r.06,sauf que la colonne "% de la superficie" est absente. Les chiffres indiques dans ces tableaux peuventetre superieurs 11 la somme des chiffres des six tableaux precedents. Tel est Ie cas lorsque tous lespluviometres n 'ont pas ete classes dans les zones altitudinales.
Une carte de la densite des pluviometres non enregistreurs (nombre de pluviometres par1000 km2) a ete incluse pour chacune des six Regions de I'OMM.
Tableau 4.r.08: Stations evaporometriques
La Colonne (4) indique Ie nombre de bacs d'evaporation, de tous types: US Class A,GGi-3000 (ancienne URSS), etc. Le nombre de bacs de divers types est connu, mais iI n'estpas indique ici.
La Colonne (5) - Methodes indirectes - correspond 11 des methodes de bilan energetique,des methodes basees sur la dynamique de I'atmosphere, des methodes combinees etd'autres methodes de mesure de I'evaporation.
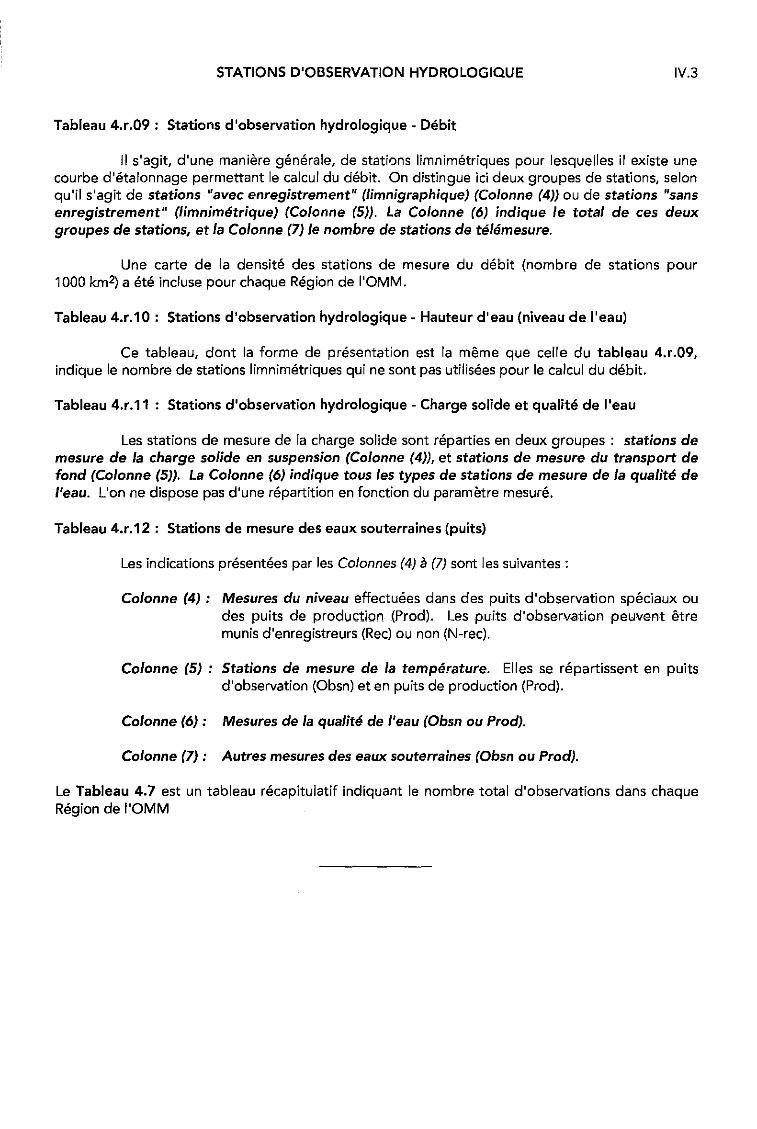
STATIONS D'OBSERVATION HYDROLOGIQUE
Tableau 4.r.09: Stations d'observation hydrologique - Debit
IV.3
/I s'agit, d'une maniere generale, de stations limnimetriques pour lesquelles il existe unecourbe d'etalonnage permettant Ie calcul du debit. On distingue iei deux groupes de stations, selonqu'i1 s'agit de stations "avec enregistrement" (limnigraphique) (Co/onne (4)) ou de stations "sansenregistrement" (limnimetrique) (Colonne (5)). La Colonne (6) indique Ie total de ces deuxgroupes de stations, et la Colonne (7) Ie nombre de stations de telemesure.
Une carte de la densite des stations de mesure du debit (nombre de stations pour1000 km2) a ete inc/use pour chaque Region de I'OMM.
Tableau 4.r.10: Stations d'observation hydrologique - Hauteur d'eau (niveau de I'eau)
Ce tableau, dont la forme de presentation est la meme que celie du tableau 4.r.09,indique Ie nombre de stations limnimetriques qui ne sont pas utilisees pour Ie calcul du debit.
Tableau 4.r.11 : Stations d'observation hydrologique - Charge solide et qualite de I'eau
Les stations de mesure de la charge solide sont reparties en deux groupes: stations demesure de la charge solide en suspension (Colonne (4)), et stations de mesure du transport defond (Colonne (5)). La Colonne (6) indique tous les types de stations de mesure de la qualite deI'eau. L'on ne dispose pas d'une repartition en fonction du parammre mesure.
Tableau 4.r.12: Stations de mesure des eaux souterraines (puits)
Les indications presentees par les C%nnes (4) a (7) sont les suivantes :
Colonne (4): Mesures du niveau effectuees dans des puits d'observation speciaux oudes puits de production (Prod). Les puits d'observation peuventetremunis d'enregistreurs (Rec) ou non (N-rec).
Colonne (5): Stations de mesure de la temperature. Elles se repartissent en puitsd'observation (Obsn) et en puits de production (Prod).
Colonne (6): Mesures de la qualite de I'eau (Obsn ou Prod).
Colonne (7): Autres mesures des eaux souterraines (Obsn ou Prod).
Le Tableau 4.7 est un tableau recapitulatif indiquant Ie nombre total d'observations dans chaqueRegion de I'OMM

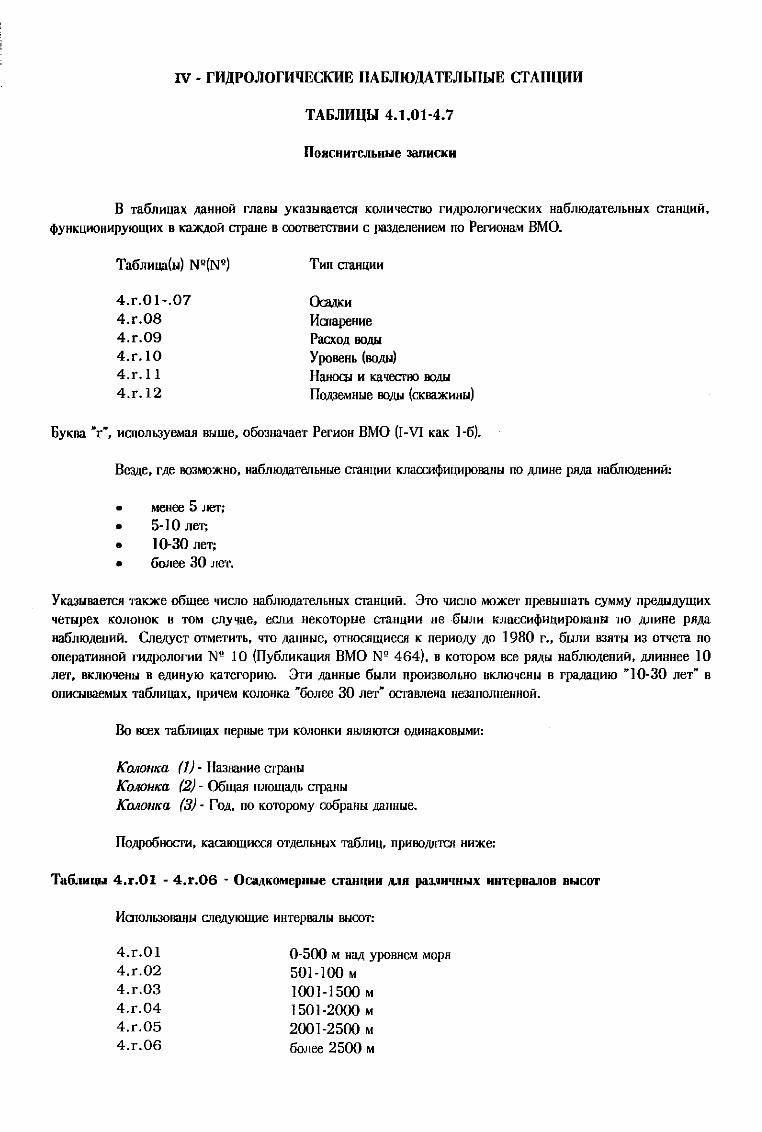
IV - fH.llPOJlOfWIECKHE IIAI>J1IO,lJ,ATEJlbllblE CTAIIUHH
TAI>J1HUbI 4.1.01-4.7
1I08CHHTeJlLHLle JaIlHCKH
B TaOnHuaX MHHOii rnaBbI YKa3b1BaeTCH KOnHqeCTBO rH!\jlOnOrHqeCKHX HaOJUOAaTMbHblx craHUHii.
4>YHKUHOHIlPYJOII\IlX B KaJKJ\oii CTpaue B COOTBeTCTBIlIl C paJAMeHHeM no PerlloHaM BMO.
4.r.Ol-.074.1'.084.1'.094.1'.104.1'.114.1'.12
OawmI1cnapeHlle
PacxoA BOi\bI
YpoOOHL (BOi\bI)
Hauow II KaqeCTBQ BOIlbI
nOAJeMHble BOi\bI (CKffilKIlHbI)
6YKBa "r", HcnonL3yeMau Bbllue. 0003HaqaeT PerHoH BMO (I-VI KaK 1-0).
BeJAe, rAe B03MO'lICHO, HaOnlOMTeJ1bHble CTaBUHH KJIa£n14>IlUIlPOBaHbI nO Jl)IHHe plIM HaOnlOAeHHii:
• MeHee 5 ner:
• 5-10 mIT;
• 10-30 neT:
• Donee 30 neT.
YKa3b1BaercJI TaK'lICe oOII\OO qHClIO HaOJlIO)laTMhHblX CTaHUHii. 3TO qllClIO MO'lICer npeBblmaTh CyMMy npei\blllYII\llx
qeTblpeX KonoHOK D TOM cnyq~ae. eCJlliHeKOTOpble craHU1l1l HeObllm KnaCClllllllUllpooaHbI nO IlJIHHe poAa
HaOmoAeHllii. CnBI\YeT OTMerIlTb. qTO AaHHble. OTHOCJIlI\HeCJI K lTep"ollY 110 1980 r .. 01lnH 83IITbI 113 OTqem ITO
onepaTIlBHOii rllllponorHIl NQ IO (nyonllKaUIlII BMO NQ 464), B KOTOpoM oce plIl\bI oaonlOlleHllii, Jl)IIlHHee 10ner, DKnlOqeHlI B eAIlHYIO KaTeropHIO. 3TH )laHHble OblJlH ITpoH3BOnbHO DKJIlOqeHbI B rpaMUll10 "10-30 neT" D
OITllCblBaeMblX mOnHuax. np"qeM KOJlOHKa "ooJlOO 30 nero OCTaBJIeHa HeJaITOnHeHHoii.
Bo ocex monlll\Bx nepBble Tpll KonOHKH IIBlTBIOTCJl OI\HHaKOBblMH:
KQIIOH/W (J) - Ha3Ba8He CTpaHbI
KQlloH/.a (2) - 06lI\au nJIOlI\lI,l\b crpaHbI
KQIIOIlKa (3) - fOil. no KOTOpoMy co6paHbI )laHHble.
no!\PD6HOCTH. KacalOlI\HeCJI OTAeJ1bHblX Ta6nHU. ITPHBOIlIITCJl HH'lICe:
Ta6.rJHJ1LI 4.r.Ol - 4.r.06 - Oca;\KOMepHLIe craB',HH i\.118 paJ..H'IHIU HHTepoaJlOH OLICOT
I1cnOJlb30Ba8b1 CIIBl\YlOlI\He IlHTepBa1lbl DblCOT:
4.r.Ol4.r.024.r.034.1'.044.1'.054.r.06
0-500 M HlI,l\ ypoBHeM MOplI
501-100 M
1001-1500 M
1501-2000 M
2001-2500 M
oonoo 2500 M
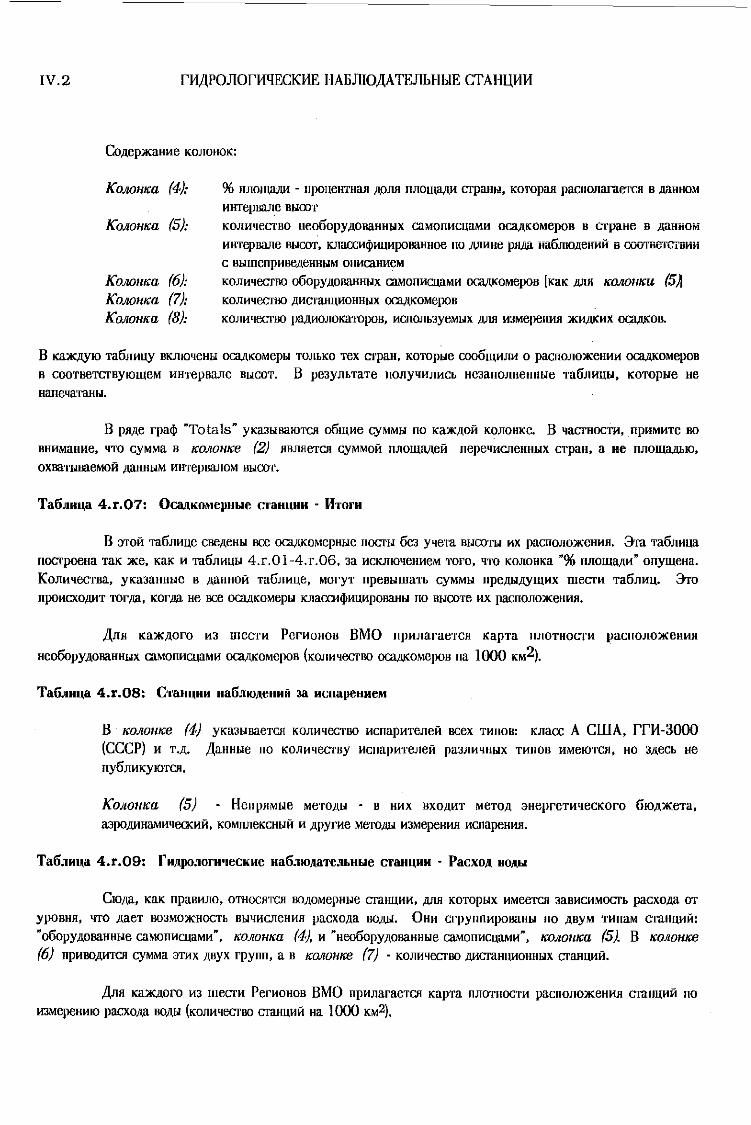
IV.2 rl1,l\POJlOmQECKI1E lIAIiJlIO,LlATEJlbHbIE CTAlIUl111
Col\eplKaHHe KOJIOHOK:
KOJ/OHlCa (4):
KOJIOHlCa (5):
KOJ/OHlCa (6):KOJ/oHlCa (7):KOJIOHlCa (8):
% nJlOl1JilJll' - npouellTHaJI I\OJIJI nJlOmal\H crpaubl, KOTOPaJI paCflOJlaraeTCH B !laHHOM
HlITepBaJle BblCXJT
KOJlHqecrBo He060pYl\oBaHHNX caMonHcuaMH ocal\KOMepoB B GrpaHe B l\aHHOM
HlITepBaJle BblCOT, KJlacrn<jlHUHpoBanHoe 110 II,JIHHe pH!Ia Ha6JllOI\eHHH B coar""'CTBHH
C BbllllenpHBel\eHHblM ollHcaHHeM
KOJlHqecrBO o6opYI\OBanHblX caMonHcuaMH DCal\KOMepoH [KaK MH ICOJIOHICU (5AKOJlHqecrBO I\HcrauUHOHHblX DCal\KOMepoB
KOJlHqecrBO PallHOJlOKaTOPOB, HCIIOJlb3yeMblx )\Jill H3Mepem", lKHl\KHX DCal\KOB.
B Ka)l()ly1O Ta6JIHuY BKJllOqeHbI Dcal\KOMepbl TOJlbKO Tex crpaH, KOTOpNe coo6IUHJIH 0 pacnOJlOlKeHHH ocaI\KOMepoB
B COOTBeTcrBylOIUeM HHTepHane BblCOT. B pe3YJlbTaTe nOJlyqHJlHCb He3anOJlHeHHble Ta6JIHUbI, KOTopble He
HaneqaTaHN.
B PHile rpalj> "Totals" YKa3b1BaIOTCH 06IUHe CYMMbI no KalKI\oii KOJlOHKe. B qacrHOCTH, npHMHTe BO
BHHMaHHe, qTO cyMMa B ICOJ/OlIlCe (2) HBJlJleTCH CyMMOii nJlOIUalleii nepeqHCJleHHblX cTpaH, a He nJlOIUallblO,
OXBaTbiBaeMOii IlaHHblM HIlTepBaJIOM BblCOT.
Ta6J1Hlla 4.r.07: OC3JlKOMepllble cram,HH • liTorH
B 3Toii m6JlHue CHel\eHbI BCe OQl)(KOMepHble nocrbl 003 yqe'ra BblCXJTbI HX pacnOJlOlKeHHH. 3'ra Ta6JlHua
nocrpoeHa TaK lKe, KaK H Ta6JlHUbI 4.r.O 1-4.r.06, 3a HCKJllOqeHHeM TOro, qTO KOJ'OHKa "% IIJlOIUaIIH" onYIUeHa.
KOJlHqecTBa, YKa3aHHble B l\aHHOii Ta6JlHue, MoryT npeBbllUaTb CyMMbI npel\blI\YIUHX lUecrH m6JlHU. 3TO
npoHCXOI\HT TOr!la, KOr!la He Bee Dcal\KOMepbl KJlaCCHlj>HUHpoBanbl no BblCOTe HX pacnOJlOlKeHHH.
,L(JlH KalKl\Oro H3 lIIeCTH PerHOHOB BMO npHJlaraeTCH KapTa nJlOTHOCTH pacnOJlOlKeHHH
Heo6opYI\OBaHHNX caMonHcuaMH Dcal\KOMellOB (KOJlHqecrBO DCal\KOMepoB Ha 1000 KM2).
Ta6JtHlla 4.r.08: CTallllHH lIa6.11OJ\eIlHil :Ill HcnapeHHeM
B ICOJ/OHlCe (4) YKa3b1BaeTCH KOJlHqecTBO HcnapHTeJleii BCex THIIOB: KJlaCC A CiliA, rrl1-3000
(CCCP) H T.I\. ,L(aHHble no KOJlHqecrBY HcnapHTeJ1eii pa3JlHqHblX THnOB HMelOTCH, HO 31\eCb He
ny6J1HKYIOTCH.
KOJ/OHlCa (5) . HenpHMble MeTO,AbI • B HHX BXOI\HT MeTO,A 3HepreTHqeCKOrO 61OI\lKeTa,
aapol\HHaMHqecKHH, KOMlIJ1eKCHblH H I\pyrHe MeTOl\bI H3MepeHHH HcnapeHHH.
Ta6J1HI,a 4.r.09: fHJ\pC>.10rHQeCKHe lIa6.11OJ\aTMLllble craMIIHH • PacxoJ\ BOJ\bI
CIO!Ia, KaK npaBHJlO, OTHOCHTCH BOI\OMepHble craHUHH, IIJ1H KOTOpblX HMeeTCH 3aBHcHMocrb paCXO!la OT
ypoBHH, qTO ,AaeT B03MOlKHOCTb BblqHCJleHHH pacxol\a BO,l\bI. OHH crpynnHpoBaHbI no ,AByM THnaM craHUHH:
"o6oPY,AOBaHHble caMOnHcuaMH", ICOJ/OHlCa (4), H "He060pY,AOBaHHble caMonHcuaMH", ICOJ/OHlCa (5). B ICOJ/OHICe
(6) npHBOI\HTCH cyMMa 3THX I\BYX rpynn, a B 1C0000HICe (7) • KOJlHqecrBO I\HCTaHUHOHHblX crauuHii.
4nH KalK,AOrO H3 lIIecrH PerHoHoB BMO npHJlaraeTCH Kapm nJlOTHOCTH pacn0J10lKeHHH CTaHUHH no
H3MepeHHIO pacxO!la BOI\bI (KOJlHqecrllO crauUHH Ha 1000 KM2).
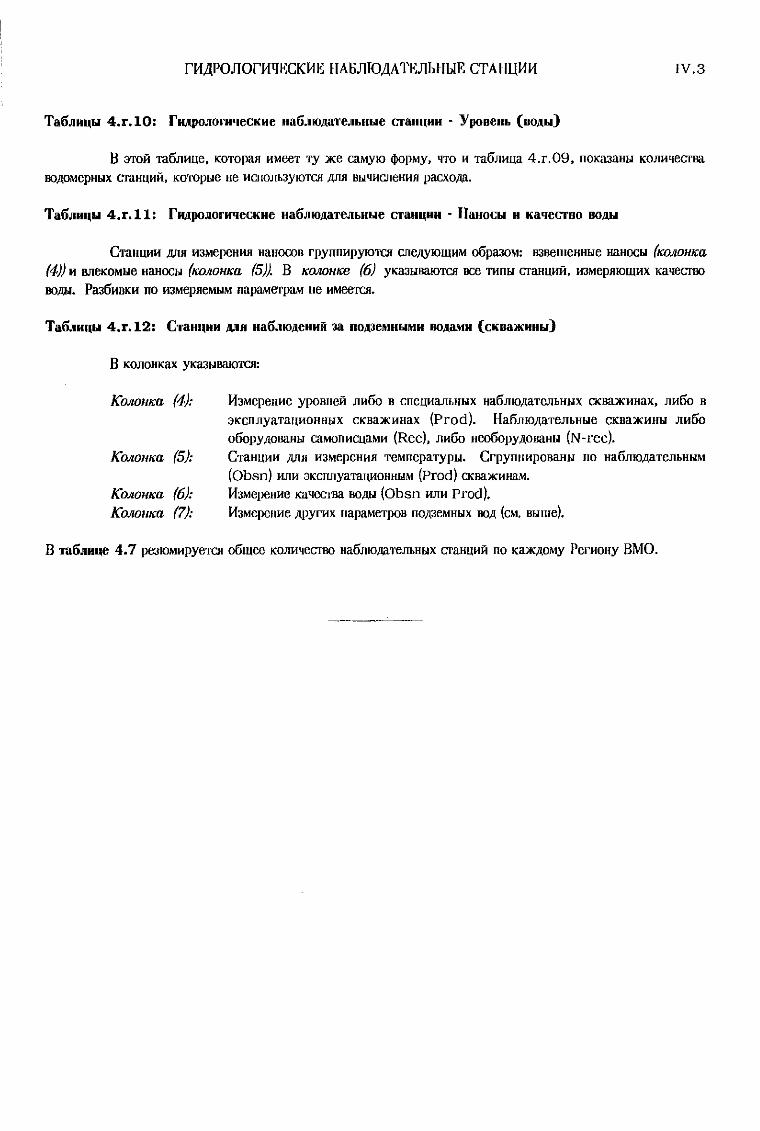
r11,L\pOJlOrWIECKI1E llAIiJlIO.L\ATEJlhHLlE CTAllUl111 IV.3
B :)TOH TIl6J1ltue, KOTOpaJI ItMeeT Ty JKe caMylO <j>opMy, qTO It Ta6J1ltua 4.r.09, nOKaJaltLl KOJlltqecrlla
BOilOMepHLlX GraHUItH, KOTOpLle He HcnOJlb3YlOTCH MIt BLlqltcneHItB pacXOi\B.
CTaHUWIt MB H3MepeHItB HaHOCOB rpyllllltpylOTCH cnei\YlOmltM 06paJOM: B3aemeHHLle HaHOCLl (KOJIOIlKa
(4)) It RlleKOMLle HanOCLl (KOAoIlKa (5)). B KOJIOIlKe (6) yKaJLlIlaIOTCH oce TltnLl cranUItH, 1t3MepBIOmltX KaqecrBO
BOi\LI. Pa:J6ItBKIt no 1t3MepBeMLlM napBMeTpa\l Ite ItMeeTCH.
Ta6.JJHI\L1 4.r.12: CTaH"HH J\.'H Ha6J1IOJ\CHHH aa HOJ\JeMHLlMH UOJ\aMH (CKoalKHHLI)
B KOJlOHKax YKaJLlIlaIOTCH:
KOAOIlKa (4):
KOAOIlKa (5):
KOAOIlKa (6):KOAollKa (7):
113MepeHlte ypoBHeH JlIt60 B cneuwanbHLlX Ha6J1lOilaTeJJbHLlx CKIJa)f(HHaX, JlH60 H
3KcnJlyamUHoIIHLlX CKBaJKHHaX (Prod). Ha6J1lOilaTeJlbHLle CKBaJKHHLI JlH60
o60pYilollaHLI caMonHcuaMH (Ree), JlIt60 He060pYIlOIlaHLI (N-ree).
CTallUlt1t Mil 1t3MepeHltll TeMnepaTypLl. Cl'pymmpoBaHLI 110 Ha6J1lOilaTeJJbllLlM
(Obsn) ItJIIt 3KcrulyaTIlUlt01l1l1lM (Prod) CKllaJKHllaM.
113MepeHlte Kaqecrlla BOW (Obsn ItJIIt Prod).
113MepeHlte ilPYrltX napaMeTpoB nOil3eMHLlX BOil (CM. BLllne).
B Ta6J1HI\C 4.7 pe3IOMltpyeTCH 06mee KOJlltqecrBO Ha6JIIOi\BTeJlbHLlX craHUItH no KBJKI\OMY Pel'ltony BMO.

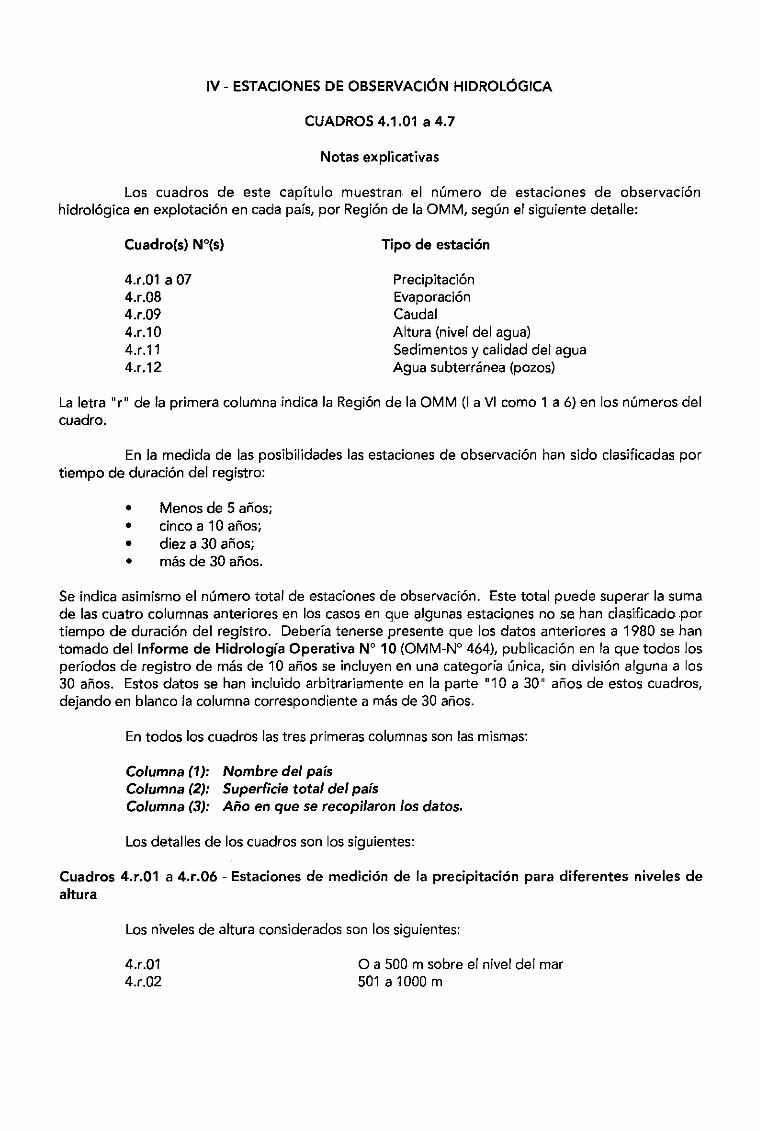
IV - ESTACIONES DE OBSERVACION HIDROLOGICA
CUADROS 4.1.01 a 4.7
Notas explicativas
Los cuadros de este capitulo muestran el numero de estaciones de observaci6nhidrol6gica en explotaci6n en cada pais, por Regi6n de la OMM, segun el siguiente detalle:
Cuadro(s) N°(s)
4.r.Ol a 074.r.084.r.094.r.l04.r.ll4.r.12
Tipo de estaci6n
Precipitaci6nEvaporacionCaudalAltura (nivel del agua)Sedimentos y calidad del aguaAgua subterranea (pozos)
La letra "r" de la primera columna indica la Regi6n de la OMM (I a VI como 1 a 6) en los numeros delcuadro.
En la medida de las posibilidades las estaciones de observaci6n han sido c1asificadas portiempo de duraci6n del registro:
• Menos de 5 arios;• cinco a 10 arios;• diez a 30 arios;• mas de 30 arios.
Se indica asimismo el numero total de estaciones de observaci6n. Este total puede superar la sumade las cuatro columnas anteriores en los casos en que algunas estaciones no se han c1asificado portiempo de duracion del registro. Deberia tenerse presente que los datos anteriores a 1980 se hantomado dellnforme de Hidrologia Operativa W 10 (OMM-N° 464), publicacion en la que todos losperiodos de registro de mas de 10 arios se incluyen en una categoria unica, sin divisi6n alguna a los30 arios. Estos datos se han incluido arbitrariamente en la parte "10 a 30" arios de estos cuadros,dejando en blanco la columna correspondiente a mas de 30 arios.
En todos los cuadros las tres primeras columnas son las mismas:
Columna (1): Nombre del paisColumna (2): Superficie total del parsColumna (3): Ailo en que se recopilaron los datos.
Los detalles de los cuadros son los siguientes:
Cuadros 4.r.01 a 4.r.06 - Estaciones de medici6n de la precipitaci6n para diferentes niveles dealtura
Los niveles de altura considerados son los siguientes:
4.r.014.r.02
o a 500 m sobre el nivel del mar501 a 1000 m
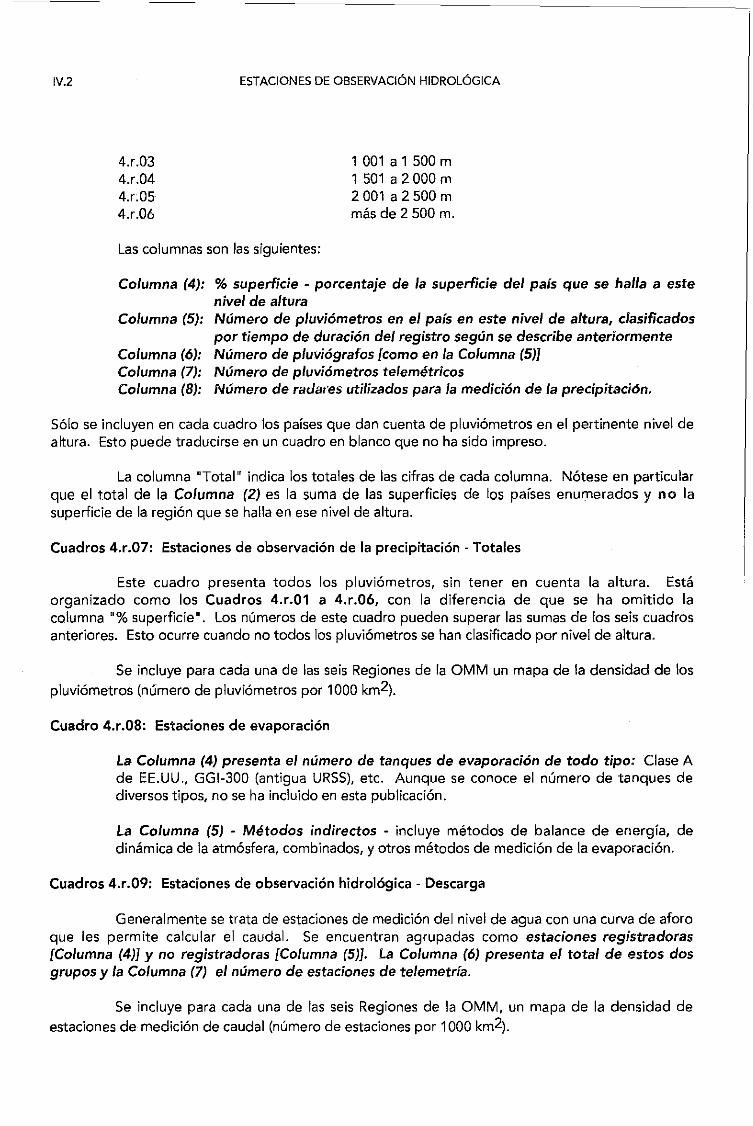
IV.2
4.r.034.r.044.r.054.r.06
ESTACIONES DE OBSERVACION HIDROLOGICA
1 001 a 1 500 m1 501 a 2 000 m2001 a 2 500 mmas de 2 500 m.
Las columnas son las siguientes:
Columna (4): % superficie - porcentaje de la superficie del pais que se halla a estenivel de altura
Columna (5): Numero de pluviometros en el pars en este nivel de altura, clasificadospor tiempo de duracion del registro segun se describe anteriormente
Columna (6): Numero de pluviografos [como en la Columna (5)]Columna (7): Numero de pluviometros telemetricosColumna (8): Numero de radares utilizados para la medicion de la precipitaci6n.
5610 se incluyen en cada cuadro los pafses que dan cuenta de pluvi6metros en el pertinente nivel dealtura. Esto puede traducirse en un cuadro en blanco que no ha sido impreso.
La columna "Total" indica los totales de las cifras de cada columna. N6tese en particularque el total de la Columna (2) es la suma de las superficies de los pafses enumerados y nolasuperficie de la regi6n que se halla en ese nivel de altura.
Cuadros 4.r.07: Estaciones de observacion de la precipitacion - Totales
Este cuadro presenta todos los pluvi6metros, sin tener en cuenta la altura. Estaorganizado como los Cuadros 4.r.01 a 4.r.06. con la diferencia de que se ha omitido lacolumna "% superficie". Los numeros de este cuadro pueden superar las sumas de los seis cuadrosanteriares. Esto ocurre cuando no todos los pluvi6metros se han clasificado por nivel de altura.
Se incluye para cada una de las seis Regiones de la OMM un mapa de la densidad de los
pluvi6metros (numero de pluvi6metros por 1000 km2).
Cuadro 4.r.08: Estaciones de evaporacion
La Columna (4) presenta el numero de tanques de evaporacion de todo tipo: Clase Ade EE.UU .• GGI-300 (antigua URSS), etc. Aunque se conoce el numero de tanques dediversos tipos. no se ha incluido en esta publicaci6n.
La Columna (5) - Metodos indirectos - incluye metodos de balance de energfa. dedinamica de la atm6sfera, combinados. y otros metodos de medici6n de la evaporaci6n.
Cuadros 4.r.09: Estaciones de observacion hidrologica - Descarga
Generalmente se trata de estaciones de medici6n del nivel de agua con una curva de aforoque les permite calcular el caudal. Se encuentran agrupadas como estaciones registradoras[Columna (4)] y no registradoras [Columna (5)J. La Columna (6) presenta el total de estos dosgrupos y la Columna (7) el numero de estaciones de telemetrra.
Se incluye para cada una de las seis Regiones de la OMM, un mapa de la densidad deestaciones de medici6n de caudal (numero de estaciones par 1000 km2).
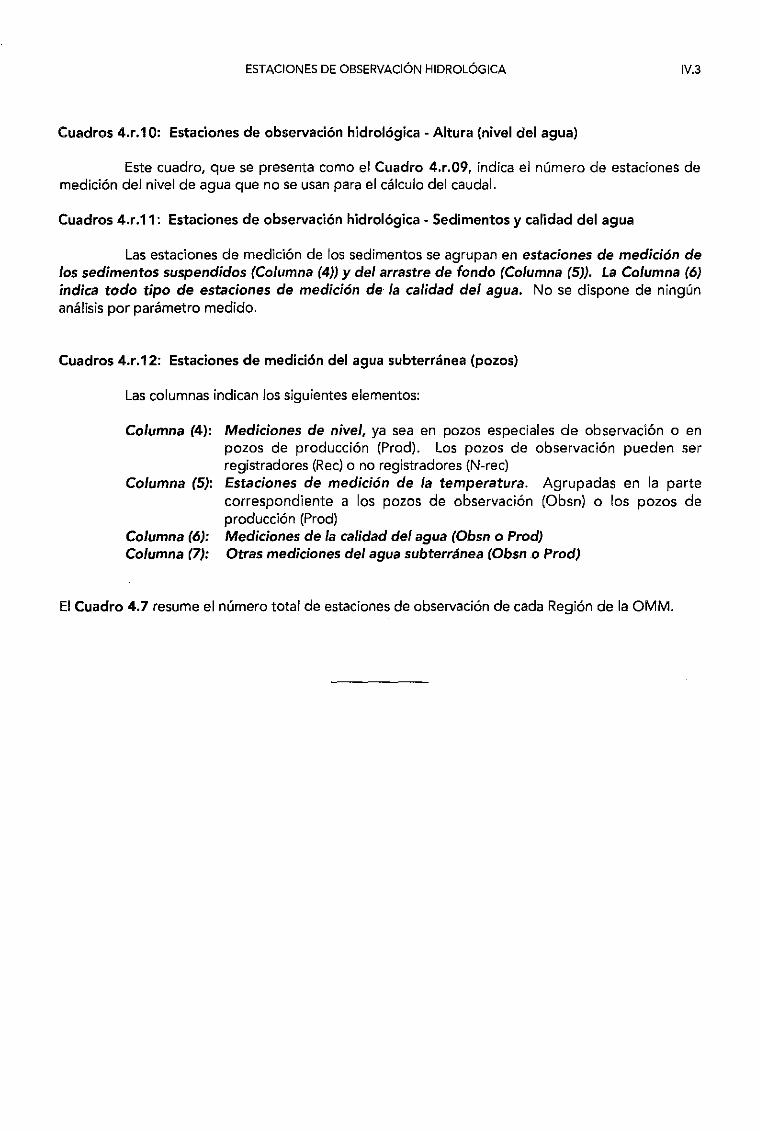
ESTACIONES DE OBSERVACION HIDROLOGICA
Cuadros 4.r.1 0: Estaciones de observacion hidrologica - Altura (nivel del agua)
IV.3
Este cuadra, que se presenta como el Cuadro 4.r.09, indica el numera de estaciones demedici6n del nivel de agua que no se usan para el calculo del caudal.
Cuadros 4.r.11: Estaciones de observacion hidrologica - Sedimentos y calidad del agua
Las estaciones de medici6n de los sedimentos se agrupan en estaciones de medici6n de105 sedimentos suspendidos (Columna (4» y del arrastre de fondo (Columna (5». La Columna (6)indica todo tipo de estaciones de medici6n de la calidad del agua. No se dispone de ningunanalisis por parametro medido.
Cuadros 4.r.12: Estaciones de medici6n del agua subterranea (pozos)
Las columnas indican los siguientes elementos:
Columna (4):
Columna (5):
Columna (6):Columna (7):
Mediciones de nivel, ya sea en pozos especiales de observaci6n 0 enpozos de producci6n (Prod). Los pozos de observaci6n pueden serregistradores (Rec) 0 no registradores (N-rec)Estaciones de medici6n de la temperatura. Agrupadas en la partecorrespondiente a los pozos de observaci6n (Obsn) 0 los pozos depraducci6n (Prod)Mediciones de la calidad del agua (Obsn 0 Prod)Otras mediciones del agua subteminea (Obsno Prod)
EI Cuadro 4.7 resume el numero total de estaciones de observaci6n de cada Regi6n de la OMM.

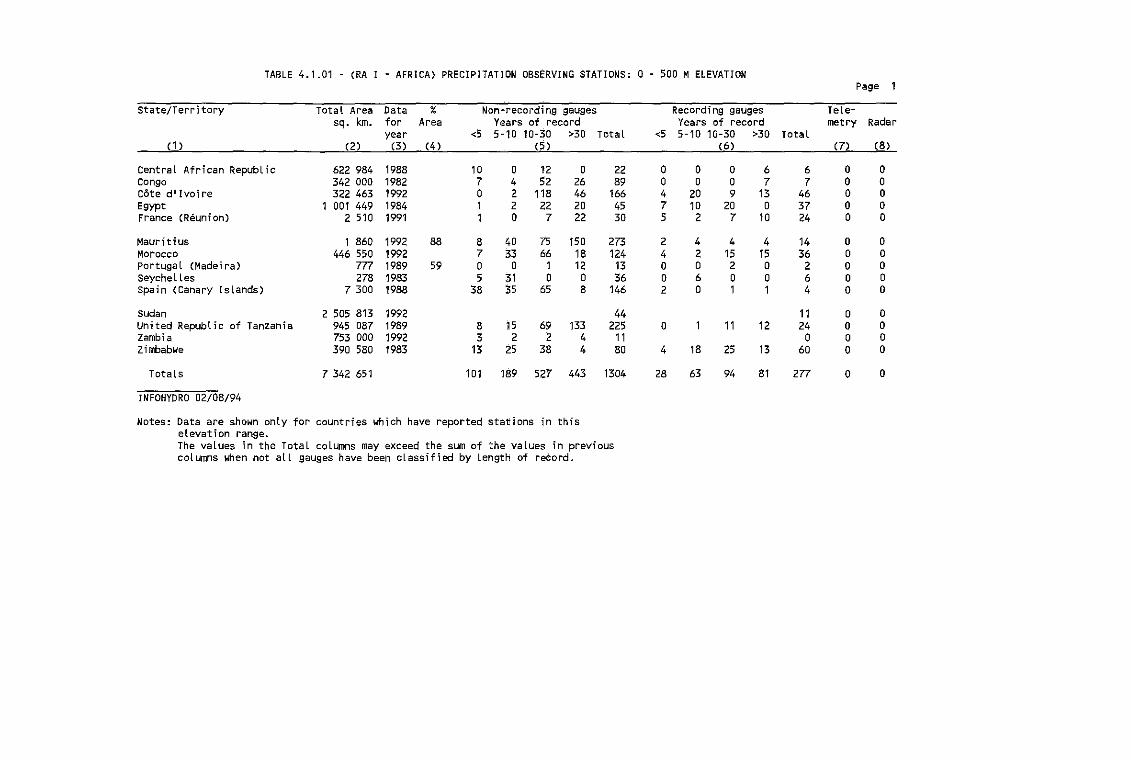
TABLE 4.1.01 . (RA I . AFRICA) PRECIPITATION OBSERVING STATIONS: o· 500 MELEVATIONPage 1
State/Territory Total Area Data % Non~recordin9 gauges Record;"9 gauges Tele~
sq. km. for Area Years of record Years of record metry Radaryear <5 5·10 10·30 >30 TotaL <5 5·10 10·30 >30 Total
(1) (2) (3 ) (4 ) (5 ) (6) (7) (8)
Central African RepubLic 622 984 1988 10 0 12 0 22 0 0 0 6 6 0 0Congo 342 000 1982 7 4 52 26 89 0 0 0 7 7 0 0Cote d ' Ivoire 322 463 1992 0 2 118 46 166 4 20 9 13 46 0 0Egypt 1 001 449 1984 1 2 22 20 45 7 10 20 0 37 0 0France (Reunion) 2 510 1991 1 0 7 22 30 5 2 7 10 24 0 0
Mauritius 1 860 1992 88 8 40 75 150 273 2 4 4 4 14 a 0Morocco 446 550 1992 7 33 66 18 124 4 2 15 15 36 0 0Portugal (Madeira) 777 1989 59 0 0 1 12 13 0 0 2 0 2 0 0Seychel Les 278 1983 5 31 10 0 36 0 6 0 0 6 0 0spain (Canary Islands) 7 300 1988 38 t5 65 8 146 2 0 1 1 4 0 0
sudan 2 505 813 1992 44 11 a aUnited Republic of Tanzania 945 087 1989 8 i5 69 133 225 a 1 11 12 24 a aZambia 753 000 1992 3 2 2 4 11 0 a aZimbabwe 390 580 1983 13 25 38 4 80 4 18 25 13 60 0 a
Totals 7 342 651 101 189 527 443 1304 28 63 94 81 277 0 a
INFOHYDRO 02/08/94
Notes: Data are shown only for countries which have reported stations in thiselevation range.The values in the Total coLumns may exceed the sum of the values in previouscolumns when not all gauges have been classified by length of record.

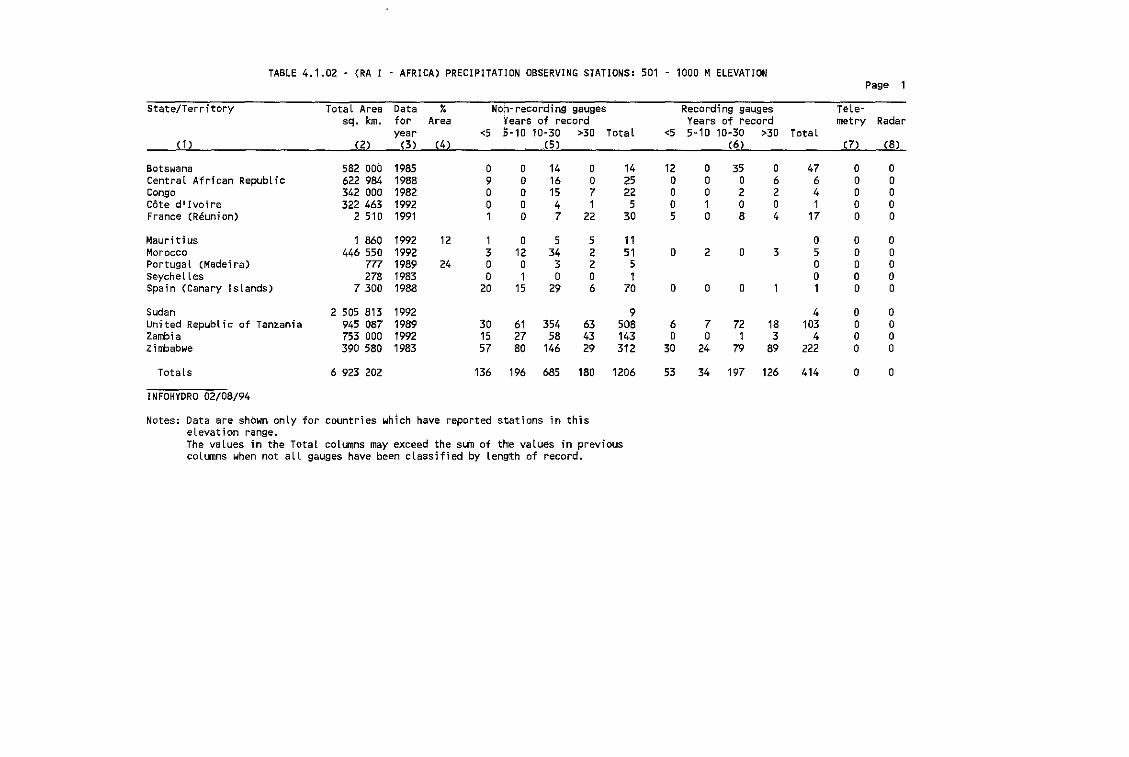
TABLE 4.1.02 - (RA I - AFRICA) PRECIPITATION OBSERVING STATIONS: 501 - 1000 MELEVATIONPage 1
State/Terri tory TotaL Area Data % Non-reco~ding gauges Record;"9 gauges Tele-sq. km. for Area Years of record Years of record metry Radar
year <5 5-10 10-30 >30 Total <5 5-10 10-30 >30 Total(1 ) (2 ) (3) (4) (5 ) (6) (7) (8)
Botswana 582 000 1985 0 0 14 0 14 12 0 35 0 47 0 0Central African Republic 622 984 1988 9 0 16 0 25 0 0 0 6 6 0 0Congo 342 000 1982 0 0 15 7 22 0 0 2 2 4 0 0Cote d'Ivoire 322 463 1992 0 0 4 1 5 0 1 0 0 1 0 0France (Reunion) 2 510 1991 1 0 7 22 30 5 0 8 4 17 0 0
Mauri ti us 1 860 1992 12 1 0 5 5 11 0 0 0Morocco 446 550 1992 3 12 34 2 51 0 2 0 3 5 0 0Portugal (Madeira) 777 1989 24 0 0 3 2 5 0 0 0SeycheL Les 278 1983 0 1 0 0 1 0 0 0Spain (Canary Islands) 7300 1988 20 15 29 6 70 0 0 0 1 1 0 0
Sudan 2 505 813 1992 9 4 0 0United Republic of Tanzania 945 087 1989 30 61 354 63 508 6 7 72 18 103 0 0Zambia 753 000 1992 15 27 58 43 143 0 0 1 3 4 0 0Zimbabwe 390 580 1983 57 80 146 29 312 30 24 79 89 222 0 0
Totals 6 923 202 136 196 685 180 1206 53 34 197 126 414 0 0
INFOHYORO 02/08/94
Notes: Data are shown only for countries whlch have reported st,ations in thiselevation range.The values in the Total coLumns may exceed the sum of the values in previouscoLumns when not all gauges have been classified by length of record.

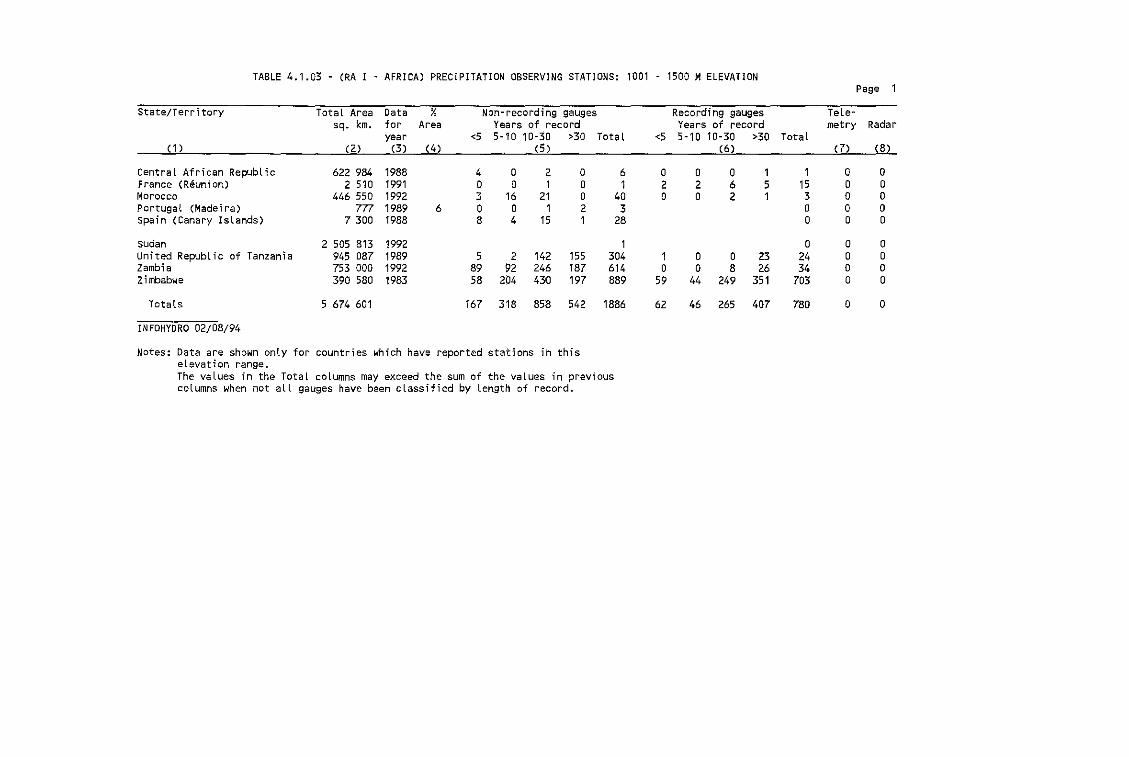
TABLE 4.1.03 - (RA I - AFRICA) PRECIPITATION OBSERVING STATIONS: 1001 - 1500 MELEVATIONPage
State/Territory Total Area Data % Non-recording gauges Record; ng gauges Tele-sq. km. for Area Years of record Years of record metry Radar
year <5 5-10 10-30 >30 TotaL <5 5-10 10-30 >30 Total(1) (2) (3) (4) (5 ) (6) (7) (8)
Central African RepubLic 622 984 1988 4 0 2 0 6 0 0 0 1 1 0 0France (Reunion) 2 510 1991 0 0 1 0 1 2 2 6 5 15 0 0Morocco 446 550 1992 3 16 21 0 40 0 0 2 1 3 0 0Portugal (Madeira) 777 1989 6 0 0 1 2 3 0 0 0spain (Canary IsLands) 7 300 1988 8 4 15 1 28 0 0 0
sudan 2 505 813 1992 1 0 0 0United Republic of Tanzania 945 087 1989 5 2 142 155 304 1 0 0 23 24 0 0Zambia 753 000 1992 89 92 246 187 614 0 0 8 26 34 0 0Zimbabwe 390 580 1983 58 204 43'0 197 889 59 44 249 351 703 0 0
Totals 5 674 601 167 318 858 542 1886 62 46 265 407 780 0 0
INFOHYORO 02/08/94
Notes: Data are shown only for countries which have reported stations in thiselevation range.The values in the Total columns may exceed the sum of the values in previouscolumns when not aLL gauges have been cLassified by Lengtrn of record.

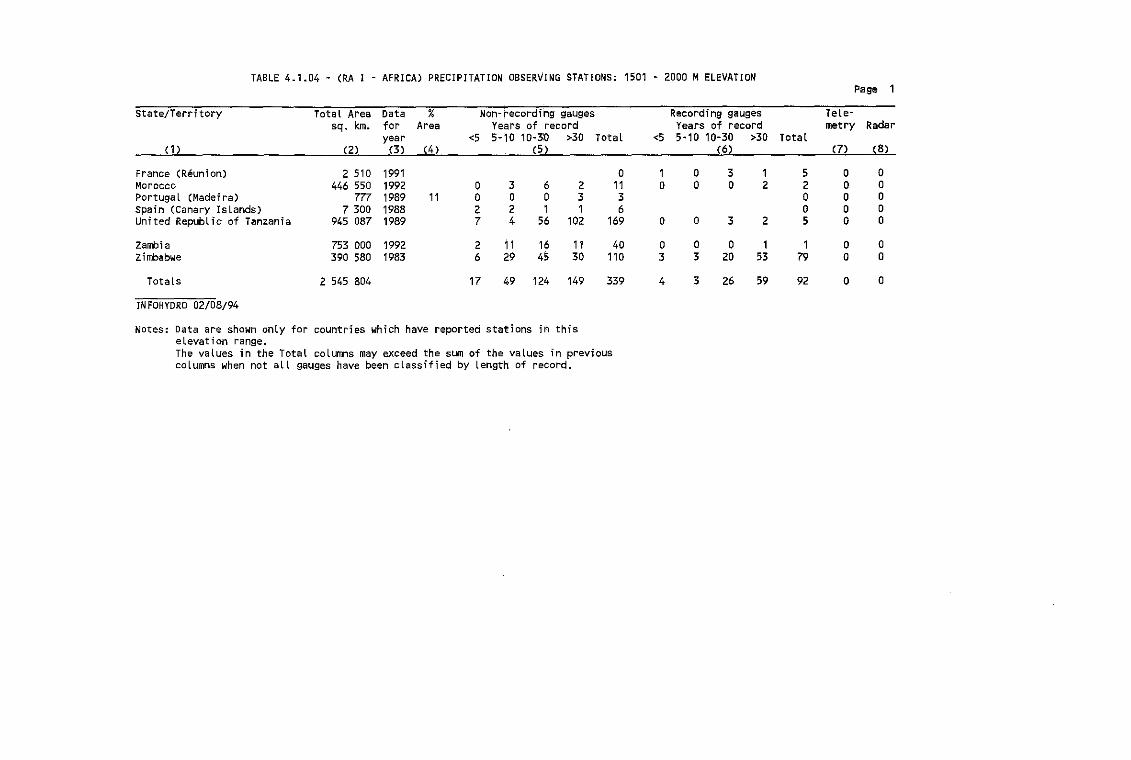
TABLE 4.1.04 - (RA I - AFRICA) PRECIPITATION OBSERVING STATIONS: 1501 . 2000 MELEVATIONPage 1
state/Territory Total Area Data % Non w recordilng gauges Recording gauges Tele-sq. km. for Area Years of record Years of record metry Radar
year <5 5-10 10-30 >30 Total <5 5-10 10-30 >30 Total(1 ) (2) (3 ) (4 ) (5 ) (6) (7) (8)
France (Reunion) 2 510 1991 0 1 0 3 1 5 0 0Morocco 446 550 1992 0 3 6 2 11 0 0 0 2 2 0 0Portugal (Madeira) 777 1989 11 0 0 0 3 3 0 0 0Spain (Canary Islands) 7300 1988 2 2 1 1 6 0 0 0United Republic of Tanzania 945 087 1989 7 4 56 102 169 0 0 3 2 5 0 0
Zambia 753 000 1992 2 i 1 16 11 40 0 0 0 1 1 0 0Zimbabwe 390 580 1983 6 29 45 30 110 3 3 20 53 79 0 0
Totals 2 545 804 17 49 124 149 339 4 3 26 59 92 0 0
INFOHYORO 02/08/94
Notes: Data are shown only for countries which have reported stations in thiseLevation range.The values in the Total columns may exceed the sum of the values in previouscolumns when not all gauges have been classified by length of record.

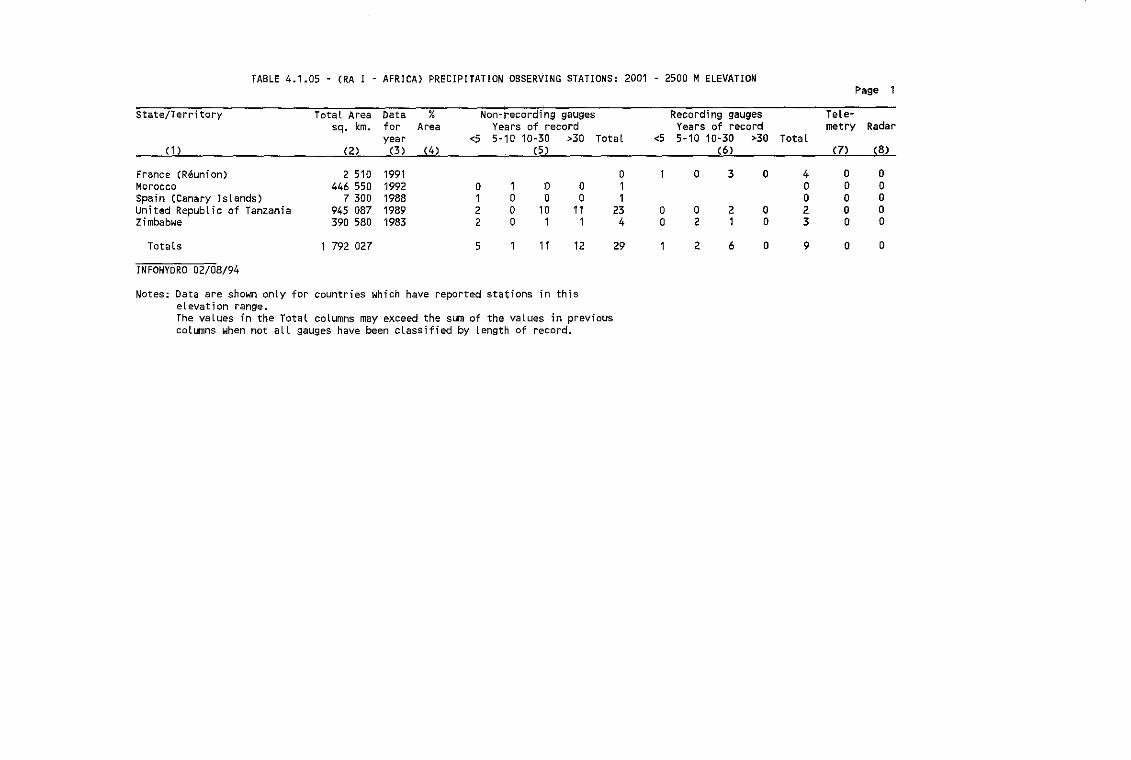
TABLE 4.1.05 - (RA I - AFRICA) PRECIPITATION OBSERVING STATIONS: 2001 - 2500 MELEVATIONP'age 1
State/Terri tory Total Area Data % Non-recording gauges Recording gauges TeLe-sq. km. for Area Years of record Years of record metry Radar
year <5 5-10 10-;0 >;0 Total <5 5-10 10-30 >30 Total(1 ) (2) (3) (4) (5 ) (6) (7) (8)
France (Reunion) 2 510 1991 a 1 a 3 a 4 a aMorocco 446 550 1992 a 1 0 a 1 a a aSpain (Canary Islands) 7 300 1988 1 a a a 1 a a aUnited Republic of Tanzania 945 087 1989 2 a 10 11 23 a a 2 a 2 a aZimbabwe 390 580 1983 2 a 1 1 4 a 2 1 a 3 a 0
Totals 1 792 027 5 1 11 12 29 1 2 6 a 9 a a
INFOHYDRO 02/08/94
Notes: Data are shown only for countries which have reported stations in thiselevation range.The values in the Total columns may exceed the sum of the values in previouscolumns when not all gauges have been classified by length of retord.

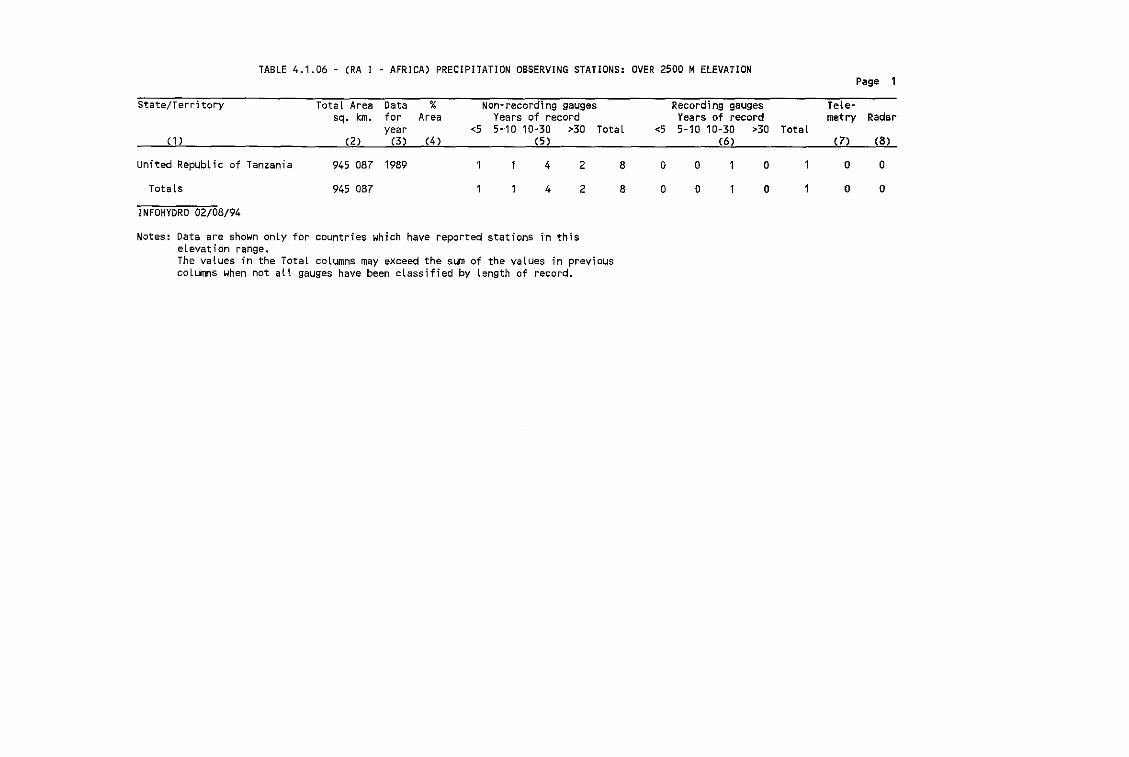
TABLE 4.1.06 - (RA I - AFRICA) PRECIPITATION OBSERVING STATIONS: OVER 2500 MELEVATION
State/Territory Total Area Data %sq. km. for Area
year(1 ) (2) (3 ) ~ (4)
United Republic of Tanzania 945 087 1989
Totals 945 087
INFOHYORO 02/08/94
Page 1
Non-recording gauges Recording gauges Tele-Years of record Years of record metry Radar
<5 5-10 10-30 >30 Total <5 5-10 10-30 >30 Total(5 ) (6) (7) (8)
4 2 8 0 0 1 0 1 0 0
4 2 8 0 0 1 0 1 0 0
Notes: Data are shown only for countries which have reported stations in thiselevation range.The values in the Total coLumns may exceed the sum of the values in previouscolumns when not all gauges have been classified by length of record.

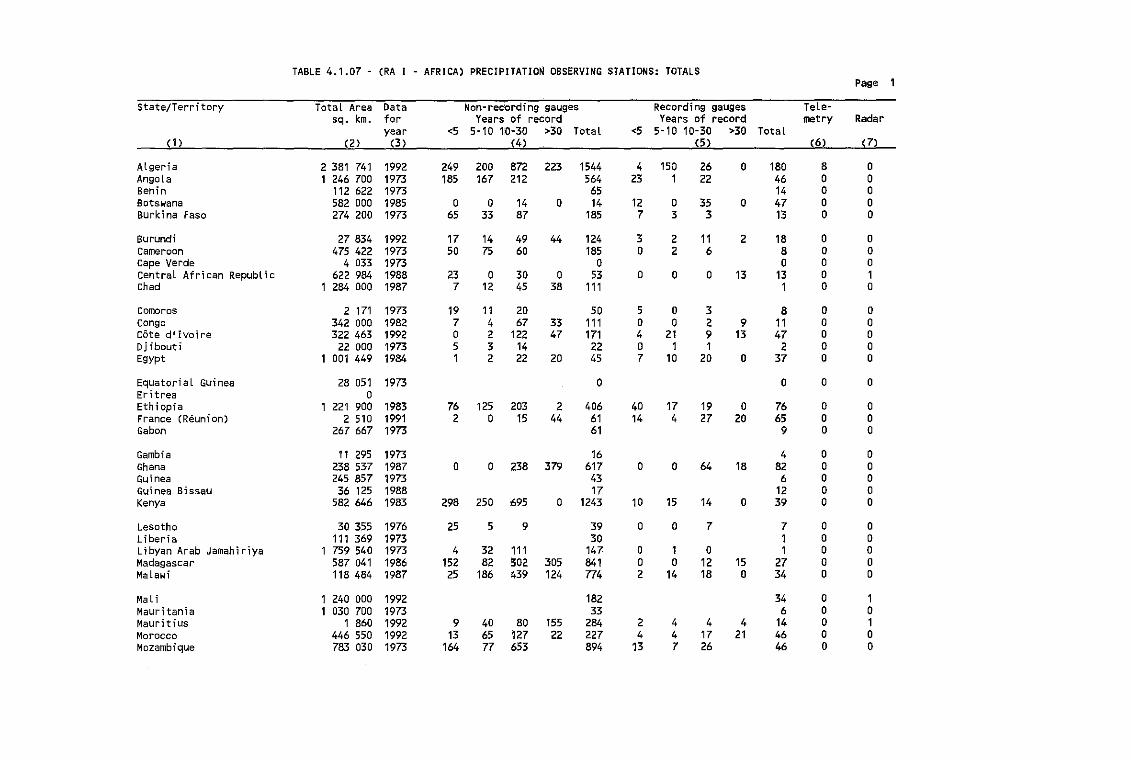
TABLE 4.1.07 - (RA I - AFRICA) PRECIPITATION OBSERVING STATIONS: TOTALSPage
State/Territory Total Area Data Non-recording gauges Recording gauges Tete-sq. km. for Years of record Years of record metry Radar
year <5 5-10 10-30 >30 Total <5 5-10 10-30 >30 TotaL(1 ) (2 ) (3 ) (4) (5 ) @ (7)
Algeria 2 381 741 1992 249 200 872 223 1544 4 150 26 0 180 8 0Angola 1 246 700 1973 185 167 212 564 23 1 22 46 0 0Benin 112 622 1973 65 14 a aBotswana 582 000 1985 0 a 14 0 14 12 a 35 0 47 0 0Burkina Faso 274 200 1973 65 33 87 185 7 3 3 13 0 0
Burundi 27 834 1992 17 14 49 44 124 3 2 11 2 18 0 0Cameroon 475 422 1973 50 75 60 185 0 2 6 8 0 acape Verde 4 033 1973 0 0 a aCentral African Republic 622 984 1988 23 0 30 0 53 a a a 13 13 0 1Chad 1 284 000 1987 7 12 45 38 111 1 a a
Comoros 2 171 1973 19 11 20 50 5 0 3 8 0 0Congo 342 000 1982 7 4 67 33 111 0 0 2 9 11 a 0Cote d l Ivoire 322 463 1992 0 2 122 47 171 4 21 9 13 47 0 0Djibouti 22 000 1973 5 3 14 22 0 1 1 2 0 0Egypt 1 001 449 1984 1 2 22 20 45 7 10 20 0 37 0 0
Equatorial Guinea 28 051 1973 0 0 0 0Eritrea 0Ethiopia 1 221 900 1983 76 125 203 2 406 40 17 19 0 76 0 0France (Reunion) 2 510 1991 2 0 15 44 61 14 4 27 20 65 0 0Gabon 267 667 1973 61 9 0 0
Gambi a 11 295 1973 16 4 0 0Ghana 238 537 1987 0 0 238 379 617 0 0 64 18 82 0 0Guinea 245 857 1973 43 6 0 0Guinea Bissau 36 125 1988 17 12 0 0Kenya 582 646 1983 298 250 695 0 1243 10 15 14 0 39 0 0
Lesotho 30 355 1976 25 5 9 39 0 0 7 7 0 0Liberia 111 369 1973 30 1 0 0Llbyan Arab Jamahi riya 1 759 540 1973 4 32 '111 147 0 1 0 1 0 0Madagascar 587 041 1986 152 82 302 305 841 0 0 12 15 27 0 0Malawi 118 484 1987 25 186 439 124 774 2 14 18 0 34 0 0
MaL i 1 240 000 1992 182 34 0 1Mauritania 1 030 700 1973 33 6 0 0Mauritius 1 860 1992 9 40 80 155 284 2 4 4 4 14 0 1Morocco 446 550 1992 13 65 127 22 227 4 4 17 21 46 0 0Mozambique 783 030 1973 164 77 653 894 13 7 26 46 0 0
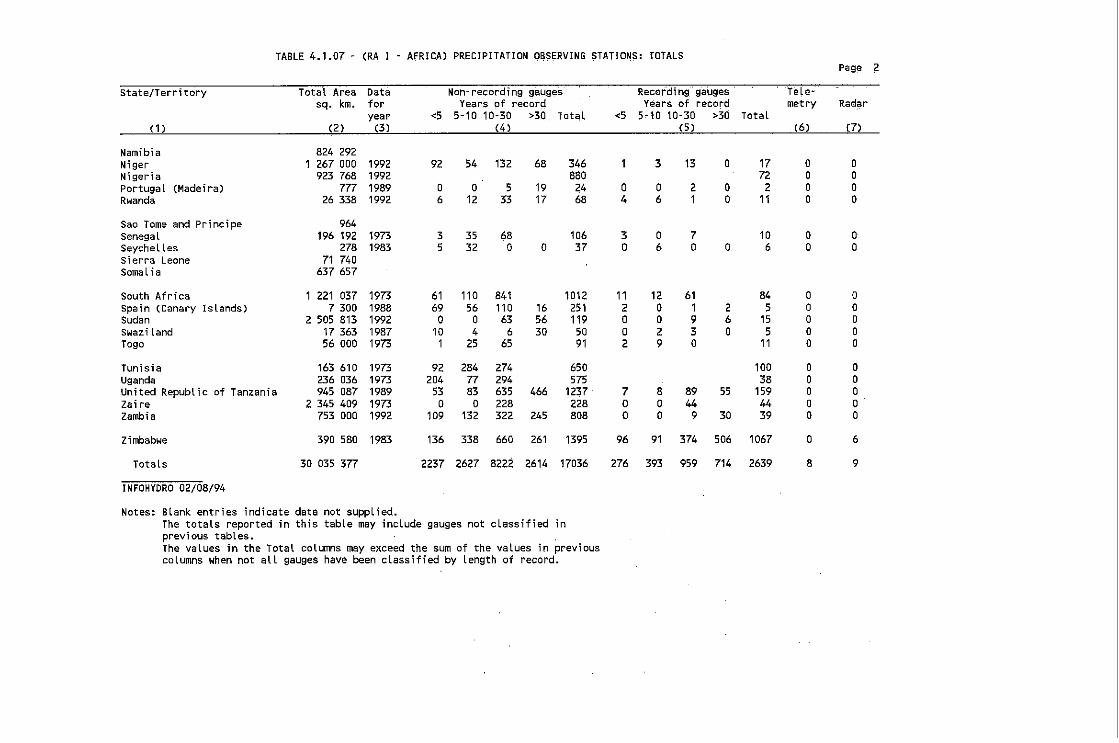
TABLE 4.1.07 - (RA I AfRICA) PRECIPITATION OBSERVING STATIONS: TOTALSPagi; ~
State/Territory Total Area Data Non~recording gauges Recording' gauges' rele~
sq. km. for Years of record Years of record metry Radaryear <5 5-10 10-30 >30 Total <5 5-10 10-30 >30 Total
ill (2) (3 ) (4) (5 ) (6) (7)
Namibia 824 292N; ger 1 267 000 1992 92 54 132 68 346 1 3 13 0 17 0 0Nigeria 923 768 1992 880 72 0 0Portugal (Madeira) 777 1989 0 0 5 19 24 0 0 2 0 2 0 0Rwanda 26 338 1992 6 12 33 17 68 4 6 1 0 11 0 0
Sao Tome and Principe 964SenegaL 196 192 1973 3 35 68 10.6 3 0 7 10 0 0SeycheL Les 278 1983 5 32 0 0 37 0 6 0 0 6 0 0sierra Leone 71 740SomaLia 637 657
South Africa 1 221 037 1973 61 110 841 1012 11 12 61 84 0 0Spain (Canary Islands) 7 300 1988 69 56 110 16 251 2 0 1 2 5 0 0Sudan 2 505 813 1992 0 0 63 56 119 0 0 9 6 15 0 0SwaziLand 17 363 1987 10 4 6 30 50 a 2 3 0 5 0 0Togo 56 000 1973 1 25 65 91 2 9 0 11 0 0
Tunisia 163 610 1973 92 284 274 650 100 0 0Uganda 236 036 1973 204 77 294 575 38 0 0United Republic of Tanzania 945 087 1989 53 83 635 466 1237 7 8 89 55 159 0 0Zaire 2 345 409 1973 0 0 228 228 a 0 44 44 0 0Zambia 753 000 1992 109 132 322 245 808 0 0 9 30 39 0 0
Zimbabwe 390 580 1983 136 338 660 261 1395 96 91 374 506 1067 0 6
TotaLs 30 035 377 2237 2627 8222 2614 17036 276 393 959 714 2639 8 9
INFOHYDRO 02/08/94
Notes: Blank entries indicate data not suppLied.The totals reported in this table may include gauges not classified inprevious tables.The values in the Total columns may exceed the sum of the values in previouscoLumns when not all gauges have been classified by Length of record.
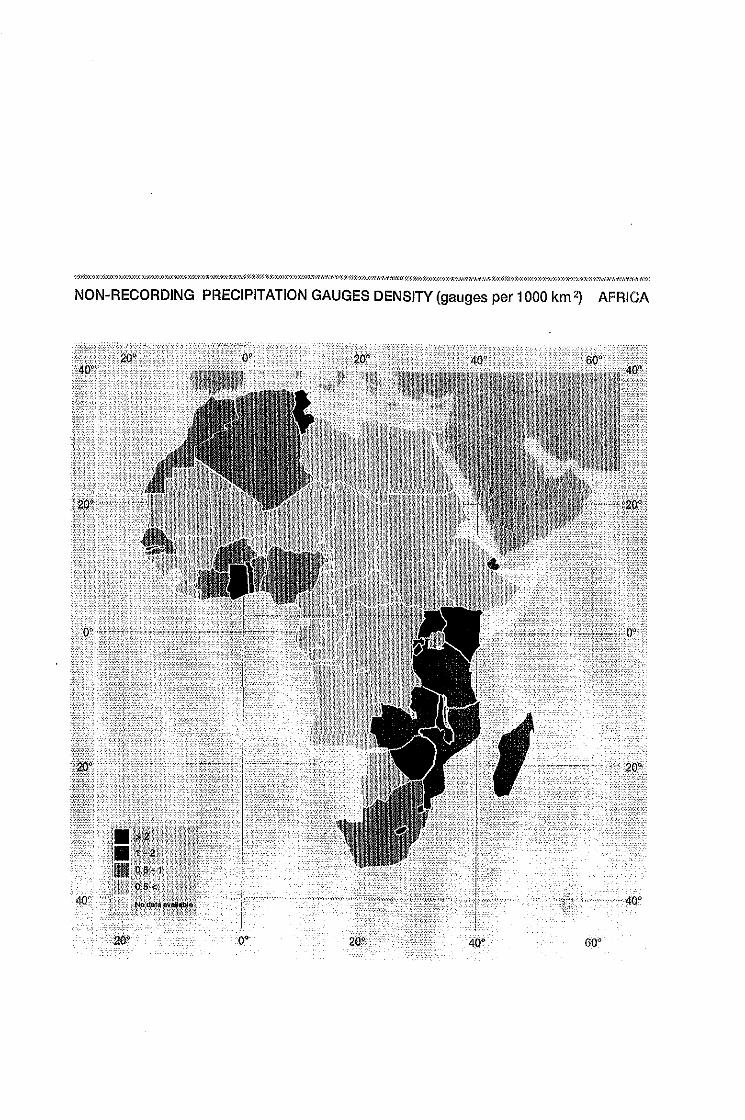
NON-RECORDING PRECIPITATION GAUGES DENSITY (gauges per 1000 km 2) AFRICA

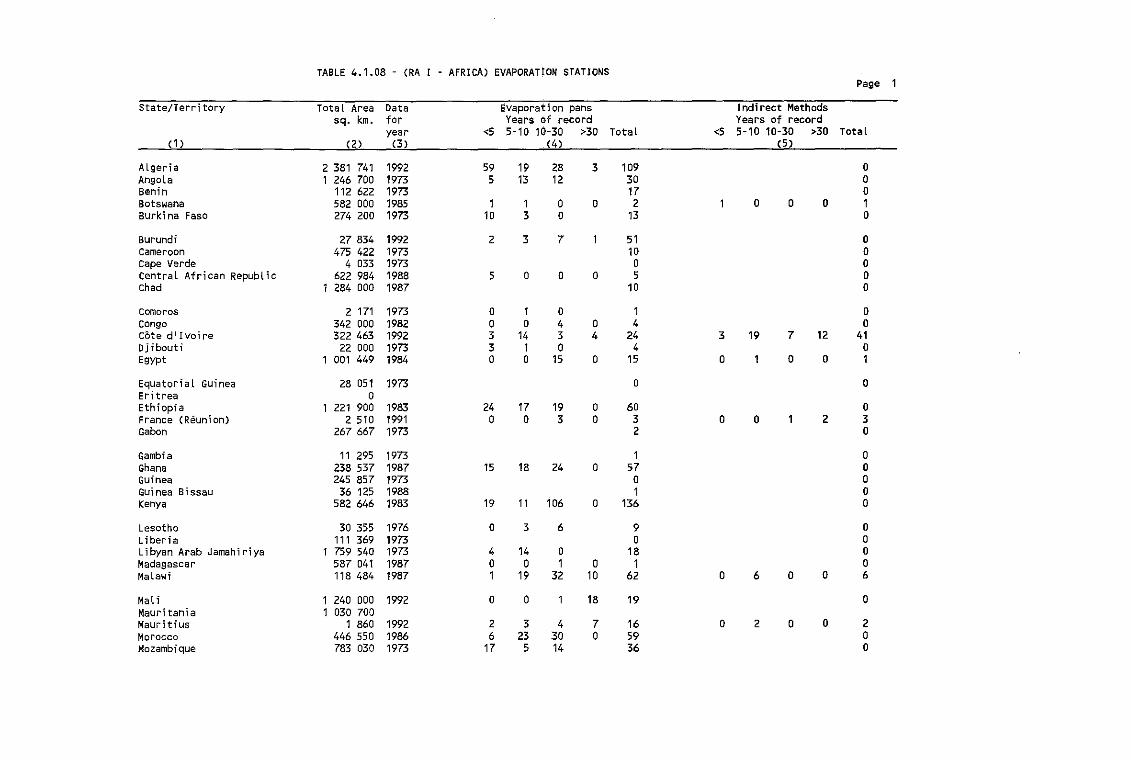
TABLE 4.1.08 - (RA I - AFRICA) EVAPORATION STATIONSPage 1
State/Terri tory Total Area Data Evaporati on pans I ndi reet Methodssq. km. for Years of record Years of record
year <5 5-10 10-30 >30 Total <5 5-10 10-30 >30 Total(1 ) (2) (3) (4) (5)
Algeria 2 381 741 1992 59 19 28 3 109 0Angola 1 246 700 1973 5 13 12 30 0Benin 112 622 1973 17 0Botswana 582 000 1985 1 1 0 0 2 1 0 0 0 1Burkina Faso 274 200 1973 10 3 0 13 0
Burundi 27 834 1992 2 3 7 1 51 0Cameroon 475 422 1973 10 0Cape Verde 4 033 1973 0 0Central African Republic 622 984 1988 5 0 0 0 5 0chad 1 284 000 1987 10 0
Comoros 2 171 1973 0 1 0 1 0congo 342 000 1982 0 0 4 0 4 0cote d'Ivoire 322 463 1992 3 14 3 4 24 3 19 7 12 41Djibouti 22 000 1973 3 1 0 4 0Egypt 1 001 449 1984 0 0 15 0 15 0 1 0 0 1
Equatorial Guinea 28 051 1973 0 0Eritrea 0Ethiopia 1 221 900 1983 24 17 19 0 60 0France (Reunion) 2 510 1991 0 0 3 0 3 0 0 1 2 3Gabon 267 667 1973 2 0
Gambia 11 295 1973 1 0Ghana 238 537 1987 15 18 24 0 57 0Guinea 245 857 1973 0 0Guinea Bissau 36 125 1988 1 0Kenya 582 646 1983 19 11 106 0 136 0
Lesotho 30 355 1976 0 3 6 9 0liberia 111 369 1973 0 0Libyan Arab Jamahiriya 1 759 540 1973 4 14 0 18 0Madagascar 587 041 1987 0 0 1 0 1 0Malawi 118 484 1987 1 19 32 10 62 0 6 0 0 6
Mali 1 240 000 1992 0 0 1 18 19 0Mauritania 1 030 700Mauritius 1 860 1992 2 3 4 7 16 0 2 0 0 2Morocco 446 550 1986 6 23 30 0 59 0Mozambique 783 030 1973 17 5 14 36 0
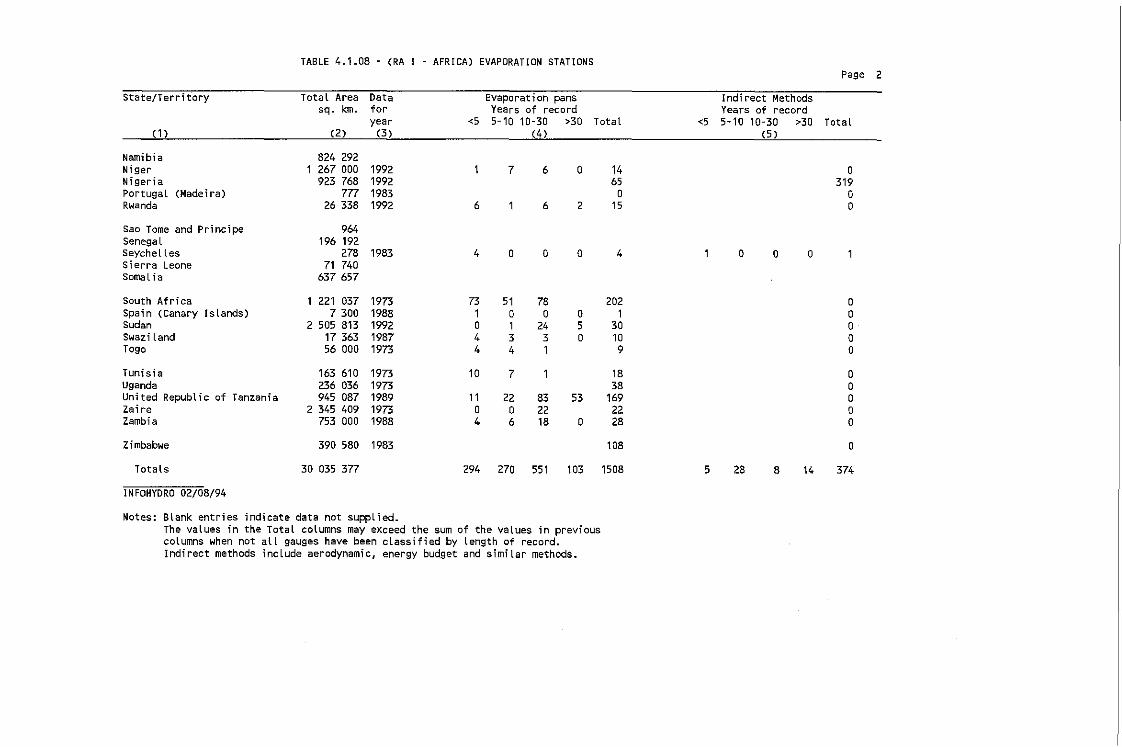
TABLE 4.1.08 - (RA I - AFRICA) EVAPORATION STATIONSPage 2
State/Territory Total Area Data Evaporation pans Indi reet Methodssq. km. for Years of record Years of record
year <5 5-10 10-30 >30 Total <5 5-10 10-30 >30 TotaL(1 ) (2) (3 ) (4 ) (5 )
Namibia 824 292Niger 1 267 000 1992 1 7 6 a 14 aNigeria 923 768 1992 65 319Portugal (Madeira) 777 1983 a aRwanda 26 338 1992 6 1 6 2 15 0
Sao Tome and Principe 964SenegaL 196 192Seychelles 278 1983 4 a 0 0 4 1 a 0 aSierra Leone 71 740Somal ia 637 657
South Afri ca 1 221 037 1973 73 51 78 202 aSpain (Canary IsLands) 7 300 1988 1 a a a 1 aSudan 2 505 813 1992 a 1 24 5 30 aSwazi land 17 363 1987 4 3 3 a 10 0Togo 56 000 1973 4 4 1 9 0
Tunisia 163 610 1973 10 7 1 18 aUganda 236 036 1973 38 aUnited Republic of Tanzania 945 087 1989 11 22 83 53 169 aZaire 2 345 409 1973 a a 22 22 aZambia 753 000 1988 4 6 18 a 28 0
Zimbabwe 390 580 1983 108 a
Totals 30 035 3n 294 270 551 103 1508 5 28 8 14 374
INFOHYDRO 02/08/94
Notes: Blank entries indicate data not supplied.The values in the Total columns may exceed the sum of the vaLues in previouscoLumns when not all gauges have been cLassified by length of record.Indirect methods include aerodynamic, energy budget and similar methods.
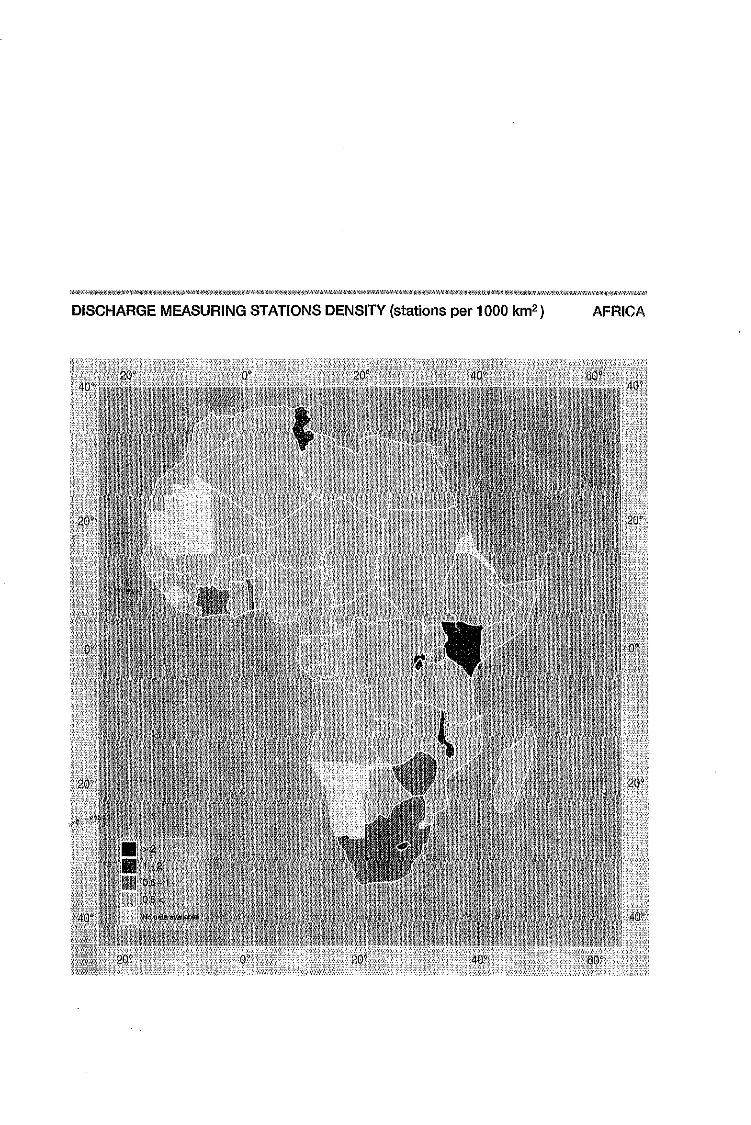
DISCHARGE MEASURING STATIONS DENSITY (stations per 1000 km2 ) AFRICA

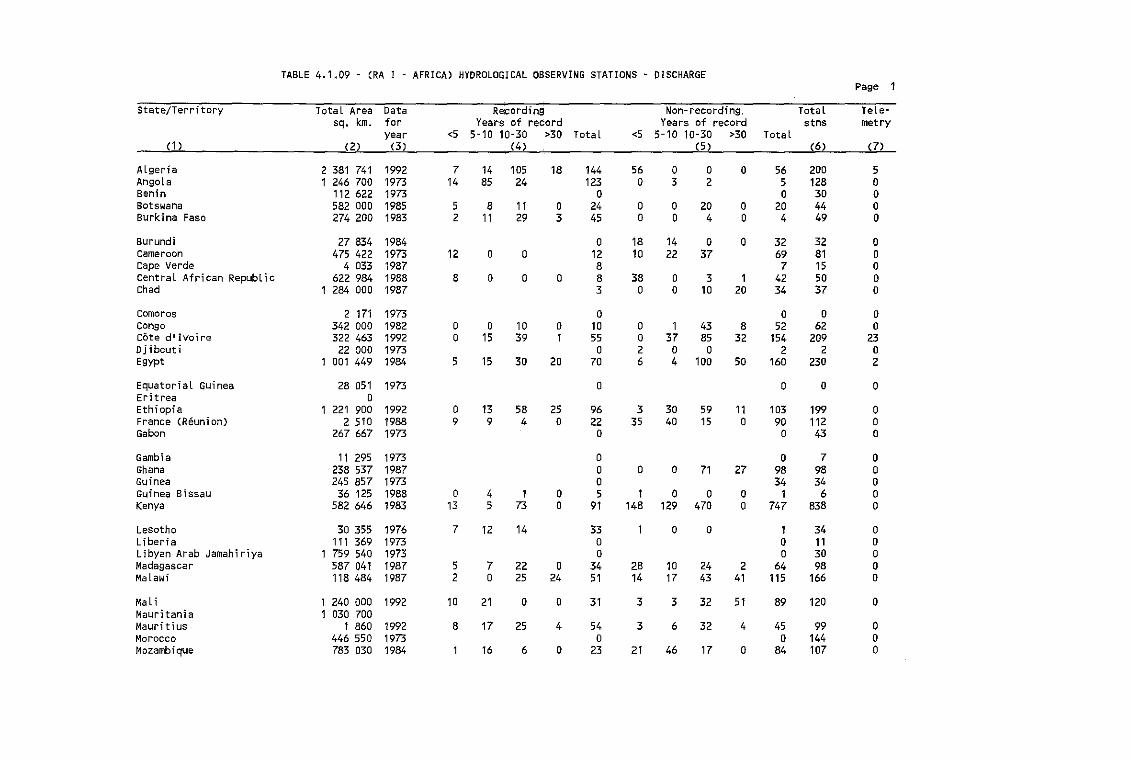
TABLE 4.1.09 - (RA I - AFRICA) HYDROLOGICAL OBSERVING STATIONS DISCHARGEPage 1
State/Territory Total Area --Data Recording Non-recording, Total Tele-sq. km. for Years of record Years of record stns metry
year <5 5-10 10-30 >30 Total <5 5-10 10-30 >30 Total(1 ) (2) (3) (4) (5 ) (6) (7)
Algeria 2 381 741 1992 7 14 105 18 144 56 0 0 0 56 200 5Angol a 1 246 700 1973 14 85 24 123 0 3 2 5 128 0Benin 112 622 1973 0 0 30 0Botswana 582 000 1985 5 8 11 0 24 0 0 20 0 20 44 0BiJrkina Faso 274 200 1983 2 11 29 3 45 0 0 4 0 4 49 0
Burundi 27 834 1984 0 18 14 0 0 32 32 0Cameroon 475 422 1973 12 0 0 12 10 22 37 69 81 0Cape Verde 4 033 1987 8 7 15 0Central African Republic 622 984 1988 8 0 0 0 8 38 0 3 1 42 50 0Chad 1 284 000 1987 3 0 0 10 20 34 37 0
Comoros 2 171 1973 0 0 0 0Congo 342 000 1982 0 0 10 0 10 0 1 43 8 52 62 0Cote d l Ivai re 322 463 1992 0 15 39 1 55 0 37 85 32 154 209 23Djibouti 22 000 1973 0 2 0 0 2 2 0Egypt 1 001 449 1984 5 15 30 20 70 6 4 100 50 160 230 2
Equatorial Guinea 28 051 1973 0 0 0 0Erl trea 0Ethiopia 1 221 900 1992 0 13 58 25 96 3 30 59 11 103 199 0France (Reuni on) 2 510 1988 9 9 4 0 22 35 40 15 0 90 112 0Gabon 267 667 1973 0 0 43 0
Gambi a 11 295 1973 0 0 7 0Ghana 238 537 1987 0 0 0 71 27 98 98 0Guinea 245 857 1973 0 34 34 0Guinea Bissau 36 125 1988 0 4 1 0 5 1 0 0 0 1 6 0Kenya 582 646 1983 13 5 73 0 91 148 129 470 0 747 838 0
Lesotho 30 355 1976 7 12 14 33 1 0 0 1 34 0Liberia 111 369 1973 0 0 11 0Libyan Arab Jamahiriya 1 759 540 1973 0 0 30 0Madagascar 587 041 1987 5 7 22 0 34 28 10 24 2 64 98 0Malawi 118 484 1987 2 0 25 24 51 14 17 43 41 115 166 0
Mali 1 240 000 1992 10 21 0 0 31 3 3 32 51 89 120 0Mauritania 1 030 700Mauritius 1 860 1992 8 17 25 4 54 3 6 32 4 45 99 0Morocco 446 550 1973 0 0 144 0Mozambique 783 030 1984 1 16 6 0 23 21 46 17 0 84 107 0
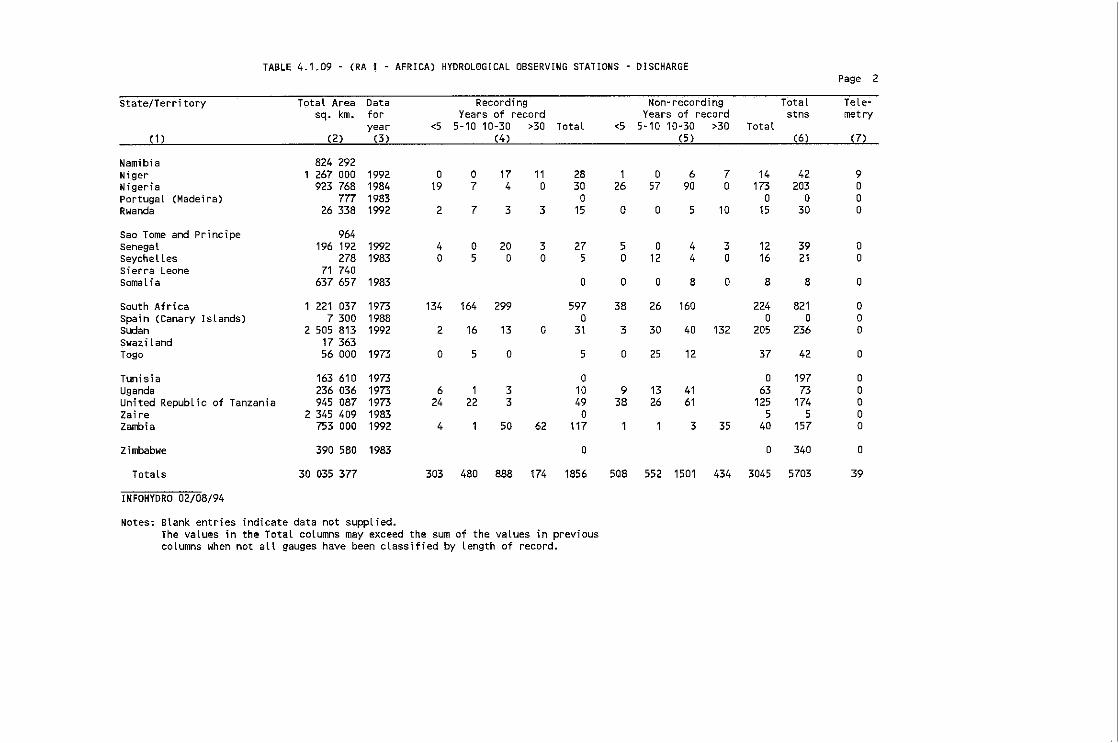
TABLE 4.1.09 - (RA I - AFRICA) HYDROLOGICAL OBSERVING STATIONS DISCHARGEPage 2
State/Territory Total Area Data Recording Non-recording Total Tete':'sq. km. for Years of record Years of record stns metry
year <5 5-10 10-30 >30 TotaL <5 5-10 10-30 >30 Totat
ill (2) (3 ) (4) (5 ) (6) (7)
Namibl a 824 292Niger 1 267 000 1992 a 0 17 11 28 1 a 6 7 14 42 9Nigeria 923 768 1984 19 7 4 a 30 26 57 90 a 173 203 aPortugal (Madeira) 777 1983 a a a aRwanda 26 338 1992 2 7 3 3 15 0 a 5 10 15 30 a
Sao Tome and Principe 964Senegal 196 192 1992 4 a 20 3 27 5 a 4 3 12 39 aSeychet Les 278 1983 0 5 a 0 5 0 12 4 a 16 21 asierra Leone 71 740Somalia 637 657 1983 a 0 a 8 0 8 8 a
South Africa 1 221 037 1973 134 164 299 597 38 26 160 224 821 0spain (Canary Islands) 7 300 1988 0 a a 0Sudan 2 505 813 1992 2 16 13 a 31 3 30 40 132 205 236 0Swaziland 17 363Togo 56 000 1973 0 5 0 5 0 25 12 37 42 a
Tunisia 163 610 1973 a a 197 aUganda 236 036 1973 6 1 3 10 9 13 41 63 73 aUnited Republic of Tanzania 945087 1973 24 22 3 49 38 26 61 125 174 aZaire 2 345 409 1983 0 5 5 0Zambia 753 000 1992 4 1 50 62 117 1 1 3 35 40 157 0
Zimbabwe 390 580 1983 a a 340 a
TotaLs 30 035 377 303 480 888 174 1856 508 552 1501 434 3045 5703 39
INFOHYORO 02/08/94
Notes: Blank entries indicate data not supplied.The values in the Total columns may exceed the sum of the vaLues in previouscoLumns when not aLL gauges have been classified by length of record.
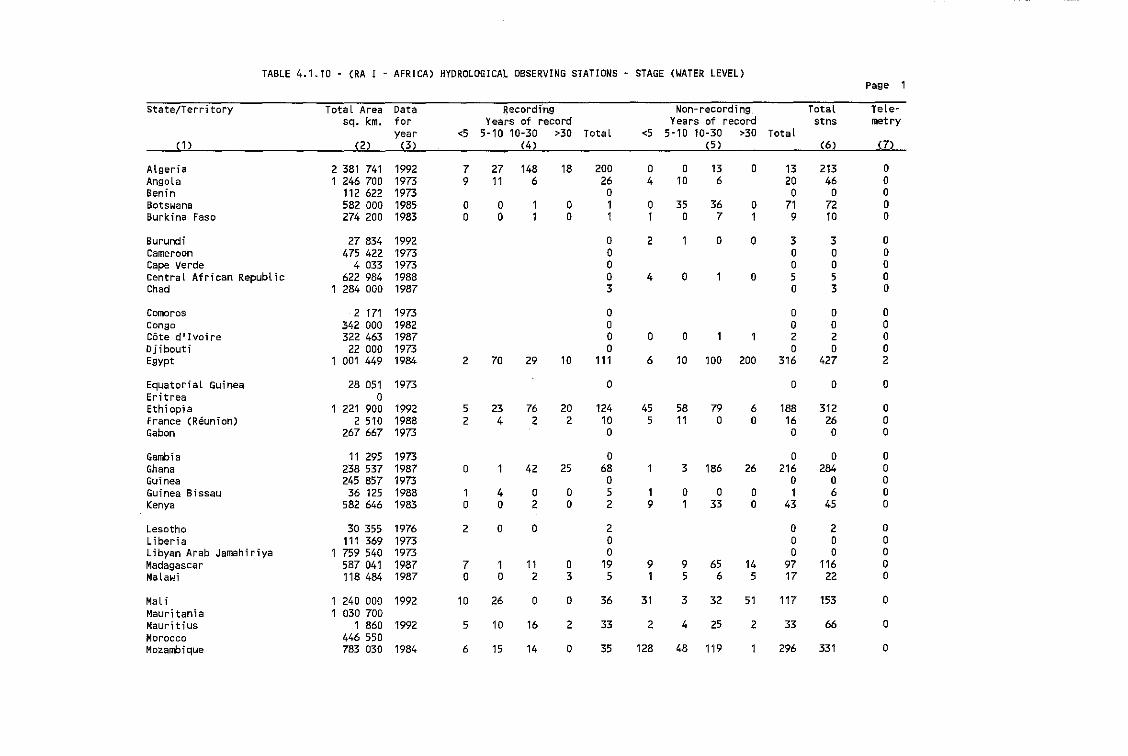
TABLE 4.1.10 - (RA I - AFRICA) HYOROLOGICAL OBSERVING STATIONS - STAGE (WATER LEVEL)Page 1
State/Territory Total Area Data Recording Non-recording. Total Tete'"sq. km. for Years of record Years of record stns metry
year <5 5-10 10-30 >30 Total <5 5-10 10-30 >30 Total(1) (2) (3) (4) (5 ) (6) (7)
Alger'i a 2 381 741 1992 7 27 148 18 200 0 0 13 0 13 213 0AngoLa 1 246 700 1973 9 11 6 26 4 10 6 20 46 0Benin 112 622 1973 0 0 0 0Botswana 582 000 1985 0 0 1 0 1 0 35 36 0 71 72 0Burkina Faso 274 200 1983 0 0 1 0 1 1 0 7 1 9 10 0
Burundi 27 834 1992 0 2 1 0 0 3 3 0Cameroon 475 422 1973 0 0 0 0Cape Verde 4 033 1973 0 0 0 0Central African Republic 622 984 1988 0 4 0 1 0 5 5 0Chad 1 284 000 1987 3 0 3 0
Comoros 2 171 1973 0 0 0 0Congo 342 000 1982 0 0 0 0Cate d J Ivai re 322 463 1987 0 0 0 1 1 2 2 0Djibouti 22 000 1973 0 0 0 0Egypt 1 001 449 1984 2 70 29 10 111 6 10 100 200 316 427 2
Equatorial Guinea 28 051 1973 0 0 0 0Eritrea 0Ethiop18 1 221 900 1992 5 23 76 20 124 45 58 79 6 188 312 0France (Reunion) 2 510 1988 2 4 2 2 10 5 11 0 0 16 26 0Gabon 267 667 1973 0 0 0 0
Gambia 11 295 1973 0 0 0 0Ghana 238 537 1987 0 1 42 25 68 1 3 186 26 216 284 0Guinea 245 857 1973 0 0 0 0Guinea Bissau 36 125 1988 1 4 0 0 5 1 0 0 0 1 6 0Kenya 582 646 1983 0 0 2 0 2 9 1 33 0 43 45 0
Lesotho 30 355 1976 2 0 0 2 0 2 0Liberia 111 369 1973 0 0 0 0Libyan Arab Jamahiriya 1 759 540 1973 0 0 0 0Madagascar 587 041 1987 7 1 11 0 19 9 9 65 14 97 116 0Malawi 118 484 1987 0 0 2 3 5 1 5 6 5 17 22 0
MaL i 1 240 000 1992 10 26 0 0 36 31 3 32 51 117 153 0Mauritania 1 030 700Mauritius 1 860 1992 5 10 16 2 33 2 4 25 2 33 66 0Morocco 446 550Mozambique 783 030 1984 6 15 14 0 35 128 48 119 1 296 331 0
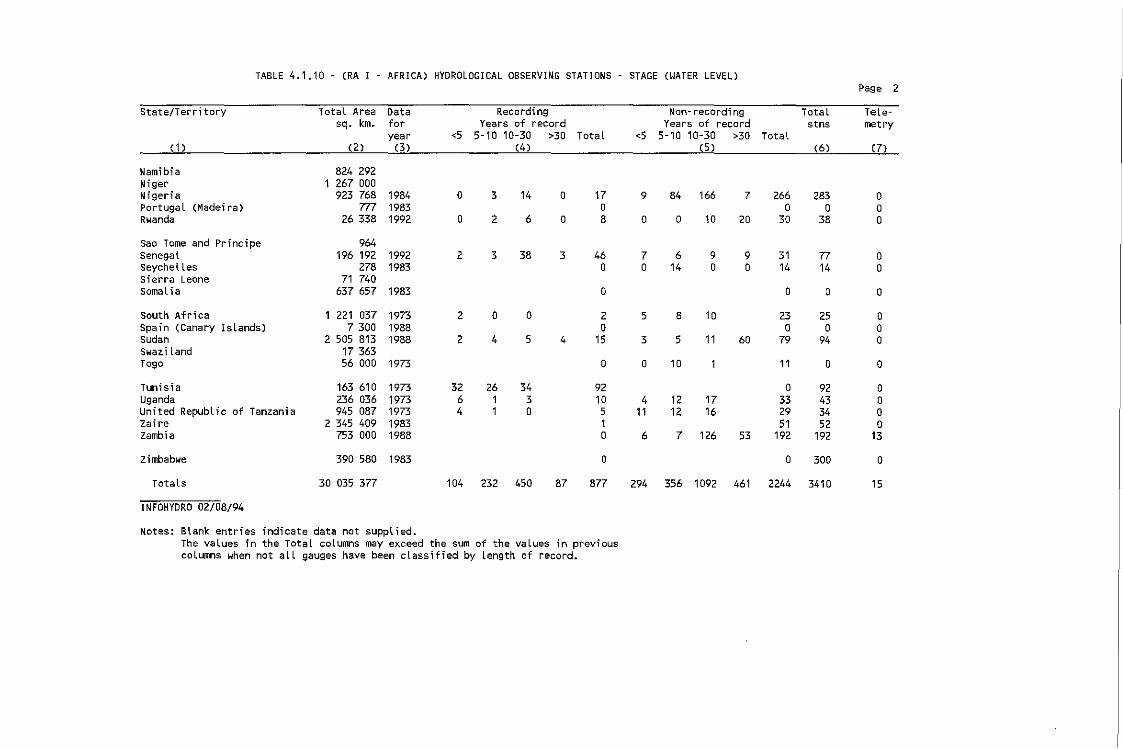
TABLE 4.1.10 - (RA I - AFRICA) HYDROLOGICAL OBSERVING STATIONS - STAGE (WATER LEVEL)Page 2
State/Territory TotaL Area Data Recording NQn~record;ng Total Tele-sq. km. for Years of record Years of record stns metry
year <5 5-10 10-30 >30 Total <5 5-10 10-30 >30 Total(1 ) (2) (3) (4) (5 ) (6) (7)
Namibia 824 292Niger 1 267 000Nigeria 923 768 1984 0 3 14 0 17 9 84 166 7 266 283 0Portugal (Madeira) 777 1983 0 0 0 0Rwanda 26 338 1992 0 2 6 0 8 0 0 10 20 30 38 0
Sao Tome and Principe 964Senegal 196 192 1992 2 3 38 3 46 7 6 9 9 31 77 0Seychelles 278 1983 0 0 14 0 0 14 14 0Sierra Leone 71 740SomaL ia 637 657 1983 0 0 0 0
South Africa 1 221 037 1973 2 0 0 2 5 8 10 23 25 0Spain (Canary Islands) 7 300 1988 0 0 0 0Sudan 2 505 813 1988 2 4 5 4 15 3 5 11 60 79 94 0Swazi land 17 363Togo 56 000 1973 0 0 10 1 11 0 0
Tunisia 163 610 1973 32 26 34 92 0 92 0Uganda 236 036 1973 6 1 3 10 4 12 17 33 43 0United RepubLic of Tanzania 945 087 1973 4 1 0 5 11 12 16 29 34 0Zaire 2 345 409 1983 1 51 52 0Zambia 753 000 1988 0 6 7 126 53 192 192 13
Zimbabwe 390 580 1983 0 0 300 0
Totals 30 035 377 104 232 450 87 877 294 356 1092 461 2244 3410 15
INFOHYDRO 02/08/94
Notes: BLank entries indicate data not supplied.The vaLues in the Total columns may exceed the sum of the vaLues in previouscoLumns when not alL gauges have been classified by length of record.
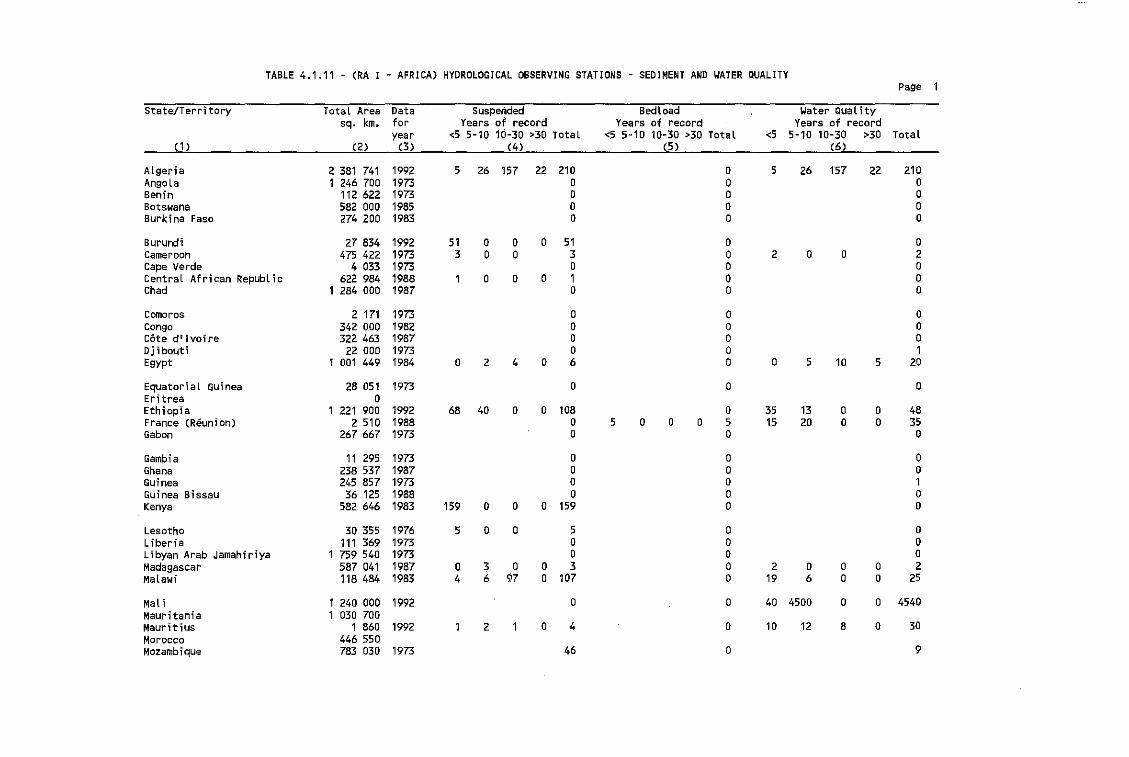
TABLE 4.1.11 - (RA I - AFRICA) HYDROLOGICAL OBSERVING STATIONS SEDIMENT AND WATER QUALITYPage 1
State/Terri tory Total Area Data Suspended Bedload Water Qualitysq. km. for Years of record Years of record Years of record
year <5 5-10 10-30 >30 Total <5 5-10 10-30 >30 Total <5 5-10 10-30 >30 Total(1 ) (2) (3) (4) (5 ) (6)
Algeria 2 381 741 1992 5 26 157 22 210 0 5 26 157 22 210Angola 1 246 700 1973 0 0 0Benin 112 622 1973 0 0 0Botswana 582 000 1985 0 0 0Burkina Faso 274 200 1983 0 0 0
Burundi 27 834 1992 51 0 0 0 51 0 0Cameroon 475 422 1973 3 0 0 3 0 2 0 0 2Cape Verde 4 033 1973 0 0 0Central African Republic 622 984 1988 1 0 0 0 1 0 0Chad 1 284 000 1987 0 0 0
Comoros 2 171 1973 0 0 0Congo 342 000 1982 0 0 0Cote d ' Ivai re 322 463 1987 0 0 0Djibouti 22 000 1973 0 0 1Egypt 1 001 449 1984 0 2 4 0 6 0 0 5 10 5 20
Equatorial Guinea 28 051 1973 0 0 0Erit'rea 0Ethiopia 1 221 900 1992 68 40 0 0 108 0 35 13 0 0 48France (Reunion) 2 510 1988 0 5 0 0 0 5 15 20 0 0 35Gabon 267 667 1973 0 0 0
Gambia 11 295 1973 0 0 0Ghana 238 537 1987 0 0 0Guinea 245 857 1973 0 0 1Guinea Bissau 36 125 1988 0 0 0Kenya 582 646 1983 159 0 0 0 159 0 0
Lesotho 30 355 1976 5 0 0 5 0 0Liberia 111 369 1973 0 0 0Llbyan Arab Jamahiriya 1 759 540 1973 0 0 0Madagascar 587 041 1987 0 3 0 0 3 0 2 0 0 0 2Malawi 118 484 1983 4 6 97 0 107 0 19 6 0 0 25
Mal i 1 240 000 1992 0 0 40 4500 0 0 4540Mauritania 1 030 700Mauritius 1 860 1992 1 2 1 0 4 0 10 12 8 0 30Morocco 446 550Mozambique 783 030 1973 46 0 9
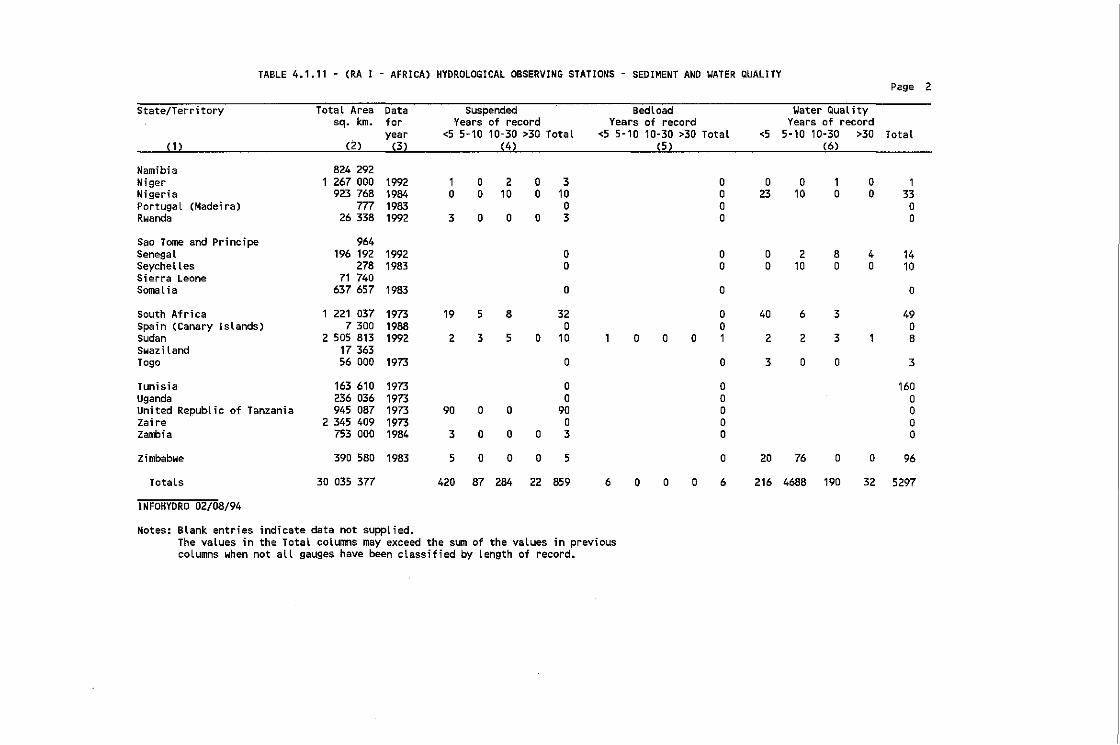
TABLE 4.1.11 - (RA I - AFRICA) HYDROLOGICAL OBSERVING STATIONS SEDIMENT AND WATER QUALITYPage 2
State/Ter~itory Total Area Data Suspended Bedload Water Qualitysq. km. for Years of record Years of record Years of record
year <5 5-10 10-30 >30 Total <5 5-10 10-30 >30 Total <5 5·10 10-30 >30 Total(1 ) (2) (3) (4) (5 ) (6)
Namibia 824 292Niger 1 267 000 1992 1 0 2 0 3 0 0 0 1 0 1Nigeria 923 768 1984 0 0 10 0 10 0 23 10 0 0 33PortugaL (Madeira) 777 1983 0 0 0Rwanda 26 338 1992 3 0 0 0 3 0 0
Sao Tome and Principe 964Senegal 196 192 1992 0 0 0 2 8 4 14Seychelles 278 1983 0 0 0 10 0 0 10Sierra Leone 71 740Somal is 637 657 1983 0 0 0
South Africa 1 221 037 1973 19 5 8 32 0 40 6 3 49Spain (Canary Islands) 7 300 1988 0 0 0Sudan 2 505 813 1992 2 3 5 0 10 1 0 0 0 1 2 2 3 1 8Swaziland 17 363Togo 56 000 1973 0 0 3 0 0 3
Tunisia 163 610 1973 0 0 160Uganda 236 036 1973 0 0 0Un; ted Republ i c of Tanzan; a 945 087 1973 90 0 0 90 0 0Zaire 2 345 409 1973 0 0 0Zambia 753 000 1984 3 0 0 0 3 0 0
Zimbabwe 39D 580 1983 5 0 0 0 5 0 20 76 0 0 96
Totals 30 035 377 420 87 284 22 859 6 0 0 0 6 216 4688 190 32 5297
INFOHYDRO 02/08/94
Notes: Blank entries indicate data not supplied.The values in the Total columns may exceed the sum of the values in previouscolumns when not all gauges have been classified by length of record.
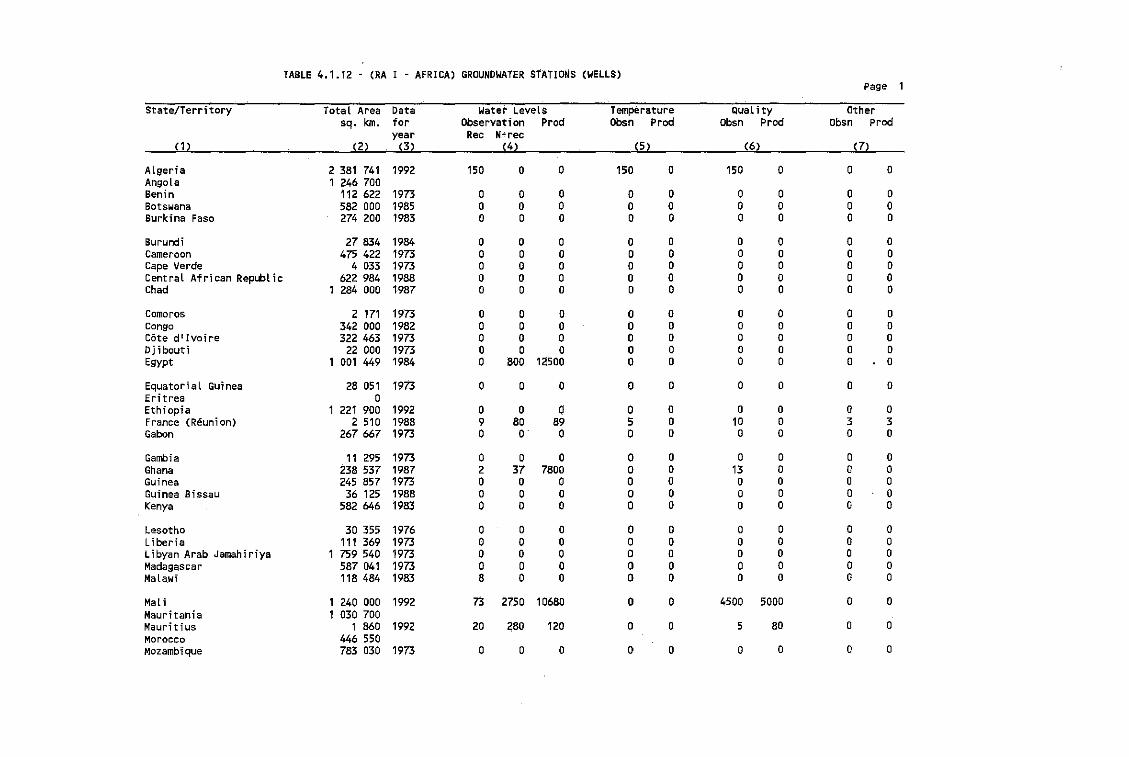
TABLE 4.1.12 - (RA I - AFRICA) GROUNDWATER STATIONS (WELLS)Page 1
State/Territory Total -Area Data Water Levels Tem!=,erature Quality Othersq. km. for Observation Prod Obsn Prod obsn Prod Obsn prod
year Rec N-rec( 1) (2) (3) (4) (5 ) (6) (7)
Algeria 2 381 741 1992 150 0 0 150 0 150 0 0 0Angola 1 246 700Benin 112622 1973 0 0 0 0 0 0 0 0 0Botswana 582 000 1985 0 0 0 0 0 0 0 0 0Burkina Faso 274 200 1983 0 0 0 0 0 0 0 0 0
Burundi 27 834 1984 0 0 0 0 0 0 0 0 0Cameroon 475 422 1973 0 0 0 0 0 0 0 0 0Cape Verde 4 033 1973 0 0 0 0 0 0 0 0 0Central African RepLbl ic 622 984 1988 0 0 0 0 0 0 0 0 0Chad 1 284 000 1987 0 0 0 0 0 0 0 0 0
Comoros 2 171 1973 0 0 0 0 0 0 0 0 0Congo 342 000 1982 0 0 0 0 0 0 0 0 0Cote dIIvo;r-e 322 463 1973 0 0 0 0 0 0 0 0 0Djibouti 22 000 1973 0 0 0 0 0 0 0 0 0Egypt 1 001 449 1984 0 800 12500 0 0 0 0 0 0
Equatorial Guinea 28 051 1973 0 0 0 0 0 0 0 0 0Eritrea 0Ethiopia 1 221 900 1992 0 0 a 0 0 0 0 0 0France (Reunion) 2 510 1988 9 80 B9 5 0 10 0 3 3Gabon 267 667 1973 0 O· 0 0 0 0 0 0 0
Gambia 11 295 1973 0 0 0 0 0 0 0 0 0Ghana 238 537 1987 2 37 7800 0 0 13 0 0 0Guinea 245 857 1973 0 0 0 0 0 0 0 0 0Guinea Bissau 36 125 1988 0 0 0 0 0 0 0 0 0Kenya 582 646 1983 0 0 0 0 0 0 0 0 0
Lesotho 30 355 1976 0 0 0 0 0 0 0 0 0Liberia 111 369 1973 0 0 0 0 0 0 0 0 0Libyan Arab Jamahiriya 1 759 540 1973 0 0 0 0 0 0 0 0 0Madagascar 587 041 1973 0 0 0 0 0 0 0 0 0MaLawi 118 484 1983 8 0 0 0 0 0 0 0 0
Mali 1 240 000 1992 73 2750 10680 0 0 4500 5000 0 0Mauritania 1 030 700Mauritius 1 860 1992 20 280 120 0 0 5 80 0 0Morocco 446 550Mozambique 783 030 1973 0 0 0 0 0 0 0 0 0
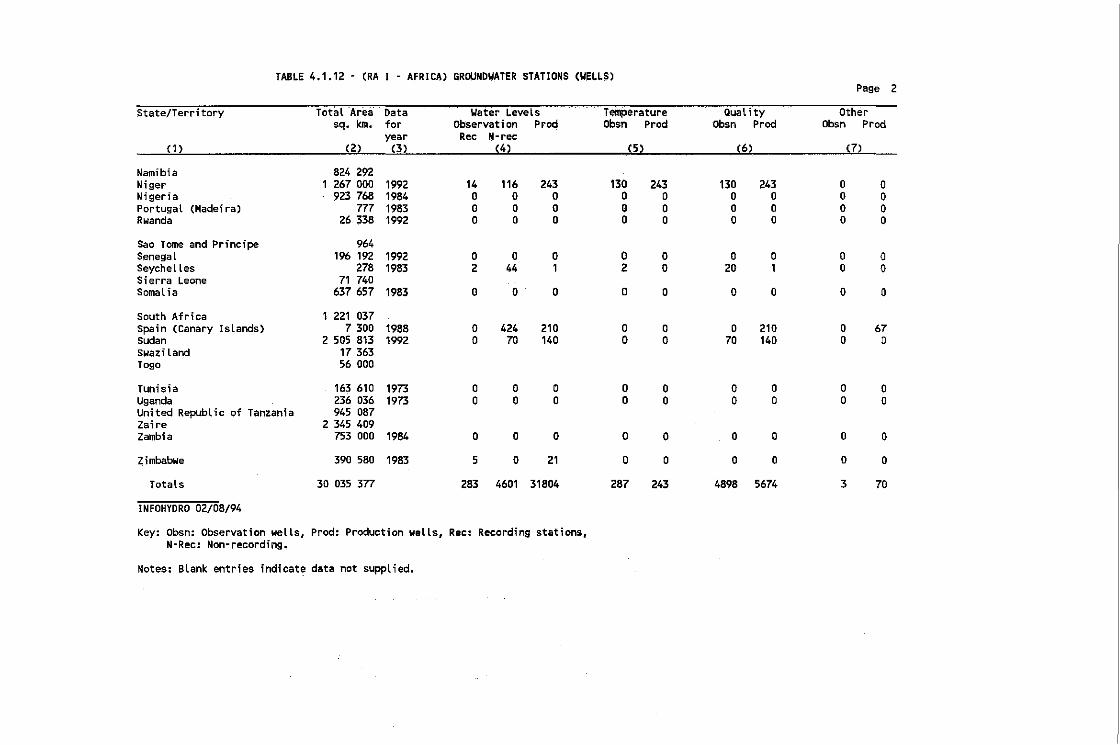
TABLE 4.1.12 - (RA I - AFRICA) GROUNDWATER STATIONS (WELLS)Page 2
State/Territory TotaL -Area- Data Water Levels TemPerature Quat ity Othersq~ km. for Observation Prod Obsn Prod Obsn Prod Obsn Prod
year Rec N-rec(1 ) (2) (3) (4) (5 ) (6) (7)
Namibia B24 292Niger 1 267 000 1992 14 116 243 130 243 130 243 0 0Nigeria 923 768 1984 0 0 0 0 0 0 0 0 0Portugal (Madeira) 777 1983 0 0 0 0 0 0 0 0 0Rwanda 26338 1992 0 0 0 0 0 0 0 0 0
Sao Tome and Principe 964Senegal 196 192 1992 0 0 0 0 0 0 0 0 0Seychelles 278 1983 2 44 1 Z 0 20 1 0 0Sierra Leone 71 740Somalia 637 657 1983 0 0 0 0 0 0 0 0 0
South Africa 1 221 037Spain (Canary Islands) 7 300 1988 0 424 210 0 0 0 210 0 67Sudan 2 505 813 1992 0 70 140 0 0 70 140 0 0swaziland 17363Togo 56 000
Tunisia 163 610 1973 0 0 0 0 0 0 0 0 0Uganda 236 036 1973 0 0 0 0 0 0 0 0 0United Republic of Tanzania 945 087Zaire 2 345 409Zambia 753 000 1984 0 0 0 0 0 0 0 0 0
Zimbabwe 390 580 1983 5 0 21 0 0 0 0 0 0
Totals 30 035 377 283 4601 31804 287 243 4898 5674 3 70
INFOHYORO 02/08/94
Key: Obsn: Observation wells, Prod: Production wells, Rec: Recording stations,N-Rec: Non-recording.
Notes: Blank entries indicat~ data not suppLied.
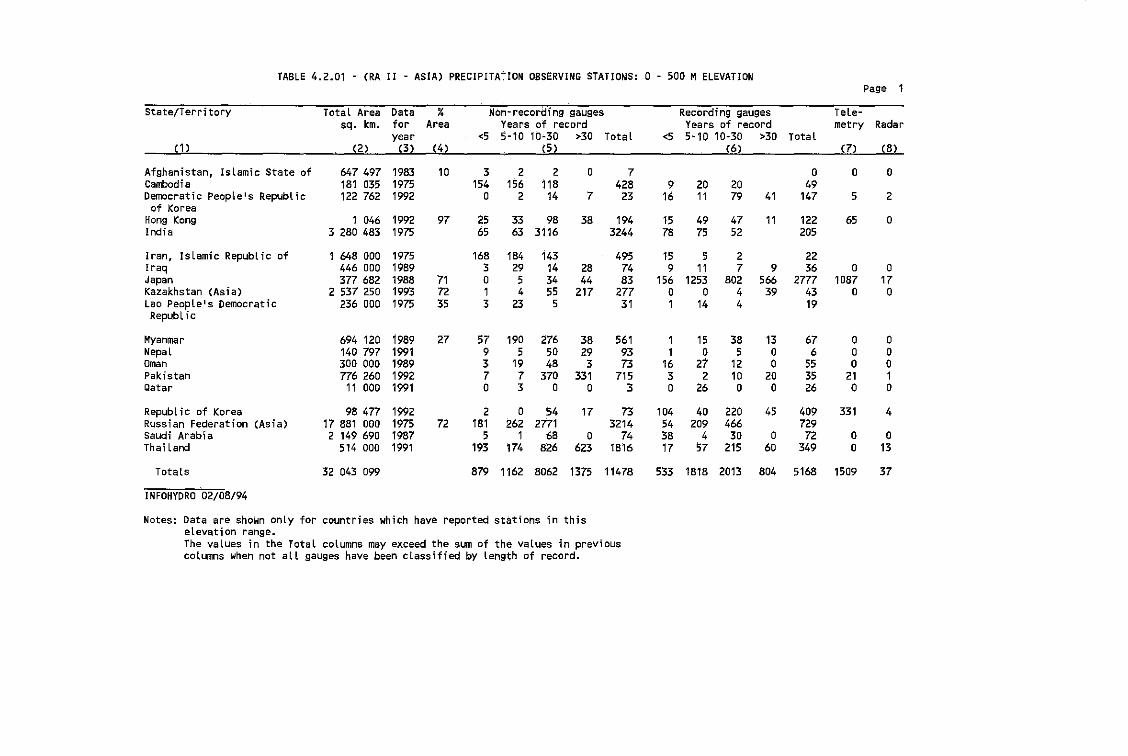
TABLE 4.2.01 - (RA II - ASIA) PRECIPITATION OBSERVING STATIONS: 0 - 500 MELEVATIONPage 1
State/Territory-
Total Area Data % Nom·recording gauges Recording gauges Tele-sq. km. for Area Years of record Yea rs of record metry Radar
year <5 5-10 10"30 >30 Total <5 5-10 10-30 >30 Totat(1 ) (2) (3) (4) (5 ) (6) (7) (8)
Afghanistan, Islamic State of 647497 1983 10 3 2 2 0 7 0 0 0Cambodia 181 035 1975 154 156 118 428 9 20 20 49Democratic Peoptels Republic 122 762 1992 0 2 14 7 23 16 11 79 41 147 5 2
of KoreaHong Kong 1 046 1992 97 25 33 98 38 194 15 49 47 11 122 65 0India 3 280 483 1975 65 63 3116 3244 78 75 52 205
Iran, Islamic Republic of 1 648 000 1975 168 184 143 495 15 5 2 22Iraq 446 000 1989 3 29 14 28 74 9 11 7 9 36 0 0Japan 377 682 1988 71 0 5 34 44 83 156 1253 802 566 2777 1087 17Kazakhstan (Asia) 2 537 250 1993 72 1 4 55 217 277 0 0 4 39 43 0 0Lao People's Democratic 236 000 1975 35 3 23 5 31 1 14 4 19RepubL ic
Myanmar 694 120 1989 27 57 190 276 38 561 1 15 38 13 67 0 0Nepal 140 797 1991 9 5 50 29 93 1 0 5 0 6 0 0Oman 300 000 1989 3 19 48 3 73 16 27 12 0 55 0 0Pakistan 776 260 1992 7 7 370 331 715 3 2 10 20 35 21 1Qatar 11 000 1991 a 3 0 0 3 0 26 0 a 26 a 0
Republic of Korea 98477 1992 2 0 ~54 17 73 104 40 220 45 409 331 4Russian Federation (Asia) 17 881 000 1975 72 181 262 2771 3214 54 209 466 729Saudi Arabi a 2 149 690 1987 5 1 68 a 74 38 4 30 0 72 0 0ThaTland 514 000 1991 193 174 826 623 1816 17 57 215 60 349 0 13
Totals 32 043 099 879 1J62 8062 1375 11478 533 1818 2013 804 5168 1509 37
INFOHYORO 02/08/94
Notes: Data are shown only for countries which have reported stations in thiselevation range.The values in the Total columns may exceed the sum of the values in previouscolumns when not all gauges have been classified by length of record.

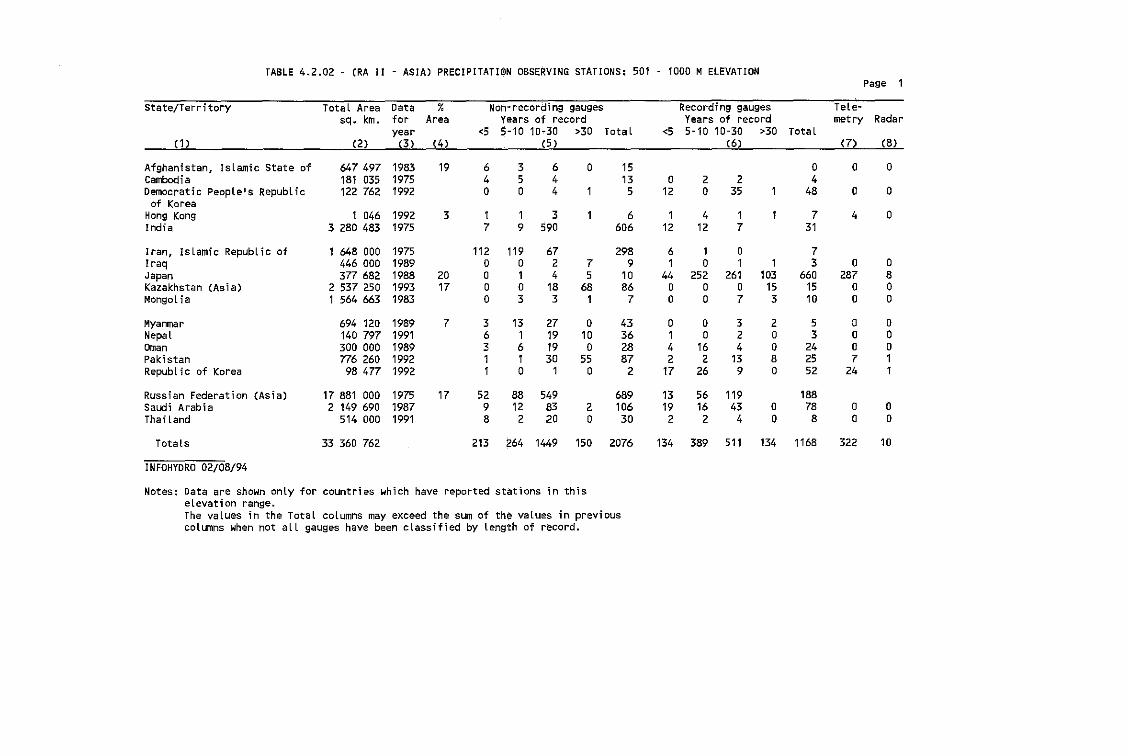
TABLE 4.2.02 - (RA II - ASIA) PRECIPITATION OBSERVING STATIONS: 501 - 1000 MELEVATIONPage 1
State/Territory TotaL Area Data % Nom-recording gauges Recording gauges Tele-sq. km. for Area Years of record Years of record metry Radar
year <5 5-10 10,30 >30 Total <5 5-10 10-30 >30 Total(1) (2) (3 ) (4) (5 ) (6) (7) (8)
Afghanistan, Islamic State of 647 497 1983 19 6 3 6 0 15 0 0 0Cambodia 181 035 1975 4 5 4 13 0 2 2 4Democratic People's Republic 122 762 1992 0 0 4 1 5 12 0 35 1 48 0 0
of KoreaHong Kong 1 046 1992 3 1 1 3 1 6 1 4 1 1 7 4 0India 3 280 483 1975 7 9 590 606 12 12 7 31
Iran, Islamic Republic of 1 648 000 1975 112 119 67 298 6 1 0 7Iraq 446 000 1989 0 0 2 7 9 1 0 1 1 3 0 0Japan 377 682 1988 20 0 1 4 5 10 44 252 261 103 660 287 8Kazakhstan (Asia) 2 537 250 1993 17 0 0 18 68 86 0 0 0 15 15 0 0Mongol ia 1 564 663 1983 0 3 3 1 7 0 0 7 3 10 0 0
Myanmar 694 120 1989 7 3 13 27 0 43 0 0 3 2 5 0 0Nepal 140 797 1991 6 1 19 10 36 1 0 2 0 3 0 0Oman 300 000 1989 3 6 19 0 28 4 16 4 0 24 0 0Pakistan 776 260 1992 1 1 30 55 87 2 2 13 8 25 7 1Republic of Korea 98 477 1992 1 0 1 0 2 17 26 9 0 52 24 1
Russian Federation (Asia) 17 881 000 1975 17 52 88 549 689 13 56 119 188Saudi Arabia 2 149 690 1987 9 12 83 2 106 19 16 43 0 78 0 0Thai land 514 000 1991 8 2 20 0 30 2 2 4 0 8 0 0
Totals 33 360 762 213 264 1449 150 2076 134 389 511 134 1168 322 10
INFOHYDRO 02/08/94
Notes: Data are shown onLy for countries which have reported statlons in thiselevation range.The vaLues in the Total columns may exceed the sum of th~ values in previouscolumns when not all gauges have been classified by length of record.

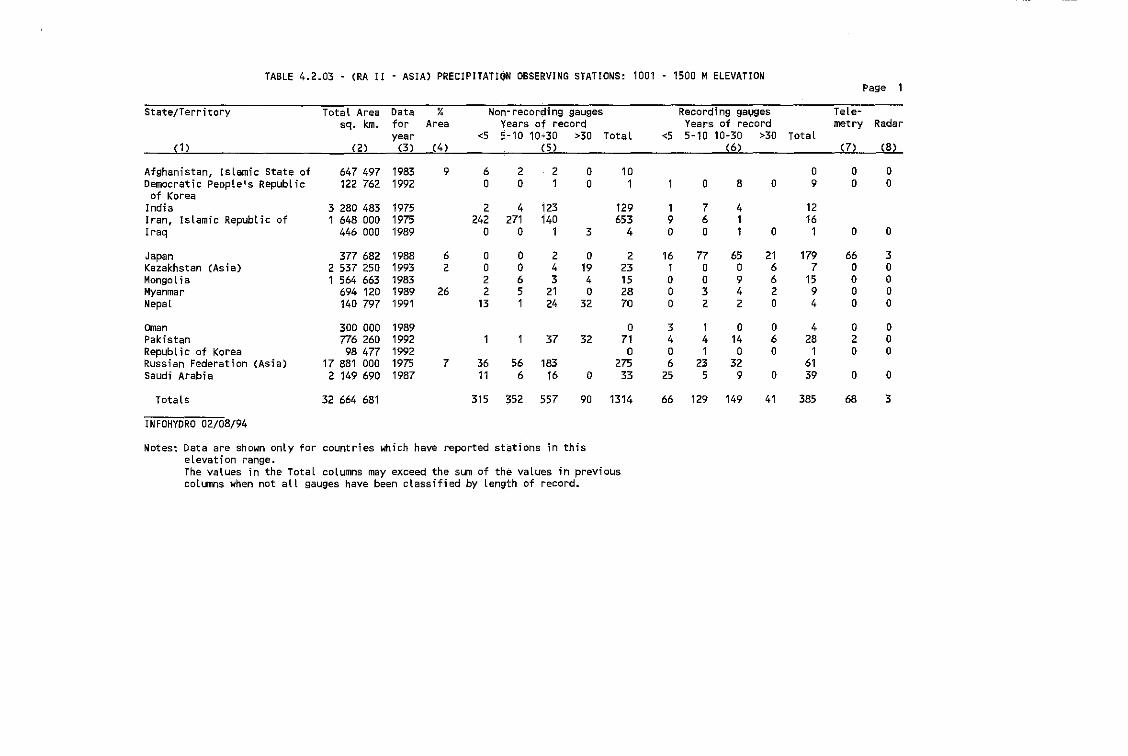
TABLE 4.2.03 - (RA II - ASIA) PRECIPITATION OBSERVING STATIONS: 1001 - 1500 M ELEVATIONPage 1
State/Territory Total Area Data % Non-recording gauges Recording gal,lges Tele-sq. km. for Area Years of record Years of record metry Radar
year <5 5-10 10.30 >30 Total <5 5-10 10-30 >30 TotaL(1 ) (2) (3 ) (4 ) (5 ) (6) (7) (8)
Afghanistan, IsLamic State of 647 497 1983 9 6 2 2 0 10 0 0 0Democratic People's Republic 122 762 1992 0 0 1 0 1 1 0 8 0 9 0 0of Korea
Jndia 3 280 483 1975 2 4 123 129 1 7 4 12Iran, Islamic Republic of 1 648 000 1975 242 271 140 653 9 6 1 16Iraq 446 000 1989 0 0 1 3 4 0 0 1 0 1 0 0
Japan 377 682 1988 6 0 0 2 0 2 16 77 65 21 179 66 3Kazakhstan (Asia) 2 537 250 1993 2 0 0 4 19 23 1 0 0 6 7 0 0Mongol ia 1 564 663 1983 2 6 3 4 15 0 0 9 6 15 0 0Myanmar 694 120 1989 26 2 5 21 0 28 0 3 4 2 9 0 0Nepal 140 797 1991 13 1 24 32 70 0 2 2 0 4 0 0
Oman 300 000 1989 0 3 1 0 0 4 0 0Pakistan 776 260 1992 1 1 37 32 71 4 4 14 6 28 2 0Republic of Korea 98477 1992 0 0 1 0 0 1 0 0Russian Federation (Asia) 17 881 000 1975 7 36 56 183 275 6 23 32 61Saudi Arabia 2 149 690 1987 11 6 16 0 33 25 5 9 0 39 0 0
Totals 32 664 681 315 352 5~57 90 1314 66 129 149 41 385 68 3
INFOHYORO 02/08/94
Notes: Data are shown only for countries which have reported stations in thiselevation range.The values in the Total columns may exceed the sum of the values 1n previouscolumns when not all gauges have been classified by length of record.

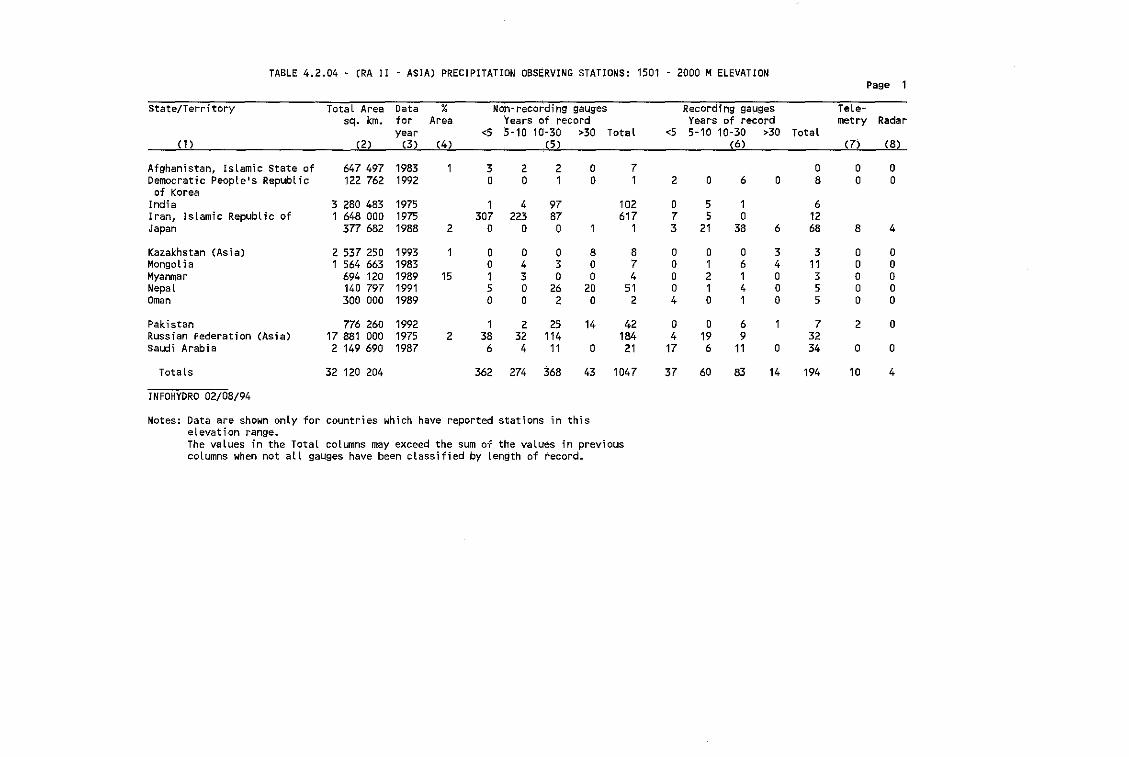
TABLE 4.2.04 - (RA II - ASIA) PRECIPITATIiON OBSERVING STATIONS: 1501 - 2000 M ELEVATIONPage 1
State/Territory Total Area Data % Non-recording gauges Recording ga\Jges Tele-sq. km. for Area Years of record Yea rs of record metry Radar
year <5 5-10 10-30 >30 Total <5 5-10 10-30 >30 Total(1 ) (2) (3) (4) (5 ) (6) (7) (8)
Afghanistan, Islamic State of 647 497 1983 1 3 2 2 0 7 0 0 0Democratic People's Republic 122 762 1992 0 0 1 0 1 2 0 6 0 8 0 0
of KoreaIndia 3 280 483 1975 1 4 97 102 0 5 1 6Iran, Islamic Republic of 1 648 000 1975 307 223 87 617 7 5 0 12Japan 377 682 1988 2 0 0 0 1 1 3 21 38 6 68 8 4
Kazakhstan (Asia) 2 537 250 1993 1 0 0 0 8 8 0 0 0 3 3 0 0Mongol ia 1 564 663 1983 0 4 3 0 7 0 1 6 4 11 0 0Myanmar 694 120 1989 15 1 3 0 0 4 0 2 1 0 3 0 0Nepal 140 797 1991 5 0 26 20 51 0 1 4 0 5 0 0Oman 300 000 1989 0 0 2 0 2 4 0 1 0 5 0 0
Pakistan 776 260 1992 1 2 25 14 42 0 0 6 1 7 2 0Russian Federation (Asia) 17 881 000 1975 2 38 32 114 184 4 19 9 32Saudi Arabia 2 149 690 1987 6 4 11 0 21 17 6 11 0 34 0 0
Totals 32 120 204 362 274 368 43 1047 37 60 83 14 194 10 4
INFOHYORO 02/08/94
Notes: Data are shown only for countries which have reported stations in thiselevation range.The vaLues in the Total columns may exceed the sum of the values in previouscolumns when not all gauges have been cLassified by Length of record.

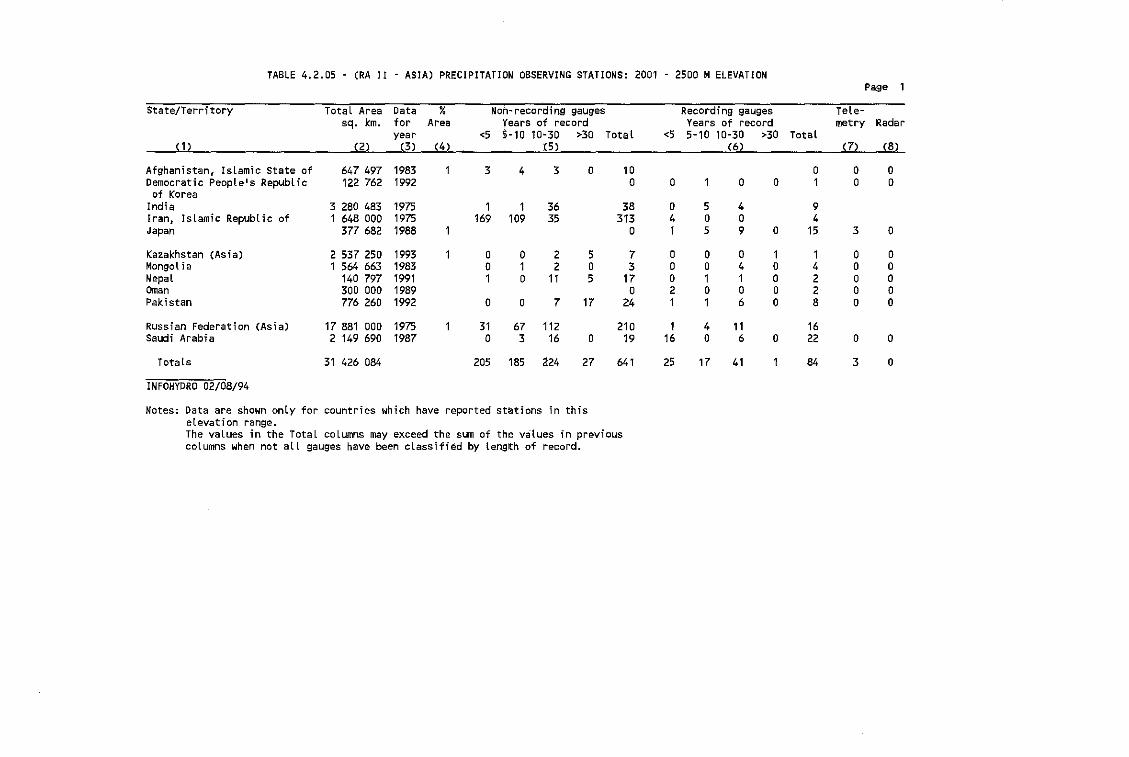
TABLE 4.2.05 - (RA II - ASIA) PRECIPITATION OBSERVING STATIONS: 2001 - 2500 MELEVATIONPage 1
State/Territory TotaL Area Data % Non-recording gauges Recording gauges Tele-sq. km. for Area Years of record Years of record metry R.adar
year <5 5-10 10"30 >30 Total <5 5-10 10-30 >30 Total(1 ) (2) (3) (4) (5 ) (6) (7) (8)
Afghanistan, Islamic State of 647 497 1983 1 3 4 3 0 10 0 0 0Democratic People's Republic 122 762 1992 0 0 1 0 0 1 0 0
of KoreaIndia 3 280 483 1975 1 1 36 38 0 5 4 9Iran, Islamic Republic of 1 648 000 1975 169 109 35 313 4 0 0 4Japan 377 682 1988 1 0 1 5 9 0 15 3 0
Kazakhstan (Asia) 2 537 250 1993 1 0 0 2 5 7 0 0 0 1 1 0 0Mongolia 1 564 663 1983 0 1 2 0 3 0 0 4 0 4 0 0Nepal 140 797 1991 1 0 11 5 17 0 1 1 0 2 0 0Oman 300 000 1989 0 2 0 0 0 2 0 0Pakistan n6260 1992 0 0 7 17 24 1 1 6 0 8 0 0
Russian Federation (Asia) 17 881 000 1975 1 31 67 112 210 1 4 11 16Saudi Arabia 2 149 690 1987 0 3 16 0 19 16 0 6 0 22 0 0
Totals 31 426 084 205 185 224 27 641 25 17 41 1 84 3 0
INFOHYORO 02/08/94
Notes: Data are shown only for countries which have reported stations in thiselevation range.The values in the Total columns may exceed the sum of the values in previouscolumns when not all gauges have been classified by length of record.

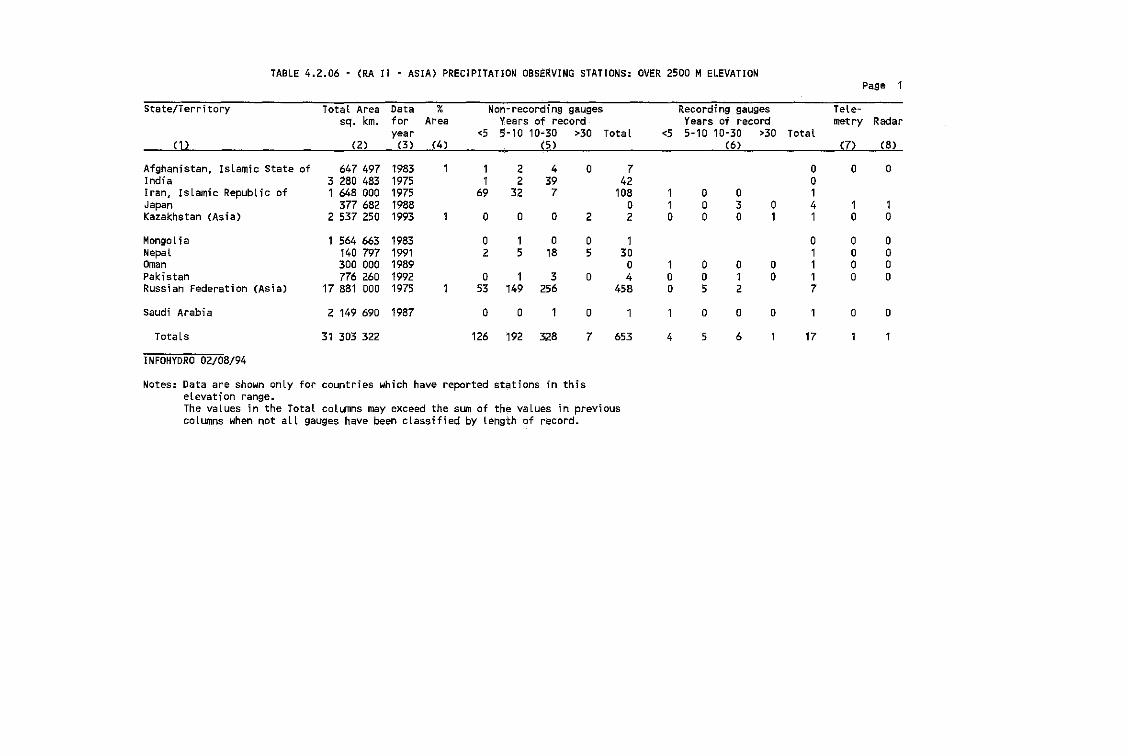
TABLE 4.2.06 - (RA II - ASIA) PRECIPITATION OBSERVING STATIONS: OVER 2500 M ELEVATIONPage 1
State/Territory Total Area Data % Non·recording gauges Recordi ng gauges Tete-sq. km. for Area Years of record Years of record metry Radar
year <5 5-10 10"30 >30 Total <5 5-10 10-30 >30 Total(1 ) (2) (3 ) (4) (5 ) (6) C7l (8)
Afghanistan, Islamic State of 647 497 1983 1 1 2 4 0 7 0 0 0India 3 280 483 1975 1 2 39 42 0Iran, Islamic Republic of 1 648 GOO 1975 69 32 7 108 1 0 0 1Japan 377 682 1988 0 1 0 3 0 4 1 1Kazakhstan (Asia) 2 537 250 1993 1 0 0 0 2 2 0 0 0 1 1 0 0
Mongol ia 1 564 663 1983 0 1 0 0 1 0 0 0Nepal 140 797 1991 2 5 18 5 30 1 0 0Oman 300 000 1989 0 1 0 0 0 1 0 0Pakistan 776 260 1992 0 1 3 0 4 0 0 1 0 1 0 0Russian Federation (Asia) 17 881 000 1975 1 53 149 256 458 0 5 2 7
Saudi Arabi a 2 149 690 1987 0 0 1 0 1 1 0 0 0 1 0 0
Totals 31 303 322 126 192 328 7 653 4 5 6 1 17
INFOHYDRO 02/08/94
Notes: Data are shown onLy for countries which have reported stations in thiselevation range.The values in the Total columns may exceed the sum of the values in previouscolumns when not alL gauges have been classified by length of record.

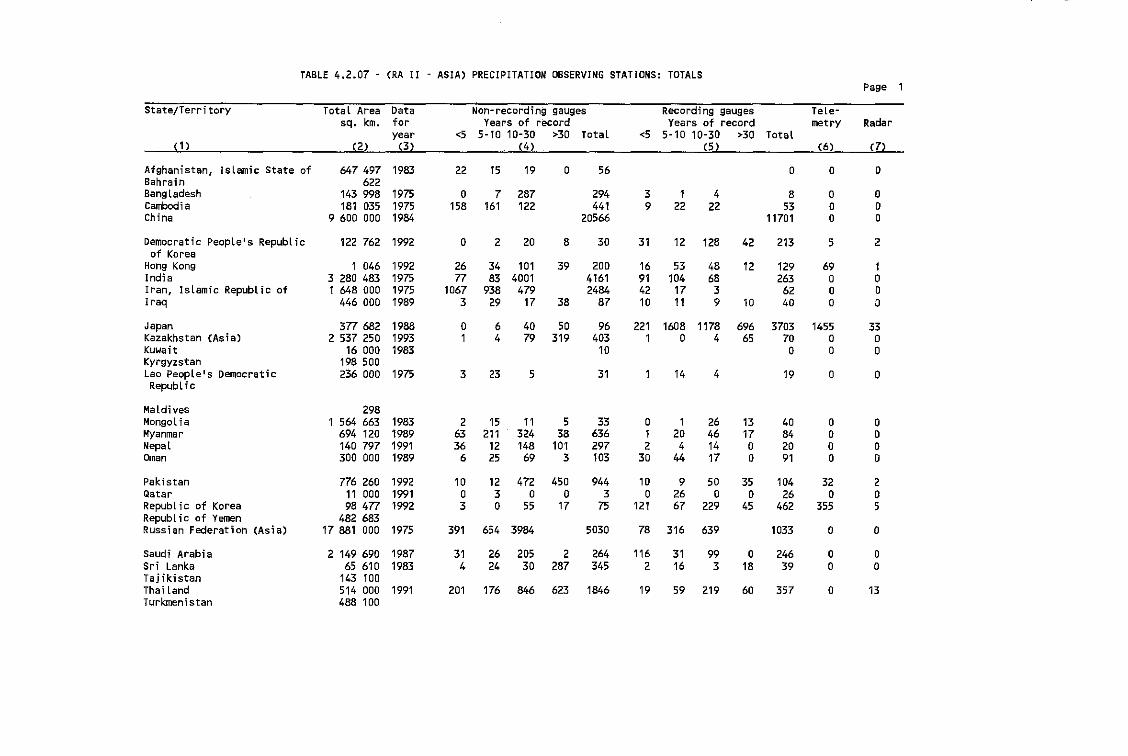
TABLE 4.2.07 - (RA II - ASIA) PRECIPITATION OBSERVING STATIONS: TOTALSPage
State/Territory Total Area Data Non-recording gauges Recording gauges Tele-sq. km. for Years of record Years of record metry Radar
year <5 5-10 10-30 >30 Total <5 5-10 10-30 >30 Total(1 ) (2) (3) (4) (5 ) (6) (7)
Afghanistan, Islamic State of 647 497 1983 22 15 19 0 56 0 0 0Bahrain 622Bangladesh 143 998 1975 0 7 287 294 3 1 4 B 0 0Cambodia 181 035 1975 158 161 122 441 9 22 22 53 0 0China 9 600 000 1984 20566 11701 0 0
Democratic People's RepubLic 122 762 1992 0 2 20 8 30 31 12 128 42 213 5 2of Korea
Hong Kong 1 046 1992 26 34 101 39 200 16 53 48 12 129 69 1India 3 280 483 1975 77 83 4001 4161 91 104 68 263 0 0Iran, Islamic Republic of 1 648 000 1975 1067 938 479 2484 42 17 3 62 0 0Iraq 446 000 1989 3 29 17 38 87 10 11 9 10 40 0 0
Japan 377 682 1988 0 6 40 50 96 221 1608 1178 696 3703 1455 33Kazakhstan (Asia) 2 537 250 1993 1 4 79 319 403 1 0 4 65 70 0 0Kuwait 16 000 1983 10 0 0 0Kyrgyzstan 198 500Lao PeopLe's Democratic 236 000 1975 3 23 5 31 1 14 4 19 0 0Republ ic
Maldives 298Mongol ia 1 564 663 1983 2 15 11 5 33 0 1 26 13 40 0 0Myanmar 694 120 1989 63 211 324 38 636 1 20 46 17 84 0 0Nepal 140 797 1991 36 12 148 101 297 2 4 14 0 20 0 0Oman 300 000 1989 6 25 69 3 103 30 44 17 0 91 0 0
Pakistan 776 260 1992 10 12 472 450 944 10 9 50 35 104 32 2Qatar 11 000 1991 0 3 0 0 3 0 26 0 0 26 0 0Republic of Korea 98477 1992 3 0 55 17 75 121 67 229 45 462 355 5Republic of Yemen 482 683Russian Federation (Asia) 17 881 000 1975 391 654 3984 5030 78 316 639 1033 0 0
Saudi Arabia 2 149 690 1987 31 26 205 2 264 116 31 99 0 246 0 0Sri Lanka 65 610 1983 4 24 30 287 345 2 16 3 18 39 0 0Tajik.istan 143 100Thai land 514 000 1991 201 176 846 623 1846 19 59 219 60 357 0 13Turkmenistan 488 100
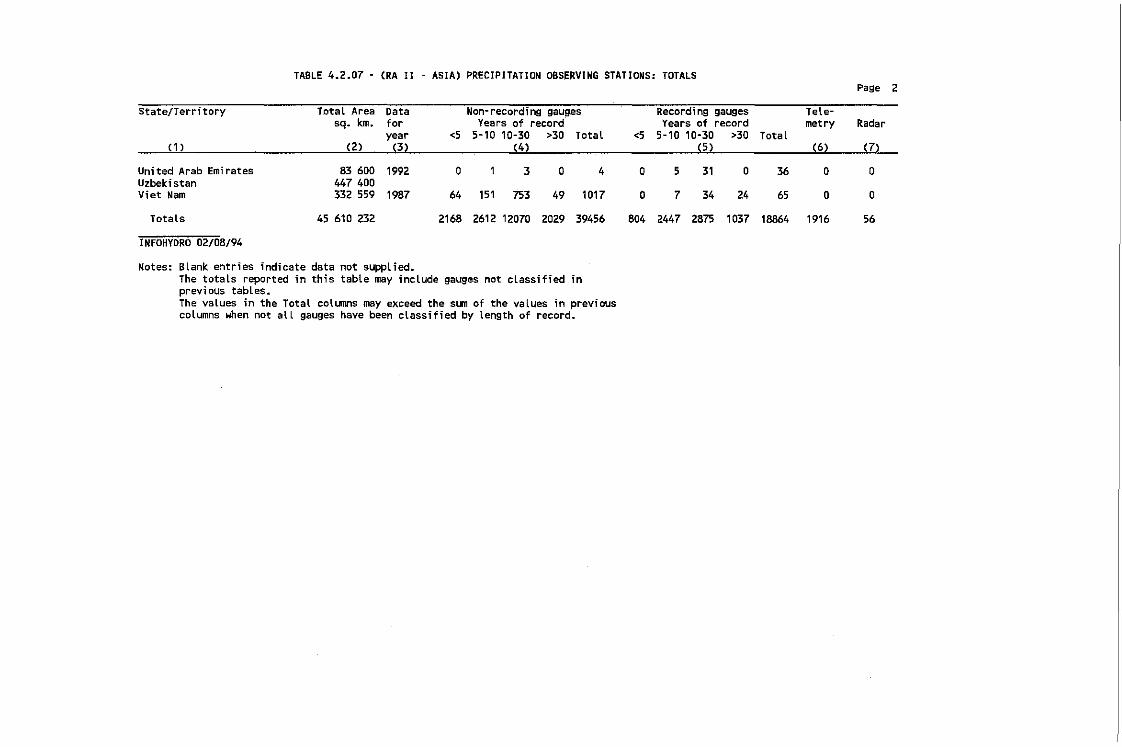
TABLE 4.2.07 - (RA II • ASIA) PRECIPITATION OBSERVING STATIONS: TOTALSPage 2
State/Territory Total Area Data Non~recording!9au!ges -Recording gauges Tele-sq. km. for Years of record Vears of record metry Radar
year <5 5-10 10-30 >30 Total <5 5-10 10-30 >30 TotaL(1 ) (2) (3) (4) (5) (6) (7)
United Arab Emirates B3600 1992 0 1 3 0 4 0 5 31 0 36 0 0Uzbekistan 447 400Viet Nam 332 559 19B7 64 151 753 49 1017 0 7 34 24 65 0 0
Totals 45 610 232 216B 2612 12070 2029 39456 B04 2447 2875 1037 18864 1916 56
INFOHYDRO 02/08/94
Notes: Blank entries indicate data not supplied.The totals reported in this table may include gauges not classified inprevious tables.The values in the Total columns may exceed the sum of the values in previouscolumns when not all gauges have been classified by length of record.
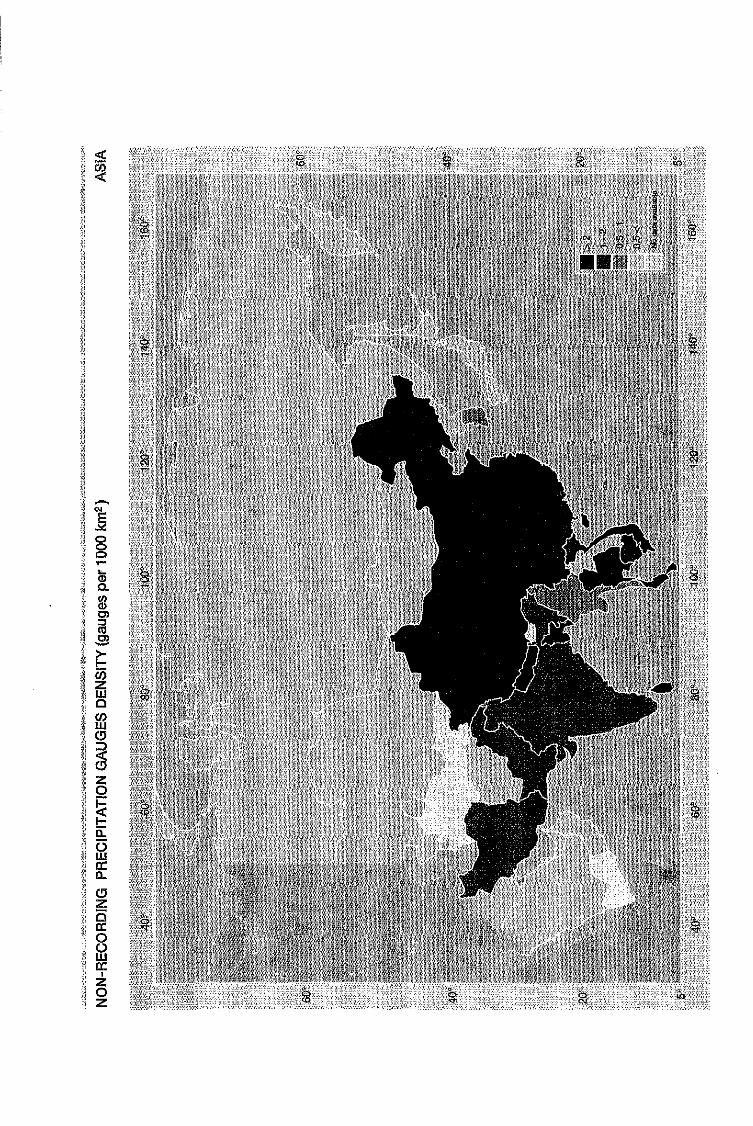

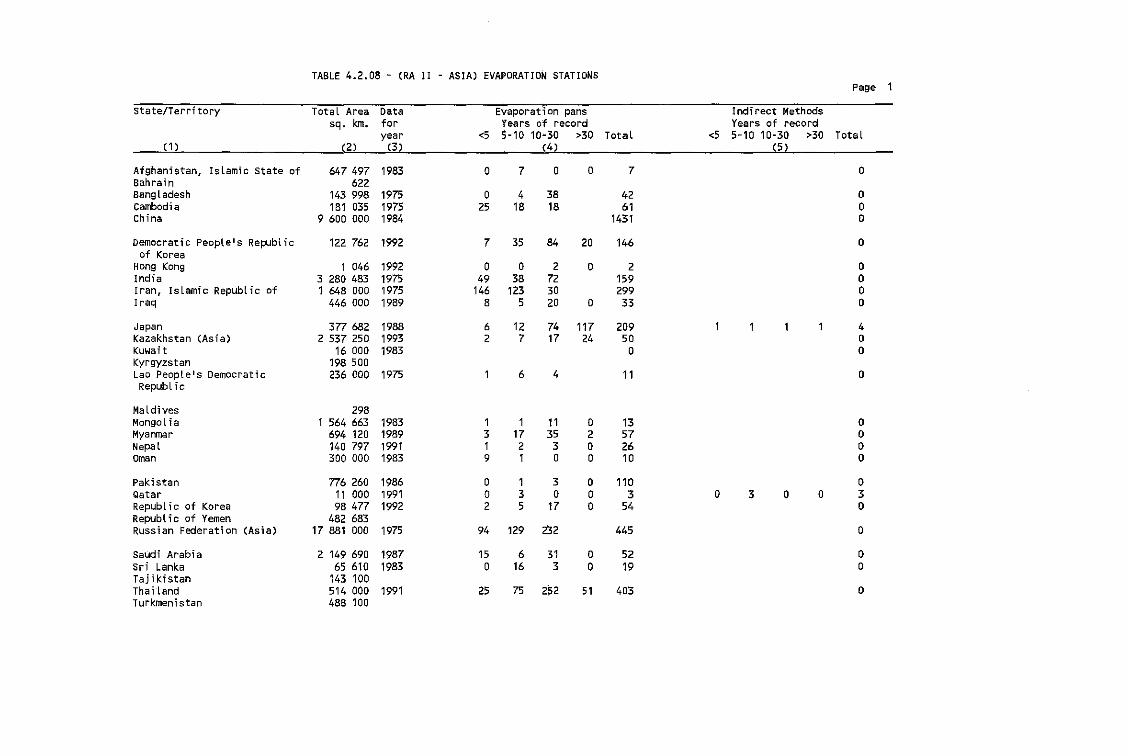
TABLE 4.2.0B - (RA II - ASIA) EVAPORATION STATIONSPage 1
state/Territory TotaL Area Data Evaporati on pans Jndi reet Methodssq. km. for Years of record Years of record
year <5 5-10 10·30 >30 Total <5 5-10 10-30 >30 Total(1 ) (2) (3 ) (4) (5 )
Afghanistan, Islamic State of 647 497 1983 0 7 0 0 7 0Bahrain 622Bangladesh 143 998 1975 0 4 38 42 0Cambodia 181 035 1975 25 18 18 61 0China 9 600 000 1984 1431 0
Democratic People's Republic 122 762 1992 7 35 84 20 146 0of Korea
Hong Kong 1 046 1992 0 0 2 0 2 0India 3 280 483 1975 49 38 72 159 0Iran, Islamic Republic of 1 648 000 1975 146 123 30 299 0Iraq 446 000 1989 8 5 20 0 33 0
Japan 377 682 1988 6 12 74 117 209 1 1 1 1 4Kazakhstan (Asia) 2 537 250 1993 2 7 17 24 50 0Kuwait 16 000 1983 0 0Kyrgyzstan 198 500Lao People's Democratic 236 000 1975 1 6 4 11 0Republic
MaLdives 298Mongol ia 1 564 663 1983 1 1 11 0 13 0Myanmar 694 120 1989 3 17 35 2 57 0Nepal 140 797 1991 1 2 3 0 26 0Oman 300 000 1983 9 1 0 0 10 0
Pakistan 776 260 1986 0 1 3 0 110 0Qatar 11 000 1991 0 3 0 0 3 0 3 0 0 3Republic of Korea 98 477 1992 2 5 17 0 54 0Republic of Yemen 482 683Russian Federation (Asia) 17 881 000 1975 94 129 232 445 0
Saudi Arabi a 2 149 690 1987 15 6 31 0 52 0Sri Lanka 65 610 1983 0 16 3 0 19 0Tajikistan 143 100Thailand 514 000 1991 25 75 252 51 403 0Turkmenistan 488 100
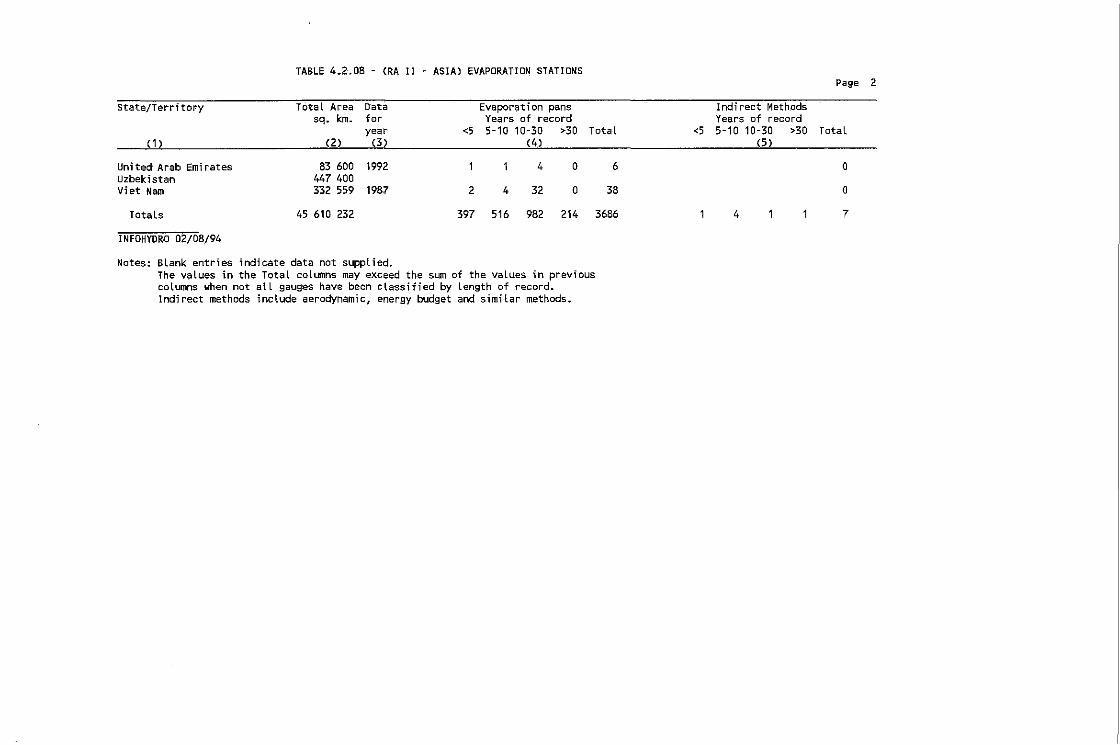
Indirect MethodsYears of record
<5 5-10 10-30 >30 Total(5 )
TABLE 4.2.08 - (RA II - ASIA) EVAPORATION STATIONS
State/Territory Total Area Data Evaporation panssq. km. for Years of record
year <5 5-10 10-30 >30 Tota·t(1 ) (2) (3 ) (4)
United' Arab Emirates 83 600 1992 1 1 4 0 6Uzbekistan 447 400Vi et 'Nam 332 559 1987 2 4 32 0 38
Totals 45 610 232 397 516 982 214 3686
INFOHYORO 02/08/94
Notes.: Blank entries indicate data not suppl ied.The values in the Total cotLftllns may exceed the- sum of the values in previouscolumns when not all gaug~es have been classified by length of record.Indirect methods incLude aerodynamic, energy budget and similar methods.
4
Page 2
o
o
7
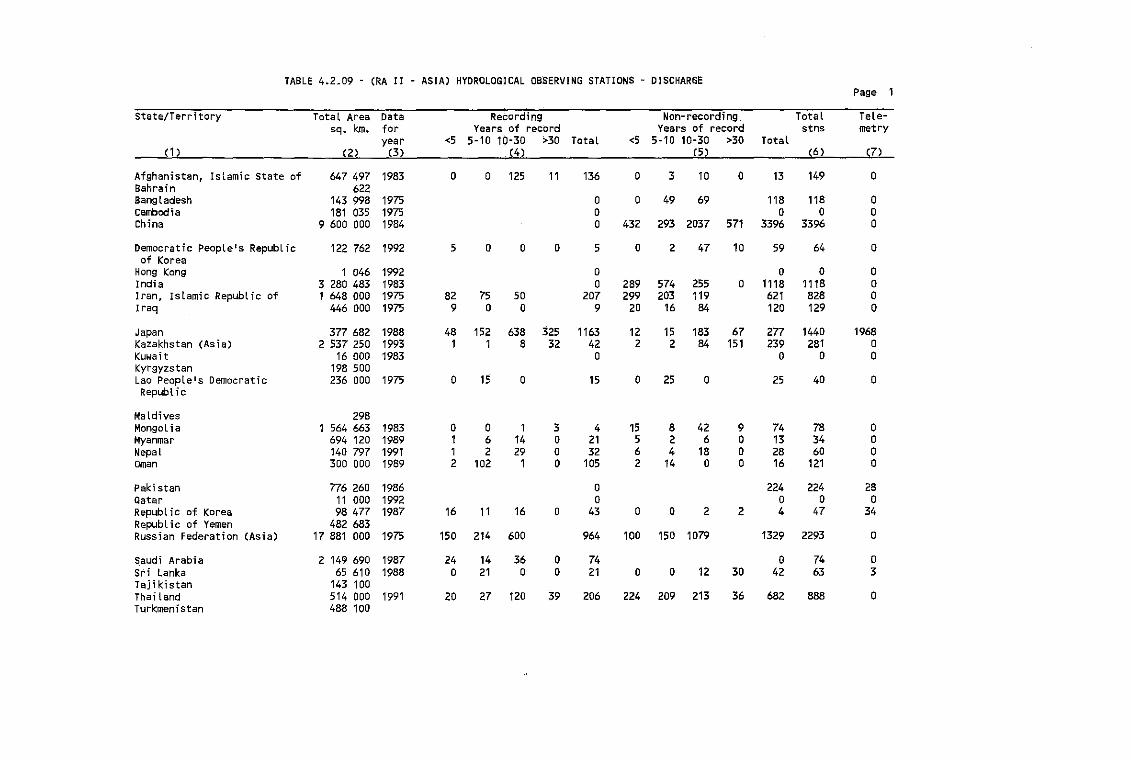
TABLE 4.2.09 - (RA II - ASIA) HYOROLOGjCAL OBSERVING STATIONS DISCHARGEPage 1
State/Territory Total Area Data Recording Non-recording. Total Tele-sq. km. for Years of record Years of record stns metry
year <5 5-10 10-30 >30 TotaL <5 5-10 10-30 >30 Total(1) (2) (3) (4) (5 ) (6) (7)
Afghanistan, Islamic State of 647 497 1983 0 0 125 11 136 0 3 10 0 13 149 0Bahrain 622Bangladesh 143 998 1975 0 0 49 69 118 118 0cambodia 181 035 1975 0 0 0 0China 9 600 000 1984 0 432 293 2037 571 3396 3396 0
Democratic PeopLe's RepubLic 122 762 1992 5 0 0 0 5 0 2 47 10 59 64 0of Korea
Hong Kong 1 046 1992 0 0 0 0India 3 280 483 1983 0 289 574 255 0 1118 1118 0Iran, Islamic Republic of 1 648 000 1975 82 75 50 207 299 203 119 621 828 0Iraq 446 000 1975 9 0 0 9 20 16 84 120 129 0
Japan 377 682 1988 48 152 638 325 1163 12 15 183 67 277 1440 1968Kazakhstan (Asia) 2 537 250 1993 1 1 8 32 42 2 2 84 151 239 281 0Kuwait 16 000 1983 0 0 0 0Kyrgyzstan 198 500Lao People's Democratic 236 000 1975 0 lS 0 15 0 25 0 25 40 0Republic
Maldives 298Mongol ia 1 564 663 1983 0 0 1 3 4 15 8 42 9 74 78 0Myanmar 694 120 1989 1 6 14 0 21 5 2 6 0 13 34 0Nepal 140 797 1991 1 2 29 0 32 6 4 18 0 28 60 0Oman 300 000 1989 2 102 1 0 105 2 14 0 0 16 121 0
Paki stan 776 260 1986 0 224 224 28Qatar 11 000 1992 0 0 0 0Republic of Korea 98477 1987 16 11 16 0 43 0 0 2 2 4 47 34RepubLic of Yemen 482 683Russian Federation (Asia) 17 881 000 1975 150 214 600 964 100 150 1079 1329 2293 0
Saudi Arabia 2 149 690 1987 24 14 36 0 74 0 74 0Sri lanka 65 610 1988 0 21 0 0 21 0 0 12 30 42 63 3Tajikistan 143 100Thai land 514 000 1991 20 27 120 39 206 224 209 213 36 682 888 0Turkmenistan 488 100
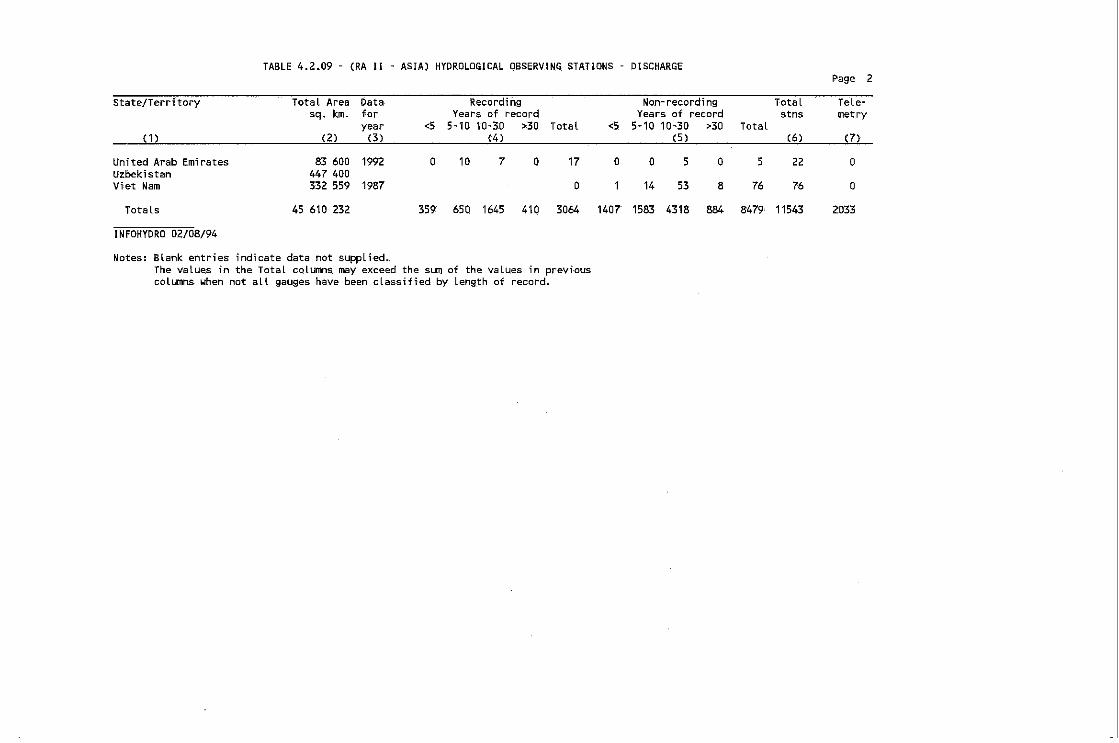
TABLE 4.2.09 - (RA II - ASIA) HYDROLOGICAL QBSERVING STATIONS DISCHARGEP'age 2
State/Terr (tory-··- Total Area Data Recording Non- record; ng Total Tele-sq. km. for Years of record Years o·f record stns metry
year <5 5-10 10-30 >30 Total <5 5-10 10-30 >30 Total(1) (2) (3) (4 ) (5 ) (6) (7)
United Arab Emirates 83 600 1992 0 10 7 0 17 0 0 5 0 5 22 0Uzbekistan 447 400Vi'et Nam 332 559 1987 0 1 14 53 8 76 76 0
Totals 45 610 232 359 650 1645 410 3064 1407 1583 4318 884 B479 11543 2033
INFOHYORO 02108/94
Notes: Blank entries indicate data not supplied.The values in the Total columns may exceed the sum of the values in previouscolumns when not all gauges have been cLassified by length of record.
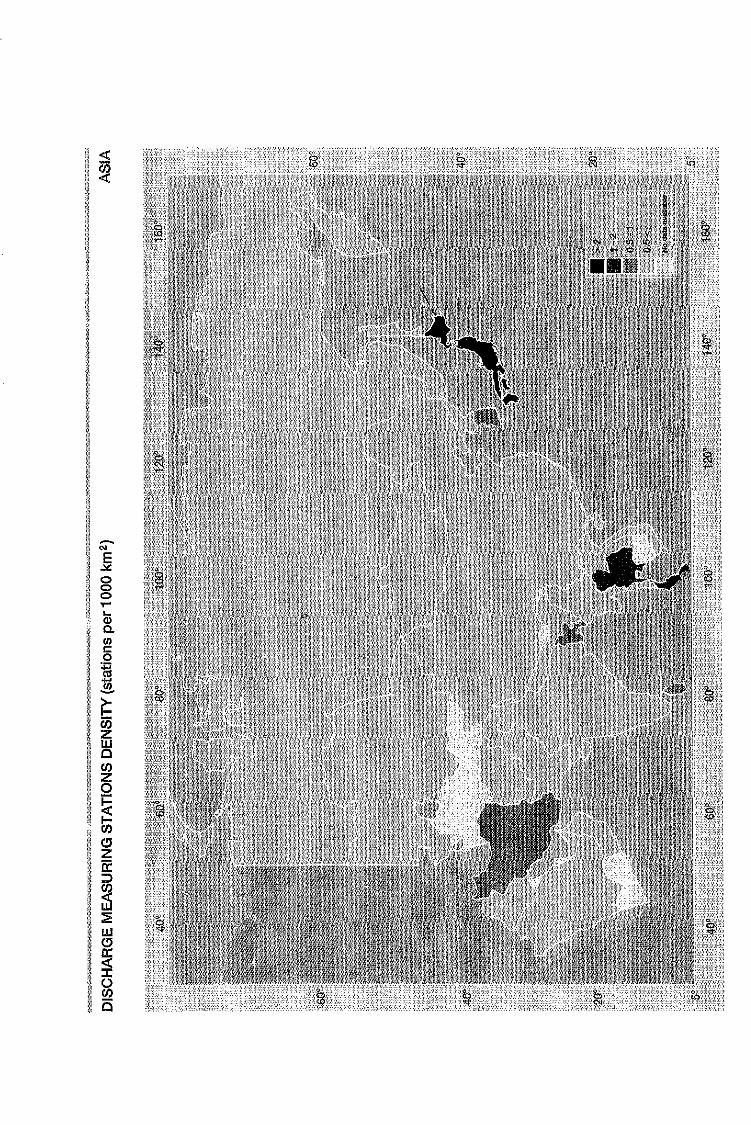
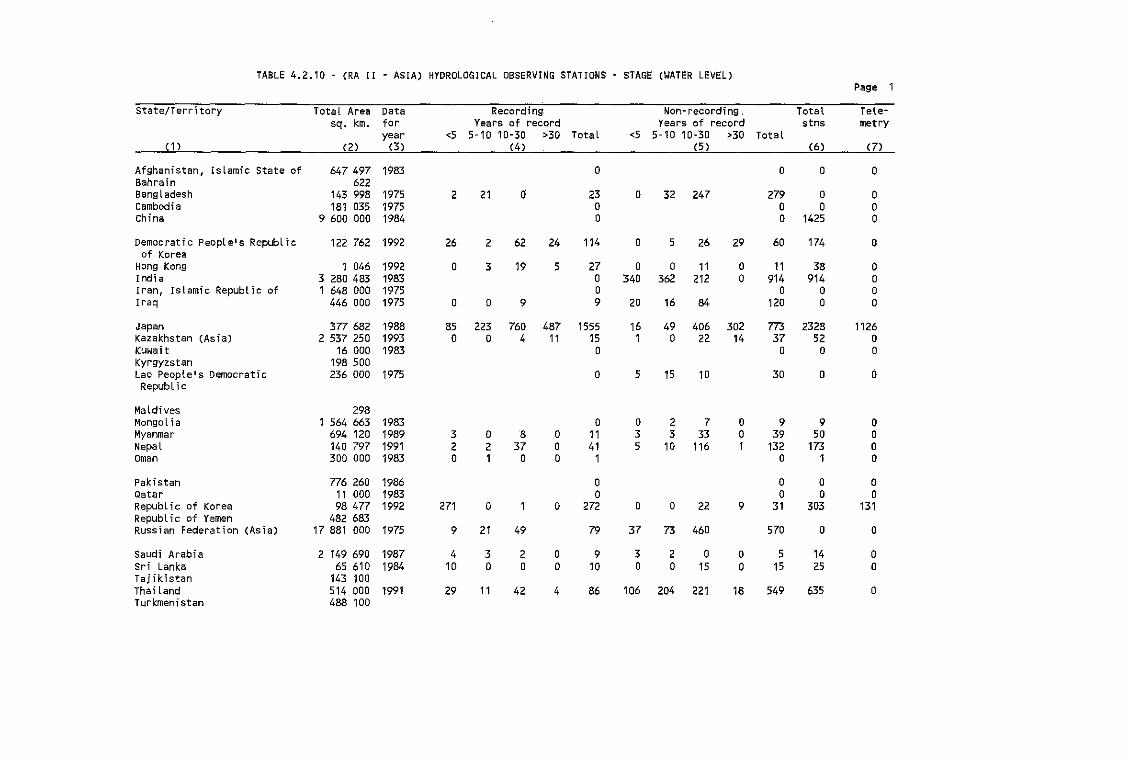
TABLE 4.2.10 - (RA I I - ASIA) HYOROLOGICAL OBSERVING STATIONS - STAGE (WATER LEVEL)Page 1
State/Territory Total Area Data Recording Non- recording, Total Tete-sq. km. for Years of ree,ord Years of record stns metry
year <5 5-10 10-30 >30 Total <5 5-10 10-30 >30 Total(1) (2 ) (3) (4) (5 ) (6) (7)
Afghanistan, Islamic State of 647 497 1983 0 0 0 0Bahrain 622Bangladesh 143 998 1975 2 21 0 23 0 32 247 279 0 0Cambodia 181 035 1975 0 0 0 0China 9 600 000 1984 0 0 1425 0
Democratic Peoplels Republic 122 762 1992 26 2 62 24 114 0 5 26 29 60 174 0of Korea
Hong Kong 1 046 1992 0 3 19 5 27 0 0 11 0 11 38 0India 3 280 483 1983 0 340 362 212 0 914 914 0Iran, Islamic Republic of 1 648 000 1975 0 0 0 0Iraq 446 000 1975 0 0 9 9 20 16 84 120 0 0
Japan 377 682 1988 85 223 760 487 1555 16 49 406 302 m 2328 1126Kazakhstan (Asia) 2 537 250 1993 0 0 4 11 15 1 0 22 14 37 52 0Kuwait 16 000 1983 0 0 0 0Kyrgyzstan 198 500Lao Peoplels Democratic 236 000 1975 0 5 15 10 30 0 0
Republ i c
MaLdives 298Mongolia 1 564 663 1983 0 0 2 7 0 9 9 0Myanmar 694 120 1989 3 0 8 0 11 3 3 33 0 39 50 0NepaL 140 797 1991 2 2 37 0 41 5 10 116 1 132 173 0Oman 300 000 1983 0 1 0 0 1 0 1 0
Pakistan 776 260 1986 0 0 0 0Qatar 11 000 1983 0 0 0 0Republic of Korea 98477 1992 271 0 1 0 272 0 0 22 9 31 303 131Republic of Yemen 482 683Russian Federation (Asia) 17 881 000 1975 9 21 49 79 37 73 460 570 0 0
Saudi Arabi a 2 149 690 1987 4 3 2 0 9 3 2 0 0 5 14 0Sri Lanka 65 610 1984 10 0 0 0 10 0 0 15 0 15 25 0Tajikistan 143 100Thai land 514 000 1991 29 11 42 4 86 106 204 221 18 549 635 0Turkmenistan 488 100
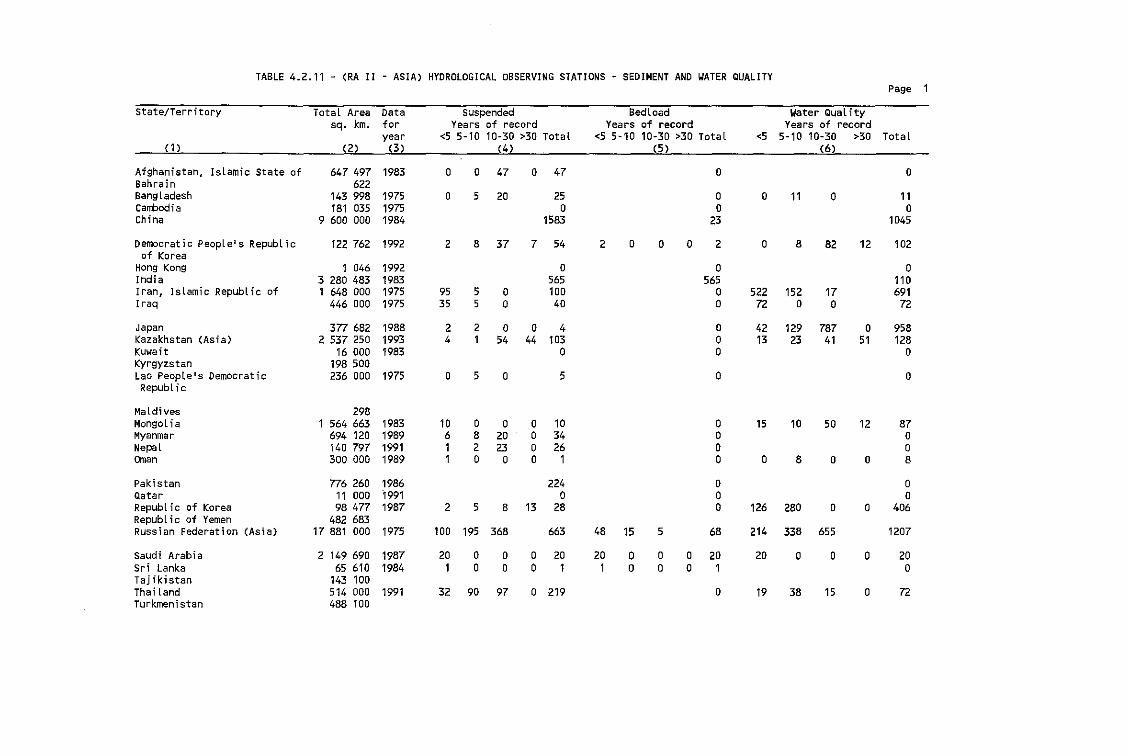
TABLE 4.2.11 - (RA II - ASIA) HYDROLOGICAL OBSERVING STATIONS SEDIMENT AND WATER QUALITYPage 1
State/Territory Total Area Data Suspended BedLoad Water Quat itysq. km. for Years of record YeaF'S of record Years of record
year <5 5-10 10-30 >30 Total <5 5-10 10-30 >30 Total <5 5-10 10-30 >30 Total(1 ) (2) (3) (4) (5) (6)
Afghanistan, Islamic State of 647 497 1983 0 0 47 0 47 0 0Bahrain 622BangLadesh 143 998 1975 0 5 20 25 0 0 11 0 11cambodia 181 035 1975 0 0 0China 9 600 000 1984 1583 23 1045
Democratic Peoplels Republic 122 762 1992 2 8 37 7 54 2 0 0 0 2 0 8 82 12 102of Korea
Hong Kong 1 046 1992 0 0 0India 3 280 483 1983 565 565 110Iran, Islamic Republic of 1 648 000 1975 95 5 0 100 0 522 152 17 691Iraq 446 000 1975 35 5 0 40 0 72 0 0 72
Japan 377 682 1988 2 2 0 0 4 0 42 129 787 0 958Kazakhstan (Asia) 2 537 250 1993 4 1 54 44 103 0 13 23 41 51 128Kuwait 16 000 1983 0 0 0Kyrgyzstan 198 500Lao People's Democratic 236 000 1975 0 5 0 5 0 0Republ i c
Maldives 298Mongol ia 1 564 663 1983 10 0 0 0 10 0 15 10 50 12 87Myanmar 694 120 1989 6 8 20 0 34 0 0Nepal 140 797 1991 1 2 23 0 26 0 0Oman 300 000 1989 1 0 0 0 1 0 0 8 0 0 8
Pakistan 776 260 1986 224 0 0Qatar 11 000 1991 0 0 0Republic of Korea 98477 1987 2 5 8 13 28 0 126 280 0 0 406Republic of Vemen 482 683Russian Federation (Asia) 17 881 000 1975 100 195 368 ,663 48 15 5 68 214 338 655 1207
Saudi Arabi a 2 149 690 1987 20 0 0 0 20 20 0 0 0 20 20 0 0 0 20Sri Lanka 65 610 1984 1 0 0 0 1 1 0 0 0 1 0Tajikistan 143 100Thai land 514 000 1991 32 90 97 0 219 0 19 38 15 0 72Turkmenistan 488 100
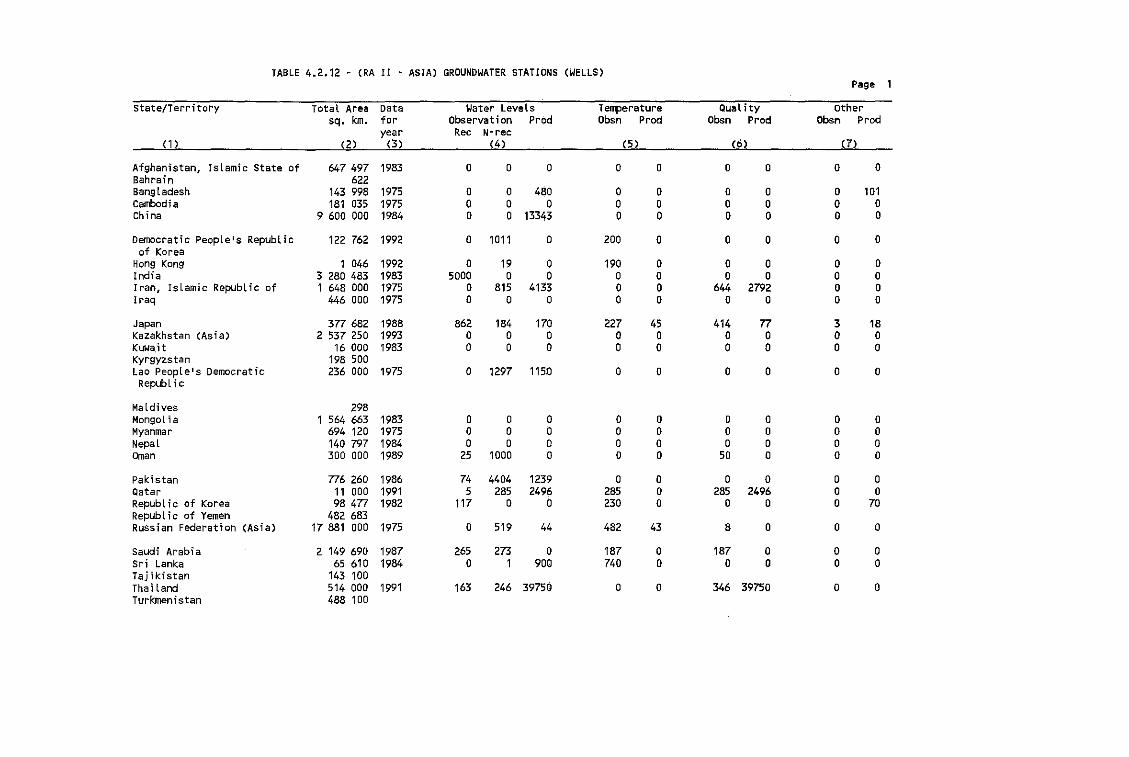
TABLE 4.2.12 - (RA II - ASIA) GROUNDWATER STATIONS (WELLS)Page
state/Territory Total Area Data Water Levels Temperature Quality othersq. km. for Observation Prod Obsn Prod Obsn Prod Obsn Prod
year Rec N-rec(1) (2) (3) (4) (5) (6) (7)
Afghanistan, Islamic State of 647 497 1983 0 D 0 D D 0 0 0 0Bahrain 622Bangladesh 143 998 1975 0 0 480 0 0 0 0 0 101Cambodia 181 035 1975 0 0 0 0 0 0 0 0 0China 9 600 000 1984 0 0 13343 0 0 0 0 0 0
Democratic People's Republic 122 762 1992 0 1011 0 200 0 0 0 0 0of Korea
Hong Kong 1 046 1992 0 19 0 190 0 0 0 0 0India 3 280 483 1983 5000 0 0 0 0 0 0 0 0Iran, Islamic Republic of 1 648 000 1975 0 815 4133 0 0 644 2792 0 0Iraq 446 000 1975 0 0 0 0 0 0 0 0 0
Japan 377 682 1988 862 184 170 227 45 414 77 3 18Kazakhstan (Asia) 2 537 250 1993 0 0 0 0 0 0 0 0 0Kuwa,it 16 000 1983 0 0 0 0 0 0 0 0 0Kyrgyzstan 198 500Lao People's Democratic 236 000 1975 0 1297 1150 0 0 0 0 0 0
Republ ; c
Maldives 298Mongol ia 1 564 663 1983 0 0 0 0 0 0 0 0 0Myanmar 694 120 1975 0 0 0 0 0 0 0 0 0Nepal 140 797 1984 0 0 0 0 0 0 0 0 0Oman 300 000 1989 25 1000 0 0 0 50 0 0 0
Pakistan 776 260 1986 74 4404 1239 0 0 0 0 0 0Qatar 11 000 1991 5 285 2496 285 0 285 2496 0 0RepubLic of Korea 98 477 1982 117 0 0 230 0 0 0 0 70Republic of Yemen 482 683Russian Federation (Asia) 17 881 000 1975 0 519 44 482 43 8 0 0 0
Saudi Arabi a 2 149 690 1987 265 273 0 187 0 187 0 0 0Sri Lanka 65 610 1984 0 1 900 740 0 0 0 0 0Tajikistan 143 100Thailand 514 000 1991 163 246 39750 0 0 346 39750 0 0Turkmenistan 488 100
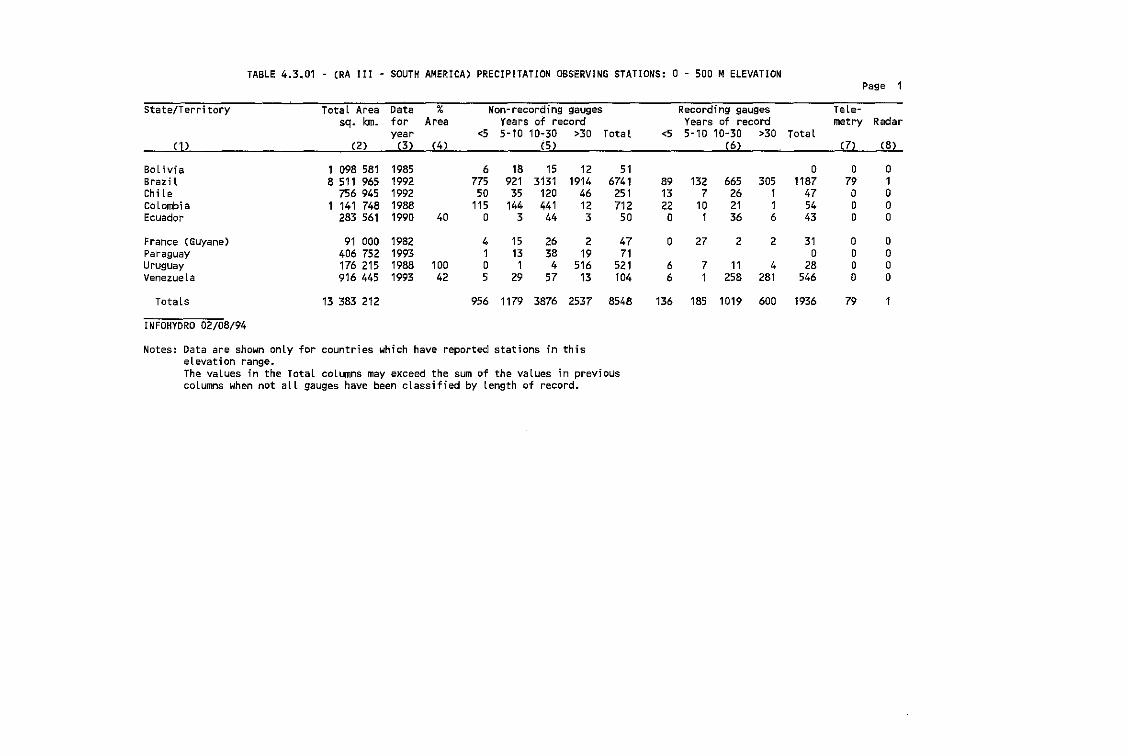
TABLE 4.3.01 - (RA III - SOUTH AMERICA) PRECIPITATION OBSERVING STATIONS: 0 - 500 MELEVATIONPage 1
State/TerritOiry Total Area Data % Non-recording gauges Recording ga\JQes Tele-sq. km. for Area Years of record Years of record metry Radar
year <5 5-10 10-30 >30 Total <5 5-10 10-30 >30 Total(1) (2) (3) (4) (5) (6) (7) (8)
Bol ivia 1 098 581 1985 6 18 15 12 51 0 0 0Brazil 8511 965 1992 775 921 3131 1914 6741 89 132 665 305 1187 79 1Chi le 756 945 1992 50 35 120 46 251 13 7 26 1 47 0 0Colombia 1 141 748 1988 115 144 441 12 712 22 10 21 1 54 0 0Ecuador 283 561 1990 40 0 3 44 3 50 0 1 36 6 43 0 0
France (Guyane) 91 000 1982 4 15 26 2 47 0 27 2 2 31 0 0Paraguay 406 752 1993 1 13 38 19 71 0 0 0Uruguay 176 215 1988 100 0 1 4 516 521 6 7 11 4 28 0 0Venezuela 916 445 1993 42 5 29 57 13 104 6 1 258 281 546 0 0
Totals 13 383 212 956 1179 3876 2537 8548 136 185 1019 600 1936 79
INFOHYDRO 02/08/94
Notes: Data are shown only for countries which have reported stations in thiseLevation range.The values in the TotaL columns may exceed the sum of the values in previouscolumns when not all gauges have been classified by length of record.

TABLE 4.3.02 - (RA III - SOUTH AM~RICA) PRECIPITATION OBSERVING STATIONS: 501 - 1000 MELEVATIONPage 1
State/Territory Total Area Data % Non-recording gaUges Recording gal,lges Tele-sq. km. for Area Years of record Years of record metry Radar
year <5 5-10 10-30 >30 Total <5 5"10 10-30 >30 Total(1 I (2) (3) (41 (5) (6) (7J (81
Bol lvie 1 098 581 1985 0 27 7 2 36 0 0 0Brazil 8 511 965 1992 177 196 1493 1065 2931 11 22 216 215 464 26 0Chi te 756 945 1992 12 6 39 28 85 6 2 12 0 20 0 0Colombia 1 141 748 1988 13 34 230 13 290 3 11 18 2 34 0 0Ecuador 283 561 1990 12 0 0 4 2 6 0 0 12 0 12 0 0
Paraguay 406 752 1993 0 0 0 1 1 0 0 0Venezuela 916 445 1993 30 0 4 25 8 37 2 0 34 79 115 7 0
Totals 13 115 997 202 267 1798 1119 3386 22 35 292 296 645 33 0
INFOHYORO 02/08/94
Notes: Data are shown only for countries which have reported statl0ns in thiselevation range.The values in the Total columns may exceed the sum of the values in previouscolumns wheh not all gauges have been classified by length of record.
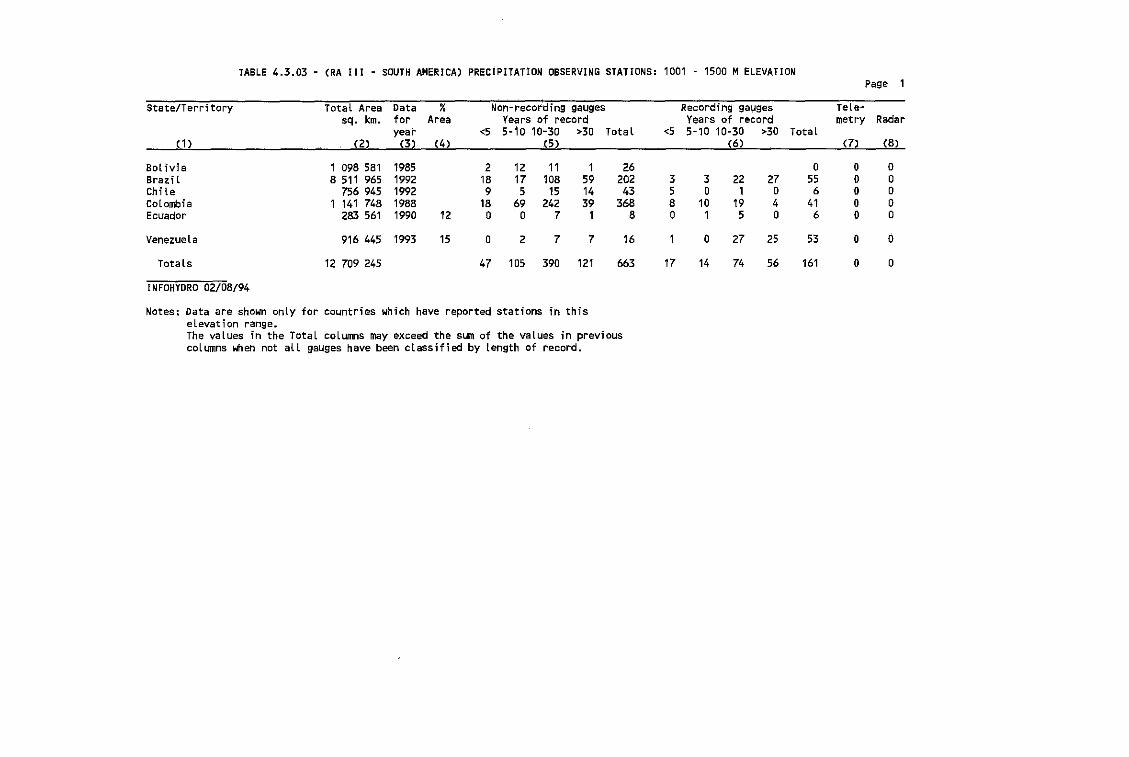
TABLE 4.3.03 (RA III - SOUTH AMERICA) PRECIPITATION OBSERVING STATIONS: 1001 - 1500 MELEVATIONPage 1
State/Territory Total Area Data % Non-recording gauges Record; h~ gal,Jges Tele-sq. km. for Area Years of record Years of record metry Radar
year <5 5-10 10-30 >30 Total <5 5-10 10-30 >30 Total(1 ) (2) (3) (4) (5) (6) (7) (8)
Bol ivia 1 098 581 1985 2 12 11 1 26 0 0 0Brazil 8511 965 1992 18 17 108 59 202 3 3 22 27 55 0 0Chi le 756 945 1992 9 5 15 14 43 5 0 1 0 6 0 0Colombia 1 141 748 1988 18 69 242 39 368 8 10 19 4 41 0 0Ecuador 283 561 1990 12 0 0 7 1 8 0 1 5 0 6 0 0
Venezuela 916 445 1993 15 0 2 7 7 16 1 0 27 25 53 0 0
Totals 12 709 245 47 105 390 121 663 17 14 74 56 161 0 0
INFOHYORO 02/08/94
Notes: Data are shown onLy for countries which have reported stations in thiselevation range.The vaLues in the Total columns may exceed the sum of the values in previouscoLumns when not all gauges have been classified by length of record.
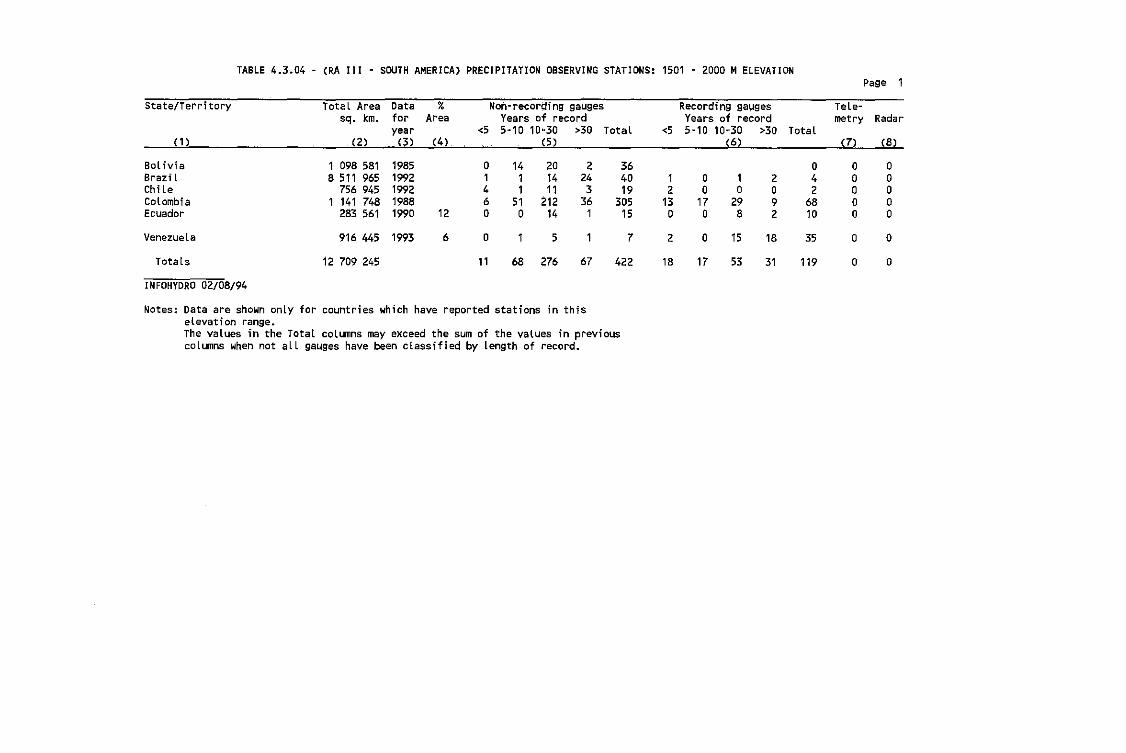
TABLE 4.3.04 (RA III - SOUTH AMERICA) PRECIPITATION OBSERVING STATIONS: 1501 - 2000 M ELEVATIONPage 1
State/Territory TotaL Area Data % Non-recording gauges Record; n9 ga\.lges Tele-sq. km. for Area Years of record Years of record metry Radar
year <5 5-10 10"30 >30 Total <5 5-10 10-30 >30 Total(1 ) (2) (3) (4) . (5) (6) (7) (8)
Bol iv; a 1 098 581 1985 0 14 20 2 36 0 0 0Brazi l 8 511 965 1992 1 1 14 24 40 1 0 1 2 4 0 0Chi Le 756 945 1992 4 1 11 3 19 2 0 0 0 2 0 0Colombia 1 141 748 1988 6 51 212 36 305 13 17 29 9 68 0 0Ecuador 283 561 1990 12 0 0 14 1 15 0 0 8 2 10 0 0
Venezuela 916 445 1993 6 0 1 5 1 7 2 0 15 18 35 0 0
Totals 12 709 245 11 68 276 67 422 18 17 53 31 119 0 0
INFOHYDRO 02/08/94
Notes: Data are shown only for countries which have reported stations in thiselevation range.The values in the Total coLumns may exceed the sum of the vaLues in previouscoLumns when not all gawges have been classified by Length of record.
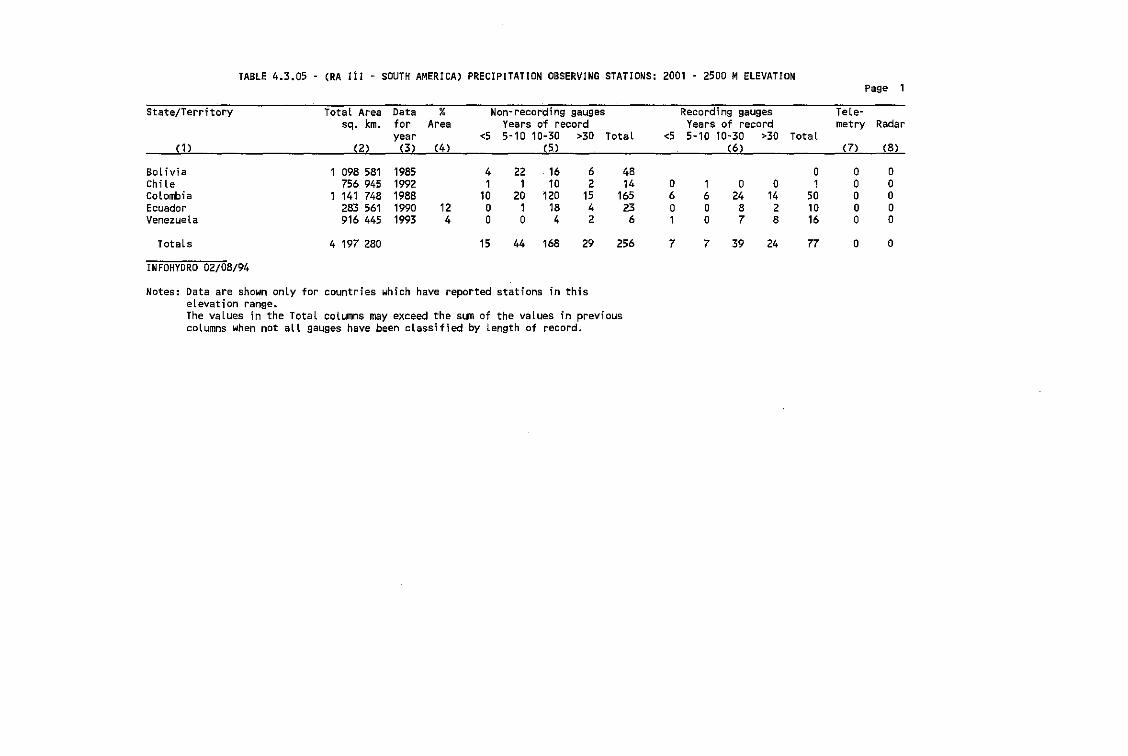
TABLE 4.3.05 (RA III - SOUTH AMERICA) PRECIPITATION OBSERVING STATIONS: 2001 - 2500 MELEVATIONPage 1
State/Territory Total Area Data % Non-recording gauges Recording gauges Tele-sq. km. for Area Years of record Years of record metry Radar
year <5 5-10 10-30 >30 Total <5 5-10 10-30 >30 Total(1 ) (2) (3) (4) (5 ) (6) (7) (8)
Bol ivia 1 098 581 1985 4 22 . 16 6 48 0 0 0Chi le 756 945 1992 1 1 10 2 14 0 1 0 0 1 0 0Colombia 1 141 748 1988 10 20 120 15 165 6 6 24 14 50 0 0Ecuador 283 561 1990 12 0 1 18 4 23 0 0 8 2 10 0 0Venezuela 916 445 1993 4 0 0 4 2 6 1 0 7 8 16 0 0
Totals 4 197 280 15 44 168 29 256 7 7 39 24 77 0 0
INFOHYORO 02/08/94
Notes: Data are shown only for countries which have reported stations in thiselevation range.The values in the TotaL columns may exceed the sum of the values in previouscolumns when not all gauges have been classified by Length of record.
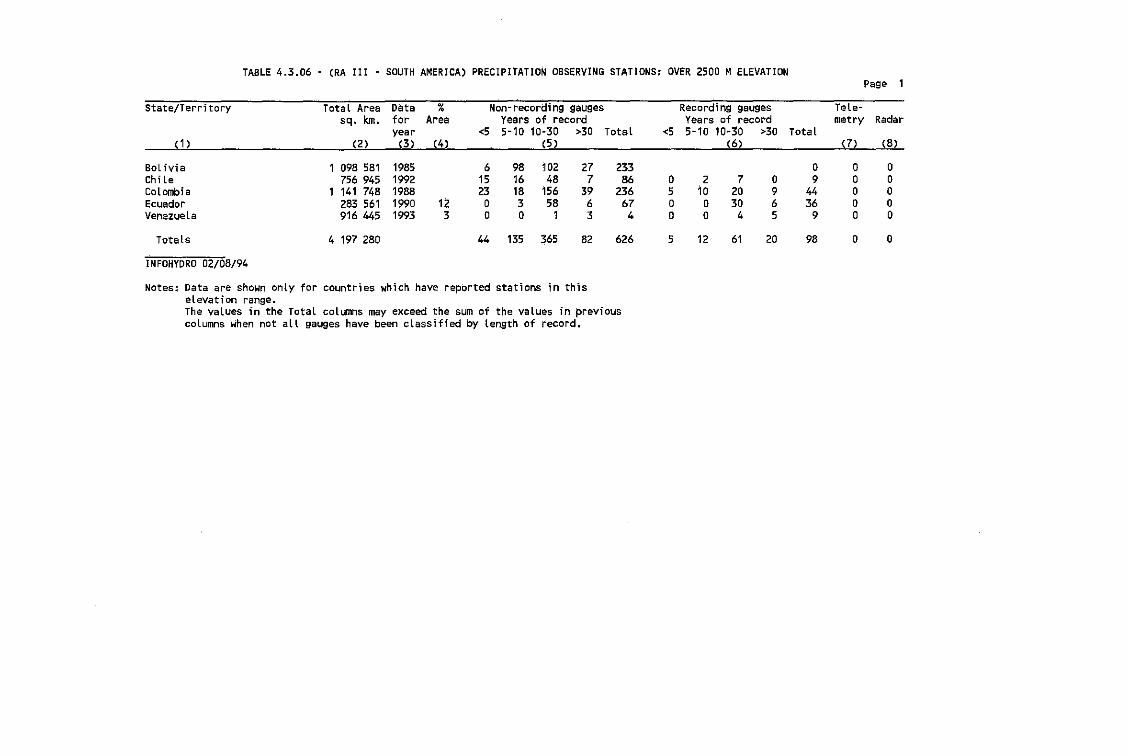
TABLE 4.3.06 - (RA III - SOUTH AMERICA) PRECIPITATION OBSERVING STATIONS: OVER 2500 MELEVATIONPage 1
State/Territory Total Area Data % Non-recording gauges Recording gauges Tele-sq. km. for Area Years of record Years of record metry Radar
year <5 $-10 10"30 >30 Total <5 5-10 10-30 >30 Total(1 ) (2) (3) (4) (5 ) (6) (7) (8)
Bol ivia 1 098 581 1985 6 98 102 27 233 0 0 0Chi Le 756 945 1992 15 16 48 7 86 0 2 7 0 9 0 0Colombia 1 141 748 1988 23 18 156 39 236 5 10 20 9 44 0 0Ecuador 283 561 1990 12 0 3 58 6 67 0 0 30 6 36 0 0Venezuela 916 445 1993 3 0 0 1 3 4 0 0 4 5 9 0 0
Totals 4 197 280 44 135 365 B2 626 5 12 61 20 98 0 0
INFOHYDRO 02/08/94
Notes: Data are shown only for countries which have reported stations in thiselevation range.The values in the Total columns may exceed the sum of the values in previouscoLumns when not all gauges have been classified by length of record.
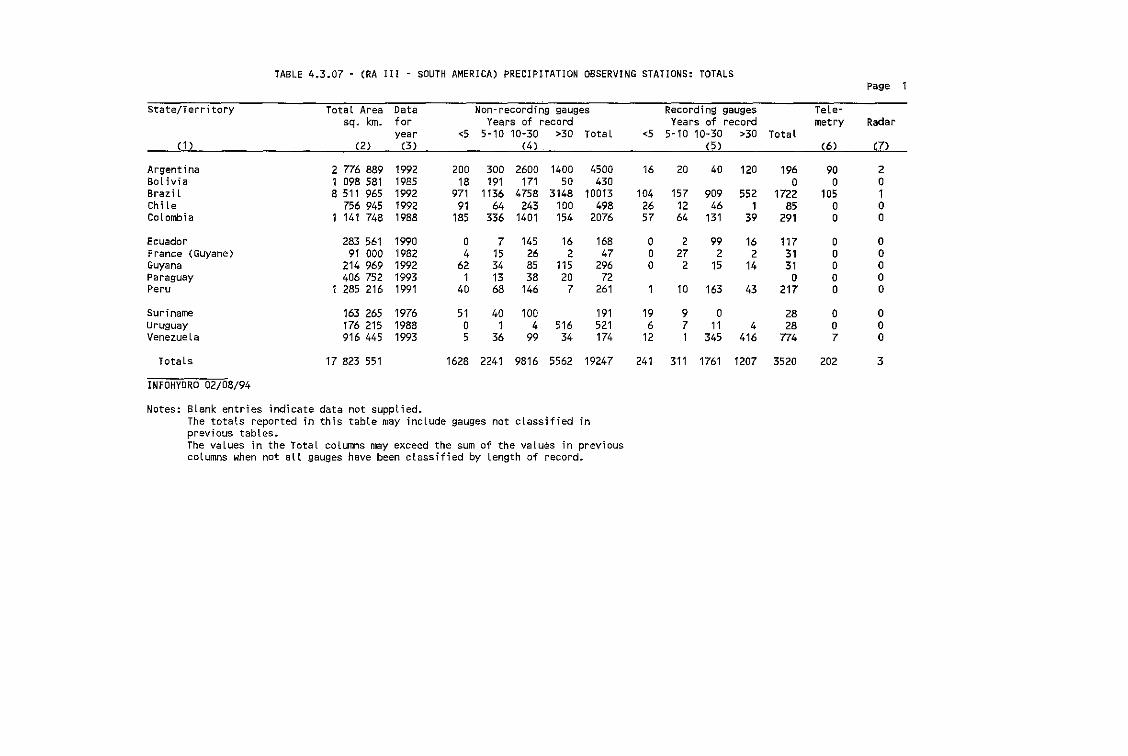
TABLE 4.3.07 - (RA III - SOUTH AMERICA) PRECIPITATION OBSERVING STATIONS: TOTALSPage
State/Territory Total Area Data Non~recording gauges Recording gauges Tete-sq. km. for Years of record Years of record metry Radar
year <5 5-10 10-30 >30 TotaL <5 5-10 10-30 >30 Total(1 ) (2) (3) (4 ) (5 ) (6) m
Argentina 2 776 889 1992 200 300 2600 1400 4500 16 20 40 120 196 90 2Bolivia 1 098 581 1985 18 191 171 50 430 0 0 0Brazil 8 511 965 1992 971 1136 4758 3148 10013 104 157 909 552 1722 105 1Chi le 756 945 1992 91 64 243 100 498 26 12 46 1 85 0 0Colombia 1 141 748 1988 185 336 1401 154 2076 57 64 131 39 291 0 0
Ecuador 283 561 1990 0 7 145 16 16B 0 2 99 16 117 0 0France (Guyane) 91 000 1982 4 15 26 2 47 0 27 2 2 31 0 0Guyana 214 969 1992 62 34 85 115 296 0 2 15 14 31 0 0Paraguay 406 752 1993 1 13 38 20 72 0 0 0Peru 1 285 216 1991 40 68 146 7 261 1 10 163 43 217 0 0
Suriname 163 265 1976 51 40 100 191 19 9 0 28 0 0Uruguay 176 215 1988 0 1 4 516 521 6 7 11 4 28 0 0VenezueLa 916 445 1993 5 36 99 34 174 12 1 345 416 774 7 0
Totals 17 823 551 1628 2241 9816 5562 19247 241 311 1761 1207 3520 202 3
INFOHYORO 02/08/94
Notes: Blank entries lndicate data not supplied.The totals reported in this table may include gauges not classified inprevious tables.The values in the Total columns may exceed the sum of the values in previouscolumns when not all gauges have been classified by length of record.
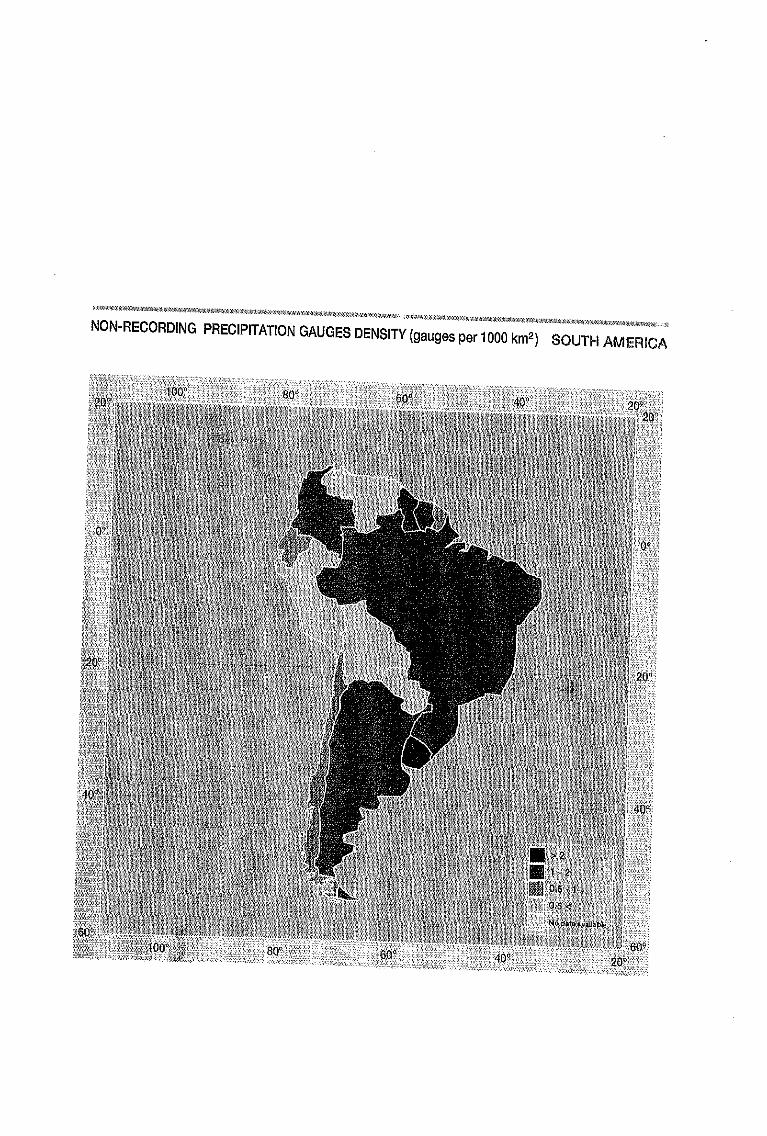
NON-RECORDING PRECIPITATION GAUGES DENSITY (gauges per 1000 km2) SOUTH AMERICA
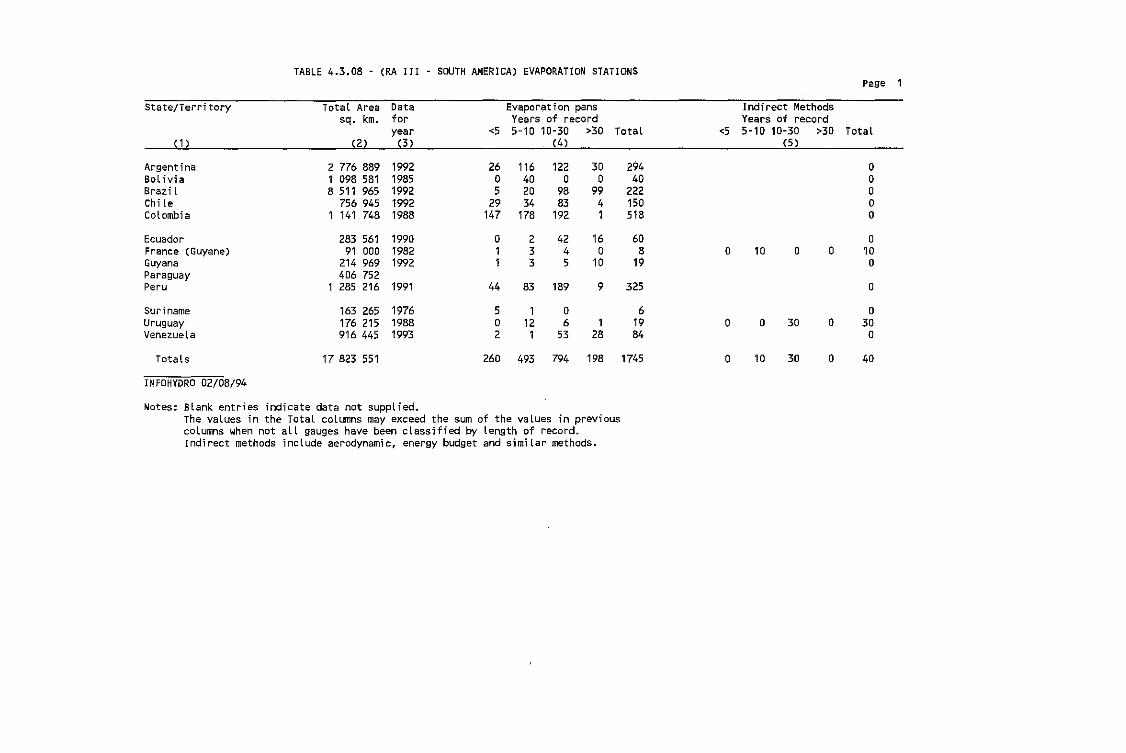
TABLE 4.3.08 - (RA III SOUTH AMERICA) EVAPORATION STATIONSPage 1
State/Territory Total Area Data Evaporat i on pans Indirect Methodssq. km. for Years of record Years of record
year <5 5-10 10-30 >30 Total <5 5-10 10-30 >30 Total(1) (2) (3 ) (4) (5)
Argentina 2 776 889 1992 26 116 122 30 294 0Sol lvia 1 098 581 1985 0 40 0 0 40 0Brazi l 8511 965 1992 5 20 98 99 222 0Chi Ie 756 945 1992 29 34 83 4 150 0Colombia 1 141 748 1988 147 178 192 1 518 0
Ecuador 283 561 1990 0 2 42 16 60 0France (Guyane) 91 000 1982 1 3 4 0 8 0 10 0 0 10Guyana 214 969 1992 1 3 5 10 19 0Paraguay 406 752Peru 1 285 216 1991 44 83 189 9 325 0
Suriname 163 265 1976 5 1 0 6 0Uruguay 176 215 1988 0 12 6 1 19 0 0 30 0 30VenezueLa 916 445 1993 2 1 53 28 84 0
Totals 17 823 551 260 493 794 198 1745 0 10 30 0 40
INFOHYORO 02/08/94
Notes: Blank entries indicate data not supplied.The vaLues in th,e Total columns may exceed the sum of the values in preViouscolumns when not aLL gauges have been classified by length of record"Indirect methods include aerodynamic, energy budget and similar methods.
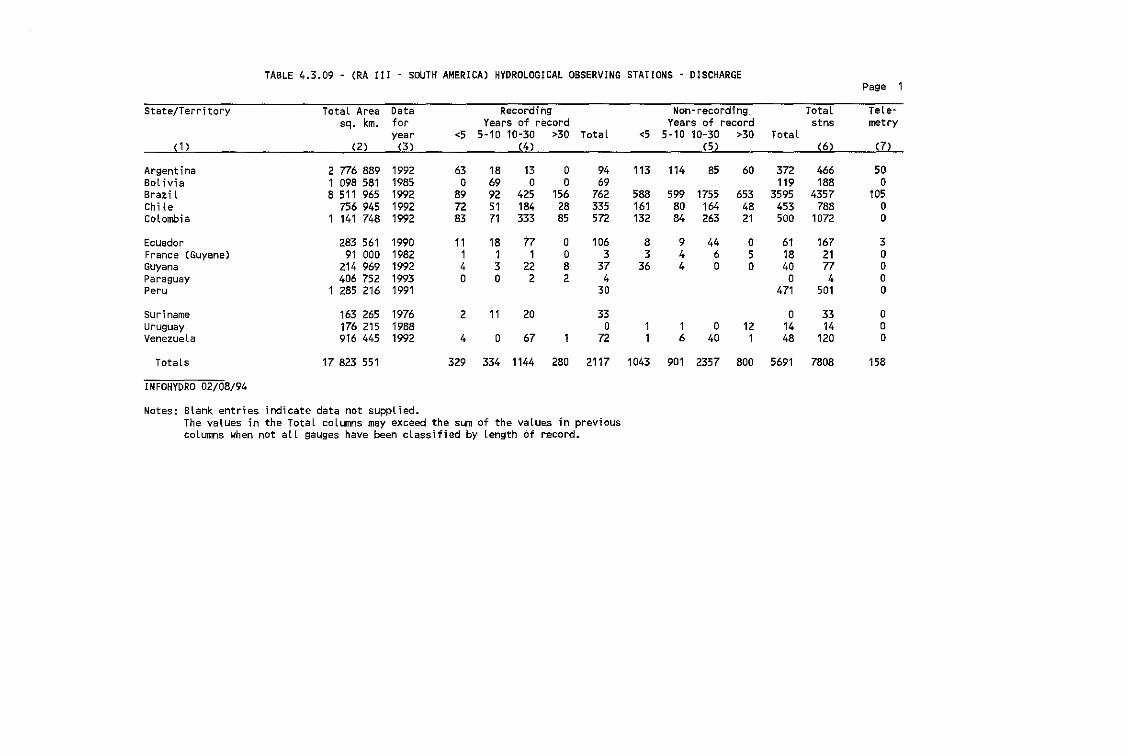
TABLE 4.3.09 - (RA III - SOUTH AMERICA) HYDROLOGICAL OBSERVING STATIONS - DISCHARGEPage 1
State/Territory TotaL Area Data Recording Non- recording Total Tele-sq. km. for Years of record Years of record stns metry
year <5 5-10 10-30 >30 Total <5 5-1 0 10-30 >30 Total(1) (2) (3) (4) (5) (6) (7)
Argentina 2 776 889 1992 63 18 13 0 94 113 114 85 60 372 466 50Bol ivia 1 098 581 1985 0 69 0 0 69 119 188 0Brazil 8511 965 1992 89 92 425 156 762 588 599 1755 653 3595 4357 105Chi le 756 945 1992 72 51 184 28 335 161 80 164 48 453 788 0Colombia 1 141 748 1992 83 71 333 85 572 132 84 263 21 500 1072 0
Ecuador 283 561 1990 11 18 77 0 106 8 9 44 0 61 167 3France (Guyane) 91 000 1982 1 1 1 0 3 3 4 6 5 18 21 0Guyana 214 969 1992 4 3 22 8 37 36 4 0 0 40 77 0Paraguay 406 752 1993 0 0 2 2 4 0 4 0Peru 1 285 216 1991 30 471 501 0
Suriname 163 265 1976 2 11 20 33 0 33 0Uruguay 176 215 1988 0 1 1 0 12 14 14 0VenezueLa 916 445 1992 4 0 67 1 n 1 6 40 1 48 120 0
Totals 17 823 551 329 334 1144 280 2117 1043 901 2357 800 5691 7808 158
INFOHYORO 02/08/94
Notes: Blank entries indicate data not suppLied.The values in the Total columns may exceed the sum of the values in previouscolumns when not all gauges have been classified by length of record.
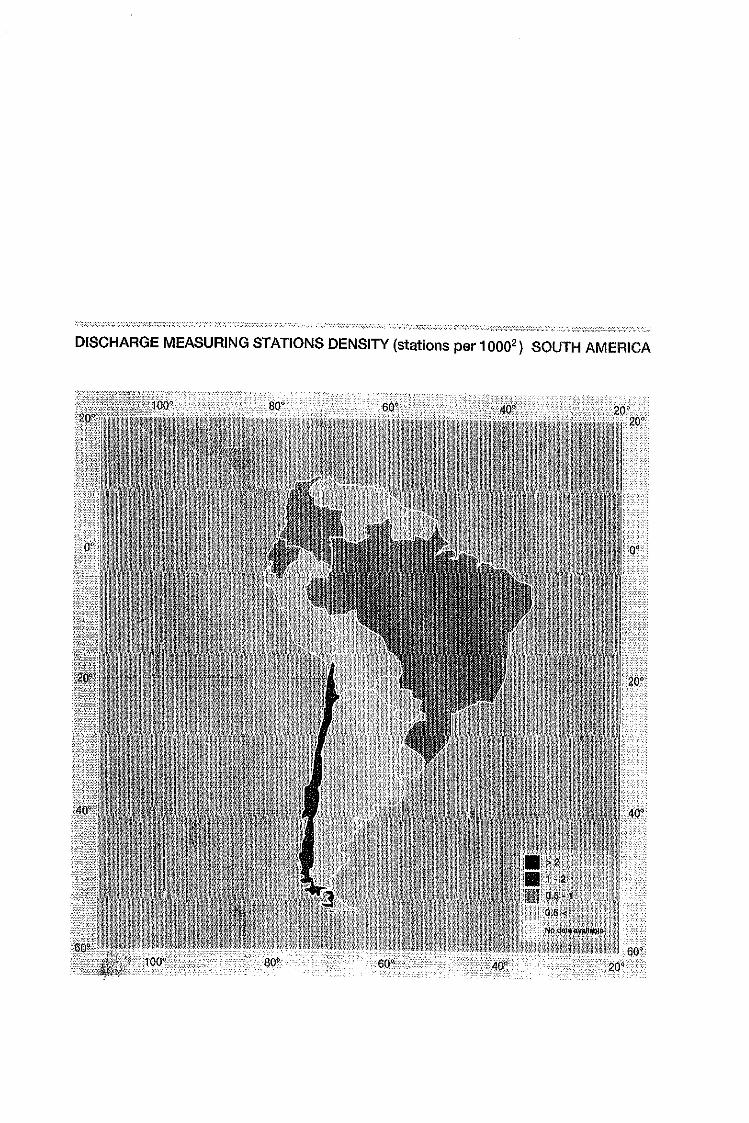
DISCHARGE MEASURING STATIONS DENSITY (stations per 10002 ) SOUTH AMERICA
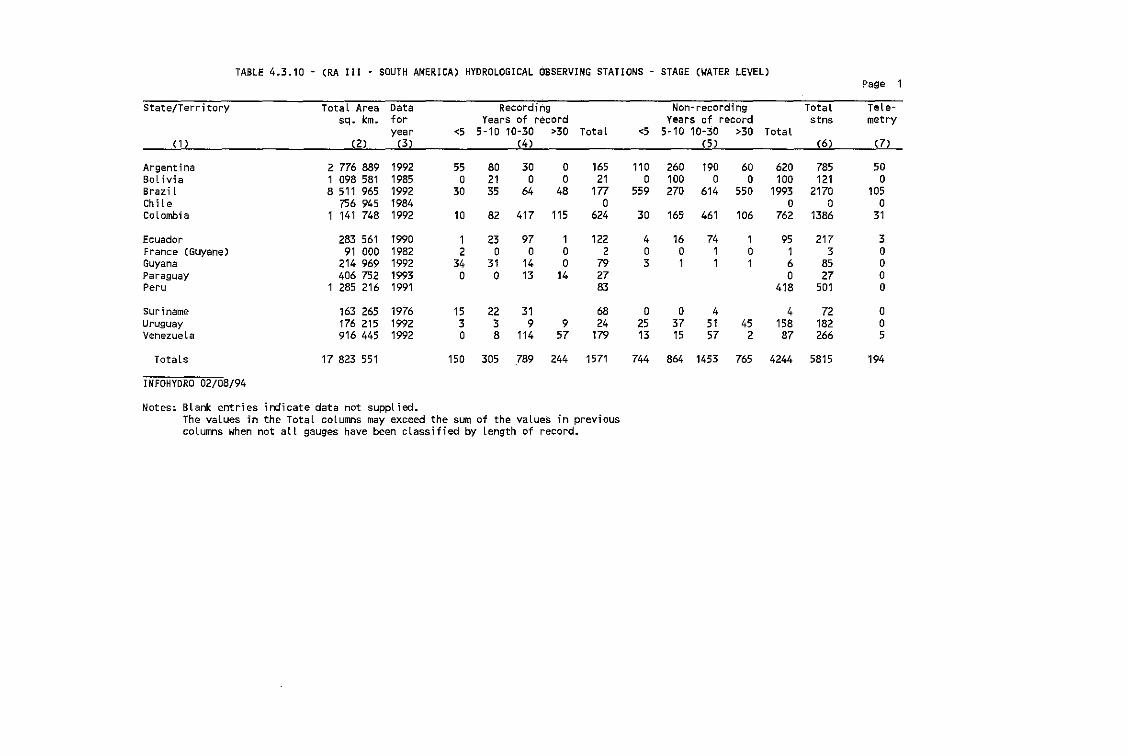
TABLE 4.3.10 (RA III . SOUTH AMERICA) HYOROLOGICAL OBSERVING STATIONS STAGE (WATER LEVEL)Page 1
State/Terri tory Total Area Data Recording Non-recording Total Tele-sq. km. for Years of record Years of record stns metry
year <5 5-10 10-30 >30 Total <5 5-10 10-30 >30 Total(1) (2) (3) (4) (5 ) (6) (7)
Argentina 2 776 889 1992 55 80 30 0 165 110 260 190 60 620 785 50Bol lVla 1 098 581 1985 0 21 0 0 21 0 100 0 0 100 121 0Braz; l 8 511 965 1992 30 35 64 48 177 559 270 614 550 1993 2170 105Ch it e 756 945 1984 0 0 0 0CoLombia 1 141 748 1992 10 82 417 115 624 30 165 461 106 762 1386 31
Ecuador 283 561 1990 1 23 97 1 122 4 16 74 1 95 217 3France (Guyane) 91 000 1982 2 0 0 0 2 0 0 1 0 1 3 0Guyana 214 969 1992 34 31 14 0 79 3 1 1 1 6 85 0Paraguay 406 752 1993 0 0 13 14 27 0 27 0Peru 1 285 216 1991 83 418 501 0
Suriname 163 265 1976 15 22 31 68 0 0 4 4 72 0Uruguay 176 215 1992 3 3 9 9 24 25 37 51 45 158 182 0Venezuela 916 445 1992 0 8 114 57 179 13 15 57 2 87 266 5
Totals 17 823 551 150 305 789 244 1571 744 864 1453 765 4244 5815 194
INFOHYORO 02/08/94
Notes: Blank entries indicate data not supplied.The vaLues in the TotaL columns may exceed the sum of the values in previouscoLumns when not all gauges have been classified by length of record.
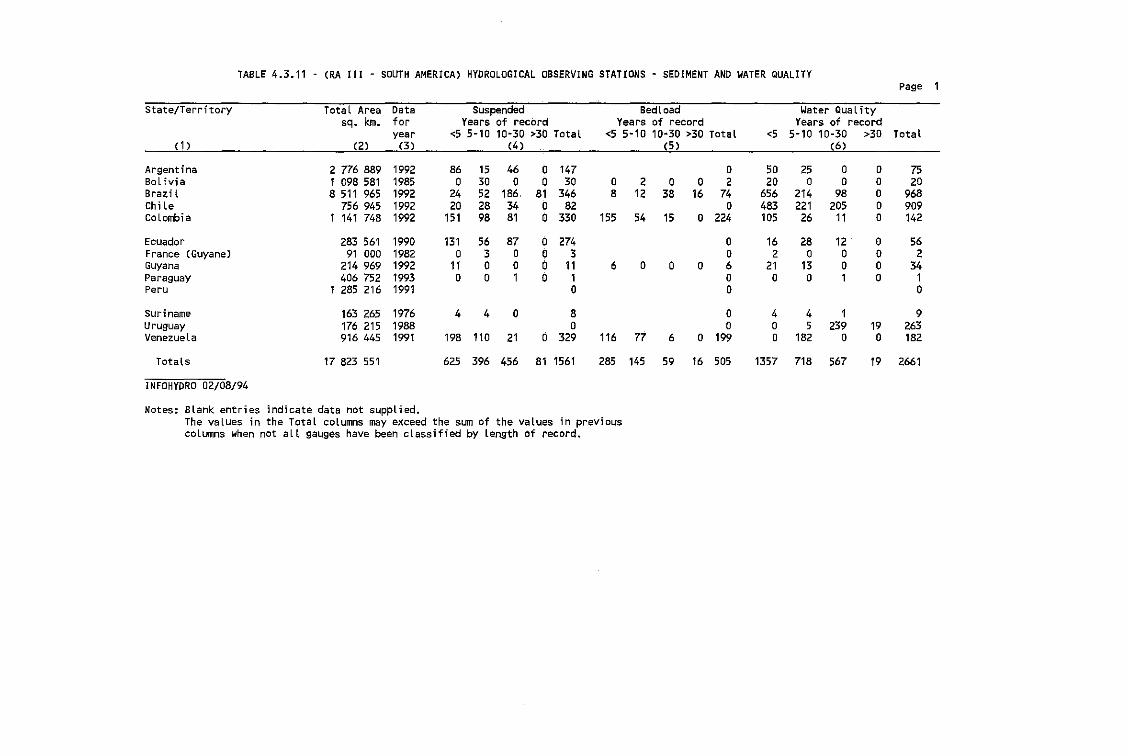
TABLE 4.3.11 (RA III - SOUTH AMERICA) HYDROLOGICAL OBSERVING STATIONS - SEDIMENT AND WATER QUALITYPage 1
State/Territory TotaL Area Data Suspended Bedload Water QuaL itysq. km. for Years of record Years of record Years of record
year <5 5-10 10-30 >30 Total <5 5-10 10-30 >30 Total <5 5-10 10-30 >30 Total(1) (2) (3 ) (4) (5 ) (6)
Argentina 2 776 889 1992 86 15 46 0 147 0 50 25 0 0 75Bol ivia 1 098 581 1985 0 30 0 0 30 0 2 0 0 2 20 0 0 0 20Brazi l 8 511 965 1992 24 52 186 81 346 8 12 38 16 74 656 214 98 0 968Chi Le 756 945 1992 20 28 34 0 82 0 483 221 205 0 909CoLombia 1 141 748 1992 151 98 81 0 330 155 54 15 0 224 105 26 11 0 142
Ecuador 283 561 1990 131 56 87 0 274 0 16 28 12 0 56France (Guyane) 91 000 1982 0 3 0 0 3 0 2 0 0 0 2Guyana 214 969 1992 11 0 0 0 11 6 0 0 0 6 21 13 0 0 34Paraguay 406 752 1993 0 0 1 0 1 0 0 0 1 0 1Peru 1 285 216 1991 0 0 0
Suriname 163 265 1976 4 4 0 8 0 4 4 1 9Uruguay 176 215 1988 0 0 0 5 239 19 263Venezuela 916 445 1991 198 110 21 0 329 116 77 6 0 199 0 182 0 0 182
Totals 17 823 551 625 396 456 81 1561 285 145 59 16 505 1357 718 567 19 2661
INFOHYORO 02/08/94
Notes: Blank entries indicate data not supplied.The values in the Total columns may exceed the sum of the values in previouscolumns when not all gauges have been classified by Length of record.
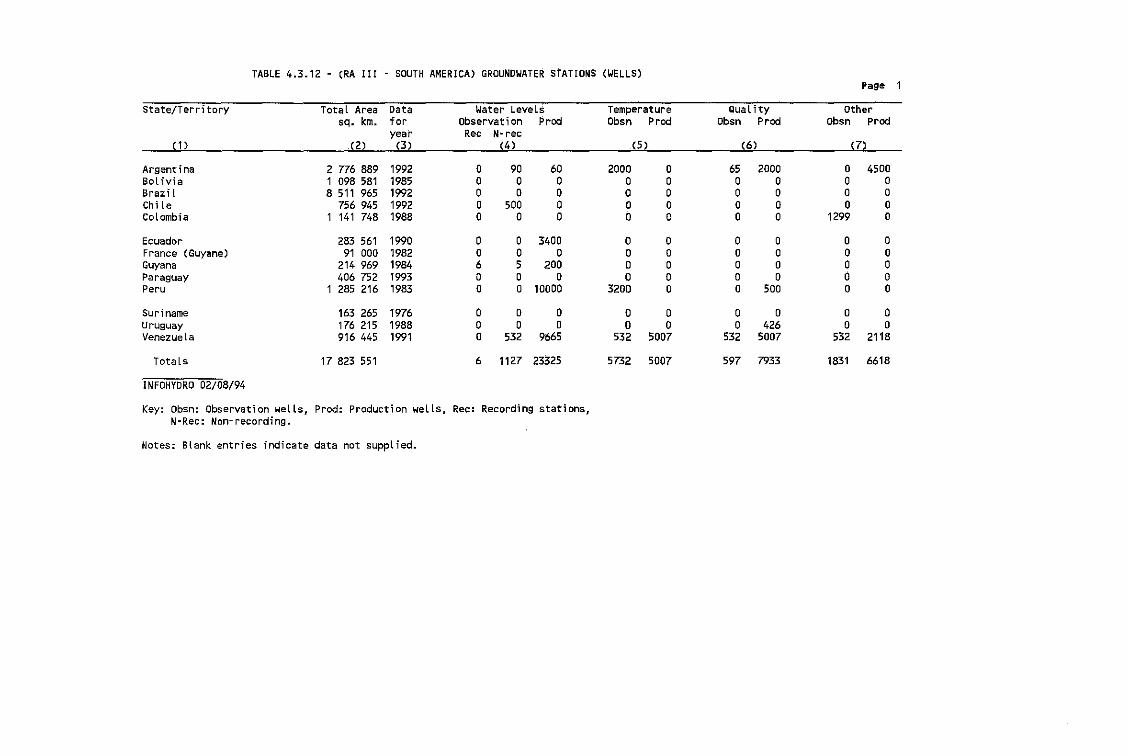
TABLE 4.3.12 - (RA III - SOUTH AMERICA) GROUNDWATER STATIONS (WELLS)Page
State/Territory TotaL Area Data Water LeveLs Temperature Quality Othersq. km. for Observation Prod Obsn Prod Obsn Prod Obsn prod
year Rec N~rec
(1) .(2) (3 ) (4) (5 ) (6) (7)
Argentina 2 n6889 1992 0 90 60 2000 0 65 2000 0 4500BoL ivia 1 098 581 1985 0 0 0 0 0 0 0 0 0Brazil 8 511 965 1992 0 0 0 0 0 0 0 0 0Chi Le 756 945 1992 0 500 0 0 0 0 0 0 0Colombia 1 141 748 1988 0 0 0 0 0 0 0 1299 0
Ecuador 283 561 1990 0 0 3400 0 0 0 0 0 0France (Guyane) 91 000 1982 0 0 0 0 0 0 0 0 0Guyana 214 969 1984 6 5 200 0 0 0 0 0 0Paraguay 406 752 1993 0 0 0 0 0 0 0 0 0Peru 1 285 216 1983 0 0 10000 3200 0 0 500 0 0
Suriname 163 265 1976 0 0 0 0 0 0 0 0 0Uruguay 176 215 1988 0 0 0 0 0 0 426 0 0Venezuela 916 445 1991 0 532 9665 532 5007 532 5007 532 2118
Totals 17 823 551 6 1127 23325 5732 5007 597 7933 1831 6618
INfOHYORO 02/08/94
Key: Obsn: Observation wells, Prod: Production wells, Rec: Recording stations,N-Rec: Non-recording.
Notes: Blank entries indicate data not supplied.
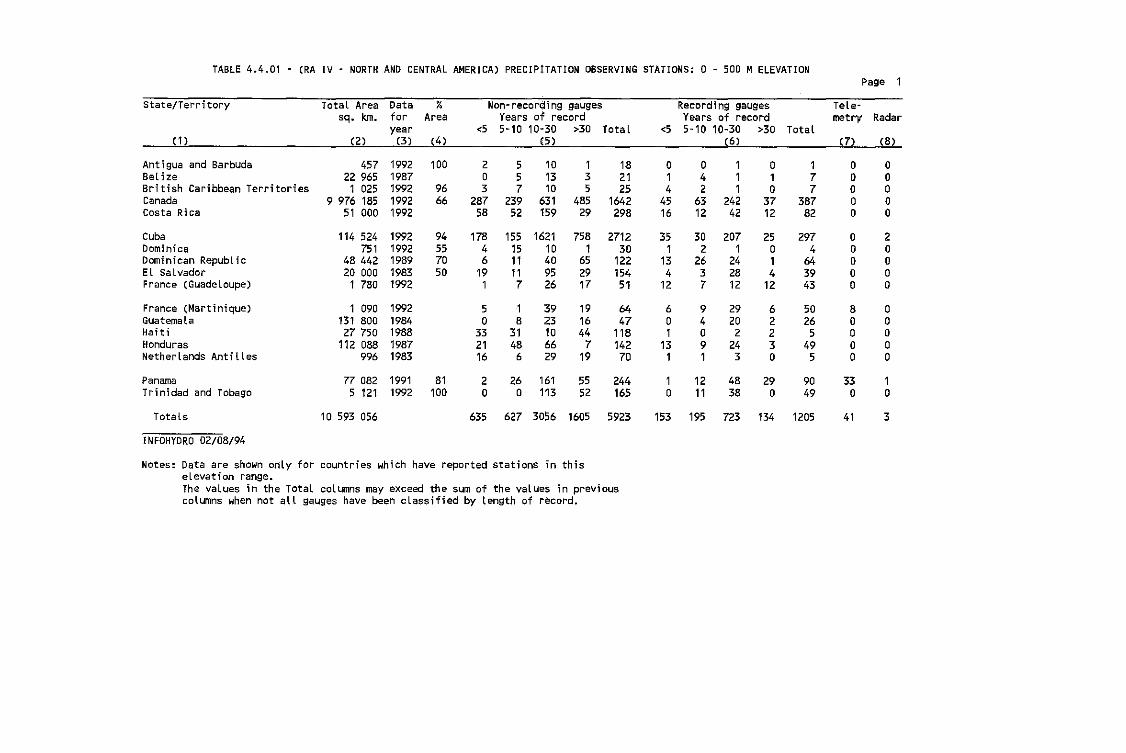
TABLE 4.4.01 - (RA IV - NORTH AND CENTRAL AMERICA) PRECIPITATION OBSERVING STATiONS: 0 - 500 MELEVATIONPage 1
State/Territory
(1)
TotaL Areasq. km.
(2)
Dataforyear
(3)
% Non-recording gauges Recording ga~ges
Area Years of record Years of record<5 5-10 10"30 >30 TotaL <5 5-10 10-30 >30
(4) (5) (6)Total
TeLe M
metry Radar
(7) (8)
1 090 1992131 800 198427 750 1988
112 088 1987996 1983
77 082 1991 815 121 1992 100
10 593 056 635 627 3056 1605 5923
26 161o 113
153 195 723 134 1205
ooooo
1o
3
ooooo
2oooo
ooooo
ooooo
8oooo
33o
41
9049
2974
643943
50265
495
177
38782
o1o
3712
25o14
12
6223o
29o
2920
2243
4838
111
24242
2071
242812
o42
6312
302
2637
94o91
1211
6o1
131
1o
o14
4516
351
134
12
6447
11814270
244165
182125
1642298
271230
12215451
191644
719
5552
135
48529
7581
652917
101310
631159
162110409526
39:23106629
557
23952
1551511117
18
3148
6
5o
332116
2o
2o3
28758
17846
191
94557050
100
9666
19921987199219921992
19921992198919831992
114 524751
48 44220 0001 780
45722 9651 025
9 976 18551 000
CubaDominicaDominican RepublicEl SalvadorFrance (Guadeloupe)
Antigua and BarbudaBelizeBritish Caribbean TerritoriesCanadaCosta Rica
France (Martinique)GuatemalaHaitiHondurasNetherlands Antilles
Totals
PanamaTrinidad and Tobago
INFOHYORO 02/08/94
Notes: Data are shown only for countries which have reported stations in thiselevation range.The values in the Total columns may exceed the sum of the values in previouscoLumns when not alL gauges have been classified by length of record.
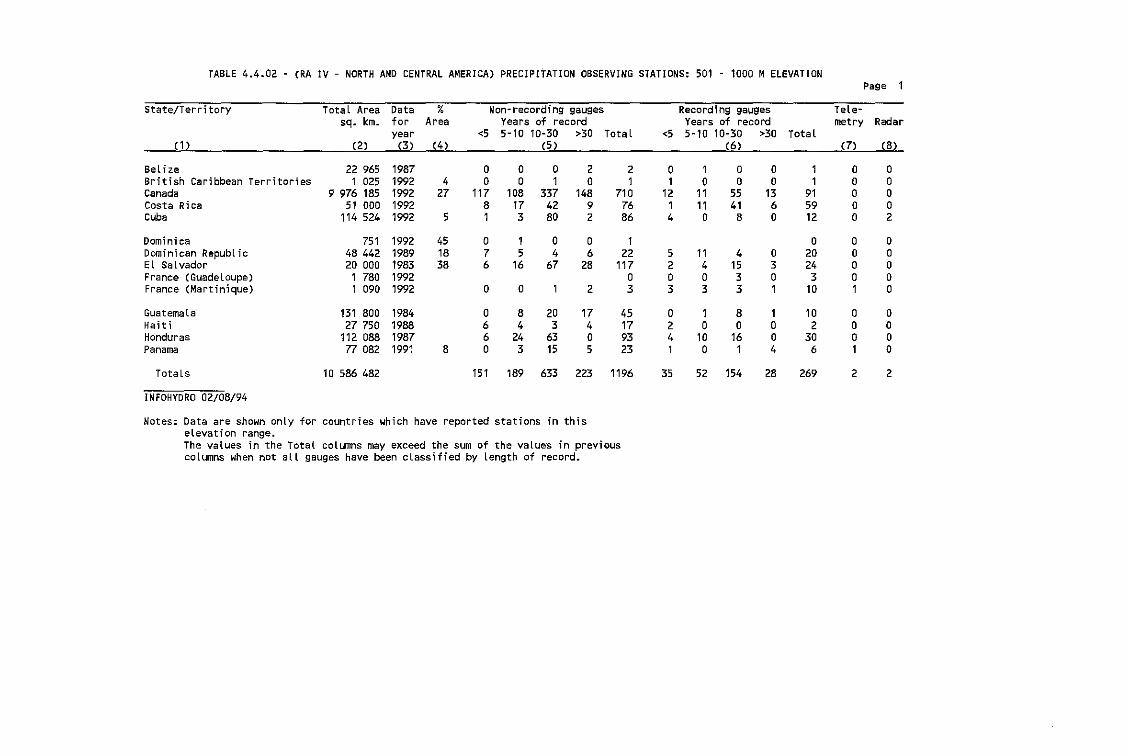
TABLE 4.4.02 (RA IV - NORTH AND CENTRAL AMERICA) PRECIPITATION OBSERVING STATIONS: 501 - 1000 MELEVATIONPage 1
State/Territory Total Area Data % Non-recording gauges Recording ga\.lges Tele-sq. km. for Area Years of record Years of record metry Radar
year <5 5-10 10"30 >30 TotaL <5 5'10 10-30 >30 Total(1 ) (2) (3 ) (4) (5 ) (6) (7) (8)
Bel ize 22 965 1987 0 0 0 2 2 0 1 0 0 1 0 0British Caribbean Territories 1 025 1992 4 0 0 1 0 1 1 0 0 0 1 0 0Canada 9 976 185 1992 27 117 108 337 148 710 12 11 55 13 91 0 0Costa Rica 51 000 1992 8 17 42 9 76 1 11 41 6 59 0 0Cuba 114 524 1992 5 1 3 80 2 86 4 0 8 0 12 0 2
Dominica 751 1992 45 0 1 0 0 1 0 0 0Dominican Republic 48 442 1989 18 7 5 4 6 22 5 11 4 0 20 0 0El Salvador 20 000 1983 38 6 16 67 28 117 2 4 15 3 24 0 0France (Guadeloupe) 1 780 1992 0 0 0 3 0 3 0 0France (Martinique) 1 090 1992 0 0 1 2 3 3 3 3 1 10 1 0
Guatemala 131 800 1984 0 8 20 17 45 0 1 8 1 10 0 0Haiti 27 750 1988 6 4 3 4 17 2 0 0 0 2 0 0Honduras 112 088 1987 6 24 63 0 93 4 10 16 0 30 0 0Panama 77 082 1991 8 0 3 15 5 23 1 0 1 4 6 1 0
Totals 10 586 482 151 189 633 223 1196 35 52 154 28 269 2 2
INFOHYDRO 02/08/94
Notes: Data are shown only for countries which have reported stations in thiselevation range.The values in the Total columns may exceed the sum of the values in previouscolumns when not all gauges have been classified by length of record.
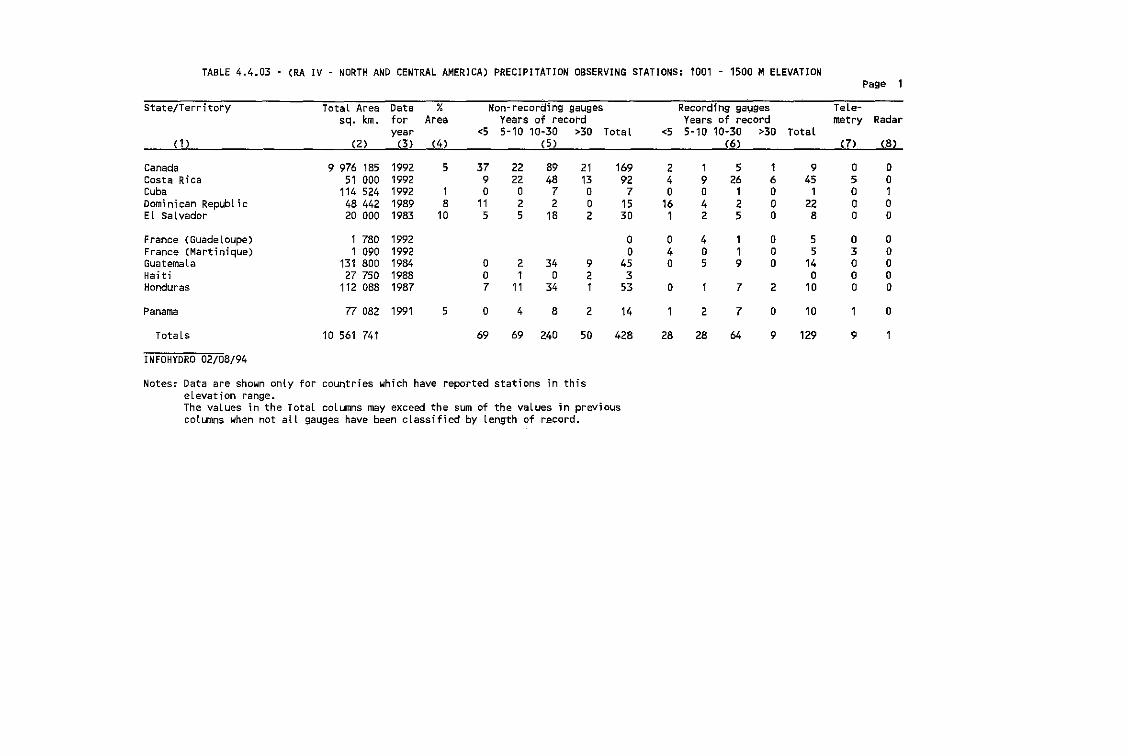
TABLE 4.4.03 (RA IV - NORTH AND CENTRAL AMERICA) PRECIPITATION OBSERVING STATIONS: 1001 - 1500 MELEVATIONPage 1
State/Territory TotatA"rea Data % Non-recording gauges Recording gauges TeLe-sq. km. for Area Years of record Years of record metry Radar
year <5 5-10 10-30 >30 Total <5 5-10 10-30 >30 Total(1) (2) (3) (4) (5 ) (6) (7) (8)
Canada 9 976 185 1992 5 37 22 89 21 169 2 1 5 1 9 0 0Costa Rica 51 000 1992 9 22 48 13 92 4 9 26 6 45 5 0Cuba 114 524 1992 1 0 0 7 0 7 0 0 1 0 1 a 1Dominican Republic 48 442 1989 8 11 2 2 0 15 16 4 2 0 22 0 0El SaLvador 20 000 1983 10 5 5 18 2 30 1 2 5 0 8 0 0
France (Guadeloupe) 1 780 1992 0 0 4 1 0 5 0 0France (Martinique) 1 090 1992 0 4 0 1 0 5 3 0Guatemala 131 800 1984 0 2 34 9 45 0 5 9 0 14 a 0Hai t'i 27 750 1988 0 1 0 2 3 0 a 0Honduras 112 088 1987 7 11 34 1 53 0 1 7 2 10 0 0
Panama 77 082 1991 5 0 4 8 2 14 1 2 7 0 10 1 0
Totals 10 561 741 69 69 240 50 428 28 28 64 9 129 9
INFOHYORO 02/08/94
Notes: Data are shown only for countries which have reported stations in thiselevation range.The values in the Total columns may exceed the sum of the values in previouscolumns when not all gauges have been classified by length of record.
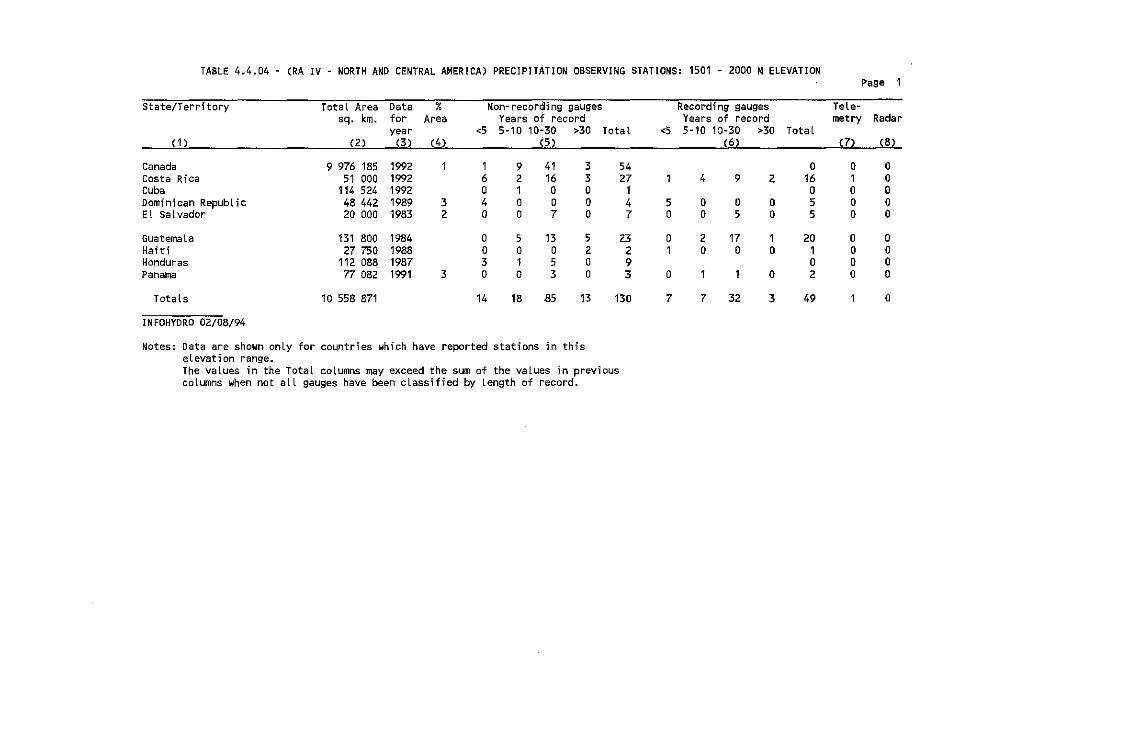
TABLE 4.4.04 - (RA IV - NORTH ANO CENTRAL AMERICA) PRECIPITATION OBSERVING STATIONS: 1501 - 2000 MELEVATIONPage 1
State/Territory Total Area Data % Non-recording gauges Recording gauges Tele-sq. km. for Area Years of record Years of record metry Radar
year <5 5-10 10·30 >30 Total <5 5-10 10-30 >30 Total(1 ) (2) (3) (4) (5 ) (6) (7) (8)
Canada 9 976 185 1992 1 1 9 41 3 54 0 0 0Costa Rica 51 000 1992 6 2 16 3 27 1 4 9 2 16 1 0Cuba 114 524 1992 0 1 0 0 1 0 0 0Dominican Republic 48 442 1989 3 4 0 0 0 4 5 0 0 0 5 0 0El Salvador 20 000 1983 2 0 0 7 0 7 0 0 5 0 5 0 0
Guatemala 131 800 19B4 0 5 13 5 23 0 2 17 1 20 0 0Ha; t; 27 750 1988 0 0 0 2 2 1 0 0 0 1 0 0Honduras 112 088 1987 3 1 5 0 9 0 0 0Panama 77 OB2 1991 3 0 0 3 0 3 0 1 1 0 2 0 0
Totals 10 558 871 14 18 85 13 130 7 7 32 3 49 1 0
INFOHYORO 02/08/94
Notes: Data are shown only for countries which have reported stations in thiselevation range.The values in the Total columns may exceed the sum of the values 1n previouscolumns when not all gauges have been classified by length of record.
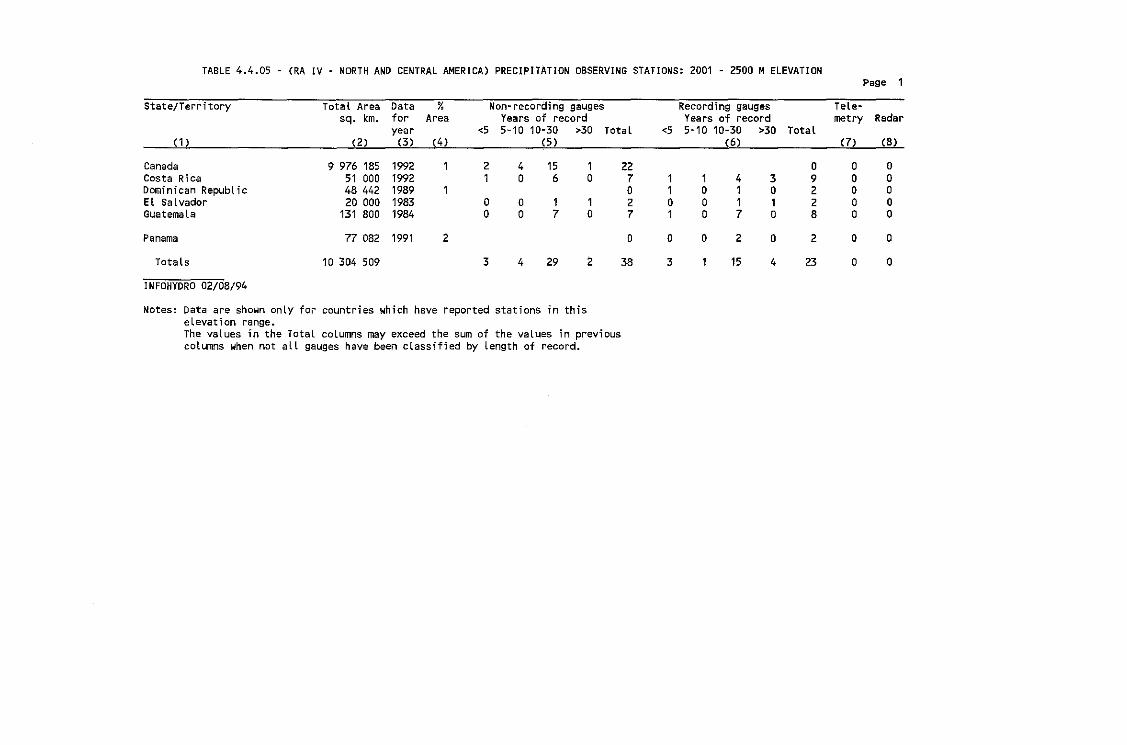
TABLE 4.4.05 - (RA IV - NORTH AND CENTRAL AMERICA) PRECIPITATION OBSERVING STATIONS: 2001 - 2500 MELEVATIONPage 1
State/Territory To-taL Area Data % ------- Non~recording gauges Recording gauges Tele-sq. km. for Area Years of record Years of record metry Radar
year <5 5-10 10"30 >30 TotaL <5 5-10 10-30 >30 TotaL(1 ) (2) (3) (4) (5 ) (6) (7) (8)
Canada 9 976 185 1992 1 2 4 15 1 22 0 0 0Costa Rica 51 000 1992 1 0 6 0 7 1 1 4 3 9 0 0Dominican Republic 48 442 19B9 1 0 1 0 1 0 2 0 0EL SaLvador 20 000 1983 0 0 1 1 2 0 0 1 1 2 0 0Guatemala 131 800 1984 0 0 7 0 7 1 0 7 0 8 0 0
Panama 77 082 1991 2 0 0 0 2 0 2 0 0
Totals 10 304 509 3 4 29 2 38 3 1 15 4 23 0 0
INFOHYORO 02/08/94
Notes: Data are shown only for countries which have reported stations in thiseLevation range.The values in the Total columns may exceed the sum of the vaLues in previouscolumns when not all gauges have been classified by Length of record.
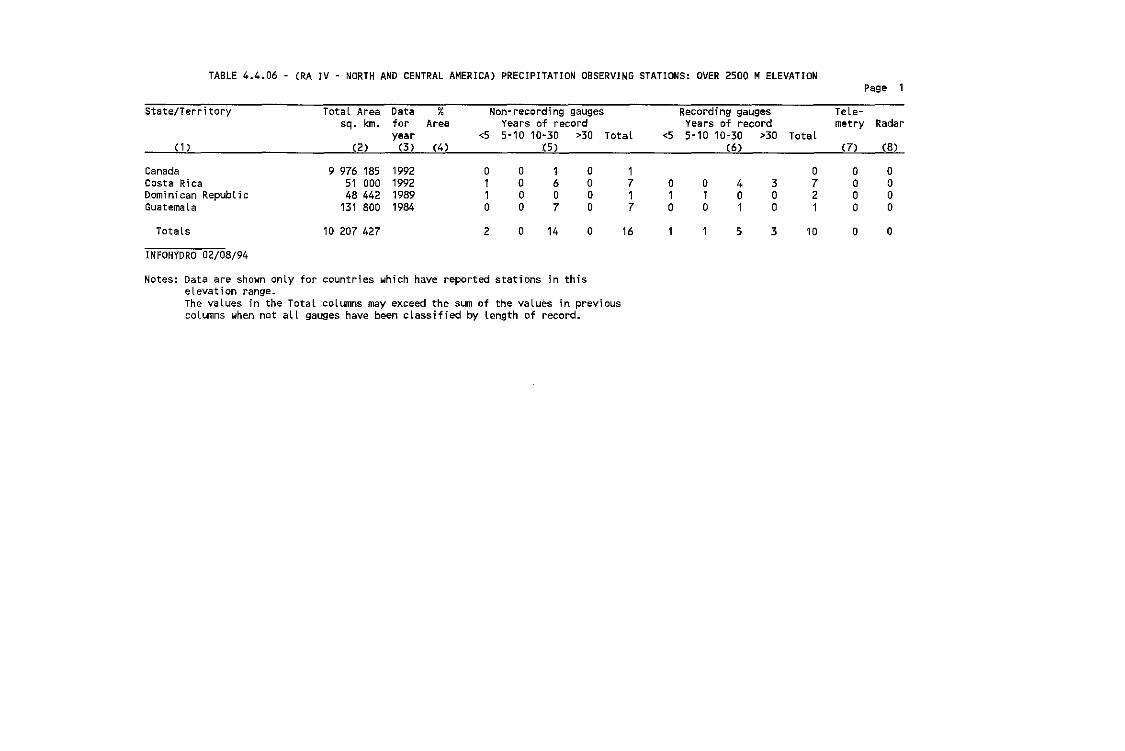
TABLE 4.4.06 - (RA IV - NORTH AND CENTRAL AMERICA) PRECIPITATION OBSERVING STATIONS: OVER 2500 MELEVATIONPage 1
State/Territory Total Area Data % Non-recording gauges Recording gauges Tele-sq. km. for Area Years of record Years of record metry Radar
year <5 5-10 10-30 >30 Total <5 5-10 10-30 >30 Total(1 ) (2) (3 ) (4 ) (5 ) (6) (7) (8)
Canada 9 976 185 1992 0 0 1 0 1 0 0 0Costa Rica 51 000 1992 1 0 6 0 7 0 0 4 3 7 0 0Dominican Republic 48 442 1989 1 0 0 0 1 1 1 0 0 2 0 0Guatemala 131 800 1984 0 0 7 0 7 0 0 1 0 1 0 0
Totals 10 207 427 2 0 14 0 16 1 1 5 3 10 0 0
INFOHYORO 02/08/94
Notes: Data are shown only for countries which have reported stations in thiselevation range.The values in the Total columns may exceed the sum of the values in previouscoLumns when not alL gauges have been classified by length of record.
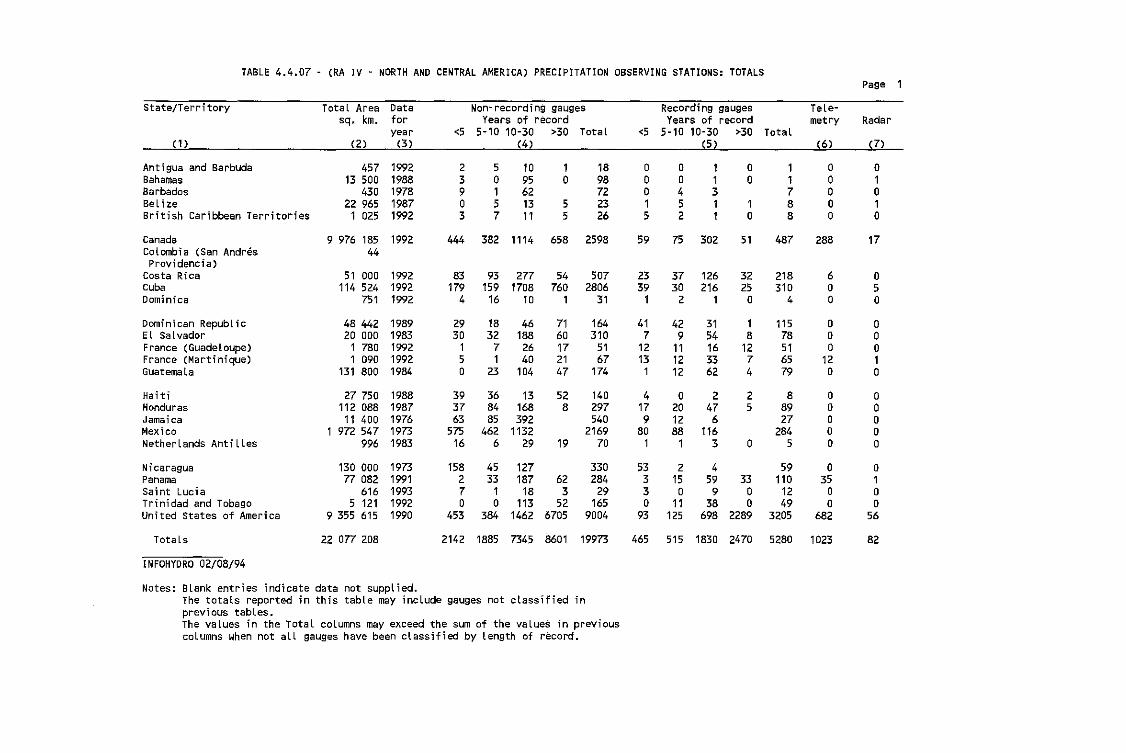
TABLE 4.4.07 - (RA IV - NORTH AND CENTRAL AMERICA) PRECIPITATION OBSERVING STATIONS: TOTALSPage
State/Territory Total Area Data Non~recording gauges Recording gauges Tele-sq. km. for Years of record YeafS of record metry Radar
year <5 5-10 10-30 >30 Total <5 5-10 10-30 >30 Total(1 ) (2) (3) (4) (5 ) (6) (7)
Antigua and Barbuda 457 1992 2 5 10 1 18 0 0 1 0 1 0 0Bahamas 13 500 1988 3 0 95 0 98 0 0 1 0 1 0 1Barbados 430 1978 9 1 62 72 0 4 3 7 0 0BeL lze 22 965 1987 0 5 13 5 23 1 5 1 1 8 0 1British Caribbean Territories 1 025 1992 3 7 11 5 26 5 2 1 0 8 0 0
Canada 9 976 185 1992 444 382 1114 658 2598 59 75 302 51 487 288 17Colombia (San Andres 44
Providenc'ia)Costa Rica 51 000 1992 83 93 277 54 507 23 37 126 32 218 6 0Cuba 114 524 1992 179 159 1708 760 2806 39 30 216 25 310 0 5Dominica 751 1992 4 16 10 1 31 1 2 1 0 4 0 0
Dominican Republic 48 442 1989 29 18 46 71 164 41 42 31 1 115 0 0El Salvador 20 000 1983 30 32 188 60 310 7 9 54 8 78 0 0France (Guadeloupe) 1 780 1992 1 7 26 17 51 12 11 16 12 51 0 0France (Martinique) 1 090 1992 5 1 40 21 67 13 12 33 7 65 12 1Guatemala 131 800 1984 0 23 104 47 174 1 12 62 4 79 0 0
Haiti 27 750 1988 39 36 13 52 140 4 0 2 2 8 0 0Honduras 112 088 1987 37 84 168 8 297 17 20 47 5 89 0 0Jamaica 11 400 1976 63 85 392 540 9 12 6 27 0 0Mexico 1 972 547 1973 575 462 1132 2169 80 88 116 284 0 0Netherlands Antilles 996 1983 16 6 29 19 70 1 1 3 0 5 0 0
Nicaragua 130 000 1973 158 45 127 330 53 2 4 59 0 0Panama 77 082 1991 2 33 187 62 284 3 15 59 33 110 35 1Saint Lucia 616 1993 7 1 18 3 29 3 0 9 0 12 0 0Trinidad and Tobago 5 121 1992 0 0 113 52 165 0 11 38 0 49 0 0United States of America 9 355 615 1990 453 384 1462 6705 9004 93 125 698 2289 3205 682 56
Totals 22 077 208 2142 1885 7345 8601 19973 465 515 1830 2470 5280 1023 82
INFOHYORO 02/08/94
Notes: Blank entries indicate data not supplied.The total,s reported in this table may include gauges not classified inprevious tabLes.The vaLues in the TotaL coLumns may exceed the sum of the vaLues in previouscoLumns when not aLL gauges have been classified by length of record.
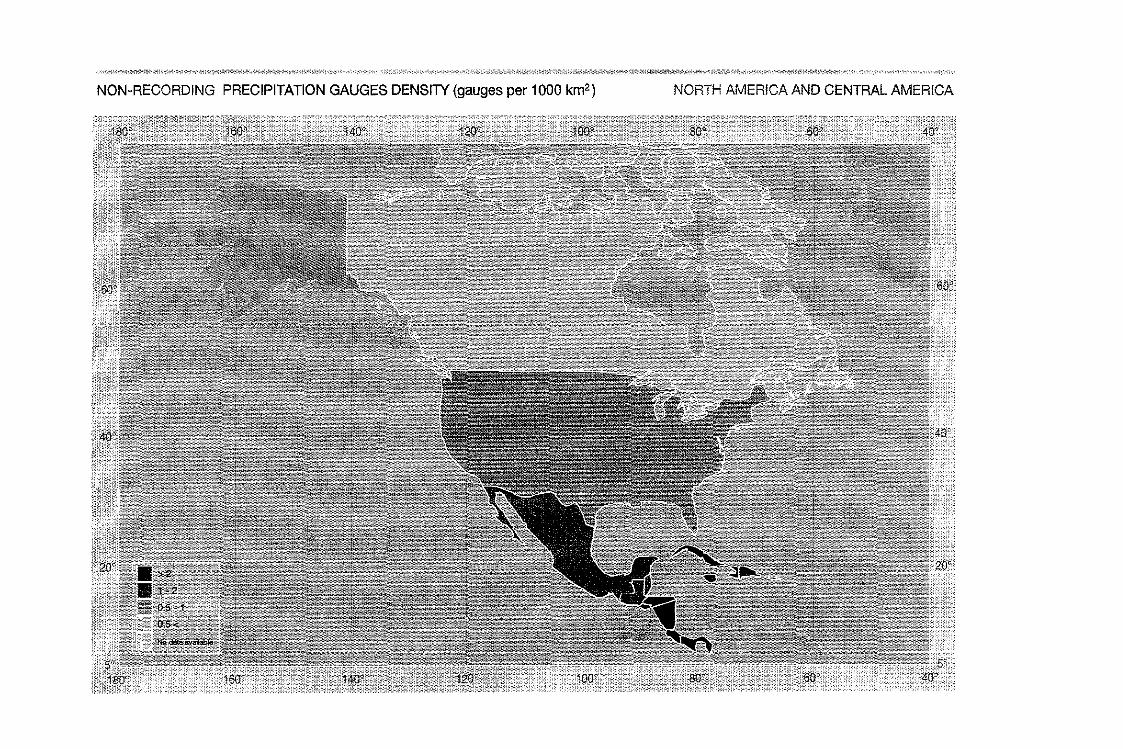
NON-RECORDING PRECIPITATION GAUGES DENSITY (gauges per 1000 km2 ) NORTH AMERICA AND CENTRAL AMERICA
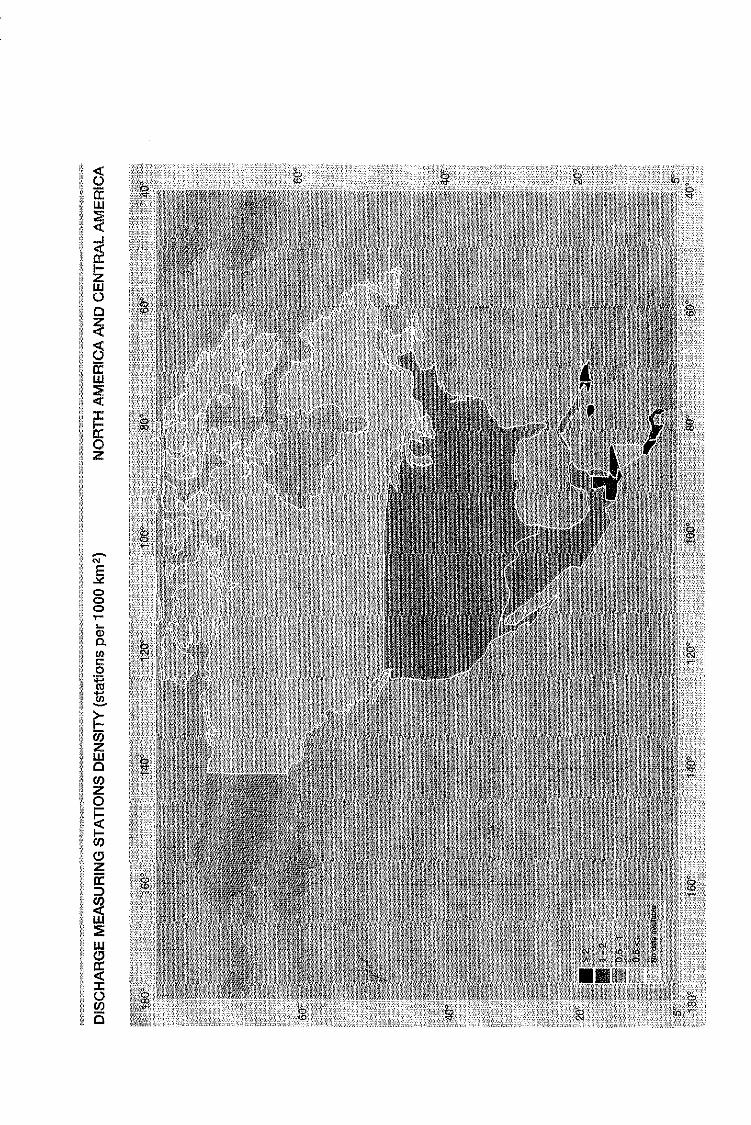
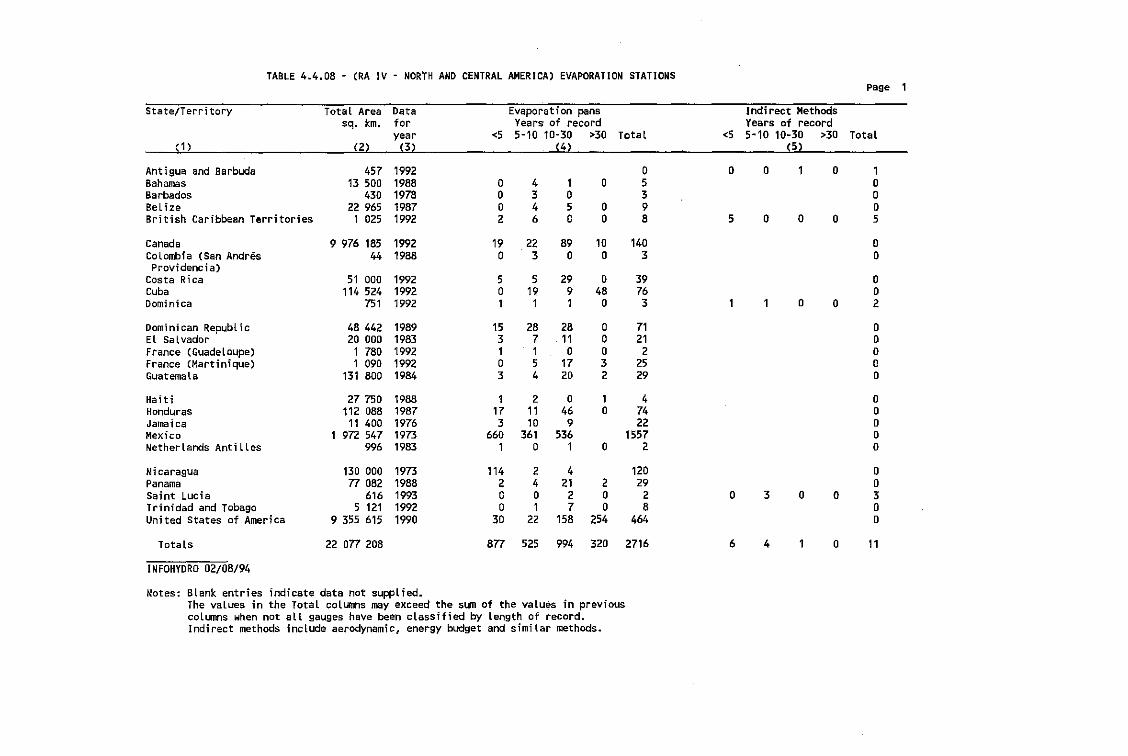
TABLE 4.4.08 - (RA IV - NORTH AND CENTRAL AMERICA) EVAPORATION STATIONSPage 1
State/Territory TotaL Area Data Evaporation pans Indirect Methodssq. km. for Years of record Years of record
year <5 5-10 10-30 >30 TotaL <5 5-10 10-30 >30 Total(1 ) (2) (3) (4) (5)
Antigua and Barbuda 457 1992 a a a 1 a 1Bahamas 13 500 1988 a 4 1 a 5 aBarbados 430 1978 a 3 a 3 aBel ize 22 965 1987 a 4 5 a 9 aBritish Caribbean Territories 1 025 1992 2 6 a a 8 5 a a a 5
Canada 9 976 185 1992 19 22 89 10 140 0Colombia (San Andres 44 1988 0 3 a a 3 0Providencia)
Costa Rica 51 000 1992 5 5 29 a 39 0Cuba 114 524 1992 a 19 9 48 76 aDominica 751 1992 1 1 1 a 3 1 1 0 a 2
Dominican RepubLic 48 442 1989 15 28 28 a 71 0El Salvador 20 000 1983 3 7 11 a 21 aFrance (GuadeLoupe) 1 780 1992 1 1 a a 2 aFrance (Martinique) 1 090 1992 0 5 17 3 25 aGuatemala 131 800 1984 3 4 20 2 29 a
Haiti 27 750 1988 1 2 a 1 4 0Honduras 112 088 1987 17 11 46 a 74 aJamaica 11 400 1976 3 10 9 22 0Mexico 1 972 547 1973 660 361 536 1557 aNetherlands AntilLes 996 1983 1 a 1 a 2 0
Nicaragua 130 000 1973 114 2 4 120 0Panama n 082 1988 2 4 21 2 29 0Saint Lucia 616 1993 a a 2 a 2 0 3 a a 3Trinidad and Tobago 5 121 1992 a 1 7 a 8 0United States of America 9 355 615 1990 30 22 158 254 464 0
Totals 22 on 208 877 525 994 320 2716 6 4 1 a 11
INFOHYORO 02/08/94
Notes: Blank entries indicate data not supplied.The vaLues in the Total columns may exceed the sum of the values in previouscolumns when not all gauges have been classified by length of record.Indirect methods include aerodynamic, energy budget and similar methods.
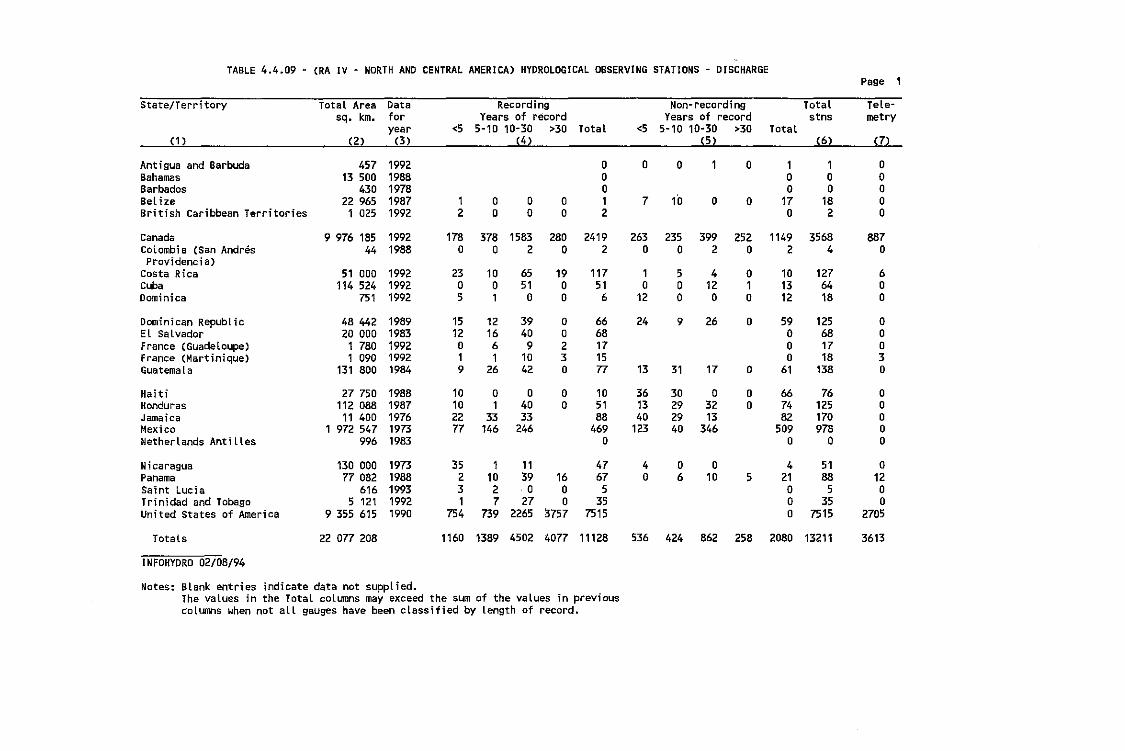
TABLE 4.4.09 - (RA IV - NORTH AND CENTRAL AMERICA) HYDROLOGICAL OBSERVING STATIONS - DISCHARGEPage 1
State/Territory Total Area Data Recording Non-recording Total Tele-sq. km. for Years of record Years of record stns metry
year <5 5-10 10-30 >30 Total <5 5-10 10-30 >30 Total(1 ) (2) (3 ) (4) (5 ) (6) (7)
Antigua and Barbuda 457 1992 0 0 0 1 0 1 1 0Bahamas 13 500 1988 0 0 0 0Barbados 430 1978 0 0 0 0BeLize 22 965 1987 1 0 0 0 1 7 10 0 0 17 18 0British Caribbean Territories 1 025 1992 2 0 0 0 2 0 2 0
Canada 9 976 185 1992 178 378 1583 280 2419 263 235 399 252 1149 3568 887Colombia (San Andres 44 1988 0 0 2 0 2 0 0 2 0 2 4 0Providencia)
Costa Rica 51 000 1992 23 10 65 19 117 1 5 4 0 10 127 6Cuba 114 524 1992 0 0 51 0 51 0 0 12 1 13 64 0Dominica 751 1992 5 1 0 0 6 12 0 0 0 12 18 0
Dominican Republic 48 442 1989 15 12 39 0 66 24 9 26 0 59 125 0EL Salvador 20 000 1983 12 16 40 0 68 0 68 0France (Guadeloupe) 1 780 1992 0 6 9 2 17 0 17 0France (Martinique) 1 090 1992 1 1 10 3 15 0 18 3Guatemala 131 800 1984 9 26 42 0 77 13 31 17 0 61 138 0
Haiti 27 750 1988 10 0 0 0 10 36 30 0 0 66 76 0Honduras 112 088 1987 10 1 40 0 51 13 29 32 0 74 125 0Jamaica 11 400 1976 22 33 33 88 40 29 13 82 170 0Mexico 1 972 547 1973 77 146 246 469 123 40 346 509 978 0NetherLands Antilles 996 1983 0 0 0 0
Nicaragua 130 000 1973 35 1 11 47 4 0 0 4 51 0Panama 77 082 1988 2 10 39 16 67 0 6 10 5 21 88 12Saint Lucia 616 1993 3 2 0 0 5 0 5 0Trinidad and Tobago 5 121 1992 1 7 27 0 35 0 35 0United States of America 9 355 615 1990 754 739 2265 3757 7515 0 7515 2705
Totals 22 077 208 1160 1389 4502 4077 11128 536 424 862 258 2080 13211 3613
INFOHYDRO 02/08/94
Notes: Blank entries indicate data not supplied.The values in the Total coLumns may exceed the sum of the values in previouscolumns when not all gauges have been classified by length of record.
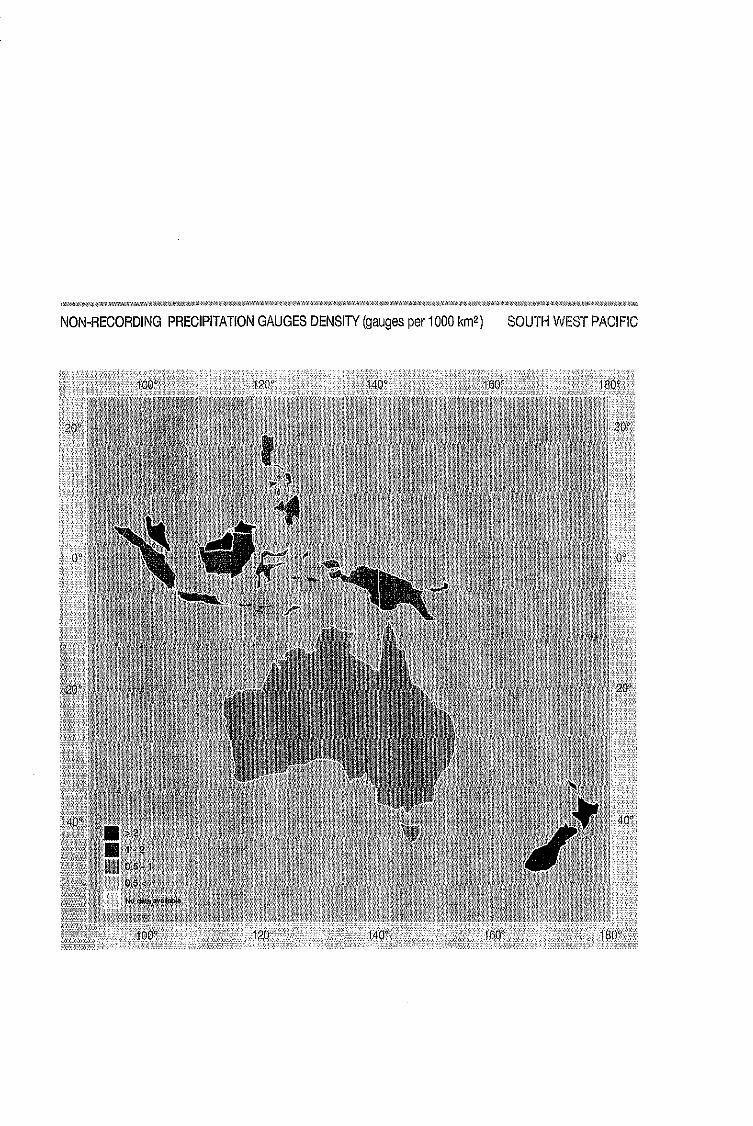
NON-RECORDING PRECIPITATION GAUGES DENSITY (gauges per 1000 km2) SOUTH WEST PACIFIC
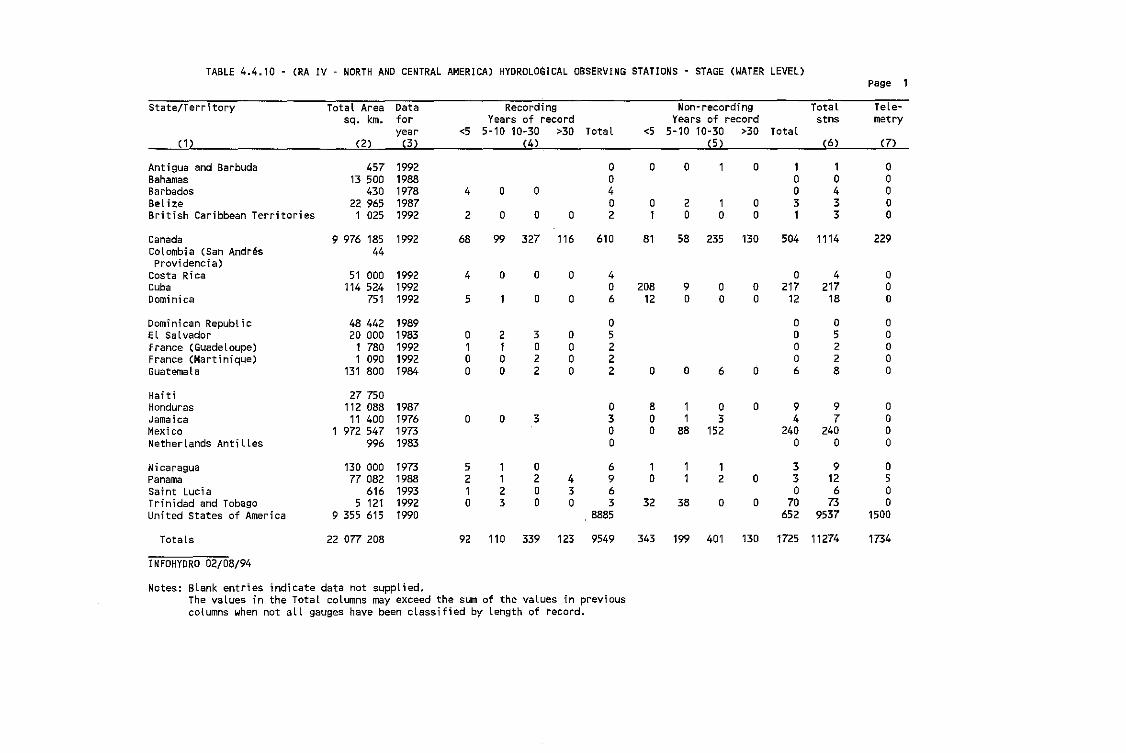
TABLE 4.4.10 - (RA IV - NORTH AND CENTRAL AMERICA) HYOROLO~ICAL OBSERVING STATIONS - STAGE (WATER LEVEL)Page 1
State/Territory Total Area Data Recording Non-recording Total reLe-sq. km. for Years of record Years of record stns metry
year <5 5-10 10-30 >30 Total <5 5-10 10-30 >30 Total(1 ) (2) (3) (4) (5 ) (6) (7)
Antigua and Barbuda 457 1992 0 0 0 1 0 1 1 0Bahamas 13 500 1988 0 0 0 0Barbados 430 1978 4 0 0 4 0 4 0Bel ize 22 965 1987 0 0 2 1 0 3 3 0British Caribbean Territories 1 025 1992 2 0 0 0 2 1 0 0 0 1 3 0
Canada 9 976 185 1992 68 99 327 116 610 81 58 235 130 504 1114 229Colombia (San Andres 44Providencia)
Costa Ri ca 51 000 1992 4 0 0 0 4 0 4 0Cuba 114 524 1992 0 208 9 0 0 217 217 0Dominica 751 1992 5 1 0 0 6 12 0 0 0 12 18 0
Dominican Republic 48 442 1989 0 0 0 0El Salvador 20 000 1983 0 2 3 0 5 0 5 0France (GuadeLoupe) 1 780 1992 1 1 0 0 2 0 2 0France (Martinique) 1 090 1992 0 0 2 0 2 0 2 0Guatemala 131 800 1984 0 0 2 0 2 0 0 6 0 6 8 0
Haiti 27 750Honduras 112 088 1987 0 8 1 0 0 9 9 0Jamaica 11 400 1976 0 0 3 3 0 1 3 4 7 0Mexi co 1 972 547 1973 0 0 88 152 240 240 0NetherLands AntiLles 996 1983 0 0 0 0
Ni caragua 130 000 1973 5 1 0 6 1 1 1 3 9 0Panama 77 082 1988 2 1 2 4 9 0 1 2 0 3 12 5Saint Lucia 616 1993 1 2 0 3 6 0 6 0Trinidad and Tobago 5 121 1992 0 3 0 0 3 32 38 0 0 70 73 0United States of America 9 355 615 1990 8885 652 9537 1500
Totals 22 077 208 92 110 339 123 9549 343 199 401 130 1725 11274 1734
INFOHYORO 02/08/94
Notes: BLank entrles indicate data not supplied.The values in the Total columns may exceed the sum of the values in previouscolumns when not all gauges have been classified by length of record.
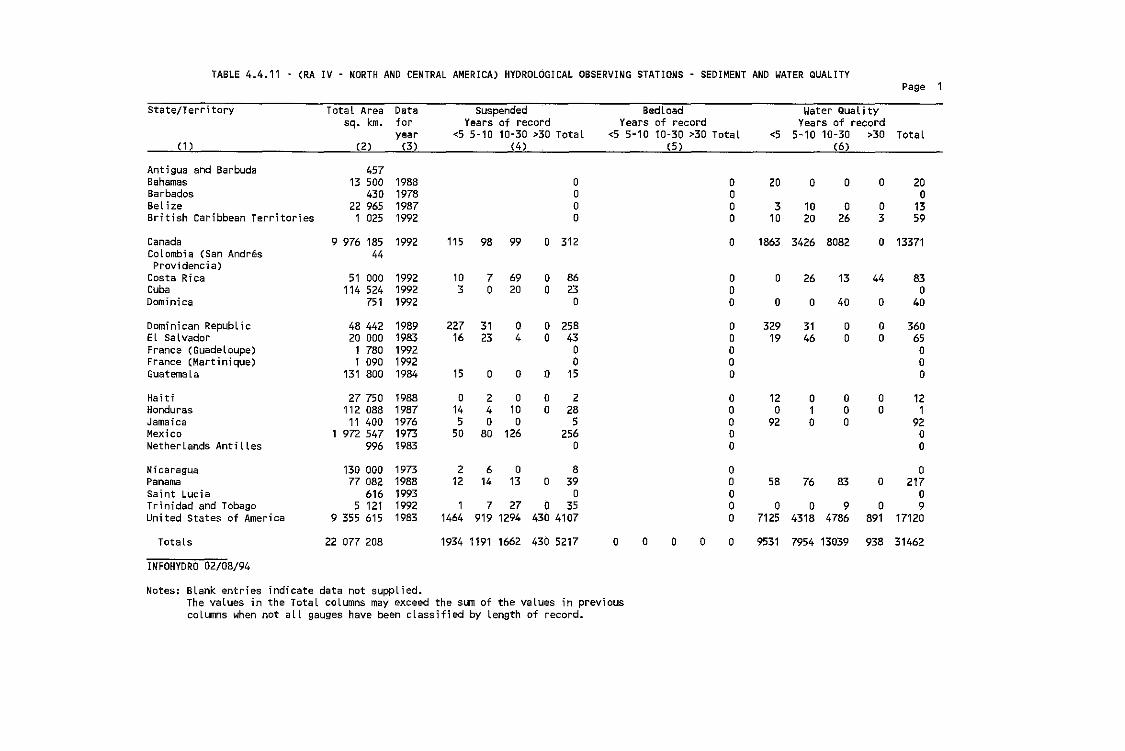
TABLE 4.4.11 - (RA IV - NORTH AND CENTRAL AMERICA) HYDROLOGICAL OBSERVING STATIONS - SEDIMENT AND WATER QUALITYPage 1
State/Territory Total Area Data Suspended Bedload Water Qual i tysq. km. for Years of record Years of record Years of record
year <5 5-10 10-30 >30 Total <5 5-10 10-30 >30 Total <5 5·10 10-30 >30 TotaL(1 ) (2) (3 ) (4) (5 ) (6)
Antigua and Barbuda 457Bahamas 13 500 1988 0 0 20 0 0 0 20Barbados 430 1978 0 0 0Bel ize 22 965 1987 0 0 3 10 0 0 13British Caribbean Territories 1 025 1992 0 0 10 20 26 3 59
Canada 9 976 185 1992 115 98 99 0 312 0 1863 3426 8082 0 13371Colombia (San Andres 44Providencia>
Costa Rica 51 000 1992 10 7 69 0 86 0 0 26 13 44 83Cuba 114 524 1992 3 0 20 0 23 0 0Domini ca 751 1992 0 0 0 0 40 0 40
Dominican RepubLic 48 442 1989 227 31 0 0 258 0 329 31 0 0 360El Salvador 20 000 1983 16 23 4 '0 43 0 19 46 0 0 65France (Guadeloupe) 1 780 1992 0 0 0France (Martinique) 1 090 1992 0 0 0Guatema La 131 800 1984 15 0 0 0 15 0 0
Ha; ti 27 750 1988 0 2 0 0 2 0 12 0 0 0 12Honduras 112 088 1987 14 4 10 0 28 0 0 1 0 0 1Jamai ca 11 400 1976 5 0 0 5 0 92 0 0 92Mexico 1 972 547 1973 50 80 126 256 0 0Netherlands AntiLles 996 1983 0 0 0
Ni caragua 130 000 1973 2 6 0 8 0 0Panama 77 082 1988 12 14 13 0 39 0 58 76 83 0 217Saint Lucia 616 1993 0 0 0Trinidad and Tobago 5 121 1992 1 7 27 0 35 0 0 0 9 0 9United States of America 9 355 615 1983 1464 919 1294 430 4107 0 7125 4318 4786 891 17120
Totals 22 077 208 1934 1191 1662 430 5217 0 0 0 0 0 9531 7954 13039 938 31462
INFOHYORO 02/08/94
Notes: Blank entries indicate data not supplied.The values in the TotaL coLumns may exceed the sum of the vaLues in previouscolumns when not all gauges have been classified by Length of record.
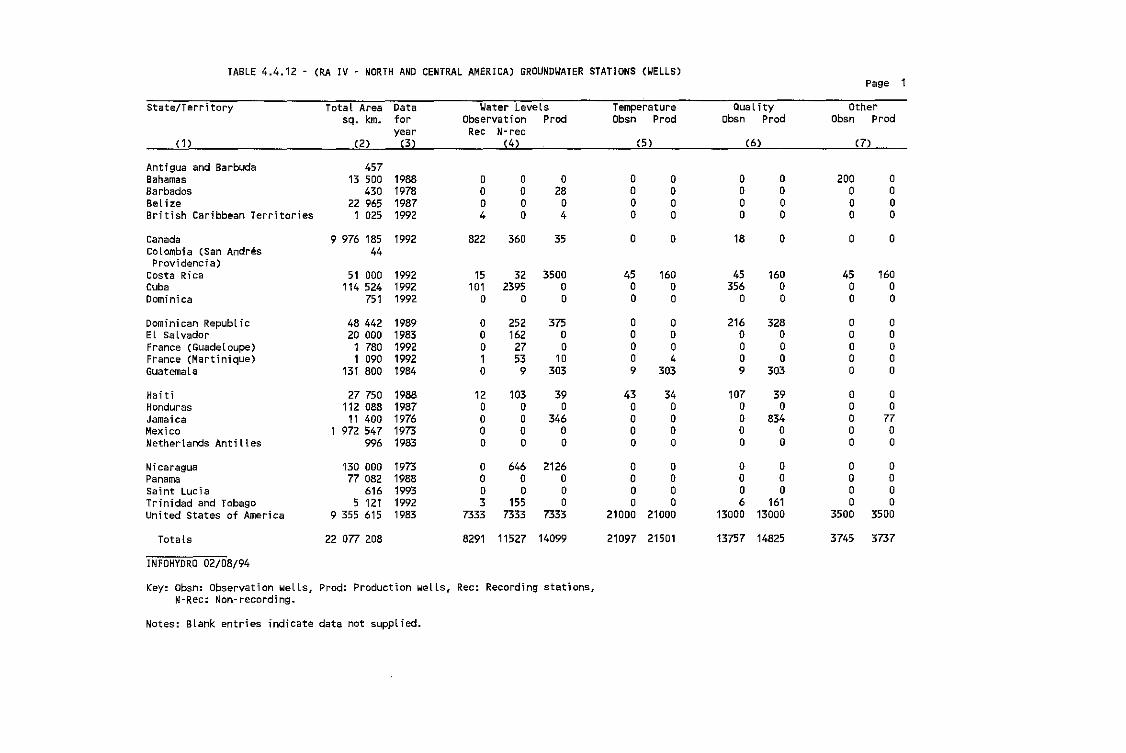
TABLE 4.4.12 (RA IV - NORTH AND CENTRAL AMERICA) GROUNDWATER STATIONS (WELLS)Page 1
State/Territory Total Area Data Water Levels Temperature QuaL fty Othersq. km. for Observat; on Prod Obsn Prod Obsn Prod Obsn Prod
year Rec N- rec(1 ) (2) (3) (4) (5 ) (6) (7)
Antigua and Barbuda 457Bahamas 13 5DD 1988 D 0 0 0 0 0 0 200 0Barbados 430 1978 0 0 28 0 0 0 0 0 0BeLize 22 965 1987 0 0 0 0 0 0 0 0 0British Caribbean Territories 1 025 1992 4 0 4 0 0 0 0 0 0
Canada 9 976 185 1992 822 360 35 0 0 18 0 0 0Colombia (San Andres 44Providencia)
Costa Rica 51 000 1992 15 32 3500 45 160 45 160 45 160Cuba 114 524 1992 101 2395 0 0 0 356 0 0 0Dominica 751 1992 0 0 0 0 0 0 0 0 0
Dominican RepUblic 48 442 1989 0 252 375 0 0 216 328 0 0El Salvador 20 000 1983 0 162 0 0 0 0 0 a 0France (Guadeloupe) 1 780 1992 0 27 0 0 0 0 0 a 0France (Martinique) 1 090 1992 1 53 10 0 4 0 0 0 aGuatemala 131 800 1984 a 9 303 9 303 9 303 a a
Ha; t; 27 750 1988 12 103 39 43 34 107 39 a aHonduras 112 088 1987 0 0 0 a 0 0 0 a 0Jamaica 11 400 1976 0 0 346 a 0 0 834 a 77Mexico 1 972 547 1973 0 a 0 0 0 0 0 a aNetherlands Antilles 996 1983 0 a 0 0 0 a a 0 a
Nicaragua 130 000 1973 a 646 2126 0 0 a 0 0 0Panama 77 082 1988 0 0 0 0 0 a a 0 aSaint lucia 616 1993 0 0 0 0 0 0 0 0 aTrinidad and Tobago 5 121 1992 3 155 0 D 0 6 161 0 0United States of America 9 355 615 1983 7333 7333 7333 21000 21000 13000 13000 3500 35DO
Totals 22 077 208 8291 11527 14099 21097 21501 13757 14825 3745 3737
INFOHYDRO 02/08/94
Key: obsn: Observation weLls, Prod: Productlon wells, Rec: Recording stations,N-Rec: Non-recording.
Notes: Blank entries indicate data not supplied.
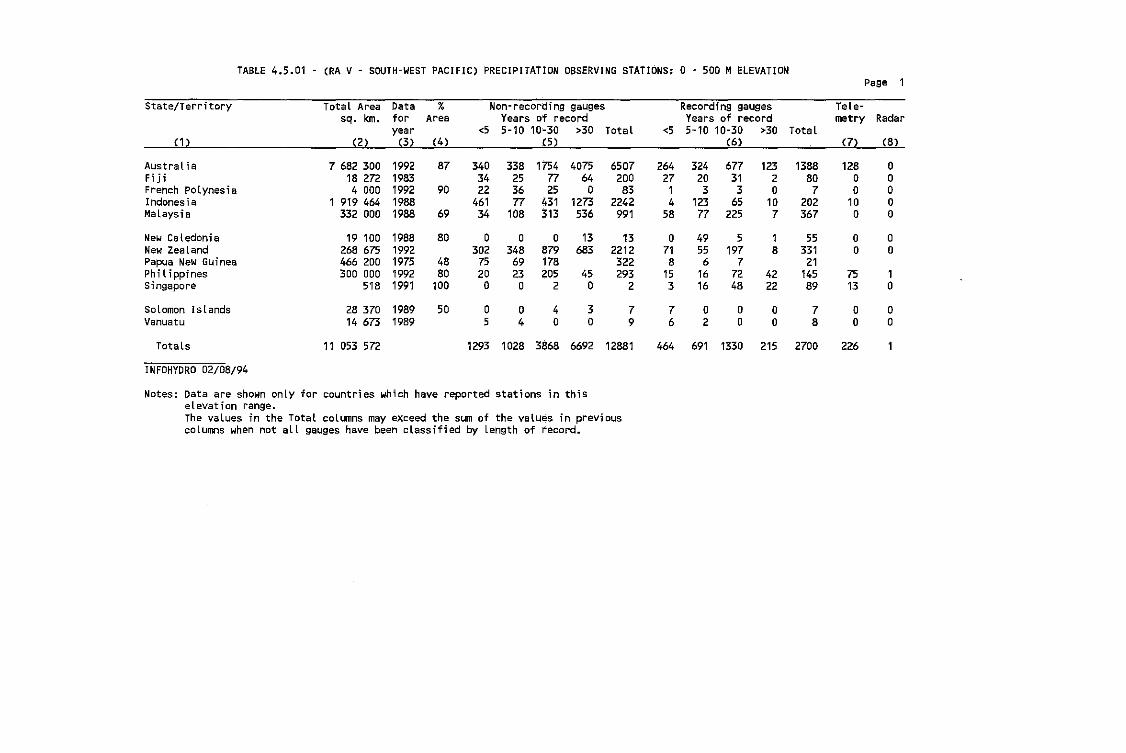
TABLE 4.5.01 (RA V - SOUTH-WEST PACIFIC) PRECIPITATION OBSERVING STATIONS: 0 - 500 MELEVATIONPage 1
State/Territory Total Area Data % Non-recording gauges Recording gauges Tele-sq. km. for Area Years of record Years of record metry Radar
year <5 5-10 10"30 >30 Total <5 5-10 10-30 >30 Total(1 ) (2 ) (3) (4) (5 ) (6) (7) (8)
Austral ia 7 682 300 1992 87 340 338 1754 4075 6507 264 324 677 123 1388 128 0Fiji 18 272 1983 34 25 77 64 200 27 20 31 2 80 0 0French polynesia 4 000 1992 90 22 36 25 0 83 1 3 3 0 7 0 0Indonesi a 1 919 464 1988 461 77 431 1273 2242 4 123 65 10 202 10 0MaLaysia 332 000 1988 69 34 108 313 536 991 58 77 225 7 367 0 0
New Caledonia 19 100 1988 80 0 0 0 13 13 0 49 5 1 55 0 0New Zealand 268 675 1992 302 348 879 683 2212 71 55 197 8 331 0 0Papua New Guinea 466 200 1975 48 75 69 178 322 8 6 7 21Philippines 300 000 1992 80 20 23 205 45 293 15 16 72 42 145 75 1Singapore 518 1991 100 0 0 2 0 2 3 16 48 22 89 13 0
SoLomon Islands 28 370 1989 50 0 0 4 3 7 7 0 0 0 7 0 0Vanuatu 14 673 1989 5 4 0 0 9 6 2 0 0 8 0 0
Totals 11 053 572 1293 1028 3868 6692 12881 464 691 1330 215 2700 226
INFOHYORO 02/08/94
Notes: Data are shown only for countries which have reported stations in thiselevation range.The values in the Total coLumns may exceed the sum of the values in previouscolumns when not all gauges have been classified by length of record.
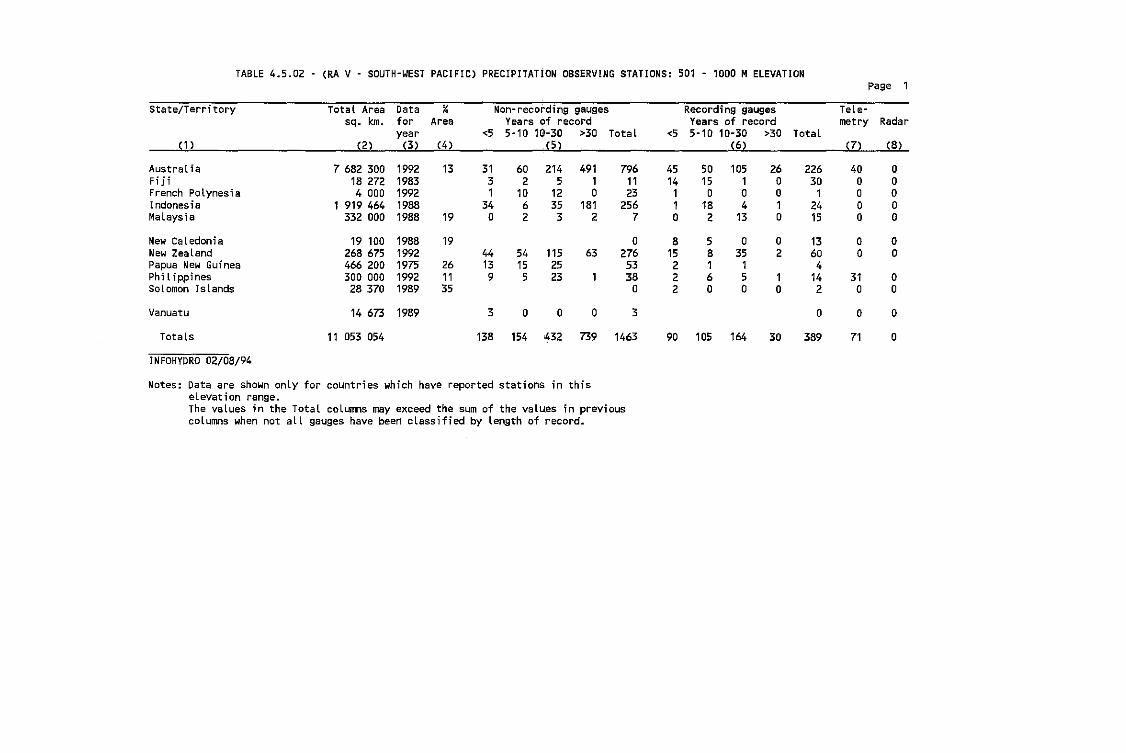
TABLE 4.5.02 (RA V - SOUTH-WEST PACIFIC) PRECIPITATION OBSERVING STATIONS: 501 - 1000 MELEVATIONPage 1
State/Territory Total Area Data % --- -Non-recording gauges Recording gauges Tele-sq. km. for Area Years Of record Years of record metry Radar
year <5 5-10 lQ-30 >30 Total <5 5-10 10-30 >30 Total(1 ) (2) (3 ) (4) (5 ) (6) (7) (8)
Austral ia 7 682 300 1992 13 31 60 214 491 796 45 50 105 26 226 40 0Fiji 18 272 1983 3 2 5 1 11 14 15 1 0 30 0 0French Polynesia 4 000 1992 1 10 12 0 23 1 0 0 0 1 0 0Indonesia 1 919 464 1988 34 6 35 181 256 1 18 4 1 24 0 0Malaysia 332 000 1988 19 0 2 3 2 7 0 2 13 0 15 0 0
New Caledonia 19 100 1988 19 0 8 5 0 0 13 0 0New Zealand 268 675 1992 44 54 115 63 276 15 8 35 2 60 0 0Papua New Guinea 466 200 1975 26 13 15 25 53 2 1 1 4Phil ippines 300 000 1992 11 9 5 23 1 38 2 6 5 1 14 31 0Solomon Islands 28 370 1989 35 0 2 0 0 0 2 0 0
Vanuatu 14 673 1989 3 0 0 0 3 0 0 0
Totals 11 053 054 138 154 ,432 739 1463 90 105 164 30 389 71 0
INFOHYORO 02/08/94
Notes: Data are shown only for countries which have reported stations in thiselevation range.The values in the TotaL coLumns may exceed the sum of the vaLues in previouscolumns when not all gauges have been classified by length of :record.
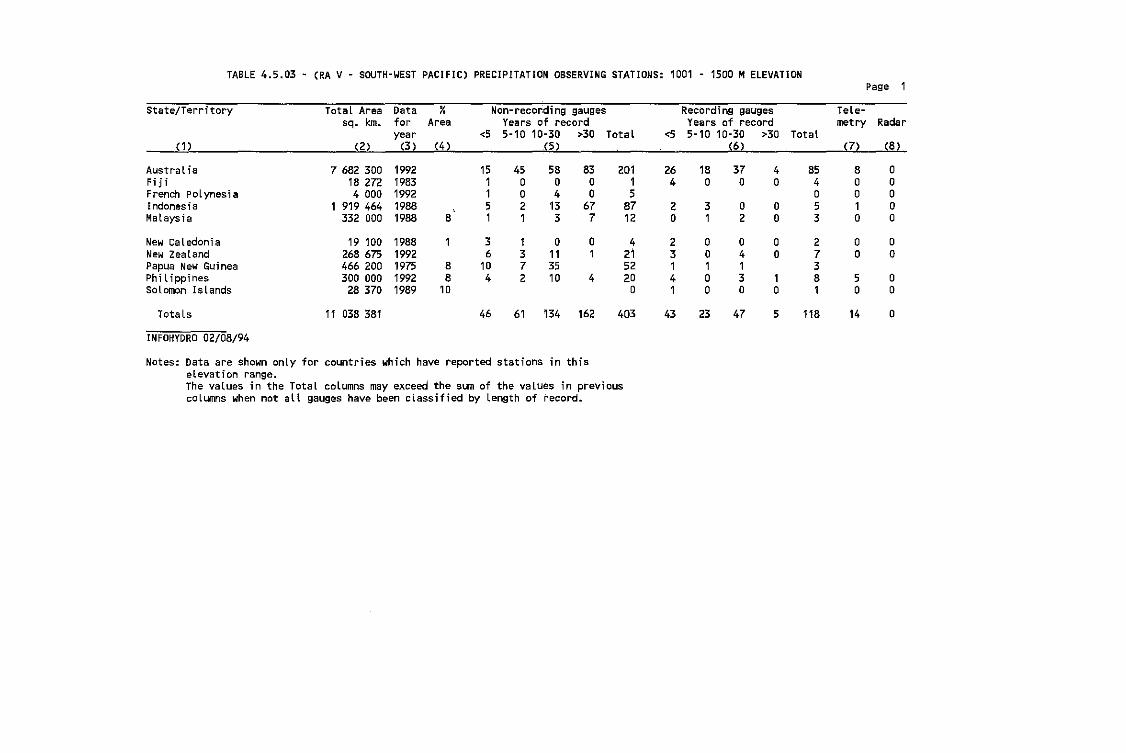
TABL. 4.5.03 (RA v - SOUTH-WEST PACIFIC) PRECIPITATION OBSERVING STATIONS: 1001 - 1500 MELEVATIONPage 1
State/Territory Total Area Data % Non-reco~ding gauges Recording gauges Tele-sq. km. for Area Years of record Years of record metry Radar
year <5 5-10 10-30 >30 TotaL <5 5-10 10-30 >30 Total(1 ) (2) (3 ) (4) (5 ) (6) (7) (8)
Austral ia 7 682 300 1992 15 45 58 83 201 26 18 37 4 85 8 0Fiji 18 272 1983 1 0 0 0 1 4 0 0 0 4 0 0French polynesia 4 000 1992 1 0 4 0 5 0 0 0Indonesia 1 919 464 1988 5 2 13 67 87 2 3 0 0 5 1 0Malaysia 332 000 1988 8 1 1 3 7 12 0 1 2 0 3 0 0
New Caledonia 19 100 1988 1 3 1 0 0 4 2 0 0 0 2 0 0New Zealand 268 675 1992 6 3 11 1 21 3 0 4 0 7 0 0Papua New Gui nea 466 200 1975 8 10 7 35 52 1 1 1 3Phi 1ippines 300 000 1992 8 4 2 10 4 20 4 0 3 1 8 5 0Solomon Islands 28 370 1989 10 0 1 0 0 0 1 0 0
Totals 11 038 381 46 61 134 162 403 43 23 47 5 118 14 0
INFOHYDRO 02/08/94
Notes: Data are shown only for countries which have reported stations in thiselevation range.The values in the Total columns may exceed the sum of the values in previouscolumns when not all gauges have been classified by length of record.
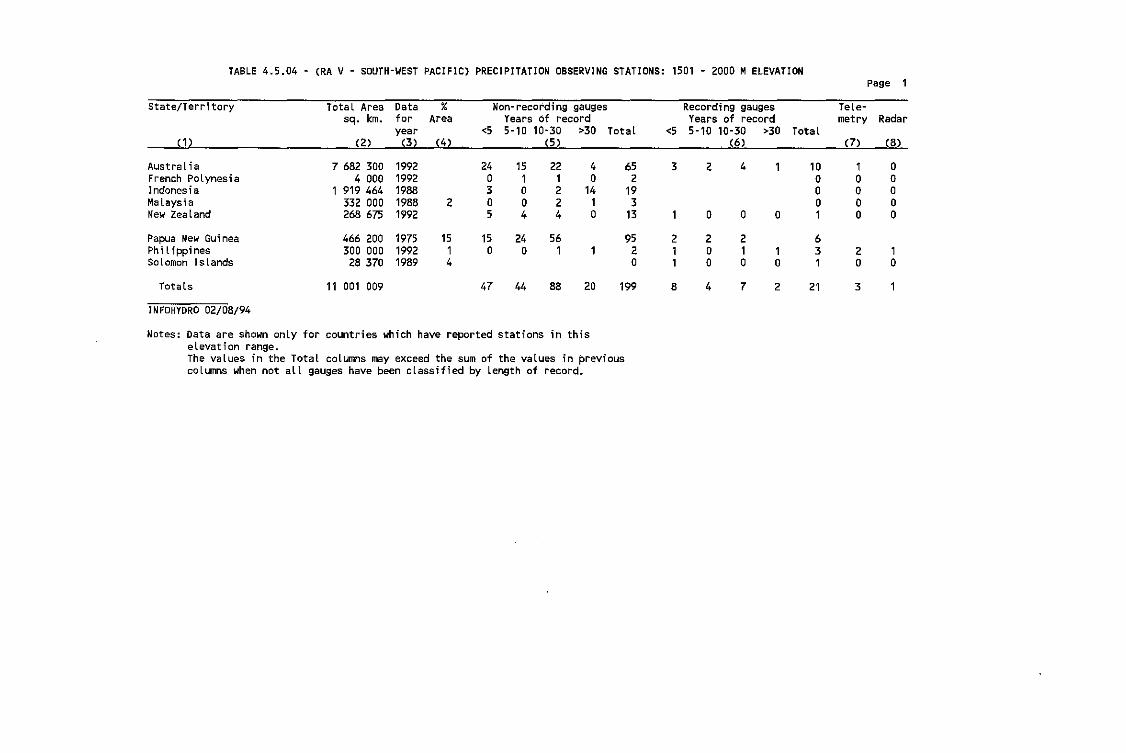
TABLE 4.5.04 (RA V - SOUTH-WEST PACIFIC) PRECIPITATION OBSERVING STATIONS: 1501 - 2000 MELEVATIONPage 1
State/Territory TotaL Area Data % Non-recording gauges Recording gauges Tele-sq. km. for Area Years of record Years of record metry Radar
year <5 5-10 10-30 >30 Total <5 5-10 10-30 >30 Total(1) (2) (3) (4) (5) (6) (7) (8)
Austral ia 7 682 300 1992 24 15 22 4 65 3 2 4 1 10 1 0French PoLynesia 4 000 1992 0 1 1 0 2 0 0 0Indonesia 1 919 464 1988 3 0 2 14 19 0 0 0Malaysia 332 000 1988 2 0 0 2 1 3 0 0 0New Zealand 268 675 1992 5 4 4 0 13 1 0 0 0 1 0 0
Papua New Guinea 466 200 1975 15 15 24 56 95 2 2 2 6Phil ippines 300 000 1992 1 0 0 1 1 2 1 0 1 1 3 2 1Solomon Islands 28 370 1989 4 0 1 0 0 0 1 0 0
Totals 11 001 009 47 44 88 20 199 8 4 7 2 21 3
INFOHYDRO 02/08/94
Notes: Data are shown only for countries which have reported stations in thiselevation range.The values in the Total columns may exceed the sum of the values in previouscoLumns when not all gauges have been classified by length of record.
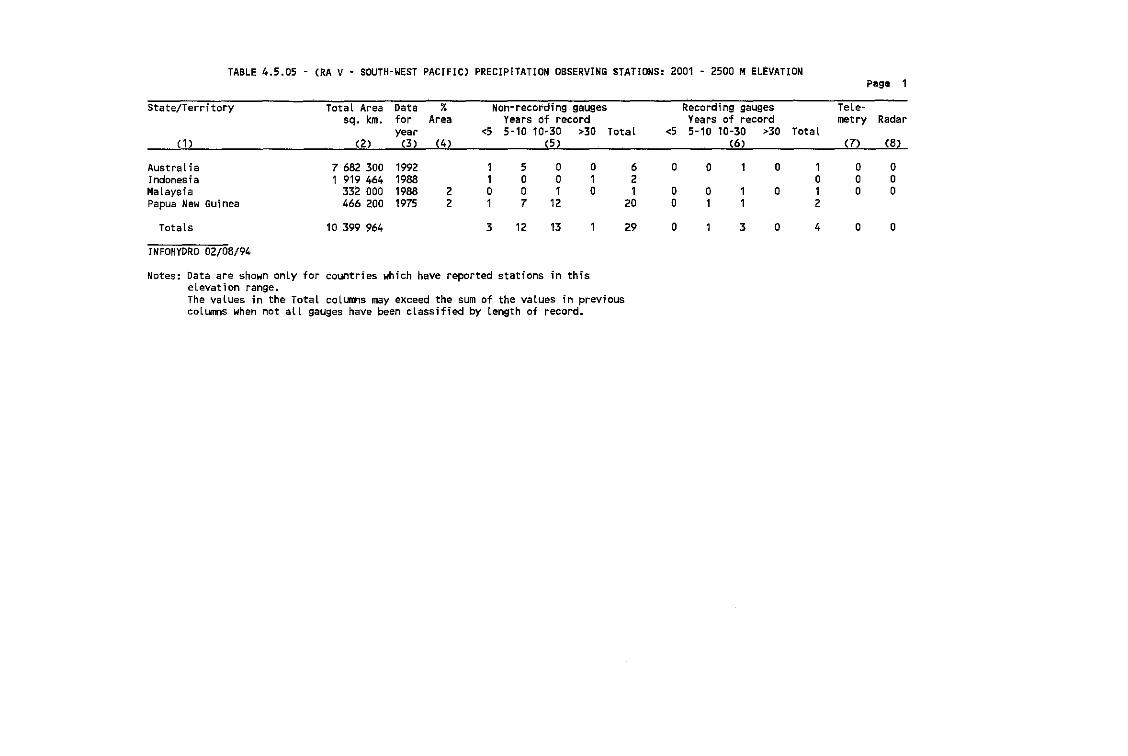
TABLE 4.5.05 - (RA V - SOUTH-WEST PACIFIC) PRECIPITATION OBSERVING STATIONS: 2001 - 2500 MELEVATIONPage 1
State/Territory Total Area Data % Non~recording gauges Recording gauges Tele~
sq. km. for Area Years Cif record Years of record metry Radaryear <5 5-10 10-30 >30 Total <5 5-10 10-30 >30 Total
(1 ) (2) (3 ) (4) (5 ) (6) (7) (8)
Austral ia 7 682 300 1992 1 5 0 0 6 0 0 1 0 1 0 0Indonesia 1 919 464 1988 1 0 0 1 2 0 0 0Malaysia 332 000 1988 2 0 0 1 0 1 0 0 1 0 1 0 0Papua New Guinea 466 200 1975 2 1 7 12 20 0 1 1 2
Totals 10 399 964 3 12 13 1 29 0 1 3 0 4 0 0
INFOHYORO 02/08/94
Notes: Data are shown only for countries which have reported stations in thiselevation range.The values in the Total columns may exceed the sum of the values in previouscolumns when not all gauges have been classified by length of record.
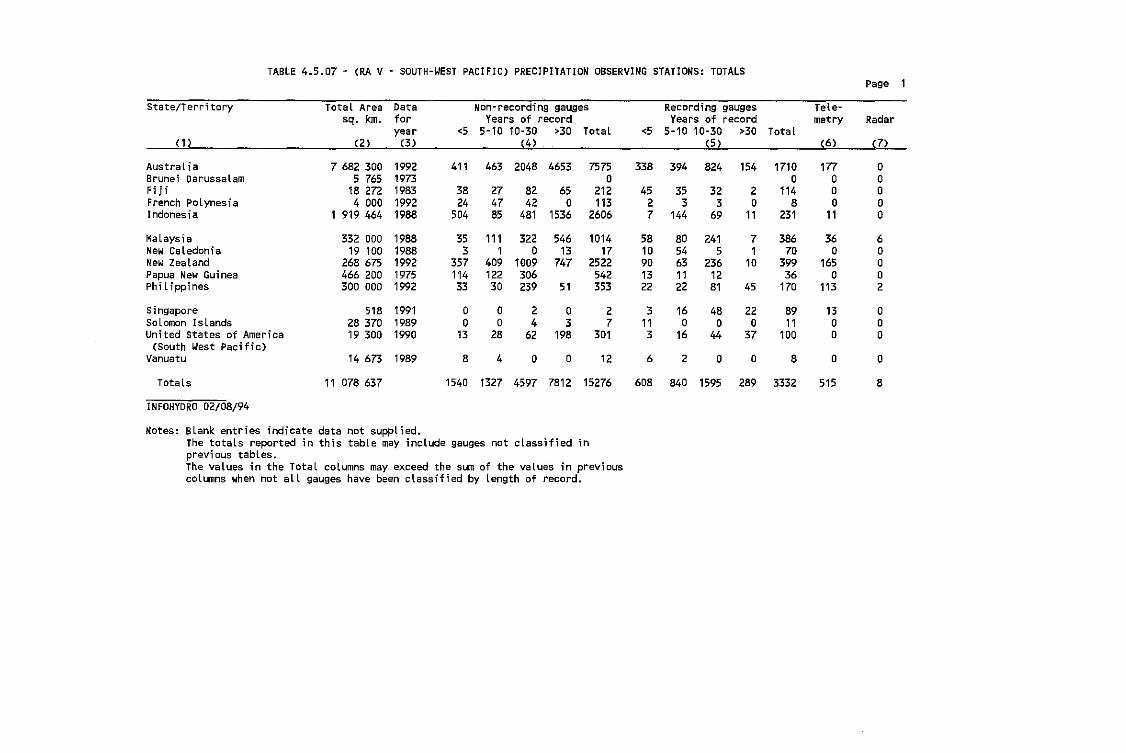
TABLE 4.5.07 - (RA V - SOUTH-WEST PACIFIC) PRECIPITATION OBSERVING STATIONS: TOTALSPage
State/Territory Total Area Data Non-recording gauges Recording gauges Tele-sq. km. for Years of record Years of record metry Radar
year <5 5-10 10-30 >30 Total <5 5-10 10-30 >30 Total(1) (2) (3) (4) (5 ) (6) (7)
Australia 7 682 300 1992 411 463 2048 4653 7575 338 394 824 154 1710 177 0Brunei Darussalam 5 765 1973 0 0 0 0Fiji 18 272 1983 38 27 82 65 212 45 35 32 2 114 0 0French Polynesia 4 000 1992 24 47 42 0 113 2 3 3 0 8 0 0Indonesia 1 919 464 1988 504 85 481 1536 2606 7 144 69 11 231 11 0
Malaysia 332 000 1988 35 111 322 546 1014 58 80 241 7 386 36 6New Caledonia 19 100 1988 3 1 0 13 17 10 54 5 1 70 0 0New Zealand 268 675 1992 357 409 1009 747 2522 90 63 236 10 399 165 0Papua New Guinea 466 200 1975 114 122 306 542 13 11 12 36 0 0Phi l ippines 300 000 1992 33 30 239 51 353 22 22 81 45 170 113 2
Singapore 518 1991 0 0 2 0 2 3 16 48 22 89 13 0Solomon Islands 28 370 1989 0 0 4 3 7 11 0 0 0 11 0 0United States of America 19 300 1990 13 28 62 198 301 3 16 44 37 100 0 0
(South West Pacific)Vanuatu 14 673 1989 8 4 0 0 12 6 2 0 0 8 0 0
Totals 11 078637 1540 1327 4597 7812 15276 608 840 1595 289 3332 515 8
INFOHYDRO 02/08/94
Notes: Blank entries indicate data not supplied.The totals reported in this table may include gauges not classified inprevious tables.The values in the Total columns may exceed the sum of the values in preViouscolumns when not aLL gauges have been classified by Length of record.
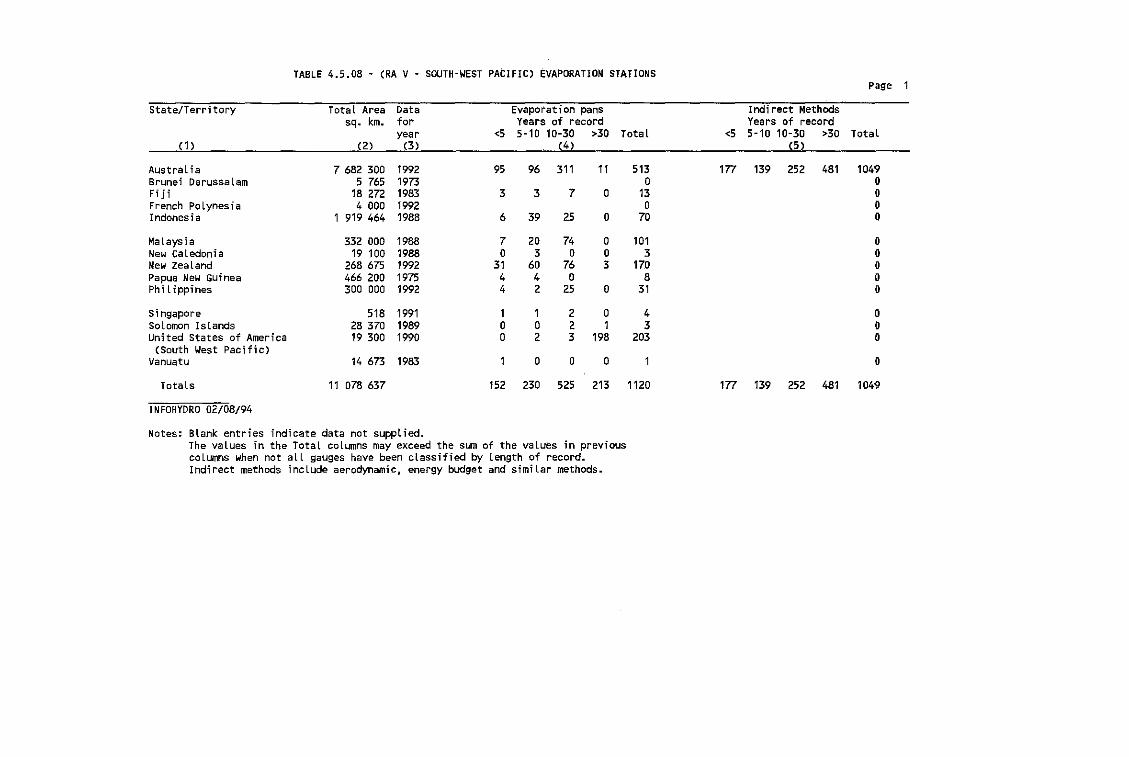
TABLE 4.5.08 - (RA V - SOUTH-WEST PACIFIC) EVAPORATION STATIONSPage 1
State/Territory Total Area Data Evaporation pans I nd; rect Methodssq. km. for Years of record Years of record
year <5 5-10 10-30 >30 Total <5 5-10 10-30 >30 TotaL(1 ) (2) (3) (4) (5 )
Austral ia 7 682 300 1992 95 96 311 11 513 177 139 252 481 1049Brunei Darussalam 5 765 1973 0 0Fiji 18 272 1983 3 3 7 0 13 0French Polynesia 4 000 1992 0 0Indonesia 1 919 464 1988 6 39 25 0 70 0
Malaysia 332 000 1988 7 20 74 0 101 0New Caledonia 19 100 1988 0 3 0 0 3 0New Zealand 268 675 1992 31 60 76 3 170 0Papua New Guinea 466 200 1975 4 4 0 8 0Phi l ippines 300 000 1992 4 2 25 0 31 0
Singapore 518 1991 1 1 2 0 4 0Solomon Islands 28 370 1989 0 0 2 1 3 0United States of America 19 300 1990 0 2 3 198 203 0
(South West Pacific)Vanuatu 14 673 1983 1 0 0 0 1 0
TotaLs 11 078 637 152 230 525 213 1120 177 139 252 481 1049
INFOHYORO 02/08/94
Notes: Blank entries indicate data not supplied.The values in the TotaL columns may exceed the sum of the values in previouscolumns when not all gauges have been classified by length of record.Indirect methods include aerodynamic, energy budget and similar methods.
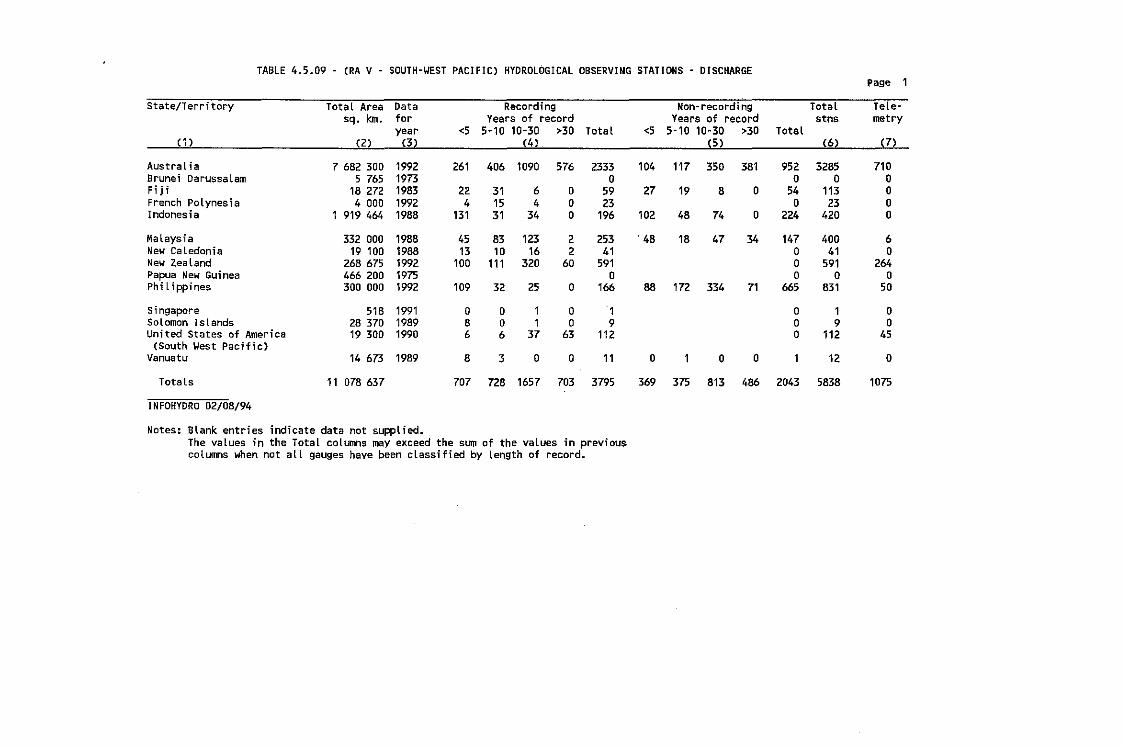
TABLE 4.5.09 - eRA v - SOUTH-WEST PACIFIC) HYDROLOGICAL OBSERVING STATIONS - DISCHARGEPage 1
State!Terr; tory --Yotal-----.e:rea Data Recording Non-recorcl,ng Total - reLe-sq. km. for Years of record Years of record stns metry
year <5 5-10 10-30 >30 Total <5 5-10 10-30 >30 Totale1) (2) (3 ) (4) (5) (6) (7)
Austral ia 7 682 300 1992 261 406 1090 576 2333 104 117 350 381 952 3285 710Brunei Darussalam 5 765 1973 0 0 0 0Fiji 18 272 1983 22 31 6 0 59 27 19 8 0 54 113 0French Polynesia 4 000 1992 4 15 4 0 23 0 23 0Indonesia 1 919 464 1988 131 31 34 0 196 102 48 74 0 224 420 0
Malaysia 332 000 1988 45 83 123 2 253 . 48 18 47 34 147 400 6New Caledonia 19 100 1988 13 10 16 2 41 0 41 0New Zealand 268 675 1992 100 111 320 60 591 0 591 264Papua New Guinea 466 200 1975 0 0 0 0Phi 1ippines 300 000 1992 109 32 25 0 166 88 172 334 71 665 831 50
Singapore 518 1991 0 0 1 0 1 0 1 0Solomon Islands 28 370 1989 8 0 1 0 9 0 9 0United States of America 19 300 1990 6 6 37 63 112 0 112 45
(South Yest Pacific)Vanuatu 14 673 1989 8 3 0 0 11 0 1 0 0 1 12 0
Totals 11 078637 707 728 1657 703 3795 369 375 813 486 2043 5838 1075
INFOHYDRO 02/08/94
Notes: Blank entries indicate data not supplied.The values in the TotaL columns may exceed the sum of the values in previouscolumns when not all gauges have been classified by length of record.
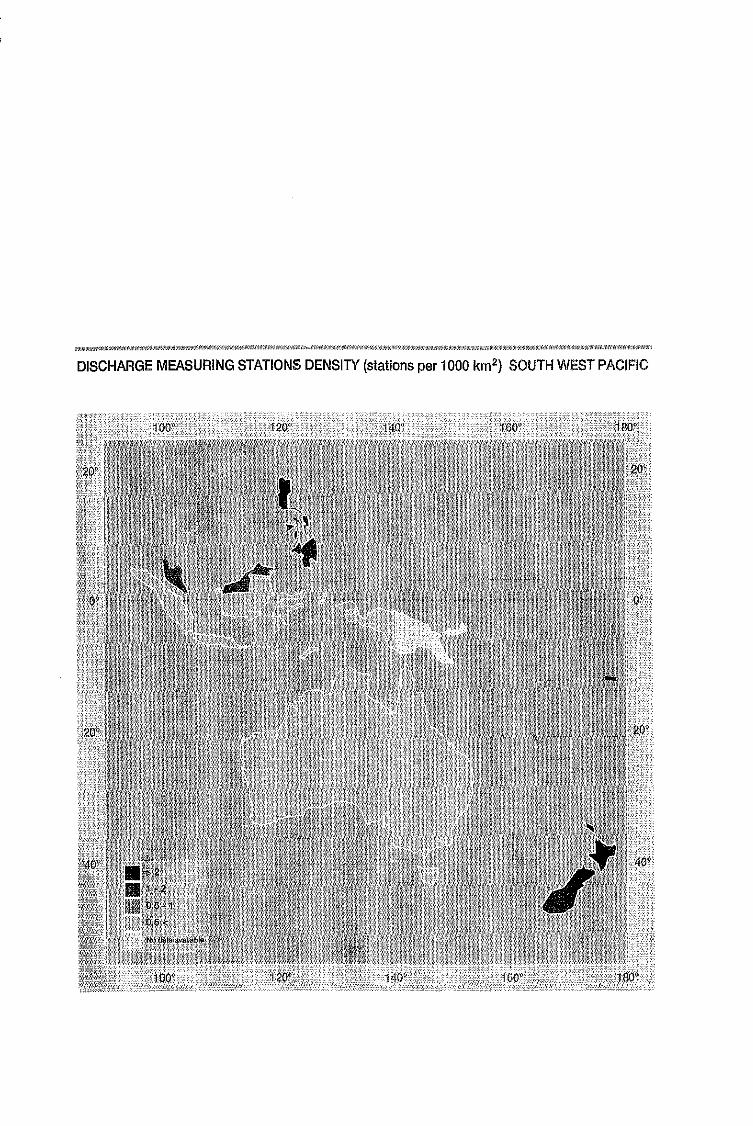
DISCHARGE MEASURING STATIONS DENSITY (stations per 1000 km2) SOUTH WEST PACIFIC
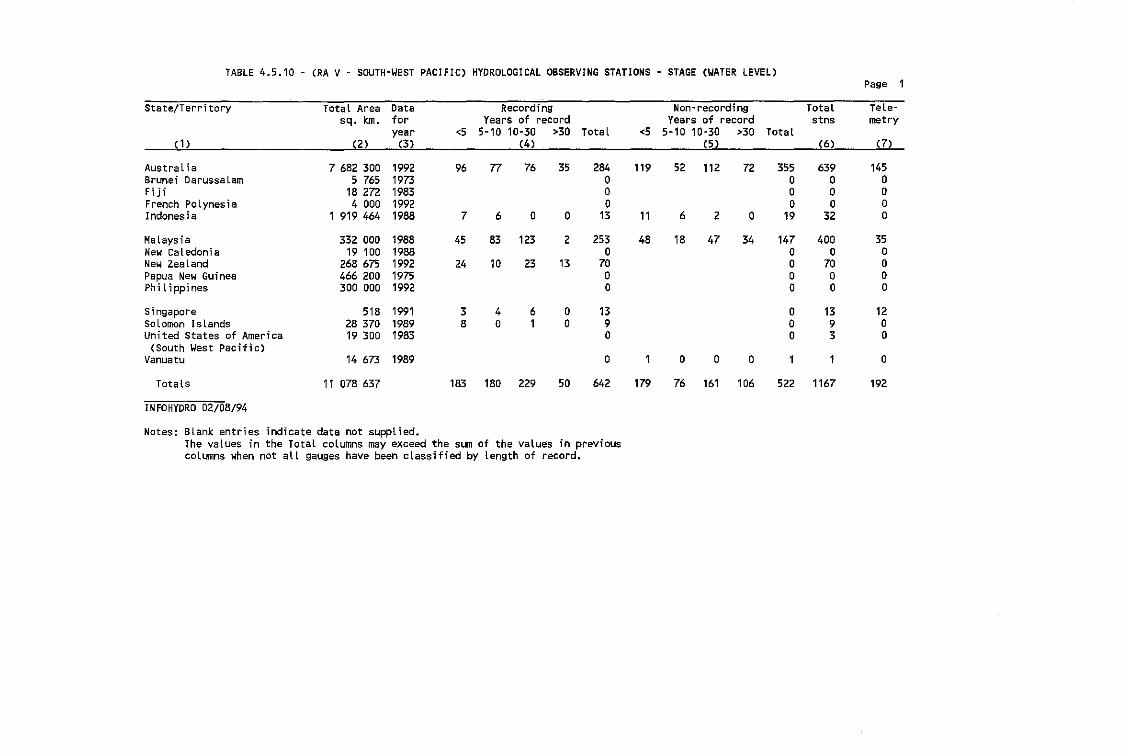
TABLE 4.5.10 (RA V - SOUTH-WEST PACIFIC) HYDROLOGICAL OBSERVING STATIONS STAGE (WATER LEVEL)Page 1
State/Territory Total Area Data Recording Non-recording Total Tele-sq. kin. for Years of record Years of record stns metry
year <5 5-10 10-30 >30 TotaL <5 5-10 10-30 >30 Total(1 ) (2) (3) (4) (5 ) (6) (7)
Austra l ;a 7 682 300 1992 96 77 76 35 284 119 52 112 72 355 639 145Brunei Darussalam 5 765 1973 0 0 0 0Fiji 18 272 1983 0 0 0 0French Polynesia 4 000 1992 0 0 0 0Indonesia 1 919 464 1988 7 6 0 0 13 11 6 2 0 19 32 0
Malaysia 332 000 1988 45 83 123 2 253 48 18 47 34 147 400 35New Caledonia 19 100 1988 0 0 0 0New Zealand 268 675 1992 24 10 23 13 70 0 70 0Papua New Guinea 466 200 1975 0 0 0 0Philippines 300 000 1992 0 0 0 0
Singapore 518 1991 3 4 6 0 13 0 13 12SoLomon Islands 28 370 1989 8 0 1 0 9 0 9 0United States of America 19 300 1983 0 0 3 0
(South West Pacific)Vanuatu 14 673 1989 0 1 0 0 0 1 1 0
Totals 11 078 637 183 180 229 50 642 179 76 161 106 522 1167 192
INFOHYORO 02/08/94
Notes: Blank entries indicate data not suppLied.The values in the Total columns may exceed the sum of the values in previouscolumns when not all gauges have been classified by length of record.
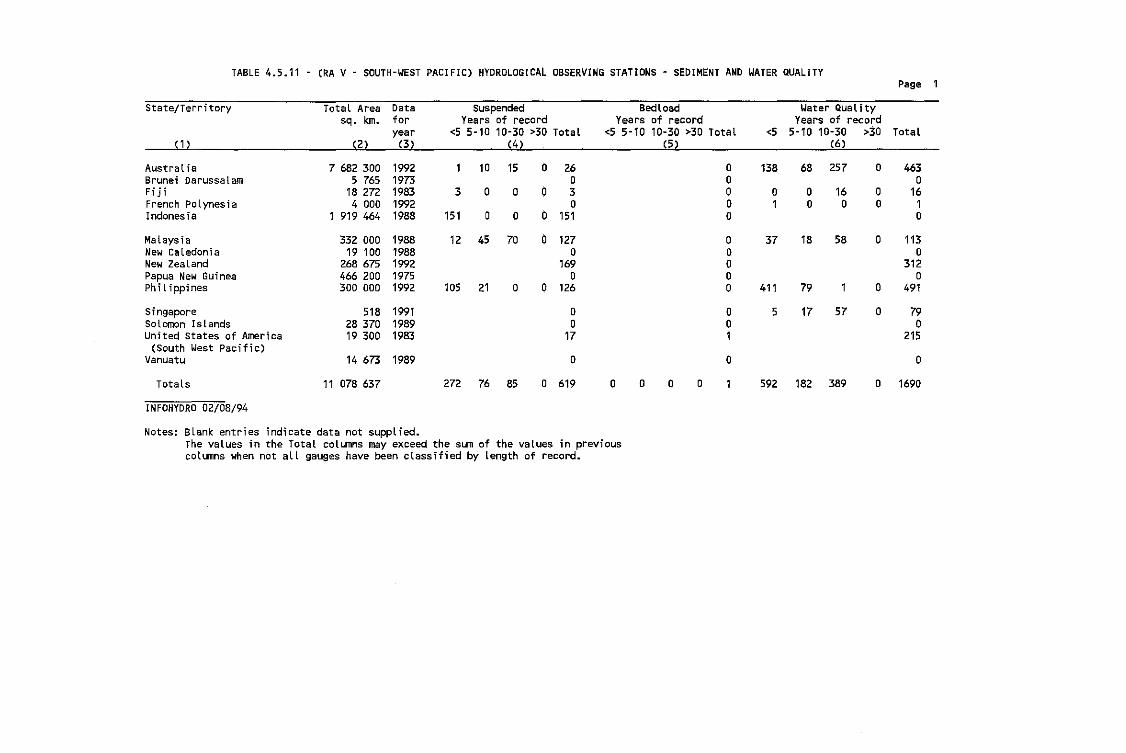
TABLE 4.5.11 (RA V - SOUTH-WEST PACIFIC) HYDROLOGICAL OBSERVING STATIONS - SEDIMENT AND WATER QUALITYPage 1
State/Territory Total Area Data Suspended Bedload Yater Qualitysq. km. for Years of record Years of record Years of record
year <5 5-10 10-30 >30 Total <5 5-10 10-30 >30 Total <5 5-10 10-30 >30 Total(1 ) (2) (3) (4) (5 ) (6)
Austral ia 7 682 300 1992 1 10 15 0 26 0 138 68 257 0 463Brunei Darussalam 5 765 1973 0 0 0Fiji 18 272 1983 3 0 0 0 3 0 0 0 16 0 16French Polynesia 4 000 1992 0 0 1 0 0 0 1Indonesia 1 919 464 1988 151 a 0 0 151 0 0
Malaysia 332 000 1988 12 45 70 a 127 a 37 18 58 0 113New Caledonia 19 100 1988 0 a 0New Zealand 268 675 1992 169 0 312Papua New Guinea 466 200 1975 a 0 aPhi 1ippines 300 000 1992 105 21 a a 126 a 411 79 1 0 491
Singapore 518 1991 a 0 5 17 57 a 79Solomon Islands 28 370 1989 a 0 0United states of America 19 300 1983 17 1 215
(South West Pacific)Vanuatu 14 673 1989 a 0 0
Totals 11 078 637 272 76 85 a 619 0 0 0 a 1 592 182 389 0 1690
INFOHYDRO 02/08/94
Notes: Blank entries indicate data not supplied.The values in the Total columns may exceed the sum of the values in previouscolumns when not aLL gauges have been classified by length of record.
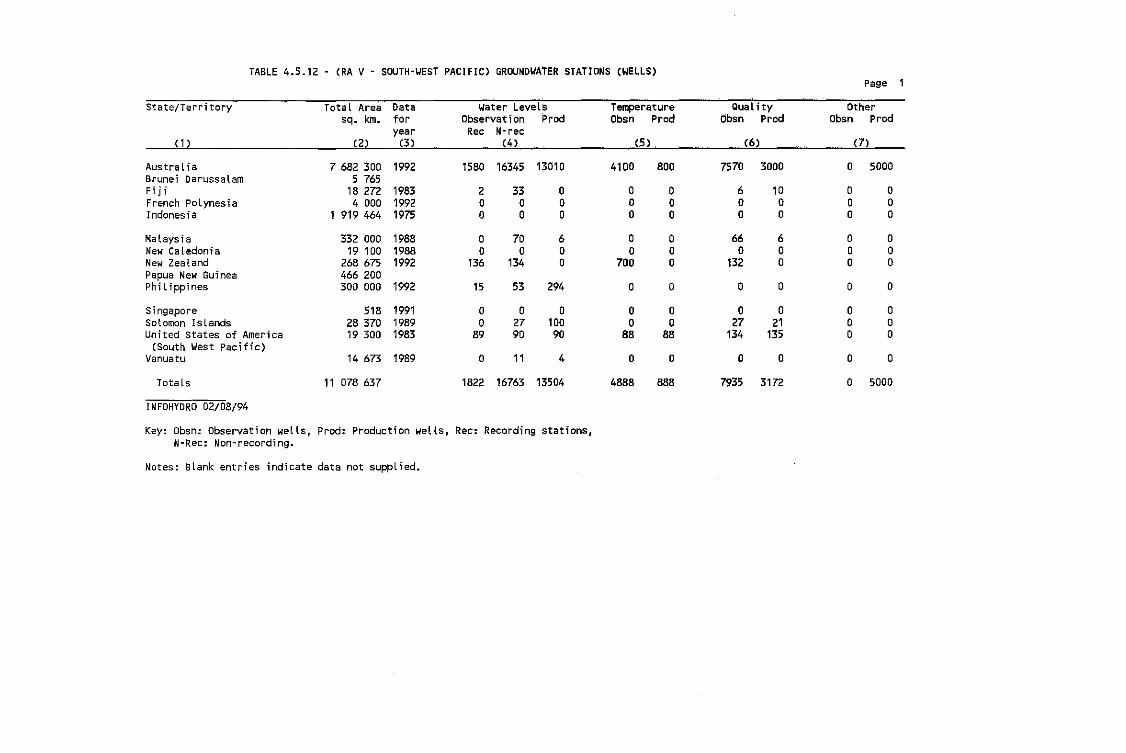
TABLE 4.5.12 - (RA V - SOUTH-YEST PACIFIC) GROUNDYATER STATIONS (YELLS)Page 1
- -- -----State/Terri tory Tota l Area Data Water Levels Temperature QuaL ity Other
sq. km. for Observation Prod Obsn Prod bbsn Prod ObSh Prodyear Rec N-rec
(1 ) (2) (3) (4) (5) (6) (7)
Austra l ; a 7 682 300 1992 1580 16345 13010 4100 800 7570 3000 0 5000Brunei Darussalam 5 765Fi ji 18 272 1983 2 33 0 0 0 6 10 0 0French PoLynesia 4 000 1992 0 0 0 0 0 0 0 0 0Indonesia 1 919 464 1975 0 0 0 0 0 0 0 0 0
Malaysia 332 000 1988 0 70 6 0 0 66 6 0 0New Caledonia 19 100 1988 0 0 0 0 0 0 0 0 0New Zealand 268 675 1992 136 134 0 700 0 132 0 0 0Papua New Guinea 466 200Phi l ippines 300 000 1992 15 53 294 0 0 0 0 0 0
Singapore 518 1991 0 0 0 0 0 0 0 0 0Solomon Islands 28 370 1989 0 27 100 0 0 27 21 0 0United states of America 19 300 1983 89 90 90 88 88 134 135 0 0
(South West Pacific)Vanuatu 14 673 1989 0 11 4 0 0 0 0 0 0
Totals 11 078 637 1822 16763 13504 4888 888 7935 3172 0 5000
INFOHYORO 02/08/94
Key: obsn: Observation wells, Prod: Production wells, Rec: Recording stations,N-Rec: Non-recording.
Notes: Blank entries indicate data not supplied.
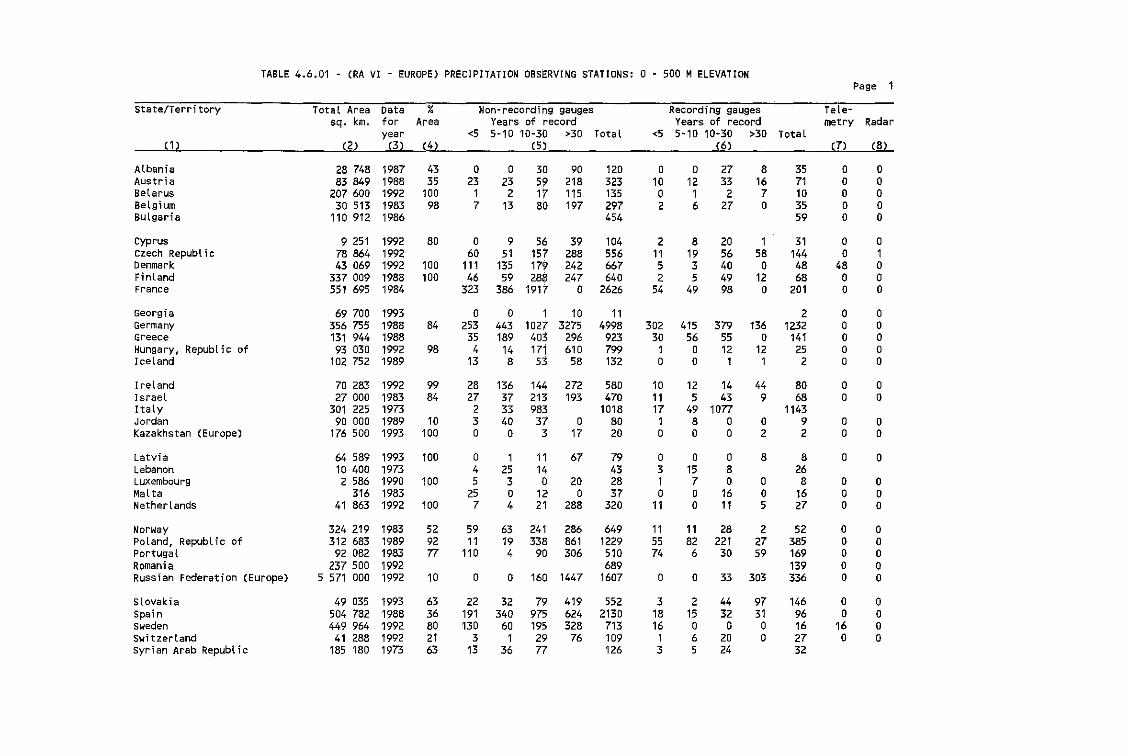
TABLE 4.6.01 - (RA VI - EUROPE) PRECIPITATION OBSERVING STATIONS: 0 - 500 MELEVATIONPage 1
State/Territory Total Area Data % Non-recording gauges Recording gauges Tele-sq. km. for Area Years of record Years of record metry Radar
year <5 5-10 10-30 >30 Total <5 5-10 10-30 >30 Total(1) (2) (3 ) (4) (5) (6) (7) (8)
Albania 28 748 1987 43 0 0 30 90 120 0 0 27 8 35 0 0Austria 83 849 1988 35 23 23 59 218 323 10 12 33 16 71 0 0Belarus 207 600 1992 100 1 2 17 115 135 0 1 2 7 10 0 0BeLgium 30 513 1983 98 7 13 80 197 297 2 6 27 0 35 0 0Bulgaria 110 912 1986 454 59 0 0
Cyprus 9 251 1992 80 0 9 56 39 104 2 8 20 1 31 0 0czech Republ i c 78 864 1992 60 51 157 288 556 11 19 56 58 144 0 1Denmark 43 069 1992 100 111 135 179 242 667 5 3 40 0 48 48 0Finland 337 009 1988 100 46 59 288 247 640 2 5 49 12 68 0 0France 551 695 1984 323 386 1917 0 2626 54 49 98 0 201 0 0
Georgia 69 700 1993 0 0 1 10 11 2 0 0Germany 356 755 1988 84 253 443 1027 3275 4998 302 415 379 136 1232 0 0Greece 131 944 1988 35 189 403 296 923 30 56 55 0 141 0 0Hungary, Republic of 93 030 1992 98 4 14 171 610 799 1 0 12 12 25 0 0Iceland 102 752 1989 13 8 53 58 132 0 0 1 1 2 0 0
Ireland 70 283 1992 99 28 136 144 272 580 10 12 14 44 80 0 0IsraeL 27 000 1983 84 27 37 213 193 470 11 5 43 9 68 0 0Italy 301 225 1973 2 33 983 1018 17 49 1077 1143Jordan 90 000 1989 10 3 40 37 0 80 1 8 0 0 9 0 0Kazakhstan (Europe) 176 500 1993 100 0 0 3 17 20 0 0 0 2 2 0 0
Latvia 64 589 1993 100 0 1 11 67 79 0 0 0 8 8 0 0Lebanon 10 400 1973 4 25 14 43 3 15 8 26Luxembourg 2 586 1990 100 5 3 0 20 28 1 7 0 0 8 0 0MaL ta 316 1983 25 0 12 0 37 0 0 16 0 16 0 0NetherLands 41 863 1992 100 7 4 21 288 320 11 0 11 5 27 0 0
Norway 324 219 1983 52 59 63 241 286 649 11 11 28 2 52 0 0poland, RepubLic of 312 683 1989 92 11 19 338 861 1229 55 82 221 27 385 0 0Portugal 92 082 1983 77 110 4 90 306 510 74 6 30 59 169 0 0Romania 237 500 1992 689 139 0 0Russian Federation (Europe) 5 571 000 1992 10 0 0 160 1447 1607 0 0 33 303 336 0 0
SLovakia 49 035 1993 63 22 32 79 419 552 3 2 44 97 146 0 0Spain 504 782 1988 36 191 340 975 624 2130 18 15 32 31 96 0 0sweden 449 964 1992 80 130 60 195 328 713 16 0 0 0 16 16 0Switzerland 41 288 1992 21 3 1 29 76 109 1 6 20 0 27 0 0Syrian Arab Republic 185 180 1973 63 13 36 77 126 3 5 24 32
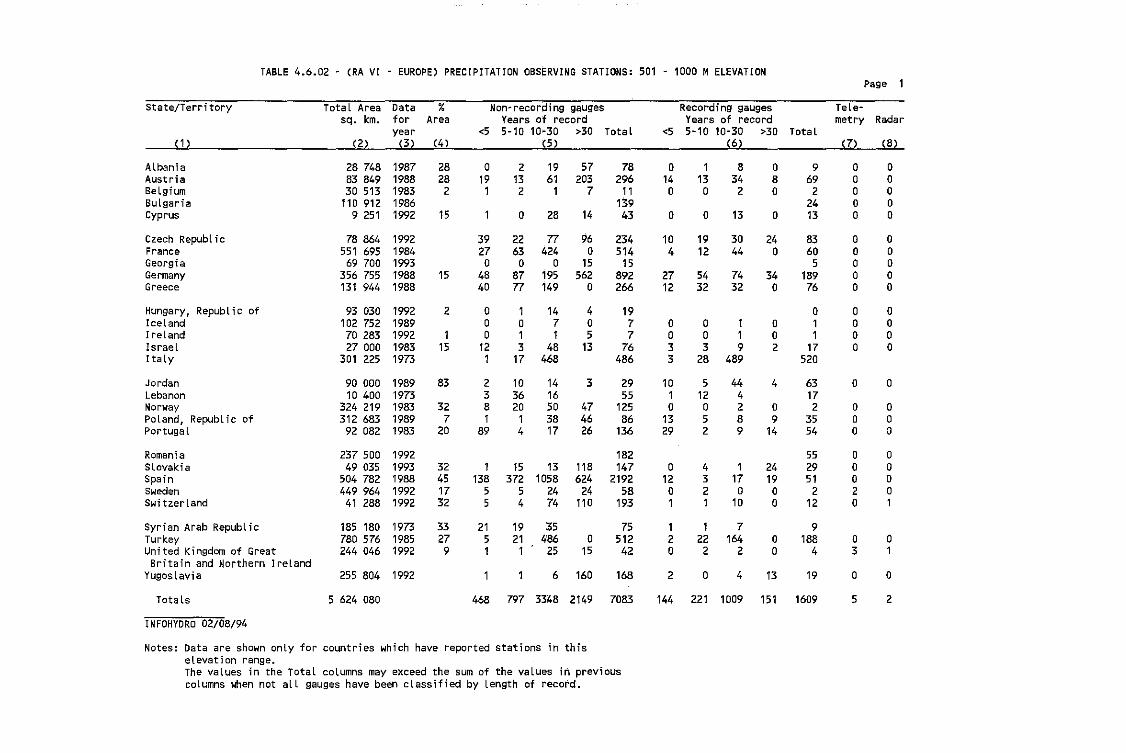
TABLE 4.6.02 - (RA VI - EUROPE) PRECIPITATION OBSERVING STATIONS: 501 - 1000 MELEVATIONPage 1
State/Territory Total Area Data % Non~recording gauges Recording gauges Tele-sq. km. for Area Years of record Years of record metry Radar
year <5 5-10 10·30 >30 Total <5 5-10 10-30 >30 Total(1) (2) (3) (4 ) (5 ) (6) (7) (8)
Albania 28 748 1987 28 0 2 19 57 78 0 1 8 0 9 0 0Austria 83 849 1988 28 19 13 61 203 296 14 13 34 8 69 0 0Belgium 30 513 1983 2 1 2 1 7 11 0 0 2 0 2 0 0Bulgaria 110 912 1986 139 24 0 0Cyprus 9 251 1992 15 1 0 28 14 43 0 0 13 0 13 0 0
Czech Republ ; c 78864 1992 39 22 77 96 234 10 19 30 24 83 0 0France 551 695 1984 27 63 424 0 514 4 12 44 0 60 0 0Georgia 69 700 1993 0 0 0 15 15 5 0 0Germany 356 755 1988 15 48 87 195 562 892 27 54 74 34 189 0 0Greece 131 944 1988 40 77 149 0 266 12 32 32 0 76 0 0
Hungary, Republic of 93 030 1992 2 0 1 14 4 19 0 0 0Iceland 102 752 1989 0 0 7 0 7 0 0 1 0 1 0 0Ireland 70 283 1992 1 0 1 1 5 7 0 0 1 0 1 0 0Israel 27 000 1983 15 12 3 48 13 76 3 3 9 2 17 0 0Italy 301 225 1973 1 17 468 486 3 28 489 520
Jordan 90 000 1989 83 2 10 14 3 29 10 5 44 4 63 0 0Lebanon 10 400 1973 3 36 16 55 1 12 4 17Norway 324 219 1983 32 8 20 50 47 125 0 0 2 0 2 0 0Poland, Republic of 312 683 1989 7 1 1 38 46 86 13 5 8 9 35 0 0Portugal 92 082 1983 20 89 4 17 26 136 29 2 9 14 54 0 0
Romania 237 500 1992 182 55 0 0SLovakia 49 035 1993 32 1 15 13 118 147 0 4 1 24 29 0 0Spain 504 782 1988 45 138 372 1058 624 2192 12 3 17 19 51 0 0Sweden 449 964 1992 17 5 5 24 24 58 0 2 0 0 2 2 0Switzerland 41 288 1992 32 5 4 74 110 193 1 1 10 0 12 0 1
Syrian Arab RepubLic 185 180 1973 33 21 19 35 75 1 1 7 9Turkey 780 576 1985 27 5 21 4.86 0 512 2 22 164 0 188 0 0United Kingdom of Great 244 046 1992 9 1 1 25 15 42 0 2 2 0 4 3 1Britain and Northern Ireland
YugosLavia 255 804 1992 1 1 6 160 168 2 0 4 13 19 0 0
Totals 5 624 080 468 797 3348 2149 7083 144 221 1009 151 1609 5 2
INFOHYDRO 02/08/94
Notes: Data are shown only for countries which have reported stations 'in thiselevation range.The values in the Total coLumns may exceed the sum of the values in previouscolumns when not all gauges have been classified by length of record.
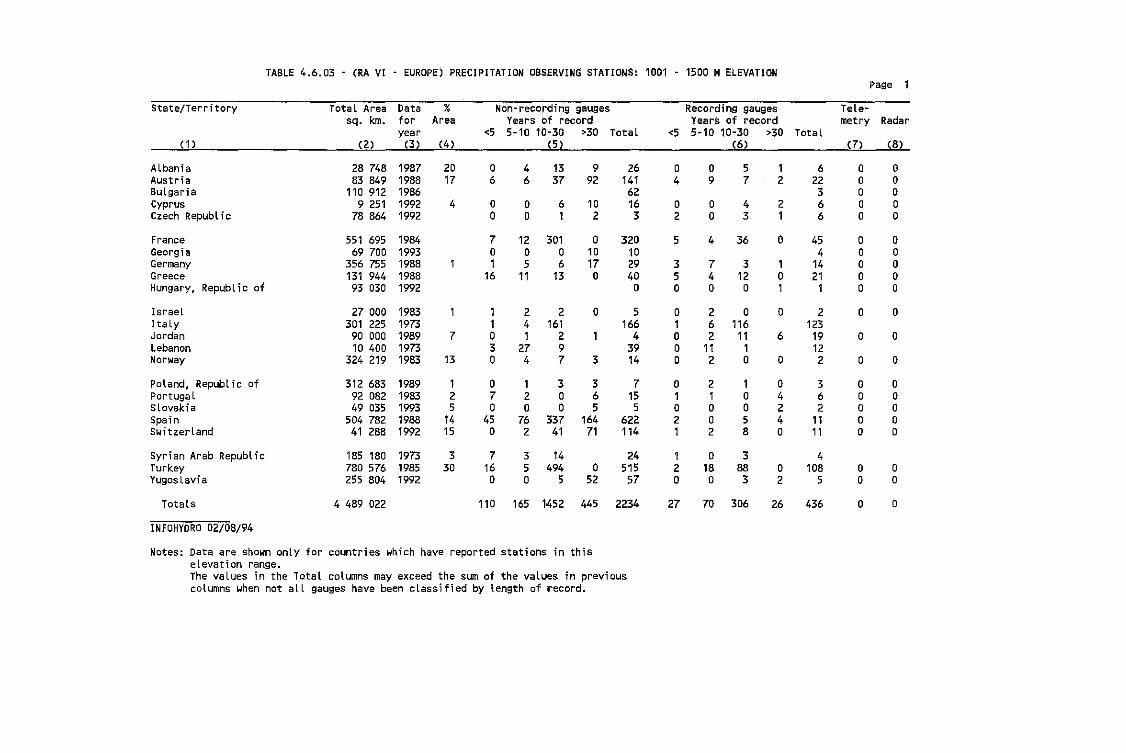
TABLE 4.6.03 - (RA VI - EUROPE) PRECIPITATION OBSERVING STATIONS: 1001 - 1500 M ELEVATIONPage 1
State/Territory Total Area Data % Non-recording gauges Recording gauges Tele-sq. km. tor Area Years of record Years 6f record metry Radar
year <5 5-10 10-30 >30 Total <5 5-10 10-30 >30 TotaL(1) (2) (3 ) (4) (5 ) (6) (7) (8)
Albania 28 748 1987 20 0 4 13 9 26 0 0 5 1 6 0 0Austria 83 849 1988 17 6 6 37 92 141 4 9 7 2 22 0 0Bulgaria 110 912 1986 62 3 0 0Cyprus 9 251 1992 4 0 0 6 10 16 0 0 4 2 6 0 0Czech Republ ;c 78 864 1992 0 0 1 2 3 2 0 3 1 6 0 0
France 551 695 1984 7 12 301 0 320 5 4 36 0 45 0 0Georgia 69 700 1993 0 0 0 10 10 4 0 0Germany 356 755 1988 1 1 5 6 17 29 3 7 3 1 14 0 0Greece 131 944 1988 16 11 13 0 40 5 4 12 0 21 0 0Hungary, Republic of 93 030 1992 0 0 0 0 1 1 0 0
Israel 27 000 1983 1 1 2 2 0 5 0 2 0 0 2 0 0ItaLy 301 225 1973 1 4 161 166 1 6 116 123Jordan 90 000 1989 7 0 1 2 1 4 0 2 11 6 19 0 0Lebanon 10 400 1973 3 27 9 39 0 11 1 12Norway 324 219 1983 13 0 4 7 3 14 0 2 0 0 2 0 0
Poland, Republic of 312 683 1989 1 0 1 3 3 7 0 2 1 0 3 0 0Portugal 92 082 1983 2 7 2 0 6 15 1 1 0 4 6 0 0Slovakia 49 035 1993 5 0 0 0 5 5 0 0 0 2 2 0 0Spain 504 782 1988 14 45 76 337 164 622 2 0 5 4 11 0 0Switzerland 41 288 1992 15 0 2 41 71 114 1 2 8 0 11 0 0
Syrian Arab Republic 185 180 1973 3 7 3 14 24 1 0 3 4Turkey 780 576 1985 30 16 5 494 0 515 2 18 88 0 108 0 0YugosLavia 255 804 1992 0 0 5 52 57 0 0 3 2 5 0 0
Totals 4 489 022 110 165 1,452 445 2234 27 70 306 26 436 0 0
INFOHYORO 02/08/94
Notes: Data are shown only for countries which have reported stations- in thiselevation range.The vaLues in the Total columns may exceed the sum of the values in previouscolumns when not all gauges have been classified by length of 'record.
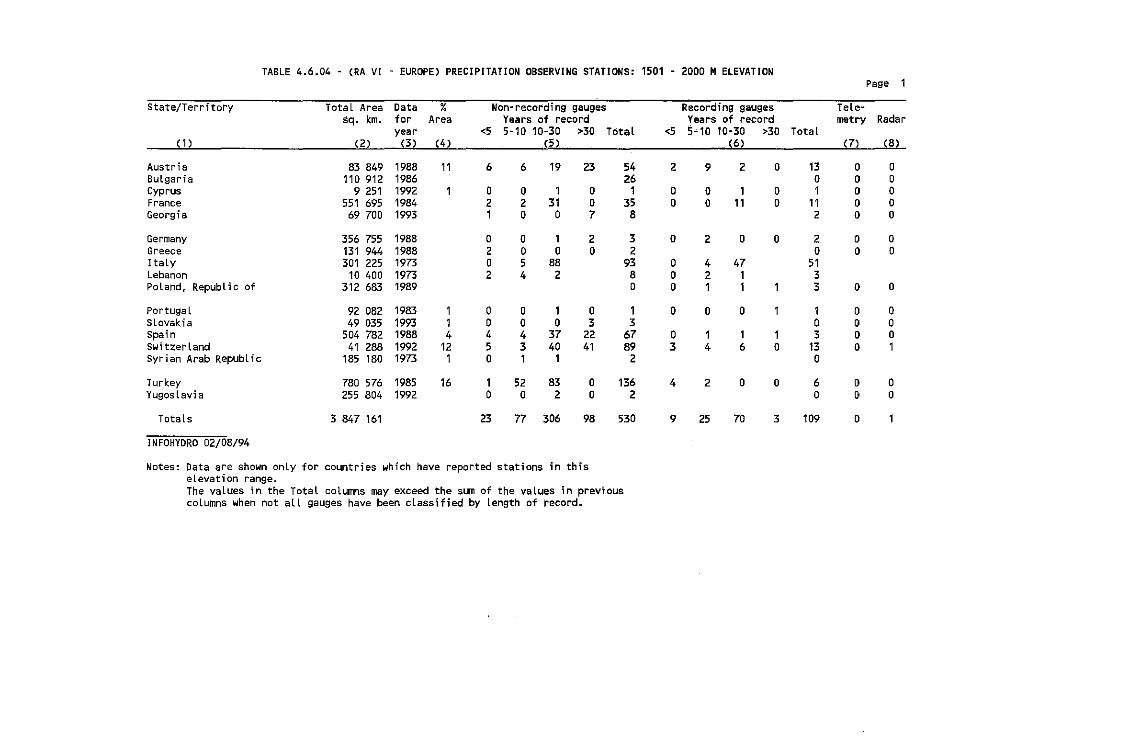
TABLE 4.6.04 - (RA VI - EUROPE) PRECIPITATioN OBSERVING STATIONS: 1501 - 2000 M ELEVATIONPage 1
State/Territory Total Area Data % Non-recording gauges Recording gauges Tele~
sq. km. for Area Years of record Years of record metry Radaryear <5 5-10 10-30 >30 Total <5 5" 10 10-30 >30 Total
(1 ) (2) (3) (4) (5 ) (6) (7) (8)
Austr; a 83 849 1988 11 6 6 19 23 54 2 9 2 0 13 0 0Bulgaria 110 912 1986 26 0 0 0Cyprus 9 251 1992 1 0 0 1 0 1 0 0 1 0 1 0 0France 551 695 1984 2 2 31 0 35 0 0 11 0 11 0 0Georgia 69 700 1993 1 0 0 7 8 2 0 0
Germany 356 755 1988 0 0 1 2 3 0 2 0 0 2 0 0Greece 131 944 1988 2 0 0 0 2 0 0 0Italy 301 225 1973 0 5 88 93 0 4 47 51Lebanon 10 400 1973 2 4 2 8 0 2 1 3Poland, Republic of 312 683 1989 0 0 1 1 1 3 0 0
PortugaL 92 082 1983 1 0 0 1 0 1 0 0 0 1 1 0 0Slovakia 49 035 1993 1 0 0 0 3 3 0 0 0Spain 504 782 1988 4 4 4 37 22 67 0 1 1 1 3 0 0Switzerland 41 288 1992 12 5 3 40 41 89 3 4 6 0 13 0 1Syrian Arab Republic 185 180 1973 1 0 1 1 2 0
Turkey 780 576 1985 16 1 52 83 0 136 4 2 0 0 6 0 0Yugoslav; a 255 804 1992 0 0 2 0 2 0 0 0
Totals 3 847 161 23 77 306 98 530 9 25 70 3 109 0
INFOHYORO 02/08/94
Notes: Data are shown only for countries which have reported stations in thiselevation range.The values in the Total columns may exceed the sum of the vaLues in prevTouscolumns when not alL gauges have been classified by length of record.

TABLE 4.6.05 - (RA VI - EUROPE) PRECIPITATION OBSERVING STATIONS: 2001 - 25GO MELEVATIONPage 1
State/Territory ·-Total Area Data % Non-recording gauges Recording gauges Tele-sq. km. for Area Years ,of record Yea is of record metry Radar
year <5 5-10 10-30 >30 Total <5 5-10 10"30 >30 TotaL(1 ) (2) (3) (4) (5) (6) (7) (8)
Austria 83 849 1988 6 8 1 20 10 39 1 0 0 0 1 0 0BuLgaria 110 912 1986 4 G 0 0France 551 695 1984 1 1 2 0 4 1 0 1 0 2 0 0Georgia 69 700 1993 0 0 0 5 5 2 0 0Slovakia 49 035 1993 0 0 0 1 1 0 0 0
Spain 504 782 1988 1 1 1 16 4 22 0 0 0Switzerland 41 288 1992 10 3 1 17 23 44 0 0 4 0 4 0 0Turkey 780 576 1985 9 3 7 14 G 24 0 0 0
TotaLs 2 191 837 16 11 69 43 143 2 0 5 0 9 0 0
INFOHYDRO 02/08/94
Notes: Data are shown only for countries which have reported stations in thiselevation range.The values in the Total columns may exceed the sum of the values in previouscolumns when not all gauges have been classified by length of record.
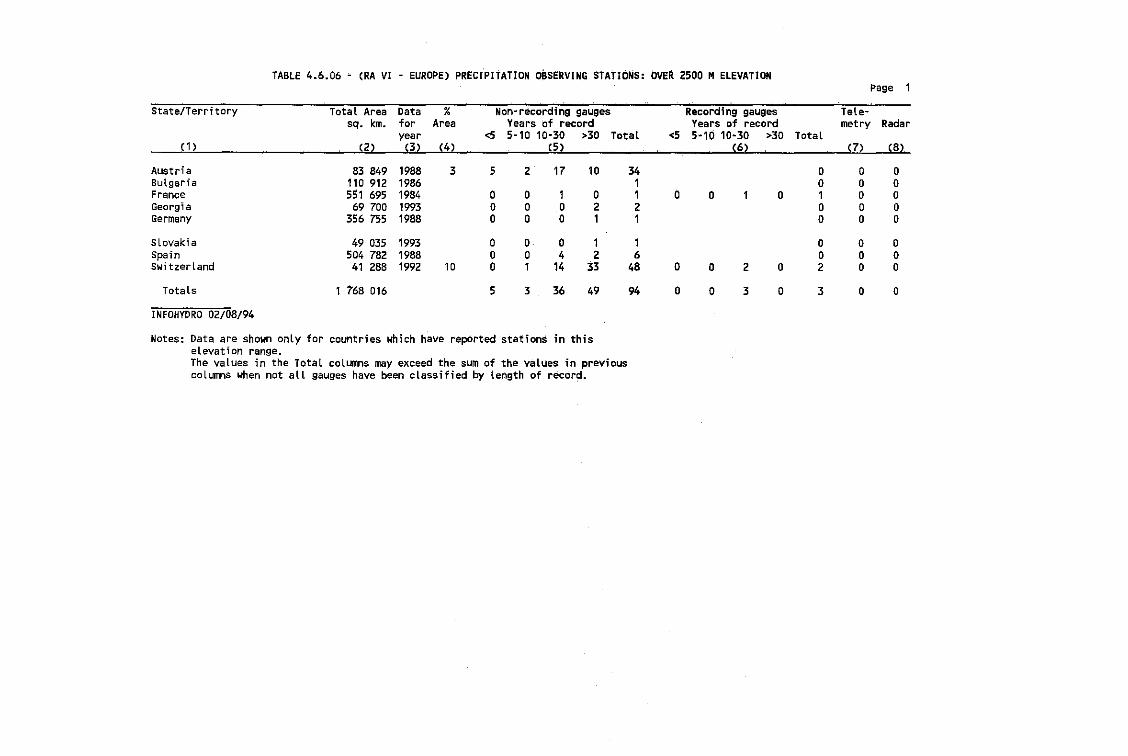
TABLE 4.6.06 " (RA VI - EUROPE) PRECIPITATION OaSERVING STATIONs: OVEIi 2500 M ELEVATIONpage 1
State/Territory Total Area Data % Non·recording gauges Recording gauges Tete-sq. km. for Area Years of record Years of record metry Radar
year <5 5-10 10-30 >30 Total <5 5-10 10-30 >30 Total(1 ) (2) (3) (4) (5) (6) (7) (8)
Austri a 83 849 1988 3 5 2 17 10 34 0 0 0Bulgaria 110 912 1986 1 0 0 0France 551 695 1984 0 0 1 0 1 0 0 1 0 1 0 0Georgia 69 700 1993 0 0 0 2 2 0 0 0Germany 356 755 1988 0 0 0 1 1 0 0 0
SLovakia 49 035 1993 0 0 0 1 1 0 0 0Spain 504 782 1988 0 0 4 2 6 0 0 0Switzerland 41 288 1992 10 0 1 14 33 48 0 0 2 0 2 0 0
Totals 1 768 016 5 3 36 49 94 0 0 3 0 3 0 0
INFOHYDRO 02/08/94
Notes: Data are shown only for countries which have reported stations in thiselevation range.The values in the Total columns may exceed the sum of the values in previouscolumns when not all gauges have been classified by Length of record.
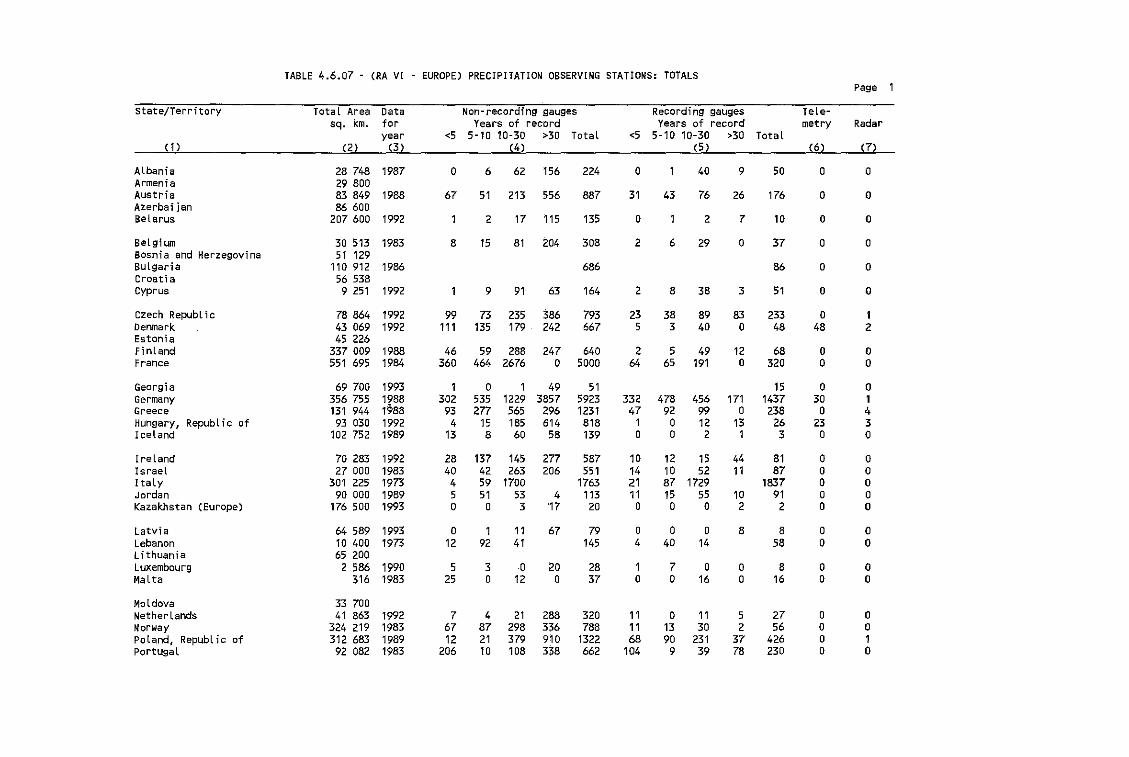
TABLE 4.6.07 - (RA VI EUROPE) PRECIPITATION OBSERVING STATIONS: TOTALSPage
state/Territory Total Area Data Non-recording gauges Recording gauges Tele-sq. km. for Years of record Years of record metry Radar
year <5 5-10 10-30 >30 Total <5 5-10 10-30 >30 TotaL(1) (2) (3) (4) (5 ) (6) (7)
ALbania 28 748 1987 0 6 62 156 224 0 1 40 9 50 0 0Armenia 29 800Austria 83 849 1988 67 51 213 556 887 31 43 76 26 176 0 0Azerbai jan 86 600Belarus 207 600 1992 1 2 17 115 135 0 1 2 7 10 0 0
Belgium 30 513 1983 8 15 81 204 308 2 6 29 0 37 0 0Bosnia and Herzegovina 51 129Bulgaria 110 912 1986 686 86 0 0Croatia 56 538Cyprus 9 251 1992 1 9 91 63 164 2 8 38 3 51 0 0
Czech Republ ; c 78 864 1992 99 73 235 386 793 23 38 89 83 233 0 1Denmark 43 069 1992 111 135 179 242 667 5 3 40 0 48 48 2Estonia 45 226Finland 337 009 1988 46 59 288 247 640 2 5 49 12 68 0 0France 551 695 1984 360 46l~ 2676 0 5000 64 65 191 0 320 0 0
Georgia 69 700 1993 1 0 1 49 51 15 0 0Germany 356 755 1988 302 535 1229 3857 5923 332 478 456 171 1437 30 1Greece 131 944 1988 93 277 565 296 1231 47 92 99 0 238 0 4Hungary, RepUblic of 93 030 1992 4 15 185 614 818 1 0 12 13 26 23 3Iceland 102 752 1989 13 8 60 58 139 0 0 2 1 3 0 0
IreLand 70 283 1992 28 137 145 277 587 10 12 15 44 81 0 0Israel 27 000 1983 40 42 263 206 551 14 10 52 11 87 0 0ItaLy 301 225 1973 4 59 1700 1763 21 87 1729 1837 0 0Jordan 90 000 1989 5 51 53 4 113 11 15 55 10 91 0 0Kazakhstan (Europe) 176 500 1993 0 0 3 '17 20 0 0 0 2 2 0 0
Latvia 64 589 1993 0 1 11 67 79 0 0 0 8 8 0 0Lebanon 10 400 1973 12 92 41 145 4 40 14 58 0 0Lithuania 65 200Luxembourg 2 586 1990 5 3 ·0 20 28 1 7 0 0 8 0 0MaL ta 316 1983 25 0 12 0 37 0 0 16 0 16 0 0
Moldova 33 700Netherlands 41 863 1992 7 4 21 288 320 11 0 11 5 27 0 0Norway 324 219 1983 67 87 298 336 788 11 13 30 2 56 0 0Poland, RepUblic of 312 683 1989 12 21 379 910 1322 68 90 231 37 426 0 1Portugal 92 082 1983 206 10 108 338 662 104 9 39 78 230 0 0
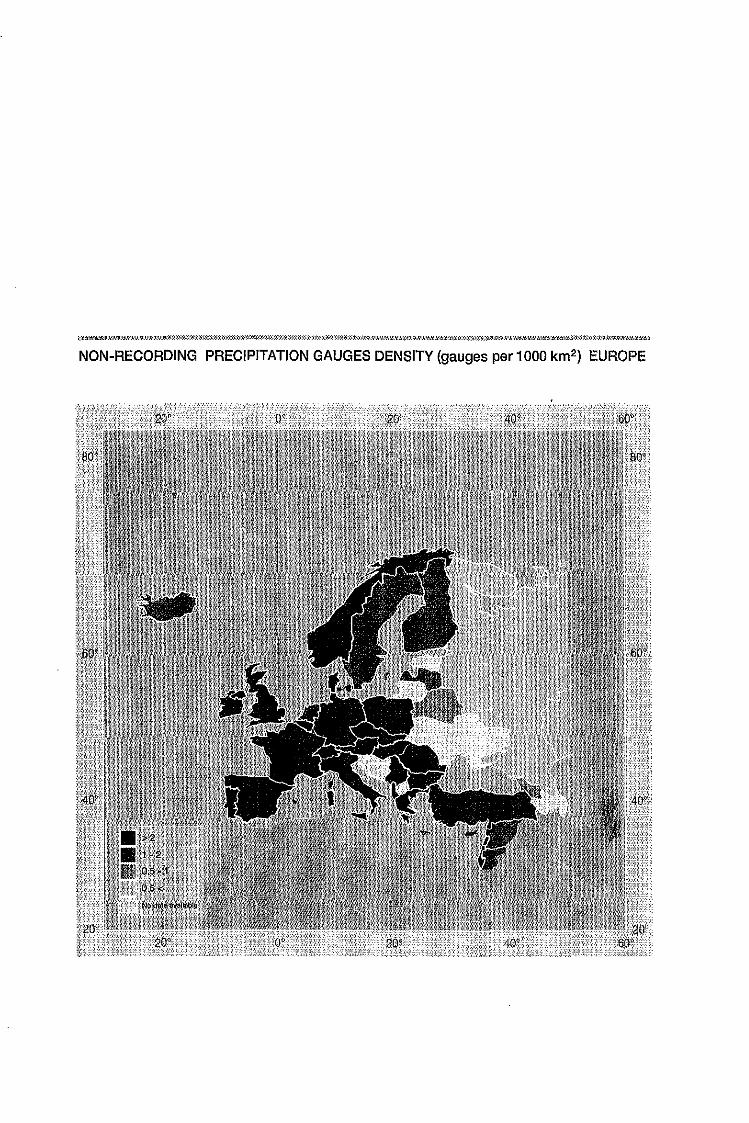
NON-RECORDING PRECIPITATION GAUGES DENSITY (gauges per 1000 km2) EUROPE
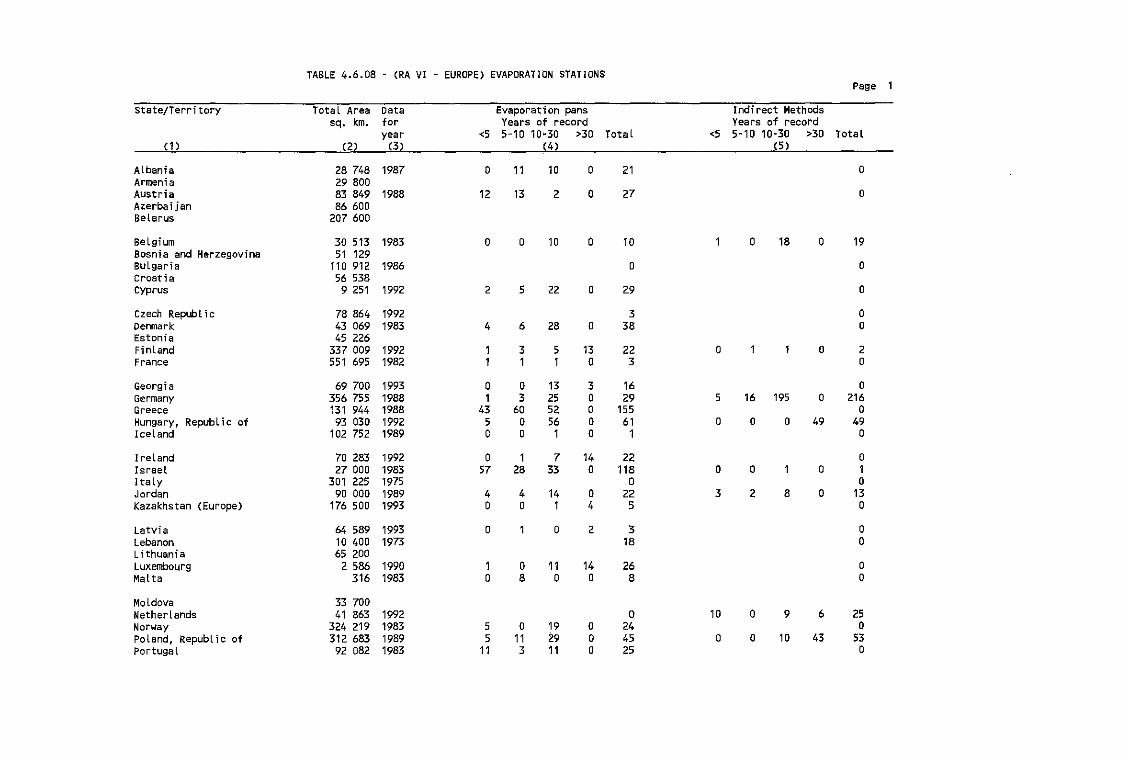
TABLE 4.6.08 - (RA VI - EUROPE) EVAPORATION STATIONSPage 1
state/Territory Total Area Data Evaporation pans Indirect Methodssq. km. for Years of record Years of record
year <5 5-10 10·30 >30 Total <5 5-10 10-30 >30 Total(1 ) (2) (3) (4) (5 )
Albania 28 748 1987 0 11 10 0 21 0Armenia 29 800Austria 83 849 1988 12 13 2 0 27 0Azerbai jan 86 600Belarus 207 600
Belgium 30 513 1983 0 0 10 0 10 1 0 18 0 19Bosnia and Herzegovina 51 129Bulgaria 110 912 1986 0 0Croatia 56 538Cyprus 9 251 1992 2 5 22 0 29 0
Czech Repub l ; c 78 864 1992 3 0Denmark 43 069 1983 4 6 28 0 38 0Estonia 45 226Flnland 337 009 1992 1 3 5 13 22 0 1 1 0 2France 551 695 1982 1 1 1 0 3 0
Georgia 69 700 1993 0 0 13 3 16 0Germany 356 755 1988 1 3 25 0 29 5 16 195 0 216Greece 131 944 1988 43 60 52 0 155 0Hungary, Republic of 93 030 1992 5 0 56 0 61 0 0 0 49 49Iceland 102 752 1989 0 0 1 0 1 0
Ireland 70 283 1992 0 1 7 14 22 0Israel 27 000 1983 57 28 33 0 118 0 0 1 0 1ItaLy 301 225 1975 0 0Jordan 90 000 1989 4 4 14 0 22 3 2 8 0 13Kazakhstan (Europe) 176 500 1993 0 0 1 4 5 0
Latv; a 64 589 1993 0 1 0 2 3 0Lebanon 10 400 1973 18 0Lithuania 65 200Luxembourg 2 586 1990 1 0 11 14 26 0Malta 316 1983 0 8 0 0 8 0
Moldova 33 700Netherlands 41 863 1992 0 10 0 9 6 25Norway 324 219 1983 5 0 19 0 24 0Poland, RepubLic of 312 683 1989 5 11 29 0 45 0 0 10 43 53PortugaL 92 082 1983 11 3 11 0 25 0
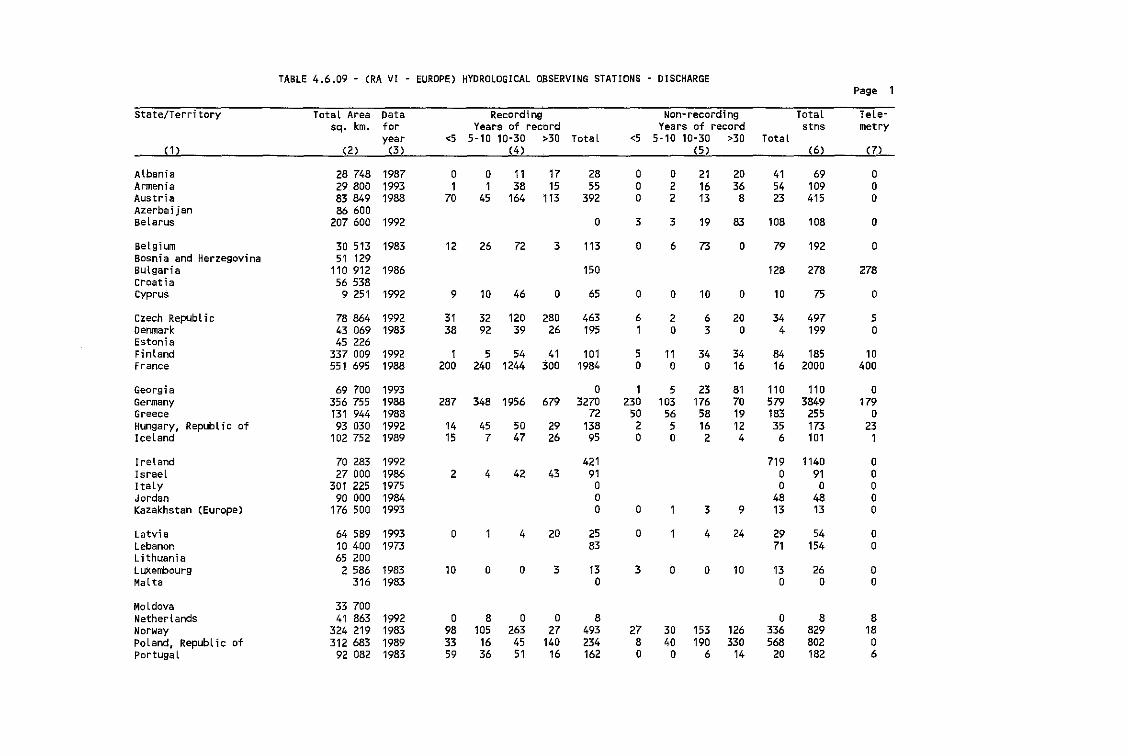
TABLE 4.6.09 - (RA VI - EUROPE) HYOROLOGICAL OBSERVING STATIONS DISCHARGEPage 1
state/Territory TotaL Area Data Recording Non-recording Total Tele-sq. km. for Years of recbrd YeafS of record stns metry
year <5 5-10 10-30 >30 Total <5 5-10 10-30 >30 Total(1 ) (2) (3 ) (4) (5) (6) (7)
Albania 28 748 1987 0 0 11 17 28 0 0 21 20 41 69 0Armenia 29 800 1993 1 1 38 15 55 0 2 16 36 54 109 0Austria 83 849 1988 70 45 164 113 392 0 2 13 8 23 415 0Azerbaijan 86 600Belarus 207 600 1992 0 3 3 19 83 108 108 0
BeLgium 30 513 1983 12 26 72 3 113 0 6 73 0 79 192 0Bosnia and Herzegovina 51 129Bulgaria 110 912 1986 150 128 278 278croatia 56 538Cyprus 9 251 1992 9 10 46 0 65 0 0 10 0 10 75 0
Czech Republ ic 78864 1992 31 32 120 280 463 6 2 6 20 34 497 5Denmark 43 069 1983 38 92 39 26 195 1 0 3 0 4 199 0Estonia 45 226Finland 337 009 1992 1 5 54 41 101 5 11 34 34 84 185 10france 551 695 1988 200 240 1244 300 1984 0 0 0 16 16 2000 400
Georgia 69 700 1993 0 1 5 23 81 110 110 0Germany 356 755 1988 287 348 1956 679 3270 230 103 176 70 579 3849 179Greece 131 944 1988 72 50 56 58 19 183 255 0Hungary, Republic of 93 030 1992 14 45 50 29 138 2 5 16 12 35 173 23Iceland 102 752 1989 15 7 47 26 95 0 0 2 4 6 101 1
Ireland 70 283 1992 421 719 1140 0Israel 27 000 1986 2 ,. 42 43 91 0 91 0Italy 301 225 1975 0 0 0 0Jordan 90 000 1984 0 48 48 0Kazakhstan (Europe) 176 500 1993 0 0 1 3 9 13 13 0
Latvia 64 589 1993 0 1 4 20 25 0 1 4 24 29 54 0Lebanon 10 400 1973 83 71 154 0Lithuania 65 200Luxerrbourg 2 586 1983 10 0 0 3 13 3 0 0 10 13 26 0Mal ta 316 1983 0 0 0 0
Moldova 33 700Netherlands 41 863 1992 0 8 0 0 8 0 8 8Norway 324 219 1983 98 105 263 27 493 27 30 153 126 336 829 18Poland, Republic of 312 683 1989 33 16 45 140 234 8 40 190 330 568 802 0PortugaL 92 082 1983 59 36 51 16 162 0 0 6 14 20 182 6
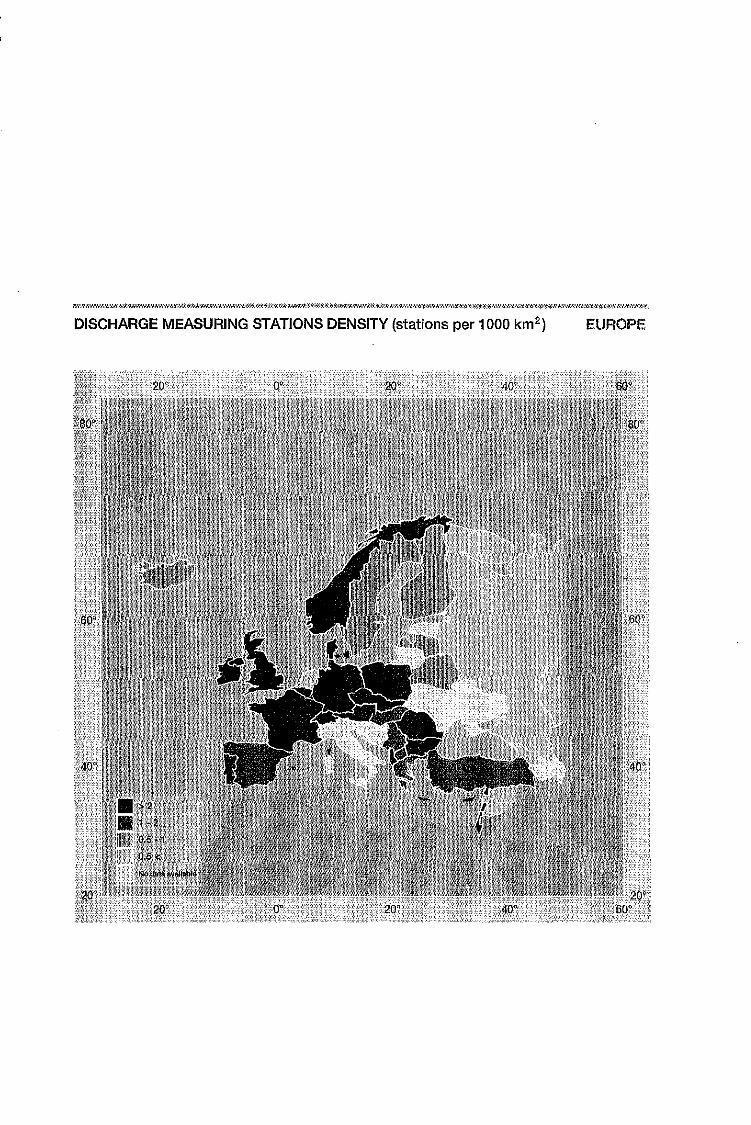
DISCHARGE MEASURING STATIONS DENSITY (stations per 1000 km 2 ) EUROPE
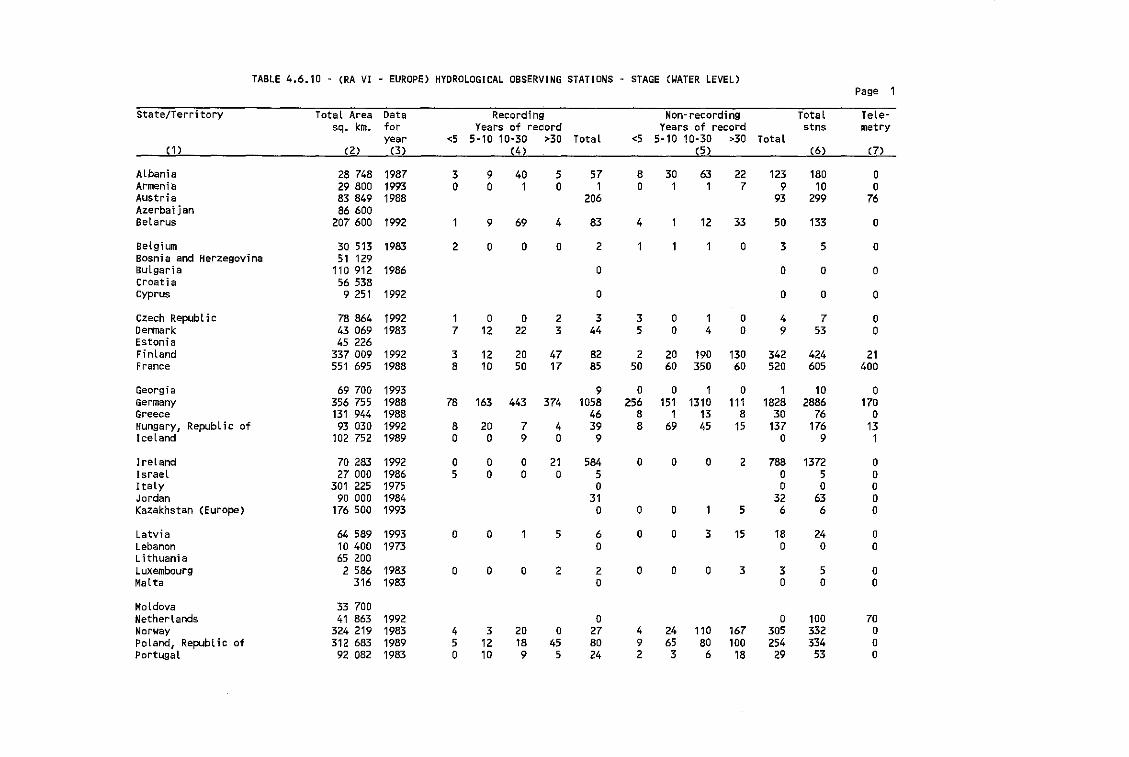
TABLE 4.6.10 - (RA VI - EUROPE) HYOROLOGICAL OBSERVING STATiONS STAGE (WATER LEVEL)Page 1
State/Territory Total Area Data Recording Non-recording Total Tele-sq. km. for Years of record Years of record stns metry
year <5 5-10 10-30 >30 Total <5 5-10 10-30 >30 Total(1 ) (2) (3) (4 ) (5 ) (6) (7)
Albania 28 748 1987 3 9 40 5 57 8 30 63 22 123 180 0Armenia 29 800 1993 0 0 1 0 1 0 1 1 7 9 10 0Austria 83 849 1988 206 93 299 76Azerbai jan 86 600Belarus 207 600 1992 1 9 69 4 83 4 1 12 33 50 133 0
Belgium 30 513 1983 2 0 0 0 2 1 1 1 0 3 5 0Bosnia and Herzegovina 51 129Bulgaria 110 912 1986 0 0 0 0croati a 56 538cyprus 9 251 1992 0 0 0 0
Czech Republ ic 78 864 1992 1 0 0 2 3 3 0 1 0 4 7 0Denmark 43 069 1983 7 12 22 3 44 5 0 4 0 9 53 0Estonia 45 226Finland 337 009 1992 3 12 20 47 82 2 20 190 130 342 424 21France 551 695 1988 8 10 50 17 85 50 60 350 60 520 605 400
Georgia 69 700 1993 9 0 0 1 0 1 10 0Germany 356 755 1988 78 163 443 374 1058 256 151 1310 111 1828 2886 170Greece 131 944 1988 46 8 1 13 8 30 76 0Hungary, Republic of 93 030 1992 8 20 7 4 39 8 69 45 15 137 176 13Iceland 102 752 1989 0 0 9 0 9 0 9 1
IreLand 70 283 1992 0 0 0 21 584 0 0 0 2 788 1372 0Israel 27 000 1986 5 0 0 0 5 0 5 0Italy 301 225 1975 0 0 0 0Jordan 90 000 1984 31 32 63 0Kazakhstan (Europe) 176 500 1993 0 0 0 1 5 6 6 0
Latvia 64 589 1993 0 0 1 5 6 0 0 3 15 18 24 0Lebanon 10 400 1973 0 0 0 0Lithuania 65 200Luxembourg 2 586 1983 0 0 0 2 2 0 0 0 3 3 5 aMaL ta 316 1983 a 0 a 0
Moldova 33 700Netherlands 41 863 1992 0 0 100 70Norway 324 219 1983 4 3 20 0 27 4 24 110 167 305 332 0Poland, Republic of 312 683 1989 5 12 18 45 80 9 65 80 100 254 334 aPortugal 92 082 1983 0 10 9 5 24 2 3 6 18 29 53 0
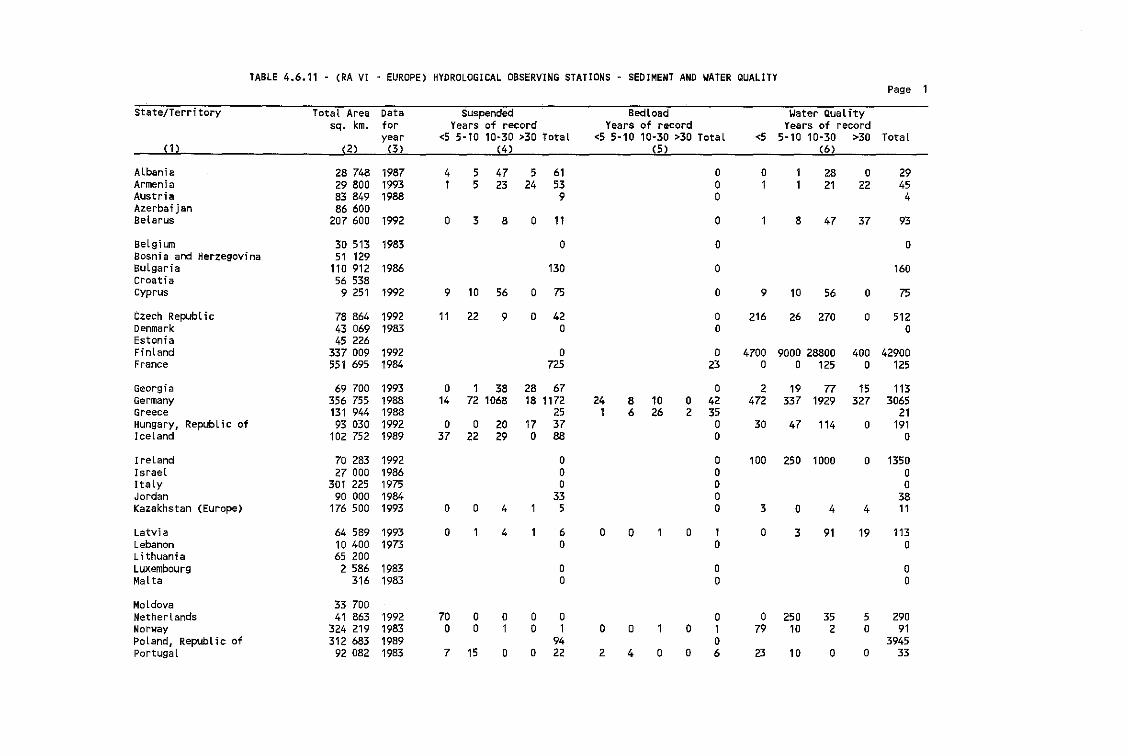
TABLE 4.6.11 - (RA VI - EUROPE) HYDROLOGICAL OBSERVING STATIONS SEDIMENT AND WATER QUALITYPage 1
State/Territory Total Area Data Suspended Bedload Water Qual itysq. km. for Years of record Years of record Years of record
year <5 5-10 10-30 >30 Total <5 5-10 10-30 >30 Total <5 5-10 10-30 >30 Total(1 ) (2) (3 ) (4) (5 ) (6)
ALbania 28 748 1987 4 5 47 5 61 0 0 1 28 0 29Armenia 29 800 1993 1 5 23 24 53 0 1 1 21 22 45Austria 83 849 1988 9 0 4Azerbai jan 86 600Belarus 207 600 1992 0 3 8 0 11 0 1 8 47 37 93
Belgium 3D 513 1983 0 0 0Bosnia and Herzegovina 51 129Bulgaria 110 912 1986 130 0 160Croat; a 56 538Cyprus 9 251 1992 9 10 56 0 75 0 9 10 56 0 75
Czech Republ ic 78 864 1992 11 22 9 0 42 0 216 26 270 0 512Denmark 43 069 1983 0 0 0Estonia 45 226Finland 337 009 1992 0 0 4700 9000 28800 400 42900France 551 695 1984 725 23 0 0 125 0 125
Georg; a 69 700 1993 0 1 38 28 67 0 2 19 77 15 113Germany 356 755 1988 14 72 1068 18 1172 24 8 10 0 42 472 337 1929 327 3065Greece 131 944 1988 25 1 6 26 2 35 21Hungary, Republic of 93 030 1992 0 0 20 17 37 0 3D 47 114 0 191Iceland 102 752 1989 37 22 29 0 88 0 0
Ireland 70 283 1992 0 0 100 250 1000 0 1350Israel 27 000 1986 0 0 0Italy 301 225 1975 0 0 0Jordan 90 000 1984 33 0 38Kazakhstan (Europe) 176 500 1993 0 0 4 1 5 0 3 0 4 4 11
Latvi a 64 589 1993 0 1 4 1 6 0 0 1 0 1 0 3 91 19 113Lebanon 10 400 1973 0 0 0Lithuania 65 200Luxembourg 2 586 1983 0 0 0Malta 316 1983 0 0 0
Moldova 33 700Netherlands 41 863 1992 70 0 0 0 0 0 0 250 35 5 290Norway 324 219 1983 0 0 1 0 1 0 0 1 0 1 79 10 2 0 91Poland, Republic of 312 683 1989 94 0 3945portugal 92 082 1983 7 15 0 0 22 2 4 0 0 6 23 10 0 0 33
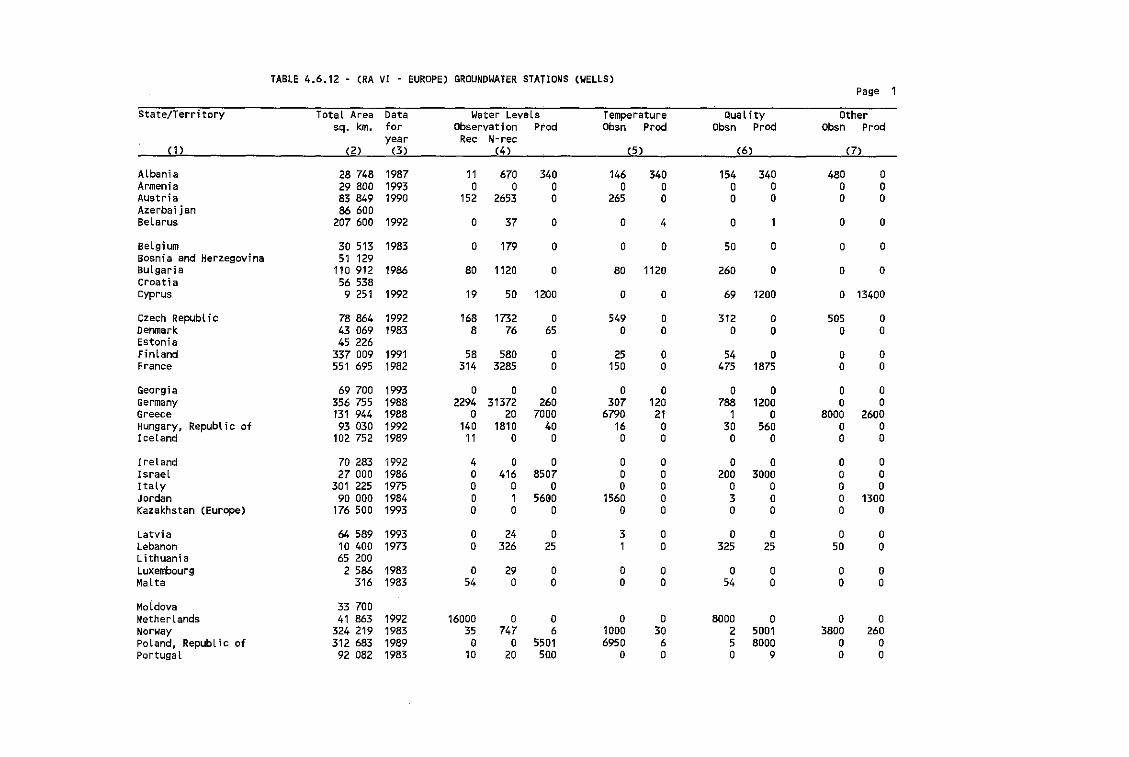
TABLE 4.6.12 - (RA VI - EUROPE) GROUNDWATER STATiONS (WELLS)Page 1
State/Territory Total Area Data Water Levels Temperature Quality Othersq. km. for Observation Prod Obsil Prod Obsn Prod Obsn Prod
year Rec N-rec(1 ) (2) (3) (4) (5 ) (6) (7)
Albania 28 748 1987 11 670 340 146 340 154 340 480 0Armenia 29 800 1993 0 0 0 0 0 0 0 0 0Austria 83 849 1990 152 2653 0 265 0 0 0 0 0Azerbaijan 86 600Belarus 207 600 1992 0 37 0 0 4 0 1 0 0
Belgium 30 513 1983 0 179 0 0 0 50 0 0 0Bosnia and Herzegovina 51 129Bulgaria 110 912 1986 80 1120 0 80 1120 260 0 0 0croatia 56 538cyprus 9 251 1992 19 50 12'00 0 0 69 1200 0 13400
Czech Republ ;c 78864 1992 168 1732 0 549 0 312 0 505 0Denmark. 43 069 1983 8 76 65 0 0 0 0 0 0Estonia 45 226Finland 337 009 1991 58 580 0 25 0 54 0 0 0France 551 695 1982 314 3285 0 150 0 475 1875 0 0
Georgia 69 700 1993 0 0 0 0 0 0 0 0 0Germany 356 755 1988 2294 31372 260 307 120 788 1200 0 0Greece 131 944 1988 0 20 7000 6790 21 1 0 8000 2600Hungary, Republic of 93 030 1992 140 1810 40 16 0 30 560 0 0Iceland 102 752 1989 11 0 0 0 0 0 0 0 0
Ireland 70 283 1992 4 0 0 0 0 0 0 0 0Israel 27 000 1986 0 416 8507 0 0 200 3000 0 0Italy 301 225 1975 0 0 0 0 0 0 0 0 0Jordan 90 000 1984 0 1 5600 1560 0 3 0 0 1300Kazakhstan (Europe) 176 500 1993 0 0 0 0 0 0 0 0 0
Latvia 64 589 1993 0 24 0 3 0 0 0 0 0Lebanon 10 400 1973 0 326 25 1 0 325 25 50 0Lithuania 65 200Luxembourg 2 586 1983 0 29 0 0 0 0 0 0 0MaLta 316 1983 54 0 0 0 0 54 0 0 0
Moldova 33 700Netherlands 41 863 1992 16000 0 0 0 0 8000 0 0 0Norway 324 219 1983 35 747 6 1000 30 2 5001 3800 260Poland, Republic of 312 683 1989 0 0 5501 6950 6 5 8000 0 0portugal 92 082 1983 10 20 500 0 0 0 9 0 0
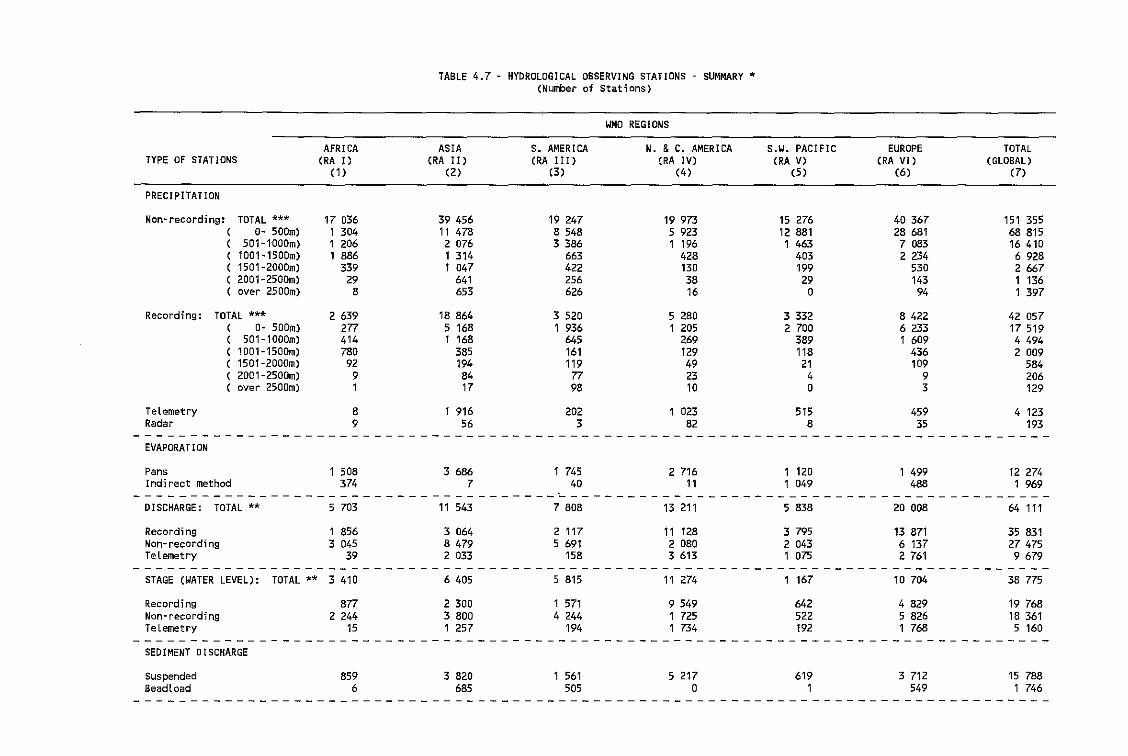
TABLE 4.7 - HYDROLOGICAL OBSERVING STATIONS - SUMMARY'(Number of Stations)
WMO REGIONS
AFRICA ASIA S. AMERICA N. &C. AMERICA S.W. PACIFIC EUROPE TOTALTYPE of STATIONS (RA I) (RA II) (RA III) (RA IV) (RA V) (RA VI) (GLOBAL)
(1 ) (2) (3) (4) (5 ) (6) (7)
PRECIPITATION
Non~recording: TOTAL *** 17 036 39 456 19 247 19 973 15 276 40 367 151 355( 0- 500m) 1 304 11 478 8 548 5 923 12 881 28 681 68 815( 501-1000m) 1 206 2 076 3 386 1 196 1 463 7 083 16 410( 1001-1500m) 1 886 1 314 663 428 403 2 234 6 928( 1501-2000m) 339 1 047 422 130 199 530 2 667( 2001-2500m) 29 641 256 38 29 143 1 136( over 2500m) 8 653 626 16 0 94 1 397
Recording: TOTAL *** 2 639 18 864 3 520 5 280 3 332 8 422 42 057( 0- 500m) 277 5 168 1 936 1 205 2 700 6 233 17 519( 501-1000m) 414 1 168 645 269 389 1 609 4 494( 1001-1500m) 780 385 161 129 118 436 2 009( 1501-2000m) 92 194 119 49 21 109 584( 2001-2500m) 9 84 77 23 4 9 206( over 2500m) 1 17 98 10 0 3 129
Telemetry 8 1 916 202 1 023 515 459 4 123Radar 9 56 3 82 8 35 193
--------------------------------------------------------------------------------EVAPORATION
Pans 1 508 3 686 1 745 2 716 1 120 1 499 12 274Indirect method 374 7 40 11 1 049 488 1 969
------------------------------------~----------------- --------------------------
DISCHARGE: TOTAL ** 5 703 11 543 7 808 13 211 5 838 20 008 64 111
Recording 1 856 3 064 2 117 11 128 3 795 13 871 35 831Non- record; ng 3 045 8479 5 691 2 080 2 043 6 137 27 475Telemetry 39 2 033 158 3 613 1 075 2 761 9679
--------------------------------------------------------------------------------STAGE (WATER LEVEL): TOTAL ** 3 410 6 405 5 815 11 274 1 167 10 704 38 775
Recording 877 2 300 1 571 9 549 642 4 829 19 768Non-recording 2 244 3 800 4 244 1 725 522 5 826 18 361TeLemetry 15 1 257 194 1 734 192 1 768 5 160
SEDIMENT DISCHARGE
SuspendedBeadload
8596
3 820685
1 561505
5 217o
6191
3 712549
15 7881 746
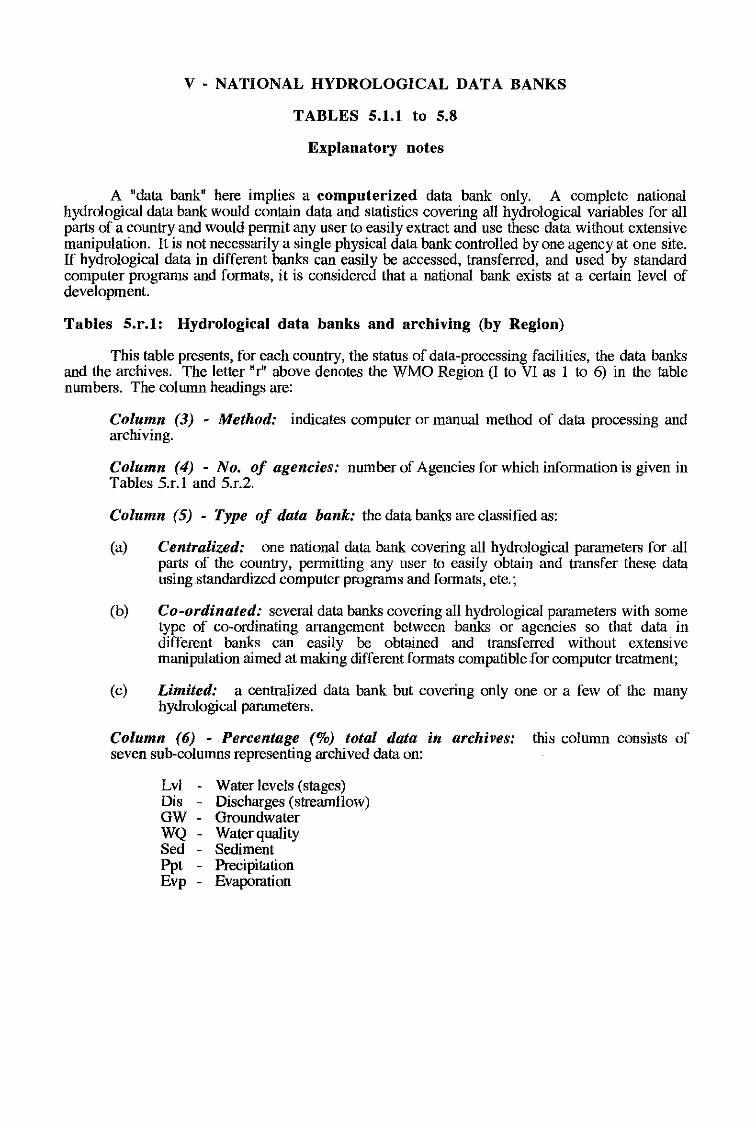
v - NATIONAL HYDROLOGICAL DATA BANKS
TABLES 5.1.1 to 5.8
Explanatory notes
A "data bank" here implies a computerized data bank only. A complete nationalhydrological data bank would contain data and statistics covering all hydrological variables for allparts of a country and would permit any user to easily extract and use these data without extensivemanipulation. It is not necessarily a single physical data bank controlled by one agency at one site.If hydrological data in different banks can easily be accessed, transferred, and used by standardcomputer programs and formats, it is considered that a national bank exists at a certain level ofdevelopment.
Tables 5.r.l: Hydrological data banks and archiving (by Region)
This table presents, for each country, the status of data-processing facilities, the data banksand the archives. The letter "r" above denotes the WMO Region (I to VI as 1 to 6) in the tablenumbers. The column headings are:
Column (3) - Method: indicates computer or manual method of data processing andarchiving.
Column (4) - No. of agencies: number of Agencies for which information is given inTables 5.r.1 and 5.r.2.
Column (5) - Type of data bank: the data banks are classified as:
(a) Centralized: one national data bank covering all hydrological parameters for allparts of the country, permitting any user to easily obtain and tnmsfer these datausing standardized computer programs and formats, etc.;
(b) Co-ordinated: several data banks covering all hydrological parameters with sometype of co-ordinating arrangement between banks or agencies so that data indifferent banks can easily be obtained and transferred without extensivemanipulation aimed at making different formats compatible for computer treatment;
(c) Limited: a centralized data bank but covering only one or a few of the manyhydrological parameters.
Column (6) -Percentage (%) total data in archives: this colwnn consists ofseven sub-columns representing archived data on:
LvI - Water levels (stages)Dis - Discharges (streamflow)GW - GroundwaterWQ - Water qualitySed - SedimentPPt - PrecipitationEvp - Evaporation
v - BANQUES DE DONN~ES HYDROLOGIQUES NATIONALES
TABLEAUX 5.1.1 it 5.8
Notes explicatives
Le terme "banques de donnees" designe iei uniquement des banques de donneesinformatisees. Une banque nationale de donnees hydrologiques complete devrait contenir desdonnees et des statistiques concernant I'ensemble des variables hydrologiques pour toutes lesparties d'un pays et permettre atout utilisateur d'extraire et d'utiliser faeilement ces donnees sanstrop de manipulations. "ne s'agit pas necessairement d'une banque de donnees unique geree parun seul organisme en un seul endroit. Si I'on peut faeilement avoir acces a des donneeshydrologiques dans differentes banques, les transferer et les utiliser a I'aide de programmes et deformats informatiques standard, on considere alors qu'iI existe une banque de donnees nationale,avec un certain niveau de developpement.
Tableau 5.r.1 : Banques de donnees hydrologiques et archivage (par Region)
Ce tableau presente, pour chaque pays, la situation concernant les moyens et installationsde traitement de donnees, les banques et les archives. La lettre "r" correspond au chiffre (de 1 a6)qui, dans I'en-tete des tableaux, designe la Region de I'OMM (de I aVI). Les en-tetes des colonnessont les suivants :
Colonne (3) - Methoded'archivage.
methode, informatique ou manuelle, de traitement et
Co/onne (4) - Nombre d'organismes: nombre des organismes auxquels correspondentles informations figurant dans les tableaux 5.r.1 et 5.r.2.
Colonne (5) - Type de banque: on distingue trois categories de banques de donnees,c1assees selon Ie type d'organisation :
a) banques centralisees: banques nationales contenant des donnees pour tous lesparametres hydrologiques et toutes les regions du pays, ce qui permet a n'importequel usager d'obtenir et de transferer aisement les donnees en utilisant desprogrammes informatiques et des modes de presentation normalises, etc.;
b) banques regies par un accord de coordination, conclu entre banques ouorganismes, qui, aeux tous, couvrent I'ensemble des parametres hydrologiques pourtout Ie pays et aux termes duquel iI est possible d 'obtenir et de transferer desdonnees de ces banques, sans manipulations complexes visant a rendre compatiblesleurs modes de presentation pour leur traitement informatique;
c) banques de donnees partiel/es: banques centralisees, mais ne contenant dedonnees que pour quelques parametres hydrologiques, voire un seul.
BANQUES DE DONN~ES HYDROLOGIQUES NATIONALES V-3
La mention "YES" (OUI) it la place d'un chiffre indique que les donnees sont rec;ues sousforme numerique ou traitees par ordinateur, mais que Ie pourcentage n'est pas connu.
Les tableaux 5.7 et 5.8 presentent un etat recapitulatif, par Region de I'OMM, respectivement pourles banques de donnees hydrologiques et les activites d'archivage, et pour la collecte et les activitesde traitement des donnees hydrologiques.
v - IIAUHOIIAJILlIblE IiAIIKH fHllPOJIOrWIECKHX ./lAlIllblX
TAIiJIHUbI 5.1.1-5.8
IIOJlCHHTeJlLHLle aanHCKH
B HacromueM UacraBJIeHl-1H "DaHle iIllHHhlX" nOHHMaeTCII TonLKO KaK KOMnLIOTepHJHpoBaHHLlii oaHK
iIllHHhlX. DonHhlii HaUHOHanLHhlii oaHK rHAponorH~eCI(HX.llaHHhlx MOr Ohl CO.llepJKaTL iIllHHhle H craTHCTH~ecKHe
napaMeTphl, oxoaThloalOIUHe Bce rHAPOnorn~ecKHe nepeMeHHhle no BCeM ~acrllM crpaHhI, H Mor Ohl .llaTL
BOJMO'lKJlOCTL JlI060My nOJlLJooaTenIO JlerKO HJBJleKaTL H HCHOJlLJOoaTL 3TH iIllJlHhle oro 60nLlliHx MaHHnYJllluuii.
Ue06l1JaTeJlLHO, ~T06h1 c!lHJH~eCI(H e.AHHhlii oaHK iIllHJIhIX ynpaBJIllnCH O.llHHM areHTCTBQM B O.llHOM Mecre. EcnH K
rH,llpoJlOrn~OCJ(HM iIllJlHhlM, HaXOI\llIUHMCH B PaJJlH~HhlX oaHKax, MOlKHO nerKO OCYIUecTBHTL .llOCTyn, OCYIUecTBHTL
HX nepei\ll~y H HCHOJlLJOoaTL C nOMOIULIO craHilllpTHhlX KOMnLlOTepHhlx nporpaMM H c!lopMaTOB, TO MOlKHO ~HnTL,
~o cymecTByeT HanHoHanLHhlii DanK Ha onpe.ileJJeHHoM ypoBHe paJBHTHlI.
TafuHua 5.r.l: IiaHKH H apXHHa"HJI rHllpoJlOrHQeCKHX lIaHlILlX (110 PerHoIIY)
B iIllHHOii TaOJlHUe no KalK./loii crpaHe npe.ilcraBJIlllOTCH CHelleHHH 0 COCTOHHHH TexHH~ecKHX CpellcrB
06pa60TKH iIllHHhlX, oaHKoB I\IIHHhlX H apxH80B. B HOMepax nonHU BhlUleYKaJaHHaJI OyKoa "r" onpellellHeT PernoH
BMO (1-VI KaK 1-6). 3aroJlOBKH KonoHOK CJle./lYIOlUHe:
KOJlOllKU (3) - MemnA: YKaJhloaeT KOMnLIOTepHhlii HnH pY~Hoii MeTO.ll oopa60TKH H apXHBaUHH
iIllHHhIX.
KOJlOllKU (4) KOJlu'IecmtlO U2€lImcmtl: KOJIH~eCTBO areHTcrB, no KOTOphlM npHBOIlHTCH
HH<!>opManHH B monHuax 5 .•. 1115.r.2.
KOJI01IKU (5) - Tun 6amca AaIIlIbIX: OaHKH i\llHHhlX Knaccuc!lHI1HpooaHhI cne./lYIOIUHM 06paJOM:
a) wmmpanU306a1111bli1.: OIlHH Hal1HOHanLHhlii oaHK llaHHhlX. oxoaThloalOIUHii BCe rHllponoru~eQ(He
napaMeTphl MH BCeX ~creii crpaHhI, nOJBOlIHlOIUHii nlO6oMy nOJlLJOoaTeJJlO nerKO nOJl~HTL H
nepellaTL 3TH iIllHHhle C HCHOJlLJooaHHeM CTaHiIllpTHJHpoBaHHhlX KOMnLIOTepHhlX nporpaMM H
c!loPMaTOB H T•.ll.; IL.H
b) KOOPAUlIup06allllbl!l: HeCKonLKO oaHKoB .llaHH"'X, OXBaThlBaIOIUHX BCe rHllpOJlOrH~ecKHe
napaMeTphl npH HanH"HH HeKOTOp",X KOOPIIHHaI1HOHH"'X cornameHHii Me)(()\)' oaHKaMH HnH
areHTCTBaMH, C TeM ~TOO'" lIaHHhle, COlleplKaIUHeCH ° PaJJIH~H"'X oaHKax, MornH OhlTL JlerKO
nony"eHhI H nepellaHhI oeJ 60JILIUHX MaHHnynlll1Hii, npellHaJHa~eHHhlxMH TOro, ~T06h1 CIIeJJaTL
paJJlH~H",e cIloPMaThI (DHMeCTHM",MH IIlIH KOMnLIOTepHoii 06paOOTKH' KllH
c) ozpallU'Ieli1IbI!l: ueHTpanHJOOaHHhlii oaHK iIllHH"'X, HO OXBaT"'BaIOIUHii TonLKO OIlHH HnH
HeOOJlLUloe KOnH"ecr80 HJ MHOruX rHftponoru~eCICHX napaMeTpoo.
KOJlOIIKa (6) - flpoijelll11Ju1Jl AGAR (96) om 06U(e20 lCoJlu'Iecmtla AallllbiX. Komnpan
lIaXOAUTTICH 8 apXU6ax: lIaHHBlI KOJlOHKa COCTOHT HJ ceMH nOIlKonoHOK, npellcraHlIHlOIUHx
nOMeIUeJlH",e 0 apxHo iIllHHhle no cne./lYIOIUHM napaMeTpaM:
Lvi ypoOHH BOIII.I (ypoOHH)
Dis paCXOIII.I (crOK)
GW II0IlJeMH",e 8011I.1
WQ Ka~ecr80 8011I.1
v - BANCOS DE DATOS HIDROLOGICOS NACIONALES
CUADROS 5.1.1 a 5.8
Notas explicativas
En este caso "banco de datos" solo significa banco de datos en ordenador. Un banconacional de datos hidrologicos completo contendria datos y estadisticas que abarcarian todas lasvariables hidrologicas para todas las regiones de un pais y permitiria a cualquier usuario extraer yutilizar facilmente esos datos sin un tratamiento extenso. No se trata necesariamente de un bancode datos fisico unico controlado por un organismo dado en un sitio dado. Si 105 datos hidrologicosde bancos diferentes pueden obtenerse, transferirse y utilizarse facilmente mediante programas yformatos de ordenador normalizados, se puede considerar que un banco nacional existe adeterminado nivel de desarrollo.
Cuadros 5.r.1: Bancos y archivo de datos hidrologicos (por Region)
Este cuadro presenta para cada pais el estado de 105 medios e instalaciones de proceso dedatos, 105 bancos de datos y 105 archivos. La letra "r" de 105 numeros del cuadro indica la Region dela OMM (I a VI como 1 a 6). Los encabezamientos de las columnas son 105 siguientes:
Columna (3) - Metodo: Indica el metodo computarizado 0 manual de proceso yarchivode datos.
Columna (4) - Numero de organismos; Numero de organismos para 105 cuales se brindainformacion en 105 Cuadros 5.r.1 y 5.r.2.
Columna (5) - Tipos de bancos de datos; Los bancos de datos se c1asifican de la siguientemanera:
a) centralizados; bancos de datos nacionales que abarcan todos los parametroshidrologicos para todas las zonas del pais, permitiendo a cualquier usuario obtener ytransferir facilmente dichos datos mediante la utilizacion de programas y formatos deordenador normalizados, etc.;
b) coordinados; varios bancos de datos que abarcan todos 105 parametros hidrologicoscon cierto tipo de arreglo para la coordinacion entre los bancos 0 los organismos, demodo tal que los datos de los diferentes bancos puedan conseguirse y transferirse confacilidad sin un tratamiento extenso tendiente a lograr que los diferentes formatossean compatibles para el tratamiento par ordenador;
c) limitados: bancos de datos centralizados pero que abarcan solo uno 0 unos pocos delos muchos parametros hidrologicos.
Columna (6) - Porcentaje (%) del total de datos de los archivos: esta columna consta desiete subcolumnas que representan los datos archivados relativos a los siguienteselementos:
Lvi Niveles de agua (altura)Dis Caudal (flujo de carriente)GW Agua subterraneaWQ Calidad del aguaSed SedimentosPpt PrecipitacionEvp Evaporacion
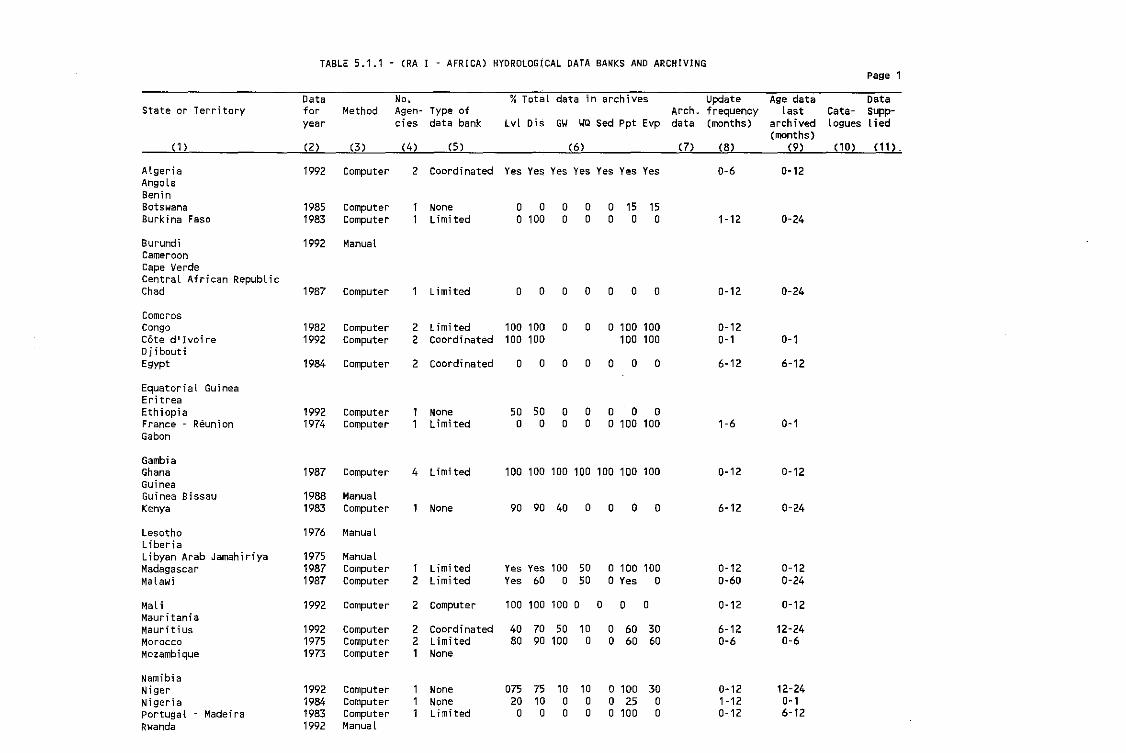
TABLE 5.1.1 - (RA I ~ AFRICA) HYDROLOGICAL DATA BANKS AND ARCHIVINGPage
Data No. % Total data in archives Update Age data DataState or Territory for Method Agen- Type of Arch. frequency last Cata- supp-
year cies data bank Lvl Dis GW we Sed Ppt Evp data (months) archived logues lied(months)
(1 ) (2 ) (3) (4) (5 ) (6) (7) (8) (9) ~ (10) (11) .
Algeria 1992 Computer 2 Coordinated Yes Yes Yes Yes Yes Yes Yes 0-6 0-12AngolaBeninBotswana 1985 Computer 1 None 0 0 0 0 0 15 15Burkina Faso 1983 Computer 1 Limi ted o 100 0 0 0 0 0 1-12 0-24
Burundi 1992 ManualCameroonCape VerdeCentral African RepublicChad 1987 Computer 1 Limited 0 0 0 0 0 0 0 0-12 0-24
ComorosCongo 1982 Computer 2 Limited 100 100 0 0 o 100 100 0-12Cote d l Ivoire 1992 computer 2 Coordinated 100 100' 100 100 0-1 0-1DjiboutiEgypt 1984 computer 2 coordinated 0 0 0 0 0 0 0 6-12 6-12
Equatorial GuineaEritreaEthiopia 1992 Computer 1 None 50 50 0 0 0 0 0France Reunion 1974 computer 1 Limited 0 0 0 0 o 100 100 1-6 0-1Gabon
GambiaGhana 1987 Computer 4 Limi ted 100 100 100 100 100 100 100 0-12 0-12GuineaGuinea Bissau 1988 ManualKenya 1983 Computer 1 None 90 90 40 0 0 0 0 6-12 0-24
Lesotho 1976 ManualLiberiaLibyan Arab Jamahiriya 1975 ManualMadagascar 1987 Computer 1 Limi ted Yes Yes 100 50 o 100 100 0-12 0-12Malawi 1987 Computer 2 Limited Yes 60 0 50 o Yes a 0-60 0-24
Mal i 1992 Computer 2 computer 100 100 100 0 0 0 0 0-12 0-12MauritaniaMauritius 1992 Computer 2 Coordinated 40 70 50 10 0 60 30 6-12 12-24Morocco 1975 Computer 2 Limited 80 90 100 0 0 60 60 0-6 0-6Mozambique 1973 Computer 1 None
NamibiaNiger 1992 Computer 1 None 075 75 10 10 o 100 30 0-12 12-24Nigeria 1984 Computer 1 None 20 10 0 0 0 25 0 1-12 0-1portugal - Madeira 1983 Computer 1 Limited 0 0 0 0 o 100 0 0-12 6-12Rwanda 1992 Manual
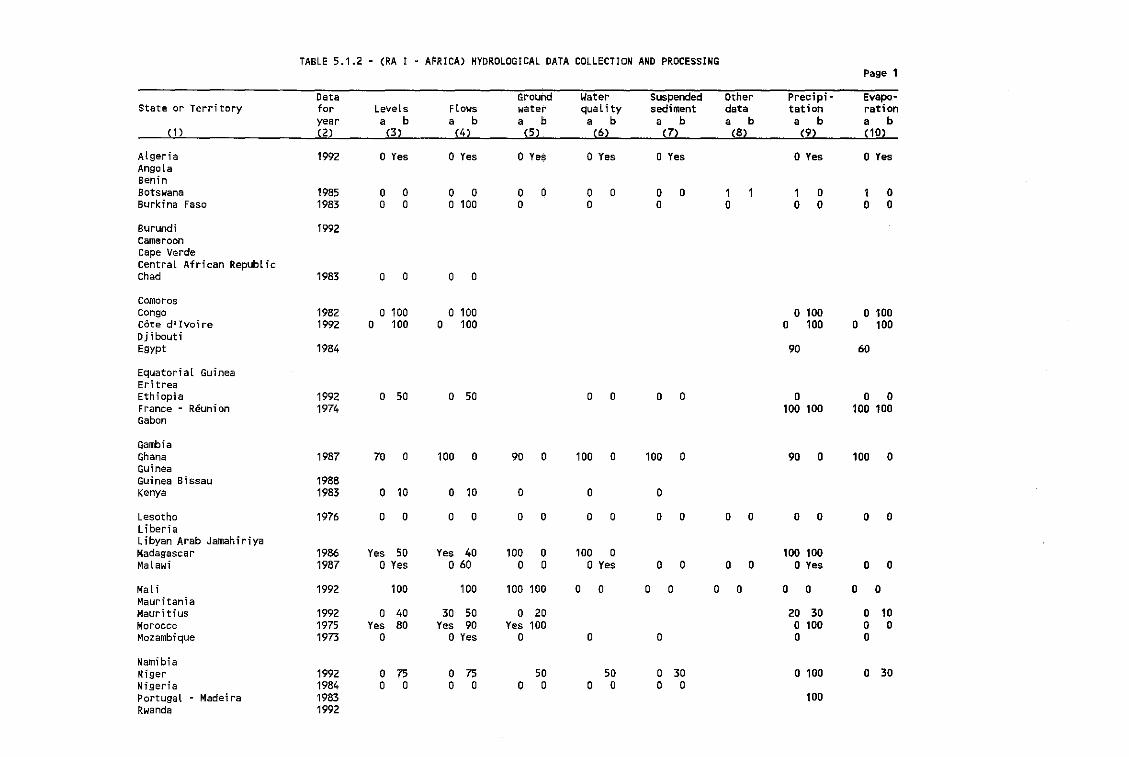
TABLE 5.1.2 - (RA I - AFRICA) HYDROLOGICAL DATA COLLECTION AND PROCESSiNGPage 1
Data Ground Water Suspended Other Precipi- Evapo-State or Territory for Levels Flows water quality sediment data tation ration
year a b a b a b a b a b a b a b a b(1) (2) (3 ) (4) (5 ) (6) (7) (8) (9) (10)
Algeria 1992 o Yes o Yes o Yes a Yes o Yes o Yes o YesAngolaBeninBotswana 1985 0 0 0 0 0 0 0 0 0 0 1 1 1 0 1 0Burkina Faso 1983 0 0 o 100 0 0 0 0 0 0 0 0
Burundi 1992CameroonCape VerdeCentral African RepublicChad 1983 0 0 0 0
Comoroscongo 1982 o 100 o 100 o 100 o 100Cote d l Ivoi re 1992 0 100 0 100 0 100 0 100DjiboutiEgypt 1984 90 60
Equatorial GuineaEri treaEthiopia 1992 0 50 0 50 0 0 0 0 0 0 0France - Reunion 1974 100 100 100 100Gabon
GambiaGhana 1987 70 0 100 0 90 0 100 0 100 0 90 0 100 0GuineaGuinea Bissau 1988Kenya 1983 0 10 0 10 0 0 0
Lesotho 1976 0 0 0 0 0 0 0 0 0 0 0 0 0 0 0 0LiberiaLibyan Arab JamahiriyaMadagascar 1986 Yes 50 Yes 40 100 0 100 0 100 100Malawi 1987 o Yes o 60 0 0 o Yes 0 0 0 0 DYes 0 0
Mali 1992 100 100 100 100 0 0 0 0 0 0 0 0 0 0MauritaniaMauritius 1992 0 40 30 50 0 20 20 30 0 10Morocco 1975 Yes 80 Yes 90 Yes 100 o 100 0 0Mozambique 1973 0 o Yes 0 0 0 0 0
NamibiaNiger 1992 0 75 0 75 50 50 0 30 o 100 0 30Nigeria 1984 0 0 0 0 0 0 0 0 0 0Portugal - Madeira 1983 100Rwanda 1992
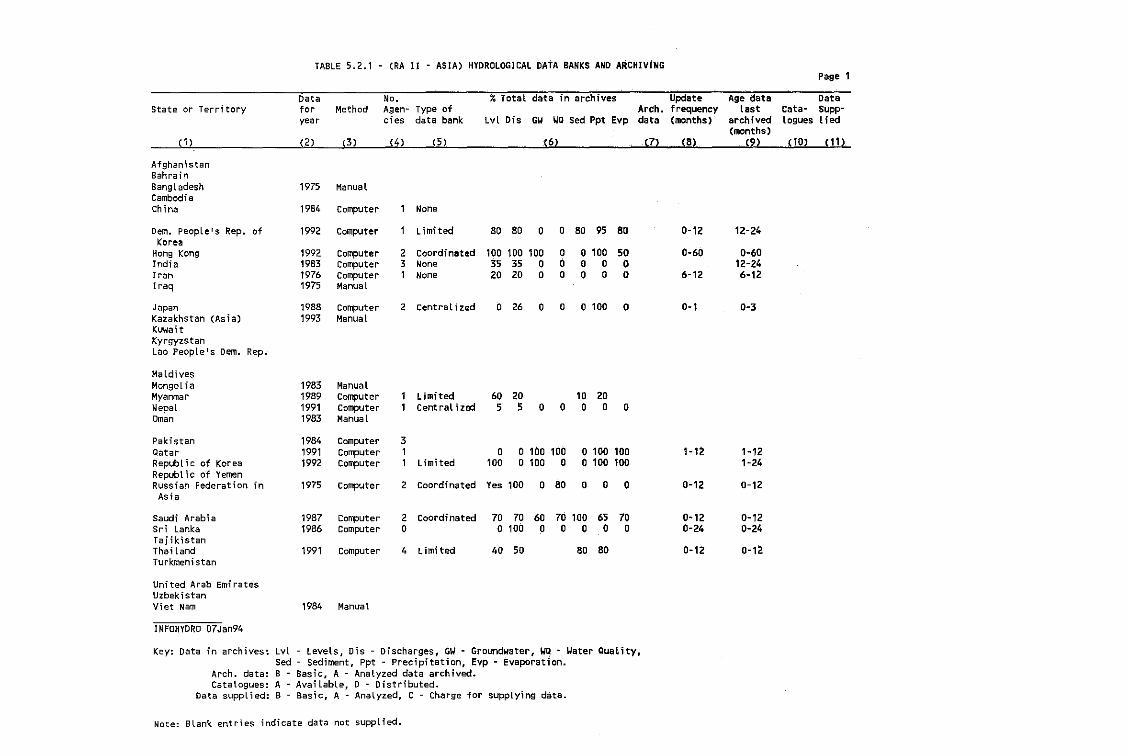
TABLE 5.2.1 M (RA II - ASIA) HYDROLOGICAL DATA BAtfKS AND ARCHIVt'NGPage 1
DataCata- Supplogues lied
Updatefrequency(months)
%Total data in archivesArch.
LvL Dis GW WQ Sed ppt Evp dataType ofdata bank
No.Agen~
ciesMethod
Dataforyear
Age datalast
archived(months)
(1) (2) (3) _(,) J,) (6) (7) (8) (9) (10) (11)
State or Territory
AfghanistanBahrainBangladesh 1975 ManualCambodiaChina 1984 Computer 1 None
Oem. People's Rep. of 1992 Computer 1 Limited 80 80 0 0 80 95 80 0-12 12-24Korea
Hong Kong 1992 Computer 2 Coordinated 100 100 100 0 o 100 50 0-60 0-60India 1983 Computer 3 None 35 35 0 0 0 0 0 12-24Iran 1976 Computer 1 None 20 20 0 0 0 0 0 6-12 6-12Iraq 1975 Manual
Japan 1988 computer 2 central ized 0 26 0 0 o 100 0 0-1 0-3Kazakhstan (Asia) 1993 ManualKuwaitKyrgyzstanLao People's Oem. Rep.
MaldivesMongol ia 1983 ManualMyanmar 1989 Computer 1 Limited 60 20 10 20Nepal 1991 Computer 1 Centralized 5 5 0 0 0 0 0Oman 1983 Manual
Pakistan 1984 Computer 3Qatar 1991 Computer 1 0 o 100 100 o 100 100 1-1~ 1-12Republic of Korea 1992 Computer 1 Limited 100 o 100 0 o 100 100 1-24Republic of YemenRussian Federation in 1975 computer 2 Coordinated Yes 100 0 80 0 0 0 0-12 0-12Asia
Saudi Arabi a 1987 computer 2 Coordinated 70 70 60 70 100 65 70 0-12 0-12Sri Lanka 1986 Computer 0 o 100 0 0 0 0 0 0-24 0-24TajikistanThailand 1991 Computer 4 Limited 40 50 80 80 0-12 0-12Turkmenistan
United Arab EmiratesUzbekistanViet Nam 1984 Manual
INFOHYORO 07Jan94
Key: Data in archives~ Lvl - Levels, Dis - Discharges, GW - Groundwater, WQ - Water QuaLity,Sed - Sediment, Ppt - Precipitation, Evp - Evaporation.
Arch. data: B Basic, A - Analyzed data archived.Catalogues: A AvailabLe, 0 - Distributed.
Data suppLied: B - Basic, A M Analyzed, C - Charge for supplying data.
Note: Blank entries indicate data not suppLied.
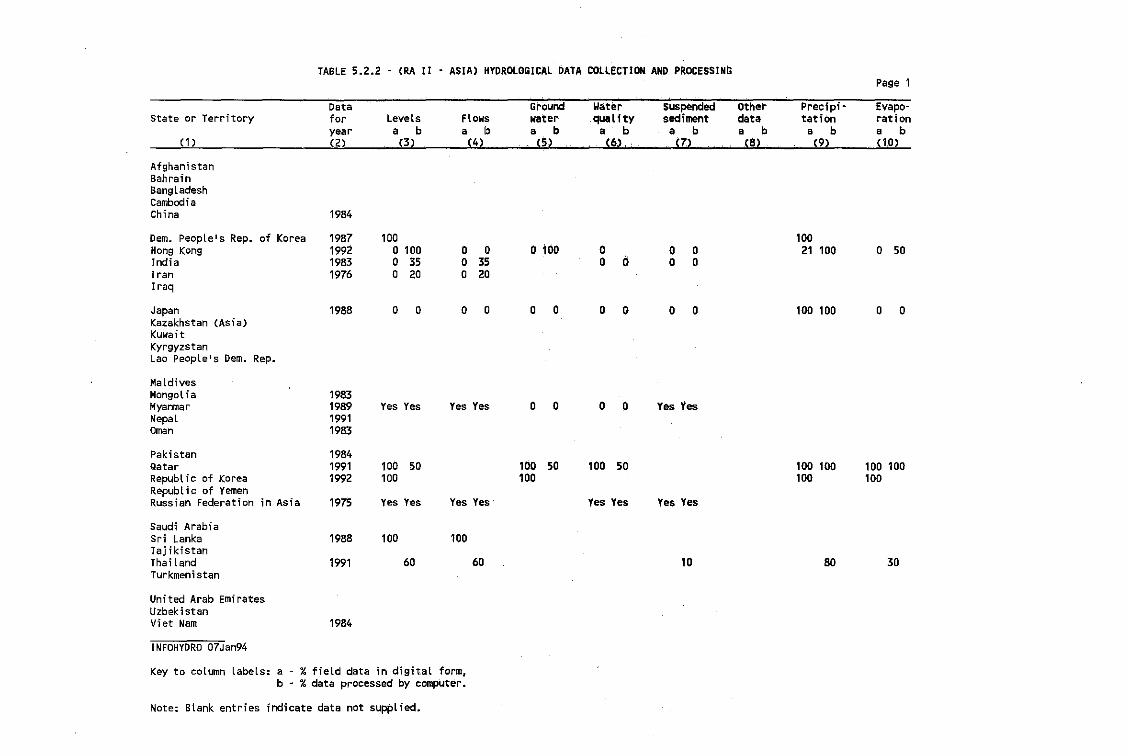
State or Territory
(1 )
TABLE 5.2.2 - (RA II • ASIA) HYDRDLDBICAL DATA COLLECTION AND PROCESSING
Data Ground water Suspended Other Precipi~
for Levels Flows water .quality sediment data tationyear a b a b a b a b a b a b a b(2) (3) __ 1~1 ~.~(5~__ ~), ~_ . .1ZJ. __ . (aL (9)
Page 1
Evaporationa b(10)
AfghanistanBahrainBangladeshCambodi aChina
Oem. People's Rep. of KoreaHong KongIndiaIranIraq
JapanKazakhstan (Asia)KuwaitKyrgyzstanLao People's Oem. Rep.
1984
1987 1001992 a 100 a a1983 a 35 o 351976 a 20 a 20
1988 a a a a
a 100
a a
aa 6
a 0
a aa a
6 a
10021 100
100 100
a 50
a 0
MaldivesMongoliaMyanmarNepalOman
PakistanQatarRepublic of KoreaRepublic of YemenRussian Federation in Asia
Saudi Arabi aSri LankaTajikistanThai landTurkmenistan
United Arab EmiratesUzbekistanViet Nam
INFOHYDRO 07Jan94
1983198919911983
198419911992
1975
1988
1991
1984
Yes Yes
100 50100
yes les
100
60
Yes Yes
Yes Yes
100
60
a a
100 '50100
a 0
100 50
Yes Yes
Yes Yes
Yes Yes
10
100 100100
80
100 100100
30
Key to column labels: a %field data in digital fonm,b %data processed by computer.
Note: Blank entries indicate data not suppLied.
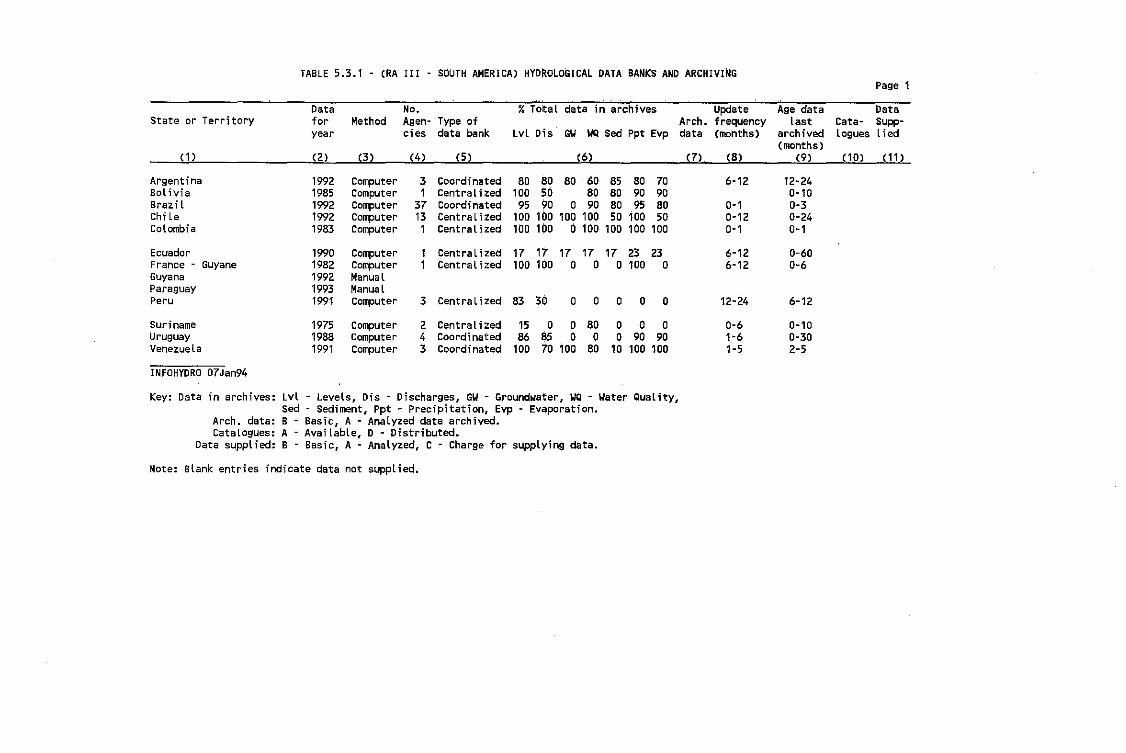
TABLE 5.3.1 (RA III SOUTH AMERICA) HYD~OLOGICAL DATA BANKS AND ARCHIVINGPage 1
Data No. % Total data in archives Update Age data DataState or Territory for Method Agen- Type of Arch. frequency last Cata- Supp-
year cies data bank Lvl Dis GW WQ.Sed Ppt Evp data (IIIOnths) archived tOQues lied(months)
(1) (2) (3) (4) (5 ) (6) (7) (S) (9) (10) (11)
Argentina 1992 Computer 3 Coordinated SO SO SO 60 S5 SO 70 6-12 12·24Bolivia 19S5 Computer 1 Central fzed 100 50 SO SO 90 90 0-10Brazil 1992 Computer 37 Coord; nated 95 90 0 90 SO 95 SO 0-1 0·3Chi Le 1992 Computer 13 Central ;zed 100 100 100 100 50 100 50 0-12 0-24Colomb; a 19S3 Computer 1 Central ized 100 100 o 100 100 100 100 0-1 0·1
Ecuador 1990 Computer 1 Centralized 17 17 17 17 17 23 23 6-12 0-60France - Guyane 19S2 computer 1 Cent ra l ;zed 100 100 0 0 o 100 0 6-12 0·6Guyana 1992 ManualParaguay 1993 ManualPeru 1991 Computer 3 CentraL lzed S3 30 0 0 0 0 0 12·24 6-12
Suriname 1975 Computer 2 CentraL ized 15 0 0 SO 0 0 0 0-6 0-10Uruguay 19S5 Computer 4 Coordinated 86 S5 0 0 0 90 90 1·6 0-30Venezuela 1991 Computer 3 Coord; nated 100 70 100 SO 10 100 100 '-5 2-5
INFOHYORO 07Jan94
Key: Data in archives: LvL - LeveLs, Dis - Discharges, GW - Groundwater, WQ - Water Quality,Sed - Sediment, Ppt - Precipitation, Evp - Evaporation.
Arch. data B - Basic, A - Analyzed data archived.Catalogues A - Available, D - Distributed.
Data supplied B - Basic, A - Analyzed, C - Charge for supplying data.
Note: Blank entries indicate data not supplied.
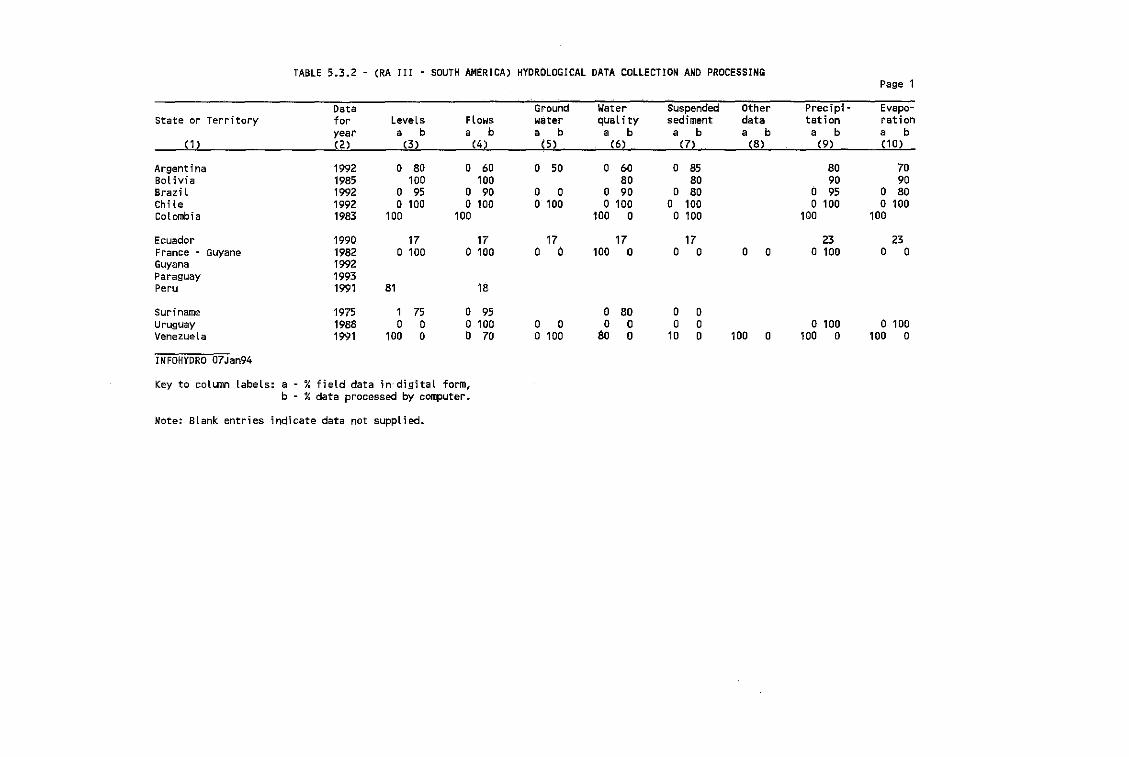
TABLE 5.3.2 - (RA III - SOUTH AMERICA) HYDROLOGICAL DATA COLLECTION AND PROCESSINGPage 1
Data Ground Water Suspended Other Precipi .. Evapo-State or Territory for l.eveLs Flows water quali ty sediment data tation ration
year a b a b a b a b a b a b a b a b(1 ) (2) (3) (4) (5) (6) (7) (8) (9) (10)
Argentina 1992 0 80 0 60 0 50 0 60 0 85 80 70Bol ivi a 1985 100 100 80 80 90 90Brazil 1992 0 95 0 90 0 0 0 90 0 80 0 95 0 80Chi le 1992 o 100 o 100 o 100 o 100 0 100 o 100 o 100Colombia 1983 100 100 100 0 o 100 100 100
Ecuador 1990 17 17 17 17 17 23 23France - Guyane 1982 o 100 o 100 0 0 100 0 0 0 0 0 o 100 0 0Guyana 1992Paraguay 1993Peru 1991 81 18
Suriname 1975 1 75 0 95 0 80 a 0Uruguay 1988 0 a a 100 0 a a 0 a a o 100 o 100Venezuela 1991 100 0 a 70 a 100 80 a 10 a 100 a 100 a 100 0
INFoHYDRO 07Jan94
Key to column labels: a %field data in"digitaL form,b %data processed by computer.
Note: Blank entries indicate data not supplied.
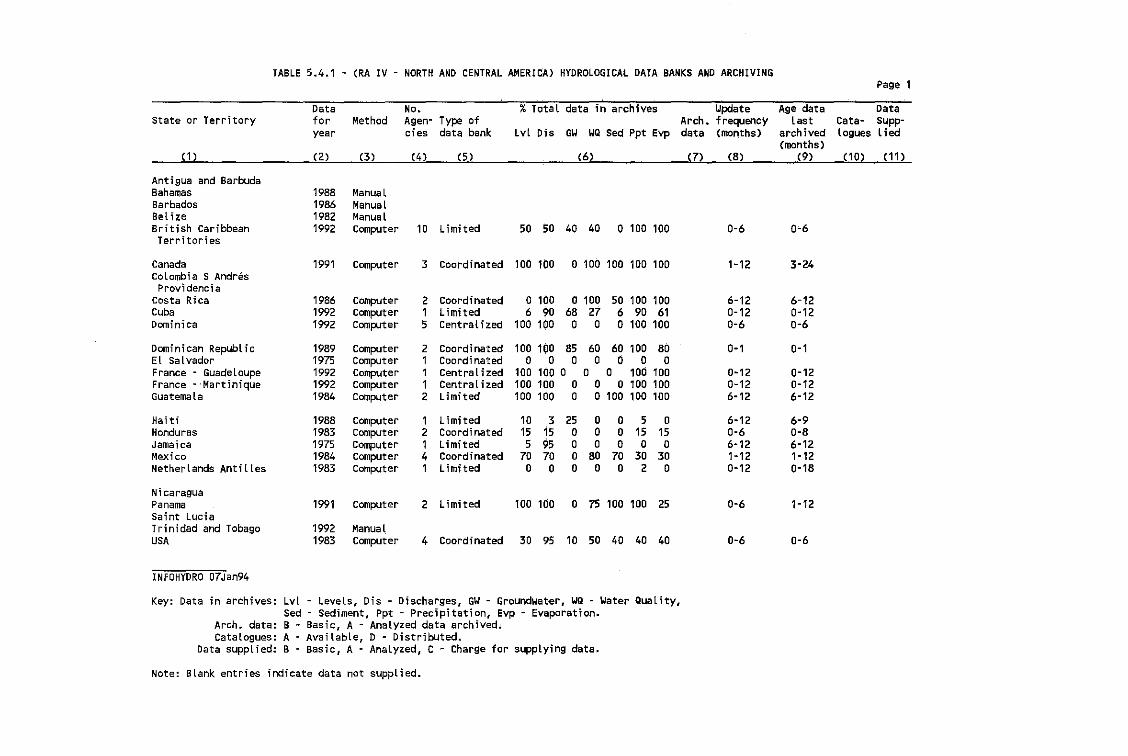
TABLE 5.4.1 - (RA IV - NORTH AND CENTRAL AMERICA) HYDROLOGICAL DATA BANKS AND ARCHIVINGPage 1
Data No. % Total data in archives Update Age data DataState or Territory for Method Agen- Type of Arch. frequency last Cata~ Supp-
year cies data bank Lvl Dis GW WQ Sed Ppt Evp data (months) archived lOQues lied(months)
(1 ) (2) (3) (4) (5 ) (6) (7) (8) (9) (10) (11)
Antigua and BarbudaBahamas 1988 ManualBarbados 1986 ManualBelize 1982 ManualBritish Caribbean 1992 Computer lD Lim; ted 50 50 40 40 o 100 100 0-6 0"6Terri tori es
Canada 1991 Computer 3 Coordinated 100 100 o 100 100 100 100 1-12 3-24Colombia S Andres
ProvidenciaCosta Rica 1986 Computer 2 Coordinated o 100 o 100 50 100 100 6-12 6-12Cuba 1992 Computer 1 Lim; ted 6 90 68 27 6 90 61 0-12 0-12Dominica 1992 Computer 5 Centralized 100 100 0 0 o 100 100 0"6 0-6
Dominican Republic 1989 Computer 2 Coordinated 100 100 85 60 60 100 80 0-1 0-1El Salvador 1975 Computer 1 Coordinated 0 0 0 0 0 0 0France - Guadeloupe 1992 Computer 1 Central ized 100 100 0 0 0 100 100 0-12 0-12France -·Martinique 1992 Computer 1 Central ized 100 100 0 0 o 100 100 0-12 0-12Guatemala 1984 Computer 2 Limited 100 100 0 o 100 100 100 6-12 6-12
Haiti 1988 Computer 1 Limited 10 3 25 0 0 5 0 6-12 6-9Honduras 1983 Computer 2 Coordinated 15 15 0 0 0 15 15 0-6 0-8Jamaica 1975 Computer 1 Limited 5 95 0 0 0 0 0 6-12 6-12Mexico 1984 Computer 4 Coordinated 70 70 0 80 70 30 30 1-12 1-12Netherlands Antilles 1983 Computer 1 Limi ted 0 0 0 0 0 2 0 0-12 0-18
NicaraguaPanama 1991 Computer 2 Limi ted 100 100 0 75 100 100 25 0-6 1-12Saint LuciaTrinidad and Tobago 1992 ManualUSA 1983 Computer 4 Coordinated 30 95 10 50 40 40 40 0-6 0-6
INFOHYDRO 07Jan94
Key: Data in archives: Lvl - Levels, Dis - Discharges, GW - Groundwater, WQ - Water Quality,Sed - Sediment, Ppt - Precipitation, Evp - Ev~poration.
Arch. data: B ~ Basic, A - Analyzed data archived~
Catalogues: A - Available, 0 - Distributed.Data supplied: B - Basic, A - Analyzed, C - Charge for supplying data.
Note: Blank entries indicate data not supplied.
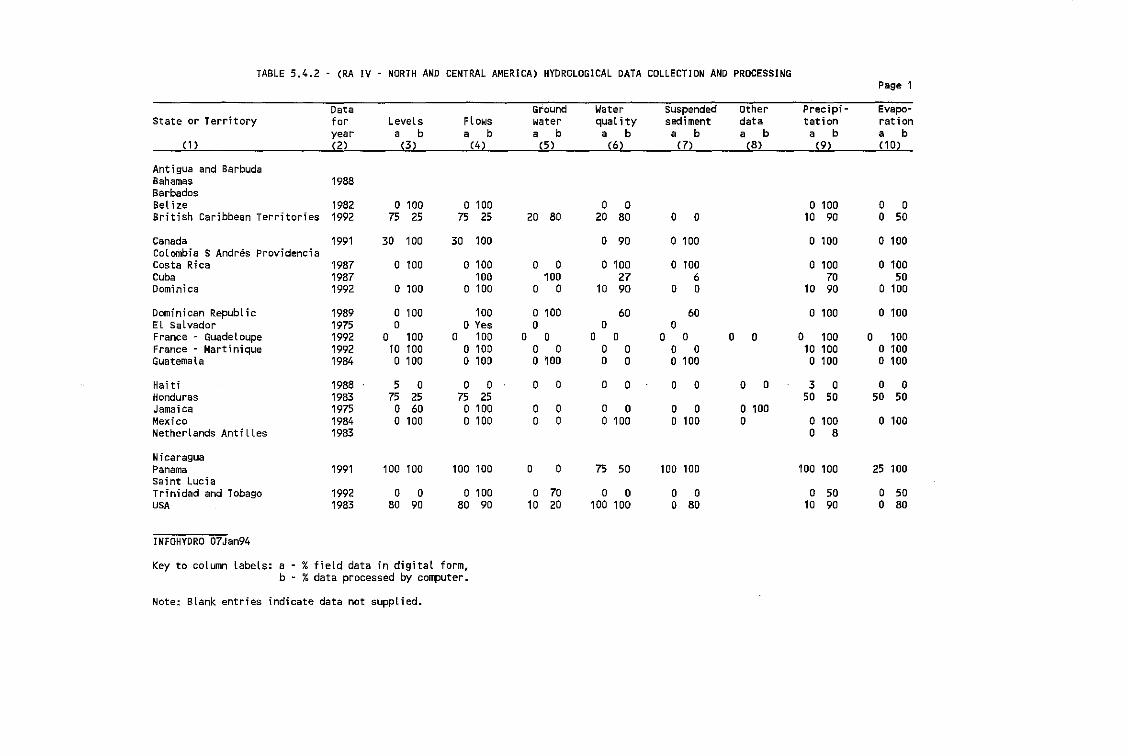
TABLE 5.4.2 - (RA IV - NORTH AND CENTRAL AMERICA) HYDROLOGICAL DATA COLLECTION AND PROCESSINGPage 1
Data Ground Water Suspended Other Precipi - Evapo-State or Territory for Levels Flows water qual ;ty sediment data tation ration
year a b a b a b a b a b a b a b a b(1) (2) (3) (4) (5 ) (6) (7) (8) (9) (10)
Antigua and BarbudaBahamas 1988BarbadosBelize 1982 o 100 o 100 0 0 o 100 0 0British Caribbean Territories 1992 75 25 75 25 20 80 20 80 a a 10 90 0 50
Canada 1991 30 100 30 100 0 90 o 100 o 100 o 100Colombia S Andres ProvidenciaCosta Rica 1987 o 100 o 100 a 0 o 100 o 100 o 100 o 100Cuba 1987 100 100 27 6 70 50Dominica 1992 o 100 a 100 0 0 10 90 0 0 10 90 o 100
Dominican Republic 1989 o 100 100 a 100 60 60 o 100 o 100El Salvador 1975 0 DYes 0 0 0France ~ Guadeloupe 1992 0 100 0 100 0 0 0 0 0 0 0 0 0 100 0 100France - Martinique 1992 10 100 o 100 0 0 0 a 0 0 10 100 o 100Guatemala 1984 o 100 o 100 o 100 0 0 o 100 o 100 o 100
Ha; ti 1988 5 0 0 0 0 0 0 0 0 0 0 0 3 0 0 0Honduras 1983 75 25 75 25 50 50 50 50Jama; ca 1975 0 60 o 100 0 0 0 0 0 0 o 100Mexico 1984 o 100 o 100 0 0 o 100 o 100 0 o 100 o 100Netherlands Antilles 1983 0 8
NicaraguaPanama 1991 100 100 100 100 0 0 75 50 100 100 100 100 25 100S8int LuciaTrinidad and Tobago 1992 0 0 o 100 0 70 0 0 0 0 0 50 0 50USA 1983 80 90 80 90 10 20 100 100 0 80 10 90 0 80
INFOHYDRO 07Jan94
Key to column labels: a - %field data in digital form,b - %data processed by computer.
Note: Blank entries indicate data not supplied.
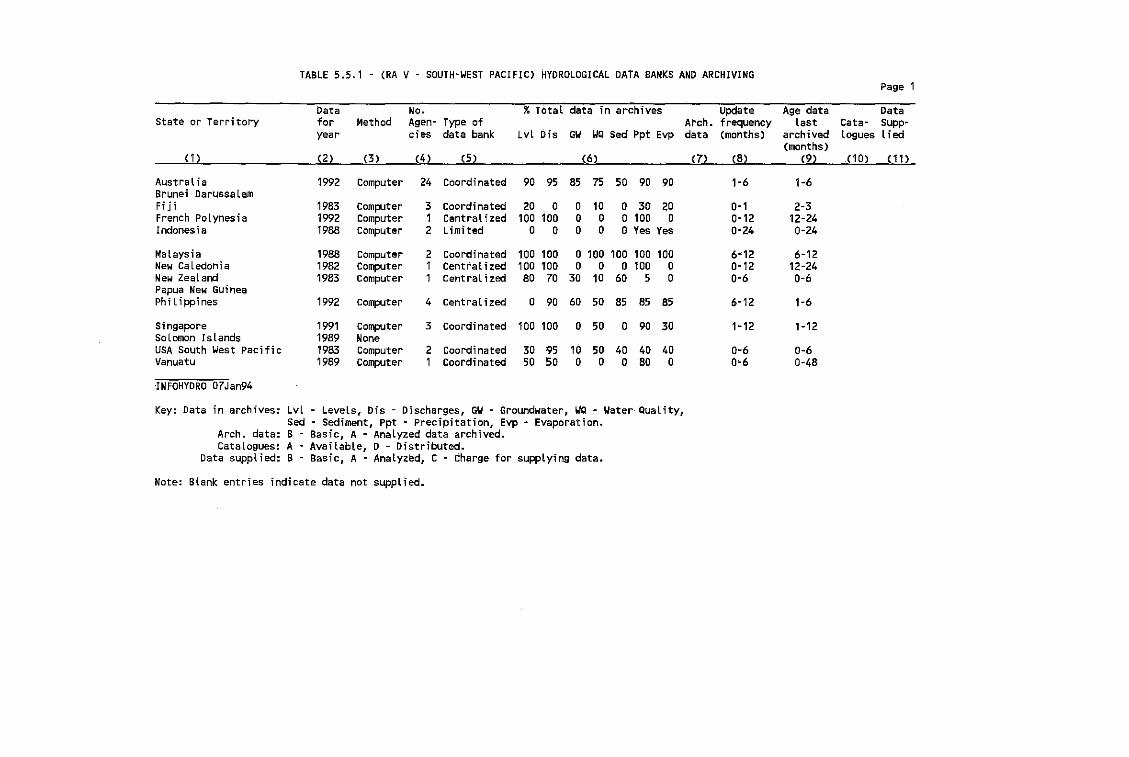
State or Territory
(1 )
AustraliaBrunei DarussalamFijiFrench PolynesiaIndonesia
MalaysiaNew CaledoniaNew ZealandPapua New GuineaPhi l ippines
SingaporeSolomon IslandsUSA South West PacificVanuatu
INFOHYDR007Jan94
TABLE 5.5.1 (RA V - SOUTH-WEST PACIFIC) HYDROLOGICAL DATA BANKS AND ARCHIVINGPage 1
Data No. %TotaL data in archives Update Age data Datafor Method Agen- Type of Arch. frequency last Cata- Supp-year des data bank Lvl Dis GW WQ Sed Ppt Evp data (months) archived logues lied
(months)(2 ) (3 ) (4 ) (5) (6) (7) (8) (9) (10) (11)
1992 Computer 24 Coordinated 90 95 85 75 50 90 90 1-6 1-6
1983 Computer 3 Coordinated 20 0 0 10 0 30 20 0-1 2-31992 Computer 1 Centralized 100 100 0 0 o 100 0 0-12 12-241988 Computer 2 Limited 0 0 0 0 o Yes Yes 0-24 0-24
1988 Computer 2 Coordinated 100 100 o 100 100 100 100 6-12 6-121982 Computer 1 Centra l i zed 100 100 0 0 o 100 0 0-12 12-241983 Computer 1 Cent rat Tzed 80 70 30 10 60 5 0 0-6 0-6
1992 Computer 4 central ized 0 90 60 50 85 85 85 6-12 1-6
1991 Computer 3 Coordinated 100 too 0 50 0 90 30 1-12 1-121989 None1983 Computer 2 Coordinated 30 95 10 50 40 40 40 0-6 0-61989 Computer 1 Coordinated 50 50 0 0 0 80 0 0-6 0-48
Key: Data in archives: Lvl - Levels, Dis - Discharges, GW - Groundwater, ~Q - Water'Quality,Sed - Sediment, Ppt ~ Precipitation, Evp • Evaporation.
Arch. data B Basic, A - Analyzed data archived.Catalogues A Available, D - Distributed.
Data supplied B - Basic 8 A - Analyzed, C - charge for supplying data.
Note: Blank entries indicate data not supplied.
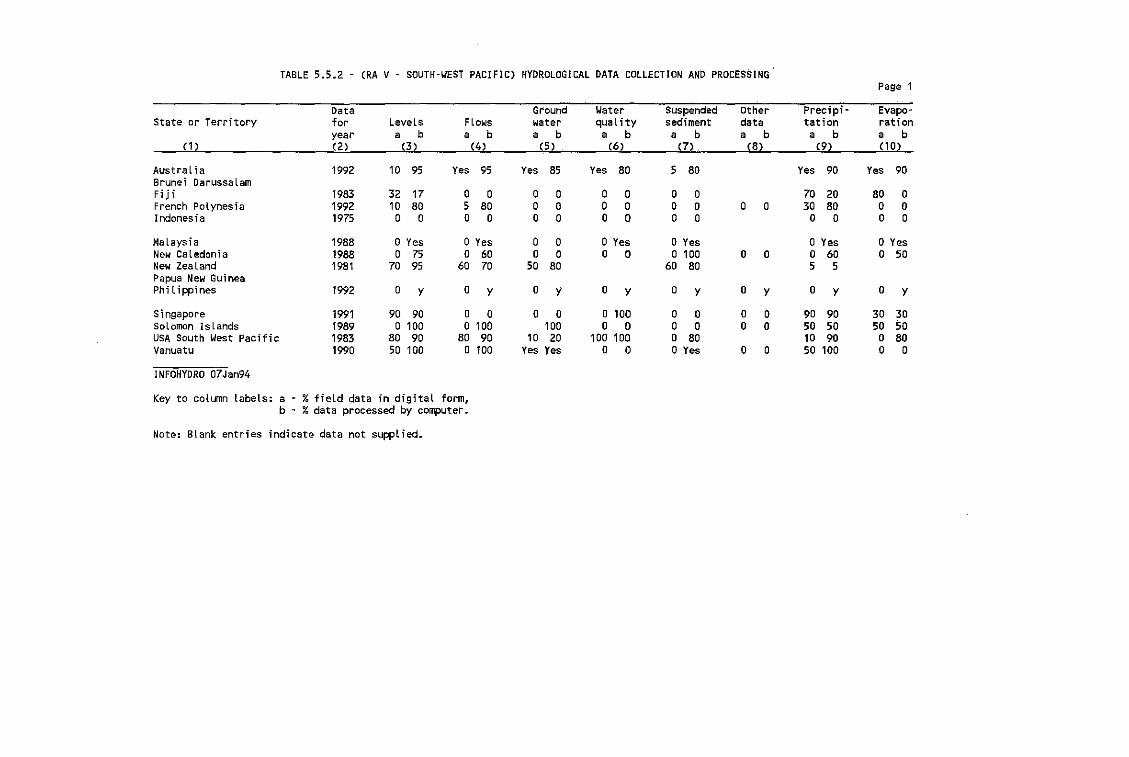
TABLE 5.5.2 - (RA V - SOUTH-YEST PACIFIC) HYDROLOGICAL DATA COLLECTION AND PROCESSING'
Data Ground Water Suspended OtherState or Territory for Levels Flows water qual ity sediment data
year a b a b a b a b a b a b(1 ) (2) (3 ) (4) (5 ) (6) (7) , (8)
Australia 1992 10 95 Yes 95 Yes 85 yes 80 5 80Brunei DarussaLamFiji 1983 32 17 0 0 0 0 0 0 0 0French Polynesia 1992 10 80 5 80 0 0 0 0 0 0 0 0Indonesia 1975 0 0 0 0 0 0 0 0 0 0
Malaysia 1988 o Yes o Yes 0 0 o Yes o YesNew Caledonia 1988 0 75 0 60 0 0 0 0 o 100 0 0New Zealand 1981 70 95 60 70 50 80 60 80Papua New GuineaPhi l ippines 1992 0 y 0 y 0 y 0 y 0 y 0 y
Singapore 1991 90 90 0 0 0 0 o 100 0 0 0 0SoLomon Islands 1989 o 100 o 100 100 0 0 0 0 0 0USA South West Pacific 1983 80 90 80 90 10 20 100 100 0 80Vanuatu 1990 50 100 o 100 yes Yes 0 0 o Yes 0 0
INFOHYDRO 07Jan94
Key to column labels: a - % field data in digital form,b - % data processed by computer.
Note: Blank entries indicate data not supplied.
Page 1
Precipi ,;, Evapo~
tation rationa b a b
(9) (10)
Yes 90 Yes 90
70 20 80 030 80 0 0
0 0 0 0
o Yes o Yes0 60 0 505 5
0 y 0 y
90 90 30 3050 50 50 5010 90 0 8050 100 0 0
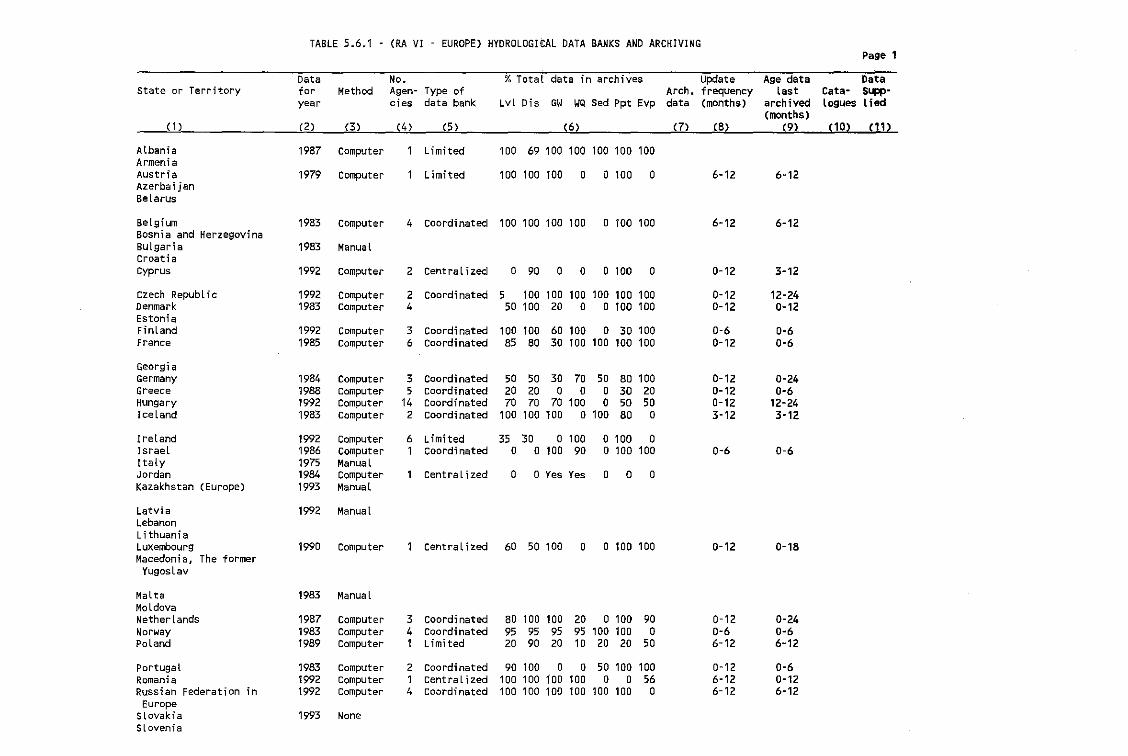
TABLE 5.6.1 - (RA VI - EUROPE) HYOROLOGI¢AL DATA BANKS AND ARCHIVINGPage 1
Data No. % Total data in archives Update Age data DataState or Territory for Method Agen- Type of Arch. frequency last Cata- S"",,-
year eies data bank Lvl Dis GW WQ Sed Ppt Evp data (months) archived logues lied(months)
(1 ) (2) (3 ) (4) (5 ) (6) (7) (8) (9) (10) OJ)
Albania 1987 Computer 1 Limited 100 69 100 100 100 100 100ArmeniaAustri a 1979 Computer 1 Limited 100 100 100 0 o 100 0 6-12 6-12AzerbaijanBelarus
Belgium 1983 computer 4 Coordinated 100 100 100 100 o 100 100 6-12 6-12Bosnia and HerzegovinaBulgaria 1983 ManualCroat; aCyprus 1992 computer 2 Central izecll 0 90 0 0 o 100 0 0-12 3-12
Czech Republ ; c 1992 Computer 2 Coord; nated 5 100 100 100 100 100 100 0-12 12-24Denmark 1983 computer 4 50 100 20 0 o 100 100 0-12 0-12EstoniaFinLand 1992 computer 3 Coord; nated 100 100 60 100 0 30 100 0-6 0-6France 1985 computer 6 Coordinated 85 80 30 100 100 100 100 0-12 0-6
Georgi aGermany 1984 Computer 3 Coordinated 50 50 30 70 50 80 100 0-12 0-24Greece 1988 computer 5 coordi nated 20 20 0 0 0 30 20 0-12 0-6Hungary 1992 Computer 14 Coordinated 70 70 70 100 0 50 50 0-12 12-24Iceland 1983 computer 2 coordinated 100 100 100 o 100 80 0 3-12 3-12
Ireland 1992 computer 6 Limited 35 3D o 100 o 100 0Israel 1986 computer 1 coord; nated 0 o 100 90 o 100 100 0-6 0-6Italy 1975 ManualJordan 1984 Computer 1 Centralized 0 o yes Yes 0 0 0Kazakhstan (Europe) 1993 Manual
latvia 1992 ManualLebanonLithuaniaLuxembourg 1990 Computer 1 centralized 60 50 100 0 o 100 100 0-12 0-18Macedonia. The former
Yugoslav
Malta 1983 ManualMoldovaNetherlands 1987 Computer 3 coordi nated 80 100 100 20 o 100 90 0-12 0-24Norway 1983 Computer 4 Coordinated 95 95 95 95 100 100 0 0-6 0-6Poland 1989 computer 1 Limi ted 20 90 20 10 20 20 50 6-12 6-12
Portugal 1983 Computer 2 Coordinated 90 100 0 0 50 100 100 0-12 0-6Romani a 1992 computer 1 Centralized 100 100 100 100 0 0 56 6-12 0-12Russian Federation in 1992 Computer 4 coordinated 100 100 100 100 100 100 0 6-12 6-12
EuropeSlovakia 1993 NoneSlovenia
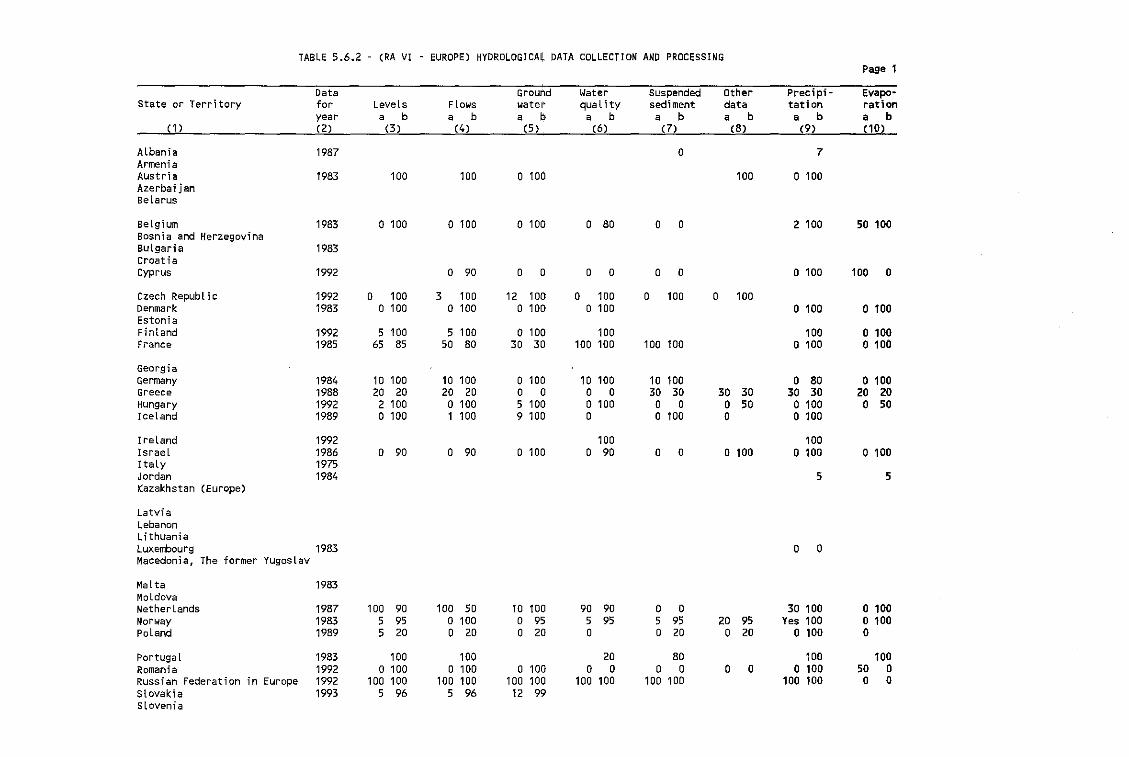
TABLE 5.6.2 - (RA VI - EUROPE) HYDROLOGICAl DATA COLLECTION AND PRDCESSINGPage 1
Data Ground Water Suspended Other Precipi- Evapo~
State or Territory for LeveLs Flows water quality sediment data tation rationyear a b a b a b a b a b a b a b a b
(1) (2) (3) (4 ) (5 ) (6) (7) (8) (9) (10)
ALbania 1987 a 7ArmeniaAustria 1983 100 100 o 100 100 o 100AzerbaijanBelarus
Belgium 1983 o 100 a 100 o 100 0 80 a 0 2 100 50 100Bosnia and HerzegovinaBulgaria 1983croatiaCyprus 1992 D 90 0 0 0 a a a a 100 100 a
Czech Republ ic 1992 0 100 3 100 12 lDO 0 100 0 100 0 100Denmark 1983 a 100 a laD o 100 o 100 a 100 a 100EstoniaFinland 1992 5 100 5 100 a 100 100 100 a 100France 1985 65 85 50 80 30 30 100 100 100 100 a 100 a 100
GeorgiaGermany 1984 10 100 10 100 o 100 10 100 10 100 a 80 a 100Greece 1988 20 20 20 20 a a a a 30 30 30 30 30 30 20 20Hungary 1992 2 100 a 100 5 100 o 100 a 0 0 50 a 100 a 50Iceland 1989 a 100 1 100 9 100 0 a 100 a a 100
Ireland 1992 100 100Israel 1986 0 90 0 90 o 100 0 90 a a o 100 a 100 a 100Italy 1975Jordan 1984 5 5Kazakhstan (Europe)
LatviaLebanonLithuaniaLuxembourg 1983 a 0Macedonia, The former Yugoslav
Malta 1983MoldovaNetherLands 1987 100 90 100 50 10 100 90 9D a a 30 100 a 100Norway 1983 5 95 o 100 0 95 5 95 5 95 20 95 Yes 100 a 100PoLand 1989 5 20 0 20 0 20 0 0 20 0 20 a 100 a
Portugal 1983 100 100 20 80 100 100Romania 1992 o 100 o 100 o 100 0 0 0 0 0 a a 100 50 aRussian Federation in Europe 1992 100 100 100 100 100 100 100 100 100 100 100 100 a aSlovakia 1993 5 96 5 96 12 99Slovenia
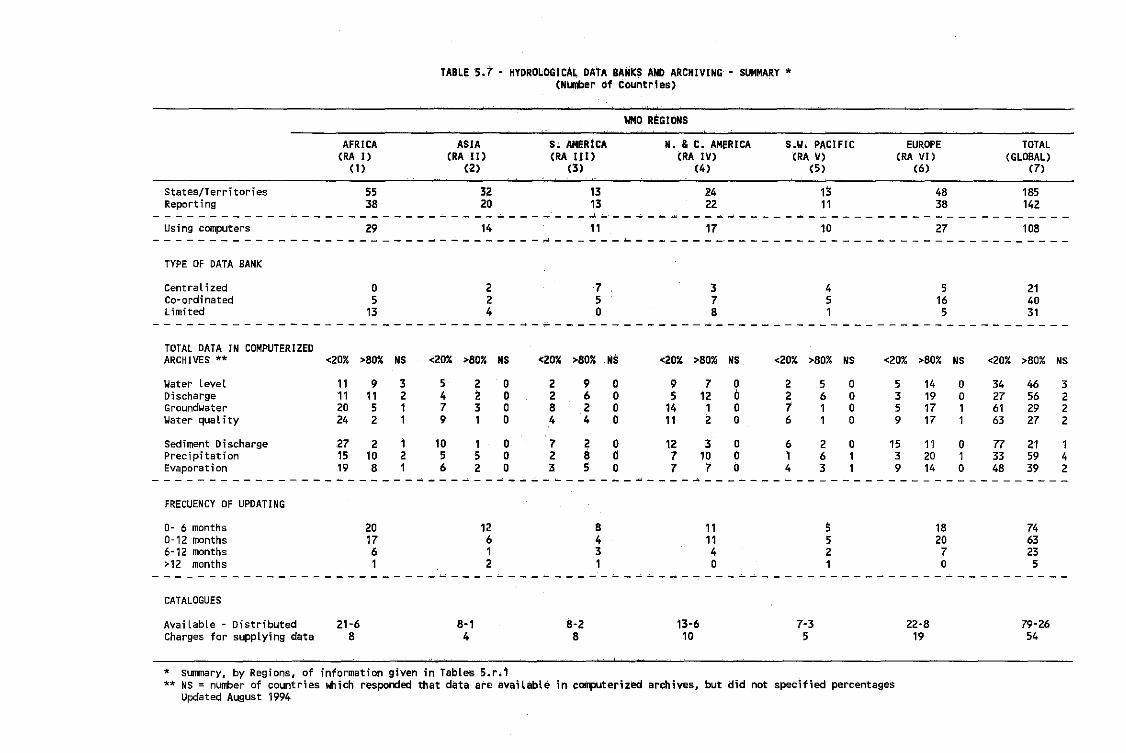
TABLE 5.7 - HYDROLOGiCAL DATA BAIIKS AND ARCHIVING - SUMMARY·(Number of Countries)
lIMO REGIONS
AFRICA ASIA S; AMERICA N. &C. AMERICA s.w. PACIFIC EUROPE TOTAL(RA I) (RA II) (RA II I) (RA IV) (RA V) (RA VI) (GLOBAL)
(1 ) (2) (3) (4) (5) (6) (7)
States/Territories 55 32 13 24 13 48 185Reporting 38 20 13 22 11 38 142
------------~-~----------~----~-------~~-_._~~~--~~--- --------------------------
Using computers 29 14 11 17 10 27 108----------------------------------*----------------------------------------------
TYPE OF DATA 8ANK
Central ;zedCo-ordinatedL;mited
o5
13
224
75o
378
451
5165
214031
--------------------------------------------------------------------------------
TOTAL DATA IN COMPUTERIZEDARCHIVES ** <20% >80% NS <20% >80% NS <20% >80% Ils <20% >8011 NS <20% >80% NS <20% >80% NS <ZO% >80% NS
Water level 11 9 3 5 2 0 2 9 0 9 7 0 2 5 0 5 14 0 34 46 3Discharge 11 11 2 4 2 0 2 6 0 5 12 0 2 6 0 3 19 0 27 56 2Groundwater 20 5 1 7 3 0 8 2 0 14 1 0 7 1 0 5 17 1 61 29 2Water qua l ; ty 24 2 1 9 1 0 4 4 0 11 2 0 6 1 0 9 17 1 63 27 2
Sediment Discharge 27 2 1 10 1 0 7 2 0 12 3 0 6 2 0 15 11 0 77 21 1Precipitat; on 15 10 2 5 5 0 2 8 0 7 10 0 , 6 1 3 20 1 33 59 4Evaporation 19 8 1 6 2 0 3 5 0 7 7 0 4 3 1 9 14 0 48 39 2
---------------------------------~--------~----~------ --------------------------
FRECUENCY OF UPDATING
0- 6 months 20 12 8 11 S 18 740-12 months 17 6 4 11 5 20 636-12 months 6 'j 3 4 2 7 23>12 months 1 2 1 0 1 0 5
----------------~-----~~-~--~-~-~-~---~-~-~~~~-~--~~~----------------~----------
CATALOGUES
Available - DistributedCharges for suppLying data
21-68
8-14
8-28
13-610
7-35
22-819
79-2654
* sunmary, by Regions, of information given in TabLes 5.-r.1** NS = number of countries which responded that data are available in computerized archives, but did not specified percentages
Updated August 1994
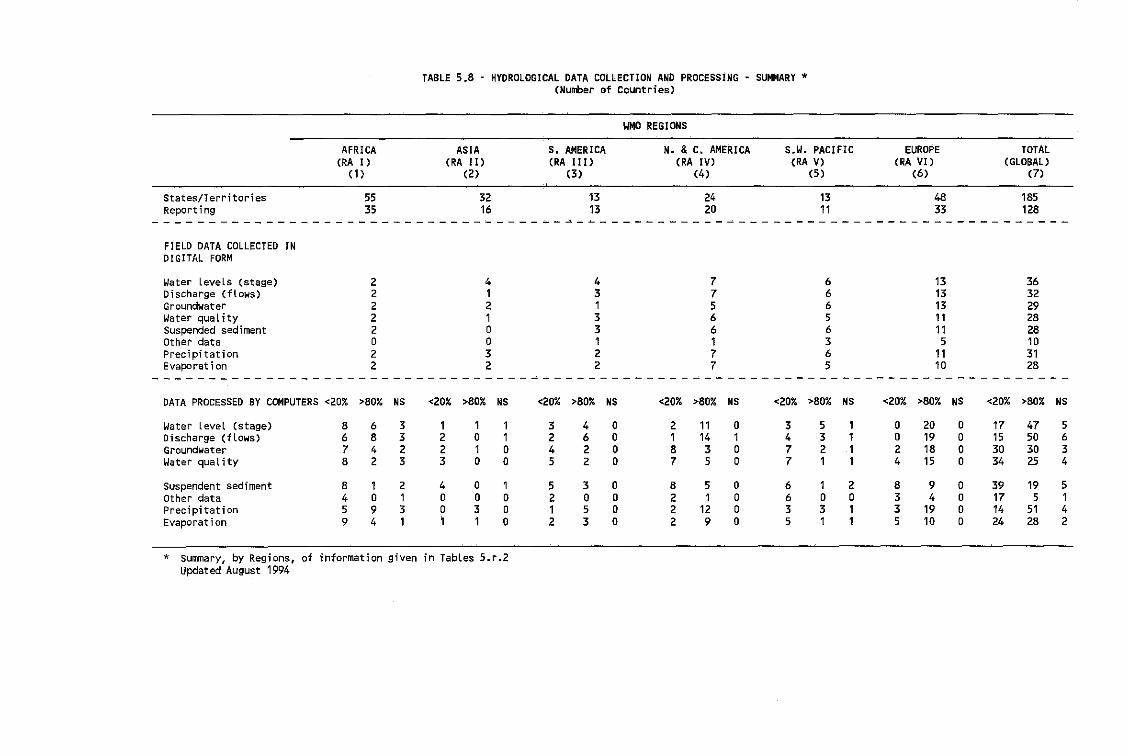
States/TerritoriesReporting
AFRICA(RA I)
(1 )
5535
TABLE 5.B - HYDROLOGltAL DATA COLLECTION AND PROCESSiNG - SUMMARY *(Number of countries)
lIMO REGIONS
ASiA S. AMERICA N. &C. AMERICA S.W. PACIFIC EUROPE(RA I I) (IlA III) (RA IV) (RA V) (RA VI)
(2) (3) (4) (5 ) (6)
32 13 24 13 4816 13 20 11 33
TOTAL(GLOBAL)
(7)
185128
-----------------------------~------~-~--------------- --------------------------
FIELD DATA COLLECTED INDIGITAL FORM
~ater levels (stage) 2 4 4 7 6 13 36Discharge (flows) 2 1 3 7 6 13 32Groundwater 2 2 1 5 6 13 29Water quaLity 2 1 3 6 5 11 2BSuspended sediment 2 0 3 6 6 11 28Other data 0 0 1 1 3 5 10Precipitation 2 3 2 7 6 11 31Evaporat ;on 2 2 2 7 5 10 28
DATA PROCESSED BY COMPUTERS <20% >80% NS <20% >80% NS <20% >80% NS <20% >80% NS <20% >80% NS <20% >80% NS <20% >80% NS
Water level (stage) 8 6 3 1 1 1 3 4 0 2 11 0 3 5 1 0 20 0 17 47 5Discharge (fLows) 6 8 3 2 0 1 2 6 0 1 14 1 4 3 1 0 19 0 15 50 6Groundwater 7 4 2 2 1 0 4 2 0 8 3 0 7 2 1 2 18 0 30 30 3Water qua l i ty 8 2 3 3 0 0 5 2 0 7 5 0 7 1 1 4 15 0 34 25 4
Suspendent sediment 8 1 2 4 0 1 5 3 0 8 5 0 6 1 2 8 9 0 39 19 5Other data 4 0 1 0 0 0 2 0 0 2 1 0 6 0 0 3 4 0 17 5 1Precipitation 5 9 3 0 3 0 1 5 0 2 12 0 3 3 1 3 19 0 14 51 4Evaporat ;on 9 4 1 1 1 0 2 3 0 2 9 0 5 1 1 5 10 0 24 28 2
* summary, by Regions, of information given in Tables 5.r.2Updated August 1994
VI - INTERNATIONAL DATA BANKS RELATED WITH HYDROLOGY ANDWATER RESOURCES
Explanatory Notes
The purpose and scope of Section VI of the Manual is to provide infonnation oninternational data banks. which can be useful for hydrology and water resources related activities.by means of a brief presentation of each of them.
For each of the international data banks included in this section infonnation is given on:
the type of data stored (actual data, metadata),
the status of collection (dates. record lengths),
how the data are stored, handled and updated.
how to request data.
Generally. extracts from data bank outputs are shown as examples.
Additional selected international data banks in the field of hydrology and water resourcesare listed in Table VI.1
VI- BANQUE DE DONNEES INTERNATIONALES CONCERNANTL'HYDROLOGIE ET LES RESSOURCES EN EAU
(Notes explicatives)
La Section VI du Manuel a pour objectif de fournir des renseignements sur les banques dedonnees internationales, qui peuvent etre utiles aux activites se rapportant it I'hydrologie et auxressources en eau, chacune de ces banques de donnees faisant I'objet d'une breve presentation.
Pour chaque banque de donnees internationale comprise dans cette Section, desrenseignements seront fournis sur:
Ie type de donnees enregistrees (donnees reelles, donnees globales),
la collecte des donnees (dates, longueur des releves),
la fac;on dont les donnees sont enregistrees, genleS et mises it jour,
la fac;on de proceder pour demander des donnees.
En general des extraits de documents elabores it partir de ces banques de donnees sontfournis it titre d'exemple.
Une selection d'autres banques de donnees internationales dans Ie domaine deI'hydrologie at des ressourceseneaufigure au Tableau V1.1.
VI . MEXllYHAPOllllhiE I>AIIKII llAllllhlX, OTIIOCHIIJ,IIXCH K rlIllPOJIOrlI1I II BOllHhlMPECYPCAM
nOHCHHTeJlLHye 38nHCKH
UeJlL H C4jlepa npHMeHeHHH, onHcaHHble B paJi\eJJe VI HaCTaBJleHHH, COCTOHT B ooecneqeHHH
HH4!lopMal\Heii no Me)((ilYHapoi\HblM oaHKaM i\aHHblX, KOTopble MoryT OblTh HCDOJlhJOBaHbl B i\eHTeJlhHOCTH,
CBH38HHOii c rHi\poJJorHeii H IIOi\HblMH pecypcaMH, nocpeilCTIIOM KpaTKoro onHcanHH K~Oro HJ HHX.
no K~OMY HJ Me)(()\yHapoi\Hblx oaHKoB ilaHHblX, BKJlIOqeHHblX B aTOT paJileJl, npHBOilHTCH CJleilYIOmaJI
HII4jloPMal\HH:
THn XpaHJImHXCH i\aHHblX (TeKymHe i\aHHble, MeTa.i\aHHble):
cocroHHHe c50pa )laHHblX WtTbl, .l\flHlla JaIlHceii):
cnocol'i xpaHeHHH, oOpaOoTKH H oOHOBJleHHH:
cnocol'i Jallpoca ilaHHblX.
KaK npaBHJIO, B KaqecTll6 npHMepoB npHBOillITCH oOpaJl\hI BblXOilHblX )laHHblX.
I-bopaHHble Me)(()\yllapoi{lIble oaHKH ilaHHblX B oOJlacTH rHi\poJlOrHH H BO}\HblX pecypcoB cocraBJleHbl B
rnOJlHl\e VI. 1.
VI - Bancos de datos internacionales relacionados con lahidrologia y los recursos hidricos
Notas explicativas
La finalidad y el alcance de la Secci6n VI del Manual es proporcionar informaci6n sobrebancos de datos internacionales, que pueden ser utiles para las actividades relacionadas con lahidrologia y los recursos hidricos, mediante una breve presentaci6n de cada uno de ellos.
Con respecto a cada uno de los bancos de datos internacionales incluidos en esta secci6nse facilita informaci6n sobre:
el tipo de datos almacenados (datos reales, metadatos);
el estado de recopilaci6n (fechas, duraciones de los registros);
manera de almacenar, tratar y aetualizar los datos;
manera de solicitar datos.
En general,se muestran extraetos de salidas de bancos de datos, a titulo de ejemplo.
Una selecci6n de otros bancos de datos internacionales en el campo de la hidrologia yrecursos hidricos figura en la Tabla V1.1.
INTERNATIONAL DATA BANKS
VIol GLOBAL RUNOFF DATA CENTRE
V1.1.1 Introduction
On 1 May 1987, a pennanent Global Runoff Data Centre (GRDC) was established at theFederal Institute of Hydrology in Koblenz, Federal RepUblic of Gennany, under the auspices ofthe World Meteorological Organization (WMO).
The GRDC operates for the benefit of WMO Members and the international scientificcommunity. It provides a mechanism for the international exchange of data pertaining to riverflows and surface water runoff on a continuous long-tenn basis. The GRDC receives data frommany sources, principally through WMo. While every attempt is made to assure reasonablestandards for data quality and related documentation, the ultimate responsibility for data lies withthe data contributors and not with the GRDC.
All data archived at the GRDC are available to users upon written request or personalvisit.
VI. 1.2 Data bank
The GRDC data bank, in March 1993, consisted of flows for 3070 stations from 140countries. Complete daily flows are available for 1834 stations and monthly flows are availablefor 1509 stations.
The core of the data bank is the daily flows for 1,327 stations from 75 countries whichwere collected initially by the WMO Hydrology and Water Resources Department under theWMO/ICSU Global Atmosphere Research Programme (GARP), for use in validation ofatmospheric general circulation models (GCMs), and later within the World Climate Programme(WCP).
The first available year for this set of data is 1978 and nearly all stations are complete upto 1980. Data from 40 countries are also available up to 1982-83 and from Australia up to 198485. The data base is being updated from time to time.
The stations have been selected according to the following criteria:
Unifonn national distribution (consistent with network conditions), with higher densitiesin areas of rapid variation of flow.
Coverage, to the greatest extent possible, of each type of hydrological homogeneousregion of each country.
Relatively small river basins (up to about 5,000 km2, and in exceptional cases, up to10,000 km2).
Flow data representing natural river flow, i. e. they should be corrected for diversions,abstractions and redistributions by storage.
Good quality of records.
VI.1
VI.1.1
BANQUE DE DONNEES INTERNATIONALES
CENTRE MONDIAL DE DONNEES SUR L'ECOULEMENT
Introduction
Le 1er mai 1987, un Centre mondial de donnees sur I'ecoulement (GRDC) permanent a etecree a I'lnstitut federal d'hydrologie de Coblence (Allemagne) sous les auspices de l'Organisationmeteorologique mondiale (OMM).
Le GRDC, qui fonctionne au profit des Membres de I'OMM et de la communautescientifique internationale assure un mecanisme d'echange international, permanent et de longueduree, de donnees sur Ie debit des fleuves et I'ecoulement de surface. II re~oit, principalement parI'intermediaire de I'OMM, des donnees provenant de nombreuses sources. Meme si Ie centre faittout son possible pour garantir des normes de qualite correctes, en particulier dans les documentsqu'iI produit, iI n'en reste pas moins que ce sont ceux qui fournissent les donnees et non Ie centre quisont en fin de compte responsables de ces donnees.
Toutes les donnees archivees au GRDC sont disponibles et les usagers peuvent se lesprocurer sur demande ecrite ou en se rendant personnellement au centre.
VI.1.2 Banque de donnees
En mars 1993, la banque de donnees du GRDC portait sur I'ecoulement mesure dans3070 stations situees dans 140 pays differents. A cette date, etaient disponibles des seriescompletes de donnees journalieres pour 1834 stations et de donnees mensuelles pour 1509 stations.
La base autour de laquelle s' articule la banque de donnees est constituee par les donnees. journalieres surl'ecoulementfournles par 1327 stations situees dans 75 pays. Ces donnees, qui ont
ete rassemblees a I'origine par Ie Departement d'hydrologie et de mise en valeur des ressources eneau de I'OMM, au titre du Programme de recherche sur I'atmosphere globale (GARP) OMM/CIUS,devaient tout d'abord servir a valider les modeles de la circulation generale (MCG) de I'atmosphere,avant d'etre utilisees dans Ie cadre du Programme c1imatologique mondial (PCM).
La premiere annee pour laquelle cet ensemble de donnees est disponible est 1978 et lesdonnees concernant presque toutes les stations sont completes jusqu'en 1980. De plus, les donneesprovenant de 40 pays differents sont disponibles jusqu'en 1982-1983 et celles fournies par l'Australiesont completes jusqu'en 1984-1985. La base de donnees est mise a jour periodiquement.
La selection des stations s'est effectuee selon les criteres suivants :
repartition nationale uniforme des stations (conforme aux caracteristiques du reseau), lesdensites etant superieures dans les zones au Ie debit varie rapidement;
a I'interieur de chaque pays, representation, dans toute la mesure du possible, de chaquetype de region hydrologique homogene;
bassins fluviaux relativement petits Gusqu'a environ 5000 kmz et, dans certains casexceptionne/s, jusqu'a 10000 km2);
BANQUE DE DONNEES INTERNATIONALES
Les demandes d'information doivent etre adressees 11 :
Olobal Runoff Data Centre (GRDC)Bundesanstalt fur GewasserkundeKaiserin-Augusta-Anlagen 15-17W - 5400 KoblenzAllemagne
Telephone: National:International :
Telex;Telecopie:
0261 1306-0+49261 1306-008-62499+49261 1306302
ME)[(j{YHAPO.llHblE 6AHKH .l\AHHblX
VI. I rJIOI>AJILIILlR UEIITP ./lAIIIILlX no CTOKY
VI. I . 1 BUeAeHHe
IIocrOJlHHJ.lH rnOOanLHJ.lH ueHTp ,llaHHJ.lX no crOl(y (r/.UC) oJ.ln OCHOHaH 1 Mall 1987 r. H
CDe,llepaJILHOM HHcrHTYTe rH,llpOnOrnH B Ko6neHue, Q)e,llepaTHBHaJI PecnyonHKa repMaHHJI. no,ll JrH,llOH BeeMHpHOH
Mereoponorn'lOCKoH OprauHJallHH (BMO).
r/.Uc 06ecneqHBlIeT npo,llyKUHeH crpaHJ.I-qneHJ.I BMO H MelK.llYHapo.llHoe HayqHOe Coo6lIlecrBO. OH
npe,llCTaBnJleT ao6oH MexaHH3M ,llnJl MelK.llYuapo.llHorO 06MeHa ,llaHHJ.lMH, KacalOlIlHMHCJI peqHOro croKa H croKa
nooopxHOCfHJ.lX BO,ll ua nOCTOJlHHOH ,llOnrocpoqUOH OCHOOO. r/.Uc nony~ ,llaHHJ.le H3 pa3nHqHJ.lX HCTOqHHKOB, B
OCHOBHOM qepe3 BMO. XOTJI npunaralOTCJl Bee yCHnHJI )JJUI 06ecneqeHHJI npHeMneMJ.lX craH.llaPTOB KaqecrBll .llaHHJ.IX
H CBJl3aHHOH C HHMH ,llOKyMeHTaUHH, OCHOBHalI OToeTCfOOHHOCTL Ja .llaHHJ.le neXHT He ua r/.Uc, a ua Tex, KTO HX
npe,llOCTllBJllleT.
Bee ,llaHHJ.le, XPaHJlIIlHeCJI B rl..JJ\c. npe,llOCTaonJiIOTCJI nonLWBlIrenJiM no nHCLMeHHOH 3aJIBKe HnH B XO,lle
nepooHaJlLHoro nocelIleHHJI.
VI.l.2 l>auK AauHY"
B MapTe 1993 r. B oaHKe ,llaHHJ.lX r/.Uc CO,llep:ll(aJlHCL ,llaHHJ.le 0 CTOKax, nocrynHBluHe OT 3070craHl\HH H3 140 crpaH. .llaHHJ.le 0 nonHoM CYTOqHOM CTOKe OJ.lnH npe,llcraoneHJ.I 1834, craHuHHMH, a .llBHHJ.le 0
MeCJlquOM croKe - 1509 CTaHUHJlMH.
OcHOBOH oaHKa .llaHHJ.lX HonHIOTCJI ,llaHHJ.le 0 .llHeHHOM CTOKe, npe,llcraoneHHJ.le 1327 CTaHl\HHMH H3 75~ crpaH, KOTOpJ.le OJ.lnH COOpaHJ.I nepBOHaqanLHO .llenapTaMeHTOM rn,llponornH H BO.llHJ.lX pecypcOB BMO H paMKax
IIporpaMMJ.I Ha:ne,llOHaHHH rnOOanLHJ.lX aTMoc4>epHblx npoueCCOB (IIHrAll) no,ll arH,llOH BMO/MCHC ,llnH HX
HCHonLJOBlIHHJI B oueHKe aTMOC4>epHblx MO,lleJIeH 06lIleH l\HpKynHUHH (MOUl, a H .llaJILHeHlIJeM B paMKax BeeMHpHOH
KnHMaTHqecKOil IlporpaMMbI (BKII).
3TOT Haoop ,llaHHJ.lX BnepBble obln nO,llrOTOBneH H 1978 r., H noqTH BCe CTaHUHH OJ.lnH
YKOMnneKTOBaHJ.I ,ll0 1980 r. KpoMe TOro, OblnH nO,llrOTOoneHbI .llaHHble H3 40 crpaH ,ll0 1982-1983 rr. H .llBHHble
H3 ABcrpaJlHH ,llO 1984,1985 rr. 6aJa .llaHHJ.lX 06HORIl1leTCJI HpeMH OT HpeMeHH.
CTaHl\HH OJ.IHH HJ.lOpaHJ.I C yqeroM cne.llYlOIIlHX KpHTepHeB:
paBHOMepHoe pacnpe,lleJIeHHe Ha HaUHOHaJlLHOM ypoBHe (c yqeTOM cocrOHHHH CeTH) npH 06ecneqeHHH
60nee BJ.lOOKOH nnOTHOCTH B paiiOHax C OJ.lCTpJ.lM H3MeHeHHeM CTOKa.
KaK MO:lKHO 60nee IUHpoKHH OxHaT pa3nHqHJ.lX BH,llOB rn,llponOrnqecKHx O.llH0PO,llHJ.lX pernOHOB Ka:ll<:,llOH
crpaHJ.I.
OTHOCHTeJlLHO HeOOnLlIJHe peqHJ.le oacceHHJ.I (npHonH3HTeHLHO ,ll0 5 000 KM2, H, B HCKnlOqHTeJILHJ.lX
cnyqallX, ,ll0 10 000 KM2).
,llaHHJ.le no crOKy, npe,llcraBJIHIOIIlHe ecrecrBeHHJ.lH peqHOH crOK, TO ecTL OHH ,llOnXHJ.I OJ.lTL
CKOppeKTHpoBaHJ.I C yqeroM OTBO,lla, aa60pa H nepepaCllpe,lleJIeHHJI Janaca BO.llJ.I.
xopollJee KaqeCfBO JanHceH.
VI.1
VI.1.1
CENTRO MUNDIAL DE DATOS DE ESCORRENTIA
Introducci6n
EI 1 de mayo de 1987 se estableci6 en el Instituto Federal de Hidrologia de Coblenza(Republica Federal de Alemania), el Centro Mundial de Datos de Escorrentia (GRDC), bajo losauspicios de la Organizaci6n Meteorol6gica Mundial (OMM).
EI GRDC funciona para los Miembros de la OMM y la comunidad cientifica internacional.Constituye un mecanismo para el intercambio internacional de datos correspondientes a corrientesfluviales y escorrentia de agua de superficie de forma continua y a largo plazo. EI GRDC recibe datosde numerosas fuentes, sobre todo a traves de la OMM. SI bien se hace todo 10 posible para lograrnormas razonables de calidad de los datos y documentaci6n conexa, la responsabilidad de los datoscorresponde en ultima instancia a quienes las proporcionan y no al GRDC.
Los usuarios pueden disponer de todos los datos archivados en el GRDC mediantesolicitud escrita 0 visita personal.
VI.1.2 Banco de datos
EI banco de datos del GRDC constaba, en marzo de 1993, de escurrimientos para 3070estaciones de 140 paises. Se dispone de caudales diarios completos para 1834 estaciones y deescurrimientos mensuales para 1509 estaciones.
La parte esencial del banco de datos la constituyen los escurrimientos diarios para 1327estaciones de 75 paises, que se recopilaron inicialmente por el Departamento de Hidrologia yRecursos Hidricos de la OMM, en el marco del Programa de Investigaci6n de la Atm6sfera Global(PIAG) OMM/CIUC, para utilizarlos en la validaci6n de modelos de circulaci6n general (MCG) de laatm6sfera, y posteriormente del Programa Mundial sobre el Clima (PMC).
EI primer ano en que se dispuso de esta serie de datos fue en 1978, y casi todas lasestaciones estan completas hasta 1980. Tambien se dispone de datos de 40 paises hasta 1982-1983y de Australia hasta 1984-1985. La base de datos se actualiza de vez en cuando.
Las estaciones se han elegido con arreglo a 105 siguientes criterios:
distribuci6n nacional uniforme (compatible con las condiciones de la red), con densidadesmas altas en zonas de rapida variaci6n de caudal;
cobertura, en la mayor medida posible, de cada tipo de regi6n homogenea hidrol6gica decada pais;
cuencas hidrogrMicas relativamente pequenas (hasta unos 5.000 km2 y, en casosexcepcionales hasta 10.000 km2);
datos que representan el escurrimiento natural de un rio, es decir, que deben corregirsepara derivaciones, abstracciones y redistribuciones por almacenamiento;
registros de buena calidad.
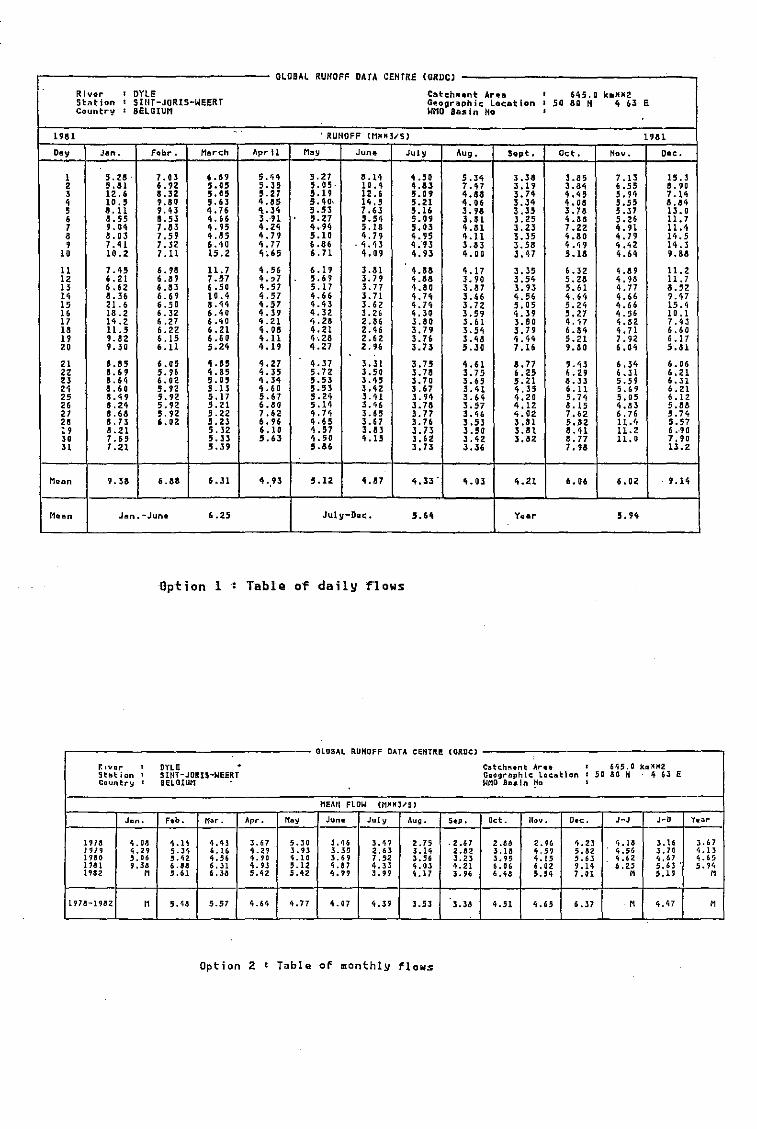
I GLOBAL RUnOFF DATA CENTRE (ORDe)
Rly~,. , OYlE Catc:hlunt Arlfe , 645. a kliH/II2.Station , SIllr-JoRlS-WEERT G@ographic Location • 50 .0 • 4 &3 •Country , 8ELGIUM WMQ 8u in No ,
1981 'RUHOFF eM""],S) 1\141
D,y Jan. FlJbr. March "prll M,y June July Aug. Sopt. Oct. Hov. Oae.
I 5.25 . 7.03 6.59 5.44 !1. 27 8.l'i 4.50 S .34 3.38 3.85 7.13 IS • .32 5.31 i.n S.05 5.H ,. OS . 10.1 4 ••53 7.41 3,17 J.a~ 6.55 8.903 12.6 ILl2 '.05 '.27 5.19 12.6 5.09 4.83 3.74 4.H 5.'" 7.144 10.' 9.80 S.6] 4.85 5.40, 14.5 5.21 4.06 3.034 1f.08 5.55 6.34, 8.11 '].4] 4.76 \.34 5.5] 1.63 S.U 3.93 3.35 l.a 5.37 1.3.0• 3.55 II. 53 'L6& ].,91 '.27 5.51 S.ot 3.51 3.25 4.H 5.26 11.77 , .114 7.8] 4.9S 4.24 4.94 S.18 S.03 i.ln 3.23 7.22 4.91 11.4• 8.0J 7.59 4.85 4.79 5.10 4.79 4.'95 4.11 3.35 4.80 4.79 14.59 1.<i1 7.]2 6.40 4.77 6.86 . "t. '13 ";']] 3.83 ].58 4./i'J 4.42 14.3
10 10.2- 7.11 15.2 'L65 6.71 4.09 4.93 4.00 3.47 5.1& 4.64 7.83
11 1.45 6.715 11.7 4.5~ 6.19 3.31 4.33 1t.17 3.35 6.32 4.3' 11. 212 6.21 6.059 7.57 4.=:17 5.69 3.79 4.33 3.'10 3.54 5.215 4. '3 11.713 6 .62 6.33 6 .50 4.57 5.17 3.77 4.050 3.37 3.93 5.61 4.77 3.5214 3.36 6.6'1 10.4 4.57 ~.66 3.71 4. ]Ii 3.66 4.56 4.64 4.66 9.47IS 21.6 6.50 8.1f4 4.57 If.43 J. 62 4.71', 3.72 5.05 5.24 4.66 15.4I' 18.2 6.32 6.40 If .39 4.32 3. 26 4.30 3.59 4. J'1 5.27 4.56 10.117 14.2 L27 6.40 'L21 1', .28 2.36 3.80 3.61 3.130 4.H 4.82 7.43I' 11.5 6.22 6.21 If.08 If.21 2.46 3.79 ~L54 3.79 6.34 4.71 6.6019 '.32 6.15 6.60 4.11 4'.28 2.6Z 3.76 3.43 '1.44 5.21 1. 92 6.172' 9.30 6.11 5.2"1 4.1'1 4.27 2.96 3.73 5.30 7.16 '].6lI 6.04 S.H
21 5.85 6.05 /1.35 4.27 4.37 3. 31 3.15 4.61 8.77 ',43 6.34 6.0622 8.6'1 5.96 4.85 4.35 5.72 3.50 3.78 3.75 6.25 Ii. 2., 6.31 6.2123 8.64 6.0Z '.n ., .34 !" 53 3.45 3.7D 3.65 '.21 3.33 5.59 6.3121 8.60 5.92 5.13 4.60 5.53 3.42 3.67 3.41 If.3S 6.11 5.69 6.2125 8. <f9 5.'Z 5.17 5.67 5.24 3.H J.'''' 3.64 Ii.20 5.7"t 5.05 6.1226 8.2'i 5.'12 !" 21 6.050 5 .14 3.0;6 3.18 3.57 4.12 ,5.15 'i.1I3 5."327 8.63 5.'2 5.22 7.62 ".11'1 3.65 3.77 3.46 4.02 7. 62 6.76 5.74
" 8.73 '.oa 5.23 6.96 4.6.5 3.67 3.7& 3.53 3,81 5.32 1l. r, 5.5719 8.21 5.32 6.10 1.51 3.83 3.73 3.50 3.151 8.41 11.2 6.·903D 7.65 s.n 5.63 ',.50 4.1.5 3.62 3.42 .1.az 8.77 11.0 7.9031 1.21 5.39 !LS6 3.73 3.36 1.9a 13.2
.
Ml!llIn 9.33 6.88 6.31 4,,93 5.12 4.37 4.33 . 4.03 4.21 6.06 6.00!: . 9.14
MllIl!ln Jan.-Juno 6.25 Jul !I-Dille. 5.64 Y/illlr 5.94
Opt ion 1 Table of daily flows
OLDSAl RUHOFF DATA CEIITRE (ORDC)
F.,vllr , DnE . elltc.h~,.nt AI""1l , 645.0 kll!lll2Sthtion , SIllT-JORU-WEERT Gtogl"'lIphlc laClltion , sa DO. 4 " •Country , 8ELOIU,,- Wl"lD hsln ~o
,
f1eAIl FlDW (MllM3/S)
Jon. F,b. M~r . Apr. M,y Jun. July Aug. SIP. Oct. lIov. D"c. J-J J-D 'I'lI;)1'"
1713 "i.Q" Ij .11 1."i3 3.61 S.:l1l 3,t16 3.'17 2.75 .2.61 2.lIl) 2.9(, 1.2:1 1',.18 :I. Hi :L 671919 4.29 5.3', (,. U. '1.27 3.93 3.35 2.63 3.14 2.32 3.13 OJ,S7 5.32 'i.56 3.10 4.131930 5. 0& 5.'12 4.56 1.90 4.10 3.67 7.52 3.56 3.23 3.95 4.15 5.63 1.62 'i.67 4.651181 '.33 6.13 (,.31 4.93 '.12 4.81 4.33 4.0J 11.21 6. 06 6.02 9.14 6.25 5. &3 . 5.94UII2 M 5.U 6.303 5.42 5.42 4.n 3.99 4.17 3.U &.'i8 5.54 1. 01 M S.H M
1973-1932 M 5.403 5.51 4.64 4.71 4.01 4.39 3.53 3.34 'i.51 4.65 6.37 M 4.47 M
Option 2 Table of monthly flows
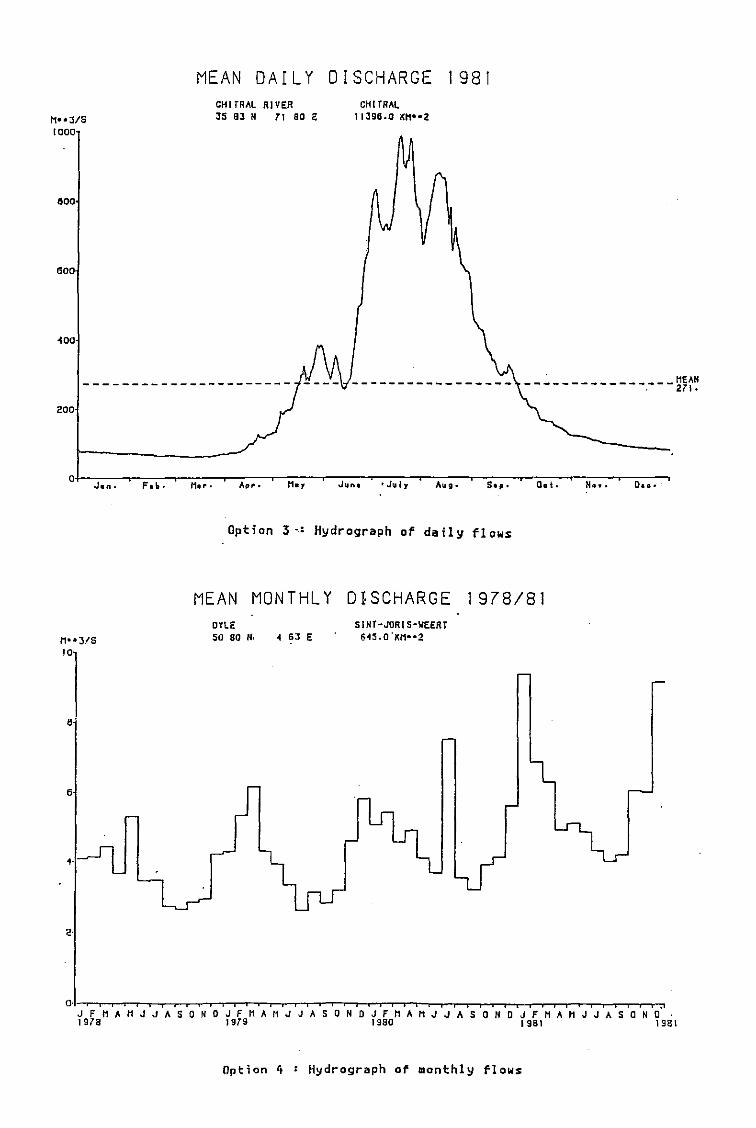
MEAN DAILY DISCHARGE 1981
H--J/S1000
eoo
600
~oo
200
CHITRAL RIVER35 S3 If 7t sa E
CHI TRAL11396.0 Kt1"2
--~------- H2E7U- I.
Opt i on 3 -, Hydrograph of da i ly flows
MEAN MONTHLY DISCHARGE 1978/81
N··JlS
'l0-
6
2-
D'i'LEso 80 N. -4 6J E
SIHT-JORIS-WEERT6.. S.0'XM"'2
o· , Iii •• , , • j , i •• , • , I I • , I • , iii I I , , i , • ii' , •• I • , I , • I ••
J F N A M J j A 5 aND J F NAN ..r J A SON 0 J F M A M J J A SON 0 J FHA H J J A. SON a1978 1979 1980 1981 198\
Option 4 Hydrograph of monthly flows
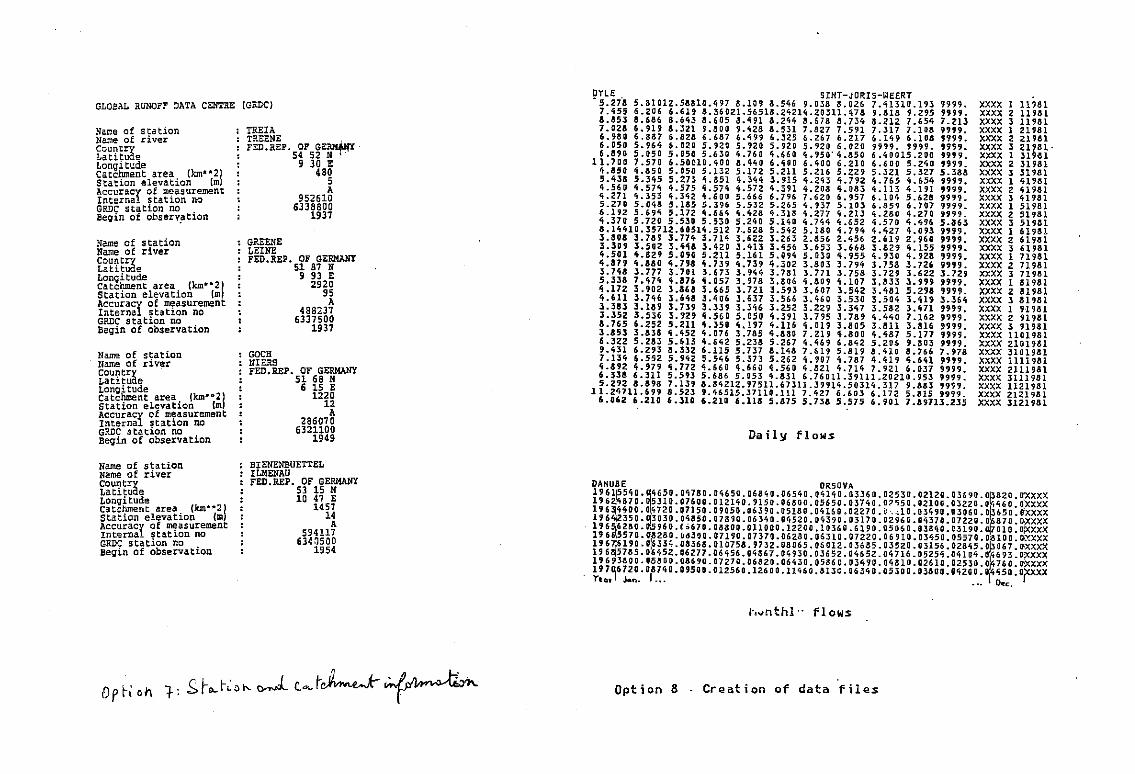
GLOBAL RUNOFF DATA CENTRE (GROC)
Name of stationName of riverCountryLatitudeLongitudeCatchment area (km**2jStation elevation (mAccuracy of measurementInternal station noGRDC station noBegin of observ~tion
Name of stationName of riverCountryLatituaeLongitudeCatchment area (km.*21Station elevation 1mAccuracy of measurementInternal station noGRDC station noBegin ot observation
Nam!! of stationNarne of rivercouJ::ltryLat!.tuaeLongitudeCatchment area Ikm.*21Station elevation {mAccuracy of m~asurementInternal statlon noGRDe station noBegin of observation
TRElATREENEFZD.REP. OF GE'=1M.&NV
S4 52 N"j"':"·9 30 E
4805A
9526106338800
1937
GREENELElNEFED.REP. OF GERMANY
51 87 N9 93 E
292095A
4882376337500
1937
GOCHUIE-IiSFED.REP. OF GERMANY
51 68 N6 15 E
122012
A286070
63211001949
P~~i78 5.81012.58310.497 8.109 4.546 9.D~~N~~~~~I~:~ri~~.1939999.7.455 6.206 6.619 8.36021.56518.24214.20311.478 9.418 9.295 "99.8.553 5.686 8.6438.605 3.491 8.244 8.678 8.734 8.212 7.654 7.2137.0286.9198.321 9.aoo ,.4288.5317.8277.591 7.317 7.)08 '999.6.980 6.887 6.828 6.687 6.499 6.325 6.267 6.217 6.149 6.104 '9'9.6.050 5.964 6.020 5.920 5.920 5.920 5.920 6.020 9999. '999. 9999.6.8905.050 s.Dsa 5.630 4.760 4.660 4.950"4.850 6.4001S.200 9999.
11.700 1.570 6.50010.400 5.440 6.400 6.400 6.210 6.600 5.240 9999.4.850 4.850 5.050 5.132 5.172 5.211 5.216 5.229 5.321 5.327 5.3a45.435 5.345 5.213 4.851 4.344 3.915 4.243 4.792 4.765 ~.654 9'97.4.S60 4.574 4.575 4.574 4.572 4.371 4.208 4.083 4.113 4.191 '7'9.4.271 4.353 4.342 4.600 5.666 6.796 7.620 6.957 6.104 5.628 9999.5.270 5.048 5.135 5.396 5.532 5.265 4.937 5.103 6.859 6.707 9999.6.192 5.694 5.172 4.664 4.428 4.318 4.277 4.213 4.280 4.270 9"9.4.370 5.720 5.530 5.530 5.240 5.140 4.744 4.652 4.570 4.496 5.3638.14410.35712.60514.512 7~628 5.542 5.180 4.794 4.427 4.093 "".3.808 3.789 3.7143.714 3.622 3.263 2.356 2.456 2.617 2.960 9"9.3.309 3.502 3.4~a 3.420 3.413 3.456 3.653 3.668 3.~29 4.155 "'9.4.501 4.829 5.090 5.211 5.161 5.094 5.030 4.955 4.930 4.'28 "'9.4.819 4.880 4.793 4.739 4.739 4.302 3.803 3.794 3.158 3.726 "".3.748 3.777 3~701 3.673 3.944 3.781 3.771 3.758 3.72' 3.622 3.7295.338 7.474 4.876 4.057 3.978 3.806 4.809 4.101 3.833 3.999 9'9'.4.172 3.902 3.868 3.665 3.721 3.593 3.607 3.542 3.481 5.298 "99.4.611 3.746 3.648 3.406 3.637 3.566 3.460 3.530 3.504 3.419 3.3643.383 3.189 3.73' 3.339 3.346 3.252 3.229 3.347 3.532 3.471 9999.3.352 3.S36 3.929 4.560 5.050 4.391 3.795 3.139 4.440 7.1&2 "".B.76S 6.252 5.211 4.350 4.1'7 4.116 4.019 3.805 3.811 3.816 9799.3.8533.5384.4524.076 3.785 4.380 7.219 ~.800 4.487 5.177 '999.6.322 5.283 5.613 4.642 5.238 5.267 4.469 6.842 5.206 9.303 9999.9.431 6.293 8.332 6.115 5.737 3.148 7.619 5.819 8.410 8.7&6 7.9737.134 6.552 5.942 5.546 5.373 5.262 4.907 4.787 4.41' 4.641 "9'.4.892 4.979 4.7724.660 4.660 4.560 4.321 4.714 7.921 6.037 9999.6.338 6.311 5.593 5.666 5.053 4.831 6.76011.39111.20210.953 799'.5.292 8.898 7.1398.84212.97511.67311.39914.50314.317 9.883 9'99.
11.2~711.699 S.523 9.4&515.37110.111 7.427 6.603 6.172 5.81S '999.6.062 6.210 6.310 6.210 6.114 5.575 5.738 5.S7S 6.901 7.89113.235
Daily flows
xxxx 1 11 'HHXXXX 2 11 931XXXX 3 11981XXxX 1 21981XXXX 2 21951XXXX 3 2U81·xXXX 1 Jl9~1XXXX 2 31981XXXX J 31951XXXX 1 419lHXXXX 2 41981XXXX 3 41981XXXX 1 51981XXXX 2 51981XXXX 3 51931XXXX 1 61981XXXX 2 61931XXXX 3 61981XXXX 1 11981XXXX Z 71981XXXX 3 719HXXXX 1 81981XXXX 2 81981XXXX 3 31981XXXX 1 91981XXXX 2 91981XXXX 3 III 981XXXX 1101981XXXX 2101981xxxx 3101981XXXX 1111981XXXX 2111981XXXX 3111981xxxx 1121981xxxx 2121981XXXX 3121981
Name of stationName of riverCountryLatitudeLongitudecatchment area (km**21Station elevation (mAccuracy of ~asurementInternal stat10n noGRDC station noBegin of Observation
BIENENBUETTELILMENAUFED.REP. OF GERMANY
53 15 N10 47 E
145714
A594117
634 Q5001954
DAtiUBE ORSOYA1961~540'OI'4650'0tj780'D4650.0684D'06540.04140'03360.02530.02120.03690.0~82D.a:.XXXX196214870.05310.07600.012140.9150.06800.05650.0]140.0') 0;50.021011.03220. 0~46O. O:XXXX19 63lHOO. 04720 .07150.09050.06390.05180.04160.02270 .l; '.-1,1 0 .03490.1t 3060.0/::,&50. OXXXXl"~2350.03030.D4850.07890.D6340.0452D.04390.03170.02960.04370.07220.0~870.D~XXX196 6280.0~960.~~670.08800.011000.12200.10360.6190.DS060.03840.03190.0VOID.O~XXX196 5570.D~280.~6JOO.07190.07370.06280.06310.D1220.D6910.03450.05570.0al00.D~XXX196?r6190.0~33;.oa363.01D158.9732.08065.06012.03685.03520.03156.028i5.0p'067.0~XXX196~5735.0645Z.06277.064S6.04367.04930.D3652.04&52.04116.D5254.04104.0~693.0XXXX19693300.0~80D.04690.a7270.a6820.a6430.05860.03490.D4810.02610.02530.~4160.0~XXX197~6720.03740.0'SOO.012560.126DD.11460.813C.D6J40.053OO.03800.G4200.0r450.0rXXXl'tQ, J..n. I... ". DlI:c.
hvnthl" flows
DPt-l 0/\ 1-: S; t"..J~ 0 t-.~ c.~ rJ.-e-.k~ Option 8 . Croat ion of data filos
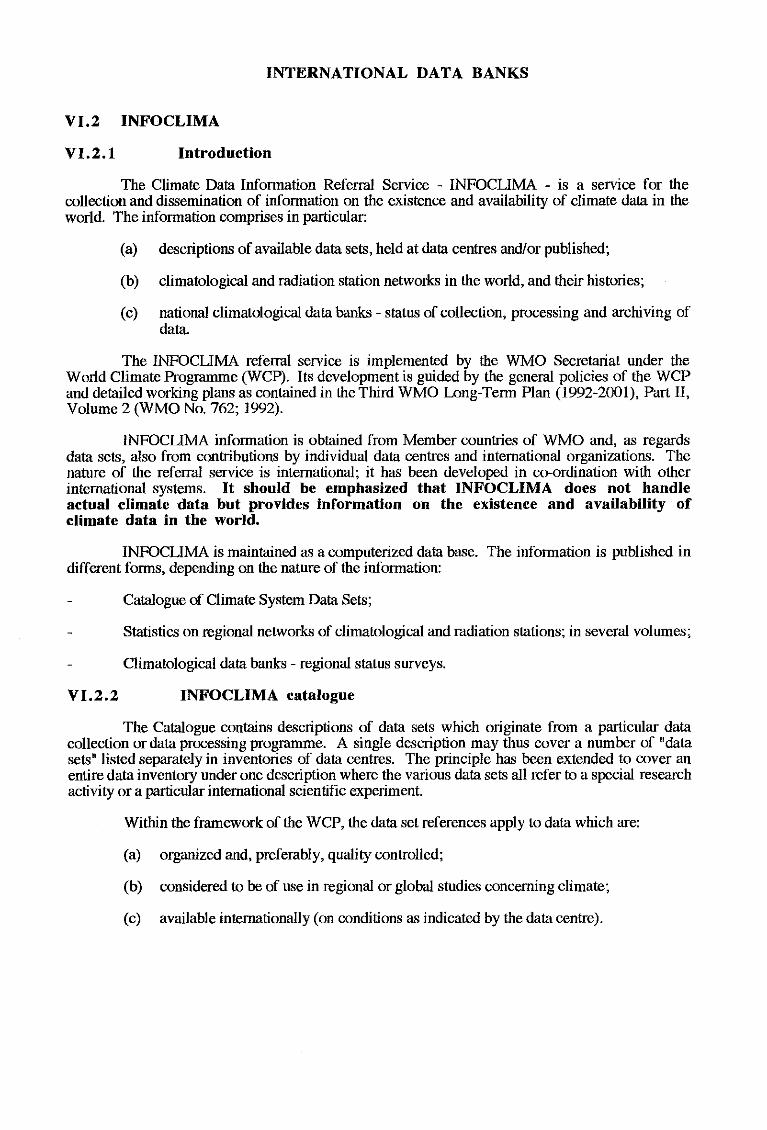
INTERNATIONAL DATA BANKS
VI.2 INFOCLIMA
VI.2.1 Introduction
The Climate Data Information Referral Service - INFOCLIMA - is a service for thecollection and dissemination of information on the existence and availability of climate data in theworld. The information comprises in particular:
(a) descriptions of available data sets, held at data centres andlor published;
(b) climatological and radiation station netwOIKs in the world, and their histories;
(c) national climatological data banks - status of collection, processing and archiving ofdata.
The INFOCLIMA referral service is implemented by the WMO Secretariat under theWorld Climate Programme (WCP). Its development is guided by the general policies of the WCPand detailed working plans as contained in the Third WMO Long-Term Plan (1992-2001), Part II,Volume 2 (WMO No. 762; 1992).
INFOCLIMA information is obtained from Member countries of WMO and, as regardsdata sets, also from contributions by individual data centres and international organizations. Thenature of the referral service is international; it has been developed in co-ordination with otherinternational systems. It should be emphasized that INFOCLIMA does not handleactual climate data but provides information on the existence and availability ofclimate data in the world.
INFOCLIMA is maintained as a computerized data base. The information is published indifferent forms, depending on the nature of the information:
Catalogue of Climate System Data Sets;
Statistics on regional networks of climatological and radiation stations; in several volumes;
Climatological data banks - regional status surveys.
VI.2.2 INFOCLIMA catalogue
The Catalogue contains descriptions of data sets which originate from a particular datacollection or data processing programme. A single description may thus cover a number of "datasets" listed separately in inventories of data centres. The principle has been extended to cover anentire data inventory under one description where the various data sets all refer to a special researchactivity or a particular international scientific experiment.
Within the framework of the WCP, the data set references apply to data which are:
(a) organized and, preferably, quality controlled;
(b) considered to be of use in regional or global studies concerning climate;
(c) available internationally (on conditions as indicated by the data centre).
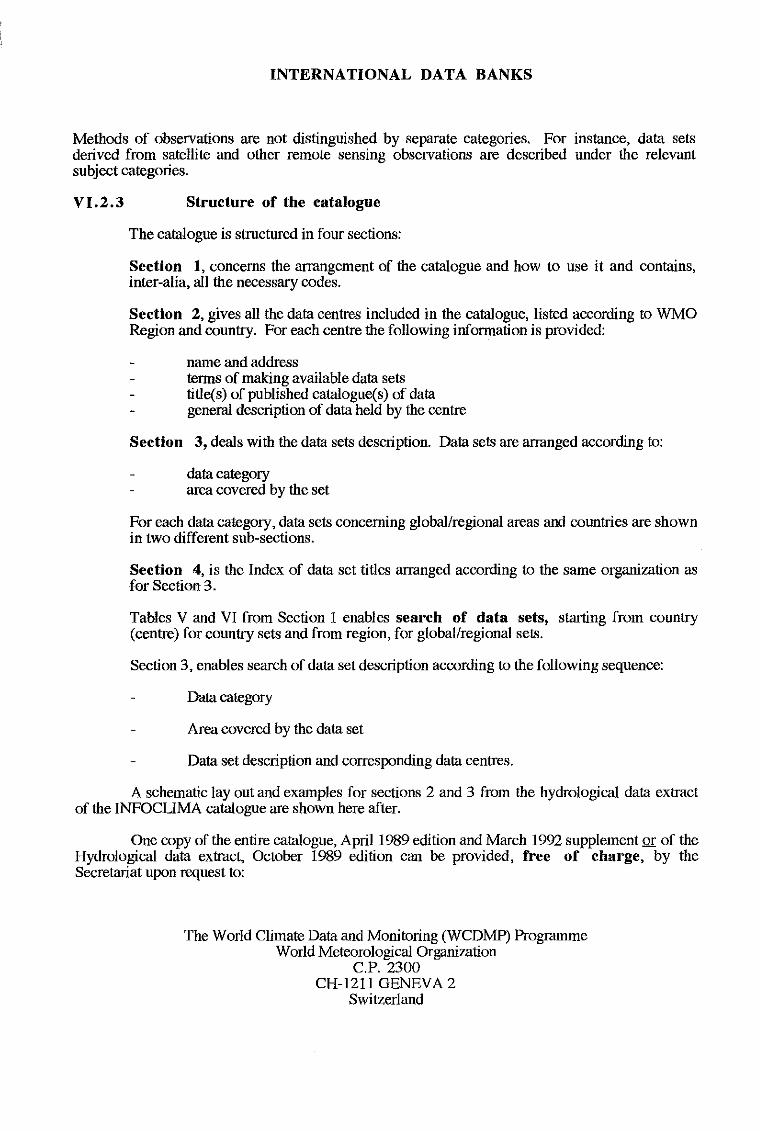
INTERNATIONAL DATA BANKS
Methods of observations are not distinguished by separate categories. For instance, data setsderived from satellite and other remote sensing observations are described under the relevantsubject categories.
VI.2.3 Structure of the catalogue
The catalogue is structured in four sections:
Section 1, concerns the arrangement of the catalogue and how to use it and contains,inter-alia, all the necessary codes.
Section 2, gives all the data centres induded in the catalogue, listed according to WMORegion and country. For each centre the following infonnation is provided:
name and addresstenns of making available data setstitle(s) of published catalogue(s) of datageneral description of data held by the centre
Section 3, deals with the data sets description. Data sets are arranged according to:
data categoryarea covered by the set
For each data category, data sets concerning global/regional areas and countries are shownin two different sub-sections.
Section 4, is the Index of data set titles arranged according to the same organization asfor Seetion 3. .
Tables V and VI from Section 1 enables search of data sets, starting from country(centre) for country sets and from region, for globallregional sets.
Section 3, enables search of data set description according to the following sequence:
Data category
Area covered by the data set
Data set description and corresponding data centres.
A schematic layout and examples for sections 2 and 3 from the hydrological data extractof the INFOCLIMA catalogue are shown here after.
One copy of the entire catalogue, April 1989 edition and March 1992 supplement or of theHydrological data extmct, October 1989 edition can be provided, free of charge, by theSecretariat upon request to:
The World Climate Data and Monitoring (WCDMP) ProgrammeWorld Meteorological Organization
C.P.2300CH-1211 GENEVA 2
Switzerland
VI.2
VI.2.1
INFOCLIMA
Introduction
BANQUE DE DONNEES INTERNATIONALES
Le Service mondial d'information sur les donnees c1imatologiques - INFOCLIMA - estcharge de la collecte et de la diffusion des renseignements sur I'existence et la disponibilite dans Iemonde des donnees c1imatologiques. Cette information comprend notamment :
a) descriptions des ensembles de donnees disponibles, se trouvant dans les centres dedonnees et/ou faisant I'objet de publications;
b) descriptions des reseaux de stations c1imatologiques et radiometriques existant dans Iemonde, accompagnees de I'historique de ces reseaux;
c) banques de donnees c1imatologiques nationales - situation concernant la collecte, Ietraitement et I'archivage des donnees.
Le Service d'information INFOCLIMA est exploite par Ie Secretariat de I'OMM dans Iecadre du Programme c1imatologique mondial (PCM). Pour Ie developper, Ie Secretariat suit lespolitiques generales du PCM et les plans de travail detailles contenus dans Ie Volume 2 de la Partie"du troisieme Plan 11 long terme del'OMM (1992-2001) (OMM N° 762; 1992).
Les informations du service INFOCLIMA sont fournies par les pays Membres de I'OMM et,en ce qui concerne les ensembles de donnees, egalement par des contributions faites par descentres de donnees individuels ainsi que par des organisations internationales. Ce serviced'information est par nature international puisqu'i1 a ete mis au point en collaboration avec d'autressystemes internationaux. II convient de souligner que Ie service INFOCLIMA ne traite pas aproprement parler de donnees climatologiques, mais fournit plutot des informations surI'existence et la disponibilite des donnees c1imatologiques dans Ie monde.
INFOCLIMA fonctionne comme une base de donnees informatisee. L'information qu'i1contient est publiee sous differentes formes, selon la nature de celle-ci :
catalogue des ensembles de donnees de systemes c1imatologiques;
statistiques des reseaux regionaux des stations climatologiques et radiometriques,contenues dans plusieurs volumes;
banques de donnees c1imatologiques - etudes regionales sur I'etat de ces banques.
BANQUE DE DONN~ES INTERNATIONALES
Donnees maritimes at oceaniques:
donnees fondees sur des observations meteorologiques en surface effectuees dans desstations maritimes et/bu donnees fondees sur des observations de la surface des oceans etdes couches superieures de la mer. Le cas echeant, un renvoi est ajoute a "donneesc1imatologiques de surface", precisant que ces ensembles de donnees se referent 11 deszones cotieres.
Donnees cryospheriques :
donnees concernant la cryosphere (terre et oceans).
Donnees sur la composition de I'atmosphere :
donnees concernant la composition chimique et celie des particules de la troposphere etde la basse stratosphere, y compris les donnees concernant les polluants.
Donnees hydrologiques:
donnees concernant les eaux de surface et les eaux souterraines, les debits solides, Ieregime des glaces, des fleuves et des lacs, les secheresses et les inondations. Lorsque desdonnees sur la precipitation ou I'evaporation sont comprises dans un ensemble dedonnees hydrologiques, un renvoi sera alors ajoute a "donnees climatologiques desurface".
Donnees anciennes et donnees indirectes :
donnees qui fournissent indirectement une indication sur Ie c1imat tel qu'i1 se presenteactuellement, mais aussi tel qu'i1 se presentait par Ie passe et dans les temps anciens (parexemple, donnees tinfies des renseignements disponibles concernant les inondations, lasedimentation, les dates des moissons, les cercles des troncs d'arbres, etc.), et egalementdonnees sur les paleoclimats. Si un ensemble de donnees indique dans une autrecategorie porte sur des donnees ayant plus de cent ans d'ilge, un renvoi sera alors ajoute a"donnees anciennes et donnees indirectes".
,Les methodes d'observations ne font pas I'objet de categories distinctes. Par exemple, les
ensembles de donnees tirees d'observations par satellite et autres moyens de teledetection sontdecrits dans les categories correspondant au type d'observation.
VI.2.3 Structure du catalogue
Le catalogue comprend quatre sections:
Section 1 : porte sur I'organisation du catalogue et son utilisation. Cette section contientnotamment tous les codes necessaires.
VI. 2
VI.2.1
HlIfIlOKJIHMA
MEX,lIYHAPO,LlHblE 6AHKM ,MHHblX
MH~PMaIlHOHHO'CIIpaooqHaJICIlyJKoa KJlHMaTHqOCKIIX IlllHHUX • MHlDOKJIMMA • JlWIIleTCR oi\Hoii HJ
CIlYJKO no diopy H pacnpocrpaHeHHlo HH~PMaIlHH 0 CYlI\OCTByKllI\HX H HMelOlI\HXCJI B HaJJHqHH KJlHMaTHqOCKHX
IlllHHUX B MHpe. MH4K>pMaUHJI, B qReTBOCfH, BKJIlOqaeT:
a) onHeaHHe HMelOlI\HXCJI B nanHqHH KOMnJleKTOB i\aHH!>IX, XpaHJllI\HXCJI B ueHTpax i\RHH!>IX u1HJlH
onyoJlHKOBaHH!>IX;
b) ceTH KJlHMaTOJlorHqOCKHX H pailHOJlOrHqOCKHX CTaHUHii B MHpe H COOTBeTCTBYIOlI\Y1O 0 HHX
HH4K>pMauulO;
c) BaIlHOHaJJLHNe KJlHMaTOJloruqOCKHe oaHKH i\RHH!>IX - COCTOJlHHe diopa, 06PaOOTKII H apxHBaUHH
i\RHHUX.
CnpaBOqHaJI CIlyJKoa MIHDOKJIMMA OCYlI\eCTBJ1J1eTCJ1 CeKpeTapHaTOM BMO B paMKax BceMHpHoii
KJlHMaTHqOCKOii nporpaMM!>I (BKTI). OHa PaJBHBaeTCJI B COOTBeTCTBHH C oOlI\eii nOJlHTHKoii BKII H nOi\poOH!>IMH
pa60qHMH MaHaMH, COi\epJKalI\HMIICH B TpeTLeM i\OJlrocpoqHOM nJlaHe BMO (1992-2001 rr.l, qaCTL II, TOM 2(IIyoJlHKauHJI BMO N° 762; 1992 r.l.
MHlDOKJIMMA nOJlyqaeT HH~pMaUHIOOT CTpaH-qJjeHOB BMO H, B TOM, ~O KaeaeTCR KOMnJleKTOB
i\RHH!>IX, TaKJKe HH~PMaUUIO, nOJJYqaeMYIO OT HHi\HBHi\YaJJLHNX ueHTpoB i\RHHNX H MeJKi\YHapoi\HUX OpffiHHJaUllii.
CnpaBOqHaJI CIlYJKoa IIMeeT MeJKi\YHapoi\H!>Iii xapaKTep; OHa COJi\RBaJlaCL B COTpyi\Hllqecroo C MeJK,l\)'Hapo)\H!>IMII
CHCTeMaMII. UeOOXOi\HMO nOi\'1epKHyTb, 'ITO HllfIlOKJIHMA He J8HHM8eTCH t8KTH'IeCKHMH
KJlHM8TH'IecKHMH i\8HHblMH, 8 npei\OCT8BJ1HeT HHtoPM8IIHIO 0 CYIl\eCTHOBaHHH H HaJIHqHH KJIHM8TH'IeCKHX
I\anHblX B MHpe.
MHlDOKJIMMA npeACTaBJlHeT coooii KOMnLIOTepHJHpOBaHHylO oaJY i\aHH!>IX. MH",opMaUHH
nyOJ1IIKYeTCJI B paJJ1HqH!>IX ~PMaX, B JaBIICllMOCTH OT ee xapaKWpa:
KaT3JlOr KOMnJleKTOB i\RHHIlX KJlHMaTHqOCKOii CllCTeMll;
CTaTHCTHqOCKHe i\RHHlle no perHOHaJJhHNM ceTHM KJUlMaTOJlOrHqOCKHX H PBAHOJlOrHqOCKHX CTaHUHii; B
HecKonLKHX TOMaX;
oaHKH KJlIIMaTOJlOmqOCKHX IlllHHIlX - oOJOP!>l COCTOHHHJI ua peruOHaJJhHOM ypoBHe.
VI.2.2 K8TaJIOr HllfIlOKJIHMA
K8TaJJor COi\epJKHT onHeaHHe KOMnJleKTOB i\RHHIlX, KOToplle 4K>PMIIPYKlTCJI Ha OCHOBe KOHKpeTHOii
coBOKynHOCTH i\aHHIlX HJlH nporpaMMIl oopa60TKH )\aHHIlX. OOlI\ee onHcaHHe MOJKeT OXBaTIlBaTh PHil
"KOMnJleKTOB i\RHHNX", nepeqHCIleHHIlX OTi\eJJhHO B KaTaJJOrax ueHTpoB i\aHHUX. 3TOT npHHUlln OIlJl HCHOJlhJOBaH
MH TOro, ~06!>1 OXBaTHTb B paMKax OiIBoro onHeaHHH sech KaTanor i\RHH!>IX, rile paJJlHqH!>Ie KOMnJleKTIl IlllHH!>IX B
UeJJOM OTHOCJITCJI K KOHKpeTHoii HayqHO-HCCJlei\OBaTeJJhCKOii i\eHTeJlhHOCTH HJlH KOHKpeTHOMy MeJKi\YHapoi\HOMY
HayqHoMy 3KCllepHMeHTy.
ME)[(j{YHAPO,l\HblE IiAHICH .l\AHHblX
fJVlllO!lOmqOCKlle ilil.IIHble:
J\aHHble, KacalOlUllecJI nOBepXHOCfHblX II nOi\JeMHblX BOi\. pacxoJ\a HaHOCOO, nei\OBOrO pe:llClIMll 0
peKaX II 03epaX, JacyX II naBOi\KOO. B TOM C1Iyqae, CC1II1 0 KOMnneKT rll!lponOrllqOCKIIX ilil.IIHblX
OKnJOqeHbI ilil.IIHble no OCRilKaM/llenapeHIlIO, TO nepeKpecrHaJI <X:bInKa ocraonHeTCH 0 "npllJeMHble
KnIlMaTOnomqeOme i\aHHble".
HcropllqecKlle II KOCBeHHble i\aHHble:
i\aHHble, i\alOlUlle KOCBeHHOe npei\craWleHlle 0 KnllMaTe 0 HaCTOHIUIIH, IICTeKWIIH II i\peOHIIH
nep"Oi\ (HanpIlMep, naBOi\KII, HaHOCbI, CpoKII c60pa ypoxaeH, mi\OObie KonbUa Ha cpy6ax
i\epeObeo II T.,II.), a mK:lICe ilil.IIHble 0 naneoKnIlMaTe. B TOM cnyqae, CC1II1 KOMnneKT J\aHHblX
i\pymH KaTempll1l COi\ep:llCIIT i\aHHble Ja 60nee qeM lOO·neTHIIH nep"Oi\, TO ocraonHeTCH
nepeKpeCTHaH <X:bInKa 0 "lIcropllqOCKlle II KocueuHble i\aHHble"
MeTO!lbl Ha6nlOi\eHIIH He nOi\paJi\enHIOTCH ua OTi\MbHble Kamropllll. HanplIMep, KOMnneKTbI J\aHHblX,
nonyqeHHble B proynLTam Ha6nlOi\eHIIH co enyTHIIKoo II i\pyrnx cpei\CTO !lIIcraBUIIOHHOro 3OH!lIIpoBaHIIH. onllcaHbI 0
paMKaX COOTlleTCTllYlOlUIIX KOHKPeTHbiX KamropllH.
VI. 2.3 CTpyKTypa KaTaJlora
lCamnor COCTOIIT 113 qeTUpex paJilMOO:
PaJi\e.JI 1 COi\ep:llCIIT IIHQJopMaUlllO, KacalOlUYIOCH CTpyKTypbl Kamnora, nOpHi\Ka em lIenonb3OBaHIIH II.
B qaCTHOCfll, oce He06xoi\IIMbie KO!lbl.
PaJi\eJl 2 COi\ep:llCIIT cnllCOK llCex ueHTpoo i\aHHblX. OKnlOqeHHblX 0 Kamnor, nepeqllC1leHHblX nO
PemoHaM BMO II CTpaHaM. 110 Ka:lICi\OMY UeHTpy npei\OCfaunHeTCH C1IeilYlOIUaJI IIHQJoPMallllH:
HaJBallHe II lIJlpecycnOOIlH npei\ocraWleHIIH KOMrmeKTOO i\aHHblX
HaIIMeHOBaHIIH ony6JIHKOBaHHblX KaTaJJoroo ilil.IIHbIX
o6lUee onllcaHlle ilil.IIHblX, KOroPblMII paenonaraeT UeHTp.
PaJi\eJl 3 COi\ep:llCIIT onllcaHlle KOMnneKTOO i\aHHblX. 1C0MnneKTbI i\aHHblX Ct/!0PMIlP0BaHbI
COOTBeTCTBeHHO IIJ:
Kamropllll ilil.IIHblX
OXBarnBaeMOH KOMnneKTOM i\aHHblX 06naCTII.
,l{nn Ka:lIC!lOH KaTeropll1l i\aHHblX, KOMnneKTbI i\aHHblX, KacalOlUllxcH rn06anbHblx!perlloHanbHblx
06nacreH II CTpaH, npei\craoneHbI 0 i\OYX paJnllqublX nO!lpaJi\enax.
PaJi\e.JI 4. B 3TOM paJi\eJle COi\ep:llCIITCH yKaJaTenb HaHMeHOBaHIIH KOMnneKTOO J\aHHblX, cocraoneHHblH 0
TOM :lICe nopHi\Ke, qTQ II paJi\M 3.
Ta6]J1111a V II VI, COi\ep:llCaIUllecJI 0 paJi\Me 1, n03BOnnlOT BeCTII nOIlCK KOMrmeKTOO ilil.IIHblX uaquHaH coCTpaH (ueHTpoo) )I,I1H nOIlCKa KOMnneKTOO ilil.IIHblX no CTpaHaM, i\0 pernOHOO i\nH nOIlCKa KOMnneKTOO
rno6anbHblx!pemOHanbHblX i\aHHblX.
PaJi\M 3 06ecnequuaeT B03MO:lICHOCfb nOIlCKa onllcaHlIH KOMnJleKTa i\aHHblX 0 C1IeilYlO1UeM nOPHilKe:
KammplIH i\aHHbIX
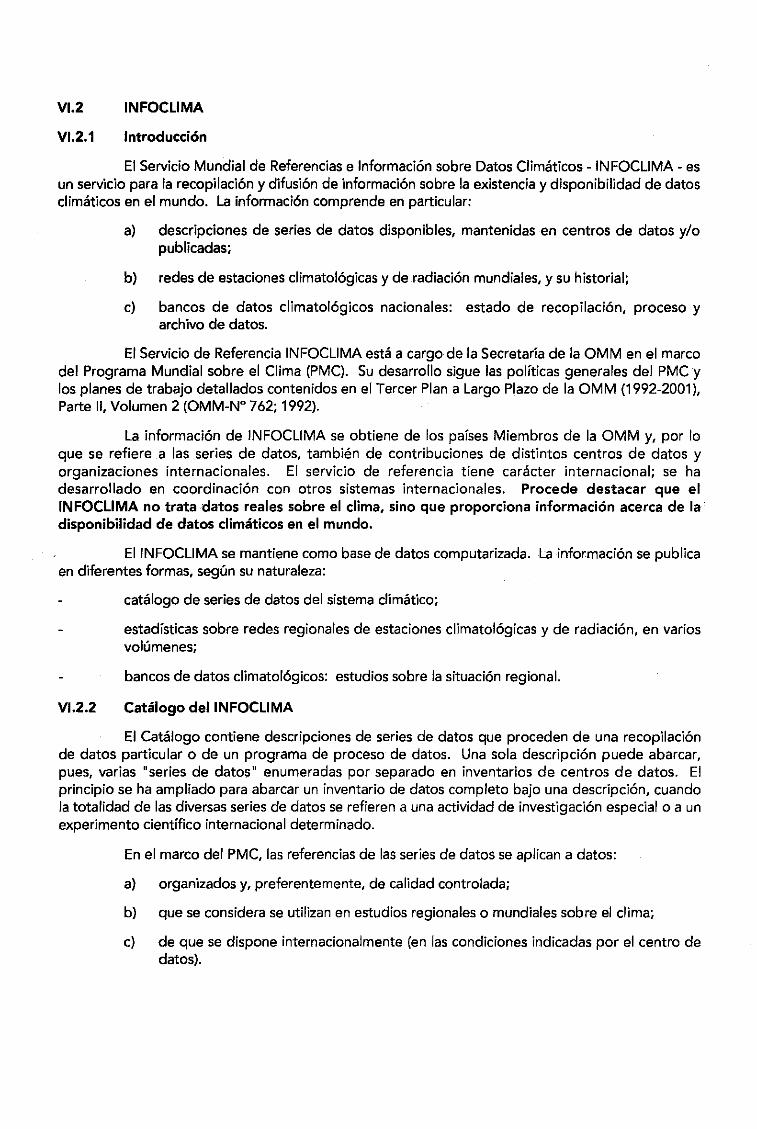
VI.2
VI.2.1
INFOCLIMA
Introduccion
EI Servicio Mundial de Referencias e Informacion sobre Datos Climaticos - INFOCLIMA - esun servicio para la recopilacion y difusion de informacion sobre la existencia y disponibilidad de datosc1imaticos en el mundo. La informacion comprende en particular:
a) descripciones de series de datos disponibles, mantenidas en centros de datos y/opublicadas;
b) redes de estaciones c1imatologicas y deradiacion mundiales, y su historial;
c) bancos de datos c1imatologicos nacionales: estado de recopilacion, proceso yarchivo de datos.
EI Servicio de Referencia INFOCLIMA estii a cargo de la Secretaria de la OMM en el marcodel Programa Mundial sobre el Clima (PMC). Su desarrollo sigue las politicas generales del PMC ylos planes de trabajo detallados contenidos en el Tercer Plan a Largo Plazo de la OMM (1992-2001),Parte II, Volumen 2 (OMM-N" 762; 1992).
La informacion de INFOCLIMA se obtiene de los paises Miembros de la OMM y, por 10que se refiere a las series de datos, tam bien de contribuciones de distintos centros de datos yorganizaciones internacionales. EI servicio de referencia tiene cariicter internacional; se hadesarrollado en coordinacion con otros sistemas internacionales. Procede destacar que elINFOCLIMA no tratadatos reales sobre el c1ima, sino que proporciona informacion acerca de ladisponibilidad de datos c1imaticos en el mundo.
EIINFOCLIMA se mantiene como base de datos computarizada. La informacion se publicaen diferentes formas. segun su naturaleza:
catalogo de series de datos del sistema c1imiitico;
estadisticas sobre redes regionales de estaciones c1imatologicas y de radiacion, en variosvolumenes;
bancos de datos c1imatologicos: estudios sobre la situacion regional.
VI.2.2 Catalogo dellNFOCLIMA
EI Catalogo contiene descripciones de series de datos que proceden de una recopilacionde datos particular 0 de un programa de proceso de datos. Una sola descripcion puede abarcar,pues, varias "series de datos" enumeradas por separado en inventarios de centros de datos. EIprincipio se ha ampliado para abarcar un inventario de datos completo bajo una descripcion, cuandola totalidad de las diversas series de datos se refieren a una actividad de investigacion especial 0 a unexperimento cientifico internacional determinado.
En el marco del PMC, las referencias de las series de datos se aplican a datos:
a) organizados y, preferentemente. de calidad controlada;
b) que se considera se utilizan en estudios regionales 0 mundiales sobre el c1ima;
c) de que se dispone internacionalmente (en las condiciones indicadas por el centro dedatos).
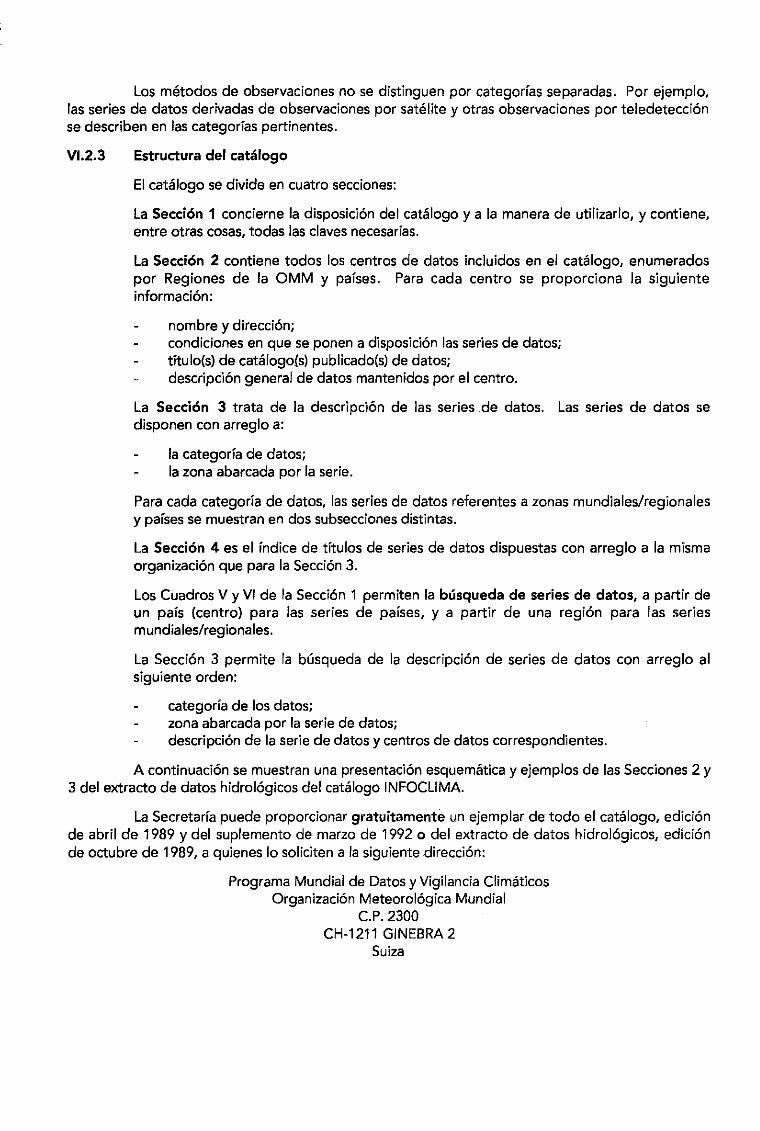
Los metodos de observaciones no se distinguen por categorfas separadas. Por ejemplo,las series de datos derivadas de observaciones por sate lite y otras observaciones por teledetecci6nse describen en las categorfas pertinentes.
VI.2.3 Estructura del catillogo
EI catalogo se divide en cuatro secciones:
La Secci6n 1 concierne la disposici6n del catalogo y a la manera de uti/izar/o, y contiene,entre otras cosas, todas las c1aves necesarias.
La Secci6n 2 contiene todos los centros de datos incluidos en el catalogo, enumeradospor Regiones de la OMM y pafses. Para cada centro se proporciona la siguienteinformaci6n:
nombre y direcci6n;condiciones en que se ponen a disposici6n las series de datos;titulo(s) de catalogo(s) publicado(s) de datos;descripci6n general de datos mantenidos por el centro.
La Secci6n 3 trata de la descripci6n de las series de datos. Las series de datos sedisponen con arreglo a:
la categoria de datos;la zona abarcada por la serie.
Para cada categoria de datos, las series de datos referentes a zonas mundiales/regionalesy pafses se muestran en dos subsecciones distintas.
La Secci6n 4 es el fndice de tftulos de series de datos dispuestas con arreglo a la mismaorganizaci6n que para la Secci6n 3.
Los Cuadros V y VI de la Secci6n 1 permiten la busqueda de series de datos, a partir deun pais (centro) para las series de pafses, y a partir de una regi6n para las seriesmundiales/regionales.
La Secci6n 3 permite la busqueda de la descripci6n de series de datos con arreglo alsiguiente orden:
categorfa de los datos;zona abarcada por la serie de datos;descripci6n de la serie de datos y centros de datos correspondientes.
A continuaci6n se muestran una presentaci6n esquematica y ejemplos de las Secciones 2 y3 del extracto de datos hidrol6gicos del catalogo INFOCLIMA.
La Secretarfa puede proporcionar gratuitamente un ejemplar de todo el catalogo, edici6nde abri/ de 1989 y del suplemento de marzo de 1992 0 del extracto de datos hidro/6gicos, edici6nde octubre de 1989, a quienes 10 soliciten a la siguiente direcci6n:
Programa Mundial de Datos y Vigi/ancia ClimaticosOrganizaci6n Meteorol6gica Mundial
C.P.2300CH-1211 GINEBRA2
Suiza
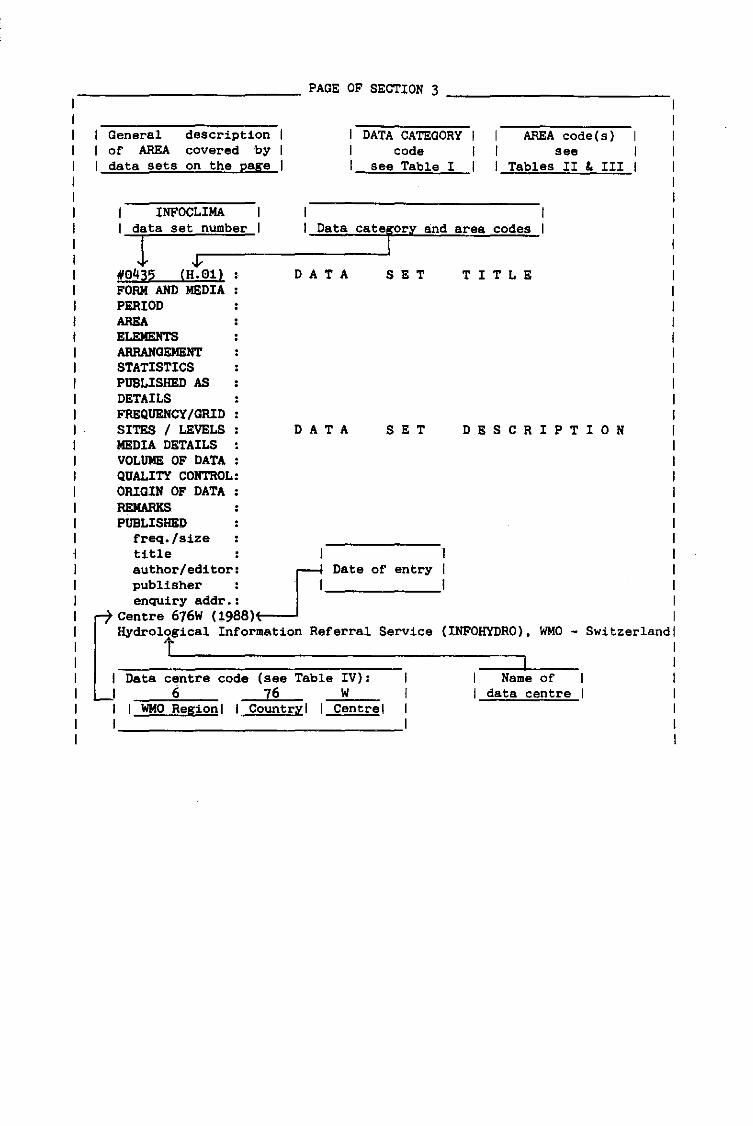
____________ PAGE OF SECTION 3
Generalof AREAdata sets
descriptioncovered byon the page
DATA CATEGORYcode
see Table I
AREA code(s)see
Tables II L III
Data catej~O~rLY~a~n~d~a~r~e~a~c~o~d~e~s_
DES C RIP T ION
TIT L E
(INFOHYDRO). WMO - Switzerland
SET
SET
OAT A
D A T A
INFOCLlMA, data set number
1le435 (H.el)FORK AND MEDIAPERIODAREAELEMENTSARRANGEMENTSTATISTICSPUBLISHED ASDETAILSFREQUENCY/GRIDSITES / LEVELSMEDIA DETAILSVOLUME OF DATAQUALITY CONTROL:ORIGIN OF DATAREMARKSPUBLISHED
freq./sizetitle Iauthor/editor: Y Date of entrypublisher: . , _enquiry addr.:
Centre 676W (1988)Hydrological Information Referral Service
t
, WMO Region I
Data centre6
code (see Table IV):76 W
Country I I-C~e~n~t-r-e'
Name ofdata centre
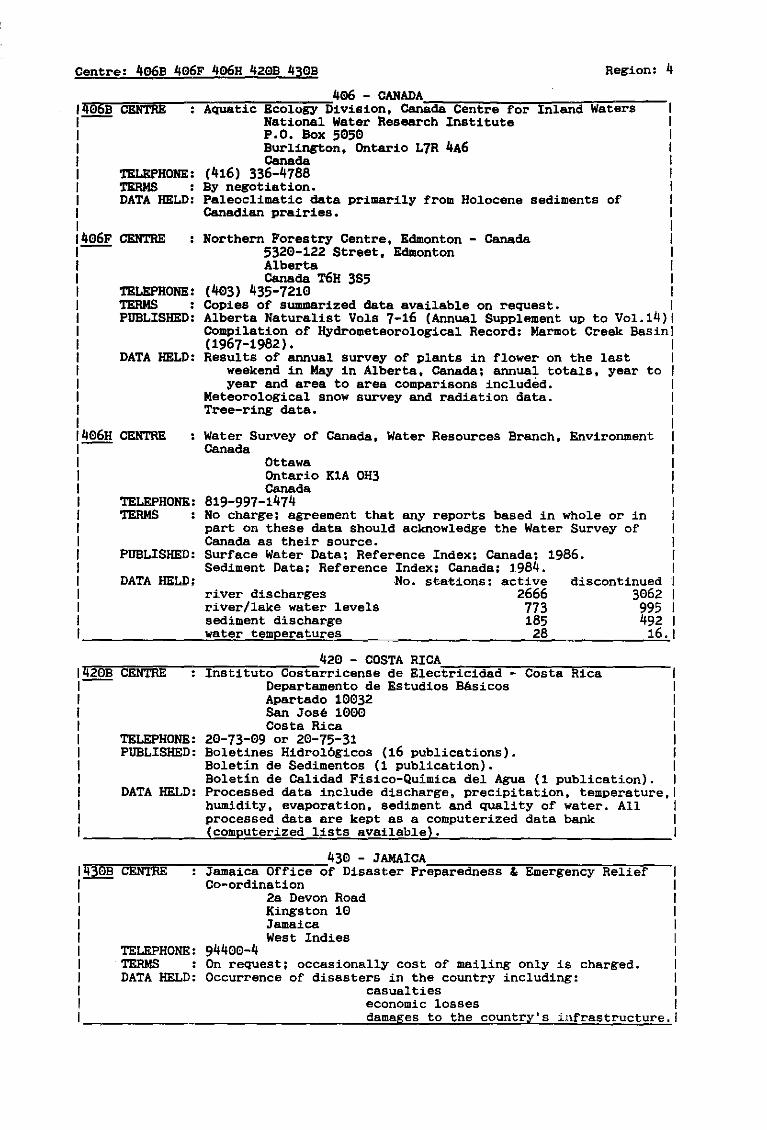
Centre: 4a6s 4a6F 4a6H 4ZlilS 43lilS Region: 4
Water Survey of Canada, Water Resources Branch, EnVironmentCanada
DATA HELD:
TELEPHONE:TERMSPUBLISHED:
1114lil6H CENTREI--I Ottawa1 Ontario K1A OH31 Canada1 TELEPHONE: 819-997-1474 I1 TERMS No charge; agreement that any reports based in whole or in II part on these data should acknowledge the Water Survey of II Canada as their source. 1I PUBLISHED: Surface Water Data; Reference Index; Canada; 1986. II Sediment Data; Reference Index; Canada; 1984. II DATA HELD: No. stations : active discontinued!I river discharges z666 3lil62 II river/lake water levels 173 995 1I sediment discharge 185 492 II .=w"'a"'t::::e"'r-=t::::e"'m"'p::::e"'r"a:.::t"'u"'r"'e"'s'--__~~ --=2,,8 -=-1,,6.;... I
4a6 - CANADA1"4"'lil"'6"'s"""CBNTilE==:;;---:-'A"'qua="'t':ri-=c-S=CO=1-=oGY=-D"'ivision, Cana-=da=-C;;e-=n=tr"'e:-f"o""r::-I"'n""l"an=d::;-;W"a::"t::"e:::r=s;;---I,--- National Water Research Institute II P.O. Box 5lil5lil I1 Burlington, Ontario L1R 4A6 II Canada I1 TELEPHONE: (416) 336-4188 II TERMS By negotiation. I1 DATA HELD: Paleoclimatic data primarily from Holocene sediments of I1 Canadian prairies. II 114lil6F CEIITIlE Northern Forestry Centre, Edmonton - Canada 1
53Zlil-122 Street, Edmonton 1Alberta ICanada T6H 3S5 I
(4lil3) 435-121lil ICopies of sWDlllllrized data available on reClUest. !Alberta Naturalist Vols 1-16 (Annual Supplement up to Vol.14)!Compilation of Hydrometeorological Record: Marmot Creek Basin(1961-1982) •Results of annual survey of plants in flower on the last
weekend in May in Alberta, Canada; annual totals, year toyear and area to area comparisons included.
Meteorological snow survey and radiation data.Tree-ring data.
42lil - COSTA RICAIr.42""lil"·S""""CENTRE=="""-"'-"'In=s"'"t""'"i"'"tu=to-C"o-s"'t"'"a-rricense de Elec""'"t-r""'"i.,.c""'"i...da-,;d----..C-o-s..,.t-a""""'R""'i-c-a-----1---- Departamento de Estudios BAsicos1 Apartado 1lillil32I San Jos~ llillillilI Costa RicaI TELEPHONE: 2lil-73-lil9 or 20-15-31I PUBLISHED: Boletines Hidrol6gicos (16 publications).1 Boletin de Sedimentos (1 publication).I Boletin de Calidad Fisico-Quimica del Agua (1 publication). II DATA HELD: Processed data include discharge, precipitation, temperature,!I humidity, evaporation, sediment and quality of water. All II processed data are kept as a computerized data bank II ..>.(.;:c.;:o=m"p.;:u.;:t.;:e:.r=i"z.;:e=d...=.l"i"s.;:t"s_a=v.;..a=il.;:a"b:.l.;:e=.l.;..' 1
430 - JAMAICAIr.4"3"'0"'S--;;CEIITIlEm;;;;;;;;---"'-·J""am=a7i""ca:-"07;f7;f':ri ""c""e-=o·f Disaster Pr'-:e""p""a""r""e"'dn=e""s""s~&-;;Em=e""r"'g:-:e""n"'c:::y"-';R:::e"'l"'i-:e""f""""-I Co-ordinationI 2a Devon Road1 Kingston 101 JamaicaI West IndiesI TELEPHONE: 94400-4I TERMS On request; occasionally cost of mailing only is charged.1 DATA HELD: Occurrence of disasters in the country including:I casualtiesI economic lossesI --"'d"'a"'m"'al>g=e.e.s-"to"--"'th~e"--"co"un="'tr"_y,,-'.e.S-=-i...~·,"_f"_r"'a.e.s"'t"_r"u=c"'t"u"_r=e.;...
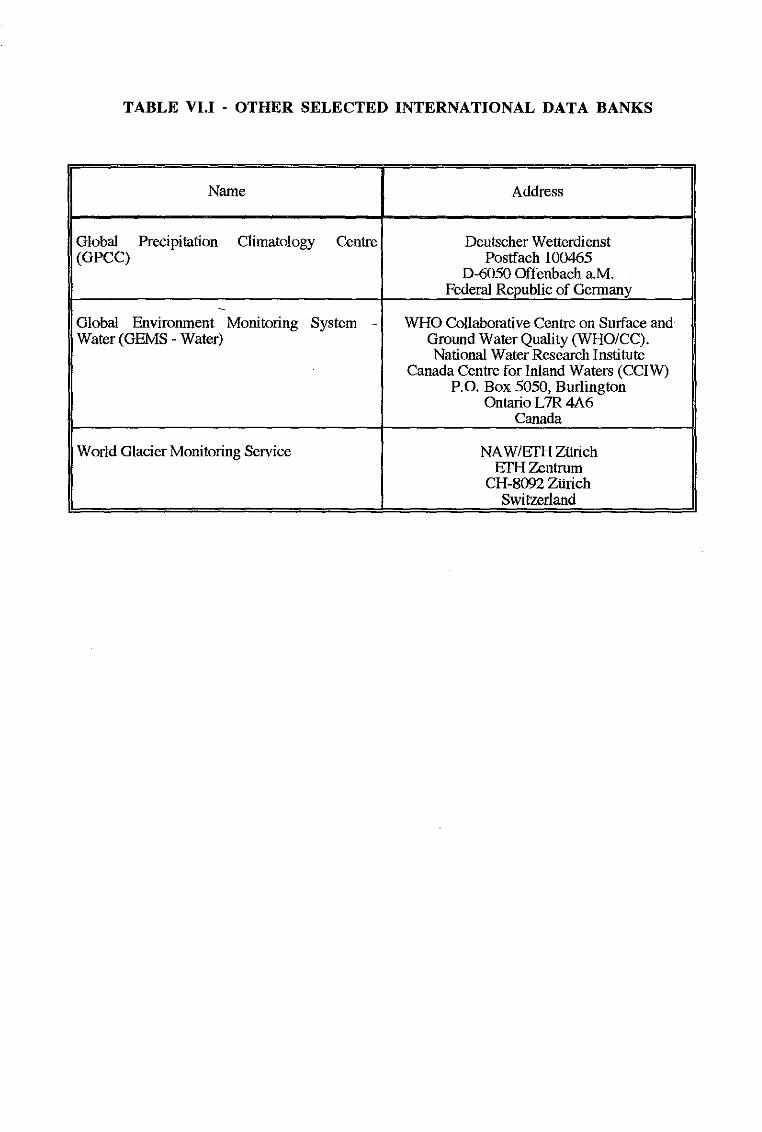
TABLE VI.I - OTHER SELECTED INTERNATIONAL DATA BANKS
Name Address
Global Precipitation Climatology Centre Deutscher Wetterdienst(GPCC) Postfach 100465
D-6050 Offenbach a.M.Federal Republic of Germany
-Global Environment Monitoring System - WHO Collaborative Centre on Surface andWater (GEMS - Water) Ground Water Quality (WHO/Ce).
National Water Research InstituteCanada Centre for Inland Waters (CCIW)
P.O. Box 5050, BurlingtonOntario L7R 4A6
Canada
World Glacier Monitoring Sen·ice NAWIEfH ZUrichErHZentrum
CH-8092 ZUrichSwitzerland