Embed Size (px)
Citation preview
METEOROLOGICAL DROUGHT ANALYSIS USING GISM.V.S.S.Giridhar1 and Dr.G.K.Viswanadh2
1Asst. Prof., Dept. of Civil Engineering, C.M.R.C.E.T, Kandlakoya (v), Hyderabad - 501 401,India, [email protected]
2 Professor, Dept. of Civil Engineering, J.N.T.U. C.E., JNTU Campus, Hyderabad - 500 072, India, e-mail: [email protected]
ABSTRACTMeteorological drought severities in the study area were
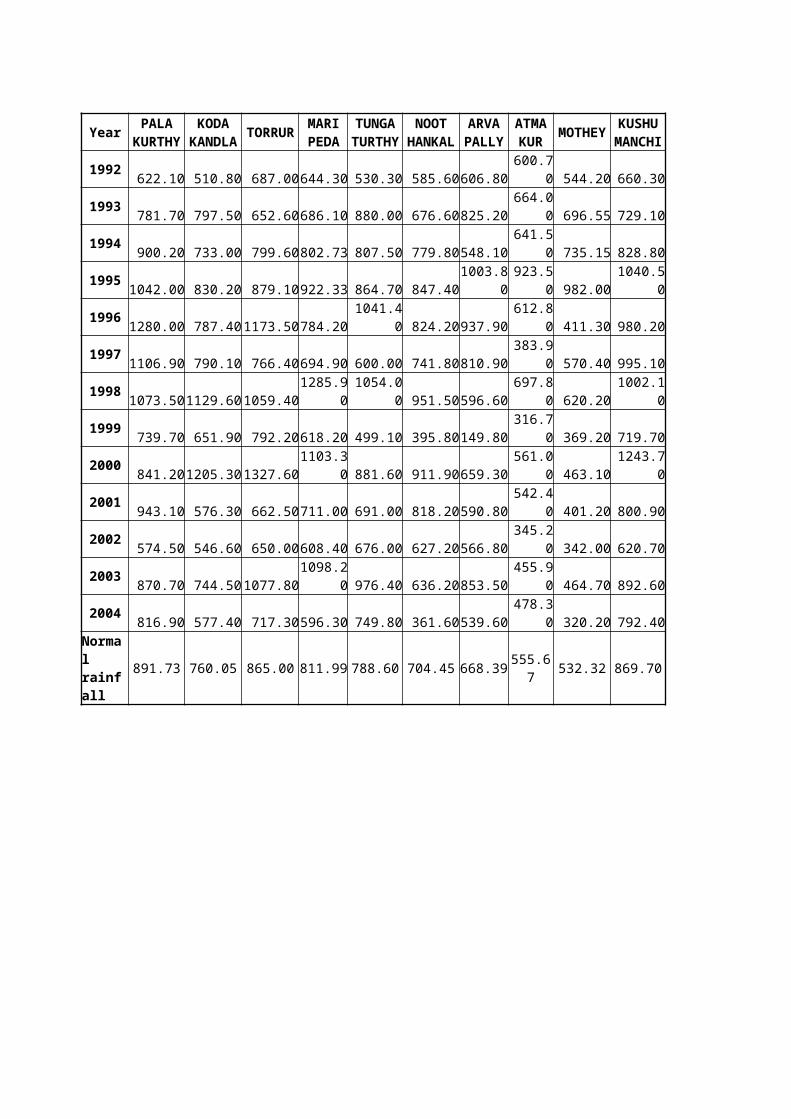
assessed in terms of percentage deviation used by the IndianMeteorological Department (IMD) form the long-term historicaldata from 1992 to 2004. Drought severity trends for the past twoyears (2003 & 2004) were projected in terms of various thematicmaps using MapInfo in ArcGIS 9.1 software. In the present studysub basin has been considered upto Palleru reservoir only. Tenrain gauge stations (Palakurthy, Kodagandla, Torrur,Tungaturthy, Aravapally, Maripeda, Noothankal, Atmakur,Kushmanchi and Mothey) were identified in and around the studyarea. Daily rainfall data was collected for all ten rain gaugestations in the study area for a period of 1992 to 2004 fromBureau of Economics and Statistics, Khairathabad, Hyderabad.Thiessen network was developed under each rain gauge stationusing Map info in Arc GIS 9.1 software. Normal rainfall has beenrecorded in Palakurthy, Kodagandla, Torrur, Tungaturthy,Aravapally, Maripeda, Noothankal, Atmakur, Kushmanchi and Motheyas 891.73mm, 760.05mm, 865.00mm, 788.60mm, 668.39mm, 576.95mm,704.45mm, 555.67mm, 869.70mm and 355.52mm respectively. In thesub basin highest rainfall recorded at Noothankal rain gaugestation as 676.00mm and lowest is 342.00mm at Kushmanchi raingauge station.
1.0 INTRODUCTIONDrought is a regional phenomenon, which is considered as
one of the major natural environmental hazard, which severelyaffects the water resources and vegetation through out thehistory of humankind. Drought indicates the deficit of rainfall,runoff, water availability, soil moisture, ground water, surfacewater and crop yield that have been the subject of manyinvestigators from the previous century. The National Commissionon Agriculture (1976) broadly classified droughts intoMeteorological drought, hydrological drought and agriculturaldrought. Meteorological drought is a situation when the actualrainfall is significantly lower than the climatologically
expected rainfall over a wide area. Hydrological drought isassociated with marked depletion of surface water and consequentdrying up of lakes, rivers, reservoirs etc. Hydrological droughtresults if meteorological drought is sufficiently prolonged.Agricultural drought is a condition in which there isinsufficient soil moisture available to a crop results inreduction of yield. Agricultural drought is the end effect ofmeteorological and hydrological drought and its severity isassessed from the crop yield. So, the periodical droughtassessment in a region must be necessary to take the managementmeasures.
Many researchers related agricultural drought by aninadequate amount of soil water available during the criticalcrop growth periods. Subramanyam (1967) and Subramanyam et al(1974) considered as a shortage of moisture estimated throughsimple water budgeting procedure. The index developed fordrought assessment was known as Moisture Adequacy Index (MAI),which is ratio of water deficit to over water need. Palmer(1986) defined severity of agricultural drought in terms of themagnitude of computed abnormal evapotranspiration deficit andexpressed as a crop moisture index. The model parameters used inwater budgeting procedure was developed based on the longerrecords of hydro meteorological data. The objective of thepresent study is to meteorological drought and to preparethematic maps using Arc Map in GIS 9.12.0 STUDY AREA
The Krishna basin is situated between East longitudes 730
21' to 810 09' and North latitudes 130 07' to 19025' in theDeccan plateau covering large areas in the States ofMaharashtra, Karnataka and Andhra Pradesh. The Krishna basinextends over an area of 2,58,948 sq.km., which is nearly 8% ofthe total geographical area of the country. Krishna catchmentwas divided in to 12 sub basins in the report of Krishna WaterDispute Tribunal. In the present study K-11 sub basin i.ePalleru basin of River Krishna has been considered to analyzemeteorological drought at each rain gauge sub area. The Pallerusub basin lies between latitudes 160 39’ and 170 50’ North andlongitudes 790 17’ and 800 09’ East. The Palleru sub basin has acatchment area of 3,263km2, which constitutes 1.3% of the totalbasin area. The catchment area of the Palleru sub basin entirelylies in the State of Andhra Pradesh. In the present studyPalleru sub basin has considered up to Palleru reservoir only.
Ten rain gauge stations (Palakurthy, Kodagandla, Torrur,Tungaturthy, Aravapally, Maripeda, Noothankal, Atmakur,Kushmanchi and Mothey) were identified in and around the studyarea. Daily rainfall data was collected for all ten rain gaugestations in the study area for a period of 1992 to 2004 formBureau of Economics and Statistics, Khairathabad, Hyderabad.
3.0 DATA & METHODOLOGY
3.1 Data used Daily rainfall data from 1992 to 2004 Toposheets used 56-o7, o10, o11, o12, o15, o16, 56-
P13, 65-C4, 65-D13.2 Software used
Arc GIS 9.1 Micro soft Excel
3.3 IMD Meteorological Drought Assessment Thiessen network was developed using Arc GIS 9.1 software.
Normal rainfall has been calculated at Palakurthy, Kodagandla,Torrur, Tungaturthy, Aravapally, Maripeda, Noothankal, Atmakur,Kushmanchi and Mothey as 891.73mm, 760.05mm, 865.00mm, 788.60mm,668.39mm, 576.95mm, 704.45mm, 555.67mm, 869.70mm and 355.52mmrespectively. In the sub basin highest rainfall recorded atNoothankal rain gauge station as 676.00mm and lowest is 342.00mmat Kushmanchi rain gauge station. The IMD uses IrrigationCommission report, 1982 to assess the meteorological drought onthe basis of percentage deviation of rainfall from the meanrainfall. The percentage deviation is given by the followingequation (1).
……(1)
where: MDt = Percenatge of meteorological deviation, Pact = Actual rainfall in the timeperiod ‘t’, Pmean = Long term mean rainfall
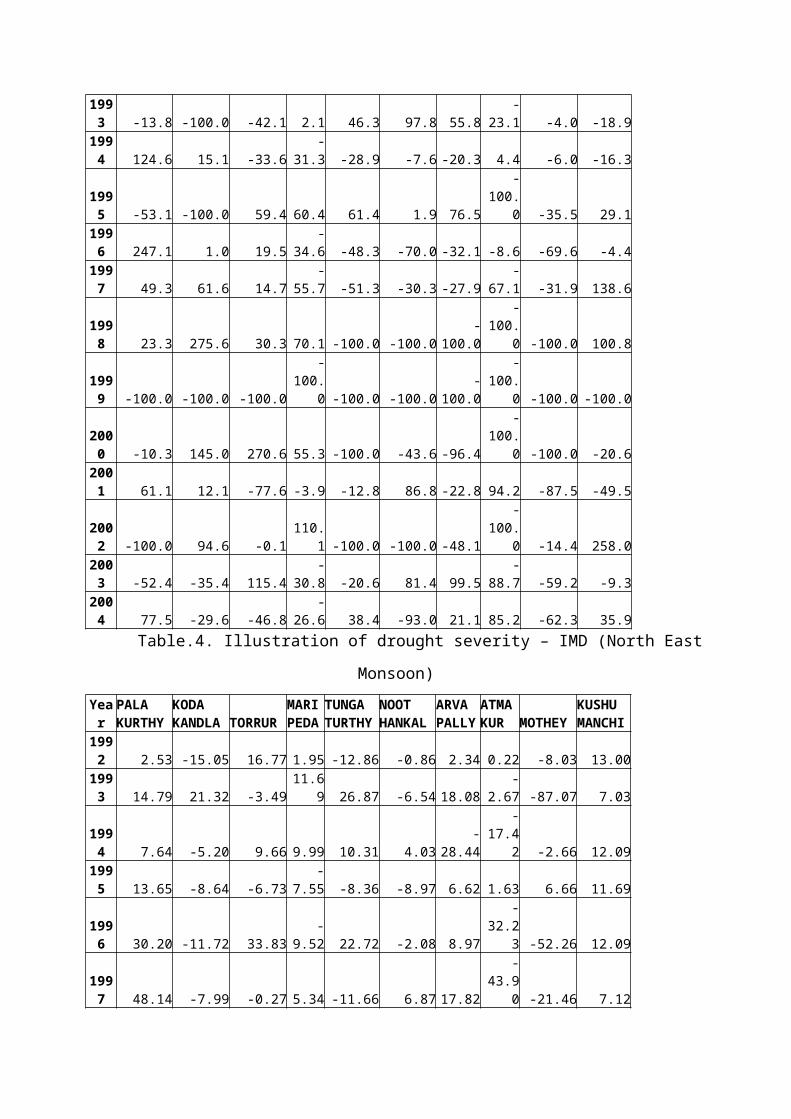
The percentage deviation of rainfall and the category ofdrought assessment used by IMD are as given in the Table.1. TheIMD drought assessment method was used for ten rain gaugestations in K-11 sub basin of river Krishna. Thirteen water yearannual rainfall data average was taken and percentage deviationsof each water year and seasonal wise (Northeast and Southwest)percentage deviations were calculated corresponding year andseasonal wise drought severity values for ten rain gaugestations are presented in Tables1 to 4.
Sl.No
Percentage Deviation(MDt)
Class Category
1 >0 M0 No drought
2 0 to –25 M1 Mild3 -25 to –50 M2 Moderate4 <-50 M3 Severe
Table. 1. Percentage of deviation and Category of drought assessment
4.0 RESULTS AND DISCUSSION Based on the results obtained from the IMD droughtassessment method for the study area, the drought severityestimates were arrived and discussed below. As seen from thetables, it is observed that K-11 sub basin of river Krishna hadexperienced mild to moderate drought in the annual assessmentfor the years 1992, 1993, 1994, 1999, 2000, 2001, 2002, 2003 and2004. Rainfall in the water years (1994, 95, 96, 97, 98 and2001) was observed more than the normal rainfall as given inTable2. In the sub basin Mild and moderate drought was observedin the year 1992, 1994, 1999, 2000, 2001, 2002 and 2004 in theentire sub basin. It is observed from the table.3.the wateryears 1995-96, 1996-97, 1997-98 and 1998-99 was observed nodrought. Seasonal assessment Southwest and Northeast monsoon wasanalyzed for the entire basin for a period of 13 years and givenin Table.4 and table5. Palakurthy sub area was observed nodrought in the entire period except 2000 water year in southwestmonsoon even in the years where rainfall is less than normalrainfall. But some of the years in the seasons of southwest andnortheast monsoons experienced severe, mild and moderatedroughts. The spatial variation of drought severity over thebasin in a particular year can be depicted in the form ofthematic maps. The drought severity values of all the ten raingauge stations were exported to the GIS software to generatedrought severity maps. Fig.1, Fig.2 and Fig.3 shows annual,northeast and southwest season’s drought severity for the pastfive water year (1999-2004) respectively to represent thedrought affected areas.
5.0 CONCLUSIONDrought severity was assessed from the deficit of rainfall
by using the IMD methodology from the historical rainfall data.From the results it is observed that mild to moderate droughthad occurred in this basin every alternative year in the annual,
southwest and northeast monsoon seasons. To know the realisticactual drought situation in a basin, hydrological drought andagricultural drought assessment must be necessary along with themeteorological drought assessment. Assessment of hydrologicaland agricultural drought can be made using remote sensingtechnology in basin wise drought assessment.REFERENCES
1. Giridhar. MV.S.S. (1995) “Validation of satellite deriveddrought assessment through water balance approach at Mandallevel” an unpublished M.Tech thesis.
2. Subramanyam, V.P. (1967), “The problem of incidence andspread of continental drought”, WMO report no: WMO/IHD-2,Geneva, p.52
3. Subramanyam, V.P. and Sastry, C.V.S.(1969), “Climaticanalogues for the dry regions of India” Tropical Ecol.Vol.10, No.1, pp:34-54
Year PALAKURTHY
KODAKANDLA TORRUR MARI
PEDATUNGATURTHY
NOOTHANKAL
ARVAPALLY
ATMAKUR MOTHEY KUSHU
MANCHI
1992 622.10 510.80 687.00644.30 530.30 585.60606.80600.7
0 544.20 660.30
1993 781.70 797.50 652.60686.10 880.00 676.60825.20664.0
0 696.55 729.10
1994 900.20 733.00 799.60802.73 807.50 779.80548.10641.5
0 735.15 828.80
1995 1042.00 830.20 879.10922.33 864.70 847.401003.8
0923.5
0 982.001040.5
0
1996 1280.00 787.401173.50784.201041.4
0 824.20937.90612.8
0 411.30 980.20
1997 1106.90 790.10 766.40694.90 600.00 741.80810.90383.9
0 570.40 995.10
1998 1073.501129.601059.401285.9
01054.0
0 951.50596.60697.8
0 620.201002.1
0
1999 739.70 651.90 792.20618.20 499.10 395.80149.80316.7
0 369.20 719.70
2000 841.201205.301327.601103.3
0 881.60 911.90659.30561.0
0 463.101243.7
0
2001 943.10 576.30 662.50711.00 691.00 818.20590.80542.4
0 401.20 800.90
2002 574.50 546.60 650.00608.40 676.00 627.20566.80345.2
0 342.00 620.70
2003 870.70 744.501077.801098.2
0 976.40 636.20853.50455.9
0 464.70 892.60
2004 816.90 577.40 717.30596.30 749.80 361.60539.60478.3
0 320.20 792.40Normalrainfall
891.73 760.05 865.00 811.99 788.60 704.45 668.39 555.67 532.32 869.70
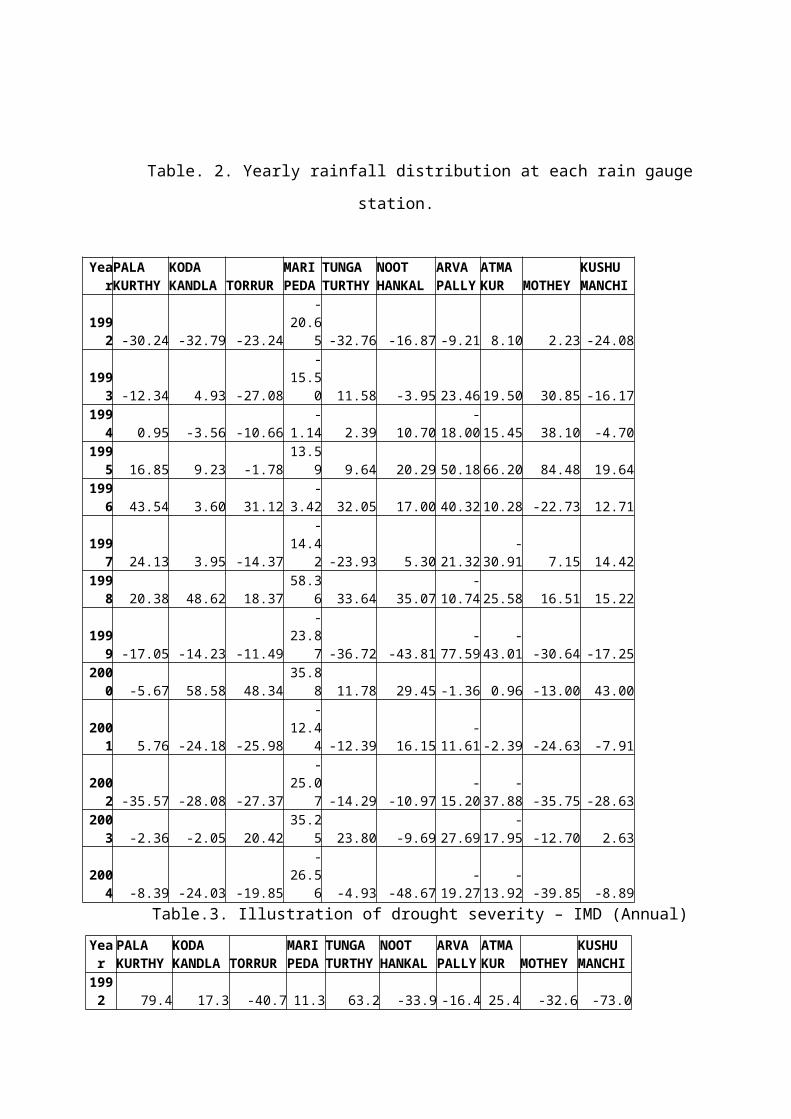
Table. 2. Yearly rainfall distribution at each rain gauge
station.
Year PALAKURTHY
KODAKANDLA TORRUR
MARIPEDA
TUNGATURTHY
NOOTHANKAL
ARVAPALLY
ATMAKUR MOTHEY
KUSHUMANCHI
1992 -30.24 -32.79 -23.24
-20.6
5 -32.76 -16.87 -9.21 8.10 2.23 -24.08
1993 -12.34 4.93 -27.08
-15.5
0 11.58 -3.95 23.46 19.50 30.85 -16.171994 0.95 -3.56 -10.66
-1.14 2.39 10.70
-18.00 15.45 38.10 -4.70
1995 16.85 9.23 -1.78
13.59 9.64 20.29 50.18 66.20 84.48 19.64
1996 43.54 3.60 31.12
-3.42 32.05 17.00 40.32 10.28 -22.73 12.71
1997 24.13 3.95 -14.37
-14.4
2 -23.93 5.30 21.32-
30.91 7.15 14.421998 20.38 48.62 18.37
58.36 33.64 35.07
-10.74 25.58 16.51 15.22
1999 -17.05 -14.23 -11.49
-23.8
7 -36.72 -43.81-
77.59-
43.01 -30.64 -17.252000 -5.67 58.58 48.34
35.88 11.78 29.45 -1.36 0.96 -13.00 43.00
2001 5.76 -24.18 -25.98
-12.4
4 -12.39 16.15-
11.61 -2.39 -24.63 -7.91
2002 -35.57 -28.08 -27.37
-25.0
7 -14.29 -10.97-
15.20-
37.88 -35.75 -28.632003 -2.36 -2.05 20.42
35.25 23.80 -9.69 27.69
-17.95 -12.70 2.63
2004 -8.39 -24.03 -19.85
-26.5
6 -4.93 -48.67-
19.27-
13.92 -39.85 -8.89Table.3. Illustration of drought severity – IMD (Annual)
Year
PALAKURTHY
KODAKANDLA TORRUR
MARIPEDA
TUNGATURTHY
NOOTHANKAL
ARVAPALLY
ATMAKUR MOTHEY
KUSHUMANCHI
1992 79.4 17.3 -40.7 11.3 63.2 -33.9 -16.4 25.4 -32.6 -73.0
1993 -13.8 -100.0 -42.1 2.1 46.3 97.8 55.8
-23.1 -4.0 -18.9
1994 124.6 15.1 -33.6
-31.3 -28.9 -7.6 -20.3 4.4 -6.0 -16.3
1995 -53.1 -100.0 59.4 60.4 61.4 1.9 76.5
-100.
0 -35.5 29.11996 247.1 1.0 19.5
-34.6 -48.3 -70.0 -32.1 -8.6 -69.6 -4.4
1997 49.3 61.6 14.7
-55.7 -51.3 -30.3 -27.9
-67.1 -31.9 138.6
1998 23.3 275.6 30.3 70.1 -100.0 -100.0
-100.0
-100.
0 -100.0 100.8
1999 -100.0 -100.0 -100.0
-100.
0 -100.0 -100.0-
100.0
-100.
0 -100.0 -100.0
2000 -10.3 145.0 270.6 55.3 -100.0 -43.6 -96.4
-100.
0 -100.0 -20.62001 61.1 12.1 -77.6 -3.9 -12.8 86.8 -22.8 94.2 -87.5 -49.5
2002 -100.0 94.6 -0.1
110.1 -100.0 -100.0 -48.1
-100.
0 -14.4 258.02003 -52.4 -35.4 115.4
-30.8 -20.6 81.4 99.5
-88.7 -59.2 -9.3
2004 77.5 -29.6 -46.8
-26.6 38.4 -93.0 21.1 85.2 -62.3 35.9
Table.4. Illustration of drought severity – IMD (North East
Monsoon)Year
PALAKURTHY
KODAKANDLA TORRUR
MARIPEDA
TUNGATURTHY
NOOTHANKAL
ARVAPALLY
ATMAKUR MOTHEY
KUSHUMANCHI
1992 2.53 -15.05 16.77 1.95 -12.86 -0.86 2.34 0.22 -8.03 13.001993 14.79 21.32 -3.49
11.69 26.87 -6.54 18.08
-2.67 -87.07 7.03
1994 7.64 -5.20 9.66 9.99 10.31 4.03
-28.44
-17.4
2 -2.66 12.091995 13.65 -8.64 -6.73
-7.55 -8.36 -8.97 6.62 1.63 6.66 11.69
1996 30.20 -11.72 33.83
-9.52 22.72 -2.08 8.97
-32.2
3 -52.26 12.09
1997 48.14 -7.99 -0.27 5.34 -11.66 6.87 17.82
-43.9
0 -21.46 7.12
1998 13.00 8.10 11.13
34.50 16.28 4.90
-34.47
-23.2
5 -31.85 1.66
1999 40.83 24.12 50.83
17.70 -4.97 -24.64
-71.48
-39.7
0 -29.71 37.03
2000 -8.51 28.57 39.43
19.18 -2.08 0.07
-26.85
-37.6
9 -48.56 36.42
2001 38.64 -16.14 3.14 6.13 3.54 17.30
-11.64
-26.7
0 -37.47 23.20
2002 6.33 -4.39 17.45 6.60 25.11 16.08 3.42
-36.1
1 -39.15 4.66
2003 9.23 -7.13 31.72
37.57 21.91 -23.46 3.66
-42.5
0 -42.05 11.04
2004 33.06 -0.15 27.67 3.05 24.71 -33.56
-12.52
-30.6
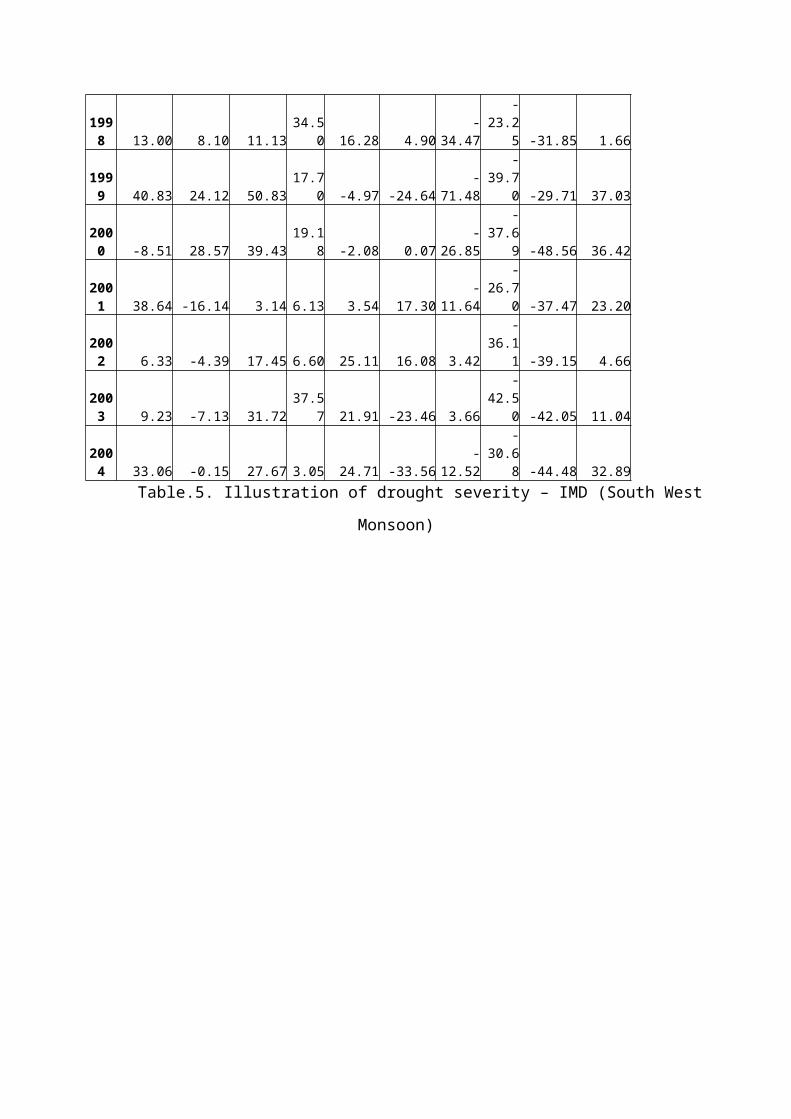
8 -44.48 32.89Table.5. Illustration of drought severity – IMD (South West
Monsoon)
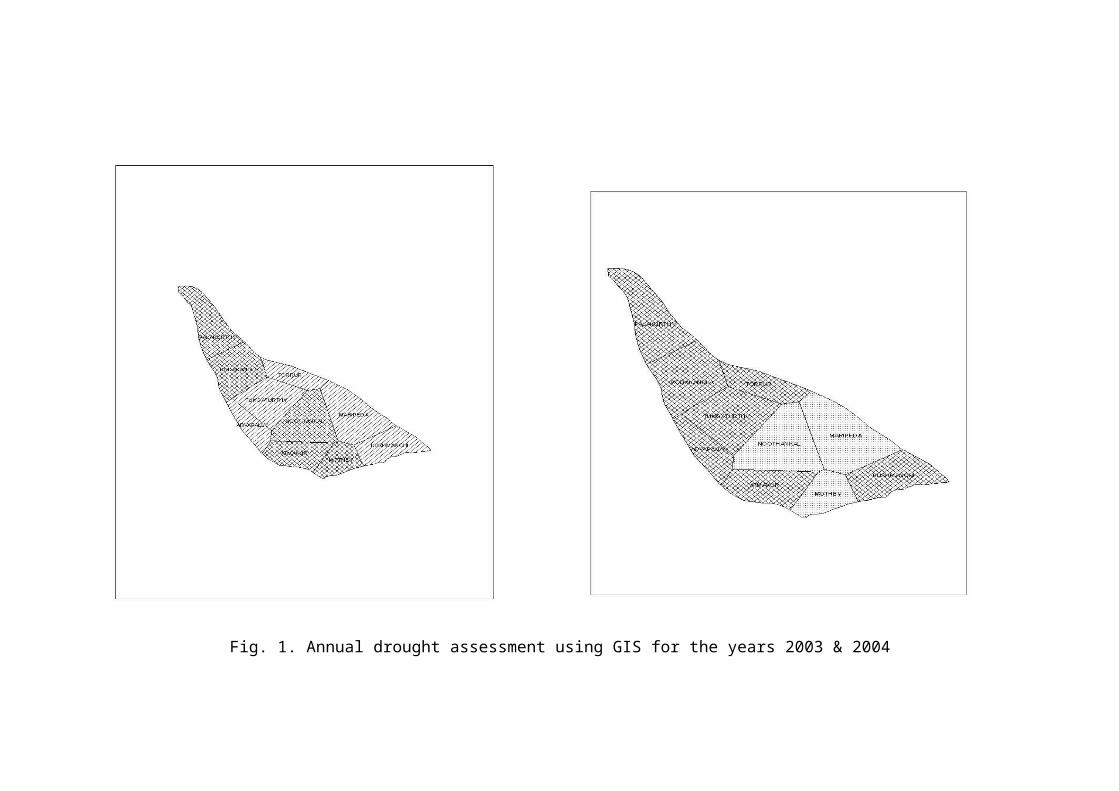
Fig. 1. Annual drought assessment using GIS for the years 2003 & 2004
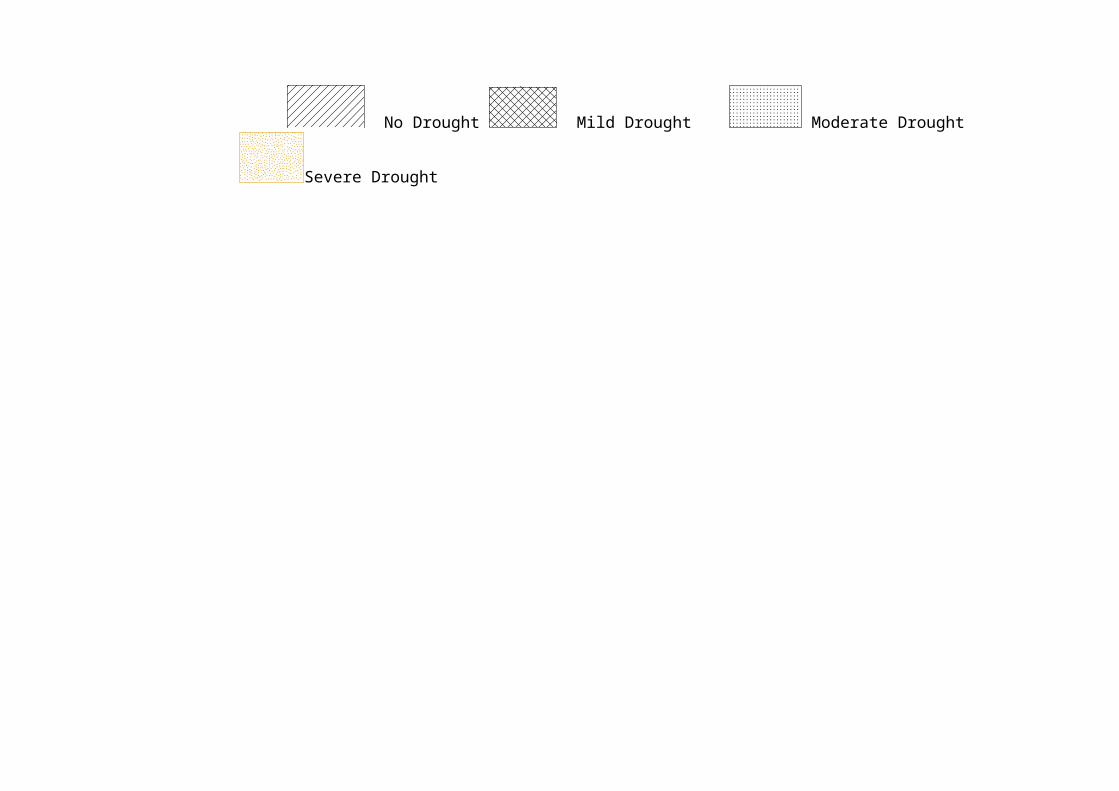
No Drought Mild Drought Moderate Drought
Severe Drought
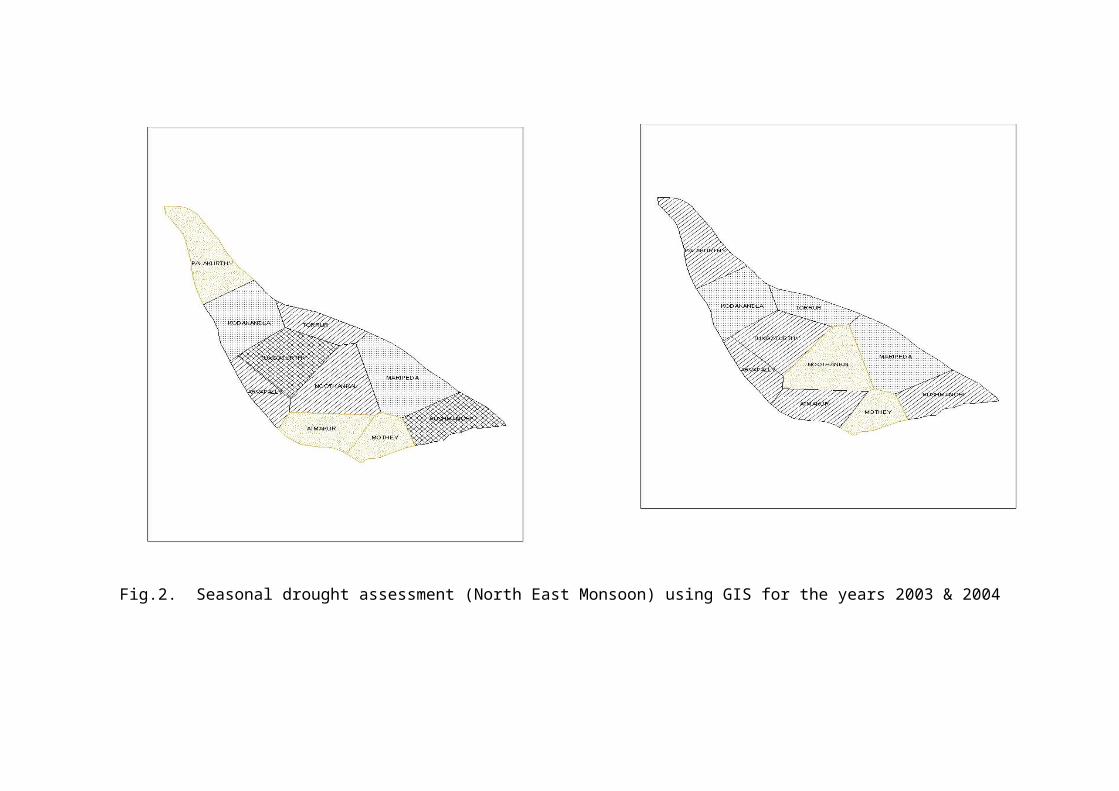
Fig.2. Seasonal drought assessment (North East Monsoon) using GIS for the years 2003 & 2004

No Drought Mild Drought Moderate Drought
Severe Drought
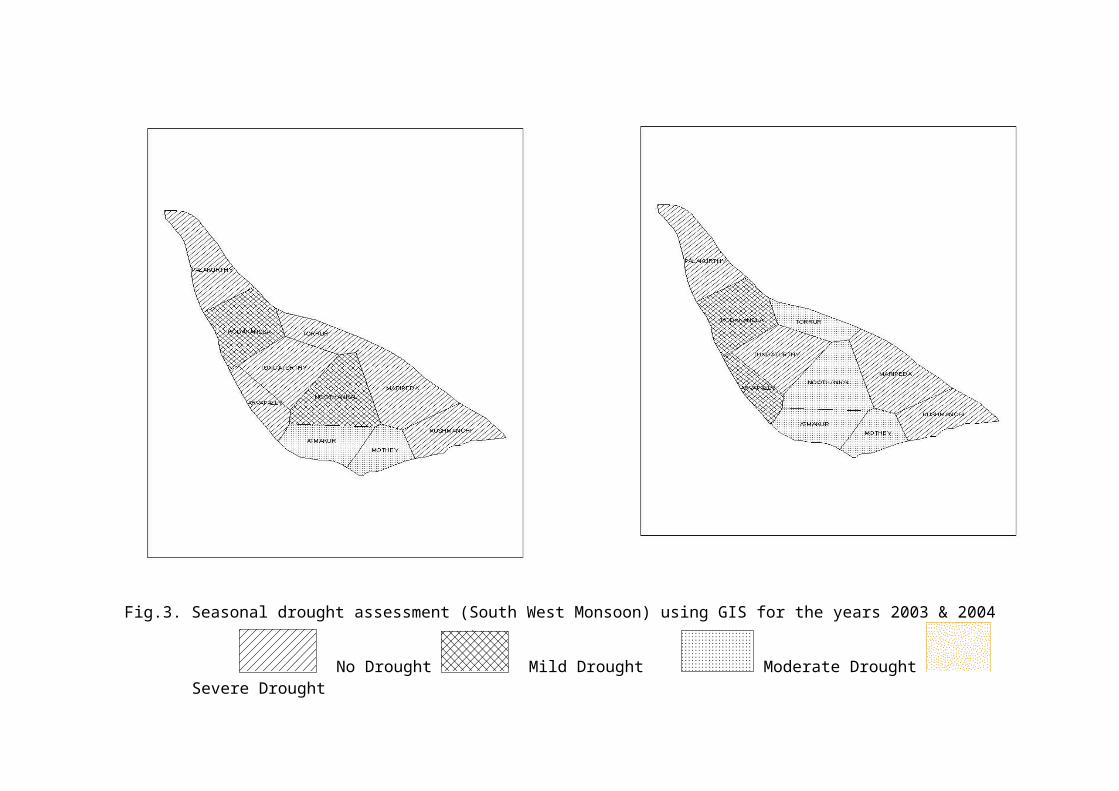
Fig.3. Seasonal drought assessment (South West Monsoon) using GIS for the years 2003 & 2004
No Drought Mild Drought Moderate Drought Severe Drought


