Embed Size (px)
Citation preview
No. 350
LEGISLATIVE ASSEMBLY OF THE NORTHERN TERRITORY
WRITTEN QUESTION
Ms Purick to the Minister for Primary Industry, Fisheries and Resources, in relation to the portfolio areas within the Department of Resources.
Department of Resources
HR Questions:
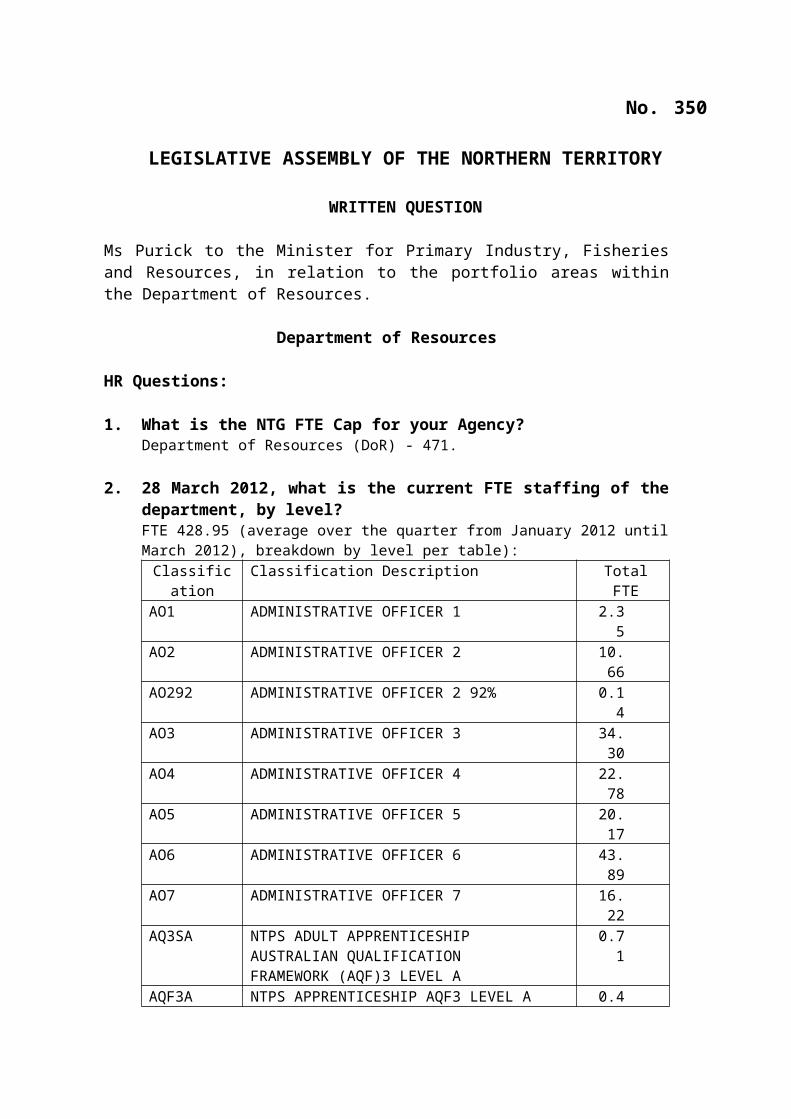
1. What is the NTG FTE Cap for your Agency?Department of Resources (DoR) - 471.
2. 28 March 2012, what is the current FTE staffing of the department, by level?FTE 428.95 (average over the quarter from January 2012 until March 2012), breakdown by level per table):Classification Classification Description Total FTEAO1 ADMINISTRATIVE OFFICER 1 2.35AO2 ADMINISTRATIVE OFFICER 2 10.6
6AO292 ADMINISTRATIVE OFFICER 2 92% 0.14AO3 ADMINISTRATIVE OFFICER 3 34.3
0AO4 ADMINISTRATIVE OFFICER 4 22.7
8AO5 ADMINISTRATIVE OFFICER 5 20.1
7AO6 ADMINISTRATIVE OFFICER 6 43.8
9AO7 ADMINISTRATIVE OFFICER 7 16.2
2AQ3SA NTPS ADULT APPRENTICESHIP
AUSTRALIAN QUALIFICATION FRAMEWORK (AQF)3 LEVEL A
0.71
AQF3A NTPS APPRENTICESHIP AQF3 LEVEL A 0.47AQF4A NTPS APPRENTICESHIP AQF4 LEVEL A 0.14BM BOARD MEMBERS 0.00EO1C EXECUTIVE OFFICER 1 - EXECUTIVE
CONTRACT14.2
1EO2C EXECUTIVE OFFICER 2 - EXECUTIVE
CONTRACT8.86
EO3C EXECUTIVE OFFICER 3 - EXECUTIVE CONTRACT
1.00
EO4C EXECUTIVE OFFICER 4 - EXECUTIVE CONTRACT
2.29
EO6C EXECUTIVE OFFICER 6 - EXECUTIVE CONTRACT
1.29
GRAD GRADUATE TRAINEES 2.79
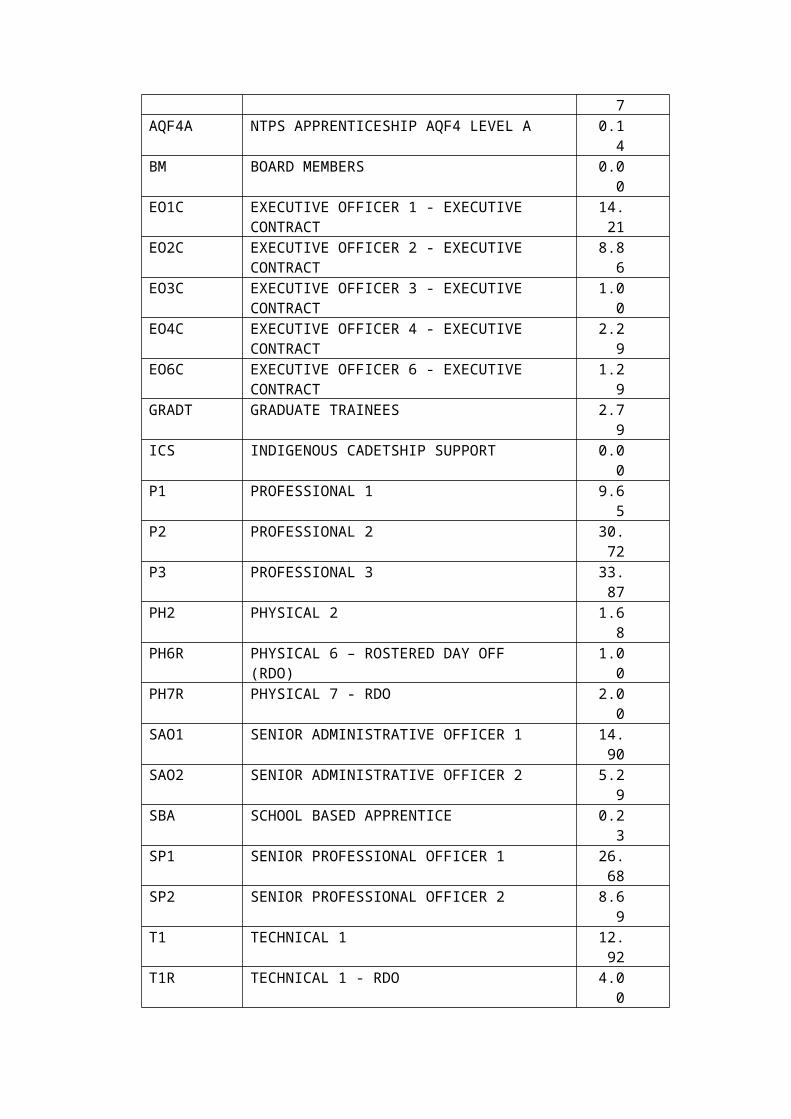
TICS INDIGENOUS CADETSHIP SUPPORT 0.00P1 PROFESSIONAL 1 9.65P2 PROFESSIONAL 2 30.7
2P3 PROFESSIONAL 3 33.8
7PH2 PHYSICAL 2 1.68PH6R PHYSICAL 6 – ROSTERED DAY OFF
(RDO) 1.00
PH7R PHYSICAL 7 - RDO 2.00SAO1 SENIOR ADMINISTRATIVE OFFICER 1 14.9
0SAO2 SENIOR ADMINISTRATIVE OFFICER 2 5.29SBA SCHOOL BASED APPRENTICE 0.23SP1 SENIOR PROFESSIONAL OFFICER 1 26.6
8SP2 SENIOR PROFESSIONAL OFFICER 2 8.69T1 TECHNICAL 1 12.9
2T1R TECHNICAL 1 - RDO 4.00T2 TECHNICAL 2 19.2
4T2R TECHNICAL 2 - RDO 2.29T3 TECHNICAL 3 42.7
6T3R TECHNICAL 3 - RDO 0.86T4 TECHNICAL 4 23.5
8T5 TECHNICAL 5 5.47T5R TECHNICAL 5 - RDO 0.86
3. Is this figure in line with the NTG FTE Cap?At the 28 March 2012 the FTE for DoR is less than the NTG FTE Cap.
4. At Pay day 20, 28 March 2012, how many funded permanent positions are there in your department?433.
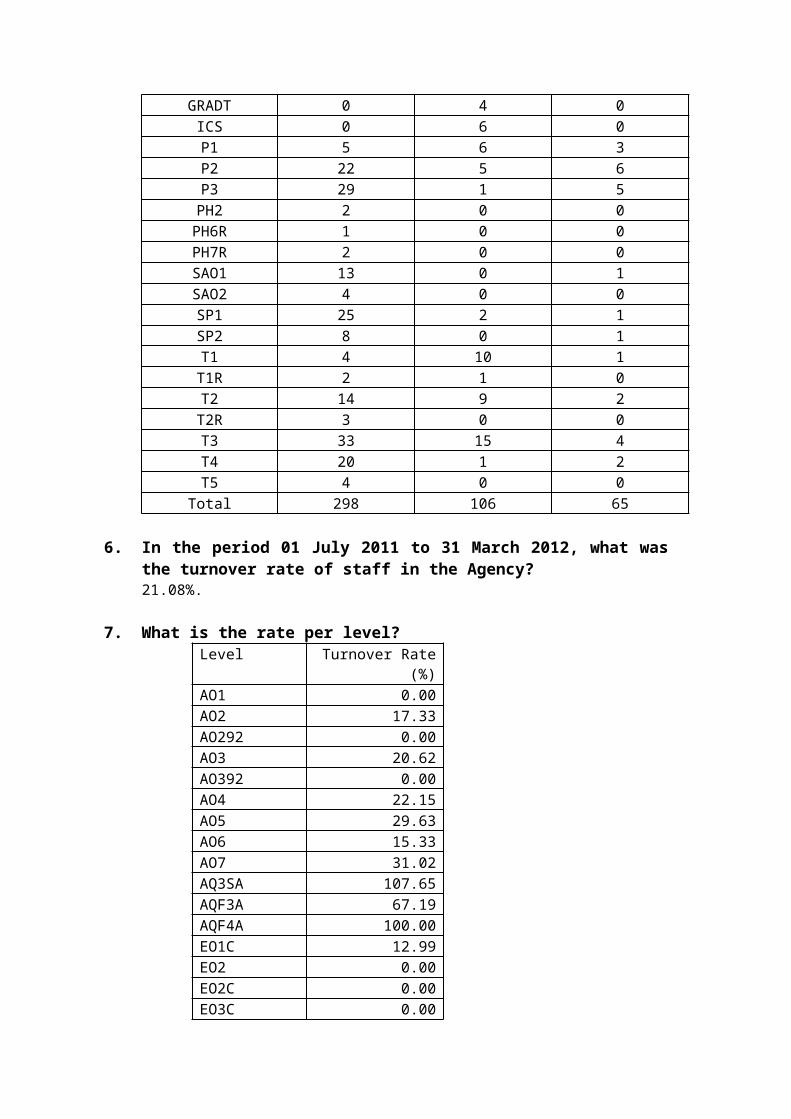
5. At Pay day 20, 28 March 2012, how many of these positions were nominally filled and how many were filled by persons acting in positions or are temporary appointments? Please separate by permanent/temporary/acting by level.Nominally filled – 298; acting – 65; temporary – 106; level breakdown per table:
Level Permanent Temporary ActingAO1 2 1 1AO2 4 7 4AO3 25 2 13AO4 14 1 7AO5 19 1 7AO6 30 3 3AO7 13 2 4
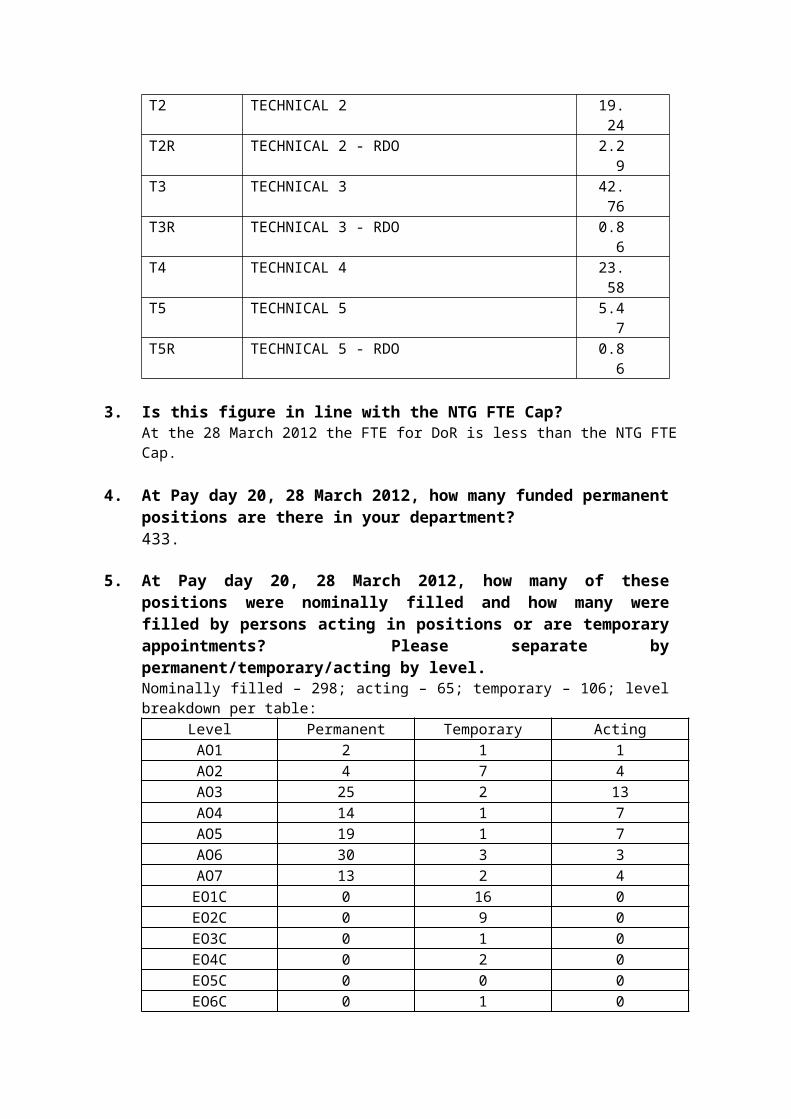
EO1C 0 16 0EO2C 0 9 0EO3C 0 1 0EO4C 0 2 0EO5C 0 0 0EO6C 0 1 0
GRADT 0 4 0ICS 0 6 0P1 5 6 3P2 22 5 6P3 29 1 5
PH2 2 0 0PH6R 1 0 0PH7R 2 0 0SAO1 13 0 1SAO2 4 0 0SP1 25 2 1SP2 8 0 1T1 4 10 1
T1R 2 1 0T2 14 9 2
T2R 3 0 0T3 33 15 4T4 20 1 2T5 4 0 0
Total 298 106 65
6. In the period 01 July 2011 to 31 March 2012, what was the turnover rate of staff in the Agency?21.08%.
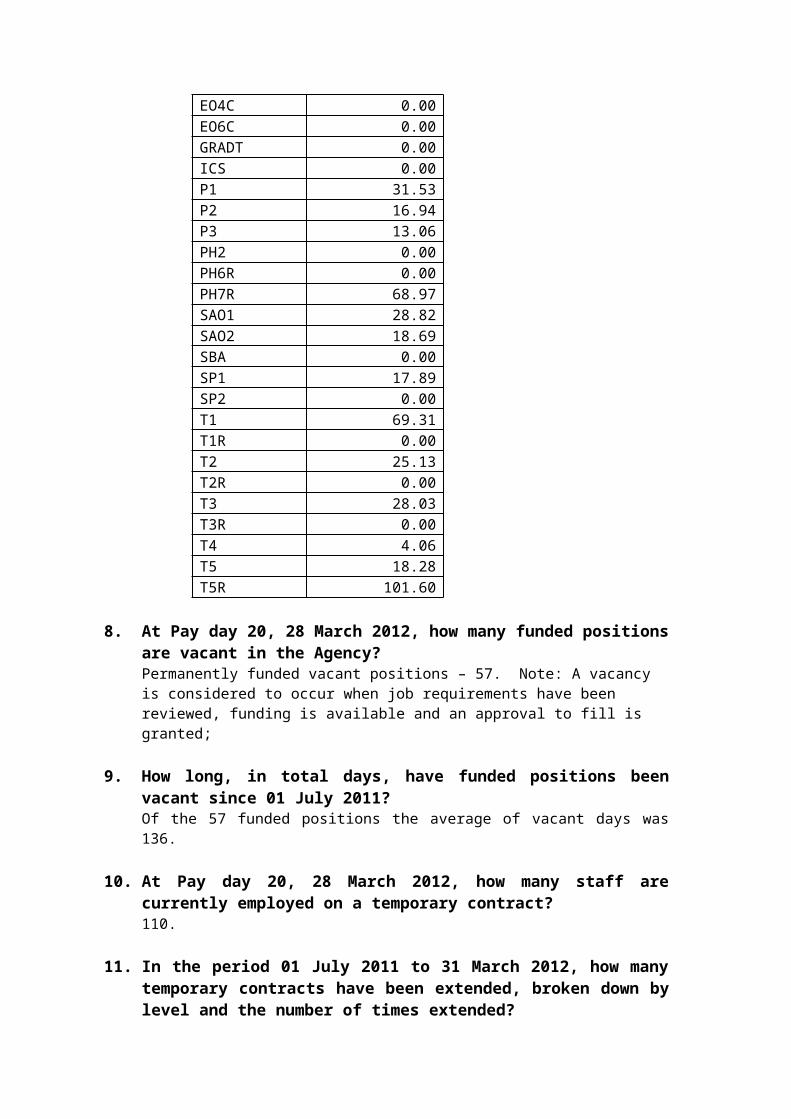
7. What is the rate per level?Level Turnover Rate (%)AO1 0.00AO2 17.33AO292 0.00AO3 20.62AO392 0.00AO4 22.15AO5 29.63AO6 15.33AO7 31.02AQ3SA 107.65AQF3A 67.19AQF4A 100.00EO1C 12.99EO2 0.00EO2C 0.00EO3C 0.00EO4C 0.00EO6C 0.00
GRADT 0.00ICS 0.00P1 31.53P2 16.94P3 13.06PH2 0.00PH6R 0.00PH7R 68.97SAO1 28.82SAO2 18.69SBA 0.00SP1 17.89SP2 0.00T1 69.31T1R 0.00T2 25.13T2R 0.00T3 28.03T3R 0.00T4 4.06T5 18.28T5R 101.60
8. At Pay day 20, 28 March 2012, how many funded positions are vacant in the Agency?Permanently funded vacant positions – 57. Note: A vacancy is considered to occur when job requirements have been reviewed, funding is available and an approval to fill is granted;
9. How long, in total days, have funded positions been vacant since 01 July 2011?Of the 57 funded positions the average of vacant days was 136.
10. At Pay day 20, 28 March 2012, how many staff are currently employed on a temporary contract?110.
11. In the period 01 July 2011 to 31 March 2012, how many temporary contracts have been extended, broken down by level and the number of times extended?
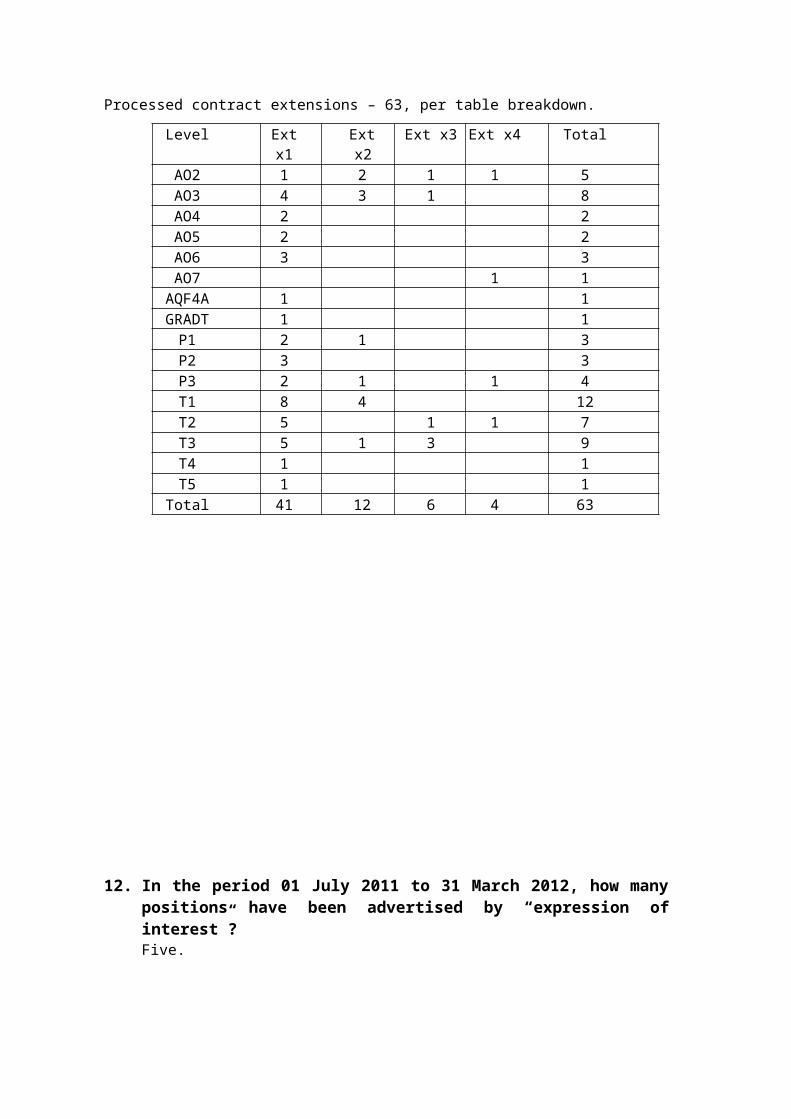
Processed contract extensions – 63, per table breakdown.
12. In the period 01 July 2011 to 31 March 2012, how many positions have been advertised by “expression of interest”?Five.
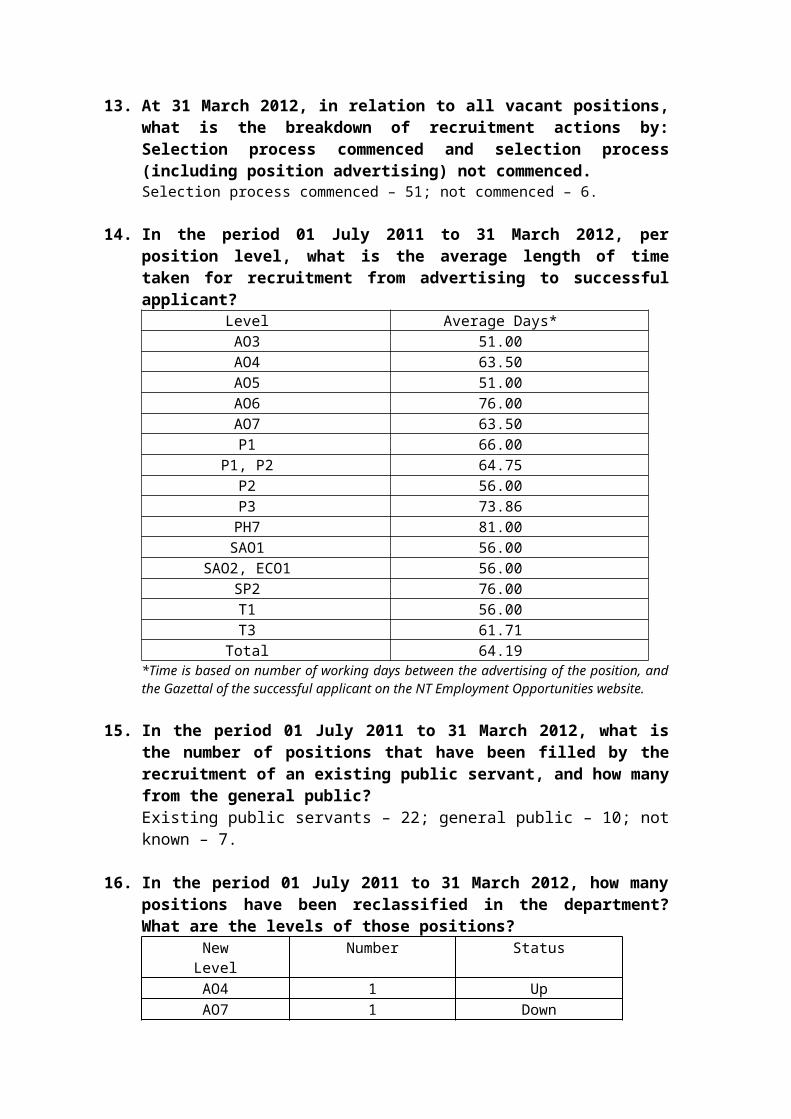
13. At 31 March 2012, in relation to all vacant positions, what is the breakdown of recruitment actions by: Selection process commenced and selection process (including position advertising) not commenced.Selection process commenced – 51; not commenced – 6.
14. In the period 01 July 2011 to 31 March 2012, per position level, what is the average length of time taken for recruitment from advertising to successful applicant?
Level Average Days*AO3 51.00
Level Ext x1 Ext x2 Ext x3 Ext x4 TotalAO2 1 2 1 1 5AO3 4 3 1 8AO4 2 2AO5 2 2AO6 3 3AO7 1 1
AQF4A 1 1GRADT 1 1
P1 2 1 3P2 3 3P3 2 1 1 4T1 8 4 12T2 5 1 1 7T3 5 1 3 9T4 1 1T5 1 1
Total 41 12 6 4 63
AO4 63.50AO5 51.00AO6 76.00AO7 63.50P1 66.00
P1, P2 64.75P2 56.00P3 73.86
PH7 81.00SAO1 56.00
SAO2, ECO1 56.00SP2 76.00T1 56.00T3 61.71
Total 64.19*Time is based on number of working days between the advertising of the position, and the Gazettal of the successful applicant on the NT Employment Opportunities website.
15. In the period 01 July 2011 to 31 March 2012, what is the number of positions that have been filled by the recruitment of an existing public servant, and how many from the general public? Existing public servants – 22; general public – 10; not known – 7.
16. In the period 01 July 2011 to 31 March 2012, how many positions have been reclassified in the department? What are the levels of those positions?
NewLevel
Number Status
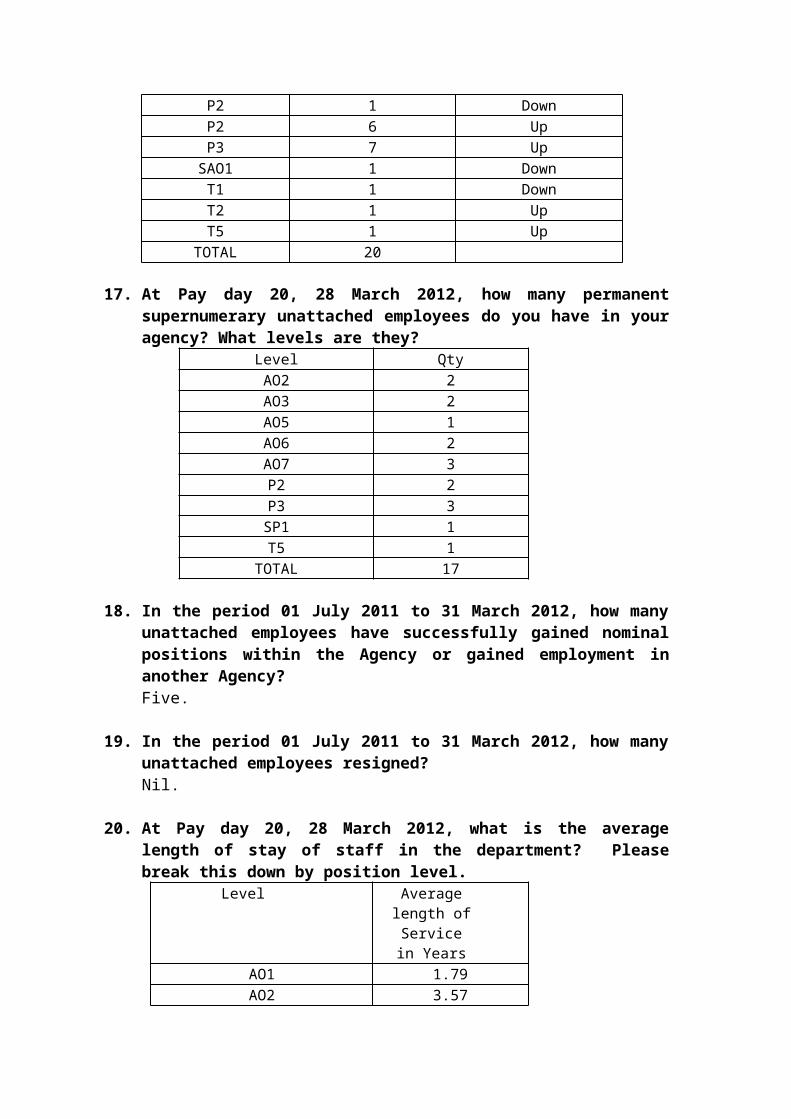
AO4 1 UpAO7 1 DownP2 1 DownP2 6 UpP3 7 Up
SAO1 1 DownT1 1 DownT2 1 UpT5 1 Up
TOTAL 20
17. At Pay day 20, 28 March 2012, how many permanent supernumerary unattached employees do you have in your agency? What levels are they?
Level QtyAO2 2AO3 2AO5 1AO6 2AO7 3P2 2P3 3
SP1 1T5 1
TOTAL 17
18. In the period 01 July 2011 to 31 March 2012, how many unattached employees have successfully gained nominal positions within the Agency or gained employment in another Agency?Five.
19. In the period 01 July 2011 to 31 March 2012, how many unattached employees resigned?Nil.
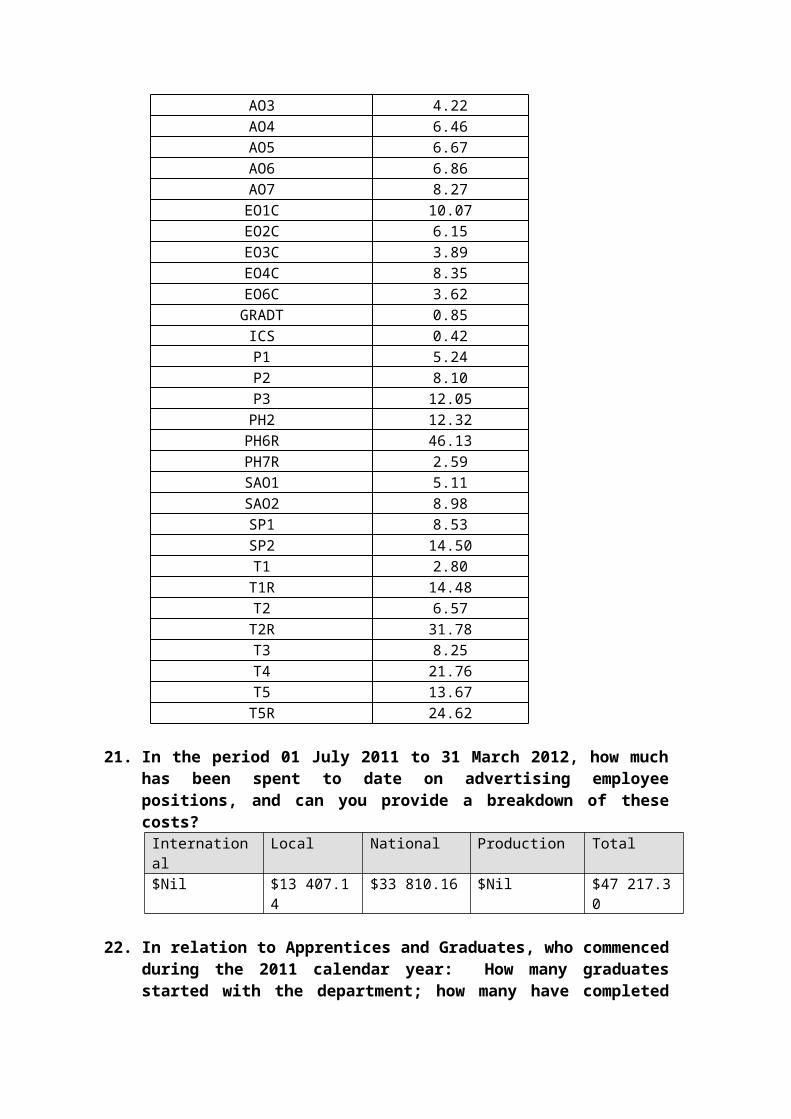
20. At Pay day 20, 28 March 2012, what is the average length of stay of staff in the department? Please break this down by position level.
Level Average length of Servicein Years
AO1 1.79AO2 3.57AO3 4.22AO4 6.46AO5 6.67AO6 6.86AO7 8.27
EO1C 10.07EO2C 6.15EO3C 3.89EO4C 8.35EO6C 3.62
GRADT 0.85ICS 0.42P1 5.24P2 8.10P3 12.05
PH2 12.32PH6R 46.13PH7R 2.59SAO1 5.11SAO2 8.98SP1 8.53SP2 14.50T1 2.80
T1R 14.48T2 6.57
T2R 31.78T3 8.25T4 21.76T5 13.67
T5R 24.62
21. In the period 01 July 2011 to 31 March 2012, how much has been spent to date on advertising employee positions, and can you provide a breakdown of these costs?
International Local National Production Total$Nil $13 407.14 $33 810.16 $Nil $47 217.30
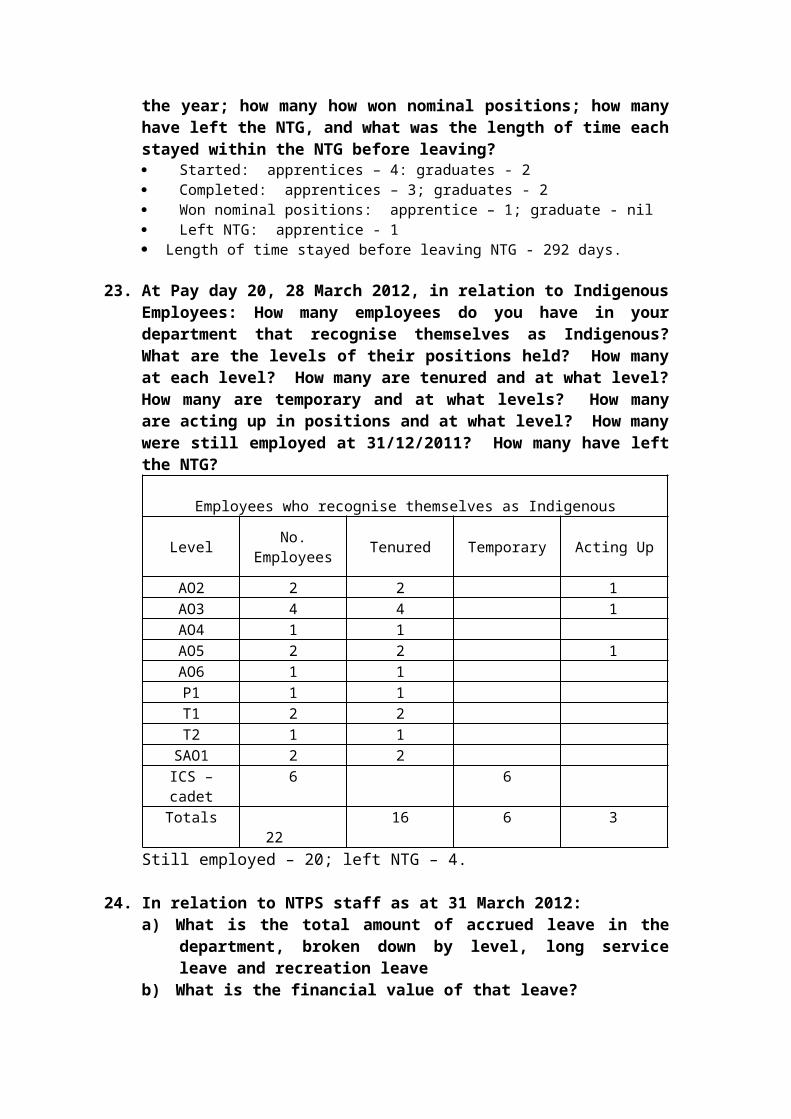
22. In relation to Apprentices and Graduates, who commenced during the 2011 calendar year: How many graduates started with the department; how many have completed the year; how many how won nominal positions; how many have left the NTG, and what was the length of time each stayed within the NTG before leaving? Started: apprentices – 4: graduates - 2 Completed: apprentices – 3; graduates - 2 Won nominal positions: apprentice – 1; graduate - nil Left NTG: apprentice - 1 Length of time stayed before leaving NTG - 292 days.
23. At Pay day 20, 28 March 2012, in relation to Indigenous Employees: How many employees do you have in your department that recognise themselves as Indigenous? What are the levels of their positions held? How many at each level? How many are tenured and at what level? How many are temporary and at what levels? How many are acting up in positions and at what level? How many were still employed at 31/12/2011? How many have left the NTG?
Employees who recognise themselves as Indigenous
Level No. Employees Tenured Temporary Acting Up
AO2 2 2 1AO3 4 4 1AO4 1 1AO5 2 2 1AO6 1 1P1 1 1T1 2 2T2 1 1
SAO1 2 2ICS – cadet 6 6
Totals 22 16 6 3Still employed – 20; left NTG – 4.
24. In relation to NTPS staff as at 31 March 2012:a) What is the total amount of accrued leave in the department,
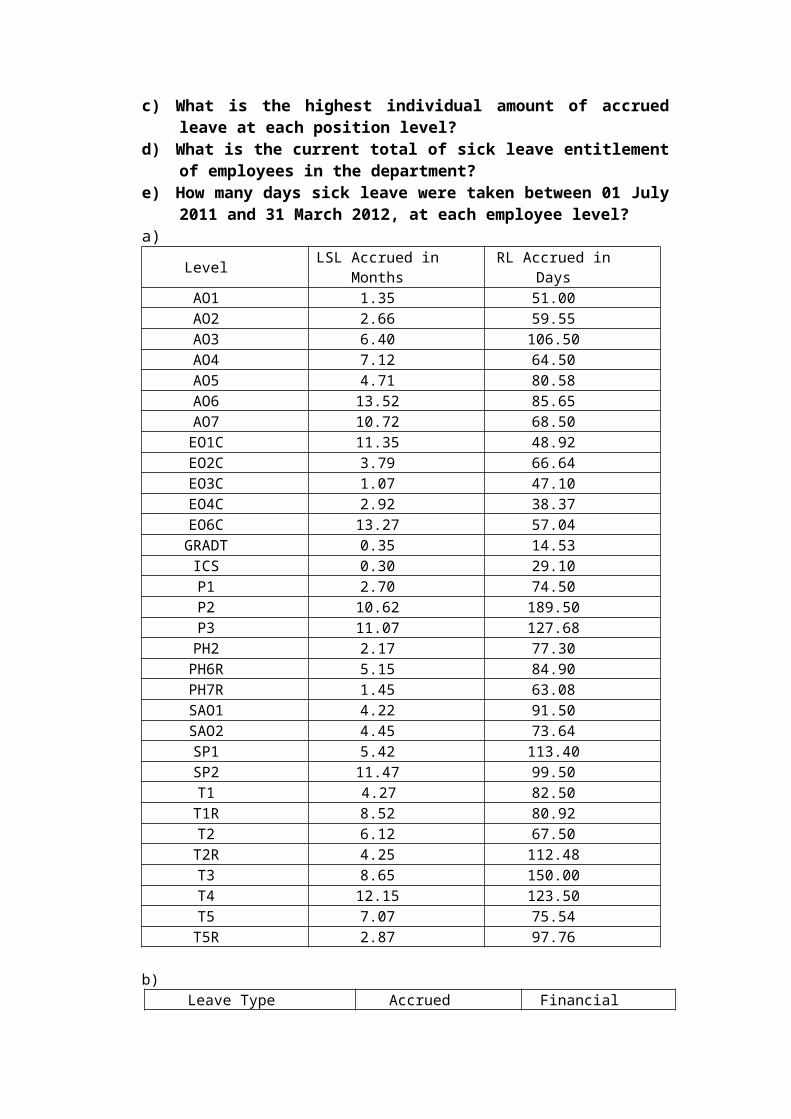
broken down by level, long service leave and recreation leave b) What is the financial value of that leave?c) What is the highest individual amount of accrued leave at each
position level?d) What is the current total of sick leave entitlement of employees
in the department?
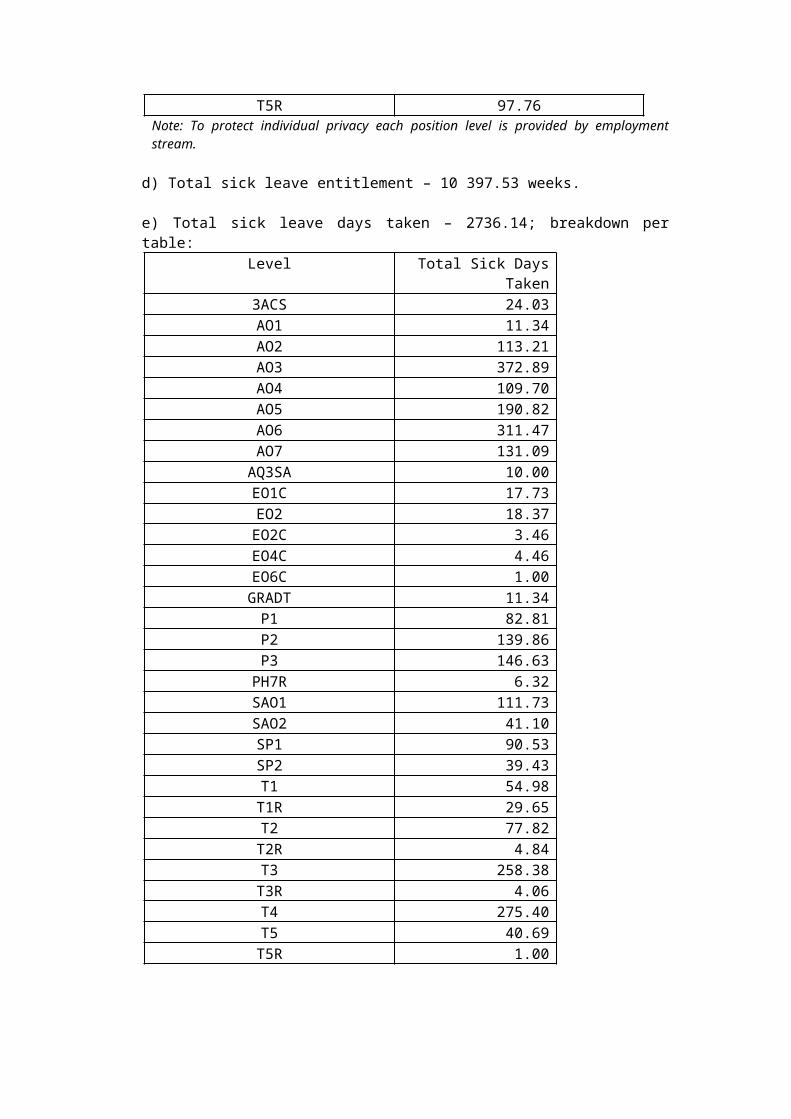
e) How many days sick leave were taken between 01 July 2011 and 31 March 2012, at each employee level?
a)
Level LSL Accrued in Months
RL Accrued inDays
AO1 1.35 51.00AO2 2.66 59.55AO3 6.40 106.50AO4 7.12 64.50AO5 4.71 80.58AO6 13.52 85.65AO7 10.72 68.50
EO1C 11.35 48.92EO2C 3.79 66.64EO3C 1.07 47.10EO4C 2.92 38.37EO6C 13.27 57.04
GRADT 0.35 14.53ICS 0.30 29.10P1 2.70 74.50P2 10.62 189.50P3 11.07 127.68
PH2 2.17 77.30PH6R 5.15 84.90PH7R 1.45 63.08SAO1 4.22 91.50SAO2 4.45 73.64SP1 5.42 113.40SP2 11.47 99.50T1 4.27 82.50
T1R 8.52 80.92T2 6.12 67.50
T2R 4.25 112.48T3 8.65 150.00T4 12.15 123.50T5 7.07 75.54
T5R 2.87 97.76
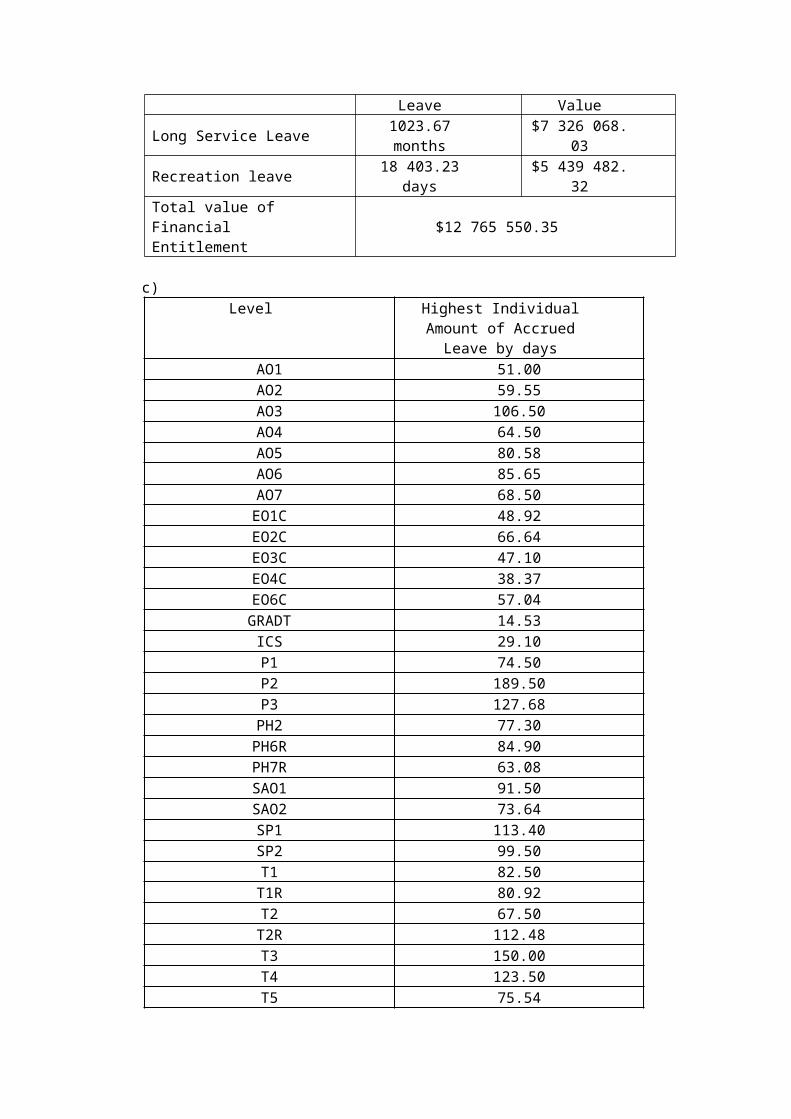
b) Leave Type Accrued Leave Financial Value
Long Service Leave 1023.67 months $7 326 068.03Recreation leave 18 403.23 days $5 439 482.32Total value of Financial Entitlement $12 765 550.35
c) Level Highest Individual Amount of
Accrued Leave by daysAO1 51.00AO2 59.55AO3 106.50AO4 64.50
AO5 80.58AO6 85.65AO7 68.50
EO1C 48.92EO2C 66.64EO3C 47.10EO4C 38.37EO6C 57.04
GRADT 14.53ICS 29.10P1 74.50P2 189.50P3 127.68
PH2 77.30PH6R 84.90PH7R 63.08SAO1 91.50SAO2 73.64SP1 113.40SP2 99.50T1 82.50
T1R 80.92T2 67.50
T2R 112.48T3 150.00T4 123.50T5 75.54
T5R 97.76Note: To protect individual privacy each position level is provided by employment stream.
d) Total sick leave entitlement – 10 397.53 weeks.
e) Total sick leave days taken – 2736.14; breakdown per table:Level Total Sick Days Taken
3ACS 24.03AO1 11.34AO2 113.21AO3 372.89AO4 109.70AO5 190.82AO6 311.47AO7 131.09
AQ3SA 10.00EO1C 17.73EO2 18.37
EO2C 3.46EO4C 4.46EO6C 1.00
GRADT 11.34P1 82.81
P2 139.86P3 146.63
PH7R 6.32SAO1 111.73SAO2 41.10SP1 90.53SP2 39.43T1 54.98
T1R 29.65T2 77.82
T2R 4.84T3 258.38
T3R 4.06T4 275.40T5 40.69
T5R 1.00
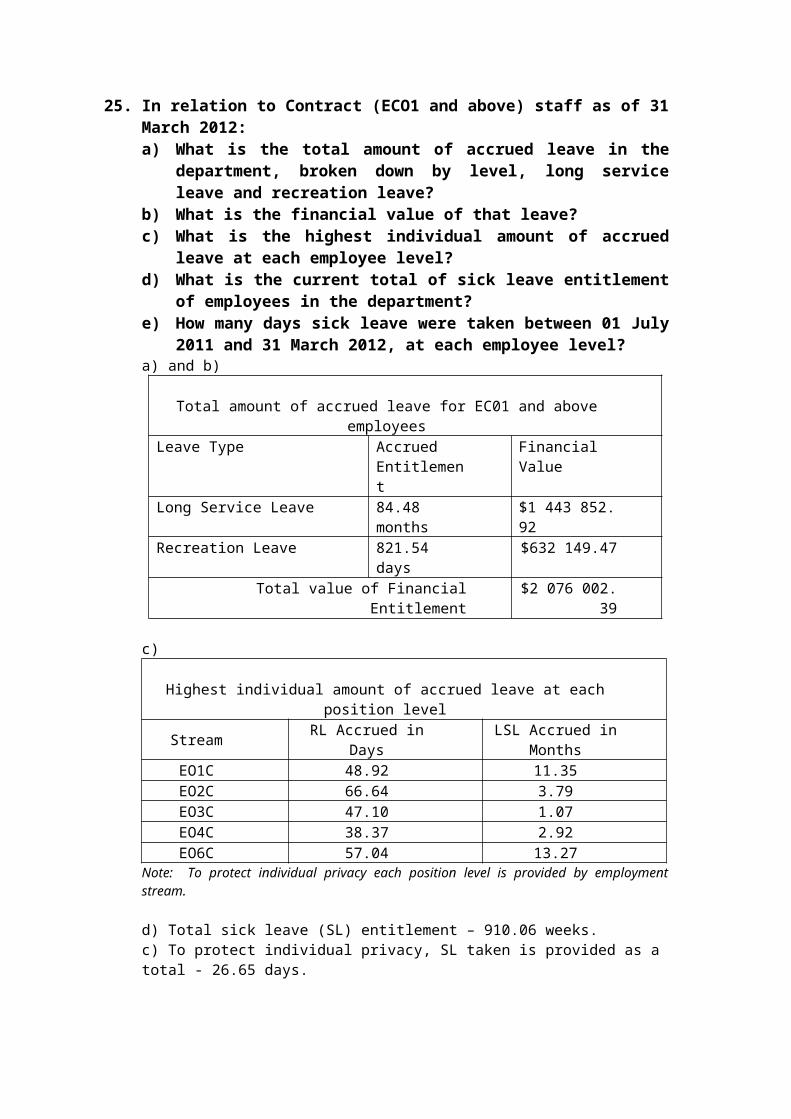
25. In relation to Contract (ECO1 and above) staff as of 31 March 2012:a) What is the total amount of accrued leave in the department,
broken down by level, long service leave and recreation leave? b) What is the financial value of that leave?c) What is the highest individual amount of accrued leave at each
employee level?d) What is the current total of sick leave entitlement of employees
in the department?e) How many days sick leave were taken between 01 July 2011 and
31 March 2012, at each employee level?a) and b)
Total amount of accrued leave for EC01 and above employeesLeave Type Accrued
EntitlementFinancial Value
Long Service Leave 84.48 months $1 443 852.92Recreation Leave 821.54 days $632 149.47
Total value of Financial Entitlement $2 076 002.39
c)
Highest individual amount of accrued leave at each position level
Stream RL Accrued in Days LSL Accrued in Months
EO1C 48.92 11.35EO2C 66.64 3.79EO3C 47.10 1.07EO4C 38.37 2.92EO6C 57.04 13.27
Note: To protect individual privacy each position level is provided by employment stream.
d) Total sick leave (SL) entitlement – 910.06 weeks.c) To protect individual privacy, SL taken is provided as a total - 26.65 days.
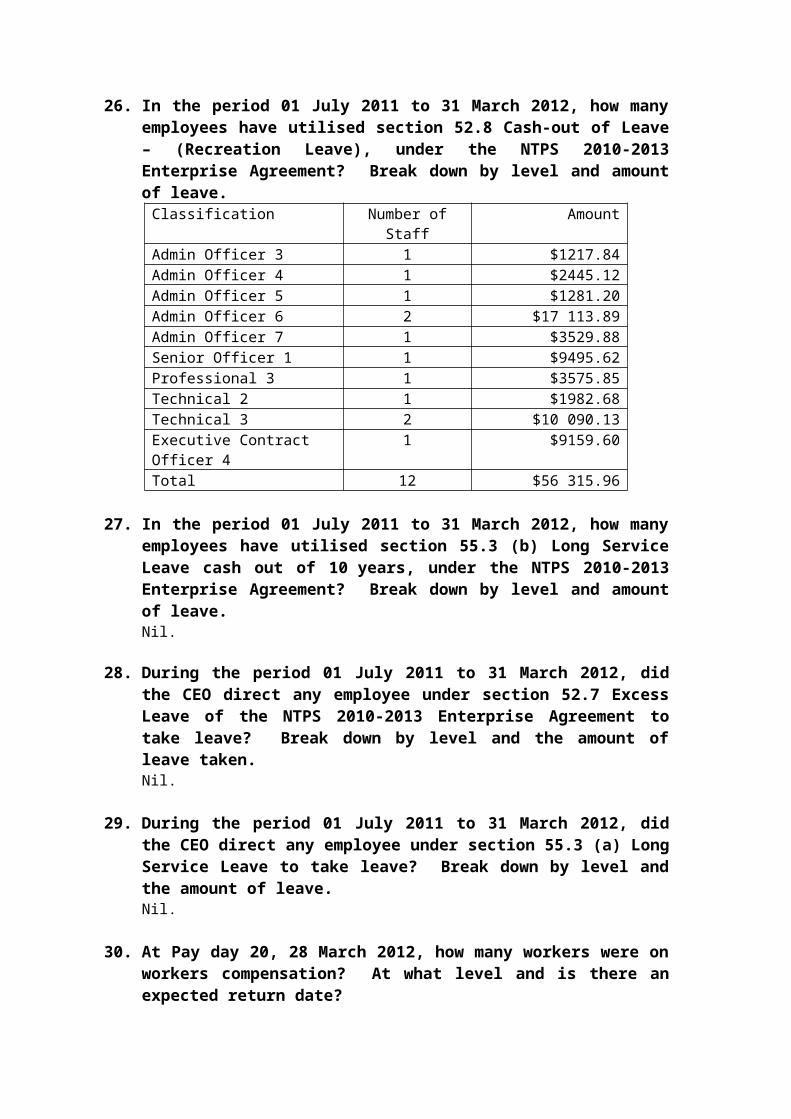
26. In the period 01 July 2011 to 31 March 2012, how many employees have utilised section 52.8 Cash-out of Leave – (Recreation Leave), under the NTPS 2010-2013 Enterprise Agreement? Break down by level and amount of leave.
Classification Number of Staff AmountAdmin Officer 3 1 $1217.84Admin Officer 4 1 $2445.12Admin Officer 5 1 $1281.20Admin Officer 6 2 $17 113.89Admin Officer 7 1 $3529.88Senior Officer 1 1 $9495.62Professional 3 1 $3575.85Technical 2 1 $1982.68Technical 3 2 $10 090.13Executive Contract Officer 4 1 $9159.60Total 12 $56 315.96
27. In the period 01 July 2011 to 31 March 2012, how many employees have utilised section 55.3 (b) Long Service Leave cash out of 10 years, under the NTPS 2010-2013 Enterprise Agreement? Break down by level and amount of leave.Nil.
28. During the period 01 July 2011 to 31 March 2012, did the CEO direct any employee under section 52.7 Excess Leave of the NTPS 2010-2013 Enterprise Agreement to take leave? Break down by level and the amount of leave taken.Nil.
29. During the period 01 July 2011 to 31 March 2012, did the CEO direct any employee under section 55.3 (a) Long Service Leave to take leave? Break down by level and the amount of leave.Nil.
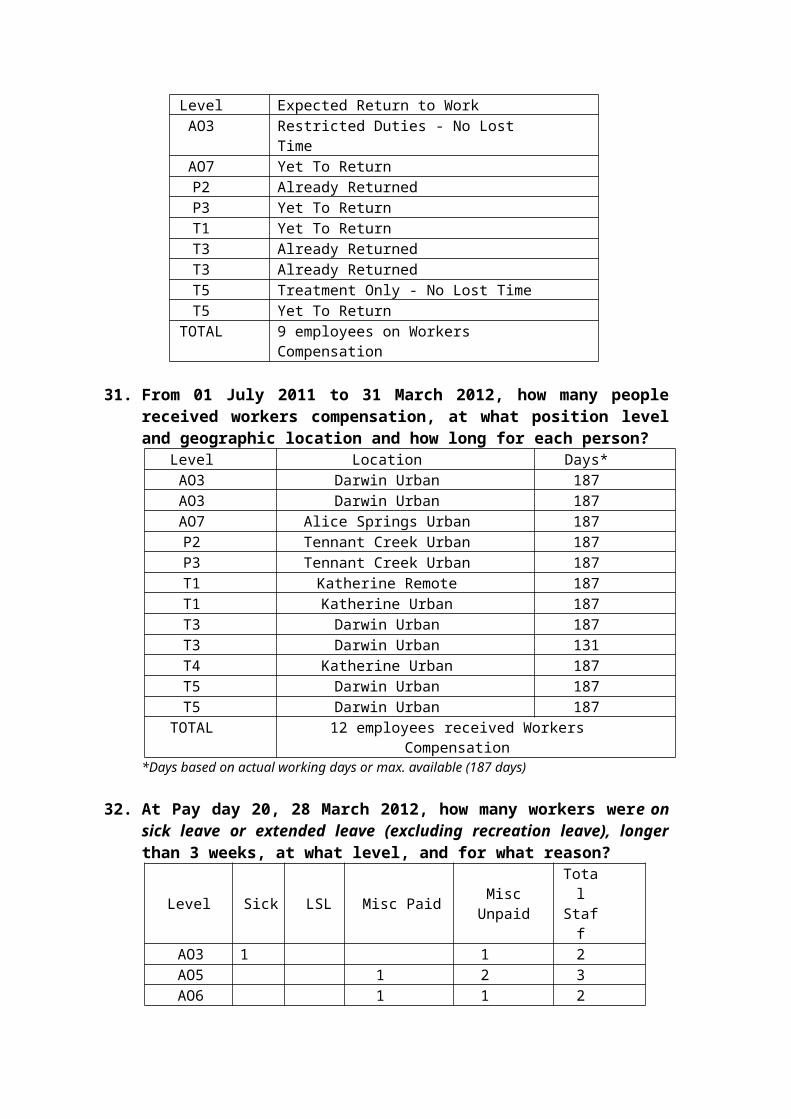
30. At Pay day 20, 28 March 2012, how many workers were on workers compensation? At what level and is there an expected return date?
Level Expected Return to WorkAO3 Restricted Duties - No Lost TimeAO7 Yet To ReturnP2 Already ReturnedP3 Yet To ReturnT1 Yet To ReturnT3 Already ReturnedT3 Already ReturnedT5 Treatment Only - No Lost TimeT5 Yet To Return
TOTAL 9 employees on Workers Compensation
31. From 01 July 2011 to 31 March 2012, how many people received workers compensation, at what position level and geographic location and how long for each person?
Level Location Days*AO3 Darwin Urban 187AO3 Darwin Urban 187AO7 Alice Springs Urban 187P2 Tennant Creek Urban 187P3 Tennant Creek Urban 187T1 Katherine Remote 187T1 Katherine Urban 187T3 Darwin Urban 187T3 Darwin Urban 131T4 Katherine Urban 187T5 Darwin Urban 187T5 Darwin Urban 187
TOTAL 12 employees received Workers Compensation*Days based on actual working days or max. available (187 days)
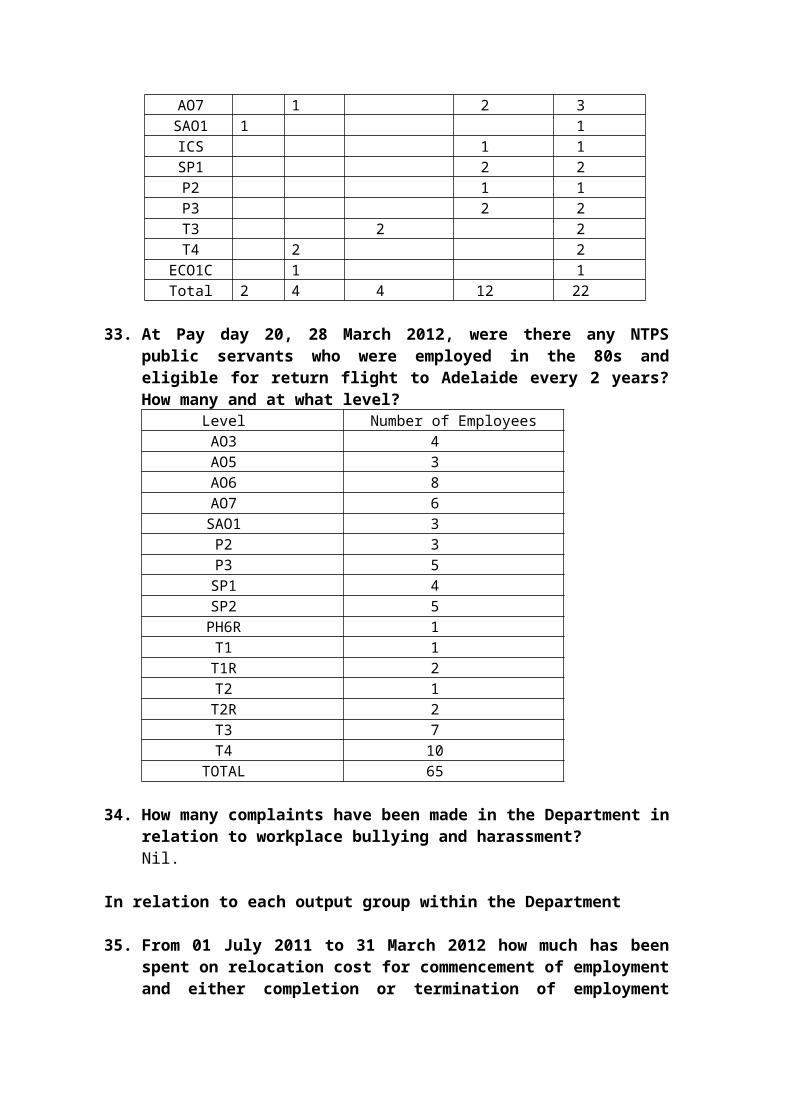
32. At Pay day 20, 28 March 2012, how many workers were on sick leave or extended leave (excluding recreation leave), longer than 3 weeks, at what level, and for what reason?
Level Sick LSL Misc Paid Misc Unpaid Total Staff
AO3 1 1 2AO5 1 2 3AO6 1 1 2AO7 1 2 3
SAO1 1 1ICS 1 1SP1 2 2P2 1 1P3 2 2T3 2 2T4 2 2
ECO1C 1 1Total 2 4 4 12 22
33. At Pay day 20, 28 March 2012, were there any NTPS public servants who were employed in the 80s and eligible for return flight to Adelaide every 2 years? How many and at what level?
Level Number of EmployeesAO3 4AO5 3AO6 8AO7 6
SAO1 3P2 3P3 5
SP1 4SP2 5
PH6R 1T1 1
T1R 2T2 1
T2R 2T3 7T4 10
TOTAL 65
34. How many complaints have been made in the Department in relation to workplace bullying and harassment?Nil.
In relation to each output group within the Department
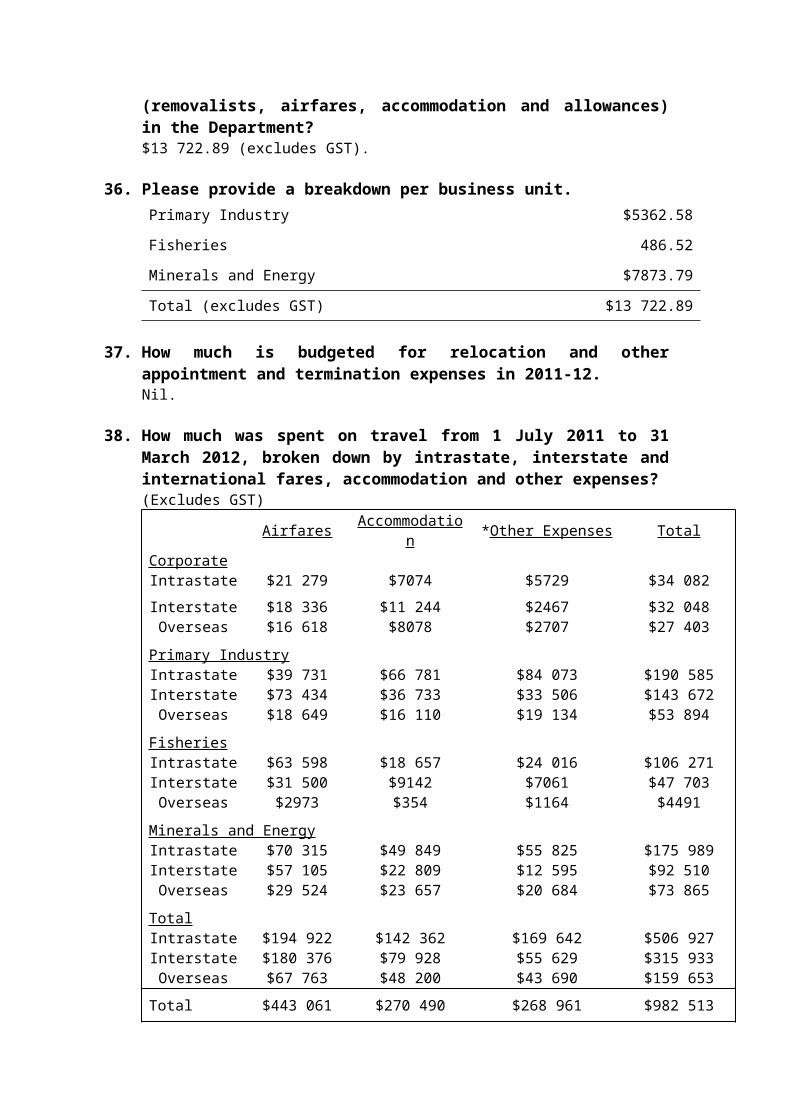
35. From 01 July 2011 to 31 March 2012 how much has been spent on relocation cost for commencement of employment and either completion or termination of employment (removalists, airfares, accommodation and allowances) in the Department?$13 722.89 (excludes GST).
36. Please provide a breakdown per business unit.Primary Industry $5362.58
Fisheries 486.52
Minerals and Energy $7873.79
Total (excludes GST) $13 722.89
37. How much is budgeted for relocation and other appointment and termination expenses in 2011-12.Nil.
38. How much was spent on travel from 1 July 2011 to 31 March 2012, broken down by intrastate, interstate and international fares, accommodation and other expenses?(Excludes GST)
Airfares Accommodation *Other Expenses Total
CorporateIntrastate $21 279 $7074 $5729 $34 082
Interstate $18 336 $11 244 $2467 $32 048Overseas $16 618 $8078 $2707 $27 403
Primary IndustryIntrastate $39 731 $66 781 $84 073 $190 585Interstate $73 434 $36 733 $33 506 $143 672Overseas $18 649 $16 110 $19 134 $53 894
FisheriesIntrastate $63 598 $18 657 $24 016 $106 271Interstate $31 500 $9142 $7061 $47 703Overseas $2973 $354 $1164 $4491
Minerals and Energy
Intrastate $70 315 $49 849 $55 825 $175 989Interstate $57 105 $22 809 $12 595 $92 510Overseas $29 524 $23 657 $20 684 $73 865
TotalIntrastate $194 922 $142 362 $169 642 $506 927Interstate $180 376 $79 928 $55 629 $315 933Overseas $67 763 $48 200 $43 690 $159 653
Total Travel $443 061 $270 490 $268 961 $982 513
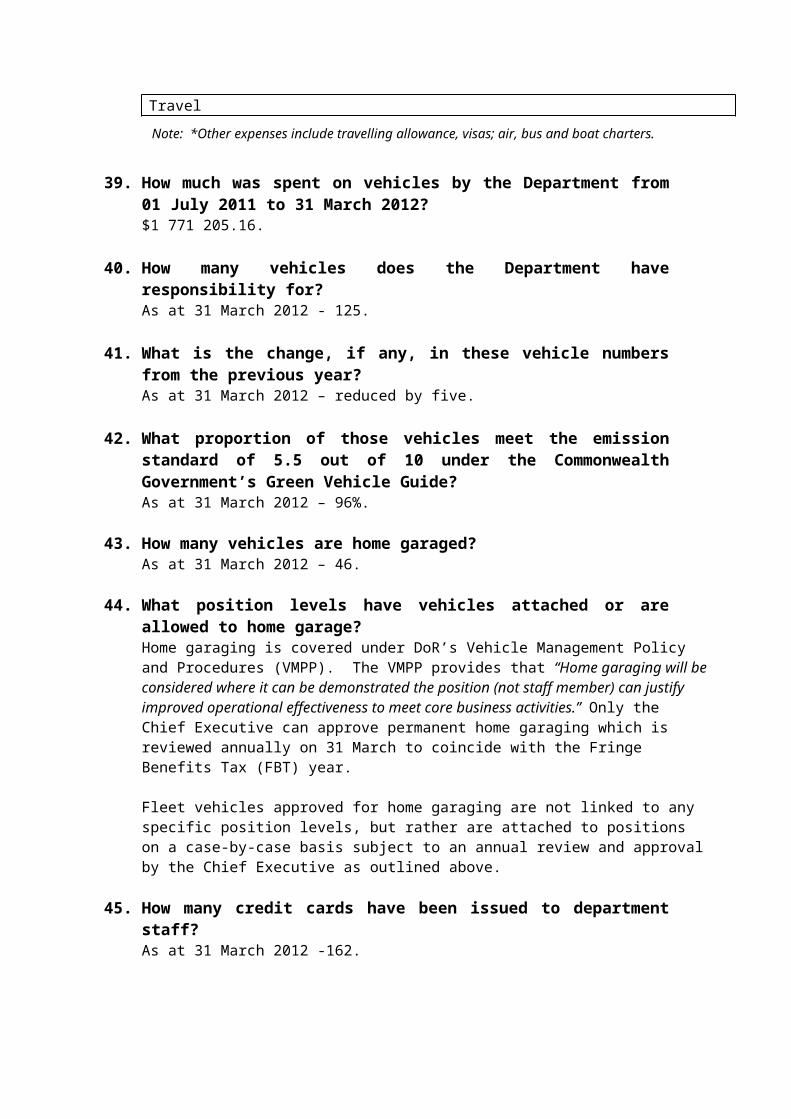
Note: *Other expenses include travelling allowance, visas; air, bus and boat charters.
39. How much was spent on vehicles by the Department from 01 July 2011 to 31 March 2012?$1 771 205.16.
40. How many vehicles does the Department have responsibility for?As at 31 March 2012 - 125.
41. What is the change, if any, in these vehicle numbers from the previous year?As at 31 March 2012 – reduced by five.
42. What proportion of those vehicles meet the emission standard of 5.5 out of 10 under the Commonwealth Government’s Green Vehicle Guide?As at 31 March 2012 – 96%.
43. How many vehicles are home garaged?As at 31 March 2012 – 46.
44. What position levels have vehicles attached or are allowed to home garage?Home garaging is covered under DoR’s Vehicle Management Policy and Procedures (VMPP). The VMPP provides that “Home garaging will be considered where it can be demonstrated the position (not staff member) can justify improved operational effectiveness to meet core business activities.” Only the Chief Executive can approve permanent home garaging which is reviewed annually on 31 March to coincide with the Fringe Benefits Tax (FBT) year.
Fleet vehicles approved for home garaging are not linked to any specific position levels, but rather are attached to positions on a case-by-case basis subject to an annual review and approval by the Chief Executive as outlined above.
45. How many credit cards have been issued to department staff?As at 31 March 2012 -162.
46. How many repayment transactions (and the value) for personal items and services are outstanding?As at 31 March 2012 – nil.
47.How many reports of the improper use of Information Technology have been made?Nil.
48.How many reports resulted in formal disciplinary action?N/A.
49.How many staff are considered ‘Essential’ in your Agency, for the purpose of an Emergency eg. Cyclone.
DoR’s Management Board has considered the issue of designating Key Government Employees for the purposes of emergency situations and has determined that it should be left to management to judge on a case-by-case basis. The critical requirement for the agency is that senior management personnel should remain contactable wherever possible and available to undertake duties if required.
DoR has internal procedures in place to respond to cyclones and there are staff identified with particular responsibilities. Subject to the nature and scope of a particular emergency event, additional staff may be assigned with specific duties to assist in whole of government or internal coordination activities.
Marketing:
50. From 1 July 2011 to 31 March 2012, how much was spent by the Department on advertising and marketing programs?Refer to Answer 51 below.
51. What was each of those programs and what was the cost of each of those programs?All amounts include GST.
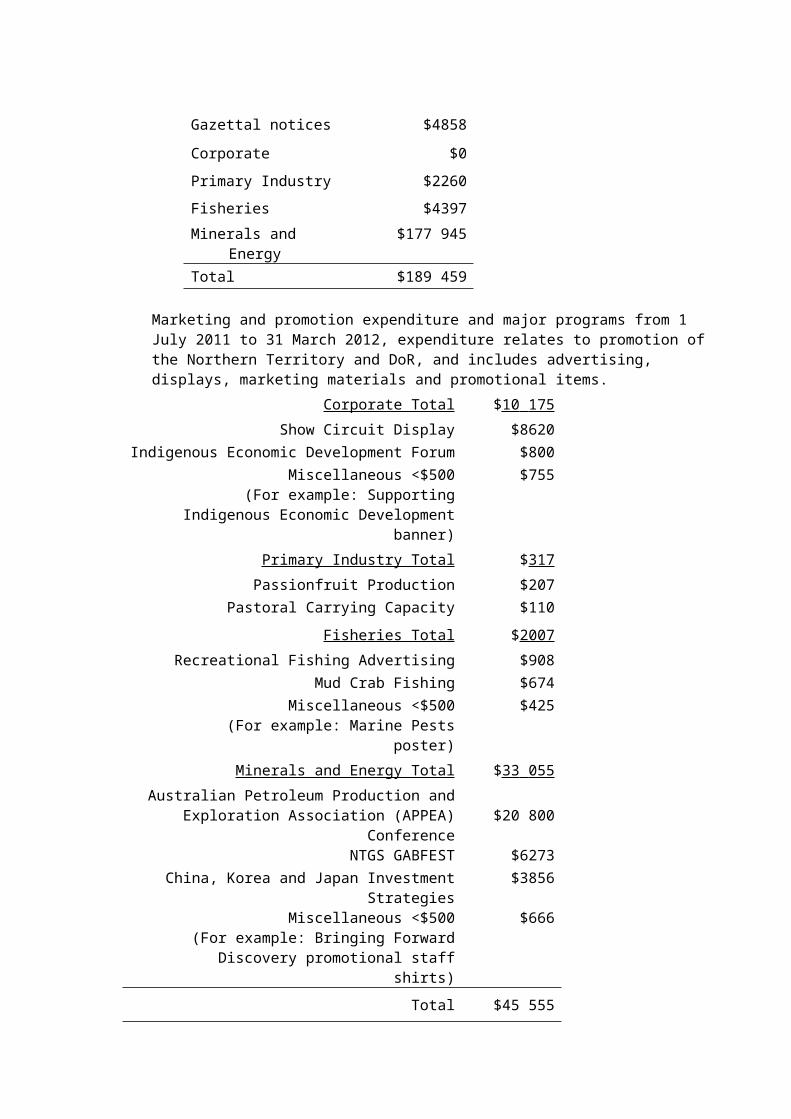
Public notification advertising expenditure from 1 July 2011 to 31 March 2012, related mainly to the Earth Sciences Scholarship, Recreational Fishing Possession Limits; Mining, Petroleum and Native Title statutory obligations; and Gazettal notices.
Gazettal notices $4858
Corporate $0
Primary Industry $2260
Fisheries $4397
Minerals and Energy $177 945
Total $189 459
Marketing and promotion expenditure and major programs from 1 July 2011 to 31 March 2012, expenditure relates to promotion of the Northern Territory and DoR, and includes advertising, displays, marketing materials and promotional items.
Corporate Total $10 175
Show Circuit Display $8620Indigenous Economic Development Forum $800
Miscellaneous <$500(For example: Supporting Indigenous
Economic Development banner)
$755
Primary Industry Total $317
Passionfruit Production $207Pastoral Carrying Capacity $110
Fisheries Total $2007
Recreational Fishing Advertising $908Mud Crab Fishing $674
Miscellaneous <$500(For example: Marine Pests poster)
$425
Minerals and Energy Total $33 055
Australian Petroleum Production and Exploration Association (APPEA) Conference $20 800
NTGS GABFEST $6273China, Korea and Japan Investment Strategies $3856
Miscellaneous <$500(For example: Bringing Forward Discovery
promotional staff shirts)
$666
Total $45 555
Insurance:
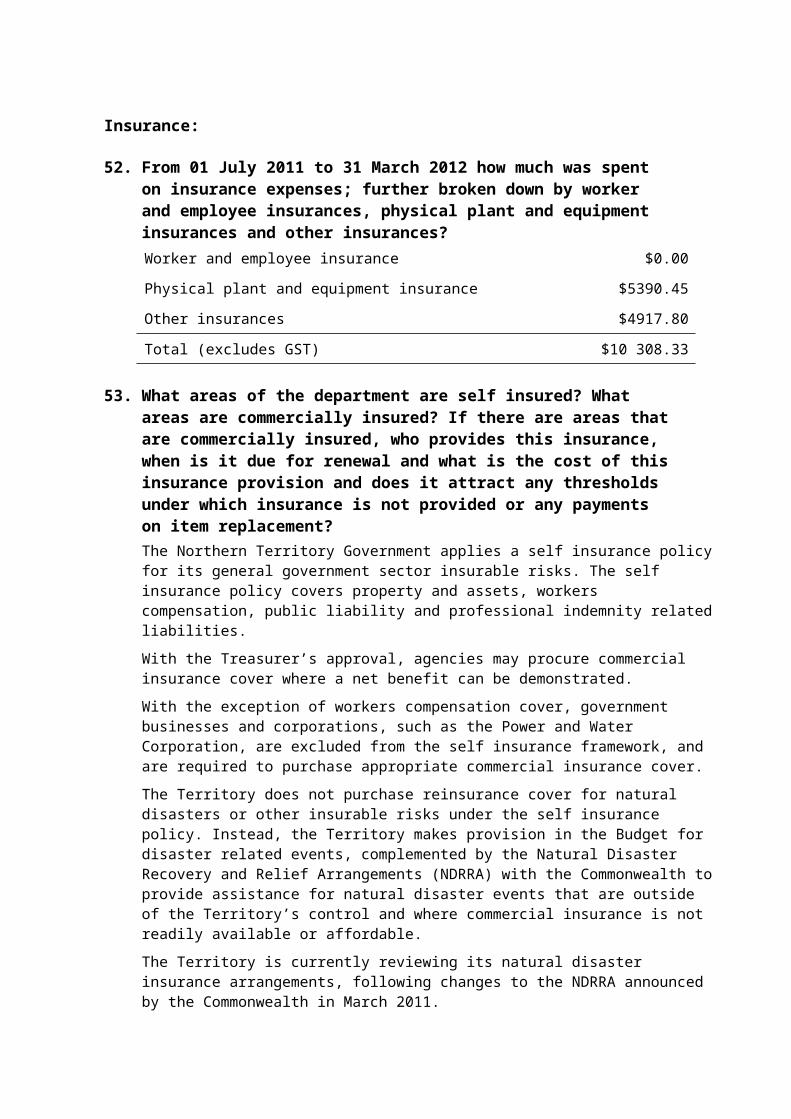
52. From 01 July 2011 to 31 March 2012 how much was spent on insurance expenses; further broken down by worker and employee insurances, physical plant and equipment insurances and other insurances?Worker and employee insurance $0.00
Physical plant and equipment insurance $5390.45
Other insurances $4917.80
Total (excludes GST) $10 308.33
53. What areas of the department are self insured? What areas are commercially insured? If there are areas that are commercially insured, who provides this insurance, when is it due for renewal and what is the cost of this insurance provision and does it attract any thresholds under which insurance is not provided or any payments on item replacement? The Northern Territory Government applies a self insurance policy for its general government sector insurable risks. The self insurance policy covers property and assets, workers compensation, public liability and professional indemnity related liabilities.
With the Treasurer’s approval, agencies may procure commercial insurance cover where a net benefit can be demonstrated.
With the exception of workers compensation cover, government businesses and corporations, such as the Power and Water Corporation, are excluded from the self insurance framework, and are required to purchase appropriate commercial insurance cover.
The Territory does not purchase reinsurance cover for natural disasters or other insurable risks under the self insurance policy. Instead, the Territory makes provision in the Budget for disaster related events, complemented by the Natural Disaster Recovery and Relief Arrangements (NDRRA) with the Commonwealth to provide assistance for natural disaster events that are outside of the Territory’s control and where commercial insurance is not readily available or affordable.
The Territory is currently reviewing its natural disaster insurance arrangements, following changes to the NDRRA announced by the Commonwealth in March 2011.
Any whole of government insurance policy related questions should be referred to the Treasurer.
54. What provision has been made for disaster or catastrophe insurance?Treasurer’s Advance is available to agencies in the event disaster costs exceed budget during the year.
The Territory does not purchase reinsurance cover for natural disasters or other insurable risks under the self insurance policy. Instead, the Territory makes provision in the Budget for disaster related events, complemented by the Natural Disaster Recovery and Relief Arrangements (NDRRA) with the Commonwealth to provide assistance for natural disaster events that are outside of the Territory’s control and where commercial insurance is not readily available or affordable.
Any whole of government insurance policy related questions should be referred to the Treasurer.
Climate change:
55. From 01 July 2011 to 31 March 2012, how many tonnes of CO2 did the department emit?Emissions from NT Fleet vehicles leased by DoR in the 9 months from 1 July 2011 to 31 March 2012 was 552 tonnes of greenhouse gas.
As required under the NTG Energy Smart Buildings Policy, energy consumption and CO2 emission data is collated at the end of each financial year. In the financial year 2010-11, the agency emitted 3681 tonnes of building greenhouse gas, down from 4103 in the 2009-10 financial year.
56. From 1 July 2011 to 31 March 2012, what programs and strategies were introduced to reduce CO2 emissions across the department?DoR initiated a number of strategies to reduce its carbon emissions during 2011-12,
including:
1. Conditions negotiated for the lease renewal of the Centrepoint tenancy requires the lessor to:a) Install a new air-conditioning system with zoned control capabilities;b) Install a Building Management System for the air-conditioning system to
provide a Time-of-Use for afterhours air-conditioning; and
c) Install new high energy efficiency lighting, including the establishment of zones and automatic lighting control throughout the tenancy.
As a result of these improvements, the Centrepoint tenancy is expected to achieve and maintain an average National Australian Build Environment Rating System (NABERS) base building energy efficiency rating of 4.5 Stars per annum. This is expected to be confirmed following the submission of one year’s data in August 2012.
2. The provision of 25-bike racks at the Metro Car-park in Austin Lane to encourage staff to ride to work.
57. Has a target for departmental CO2 emissions been set for the coming financial year?The NTG sets energy intensity (gigajoules per square metre) reduction targets. The 2009 NTG Climate Change Policy sets a reduction target of 33% in building energy intensity by 2020, from the 2004-05 base years.
In addition, DoR is working towards the reduction target set in the Northern Territory Greening the Fleet Strategy that aims to reduce emissions from NTG’s passenger and light commercial fleet by 20% by 2014 and 50% by 2020. For 2012-13, DoR’s target for CO2 on motor vehicles is a 4% reduction. Individual agency targets have been set based on opportunity for greenhouse gas reduction from the agency’s vehicle replacement program.
Utilities:
58. From 01 July 2011 to 31 March 2012, what was the cost of power and water to the department?Power $671 912.01 and water $79 013.10
59. What is the projected cost for power and water to the department for the 2012-13 financial year?DoR’s electricity accounts will be based on the gazetted tariff except where an individual site is large enough to be classed as a contestable customer. Contestable customers negotiate site specific contracts with an electricity provider.
Public Events:
60. From 1 July 2011 to 31 March 2012, list the public events/ conferences/ forums that were sponsored by the department. What are projected for the 2012-13 financial year?Incorporated into Question 61.
61. What is the level of sponsorship provided in terms of financial support or in-kind support?Response to Question No. 289 by Ms Purick, Member for Goyder, already provides complete details on in-kind support. All amounts below include GST.
Sponsorship financial support from 1 July 2011 to 31 March 20121. Geological Society of Australia 2012 Dinner, sponsorship of $1822. Minerals Council NT Annual Dinner, sponsorship of $5003. Douglas Daly Community Development Association Cricket, sponsorship of $5004. Tennant Creek Show Society Cattle Section, sponsorship of $1000
5. NT Big Boys Toys Expo, co-sponsorship of $33336. Northern Territory Cattlemen’s Association (NTCA) Annual Conference 2012,
financial sponsorship of $50007. Annual Nuffield Australia, sponsorship of $8000
Approved Sponsorship for April to June 20121. Barkly Beef Dinner 2012, sponsorship of $5002. Douglas Daly Community Development Association, sponsorship of $5003. Royal Darwin Show, sponsorship of $31104. China Australia Resources Symposium, Gold sponsorship of $25 000
Projected 2012-131. Possible - Douglas Daly Community Development Association, sponsorship of
$5002. Possible - Barkly Beef Dinner 2013, sponsorship of $5003. Possible - Tennant Creek Show Society Cattle Section, sponsorship of $10004. Possible - Freds Pass Rural Show agricultural event, sponsorship of $20005. Possible - Royal Darwin Show agricultural event, sponsorship of $31106. Possible - NTCA Annual Conference, sponsorship of $5000
Advertising:
62. What is the department's budget for advertising for the 2011-12 financial year?Public notification advertising budget, relating mainly to the department’s statutory obligations and Gazettal notices, 2011-12 Budget $224 800.
Marketing and promotion advertising budget, relating to promotion of the Northern Territory and DoR, 2011-12 Budget $30 900.
Total advertising budget, 2011-12 Budget $255 700.
63. How much is year to date expenditure? Please breakdown into newspaper, radio and TV? (use 1 July 2011 to 31 March 2012 only, and does not include recruitment)All amounts exclude GST.
Advertising expenditure from 1 July 2011 to
31 March 2012
Public Notification Advertising
Marketing and
Promotions Advertising
Total Advertising
Newspaper ads $2140 $674 $2813
Newspaper – Mining Titles Notices $176 519 $0 $176 519
Television adverts $0 $0 $0
Radio adverts $0 $0 $0
Sub-Total $178 659 $674 $179 333
NTG Gazette notices $4858 $137 $4995
Magazine adverts $4354 $113 $4466
Outdoors (banners) $0 $0 $0
Posters $1588 $0 $1588
Grand Total $189 459 $924 $190 382
64. What advertising campaigns have been undertaken or will be undertaken by the department in 2011-12 financial year?All amounts exclude GST.
Advertising campaigns undertaken by the department in 2011-12 Fisheries – Barotrauma
Fisheries – recreational fishing possession limits
Minerals and Energy – Earth Sciences Scholarship
Primary Industry – Cattle and Biosecurity
Primary Industry – End of Year Office Closures
65. From 1 July 2011 to 31 March 2012, how many consultancies were let, at what cost, how many were NT firms and how many interstate and what was the value of those intra-territory and those interstate?All amounts exclude GST.
No. of Consultancies Cost
CorporateIntrastate 3 $7176Interstate 1 $773
Total 4 $7949Primary Industry
Intrastate 6 $54 450Interstate 2 $25 305
Total 8 $79 755Fisheries
Intrastate 3 $120 404Interstate 2 $46 955
Total 5 $167 359Minerals and Energy
Intrastate 4 $134 210Interstate 9 $709 238Overseas 1 $172 528
Total 14 $1 015 976Total
Intrastate 16 $316 240Interstate 14 $782 270Overseas 1 $172 528
Total 31 $1 271 038