Embed Size (px)
Citation preview
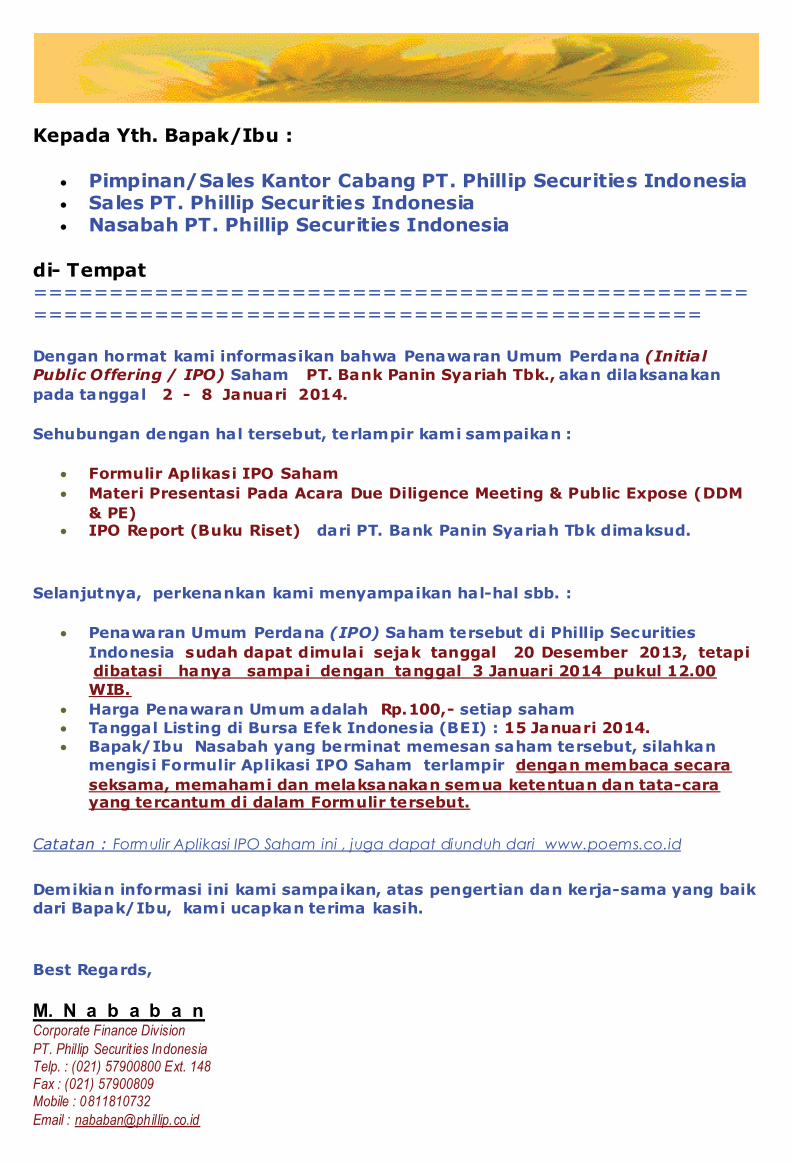
Kepada Yth. Bapak/Ibu :
• Pimpinan/Sales Kantor Cabang PT. Phillip Securities Indonesia • Sales PT. Phillip Securities Indonesia • Nasabah PT. Phillip Securities Indonesia
di- Tempat =========================================================================================== Dengan hormat kami informasikan bahwa Penawaran Umum Perdana (Initial Public Offering / IPO) Saham PT. Bank Panin Syariah Tbk., akan dilaksanakan pada tanggal 2 - 8 Januari 2014. Sehubungan dengan hal tersebut, terlampir kami sampaikan :
• Formulir Aplikasi IPO Saham • Materi Presentasi Pada Acara Due Diligence Meeting & Public Expose (DDM
& PE) • IPO Report (Buku Riset) dari PT. Bank Panin Syariah Tbk dimaksud.
Selanjutnya, perkenankan kami menyampaikan hal-hal sbb. :
• Penawaran Umum Perdana (IPO) Saham tersebut di Phillip Securities Indonesia sudah dapat dimulai sejak tanggal 20 Desember 2013, tetapi dibatasi hanya sampai dengan tanggal 3 Januari 2014 pukul 12.00 WIB.
• Harga Penawaran Umum adalah Rp.100,- setiap saham • Tanggal Listing di Bursa Efek Indonesia (BEI) : 15 Januari 2014. • Bapak/Ibu Nasabah yang berminat memesan saham tersebut, silahkan
mengisi Formulir Aplikasi IPO Saham terlampir dengan membaca secara seksama, memahami dan melaksanakan semua ketentuan dan tata-cara yang tercantum di dalam Formulir tersebut.
Catatan : Formulir Aplikasi IPO Saham ini , juga dapat diunduh dari www.poems.co.id Demikian informasi ini kami sampaikan, atas pengertian dan kerja-sama yang baik dari Bapak/Ibu, kami ucapkan terima kasih. Best Regards, M. N a b a b a n Corporate Finance Division PT. Phillip Securit ies Indonesia Telp. : (021) 57900800 Ext. 148 Fax : (021) 57900809 Mobile : 0811810732 Email : [email protected]
PT Evergreen Capital
DUE DILIGENCE MEETING & PUBLIC EXPOSEPENAWARAN UMUM PERDANA SAHAM TAHUN 2013
Materi Presentasi
Penjamin Pelaksana Emisi Efek
PT BANK PANIN SYARIAH Tbk
Jakarta, 2 Desember 2013Assembly Hall – Plaza Bapindo Lt.9
2
Selayang Pandang 3 Operasional Perbankan 14Kinerja Keuangan 22Struktur Penawaran 26Pertimbangan Investasi 30Lampiran 32
2
Daftar Isi
Selayang Pandang
4 4
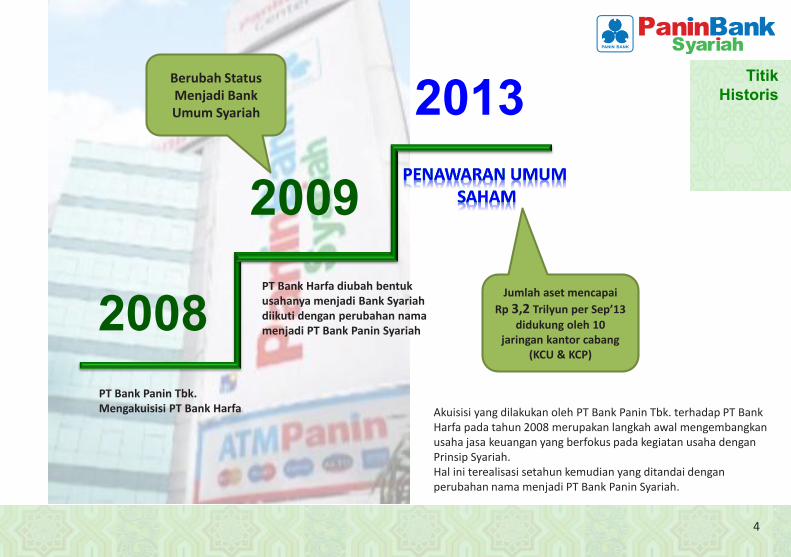
2008PT Bank Panin Tbk. Mengakuisisi PT Bank Harfa
PT Bank Harfa diubah bentuk usahanya menjadi Bank Syariah diikuti dengan perubahan nama menjadi PT Bank Panin Syariah
Berubah Status Menjadi Bank Umum Syariah
Jumlah aset mencapai Rp 3,2 Trilyun per Sep’13
didukung oleh 10 jaringan kantor cabang
(KCU & KCP)
2009
2013
Akuisisi yang dilakukan oleh PT Bank Panin Tbk. terhadap PT Bank Harfa pada tahun 2008 merupakan langkah awal mengembangkan usaha jasa keuangan yang berfokus pada kegiatan usaha dengan Prinsip Syariah. Hal ini terealisasi setahun kemudian yang ditandai dengan perubahan nama menjadi PT Bank Panin Syariah.
Titik Historis
5
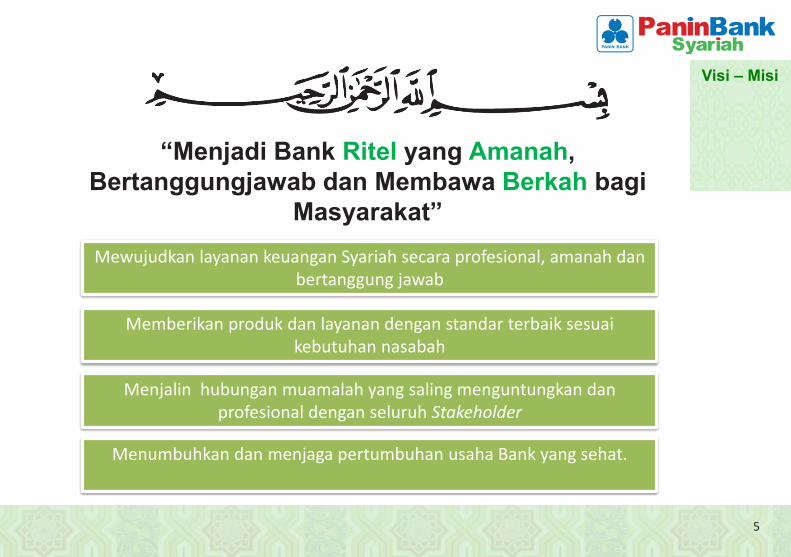
“Menjadi Bank Ritel yang Amanah,Bertanggungjawab dan Membawa Berkah bagi
Masyarakat”
5
Mewujudkan layanan keuangan Syariah secara profesional, amanah dan bertanggung jawab
Memberikan produk dan layanan dengan standar terbaik sesuai kebutuhan nasabah
Menjalin hubungan muamalah yang saling menguntungkan dan profesional dengan seluruh Stakeholder
Menumbuhkan dan menjaga pertumbuhan usaha Bank yang sehat.
Visi – Misi
66
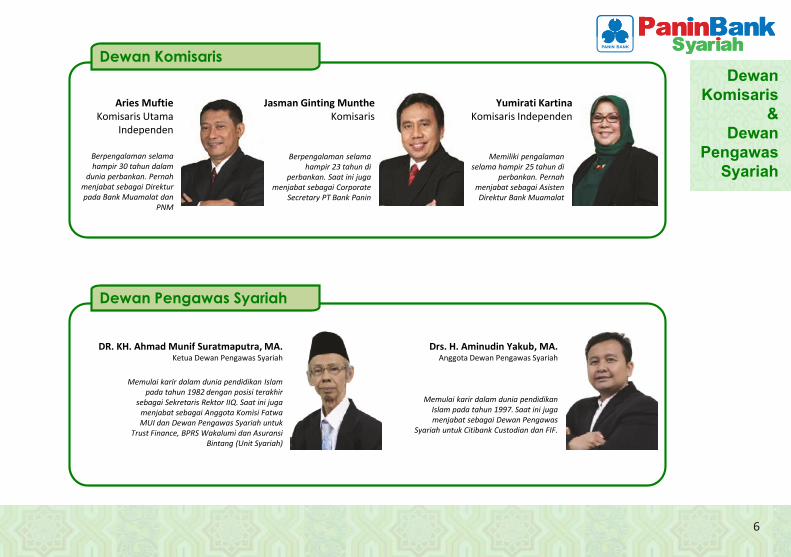
Dewan Komisaris
Aries Muftie Komisaris Utama
Independen
Jasman Ginting Munthe Komisaris
Yumirati Kartina Komisaris Independen
Dewan Pengawas Syariah
Berpengalaman selama hampir 30 tahun dalam
dunia perbankan. Pernah menjabat sebagai Direktur pada Bank Muamalat dan
PNM
Berpengalaman selama hampir 23 tahun di
perbankan. Saat ini juga menjabat sebagai Corporate
Secretary PT Bank Panin
Memiliki pengalaman selama hampir 25 tahun di
perbankan. Pernah menjabat sebagai Asisten Direktur Bank Muamalat
DR. KH. Ahmad Munif Suratmaputra, MA. Ketua Dewan Pengawas Syariah
Drs. H. Aminudin Yakub, MA. Anggota Dewan Pengawas Syariah
Memulai karir dalam dunia pendidikan Islam pada tahun 1982 dengan posisi terakhir
sebagai Sekretaris Rektor IIQ. Saat ini juga menjabat sebagai Anggota Komisi Fatwa MUI dan Dewan Pengawas Syariah untuk
Trust Finance, BPRS Wakalumi dan Asuransi Bintang (Unit Syariah)
Memulai karir dalam dunia pendidikan Islam pada tahun 1997. Saat ini juga menjabat sebagai Dewan Pengawas
Syariah untuk Citibank Custodian dan FIF.
Dewan Komisaris
& Dewan
Pengawas Syariah
7 7
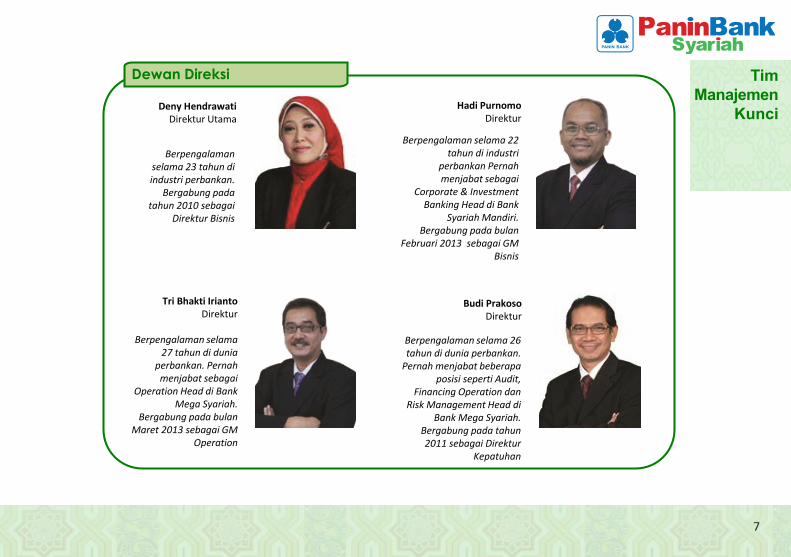
Deny Hendrawati Direktur Utama
Hadi Purnomo Direktur
Budi Prakoso Direktur
Tri Bhakti Irianto Direktur
Dewan Direksi
Berpengalaman selama 23 tahun di industri perbankan.
Bergabung pada tahun 2010 sebagai
Direktur Bisnis
Berpengalaman selama 22 tahun di industri
perbankan Pernah menjabat sebagai
Corporate & Investment Banking Head di Bank
Syariah Mandiri. Bergabung pada bulan
Februari 2013 sebagai GM Bisnis
Berpengalaman selama 27 tahun di dunia
perbankan. Pernah menjabat sebagai
Operation Head di Bank Mega Syariah.
Bergabung pada bulan Maret 2013 sebagai GM
Operation
Berpengalaman selama 26 tahun di dunia perbankan.
Pernah menjabat beberapa posisi seperti Audit,
Financing Operation dan Risk Management Head di
Bank Mega Syariah. Bergabung pada tahun 2011 sebagai Direktur
Kepatuhan
Tim Manajemen
Kunci
88
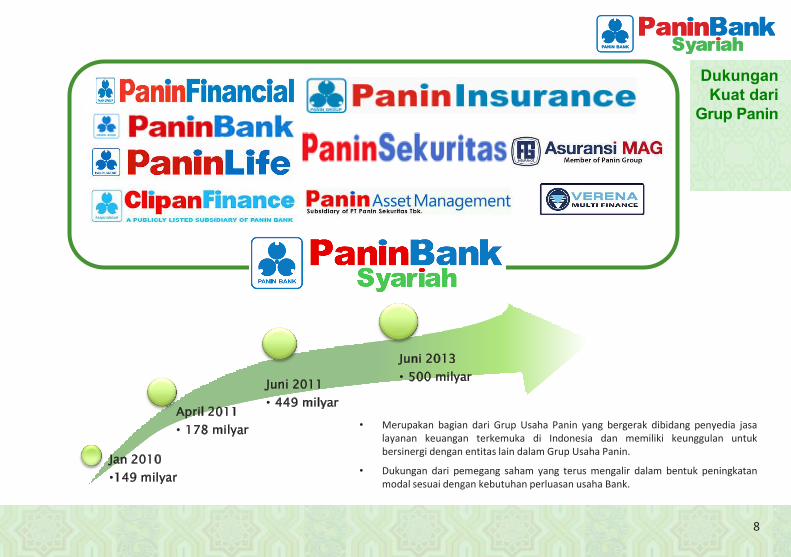
• Merupakan bagian dari Grup Usaha Panin yang bergerak dibidang penyedia jasa layanan keuangan terkemuka di Indonesia dan memiliki keunggulan untuk bersinergi dengan entitas lain dalam Grup Usaha Panin.
• Dukungan dari pemegang saham yang terus mengalir dalam bentuk peningkatan modal sesuai dengan kebutuhan perluasan usaha Bank.
Jan 2010 •149 milyar
April 2011 • 178 milyar
Juni 2011 • 449 milyar
Juni 2013 • 500 milyar
Dukungan Kuat dari
Grup Panin
9
Title:Source:
Please�fill�in�the�values�above�to�have�them�entered�in�your�report
0
1
2
3
4
5
6
0
20
40
60
80
100
120
140
160
180
2005 2006 2007 2008 2009 2010 2011 2012 Aug-13
(%)(IDRtrn)
Islamic bank deposit (LHS)
Islamic bank deposit as % of conventional bank deposit (RHS) �
Title:Source:
Please�fill�in�the�values�above�to�have�them�entered�in�your�report
0
10
20
30
40
50
60
2006 2007 2008 2009 2010 2011 2012 Aug-13
(y-o-y %)
Islamic bank deposit growth Commercial bank deposit growth �
9
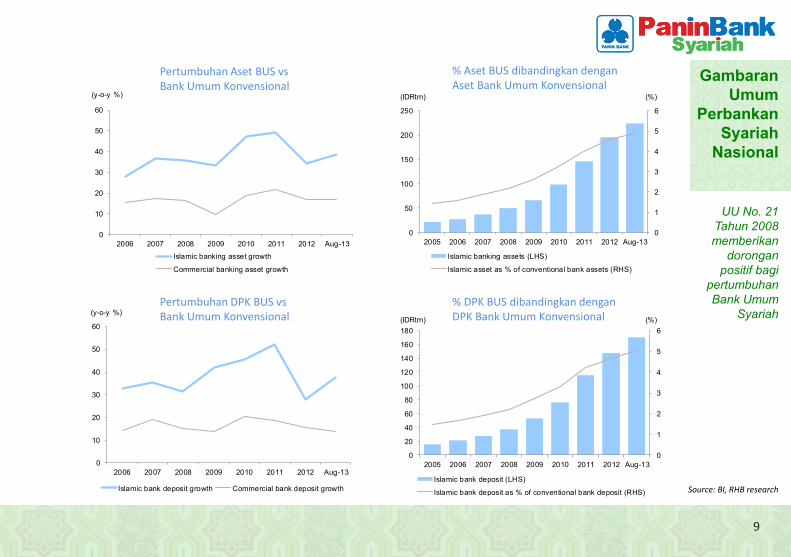
UU No. 21 Tahun 2008memberikan
dorongan positif bagi
pertumbuhan Bank Umum
Syariah
Title:Source:
Please�fill�in�the�values�above�to�have�them�entered�in�your�report
0
10
20
30
40
50
60
2006 2007 2008 2009 2010 2011 2012 Aug-13
(y-o-y %)
Islamic banking asset growth
Commercial banking asset growth �
Title:Source:
Please�fill�in�the�values�above�to�have�them�entered�in�your�report
0
1
2
3
4
5
6
0
50
100
150
200
250
2005 2006 2007 2008 2009 2010 2011 2012 Aug-13
(%)(IDRtrn)
Islamic banking assets (LHS)
Islamic asset as % of conventional bank assets (RHS) �
Pertumbuhan Aset BUS vs Bank Umum Konvensional
% Aset BUS dibandingkan dengan Aset Bank Umum Konvensional
Pertumbuhan DPK BUS vs Bank Umum Konvensional
% DPK BUS dibandingkan dengan DPK Bank Umum Konvensional
Source: BI, RHB research
Gambaran Umum
Perbankan Syariah
Nasional
1010
Title:Source:
Please�fill�in�the�values�above�to�have�them�entered�in�your�report
0
10
20
30
40
50
60
2006 2007 2008 2009 2010 2011 2012 Aug-13
(y-o-y %)
Islamic bank financing growth Commercial bank loans growth �
Title:Source:
Please�fill�in�the�values�above�to�have�them�entered�in�your�report
0
1
2
3
4
5
6
0
20
40
60
80
100
120
140
160
180
200
2005 2006 2007 2008 2009 2010 2011 2012 Aug-13
(%)(IDRtrn)
Islamic bank financing (LHS)
Islamic bank financing as % of conventional bank loans (RHS) �
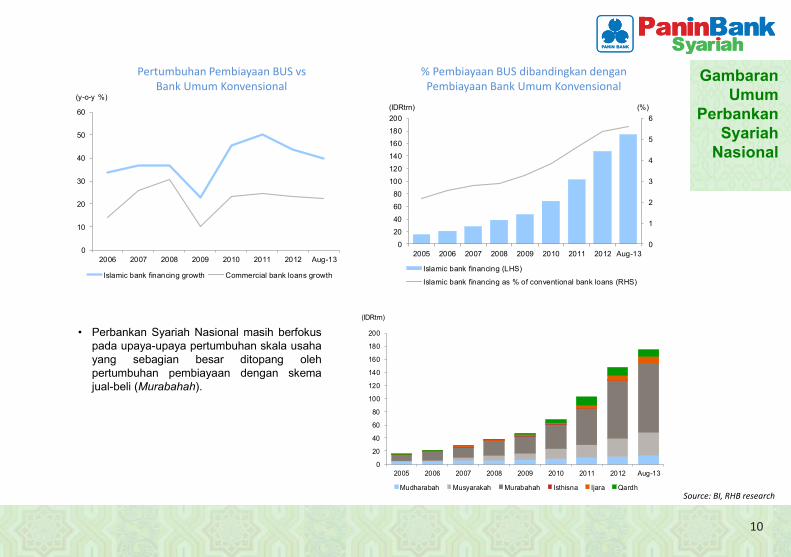
Pertumbuhan Pembiayaan BUS vs Bank Umum Konvensional
% Pembiayaan BUS dibandingkan dengan Pembiayaan Bank Umum Konvensional
Source: BI, RHB research
• Perbankan Syariah Nasional masih berfokus pada upaya-upaya pertumbuhan skala usaha yang sebagian besar ditopang oleh pertumbuhan pembiayaan dengan skema jual-beli (Murabahah).
Title:Source:
Please�fill�in�the�values�above�to�have�them�entered�in�your�report
0
20
40
60
80
100
120
140
160
180
200
2005 2006 2007 2008 2009 2010 2011 2012 Aug-13
(IDRtrn)
Mudharabah Musyarakah Murabahah Isthisna Ijara Qardh �
Gambaran Umum
Perbankan Syariah
Nasional
1111
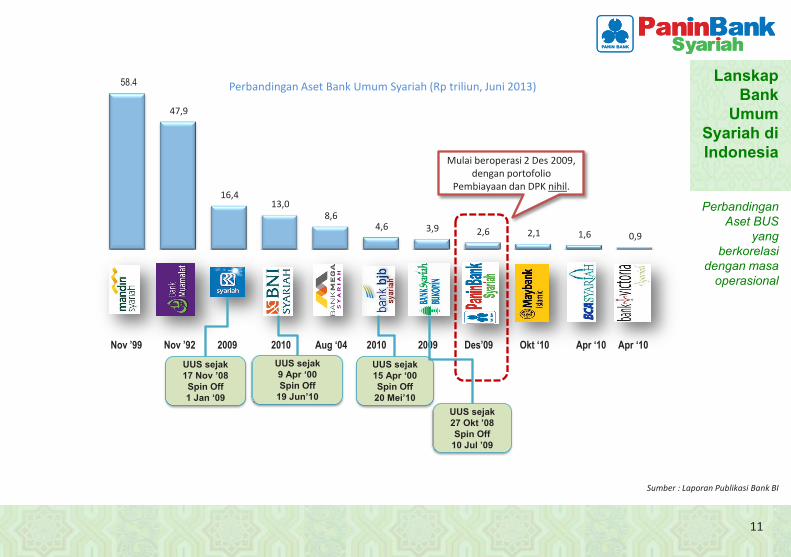
Perbandingan Aset BUS
yang berkorelasi
dengan masa operasional
Perbandingan Aset Bank Umum Syariah (Rp triliun, Juni 2013)
Sumber : Laporan Publikasi Bank BI
Nov ’99 Nov ’92 2009 2010 Aug ‘04 2010 2009 Des’09 Okt ‘10 Apr ‘10 Apr ‘10
58.4
47,9
16,4 13,0
8,6 4,6 3,9 2,6 2,1 1,6 0,9
UUS sejak 17 Nov ‟08Spin Off 1 Jan „09
UUS sejak 9 Apr „00Spin Off
19 Jun‟10
UUS sejak 15 Apr „00Spin Off
20 Mei‟10UUS sejak 27 Okt ‟08Spin Off
10 Jul ‟09
Mulai beroperasi 2 Des 2009, dengan portofolio
Pembiayaan dan DPK nihil.
Lanskap Bank
Umum Syariah di Indonesia
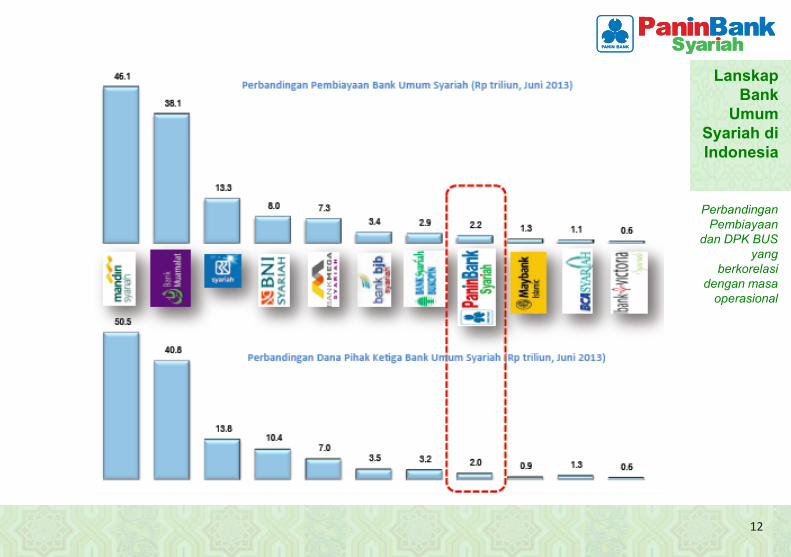
1212
Perbandingan Pembiayaan
dan DPK BUS yang
berkorelasi dengan masa
operasional
Lanskap Bank
Umum Syariah di Indonesia
1313
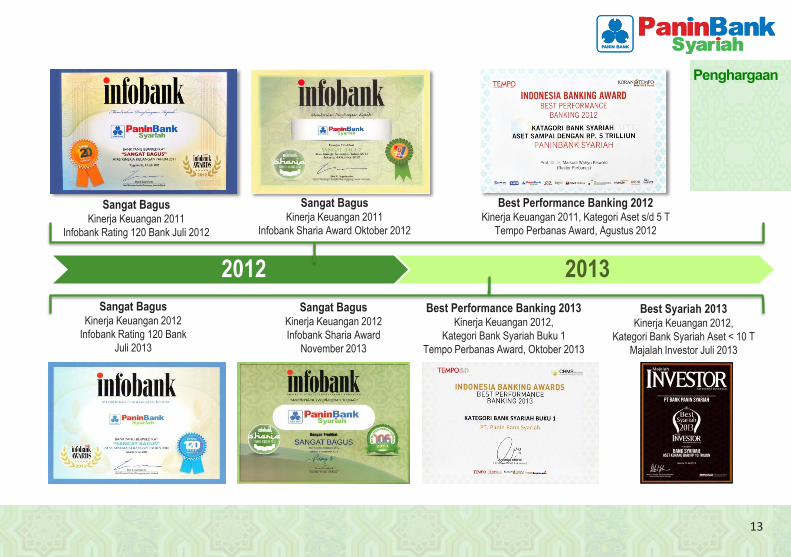
2012 2013
Sangat Bagus Kinerja Keuangan 2011
Infobank Sharia Award Oktober 2012
Sangat Bagus Kinerja Keuangan 2011
Infobank Rating 120 Bank Juli 2012
Best Performance Banking 2012 Kinerja Keuangan 2011, Kategori Aset s/d 5 T
Tempo Perbanas Award, Agustus 2012
Sangat Bagus Kinerja Keuangan 2012 Infobank Sharia Award
November 2013
Sangat Bagus Kinerja Keuangan 2012
Infobank Rating 120 Bank Juli 2013
Best Performance Banking 2013 Kinerja Keuangan 2012,
Kategori Bank Syariah Buku 1 Tempo Perbanas Award, Oktober 2013
Best Syariah 2013 Kinerja Keuangan 2012,
Kategori Bank Syariah Aset < 10 T Majalah Investor Juli 2013
Penghargaan
Operasional Perbankan
1515
Fokus &Strategi
Usaha Perbankan
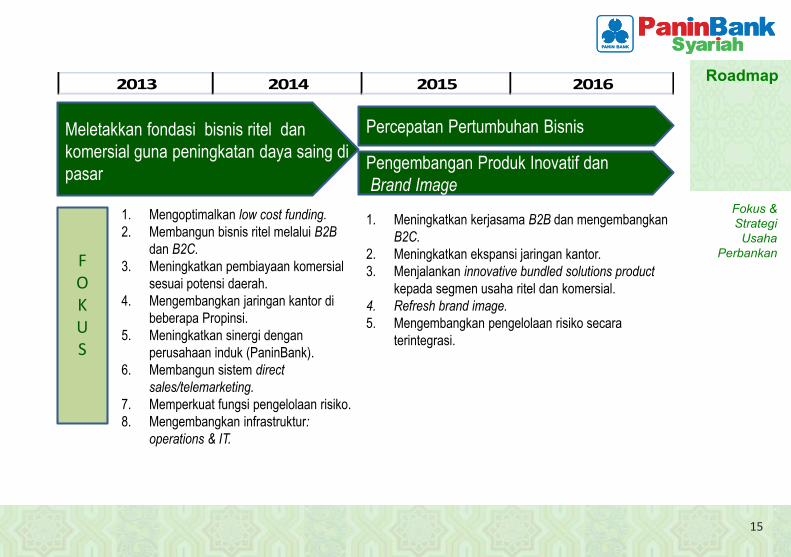
2013 2014 2015 2016
F O K U S
Percepatan Pertumbuhan Bisnis
Pengembangan Produk Inovatif dan Brand Image
Meletakkan fondasi bisnis ritel dan komersial guna peningkatan daya saing di pasar
1. Mengoptimalkan low cost funding. 2. Membangun bisnis ritel melalui B2B
dan B2C. 3. Meningkatkan pembiayaan komersial
sesuai potensi daerah. 4. Mengembangkan jaringan kantor di
beberapa Propinsi. 5. Meningkatkan sinergi dengan
perusahaan induk (PaninBank). 6. Membangun sistem direct
sales/telemarketing. 7. Memperkuat fungsi pengelolaan risiko. 8. Mengembangkan infrastruktur:
operations & IT.
1. Meningkatkan kerjasama B2B dan mengembangkan B2C.
2. Meningkatkan ekspansi jaringan kantor. 3. Menjalankan innovative bundled solutions product
kepada segmen usaha ritel dan komersial. 4. Refresh brand image. 5. Mengembangkan pengelolaan risiko secara
terintegrasi.
Roadmap
1616
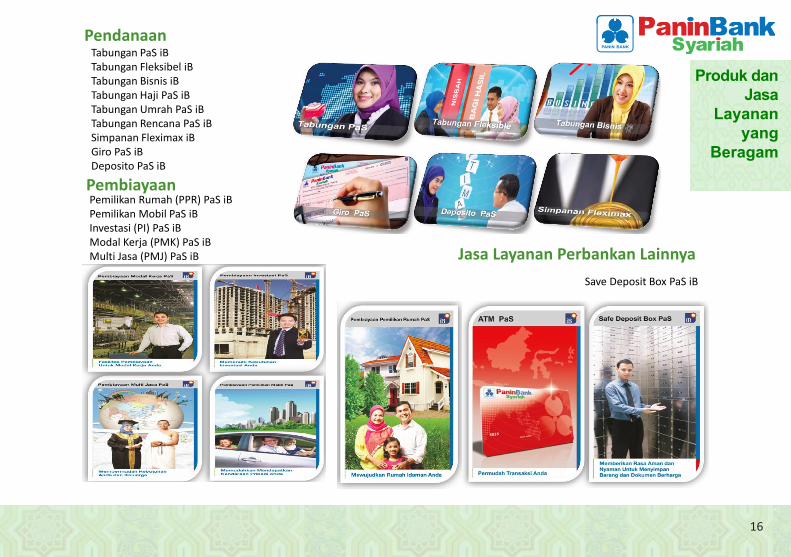
Pendanaan
Pembiayaan
Jasa Layanan Perbankan Lainnya
Pemilikan Rumah (PPR) PaS iB Pemilikan Mobil PaS iB Investasi (PI) PaS iB Modal Kerja (PMK) PaS iB Multi Jasa (PMJ) PaS iB
Tabungan PaS iB Tabungan Fleksibel iB Tabungan Bisnis iB Tabungan Haji PaS iB Tabungan Umrah PaS iB Tabungan Rencana PaS iB Simpanan Fleximax iB Giro PaS iB Deposito PaS iB
Save Deposit Box PaS iB
Produk dan Jasa
Layanan yang
Beragam
1717
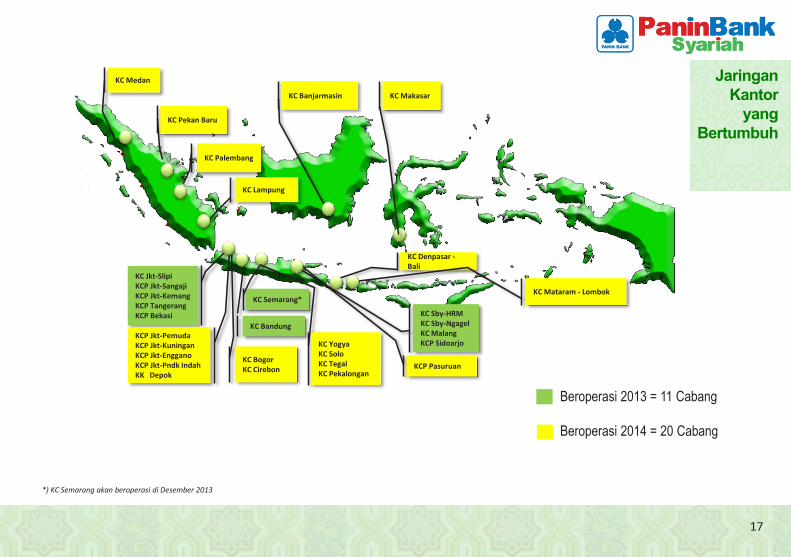
KC Jkt-Slipi KCP Jkt-Sangaji KCP Jkt-Kemang KCP Tangerang KCP Bekasi
KCP Jkt-Pemuda KCP Jkt-Kuningan KCP Jkt-Enggano KCP Jkt-Pndk Indah KK Depok
KC Sby-HRM KC Sby-Ngagel KC Malang KCP Sidoarjo
KC Bogor KC Cirebon
KC Bandung
KC Semarang*
KCP Pasuruan
KC Medan
KC Pekan Baru
KC Palembang
KC Lampung
KC Banjarmasin KC Makasar
KC Yogya KC Solo KC Tegal KC Pekalongan
KC Denpasar - Bali
KC Mataram - Lombok
Beroperasi 2013 = 11 Cabang Beroperasi 2014 = 20 Cabang
*) KC Semarang akan beroperasi di Desember 2013
Jaringan Kantor
yang Bertumbuh
1818
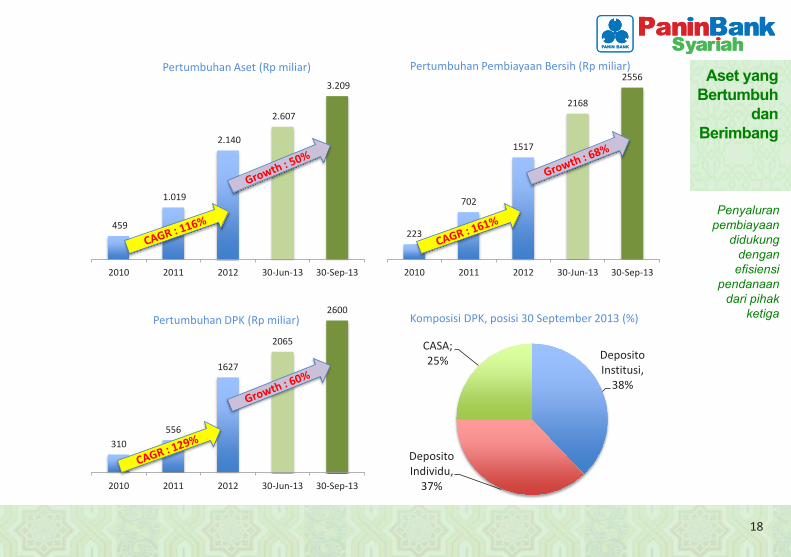
Penyaluran pembiayaan
didukung dengan
efisiensipendanaan
dari pihak ketiga
Pertumbuhan Aset (Rp miliar)
459
1.019
2.140
2.607
3.209
2010 2011 2012 30-Jun-13 30-Sep-13
223
702
1517
2168
2556
2010 2011 2012 30-Jun-13 30-Sep-13
Pertumbuhan Pembiayaan Bersih (Rp miliar)
310 556
1627
2065
2600
2010 2011 2012 30-Jun-13 30-Sep-13
Pertumbuhan DPK (Rp miliar)
Deposito Institusi,
38%
Deposito Individu,
37%
CASA; 25%
Komposisi DPK, posisi 30 September 2013 (%)
Aset yang Bertumbuh
dan Berimbang
1919
Title:Source:
Please fill in the values above to have them entered in your report
0
500
1,000
1,500
2,000
2,500
2010 2011 2012 2Q13
(IDRbn)
Murabahah Mudharabah Musyarakah �
Title:Source:
Please fill in the values above to have them entered in your report
0
500
1,000
1,500
2,000
2,500
2010 2011 2012 2Q13
(IDRbn)
Investment Consumer Working capital �
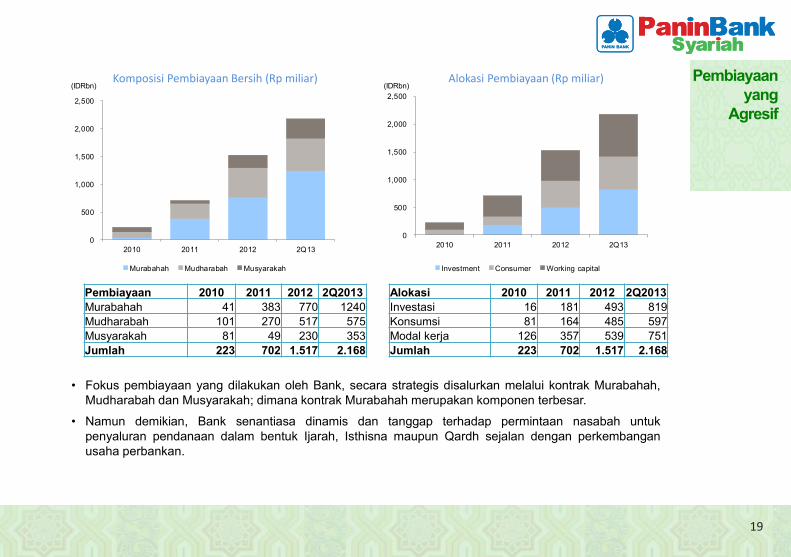
Komposisi Pembiayaan Bersih (Rp miliar) Alokasi Pembiayaan (Rp miliar)
• Fokus pembiayaan yang dilakukan oleh Bank, secara strategis disalurkan melalui kontrak Murabahah, Mudharabah dan Musyarakah; dimana kontrak Murabahah merupakan komponen terbesar.
• Namun demikian, Bank senantiasa dinamis dan tanggap terhadap permintaan nasabah untuk penyaluran pendanaan dalam bentuk Ijarah, Isthisna maupun Qardh sejalan dengan perkembangan usaha perbankan.
Pembiayaan 2010 2011 2012 2Q2013Murabahah 41 383 770 1240Mudharabah 101 270 517 575Musyarakah 81 49 230 353Jumlah 223 702 1.517 2.168
Alokasi 2010 2011 2012 2Q2013Investasi 16 181 493 819Konsumsi 81 164 485 597Modal kerja 126 357 539 751Jumlah 223 702 1.517 2.168
Pembiayaan yang
Agresif
2020
Title:Source:
Please fill in the values above to have them entered in your report0.86
0.19
0.56
0.0
0.1
0.2
0.3
0.4
0.5
0.6
0.7
0.8
0.9
1.0
0
2
4
6
8
10
12
14
2011 2012 2Q13
(%)(IDRbn)
NPF (LHS) NPF (RHS) �
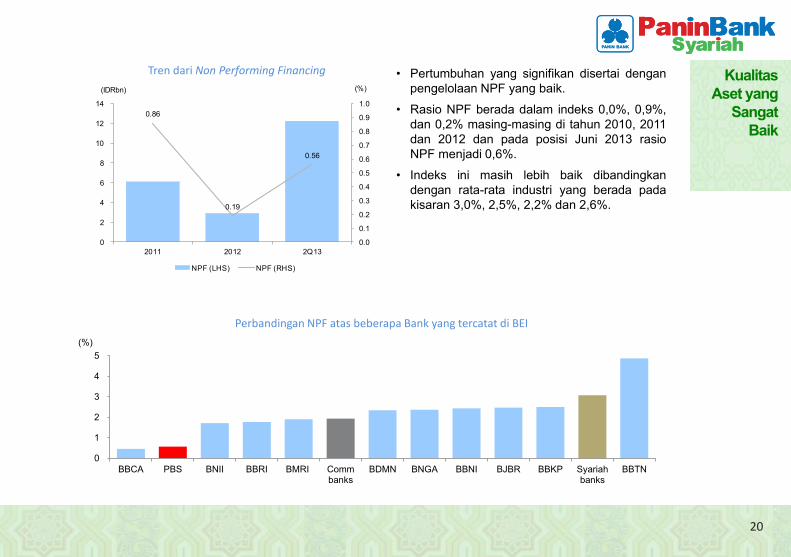
Tren dari Non Performing Financing • Pertumbuhan yang signifikan disertai dengan pengelolaan NPF yang baik.
• Rasio NPF berada dalam indeks 0,0%, 0,9%, dan 0,2% masing-masing di tahun 2010, 2011 dan 2012 dan pada posisi Juni 2013 rasio NPF menjadi 0,6%.
• Indeks ini masih lebih baik dibandingkan dengan rata-rata industri yang berada padakisaran 3,0%, 2,5%, 2,2% dan 2,6%.
0
1
2
3
4
5
BBCA PBS BNII BBRI BMRI Commbanks
BDMN BNGA BBNI BJBR BBKP Syariahbanks
BBTN
(%)
Perbandingan NPF atas beberapa Bank yang tercatat di BEI
Kualitas Aset yang
Sangat Baik
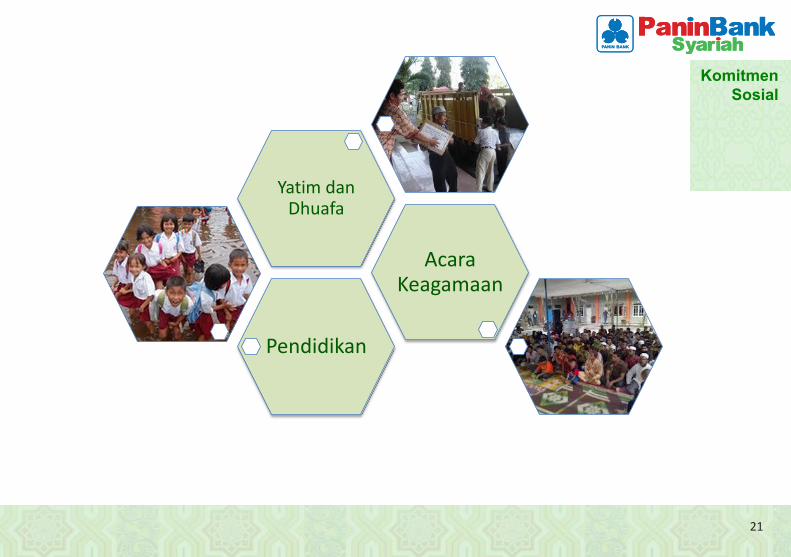
21
Pendidikan
Acara Keagamaan
Yatim dan Dhuafa
21
Komitmen Sosial

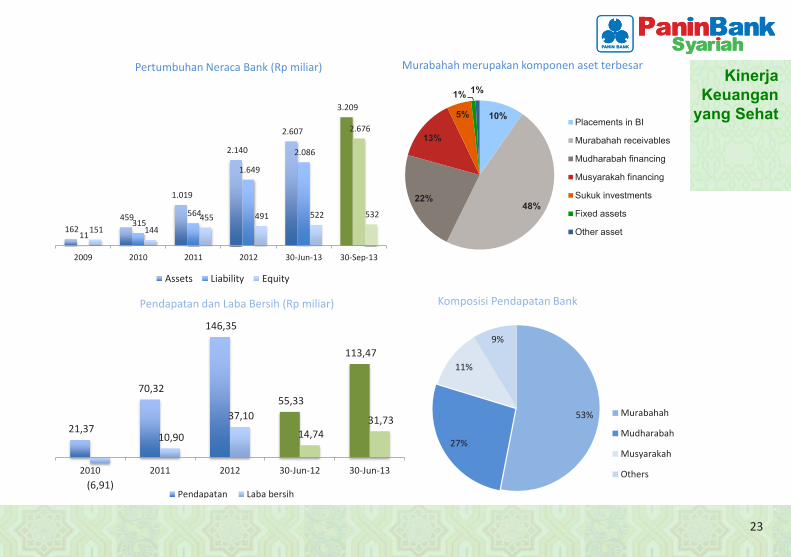
Kinerja Keuangan
2323
Pertumbuhan Neraca Bank (Rp miliar)
10%
48%22%
13%
5%
1% 1%
Placements in BI
Murabahah receivables
Mudharabah financing
Musyarakah financing
Sukuk investments
Fixed assets
Other asset
Murabahah merupakan komponen aset terbesar
162 459
1.019
2.140
2.607
3.209
11 315
564
1.649
2.086
2.676
151 144 455 491 522 532
2009 2010 2011 2012 30-Jun-13 30-Sep-13
Assets Liability Equity
Komposisi Pendapatan Bank Pendapatan dan Laba Bersih (Rp miliar)
53%
27%
11%
9%
Murabahah
Mudharabah
Musyarakah
Others
21,37
70,32
146,35
55,33
113,47
(6,91)
10,90
37,10
14,74 31,73
2010 2011 2012 30-Jun-12 30-Jun-13
Pendapatan Laba bersih
Kinerja Keuangan
yang Sehat
2424
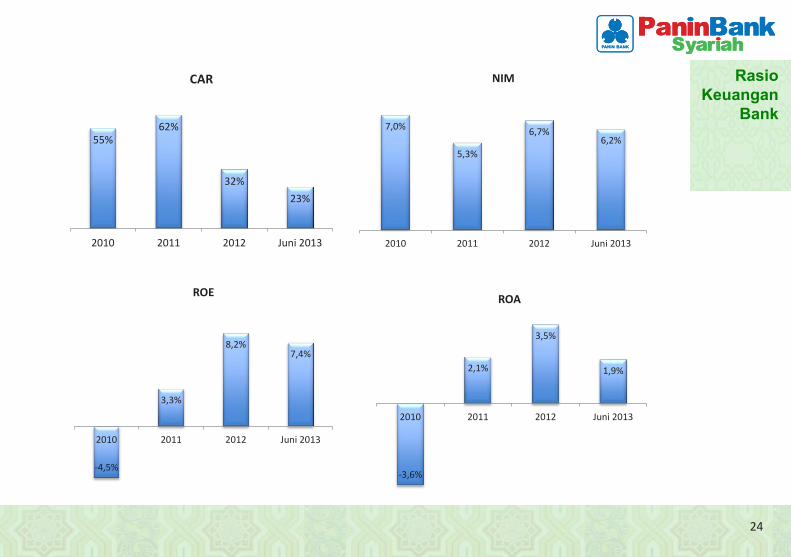
55% 62%
32% 23%
2010 2011 2012 Juni 2013
CAR
7,0%
5,3%
6,7% 6,2%
2010 2011 2012 Juni 2013
NIM
-4,5%
3,3%
8,2% 7,4%
2010 2011 2012 Juni 2013
ROE
-3,6%
2,1%
3,5%
1,9%
2010 2011 2012 Juni 2013
ROA
Rasio Keuangan
Bank
2525
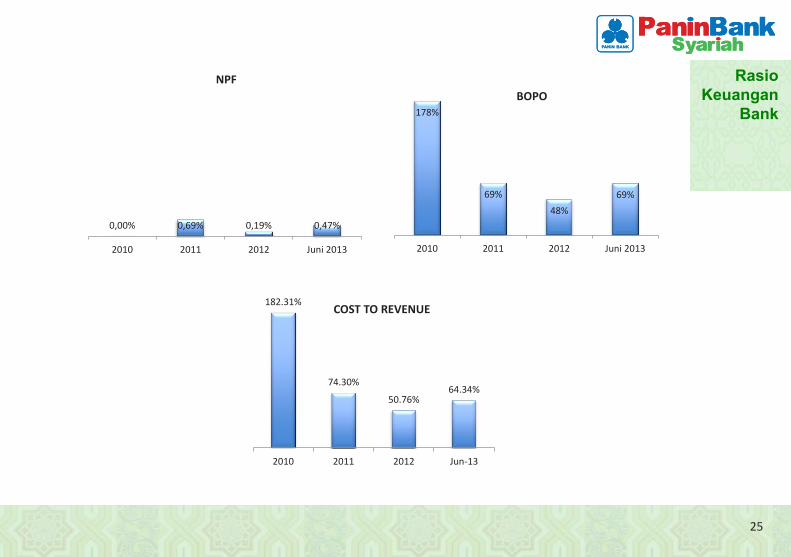
0,00% 0,69% 0,19% 0,47%
2010 2011 2012 Juni 2013
NPF
178%
69% 48%
69%
2010 2011 2012 Juni 2013
BOPO
182.31%
74.30%
50.76% 64.34%
2010 2011 2012 Jun-13
COST TO REVENUE
Rasio Keuangan
Bank
Struktur Penawaran
27
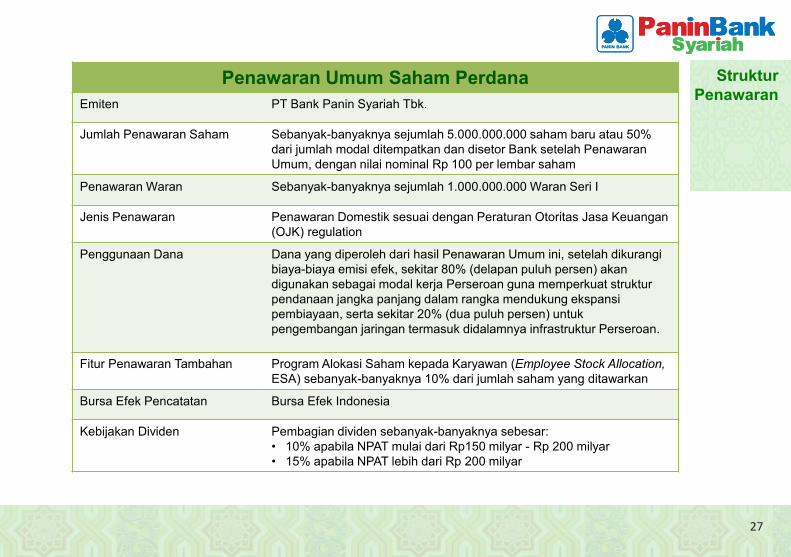
Penawaran Umum Saham Perdana Emiten PT Bank Panin Syariah Tbk.
Jumlah Penawaran Saham Sebanyak-banyaknya sejumlah 5.000.000.000 saham baru atau 50%dari jumlah modal ditempatkan dan disetor Bank setelah Penawaran Umum, dengan nilai nominal Rp 100 per lembar saham
Penawaran Waran Sebanyak-banyaknya sejumlah 1.000.000.000 Waran Seri I
Jenis Penawaran Penawaran Domestik sesuai dengan Peraturan Otoritas Jasa Keuangan(OJK) regulation
Penggunaan Dana Dana yang diperoleh dari hasil Penawaran Umum ini, setelah dikurangi biaya-biaya emisi efek, sekitar 80% (delapan puluh persen) akandigunakan sebagai modal kerja Perseroan guna memperkuat strukturpendanaan jangka panjang dalam rangka mendukung ekspansipembiayaan, serta sekitar 20% (dua puluh persen) untukpengembangan jaringan termasuk didalamnya infrastruktur Perseroan.
Fitur Penawaran Tambahan Program Alokasi Saham kepada Karyawan (Employee Stock Allocation, ESA) sebanyak-banyaknya 10% dari jumlah saham yang ditawarkan
Bursa Efek Pencatatan Bursa Efek Indonesia
Kebijakan Dividen Pembagian dividen sebanyak-banyaknya sebesar: • 10% apabila NPAT mulai dari Rp150 milyar - Rp 200 milyar • 15% apabila NPAT lebih dari Rp 200 milyar
27
Struktur Penawaran
28
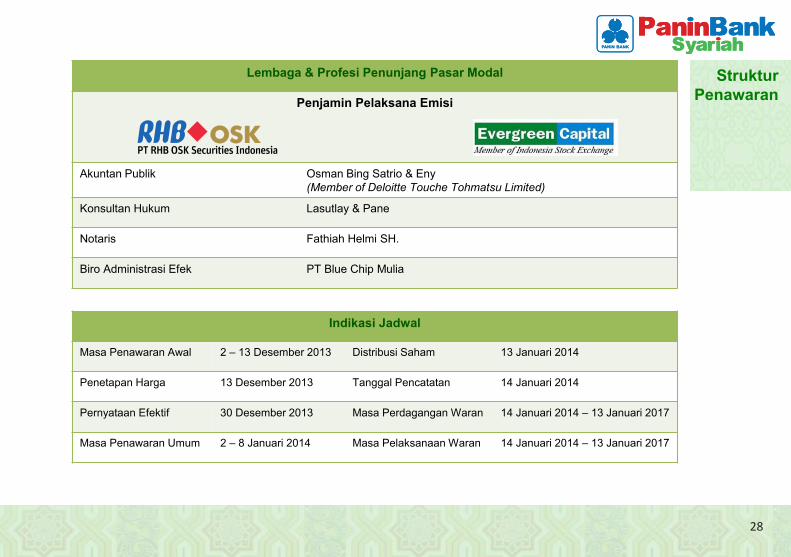
Lembaga & Profesi Penunjang Pasar Modal
Penjamin Pelaksana Emisi
Akuntan Publik Osman Bing Satrio & Eny (Member of Deloitte Touche Tohmatsu Limited)
Konsultan Hukum Lasutlay & Pane
Notaris Fathiah Helmi SH.
Biro Administrasi Efek PT Blue Chip Mulia
28
Indikasi Jadwal
Masa Penawaran Awal 2 – 13 Desember 2013 Distribusi Saham 13 Januari 2014
Penetapan Harga 13 Desember 2013 Tanggal Pencatatan 14 Januari 2014
Pernyataan Efektif 30 Desember 2013 Masa Perdagangan Waran 14 Januari 2014 – 13 Januari 2017
Masa Penawaran Umum 2 – 8 Januari 2014 Masa Pelaksanaan Waran 14 Januari 2014 – 13 Januari 2017
Struktur Penawaran
29
29
RENTANG HARGA PENAWARAN UMUM SAHAM PERDANA
Rp _______________ sampai dengan Rp _______________
per lembar saham
Harga Penawaran

Pertimbangan Investasi
31
31
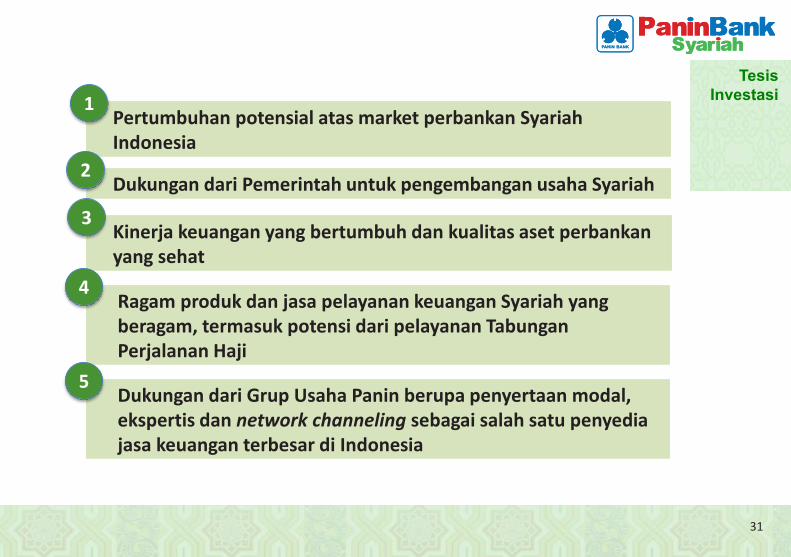
Pertumbuhan potensial atas market perbankan Syariah Indonesia
1
Dukungan dari Pemerintah untuk pengembangan usaha Syariah 2
Kinerja keuangan yang bertumbuh dan kualitas aset perbankan yang sehat
3
Ragam produk dan jasa pelayanan keuangan Syariah yang beragam, termasuk potensi dari pelayanan Tabungan Perjalanan Haji
4
Dukungan dari Grup Usaha Panin berupa penyertaan modal, ekspertis dan network channeling sebagai salah satu penyedia jasa keuangan terbesar di Indonesia
5
Tesis Investasi
Lampiran
33
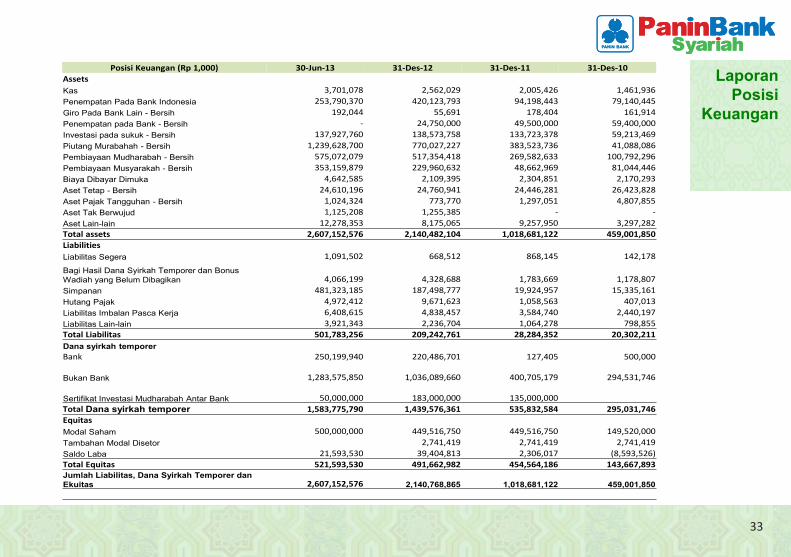
Posisi Keuangan (Rp 1,000) 30-Jun-13 31-Des-12 31-Des-11 31-Des-10 Assets Kas 3,701,078 2,562,029 2,005,426 1,461,936 Penempatan Pada Bank Indonesia 253,790,370 420,123,793 94,198,443 79,140,445 Giro Pada Bank Lain - Bersih 192,044 55,691 178,404 161,914 Penempatan pada Bank - Bersih - 24,750,000 49,500,000 59,400,000 Investasi pada sukuk - Bersih 137,927,760 138,573,758 133,723,378 59,213,469 Piutang Murabahah - Bersih 1,239,628,700 770,027,227 383,523,736 41,088,086 Pembiayaan Mudharabah - Bersih 575,072,079 517,354,418 269,582,633 100,792,296 Pembiayaan Musyarakah - Bersih 353,159,879 229,960,632 48,662,969 81,044,446 Biaya Dibayar Dimuka 4,642,585 2,109,395 2,304,851 2,170,293 Aset Tetap - Bersih 24,610,196 24,760,941 24,446,281 26,423,828 Aset Pajak Tangguhan - Bersih 1,024,324 773,770 1,297,051 4,807,855 Aset Tak Berwujud 1,125,208 1,255,385 - - Aset Lain-lain 12,278,353 8,175,065 9,257,950 3,297,282 Total assets 2,607,152,576 2,140,482,104 1,018,681,122 459,001,850 Liabilities Liabilitas Segera 1,091,502 668,512 868,145 142,178
Bagi Hasil Dana Syirkah Temporer dan Bonus Wadiah yang Belum Dibagikan 4,066,199 4,328,688 1,783,669 1,178,807 Simpanan 481,323,185 187,498,777 19,924,957 15,335,161 Hutang Pajak 4,972,412 9,671,623 1,058,563 407,013 Liabilitas Imbalan Pasca Kerja 6,408,615 4,838,457 3,584,740 2,440,197 Liabilitas Lain-lain 3,921,343 2,236,704 1,064,278 798,855 Total Liabilitas 501,783,256 209,242,761 28,284,352 20,302,211 Dana syirkah temporer Bank 250,199,940 220,486,701 127,405 500,000
Bukan Bank 1,283,575,850 1,036,089,660 400,705,179 294,531,746
Sertifikat Investasi Mudharabah Antar Bank 50,000,000 183,000,000 135,000,000 Total Dana syirkah temporer 1,583,775,790 1,439,576,361 535,832,584 295,031,746 Equitas Modal Saham 500,000,000 449,516,750 449,516,750 149,520,000 Tambahan Modal Disetor 2,741,419 2,741,419 2,741,419 Saldo Laba 21,593,530 39,404,813 2,306,017 (8,593,526) Total Equitas 521,593,530 491,662,982 454,564,186 143,667,893 Jumlah Liabilitas, Dana Syirkah Temporer dan Ekuitas 2,607,152,576 2,140,768,865 1,018,681,122 459,001,850
Laporan Posisi
Keuangan
34
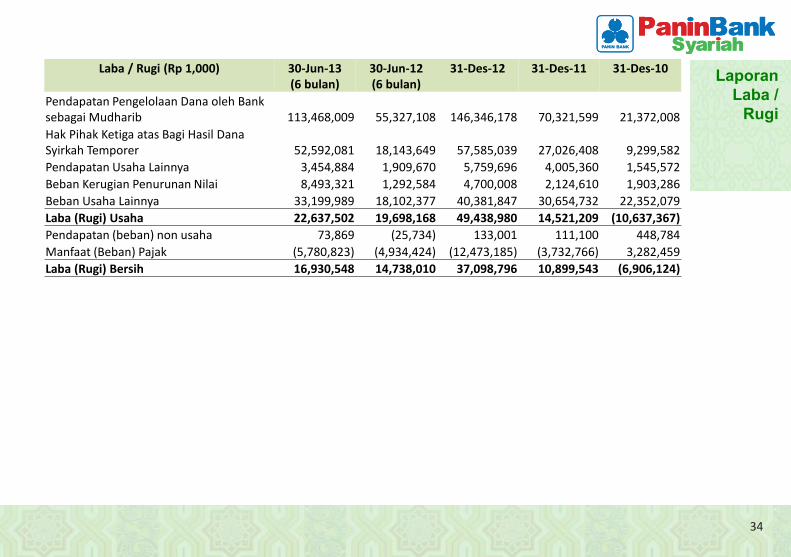
Laba / Rugi (Rp 1,000) 30-Jun-13 (6 bulan)
30-Jun-12 (6 bulan)
31-Des-12 31-Des-11 31-Des-10
Pendapatan Pengelolaan Dana oleh Bank sebagai Mudharib 113,468,009 55,327,108 146,346,178 70,321,599 21,372,008 Hak Pihak Ketiga atas Bagi Hasil Dana Syirkah Temporer 52,592,081 18,143,649 57,585,039 27,026,408 9,299,582 Pendapatan Usaha Lainnya 3,454,884 1,909,670 5,759,696 4,005,360 1,545,572 Beban Kerugian Penurunan Nilai 8,493,321 1,292,584 4,700,008 2,124,610 1,903,286 Beban Usaha Lainnya 33,199,989 18,102,377 40,381,847 30,654,732 22,352,079 Laba (Rugi) Usaha 22,637,502 19,698,168 49,438,980 14,521,209 (10,637,367) Pendapatan (beban) non usaha 73,869 (25,734) 133,001 111,100 448,784 Manfaat (Beban) Pajak (5,780,823) (4,934,424) (12,473,185) (3,732,766) 3,282,459 Laba (Rugi) Bersih 16,930,548 14,738,010 37,098,796 10,899,543 (6,906,124)
Laporan Laba /
Rugi
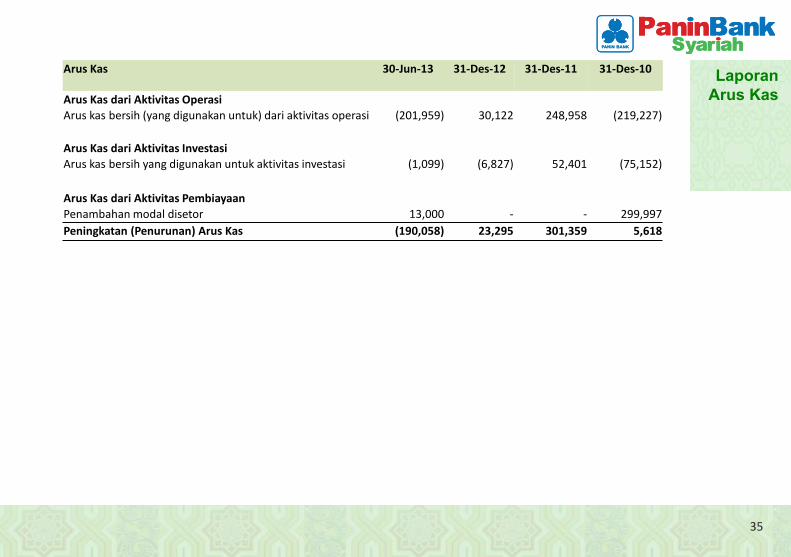
3535
Arus Kas 30-Jun-13 31-Des-12 31-Des-11
31-Des-10
Arus Kas dari Aktivitas Operasi Arus kas bersih (yang digunakan untuk) dari aktivitas operasi (201,959) 30,122 248,958 (219,227)
Arus Kas dari Aktivitas Investasi Arus kas bersih yang digunakan untuk aktivitas investasi (1,099) (6,827) 52,401 (75,152)
Arus Kas dari Aktivitas Pembiayaan Penambahan modal disetor 13,000 - - 299,997 Peningkatan (Penurunan) Arus Kas (190,058) 23,295 301,359 5,618
Laporan Arus Kas
36
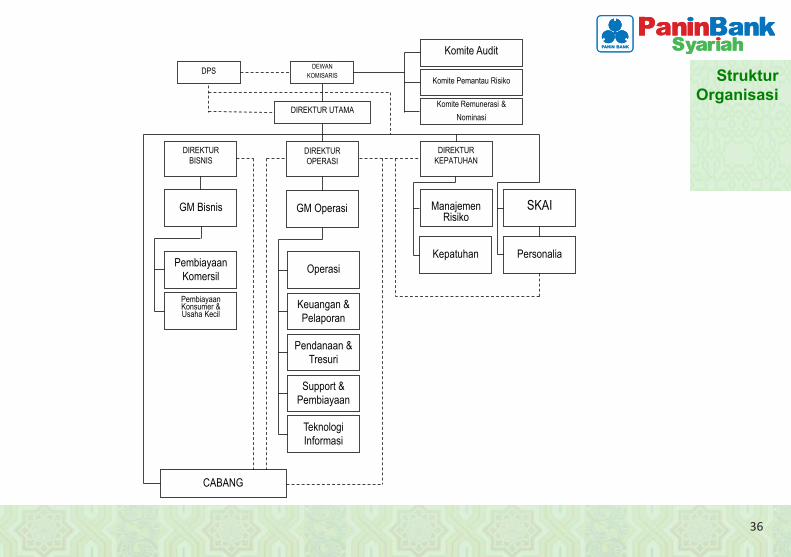
DIREKTUR BISNIS
DIREKTUR KEPATUHAN
Manajemen
Risiko
Kepatuhan
SKAI
Personalia
GM Bisnis
Pembiayaan Komersil
Pembiayaan Konsumer & Usaha Kecil
CABANG
DIREKTUR UTAMA
DIREKTUR OPERASI
GM Operasi
Operasi
Keuangan & Pelaporan
Pendanaan & Tresuri
Support & Pembiayaan
Teknologi Informasi
DPS DEWAN KOMISARIS
Komite Audit
Komite Pemantau Risiko
Komite Remunerasi &
Nominasi
Struktur Organisasi
37
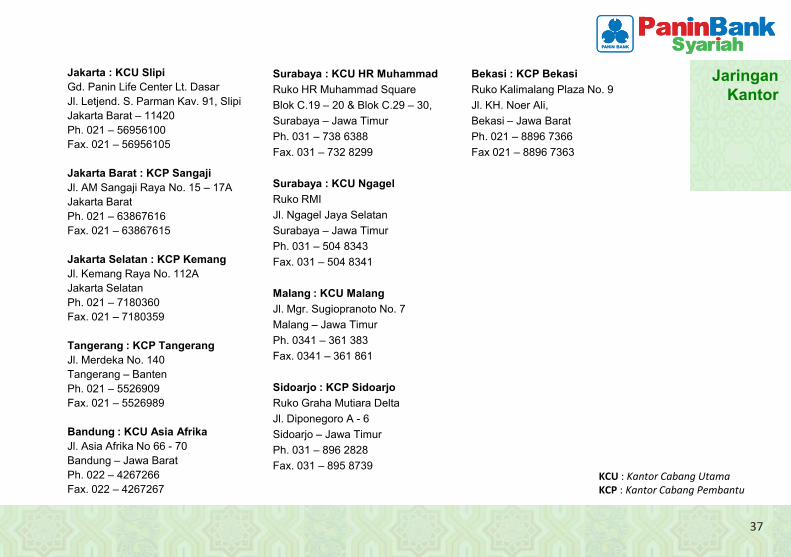
Jakarta : KCU Slipi Gd. Panin Life Center Lt. Dasar Jl. Letjend. S. Parman Kav. 91, Slipi Jakarta Barat – 11420Ph. 021 – 56956100Fax. 021 – 56956105
Jakarta Barat : KCP Sangaji Jl. AM Sangaji Raya No. 15 – 17AJakarta Barat Ph. 021 – 63867616Fax. 021 – 63867615
Jakarta Selatan : KCP Kemang Jl. Kemang Raya No. 112A Jakarta Selatan Ph. 021 – 7180360Fax. 021 – 7180359
Tangerang : KCP Tangerang Jl. Merdeka No. 140 Tangerang – Banten Ph. 021 – 5526909Fax. 021 – 5526989
Bandung : KCU Asia Afrika Jl. Asia Afrika No 66 - 70Bandung – Jawa Barat Ph. 022 – 4267266Fax. 022 – 4267267
37
Surabaya : KCU HR Muhammad Ruko HR Muhammad Square Blok C.19 – 20 & Blok C.29 – 30,Surabaya – Jawa Timur Ph. 031 – 738 6388 Fax. 031 – 732 8299
Surabaya : KCU Ngagel Ruko RMI Jl. Ngagel Jaya Selatan Surabaya – Jawa Timur Ph. 031 – 504 8343 Fax. 031 – 504 8341
Malang : KCU Malang Jl. Mgr. Sugiopranoto No. 7 Malang – Jawa Timur Ph. 0341 – 361 383 Fax. 0341 – 361 861
Sidoarjo : KCP Sidoarjo Ruko Graha Mutiara Delta Jl. Diponegoro A - 6 Sidoarjo – Jawa Timur Ph. 031 – 896 2828 Fax. 031 – 895 8739
KCU : Kantor Cabang Utama KCP : Kantor Cabang Pembantu
Bekasi : KCP Bekasi Ruko Kalimalang Plaza No. 9 Jl. KH. Noer Ali, Bekasi – Jawa Barat Ph. 021 – 8896 7366 Fax 021 – 8896 7363
Jaringan Kantor
Terima KasihKantor Pusat:
Gedung Panin Life Center, 3rd FloorJl. Letjend S. ParmanKav 91, SlipiJakarta Barat 11420Indonesia www.paninbanksyariah.co.id
39
The information that follows is a presentation of general background information about PT Bank Panin Syariah Tbk. (the “Bank”) prepared by the Bank as of 2 December 2013. The information contained in this presentation shall be treated as strictly confidential.
This presentation has been prepared for information purposes only. This presentation does not constitute as prospectus or other offering memorandum in whole or in part. None of the information appearing in this presentation may be distributed to the press or other media orreproduced or redistributed in the whole or in part in any form at any time. Any recipient of this presentation and its directors, officers, employees, agents and affiliates must hold this presentation and any information provided in connection with this presentation in strict confidence and may not communicate, reproduce, distribute or disclose to any other person, or refer to them publicly, in whole or in part.
The information contained in this presentation is not intended for potential investors and does not constitute an offer to sell or the solicitation of an offer to buy any securities in the United States, Indonesia or any other jurisdiction, and neither this presentation nor anything contained herein shall form the basis of or be relied on in connection with any contract or commitment whatsoever. Certainstatements in this document may constitute “forward-looking statements”, including statements regarding the Company’s expectationsand projections for future operating performance and business prospects. Such forward-looking statements are based on numerousassumptions regarding the Bank’s present and future business strategies and the environment in which the Bank will operate in thefuture. Such forward-looking statements speak only as of the date on which they are made. Accordingly, the Bank expressly disclaimsany obligation to update or revise any forward looking statement contained herein to reflect any change in the Bank’s expectations withregard to new information, future events or other circumstances. The Bank does not make any representation, warranty or prediction thatthe results anticipated by such forward looking statements will be achieved, and such forward looking statements represent, in eachcase, only on of many possible scenarios and should not be viewed as the most likely or standard scenario.
Accordingly, no representation or warranty, express or implied, is made as to, and no reliance should be placed on the fairness, accuracy, completeness or correctness of the information and opinions in this presentation, nor is it intended to be a complete statementor summary of the resources markets or developments referred to in this presentation. Accordingly, none of the Bank or any of its agentsor advisers, or any of their respective affiliates, advisers or representatives, undertake to update or revise any information, includingforward-looking statements, whether as a result of new information, future events or otherwise and none of them shall have any liability(in negligence or otherwise) for any loss howsoever arising from any use of this presentation or its contents or otherwise arising inconnection with this presentation. It should not be regarded by recipients as a substitute for the exercise of their own judgment.
By accepting delivery of all or part of this presentation, the recipient agrees to maintain absolute confidentiality regarding the information disclosed in this presentation and to be bound by the statements, restrictions and limitations set forth herein and agrees to keep confidential the existence and scope of this presentation and of all conversations. Any failure to comply with these restrictions may constitute a violation of applicable securities law.
39
Important Disclaimer
Rocky In(65) 6232rocky.ind
20 No
ndrawan 2 3832 drawan@sg
ovember 2
g.oskgroup.c
013
com
THIS REPORSTATES, CASPECIAL ADSOLELY FORTO ANY OTRESTRICTIOAPPLY.
Ple
RTS MAY NOTANADA, THE DMINISTRATIVR YOUR INFORHER PERSON
ONS AS SET O
Pa
ease read im
T BE DISTRIBUPEOPLE’S RE
VE REGION) ORMATION AND IN ANY FORM
OUT IN THE IN
nin B
mportant dis
PANIN B
UTED, DIRECTLEPUBLIC OF OR JAPAN. IT
D MAY NOT BE M. IT MAY NONSIDE AND BA
Bank S
sclosures a
BANK SYAR
LY, OR INDIRECHINA (EXCL
T HAS BEEN REPRODUCET BE SENT TOACK COVER O
Syaria
t the end of
RIAH
ECTLY, IN THELUDING HONGFURNISHED TD OR REDISTRO THE MEDIAOF THE THIS
ah
IPO REP
f this report.
UNITED G KONG TO YOU RIBUTED . OTHER REPORT
PORT
.
These materials are not an offer for sale of the securities of the Company in the United States. The securities may not be offered orsold in the United States absent registration or an exemption from registration under the U.S. Securities Act of 1933, as amended. TheCompany does not intend to register any portion of the offering in the United States or to conduct a public offering of its securities inthe United States.
Power
1
Disclaimers This Report is based on current information that we consider reliable. However, as the information contained in this Report has not been independently verified, no representation or warranty, express or implied, is made as to the fairness, accuracy or completeness of the information and opinions contained in this report and it is not the author’s intention to provide, and the recipient may not rely on this report as providing, a complete or comprehensive analysis of Panin Bank Syariah’s financial or trading position or prospects. Without limiting the generality of the foregoing, liability for negligent misstatement in respect of the contents of, or any omission from, this Report is hereby expressly excluded. The information and opinions in this report are subject to change without notice. Any opinions and projections contained in this document are entirely those of RHB. Neither Panin Bank Syariah, RHB or any other person accepts any liability whatsoever for any loss howsoever arising from any use of this Report or its contents or otherwise arising in connection therewith.
This Report is not an offer to sell or the solicitation of an offer to buy any security in any jurisdiction where such an offer or solicitation would be illegal. It does not constitute and shall not be construed as a proposal to make available, offer for subscription or purchase or issue an invitation to subscribe for or purchase securities, nor does it refer and shall not be construed as referring, whether directly or indirectly, to any prospectus in respect of securities of a corporation, an issue, intended issue, offer, intended offer, invitation or intended invitation in respect of securities, or to any other notice that refers to a prospectus in relation to an issue, intended issue, offer, intended offer, invitation or intended invitation in respect of securities.
This Report is furnished solely for your information and no part of this material may be (i) copied, photocopied or duplicated in any form by any means; or (ii) distributed to the press or other media or redistributed by mail, facsimile, electronic or computer transmission or by any other means to any other person without the prior written consent of RHB. By accepting this document you agree to be bound by the foregoing limitations.
MALAYSIA
This document has not been and will not be registered as a prospectus or lodged with the Securities Commission of Malaysia under the Capital Markets and Services Act, 2007 and may not be circulated or distributed to any person in Malaysia other than to specific persons specified under Schedules 6 or 7 of the Capital Markets and Services Act, 2007. The person receiving this document represents and warrants that if it receives this document in Malaysia as a specified person under Schedules 6 or 7 of the Capital Markets and Services Act, 2007. Additionally, the information contained in this Report should not be disclosed by the recipient to any other person.
SINGAPORE
This document has not been and will not be registered as an offering memorandum or prospectus with the Monetary Authority of Singapore under the Securities And Futures Act, Chapter 289 of Singapore (the “SFA”) and accordingly, this document may not be distributed, either directly or indirectly, to the public or any member of the public in Singapore, other than to institutional investors and/or accredited investors (both as defined in Section 4A of the SFA). In Singapore, in accordance, with the provisions of the SFA and the regulations made thereunder. The person receiving this document represents and warrants that if it receives this document in Singapore it is an institutional investor. Additionally, the information contained in this Report should not be disclosed by the recipient to any other person.
HONG KONG
The contents of this document have not been reviewed or approved by any regulatory authority in Hong Kong. This document may not be issued in any manner which is directed at, or the contents of which are likely to be accessed or read by, the public in Hong Kong, and is for distribution only to “professional investors” within the meaning of the Securities and Futures Ordinance (Cap. 571 of the Laws of Hong Kong) of Hong Kong and any rules promulgated thereunder. The person receiving this document represents and warrants that if it receives this document in Hong Kong it is a “professional investor” as defined above. Additionally, the information contained in this Report should not be disclosed by the recipient to any other person.
Panin Bank Syariah 20 November 2013
NO PART OF THIS RESEARCH REPORT MAY BE REPRODUCED OR TAKEN OR TRANSMITTED OUTSIDE MALAYSIA. THIS DOCUMENT HAS BEEN FURNISHED TO YOU SOLELY FOR YOUR INFORMATION AND MAY NOT BE REPRODUCED OR REDISTRIBUTED TO ANY OTHER PERSON.
2
Contents
1. Executive Summary 3
2. Valuation Summar 4
3. Company Profile 5
4. Industry Overview and Outlook 10
5. Key Investment Themes 20
6. Key Risks 21
7. Financial Analysis and Forecasts 23
8. Financial Exhibits 32
9. Appendix 34
Panin Bank Syariah 20 November 2013
NO PART OF THIS RESEARCH REPORT MAY BE REPRODUCED OR TAKEN OR TRANSMITTED OUTSIDE MALAYSIA. THIS DOCUMENT HAS BEEN FURNISHED TO YOU SOLELY FOR YOUR INFORMATION AND MAY NOT BE REPRODUCED OR REDISTRIBUTED TO ANY OTHER PERSON.
3
Executive Summary Panin Bank Syariah (PBS)’s enlarged capital, post IPO, will allow it to: i) develop new products, ii) generate new businesses, iii) expand its footprint, and iv) improve profitability. Indonesia’s favourable demographic profile and supportive regulators provide a solid foundation for the growth of sharia banks. The pathway for robust growth lies ahead, although it is not without challenges.
Riding the strong expansion of sharia banks.The growth of sharia banks in the last several years have outpaced conventional ones, given the: i) rising awareness, ii) deepening penetration, iii) support from regulators, and iv) various untapped pockets of business opportunities. The relative asset size of the former remainssmall – at 5% of the latter – but has been rising steadily. PBS is no exception. Its 3-year CAGR (2010-2013F) for asset, financing, operating revenue are 91%, 124% and 126% respectively. Meanwhile, the bank’s net loss in its first full year of operation (2010) has been turned into profits, with 2013F ROAA and ROAE of 1.6% and 8.1% respectively.
Fresh capital to spawn exciting new businesses. Post-IPO, PBS’ core capital will rise to IDR1trn, which will elevate it to a BUKU II status bank. This opens up an array of new opportunities, which were previously unavailable for PBS. Among many, the bank will now be able to tap into the growing hajj/umroh pilgrim market, develop a bancassurance business and establishan Internet banking platform. The enlarged capital will also enable PBS to grow its footprint, as it aspires to more than double its existing branch network in 2014.
Operates in a favourable environment. Indonesia is the world’s largest Muslim country, with roughly 87% of its ~250m population being adherents of this faith. Yet Islamic banking/financing makes up a mere 6% of conventional bank loans,while nationwide loans-to-GDP is only 35%. This indicates a bright growth potential ahead, as it is in stark contrast to Malaysia where Islamic banks command a 20% market share and where Islamic banking products are more developed. Surveys have suggested that awareness of sharia banks in Indonesia is prevalent.However, understanding and familiarity with their products and principles remain somewhat poor, which suggeststhat it requires a combination of penetration and education to increase the market share of sharia banks in Indonesia.
Regulators are supportive too. Via various regulations and initiatives, Bank Indonesia (BI)– together with the Government – has shown support for sharia banks. In 2008 the Islamic Banking Act was enacted and BI unveiled the Islamic banks developmentmaster plan. Over the past six years the central bank has introduced various regulations to improve prudence in sharia banks, while it encourages their expansion by assigning lower capital costs for shariabank branches.
Staying on the fast lane. PBS’ growth trajectory will remain robust in the next three years, supported by new businesses, expanded network and sufficient capital. We forecast its forward 3-year CAGR (2012-2015F) of financing, asset, operating revenue and net income at 41%, 38%, 68% and 40% respectively. We also expect ROAA/ROAE to expand gradually to 2.0%/8.4%by 2015F.
Valuation. PBS’ existing ROE profile (2013F: 7.4%) is below the estimated cost of equity (ie 14.5%). It is also inferior to both the industry average and the bank’sconventional peers.Therefore, we see it fair to assign no premium over its book value. We estimate PBS’ FV to be approximately IDR1.15trn, which is based on 2014F target P/BV multiple of 1x.
Panin Bank Syariah 20 November 2013
NO PART OF THIS RESEARCH REPORT MAY BE REPRODUCED OR TAKEN OR TRANSMITTED OUTSIDE MALAYSIA. THIS DOCUMENT HAS BEEN FURNISHED TO YOU SOLELY FOR YOUR INFORMATION AND MAY NOT BE REPRODUCED OR REDISTRIBUTED TO ANY OTHER PERSON.
4
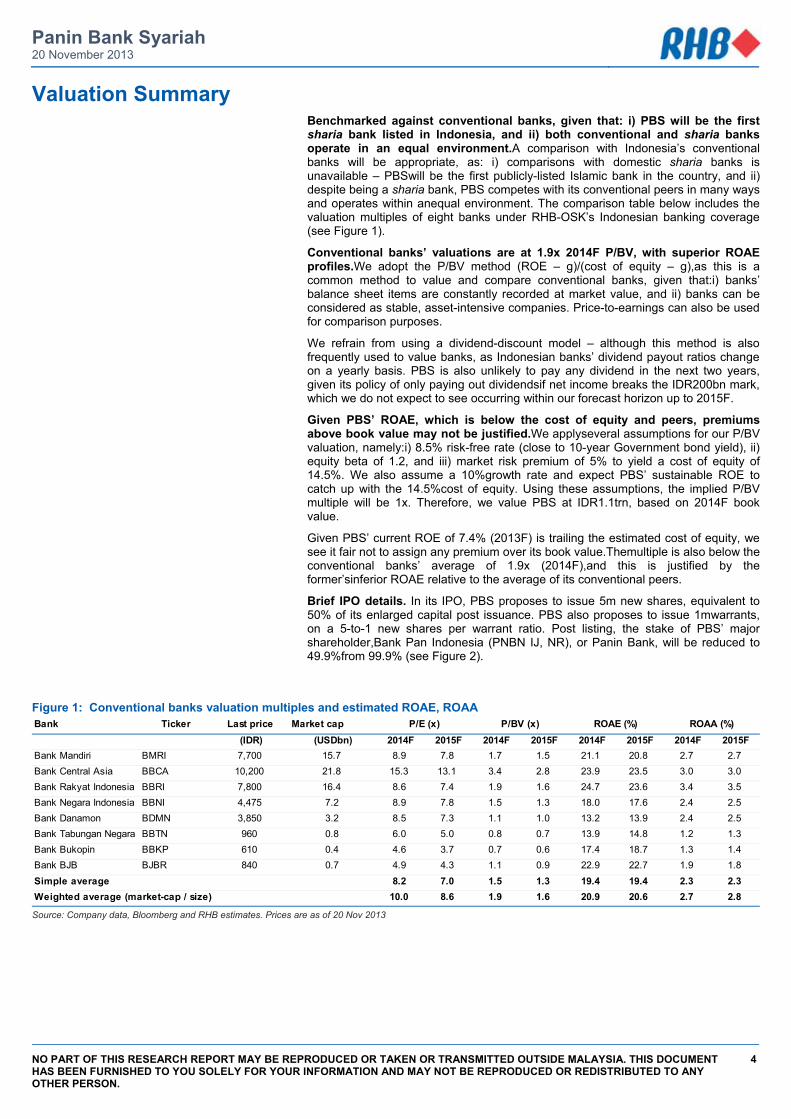
Valuation Summary Benchmarked against conventional banks, given that: i) PBS will be the first sharia bank listed in Indonesia, and ii) both conventional and sharia banks operate in an equal environment.A comparison with Indonesia’s conventional banks will be appropriate, as: i) comparisons with domestic sharia banks is unavailable – PBSwill be the first publicly-listed Islamic bank in the country, and ii) despite being a sharia bank, PBS competes with its conventional peers in many ways and operates within anequal environment. The comparison table below includes the valuation multiples of eight banks under RHB-OSK’s Indonesian banking coverage (see Figure 1).
Conventional banks’ valuations are at 1.9x 2014F P/BV, with superior ROAE profiles.We adopt the P/BV method (ROE – g)/(cost of equity – g),as this is a common method to value and compare conventional banks, given that:i) banks’ balance sheet items are constantly recorded at market value, and ii) banks can be considered as stable, asset-intensive companies. Price-to-earnings can also be used for comparison purposes.
We refrain from using a dividend-discount model – although this method is also frequently used to value banks, as Indonesian banks’ dividend payout ratios change on a yearly basis. PBS is also unlikely to pay any dividend in the next two years, given its policy of only paying out dividendsif net income breaks the IDR200bn mark, which we do not expect to see occurring within our forecast horizon up to 2015F.
Given PBS’ ROAE, which is below the cost of equity and peers, premiums above book value may not be justified.We applyseveral assumptions for our P/BV valuation, namely:i) 8.5% risk-free rate (close to 10-year Government bond yield), ii) equity beta of 1.2, and iii) market risk premium of 5% to yield a cost of equity of 14.5%. We also assume a 10%growth rate and expect PBS’ sustainable ROE to catch up with the 14.5%cost of equity. Using these assumptions, the implied P/BV multiple will be 1x. Therefore, we value PBS at IDR1.1trn, based on 2014F book value.
Given PBS’ current ROE of 7.4% (2013F) is trailing the estimated cost of equity, we see it fair not to assign any premium over its book value.Themultiple is also below the conventional banks’ average of 1.9x (2014F),and this is justified by the former’sinferior ROAE relative to the average of its conventional peers.
Brief IPO details. In its IPO, PBS proposes to issue 5m new shares, equivalent to 50% of its enlarged capital post issuance. PBS also proposes to issue 1mwarrants, on a 5-to-1 new shares per warrant ratio. Post listing, the stake of PBS’ major shareholder,Bank Pan Indonesia (PNBN IJ, NR), or Panin Bank, will be reduced to 49.9%from 99.9% (see Figure 2).
Figure 1: Conventional banks valuation multiples and estimated ROAE, ROAA
Source: Company data, Bloomberg and RHB estimates. Prices are as of 20 Nov 2013
Bank Ticker Last price Market cap(IDR) (USDbn) 2014F 2015F 2014F 2015F 2014F 2015F 2014F 2015F
Bank Mandiri BMRI 7,700 15.7 8.9 7.8 1.7 1.5 21.1 20.8 2.7 2.7Bank Central Asia BBCA 10,200 21.8 15.3 13.1 3.4 2.8 23.9 23.5 3.0 3.0Bank Rakyat Indonesia BBRI 7,800 16.4 8.6 7.4 1.9 1.6 24.7 23.6 3.4 3.5Bank Negara Indonesia BBNI 4,475 7.2 8.9 7.8 1.5 1.3 18.0 17.6 2.4 2.5Bank Danamon BDMN 3,850 3.2 8.5 7.3 1.1 1.0 13.2 13.9 2.4 2.5Bank Tabungan Negara BBTN 960 0.8 6.0 5.0 0.8 0.7 13.9 14.8 1.2 1.3Bank Bukopin BBKP 610 0.4 4.6 3.7 0.7 0.6 17.4 18.7 1.3 1.4Bank BJB BJBR 840 0.7 4.9 4.3 1.1 0.9 22.9 22.7 1.9 1.8Simple average 8.2 7.0 1.5 1.3 19.4 19.4 2.3 2.3
10.0 8.6 1.9 1.6 20.9 20.6 2.7 2.8
P/E (x) P/BV (x) ROAE (%) ROAA (%)
Weighted average (market-cap / size)
Panin Bank Syariah 20 November 2013
NO PART OF THIS RESEARCH REPORT MAY BE REPRODUCED OR TAKEN OR TRANSMITTED OUTSIDE MALAYSIA. THIS DOCUMENT HAS BEEN FURNISHED TO YOU SOLELY FOR YOUR INFORMATION AND MAY NOT BE REPRODUCED OR REDISTRIBUTED TO ANY OTHER PERSON.
5
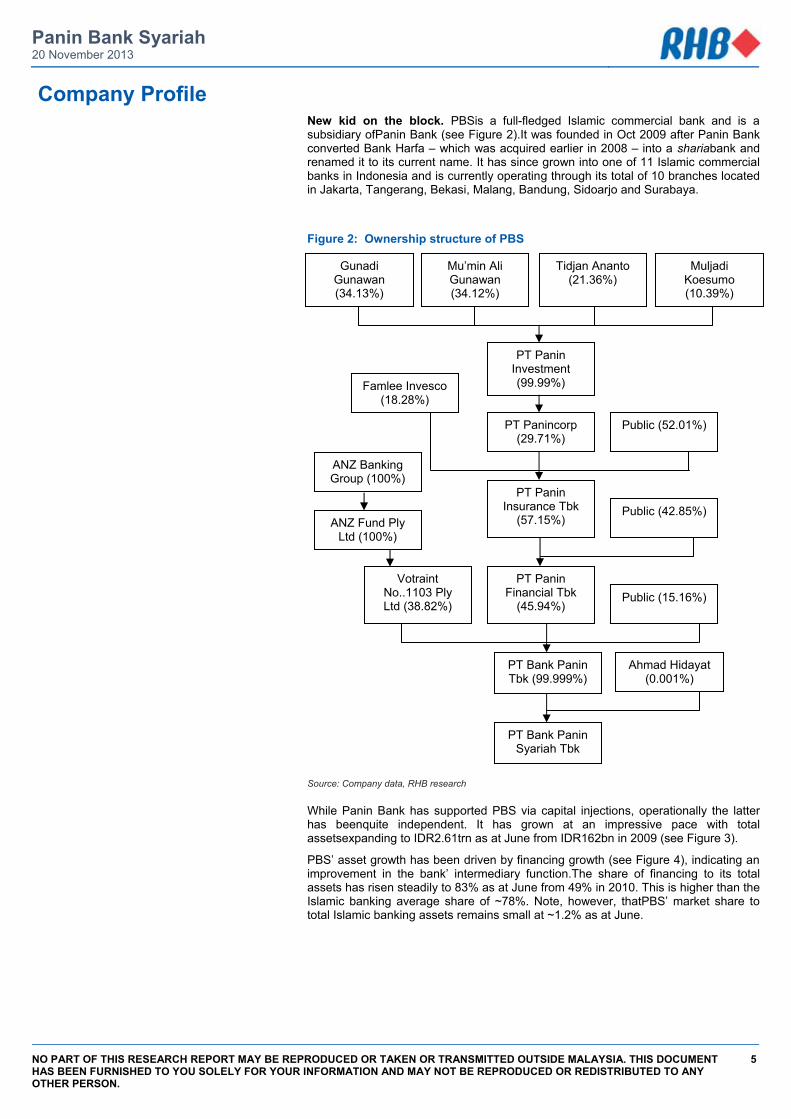
Company Profile New kid on the block. PBSis a full-fledged Islamic commercial bank and is a subsidiary ofPanin Bank (see Figure 2).It was founded in Oct 2009 after Panin Bank converted Bank Harfa – which was acquired earlier in 2008 – into a shariabank and renamed it to its current name. It has since grown into one of 11 Islamic commercial banks in Indonesia and is currently operating through its total of 10 branches located in Jakarta, Tangerang, Bekasi, Malang, Bandung, Sidoarjo and Surabaya.
Figure 2: Ownership structure of PBS
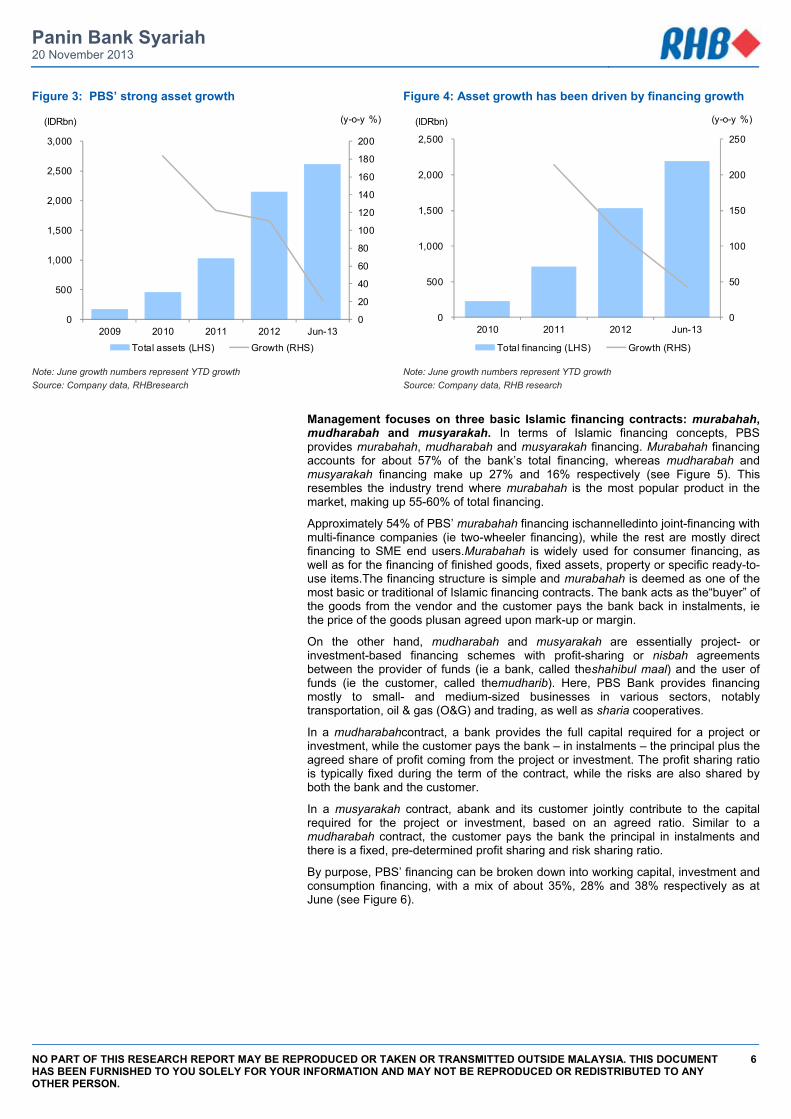
Source: Company data, RHB research While Panin Bank has supported PBS via capital injections, operationally the latter has beenquite independent. It has grown at an impressive pace with total assetsexpanding to IDR2.61trn as at June from IDR162bn in 2009 (see Figure 3).
PBS’ asset growth has been driven by financing growth (see Figure 4), indicating an improvement in the bank’ intermediary function.The share of financing to its total assets has risen steadily to 83% as at June from 49% in 2010. This is higher than the Islamic banking average share of ~78%. Note, however, thatPBS’ market share to total Islamic banking assets remains small at ~1.2% as at June.
Gunadi Gunawan (34.13%)
Mu’min Ali Gunawan (34.12%)
Tidjan Ananto (21.36%)
Muljadi Koesumo (10.39%)
PT Panin Investment (99.99%)
PT Panincorp (29.71%)
Public (52.01%)
Famlee Invesco (18.28%)
PT Panin Insurance Tbk
(57.15%)
PT Panin Financial Tbk
(45.94%)
Public (42.85%)
Public (15.16%) Votraint
No..1103 Ply Ltd (38.82%)
ANZ Fund Ply Ltd (100%)
ANZ Banking Group (100%)
PT Bank Panin Tbk (99.999%)
PT Bank Panin Syariah Tbk
Ahmad Hidayat (0.001%)
Panin Bank Syariah 20 November 2013
NO PART OF THIS RESEARCH REPORT MAY BE REPRODUCED OR TAKEN OR TRANSMITTED OUTSIDE MALAYSIA. THIS DOCUMENT HAS BEEN FURNISHED TO YOU SOLELY FOR YOUR INFORMATION AND MAY NOT BE REPRODUCED OR REDISTRIBUTED TO ANY OTHER PERSON.
6
Figure 3: PBS’ strong asset growth Figure 4: Asset growth has been driven by financing growth
Note: June growth numbers represent YTD growth Source: Company data, RHBresearch
Note: June growth numbers represent YTD growth Source: Company data, RHB research
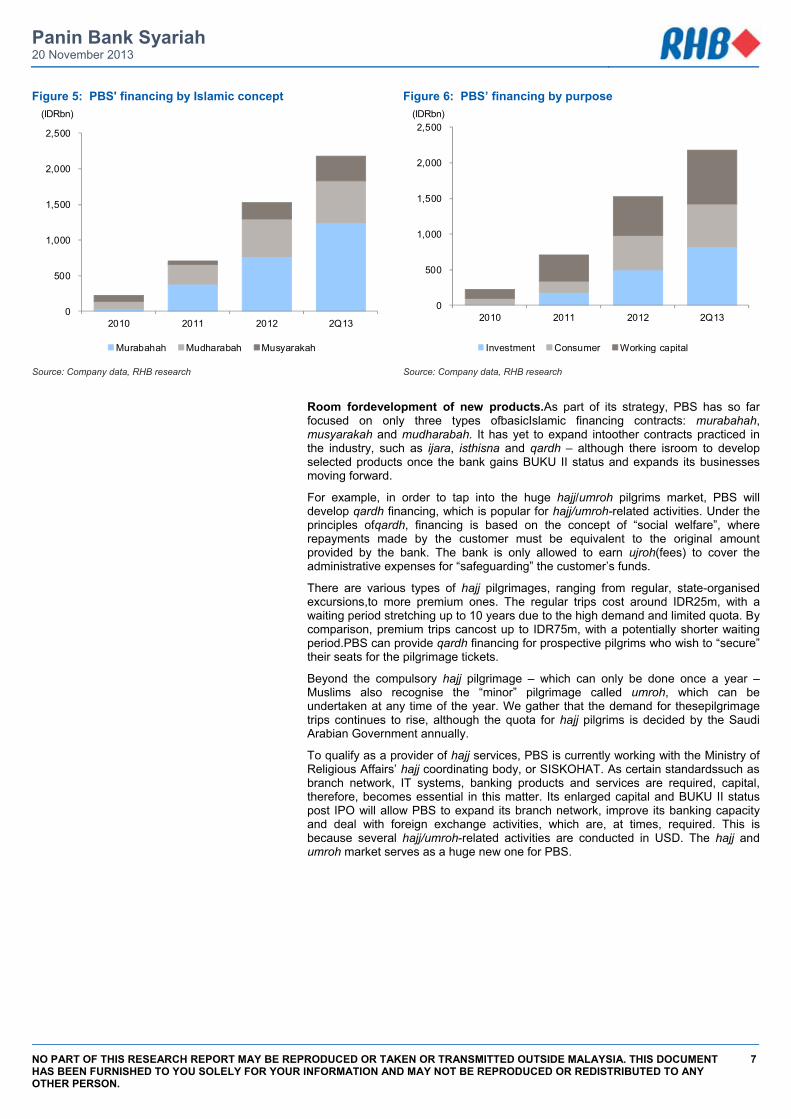
Management focuses on three basic Islamic financing contracts: murabahah, mudharabah and musyarakah. In terms of Islamic financing concepts, PBS provides murabahah, mudharabah and musyarakah financing. Murabahah financing accounts for about 57% of the bank’s total financing, whereas mudharabah and musyarakah financing make up 27% and 16% respectively (see Figure 5). This resembles the industry trend where murabahah is the most popular product in the market, making up 55-60% of total financing.
Approximately 54% of PBS’ murabahah financing ischannelledinto joint-financing with multi-finance companies (ie two-wheeler financing), while the rest are mostly direct financing to SME end users.Murabahah is widely used for consumer financing, as well as for the financing of finished goods, fixed assets, property or specific ready-to-use items.The financing structure is simple and murabahah is deemed as one of the most basic or traditional of Islamic financing contracts. The bank acts as the“buyer” of the goods from the vendor and the customer pays the bank back in instalments, ie the price of the goods plusan agreed upon mark-up or margin.
On the other hand, mudharabah and musyarakah are essentially project- or investment-based financing schemes with profit-sharing or nisbah agreements between the provider of funds (ie a bank, called theshahibul maal) and the user of funds (ie the customer, called themudharib). Here, PBS Bank provides financing mostly to small- and medium-sized businesses in various sectors, notably transportation, oil & gas (O&G) and trading, as well as sharia cooperatives.
In a mudharabahcontract, a bank provides the full capital required for a project or investment, while the customer pays the bank – in instalments – the principal plus the agreed share of profit coming from the project or investment. The profit sharing ratio is typically fixed during the term of the contract, while the risks are also shared by both the bank and the customer.
In a musyarakah contract, abank and its customer jointly contribute to the capital required for the project or investment, based on an agreed ratio. Similar to a mudharabah contract, the customer pays the bank the principal in instalments and there is a fixed, pre-determined profit sharing and risk sharing ratio.
By purpose, PBS’ financing can be broken down into working capital, investment and consumption financing, with a mix of about 35%, 28% and 38% respectively as at June (see Figure 6).
0
20
40
60
80
100
120
140
160
180
200
0
500
1,000
1,500
2,000
2,500
3,000
2009 2010 2011 2012 Jun-13
(y-o-y %)(IDRbn)
Total assets (LHS) Growth (RHS)
0
50
100
150
200
250
0
500
1,000
1,500
2,000
2,500
2010 2011 2012 Jun-13
(y-o-y %)(IDRbn)
Total financing (LHS) Growth (RHS)
Panin Bank Syariah 20 November 2013
NO PART OF THIS RESEARCH REPORT MAY BE REPRODUCED OR TAKEN OR TRANSMITTED OUTSIDE MALAYSIA. THIS DOCUMENT HAS BEEN FURNISHED TO YOU SOLELY FOR YOUR INFORMATION AND MAY NOT BE REPRODUCED OR REDISTRIBUTED TO ANY OTHER PERSON.
7
Figure 5: PBS' financing by Islamic concept Figure 6: PBS’ financing by purpose
Source: Company data, RHB research Source: Company data, RHB research
Room fordevelopment of new products.As part of its strategy, PBS has so far focused on only three types ofbasicIslamic financing contracts: murabahah, musyarakah and mudharabah. It has yet to expand intoother contracts practiced in the industry, such as ijara, isthisna and qardh – although there isroom to develop selected products once the bank gains BUKU II status and expands its businesses moving forward.
For example, in order to tap into the huge hajj/umroh pilgrims market, PBS will develop qardh financing, which is popular for hajj/umroh-related activities. Under the principles ofqardh, financing is based on the concept of “social welfare”, where repayments made by the customer must be equivalent to the original amount provided by the bank. The bank is only allowed to earn ujroh(fees) to cover the administrative expenses for “safeguarding” the customer’s funds.
There are various types of hajj pilgrimages, ranging from regular, state-organised excursions,to more premium ones. The regular trips cost around IDR25m, with a waiting period stretching up to 10 years due to the high demand and limited quota. By comparison, premium trips cancost up to IDR75m, with a potentially shorter waiting period.PBS can provide qardh financing for prospective pilgrims who wish to “secure” their seats for the pilgrimage tickets.
Beyond the compulsory hajj pilgrimage – which can only be done once a year – Muslims also recognise the “minor” pilgrimage called umroh, which can be undertaken at any time of the year. We gather that the demand for thesepilgrimage trips continues to rise, although the quota for hajj pilgrims is decided by the Saudi Arabian Government annually.
To qualify as a provider of hajj services, PBS is currently working with the Ministry of Religious Affairs’ hajj coordinating body, or SISKOHAT. As certain standardssuch as branch network, IT systems, banking products and services are required, capital, therefore, becomes essential in this matter. Its enlarged capital and BUKU II status post IPO will allow PBS to expand its branch network, improve its banking capacity and deal with foreign exchange activities, which are, at times, required. This is because several hajj/umroh-related activities are conducted in USD. The hajj and umroh market serves as a huge new one for PBS.
0
500
1,000
1,500
2,000
2,500
2010 2011 2012 2Q13
(IDRbn)
Murabahah Mudharabah Musyarakah
0
500
1,000
1,500
2,000
2,500
2010 2011 2012 2Q13
(IDRbn)
Investment Consumer Working capital
Panin Bank Syariah 20 November 2013
NO PART OF THIS RESEARCH REPORT MAY BE REPRODUCED OR TAKEN OR TRANSMITTED OUTSIDE MALAYSIA. THIS DOCUMENT HAS BEEN FURNISHED TO YOU SOLELY FOR YOUR INFORMATION AND MAY NOT BE REPRODUCED OR REDISTRIBUTED TO ANY OTHER PERSON.
8
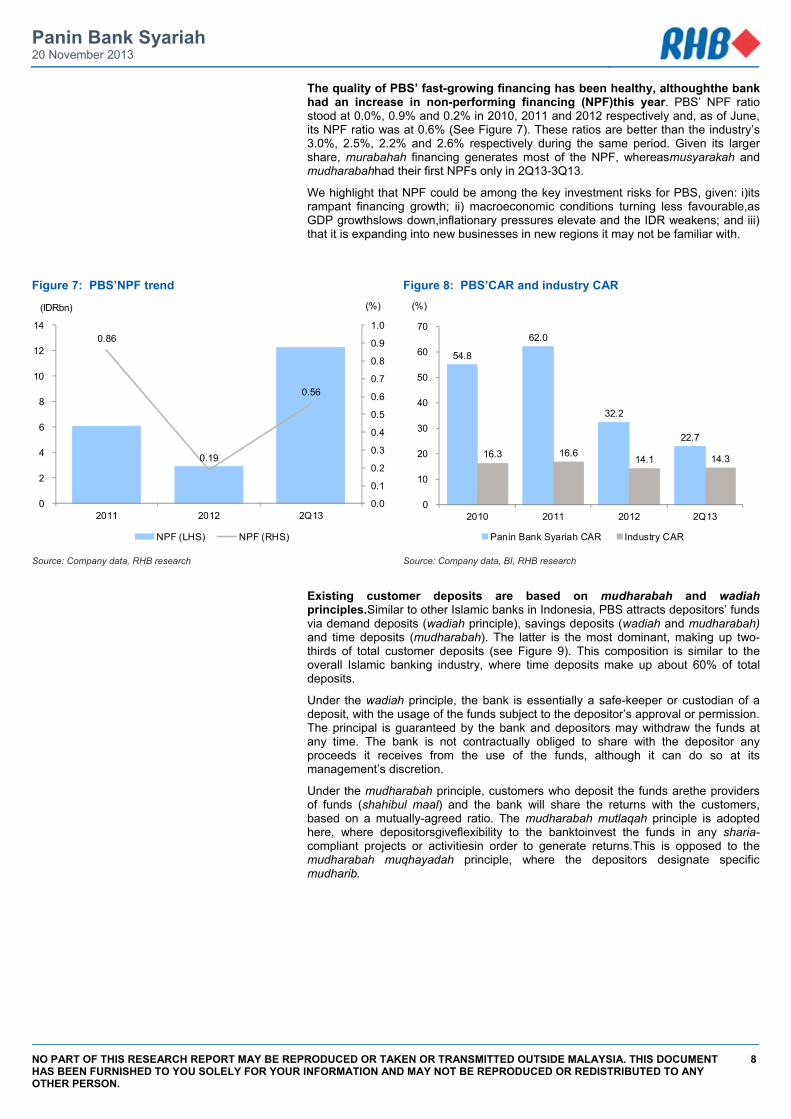
The quality of PBS’ fast-growing financing has been healthy, althoughthe bank had an increase in non-performing financing (NPF)this year. PBS’ NPF ratio stood at 0.0%, 0.9% and 0.2% in 2010, 2011 and 2012 respectively and, as of June, its NPF ratio was at 0.6% (See Figure 7). These ratios are better than the industry’s 3.0%, 2.5%, 2.2% and 2.6% respectively during the same period. Given its larger share, murabahah financing generates most of the NPF, whereasmusyarakah and mudharabahhad their first NPFs only in 2Q13-3Q13.
We highlight that NPF could be among the key investment risks for PBS, given: i)its rampant financing growth; ii) macroeconomic conditions turning less favourable,as GDP growthslows down,inflationary pressures elevate and the IDR weakens; and iii) that it is expanding into new businesses in new regions it may not be familiar with.
Figure 7: PBS’NPF trend Figure 8: PBS’CAR and industry CAR
Source: Company data, RHB research Source: Company data, BI, RHB research
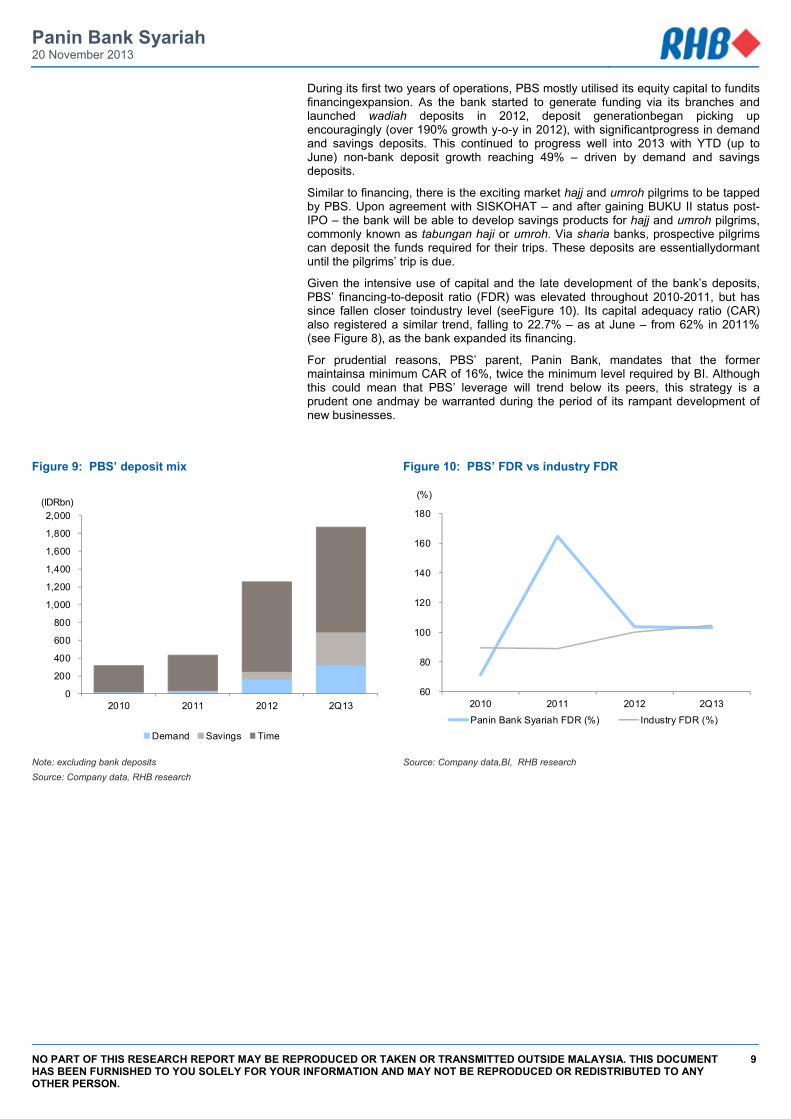
Existing customer deposits are based on mudharabah and wadiah principles.Similar to other Islamic banks in Indonesia, PBS attracts depositors’ funds via demand deposits (wadiah principle), savings deposits (wadiah and mudharabah) and time deposits (mudharabah). The latter is the most dominant, making up two-thirds of total customer deposits (see Figure 9). This composition is similar to the overall Islamic banking industry, where time deposits make up about 60% of total deposits.
Under the wadiah principle, the bank is essentially a safe-keeper or custodian of a deposit, with the usage of the funds subject to the depositor’s approval or permission. The principal is guaranteed by the bank and depositors may withdraw the funds at any time. The bank is not contractually obliged to share with the depositor any proceeds it receives from the use of the funds, although it can do so at its management’s discretion.
Under the mudharabah principle, customers who deposit the funds arethe providers of funds (shahibul maal) and the bank will share the returns with the customers, based on a mutually-agreed ratio. The mudharabah mutlaqah principle is adopted here, where depositorsgiveflexibility to the banktoinvest the funds in any sharia-compliant projects or activitiesin order to generate returns.This is opposed to the mudharabah muqhayadah principle, where the depositors designate specific mudharib.
0.86
0.19
0.56
0.0
0.1
0.2
0.3
0.4
0.5
0.6
0.7
0.8
0.9
1.0
0
2
4
6
8
10
12
14
2011 2012 2Q13
(%)(IDRbn)
NPF (LHS) NPF (RHS)
54.8
62.0
32.2
22.7
16.3 16.6 14.1 14.3
0
10
20
30
40
50
60
70
2010 2011 2012 2Q13
(%)
Panin Bank Syariah CAR Industry CAR
Panin Bank Syariah 20 November 2013
NO PART OF THIS RESEARCH REPORT MAY BE REPRODUCED OR TAKEN OR TRANSMITTED OUTSIDE MALAYSIA. THIS DOCUMENT HAS BEEN FURNISHED TO YOU SOLELY FOR YOUR INFORMATION AND MAY NOT BE REPRODUCED OR REDISTRIBUTED TO ANY OTHER PERSON.
9
During its first two years of operations, PBS mostly utilised its equity capital to fundits financingexpansion. As the bank started to generate funding via its branches and launched wadiah deposits in 2012, deposit generationbegan picking up encouragingly (over 190% growth y-o-y in 2012), with significantprogress in demand and savings deposits. This continued to progress well into 2013 with YTD (up to June) non-bank deposit growth reaching 49% – driven by demand and savings deposits.
Similar to financing, there is the exciting market hajj and umroh pilgrims to be tapped by PBS. Upon agreement with SISKOHAT – and after gaining BUKU II status post-IPO – the bank will be able to develop savings products for hajj and umroh pilgrims, commonly known as tabungan haji or umroh. Via sharia banks, prospective pilgrims can deposit the funds required for their trips. These deposits are essentiallydormant until the pilgrims’ trip is due.
Given the intensive use of capital and the late development of the bank’s deposits, PBS’ financing-to-deposit ratio (FDR) was elevated throughout 2010-2011, but has since fallen closer toindustry level (seeFigure 10). Its capital adequacy ratio (CAR) also registered a similar trend, falling to 22.7% – as at June – from 62% in 2011% (see Figure 8), as the bank expanded its financing.
For prudential reasons, PBS’ parent, Panin Bank, mandates that the former maintainsa minimum CAR of 16%, twice the minimum level required by BI. Although this could mean that PBS’ leverage will trend below its peers, this strategy is a prudent one andmay be warranted during the period of its rampant development of new businesses.
Figure 9: PBS’ deposit mix Figure 10: PBS’ FDR vs industry FDR
Note: excluding bank deposits Source: Company data, RHB research
Source: Company data,BI, RHB research
0
200
400
600
800
1,000
1,200
1,400
1,600
1,800
2,000
2010 2011 2012 2Q13
(IDRbn)
Demand Savings Time
60
80
100
120
140
160
180
2010 2011 2012 2Q13
(%)
Panin Bank Syariah FDR (%) Industry FDR (%)
Panin Bank Syariah 20 November 2013
NO PART OF THIS RESEARCH REPORT MAY BE REPRODUCED OR TAKEN OR TRANSMITTED OUTSIDE MALAYSIA. THIS DOCUMENT HAS BEEN FURNISHED TO YOU SOLELY FOR YOUR INFORMATION AND MAY NOT BE REPRODUCED OR REDISTRIBUTED TO ANY OTHER PERSON.
10
Industry Overview And Outlook
Brief overview of Indonesian Islamic banking industry. The Indonesian Islamic banking industry began in 1991-92, when the first Islamic bank in the country, Bank Muamalat Indonesia, was founded. The country allowsfor the establishment of Islamic banks alongside conventional ones and the landscape remains unchanged until today.
Although Islamic banking started in the early 1990’s, it was only in 2008 that specific regulations concerning Islamic banking (ie Act of Republic of Indonesia Number 21 of 2008) and sukuk were enacted. The Acts not only functions as a legal foundation to develop Islamic banking, but it also suggested that the Government recognised thespecial characteristics and thegrowth potential ofthe sharia banking industry.
The industry has grown via various channels. The major Islamic institutions conducting banking activities have been: i) commercial Islamic banks (bank umum sharia or BUS), which are standalone banks; ii) Islamic banking windows (unit usaha sharia or UUS), which are units within conventional banks that operate under Islamic principles; and iii) Islamic rural banks (bank pembiayaanrakyat sharia or BPRS), which are generally small, localised banks that target certain communities in specific regions.
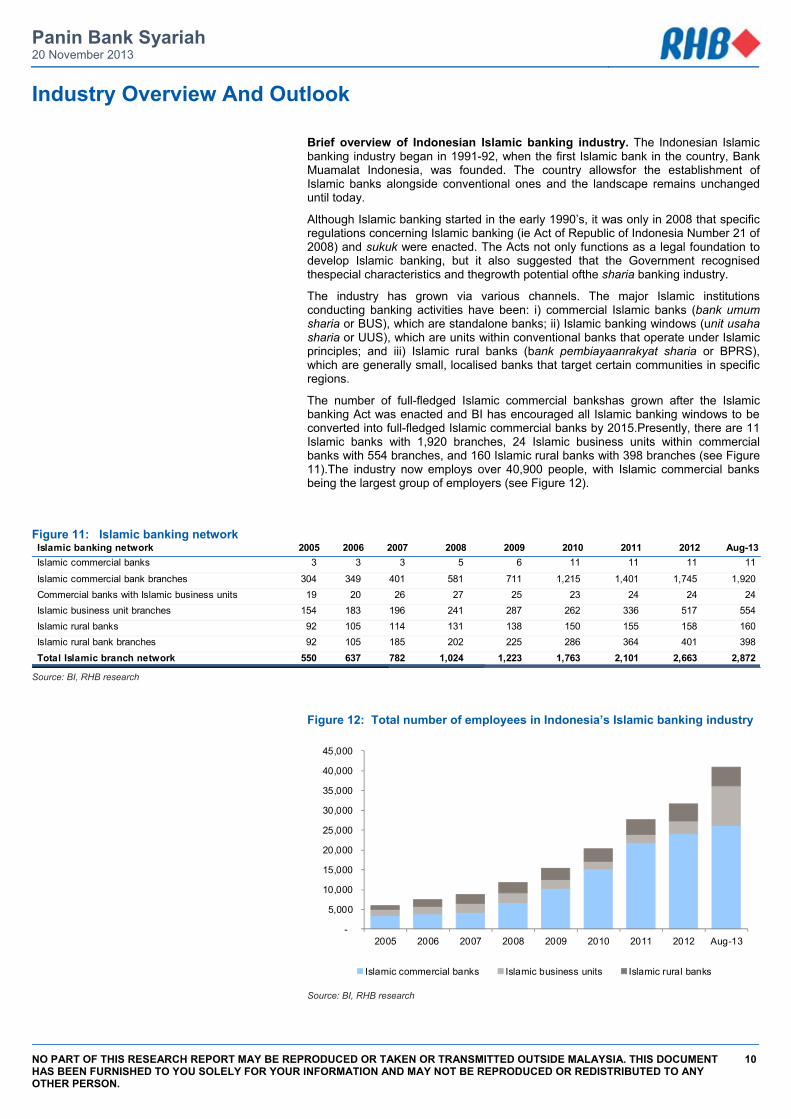
The number of full-fledged Islamic commercial bankshas grown after the Islamic banking Act was enacted and BI has encouraged all Islamic banking windows to be converted into full-fledged Islamic commercial banks by 2015.Presently, there are 11 Islamic banks with 1,920 branches, 24 Islamic business units within commercial banks with 554 branches, and 160 Islamic rural banks with 398 branches (see Figure 11).The industry now employs over 40,900 people, with Islamic commercial banks being the largest group of employers (see Figure 12).
Figure 11: Islamic banking network
Source: BI, RHB research
Figure 12: Total number of employees in Indonesia’s Islamic banking industry
Source: BI, RHB research
Islamic banking network 2005 2006 2007 2008 2009 2010 2011 2012 Aug-13Islamic commercial banks 3 3 3 5 6 11 11 11 11
Islamic commercial bank branches 304 349 401 581 711 1,215 1,401 1,745 1,920 Commercial banks with Islamic business units 19 20 26 27 25 23 24 24 24 Islamic business unit branches 154 183 196 241 287 262 336 517 554 Islamic rural banks 92 105 114 131 138 150 155 158 160 Islamic rural bank branches 92 105 185 202 225 286 364 401 398 Total Islamic branch network 550 637 782 1,024 1,223 1,763 2,101 2,663 2,872
-
5,000
10,000
15,000
20,000
25,000
30,000
35,000
40,000
45,000
2005 2006 2007 2008 2009 2010 2011 2012 Aug-13
Islamic commercial banks Islamic business units Islamic rural banks
Panin Bank Syariah 20 November 2013
NO PART OF THIS RESEARCH REPORT MAY BE REPRODUCED OR TAKEN OR TRANSMITTED OUTSIDE MALAYSIA. THIS DOCUMENT HAS BEEN FURNISHED TO YOU SOLELY FOR YOUR INFORMATION AND MAY NOT BE REPRODUCED OR REDISTRIBUTED TO ANY OTHER PERSON.
11
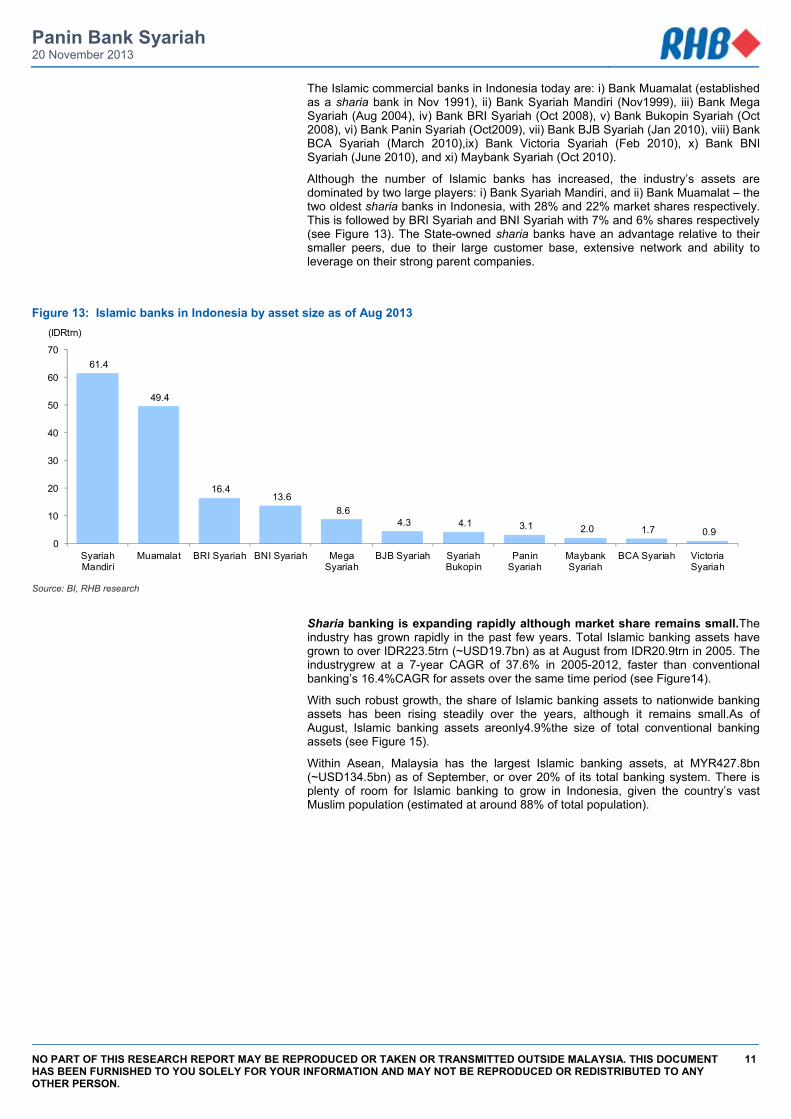
The Islamic commercial banks in Indonesia today are: i) Bank Muamalat (established as a sharia bank in Nov 1991), ii) Bank Syariah Mandiri (Nov1999), iii) Bank Mega Syariah (Aug 2004), iv) Bank BRI Syariah (Oct 2008), v) Bank Bukopin Syariah (Oct 2008), vi) Bank Panin Syariah (Oct2009), vii) Bank BJB Syariah (Jan 2010), viii) Bank BCA Syariah (March 2010),ix) Bank Victoria Syariah (Feb 2010), x) Bank BNI Syariah (June 2010), and xi) Maybank Syariah (Oct 2010).
Although the number of Islamic banks has increased, the industry’s assets are dominated by two large players: i) Bank Syariah Mandiri, and ii) Bank Muamalat – the two oldest sharia banks in Indonesia, with 28% and 22% market shares respectively. This is followed by BRI Syariah and BNI Syariah with 7% and 6% shares respectively (see Figure 13). The State-owned sharia banks have an advantage relative to their smaller peers, due to their large customer base, extensive network and ability to leverage on their strong parent companies.
Figure 13: Islamic banks in Indonesia by asset size as of Aug 2013
Source: BI, RHB research
Sharia banking is expanding rapidly although market share remains small.The industry has grown rapidly in the past few years. Total Islamic banking assets have grown to over IDR223.5trn (~USD19.7bn) as at August from IDR20.9trn in 2005. The industrygrew at a 7-year CAGR of 37.6% in 2005-2012, faster than conventional banking’s 16.4%CAGR for assets over the same time period (see Figure14).
With such robust growth, the share of Islamic banking assets to nationwide banking assets has been rising steadily over the years, although it remains small.As of August, Islamic banking assets areonly4.9%the size of total conventional banking assets (see Figure 15).
Within Asean, Malaysia has the largest Islamic banking assets, at MYR427.8bn (~USD134.5bn) as of September, or over 20% of its total banking system. There is plenty of room for Islamic banking to grow in Indonesia, given the country’s vast Muslim population (estimated at around 88% of total population).
61.4
49.4
16.4 13.6
8.6 4.3 4.1 3.1 2.0 1.7 0.9
0
10
20
30
40
50
60
70
SyariahMandiri
Muamalat BRI Syariah BNI Syariah MegaSyariah
BJB Syariah SyariahBukopin
PaninSyariah
MaybankSyariah
BCA Syariah VictoriaSyariah
(IDRtrn)
Panin Bank Syariah 20 November 2013
NO PART OF THIS RESEARCH REPORT MAY BE REPRODUCED OR TAKEN OR TRANSMITTED OUTSIDE MALAYSIA. THIS DOCUMENT HAS BEEN FURNISHED TO YOU SOLELY FOR YOUR INFORMATION AND MAY NOT BE REPRODUCED OR REDISTRIBUTED TO ANY OTHER PERSON.
12
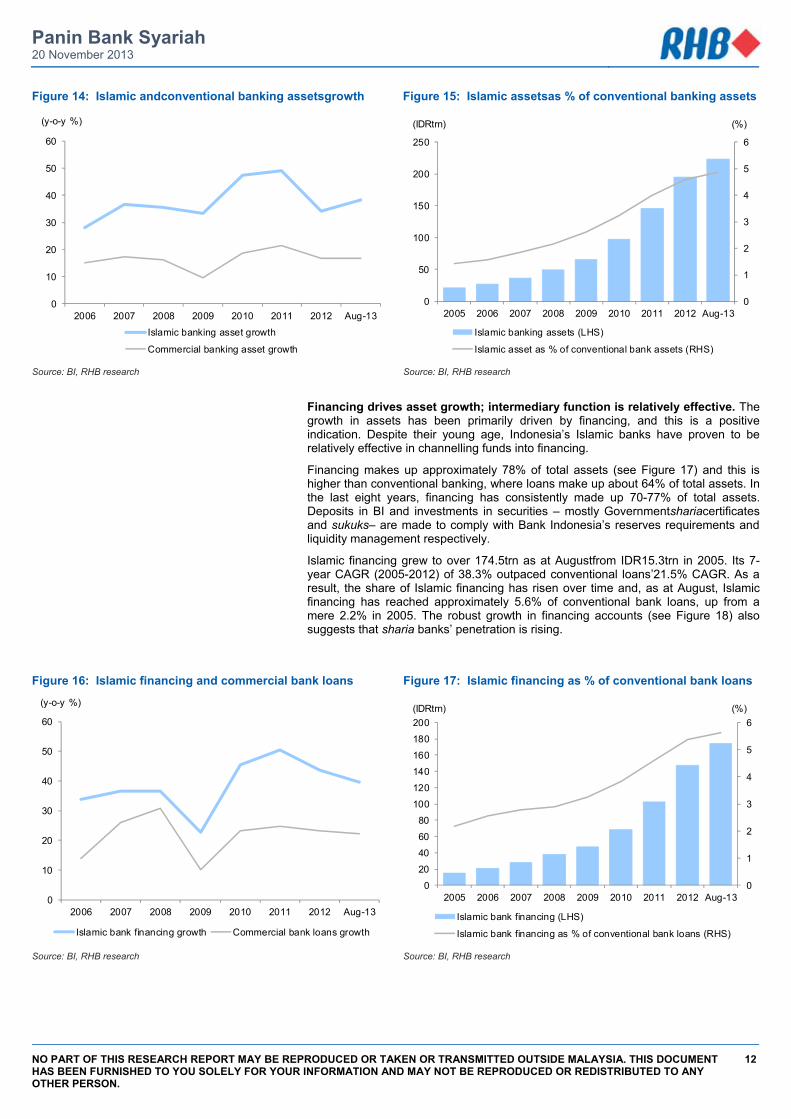
Figure 14: Islamic andconventional banking assetsgrowth Figure 15: Islamic assetsas % of conventional banking assets
Source: BI, RHB research Source: BI, RHB research
Financing drives asset growth; intermediary function is relatively effective. The growth in assets has been primarily driven by financing, and this is a positive indication. Despite their young age, Indonesia’s Islamic banks have proven to be relatively effective in channelling funds into financing.
Financing makes up approximately 78% of total assets (see Figure 17) and this is higher than conventional banking, where loans make up about 64% of total assets. In the last eight years, financing has consistently made up 70-77% of total assets. Deposits in BI and investments in securities – mostly Governmentshariacertificates and sukuks– are made to comply with Bank Indonesia’s reserves requirements and liquidity management respectively.
Islamic financing grew to over 174.5trn as at Augustfrom IDR15.3trn in 2005. Its 7-year CAGR (2005-2012) of 38.3% outpaced conventional loans’21.5% CAGR. As a result, the share of Islamic financing has risen over time and, as at August, Islamic financing has reached approximately 5.6% of conventional bank loans, up from a mere 2.2% in 2005. The robust growth in financing accounts (see Figure 18) also suggests that sharia banks’ penetration is rising.
Figure 16: Islamic financing and commercial bank loans Figure 17: Islamic financing as % of conventional bank loans
Source: BI, RHB research Source: BI, RHB research
0
10
20
30
40
50
60
2006 2007 2008 2009 2010 2011 2012 Aug-13
(y-o-y %)
Islamic banking asset growth
Commercial banking asset growth
0
1
2
3
4
5
6
0
50
100
150
200
250
2005 2006 2007 2008 2009 2010 2011 2012 Aug-13
(%)(IDRtrn)
Islamic banking assets (LHS)
Islamic asset as % of conventional bank assets (RHS)
0
10
20
30
40
50
60
2006 2007 2008 2009 2010 2011 2012 Aug-13
(y-o-y %)
Islamic bank financing growth Commercial bank loans growth
0
1
2
3
4
5
6
0
20
40
60
80
100
120
140
160
180
200
2005 2006 2007 2008 2009 2010 2011 2012 Aug-13
(%)(IDRtrn)
Islamic bank financing (LHS)
Islamic bank financing as % of conventional bank loans (RHS)
Panin Bank Syariah 20 November 2013
NO PART OF THIS RESEARCH REPORT MAY BE REPRODUCED OR TAKEN OR TRANSMITTED OUTSIDE MALAYSIA. THIS DOCUMENT HAS BEEN FURNISHED TO YOU SOLELY FOR YOUR INFORMATION AND MAY NOT BE REPRODUCED OR REDISTRIBUTED TO ANY OTHER PERSON.
13
Figure 18: Growth of financing accounts in Islamic banks Figure 19: Composition of assets in Islamic banks
Source: BI, RHB research Source: BI, RHB research
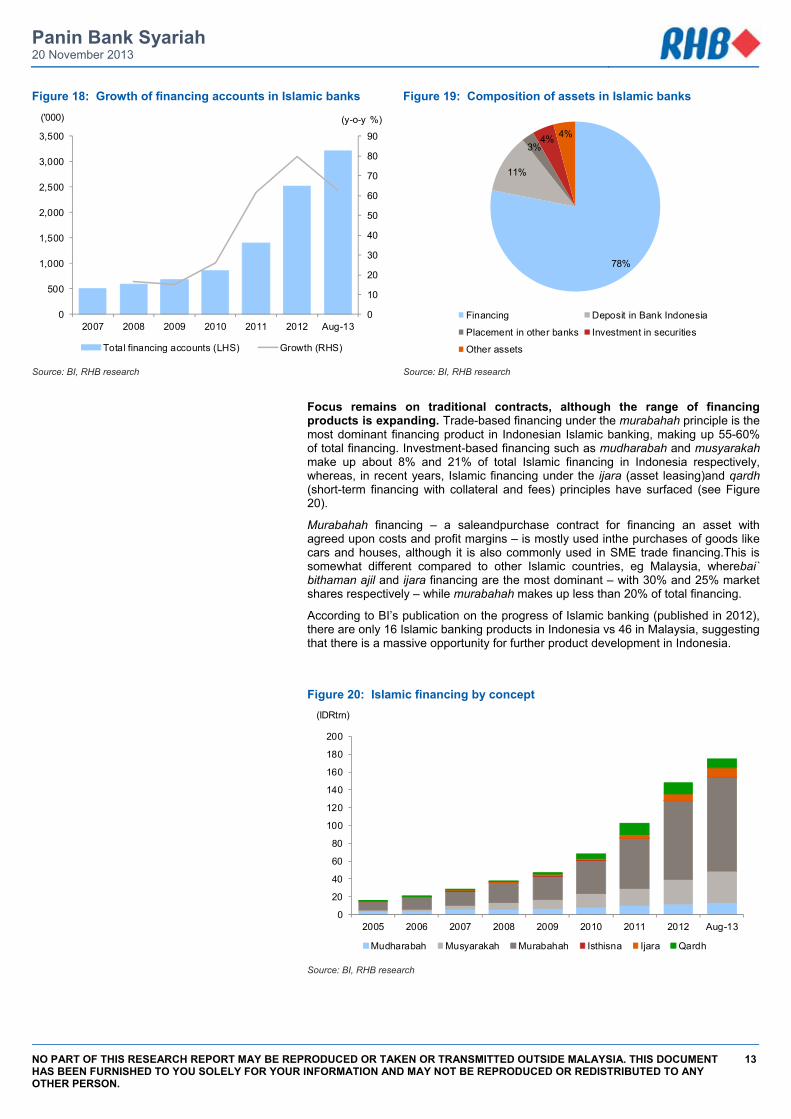
Focus remains on traditional contracts, although the range of financing products is expanding. Trade-based financing under the murabahah principle is the most dominant financing product in Indonesian Islamic banking, making up 55-60% of total financing. Investment-based financing such as mudharabah and musyarakah make up about 8% and 21% of total Islamic financing in Indonesia respectively, whereas, in recent years, Islamic financing under the ijara (asset leasing)and qardh (short-term financing with collateral and fees) principles have surfaced (see Figure 20).
Murabahah financing – a saleandpurchase contract for financing an asset with agreed upon costs and profit margins – is mostly used inthe purchases of goods like cars and houses, although it is also commonly used in SME trade financing.This is somewhat different compared to other Islamic countries, eg Malaysia, wherebai` bithaman ajil and ijara financing are the most dominant – with 30% and 25% market shares respectively – while murabahah makes up less than 20% of total financing.
According to BI’s publication on the progress of Islamic banking (published in 2012), there are only 16 Islamic banking products in Indonesia vs 46 in Malaysia, suggesting that there is a massive opportunity for further product development in Indonesia.
Figure 20: Islamic financing by concept
Source: BI, RHB research
0
10
20
30
40
50
60
70
80
90
0
500
1,000
1,500
2,000
2,500
3,000
3,500
2007 2008 2009 2010 2011 2012 Aug-13
(y-o-y %)('000)
Total financing accounts (LHS) Growth (RHS)
78%
11%
3%4% 4%
Financing Deposit in Bank Indonesia
Placement in other banks Investment in securities
Other assets
0
20
40
60
80
100
120
140
160
180
200
2005 2006 2007 2008 2009 2010 2011 2012 Aug-13
(IDRtrn)
Mudharabah Musyarakah Murabahah Isthisna Ijara Qardh
Panin Bank Syariah 20 November 2013
NO PART OF THIS RESEARCH REPORT MAY BE REPRODUCED OR TAKEN OR TRANSMITTED OUTSIDE MALAYSIA. THIS DOCUMENT HAS BEEN FURNISHED TO YOU SOLELY FOR YOUR INFORMATION AND MAY NOT BE REPRODUCED OR REDISTRIBUTED TO ANY OTHER PERSON.
14
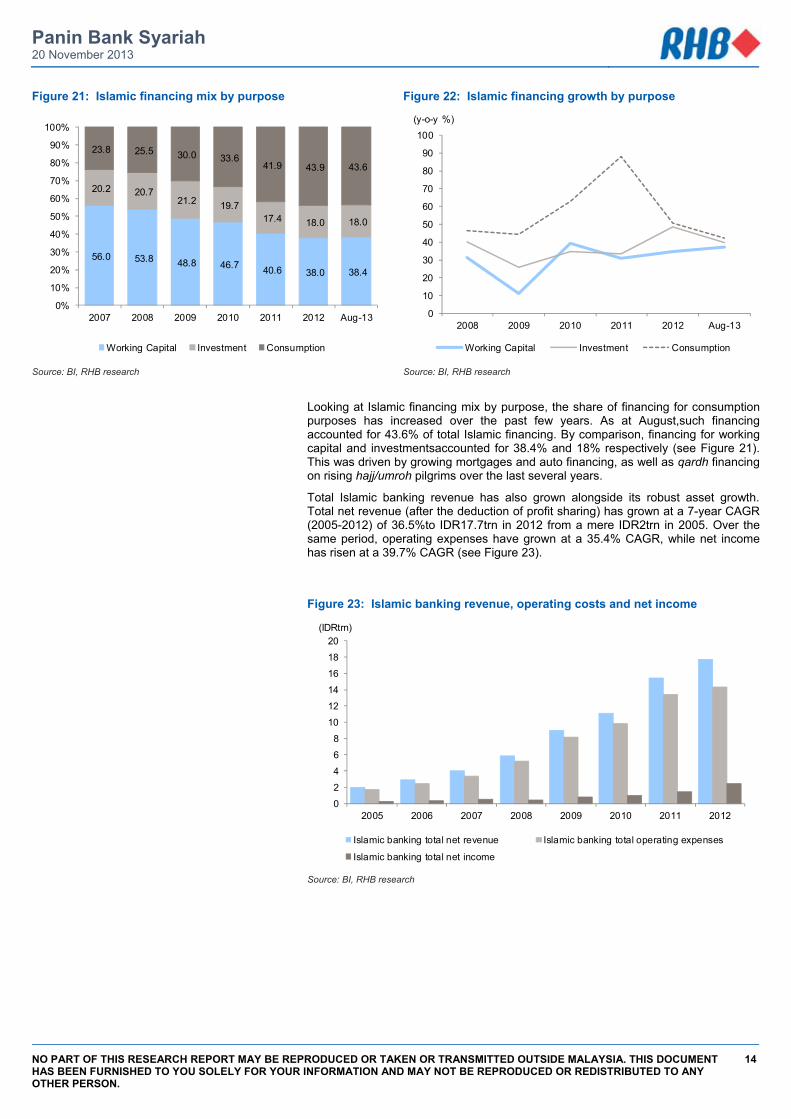
Figure 21: Islamic financing mix by purpose Figure 22: Islamic financing growth by purpose
Source: BI, RHB research Source: BI, RHB research
Looking at Islamic financing mix by purpose, the share of financing for consumption purposes has increased over the past few years. As at August,such financing accounted for 43.6% of total Islamic financing. By comparison, financing for working capital and investmentsaccounted for 38.4% and 18% respectively (see Figure 21). This was driven by growing mortgages and auto financing, as well as qardh financing on rising hajj/umroh pilgrims over the last several years.
Total Islamic banking revenue has also grown alongside its robust asset growth. Total net revenue (after the deduction of profit sharing) has grown at a 7-year CAGR (2005-2012) of 36.5%to IDR17.7trn in 2012 from a mere IDR2trn in 2005. Over the same period, operating expenses have grown at a 35.4% CAGR, while net income has risen at a 39.7% CAGR (see Figure 23).
Figure 23: Islamic banking revenue, operating costs and net income
Source: BI, RHB research
56.0 53.8 48.8 46.7 40.6 38.0 38.4
20.2 20.7 21.2 19.7
17.4 18.0 18.0
23.8 25.5 30.0 33.6 41.9 43.9 43.6
0%
10%
20%
30%
40%
50%
60%
70%
80%
90%
100%
2007 2008 2009 2010 2011 2012 Aug-13
Working Capital Investment Consumption
0
10
20
30
40
50
60
70
80
90
100
2008 2009 2010 2011 2012 Aug-13
(y-o-y %)
Working Capital Investment Consumption
0
2
4
6
8
10
12
14
16
18
20
2005 2006 2007 2008 2009 2010 2011 2012
(IDRtrn)
Islamic banking total net revenue Islamic banking total operating expenses
Islamic banking total net income
Panin Bank Syariah 20 November 2013
NO PART OF THIS RESEARCH REPORT MAY BE REPRODUCED OR TAKEN OR TRANSMITTED OUTSIDE MALAYSIA. THIS DOCUMENT HAS BEEN FURNISHED TO YOU SOLELY FOR YOUR INFORMATION AND MAY NOT BE REPRODUCED OR REDISTRIBUTED TO ANY OTHER PERSON.
15
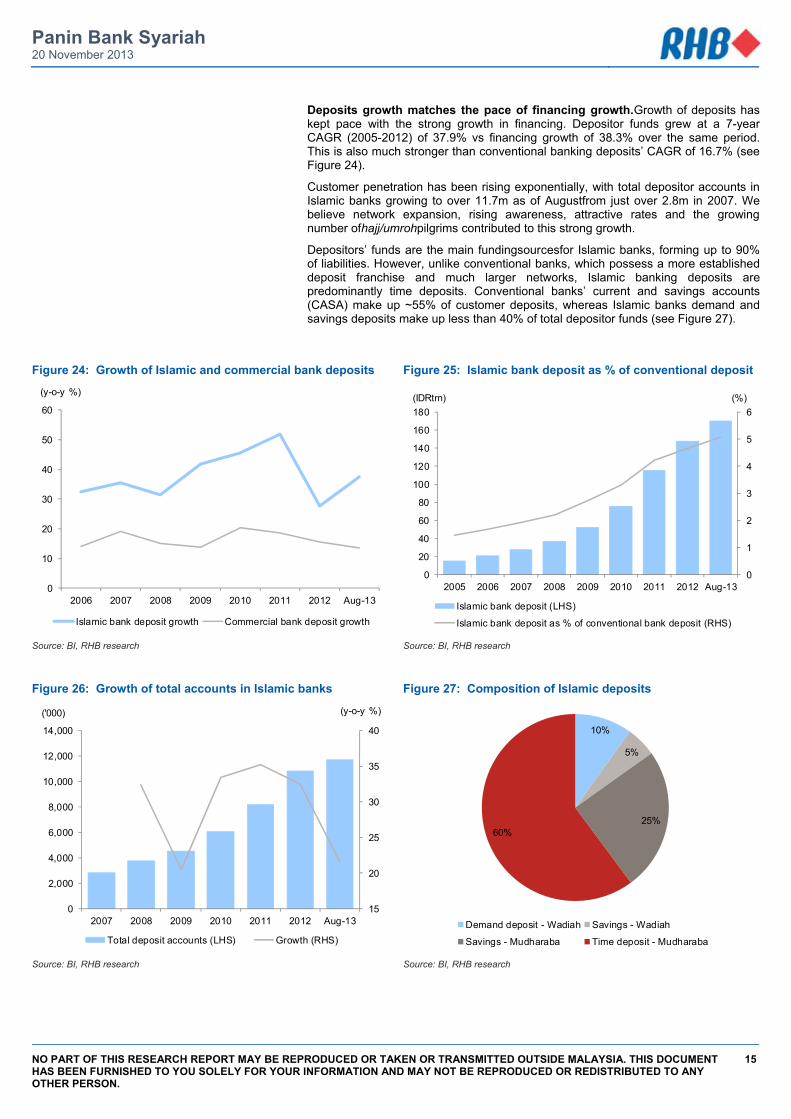
Deposits growth matches the pace of financing growth.Growth of deposits has kept pace with the strong growth in financing. Depositor funds grew at a 7-year CAGR (2005-2012) of 37.9% vs financing growth of 38.3% over the same period. This is also much stronger than conventional banking deposits’ CAGR of 16.7% (see Figure 24).
Customer penetration has been rising exponentially, with total depositor accounts in Islamic banks growing to over 11.7m as of Augustfrom just over 2.8m in 2007. We believe network expansion, rising awareness, attractive rates and the growing number ofhajj/umrohpilgrims contributed to this strong growth.
Depositors’ funds are the main fundingsourcesfor Islamic banks, forming up to 90% of liabilities. However, unlike conventional banks, which possess a more established deposit franchise and much larger networks, Islamic banking deposits are predominantly time deposits. Conventional banks’ current and savings accounts (CASA) make up ~55% of customer deposits, whereas Islamic banks demand and savings deposits make up less than 40% of total depositor funds (see Figure 27).
Figure 24: Growth of Islamic and commercial bank deposits Figure 25: Islamic bank deposit as % of conventional deposit
Source: BI, RHB research Source: BI, RHB research
Figure 26: Growth of total accounts in Islamic banks Figure 27: Composition of Islamic deposits
Source: BI, RHB research Source: BI, RHB research
0
10
20
30
40
50
60
2006 2007 2008 2009 2010 2011 2012 Aug-13
(y-o-y %)
Islamic bank deposit growth Commercial bank deposit growth
0
1
2
3
4
5
6
0
20
40
60
80
100
120
140
160
180
2005 2006 2007 2008 2009 2010 2011 2012 Aug-13
(%)(IDRtrn)
Islamic bank deposit (LHS)
Islamic bank deposit as % of conventional bank deposit (RHS)
15
20
25
30
35
40
0
2,000
4,000
6,000
8,000
10,000
12,000
14,000
2007 2008 2009 2010 2011 2012 Aug-13
(y-o-y %)('000)
Total deposit accounts (LHS) Growth (RHS)
10%
5%
25%60%
Demand deposit - Wadiah Savings - Wadiah
Savings - Mudharaba Time deposit - Mudharaba
Panin Bank Syariah 20 November 2013
NO PART OF THIS RESEARCH REPORT MAY BE REPRODUCED OR TAKEN OR TRANSMITTED OUTSIDE MALAYSIA. THIS DOCUMENT HAS BEEN FURNISHED TO YOU SOLELY FOR YOUR INFORMATION AND MAY NOT BE REPRODUCED OR REDISTRIBUTED TO ANY OTHER PERSON.
16
Figure 28: Financing growth, deposit growth and FDR ratio
Source: BI, RHB research
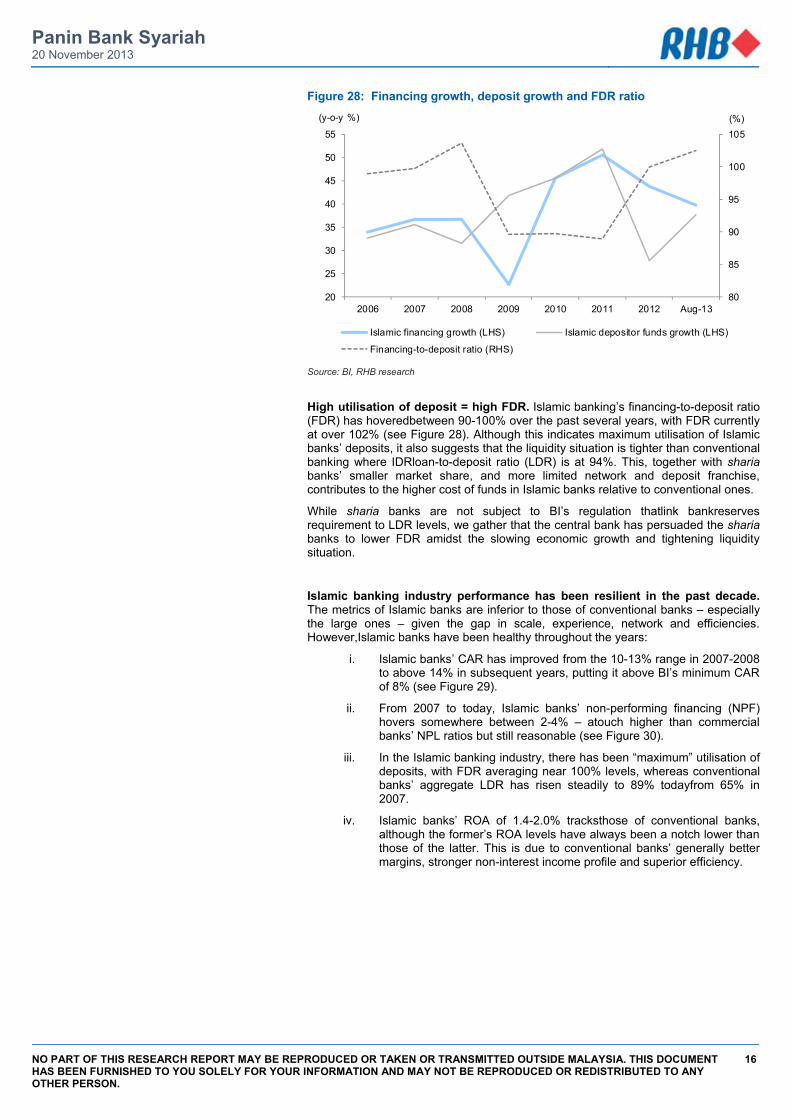
High utilisation of deposit = high FDR. Islamic banking’s financing-to-deposit ratio (FDR) has hoveredbetween 90-100% over the past several years, with FDR currently at over 102% (see Figure 28). Although this indicates maximum utilisation of Islamic banks’ deposits, it also suggests that the liquidity situation is tighter than conventional banking where IDRloan-to-deposit ratio (LDR) is at 94%. This, together with sharia banks’ smaller market share, and more limited network and deposit franchise, contributes to the higher cost of funds in Islamic banks relative to conventional ones.
While sharia banks are not subject to BI’s regulation thatlink bankreserves requirement to LDR levels, we gather that the central bank has persuaded the sharia banks to lower FDR amidst the slowing economic growth and tightening liquidity situation.
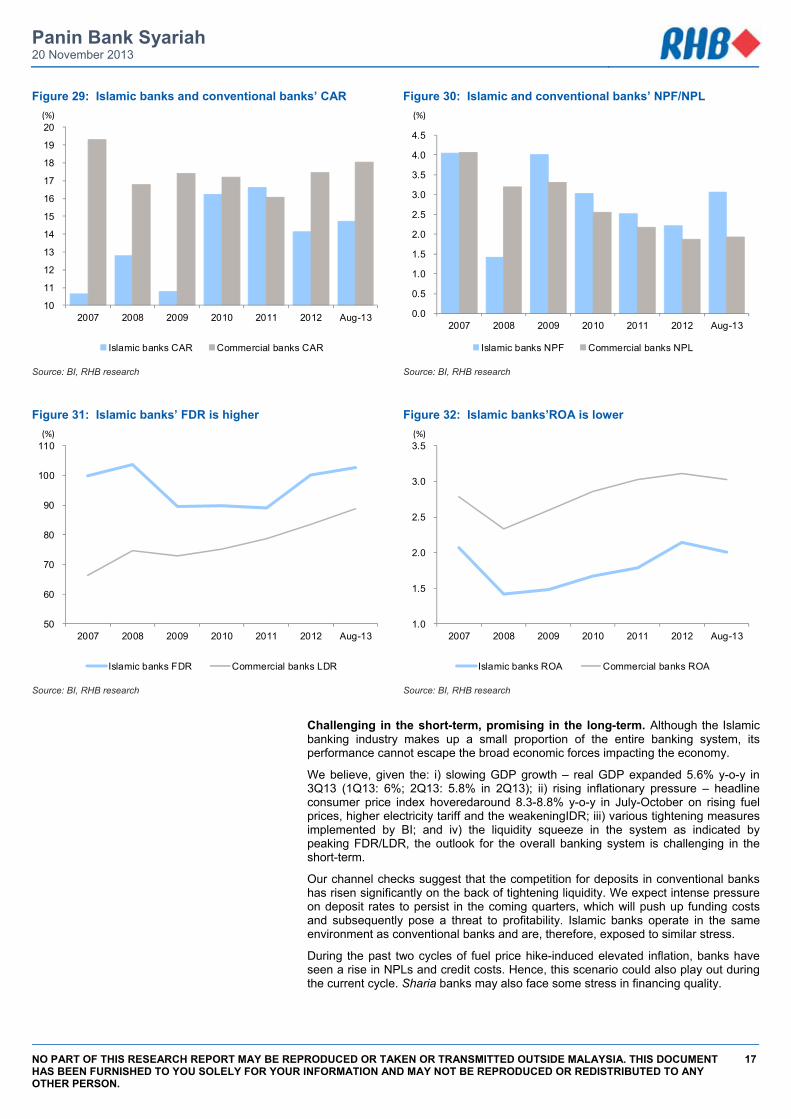
Islamic banking industry performance has been resilient in the past decade. The metrics of Islamic banks are inferior to those of conventional banks – especially the large ones – given the gap in scale, experience, network and efficiencies. However,Islamic banks have been healthy throughout the years:
i. Islamic banks’ CAR has improved from the 10-13% range in 2007-2008 to above 14% in subsequent years, putting it above BI’s minimum CAR of 8% (see Figure 29).
ii. From 2007 to today, Islamic banks’ non-performing financing (NPF) hovers somewhere between 2-4% – atouch higher than commercial banks’ NPL ratios but still reasonable (see Figure 30).
iii. In the Islamic banking industry, there has been “maximum” utilisation of deposits, with FDR averaging near 100% levels, whereas conventional banks’ aggregate LDR has risen steadily to 89% todayfrom 65% in 2007.
iv. Islamic banks’ ROA of 1.4-2.0% tracksthose of conventional banks, although the former’s ROA levels have always been a notch lower than those of the latter. This is due to conventional banks’ generally better margins, stronger non-interest income profile and superior efficiency.
80
85
90
95
100
105
20
25
30
35
40
45
50
55
2006 2007 2008 2009 2010 2011 2012 Aug-13
(%)(y-o-y %)
Islamic financing growth (LHS) Islamic depositor funds growth (LHS)
Financing-to-deposit ratio (RHS)
Panin Bank Syariah 20 November 2013
NO PART OF THIS RESEARCH REPORT MAY BE REPRODUCED OR TAKEN OR TRANSMITTED OUTSIDE MALAYSIA. THIS DOCUMENT HAS BEEN FURNISHED TO YOU SOLELY FOR YOUR INFORMATION AND MAY NOT BE REPRODUCED OR REDISTRIBUTED TO ANY OTHER PERSON.
17
Figure 29: Islamic banks and conventional banks’ CAR Figure 30: Islamic and conventional banks’ NPF/NPL
Source: BI, RHB research Source: BI, RHB research
Figure 31: Islamic banks’ FDR is higher Figure 32: Islamic banks’ROA is lower
Source: BI, RHB research Source: BI, RHB research
Challenging in the short-term, promising in the long-term. Although the Islamic banking industry makes up a small proportion of the entire banking system, its performance cannot escape the broad economic forces impacting the economy.
We believe, given the: i) slowing GDP growth – real GDP expanded 5.6% y-o-y in 3Q13 (1Q13: 6%; 2Q13: 5.8% in 2Q13); ii) rising inflationary pressure – headline consumer price index hoveredaround 8.3-8.8% y-o-y in July-October on rising fuel prices, higher electricity tariff and the weakeningIDR; iii) various tightening measures implemented by BI; and iv) the liquidity squeeze in the system as indicated by peaking FDR/LDR, the outlook for the overall banking system is challenging in the short-term.
Our channel checks suggest that the competition for deposits in conventional banks has risen significantly on the back of tightening liquidity. We expect intense pressure on deposit rates to persist in the coming quarters, which will push up funding costs and subsequently pose a threat to profitability. Islamic banks operate in the same environment as conventional banks and are, therefore, exposed to similar stress.
During the past two cycles of fuel price hike-induced elevated inflation, banks have seen a rise in NPLs and credit costs. Hence, this scenario could also play out during the current cycle. Sharia banks may also face some stress in financing quality.
10
11
12
13
14
15
16
17
18
19
20
2007 2008 2009 2010 2011 2012 Aug-13
(%)
Islamic banks CAR Commercial banks CAR
0.0
0.5
1.0
1.5
2.0
2.5
3.0
3.5
4.0
4.5
2007 2008 2009 2010 2011 2012 Aug-13
(%)
Islamic banks NPF Commercial banks NPL
50
60
70
80
90
100
110
2007 2008 2009 2010 2011 2012 Aug-13
(%)
Islamic banks FDR Commercial banks LDR
1.0
1.5
2.0
2.5
3.0
3.5
2007 2008 2009 2010 2011 2012 Aug-13
(%)
Islamic banks ROA Commercial banks ROA
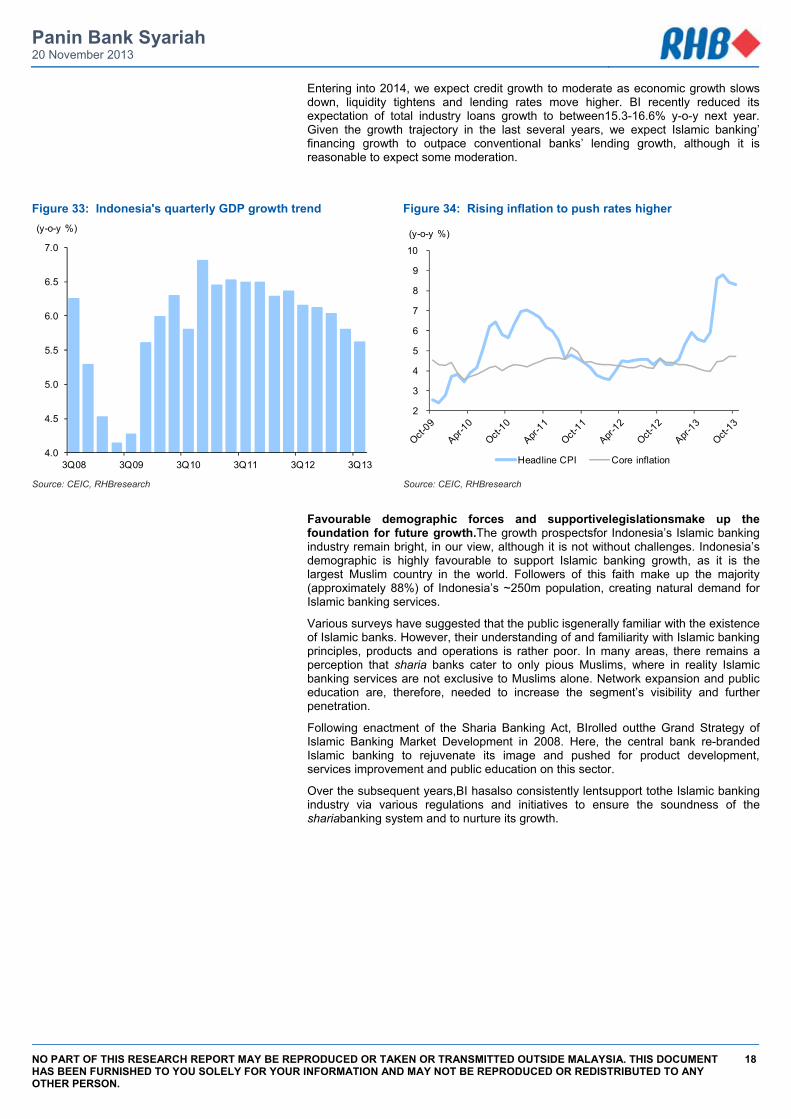
Panin Bank Syariah 20 November 2013
NO PART OF THIS RESEARCH REPORT MAY BE REPRODUCED OR TAKEN OR TRANSMITTED OUTSIDE MALAYSIA. THIS DOCUMENT HAS BEEN FURNISHED TO YOU SOLELY FOR YOUR INFORMATION AND MAY NOT BE REPRODUCED OR REDISTRIBUTED TO ANY OTHER PERSON.
18
Entering into 2014, we expect credit growth to moderate as economic growth slows down, liquidity tightens and lending rates move higher. BI recently reduced its expectation of total industry loans growth to between15.3-16.6% y-o-y next year. Given the growth trajectory in the last several years, we expect Islamic banking’ financing growth to outpace conventional banks’ lending growth, although it is reasonable to expect some moderation.
Figure 33: Indonesia's quarterly GDP growth trend Figure 34: Rising inflation to push rates higher
Source: CEIC, RHBresearch Source: CEIC, RHBresearch
Favourable demographic forces and supportivelegislationsmake up the foundation for future growth.The growth prospectsfor Indonesia’s Islamic banking industry remain bright, in our view, although it is not without challenges. Indonesia’s demographic is highly favourable to support Islamic banking growth, as it is the largest Muslim country in the world. Followers of this faith make up the majority (approximately 88%) of Indonesia’s ~250m population, creating natural demand for Islamic banking services.
Various surveys have suggested that the public isgenerally familiar with the existence of Islamic banks. However, their understanding of and familiarity with Islamic banking principles, products and operations is rather poor. In many areas, there remains a perception that sharia banks cater to only pious Muslims, where in reality Islamic banking services are not exclusive to Muslims alone. Network expansion and public education are, therefore, needed to increase the segment’s visibility and further penetration.
Following enactment of the Sharia Banking Act, BIrolled outthe Grand Strategy of Islamic Banking Market Development in 2008. Here, the central bank re-branded Islamic banking to rejuvenate its image and pushed for product development, services improvement and public education on this sector.
Over the subsequent years,BI hasalso consistently lentsupport tothe Islamic banking industry via various regulations and initiatives to ensure the soundness of the shariabanking system and to nurture its growth.
4.0
4.5
5.0
5.5
6.0
6.5
7.0
3Q08 3Q09 3Q10 3Q11 3Q12 3Q13
(y-o-y %)
2
3
4
5
6
7
8
9
10
(y-o-y %)
Headline CPI Core inflation
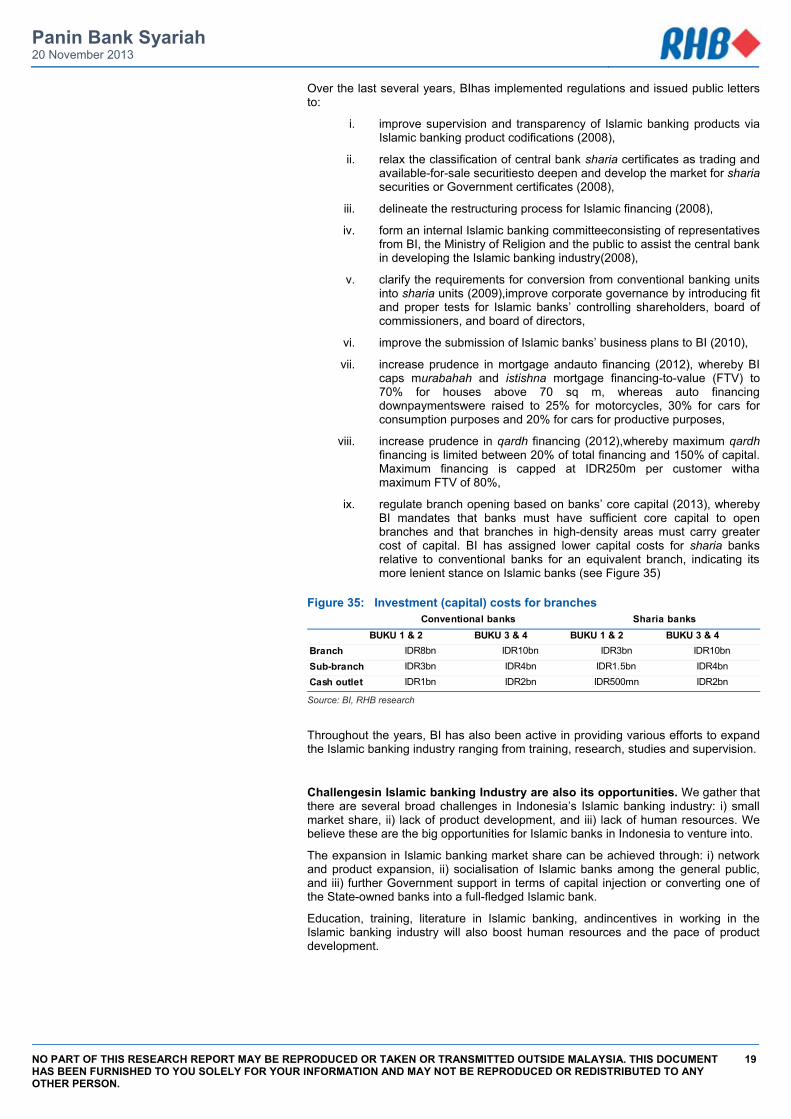
Panin Bank Syariah 20 November 2013
NO PART OF THIS RESEARCH REPORT MAY BE REPRODUCED OR TAKEN OR TRANSMITTED OUTSIDE MALAYSIA. THIS DOCUMENT HAS BEEN FURNISHED TO YOU SOLELY FOR YOUR INFORMATION AND MAY NOT BE REPRODUCED OR REDISTRIBUTED TO ANY OTHER PERSON.
19
Over the last several years, BIhas implemented regulations and issued public letters to:
i. improve supervision and transparency of Islamic banking products via Islamic banking product codifications (2008),
ii. relax the classification of central bank sharia certificates as trading and available-for-sale securitiesto deepen and develop the market for sharia securities or Government certificates (2008),
iii. delineate the restructuring process for Islamic financing (2008),
iv. form an internal Islamic banking committeeconsisting of representatives from BI, the Ministry of Religion and the public to assist the central bank in developing the Islamic banking industry(2008),
v. clarify the requirements for conversion from conventional banking units into sharia units (2009),improve corporate governance by introducing fit and proper tests for Islamic banks’ controlling shareholders, board of commissioners, and board of directors,
vi. improve the submission of Islamic banks’ business plans to BI (2010),
vii. increase prudence in mortgage andauto financing (2012), whereby BI caps murabahah and istishna mortgage financing-to-value (FTV) to 70% for houses above 70 sq m, whereas auto financing downpaymentswere raised to 25% for motorcycles, 30% for cars for consumption purposes and 20% for cars for productive purposes,
viii. increase prudence in qardh financing (2012),whereby maximum qardh financing is limited between 20% of total financing and 150% of capital. Maximum financing is capped at IDR250m per customer witha maximum FTV of 80%,
ix. regulate branch opening based on banks’ core capital (2013), whereby BI mandates that banks must have sufficient core capital to open branches and that branches in high-density areas must carry greater cost of capital. BI has assigned lower capital costs for sharia banks relative to conventional banks for an equivalent branch, indicating its more lenient stance on Islamic banks (see Figure 35)
Figure 35: Investment (capital) costs for branches
Source: BI, RHB research
Throughout the years, BI has also been active in providing various efforts to expand the Islamic banking industry ranging from training, research, studies and supervision.
Challengesin Islamic banking Industry are also its opportunities. We gather that there are several broad challenges in Indonesia’s Islamic banking industry: i) small market share, ii) lack of product development, and iii) lack of human resources. We believe these are the big opportunities for Islamic banks in Indonesia to venture into.
The expansion in Islamic banking market share can be achieved through: i) network and product expansion, ii) socialisation of Islamic banks among the general public, and iii) further Government support in terms of capital injection or converting one of the State-owned banks into a full-fledged Islamic bank.
Education, training, literature in Islamic banking, andincentives in working in the Islamic banking industry will also boost human resources and the pace of product development.
BUKU 1 & 2 BUKU 3 & 4 BUKU 1 & 2 BUKU 3 & 4Branch IDR8bn IDR10bn IDR3bn IDR10bnSub-branch IDR3bn IDR4bn IDR1.5bn IDR4bnCash outlet IDR1bn IDR2bn IDR500mn IDR2bn
Conventional banks Sharia banks
Panin Bank Syariah 20 November 2013
NO PART OF THIS RESEARCH REPORT MAY BE REPRODUCED OR TAKEN OR TRANSMITTED OUTSIDE MALAYSIA. THIS DOCUMENT HAS BEEN FURNISHED TO YOU SOLELY FOR YOUR INFORMATION AND MAY NOT BE REPRODUCED OR REDISTRIBUTED TO ANY OTHER PERSON.
20
Key Investment Themes Key investment theses.We summarise several key investment theses in PBS:
Fresh capital will spawn new businesses.Upon completion of its IPO, PBS will be a BUKU II bank (BUKU II banks are those with core capital between IDR1trn and IDR5trn) and this will open up an array of opportunities for the bank to develop products and services that would otherwise not be allowed under its current BUKU I status.
Among others, a BUKU II bank will be allowed to issue letter of credit for export and import transactions, embark on bancassurance businesses, issue credit cards, develop Internet banking platforms, issue traveller’s checks, run cash management services, and perform foreign exchange transactions.
PBS can seize on this opportunity to enrich its banking capabilities, gain new businesses and reap bigger market share. For instance, upon gaining BUKU II status, the bank will be able to provide funding (under themudharabah principle) and financing (under theqardh principle) for Hajj pilgrims, some of which are done in USD. PBS’ deposit generation capabilities and fee income profile will also improvestructurally, as it develops Internet banking, bancassurance andtradefinance businesses, among others.
Islamic banks operate in a competitive, but conducive environment. Indonesia is the world’s largest Muslim country, with approximately 87% of the population identified as Muslims. Yet, it remains an under-leveraged country with banking loans-to-GDP at ~35%. Sharia banking financing is less than 6% the size of conventional banking loans, which points to massive growth opportunities for Islamic banks in Indonesia.
Supportive regulations will also help strengthen Sharia banking’s growth prospects. Beyond enacting the Islamic Banking Act in 2008, BI has implemented various regulations and initiatives to improve sharia banking products, enhance their visibility, and protect the prudence of their financing. For instance, the capital costs for Islamic banks to open branches are lower than those for conventional banks, making it less demandingfrom the perspective of capital requirement forsharia banks to expand branch networkrelative to conventional banks.
The growth ofhajj and umroh pilgrims in Indonesia will also indirectly support the industry growth. In May, the Government indicated its intention to shift the savings of hajj pilgrims – totallingaround IDR11trn (USD960m), or ~6.5% of existing customer deposits in sharia banks – located in conventional banks intosharia-compliant ones within a year. This is principally accurate, as the funds were originally garnered by sharia banks and the move will support the Islamic banks’ funding base too.
We also gather that the waiting list for State-organised hajj pilgrimage in Indonesia has now stretched to over 10 years, indicating strong demand for adherents to undertake the pilgrimage. Meanwhile, the number of foreign hajj pilgrims to Saudi Arabia has risen to 1.8m in 2012 from 1.3m in 2000, where Indonesia is typically given a quota of 200,000hajj pilgrims per year. Other than the hajj, Saudi Arabia also accepts over 6m of umroh pilgrims annually with rising number of pilgrims coming from Indonesia.
A small but fast-growing bank. Given the combination of: i) abundant new business opportunities, ii) demographic appeal of potential customers, iii) low penetration of sharia banking, and iv) supportive regulations, PBS has ample room for growth going forward.
The bank’s growth will be supported with sufficient capital, as we expect CAR to remain relatively high at 33% and 25% by 2014F and 2015F respectively. Our forecasts assume PBS’ 4-year CAGR (2011-2015F) of 57% in financing, 54% in total assets, 75% in net operating revenue and 74% in net income. We expect ROAE to gradually increase to 8.4% in 2015Ffrom 3.6% in 2011. The financial analysis and forecasts of PBS are available in more details in the latter section of this report.
Panin Bank Syariah 20 November 2013
NO PART OF THIS RESEARCH REPORT MAY BE REPRODUCED OR TAKEN OR TRANSMITTED OUTSIDE MALAYSIA. THIS DOCUMENT HAS BEEN FURNISHED TO YOU SOLELY FOR YOUR INFORMATION AND MAY NOT BE REPRODUCED OR REDISTRIBUTED TO ANY OTHER PERSON.
21
Key Risks Key investment risks. We identified several investment risks toPBS:
i. Competition from both Sharia and conventional banks. PBS cannot escape competitive pressure from other sharia and conventional banks, given that it operates within the same environment. The large banks may have the ability to offer more attractive rates, provide more comprehensive services and possess better branding power, which may hamper PBS’ efforts to gain market share or expand profits. The lack of understanding and penetration of Islamic banking products may also be an obstacle.
ii. Financing quality risks. As a young sharia bank, PBS has been growing its financing aggressively over the last several years. Moving forward the Bank also plans to expand to new businesses in new regions it may not be fully familiar with, hence putting a test on its underwriting quality. The combination of higher lending rates, slowing economic growth, elevated inflation and its exposure to the SME and two-wheeler segments may also pose a risk to asset quality.While remaining well below the industry level, the bank’s NPF ratio has seen an increase YTD.
iii. Rising cost of funds. Liquidity in the banking system is tightening with conventional banks’ IDR LDR hitting 94%– a level unseen since 1998. Islamic banks’ FDR has also been above 100% since Aug 2012. As competition for funding intensifies, cost of funds could increase materially, threatening margins.
iv. Talent shortage.The lack of human resources is among the key obstacles hampering the development of Indonesia’s Islamic banking industry. As the industry has different practices from conventional banking, personnel with appropriate knowledge and experience are hard to come by, and this may compromise the bank’s growth prospects or execution.
v. Unfavourable regulatory changes. BI is more lenient towards sharia banks in several regulations, eg lowerallocation of core capital for branch expansion. However, this could change in the future,assharia banks may have to compete with conventional banks on a more equal playing field.
vi. Parent bank’s influence. Although PBS operates independently, there is a possibility that its parent – Panin Bank –may imposechanges or exert influence on the former’s directionin the future.
vii. High operating costs on aggressive expansion. As the bank plans to expand its branch network aggressively, operating costs could rise significantly.
viii. Macroeconomic risks. As a bank, PBS cannot avoid macroeconomic changes and forces such as GDP growth and inflationary pressure, which may affect demand for credit and viability of its businesses.
Panin Bank Syariah 20 November 2013
NO PART OF THIS RESEARCH REPORT MAY BE REPRODUCED OR TAKEN OR TRANSMITTED OUTSIDE MALAYSIA. THIS DOCUMENT HAS BEEN FURNISHED TO YOU SOLELY FOR YOUR INFORMATION AND MAY NOT BE REPRODUCED OR REDISTRIBUTED TO ANY OTHER PERSON.
22
THIS PAGE IS INTENTIONALLY LEFT BLANK
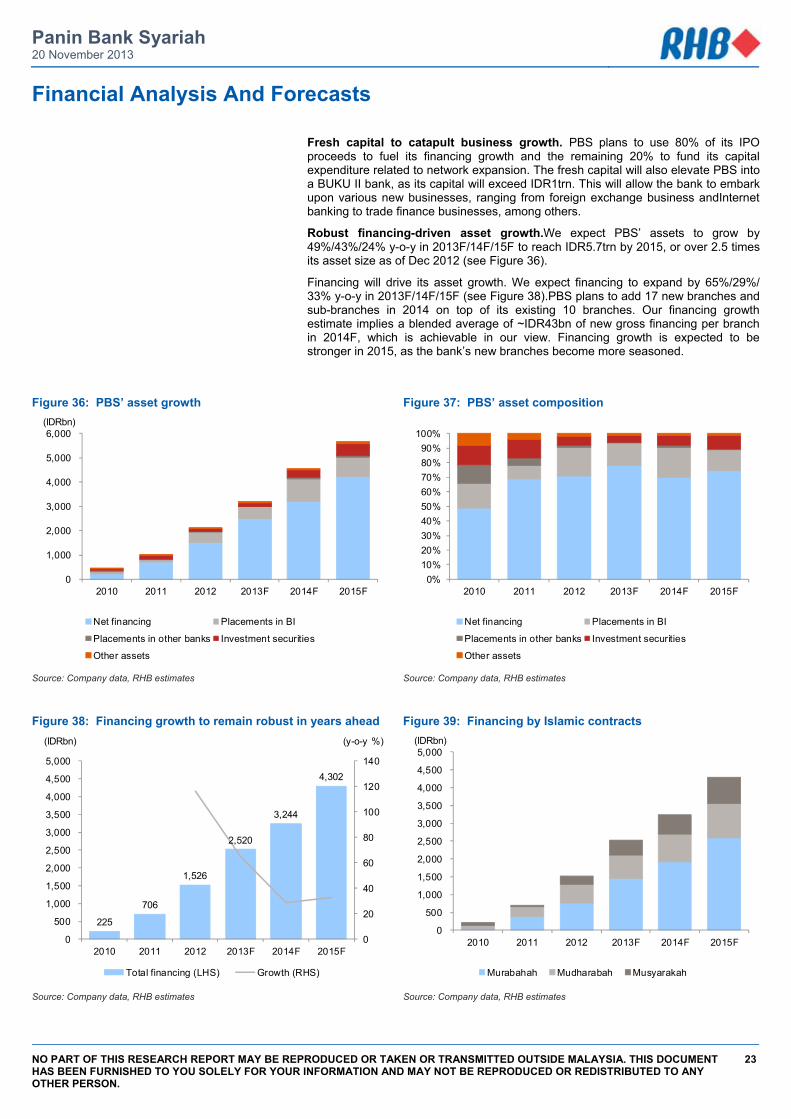
Panin Bank Syariah 20 November 2013
NO PART OF THIS RESEARCH REPORT MAY BE REPRODUCED OR TAKEN OR TRANSMITTED OUTSIDE MALAYSIA. THIS DOCUMENT HAS BEEN FURNISHED TO YOU SOLELY FOR YOUR INFORMATION AND MAY NOT BE REPRODUCED OR REDISTRIBUTED TO ANY OTHER PERSON.
23
Financial Analysis And Forecasts
Fresh capital to catapult business growth. PBS plans to use 80% of its IPO proceeds to fuel its financing growth and the remaining 20% to fund its capital expenditure related to network expansion. The fresh capital will also elevate PBS into a BUKU II bank, as its capital will exceed IDR1trn. This will allow the bank to embark upon various new businesses, ranging from foreign exchange business andInternet banking to trade finance businesses, among others.
Robust financing-driven asset growth.We expect PBS’ assets to grow by 49%/43%/24% y-o-y in 2013F/14F/15F to reach IDR5.7trn by 2015, or over 2.5 times its asset size as of Dec 2012 (see Figure 36).
Financing will drive its asset growth. We expect financing to expand by 65%/29%/ 33% y-o-y in 2013F/14F/15F (see Figure 38).PBS plans to add 17 new branches and sub-branches in 2014 on top of its existing 10 branches. Our financing growth estimate implies a blended average of ~IDR43bn of new gross financing per branch in 2014F, which is achievable in our view. Financing growth is expected to be stronger in 2015, as the bank’s new branches become more seasoned.
Figure 36: PBS’ asset growth Figure 37: PBS’ asset composition
Source: Company data, RHB estimates Source: Company data, RHB estimates
Figure 38: Financing growth to remain robust in years ahead Figure 39: Financing by Islamic contracts
Source: Company data, RHB estimates Source: Company data, RHB estimates
0
1,000
2,000
3,000
4,000
5,000
6,000
2010 2011 2012 2013F 2014F 2015F
(IDRbn)
Net financing Placements in BI
Placements in other banks Investment securities
Other assets
0%10%20%30%40%50%60%70%80%90%
100%
2010 2011 2012 2013F 2014F 2015F
Net financing Placements in BI
Placements in other banks Investment securities
Other assets
225
706
1,526
2,520
3,244
4,302
0
20
40
60
80
100
120
140
0
500
1,000
1,500
2,000
2,500
3,000
3,500
4,000
4,500
5,000
2010 2011 2012 2013F 2014F 2015F
(y-o-y %)(IDRbn)
Total financing (LHS) Growth (RHS)
0
500
1,000
1,500
2,000
2,500
3,000
3,500
4,000
4,500
5,000
2010 2011 2012 2013F 2014F 2015F
(IDRbn)
Murabahah Mudharabah Musyarakah
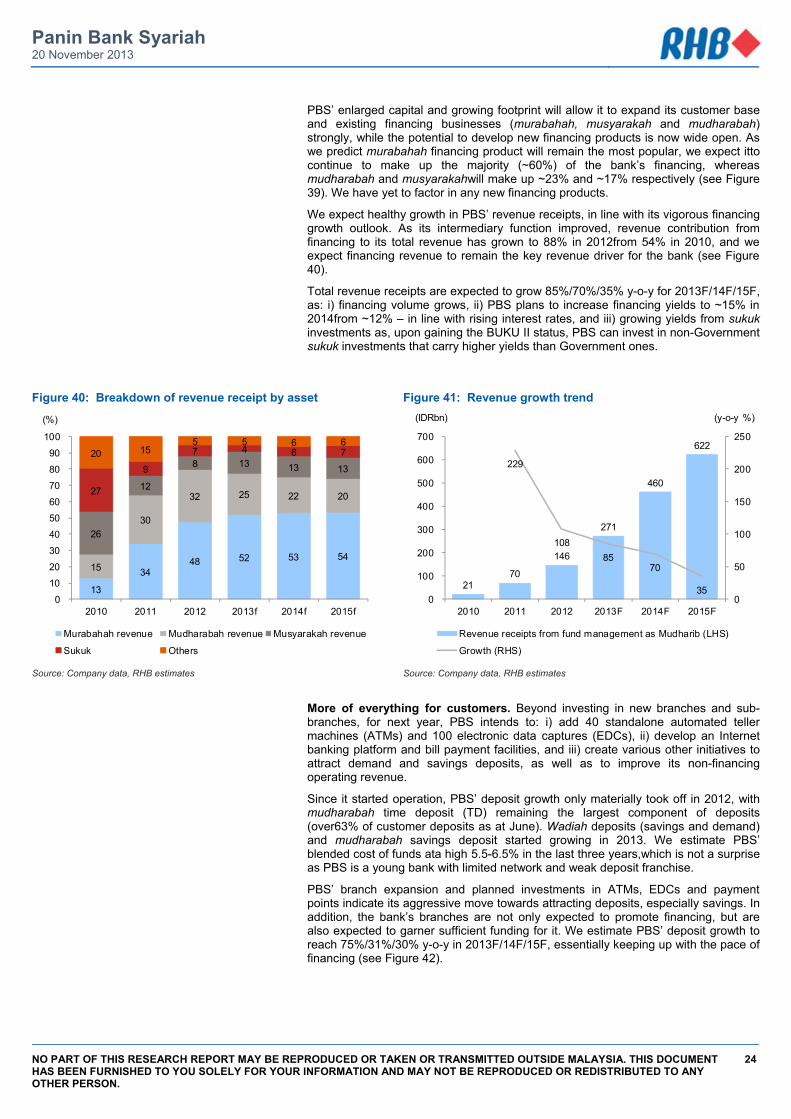
Panin Bank Syariah 20 November 2013
NO PART OF THIS RESEARCH REPORT MAY BE REPRODUCED OR TAKEN OR TRANSMITTED OUTSIDE MALAYSIA. THIS DOCUMENT HAS BEEN FURNISHED TO YOU SOLELY FOR YOUR INFORMATION AND MAY NOT BE REPRODUCED OR REDISTRIBUTED TO ANY OTHER PERSON.
24
PBS’ enlarged capital and growing footprint will allow it to expand its customer base and existing financing businesses (murabahah, musyarakah and mudharabah) strongly, while the potential to develop new financing products is now wide open. As we predict murabahah financing product will remain the most popular, we expect itto continue to make up the majority (~60%) of the bank’s financing, whereas mudharabah and musyarakahwill make up ~23% and ~17% respectively (see Figure 39). We have yet to factor in any new financing products.
We expect healthy growth in PBS’ revenue receipts, in line with its vigorous financing growth outlook. As its intermediary function improved, revenue contribution from financing to its total revenue has grown to 88% in 2012from 54% in 2010, and we expect financing revenue to remain the key revenue driver for the bank (see Figure 40).
Total revenue receipts are expected to grow 85%/70%/35% y-o-y for 2013F/14F/15F, as: i) financing volume grows, ii) PBS plans to increase financing yields to ~15% in 2014from ~12% – in line with rising interest rates, and iii) growing yields from sukuk investments as, upon gaining the BUKU II status, PBS can invest in non-Government sukuk investments that carry higher yields than Government ones.
Figure 40: Breakdown of revenue receipt by asset Figure 41: Revenue growth trend
Source: Company data, RHB estimates Source: Company data, RHB estimates
More of everything for customers. Beyond investing in new branches and sub-branches, for next year, PBS intends to: i) add 40 standalone automated teller machines (ATMs) and 100 electronic data captures (EDCs), ii) develop an Internet banking platform and bill payment facilities, and iii) create various other initiatives to attract demand and savings deposits, as well as to improve its non-financing operating revenue.
Since it started operation, PBS’ deposit growth only materially took off in 2012, with mudharabah time deposit (TD) remaining the largest component of deposits (over63% of customer deposits as at June). Wadiah deposits (savings and demand) and mudharabah savings deposit started growing in 2013. We estimate PBS’ blended cost of funds ata high 5.5-6.5% in the last three years,which is not a surprise as PBS is a young bank with limited network and weak deposit franchise.
PBS’ branch expansion and planned investments in ATMs, EDCs and payment points indicate its aggressive move towards attracting deposits, especially savings. In addition, the bank’s branches are not only expected to promote financing, but are also expected to garner sufficient funding for it. We estimate PBS’ deposit growth to reach 75%/31%/30% y-o-y in 2013F/14F/15F, essentially keeping up with the pace of financing (see Figure 42).
13
34 48 52 53 54
15
30
32 25 22 20
26
12
8 13 13 13
27
9
7 4 6 7 20 15 5 5 6 6
0
10
20
30
40
50
60
70
80
90
100
2010 2011 2012 2013f 2014f 2015f
(%)
Murabahah revenue Mudharabah revenue Musyarakah revenue
Sukuk Others
21 70
146
271
460
622
229
10885
70
350
50
100
150
200
250
0
100
200
300
400
500
600
700
2010 2011 2012 2013F 2014F 2015F
(y-o-y %)(IDRbn)
Revenue receipts from fund management as Mudharib (LHS)
Growth (RHS)
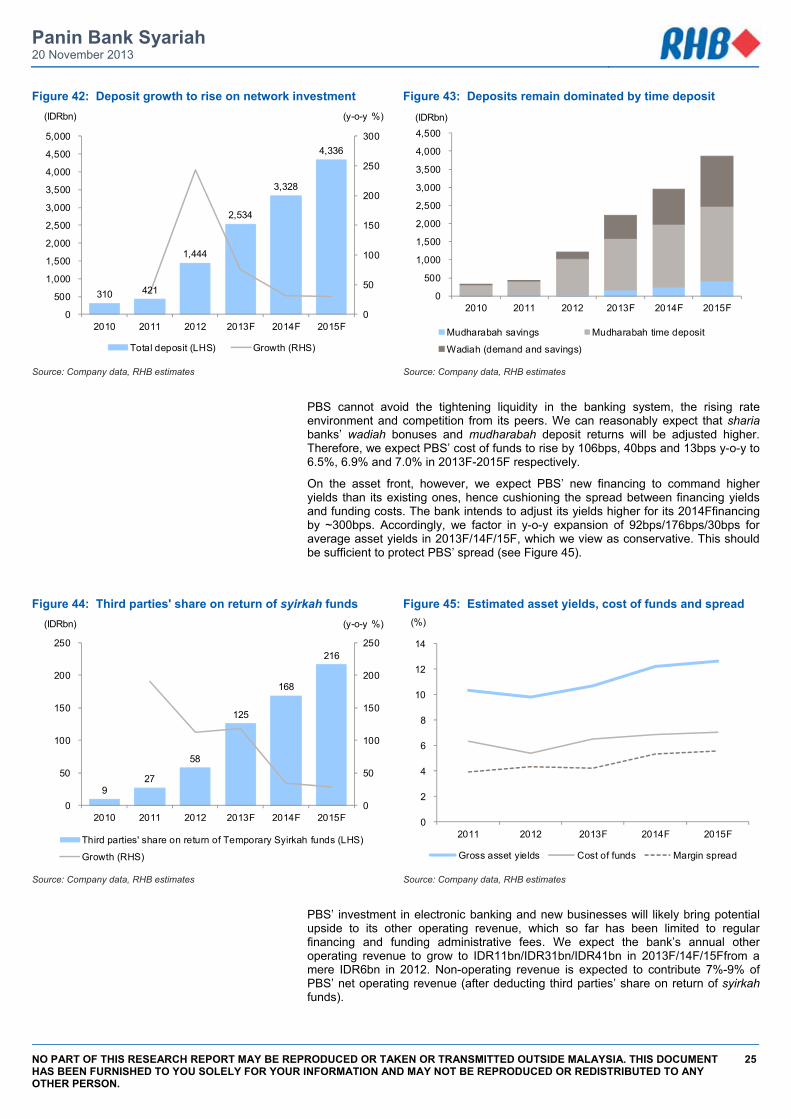
Panin Bank Syariah 20 November 2013
NO PART OF THIS RESEARCH REPORT MAY BE REPRODUCED OR TAKEN OR TRANSMITTED OUTSIDE MALAYSIA. THIS DOCUMENT HAS BEEN FURNISHED TO YOU SOLELY FOR YOUR INFORMATION AND MAY NOT BE REPRODUCED OR REDISTRIBUTED TO ANY OTHER PERSON.
25
Figure 42: Deposit growth to rise on network investment Figure 43: Deposits remain dominated by time deposit
Source: Company data, RHB estimates Source: Company data, RHB estimates
PBS cannot avoid the tightening liquidity in the banking system, the rising rate environment and competition from its peers. We can reasonably expect that sharia banks’ wadiah bonuses and mudharabah deposit returns will be adjusted higher. Therefore, we expect PBS’ cost of funds to rise by 106bps, 40bps and 13bps y-o-y to 6.5%, 6.9% and 7.0% in 2013F-2015F respectively.
On the asset front, however, we expect PBS’ new financing to command higher yields than its existing ones, hence cushioning the spread between financing yields and funding costs. The bank intends to adjust its yields higher for its 2014Ffinancing by ~300bps. Accordingly, we factor in y-o-y expansion of 92bps/176bps/30bps for average asset yields in 2013F/14F/15F, which we view as conservative. This should be sufficient to protect PBS’ spread (see Figure 45).
Figure 44: Third parties' share on return of syirkah funds Figure 45: Estimated asset yields, cost of funds and spread
Source: Company data, RHB estimates Source: Company data, RHB estimates
PBS’ investment in electronic banking and new businesses will likely bring potential upside to its other operating revenue, which so far has been limited to regular financing and funding administrative fees. We expect the bank’s annual other operating revenue to grow to IDR11bn/IDR31bn/IDR41bn in 2013F/14F/15Ffrom a mere IDR6bn in 2012. Non-operating revenue is expected to contribute 7%-9% of PBS’ net operating revenue (after deducting third parties’ share on return of syirkah funds).
310 421
1,444
2,534
3,328
4,336
0
50
100
150
200
250
300
0
500
1,000
1,500
2,000
2,500
3,000
3,500
4,000
4,500
5,000
2010 2011 2012 2013F 2014F 2015F
(y-o-y %)(IDRbn)
Total deposit (LHS) Growth (RHS)
0
500
1,000
1,500
2,000
2,500
3,000
3,500
4,000
4,500
2010 2011 2012 2013F 2014F 2015F
(IDRbn)
Mudharabah savings Mudharabah time deposit
Wadiah (demand and savings)
9 27
58
125
168
216
0
50
100
150
200
250
0
50
100
150
200
250
2010 2011 2012 2013F 2014F 2015F
(y-o-y %)(IDRbn)
Third parties' share on return of Temporary Syirkah funds (LHS)
Growth (RHS)
0
2
4
6
8
10
12
14
2011 2012 2013F 2014F 2015F
(%)
Gross asset yields Cost of funds Margin spread
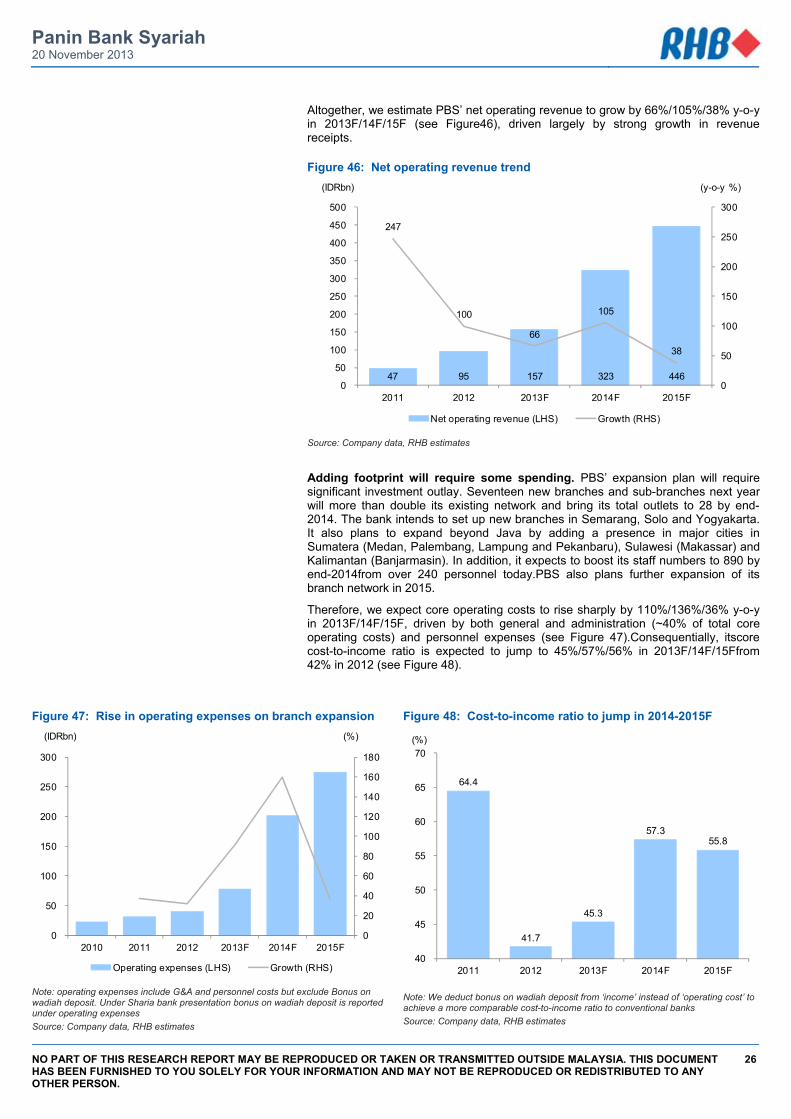
Panin Bank Syariah 20 November 2013
NO PART OF THIS RESEARCH REPORT MAY BE REPRODUCED OR TAKEN OR TRANSMITTED OUTSIDE MALAYSIA. THIS DOCUMENT HAS BEEN FURNISHED TO YOU SOLELY FOR YOUR INFORMATION AND MAY NOT BE REPRODUCED OR REDISTRIBUTED TO ANY OTHER PERSON.
26
Altogether, we estimate PBS’ net operating revenue to grow by 66%/105%/38% y-o-y in 2013F/14F/15F (see Figure46), driven largely by strong growth in revenue receipts.
Figure 46: Net operating revenue trend
Source: Company data, RHB estimates
Adding footprint will require some spending. PBS’ expansion plan will require significant investment outlay. Seventeen new branches and sub-branches next year will more than double its existing network and bring its total outlets to 28 by end-2014. The bank intends to set up new branches in Semarang, Solo and Yogyakarta. It also plans to expand beyond Java by adding a presence in major cities in Sumatera (Medan, Palembang, Lampung and Pekanbaru), Sulawesi (Makassar) and Kalimantan (Banjarmasin). In addition, it expects to boost its staff numbers to 890 by end-2014from over 240 personnel today.PBS also plans further expansion of its branch network in 2015.
Therefore, we expect core operating costs to rise sharply by 110%/136%/36% y-o-y in 2013F/14F/15F, driven by both general and administration (~40% of total core operating costs) and personnel expenses (see Figure 47).Consequentially, itscore cost-to-income ratio is expected to jump to 45%/57%/56% in 2013F/14F/15Ffrom 42% in 2012 (see Figure 48).
Figure 47: Rise in operating expenses on branch expansion Figure 48: Cost-to-income ratio to jump in 2014-2015F
Note: operating expenses include G&A and personnel costs but exclude Bonus on wadiah deposit. Under Sharia bank presentation bonus on wadiah deposit is reported under operating expenses Source: Company data, RHB estimates
Note: We deduct bonus on wadiah deposit from ‘income’ instead of ‘operating cost’ to achieve a more comparable cost-to-income ratio to conventional banks Source: Company data, RHB estimates
47 95 157 323 446
247
100
66
105
38
0
50
100
150
200
250
300
0
50
100
150
200
250
300
350
400
450
500
2011 2012 2013F 2014F 2015F
(y-o-y %)(IDRbn)
Net operating revenue (LHS) Growth (RHS)
0
20
40
60
80
100
120
140
160
180
0
50
100
150
200
250
300
2010 2011 2012 2013F 2014F 2015F
(%)(IDRbn)
Operating expenses (LHS) Growth (RHS)
64.4
41.7
45.3
57.3 55.8
40
45
50
55
60
65
70
2011 2012 2013F 2014F 2015F
(%)
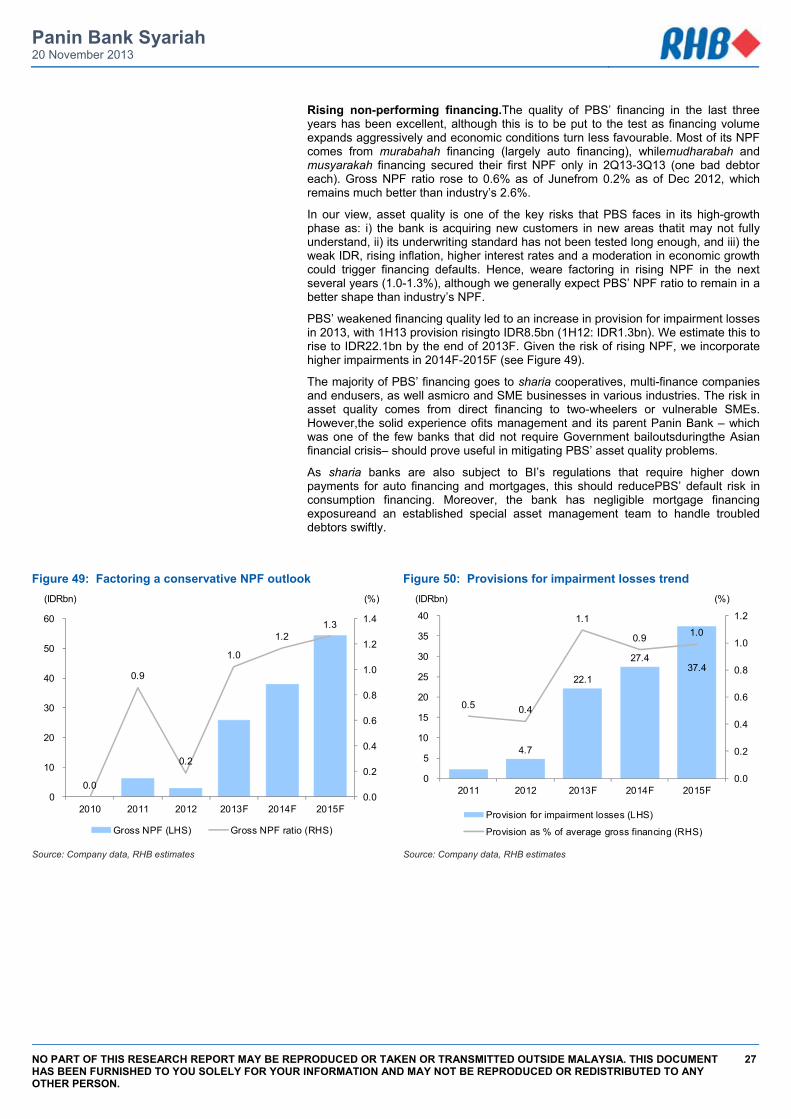
Panin Bank Syariah 20 November 2013
NO PART OF THIS RESEARCH REPORT MAY BE REPRODUCED OR TAKEN OR TRANSMITTED OUTSIDE MALAYSIA. THIS DOCUMENT HAS BEEN FURNISHED TO YOU SOLELY FOR YOUR INFORMATION AND MAY NOT BE REPRODUCED OR REDISTRIBUTED TO ANY OTHER PERSON.
27
Rising non-performing financing.The quality of PBS’ financing in the last three years has been excellent, although this is to be put to the test as financing volume expands aggressively and economic conditions turn less favourable. Most of its NPF comes from murabahah financing (largely auto financing), whilemudharabah and musyarakah financing secured their first NPF only in 2Q13-3Q13 (one bad debtor each). Gross NPF ratio rose to 0.6% as of Junefrom 0.2% as of Dec 2012, which remains much better than industry’s 2.6%.
In our view, asset quality is one of the key risks that PBS faces in its high-growth phase as: i) the bank is acquiring new customers in new areas thatit may not fully understand, ii) its underwriting standard has not been tested long enough, and iii) the weak IDR, rising inflation, higher interest rates and a moderation in economic growth could trigger financing defaults. Hence, weare factoring in rising NPF in the next several years (1.0-1.3%), although we generally expect PBS’ NPF ratio to remain in a better shape than industry’s NPF.
PBS’ weakened financing quality led to an increase in provision for impairment losses in 2013, with 1H13 provision risingto IDR8.5bn (1H12: IDR1.3bn). We estimate this to rise to IDR22.1bn by the end of 2013F. Given the risk of rising NPF, we incorporate higher impairments in 2014F-2015F (see Figure 49).
The majority of PBS’ financing goes to sharia cooperatives, multi-finance companies and endusers, as well asmicro and SME businesses in various industries. The risk in asset quality comes from direct financing to two-wheelers or vulnerable SMEs. However,the solid experience ofits management and its parent Panin Bank – which was one of the few banks that did not require Government bailoutsduringthe Asian financial crisis– should prove useful in mitigating PBS’ asset quality problems.
As sharia banks are also subject to BI’s regulations that require higher down payments for auto financing and mortgages, this should reducePBS’ default risk in consumption financing. Moreover, the bank has negligible mortgage financing exposureand an established special asset management team to handle troubled debtors swiftly.
Figure 49: Factoring a conservative NPF outlook Figure 50: Provisions for impairment losses trend
Source: Company data, RHB estimates Source: Company data, RHB estimates
0.0
0.9
0.2
1.0
1.21.3
0.0
0.2
0.4
0.6
0.8
1.0
1.2
1.4
0
10
20
30
40
50
60
2010 2011 2012 2013F 2014F 2015F
(%)(IDRbn)
Gross NPF (LHS) Gross NPF ratio (RHS)
4.7
22.1
27.4 37.4
0.5 0.4
1.1
0.9 1.0
0.0
0.2
0.4
0.6
0.8
1.0
1.2
0
5
10
15
20
25
30
35
40
2011 2012 2013F 2014F 2015F
(%)(IDRbn)
Provision for impairment losses (LHS)
Provision as % of average gross financing (RHS)
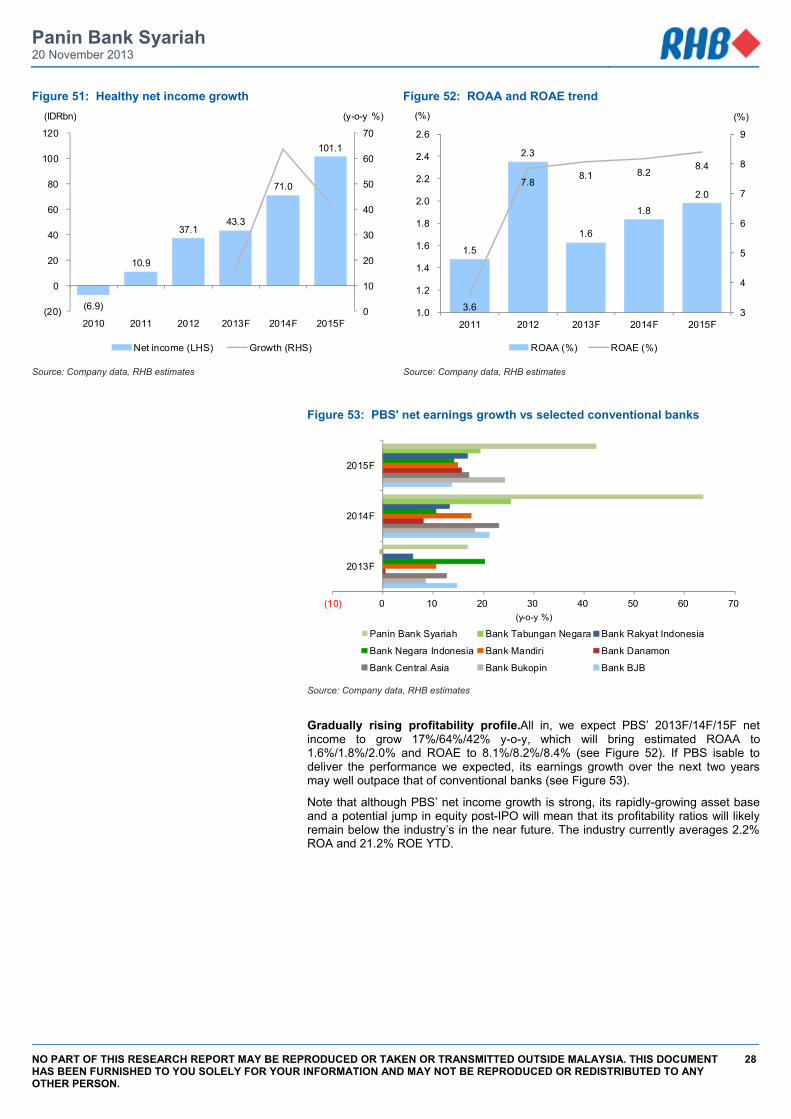
Panin Bank Syariah 20 November 2013
NO PART OF THIS RESEARCH REPORT MAY BE REPRODUCED OR TAKEN OR TRANSMITTED OUTSIDE MALAYSIA. THIS DOCUMENT HAS BEEN FURNISHED TO YOU SOLELY FOR YOUR INFORMATION AND MAY NOT BE REPRODUCED OR REDISTRIBUTED TO ANY OTHER PERSON.
28
Figure 51: Healthy net income growth Figure 52: ROAA and ROAE trend
Source: Company data, RHB estimates Source: Company data, RHB estimates
Figure 53: PBS' net earnings growth vs selected conventional banks
Source: Company data, RHB estimates
Gradually rising profitability profile.All in, we expect PBS’ 2013F/14F/15F net income to grow 17%/64%/42% y-o-y, which will bring estimated ROAA to 1.6%/1.8%/2.0% and ROAE to 8.1%/8.2%/8.4% (see Figure 52). If PBS isable to deliver the performance we expected, its earnings growth over the next two years may well outpace that of conventional banks (see Figure 53).
Note that although PBS’ net income growth is strong, its rapidly-growing asset base and a potential jump in equity post-IPO will mean that its profitability ratios will likely remain below the industry’s in the near future. The industry currently averages 2.2% ROA and 21.2% ROE YTD.
(6.9)
10.9
37.1 43.3
71.0
101.1
0
10
20
30
40
50
60
70
(20)
0
20
40
60
80
100
120
2010 2011 2012 2013F 2014F 2015F
(y-o-y %)(IDRbn)
Net income (LHS) Growth (RHS)
1.5
2.3
1.6
1.8 2.0
3.6
7.8 8.1 8.2 8.4
3
4
5
6
7
8
9
1.0
1.2
1.4
1.6
1.8
2.0
2.2
2.4
2.6
2011 2012 2013F 2014F 2015F
(%)(%)
ROAA (%) ROAE (%)
(10) 0 10 20 30 40 50 60 70
2013F
2014F
2015F
(y-o-y %)
Panin Bank Syariah Bank Tabungan Negara Bank Rakyat Indonesia
Bank Negara Indonesia Bank Mandiri Bank Danamon
Bank Central Asia Bank Bukopin Bank BJB
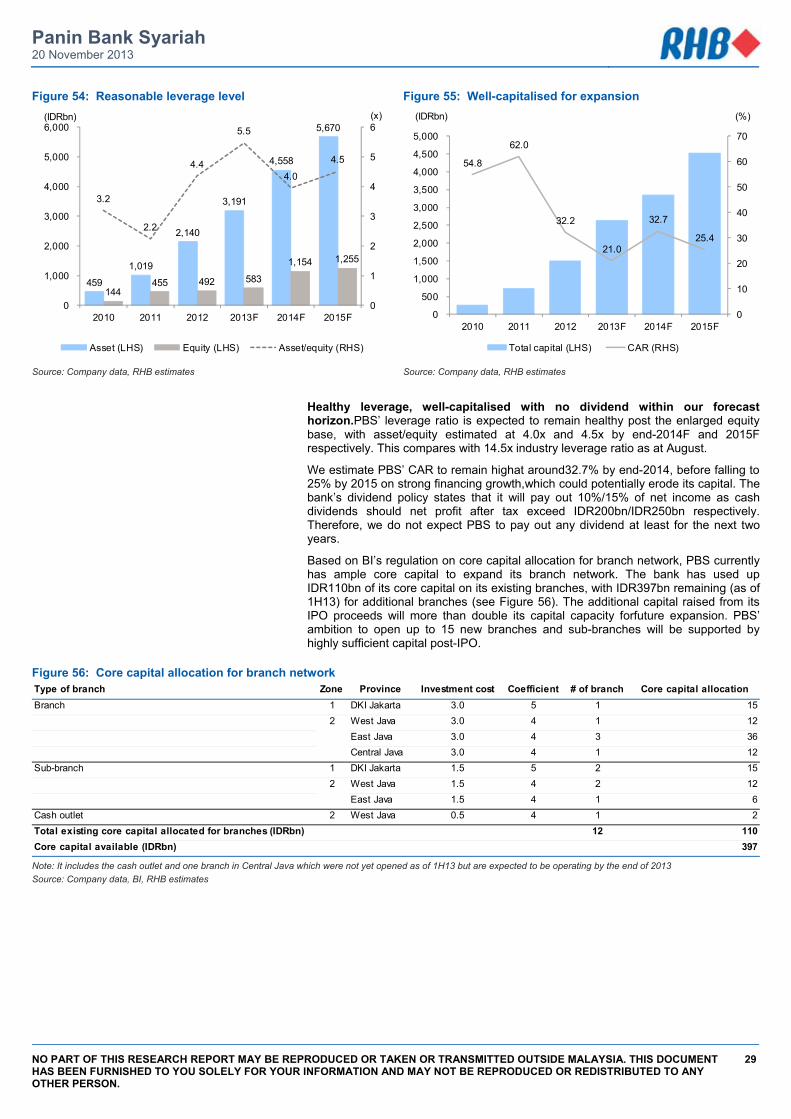
Panin Bank Syariah 20 November 2013
NO PART OF THIS RESEARCH REPORT MAY BE REPRODUCED OR TAKEN OR TRANSMITTED OUTSIDE MALAYSIA. THIS DOCUMENT HAS BEEN FURNISHED TO YOU SOLELY FOR YOUR INFORMATION AND MAY NOT BE REPRODUCED OR REDISTRIBUTED TO ANY OTHER PERSON.
29
Figure 54: Reasonable leverage level Figure 55: Well-capitalised for expansion
Source: Company data, RHB estimates Source: Company data, RHB estimates
Healthy leverage, well-capitalised with no dividend within our forecast horizon.PBS’ leverage ratio is expected to remain healthy post the enlarged equity base, with asset/equity estimated at 4.0x and 4.5x by end-2014F and 2015F respectively. This compares with 14.5x industry leverage ratio as at August.
We estimate PBS’ CAR to remain highat around32.7% by end-2014, before falling to 25% by 2015 on strong financing growth,which could potentially erode its capital. The bank’s dividend policy states that it will pay out 10%/15% of net income as cash dividends should net profit after tax exceed IDR200bn/IDR250bn respectively. Therefore, we do not expect PBS to pay out any dividend at least for the next two years.
Based on BI’s regulation on core capital allocation for branch network, PBS currently has ample core capital to expand its branch network. The bank has used up IDR110bn of its core capital on its existing branches, with IDR397bn remaining (as of 1H13) for additional branches (see Figure 56). The additional capital raised from its IPO proceeds will more than double its capital capacity forfuture expansion. PBS’ ambition to open up to 15 new branches and sub-branches will be supported by highly sufficient capital post-IPO.
Figure 56: Core capital allocation for branch network
Note: It includes the cash outlet and one branch in Central Java which were not yet opened as of 1H13 but are expected to be operating by the end of 2013 Source: Company data, BI, RHB estimates
459
1,019
2,140
3,191
4,558
5,670
144 455 492 583
1,154 1,255
3.2
2.2
4.4
5.5
4.0
4.5
0
1
2
3
4
5
6
0
1,000
2,000
3,000
4,000
5,000
6,000
2010 2011 2012 2013F 2014F 2015F
(x)(IDRbn)
Asset (LHS) Equity (LHS) Asset/equity (RHS)
54.8
62.0
32.2
21.0
32.7
25.4
0
10
20
30
40
50
60
70
0
500
1,000
1,500
2,000
2,500
3,000
3,500
4,000
4,500
5,000
2010 2011 2012 2013F 2014F 2015F
(%)(IDRbn)
Total capital (LHS) CAR (RHS)
Type of branch Zone Province Investment cost Coefficient # of branch Core capital allocationBranch 1 DKI Jakarta 3.0 5 1 15
West Java 3.0 4 1 12East Java 3.0 4 3 36Central Java 3.0 4 1 12
Sub-branch 1 DKI Jakarta 1.5 5 2 15West Java 1.5 4 2 12East Java 1.5 4 1 6
Cash outlet 2 West Java 0.5 4 1 2Total existing core capital allocated for branches (IDRbn) 12 110Core capital available (IDRbn) 397
2
2
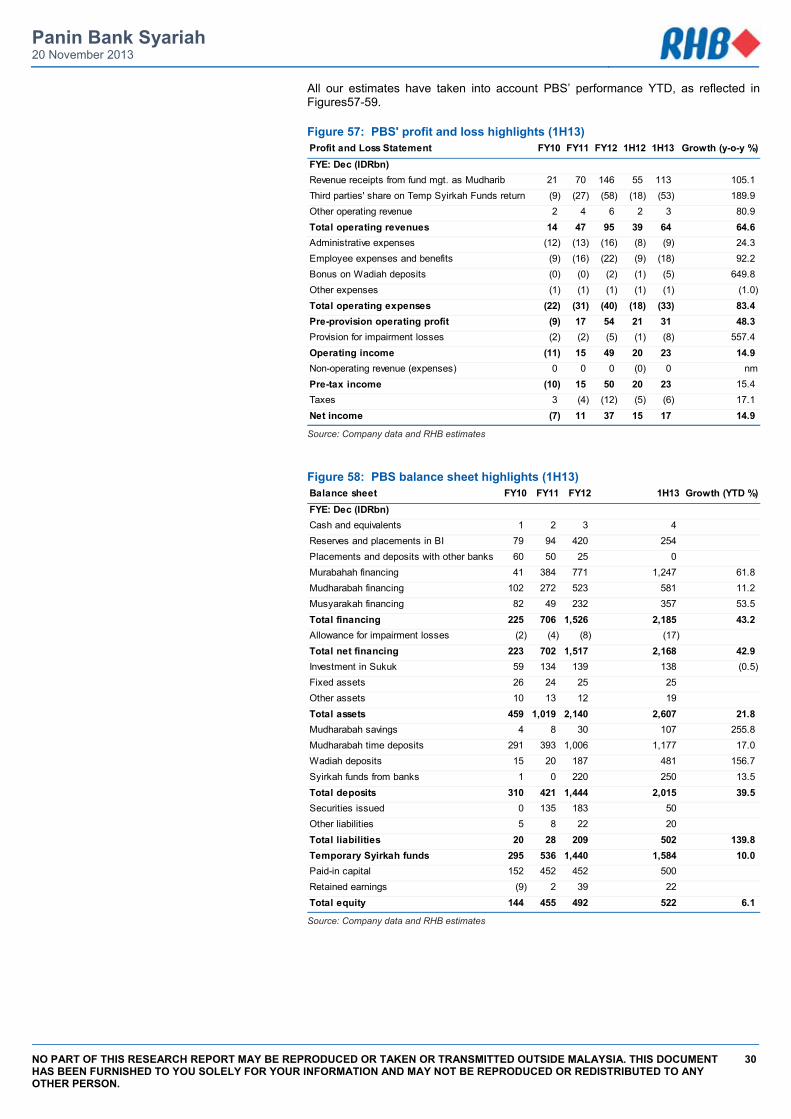
Panin Bank Syariah 20 November 2013
NO PART OF THIS RESEARCH REPORT MAY BE REPRODUCED OR TAKEN OR TRANSMITTED OUTSIDE MALAYSIA. THIS DOCUMENT HAS BEEN FURNISHED TO YOU SOLELY FOR YOUR INFORMATION AND MAY NOT BE REPRODUCED OR REDISTRIBUTED TO ANY OTHER PERSON.
30
All our estimates have taken into account PBS’ performance YTD, as reflected in Figures57-59.
Figure 57: PBS' profit and loss highlights (1H13)
Source: Company data and RHB estimates
Figure 58: PBS balance sheet highlights (1H13)
Source: Company data and RHB estimates
Profit and Loss Statement FY10 FY11 FY12 1H12 1H13 Growth (y-o-y %)FYE: Dec (IDRbn)Revenue receipts from fund mgt. as Mudharib 21 70 146 55 113 105.1Third parties' share on Temp Syirkah Funds return (9) (27) (58) (18) (53) 189.9Other operating revenue 2 4 6 2 3 80.9Total operating revenues 14 47 95 39 64 64.6Administrative expenses (12) (13) (16) (8) (9) 24.3Employee expenses and benefits (9) (16) (22) (9) (18) 92.2Bonus on Wadiah deposits (0) (0) (2) (1) (5) 649.8Other expenses (1) (1) (1) (1) (1) (1.0)Total operating expenses (22) (31) (40) (18) (33) 83.4Pre-provision operating profit (9) 17 54 21 31 48.3Provision for impairment losses (2) (2) (5) (1) (8) 557.4Operating income (11) 15 49 20 23 14.9Non-operating revenue (expenses) 0 0 0 (0) 0 nmPre-tax income (10) 15 50 20 23 15.4Taxes 3 (4) (12) (5) (6) 17.1Net income (7) 11 37 15 17 14.9
Balance sheet FY10 FY11 FY12 1H13 Growth (YTD %)FYE: Dec (IDRbn)Cash and equivalents 1 2 3 4Reserves and placements in BI 79 94 420 254Placements and deposits with other banks 60 50 25 0Murabahah financing 41 384 771 1,247 61.8Mudharabah financing 102 272 523 581 11.2Musyarakah financing 82 49 232 357 53.5Total financing 225 706 1,526 2,185 43.2Allowance for impairment losses (2) (4) (8) (17)Total net financing 223 702 1,517 2,168 42.9Investment in Sukuk 59 134 139 138 (0.5)Fixed assets 26 24 25 25Other assets 10 13 12 19Total assets 459 1,019 2,140 2,607 21.8Mudharabah savings 4 8 30 107 255.8Mudharabah time deposits 291 393 1,006 1,177 17.0Wadiah deposits 15 20 187 481 156.7Syirkah funds from banks 1 0 220 250 13.5Total deposits 310 421 1,444 2,015 39.5Securities issued 0 135 183 50Other liabilities 5 8 22 20Total liabilities 20 28 209 502 139.8Temporary Syirkah funds 295 536 1,440 1,584 10.0Paid-in capital 152 452 452 500Retained earnings (9) 2 39 22Total equity 144 455 492 522 6.1
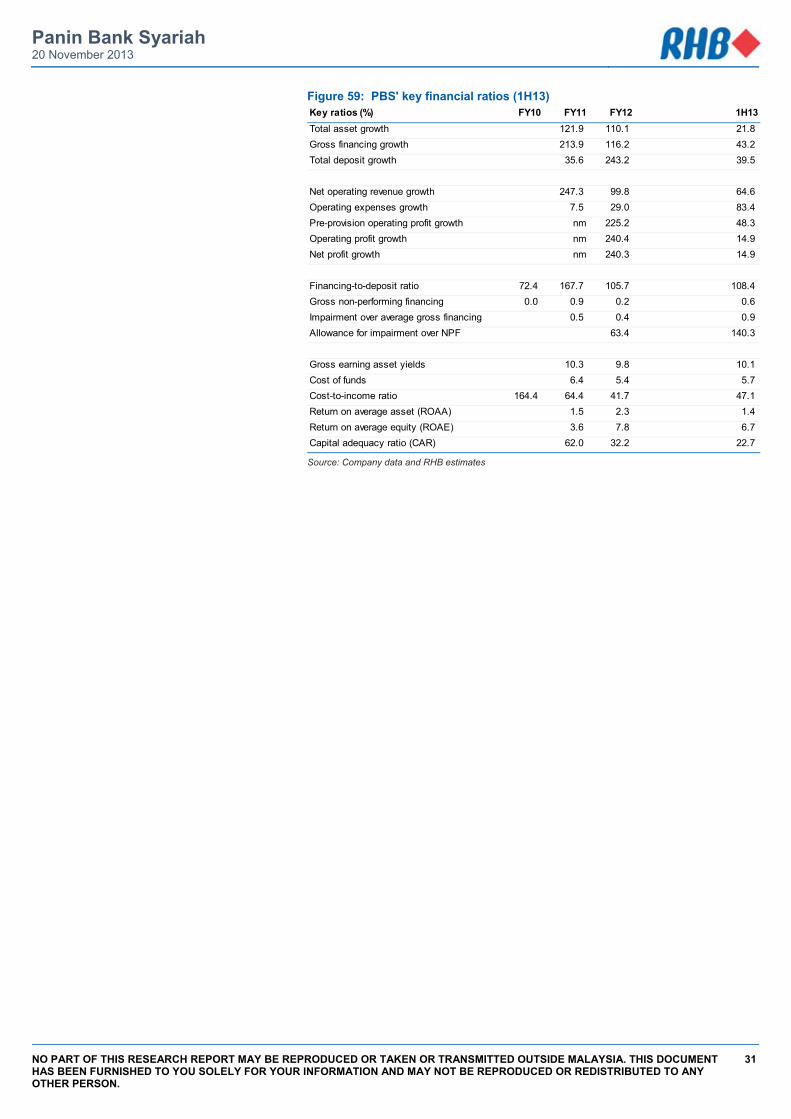
Panin Bank Syariah 20 November 2013
NO PART OF THIS RESEARCH REPORT MAY BE REPRODUCED OR TAKEN OR TRANSMITTED OUTSIDE MALAYSIA. THIS DOCUMENT HAS BEEN FURNISHED TO YOU SOLELY FOR YOUR INFORMATION AND MAY NOT BE REPRODUCED OR REDISTRIBUTED TO ANY OTHER PERSON.
31
Figure 59: PBS' key financial ratios (1H13)
Source: Company data and RHB estimates
Key ratios (%) FY10 FY11 FY12 1H13Total asset growth 121.9 110.1 21.8Gross financing growth 213.9 116.2 43.2Total deposit growth 35.6 243.2 39.5
Net operating revenue growth 247.3 99.8 64.6Operating expenses growth 7.5 29.0 83.4Pre-provision operating profit growth nm 225.2 48.3Operating profit growth nm 240.4 14.9Net profit growth nm 240.3 14.9
Financing-to-deposit ratio 72.4 167.7 105.7 108.4Gross non-performing financing 0.0 0.9 0.2 0.6Impairment over average gross financing 0.5 0.4 0.9Allowance for impairment over NPF 63.4 140.3
Gross earning asset yields 10.3 9.8 10.1Cost of funds 6.4 5.4 5.7Cost-to-income ratio 164.4 64.4 41.7 47.1Return on average asset (ROAA) 1.5 2.3 1.4Return on average equity (ROAE) 3.6 7.8 6.7Capital adequacy ratio (CAR) 62.0 32.2 22.7
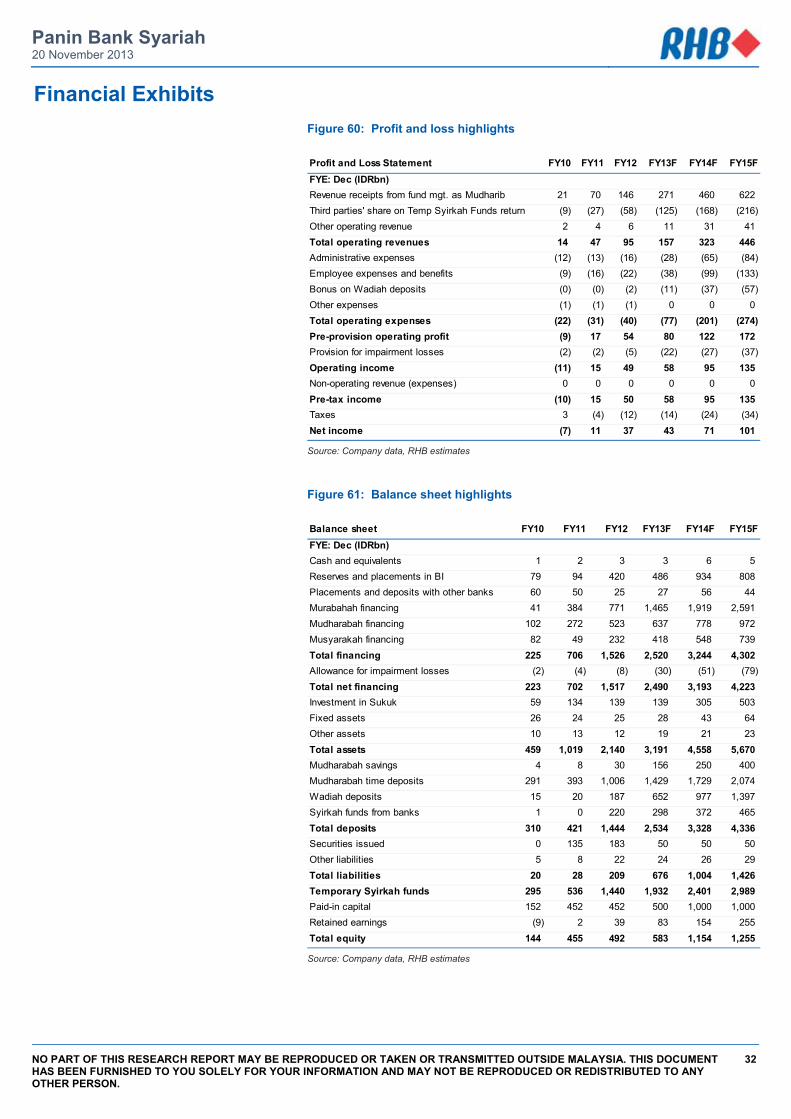
Panin Bank Syariah 20 November 2013
NO PART OF THIS RESEARCH REPORT MAY BE REPRODUCED OR TAKEN OR TRANSMITTED OUTSIDE MALAYSIA. THIS DOCUMENT HAS BEEN FURNISHED TO YOU SOLELY FOR YOUR INFORMATION AND MAY NOT BE REPRODUCED OR REDISTRIBUTED TO ANY OTHER PERSON.
32
Financial Exhibits Figure 60: Profit and loss highlights
Source: Company data, RHB estimates
Figure 61: Balance sheet highlights
Source: Company data, RHB estimates
Profit and Loss Statement FY10 FY11 FY12 FY13F FY14F FY15FFYE: Dec (IDRbn)Revenue receipts from fund mgt. as Mudharib 21 70 146 271 460 622Third parties' share on Temp Syirkah Funds return (9) (27) (58) (125) (168) (216)Other operating revenue 2 4 6 11 31 41Total operating revenues 14 47 95 157 323 446Administrative expenses (12) (13) (16) (28) (65) (84)Employee expenses and benefits (9) (16) (22) (38) (99) (133)Bonus on Wadiah deposits (0) (0) (2) (11) (37) (57)Other expenses (1) (1) (1) 0 0 0Total operating expenses (22) (31) (40) (77) (201) (274)Pre-provision operating profit (9) 17 54 80 122 172Provision for impairment losses (2) (2) (5) (22) (27) (37)Operating income (11) 15 49 58 95 135Non-operating revenue (expenses) 0 0 0 0 0 0Pre-tax income (10) 15 50 58 95 135Taxes 3 (4) (12) (14) (24) (34)Net income (7) 11 37 43 71 101
Balance sheet FY10 FY11 FY12 FY13F FY14F FY15FFYE: Dec (IDRbn)Cash and equivalents 1 2 3 3 6 5Reserves and placements in BI 79 94 420 486 934 808Placements and deposits with other banks 60 50 25 27 56 44Murabahah financing 41 384 771 1,465 1,919 2,591Mudharabah financing 102 272 523 637 778 972Musyarakah financing 82 49 232 418 548 739Total financing 225 706 1,526 2,520 3,244 4,302Allowance for impairment losses (2) (4) (8) (30) (51) (79)Total net financing 223 702 1,517 2,490 3,193 4,223Investment in Sukuk 59 134 139 139 305 503Fixed assets 26 24 25 28 43 64Other assets 10 13 12 19 21 23Total assets 459 1,019 2,140 3,191 4,558 5,670Mudharabah savings 4 8 30 156 250 400Mudharabah time deposits 291 393 1,006 1,429 1,729 2,074Wadiah deposits 15 20 187 652 977 1,397Syirkah funds from banks 1 0 220 298 372 465Total deposits 310 421 1,444 2,534 3,328 4,336Securities issued 0 135 183 50 50 50Other liabilities 5 8 22 24 26 29Total liabilities 20 28 209 676 1,004 1,426Temporary Syirkah funds 295 536 1,440 1,932 2,401 2,989Paid-in capital 152 452 452 500 1,000 1,000Retained earnings (9) 2 39 83 154 255Total equity 144 455 492 583 1,154 1,255
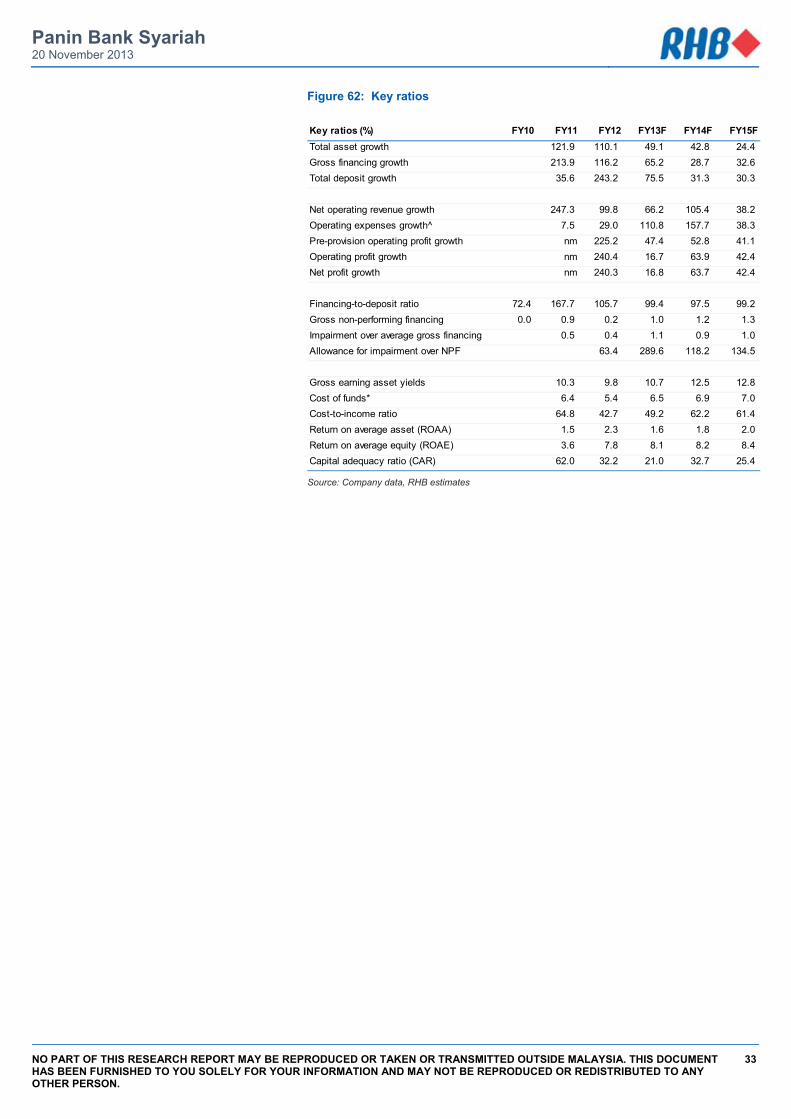
Panin Bank Syariah 20 November 2013
NO PART OF THIS RESEARCH REPORT MAY BE REPRODUCED OR TAKEN OR TRANSMITTED OUTSIDE MALAYSIA. THIS DOCUMENT HAS BEEN FURNISHED TO YOU SOLELY FOR YOUR INFORMATION AND MAY NOT BE REPRODUCED OR REDISTRIBUTED TO ANY OTHER PERSON.
33
Figure 62: Key ratios
Source: Company data, RHB estimates
Key ratios (%) FY10 FY11 FY12 FY13F FY14F FY15FTotal asset growth 121.9 110.1 49.1 42.8 24.4Gross financing growth 213.9 116.2 65.2 28.7 32.6Total deposit growth 35.6 243.2 75.5 31.3 30.3
Net operating revenue growth 247.3 99.8 66.2 105.4 38.2Operating expenses growth^ 7.5 29.0 110.8 157.7 38.3Pre-provision operating profit growth nm 225.2 47.4 52.8 41.1Operating profit growth nm 240.4 16.7 63.9 42.4Net profit growth nm 240.3 16.8 63.7 42.4
Financing-to-deposit ratio 72.4 167.7 105.7 99.4 97.5 99.2Gross non-performing financing 0.0 0.9 0.2 1.0 1.2 1.3Impairment over average gross financing 0.5 0.4 1.1 0.9 1.0Allowance for impairment over NPF 63.4 289.6 118.2 134.5
Gross earning asset yields 10.3 9.8 10.7 12.5 12.8Cost of funds* 6.4 5.4 6.5 6.9 7.0Cost-to-income ratio 64.8 42.7 49.2 62.2 61.4Return on average asset (ROAA) 1.5 2.3 1.6 1.8 2.0Return on average equity (ROAE) 3.6 7.8 8.1 8.2 8.4Capital adequacy ratio (CAR) 62.0 32.2 21.0 32.7 25.4
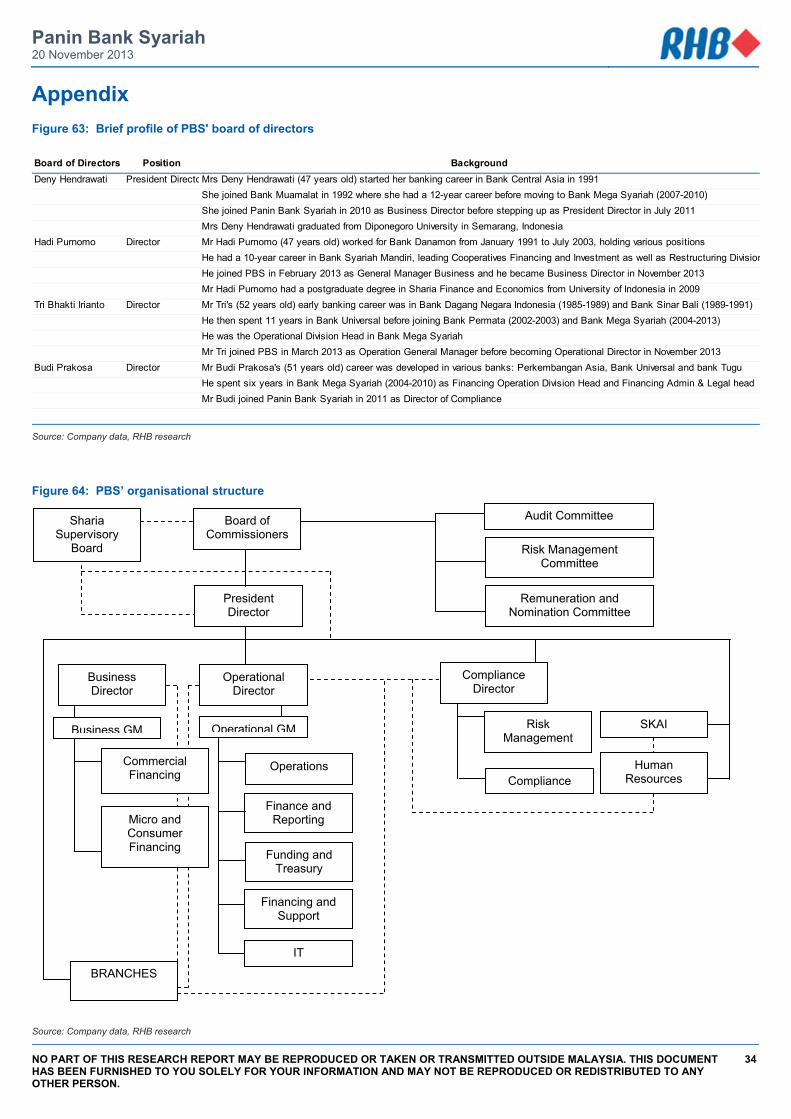
Panin Bank Syariah 20 November 2013
NO PART OF THIS RESEARCH REPORT MAY BE REPRODUCED OR TAKEN OR TRANSMITTED OUTSIDE MALAYSIA. THIS DOCUMENT HAS BEEN FURNISHED TO YOU SOLELY FOR YOUR INFORMATION AND MAY NOT BE REPRODUCED OR REDISTRIBUTED TO ANY OTHER PERSON.
34
Appendix Figure 63: Brief profile of PBS' board of directors
Source: Company data, RHB research
Figure 64: PBS’ organisational structure
Source: Company data, RHB research
Board of Directors Position BackgroundDeny Hendrawati President DirectoMrs Deny Hendrawati (47 years old) started her banking career in Bank Central Asia in 1991
She joined Bank Muamalat in 1992 where she had a 12-year career before moving to Bank Mega Syariah (2007-2010)She joined Panin Bank Syariah in 2010 as Business Director before stepping up as President Director in July 2011Mrs Deny Hendrawati graduated from Diponegoro University in Semarang, Indonesia
Hadi Purnomo Director Mr Hadi Purnomo (47 years old) worked for Bank Danamon from January 1991 to July 2003, holding various positionsHe had a 10-year career in Bank Syariah Mandiri, leading Cooperatives Financing and Investment as well as Restructuring DivisionHe joined PBS in February 2013 as General Manager Business and he became Business Director in November 2013Mr Hadi Purnomo had a postgraduate degree in Sharia Finance and Economics from University of Indonesia in 2009
Tri Bhakti Irianto Director Mr Tri's (52 years old) early banking career was in Bank Dagang Negara Indonesia (1985-1989) and Bank Sinar Bali (1989-1991)He then spent 11 years in Bank Universal before joining Bank Permata (2002-2003) and Bank Mega Syariah (2004-2013)He was the Operational Division Head in Bank Mega SyariahMr Tri joined PBS in March 2013 as Operation General Manager before becoming Operational Director in November 2013
Budi Prakosa Director Mr Budi Prakosa's (51 years old) career was developed in various banks: Perkembangan Asia, Bank Universal and bank TuguHe spent six years in Bank Mega Syariah (2004-2010) as Financing Operation Division Head and Financing Admin & Legal headMr Budi joined Panin Bank Syariah in 2011 as Director of Compliance
Sharia Supervisory
Board
Board of Commissioners
President Director
Audit Committee
Risk Management Committee
Remuneration and Nomination Committee
Operational Director
Business Director
Compliance Director
Risk Management
Compliance
SKAI
Human Resources
Operational GM
Operations
Finance and Reporting
Funding and Treasury
Financing and Support
IT
Business GM
Commercial Financing
Micro and Consumer Financing
BRANCHES
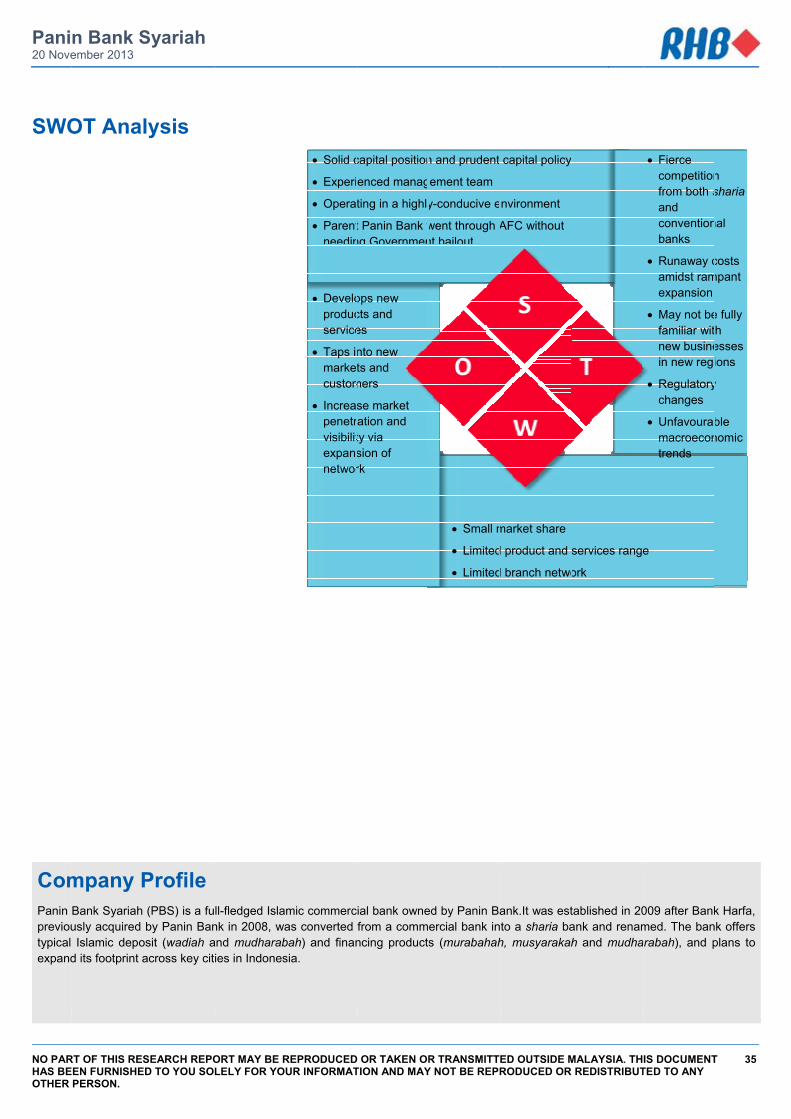
Pani20 Nove
NO PARHAS BEOTHER
SWO
ComPanin previoutypical expand
n Bank Sember 2013
RT OF THIS RESEEN FURNISHE
PERSON.
OT Ana
mpany PBank Syariahusly acquired Islamic depo
d its footprint a
Syariah
SEARCH REPOED TO YOU SO
lysis
Profile (PBS) is a fuby Panin Ban
osit (wadiah aacross key cit
ORT MAY BE RLELY FOR YOU
ll-fledged Islank in 2008, waand mudharabies in Indones
REPRODUCEDUR INFORMAT
Solid c
Experi
Operat
Parentneedin
Developroducservice
Taps inmarketcustom
Increaspenetrvisibilitexpansnetwor
mic commercas converted bah) and finansia.
OR TAKEN ORTION AND MAY
capital position
enced manag
ting in a highly
t Panin Bank wng Governmen
ops new cts and es
nto new ts and
mers
se market ation and ty via sion of rk
ial bank ownefrom a commncing products
R TRANSMITTEY NOT BE REPR
n and prudent
ement team
y-conducive e
went through Ant bailout
Small m
Limited
Limited
ed by Panin Baercial bank ins (murabahah
ED OUTSIDE MRODUCED OR
capital policy
nvironment
AFC without
market share
d product and s
d branch netwo
ank.It was estto a sharia ba
h, musyarakah
MALAYSIA. THREDISTRIBUT
services range
ork
tablished in 20ank and renamh and mudha
IS DOCUMENTTED TO ANY
Fierce competitionfrom both sand conventionbanks
Runaway camidst ramexpansion
May not befamiliar witnew businein new regi
Regulatorychanges
Unfavourabmacroecontrends
e
009 after Bankmed. The banrabah), and p
T 35
n sharia
nal
costs mpant
e fully h esses ions
y
ble nomic
k Harfa, k offers
plans to
36
RHB Guide to Investment Ratings Buy: Share price may exceed 10% over the next 12 months Trading Buy: Share price may exceed 15% over the next 3 months, however longer-term outlook remains uncertain Neutral: Share price may fall within the range of +/- 10% over the next 12 months Take Profit: Target price has been attained. Look to accumulate at lower levels Sell: Share price may fall by more than 10% over the next 12 months Not Rated: Stock is not within regular research coverage Disclosure & Disclaimer All research is based on material compiled from data considered to be reliable at the time of writing, but RHB does not make any representation or warranty, express or implied, as to its accuracy, completeness or correctness. No part of this report is to be construed as an offer or solicitation of an offer to transact any securities or financial instruments whether referred to herein or otherwise. This report is general in nature and has been prepared for information purposes only. It is intended for circulation to the clients of RHB and its related companies. Any recommendation contained in this report does not have regard to the specific investment objectives, financial situation and the particular needs of any specific addressee. This report is for the information of addressees only and is not to be taken in substitution for the exercise of judgment by addressees, who should obtain separate legal or financial advice to independently evaluate the particular investments and strategies. RHB, its affiliates and related companies, their respective directors, associates, connected parties and/or employees may own or have positions in securities of the company(ies) covered in this research report or any securities related thereto, and may from time to time add to, or dispose off, or may be materially interested in any such securities. Further, RHB, its affiliates and related companies do and seek to do business with the company(ies) covered in this research report and may from time to time act as market maker or have assumed an underwriting commitment in securities of such company(ies), may sell them or buy them from customers on a principal basis and may also perform or seek to perform significant investment banking, advisory or underwriting services for or relating to such company(ies), as well as solicit such investment, advisory or other services from any entity mentioned in this research report. RHB and its employees and/or agents do not accept any liability, be it directly, indirectly or consequential losses, loss of profits or damages that may arise from any reliance based on this report or further communication given in relation to this report, including where such losses, loss of profits or damages are alleged to have arisen due to the contents of such report or communication being perceived as defamatory in nature. The term “RHB” shall denote where applicable, the relevant entity distributing the report in the particular jurisdiction mentioned specifically herein below and shall refer to RHB Research Institute Sdn Bhd, its holding company, affiliates, subsidiaries and related companies. All Rights Reserved. This report is for the use of intended recipients only and may not be reproduced, distributed or published for any purpose without prior consent of RHB and RHB accepts no liability whatsoever for the actions of third parties in this respect. Malaysia This report is published and distributed in Malaysia by RHB Research Institute Sdn Bhd (233327-M), Level 11, Tower One, RHB Centre, Jalan Tun Razak, 50400 Kuala Lumpur, a wholly-owned subsidiary of RHB Investment Bank Berhad (RHBIB), which in turn is a wholly-owned subsidiary of RHB Capital Berhad. Singapore This report is published and distributed in Singapore by DMG & Partners Research Pte Ltd (Reg. No. 200808705N), a wholly-owned subsidiary of DMG & Partners Securities Pte Ltd, a joint venture between Deutsche Asia Pacific Holdings Pte Ltd (a subsidiary of Deutsche Bank Group) and OSK Investment Bank Berhad, Malaysia which have since merged into RHB Investment Bank Berhad (the merged entity is referred to as “RHBIB”, which in turn is a wholly-owned subsidiary of RHB Capital Berhad). DMG & Partners Securities Pte Ltd is a Member of the Singapore Exchange Securities Trading Limited. DMG & Partners Securities Pte Ltd may have received compensation from the company covered in this report for its corporate finance or its dealing activities; this report is therefore classified as a non-independent report. As of 19 November 2013, DMG & Partners Securities Pte Ltd and its subsidiaries, including DMG & Partners Research Pte Ltd do not have proprietary positions in the securities covered in this report, except for: a) - As of 19 November 2013, none of the analysts who covered the securities in this report has an interest in such securities, except for: a) - Special Distribution by RHB Where the research report is produced by an RHB entity (excluding DMG & Partners Research Pte Ltd) and distributed in Singapore, it is only distributed to "Institutional Investors", "Expert Investors" or "Accredited Investors" as defined in the Securities and Futures Act, CAP. 289 of Singapore. If you are not an "Institutional Investor", "Expert Investor" or "Accredited Investor", this research report is not intended for you and you should disregard this research report in its entirety. In respect of any matters arising from, or in connection with this research report, you are to contact our Singapore Office, DMG & Partners Securities Pte Ltd. Hong Kong This report is published and distributed in Hong Kong by RHB OSK Securities Hong Kong Limited (“RHBSHK”) (formerly known as OSK Securities Hong Kong Limited), a subsidiary of OSK Investment Bank Berhad, Malaysia which have since merged into RHB Investment Bank Berhad (the merged entity is referred to as “RHBIB”), which in turn is a wholly-owned subsidiary of RHB Capital Berhad. RHBSHK, RHBIB and/or other affiliates may beneficially own a total of 1% or more of any class of common equity securities of the subject company. RHBSHK, RHBIB and/or other affiliates may, within the past 12 months, have received compensation and/or within the next 3 months seek to obtain compensation for investment banking services from the subject company.
37
THIS PAGE IS INTENTIONALLY LEFT BLANK

38
THIS PAGE IS INTENTIONALLY LEFT BLANK
39
Risk Disclosure Statements The prices of securities fluctuate, sometimes dramatically. The price of a security may move up or down, and may become valueless. It is as likely that losses will be incurred rather than profit made as a result of buying and selling securities. Past performance is not a guide to future performance. RHBSHK does not maintain a predetermined schedule for publication of research and will not necessarily update this report Indonesia This report is published and distributed in Indonesia by PT RHB OSK Securities Indonesia (formerly known as PT OSK Nusadana Securities Indonesia), a subsidiary of OSK Investment Bank Berhad, Malaysia, which have since merged into RHB Investment Bank Berhad, which in turn is a wholly-owned subsidiary of RHB Capital Berhad. Thailand This report is published and distributed in Thailand by RHB OSK Securities (Thailand) PCL (formerly known as OSK Securities (Thailand) PCL), a subsidiary of OSK Investment Bank Berhad, Malaysia, which have since merged into RHB Investment Bank Berhad, which in turn is a wholly-owned subsidiary of RHB Capital Berhad. Other Jurisdictions In any other jurisdictions, this report is intended to be distributed to qualified, accredited and professional investors, in compliance with the law and regulations of the jurisdictions.
Kuala Lumpur Hong Kong Singapore
Malaysia Research Office RHB Research Institute Sdn Bhd
Level 11, Tower One, RHB Centre Jalan Tun Razak
Kuala Lumpur Malaysia
Tel : +(60) 3 9280 2185 Fax : +(60) 3 9284 8693
RHB OSK Securities Hong Kong Ltd.
(formerly known as OSK Securities Hong Kong Ltd.) 12th Floor
World-Wide House 19 Des Voeux Road Central, Hong Kong
Tel : +(852) 2525 1118 Fax : +(852) 2810 0908
DMG & Partners
Securities Pte. Ltd. 10 Collyer Quay
#09-08 Ocean Financial Centre Singapore 049315
Tel : +(65) 6533 1818 Fax : +(65) 6532 6211
Jakarta Shanghai Phnom Penh
PT RHB OSK Securities Indonesia (formerly known as PT OSK Nusadana Securities
Indonesia) Plaza CIMB Niaga
14th Floor Jl. Jend. Sudirman Kav.25
Jakarta Selatan 12920, Indonesia Tel : +(6221) 2598 6888 Fax : +(6221) 2598 6777
RHB OSK (China) Investment Advisory Co. Ltd.
(formerly known as OSK (China) Investment Advisory Co. Ltd.)
Suite 4005, CITIC Square 1168 Nanjing West Road
Shanghai 20041 China
Tel : +(8621) 6288 9611 Fax : +(8621) 6288 9633
RHB OSK Indochina Securities Limited
(formerly known as OSK Indochina Securities Limited)No. 1-3, Street 271
Sangkat Toeuk Thla, Khan Sen Sok Phnom Penh
Cambodia Tel: +(855) 23 969 161 Fax: +(855) 23 969 171
Bangkok
RHB OSK Securities (Thailand) PCL (formerly known as OSK Securities (Thailand) PCL)
10th Floor, Sathorn Square Office Tower 98, North Sathorn Road,Silom
Bangrak, Bangkok 10500 Thailand
Tel: +(66) 862 9999 Fax : +(66) 108 0999
This report may not be reproduced or redistributed, in whole or in part, without the written permission of RHBRI and RHBRI accepts no liability whatsoever for the actions of third parties in this respect.
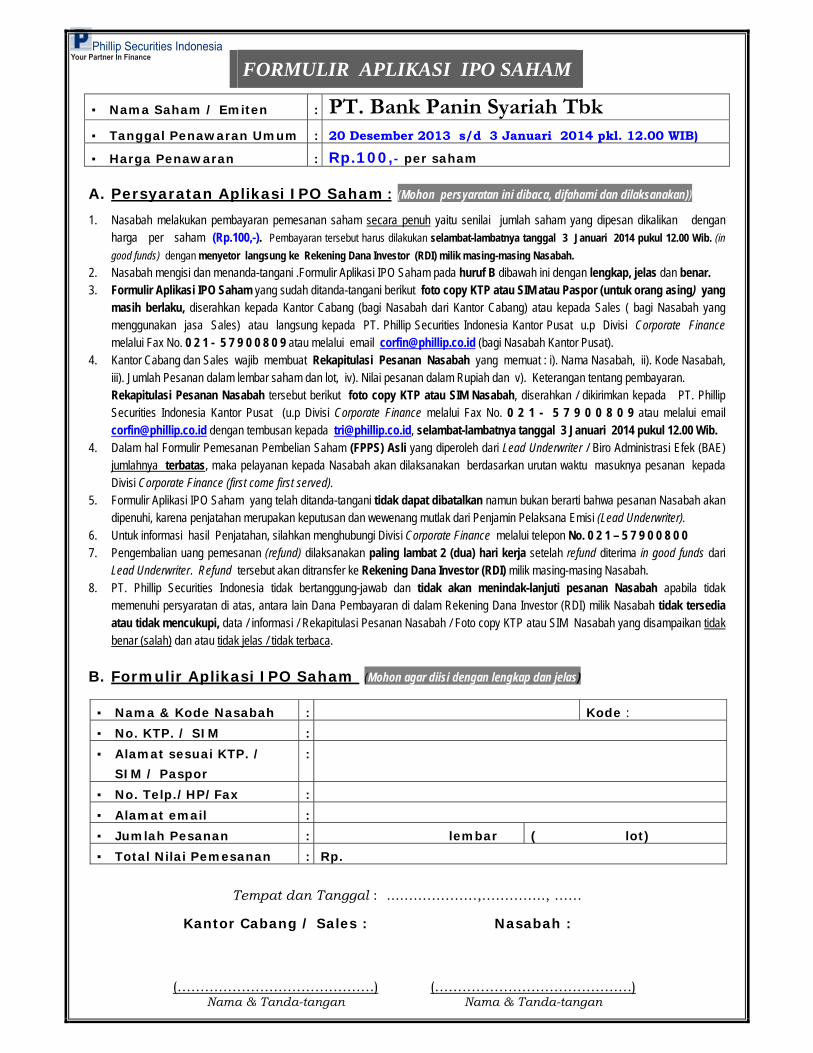
▪ Nama Saham / Emiten : PT. Bank Panin Syariah Tbk ▪ Tanggal Penawaran Umum : 20 Desember 2013 s/d 3 Januari 2014 pkl. 12.00 WIB)
▪ Harga Penawaran : Rp.100,- per saham A. Persyaratan Aplikasi IPO Saham : (Mohon persyaratan ini dibaca, difahami dan dilaksanakan))
1. Nasabah melakukan pembayaran pemesanan saham secara penuh yaitu senilai jumlah saham yang dipesan dikalikan dengan harga per saham (Rp.100,-). Pembayaran tersebut harus dilakukan selambat-lambatnya tanggal 3 Januari 2014 pukul 12.00 Wib. (in good funds) dengan menyetor langsung ke Rekening Dana Investor (RDI) milik masing-masing Nasabah.
2. Nasabah mengisi dan menanda-tangani .Formulir Aplikasi IPO Saham pada huruf B dibawah ini dengan lengkap, jelas dan benar. 3. Formulir Aplikasi IPO Saham yang sudah ditanda-tangani berikut foto copy KTP atau SIM atau Paspor (untuk orang asing) yang
masih berlaku, diserahkan kepada Kantor Cabang (bagi Nasabah dari Kantor Cabang) atau kepada Sales ( bagi Nasabah yang menggunakan jasa Sales) atau langsung kepada PT. Phillip Securities Indonesia Kantor Pusat u.p Divisi Corporate Finance melalui Fax No. 0 2 1 - 5 7 9 0 0 8 0 9 atau melalui email [email protected] (bagi Nasabah Kantor Pusat).
4. Kantor Cabang dan Sales wajib membuat Rekapitulasi Pesanan Nasabah yang memuat : i). Nama Nasabah, ii). Kode Nasabah, iii). Jumlah Pesanan dalam lembar saham dan lot, iv). Nilai pesanan dalam Rupiah dan v). Keterangan tentang pembayaran. Rekapitulasi Pesanan Nasabah tersebut berikut foto copy KTP atau SIM Nasabah, diserahkan / dikirimkan kepada PT. Phillip Securities Indonesia Kantor Pusat (u.p Divisi Corporate Finance melalui Fax No. 0 2 1 - 5 7 9 0 0 8 0 9 atau melalui email [email protected] dengan tembusan kepada [email protected], selambat-lambatnya tanggal 3 Januari 2014 pukul 12.00 Wib.
4. Dalam hal Formulir Pemesanan Pembelian Saham (FPPS) Asli yang diperoleh dari Lead Underwriter / Biro Administrasi Efek (BAE) jumlahnya terbatas, maka pelayanan kepada Nasabah akan dilaksanakan berdasarkan urutan waktu masuknya pesanan kepada Divisi Corporate Finance (first come first served).
5. Formulir Aplikasi IPO Saham yang telah ditanda-tangani tidak dapat dibatalkan namun bukan berarti bahwa pesanan Nasabah akan dipenuhi, karena penjatahan merupakan keputusan dan wewenang mutlak dari Penjamin Pelaksana Emisi (Lead Underwriter).
6. Untuk informasi hasil Penjatahan, silahkan menghubungi Divisi Corporate Finance melalui telepon No. 0 2 1 – 5 7 9 0 0 8 0 0 7. Pengembalian uang pemesanan (refund) dilaksanakan paling lambat 2 (dua) hari kerja setelah refund diterima in good funds dari
Lead Underwriter. Refund tersebut akan ditransfer ke Rekening Dana Investor (RDI) milik masing-masing Nasabah. 8. PT. Phillip Securities Indonesia tidak bertanggung-jawab dan tidak akan menindak-lanjuti pesanan Nasabah apabila tidak
memenuhi persyaratan di atas, antara lain Dana Pembayaran di dalam Rekening Dana Investor (RDI) milik Nasabah tidak tersedia atau tidak mencukupi, data / informasi / Rekapitulasi Pesanan Nasabah / Foto copy KTP atau SIM Nasabah yang disampaikan tidak benar (salah) dan atau tidak jelas / tidak terbaca.
B. Formulir Aplikasi IPO Saham (Mohon agar diisi dengan lengkap dan jelas)
▪ Nama & Kode Nasabah : Kode :
▪ No. KTP. / SIM :
▪ Alamat sesuai KTP. /
SIM / Paspor
:
▪ No. Telp./HP/Fax :
▪ Alamat email :
▪ Jumlah Pesanan : lembar ( lot)
▪ Total Nilai Pemesanan : Rp.
Tempat dan Tanggal : ....….…………,………….., ……
Kantor Cabang / Sales :
(…………………………………….)
Nama & Tanda-tangan
Nasabah :
(…………………………………….)
Nama & Tanda-tangan
FORMULIR APLIKASI IPO SAHAM