Embed Size (px)
Citation preview

11
Comparative Lightning Comparative Lightning Characteristics of a Tornadic Characteristics of a Tornadic and Non-Tornadic Oklahoma and Non-Tornadic Oklahoma
Thunderstorm on Thunderstorm on April 24 - 25, 2006April 24 - 25, 2006
Amanda SheffieldAmanda SheffieldPurdue UniversityPurdue UniversityWest Lafayette, INWest Lafayette, IN
Dr. Phillip BothwellDr. Phillip BothwellDr. Joe SchaeferDr. Joe Schaefer
Storm Prediction CenterStorm Prediction CenterNorman, OKNorman, OK
22
OutlineOutline
ObjectiveObjective BackgroundBackground MethodologyMethodology ResultsResults Conclusion/Future WorkConclusion/Future Work

33
ObjectiveObjective
Evaluate importance of real time Evaluate importance of real time total lightning data as will be total lightning data as will be provided from the GOES-R 2014 provided from the GOES-R 2014 missionmission
Relate total lightning to severe (and Relate total lightning to severe (and non-severe) weather eventsnon-severe) weather events
www.goes-r.gov/overview/index.html

44
BackgroundBackground
Lightning is divided into two main Lightning is divided into two main categories:categories: Cloud-to-Ground (Cloud-to-Ground (CGCG) Lightning) Lightning
Positive Flash (lowers positive charge)Positive Flash (lowers positive charge) Negative Flash (lowers negative charge)Negative Flash (lowers negative charge)
In-Cloud (In-Cloud (ICIC) Lightning ) Lightning
Total Lightning = CG + Total Lightning = CG + ICIC
(MacGorman, 1993)(MacGorman, 1993)

55
Background cont.Background cont. OTD & LIS provide polar orbiting, twice OTD & LIS provide polar orbiting, twice
daily total lightning observationsdaily total lightning observations GOES-R Geostationary Lightning Mapper GOES-R Geostationary Lightning Mapper
(GLM) (2014) will deliver 24/7 total (GLM) (2014) will deliver 24/7 total lightning observationslightning observations
Applications and Benefits:Applications and Benefits: Predict the onset of tornadoes, hail, microbursts, flash floods;Predict the onset of tornadoes, hail, microbursts, flash floods;
Track thunderstorms and warn of approaching lightning Track thunderstorms and warn of approaching lightning
threats;threats;
Improve airline routing around thunderstorms; improving Improve airline routing around thunderstorms; improving
safety, saving fuel, and reducing delays; TAFssafety, saving fuel, and reducing delays; TAFs
Provide real-time hazardous weather information, improving Provide real-time hazardous weather information, improving
the efficiency of emergency management;the efficiency of emergency management;(Steve Goodman presentation to SPC, May 2008)

66
Background cont.Background cont.
Applications and Benefits cont.Applications and Benefits cont. NWP/Data Assimilation;NWP/Data Assimilation;
Locate lightning strikes known to cause forest fires and Locate lightning strikes known to cause forest fires and
reduce response times;reduce response times;
Multi-sensor precipitation algorithms;Multi-sensor precipitation algorithms;
Assess the role of thunderstorms and deep convection in Assess the role of thunderstorms and deep convection in
global climate;global climate;
Provide a new data source to improve air quality / Provide a new data source to improve air quality /
chemistry forecasts.chemistry forecasts.

77
Oklahoma Lightning Mapping Oklahoma Lightning Mapping Array (LMA)Array (LMA)
Current ground based instrumentation that measures Current ground based instrumentation that measures total lightning over small geographic areastotal lightning over small geographic areas
Developed by New Mexico Institute of Mining and Developed by New Mexico Institute of Mining and Technology, reliably operational from 2004Technology, reliably operational from 2004
Source points mapped for an individual lightning Source points mapped for an individual lightning flash, to reveal its location and the development of its flash, to reveal its location and the development of its structure structure
Other LMA sites are: Other LMA sites are: Northern Alabama (Huntsville)Northern Alabama (Huntsville) Washington DCWashington DC Kennedy Space CenterKennedy Space Center Dallas/Ft WorthDallas/Ft Worth HoustonHouston TucsonTucson White SandsWhite Sands

88http://www.nssl.noaa.gov/observations/ltmap.php
Region Region within which within which the system the system provides provides most most accurate accurate three-three-dimensional dimensional locations of locations of lightning lightning channel channel segmentssegments
Oklahoma Lightning Mapping Array Oklahoma Lightning Mapping Array (LMA)(LMA)

99
National Lightning Detection National Lightning Detection Network (NLDN)Network (NLDN)
NWS US Network based to detect Cloud-NWS US Network based to detect Cloud-to-Ground (CG) Lightning Flashes to-Ground (CG) Lightning Flashes
Recent addition to detect In-Cloud (IC) Recent addition to detect In-Cloud (IC) flashes, though with only 10 - 25% flashes, though with only 10 - 25% detection efficiency across the US. detection efficiency across the US.
In comparison, GOES-R Lightning In comparison, GOES-R Lightning Mapper is expected to detect 80 – 90+Mapper is expected to detect 80 – 90+% of cloud flashes% of cloud flashes
(MacGorman 2006)(MacGorman 2006)

1010
Lightning Lightning Jump* - Jump* -
precursor to precursor to severe severe
weatherweather
* * Rapid increase in the lightning Rapid increase in the lightning flash rate, number of flash rate, number of flashes flashes per minute (fpm)per minute (fpm), preceding a , preceding a peak peak
Determined by looking at the Determined by looking at the flash rate per minute (fpm minflash rate per minute (fpm min-1-1))
(Figure from Williams, 1999)(Figure from Williams, 1999)
fpm

1111
First termed in Williams et al, 1999, in First termed in Williams et al, 1999, in The The behavior of total lightning activity in behavior of total lightning activity in severe Florida thunderstormssevere Florida thunderstorms
2007 MS Thesis of Patrick Gatlin at 2007 MS Thesis of Patrick Gatlin at University of Alabama in Huntsville University of Alabama in Huntsville qualified the lightning jump as greater qualified the lightning jump as greater than one standard deviation of the flash than one standard deviation of the flash rate per minute (fpm minrate per minute (fpm min-1-1) in order to ) in order to identify peaksidentify peaks
Lightning Lightning Jump* - Jump* -
precursor to precursor to severe severe
weatherweather
fpm
1212
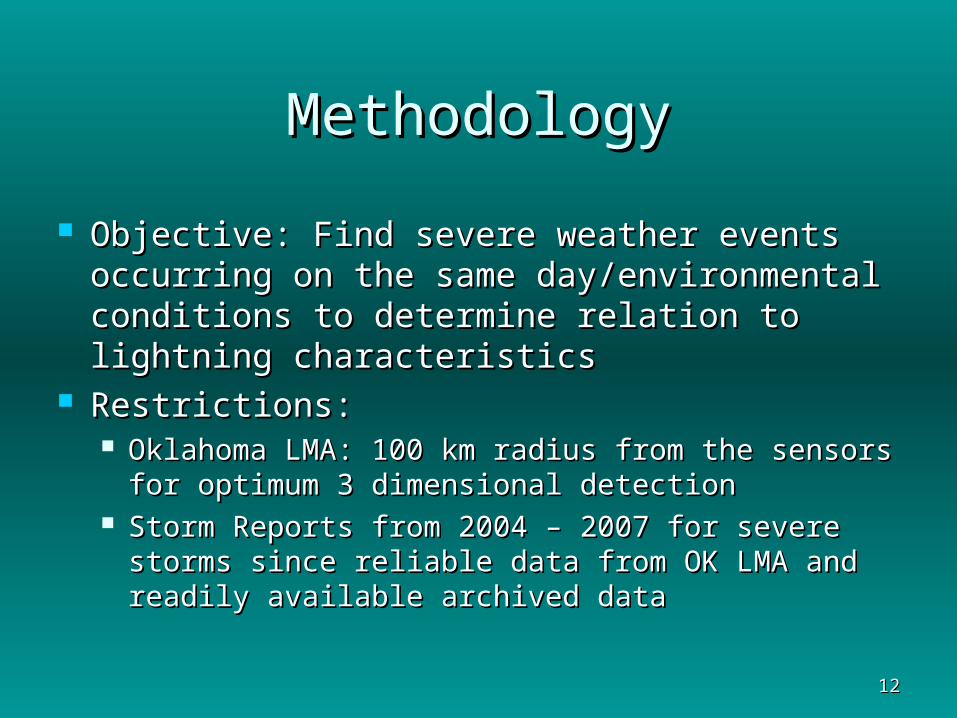
MethodologyMethodology
Objective: Find severe weather events Objective: Find severe weather events occurring on the same day/environmental occurring on the same day/environmental conditions to determine relation to conditions to determine relation to lightning characteristicslightning characteristics
Restrictions:Restrictions: Oklahoma LMA: 100 km radius from the Oklahoma LMA: 100 km radius from the
sensors for optimum 3 dimensional detectionsensors for optimum 3 dimensional detection Storm Reports from 2004 – 2007 for severe Storm Reports from 2004 – 2007 for severe
storms since reliable data from OK LMA and storms since reliable data from OK LMA and readily available archived datareadily available archived data

1313
New Mexico Tech XLMA New Mexico Tech XLMA SoftwareSoftware
XLMA – lightning XLMA – lightning display softwaredisplay software
Use XLMA software Use XLMA software on selected storms on selected storms in order to:in order to: Calculate Total Calculate Total
number of flashes (IC number of flashes (IC & CG) with software & CG) with software Flash AlgorithmFlash Algorithm
10 minute and 5 10 minute and 5 minute time bins minute time bins from Start to End of from Start to End of stormstorm

1414
XLMA & NLDNXLMA & NLDN XLMA software provides Total flash countXLMA software provides Total flash count Developed method to separate the Total Developed method to separate the Total
Flash count into In-Cloud and Cloud-to-Flash count into In-Cloud and Cloud-to-Ground FlashesGround Flashes Plot NLDN data visually using counts in 10 km Plot NLDN data visually using counts in 10 km
grid box in a 5 minute bin in order to calculate grid box in a 5 minute bin in order to calculate total number of CG Flashestotal number of CG Flashes
Further determined Positive & Negative CG Further determined Positive & Negative CG flashesflashes
XLMA Total Flashes – NLDN CG XLMA Total Flashes – NLDN CG Flashes = IC Flashes estimateFlashes = IC Flashes estimate

1515
Final Data for Storm Final Data for Storm AnalysisAnalysis
Storm ReportsStorm Reports Radar DataRadar Data Lightning:Lightning:
Total (CG + IC) Flash countsTotal (CG + IC) Flash counts Positive and Negative CG Flash Positive and Negative CG Flash
countscounts IC (=Total – CG) Flash countsIC (=Total – CG) Flash counts

1616
Lightning Flash RatesLightning Flash Rates
With Total number of flashes, CG With Total number of flashes, CG flashes, and IC flashes, calculated from flashes, and IC flashes, calculated from each:each: Flash Per Minute (fpm)Flash Per Minute (fpm) = (Number of = (Number of
Flashes)/(5 minutes time bins of storm)Flashes)/(5 minutes time bins of storm) Identified Lightning JumpIdentified Lightning Jump
fpm minfpm min-1-1
Compare with severe weather Compare with severe weather occurrences in the stormsoccurrences in the storms

1717
ResultsResults
StormsStorms 1 Tornadic1 Tornadic
2 F1 tornados (0023–0038 2 F1 tornados (0023–0038 UTC, 0030–0042 UTC)UTC, 0030–0042 UTC)
Hail 1 – 2.75 inch (0015 Hail 1 – 2.75 inch (0015 UTC)UTC)
2 Hailstorms2 Hailstorms Northern Cell (2220–215 Northern Cell (2220–215
UTC): 0.75 – 3.00 inch HailUTC): 0.75 – 3.00 inch Hail Southern Cell (2240-400 Southern Cell (2240-400
UTC): 0.88 – 1.75 inch HailUTC): 0.88 – 1.75 inch Hail
Case Study: April 24-25, 2006Case Study: April 24-25, 2006

1818
El Reno tornadoes
100 km radius of Oklahoma LMA
April 24 – 25, 2006Severe Weather
04/24/2006 0000 UTC – 04/25/2006 1200 UTCRadar Image (4 km) on April 25, 2006 0029 UTC
Green Dots indicate Hail Reports, with size in inches * 100

1919
1.00 – 2.75 inch Hail, 2 F1 Tornadoes
0.75 – 3.00 inch Hail
0.88 – 1.75 inch Hail, Wind Report
IC & CG Percentages of Total Lightning
Tornadic Storm
0
10
20
30
40
50
60
70
80
90
100
1 3 5 7 9 11 13 15 17 19 21 23 25 27 29 31 33
Sequential 5 Minute Time Bins over Storm Existence
%
IC
CG
Northern Hailstorm
0
10
20
30
40
50
60
70
80
90
100
1 3 5 7 9 11 13 15 17 19 21 23 25 27 29 31 33 35 37 39 41 43 45 47
Sequential 5 Minute Time Bins over Storm Existence
%
IC
CG
Southern Hailstorm
0
10
20
30
40
50
60
70
80
90
100
1 4 7 10 13 16 19 22 25 28 31 34 37 40 43 46 49 52 55 58 61
Sequential 5 Minute Time Bins over Storm Existence
%
IC
CG
Northern & Southern Hailstorm Combined
0
10
20
30
40
50
60
70
80
90
100
1 3 5 7 9 11 13 15 17 19 21 23 25 27 29 31 33 35 37 39 41 43
Sequential 5 Minute Time Bins over Storm Existence
%
IC
CG

2020
Tornadic Storm: IC and CG Flashes Per Minute
0
20
40
60
80
100
120
140
1 3 5 7 9 11 13 15 17 19 21 23 25 27 29 31 33
Sequential 5 Minute Time Bins over Storm Life
Fla
shes
per
Min
ute
IC
CG
2.75 inch Hail: 122 F1 tornados: 14,15
1.75 inch Hail: 191.25 inch Hail: 221.75 inch Hail: 241.00 inch Hail: 27
Lightning Jump

2121
Northern Hailstorm: IC and CG Flashes Per Minute
0
20
40
60
80
100
120
140
160
180
200
1 3 5 7 9 11 13 15 17 19 21 23 25 27 29 31 33 35 37 39 41 43 45 47
Sequential 5 Minute Time Bins over Storm Life
Fla
shes
Per
Min
ute
IC
CG
0.75 inch Hail: 7, 8, 141.00 inch Hail: 153.00 inch Hail: 170.75 inch Hail: 18
0.88 inch Hail: 180.88 inch Hail: 230.75 inch Hail: 301.00 inch Hail: 35
Lightning Jump

2222
Southern Hailstorm: IC and CG Flashes Per Minute
0
10
20
30
40
50
60
70
80
90
100
1 4 7 10 13 16 19 22 25 28 31 34 37 40 43 46 49 52 55 58 61
Sequential 5 Minute Time Bins over Storm Life
Fla
shes
Per
Min
ute
IC
CG
1.75 inch Hail: 141.00 inch Hail: 40Wind Report: 510.88 inch Hail: 53
Lightning Jump

2323
Tornadic Storm: Flashes Per Minute of Cloud-to-Ground Flashes, Positive CG Flashes, & Negative CG Flashes
0
5
10
15
20
25
1 3 5 7 9 11 13 15 17 19 21 23 25 27 29 31 33
Sequential 5 Minute Time Bins over Storm Life
Fla
shes
Per
Min
ute
CG
Positive CG
Negative CG
2.75 inch Hail: 122 F1 tornados: 14,15
1.75 inch Hail: 191.25 inch Hail: 221.75 inch Hail: 241.00 inch Hail: 27

2424
ConclusionConclusion GOES-R Geostationary Lightning Mapper GOES-R Geostationary Lightning Mapper
(GLM) will provide 24/7 total lightning (GLM) will provide 24/7 total lightning information and climatology that is information and climatology that is currently only available in smaller areas currently only available in smaller areas and time (LMAs, LIS/OTD)and time (LMAs, LIS/OTD)
Case Study here emphasized the Case Study here emphasized the importance of total lightning information, importance of total lightning information, including In-Cloud Lightning, to: including In-Cloud Lightning, to: Flash Rates & Lightning JumpsFlash Rates & Lightning Jumps Storm related eventsStorm related events Comparison of Percentages of Total LightningComparison of Percentages of Total Lightning

2525
Future WorkFuture Work More cases studies leading up to the launch of More cases studies leading up to the launch of
the GOES-R satellite in 2014the GOES-R satellite in 2014 More in-depth storm study to compare to More in-depth storm study to compare to
lightning characteristics, including dynamics and lightning characteristics, including dynamics and microphysics of storms, in order to determine microphysics of storms, in order to determine storm evolutionstorm evolution
Use of radar and new technology, like the Dual-Use of radar and new technology, like the Dual-Pol/Phased Array Radar, in combination with Pol/Phased Array Radar, in combination with current lightning data and areas that are current lightning data and areas that are simulating the GOES-R GLM capabilitiessimulating the GOES-R GLM capabilities
Exploration of lightning characteristics in other Exploration of lightning characteristics in other geographic regions and environments leading up geographic regions and environments leading up to the GOES-R launchto the GOES-R launch
With launch of GOES-R, continuous coverage of With launch of GOES-R, continuous coverage of total lightning information and climatologytotal lightning information and climatology

2626
ReferencesReferences Gatlin, P., (2007). Gatlin, P., (2007). Severe Weather Precursors in the Lightning Activity of Tennessee Severe Weather Precursors in the Lightning Activity of Tennessee
Valley ThunderstormsValley Thunderstorms. Unpublished master’s thesis. The University of Alabama, . Unpublished master’s thesis. The University of Alabama, Huntsville, AL.Huntsville, AL.
Goodman, S., presentation at National Weather Center, Norman, OK, May 14, 2008.Goodman, S., presentation at National Weather Center, Norman, OK, May 14, 2008. MacGorman, D. R., 1993. Lightning in tornadic storms: a review. In: Church, C., MacGorman, D. R., 1993. Lightning in tornadic storms: a review. In: Church, C.,
Burgess, D., Doswell, C., Davies-Jones, R., (Eds.), The Tornado: Its Structure, Burgess, D., Doswell, C., Davies-Jones, R., (Eds.), The Tornado: Its Structure, Dynamics, Prediction and Hazards, Geophysical Monograph, Vol 79, American Dynamics, Prediction and Hazards, Geophysical Monograph, Vol 79, American Geophysical Union.Geophysical Union.
MacGorman, D., I. Apostolakopoulos, A. Nierow, J. Cramer, N. Demetriades, and P. MacGorman, D., I. Apostolakopoulos, A. Nierow, J. Cramer, N. Demetriades, and P. Krehbiel (2006). Krehbiel (2006). Improved Timeliness of thunderstorm Detection from Mapping a Improved Timeliness of thunderstorm Detection from Mapping a Larger Fraction of Lightning Flashes. Larger Fraction of Lightning Flashes. Paper presented at the 1Paper presented at the 1stst International International Lightning Meteorology Conference, 26-27 April, 2006. Retrieved from the 2006 ILMC Lightning Meteorology Conference, 26-27 April, 2006. Retrieved from the 2006 ILMC Website: Website: http://www.vaisala.com/newsandmedia/events/ildcilmc/pastconferences/http://www.vaisala.com/newsandmedia/events/ildcilmc/pastconferences/2006%20ilmc%20papers2006%20ilmc%20papers
National Climactic Data Center. (2008). National Climactic Data Center. (2008). Storm EventsStorm Events. Retrieved May 2008, from: . Retrieved May 2008, from: http://www4.ncdc.noaa.gov/cgi-win/wwcgi.dll?wwEvent~Stormshttp://www4.ncdc.noaa.gov/cgi-win/wwcgi.dll?wwEvent~Storms
NOAA National Severe Storms Laboratory. (2008). Field Observing Systems: NOAA National Severe Storms Laboratory. (2008). Field Observing Systems: Oklahoma Lightning Mapping Array. Retrieved June 2008, from: Oklahoma Lightning Mapping Array. Retrieved June 2008, from: http://www.nssl.noaa.gov/observations/ltmap.phphttp://www.nssl.noaa.gov/observations/ltmap.php
National Weather Service Forecast Office, Norman, OK. (2008). National Weather Service Forecast Office, Norman, OK. (2008). Preliminary Storm Preliminary Storm Data ReportsData Reports. Retrieved June 2008, from: . Retrieved June 2008, from: http://www.srh.noaa.gov/oun/stormdata/oun200604.pdfhttp://www.srh.noaa.gov/oun/stormdata/oun200604.pdf
Storm Prediction Center. (2008). Storm Prediction Center. (2008). Storm ReportsStorm Reports. Retrieved May 2008, from: . Retrieved May 2008, from: http://www.spc.noaa.gov/climo/http://www.spc.noaa.gov/climo/
Williams, E. R., B. Boldi, A. Matlin, M. Weber, S. Hodanish, D. Sharp, S. Goodman, R. Williams, E. R., B. Boldi, A. Matlin, M. Weber, S. Hodanish, D. Sharp, S. Goodman, R. Raghavan, and D. Buechler, 1999: The behavior of total lightning activity in Raghavan, and D. Buechler, 1999: The behavior of total lightning activity in severe Florida thunderstorms. severe Florida thunderstorms. Atmos. Res., Atmos. Res., 5151, 245-265., 245-265.