Embed Size (px)
Citation preview
1
1. Fisheries Research
1.1 Coastal (artisanal) fishery
Data from the artisanal fishery were collected on a monthly basis at 25 selected fish landing
stations to estimate the catch and effort by fish species and gear type. During the year, 3 766
landings were thus recorded. .
1.1.1 Catch, effort and catch per fisherman day
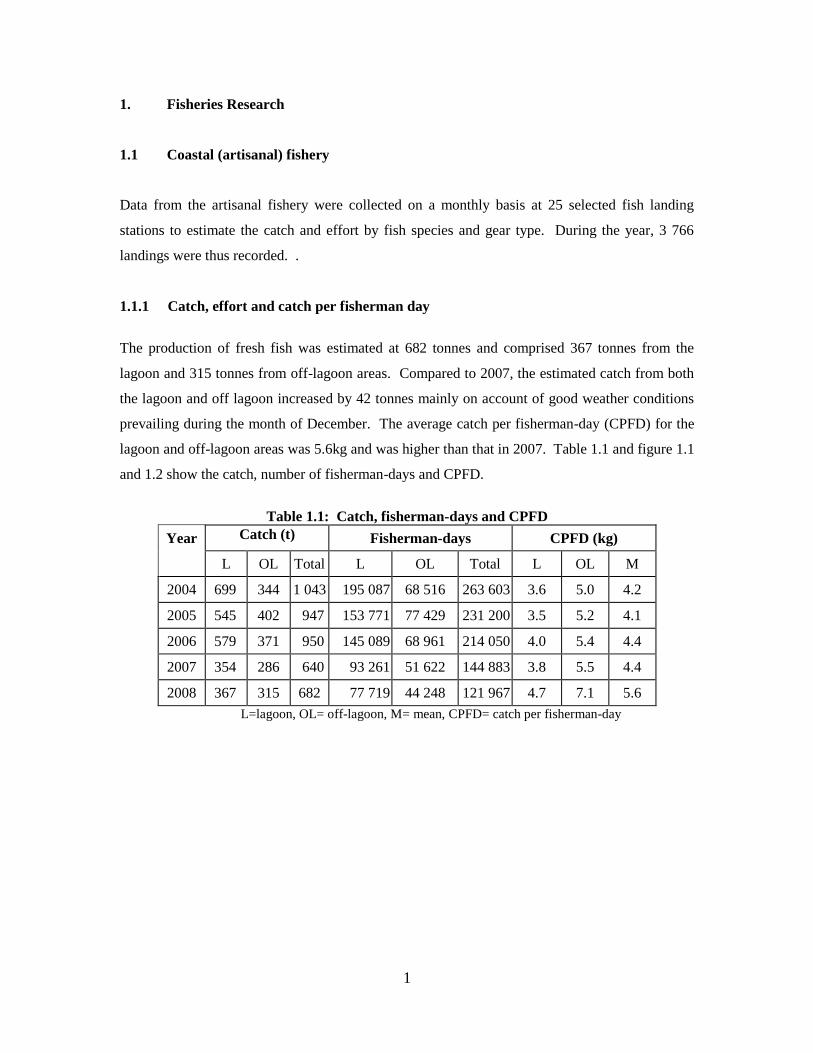
The production of fresh fish was estimated at 682 tonnes and comprised 367 tonnes from the
lagoon and 315 tonnes from off-lagoon areas. Compared to 2007, the estimated catch from both
the lagoon and off lagoon increased by 42 tonnes mainly on account of good weather conditions
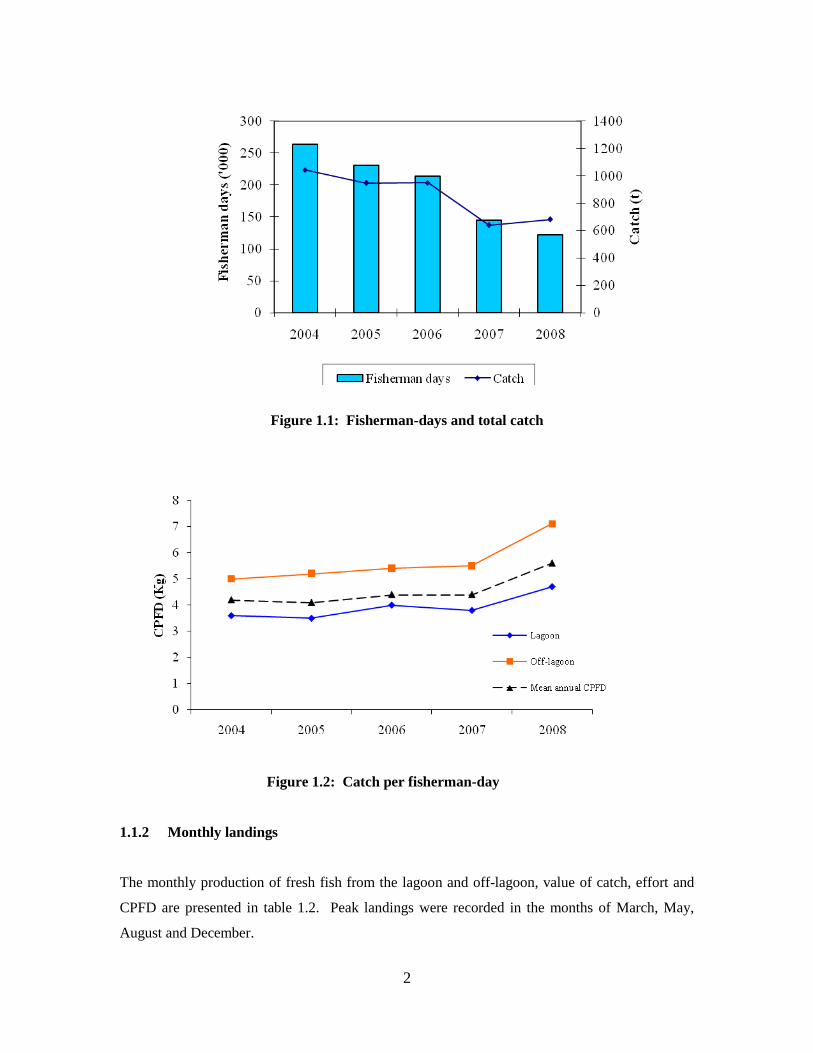
prevailing during the month of December. The average catch per fisherman-day (CPFD) for the
lagoon and off-lagoon areas was 5.6kg and was higher than that in 2007. Table 1.1 and figure 1.1
and 1.2 show the catch, number of fisherman-days and CPFD.
Table 1.1: Catch, fisherman-days and CPFD
Year Catch (t) Fisherman-days CPFD (kg)
L OL Total L OL Total L OL M
2004 699 344 1 043 195 087 68 516 263 603 3.6 5.0 4.2
2005 545 402 947 153 771 77 429 231 200 3.5 5.2 4.1
2006 579 371 950 145 089 68 961 214 050 4.0 5.4 4.4
2007 354 286 640 93 261 51 622 144 883 3.8 5.5 4.4
2008 367 315 682 77 719 44 248 121 967 4.7 7.1 5.6
L=lagoon, OL= off-lagoon, M= mean, CPFD= catch per fisherman-day
2
Figure 1.1: Fisherman-days and total catch
Figure 1.2: Catch per fisherman-day
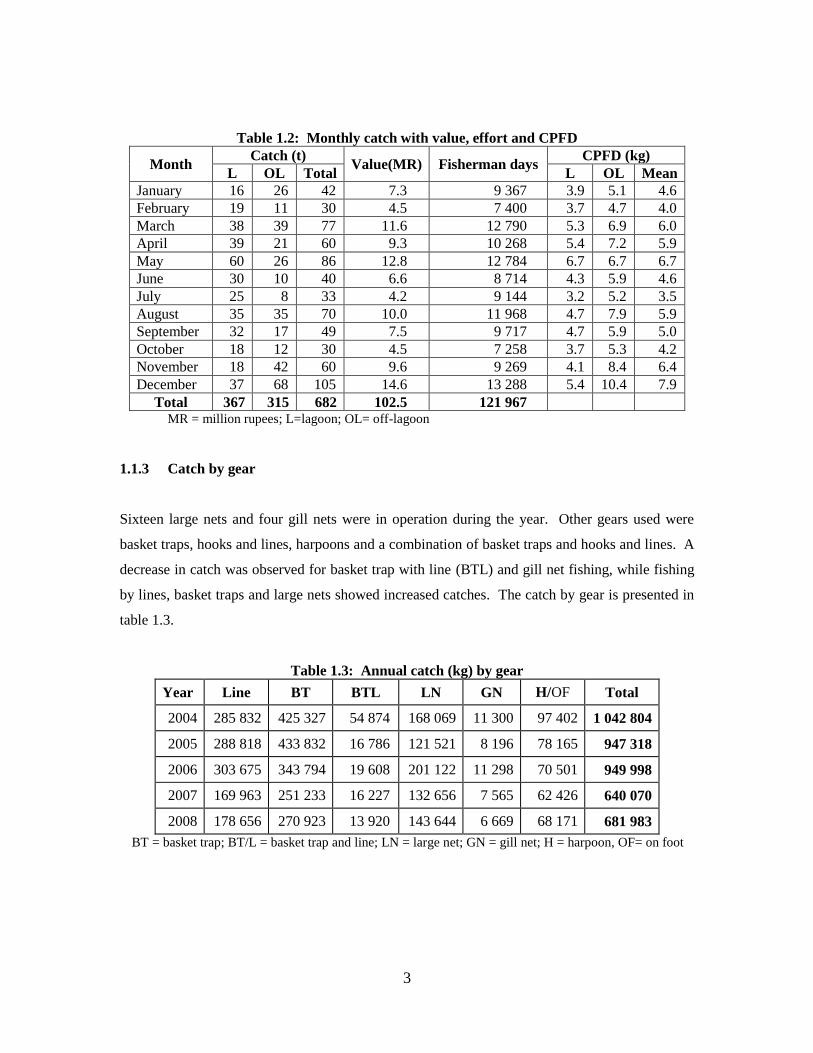
1.1.2 Monthly landings
The monthly production of fresh fish from the lagoon and off-lagoon, value of catch, effort and
CPFD are presented in table 1.2. Peak landings were recorded in the months of March, May,
August and December.
3
Table 1.2: Monthly catch with value, effort and CPFD
Month Catch (t)
Value(MR) Fisherman days CPFD (kg)
L OL Total L OL Mean
January 16 26 42 7.3 9 367 3.9 5.1 4.6
February 19 11 30 4.5 7 400 3.7 4.7 4.0
March 38 39 77 11.6 12 790 5.3 6.9 6.0
April 39 21 60 9.3 10 268 5.4 7.2 5.9
May 60 26 86 12.8 12 784 6.7 6.7 6.7
June 30 10 40 6.6 8 714 4.3 5.9 4.6
July 25 8 33 4.2 9 144 3.2 5.2 3.5
August 35 35 70 10.0 11 968 4.7 7.9 5.9
September 32 17 49 7.5 9 717 4.7 5.9 5.0
October 18 12 30 4.5 7 258 3.7 5.3 4.2
November 18 42 60 9.6 9 269 4.1 8.4 6.4
December 37 68 105 14.6 13 288 5.4 10.4 7.9
Total 367 315 682 102.5 121 967 MR = million rupees; L=lagoon; OL= off-lagoon
1.1.3 Catch by gear
Sixteen large nets and four gill nets were in operation during the year. Other gears used were
basket traps, hooks and lines, harpoons and a combination of basket traps and hooks and lines. A
decrease in catch was observed for basket trap with line (BTL) and gill net fishing, while fishing
by lines, basket traps and large nets showed increased catches. The catch by gear is presented in
table 1.3.
Table 1.3: Annual catch (kg) by gear
Year Line BT BTL LN GN H/OF Total
2004 285 832 425 327 54 874 168 069 11 300 97 402 1 042 804
2005 288 818 433 832 16 786 121 521 8 196 78 165 947 318
2006 303 675 343 794 19 608 201 122 11 298 70 501 949 998
2007 169 963 251 233 16 227 132 656 7 565 62 426 640 070
2008 178 656 270 923 13 920 143 644 6 669 68 171 681 983
BT = basket trap; BT/L = basket trap and line; LN = large net; GN = gill net; H = harpoon, OF= on foot
4
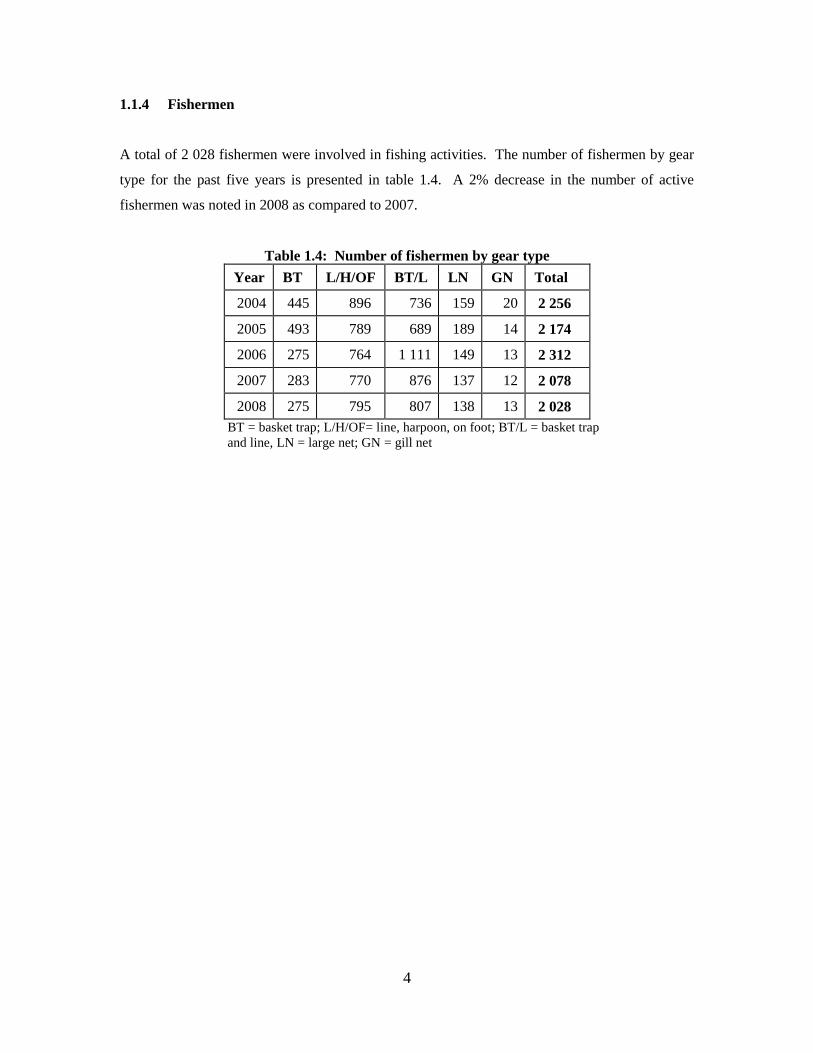
1.1.4 Fishermen
A total of 2 028 fishermen were involved in fishing activities. The number of fishermen by gear
type for the past five years is presented in table 1.4. A 2% decrease in the number of active
fishermen was noted in 2008 as compared to 2007.
Table 1.4: Number of fishermen by gear type
Year BT L/H/OF BT/L LN GN Total
2004 445 896 736 159 20 2 256
2005 493 789 689 189 14 2 174
2006 275 764 1 111 149 13 2 312
2007 283 770 876 137 12 2 078
2008 275 795 807 138 13 2 028
BT = basket trap; L/H/OF= line, harpoon, on foot; BT/L = basket trap
and line, LN = large net; GN = gill net
5
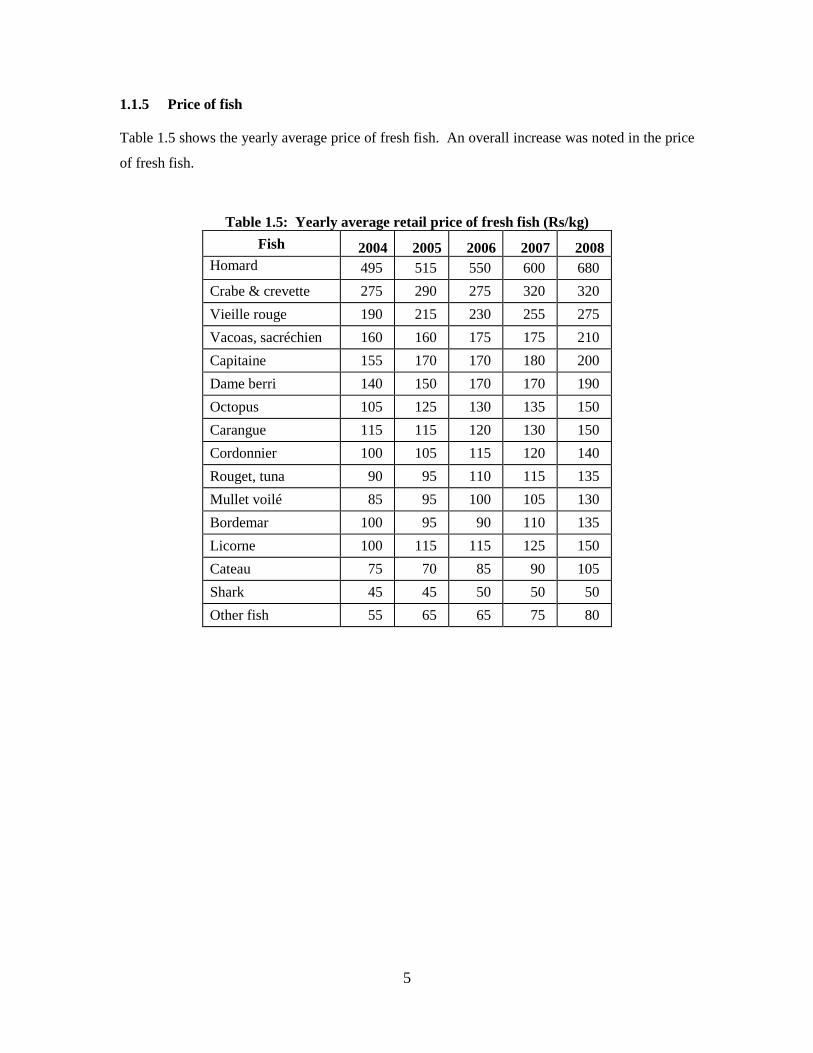
1.1.5 Price of fish
Table 1.5 shows the yearly average price of fresh fish. An overall increase was noted in the price
of fresh fish.
Table 1.5: Yearly average retail price of fresh fish (Rs/kg)
Fish 2004 2005 2006 2007 2008
Homard 495 515 550 600 680
Crabe & crevette 275 290 275 320 320
Vieille rouge 190 215 230 255 275
Vacoas, sacréchien 160 160 175 175 210
Capitaine 155 170 170 180 200
Dame berri 140 150 170 170 190
Octopus 105 125 130 135 150
Carangue 115 115 120 130 150
Cordonnier 100 105 115 120 140
Rouget, tuna 90 95 110 115 135
Mullet voilé 85 95 100 105 130
Bordemar 100 95 90 110 135
Licorne 100 115 115 125 150
Cateau 75 70 85 90 105
Shark 45 45 50 50 50
Other fish 55 65 65 75 80
6
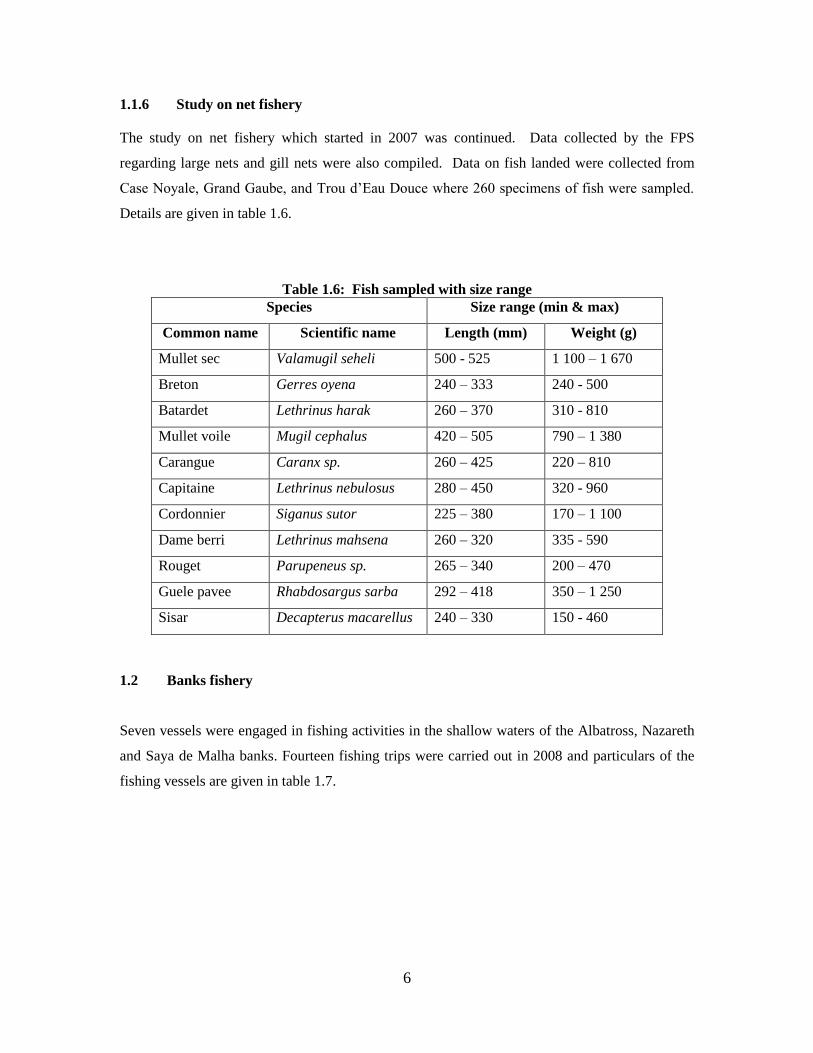
1.1.6 Study on net fishery
The study on net fishery which started in 2007 was continued. Data collected by the FPS
regarding large nets and gill nets were also compiled. Data on fish landed were collected from
Case Noyale, Grand Gaube, and Trou d‟Eau Douce where 260 specimens of fish were sampled.
Details are given in table 1.6.
Table 1.6: Fish sampled with size range
Species Size range (min & max)
Common name Scientific name Length (mm) Weight (g)
Mullet sec Valamugil seheli 500 - 525 1 100 – 1 670
Breton Gerres oyena 240 – 333 240 - 500
Batardet Lethrinus harak 260 – 370 310 - 810
Mullet voile Mugil cephalus 420 – 505 790 – 1 380
Carangue Caranx sp. 260 – 425 220 – 810
Capitaine Lethrinus nebulosus 280 – 450 320 - 960
Cordonnier Siganus sutor 225 – 380 170 – 1 100
Dame berri Lethrinus mahsena 260 – 320 335 - 590
Rouget Parupeneus sp. 265 – 340 200 – 470
Guele pavee Rhabdosargus sarba 292 – 418 350 – 1 250
Sisar Decapterus macarellus 240 – 330 150 - 460
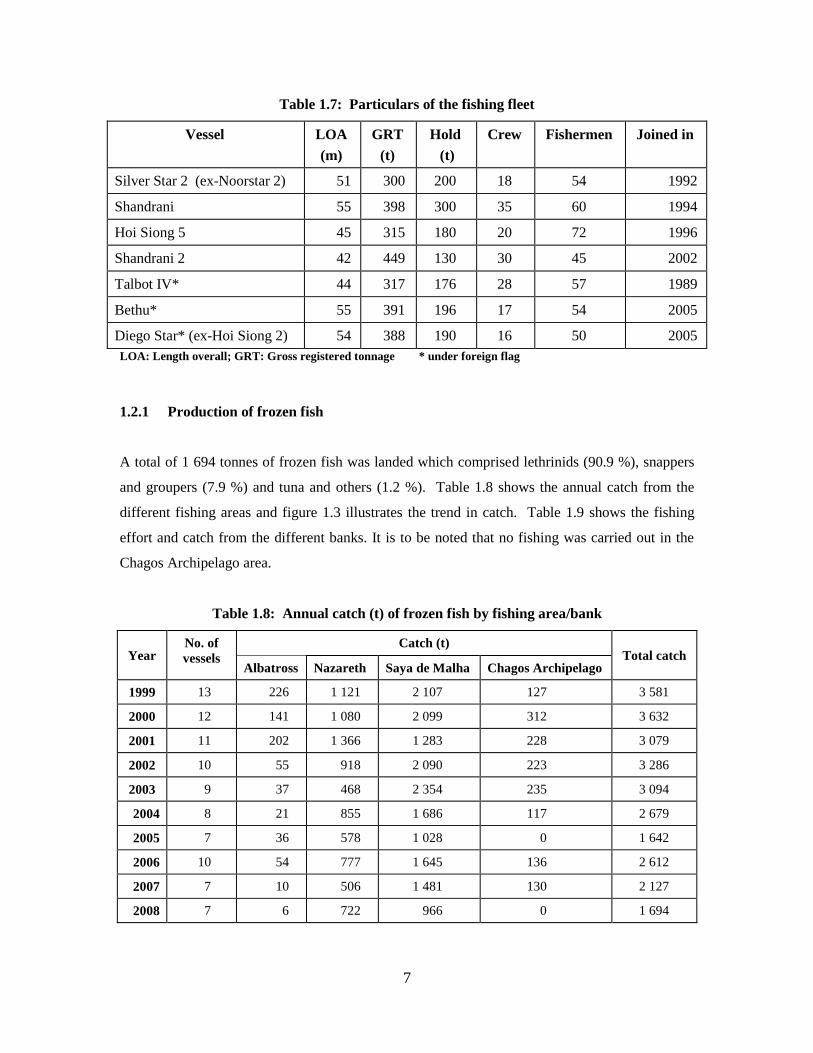
1.2 Banks fishery
Seven vessels were engaged in fishing activities in the shallow waters of the Albatross, Nazareth
and Saya de Malha banks. Fourteen fishing trips were carried out in 2008 and particulars of the
fishing vessels are given in table 1.7.
7
Table 1.7: Particulars of the fishing fleet
Vessel LOA
(m)
GRT
(t)
Hold
(t)
Crew Fishermen Joined in
Silver Star 2 (ex-Noorstar 2) 51 300 200 18 54 1992
Shandrani 55 398 300 35 60 1994
Hoi Siong 5 45 315 180 20 72 1996
Shandrani 2 42 449 130 30 45 2002
Talbot IV* 44 317 176 28 57 1989
Bethu* 55 391 196 17 54 2005
Diego Star* (ex-Hoi Siong 2) 54 388 190 16 50 2005
LOA: Length overall; GRT: Gross registered tonnage * under foreign flag
1.2.1 Production of frozen fish
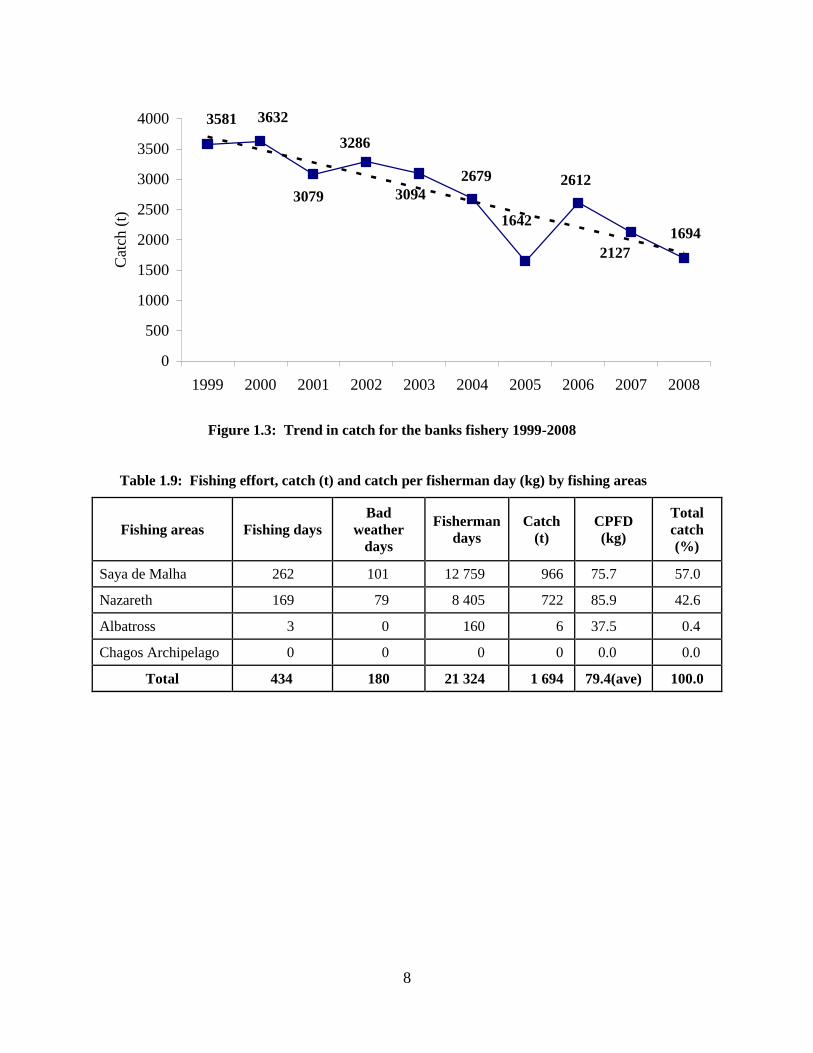
A total of 1 694 tonnes of frozen fish was landed which comprised lethrinids (90.9 %), snappers
and groupers (7.9 %) and tuna and others (1.2 %). Table 1.8 shows the annual catch from the
different fishing areas and figure 1.3 illustrates the trend in catch. Table 1.9 shows the fishing
effort and catch from the different banks. It is to be noted that no fishing was carried out in the
Chagos Archipelago area.
Table 1.8: Annual catch (t) of frozen fish by fishing area/bank
Year No. of
vessels
Catch (t) Total catch
Albatross Nazareth Saya de Malha Chagos Archipelago
1999 13 226 1 121 2 107 127 3 581
2000 12 141 1 080 2 099 312 3 632
2001 11 202 1 366 1 283 228 3 079
2002 10 55 918 2 090 223 3 286
2003 9 37 468 2 354 235 3 094
2004 8 21 855 1 686 117 2 679
2005 7 36 578 1 028 0 1 642
2006 10 54 777 1 645 136 2 612
2007 7 10 506 1 481 130 2 127
2008 7 6 722 966 0 1 694
8
1694
2127
2612
1642
2679
3094
3286
3079
36323581
0
500
1000
1500
2000
2500
3000
3500
4000
1999 2000 2001 2002 2003 2004 2005 2006 2007 2008
Cat
ch (
t)
Figure 1.3: Trend in catch for the banks fishery 1999-2008
Table 1.9: Fishing effort, catch (t) and catch per fisherman day (kg) by fishing areas
Fishing areas Fishing days
Bad
weather
days
Fisherman
days
Catch
(t)
CPFD
(kg)
Total
catch
(%)
Saya de Malha 262 101 12 759 966 75.7 57.0
Nazareth 169 79 8 405 722 85.9 42.6
Albatross 3 0 160 6 37.5 0.4
Chagos Archipelago 0 0 0 0 0.0 0.0
Total 434 180 21 324 1 694 79.4(ave) 100.0
9
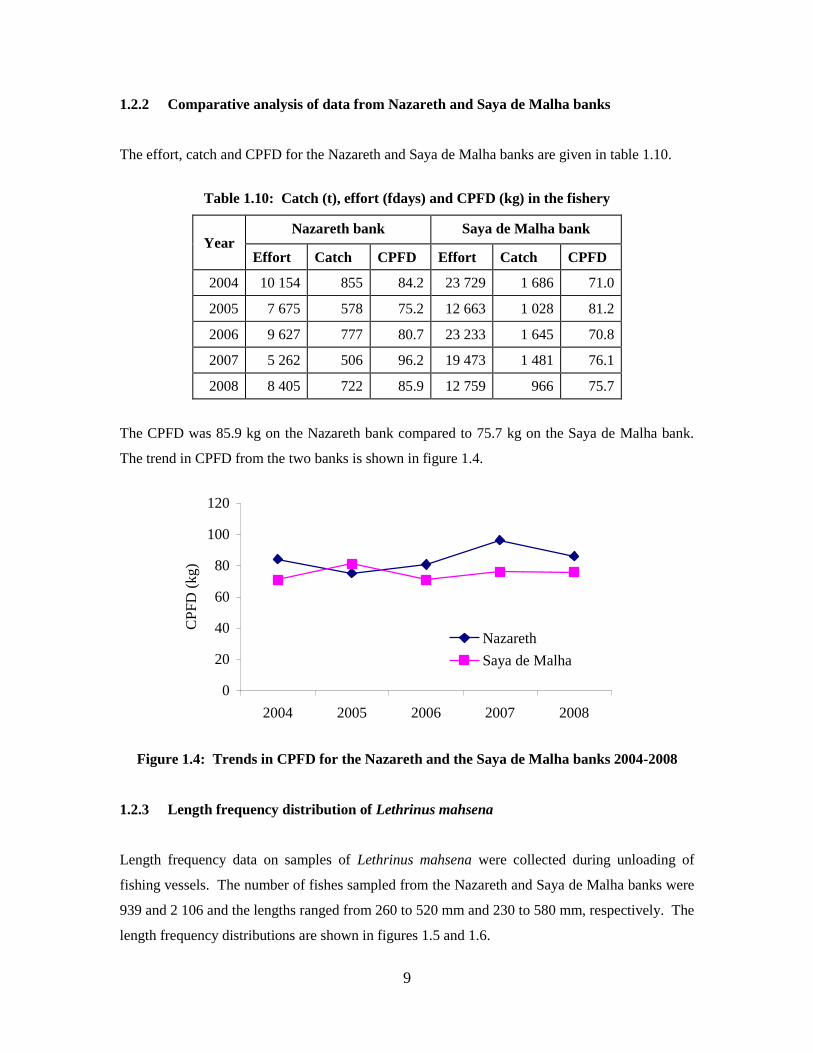
1.2.2 Comparative analysis of data from Nazareth and Saya de Malha banks
The effort, catch and CPFD for the Nazareth and Saya de Malha banks are given in table 1.10.
Table 1.10: Catch (t), effort (fdays) and CPFD (kg) in the fishery
Year Nazareth bank Saya de Malha bank
Effort Catch CPFD Effort Catch CPFD
2004 10 154 855 84.2 23 729 1 686 71.0
2005 7 675 578 75.2 12 663 1 028 81.2
2006 9 627 777 80.7 23 233 1 645 70.8
2007 5 262 506 96.2 19 473 1 481 76.1
2008 8 405 722 85.9 12 759 966 75.7
The CPFD was 85.9 kg on the Nazareth bank compared to 75.7 kg on the Saya de Malha bank.
The trend in CPFD from the two banks is shown in figure 1.4.
0
20
40
60
80
100
120
2004 2005 2006 2007 2008
CP
FD
(k
g)
Nazareth
Saya de Malha
Figure 1.4: Trends in CPFD for the Nazareth and the Saya de Malha banks 2004-2008
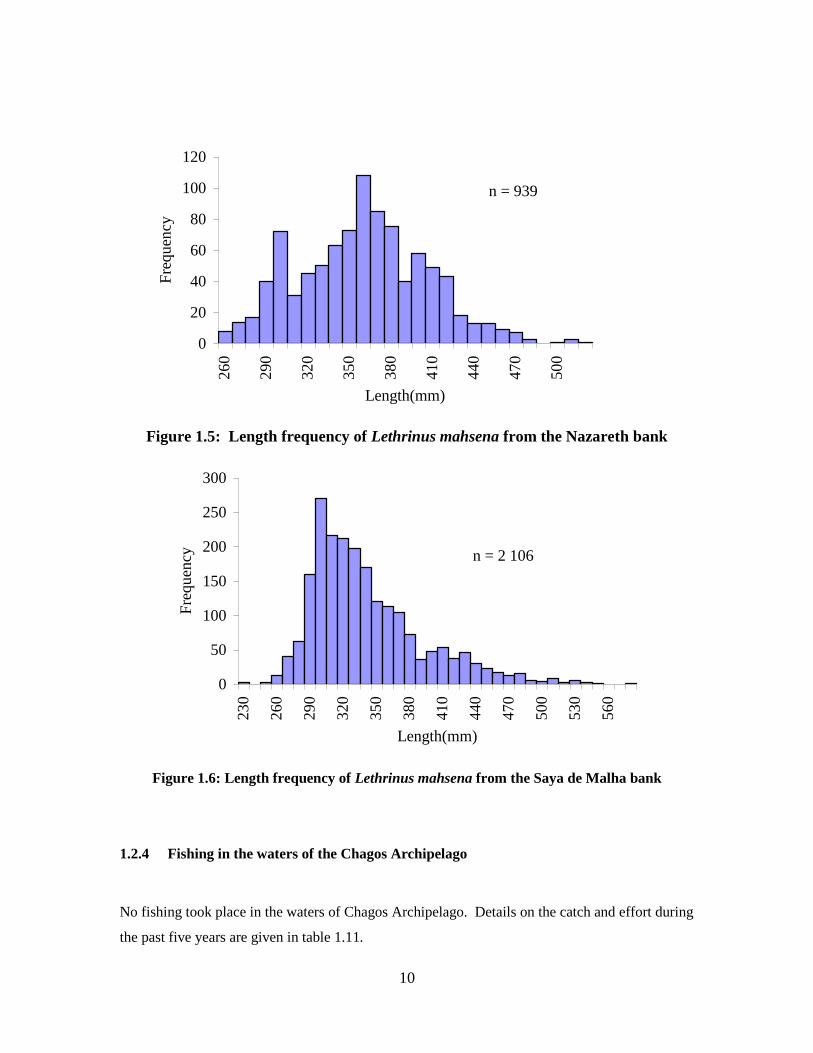
1.2.3 Length frequency distribution of Lethrinus mahsena
Length frequency data on samples of Lethrinus mahsena were collected during unloading of
fishing vessels. The number of fishes sampled from the Nazareth and Saya de Malha banks were
939 and 2 106 and the lengths ranged from 260 to 520 mm and 230 to 580 mm, respectively. The
length frequency distributions are shown in figures 1.5 and 1.6.
10
0
20
40
60
80
100
120
260
290
320
350
380
410
440
470
500
Length(mm)
Fre
quen
cy
Figure 1.5: Length frequency of Lethrinus mahsena from the Nazareth bank
0
50
100
150
200
250
300
230
260
290
320
350
380
410
440
470
500
530
560
Length(mm)
Fre
quen
cy
Figure 1.6: Length frequency of Lethrinus mahsena from the Saya de Malha bank
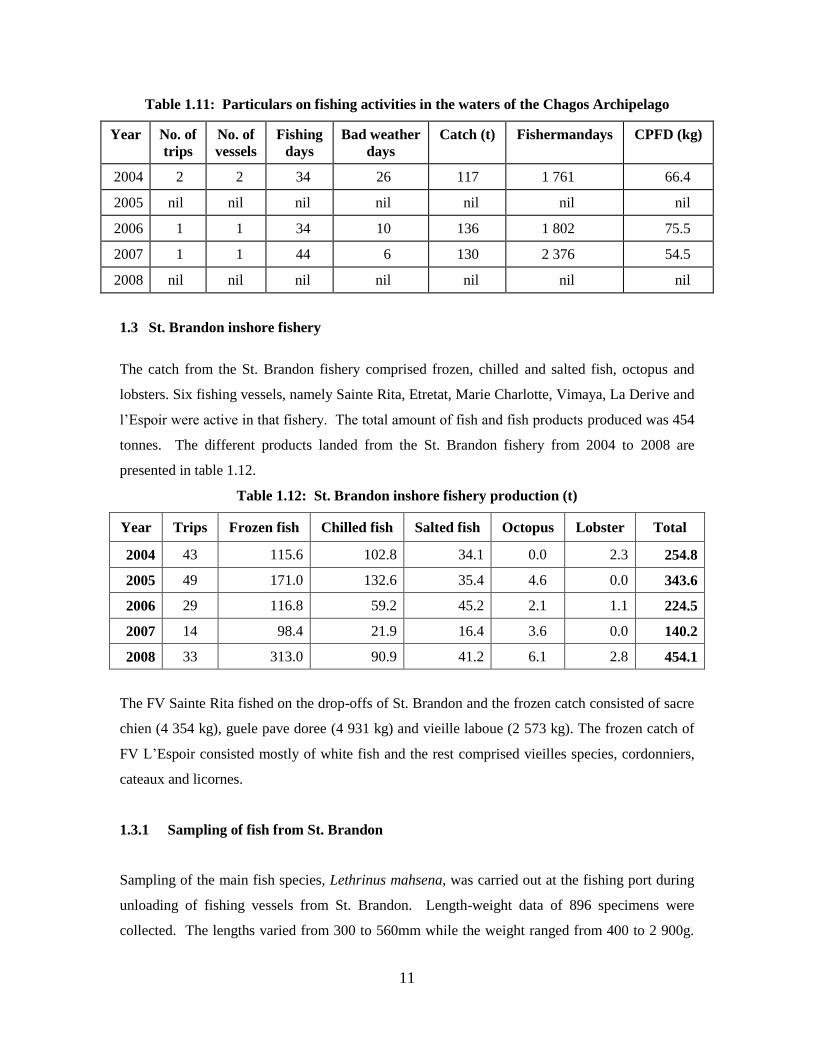
1.2.4 Fishing in the waters of the Chagos Archipelago
No fishing took place in the waters of Chagos Archipelago. Details on the catch and effort during
the past five years are given in table 1.11.
n = 939
n = 2 106
11
Table 1.11: Particulars on fishing activities in the waters of the Chagos Archipelago
Year No. of
trips
No. of
vessels
Fishing
days
Bad weather
days
Catch (t) Fishermandays CPFD (kg)
2004 2 2 34 26 117 1 761 66.4
2005 nil nil nil nil nil nil nil
2006 1 1 34 10 136 1 802 75.5
2007 1 1 44 6 130 2 376 54.5
2008 nil nil nil nil nil nil nil
1.3 St. Brandon inshore fishery
The catch from the St. Brandon fishery comprised frozen, chilled and salted fish, octopus and
lobsters. Six fishing vessels, namely Sainte Rita, Etretat, Marie Charlotte, Vimaya, La Derive and
l‟Espoir were active in that fishery. The total amount of fish and fish products produced was 454
tonnes. The different products landed from the St. Brandon fishery from 2004 to 2008 are
presented in table 1.12.
Table 1.12: St. Brandon inshore fishery production (t)
Year Trips Frozen fish Chilled fish Salted fish Octopus Lobster Total
2004 43 115.6 102.8 34.1 0.0 2.3 254.8
2005 49 171.0 132.6 35.4 4.6 0.0 343.6
2006 29 116.8 59.2 45.2 2.1 1.1 224.5
2007 14 98.4 21.9 16.4 3.6 0.0 140.2
2008 33 313.0 90.9 41.2 6.1 2.8 454.1
The FV Sainte Rita fished on the drop-offs of St. Brandon and the frozen catch consisted of sacre
chien (4 354 kg), guele pave doree (4 931 kg) and vieille laboue (2 573 kg). The frozen catch of
FV L‟Espoir consisted mostly of white fish and the rest comprised vieilles species, cordonniers,
cateaux and licornes.
1.3.1 Sampling of fish from St. Brandon
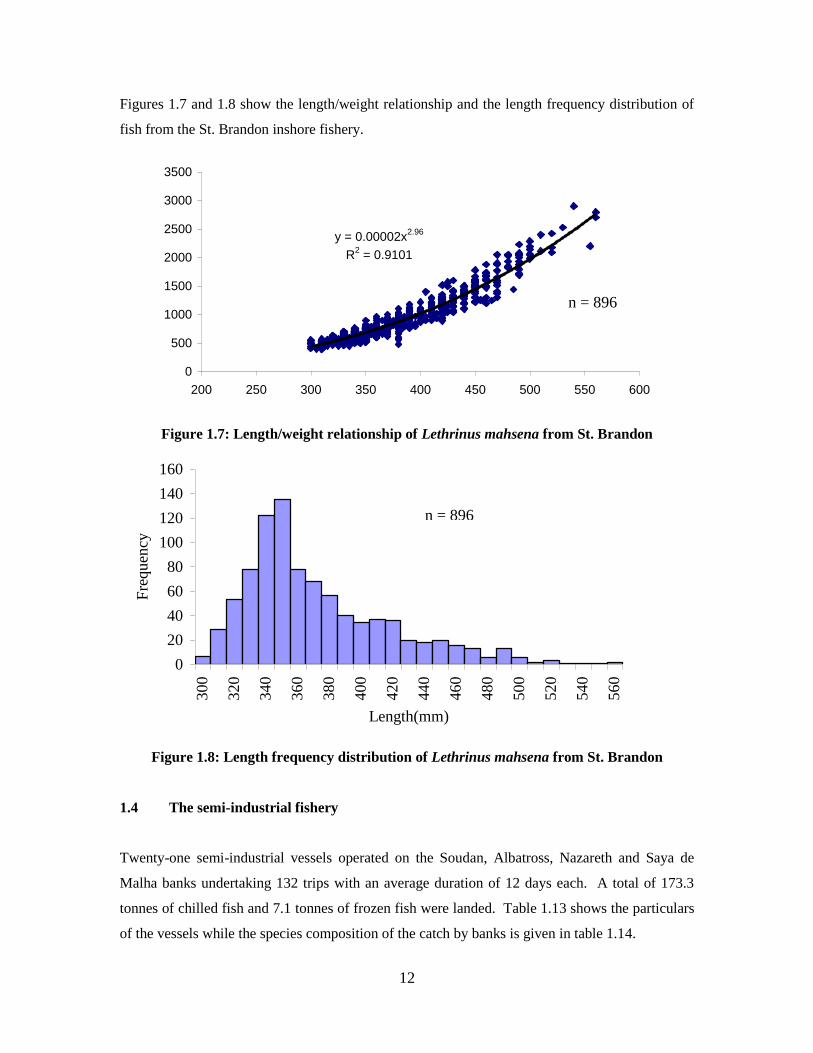
Sampling of the main fish species, Lethrinus mahsena, was carried out at the fishing port during
unloading of fishing vessels from St. Brandon. Length-weight data of 896 specimens were
collected. The lengths varied from 300 to 560mm while the weight ranged from 400 to 2 900g.
12
Figures 1.7 and 1.8 show the length/weight relationship and the length frequency distribution of
fish from the St. Brandon inshore fishery.
y = 0.00002x2.96
R2 = 0.9101
0
500
1000
1500
2000
2500
3000
3500
200 250 300 350 400 450 500 550 600
Figure 1.7: Length/weight relationship of Lethrinus mahsena from St. Brandon
0
20
40
60
80
100
120
140
160
300
320
340
360
380
400
420
440
460
480
500
520
540
560
Length(mm)
Fre
quen
cy
Figure 1.8: Length frequency distribution of Lethrinus mahsena from St. Brandon
1.4 The semi-industrial fishery
Twenty-one semi-industrial vessels operated on the Soudan, Albatross, Nazareth and Saya de
Malha banks undertaking 132 trips with an average duration of 12 days each. A total of 173.3
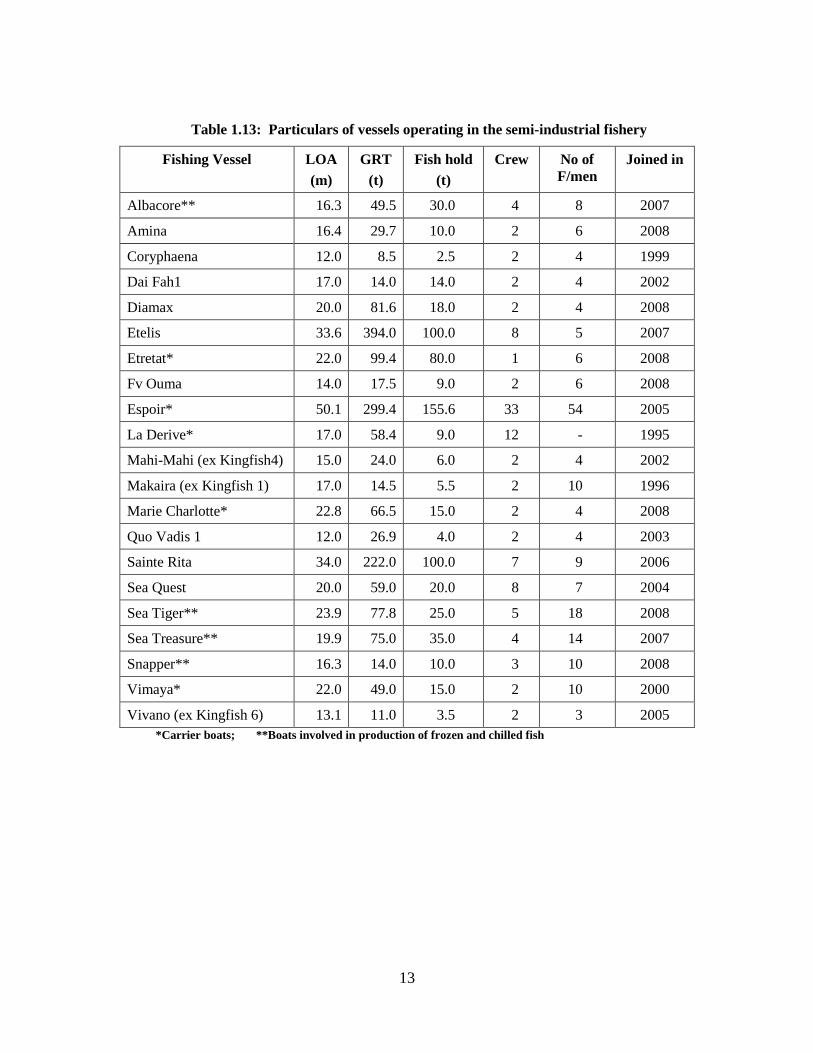
tonnes of chilled fish and 7.1 tonnes of frozen fish were landed. Table 1.13 shows the particulars
of the vessels while the species composition of the catch by banks is given in table 1.14.
n = 896
n = 896
13
Table 1.13: Particulars of vessels operating in the semi-industrial fishery
Fishing Vessel LOA
(m)
GRT
(t)
Fish hold
(t)
Crew No of
F/men
Joined in
Albacore** 16.3 49.5 30.0 4 8 2007
Amina 16.4 29.7 10.0 2 6 2008
Coryphaena 12.0 8.5 2.5 2 4 1999
Dai Fah1 17.0 14.0 14.0 2 4 2002
Diamax 20.0 81.6 18.0 2 4 2008
Etelis 33.6 394.0 100.0 8 5 2007
Etretat* 22.0 99.4 80.0 1 6 2008
Fv Ouma 14.0 17.5 9.0 2 6 2008
Espoir* 50.1 299.4 155.6 33 54 2005
La Derive* 17.0 58.4 9.0 12 - 1995
Mahi-Mahi (ex Kingfish4) 15.0 24.0 6.0 2 4 2002
Makaira (ex Kingfish 1) 17.0 14.5 5.5 2 10 1996
Marie Charlotte* 22.8 66.5 15.0 2 4 2008
Quo Vadis 1 12.0 26.9 4.0 2 4 2003
Sainte Rita 34.0 222.0 100.0 7 9 2006
Sea Quest 20.0 59.0 20.0 8 7 2004
Sea Tiger** 23.9 77.8 25.0 5 18 2008
Sea Treasure** 19.9 75.0 35.0 4 14 2007
Snapper** 16.3 14.0 10.0 3 10 2008
Vimaya* 22.0 49.0 15.0 2 10 2000
Vivano (ex Kingfish 6) 13.1 11.0 3.5 2 3 2005
*Carrier boats; **Boats involved in production of frozen and chilled fish
14
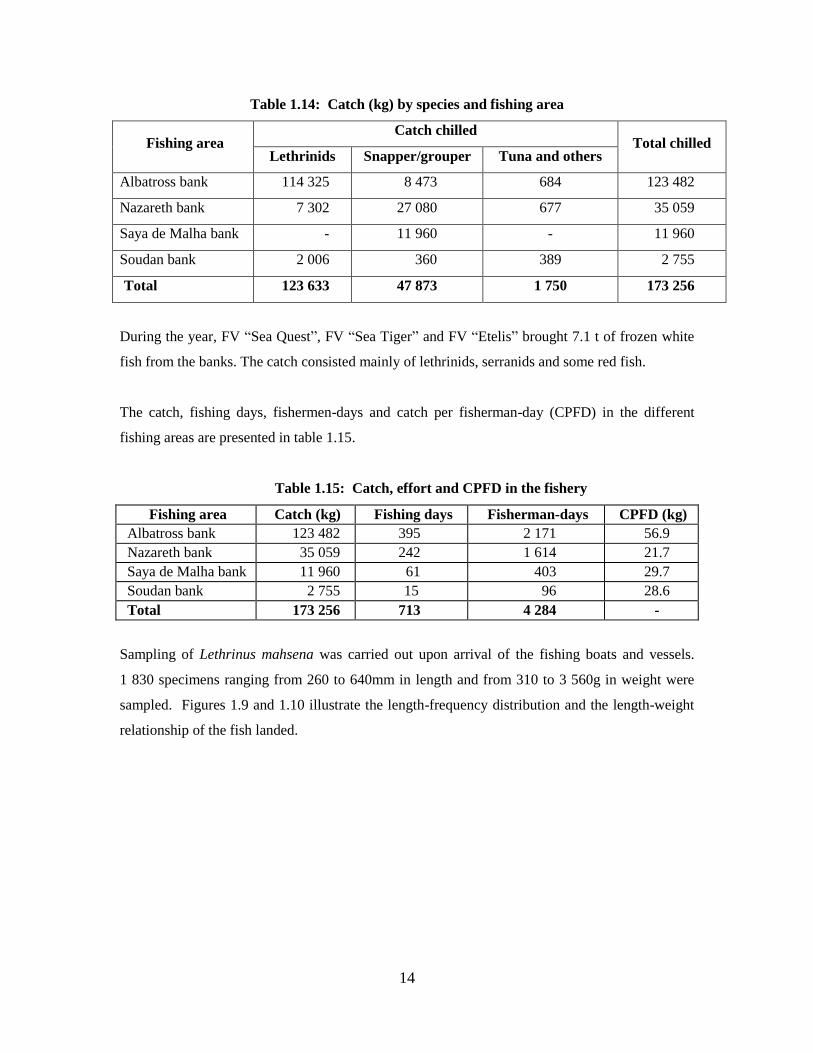
Table 1.14: Catch (kg) by species and fishing area
Fishing area Catch chilled
Total chilled Lethrinids Snapper/grouper Tuna and others
Albatross bank 114 325 8 473 684 123 482
Nazareth bank 7 302 27 080 677 35 059
Saya de Malha bank - 11 960 - 11 960
Soudan bank 2 006 360 389 2 755
Total 123 633 47 873 1 750 173 256
During the year, FV “Sea Quest”, FV “Sea Tiger” and FV “Etelis” brought 7.1 t of frozen white
fish from the banks. The catch consisted mainly of lethrinids, serranids and some red fish.
The catch, fishing days, fishermen-days and catch per fisherman-day (CPFD) in the different
fishing areas are presented in table 1.15.
Table 1.15: Catch, effort and CPFD in the fishery
Fishing area Catch (kg) Fishing days Fisherman-days CPFD (kg)
Albatross bank
bbbbababankNazare
th
123 482 395 2 171 56.9
Nazareth bank 35 059 242 1 614 21.7
Saya de Malha bank 11 960 61 403 29.7
Soudan bank 2 755 15 96 28.6
Total 173 256 713 4 284 -
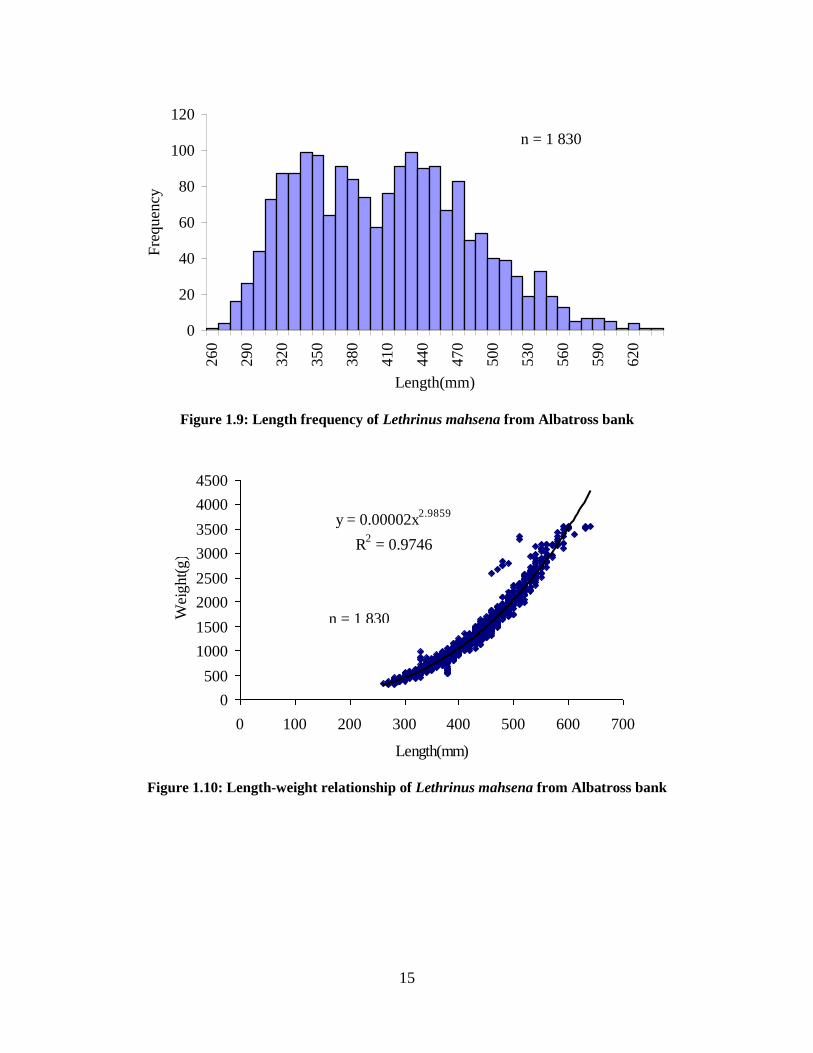
Sampling of Lethrinus mahsena was carried out upon arrival of the fishing boats and vessels.
1 830 specimens ranging from 260 to 640mm in length and from 310 to 3 560g in weight were
sampled. Figures 1.9 and 1.10 illustrate the length-frequency distribution and the length-weight
relationship of the fish landed.
15
0
20
40
60
80
100
120
26
0
29
0
32
0
35
0
38
0
41
0
44
0
47
0
50
0
53
0
56
0
59
0
62
0
Length(mm)
Fre
qu
ency
Figure 1.9: Length frequency of Lethrinus mahsena from Albatross bank
y = 0.00002x2.9859
R2 = 0.9746
0
500
1000
1500
2000
2500
3000
3500
4000
4500
0 100 200 300 400 500 600 700
Length(mm)
Wei
ght(
g)
Figure 1.10: Length-weight relationship of Lethrinus mahsena from Albatross bank
n = 1 830
n = 1 830
16
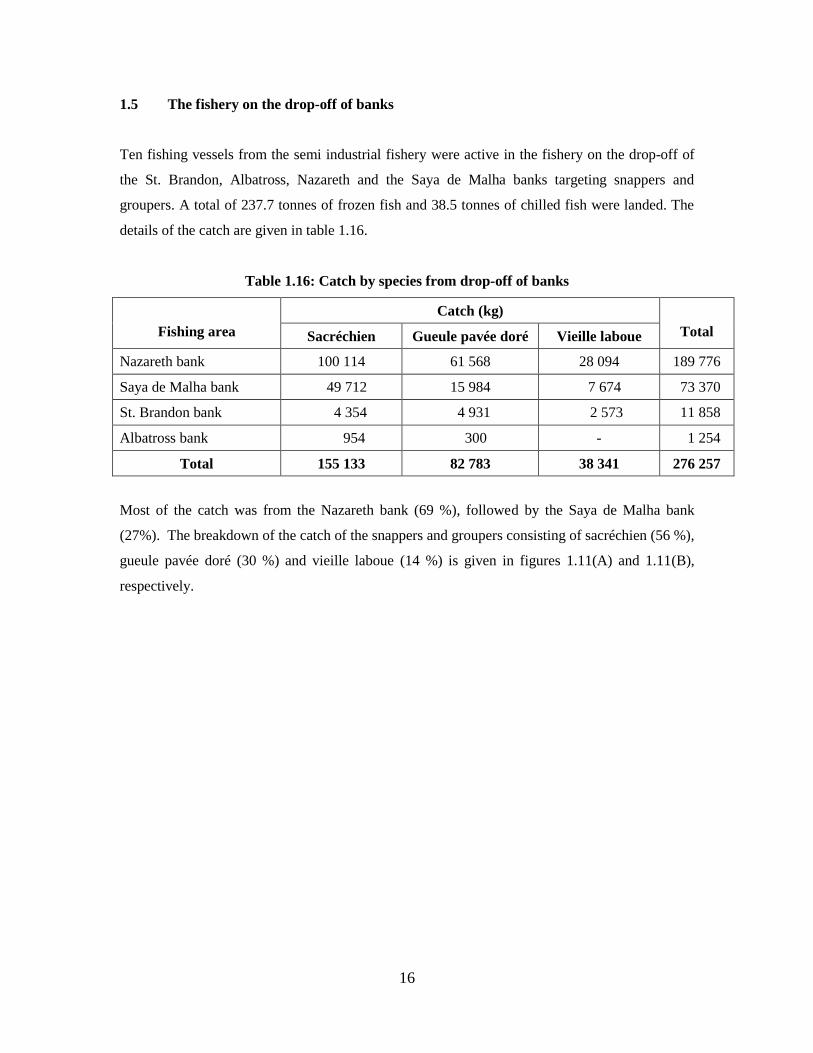
1.5 The fishery on the drop-off of banks
Ten fishing vessels from the semi industrial fishery were active in the fishery on the drop-off of
the St. Brandon, Albatross, Nazareth and the Saya de Malha banks targeting snappers and
groupers. A total of 237.7 tonnes of frozen fish and 38.5 tonnes of chilled fish were landed. The
details of the catch are given in table 1.16.
Table 1.16: Catch by species from drop-off of banks
Fishing area
Catch (kg)
Total Sacréchien Gueule pavée doré Vieille laboue
Nazareth bank 100 114 61 568 28 094 189 776
Saya de Malha bank 49 712 15 984 7 674 73 370
St. Brandon bank 4 354 4 931 2 573 11 858
Albatross bank 954 300 - 1 254
Total 155 133 82 783 38 341 276 257
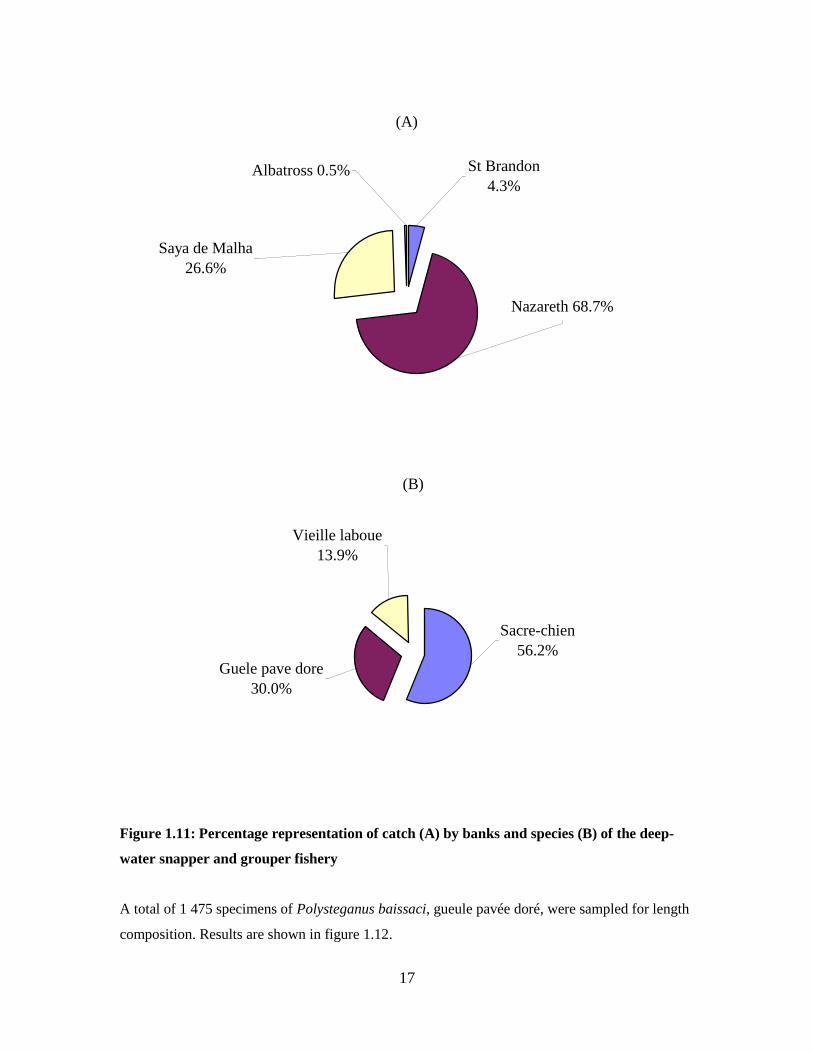
Most of the catch was from the Nazareth bank (69 %), followed by the Saya de Malha bank
(27%). The breakdown of the catch of the snappers and groupers consisting of sacréchien (56 %),
gueule pavée doré (30 %) and vieille laboue (14 %) is given in figures 1.11(A) and 1.11(B),
respectively.
17
(A)
Nazareth 68.7%
Saya de Malha
26.6%
St Brandon
4.3%Albatross 0.5%
(B)
Guele pave dore
30.0%
Vieille laboue
13.9%
Sacre-chien
56.2%
Figure 1.11: Percentage representation of catch (A) by banks and species (B) of the deep-
water snapper and grouper fishery
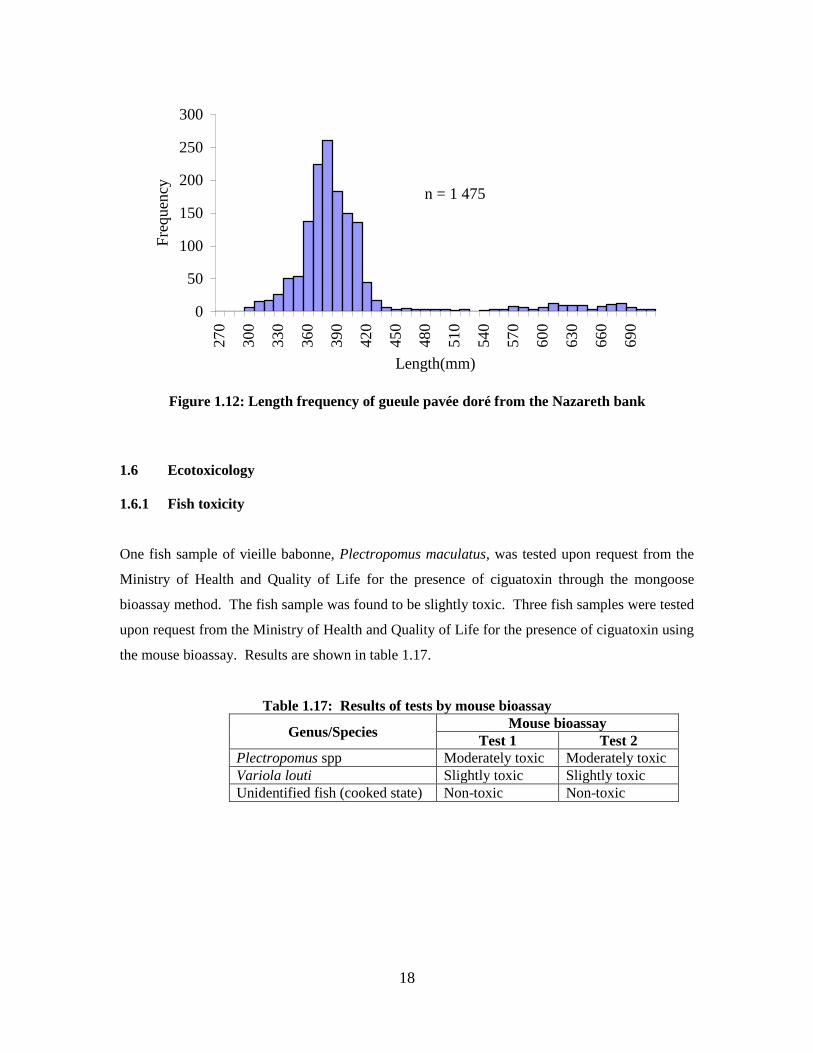
A total of 1 475 specimens of Polysteganus baissaci, gueule pavée doré, were sampled for length
composition. Results are shown in figure 1.12.
18
0
50
100
150
200
250
300
27
0
30
0
33
0
36
0
39
0
42
0
45
0
48
0
51
0
54
0
57
0
60
0
63
0
66
0
69
0
Length(mm)
Fre
qu
ency
Figure 1.12: Length frequency of gueule pavée doré from the Nazareth bank
1.6 Ecotoxicology
1.6.1 Fish toxicity
One fish sample of vieille babonne, Plectropomus maculatus, was tested upon request from the
Ministry of Health and Quality of Life for the presence of ciguatoxin through the mongoose
bioassay method. The fish sample was found to be slightly toxic. Three fish samples were tested
upon request from the Ministry of Health and Quality of Life for the presence of ciguatoxin using
the mouse bioassay. Results are shown in table 1.17.
Table 1.17: Results of tests by mouse bioassay
Genus/Species Mouse bioassay
Test 1 Test 2
Plectropomus spp Moderately toxic Moderately toxic
Variola louti Slightly toxic Slightly toxic
Unidentified fish (cooked state) Non-toxic Non-toxic
n = 1 475
19
1.6.2 Harmful marine microalgae
The study of potentially harmful marine microalgae was continued at the four established sites
namely, Albion, Blue Bay, Le Morne and Trou aux Biches. The sites were sampled quarterly for
the presence and density of harmful marine microalgae. The main species of dinoflagellates
recorded in high numbers were Prorocentrum spp. and Ostreopsis. Species of Amphidinium and
Synophysis were not observed at Blue Bay. However, diatoms were present at all the sites in
larger numbers than previously observed. The total number of dinoflagellates, per six litres of
seawater and macroalgae, recorded at the four sampling sites is shown in table 1.18.
Table 1.18: Total number of dinoflagellates recorded (cell count)
Species Blue Bay Trou aux Biches Albion Le Morne
Gambierdiscus sp. nil nil nil nil
Ostreopsis sp. 34 11 67 16
Prorocentrum lima 51 7 15 17
Prorocentrum concavum 5 6 10 8
Prorocentrum sp. 14 9 7 9
Amphidinium sp. nil 1 1 2
Synophysis sp. nil l 1 1
Coolia sp. nil 3 nil 2
1.7 Identification of fish specimens
Fifty-one different fish species were brought to AFRC by officers of the Fisheries Protection
Service, National Coast Guard, Police and Ministry of Health and Quality of Life for
identification.
1.8 Sea cucumber fishery
1.8.1 Survey on sea cucumbers
Sea cucumber surveys were undertaken in April 2008 at 8 sites, i.e., Grand Gaube, Roche Noires,
Grand River South East, Mahebourg, Le Morne, La Preneuse, Flic en Flac and Pointe aux Piments
to assess the sea cucumber stocks. Seven species of sea cucumber, namely Holothuria atra,
Holothuria leucospilota, Holothuria scabra, Holothuria percivax, Stichopus chloronotus,
Bohadscia marmorata and Thenelota annax were observed at the survey sites.
The average number of sea cucumbers was 58 per 1000m2 and the overall density was estimated at
58 000 individuals/km2 in the lagoon around the island. The highest density of sea cucumbers
20
was again found at Grand Gaube (326 per1000m2). A lower density was observed in most of the
regions surveyed except at Le Morne where there was an increase in the number of sea cucumbers.
Based on the survey, a total allowable catch (TAC) of 275 tonnes (wet weight) was imposed.
1.8.2 Sea cucumber production
Ten operators were authorised to collect, process and export sea cucumbers on a quota basis for
the period 1st August 2008 to 31
st July 2009, January to March 2009 being closed season for the
collection of sea cucumbers. A quota of 35 tonnes (dry weight) was distributed among the 10
operators. Only 5 operators undertook the collection and export of sea cucumbers. The collection
of sea cucumbers amounted to 95.3 tonnes (wet weight).
21
2. MARINE SCIENCE
2.1 Coastal ecosystem research
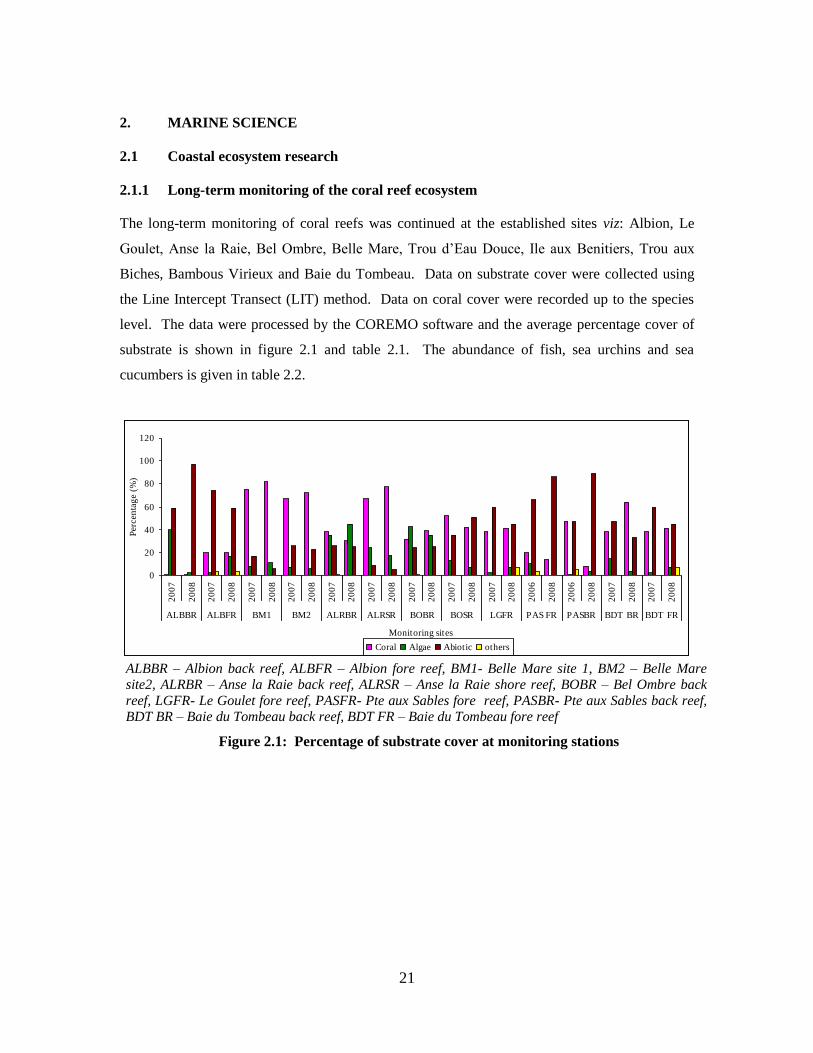
2.1.1 Long-term monitoring of the coral reef ecosystem
The long-term monitoring of coral reefs was continued at the established sites viz: Albion, Le
Goulet, Anse la Raie, Bel Ombre, Belle Mare, Trou d‟Eau Douce, Ile aux Benitiers, Trou aux
Biches, Bambous Virieux and Baie du Tombeau. Data on substrate cover were collected using
the Line Intercept Transect (LIT) method. Data on coral cover were recorded up to the species
level. The data were processed by the COREMO software and the average percentage cover of
substrate is shown in figure 2.1 and table 2.1. The abundance of fish, sea urchins and sea
cucumbers is given in table 2.2.
0
20
40
60
80
100
120
20
07
20
08
20
07
20
08
20
07
20
08
20
07
20
08
20
07
20
08
20
07
20
08
20
07
20
08
20
07
20
08
20
07
20
08
20
06
20
08
20
06
20
08
20
07
20
08
20
07
20
08
ALBBR ALBFR BM1 BM2 ALRBR ALRSR BOBR BOSR LGFR PAS FR PASBR BDT BR BDT FR
Monitoring sites
Per
cen
tag
e (%
)
Coral Algae Abiotic others
ALBBR – Albion back reef, ALBFR – Albion fore reef, BM1- Belle Mare site 1, BM2 – Belle Mare site2, ALRBR – Anse la Raie back reef, ALRSR – Anse la Raie shore reef, BOBR – Bel Ombre back
reef, LGFR- Le Goulet fore reef, PASFR- Pte aux Sables fore reef, PASBR- Pte aux Sables back reef,
BDT BR – Baie du Tombeau back reef, BDT FR – Baie du Tombeau fore reef
Figure 2.1: Percentage of substrate cover at monitoring stations
22
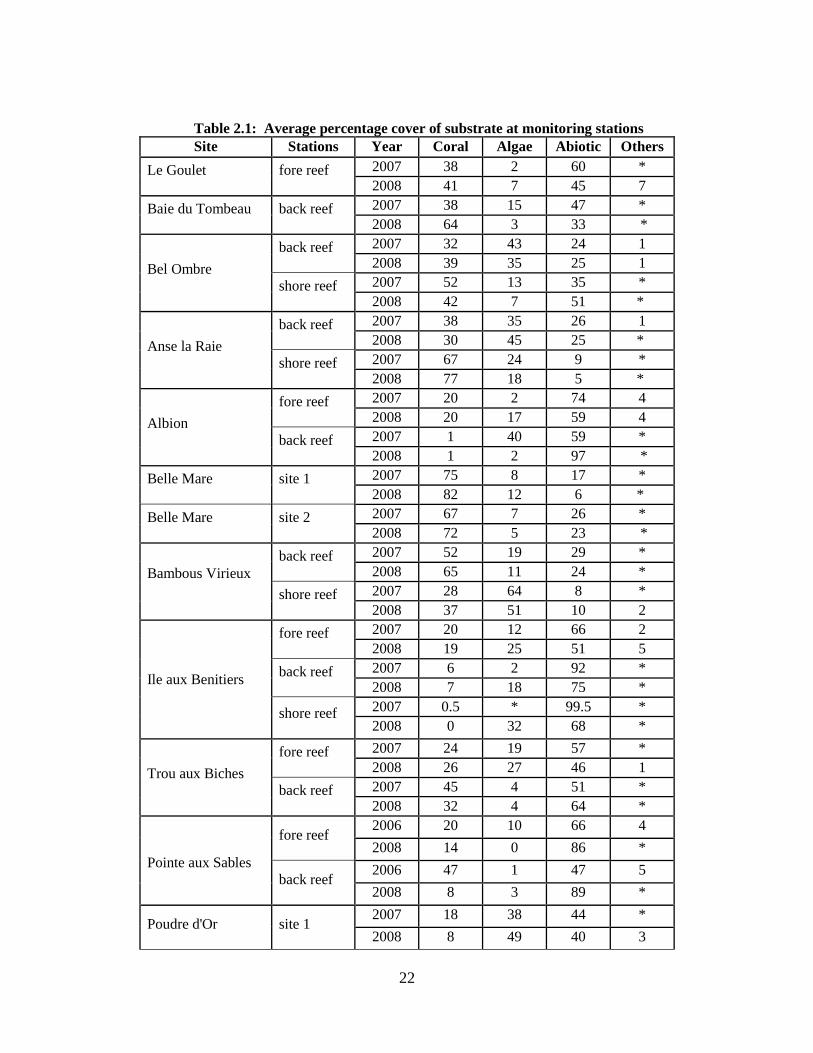
Table 2.1: Average percentage cover of substrate at monitoring stations
Site Stations Year Coral Algae Abiotic Others
Le Goulet
fore reef
2007 38 2 60 *
2008 41 7 45 7
Baie du Tombeau
back reef
2007 38 15 47 *
2008 64 3 33 *
Bel Ombre
back reef
2007 32 43 24 1
2008 39 35 25 1
shore reef
2007 52 13 35 *
2008 42 7 51 *
Anse la Raie
back reef
2007 38 35 26 1
2008 30 45 25 *
shore reef
2007 67 24 9 *
2008 77 18 5 *
Albion
fore reef
2007 20 2 74 4
2008 20 17 59 4
back reef
2007 1 40 59 *
2008 1 2 97 *
Belle Mare
site 1
2007 75 8 17 *
2008 82 12 6 *
Belle Mare
site 2
2007 67 7 26 *
2008 72 5 23 *
Bambous Virieux
back reef
2007 52 19 29 *
2008 65 11 24 *
shore reef
2007 28 64 8 *
2008 37 51 10 2
Ile aux Benitiers
fore reef
2007 20 12 66 2
2008 19 25 51 5
back reef
2007 6 2 92 *
2008 7 18 75 *
shore reef
2007 0.5 * 99.5 *
2008 0 32 68 *
Trou aux Biches
fore reef
2007 24 19 57 *
2008 26 27 46 1
back reef
2007 45 4 51 *
2008 32 4 64 *
Pointe aux Sables
fore reef
2006 20 10 66 4
2008 14 0 86 *
back reef
2006 47 1 47 5
2008 8 3 89 *
Poudre d'Or
site 1
2007 18 38 44 *
2008 8 49 40 3
23
Poudre d'Or
site 2
2007 54 1 45 *
2008 56 3 41 *
Trou d'Eau Douce
back reef
2007 30 46 23 1
2008 38 32 29 1
shore reef
2007 64 2 30 4
2008 52 6 39 3
Others: sponges, crown of thorns, soft corals, giant clams, * - Not Observed
Observations showed a variation in the percentage of coral cover, with an increase in coral cover
at certain monitoring stations which may be attributed to coral recruitment while a decrease at
some of the monitoring stations may be due to an increase in the abiotic component and algal
cover. The increase in abiotic component may be attributed to the combined effects of previous
coral bleaching and siltation in the region. During the year no coral bleaching was observed at
any of the sites surveyed.
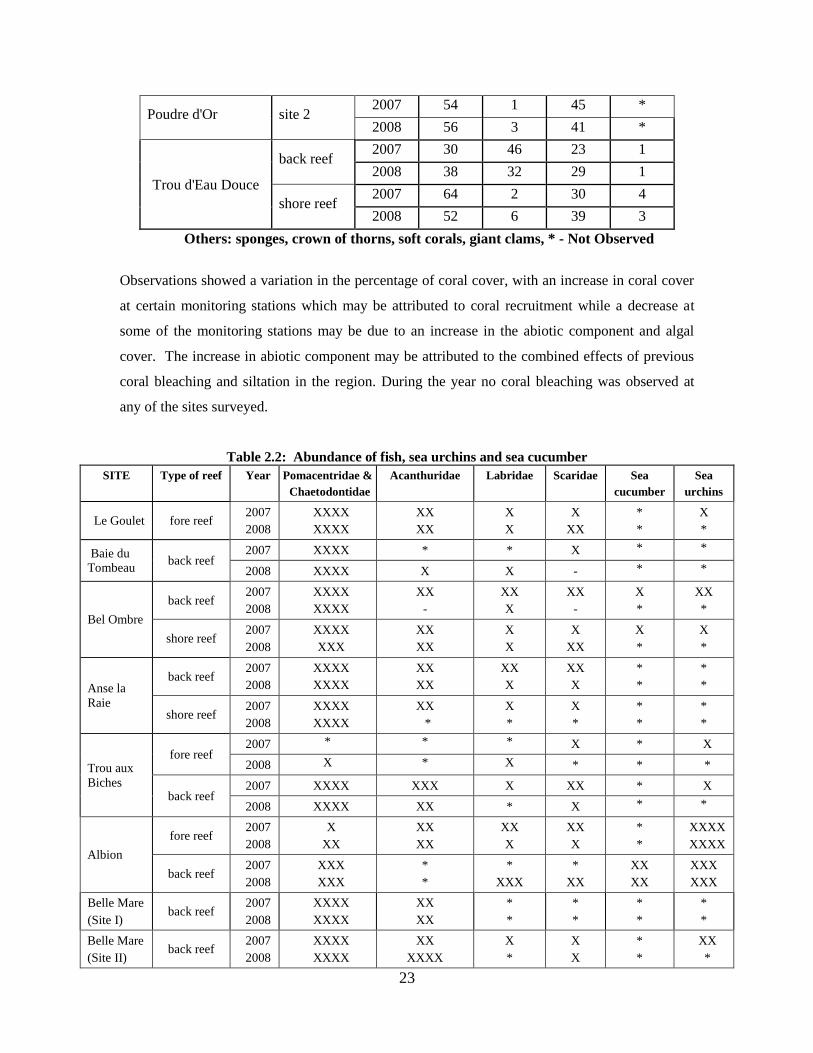
Table 2.2: Abundance of fish, sea urchins and sea cucumber
SITE Type of reef Year Pomacentridae &
Chaetodontidae
Acanthuridae Labridae Scaridae Sea
cucumber
Sea
urchins
Le Goulet fore reef 2007
2008
XXXX
XXXX
XX
XX
X
X
X
XX
*
*
X
*
Baie du
Tombeau back reef
2007 XXXX * * X * *
2008 XXXX X X - * *
Bel Ombre
back reef 2007
2008
XXXX
XXXX
XX
-
XX
X
XX
-
X
*
XX
*
shore reef 2007
2008
XXXX
XXX
XX
XX
X
X
X
XX
X
*
X
*
Anse la
Raie
back reef 2007
2008
XXXX
XXXX
XX
XX
XX
X
XX
X
*
*
*
*
shore reef 2007
2008
XXXX
XXXX
XX
*
X
*
X
*
*
*
*
*
Trou aux
Biches
fore reef 2007 * * * X * X
2008 X * X * * *
back reef 2007 XXXX XXX X XX * X
2008 XXXX XX * X * *
Albion
fore reef 2007
2008
X
XX
XX
XX
XX
X
XX
X
*
*
XXXX
XXXX
back reef 2007
2008
XXX
XXX
*
*
*
XXX
*
XX
XX
XX
XXX
XXX
Belle Mare
(Site I) back reef
2007
2008
XXXX
XXXX
XX
XX
*
*
*
*
*
*
*
*
Belle Mare
(Site II) back reef
2007
2008
XXXX
XXXX
XX
XXXX
X
*
X
X
*
*
XX
*
24
Trou
d‟Eau
Douce
back reef 2007 XXXX XX X * * *
2008 XXXX * * * * *
shore reef 2007 XX * * X * *
2008 XX XX X * * *
Ile aux
Benitiers
back reef 2007 XXXX XXX X X * *
2008 XXXX XX X X * *
shore reef 2007 X XX X XX X XX
2008 XX XX X XX * *
fore reef 2007 X XXX XX * * XXX
2008 X XX X XX * XXXX
Bambous
Virieux
back reef 2007 XXXX * X X X XX
2008 XXXX XX X X * *
shore reef 2007 XXXX XXX X XX * *
2008 XXXX XX X * * *
Pointe aux
Sables back reef
2006
2008
XXX
XXX
XX
XX
X
X
XX
XX
X
N/O
XXXX
XXXX
*– Not observed, X – 0-10, XX- 10-50, XXX – 50-100, XXXX - >100
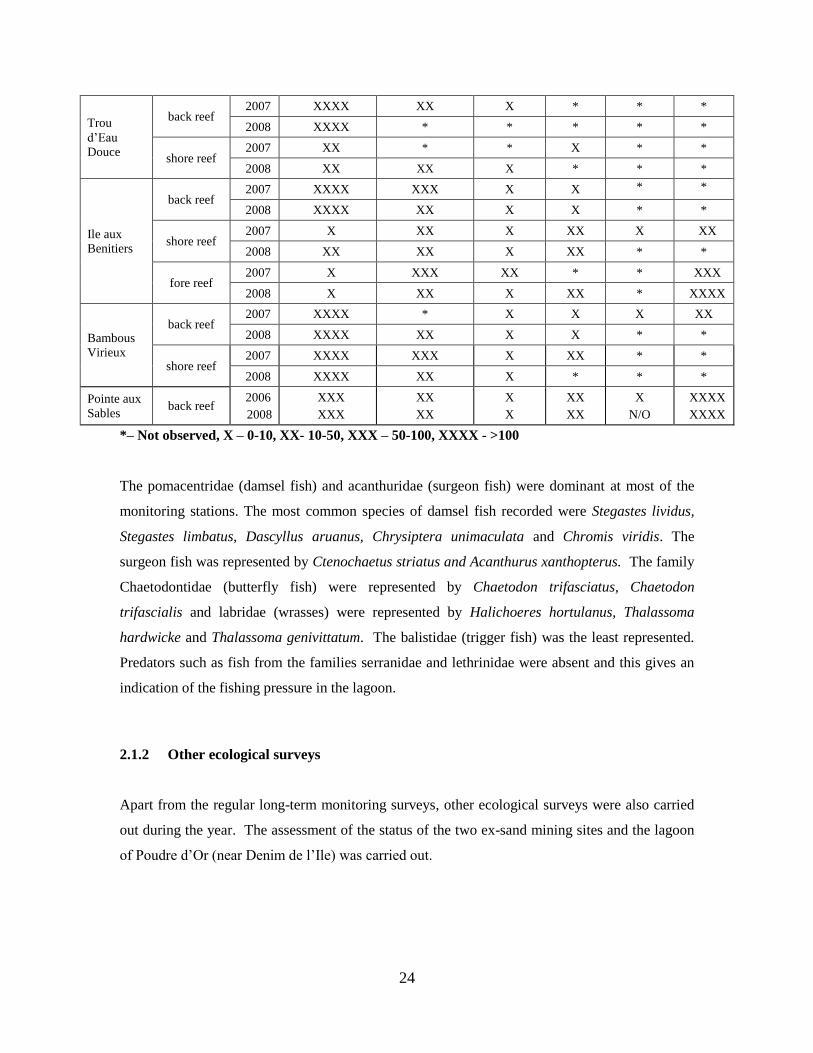
The pomacentridae (damsel fish) and acanthuridae (surgeon fish) were dominant at most of the
monitoring stations. The most common species of damsel fish recorded were Stegastes lividus,
Stegastes limbatus, Dascyllus aruanus, Chrysiptera unimaculata and Chromis viridis. The
surgeon fish was represented by Ctenochaetus striatus and Acanthurus xanthopterus. The family
Chaetodontidae (butterfly fish) were represented by Chaetodon trifasciatus, Chaetodon
trifascialis and labridae (wrasses) were represented by Halichoeres hortulanus, Thalassoma
hardwicke and Thalassoma genivittatum. The balistidae (trigger fish) was the least represented.
Predators such as fish from the families serranidae and lethrinidae were absent and this gives an
indication of the fishing pressure in the lagoon.
2.1.2 Other ecological surveys
Apart from the regular long-term monitoring surveys, other ecological surveys were also carried
out during the year. The assessment of the status of the two ex-sand mining sites and the lagoon
of Poudre d‟Or (near Denim de l‟Ile) was carried out.
25
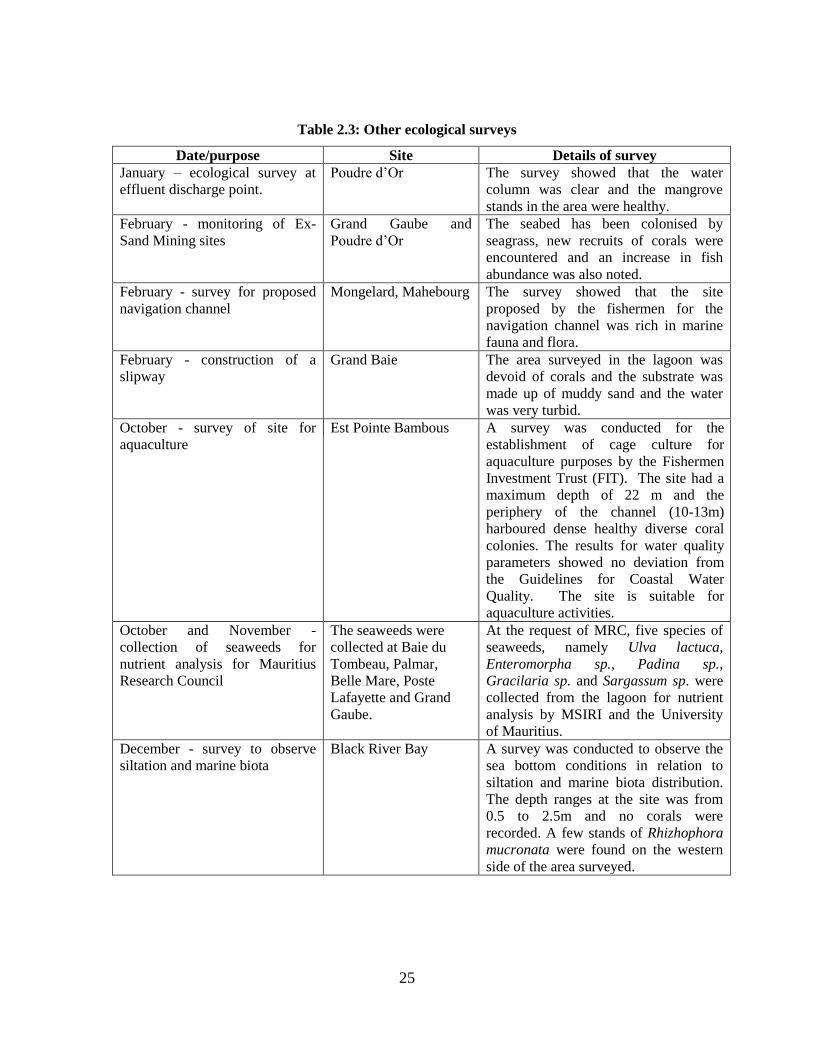
Table 2.3: Other ecological surveys
Date/purpose Site Details of survey
January – ecological survey at
effluent discharge point.
Poudre d‟Or The survey showed that the water
column was clear and the mangrove
stands in the area were healthy.
February - monitoring of Ex-
Sand Mining sites
Grand Gaube and
Poudre d‟Or
The seabed has been colonised by
seagrass, new recruits of corals were
encountered and an increase in fish
abundance was also noted.
February - survey for proposed
navigation channel
Mongelard, Mahebourg The survey showed that the site
proposed by the fishermen for the
navigation channel was rich in marine
fauna and flora.
February - construction of a
slipway
Grand Baie The area surveyed in the lagoon was
devoid of corals and the substrate was
made up of muddy sand and the water
was very turbid.
October - survey of site for
aquaculture
Est Pointe Bambous A survey was conducted for the
establishment of cage culture for
aquaculture purposes by the Fishermen
Investment Trust (FIT). The site had a
maximum depth of 22 m and the
periphery of the channel (10-13m)
harboured dense healthy diverse coral
colonies. The results for water quality
parameters showed no deviation from
the Guidelines for Coastal Water
Quality. The site is suitable for
aquaculture activities.
October and November -
collection of seaweeds for
nutrient analysis for Mauritius
Research Council
The seaweeds were
collected at Baie du
Tombeau, Palmar,
Belle Mare, Poste
Lafayette and Grand
Gaube.
At the request of MRC, five species of
seaweeds, namely Ulva lactuca,
Enteromorpha sp., Padina sp.,
Gracilaria sp. and Sargassum sp. were
collected from the lagoon for nutrient
analysis by MSIRI and the University
of Mauritius.
December - survey to observe
siltation and marine biota
Black River Bay A survey was conducted to observe the
sea bottom conditions in relation to
siltation and marine biota distribution.
The depth ranges at the site was from
0.5 to 2.5m and no corals were
recorded. A few stands of Rhizhophora
mucronata were found on the western
side of the area surveyed.
26
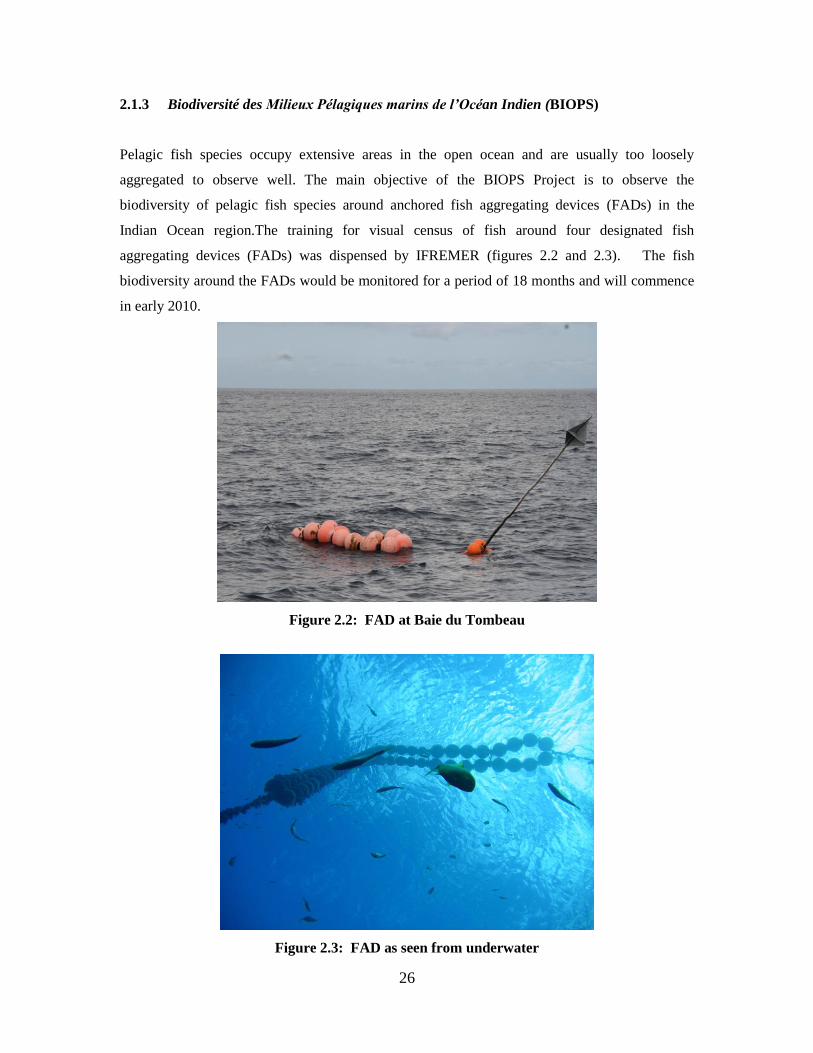
2.1.3 Biodiversité des Milieux Pélagiques marins de l’Océan Indien (BIOPS)
Pelagic fish species occupy extensive areas in the open ocean and are usually too loosely
aggregated to observe well. The main objective of the BIOPS Project is to observe the
biodiversity of pelagic fish species around anchored fish aggregating devices (FADs) in the
Indian Ocean region.The training for visual census of fish around four designated fish
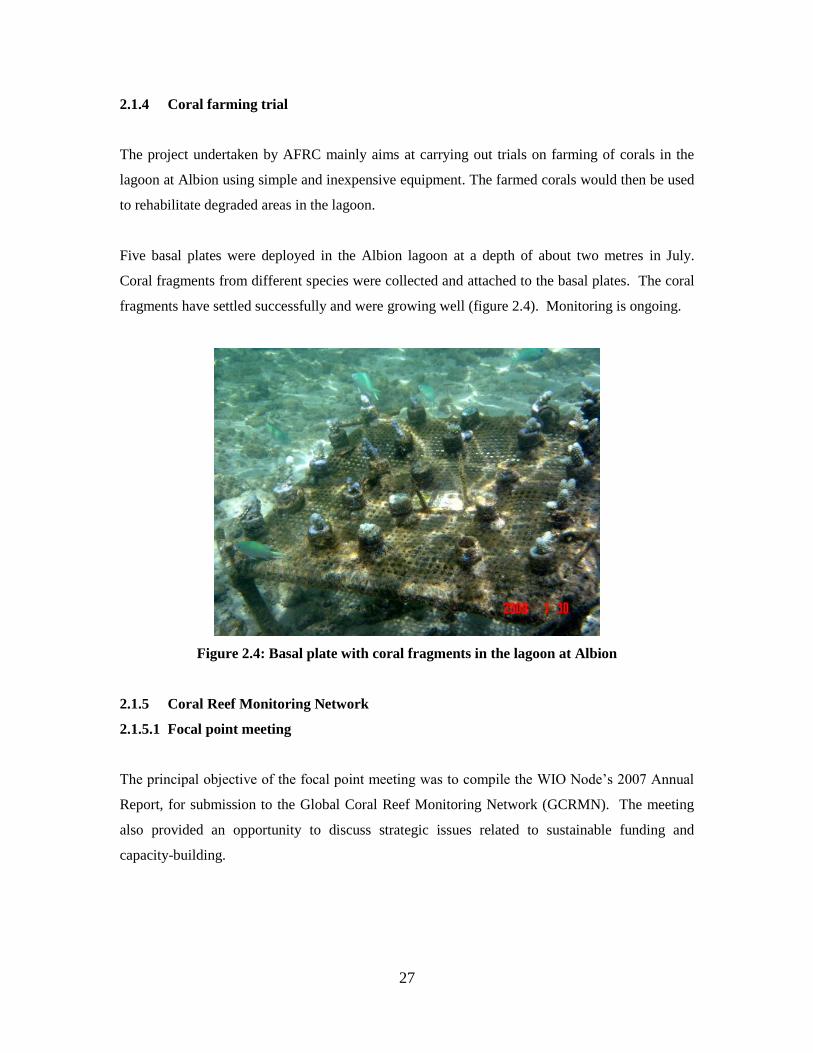
aggregating devices (FADs) was dispensed by IFREMER (figures 2.2 and 2.3). The fish
biodiversity around the FADs would be monitored for a period of 18 months and will commence
in early 2010.
Figure 2.2: FAD at Baie du Tombeau
Figure 2.3: FAD as seen from underwater
27
2.1.4 Coral farming trial
The project undertaken by AFRC mainly aims at carrying out trials on farming of corals in the
lagoon at Albion using simple and inexpensive equipment. The farmed corals would then be used
to rehabilitate degraded areas in the lagoon.
Five basal plates were deployed in the Albion lagoon at a depth of about two metres in July.
Coral fragments from different species were collected and attached to the basal plates. The coral
fragments have settled successfully and were growing well (figure 2.4). Monitoring is ongoing.
Figure 2.4: Basal plate with coral fragments in the lagoon at Albion
2.1.5 Coral Reef Monitoring Network
2.1.5.1 Focal point meeting
The principal objective of the focal point meeting was to compile the WIO Node‟s 2007 Annual
Report, for submission to the Global Coral Reef Monitoring Network (GCRMN). The meeting
also provided an opportunity to discuss strategic issues related to sustainable funding and
capacity-building.
28
2.1.5.2 Workshop on COREMO III software
COREMO is the software used in the SWIO region for analysis of data collected during the
monitoring of coral reefs. A workshop funded by RECOMAP (COI) was held in May for the
presentation of the COREMO III software to the member countries of the COI.
2.1.6 Mangrove propagation
Two NGOs were given assistance for mangrove propagation at three sites namely, Estuary Terre
Rouge Bird Sanctuary, Barachois Le Blanc at Roches Noires and Champagne Bridge, Ferney.
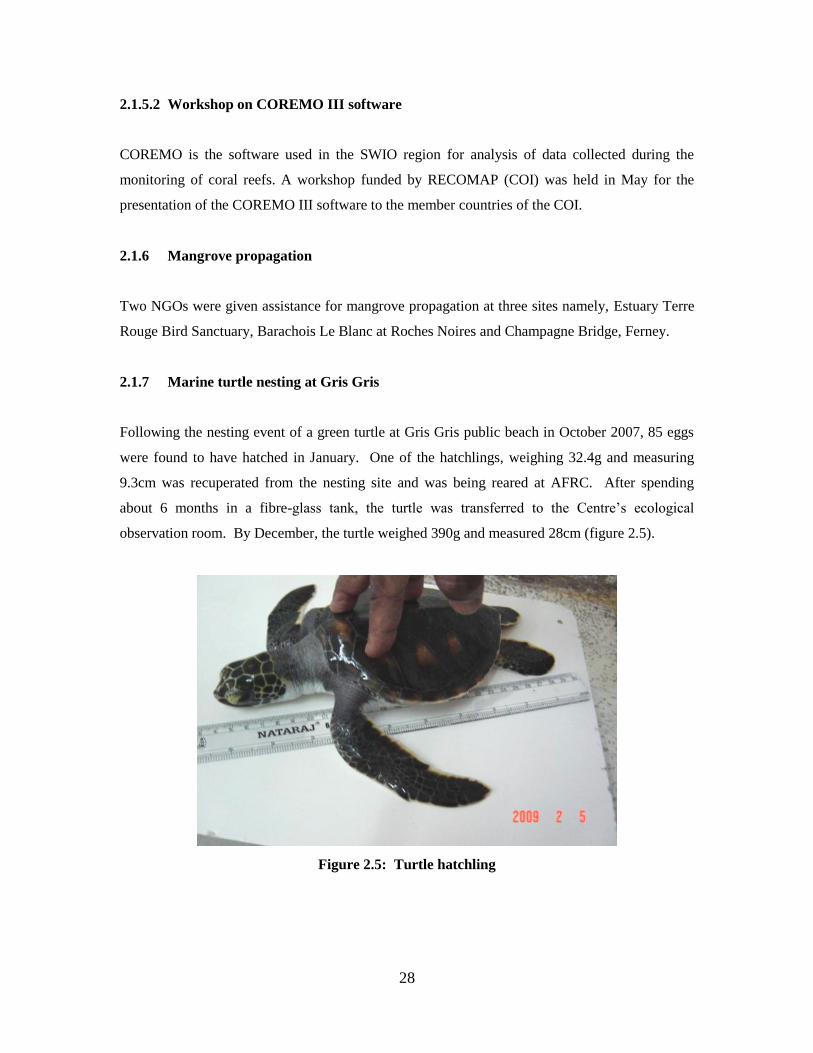
2.1.7 Marine turtle nesting at Gris Gris
Following the nesting event of a green turtle at Gris Gris public beach in October 2007, 85 eggs
were found to have hatched in January. One of the hatchlings, weighing 32.4g and measuring
9.3cm was recuperated from the nesting site and was being reared at AFRC. After spending
about 6 months in a fibre-glass tank, the turtle was transferred to the Centre‟s ecological
observation room. By December, the turtle weighed 390g and measured 28cm (figure 2.5).
Figure 2.5: Turtle hatchling
29
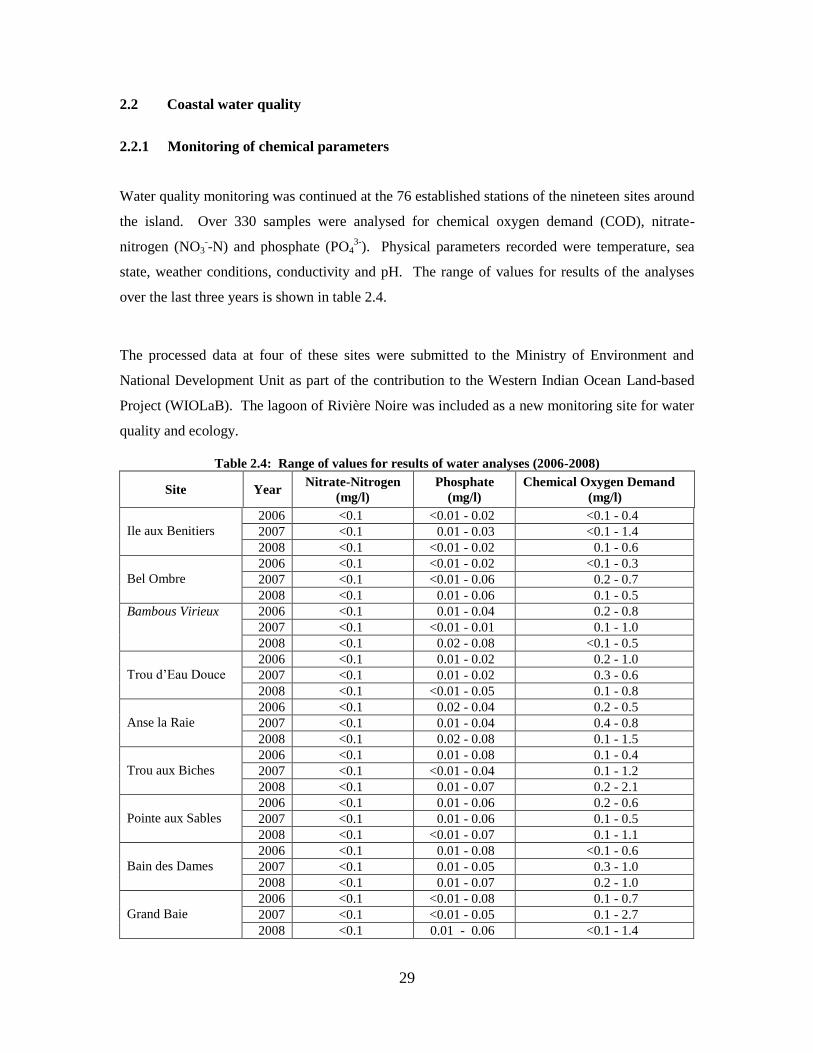
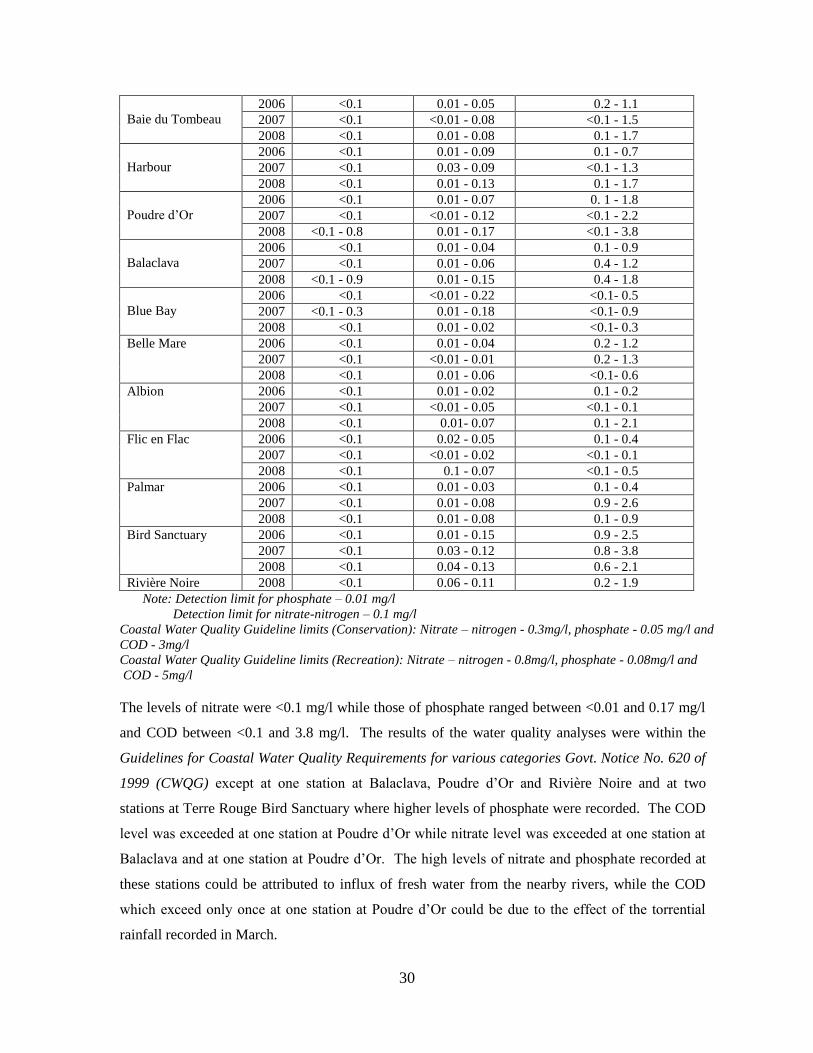
2.2 Coastal water quality
2.2.1 Monitoring of chemical parameters
Water quality monitoring was continued at the 76 established stations of the nineteen sites around
the island. Over 330 samples were analysed for chemical oxygen demand (COD), nitrate-
nitrogen (NO3--N) and phosphate (PO4
3-). Physical parameters recorded were temperature, sea
state, weather conditions, conductivity and pH. The range of values for results of the analyses
over the last three years is shown in table 2.4.
The processed data at four of these sites were submitted to the Ministry of Environment and
National Development Unit as part of the contribution to the Western Indian Ocean Land-based
Project (WIOLaB). The lagoon of Rivière Noire was included as a new monitoring site for water
quality and ecology.
Table 2.4: Range of values for results of water analyses (2006-2008)
Site Year Nitrate-Nitrogen
(mg/l)
Phosphate
(mg/l)
Chemical Oxygen Demand
(mg/l)
Ile aux Benitiers
2006 <0.1 <0.01 - 0.02 <0.1 - 0.4
2007 <0.1 0.01 - 0.03 <0.1 - 1.4
2008 <0.1 <0.01 - 0.02 0.1 - 0.6
Bel Ombre
2006 <0.1 <0.01 - 0.02 <0.1 - 0.3
2007 <0.1 <0.01 - 0.06 0.2 - 0.7
2008 <0.1 0.01 - 0.06 0.1 - 0.5
Bambous Virieux
Bambous Virieux
2006 <0.1 0.01 - 0.04 0.2 - 0.8
2007 <0.1 <0.01 - 0.01 0.1 - 1.0
2008 <0.1 0.02 - 0.08 <0.1 - 0.5
Trou d‟Eau Douce
2006 <0.1 0.01 - 0.02 0.2 - 1.0
2007 <0.1 0.01 - 0.02 0.3 - 0.6
2008 <0.1 <0.01 - 0.05 0.1 - 0.8
Anse la Raie
2006 <0.1 0.02 - 0.04 0.2 - 0.5
2007 <0.1 0.01 - 0.04 0.4 - 0.8
2008 <0.1 0.02 - 0.08 0.1 - 1.5
Trou aux Biches
2006 <0.1 0.01 - 0.08 0.1 - 0.4
2007 <0.1 <0.01 - 0.04 0.1 - 1.2
2008 <0.1 0.01 - 0.07 0.2 - 2.1
Pointe aux Sables
2006 <0.1 0.01 - 0.06 0.2 - 0.6
2007 <0.1 0.01 - 0.06 0.1 - 0.5
2008 <0.1 <0.01 - 0.07 0.1 - 1.1
Bain des Dames
2006 <0.1 0.01 - 0.08 <0.1 - 0.6
2007 <0.1 0.01 - 0.05 0.3 - 1.0
2008 <0.1 0.01 - 0.07 0.2 - 1.0
Grand Baie
2006 <0.1 <0.01 - 0.08 0.1 - 0.7
2007 <0.1 <0.01 - 0.05 0.1 - 2.7
2008 <0.1 0.01 - 0.06 <0.1 - 1.4
30
Baie du Tombeau
2006 <0.1 0.01 - 0.05 0.2 - 1.1
2007 <0.1 <0.01 - 0.08 <0.1 - 1.5
2008 <0.1 0.01 - 0.08 0.1 - 1.7
Harbour
2006 <0.1 0.01 - 0.09 0.1 - 0.7
2007 <0.1 0.03 - 0.09 <0.1 - 1.3
2008 <0.1 0.01 - 0.13 0.1 - 1.7
Poudre d‟Or
2006 <0.1 0.01 - 0.07 0. 1 - 1.8
2007 <0.1 <0.01 - 0.12 <0.1 - 2.2
2008 <0.1 - 0.8 0.01 - 0.17 <0.1 - 3.8
Balaclava
2006 <0.1 0.01 - 0.04 0.1 - 0.9
2007 <0.1 0.01 - 0.06 0.4 - 1.2
2008 <0.1 - 0.9 0.01 - 0.15 0.4 - 1.8
Blue Bay
2006 <0.1 <0.01 - 0.22 <0.1- 0.5
2007 <0.1 - 0.3 0.01 - 0.18 <0.1- 0.9
2008 <0.1 0.01 - 0.02 <0.1- 0.3
Belle Mare 2006 <0.1 0.01 - 0.04 0.2 - 1.2
2007 <0.1 <0.01 - 0.01 0.2 - 1.3
2008 <0.1 0.01 - 0.06 <0.1- 0.6
Albion 2006 <0.1 0.01 - 0.02 0.1 - 0.2
2007 <0.1 <0.01 - 0.05 <0.1 - 0.1
2008 <0.1 0.01- 0.07 0.1 - 2.1
Flic en Flac 2006 <0.1 0.02 - 0.05 0.1 - 0.4
2007 <0.1 <0.01 - 0.02 <0.1 - 0.1
2008 <0.1 0.1 - 0.07 <0.1 - 0.5
Palmar 2006 <0.1 0.01 - 0.03 0.1 - 0.4
2007 <0.1 0.01 - 0.08 0.9 - 2.6
2008 <0.1 0.01 - 0.08 0.1 - 0.9
Bird Sanctuary 2006 <0.1 0.01 - 0.15 0.9 - 2.5
2007 <0.1 0.03 - 0.12 0.8 - 3.8
2008 <0.1 0.04 - 0.13 0.6 - 2.1
Rivière Noire 2008 <0.1 0.06 - 0.11 0.2 - 1.9
Note: Detection limit for phosphate – 0.01 mg/l
Detection limit for nitrate-nitrogen – 0.1 mg/l
Coastal Water Quality Guideline limits (Conservation): Nitrate – nitrogen - 0.3mg/l, phosphate - 0.05 mg/l and
COD - 3mg/l
Coastal Water Quality Guideline limits (Recreation): Nitrate – nitrogen - 0.8mg/l, phosphate - 0.08mg/l and
COD - 5mg/l
The levels of nitrate were <0.1 mg/l while those of phosphate ranged between <0.01 and 0.17 mg/l
and COD between <0.1 and 3.8 mg/l. The results of the water quality analyses were within the
Guidelines for Coastal Water Quality Requirements for various categories Govt. Notice No. 620 of
1999 (CWQG) except at one station at Balaclava, Poudre d‟Or and Rivière Noire and at two
stations at Terre Rouge Bird Sanctuary where higher levels of phosphate were recorded. The COD
level was exceeded at one station at Poudre d‟Or while nitrate level was exceeded at one station at
Balaclava and at one station at Poudre d‟Or. The high levels of nitrate and phosphate recorded at
these stations could be attributed to influx of fresh water from the nearby rivers, while the COD
which exceed only once at one station at Poudre d‟Or could be due to the effect of the torrential
rainfall recorded in March.
31
2.2.2 Analysis for trace metals
The concentrations of lead and cadmium were determined in water samples collected near river
mouths at Grand River North West, Rivière Lataniers, Pointe Roches Noires, Grand River South
East, Mahebourg, l‟Escalier, Baie du Cap and Tamarin. No detectable levels of these two trace
metals were recorded in any of the samples analysed.
Note: Detection limit for lead – 0.013 mg/l
Detection limit for cadmium – 0.0028 mg/l
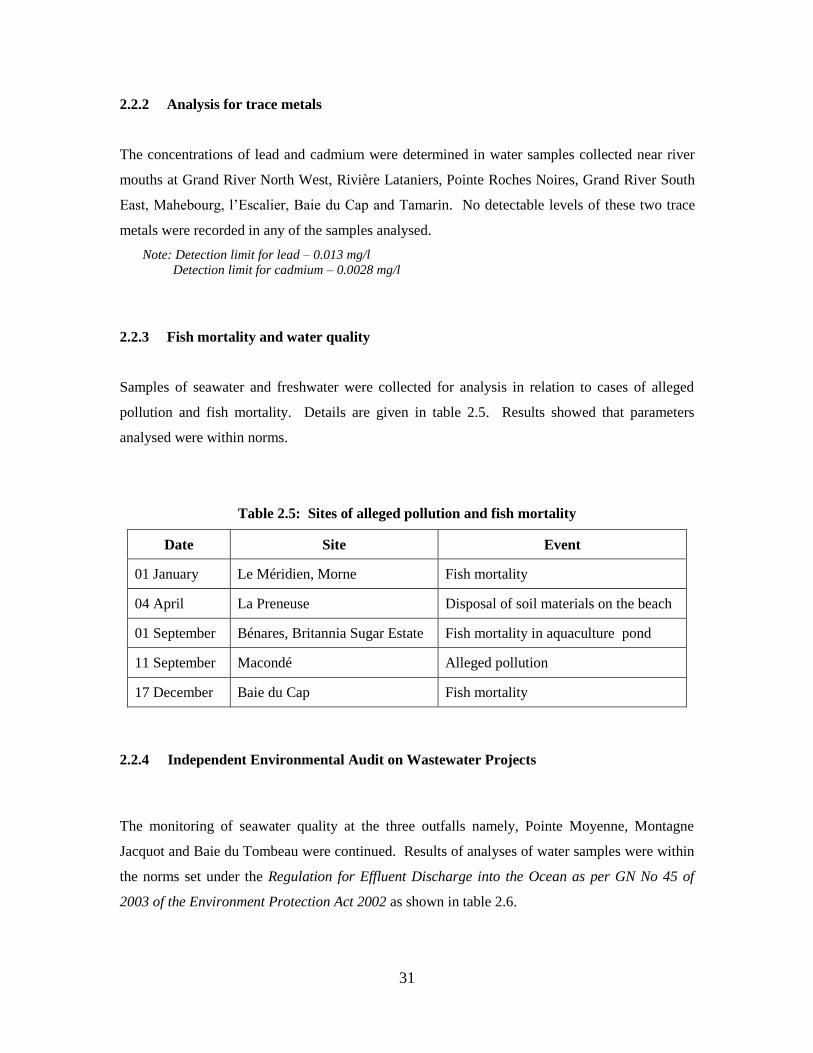
2.2.3 Fish mortality and water quality
Samples of seawater and freshwater were collected for analysis in relation to cases of alleged
pollution and fish mortality. Details are given in table 2.5. Results showed that parameters
analysed were within norms.
Table 2.5: Sites of alleged pollution and fish mortality
Date Site Event
01 January Le Méridien, Morne Fish mortality
04 April La Preneuse Disposal of soil materials on the beach
01 September Bénares, Britannia Sugar Estate Fish mortality in aquaculture pond
11 September Macondé Alleged pollution
17 December Baie du Cap Fish mortality
2.2.4 Independent Environmental Audit on Wastewater Projects
The monitoring of seawater quality at the three outfalls namely, Pointe Moyenne, Montagne
Jacquot and Baie du Tombeau were continued. Results of analyses of water samples were within
the norms set under the Regulation for Effluent Discharge into the Ocean as per GN No 45 of
2003 of the Environment Protection Act 2002 as shown in table 2.6.
32
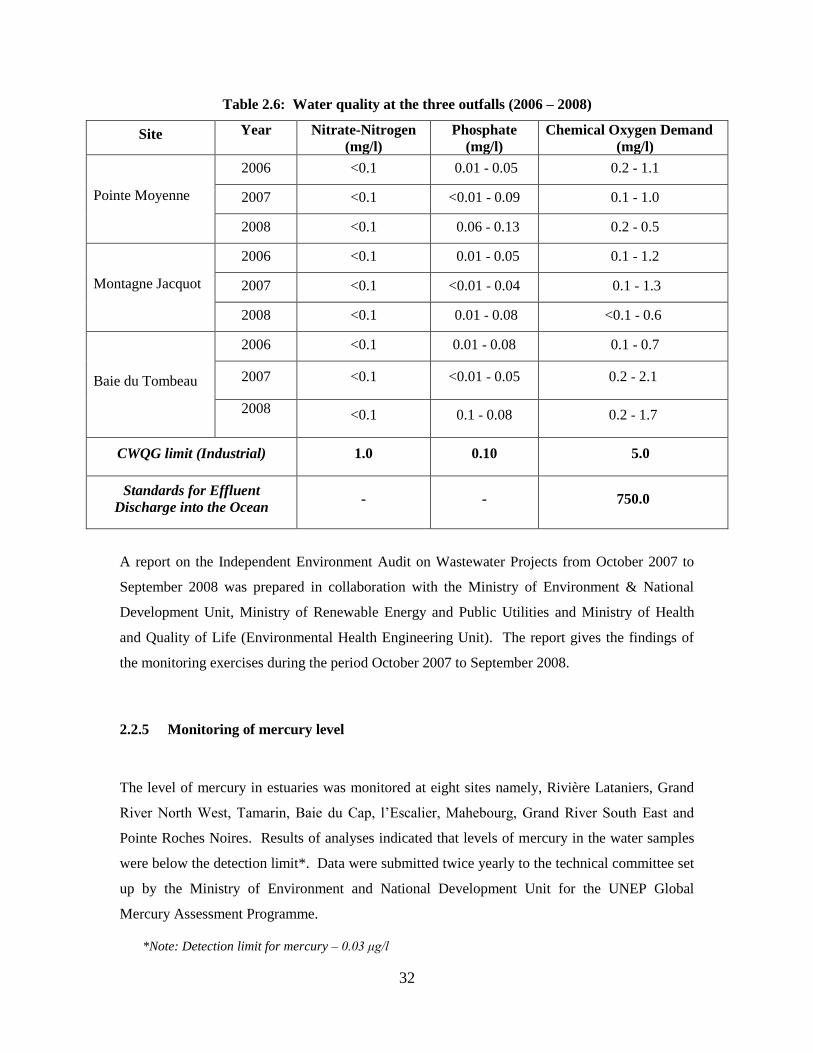
Table 2.6: Water quality at the three outfalls (2006 – 2008)
Site Year Nitrate-Nitrogen
(mg/l)
Phosphate
(mg/l)
Chemical Oxygen Demand
(mg/l)
Pointe Moyenne
2006 <0.1 0.01 - 0.05 0.2 - 1.1
2007 <0.1 <0.01 - 0.09 0.1 - 1.0
2008 <0.1 0.06 - 0.13 0.2 - 0.5
Montagne Jacquot
2006 <0.1 0.01 - 0.05 0.1 - 1.2
2007 <0.1 <0.01 - 0.04 0.1 - 1.3
2008 <0.1 0.01 - 0.08 <0.1 - 0.6
Baie du Tombeau
2006 <0.1 0.01 - 0.08 0.1 - 0.7
2007 <0.1 <0.01 - 0.05 0.2 - 2.1
2008 <0.1 0.1 - 0.08 0.2 - 1.7
CWQG limit (Industrial) 1.0 0.10 5.0
Standards for Effluent
Discharge into the Ocean - - 750.0
A report on the Independent Environment Audit on Wastewater Projects from October 2007 to
September 2008 was prepared in collaboration with the Ministry of Environment & National
Development Unit, Ministry of Renewable Energy and Public Utilities and Ministry of Health
and Quality of Life (Environmental Health Engineering Unit). The report gives the findings of
the monitoring exercises during the period October 2007 to September 2008.
2.2.5 Monitoring of mercury level
The level of mercury in estuaries was monitored at eight sites namely, Rivière Lataniers, Grand
River North West, Tamarin, Baie du Cap, l‟Escalier, Mahebourg, Grand River South East and
Pointe Roches Noires. Results of analyses indicated that levels of mercury in the water samples
were below the detection limit*. Data were submitted twice yearly to the technical committee set
up by the Ministry of Environment and National Development Unit for the UNEP Global
Mercury Assessment Programme.
*Note: Detection limit for mercury – 0.03 μg/l
33
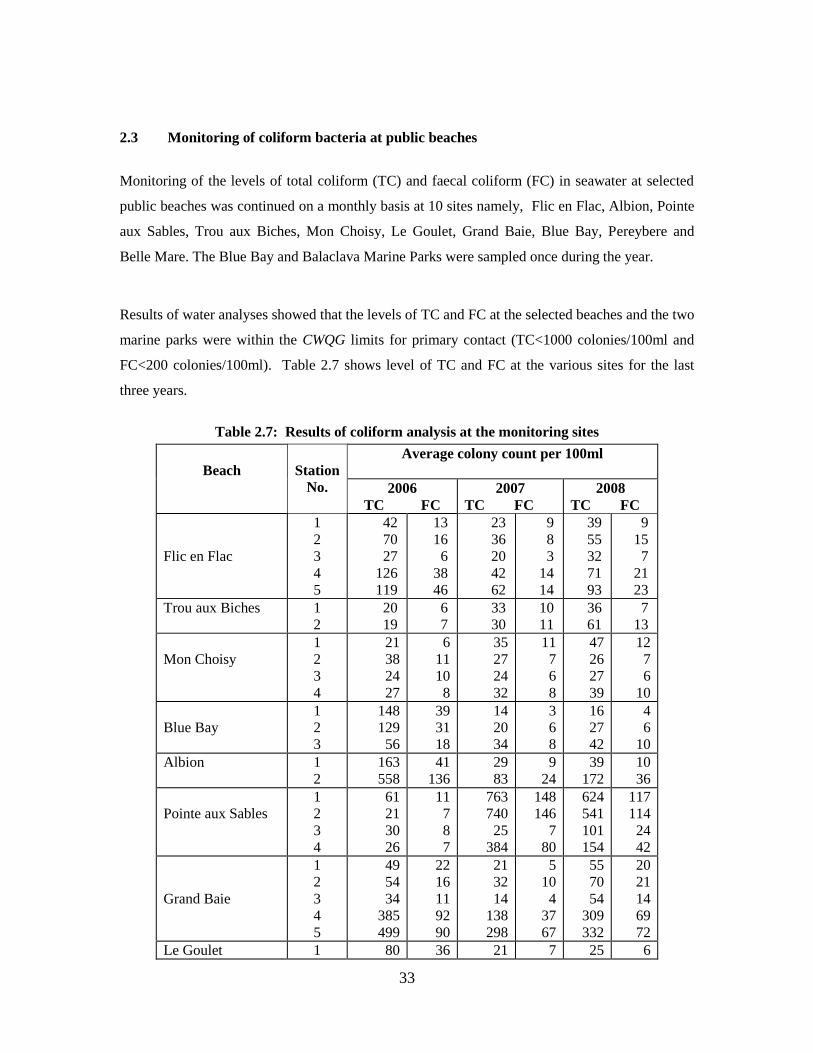
2.3 Monitoring of coliform bacteria at public beaches
Monitoring of the levels of total coliform (TC) and faecal coliform (FC) in seawater at selected
public beaches was continued on a monthly basis at 10 sites namely, Flic en Flac, Albion, Pointe
aux Sables, Trou aux Biches, Mon Choisy, Le Goulet, Grand Baie, Blue Bay, Pereybere and
Belle Mare. The Blue Bay and Balaclava Marine Parks were sampled once during the year.
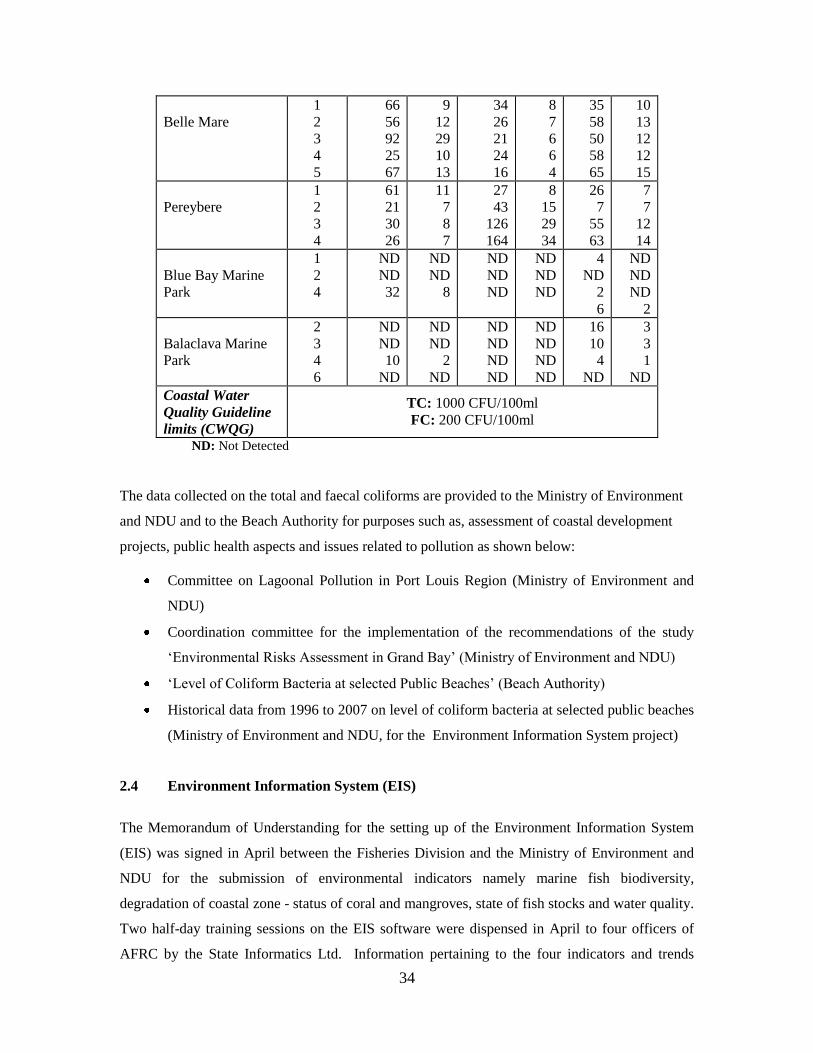
Results of water analyses showed that the levels of TC and FC at the selected beaches and the two
marine parks were within the CWQG limits for primary contact (TC<1000 colonies/100ml and
FC<200 colonies/100ml). Table 2.7 shows level of TC and FC at the various sites for the last
three years.
Table 2.7: Results of coliform analysis at the monitoring sites
Beach
Station
No.
Average colony count per 100ml
2006
TC FC
2007
TC FC
2008
TC FC
Flic en Flac
1
2
3
4
5
42
70
27
126
119
13
16
6
38
46
23
36
20
42
62
9
8
3
14
14
39
55
32
71
93
9
15
7
21
23
Trou aux Biches 1
2
20
19
6
7
33
30
10
11
36
61
7
13
Mon Choisy
1
2
3
4
21
38
24
27
6
11
10
8
35
27
24
32
11
7
6
8
47
26
27
39
12
7
6
10
Blue Bay
1
2
3
148
129
56
39
31
18
14
20
34
3
6
8
16
27
42
4
6
10
Albion 1
2
163
558
41
136
29
83
9
24
39
172
10
36
Pointe aux Sables
1
2
3
4
61
21
30
26
11
7
8
7
763
740
25
384
148
146
7
80
624
541
101
154
117
114
24
42
Grand Baie
1
2
3
4
5
49
54
34
385
499
22
16
11
92
90
21
32
14
138
298
5
10
4
37
67
55
70
54
309
332
20
21
14
69
72
Le Goulet 1 80 36 21 7 25 6
34
Belle Mare
1
2
3
4
5
66
56
92
25
67
9
12
29
10
13
34
26
21
24
16
8
7
6
6
4
35
58
50
58
65
10
13
12
12
15
Pereybere
1
2
3
4
61
21
30
26
11
7
8
7
27
43
126
164
8
15
29
34
26
7
55
63
7
7
12
14
Blue Bay Marine
Park
1
2
4
ND
ND
32
ND
ND
8
ND
ND
ND
ND
ND
ND
4
ND
2
6
ND
ND
ND
2
Balaclava Marine
Park
2
3
4
6
ND
ND
10
ND
ND
ND
2
ND
ND
ND
ND
ND
ND
ND
ND
ND
16
10
4
ND
3
3
1
ND
Coastal Water
Quality Guideline
limits (CWQG)
TC: 1000 CFU/100ml
FC: 200 CFU/100ml
ND: Not Detected
The data collected on the total and faecal coliforms are provided to the Ministry of Environment
and NDU and to the Beach Authority for purposes such as, assessment of coastal development
projects, public health aspects and issues related to pollution as shown below:
Committee on Lagoonal Pollution in Port Louis Region (Ministry of Environment and
NDU)
Coordination committee for the implementation of the recommendations of the study
„Environmental Risks Assessment in Grand Bay‟ (Ministry of Environment and NDU)
„Level of Coliform Bacteria at selected Public Beaches‟ (Beach Authority)
Historical data from 1996 to 2007 on level of coliform bacteria at selected public beaches
(Ministry of Environment and NDU, for the Environment Information System project)
2.4 Environment Information System (EIS)
The Memorandum of Understanding for the setting up of the Environment Information System
(EIS) was signed in April between the Fisheries Division and the Ministry of Environment and
NDU for the submission of environmental indicators namely marine fish biodiversity,
degradation of coastal zone - status of coral and mangroves, state of fish stocks and water quality.
Two half-day training sessions on the EIS software were dispensed in April to four officers of
AFRC by the State Informatics Ltd. Information pertaining to the four indicators and trends
35
observed on a specific parameter and historical data from 1996 to 2007 were submitted to the
M/Environment and NDU to be uploaded under the section EIS news and to the metadata file on
its website.
2.5 Accreditation of Laboratories
Under the component “Assistance and support to the quality control of laboratories in Mauritius”
of the “Strengthening Fishery Production Programme”, an EU consultant on laboratory
accreditation carried out an audit of the three laboratories at AFRC. He made recommendations
which included renovation and upgrading of the laboratory facilities, recruitment of qualified
personnel, funds needed and capacity building in order to start the accreditation process. An
action plan was prepared setting out the activities to be carried out within the next five years for
the accreditation process of the AFRC laboratories.
Action was initiated for the implementation of the recommendations. Designs and layout for the
renovation and upgrading of the Fish Toxicity, Chemistry and Bacteriology laboratories as well
as the animal house were prepared and tenders launched.
36
3. AQUACULTURE
Aquaculture activities were geared towards the seed production of berri rouge, Oreochromis sp.
of the Malaysian variety, freshwater ornamental fish namely gold fish (Carassius auratus),
platy (Xiphophorus maculatus) and molly (Poecilia latipinna) and giant freshwater prawn
(Macrobrachium rosenbergii).
3.1 Plankton culture
Pure cultures of the phytoplankton species namely Nannochloropsis sp., Tetraselmis sp. and
Chaetoceros calcitrans were maintained in the phytoplankton room. Mass production of
Nannochloropsis sp. was undertaken during the seed production of Macrobrachium rosenbergii.
The zooplankton, Brachionus rotundiformis (rotifer), maintained in polycarbonate tanks was fed
on Nannochloropsis sp.
3.2 Camaron culture
3.2.1 Broodstock
A broodstock of 29 camaron spawners was obtained from Medine Sugar Estate (SODIA) and 318
from Riche en Eau Sugar Estate for the production cycle. The females were conditioned and
maintained in black circular polycarbonate tanks in the dark at a water temperature of 28°C. The
berried females were fed once daily on chopped frozen mussels.
3.2.2 Seed production
The camaron seed production cycle was undertaken from January to April and from October to
December when the average water temperatures were 27°C and 28°C respectively. Three rearing
cycles were carried out; a total of 1 945 000 larvae was obtained and stocked in fibreglass and
polycarbonate tanks in green water at a salinity of 12 ppt. The camaron larvae were fed daily on
brine shrimp nauplii, Artemia sp. and “egg custard”. The larval stage index was closely
monitored. Post-larvae (> stage-12) were obtained after a culture period ranging between 40 and
37
50 days, after which the salinity of the water was gradually brought down to zero. A total of
264 131 camaron juveniles was produced.
3.2.3 Sale of camaron
A total of 264 131 camaron juveniles was sold to 22 farmers at the rate of Rs. 1.25/unit. Proceeds
of sales amounted to Rs.330 163.75
3.3 Berri rouge culture
3.3.1 Broodstock and fingerlings production
The broodstock of berri rouge was maintained in concrete nursery and broodstock ponds. The
fish were fed on extruded red snapper pellets. Freshwater from the adjacent Belle Eau River was
supplied to all ponds. Reproduction occurred naturally in the ponds round the year. A total of
69 689 fingerlings was collected out of which 3 029 were distributed free of charge to 85 small-
scale farmers and 66 660 were sold to 6 large-scale farmers at Rs. 1.25/unit amounting to a sale
value of Rs. 83 325.
3.3.2 Pilot project for Small Entrepreneurs and Cooperative Societies
A project for aquaculture to be undertaken by small entrepreneurs and cooperative societies was
launched in July. In that context, 3 000 berri rouge fingerlings were provided to the La Ferme
St. Martin Multipurpose Cooperative Society Ltd. to carry out a pilot project on culture of berri
rouge in ponds used for storing water for irrigation purposes. Technical advice was given to
fifteen members of the cooperative society during a half day training session. Mentoring of the
farmers was effected regularly. Despite difficulties encountered at the beginning, the farmers
have now successfully mastered the culture techniques.
3.4 Breeding and seed production of freshwater ornamental fish
Breeding and seed production techniques of three species of freshwater ornamental fish, sailfin
molly (Poecilia latipinna), platy (Xiphophorus maculates) and goldfish (Carassius auratus) have
been successfully developed. A practical guide on culture of freshwater ornamental fish was
prepared in collaboration with the Human Resources Development Council (HRDC). In
38
February, 25 entrepreneurs attended a two-day training session in broodstock management,
collection of eggs and fry, water quality management and rearing of fry amongst others.
The launching ceremony for the pilot project was held in March at AFRC and on that occasion
each trainee was provided with a set of ornamental fish and a practical guide with a view to
facilitate them to undertake the project. The pilot project has demonstrated that the culture of
freshwater ornamental fish is feasible. Two more training sessions were held in October. A total
of 37 persons attended the training sessions which was followed by the distribution of a set of
ornamental fish and a practical guide to each trainee. The trainees were provided with technical
assistance for their fish culture projects.
3.5 Aquaculture extension service
Technical advice was provided to 350 persons interested in aquaculture. Site visits were
undertaken to assist the potential fish farmers.
3.6 Amendments to the Fisheries and Marine Resources Act 2007
The Fisheries and Marine Resources Act 2007 (FMRA) was amended under the Finance
(Miscellaneous Provision) Act 2008 to provide the legal framework for fish farming in the sea.
The new section 8 (B) consolidates the provisions made in the FMRA 2007 to authorise fish
farming at sea. The sites earmarked for fish farming in the sea are located at eight specific zones
(Appendix 10) as listed in the First Schedule of the FMRA 2007(amended).
3.7 Guidelines for fish farming in the sea
Guidelines to applicants for fish farming at sea were prepared jointly with the Board of
Investment, the Prime Minister‟s Office, the Ministry of Housing and Lands, the Ministry of
Environment and National Development Unit, the Ministry of Finance and Economic
Empowerment and the Competent Authority of the Division of Veterinary Services of the
Ministry of Agro Industry, Food Production and Security. The guidelines define the requirements
and conditions for fish farming at sea.
39
3.8 Commercial aquaculture production
Production of red drum, silver sea bream and rabbit fish for the local market amounted to 181
tonnes from La Ferme Marine de Mahebourg. A total of 60 tonnes of chilled red drum was
exported to Dubai, South Africa, Switzerland and the USA.
One tonne of fish and 800 kg of mud crab together with 80 000 units of oysters were harvested
from different barachois.
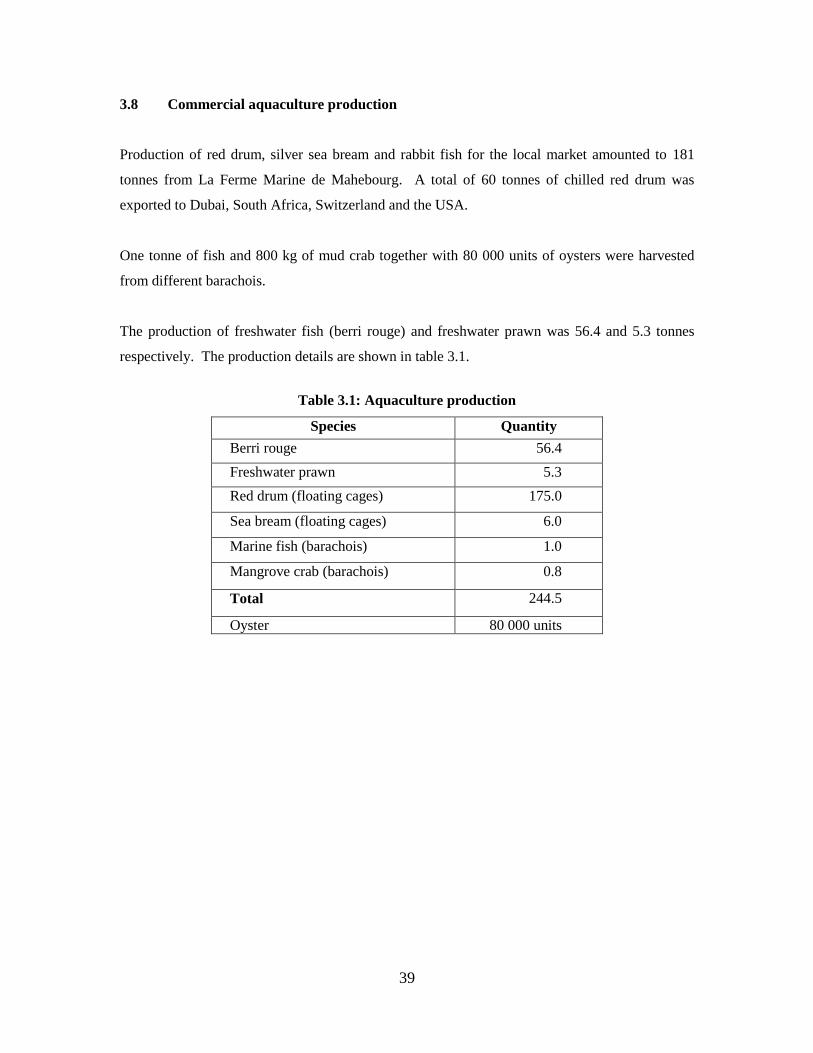
The production of freshwater fish (berri rouge) and freshwater prawn was 56.4 and 5.3 tonnes
respectively. The production details are shown in table 3.1.
Table 3.1: Aquaculture production
Species Quantity
Berri rouge 56.4
Freshwater prawn 5.3
Red drum (floating cages) 175.0
Sea bream (floating cages) 6.0
Marine fish (barachois) 1.0
Mangrove crab (barachois) 0.8
Total 244.5
Oyster 80 000 units
40
4. MARINE CONSERVATION
The Marine Conservation Division has the responsibility to manage the two marine parks, review
Environmental Impact Assessment (EIA) reports and Preliminary Environment Reports (PER),
assess coastal development projects and tourism related activities for recommendations and
participate in post EIA and post PER monitoring.
4.1 Blue Bay Marine Park (BBMP)
4.1.1 Management
The management of the BBMP involved the monitoring, control and surveillance of permissible
activities such as glass bottom boating, snorkelling, diving, water skiing, swimming and non-
motorised boating. Seventeen picked up cases of prohibited fishing gear were recorded, viz:
basket traps (10), underwater fishing equipment (2), fishing nets (1), pole and line (4), and a
bundle of fishing line. Eleven contraventions were established including access to the park
without a permit (5), discharging polluting substances into the park (2), engaging in commercial
activities in the park without a permit (2) and illegal fishing (2).
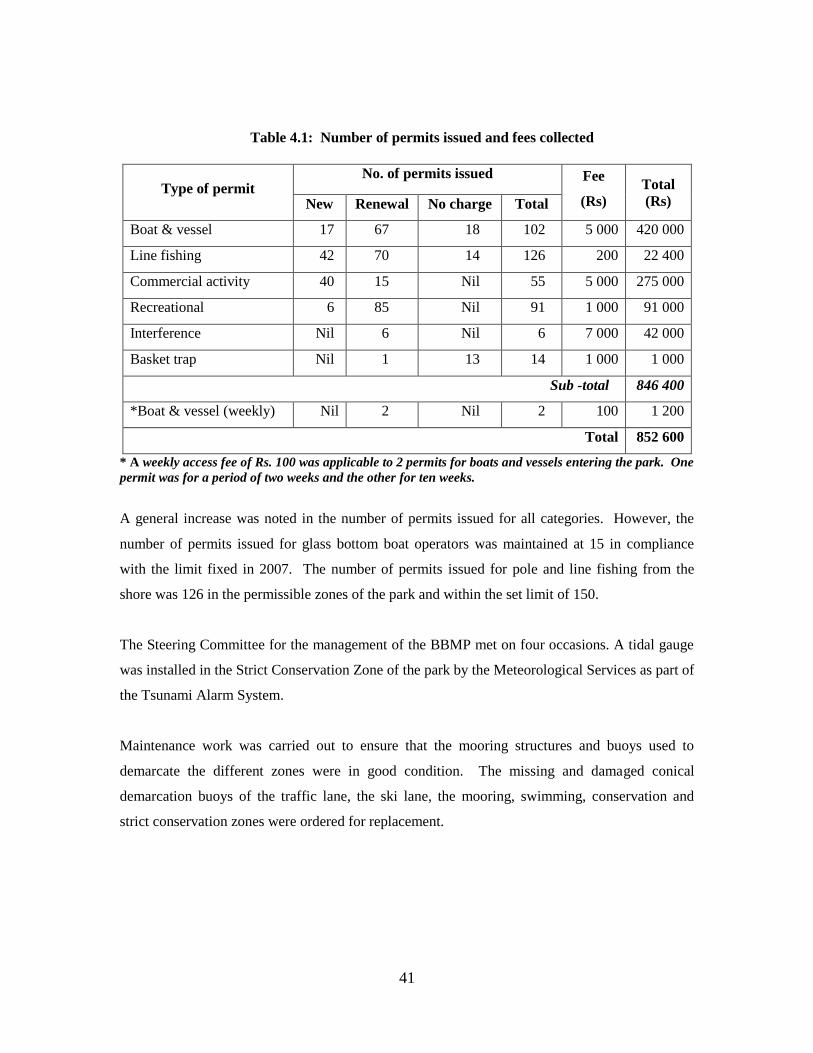
During the year, 105 new permits were issued to the different users of the park, and 246 permits
were renewed against payment of Rs. 852 600. Registered artisanal fishermen were exempted of
charges for permits. Details on the various types of permits and fees collected are shown in table
4.1.
41
Table 4.1: Number of permits issued and fees collected
Type of permit No. of permits issued Fee
(Rs)
Total
(Rs) New Renewal No charge Total
Boat & vessel 17 67 18 102 5 000 420 000
Line fishing 42 70 14 126 200 22 400
Commercial activity 40 15 Nil 55 5 000 275 000
Recreational 6 85 Nil 91 1 000 91 000
Interference Nil 6 Nil 6 7 000 42 000
Basket trap Nil 1 13 14 1 000 1 000
Sub -total 846 400
*Boat & vessel (weekly) Nil 2 Nil 2 100 1 200
Total 852 600
* A weekly access fee of Rs. 100 was applicable to 2 permits for boats and vessels entering the park. One
permit was for a period of two weeks and the other for ten weeks.
A general increase was noted in the number of permits issued for all categories. However, the
number of permits issued for glass bottom boat operators was maintained at 15 in compliance
with the limit fixed in 2007. The number of permits issued for pole and line fishing from the
shore was 126 in the permissible zones of the park and within the set limit of 150.
The Steering Committee for the management of the BBMP met on four occasions. A tidal gauge
was installed in the Strict Conservation Zone of the park by the Meteorological Services as part of
the Tsunami Alarm System.
Maintenance work was carried out to ensure that the mooring structures and buoys used to
demarcate the different zones were in good condition. The missing and damaged conical
demarcation buoys of the traffic lane, the ski lane, the mooring, swimming, conservation and
strict conservation zones were ordered for replacement.
42
4.1.2 Blue Bay Marine Park Ramsar Site
The BBMP was officially designated a Wetland of International Importance in January and
included in the List of Wetlands of International Importance established by Article 2.1 of the
Ramsar Convention on Wetlands. The official ceremony for the designation of the BBMP
Ramsar site was held in September. In that context, an exhibition on Marine Protected Areas
(MPAs) was organised by the Fisheries Division and the Indian Ocean Commission. A quiz
competition was also organized on the topic “Marine flora and fauna of MPAs in the Western
Indian Ocean Eco-region” for students of secondary schools. The Imperial College won the first
prize and the DAV College the second prize.
Pamphlets on the BBMP were distributed to sensitise a wider spectrum of visitors on the
importance of the conservation of the Park and MPAs. Information boards, funded by the French
Embassy, have been placed at the BBMP Patrol and Visitors‟ Centre.
4.1.3 Coral reef ecosystem monitoring at BBMP
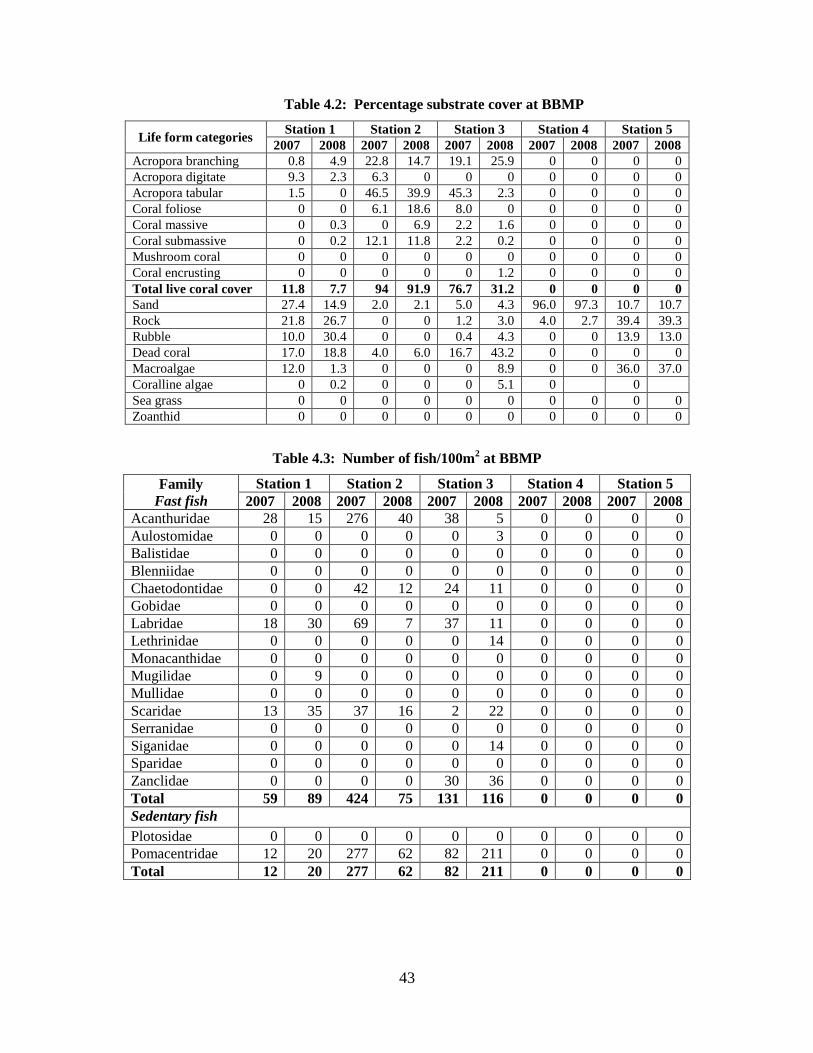
The annual monitoring was carried out at the five established stations. Data were collected on the
sea-bottom substrate in terms of corals, macro-algae, marine invertebrates and fish. Table corals
were the dominant species in the park (Table 4.2). A slight decrease in the percentage of live
corals was noted in comparison to the previous year at station 2. At station 3, the percentage of
live coral has considerably decreased due to the increased frequency of diving, snorkelling and
anchor damage. The dominant fish species comprised mainly those of families acanthuridae,
labridae, scaridae, chaetodontidae and pomacentridae (Table 4.3).
43
Table 4.2: Percentage substrate cover at BBMP
Life form categories Station 1 Station 2 Station 3 Station 4 Station 5
2007 2008 2007 2008 2007 2008 2007 2008 2007 2008
Acropora branching 0.8 4.9 22.8 14.7 19.1 25.9 0 0 0 0
Acropora digitate 9.3 2.3 6.3 0 0 0 0 0 0 0
Acropora tabular 1.5 0 46.5 39.9 45.3 2.3 0 0 0 0
Coral foliose 0 0 6.1 18.6 8.0 0 0 0 0 0
Coral massive 0 0.3 0 6.9 2.2 1.6 0 0 0 0
Coral submassive 0 0.2 12.1 11.8 2.2 0.2 0 0 0 0
Mushroom coral 0 0 0 0 0 0 0 0 0 0
Coral encrusting 0 0 0 0 0 1.2 0 0 0 0
Total live coral cover 11.8 7.7 94 91.9 76.7 31.2 0 0 0 0
Sand 27.4 14.9 2.0 2.1 5.0 4.3 96.0 97.3 10.7 10.7
Rock 21.8 26.7 0 0 1.2 3.0 4.0 2.7 39.4 39.3
Rubble 10.0 30.4 0 0 0.4 4.3 0 0 13.9 13.0
Dead coral 17.0 18.8 4.0 6.0 16.7 43.2 0 0 0 0
Macroalgae 12.0 1.3 0 0 0 8.9 0 0 36.0 37.0
Coralline algae 0 0.2 0 0 0 5.1 0 0
Sea grass 0 0 0 0 0 0 0 0 0 0
Zoanthid 0 0 0 0 0 0 0 0 0 0
Table 4.3: Number of fish/100m2 at BBMP
Family
Fast fish
Station 1 Station 2 Station 3 Station 4 Station 5
2007 2008 2007 2008 2007 2008 2007 2008 2007 2008
Acanthuridae 28 15 276 40 38 5 0 0 0 0
Aulostomidae 0 0 0 0 0 3 0 0 0 0
Balistidae 0 0 0 0 0 0 0 0 0 0
Blenniidae 0 0 0 0 0 0 0 0 0 0
Chaetodontidae 0 0 42 12 24 11 0 0 0 0
Gobidae 0 0 0 0 0 0 0 0 0 0
Labridae 18 30 69 7 37 11 0 0 0 0
Lethrinidae 0 0 0 0 0 14 0 0 0 0
Monacanthidae 0 0 0 0 0 0 0 0 0 0
Mugilidae 0 9 0 0 0 0 0 0 0 0
Mullidae 0 0 0 0 0 0 0 0 0 0
Scaridae 13 35 37 16 2 22 0 0 0 0
Serranidae 0 0 0 0 0 0 0 0 0 0
Siganidae 0 0 0 0 0 14 0 0 0 0
Sparidae 0 0 0 0 0 0 0 0 0 0
Zanclidae 0 0 0 0 30 36 0 0 0 0
Total 59 89 424 75 131 116 0 0 0 0
Sedentary fish
Plotosidae 0 0 0 0 0 0 0 0 0 0
Pomacentridae 12 20 277 62 82 211 0 0 0 0
Total 12 20 277 62 82 211 0 0 0 0
44
4.2 Balaclava Marine Park (BMP)
4.2.1 Management
Information on the MPA Regulations and the conservation of the marine ecosystems were
disseminated to fishers, boat operators and the public. The number of boats encountered and their
activities were recorded monthly. During the year, 108 boats of all categories operated in the
park. There were 7 boathouses engaged in recreational activities using glass-bottom boats (7),
parasails (2), pedalos (27), kayaks (46), lasers (23), hobbie cats (5), windsurfs (41) and for
snorkelling (124 sets).
4.2.2. Construction of the BMP Centre
The consulting engineers for the construction of the BMP Centre submitted the design drawing
plans for the building and its associated facilities. Clearances on the drawing plans were being
sought from relevant authorities.
4.2.3 Demarcation of the BMP
Funding for the demarcation of the conservation zone and the installation of scattered mooring
buoys in the BMP was confirmed in June, under the Indian Ocean Commission (IOC) Project
“Marine Protected Areas Network of the IOC Countries” for a sum of 22 000 Euro.
4.2.4. Interference permit
Three interference permits were issued for the demarcation of a swimming zone and the
construction of two jetties in the BMP.
4.2.5 Coral reef ecosystem monitoring at BMP
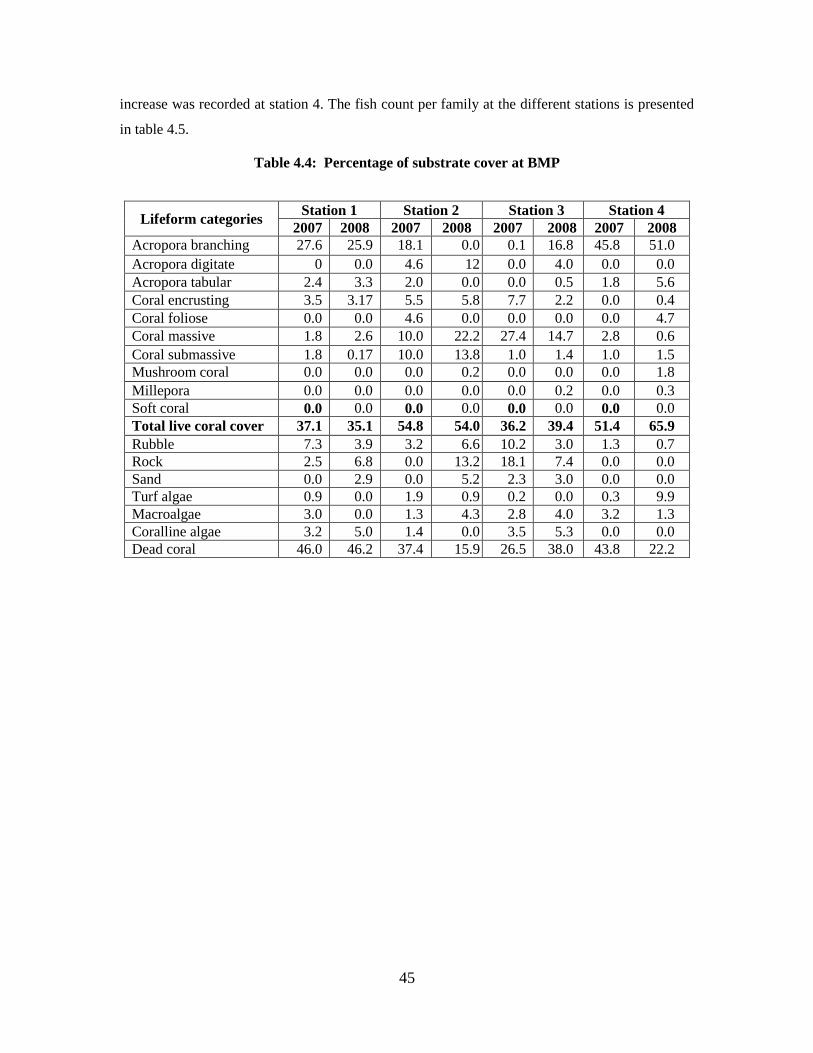
Monitoring was carried out at four of the seven established stations. Results of the survey on the
percentage of substrate cover are given in table 4.4. Branching Acropora corals were the
dominant species in the park while the highest diversity of corals was found at station 3. As
compared to 2007, the live coral cover at stations 1 and 2 showed a slight decrease, whilst an
45
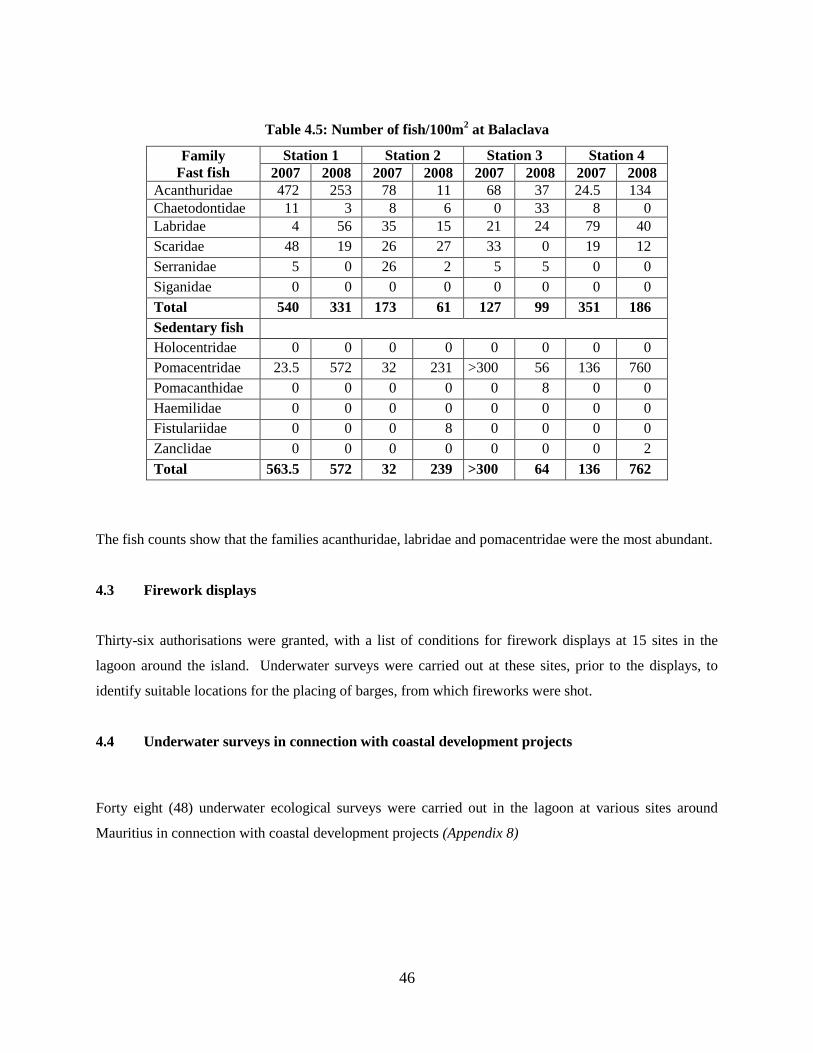
increase was recorded at station 4. The fish count per family at the different stations is presented
in table 4.5.
Table 4.4: Percentage of substrate cover at BMP
Lifeform categories Station 1 Station 2 Station 3 Station 4
2007 2008 2007 2008 2007 2008 2007 2008
Acropora branching 27.6 25.9 18.1 0.0 0.1 16.8 45.8 51.0
Acropora digitate 0 0.0 4.6 12 0.0 4.0 0.0 0.0
Acropora tabular 2.4 3.3 2.0 0.0 0.0 0.5 1.8 5.6
Coral encrusting 3.5 3.17 5.5 5.8 7.7 2.2 0.0 0.4
Coral foliose 0.0 0.0 4.6 0.0 0.0 0.0 0.0 4.7
Coral massive 1.8 2.6 10.0 22.2 27.4 14.7 2.8 0.6
Coral submassive 1.8 0.17 10.0 13.8 1.0 1.4 1.0 1.5
Mushroom coral 0.0 0.0 0.0 0.2 0.0 0.0 0.0 1.8
Millepora 0.0 0.0 0.0 0.0 0.0 0.2 0.0 0.3
Soft coral 0.0 0.0 0.0 0.0 0.0 0.0 0.0 0.0
Total live coral cover 37.1 35.1 54.8 54.0 36.2 39.4 51.4 65.9
Rubble 7.3 3.9 3.2 6.6 10.2 3.0 1.3 0.7
Rock 2.5 6.8 0.0 13.2 18.1 7.4 0.0 0.0
Sand 0.0 2.9 0.0 5.2 2.3 3.0 0.0 0.0
Turf algae 0.9 0.0 1.9 0.9 0.2 0.0 0.3 9.9
Macroalgae 3.0 0.0 1.3 4.3 2.8 4.0 3.2 1.3
Coralline algae 3.2 5.0 1.4 0.0 3.5 5.3 0.0 0.0
Dead coral 46.0 46.2 37.4 15.9 26.5 38.0 43.8 22.2
46
Table 4.5: Number of fish/100m2 at Balaclava
Family
Fast fish
Station 1 Station 2 Station 3 Station 4
2007 2008 2007 2008 2007 2008 2007 2008
Acanthuridae 472 253 78 11 68 37 24.5 134
Chaetodontidae 11 3 8 6 0 33 8 0
Labridae 4 56 35 15 21 24 79 40
Scaridae 48 19 26 27 33 0 19 12
Serranidae 5 0 26 2 5 5 0 0
Siganidae 0 0 0 0 0 0 0 0
Total 540 331 173 61 127 99 351 186
Sedentary fish
Holocentridae 0 0 0 0 0 0 0 0
Pomacentridae 23.5 572 32 231 >300 56 136 760
Pomacanthidae 0 0 0 0 0 8 0 0
Haemilidae 0 0 0 0 0 0 0 0
Fistulariidae 0 0 0 8 0 0 0 0
Zanclidae 0 0 0 0 0 0 0 2
Total 563.5 572 32 239 >300 64 136 762
The fish counts show that the families acanthuridae, labridae and pomacentridae were the most abundant.
4.3 Firework displays
Thirty-six authorisations were granted, with a list of conditions for firework displays at 15 sites in the
lagoon around the island. Underwater surveys were carried out at these sites, prior to the displays, to
identify suitable locations for the placing of barges, from which fireworks were shot.
4.4 Underwater surveys in connection with coastal development projects
Forty eight (48) underwater ecological surveys were carried out in the lagoon at various sites around
Mauritius in connection with coastal development projects (Appendix 8)
47
4.5 Environmental Impact Assessment (EIA)
Fifty EIA applications were assessed and recommendations were made to the Ministry of Environment
and National Development Unit. Eighteen of the EIA applications involved major coastal projects such
as hotel development, integrated resort schemes (IRS), beach re-profiling, dredging works, construction
of rock revetments and jetties as indicated at appendix 9.
4.6 Undersea walk sites
Underwater ecological surveys were carried out at four sites in the lagoons of GRSE and Black River to
assess the area for proposed undersea walk activities. The percentage of live coral cover, the fish species
and their abundance, GPS positions of the platform, characteristics of the bottom substrate and visibility
at each site were recorded.
4.7 Partnerships for Marine Protected Areas of Mauritius and Rodrigues
The UNDP/GEF/Government of Mauritius Project “Partnerships for Marine Protected Areas in Mauritius
and Rodrigues”, which started in 2005 was in its fourth year of implementation. The proposal for the
gazetting of the demonstration site “The South East Marine Protected Area (SEMPA) – Rodrigues” was
finalised.
4.8 Marine Protected Areas Network of the Indian Ocean Commission (IOC) Countries
The third steering meeting for the project "Marine Protected Areas Network of the Indian Ocean
Commission Countries" was held in Seychelles in June. Funds earmarked for the different proposals were
approved. A biological inventory and the first phase for the demarcation of the BMP were approved for a
sum of 36 400 Euro. For Rodrigues, funds to the tune of 51 000 Euro were agreed upon for the
development of alternative livelihoods for fishermen operating in the marine reserve of Rivière Banane,
the demarcation of the marine reserve and the training of rangers.
48
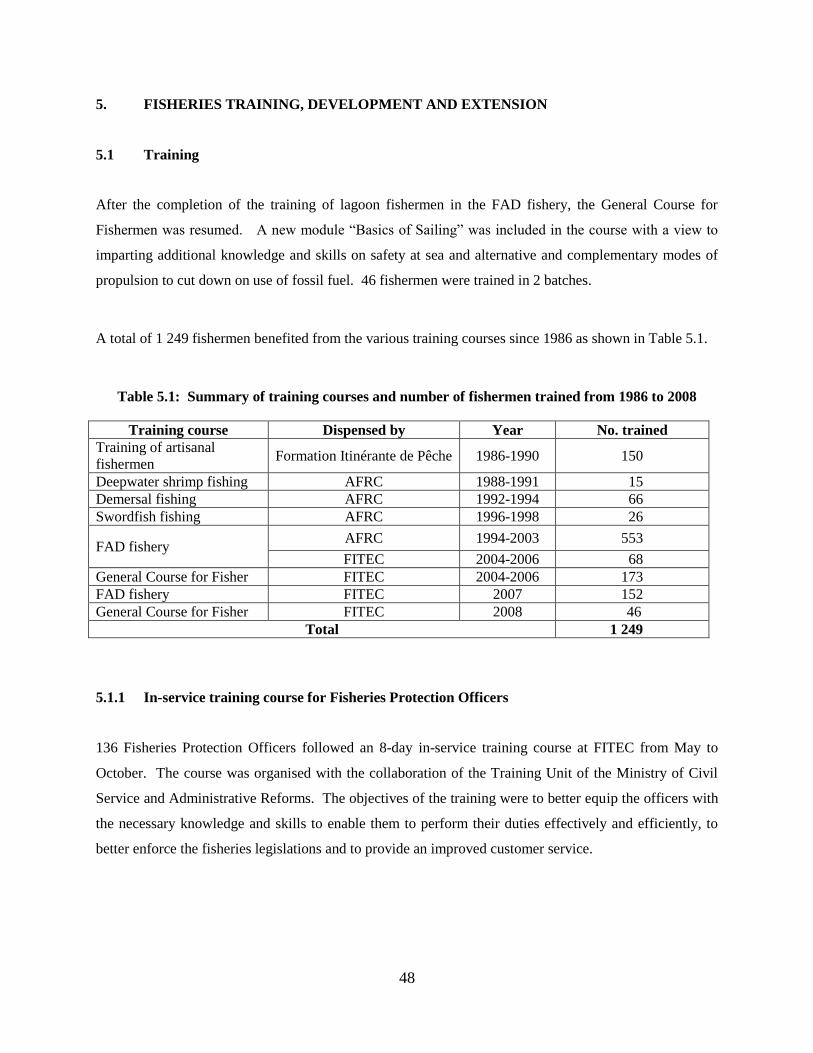
5. FISHERIES TRAINING, DEVELOPMENT AND EXTENSION
5.1 Training
After the completion of the training of lagoon fishermen in the FAD fishery, the General Course for
Fishermen was resumed. A new module “Basics of Sailing” was included in the course with a view to
imparting additional knowledge and skills on safety at sea and alternative and complementary modes of
propulsion to cut down on use of fossil fuel. 46 fishermen were trained in 2 batches.
A total of 1 249 fishermen benefited from the various training courses since 1986 as shown in Table 5.1.
Table 5.1: Summary of training courses and number of fishermen trained from 1986 to 2008
Training course Dispensed by Year No. trained
Training of artisanal
fishermen Formation Itinérante de Pêche 1986-1990 150
Deepwater shrimp fishing AFRC 1988-1991 15
Demersal fishing AFRC 1992-1994 66
Swordfish fishing AFRC 1996-1998 26
FAD fishery AFRC 1994-2003 553
FITEC 2004-2006 68
General Course for Fisher FITEC 2004-2006 173
FAD fishery FITEC 2007 152
General Course for Fisher FITEC 2008 46
Total 1 249
5.1.1 In-service training course for Fisheries Protection Officers
136 Fisheries Protection Officers followed an 8-day in-service training course at FITEC from May to
October. The course was organised with the collaboration of the Training Unit of the Ministry of Civil
Service and Administrative Reforms. The objectives of the training were to better equip the officers with
the necessary knowledge and skills to enable them to perform their duties effectively and efficiently, to
better enforce the fisheries legislations and to provide an improved customer service.
49
5.2 FAD fishery
Activities in relation to the development of the FAD fishery under the International Fund for Agricultural
Development Loan 504: MU-Rural Diversification Programme were continued.
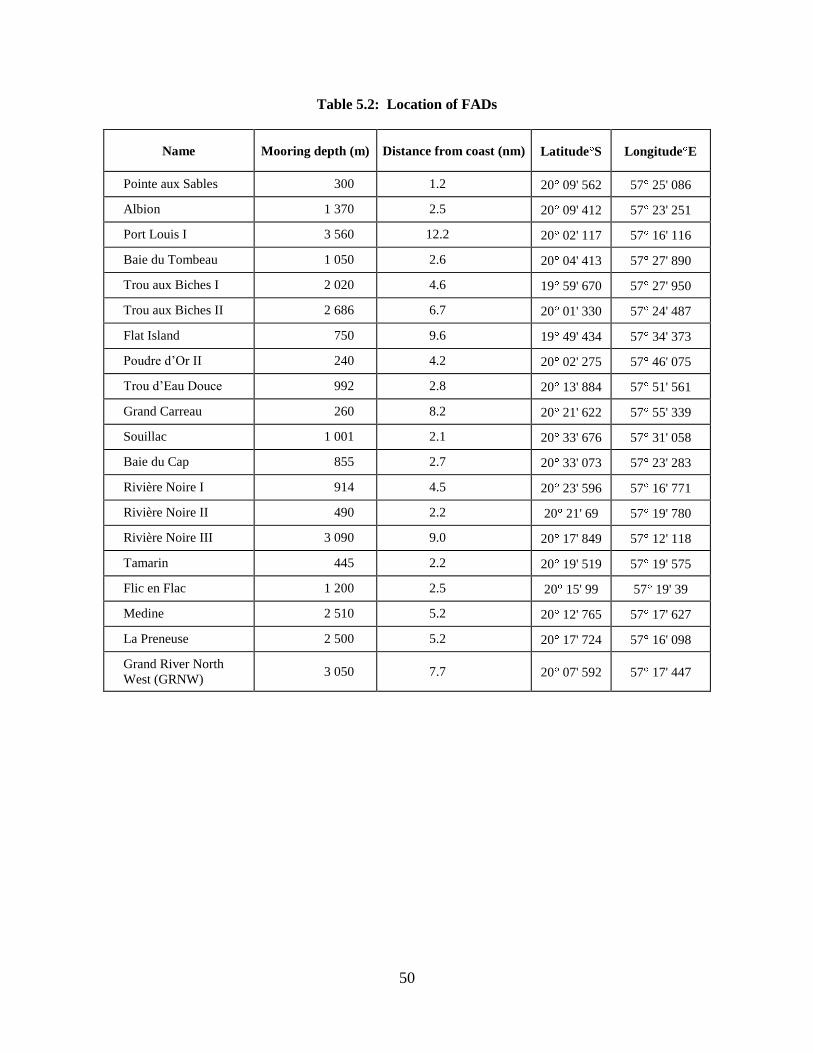
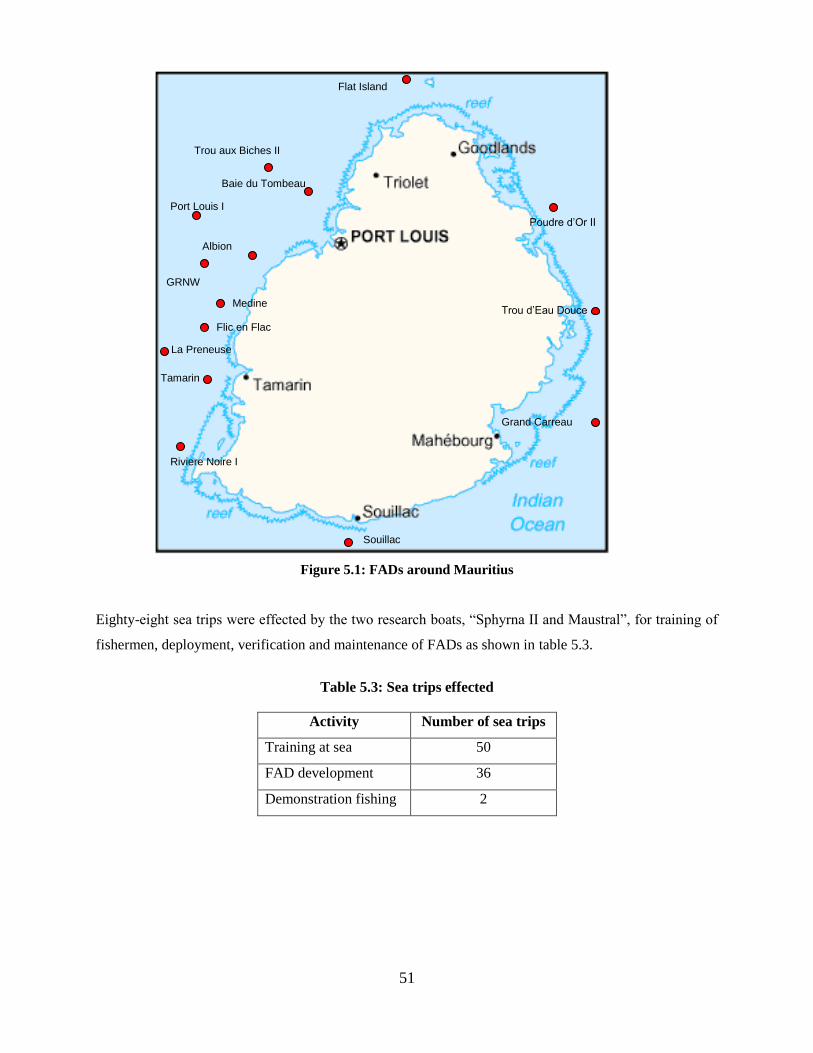
5.2.1 FAD deployment and maintenance
Sixteen FADs were replaced and a new one was set off GRNW. An average of twenty FADs was kept
active around the island. Table 5.2 gives the particulars of the FADs around the island and figure 5.1
illustrates their locations.
50
Table 5.2: Location of FADs
Name Mooring depth (m) Distance from coast (nm) Latitude S Longitude E
Pointe aux Sables 300 1.2 20 09' 562 57 25' 086
Albion 1 370 2.5 20 09' 412 57 23' 251
Port Louis I 3 560 12.2 20 02' 117 57 16' 116
Baie du Tombeau 1 050 2.6 20 04' 413 57 27' 890
Trou aux Biches I 2 020 4.6 19 59' 670 57 27' 950
Trou aux Biches II 2 686 6.7 20 01' 330 57 24' 487
Flat Island 750 9.6 19 49' 434 57 34' 373
Poudre d‟Or II 240 4.2 20 02' 275 57 46' 075
Trou d‟Eau Douce 992 2.8 20 13' 884 57 51' 561
Grand Carreau 260 8.2 20 21' 622 57 55' 339
Souillac 1 001 2.1 20 33' 676 57 31' 058
Baie du Cap 855 2.7 20 33' 073 57 23' 283
Rivière Noire I 914 4.5 20 23' 596 57 16' 771
Rivière Noire II 490 2.2 20 21' 69 57 19' 780
Rivière Noire III 3 090 9.0 20 17' 849 57 12' 118
Tamarin 445 2.2 20 19' 519 57 19' 575
Flic en Flac 1 200 2.5 20 15' 99 57 19' 39
Medine 2 510 5.2 20 12' 765 57 17' 627
La Preneuse 2 500 5.2 20 17' 724 57 16' 098
Grand River North
West (GRNW) 3 050 7.7 20 07' 592 57 17' 447
51
Figure 5.1: FADs around Mauritius
Eighty-eight sea trips were effected by the two research boats, “Sphyrna II and Maustral”, for training of
fishermen, deployment, verification and maintenance of FADs as shown in table 5.3.
Table 5.3: Sea trips effected
Activity Number of sea trips
Training at sea 50
FAD development 36
Demonstration fishing 2
Flat Island Cannoniers
Trou aux Biches II
Baie du Tombeau
Albion
Port Louis I
GRNW
Medine
Flic en Flac
La Preneuse
Tamarin
Riviere Noire I
Souillac
Grand Carreau
Poudre d’Or II
Trou d’Eau Douce
52
5.2.2 FAD fishery monitoring
The software licence for the Statistical Package for Social Sciences (SPSS) and a new computer for FAD
monitoring were acquired under the IFAD-RDP programme. Daily catch and related information on the
FAD fishery, under the sample based data collection programme, were collected at the fish landing
stations. Data from June 2007 to December 2008 were coded and input in the database for later analysis.
5.2.3 Consolidation of control measures
The draft FAD regulations were prepared after consultations with associations of fishermen and other
stakeholders. After vetting by the Solicitor General, procedures for its proclamation would be
undertaken.
5.2.4 FAD fishery development sub-programme under the Rural Diversification Programme
Two IFAD supervision missions were held in April and August to review the progress achieved in the
FAD fishery and to facilitate the completion of the final year activities.
5.3 Demonstration fishing for deepwater shrimp
Two fishing trips for catching deepwater shrimp using traps were undertaken onboard Sphyrna II for a
private promoter in April. The aim of the trips was to demonstrate the setting and hauling of traps, catch
per trap, optimal depth of abundance, handling and preservation methods.
53
6. FISHERIES MANAGEMENT
6.1 Licensing of fishing vessels
All fishing vessels operating in the Exclusive Economic Zone of Mauritius are required by law to obtain a
fishing licence. Licensing of fishing vessels is an important tool in the management of the fishery
resources and in the monitoring, control and surveillance of fishing activities.
Licences are issued to local and foreign fishing vessels under a set of conditions and against payment of
the appropriate licence fees.
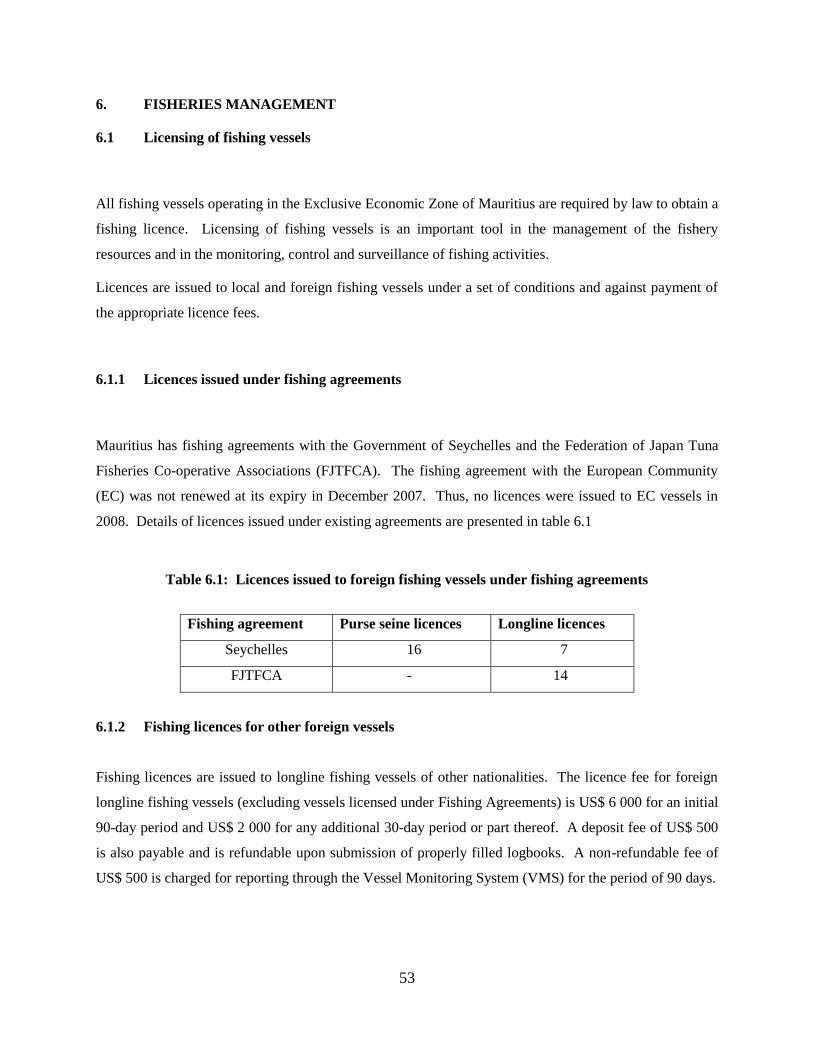
6.1.1 Licences issued under fishing agreements
Mauritius has fishing agreements with the Government of Seychelles and the Federation of Japan Tuna
Fisheries Co-operative Associations (FJTFCA). The fishing agreement with the European Community
(EC) was not renewed at its expiry in December 2007. Thus, no licences were issued to EC vessels in
2008. Details of licences issued under existing agreements are presented in table 6.1
Table 6.1: Licences issued to foreign fishing vessels under fishing agreements
Fishing agreement Purse seine licences Longline licences
Seychelles 16 7
FJTFCA - 14
6.1.2 Fishing licences for other foreign vessels
Fishing licences are issued to longline fishing vessels of other nationalities. The licence fee for foreign
longline fishing vessels (excluding vessels licensed under Fishing Agreements) is US$ 6 000 for an initial
90-day period and US$ 2 000 for any additional 30-day period or part thereof. A deposit fee of US$ 500
is also payable and is refundable upon submission of properly filled logbooks. A non-refundable fee of
US$ 500 is charged for reporting through the Vessel Monitoring System (VMS) for the period of 90 days.
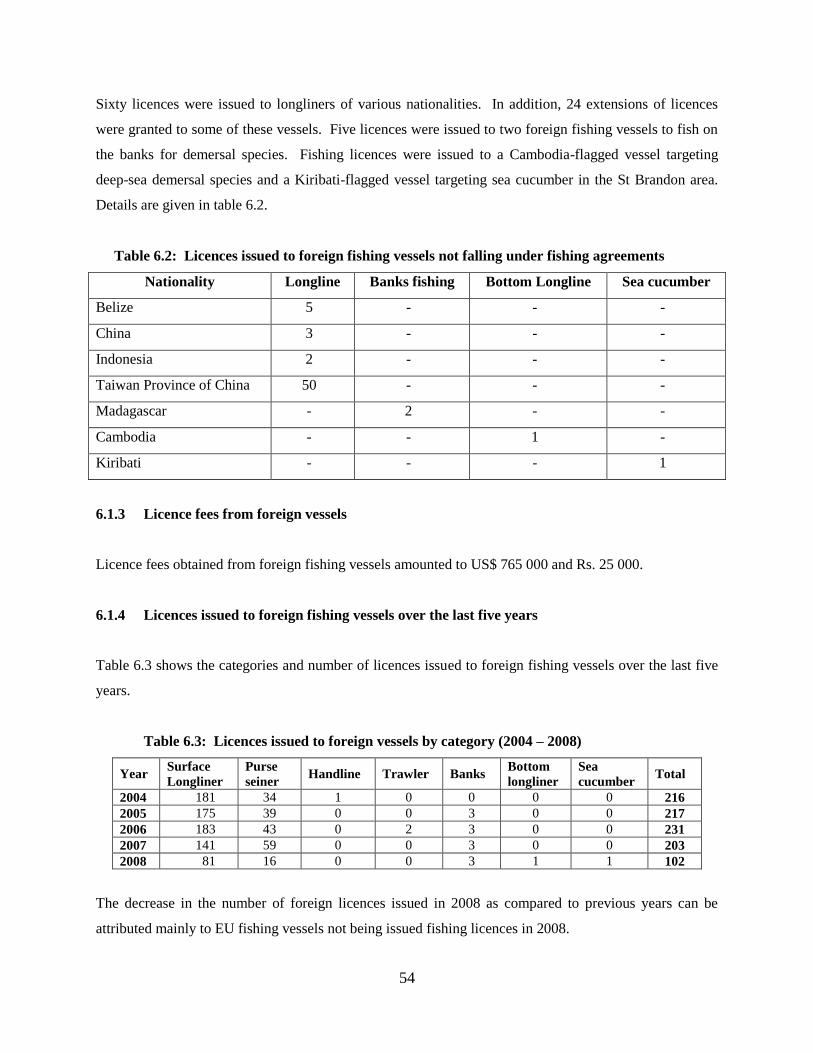
54
Sixty licences were issued to longliners of various nationalities. In addition, 24 extensions of licences
were granted to some of these vessels. Five licences were issued to two foreign fishing vessels to fish on
the banks for demersal species. Fishing licences were issued to a Cambodia-flagged vessel targeting
deep-sea demersal species and a Kiribati-flagged vessel targeting sea cucumber in the St Brandon area.
Details are given in table 6.2.
Table 6.2: Licences issued to foreign fishing vessels not falling under fishing agreements
Nationality Longline Banks fishing Bottom Longline Sea cucumber
Belize 5 - - -
China 3 - - -
Indonesia 2 - - -
Taiwan Province of China 50 - - -
Madagascar - 2 - -
Cambodia - - 1 -
Kiribati - - - 1
6.1.3 Licence fees from foreign vessels
Licence fees obtained from foreign fishing vessels amounted to US$ 765 000 and Rs. 25 000.
6.1.4 Licences issued to foreign fishing vessels over the last five years
Table 6.3 shows the categories and number of licences issued to foreign fishing vessels over the last five
years.
Table 6.3: Licences issued to foreign vessels by category (2004 – 2008)
Year Surface
Longliner
Purse
seiner Handline Trawler Banks
Bottom
longliner
Sea
cucumber Total
2004 181 34 1 0 0 0 0 216
2005 175 39 0 0 3 0 0 217
2006 183 43 0 2 3 0 0 231
2007 141 59 0 0 3 0 0 203
2008 81 16 0 0 3 1 1 102
The decrease in the number of foreign licences issued in 2008 as compared to previous years can be
attributed mainly to EU fishing vessels not being issued fishing licences in 2008.
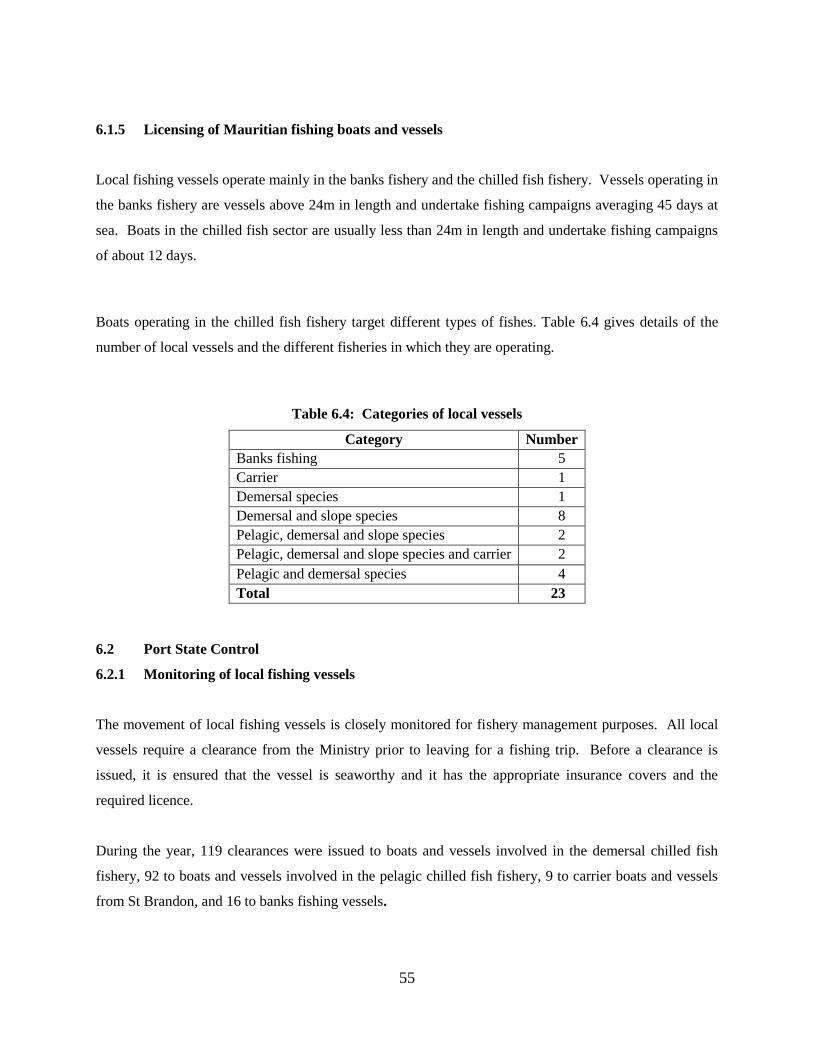
55
6.1.5 Licensing of Mauritian fishing boats and vessels
Local fishing vessels operate mainly in the banks fishery and the chilled fish fishery. Vessels operating in
the banks fishery are vessels above 24m in length and undertake fishing campaigns averaging 45 days at
sea. Boats in the chilled fish sector are usually less than 24m in length and undertake fishing campaigns
of about 12 days.
Boats operating in the chilled fish fishery target different types of fishes. Table 6.4 gives details of the
number of local vessels and the different fisheries in which they are operating.
Table 6.4: Categories of local vessels
Category Number
Banks fishing 5
Carrier 1
Demersal species 1
Demersal and slope species 8
Pelagic, demersal and slope species 2
Pelagic, demersal and slope species and carrier 2
Pelagic and demersal species 4
Total 23
6.2 Port State Control
6.2.1 Monitoring of local fishing vessels
The movement of local fishing vessels is closely monitored for fishery management purposes. All local
vessels require a clearance from the Ministry prior to leaving for a fishing trip. Before a clearance is
issued, it is ensured that the vessel is seaworthy and it has the appropriate insurance covers and the
required licence.
During the year, 119 clearances were issued to boats and vessels involved in the demersal chilled fish
fishery, 92 to boats and vessels involved in the pelagic chilled fish fishery, 9 to carrier boats and vessels
from St Brandon, and 16 to banks fishing vessels.
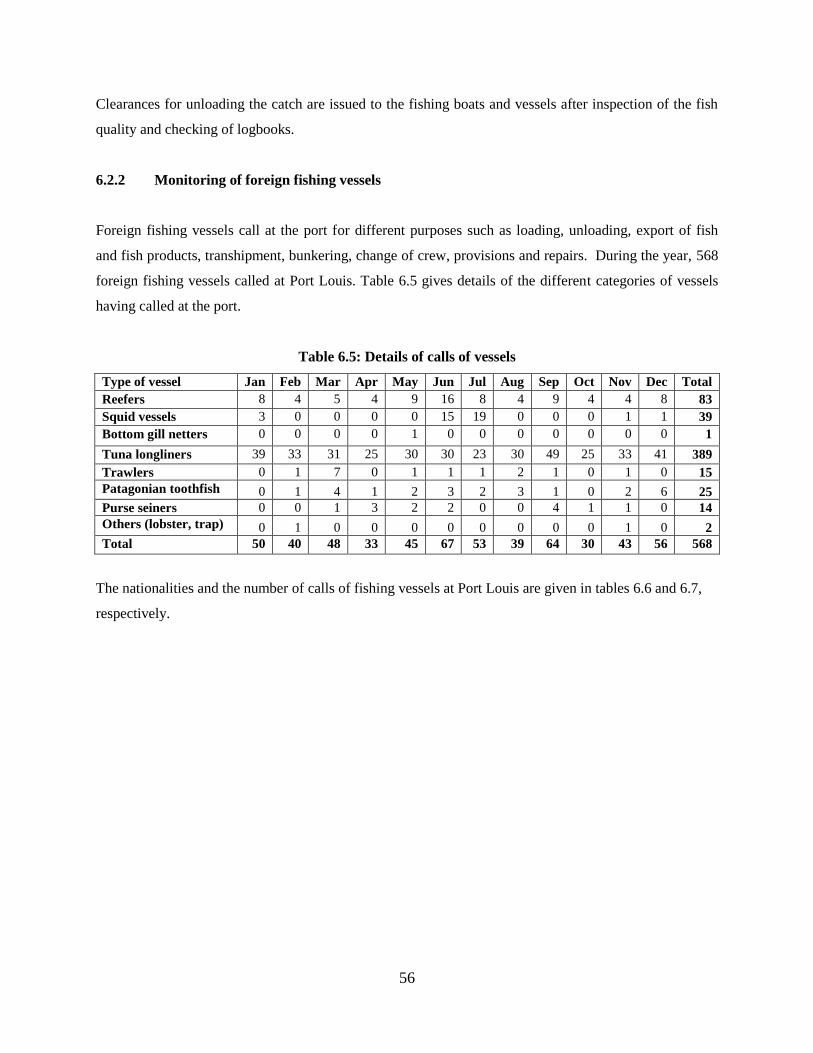
56
Clearances for unloading the catch are issued to the fishing boats and vessels after inspection of the fish
quality and checking of logbooks.
6.2.2 Monitoring of foreign fishing vessels
Foreign fishing vessels call at the port for different purposes such as loading, unloading, export of fish
and fish products, transhipment, bunkering, change of crew, provisions and repairs. During the year, 568
foreign fishing vessels called at Port Louis. Table 6.5 gives details of the different categories of vessels
having called at the port.
Table 6.5: Details of calls of vessels
Type of vessel Jan Feb Mar Apr May Jun Jul Aug Sep Oct Nov Dec Total
Reefers 8 4 5 4 9 16 8 4 9 4 4 8 83
Squid vessels 3 0 0 0 0 15 19 0 0 0 1 1 39
Bottom gill netters 0 0 0 0 1 0 0 0 0 0 0 0 1
Tuna longliners 39 33 31 25 30 30 23 30 49 25 33 41 389
Trawlers 0 1 7 0 1 1 1 2 1 0 1 0 15
Patagonian toothfish 0 1 4 1 2 3 2 3 1 0 2 6 25
Purse seiners 0 0 1 3 2 2 0 0 4 1 1 0 14
Others (lobster, trap) 0 1 0 0 0 0 0 0 0 0 1 0 2
Total 50 40 48 33 45 67 53 39 64 30 43 56 568
The nationalities and the number of calls of fishing vessels at Port Louis are given in tables 6.6 and 6.7,
respectively.
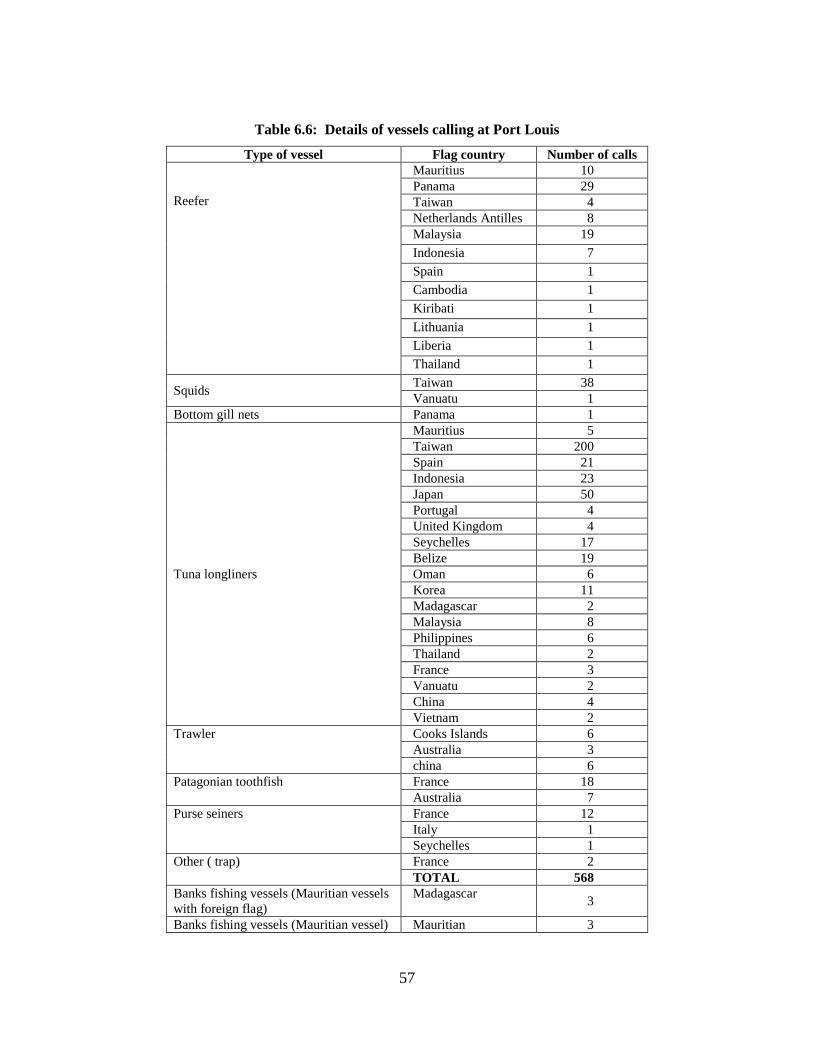
57
Table 6.6: Details of vessels calling at Port Louis
Type of vessel Flag country Number of calls
Reefer
Mauritius 10
Panama 29
Taiwan 4
Netherlands Antilles 8
Malaysia 19
Indonesia 7
Spain 1
Cambodia 1
Kiribati 1
Lithuania 1
Liberia 1
Thailand 1
Squids Taiwan 38
Vanuatu 1
Bottom gill nets Panama 1
Tuna longliners
Mauritius 5
Taiwan 200
Spain 21
Indonesia 23
Japan 50
Portugal 4
United Kingdom 4
Seychelles 17
Belize 19
Oman 6
Korea 11
Madagascar 2
Malaysia 8
Philippines 6
Thailand 2
France 3
Vanuatu 2
China 4
Vietnam 2
Trawler Cooks Islands 6
Australia 3
china 6
Patagonian toothfish France 18
Australia 7
Purse seiners France 12
Italy 1
Seychelles 1
Other ( trap) France 2
TOTAL 568
Banks fishing vessels (Mauritian vessels
with foreign flag)
Madagascar 3
Banks fishing vessels (Mauritian vessel) Mauritian 3
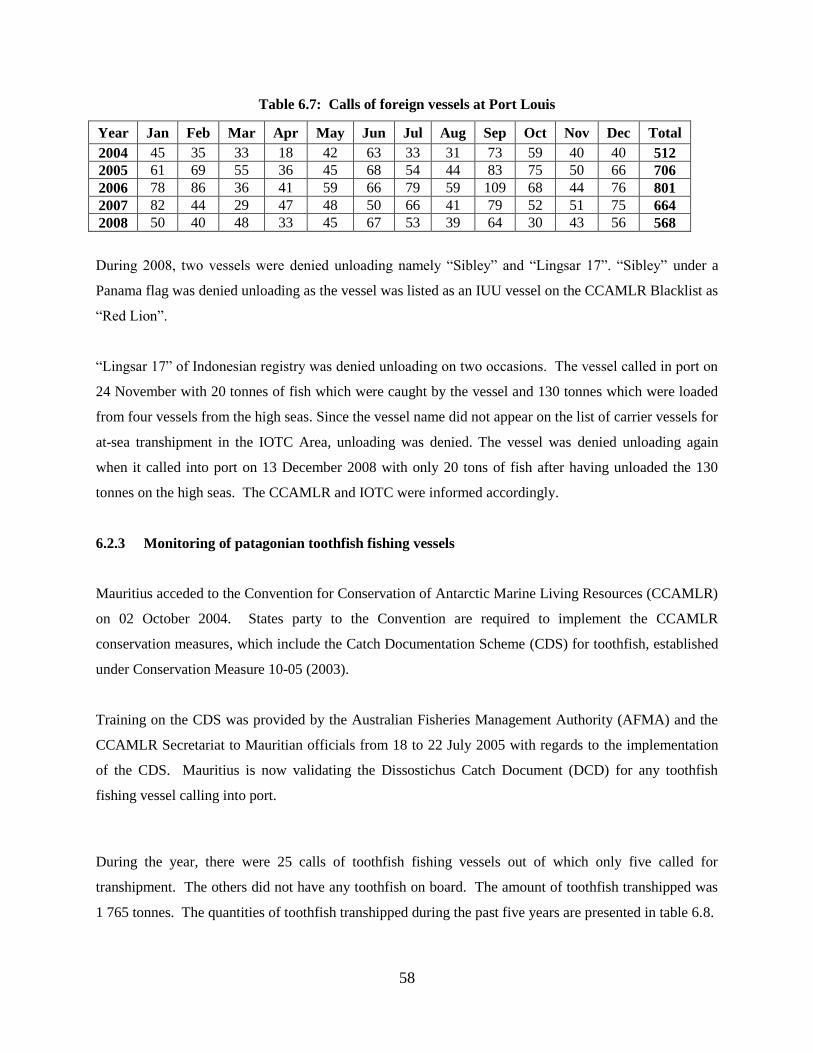
58
Table 6.7: Calls of foreign vessels at Port Louis
Year Jan Feb Mar Apr May Jun Jul Aug Sep Oct Nov Dec Total
2004 45 35 33 18 42 63 33 31 73 59 40 40 512
2005 61 69 55 36 45 68 54 44 83 75 50 66 706
2006 78 86 36 41 59 66 79 59 109 68 44 76 801
2007 82 44 29 47 48 50 66 41 79 52 51 75 664
2008 50 40 48 33 45 67 53 39 64 30 43 56 568
During 2008, two vessels were denied unloading namely “Sibley” and “Lingsar 17”. “Sibley” under a
Panama flag was denied unloading as the vessel was listed as an IUU vessel on the CCAMLR Blacklist as
“Red Lion”.
“Lingsar 17” of Indonesian registry was denied unloading on two occasions. The vessel called in port on
24 November with 20 tonnes of fish which were caught by the vessel and 130 tonnes which were loaded
from four vessels from the high seas. Since the vessel name did not appear on the list of carrier vessels for
at-sea transhipment in the IOTC Area, unloading was denied. The vessel was denied unloading again
when it called into port on 13 December 2008 with only 20 tons of fish after having unloaded the 130
tonnes on the high seas. The CCAMLR and IOTC were informed accordingly.
6.2.3 Monitoring of patagonian toothfish fishing vessels
Mauritius acceded to the Convention for Conservation of Antarctic Marine Living Resources (CCAMLR)
on 02 October 2004. States party to the Convention are required to implement the CCAMLR
conservation measures, which include the Catch Documentation Scheme (CDS) for toothfish, established
under Conservation Measure 10-05 (2003).
Training on the CDS was provided by the Australian Fisheries Management Authority (AFMA) and the
CCAMLR Secretariat to Mauritian officials from 18 to 22 July 2005 with regards to the implementation
of the CDS. Mauritius is now validating the Dissostichus Catch Document (DCD) for any toothfish
fishing vessel calling into port.
During the year, there were 25 calls of toothfish fishing vessels out of which only five called for
transhipment. The others did not have any toothfish on board. The amount of toothfish transhipped was
1 765 tonnes. The quantities of toothfish transhipped during the past five years are presented in table 6.8.
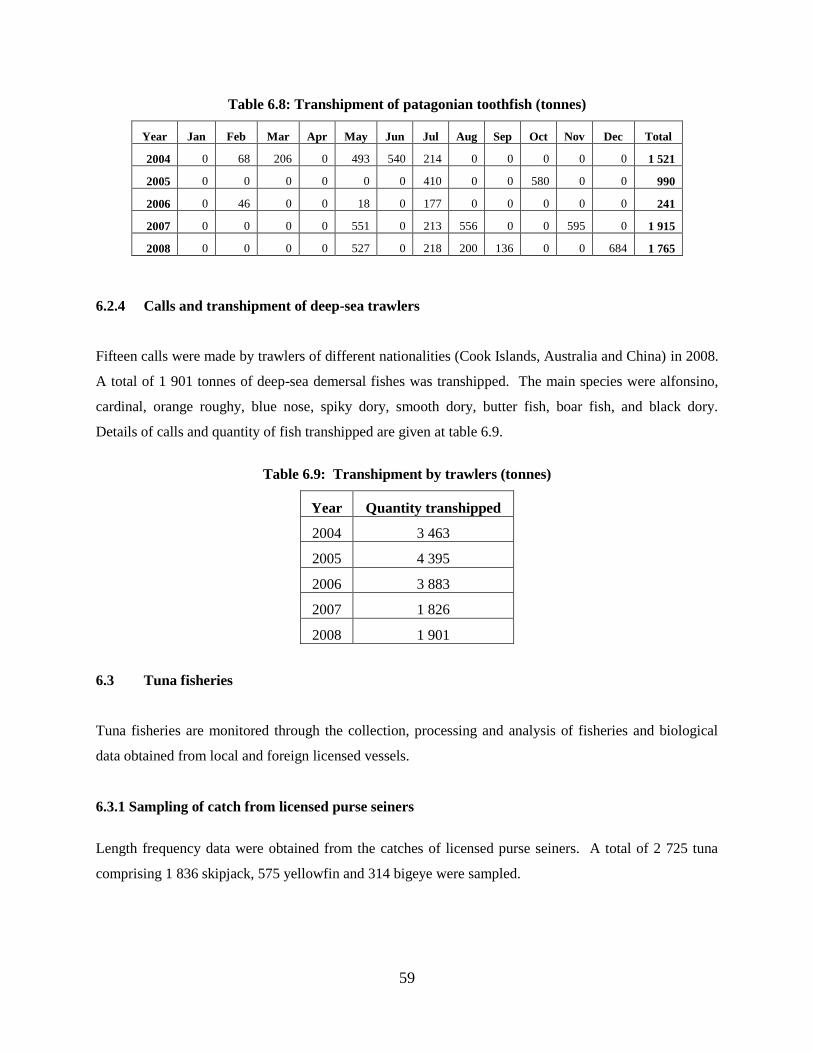
59
Table 6.8: Transhipment of patagonian toothfish (tonnes)
Year Jan Feb Mar Apr May Jun Jul Aug Sep Oct Nov Dec Total
2004 0 68 206 0 493 540 214 0 0 0 0 0 1 521
2005 0 0 0 0 0 0 410 0 0 580 0 0 990
2006 0 46 0 0 18 0 177 0 0 0 0 0 241
2007 0 0 0 0 551 0 213 556 0 0 595 0 1 915
2008 0 0 0 0 527 0 218 200 136 0 0 684 1 765
6.2.4 Calls and transhipment of deep-sea trawlers
Fifteen calls were made by trawlers of different nationalities (Cook Islands, Australia and China) in 2008.
A total of 1 901 tonnes of deep-sea demersal fishes was transhipped. The main species were alfonsino,
cardinal, orange roughy, blue nose, spiky dory, smooth dory, butter fish, boar fish, and black dory.
Details of calls and quantity of fish transhipped are given at table 6.9.
Table 6.9: Transhipment by trawlers (tonnes)
Year Quantity transhipped
2004 3 463
2005 4 395
2006 3 883
2007 1 826
2008 1 901
6.3 Tuna fisheries
Tuna fisheries are monitored through the collection, processing and analysis of fisheries and biological
data obtained from local and foreign licensed vessels.
6.3.1 Sampling of catch from licensed purse seiners
Length frequency data were obtained from the catches of licensed purse seiners. A total of 2 725 tuna
comprising 1 836 skipjack, 575 yellowfin and 314 bigeye were sampled.
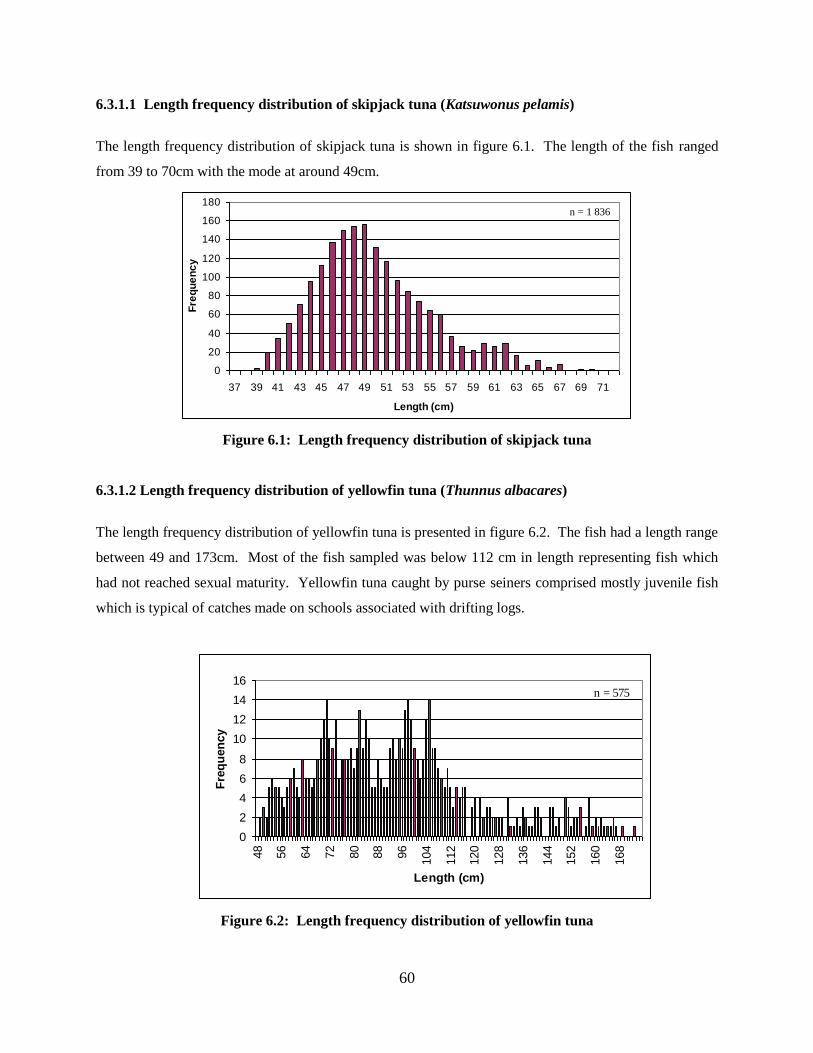
60
6.3.1.1 Length frequency distribution of skipjack tuna (Katsuwonus pelamis)
The length frequency distribution of skipjack tuna is shown in figure 6.1. The length of the fish ranged
from 39 to 70cm with the mode at around 49cm.
n = 1 836
0
20
40
60
80
100
120
140
160
180
37 39 41 43 45 47 49 51 53 55 57 59 61 63 65 67 69 71
Length (cm)
Fre
qu
en
cy
Figure 6.1: Length frequency distribution of skipjack tuna
6.3.1.2 Length frequency distribution of yellowfin tuna (Thunnus albacares)
The length frequency distribution of yellowfin tuna is presented in figure 6.2. The fish had a length range
between 49 and 173cm. Most of the fish sampled was below 112 cm in length representing fish which
had not reached sexual maturity. Yellowfin tuna caught by purse seiners comprised mostly juvenile fish
which is typical of catches made on schools associated with drifting logs.
n = 575
0
2
4
6
8
10
12
14
16
48
56
64
72
80
88
96
104
112
120
128
136
144
152
160
168
Length (cm)
Fre
qu
en
cy
Figure 6.2: Length frequency distribution of yellowfin tuna
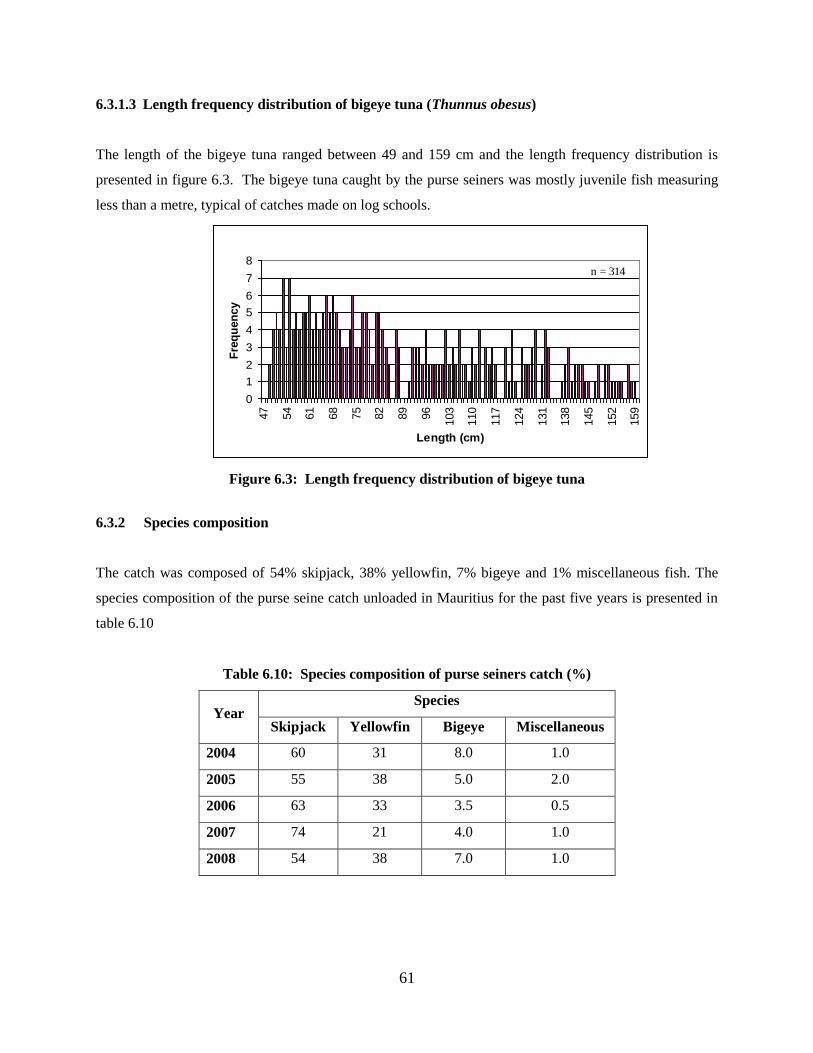
61
6.3.1.3 Length frequency distribution of bigeye tuna (Thunnus obesus)
The length of the bigeye tuna ranged between 49 and 159 cm and the length frequency distribution is
presented in figure 6.3. The bigeye tuna caught by the purse seiners was mostly juvenile fish measuring
less than a metre, typical of catches made on log schools.
n = 314
0
1
2
3
4
5
6
7
847
54
61
68
75
82
89
96
103
110
117
124
131
138
145
152
159
Length (cm)
Fre
qu
en
cy
Figure 6.3: Length frequency distribution of bigeye tuna
6.3.2 Species composition
The catch was composed of 54% skipjack, 38% yellowfin, 7% bigeye and 1% miscellaneous fish. The
species composition of the purse seine catch unloaded in Mauritius for the past five years is presented in
table 6.10
Table 6.10: Species composition of purse seiners catch (%)
Year Species
Skipjack Yellowfin Bigeye Miscellaneous
2004 60 31 8.0 1.0
2005 55 38 5.0 2.0
2006 63 33 3.5 0.5
2007 74 21 4.0 1.0
2008 54 38 7.0 1.0
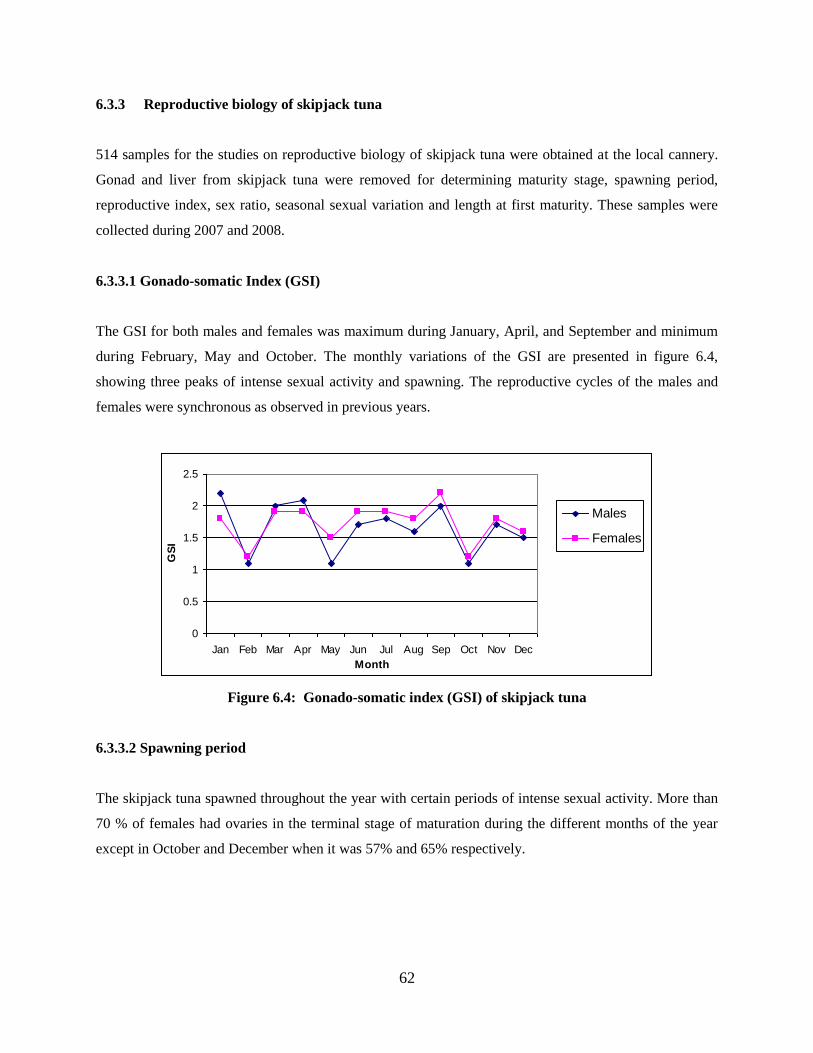
62
6.3.3 Reproductive biology of skipjack tuna
514 samples for the studies on reproductive biology of skipjack tuna were obtained at the local cannery.
Gonad and liver from skipjack tuna were removed for determining maturity stage, spawning period,
reproductive index, sex ratio, seasonal sexual variation and length at first maturity. These samples were
collected during 2007 and 2008.
6.3.3.1 Gonado-somatic Index (GSI)
The GSI for both males and females was maximum during January, April, and September and minimum
during February, May and October. The monthly variations of the GSI are presented in figure 6.4,
showing three peaks of intense sexual activity and spawning. The reproductive cycles of the males and
females were synchronous as observed in previous years.
0
0.5
1
1.5
2
2.5
Jan Feb Mar Apr May Jun Jul Aug Sep Oct Nov Dec
Month
GS
I
Males
Females
Figure 6.4: Gonado-somatic index (GSI) of skipjack tuna
6.3.3.2 Spawning period
The skipjack tuna spawned throughout the year with certain periods of intense sexual activity. More than
70 % of females had ovaries in the terminal stage of maturation during the different months of the year
except in October and December when it was 57% and 65% respectively.
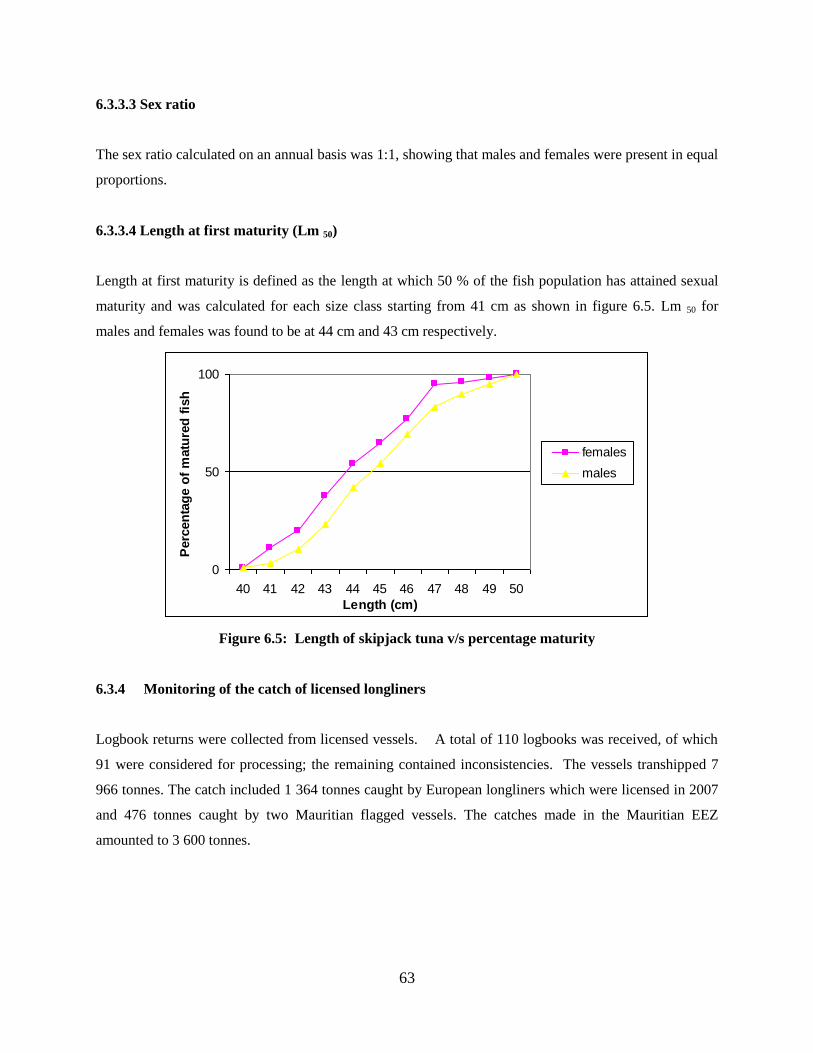
63
6.3.3.3 Sex ratio
The sex ratio calculated on an annual basis was 1:1, showing that males and females were present in equal
proportions.
6.3.3.4 Length at first maturity (Lm 50)
Length at first maturity is defined as the length at which 50 % of the fish population has attained sexual
maturity and was calculated for each size class starting from 41 cm as shown in figure 6.5. Lm 50 for
males and females was found to be at 44 cm and 43 cm respectively.
0
50
100
40 41 42 43 44 45 46 47 48 49 50
Length (cm)
Perc
en
tag
e o
f m
atu
red
fis
h
females
males
Figure 6.5: Length of skipjack tuna v/s percentage maturity
6.3.4 Monitoring of the catch of licensed longliners
Logbook returns were collected from licensed vessels. A total of 110 logbooks was received, of which
91 were considered for processing; the remaining contained inconsistencies. The vessels transhipped 7
966 tonnes. The catch included 1 364 tonnes caught by European longliners which were licensed in 2007
and 476 tonnes caught by two Mauritian flagged vessels. The catches made in the Mauritian EEZ
amounted to 3 600 tonnes.
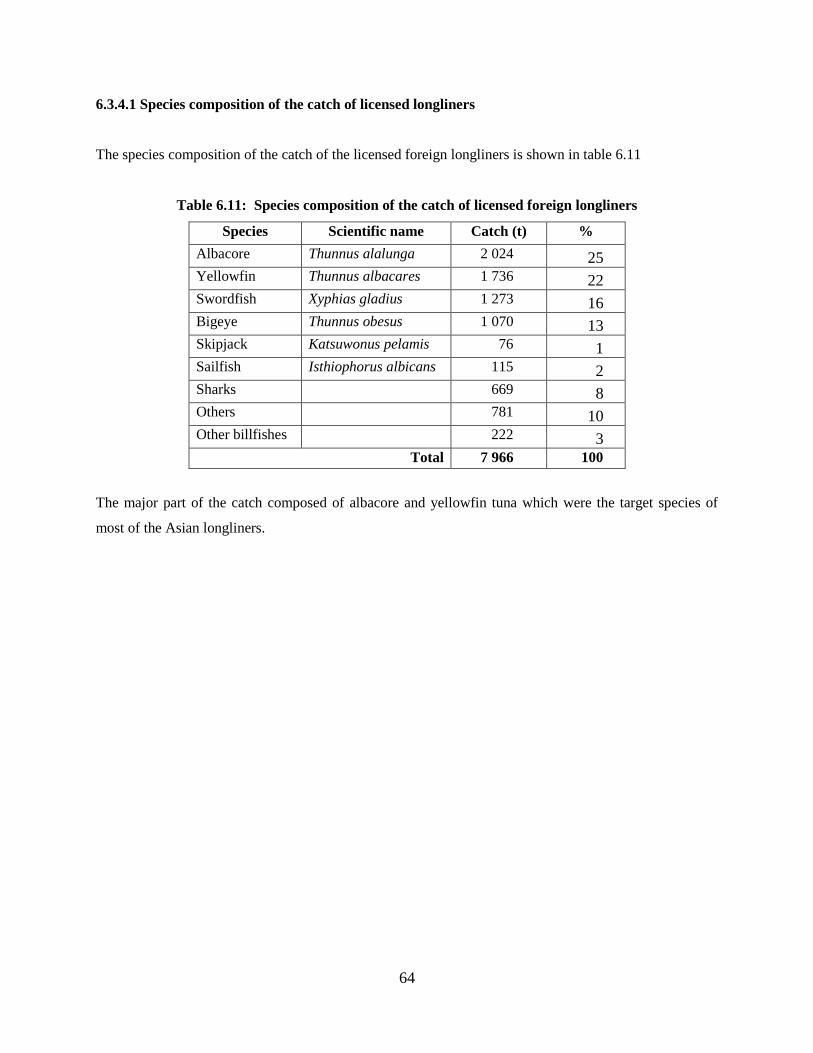
64
6.3.4.1 Species composition of the catch of licensed longliners
The species composition of the catch of the licensed foreign longliners is shown in table 6.11
Table 6.11: Species composition of the catch of licensed foreign longliners
The major part of the catch composed of albacore and yellowfin tuna which were the target species of
most of the Asian longliners.
Species Scientific name Catch (t) %
Albacore Thunnus alalunga 2 024 25 Yellowfin Thunnus albacares 1 736 22 Swordfish Xyphias gladius 1 273 16 Bigeye Thunnus obesus 1 070 13 Skipjack Katsuwonus pelamis 76 1 Sailfish Isthiophorus albicans 115 2 Sharks 669 8 Others 781 10 Other billfishes 222 3
Total 7 966 100
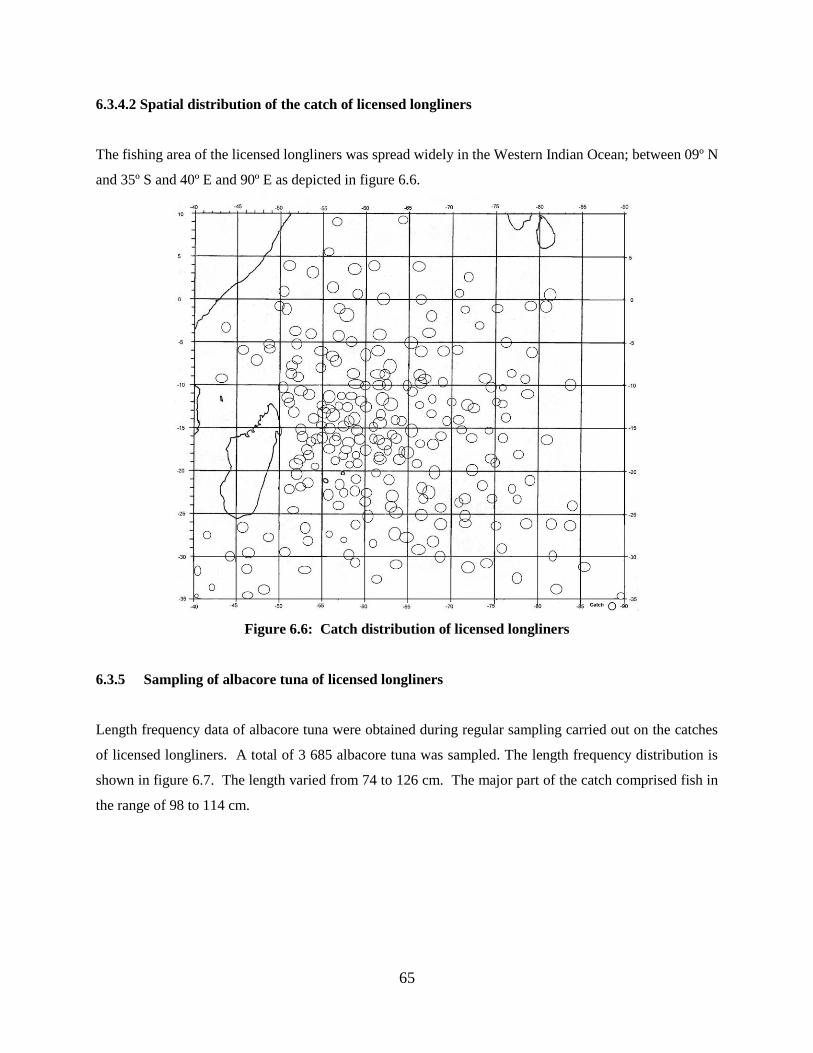
65
6.3.4.2 Spatial distribution of the catch of licensed longliners
The fishing area of the licensed longliners was spread widely in the Western Indian Ocean; between 09º N
and 35º S and 40º E and 90º E as depicted in figure 6.6.
Figure 6.6: Catch distribution of licensed longliners
6.3.5 Sampling of albacore tuna of licensed longliners
Length frequency data of albacore tuna were obtained during regular sampling carried out on the catches
of licensed longliners. A total of 3 685 albacore tuna was sampled. The length frequency distribution is
shown in figure 6.7. The length varied from 74 to 126 cm. The major part of the catch comprised fish in
the range of 98 to 114 cm.
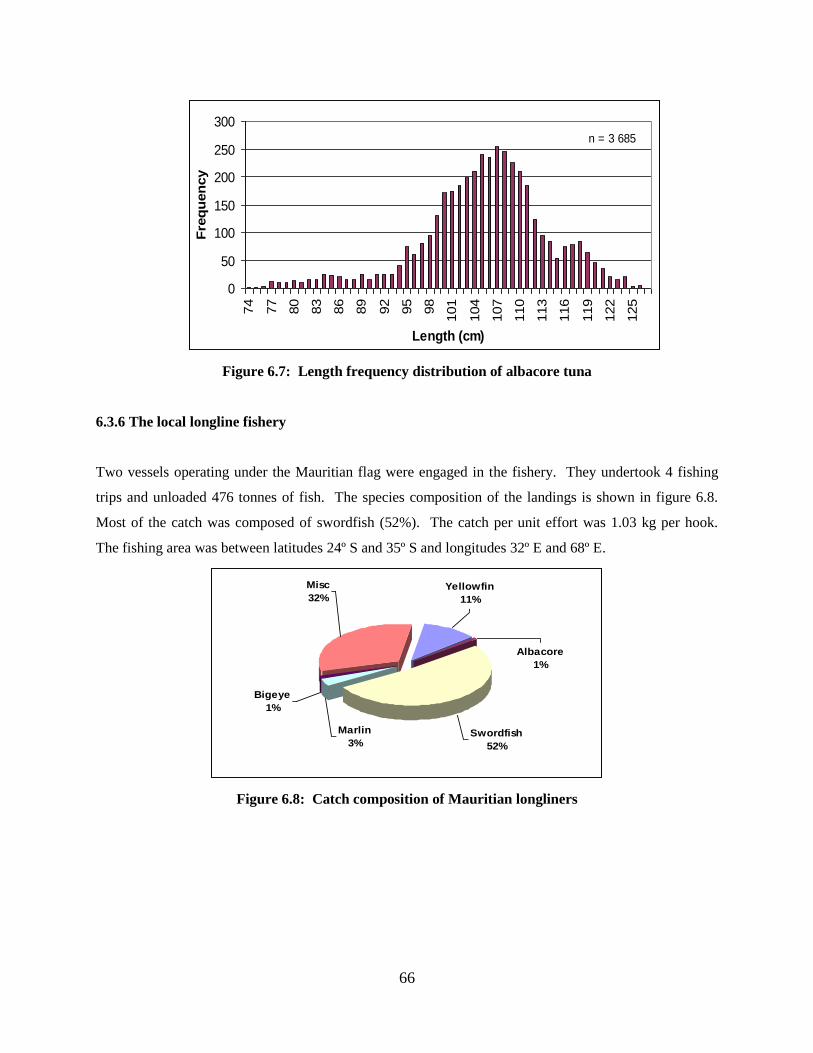
66
n = 3 685
0
50
100
150
200
250
300
74
77
80
83
86
89
92
95
98
101
104
107
110
113
116
119
122
125
Length (cm)
Fre
qu
en
cy
Figure 6.7: Length frequency distribution of albacore tuna
6.3.6 The local longline fishery
Two vessels operating under the Mauritian flag were engaged in the fishery. They undertook 4 fishing
trips and unloaded 476 tonnes of fish. The species composition of the landings is shown in figure 6.8.
Most of the catch was composed of swordfish (52%). The catch per unit effort was 1.03 kg per hook.
The fishing area was between latitudes 24º S and 35º S and longitudes 32º E and 68º E.
Misc
32%
Bigeye
1%
Marlin
3%Swordfish
52%
Albacore
1%
Yellowfin
11%
Figure 6.8: Catch composition of Mauritian longliners
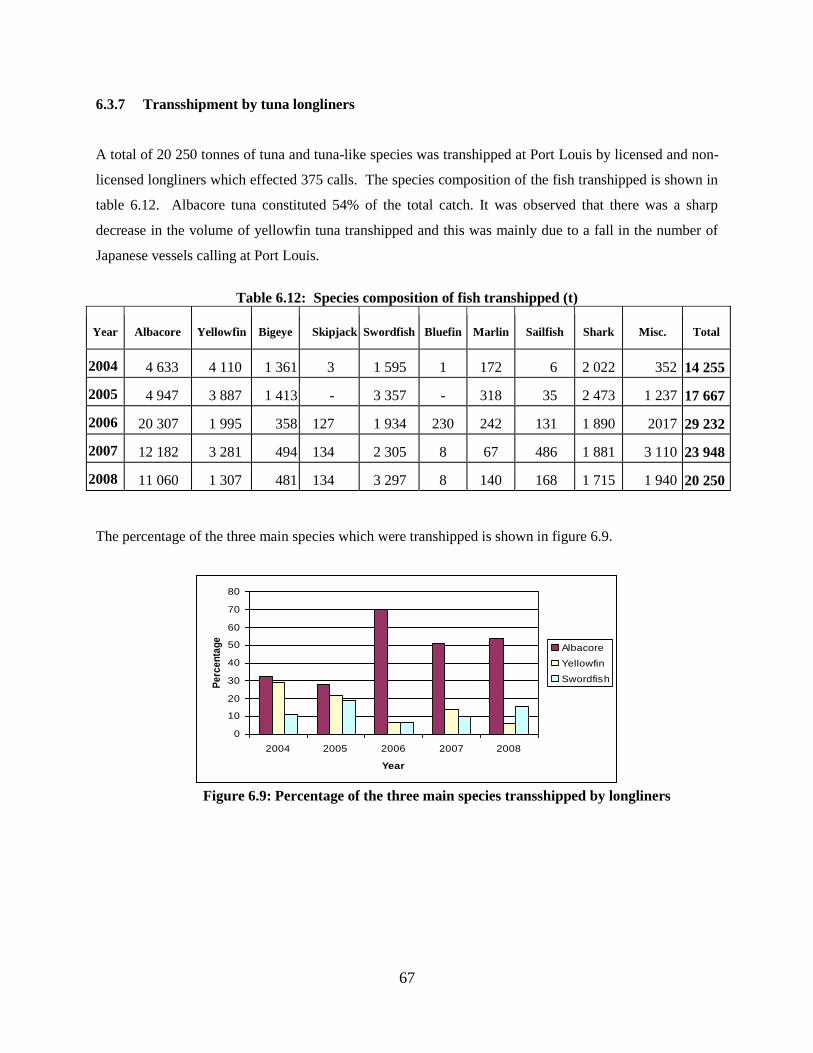
67
6.3.7 Transshipment by tuna longliners
A total of 20 250 tonnes of tuna and tuna-like species was transhipped at Port Louis by licensed and non-
licensed longliners which effected 375 calls. The species composition of the fish transhipped is shown in
table 6.12. Albacore tuna constituted 54% of the total catch. It was observed that there was a sharp
decrease in the volume of yellowfin tuna transhipped and this was mainly due to a fall in the number of
Japanese vessels calling at Port Louis.
Table 6.12: Species composition of fish transhipped (t)
Year Albacore Yellowfin Bigeye Skipjack Swordfish Bluefin Marlin Sailfish Shark Misc. Total
2004 4 633 4 110 1 361 3 1 595 1 172 6 2 022 352 14 255
2005 4 947 3 887 1 413 - 3 357 - 318 35 2 473 1 237 17 667
2006 20 307 1 995 358 127 1 934 230 242 131 1 890 2017 29 232
2007 12 182 3 281 494 134 2 305 8 67 486 1 881 3 110 23 948
2008 11 060 1 307 481 134 3 297 8 140 168 1 715 1 940 20 250
The percentage of the three main species which were transhipped is shown in figure 6.9.
0
10
20
30
40
50
60
70
80
2004 2005 2006 2007 2008
Year
Pe
rce
nta
ge
Albacore
Yellowfin
Swordfish
Figure 6.9: Percentage of the three main species transshipped by longliners
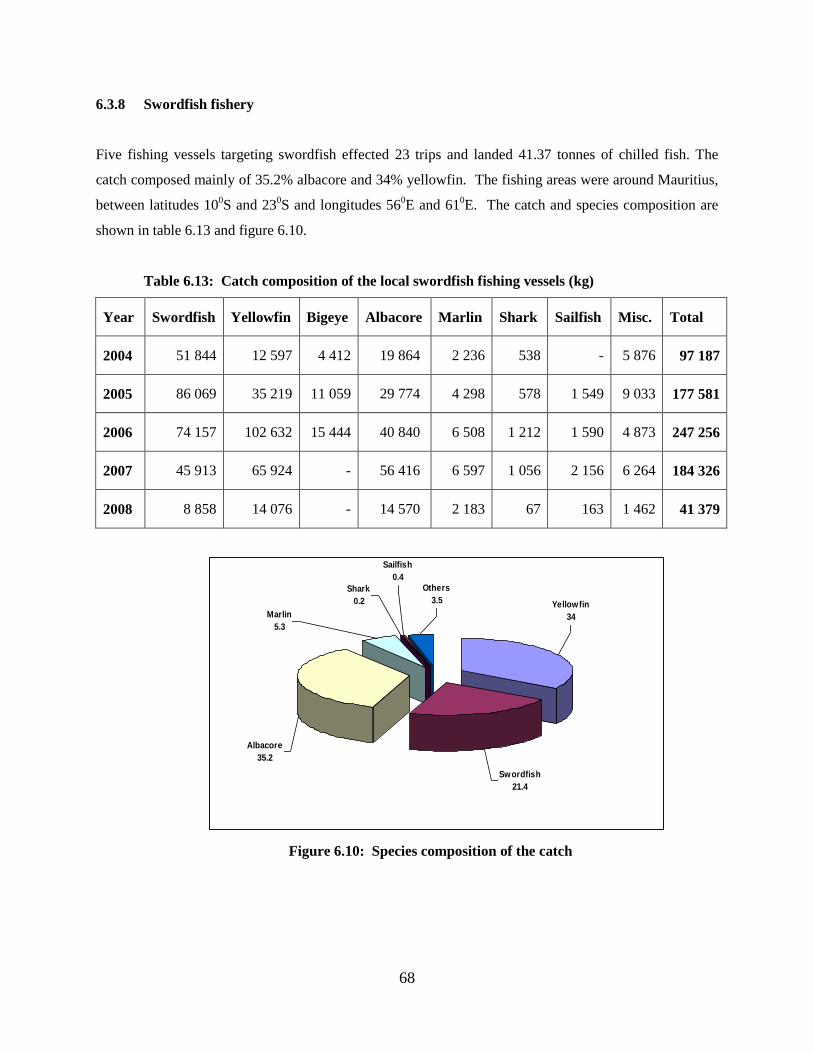
68
6.3.8 Swordfish fishery
Five fishing vessels targeting swordfish effected 23 trips and landed 41.37 tonnes of chilled fish. The
catch composed mainly of 35.2% albacore and 34% yellowfin. The fishing areas were around Mauritius,
between latitudes 100S and 23
0S and longitudes 56
0E and 61
0E. The catch and species composition are
shown in table 6.13 and figure 6.10.
Table 6.13: Catch composition of the local swordfish fishing vessels (kg)
Year Swordfish Yellowfin Bigeye Albacore Marlin Shark Sailfish Misc. Total
2004 51 844 12 597 4 412 19 864 2 236 538 - 5 876 97 187
2005 86 069 35 219 11 059 29 774 4 298 578 1 549 9 033 177 581
2006 74 157 102 632 15 444 40 840 6 508 1 212 1 590 4 873 247 256
2007 45 913 65 924 - 56 416 6 597 1 056 2 156 6 264 184 326
2008 8 858 14 076 - 14 570 2 183 67 163 1 462 41 379
Marlin
5.3
Shark
0.2
Swordfish
21.4
Yellowfin
34
Others
3.5
Albacore
35.2
Sailfish
0.4
Figure 6.10: Species composition of the catch
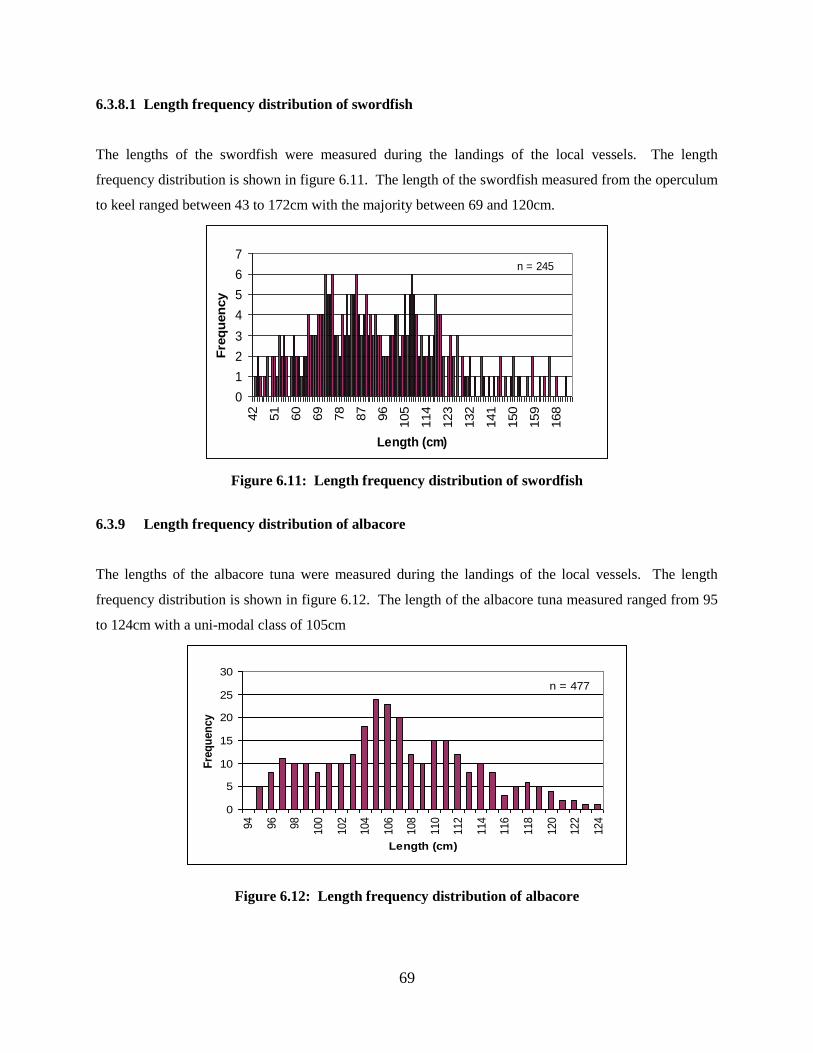
69
6.3.8.1 Length frequency distribution of swordfish
The lengths of the swordfish were measured during the landings of the local vessels. The length
frequency distribution is shown in figure 6.11. The length of the swordfish measured from the operculum
to keel ranged between 43 to 172cm with the majority between 69 and 120cm.
n = 245
0
1
2
3
4
5
6
742
51
60
69
78
87
96
105
114
123
132
141
150
159
168
Length (cm)
Fre
qu
en
cy
Figure 6.11: Length frequency distribution of swordfish
6.3.9 Length frequency distribution of albacore
The lengths of the albacore tuna were measured during the landings of the local vessels. The length
frequency distribution is shown in figure 6.12. The length of the albacore tuna measured ranged from 95
to 124cm with a uni-modal class of 105cm
n = 477
0
5
10
15
20
25
30
94
96
98
100
102
104
106
108
110
112
114
116
118
120
122
124
Length (cm)
Fre
qu
en
cy
Figure 6.12: Length frequency distribution of albacore
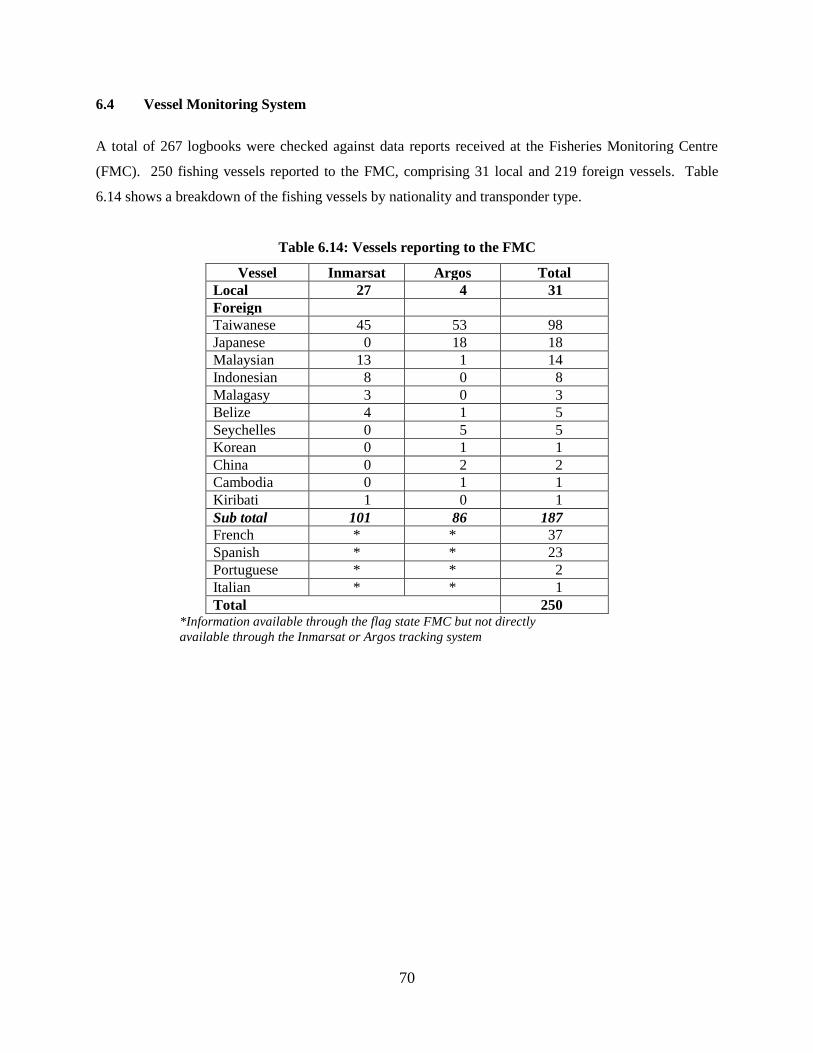
70
6.4 Vessel Monitoring System
A total of 267 logbooks were checked against data reports received at the Fisheries Monitoring Centre
(FMC). 250 fishing vessels reported to the FMC, comprising 31 local and 219 foreign vessels. Table
6.14 shows a breakdown of the fishing vessels by nationality and transponder type.
Table 6.14: Vessels reporting to the FMC
Vessel Inmarsat Argos Total
Local 27 4 31
Foreign
Taiwanese 45 53 98
Japanese 0 18 18
Malaysian 13 1 14
Indonesian 8 0 8
Malagasy 3 0 3
Belize 4 1 5
Seychelles 0 5 5
Korean 0 1 1
China 0 2 2
Cambodia 0 1 1
Kiribati 1 0 1
Sub total 101 86 187
French * * 37
Spanish * * 23
Portuguese * * 2
Italian * * 1
Total 250 *Information available through the flag state FMC but not directly
available through the Inmarsat or Argos tracking system
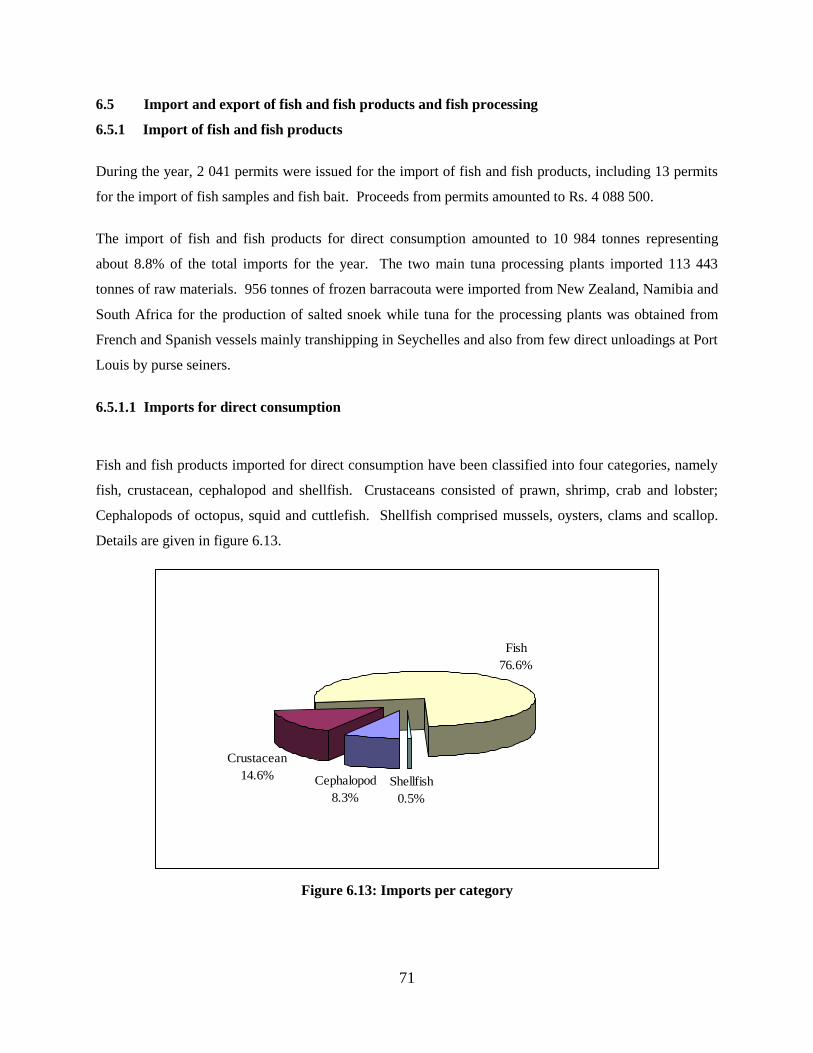
71
6.5 Import and export of fish and fish products and fish processing
6.5.1 Import of fish and fish products
During the year, 2 041 permits were issued for the import of fish and fish products, including 13 permits
for the import of fish samples and fish bait. Proceeds from permits amounted to Rs. 4 088 500.
The import of fish and fish products for direct consumption amounted to 10 984 tonnes representing
about 8.8% of the total imports for the year. The two main tuna processing plants imported 113 443
tonnes of raw materials. 956 tonnes of frozen barracouta were imported from New Zealand, Namibia and
South Africa for the production of salted snoek while tuna for the processing plants was obtained from
French and Spanish vessels mainly transhipping in Seychelles and also from few direct unloadings at Port
Louis by purse seiners.
6.5.1.1 Imports for direct consumption
Fish and fish products imported for direct consumption have been classified into four categories, namely
fish, crustacean, cephalopod and shellfish. Crustaceans consisted of prawn, shrimp, crab and lobster;
Cephalopods of octopus, squid and cuttlefish. Shellfish comprised mussels, oysters, clams and scallop.
Details are given in figure 6.13.
Cephalopod
8.3%
Crustacean
14.6%
Fish
76.6%
Shellfish
0.5%
Figure 6.13: Imports per category
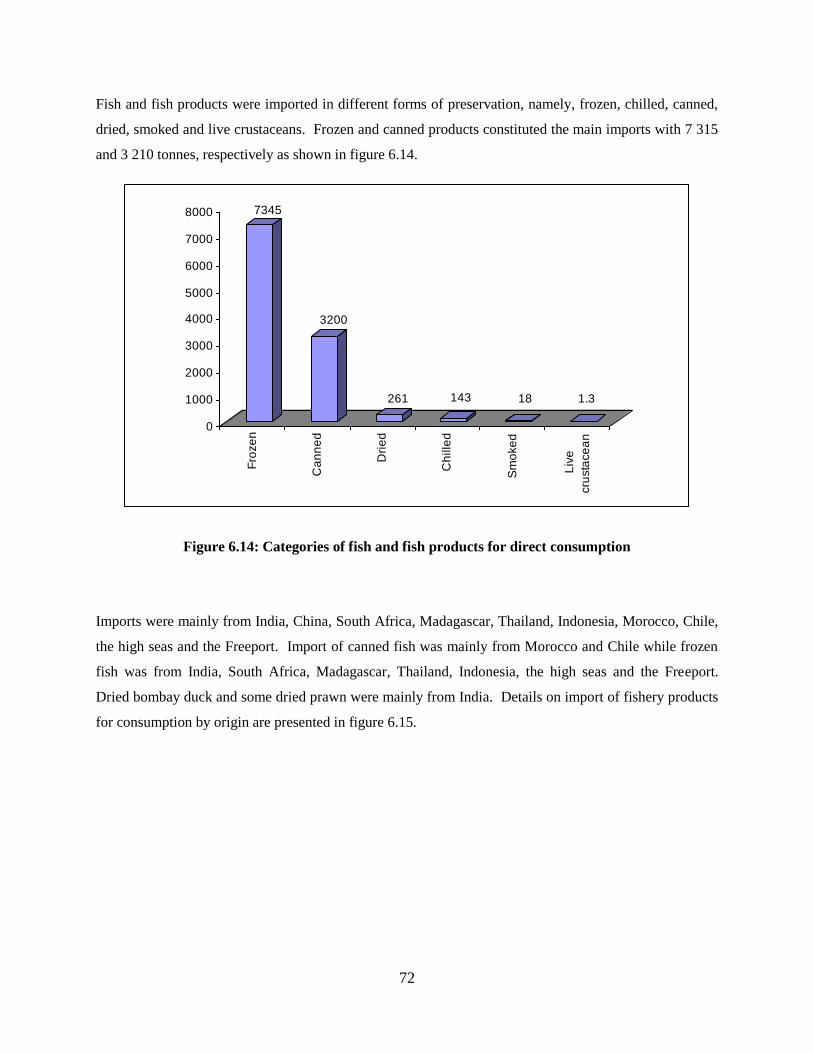
72
Fish and fish products were imported in different forms of preservation, namely, frozen, chilled, canned,
dried, smoked and live crustaceans. Frozen and canned products constituted the main imports with 7 315
and 3 210 tonnes, respectively as shown in figure 6.14.
7345
3200
261 143 18 1.3
0
1000
2000
3000
4000
5000
6000
7000
8000
Fro
ze
n
Ca
nn
ed
Dri
ed
Ch
ille
d
Sm
oke
d
Liv
e
cru
sta
ce
an
Figure 6.14: Categories of fish and fish products for direct consumption
Imports were mainly from India, China, South Africa, Madagascar, Thailand, Indonesia, Morocco, Chile,
the high seas and the Freeport. Import of canned fish was mainly from Morocco and Chile while frozen
fish was from India, South Africa, Madagascar, Thailand, Indonesia, the high seas and the Freeport.
Dried bombay duck and some dried prawn were mainly from India. Details on import of fishery products
for consumption by origin are presented in figure 6.15.
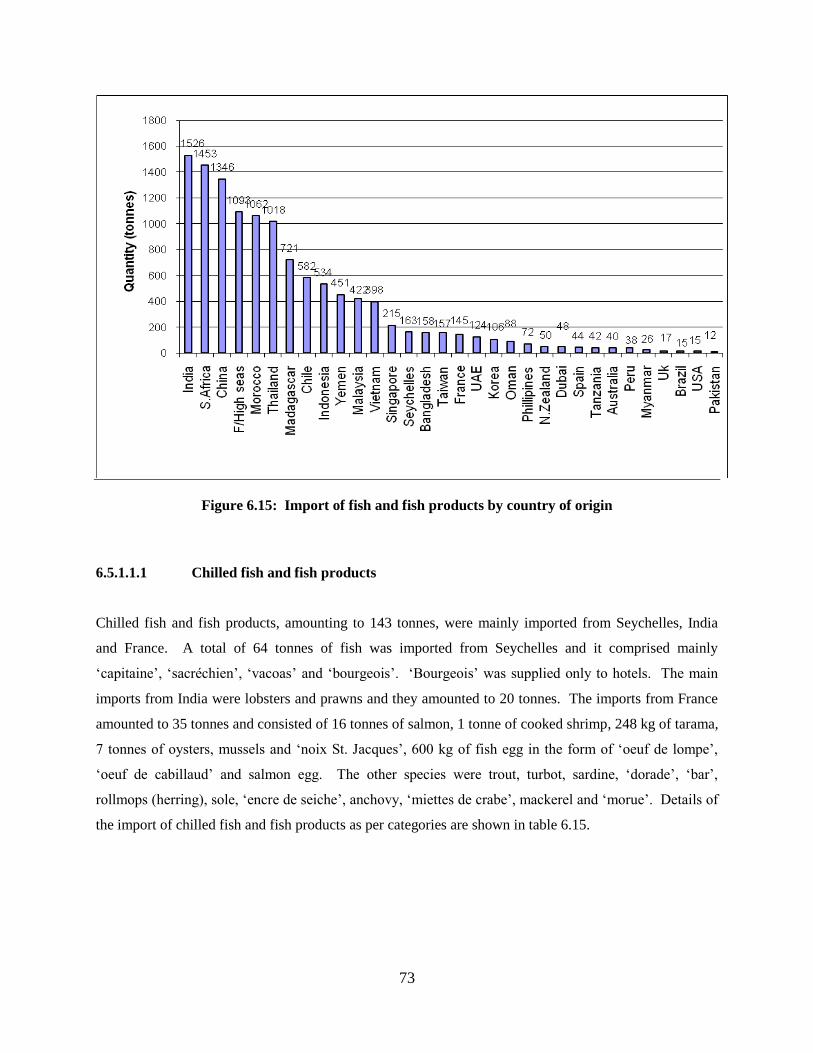
73
Figure 6.15: Import of fish and fish products by country of origin
6.5.1.1.1 Chilled fish and fish products
Chilled fish and fish products, amounting to 143 tonnes, were mainly imported from Seychelles, India
and France. A total of 64 tonnes of fish was imported from Seychelles and it comprised mainly
„capitaine‟, „sacréchien‟, „vacoas‟ and „bourgeois‟. „Bourgeois‟ was supplied only to hotels. The main
imports from India were lobsters and prawns and they amounted to 20 tonnes. The imports from France
amounted to 35 tonnes and consisted of 16 tonnes of salmon, 1 tonne of cooked shrimp, 248 kg of tarama,
7 tonnes of oysters, mussels and „noix St. Jacques‟, 600 kg of fish egg in the form of „oeuf de lompe‟,
„oeuf de cabillaud‟ and salmon egg. The other species were trout, turbot, sardine, „dorade‟, „bar‟,
rollmops (herring), sole, „encre de seiche‟, anchovy, „miettes de crabe‟, mackerel and „morue‟. Details of
the import of chilled fish and fish products as per categories are shown in table 6.15.
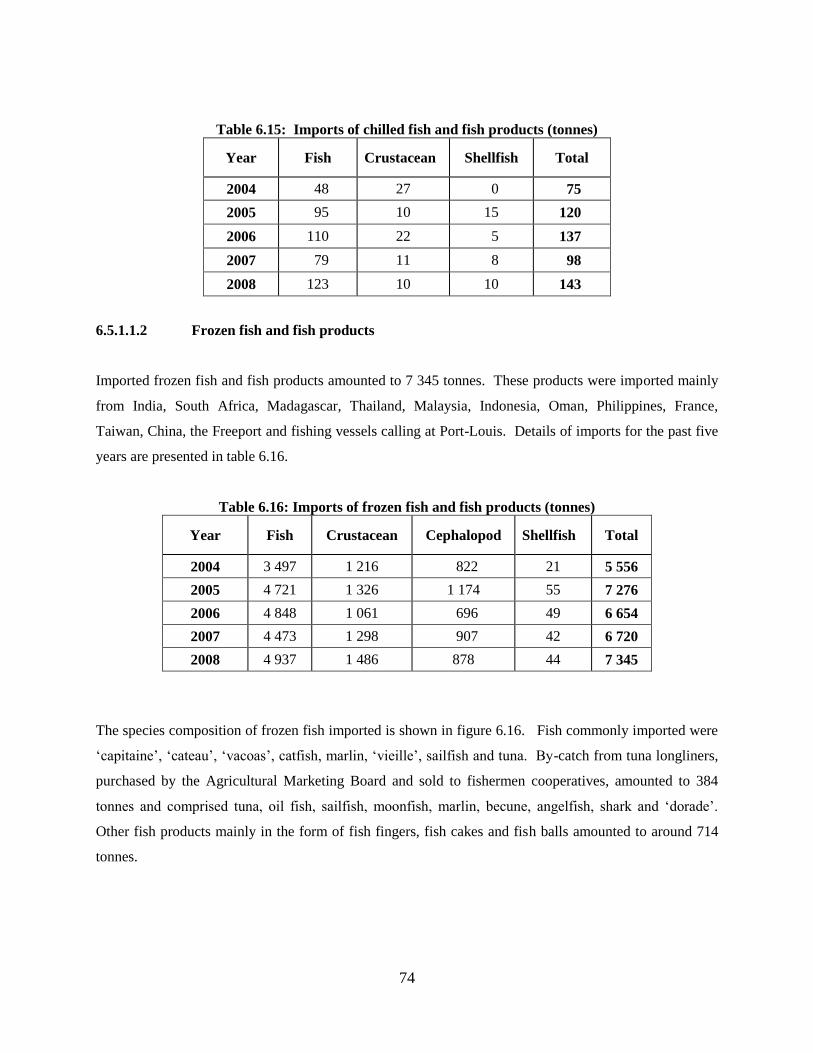
74
Table 6.15: Imports of chilled fish and fish products (tonnes)
Year Fish Crustacean Shellfish Total
2004 48 27 0 75
2005 95 10 15 120
2006 110 22 5 137
2007 79 11 8 98
2008 123 10 10 143
6.5.1.1.2 Frozen fish and fish products
Imported frozen fish and fish products amounted to 7 345 tonnes. These products were imported mainly
from India, South Africa, Madagascar, Thailand, Malaysia, Indonesia, Oman, Philippines, France,
Taiwan, China, the Freeport and fishing vessels calling at Port-Louis. Details of imports for the past five
years are presented in table 6.16.
Table 6.16: Imports of frozen fish and fish products (tonnes)
Year Fish Crustacean Cephalopod Shellfish Total
2004 3 497 1 216 822 21 5 556
2005 4 721 1 326 1 174 55 7 276
2006 4 848 1 061 696 49 6 654
2007 4 473 1 298 907 42 6 720
2008 4 937 1 486 878 44 7 345
The species composition of frozen fish imported is shown in figure 6.16. Fish commonly imported were
„capitaine‟, „cateau‟, „vacoas‟, catfish, marlin, „vieille‟, sailfish and tuna. By-catch from tuna longliners,
purchased by the Agricultural Marketing Board and sold to fishermen cooperatives, amounted to 384
tonnes and comprised tuna, oil fish, sailfish, moonfish, marlin, becune, angelfish, shark and „dorade‟.
Other fish products mainly in the form of fish fingers, fish cakes and fish balls amounted to around 714
tonnes.
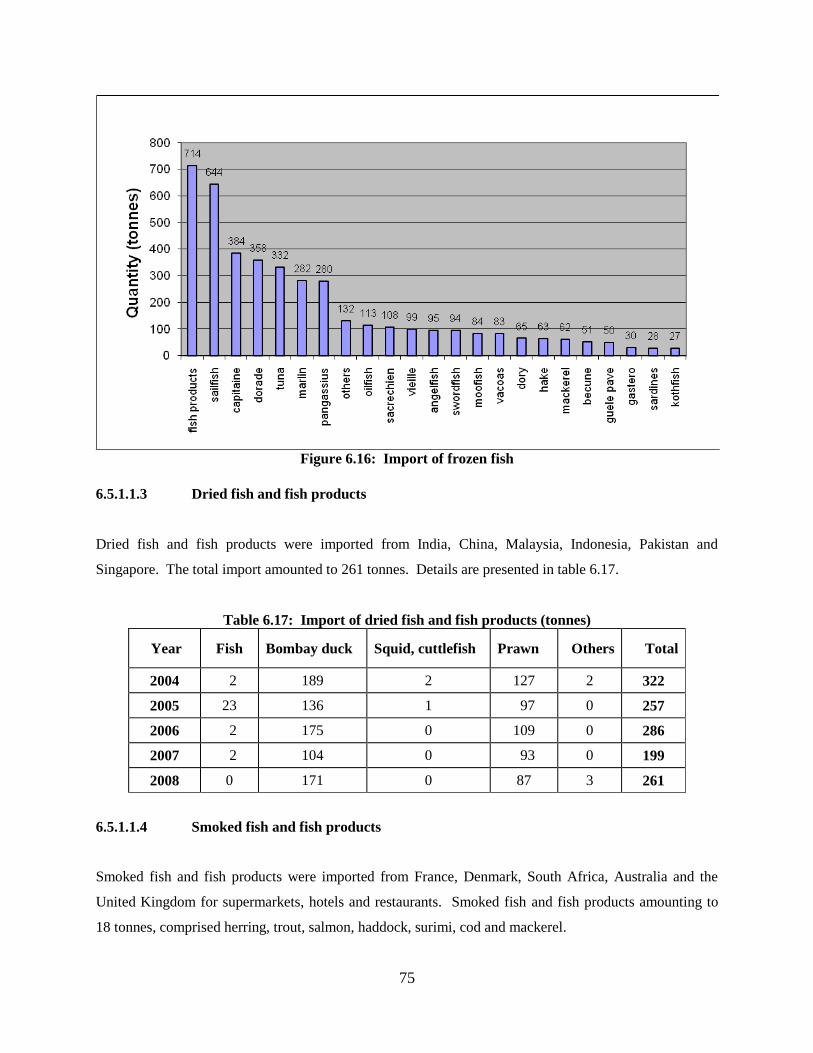
75
Figure 6.16: Import of frozen fish
6.5.1.1.3 Dried fish and fish products
Dried fish and fish products were imported from India, China, Malaysia, Indonesia, Pakistan and
Singapore. The total import amounted to 261 tonnes. Details are presented in table 6.17.
Table 6.17: Import of dried fish and fish products (tonnes)
Year Fish Bombay duck Squid, cuttlefish Prawn Others Total
2004 2 189 2 127 2 322
2005 23 136 1 97 0 257
2006 2 175 0 109 0 286
2007 2 104 0 93 0 199
2008 0 171 0 87 3 261
6.5.1.1.4 Smoked fish and fish products
Smoked fish and fish products were imported from France, Denmark, South Africa, Australia and the
United Kingdom for supermarkets, hotels and restaurants. Smoked fish and fish products amounting to
18 tonnes, comprised herring, trout, salmon, haddock, surimi, cod and mackerel.
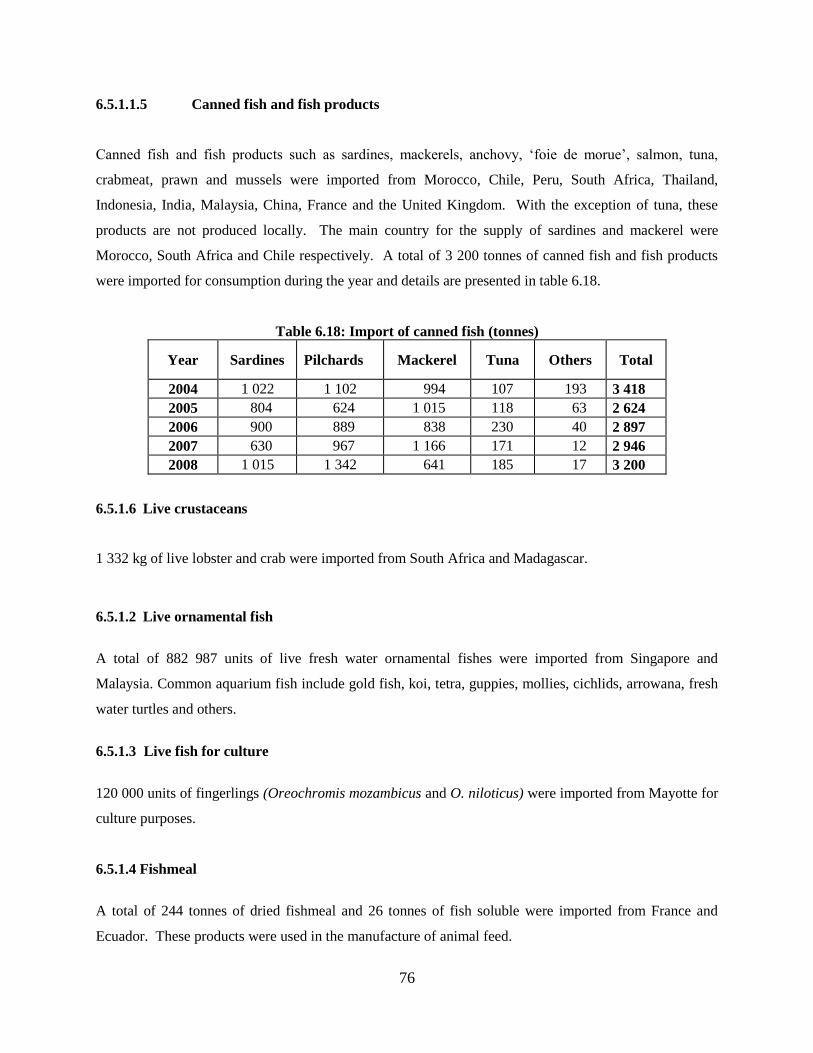
76
6.5.1.1.5 Canned fish and fish products
Canned fish and fish products such as sardines, mackerels, anchovy, „foie de morue‟, salmon, tuna,
crabmeat, prawn and mussels were imported from Morocco, Chile, Peru, South Africa, Thailand,
Indonesia, India, Malaysia, China, France and the United Kingdom. With the exception of tuna, these
products are not produced locally. The main country for the supply of sardines and mackerel were
Morocco, South Africa and Chile respectively. A total of 3 200 tonnes of canned fish and fish products
were imported for consumption during the year and details are presented in table 6.18.
Table 6.18: Import of canned fish (tonnes)
Year Sardines Pilchards Mackerel Tuna Others Total
2004 1 022 1 102 994 107 193 3 418
2005 804 624 1 015 118 63 2 624
2006 900 889 838 230 40 2 897
2007 630 967 1 166 171 12 2 946
2008 1 015 1 342 641 185 17 3 200
6.5.1.6 Live crustaceans
1 332 kg of live lobster and crab were imported from South Africa and Madagascar.
6.5.1.2 Live ornamental fish
A total of 882 987 units of live fresh water ornamental fishes were imported from Singapore and
Malaysia. Common aquarium fish include gold fish, koi, tetra, guppies, mollies, cichlids, arrowana, fresh
water turtles and others.
6.5.1.3 Live fish for culture
120 000 units of fingerlings (Oreochromis mozambicus and O. niloticus) were imported from Mayotte for
culture purposes.
6.5.1.4 Fishmeal
A total of 244 tonnes of dried fishmeal and 26 tonnes of fish soluble were imported from France and
Ecuador. These products were used in the manufacture of animal feed.
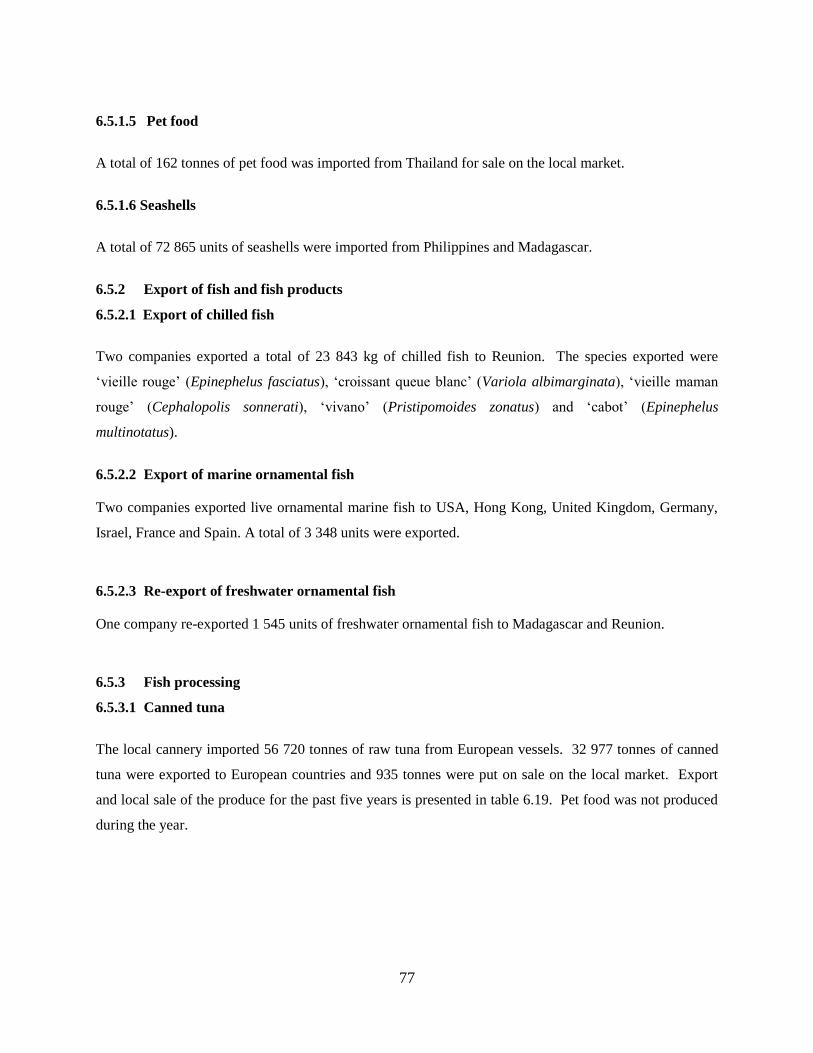
77
6.5.1.5 Pet food
A total of 162 tonnes of pet food was imported from Thailand for sale on the local market.
6.5.1.6 Seashells
A total of 72 865 units of seashells were imported from Philippines and Madagascar.
6.5.2 Export of fish and fish products
6.5.2.1 Export of chilled fish
Two companies exported a total of 23 843 kg of chilled fish to Reunion. The species exported were
„vieille rouge‟ (Epinephelus fasciatus), „croissant queue blanc‟ (Variola albimarginata), „vieille maman
rouge‟ (Cephalopolis sonnerati), „vivano‟ (Pristipomoides zonatus) and „cabot‟ (Epinephelus
multinotatus).
6.5.2.2 Export of marine ornamental fish
Two companies exported live ornamental marine fish to USA, Hong Kong, United Kingdom, Germany,
Israel, France and Spain. A total of 3 348 units were exported.
6.5.2.3 Re-export of freshwater ornamental fish
One company re-exported 1 545 units of freshwater ornamental fish to Madagascar and Reunion.
6.5.3 Fish processing
6.5.3.1 Canned tuna
The local cannery imported 56 720 tonnes of raw tuna from European vessels. 32 977 tonnes of canned
tuna were exported to European countries and 935 tonnes were put on sale on the local market. Export
and local sale of the produce for the past five years is presented in table 6.19. Pet food was not produced
during the year.
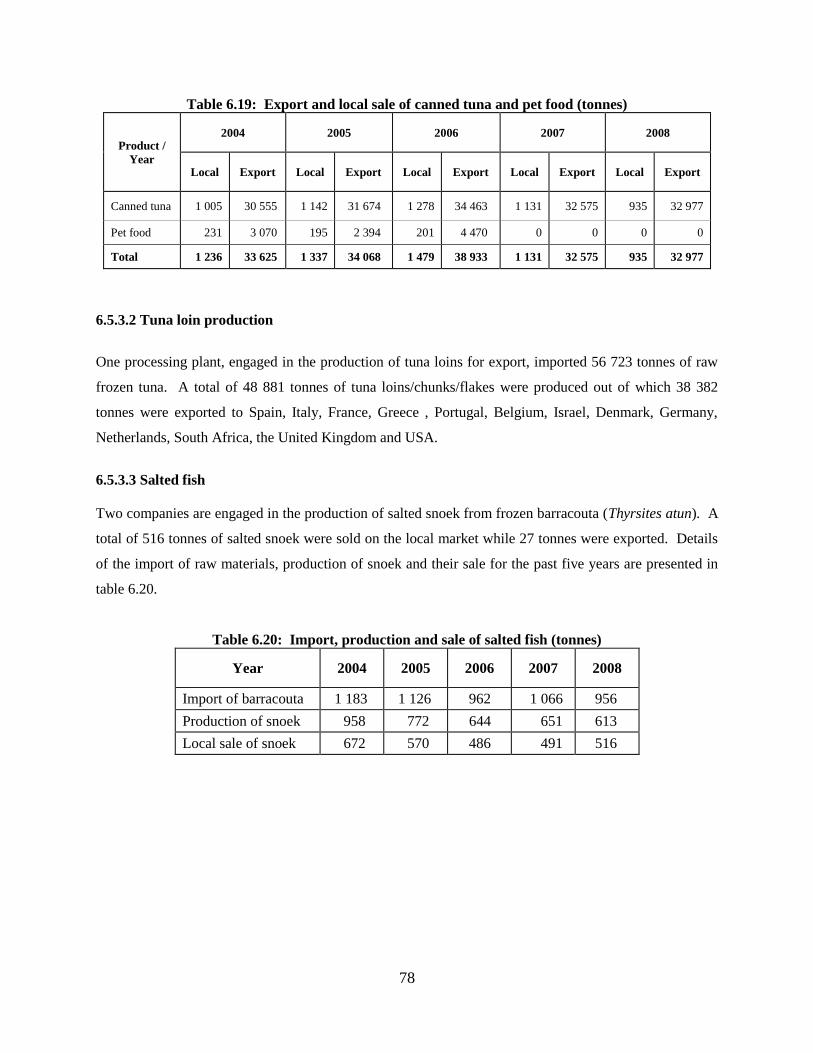
78
Table 6.19: Export and local sale of canned tuna and pet food (tonnes)
Product /
Year
2004 2005 2006 2007 2008
Local Export Local Export Local Export Local Export Local Export
Canned tuna 1 005 30 555 1 142 31 674 1 278 34 463 1 131 32 575 935 32 977
Pet food 231 3 070 195 2 394 201 4 470 0 0 0 0
Total 1 236 33 625 1 337 34 068 1 479 38 933 1 131 32 575 935 32 977
6.5.3.2 Tuna loin production
One processing plant, engaged in the production of tuna loins for export, imported 56 723 tonnes of raw
frozen tuna. A total of 48 881 tonnes of tuna loins/chunks/flakes were produced out of which 38 382
tonnes were exported to Spain, Italy, France, Greece , Portugal, Belgium, Israel, Denmark, Germany,
Netherlands, South Africa, the United Kingdom and USA.
6.5.3.3 Salted fish
Two companies are engaged in the production of salted snoek from frozen barracouta (Thyrsites atun). A
total of 516 tonnes of salted snoek were sold on the local market while 27 tonnes were exported. Details
of the import of raw materials, production of snoek and their sale for the past five years are presented in
table 6.20.
Table 6.20: Import, production and sale of salted fish (tonnes)
Year 2004 2005 2006 2007 2008
Import of barracouta 1 183 1 126 962 1 066 956
Production of snoek 958 772 644 651 613
Local sale of snoek 672 570 486 491 516
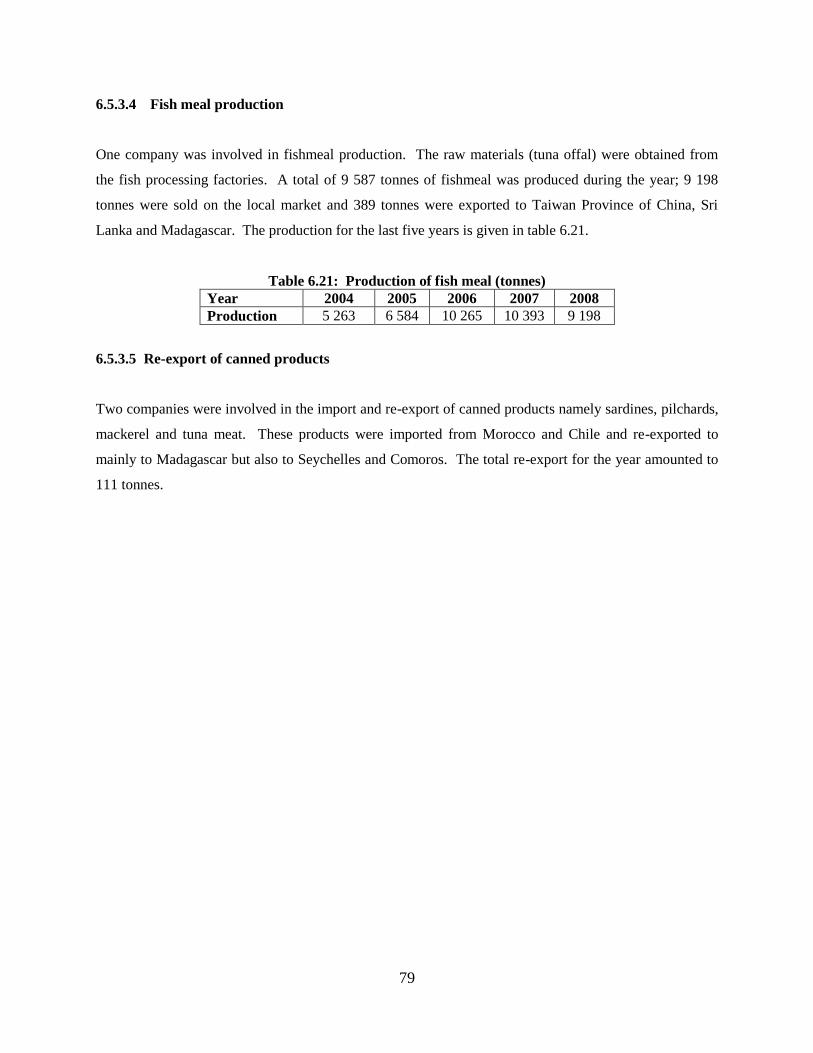
79
6.5.3.4 Fish meal production
One company was involved in fishmeal production. The raw materials (tuna offal) were obtained from
the fish processing factories. A total of 9 587 tonnes of fishmeal was produced during the year; 9 198
tonnes were sold on the local market and 389 tonnes were exported to Taiwan Province of China, Sri
Lanka and Madagascar. The production for the last five years is given in table 6.21.
Table 6.21: Production of fish meal (tonnes)
Year 2004 2005 2006 2007 2008
Production 5 263 6 584 10 265 10 393 9 198
6.5.3.5 Re-export of canned products
Two companies were involved in the import and re-export of canned products namely sardines, pilchards,
mackerel and tuna meat. These products were imported from Morocco and Chile and re-exported to
mainly to Madagascar but also to Seychelles and Comoros. The total re-export for the year amounted to
111 tonnes.
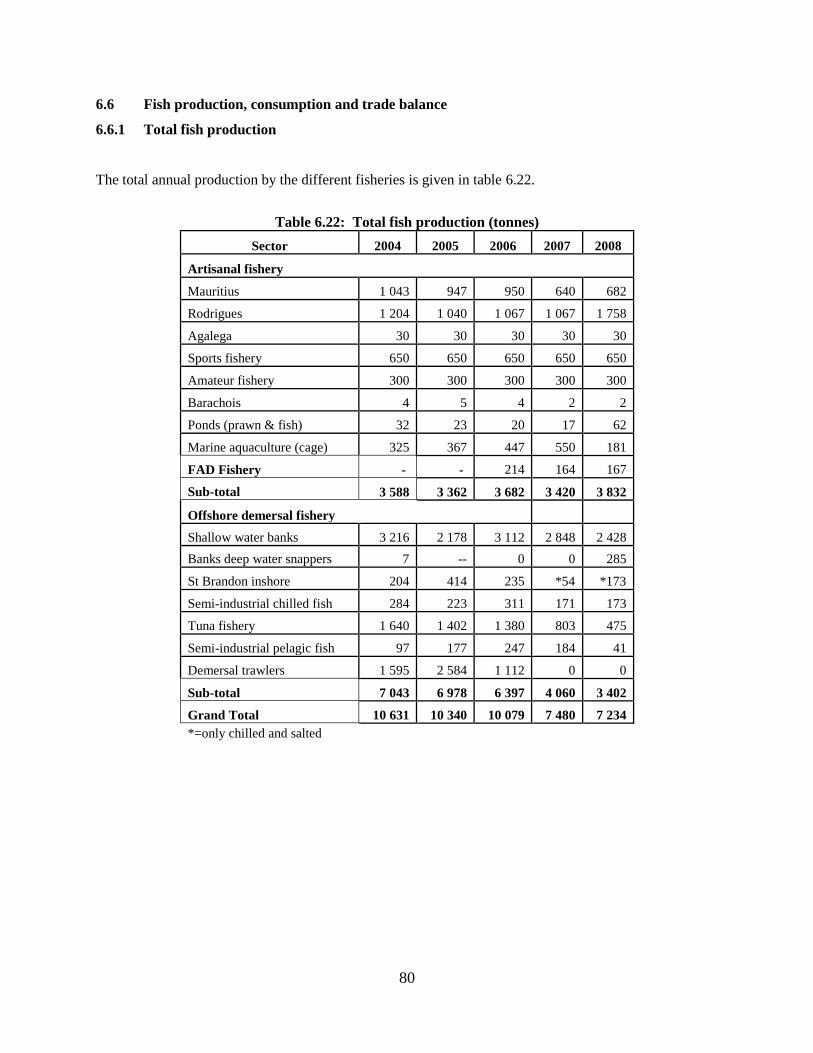
80
6.6 Fish production, consumption and trade balance
6.6.1 Total fish production
The total annual production by the different fisheries is given in table 6.22.
Table 6.22: Total fish production (tonnes)
Sector 2004 2005 2006 2007 2008
Artisanal fishery
Mauritius 1 043 947 950 640 682
Rodrigues 1 204 1 040 1 067 1 067 1 758
Agalega 30 30 30 30 30
Sports fishery 650 650 650 650 650
Amateur fishery 300 300 300 300 300
Barachois 4 5 4 2 2
Ponds (prawn & fish) 32 23 20 17 62
Marine aquaculture (cage) 325 367 447 550 181
FAD Fishery - - 214 164 167
Sub-total 3 588 3 362 3 682 3 420 3 832
Offshore demersal fishery
Shallow water banks 3 216 2 178 3 112 2 848 2 428
Banks deep water snappers 7 -- 0 0 285
St Brandon inshore 204 414 235 *54 *173
Semi-industrial chilled fish 284 223 311 171 173
Tuna fishery 1 640 1 402 1 380 803 475
Semi-industrial pelagic fish 97 177 247 184 41
Demersal trawlers 1 595 2 584 1 112 0 0
Sub-total 7 043 6 978 6 397 4 060 3 402
Grand Total 10 631 10 340 10 079 7 480 7 234
*=only chilled and salted
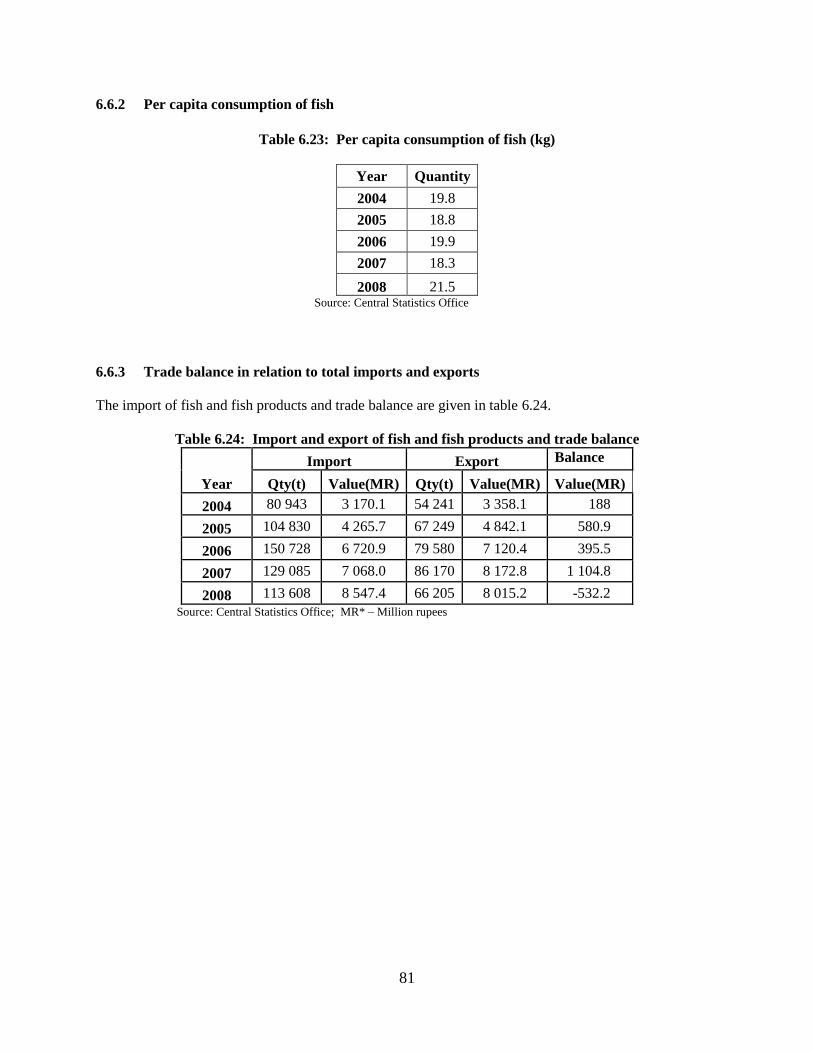
81
6.6.2 Per capita consumption of fish
Table 6.23: Per capita consumption of fish (kg)
Year Quantity
2004 19.8
2005 18.8
2006 19.9
2007 18.3
2008 21.5 Source: Central Statistics Office
6.6.3 Trade balance in relation to total imports and exports
The import of fish and fish products and trade balance are given in table 6.24.
Table 6.24: Import and export of fish and fish products and trade balance
Year
Import Export Balance
Qty(t) Value(MR) Qty(t) Value(MR) Value(MR)
2004 80 943 3 170.1 54 241 3 358.1 188
2005 104 830 4 265.7 67 249 4 842.1 580.9
2006 150 728 6 720.9 79 580 7 120.4 395.5
2007 129 085 7 068.0 86 170 8 172.8 1 104.8
2008 113 608 8 547.4 66 205 8 015.2 -532.2
Source: Central Statistics Office; MR* – Million rupees
82
7 FISHERIES PLANNING
7.1 Fisheries Sector Strategy Paper (2008 - 2015)
The Fisheries Sector Strategy Paper (2008 - 2015) was prepared and the draft submitted in December to
be included under the Agriculture Sector Strategy Plan. The main objective of the strategy plan is to
incorporate the Medium Term Expenditure Framework (MTEF) within a Programme Based Budgeting
(PBB). The activities of the Fisheries Division have been divided into two Sub-programmes with priority
objectives and outputs for the different delivery units with well defined performance indicators and
annual targets.
7.2 Regional and International Cooperation
7.2.1 Interim Economic Partnership Agreement
Mauritius initialled the interim Economic Partnership Agreement (EPA) for Eastern and Southern Africa
(ESA) on 4 December 2007 to prevent trade disruption with the European Union (EU). The Interim EPA
for the ESA configuration provides for an automatic derogation amounting to 8 000 tonnes of canned tuna
and 2 000 tonnes tuna loins for export annually to the EU and to be shared among three ESA countries
namely: Mauritius, Seychelles and Madagascar. Mauritius was granted a derogated quota of 3 000
tonnes for canned tuna and 600 tonnes for tuna loins under the European Union Council Regulation “EC
MAR 1528/2007” for a period of one year starting January 2008. The allocated quota was distributed
amongst tuna producers exporting to the European market.
7.2.2 Cooperation with Norway
An Agreement for bilateral cooperation programme over a period of three years (2008-2010) was signed
in April between the Norwegian Agency for Development Cooperation (NORAD) representing the
Kingdom of Norway and Mauritius. A financial grant to the tune of 8.85 million Norwegian Krona
(about Rs 45 million) would be made available to finance projects for sustainable utilisation of marine
living resources in the waters of Mauritius. The Institutional Cooperation Contract for implementation of
the projects was endorsed by both countries in October during the hosting of an inception workshop in
Mauritius. The workshop was attended by scientists from the Centre for Development Cooperation in
Fisheries (CDCF), Norway, to elaborate and finalise project work plans, budget, timeframe, and
milestones.
83
7.2.3 Cooperation with the Overseas Fishery Cooperation Foundation of Japan
The Overseas Fishery Cooperation Foundation (OFCF) of Japan fielded a project formulation mission in
May to investigate the possibility of providing further assistance for the rehabilitation of fisheries
facilities in Mauritius. A Memorandum of Understanding on the “Project for the Rehabilitation of
Fisheries Facilities for Fisheries Development” was thereafter signed between the Ministry and the OFCF
in August. The OFCF would offer assistance in the rehabilitation of the facilities at the FITEC, the AFRC
and the Agricultural Marketing Board. The works have been scheduled to start in January 2009.
7.2.4 Cooperation with Greece
Procedures for the construction of a fish auction market, funded by the Hellenic Republic of Greece to the
tune of Rs 25 million, were initiated. However, as the initial site was located in the buffer zone of the
Aapravasi Ghat World Heritage Site, a new site was identified at Les Salines, adjacent to the Bulk Sugar
Terminal in the port area.
7.2.5 Cooperation with Seychelles
The 8th Session of the Seychelles – Mauritius Commission on bilateral cooperation was held in Mauritius
in July. In principle Mauritius was agreeable to the proposals formulated by the Seychelles authorities
under the exchange programme in fisheries. In this respect, Mauritian and Seychelles officers would
follow attachment courses in the following fields: demersal and long line fishing, monitoring, control and
surveillance, quality control and inspection and aquaculture development.
7.2.6 Cooperation with Mozambique
Mauritius has entered into a Memorandum of Understanding with Mozambique and cooperation will start
through the dispensing of training to two Mozambican technicians in prawn and ornamental fish culture at
AFRC.
84
7.2.7 Cooperation with Pakistan
The 7th Joint Working Group (JWG) meeting was held in April in Islamabad between officials from the
Islamic Republic of Pakistan and Mauritius. The JWG reviewed progress on the implementation of the
Preferential Trade Agreement (PTA) which came into force on 20 November 2007. Based on the PTA, a
Free Trade Agreement (FTA) will be prepared to facilitate trade of products between Mauritius and
Pakistan. A Memorandum of Understanding between the two countries for the development of
cooperation in the field of fisheries has been prepared and is awaiting finalisation.
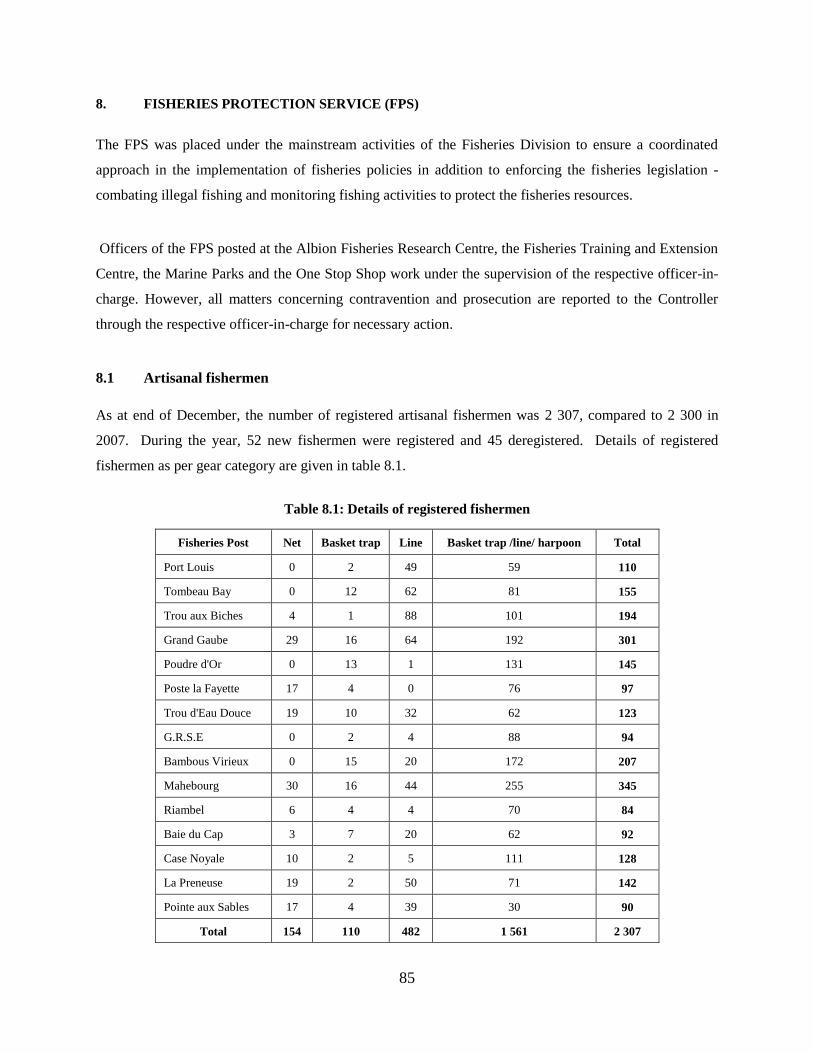
85
8. FISHERIES PROTECTION SERVICE (FPS)
The FPS was placed under the mainstream activities of the Fisheries Division to ensure a coordinated
approach in the implementation of fisheries policies in addition to enforcing the fisheries legislation -
combating illegal fishing and monitoring fishing activities to protect the fisheries resources.
Officers of the FPS posted at the Albion Fisheries Research Centre, the Fisheries Training and Extension
Centre, the Marine Parks and the One Stop Shop work under the supervision of the respective officer-in-
charge. However, all matters concerning contravention and prosecution are reported to the Controller
through the respective officer-in-charge for necessary action.
8.1 Artisanal fishermen
As at end of December, the number of registered artisanal fishermen was 2 307, compared to 2 300 in
2007. During the year, 52 new fishermen were registered and 45 deregistered. Details of registered
fishermen as per gear category are given in table 8.1.
Table 8.1: Details of registered fishermen
Fisheries Post Net Basket trap Line Basket trap /line/ harpoon Total
Port Louis 0 2 49 59 110
Tombeau Bay 0 12 62 81 155
Trou aux Biches 4 1 88 101 194
Grand Gaube 29 16 64 192 301
Poudre d'Or 0 13 1 131 145
Poste la Fayette 17 4 0 76 97
Trou d'Eau Douce 19 10 32 62 123
G.R.S.E 0 2 4 88 94
Bambous Virieux 0 15 20 172 207
Mahebourg 30 16 44 255 345
Riambel 6 4 4 70 84
Baie du Cap 3 7 20 62 92
Case Noyale 10 2 5 111 128
La Preneuse 19 2 50 71 142
Pointe aux Sables 17 4 39 30 90
Total 154 110 482 1 561 2 307
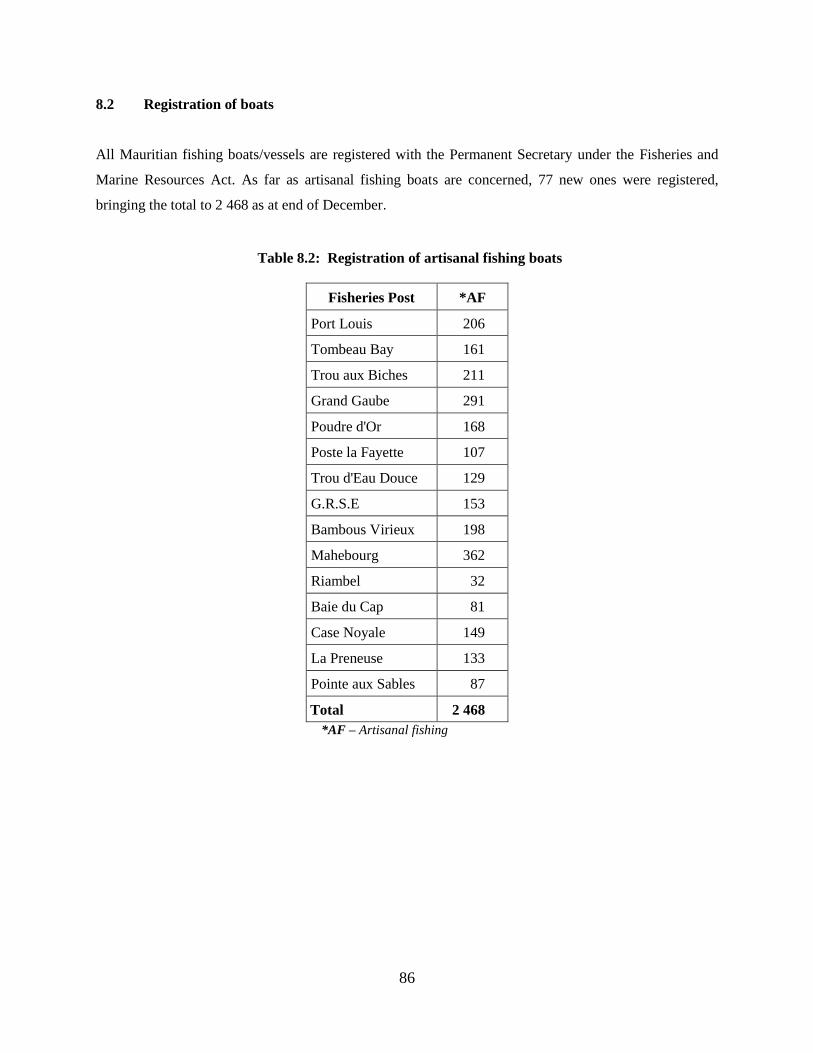
86
8.2 Registration of boats
All Mauritian fishing boats/vessels are registered with the Permanent Secretary under the Fisheries and
Marine Resources Act. As far as artisanal fishing boats are concerned, 77 new ones were registered,
bringing the total to 2 468 as at end of December.
Table 8.2: Registration of artisanal fishing boats
Fisheries Post *AF
Port Louis 206
Tombeau Bay 161
Trou aux Biches 211
Grand Gaube 291
Poudre d'Or 168
Poste la Fayette 107
Trou d'Eau Douce 129
G.R.S.E 153
Bambous Virieux 198
Mahebourg 362
Riambel 32
Baie du Cap 81
Case Noyale 149
La Preneuse 133
Pointe aux Sables 87
Total 2 468
*AF – Artisanal fishing
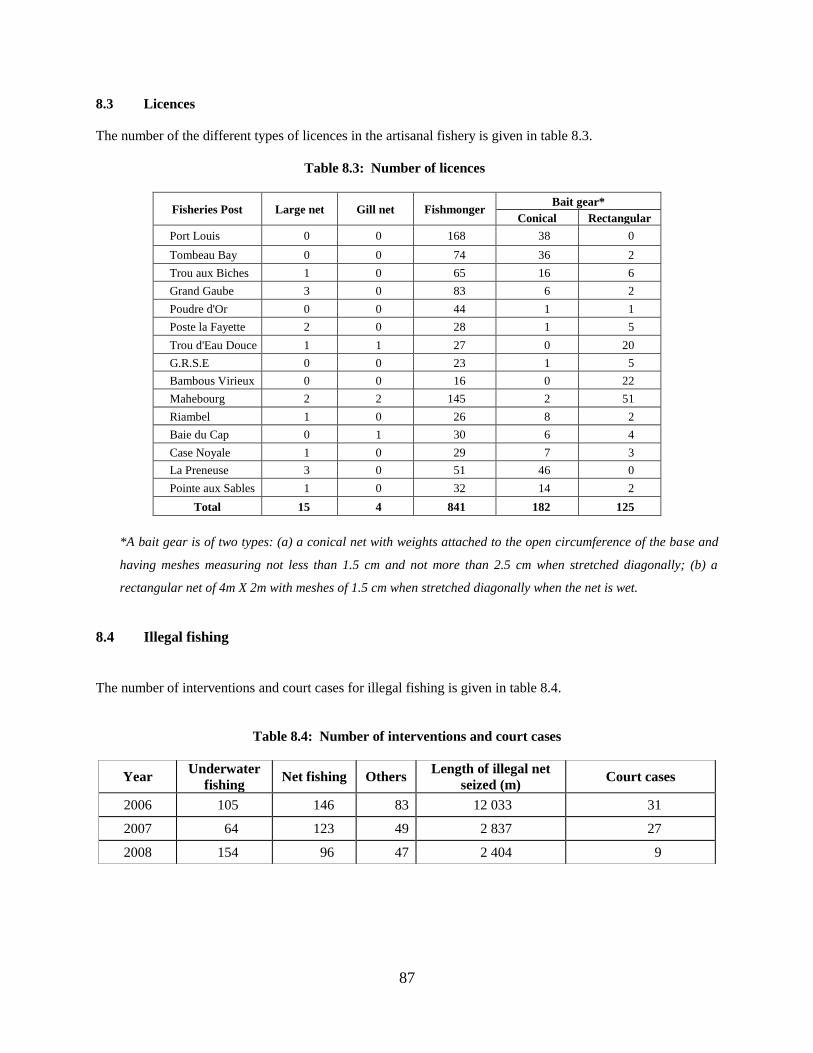
87
8.3 Licences
The number of the different types of licences in the artisanal fishery is given in table 8.3.
Table 8.3: Number of licences
Fisheries Post Large net Gill net Fishmonger Bait gear*
Conical Rectangular
Port Louis 0 0 168 38 0
Tombeau Bay 0 0 74 36 2
Trou aux Biches 1 0 65 16 6
Grand Gaube 3 0 83 6 2
Poudre d'Or 0 0 44 1 1
Poste la Fayette 2 0 28 1 5
Trou d'Eau Douce 1 1 27 0 20
G.R.S.E 0 0 23 1 5
Bambous Virieux 0 0 16 0 22
Mahebourg 2 2 145 2 51
Riambel 1 0 26 8 2
Baie du Cap 0 1 30 6 4
Case Noyale 1 0 29 7 3
La Preneuse 3 0 51 46 0
Pointe aux Sables 1 0 32 14 2
Total 15 4 841 182 125
*A bait gear is of two types: (a) a conical net with weights attached to the open circumference of the base and
having meshes measuring not less than 1.5 cm and not more than 2.5 cm when stretched diagonally; (b) a
rectangular net of 4m X 2m with meshes of 1.5 cm when stretched diagonally when the net is wet.
8.4 Illegal fishing
The number of interventions and court cases for illegal fishing is given in table 8.4.
Table 8.4: Number of interventions and court cases
Year Underwater
fishing Net fishing Others
Length of illegal net seized (m)
Court cases
2006 105 146 83 12 033 31
2007 64 123 49 2 837 27
2008 154 96 47 2 404 9
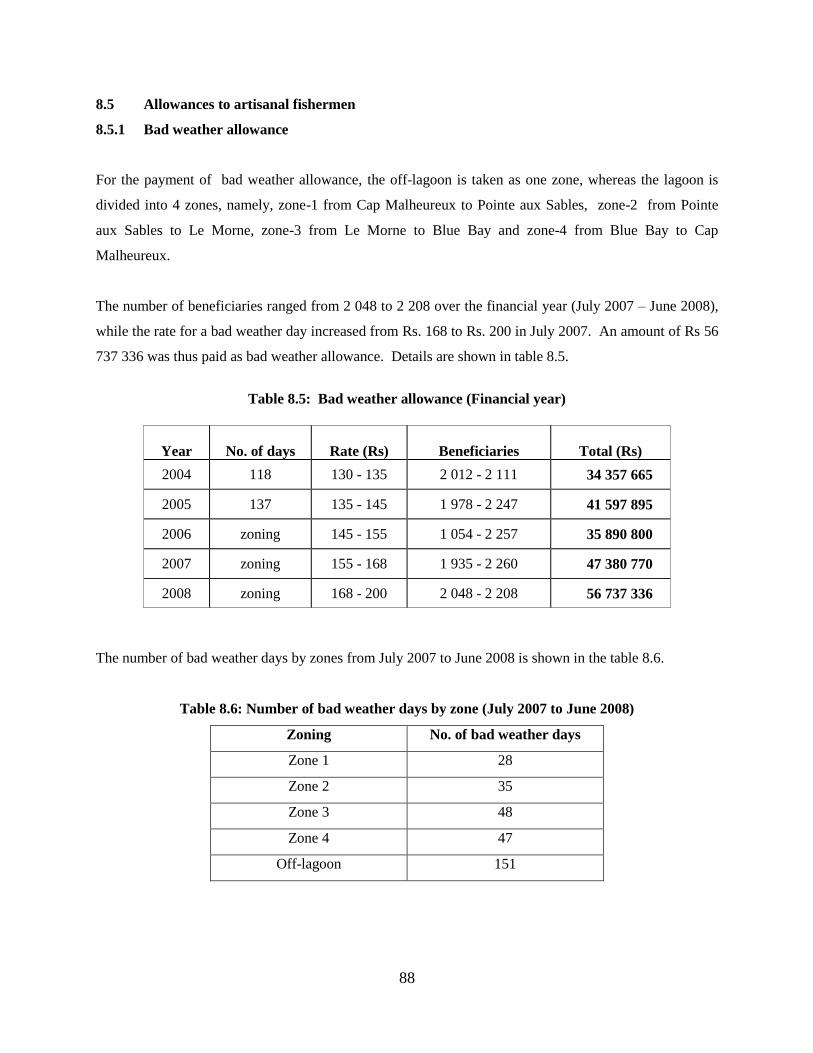
88
8.5 Allowances to artisanal fishermen
8.5.1 Bad weather allowance
For the payment of bad weather allowance, the off-lagoon is taken as one zone, whereas the lagoon is
divided into 4 zones, namely, zone-1 from Cap Malheureux to Pointe aux Sables, zone-2 from Pointe
aux Sables to Le Morne, zone-3 from Le Morne to Blue Bay and zone-4 from Blue Bay to Cap
Malheureux.
The number of beneficiaries ranged from 2 048 to 2 208 over the financial year (July 2007 – June 2008),
while the rate for a bad weather day increased from Rs. 168 to Rs. 200 in July 2007. An amount of Rs 56
737 336 was thus paid as bad weather allowance. Details are shown in table 8.5.
Table 8.5: Bad weather allowance (Financial year)
Year
No. of days
Rate (Rs)
Beneficiaries
Total (Rs)
2004 118 130 - 135 2 012 - 2 111 34 357 665
2005 137 135 - 145 1 978 - 2 247 41 597 895
2006 zoning 145 - 155 1 054 - 2 257 35 890 800
2007 zoning 155 - 168 1 935 - 2 260 47 380 770
2008 zoning 168 - 200 2 048 - 2 208 56 737 336
The number of bad weather days by zones from July 2007 to June 2008 is shown in the table 8.6.
Table 8.6: Number of bad weather days by zone (July 2007 to June 2008)
Zoning No. of bad weather days
Zone 1 28
Zone 2 35
Zone 3 48
Zone 4 47
Off-lagoon 151
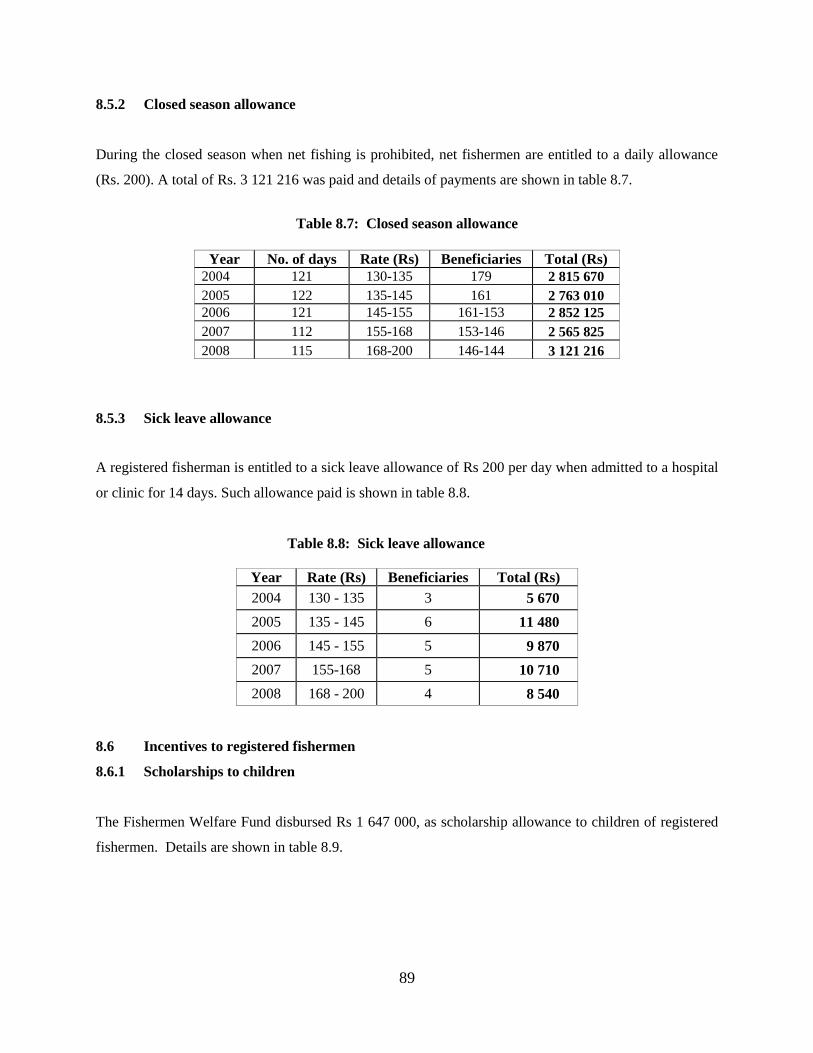
89
8.5.2 Closed season allowance
During the closed season when net fishing is prohibited, net fishermen are entitled to a daily allowance
(Rs. 200). A total of Rs. 3 121 216 was paid and details of payments are shown in table 8.7.
Table 8.7: Closed season allowance
Year No. of days Rate (Rs) Beneficiaries Total (Rs)
2004 121 130-135 179 2 815 670
2005 122 135-145 161 2 763 010
2006 121 145-155 161-153 2 852 125
2007 112 155-168 153-146 2 565 825
2008 115 168-200 146-144 3 121 216
8.5.3 Sick leave allowance
A registered fisherman is entitled to a sick leave allowance of Rs 200 per day when admitted to a hospital
or clinic for 14 days. Such allowance paid is shown in table 8.8.
Table 8.8: Sick leave allowance
Year Rate (Rs) Beneficiaries Total (Rs)
2004 130 - 135 3 5 670
2005 135 - 145 6 11 480
2006 145 - 155 5 9 870
2007 155-168 5 10 710
2008 168 - 200 4 8 540
8.6 Incentives to registered fishermen
8.6.1 Scholarships to children
The Fishermen Welfare Fund disbursed Rs 1 647 000, as scholarship allowance to children of registered
fishermen. Details are shown in table 8.9.
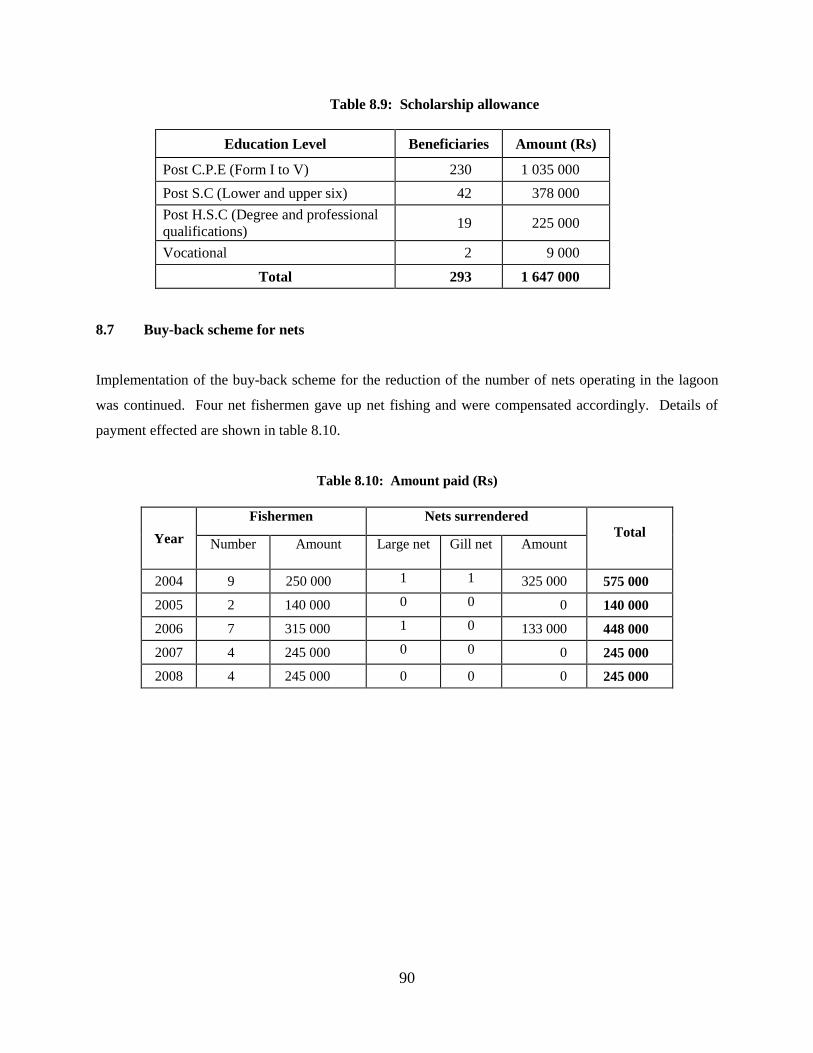
90
Table 8.9: Scholarship allowance
Education Level Beneficiaries Amount (Rs)
Post C.P.E (Form I to V) 230 1 035 000
Post S.C (Lower and upper six) 42 378 000
Post H.S.C (Degree and professional
qualifications) 19 225 000
Vocational 2 9 000
Total 293 1 647 000
8.7 Buy-back scheme for nets
Implementation of the buy-back scheme for the reduction of the number of nets operating in the lagoon
was continued. Four net fishermen gave up net fishing and were compensated accordingly. Details of
payment effected are shown in table 8.10.
Table 8.10: Amount paid (Rs)
Year
Fishermen Nets surrendered
Total Number Amount Large net Gill net Amount
2004 9 250 000 1 1 325 000 575 000
2005 2 140 000 0 0 0 140 000
2006 7 315 000 1 0 133 000 448 000
2007 4 245 000 0 0 0 245 000
2008 4 245 000 0 0 0 245 000
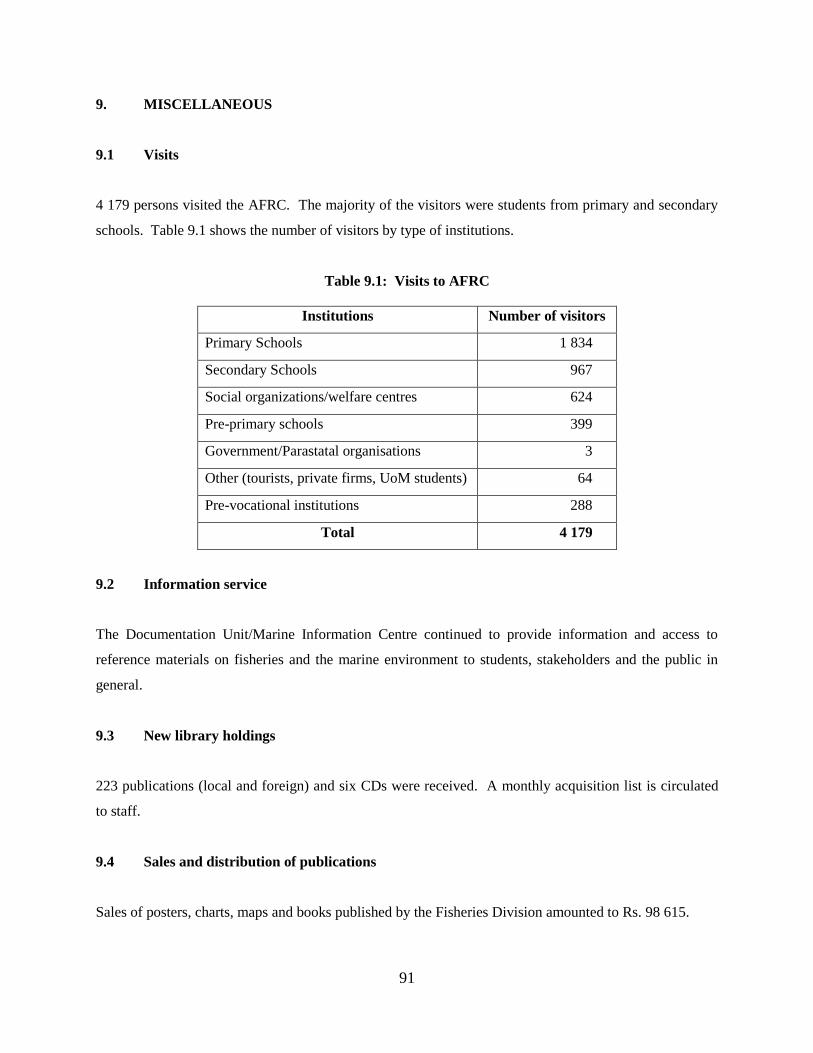
91
9. MISCELLANEOUS
9.1 Visits
4 179 persons visited the AFRC. The majority of the visitors were students from primary and secondary
schools. Table 9.1 shows the number of visitors by type of institutions.
Table 9.1: Visits to AFRC
Institutions Number of visitors
Primary Schools 1 834
Secondary Schools 967
Social organizations/welfare centres 624
Pre-primary schools 399
Government/Parastatal organisations 3
Other (tourists, private firms, UoM students) 64
Pre-vocational institutions 288
Total 4 179
9.2 Information service
The Documentation Unit/Marine Information Centre continued to provide information and access to
reference materials on fisheries and the marine environment to students, stakeholders and the public in
general.
9.3 New library holdings
223 publications (local and foreign) and six CDs were received. A monthly acquisition list is circulated
to staff.
9.4 Sales and distribution of publications
Sales of posters, charts, maps and books published by the Fisheries Division amounted to Rs. 98 615.
92
9.5 The Fisheries and Marine Resources Act
The Fisheries and Marine Resources Act was proclaimed and enforced as from 08 May.
9.6 South West Indian Ocean Fisheries Project (SWIOFP)
The SWIOFP, a regional fisheries project with nine participating countries; namely Comoros, France
(Reunion), Kenya, Madagascar, Mauritius, Mozambique, Seychelles, South Africa and Tanzania, became
effective in June.
The project aims at assessing the offshore fishery resources within the South West Indian Ocean region
and to develop institutional and human capacity. One participant from each country was trained in the
preparation of the metadata format and StatBase and Weblis softwares. The metadata would be for the
Data Gap Analysis while the Weblis software would be used for bibliographic records.
9.7 “Plan Regional de Surveillance des Peches dans le Sud-Ouest de l’Ocean Indien’’
A surveillance mission was organized in the waters of Mauritius and Madagascar from 04 to 15 February
2008. The Mission Coordination Centre (MCC) was based at the FMC and the latter was required to give
VMS information as well as weather conditions to the MCC.
A joint fisheries patrol was held in the waters of Mauritius and Seychelles from 23 to 30 May 2008. The
French PV OSIRIS equipped with French, Seychelles and Mauritian inspectors undertook a patrol
mission in the northern part of the EEZ of Mauritius. The Mission Coordination Centre [MCC] was
based at the FMC, Mauritius.
The FMC was used as the Mission Coordination Centre (MCC) from 02 to 16 October 2008. In this
connection the FMC was required to provide VMS data to the Coordination team. A joint fisheries patrol
was held in the waters of Seychelles and Mauritius using patrol boats Osiris and Guardian and the NCG
aircraft Dornier.