Embed Size (px)
Citation preview

TABLE OF
1| Company Information
3| Company Profile
5| Directors’ Review
UNCONSOLIDATED FINANCIAL INFORMATION
9| Independent Auditors’ Report to the Members
10| Condensed Interim Unconsolidated
Balance Sheet
11| Condensed Interim Unconsolidated Profit and Loss Account (Unaudited)
12| Condensed Interim Unconsolidated Statement of Comprehensive Income (Unaudited)
13| Condensed Interim Unconsolidated
Cash Flow Statement (Unaudited)
14| Condensed Interim Unconsolidated Statement of Changes in Equity (Unaudited)
15| Notes to the Condensed Interim Unconsolidated Financial Information (Unaudited)
CONSOLIDATED FINANCIAL INFORMATION
33| Condensed Interim Consolidated Balance Sheet
34| Condensed Interim Consolidated Profit and Loss Account (Unaudited)
35| Condensed Interim Consolidated
Statement of Comprehensive Income (Unaudited)
36| Condensed Interim Consolidated Cash Flow Statement (Unaudited)
37| Condensed Interim Consolidated
Statement of Changes in Equity (Unaudited)
38| Notes to the Condensed Interim Consolidated
Financial Information (Unaudited)
63|
CO
NTE
NT
COMPANY INFORMATION
BOARD OF DIRECTORS
Ahmad Waqar
Chairman, Non-Executive Director
(Independent)
Ahsan M. Saleem
Chief Executive Officer and Managing
Director
Farrukh V. Junaidy
Non-Executive Director (Independent)
NIT Nominee
Nasir Shafi
Non-Executive Director
S.M. Ehtishamullah
Non-Executive Director
Syed Zahid Hussain
Non-Executive Director (Independent)
Zahid Bashir
Non-Executive Director
COMPANY SECRETARY
Mohammad Fahad
AUDIT COMMITTEE
Syed Zahid Hussain
Chairman, Non-Executive Director
(Independent)
Farrukh V. Junaidy
Member, Non-Executive Director
(Independent)
Nasir Shafi
Member, Non-Executive Director
S.M. Ehtishamullah
Member, Non-Executive Director
HUMAN RESOURCE AND REMUNERATION COMMITTEE
Zahid Bashir
Chairman, Non-Executive Director
Nasir Shafi
Member, Non-Executive Director
S.M. Ehtishamullah
Member, Non-Executive Director
Syed Zahid Hussain
Member, Non-Executive Director
(Independent)
GOVERNANCE AND EVALUATION COMMITTEE
Ahmad Waqar
Chairman, Non-Executive Director
(Independent)
Ahsan M. Saleem
Member, Chief Executive Officer
Zahid Bashir
Member, Non-Executive Director
MANAGEMENT TEAM
Ahsan M. Saleem – 1983*
Chief Executive Officer and Managing
Director
Muhammad Saad Thaniana – 2007*
Chief Financial Officer and CEO
Shakarganj Energy (Private) Limited
and Solution De Energy (Private)
Limited
Abdul Rouf – 2000*
BU Head – Cotton Division
Arif Raza – 1985*
BU Head – Steel Division
Ehsan Durrani – 2008*
Human Resource Advisor
Hajerah A. Saleem – 2012*
BU Head - Investments and
Infrastructure Development Division
and Head of Corporate Affairs and
CEO CS Capital (Private) Limited
Hasan Altaf Saleem – 2010*
Resident Director and
COO Crescent Hadeed (Private)
Limited
Iqbal Abdulla – 2014*
IT Advisor
Iqbal Zafar Siddiqui – 2008*
Head of Supply Chain and CEO
Crescent Hadeed (Private) Limited
Mushtaque Ahmed – 1985*
Head of Manufacturing – Steel
Division
HEAD OF INTERNAL AUDIT
Muhammad Saood - 2017*
AUDITORS
EXTERNAL AUDITORS
KPMG Taseer Hadi & Co.
Chartered Accountants
INTERNAL AUDITORS
BDO Ebrahim & Co
Chartered Accountants
LEGAL ADVISOR
Hassan and Hassan, Advocates,
Lahore
A.K. Brohi & Co., Advocates,
Karachi
BANKERS
CONVENTIONAL
Allied Bank Limited
Habib Bank Limited
Habib Metropolitan Bank Limited
Industrial and Commercial Bank
of China
MCB Bank Limited
National Bank of Pakistan
Sindh Bank Limited
Summit Bank Limited
SHARIAH COMPLIANT
Al-Baraka Bank Pakistan Limited
BankIslami Pakistan Limited
Dubai Islamic Bank Pakistan
Limited
* Year of joining
Disclaimer: Other than the position of Chairman and CEO, listings are in alphabetical order.
1
SUBSIDIARIES*
Crescent Hadeed (Private)
Limited
CS Capital (Private) Limited
Shakarganj Energy (Private)
Limited
Solution de Energy (Private)
Limited
REGISTERED OFFICE
E-Floor, IT Tower, 73-E/1, Hali
Road, Gulberg-III, Lahore.
Tel: +92 42 3578 3801-03
Fax: +92 42 3578 3811
LIAISON OFFICE LAHORE
E-Floor, IT Tower, 73-E/1, Hali
Road, Gulberg-III, Lahore.
Tel: +92 42 3578 3801-03
Fax: +92 42 3578 3811
Email: ejaz.ahmed@crescent.
com.pk
PRINCIPAL OFFICE
9th Floor, Sidco Avenue Centre,
264 R.A. Lines, Karachi-74200.
Tel: +92 21 3567 4881-85
Fax: +92 21 3568 0476
Email: [email protected]
PRODUCTION SITES
STEEL DIVISION
PIPE AND COATING PLANTS
A/25, S.I.T.E., Nooriabad, District
Jamshoro, Sindh-73090.
Tel: +92 25 4670 020-22
+92 25 4670 055
Email: [email protected]
ENGINEERING UNIT
(Shakarganj Engineering)
17 Kilometer Summundri Road,
Dalowal, District Faisalabad,
Punjab.
Tel : +92 41 2569 825-26
Fax: +92 41 2679 825
CRESCENT HADEED (PRIVATE) LIMITED
59 Kilometer, Jhang Sargodha
Road, Bhone, District Jhang
Tel: +92 48 6889 210 – 12
Email: iqbal.siddiqui@crescent.
com.pk
COTTON DIVISION
CRESCENT COTTON PRODUCTS
1st Mile, Lahore Road,
Jaranwala, District Faisalabad.
Tel: +92 41 4318 061-65
Fax: +92 41 4318 066
Email: abdul.rouf@crescent.
com.pk
POWER PLANT
SHAKARGANJ ENERGY (PRIVATE)
LIMITED
57 Kilometer, Jhang Sargodha
Road, Bhone, District Jhang.
Tel: +92 48 6889 210 – 12
PUBLIC INFORMATION
Financial analysts, stock brokers,
interested investors and financial
media desiring information
regarding the Company contact
Mr. Mohammad Fahad
Manager Accounts
9th Floor, Sidco Avenue Centre,
264 R.A. Lines, Karachi-74200.
Tel: +92 21 3567 4881-85
Email:mohammad.fahad@crescen
t.com.pk
SHARE REGISTRAR ENQUIRIES CONCERNING
lost share certificates, dividend
payments, change of address,
verification of transfer deeds
and share transfers should be
directed to Company’s Share
Registrar.
M/s CorpTec Associates (Private)
Limited, 503-E Johar Town,
Lahore.
Tel: +92 42 3517 0336-37
Fax: +92 42 3517 0338
Email: [email protected]
CORPORATE WEBSITE
To visit our website, go to
www. crescent.com.pk.or scan
QR code
For condensed Interim Report
for the six months period
ended 31 December 2017, go
to
http://www.crescent.com.pk/
wp-content/uploads/2017/12/
HalfYear-Dec17.pdf or scan
Qr code
* Registered Office and Principal Office are same as holding company
2
COMPANY PROFILE
Crescent Steel and Allied
Products Limited is a
conglomerate listed on the
Pakistan Stock Exchange as
‘CSAP’. Starting commercial
operations with a line pipe
manufacturing facility in March
1987, today the company
operates businesses in
four industry segments –
engineering, textiles, capital
markets and power – spread
over six campuses in Pakistan.
The Company operates three
divisions and four wholly
owned subsidiaries (directly
and indirectly).
STEEL DIVISION – SPIRAL
PIPE PRODUCTION LINE,
PIPE COATINGS AND
FABRICATION
The Company’s Steel Division
operates two Helical Seam
Submerged Arc Welded Steel
Pipe manufacturing lines and
an external coating application
line at Nooriabad and, a
fabrication facility - Shakarganj
Engineering - in Dalowal,
Faisalabad.
The Pipe Plant manufactures
high quality steel pipes in the
diameter range of 8” – 120”
(219 mm – 3,048 mm) in wall
thickness from 4 mm – 25
mm up to lengths of 40 feet
per pipe and material grades
up to API 5L X-100. The unit
has authorization to use API
monogram of the American
Petroleum Institute (API) – the
highest international standard
accredited for quality of steel
line pipe in the Oil and Gas
Sector and also continues to
retain the ISO 9001 certification.
The Coating Plant is capable of
applying various flow efficient
and corrosion protection
coatings such as Multilayer
Polyolefin and Polypropylene
coatings, Single Layer Fusion
Bonded Epoxy coatings, Liquid
Epoxy coatings and High
Temperature Heat Shrink Tape
coatings on steel pipes ranging
from 4” – 60” (114 mm – 1,524
mm), tape coatings on pipe
diameter above 60” (1,524 mm)
and internal epoxy coatings on
diameters ranging from 8” – 60”
(219 mm – 1,524 mm).
Crescent Steel is a serious and
responsible local line pipe
manufacturer that continues to
serve as a partner in important
national energy projects with
demonstrated commitment in
terms of quality, experience,
financial strength and technical
expertise. Over the course of
the last 30 years the Company
has supplied 3,430 Km, 30%
of the national transmission
network of 11,370 Km and is
the sole operational line pipe
manufacturer in the high end
segment in the country.
The fabrication unit is engaged
in fabrication and erection
of machinery at par with
international standards and
designs, especially for sugar
and cement industry. The unit
has a wide product fabrication
capability and specializes in
the manufacture and supply
of cane shredders, juice
heaters, evaporators, batch
and continuous vacuum pans,
centrifugal machines, stainless
steel spray clusters and multi-jet
condensers, perforated plates
and vibrio screens, and high
voltage transformer tanks.
The unit has recently developed
the capability to fabricate and
erect machinery used in the
secondary steel sector and has
supplied partial fabrication for
a Continuous Caster Machine,
girders for overhead cranes
and a vibro feeder to the fully
owned subsidiary Crescent
Hadeed (Private) Limited.
COTTON DIVISION – COTTON
YARN SPINNING UNIT
The Cotton Division comprises
of one spinning unit with
19,680 spindles and is located
in Jaranwala. The unit operating
as ‘’Crescent Cotton Products’’
(CCP), has a daily production
capacity of 385 Bags of high
quality cotton/synthetic carded
yarn, in counts ranging from
10s to 31s.
CCP is a division of the
company but its operating
3
results are shown separately,
CCP as a division holds ISO
9001 Quality Management
Credentials, is registered with
Ministry of Textile Industry
Pakistan and is a member of
International Cotton Association
Limited (ICA Limited) and All
Pakistan Textile Mills Association
(APTMA). CCP produces quality
cotton/synthetic yarn with
value addition of Slub, Siro and
Compact Attachments. CCP is
equipped with modern high-
tech European and Japanese
machinery ensuring a high-
quality yarn making process,
producing various counts from
10s to 31s and has a notional
capacity (based on 20s) of 6.36
million Kgs per annum. The
brand is known for high quality
and demands a premium.
INVESTMENT AND
INFRASTRUCTURE
DEVELOPMENT DIVISION
The division manages a
portfolio of equity investments
and real estate. The portfolio is
balanced in a way that spreads
risk over a diversified spectrum
and offers potential for growth
as well as dividend yields, while
real estate investments are held
for rental as well as long term
appreciation.
SUBSIDIARY COMPANIES
CS CAPITAL (PRIVATE)
LIMITED
CS Capital (Private) Limited
is a fully owned subsidiary.
The principal activity of the
subsidiary is to manage
investment portfolios in shares,
real estate, commodities and
other securities (strategic as
well as short term).
SHAKARGANJ ENERGY
(PRIVATE) LIMITED
The company operates as
a fully owned subsidiary of
Crescent Steel and Allied
Products Limited and its
primary business is to generate,
accumulate, distribute, sell and
supply electricity to Crescent
Hadeed (Private) Limited and
to Distribution companies, as
permitted.
Initially equipped with a 15
MW co-generation, thermal
generation power plant
at Bhone, Punjab, the Unit
commenced commercial
operations in December 2014.
The Unit also employs a 16.5
MW condensing and extraction
turbine to process steam
during off-season periods to
ensure uninterrupted supply to
Crescent Hadeed throughout
the year. The Generation Plants
use bagasse in the combustion
process to produce power and
processed steam.
Solution De Energy (Private)
Limited
Solution de Energy (Private)
Limited was incorporated in
Pakistan in October 2013 as
a fully owned subsidiary of
Shakarganj Energy (Private)
Limited. The principal activity of
the Company is to build, own,
operate and maintain a 100MW
solar power project.
CRESCENT HADEED
(PRIVATE) LIMITED
Crescent Hadeed (Private)
Limited, a wholly owned
subsidiary of Crescent Steel
and Allied Products Limited,
was incorporated in May 2013
alongside Shakarganj Energy
(Private) Limited. The principal
activity of the Company is
to manufacture steel long
products. At present the
Company operates a melt shop
and billet manufacturing facility
with an annual production
capacity of 85,000 MT of steel
billets in various sizes and a
standard length of 6 meters.
The billets manufactured at our
facility are used by re-rolling
mills to manufacture rebar
and other steel long products
for use in the construction
and engineering sectors.
Successfully concluding the
trial-run in May 2016, CHL
commenced commercial
production from 1 June
2016 and is well positioned
to capture the growth in the
engineering segment.
4
DIRECTORS’ REVIEW
Dear Shareholders,
I am pleased to present the
unaudited unconsolidated and
consolidated interim financial
information of the Company and
the Group respectively for the
half year ended 31 December
2017.
Economic Outlook
Even though shifting political
winds, the economy has shown
resilience and appears poised to
turn into strong performance this
fiscal on the back of broad-based
expansions in the real and
external sectors. Improved metrics
in the agricultural sector and
manufacturing-related investment
in the industrial sector propelled
growth in the first three months of
FY 2018 (July–September).
Furthermore, exports from July
through December posted double-
digit growth over 12 months ago,
while remittances recorded a
modest expansion. These gains,
however, were more than offset
through October by strong
demand for imports. Over the
medium term, increasing
government and CPEC-related
repayment obligations highlight
the need to carefully manage
external debt, the balance of
payments and their financing
requirements, and instituting
policies to support economic
stability and make Pakistan more
competitive; hence maintaining the
long term outlook with 5% GDP
growth in FY18.
Financial and Operational
Performance
Overall financial performance
Unconsolidated results for the
period ended December 31, 2017
(HYFY18), were similar to
HYFY17 as orders in hand for the
Steel division as at the end of
June 2017 were executed during
the period under review. The
Company’s profit after tax (PAT)
amounted to Rs. 837.5 million, as
compared to after tax profit of Rs.
890.6 million in the corresponding
period last year. Earnings per
share (EPS) for the current period
stood at Rs. 10.79 as compared to
Rs. 11.47 in the corresponding
period last year.
Company’s sales revenue stood at
Rs. 6,091.7 million (HYFY17: Rs.
5,580.6 million) which mainly
represents turnover from Steel
division. Profit on investments
from IID division amounted to Rs.
434.7 million (HYFY17: Rs. 329.4
million).
Gross Profit (GP) stood at Rs.
929.4 million (HYFY17: Rs.
1,550.6 million), contributed
almost entirely by the Steel
division which posted a GP of Rs.
948.3 million (HYFY17: Rs.
1,550.5 million), while Cotton
division reported a Gross Loss of
Rs. 18.9 million (HYFY17 – GP:
Rs. 0.07 million).
The Company posted profit before
tax (PBT) of Rs. 1,053.6 million
(HYFY17: Rs. 1,171.3 million).
The Steel division’s PBT for the
period stood at Rs. 648.8 million
(HYFY17: Rs. 868.3 million)
whereas loss before tax (LBT)
from Cotton division stood at Rs.
30.0 million (HYFY17 - LBT: Rs.
26.4 million). IID posted PBT of
Rs. 329.4 million (HYFY16 - LBT
Rs. 14.7 million).
Summary of operating results
as per unconsolidated financial
information of the Company
• Sales revenue increased to Rs.
6,091.7 million as compared to
Rs. 5,580.6 million in HYFY17.
• Gross Profit stood at Rs. 1,381.3
million as compared to a gross
profit of Rs. 1,793.9 million in
HYFY17.
• Profit from Investment amounted
to Rs. 451.9 million as
compared to profit of Rs. 243.3
million in HYFY17.
• Other income decreased to Rs.
28.7 million as compared to Rs.
114.7 million in the
corresponding period last year.
• Net profit slightly decreased to
Rs. 837.5 million as compared
to Rs. 890.6 million in HYFY17.
• EBIT decreased to Rs. 1,203.9
million as compared to Rs.
1,268 million in HYFY17.
• EPS stood at Rs. 10.79 for the
current period, as compared to
EPS of Rs. 11.47 for HYFY17.
• Return on average capital
employed (annualized) was
23.86% for the current period
as compared to 23% in the
corresponding period last year.
• Break-up value per share
increased to Rs. 96.3 from Rs.
84.4 as at 30 June 2017
Business Segments
Steel segment
Segment performance
The Steel Division reported profit
before tax (PBT) of Rs. 648.8
million (HYFY17: 868.3 million).
Capacity utilization remained high
throughout the period.
Revenue amounting to Rs.
5,934.4 million was generated
during the current period, vis-à-vis
Rs. 4,954.5 million during
HYFY18. Gross Profit (GP) of Rs.
948.3 million was registered
during the period as compared to
Rs. 1,550.5 million during
HYFY17. The decrease in gross
profit was primarily on account of
increasing Hot Rolled Coils (HRC)
prices.
5

Investment and Infrastructure
Development (IID) segment
Market Review
After being Asia’s best performing
market last year, Pakistan Stock
Exchange posted a negative
return of 15% in CY17
(HYFY18:↓13%), losing 7,335
points, and was ranked as one of
the worst performing markets
globally. The benchmark index
had climbed 11% in the earlier half
of the calendar year and remained
stressed in the later half on
account of outflows by foreign
investors, mounting political and
economic uncertainty, and fears of
imminent Pak Rupee devaluation.
During the period the index hit a
low of 37,736 points, 28% down
from its peak of 52,876 points.
While liquidity remained sharp, the
market recovered c.7% to close
the year at 40,471 points. This
was likely triggered by attractive
valuations and some clarity in the
political arena.
Trading activity for Calendar year
(CY)17 remained dull as daily
average volumes recorded at 236
million shares, down 16%YoY
(HYFY18: 158 million shares,
down 59%YoY). Index volumes hit
a high of 606 million shares in May
2017 and a low of 50 million
shares in December 2017.
Foreigners remained net sellers of
USD 488 million in CY17 (6MFY18
outflow: USD 155 million). Major
sectors that experienced outflow
includes Cement (34%),
Commercial Banks (20%) and
Power Generation and Distribution
(10%). On the local front, the
foreign sell-off was majorly
absorbed by Mutual Funds
(USD216mn), Insurance
Companies (USD191mn) and
Companies (USD136mn).
Segment performance
During the half year ended 31
December 2017, the division’s
HFT segment recorded negative
ROI of 7.57% on weighted
average investments of Rs. 497.8
million – during the same period,
the benchmark KSE-100 index
decreased by 13.09%. On an
overall basis, the portfolio ROI on
marketable securities stood at -
8.52% on weighted average
investments of Rs. 6,036.3 million.
The portfolio’s accumulated profit
before tax (PBT) for the half year
ended 31 December 2017 stood at
Rs. 434.7 million against HYFY17
PBT of Rs. 329.9 million. The PBT
constitutes unrealised loss of Rs.
56.4 million and a dividend of Rs.
483.8 million on equity accounted
investments in Altern Energy
Limited (AEL)
Closing position of investment
portfolio was Rs. 5,102.6 million
as compared to Rs. 5,909.9 million
as at 30 June 2017.
Overall financial performance –
Consolidated
On consolidated basis, operating
profit before finance cost
amounted to Rs. 423.1 million
(HYFY17: Rs. 1,116.6 million).
Consolidated profit after tax and
EPS of the Group for HYFY18
amounted to Rs. 65.5 million and
Rs. 0.84 per share as compared to
profit after tax of Rs. 716.8 million
and EPS of Rs. 9.23 per share
respectively, in the corresponding
period last year.
During the period, CS Capital
(Private) Limited recorded net loss
of Rs. 18.164 million (HYFY17:
net profit Rs. 78.874 million), due
to unrealized losses on HFT
investments.
During the period, Shakarganj
Energy (Private) Limited (SEL)
reported loss of Rs. 129.5 million
(HYFY17: loss Rs. 62.9 million).
Crescent Hadeed (Private) Limited
(CHL) manufactured 21,771 tons
of billets, while it sold out 20,364
tons. During HYFY18 CHL
reported loss of Rs. 85.6 million
(HYFY17: loss Rs. 79.2 million).
However, for the month of
December 2017, the company
recorded profit of Rs 4.4 million.
Compared to the Company’s net
profit, the Group showed a
significantly lower net profit. This
is mainly due to net share of loss
amounting to Rs. 53.378 million
(HYFY17: Share of profit Rs.
122.905 million) from investment
in equity accounted investees and
elimination of dividend from AEL
amounting to Rs. 511.740 million
(HYFY17: Rs. 149.045 million).
Further, losses from wholly owned
subsidiaries also contributed
towards lower bottom line of the
group.
The value of investment portfolio
of the Group as of December 31,
2017 was Rs. 4,286.1 million as
compared to Rs. 4,713.6 million as
of June 30, 2017.
Financial Position
Balance sheet
Balance sheet footing stood of the
Company at Rs. 11,247 million as
of December 31, 2017, compared
to Rs. 12,810 million as of June
30, 2017. Break-up value per
share increased to Rs. 96.3 from
Rs. 87.8 as at June 30, 2017.
Current ratio as at December 31,
2017 increased to 1.72:1 from
1.44:1 as at 30 June 2017.
Gearing ratio decreased to 25.9%
as at December 31, 2017 from
31% as at June 30, 2017.
On a Group basis, the
consolidated balance sheet footing
stood at Rs. 12,871 million,
compared to Rs. 14,810 million as
of June 30, 2017. Total
shareholders’ fund decreased to
Rs. 8,437.5 million from Rs.
8,601.4 million as of June 30,
2017. Break-up value per share
decreased to Rs. 108.7 from Rs.
110.8 as at 30 June 2017.
6
Future Outlook
Some projects (RLNG III) were
delayed due to project approval by
Economic Coordination
Committee. These have now have
been approved and we expect
tendering soon. This would mean
idling for about a quarter after
which we expect activity to pick up
and carry on well into the next
fiscal year.
Political risks leading to execution
risks, will continue to pose
challenges. HRC prices are
showing an upward trend, which
will make it tough to maintain
margins at historical levels.
However, our focus will be to
concentrate on capacity utilization
to the fullest and capture
additional business on the basis of
marginal costing.
Outlook on the capital market
remain neutral as liquidity is strong
and market remains discounted at
a forward PE of 9.0x. Political and
economic uncertainty will continue
to keep markets under pressure
with positive medium to long term
outlook.
Achievements and Awards
Our Annual Report and Corporate
Sustainably Report are being
constantly recognized by ICAP &
ICMAP and South Asian
Federation of Accountants (SAFA)
for delivering best presented
reports, providing financial
transparency and timely
stakeholder engagement.
I am pleased to announce that we
were ranked First in the Diversified
Holdings category and Joint
Second Runner Up in the
Integrated Reporting category by
South Asian Federation of
Accountants (SAFA) under the
‘Best Presented Annual Report
Awards’ for 2016.
We also secured Third position
amongst Top 25 Companies
announced by Pakistan Stock
Exchange (PSX) for the year
2016.
I would like to thank all
stakeholders for their
patronage, and look forward for
their continued support.
Ahsan M. Saleem
Chief Executive Officer
Zahid Bashir
Director
29 January 2018
7
Crescent Steel and Allied Products Limited
CONDENSED INTERIM UNCONSOLIDATED FINANCIAL INFORMATION FOR THE SIX MONTHS ENDED 31 DECEMBER 2017
8
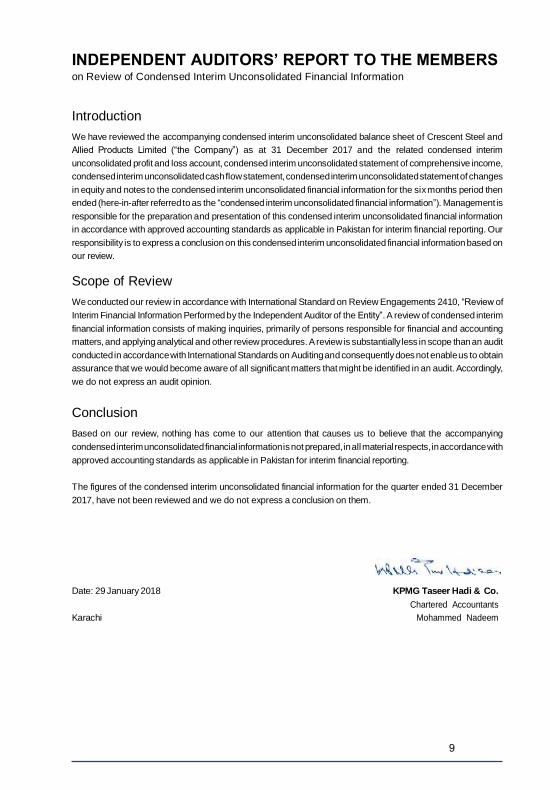
INDEPENDENT AUDITORS’ REPORT TO THE MEMBERS on Review of Condensed Interim Unconsolidated Financial Information
Introduction
We have reviewed the accompanying condensed interim unconsolidated balance sheet of Crescent Steel and
Allied Products Limited (“the Company”) as at 31 December 2017 and the related condensed interim
unconsolidated profit and loss account, condensed interim unconsolidated statement of comprehensive income,
condensed interim unconsolidated cash flow statement, condensed interim unconsolidated statement of changes
in equity and notes to the condensed interim unconsolidated financial information for the six months period then
ended (here-in-after referred to as the “condensed interim unconsolidated financial information”). Management is
responsible for the preparation and presentation of this condensed interim unconsolidated financial information
in accordance with approved accounting standards as applicable in Pakistan for interim financial reporting. Our
responsibility is to express a conclusion on this condensed interim unconsolidated financial information based on
our review.
Scope of Review
We conducted our review in accordance with International Standard on Review Engagements 2410, “Review of
Interim Financial Information Performed by the Independent Auditor of the Entity”. A review of condensed interim
financial information consists of making inquiries, primarily of persons responsible for financial and accounting
matters, and applying analytical and other review procedures. A review is substantially less in scope than an audit
conducted in accordance with International Standards on Auditing and consequently does not enable us to obtain
assurance that we would become aware of all significant matters that might be identified in an audit. Accordingly,
we do not express an audit opinion.
Conclusion
Based on our review, nothing has come to our attention that causes us to believe that the accompanying
condensed interim unconsolidated financial information is not prepared, in all material respects, in accordance with
approved accounting standards as applicable in Pakistan for interim financial reporting.
The figures of the condensed interim unconsolidated financial information for the quarter ended 31 December
2017, have not been reviewed and we do not express a conclusion on them.
Date: 29 January 2018 KPMG Taseer Hadi & Co.
Chartered Accountants
Karachi Mohammed Nadeem
9
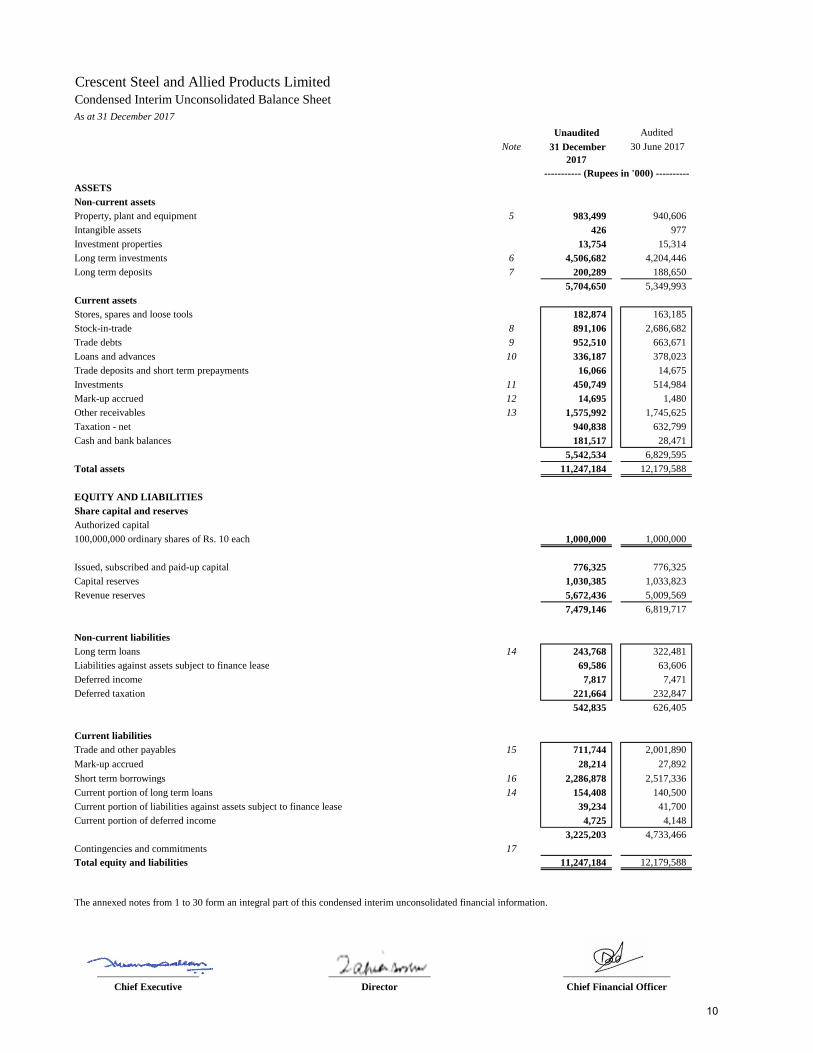
Crescent Steel and Allied Products Limited
Condensed Interim Unconsolidated Balance Sheet
As at 31 December 2017
Unaudited Audited
Note 31 December
2017
30 June 2017
ASSETS
Non-current assets
Property, plant and equipment 5 983,499 940,606
Intangible assets 426 977
Investment properties 13,754 15,314
Long term investments 6 4,506,682 4,204,446
Long term deposits 7 200,289 188,650
5,704,650 5,349,993
Current assets
Stores, spares and loose tools 182,874 163,185
Stock-in-trade 8 891,106 2,686,682
Trade debts 9 952,510 663,671
Loans and advances 10 336,187 378,023
Trade deposits and short term prepayments 16,066 14,675
Investments 11 450,749 514,984
Mark-up accrued 12 14,695 1,480
Other receivables 13 1,575,992 1,745,625
Taxation - net 940,838 632,799
Cash and bank balances 181,517 28,471
5,542,534 6,829,595
Total assets 11,247,184 12,179,588
EQUITY AND LIABILITIES
Share capital and reserves
Authorized capital
100,000,000 ordinary shares of Rs. 10 each 1,000,000 1,000,000
Issued, subscribed and paid-up capital 776,325 776,325
Capital reserves 1,030,385 1,033,823
Revenue reserves 5,672,436 5,009,569
7,479,146 6,819,717
Non-current liabilities
Long term loans 14 243,768 322,481
Liabilities against assets subject to finance lease 69,586 63,606
Deferred income 7,817 7,471
Deferred taxation 221,664 232,847
542,835 626,405
Current liabilities
Trade and other payables 15 711,744 2,001,890
Mark-up accrued 28,214 27,892
Short term borrowings 16 2,286,878 2,517,336
Current portion of long term loans 14 154,408 140,500
Current portion of liabilities against assets subject to finance lease 39,234 41,700
Current portion of deferred income 4,725 4,148
3,225,203 4,733,466
Contingencies and commitments 17
Total equity and liabilities 11,247,184 12,179,588
The annexed notes from 1 to 30 form an integral part of this condensed interim unconsolidated financial information.
____________________ ____________________ _____________________
Chief Executive Director Chief Financial Officer
----------- (Rupees in '000) ----------
10
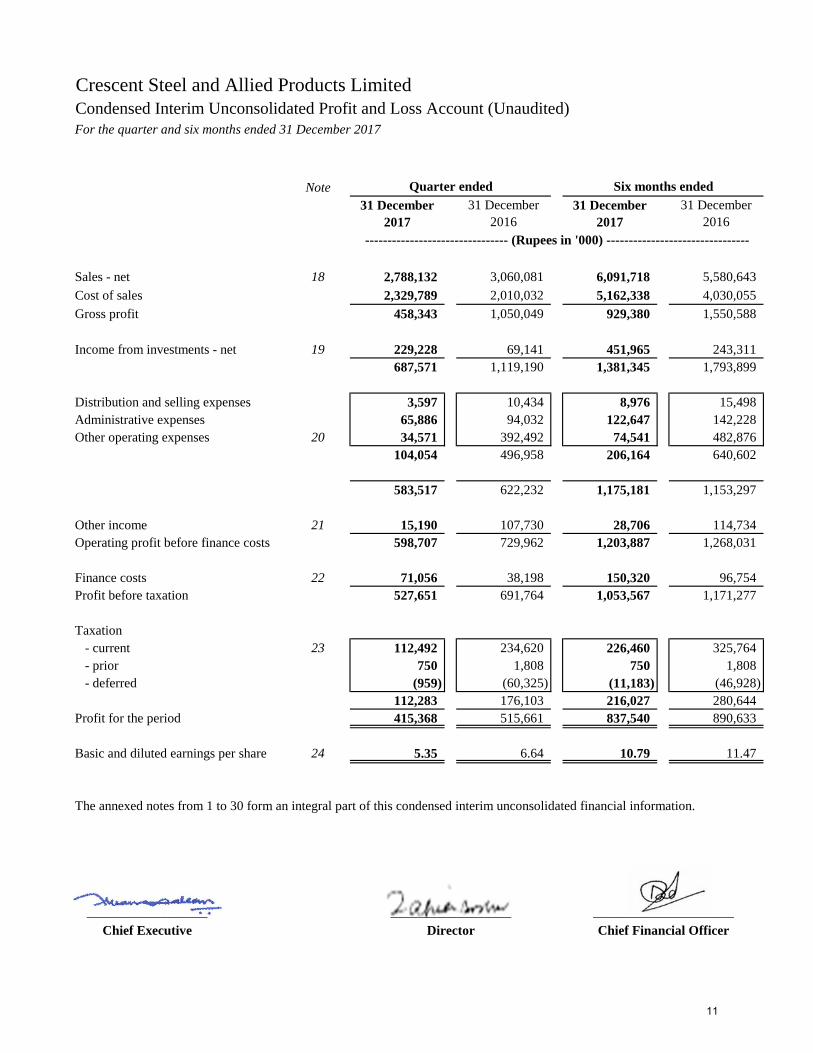
Crescent Steel and Allied Products Limited
Condensed Interim Unconsolidated Profit and Loss Account (Unaudited)
For the quarter and six months ended 31 December 2017
Note
-------------------------------- (Rupees in '000) --------------------------------
Sales - net 18 2,788,132 3,060,081 6,091,718 5,580,643
Cost of sales 2,329,789 2,010,032 5,162,338 4,030,055
Gross profit 458,343 1,050,049 929,380 1,550,588
Income from investments - net 19 229,228 69,141 451,965 243,311
687,571 1,119,190 1,381,345 1,793,899
Distribution and selling expenses 3,597 10,434 8,976 15,498
Administrative expenses 65,886 94,032 122,647 142,228
Other operating expenses 20 34,571 392,492 74,541 482,876
104,054 496,958 206,164 640,602
583,517 622,232 1,175,181 1,153,297
Other income 21 15,190 107,730 28,706 114,734
Operating profit before finance costs 598,707 729,962 1,203,887 1,268,031
Finance costs 22 71,056 38,198 150,320 96,754
Profit before taxation 527,651 691,764 1,053,567 1,171,277
Taxation
- current 23 112,492 234,620 226,460 325,764
- prior 750 1,808 750 1,808
- deferred (959) (60,325) (11,183) (46,928)
112,283 176,103 216,027 280,644
Profit for the period 415,368 515,661 837,540 890,633
Basic and diluted earnings per share 24 5.35 6.64 10.79 11.47
__________________ __________________ _____________________
Chief Executive Director Chief Financial Officer
The annexed notes from 1 to 30 form an integral part of this condensed interim unconsolidated financial information.
Quarter ended
31 December
2017
31 December
2016
Six months ended
31 December
2017
31 December
2016
11
Crescent Steel and Allied Products Limited
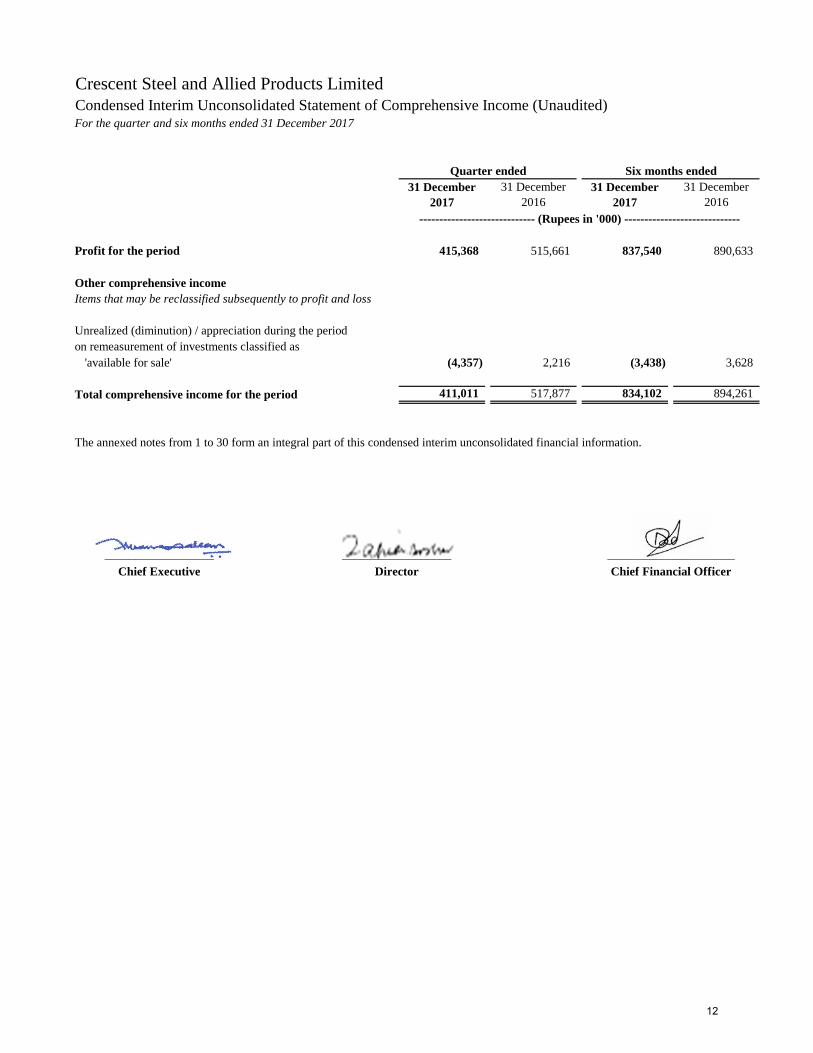
Condensed Interim Unconsolidated Statement of Comprehensive Income (Unaudited)For the quarter and six months ended 31 December 2017
----------------------------- (Rupees in '000) -----------------------------
Profit for the period 415,368 515,661 837,540 890,633
Other comprehensive income
Items that may be reclassified subsequently to profit and loss
Unrealized (diminution) / appreciation during the period
on remeasurement of investments classified as
'available for sale' (4,357) 2,216 (3,438) 3,628
Total comprehensive income for the period 411,011 517,877 834,102 894,261
__________________ __________________ _____________________
Chief Executive Director Chief Financial Officer
Quarter ended Six months ended
31 December
2017
31 December
2016
31 December
2017
31 December
2016
The annexed notes from 1 to 30 form an integral part of this condensed interim unconsolidated financial information.
12
Crescent Steel and Allied Products Limited
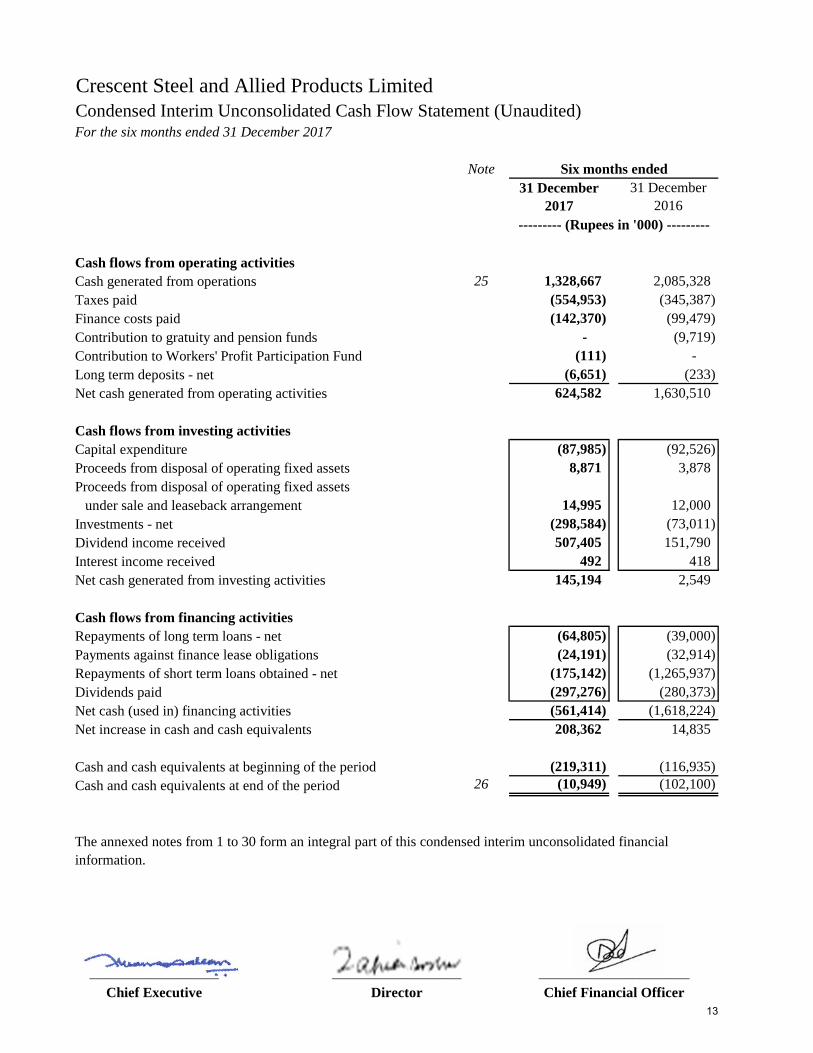
Condensed Interim Unconsolidated Cash Flow Statement (Unaudited)For the six months ended 31 December 2017
Note
Cash flows from operating activities
Cash generated from operations 25 1,328,667 2,085,328
Taxes paid (554,953) (345,387)
Finance costs paid (142,370) (99,479)
Contribution to gratuity and pension funds - (9,719)
Contribution to Workers' Profit Participation Fund (111) -
Long term deposits - net (6,651) (233)
Net cash generated from operating activities 624,582 1,630,510
Cash flows from investing activities
Capital expenditure (87,985) (92,526)
Proceeds from disposal of operating fixed assets 8,871 3,878
Proceeds from disposal of operating fixed assets
under sale and leaseback arrangement 14,995 12,000
Investments - net (298,584) (73,011)
Dividend income received 507,405 151,790
Interest income received 492 418
Net cash generated from investing activities 145,194 2,549
Cash flows from financing activities
Repayments of long term loans - net (64,805) (39,000)
Payments against finance lease obligations (24,191) (32,914)
Repayments of short term loans obtained - net (175,142) (1,265,937)
Dividends paid (297,276) (280,373)
Net cash (used in) financing activities (561,414) (1,618,224)
Net increase in cash and cash equivalents 208,362 14,835
Cash and cash equivalents at beginning of the period (219,311) (116,935)
Cash and cash equivalents at end of the period 26 (10,949) (102,100)
The annexed notes from 1 to 30 form an integral part of this condensed interim unconsolidated financial
information.
__________________ __________________ _____________________
Chief Executive Director Chief Financial Officer
31 December
2017
31 December
2016
Six months ended
--------- (Rupees in '000) ---------
13
Crescent Steel and Allied Products Limited
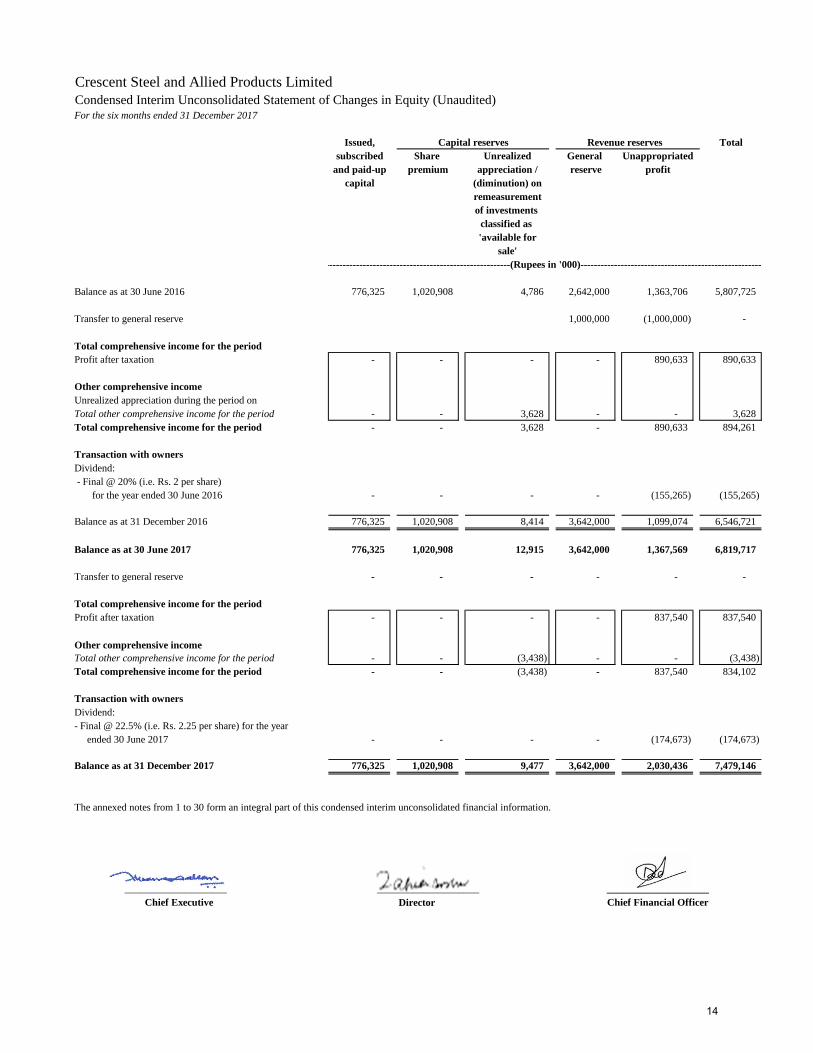
Condensed Interim Unconsolidated Statement of Changes in Equity (Unaudited)For the six months ended 31 December 2017
Issued, Total
subscribed Share Unrealized General
and paid-up premium appreciation / reserve profit
capital (diminution) on
remeasurement
of investments
classified as
'available for
sale'
Balance as at 30 June 2016 776,325 1,020,908 4,786 2,642,000 1,363,706 5,807,725
Transfer to general reserve 1,000,000 (1,000,000) -
Total comprehensive income for the period
Profit after taxation - - - - 890,633 890,633
Other comprehensive income
Unrealized appreciation during the period on
Total other comprehensive income for the period - - 3,628 - - 3,628
Total comprehensive income for the period - - 3,628 - 890,633 894,261
Transaction with owners
Dividend:
- Final @ 20% (i.e. Rs. 2 per share)
for the year ended 30 June 2016 - - - - (155,265) (155,265)
Balance as at 31 December 2016 776,325 1,020,908 8,414 3,642,000 1,099,074 6,546,721
Balance as at 30 June 2017 776,325 1,020,908 12,915 3,642,000 1,367,569 6,819,717
Transfer to general reserve - - - - - -
Total comprehensive income for the period
Profit after taxation - - - - 837,540 837,540
Other comprehensive income
Total other comprehensive income for the period - - (3,438) - - (3,438)
Total comprehensive income for the period - - (3,438) - 837,540 834,102
Transaction with owners
Dividend:
- Final @ 22.5% (i.e. Rs. 2.25 per share) for the year
ended 30 June 2017 - - - - (174,673) (174,673)
Balance as at 31 December 2017 776,325 1,020,908 9,477 3,642,000 2,030,436 7,479,146
The annexed notes from 1 to 30 form an integral part of this condensed interim unconsolidated financial information.
____________________ ____________________ ____________________
Chief Executive Director Chief Financial Officer
Revenue reservesCapital reserves
---------------------------------------------------------(Rupees in '000)---------------------------------------------------------
Unappropriated
14
Crescent Steel and Allied Products Limited
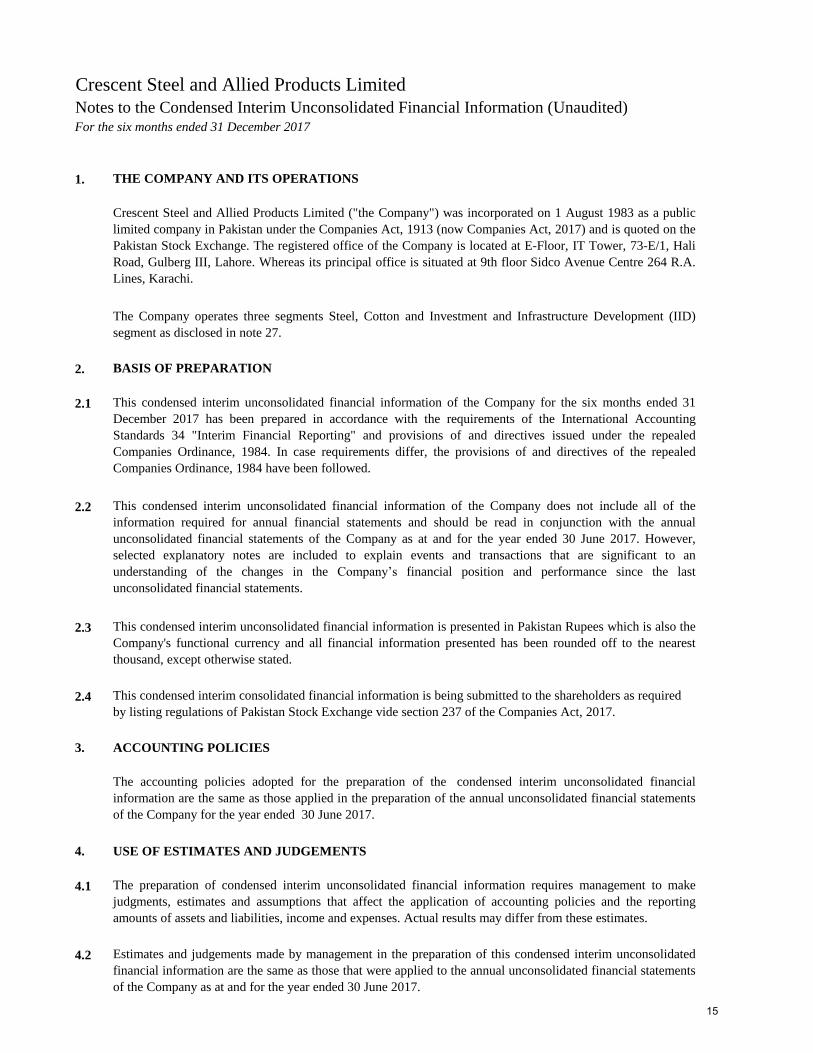
Notes to the Condensed Interim Unconsolidated Financial Information (Unaudited)For the six months ended 31 December 2017
1. THE COMPANY AND ITS OPERATIONS
2. BASIS OF PREPARATION
2.1
2.2
2.3
2.4
3. ACCOUNTING POLICIES
4. USE OF ESTIMATES AND JUDGEMENTS
4.1
4.2 Estimates and judgements made by management in the preparation of this condensed interim unconsolidated
financial information are the same as those that were applied to the annual unconsolidated financial statements
of the Company as at and for the year ended 30 June 2017.
The preparation of condensed interim unconsolidated financial information requires management to make
judgments, estimates and assumptions that affect the application of accounting policies and the reporting
amounts of assets and liabilities, income and expenses. Actual results may differ from these estimates.
Crescent Steel and Allied Products Limited ("the Company") was incorporated on 1 August 1983 as a public
limited company in Pakistan under the Companies Act, 1913 (now Companies Act, 2017) and is quoted on the
Pakistan Stock Exchange. The registered office of the Company is located at E-Floor, IT Tower, 73-E/1, Hali
Road, Gulberg III, Lahore. Whereas its principal office is situated at 9th floor Sidco Avenue Centre 264 R.A.
Lines, Karachi.
This condensed interim unconsolidated financial information of the Company for the six months ended 31
December 2017 has been prepared in accordance with the requirements of the International Accounting
Standards 34 "Interim Financial Reporting" and provisions of and directives issued under the repealed
Companies Ordinance, 1984. In case requirements differ, the provisions of and directives of the repealed
Companies Ordinance, 1984 have been followed.
This condensed interim unconsolidated financial information is presented in Pakistan Rupees which is also the
Company's functional currency and all financial information presented has been rounded off to the nearest
thousand, except otherwise stated.
The accounting policies adopted for the preparation of the condensed interim unconsolidated financial
information are the same as those applied in the preparation of the annual unconsolidated financial statements
of the Company for the year ended 30 June 2017.
This condensed interim unconsolidated financial information of the Company does not include all of the
information required for annual financial statements and should be read in conjunction with the annual
unconsolidated financial statements of the Company as at and for the year ended 30 June 2017. However,
selected explanatory notes are included to explain events and transactions that are significant to an
understanding of the changes in the Company’s financial position and performance since the last
unconsolidated financial statements.
The Company operates three segments Steel, Cotton and Investment and Infrastructure Development (IID)
segment as disclosed in note 27.
This condensed interim consolidated financial information is being submitted to the shareholders as required
by listing regulations of Pakistan Stock Exchange vide section 237 of the Companies Act, 2017.
15
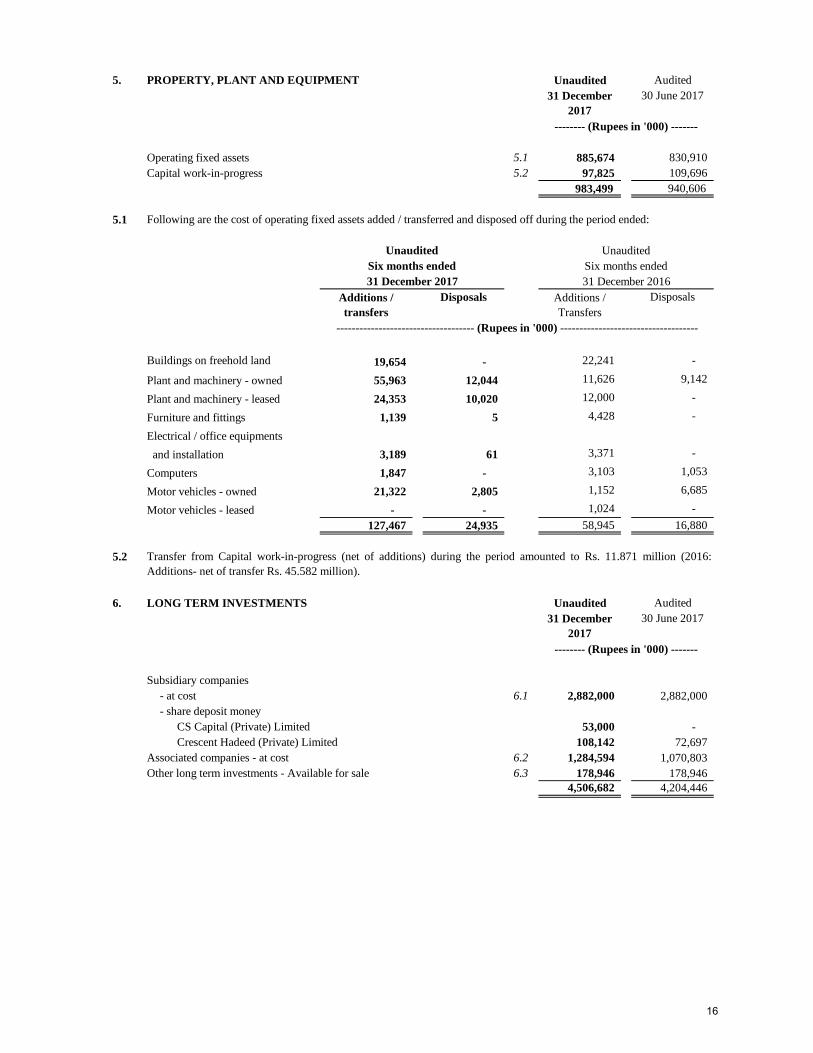
5. PROPERTY, PLANT AND EQUIPMENT Unaudited Audited
Operating fixed assets 5.1 885,674 830,910
Capital work-in-progress 5.2 97,825 109,696
983,499 940,606
5.1
Buildings on freehold land 19,654 - 22,241 -
Plant and machinery - owned 55,963 12,044 11,626 9,142
Plant and machinery - leased 24,353 10,020 12,000 -
Furniture and fittings 1,139 5 4,428 -
Electrical / office equipments
and installation 3,189 61 3,371 -
Computers 1,847 - 3,103 1,053
Motor vehicles - owned 21,322 2,805 1,152 6,685
Motor vehicles - leased - - 1,024 -
127,467 24,935 58,945 16,880
5.2
6. LONG TERM INVESTMENTS Unaudited Audited
Subsidiary companies
- at cost 6.1 2,882,000 2,882,000
- share deposit money
CS Capital (Private) Limited 53,000 -
Crescent Hadeed (Private) Limited 108,142 72,697
Associated companies - at cost 6.2 1,284,594 1,070,803
Other long term investments - Available for sale 6.3 178,946 178,946
4,506,682 4,204,446
30 June 2017
-------- (Rupees in '000) -------
Six months ended
Following are the cost of operating fixed assets added / transferred and disposed off during the period ended:
Unaudited Unaudited
31 December
2017
30 June 2017
-------- (Rupees in '000) -------
Six months ended
Additions /
transfers
Additions /
Transfers
Disposals Disposals
31 December 2017 31 December 2016
------------------------------------ (Rupees in '000) ------------------------------------
Transfer from Capital work-in-progress (net of additions) during the period amounted to Rs. 11.871 million (2016:
Additions- net of transfer Rs. 45.582 million).
31 December
2017
16

6.1 Subsidiary companies - at cost
Unaudited Audited Unaudited Audited
(Number of shares) Unquoted
126,000,000 126,000,000 Shakarganj Energy (Private) Limited 6.1.1 1,260,000 1,260,000
(Chief Executive Officer -
Mr. Muhammad Saad Thaniana)
47,200,000 47,200,000 CS Capital (Private) Limited 6.1.2 472,000 472,000
(Chief Executive Officer -
Ms. Hajerah Ahsan Saleem)
115,000,000 11,500,000 Crescent Hadeed (Private) Limited 6.1.3 1,150,000 1,150,000
(Chief Executive Officer -
Mr. Iqbal Zafar Siddiqui)
2 2 Crescent Continental Gas Pipelines 6.1.4 - -
Limited (US $ 1 each)
2,882,000 2,882,000
6.1.1
6.1.2
6.1.3
6.1.4
6.2 Associates - at cost
Unaudited Audited Unaudited Audited
(Number of shares)
Quoted
60,475,416 60,475,416 Altern Energy Limited 6.2.1 593,488 593,488
(Chief Executive Officer -
Mr. Taimur Dawood)
27,409,075 24,119,987 Shakarganj Limited 6.2.2 691,106 477,315
(Chief Executive Officer -
Mr. Anjum M. Saleem)
1,284,594 1,070,803
This represents the Company's investment in 100% ordinary shares of CS Capital (Private) Limited. The Company has
acquired CS Capital (Private) Limited on 26 September 2011.
This represents the Company's investment in 100% ordinary shares of Crescent Hadeed (Private) Limited which was
incorporated on 15 May 2013.
This represents investment in subsidiary of Rs. 90 only. The subsidiary company has not commenced operation and
accordingly no financial statements have been prepared.
31 December
2017
30 June 2017
-------- (Rupees in '000) -------
-------- (Rupees in '000) --------
31 December
2017
30 June 2017 31 December
2017
30 June 2017
31 December
2017
This represents the Company's investment in 100% ordinary shares of Shakarganj Energy (Private) Limited. The
Company has acquired Shakarganj Energy (Private) Limited on 4 January 2010.
30 June 2017
17
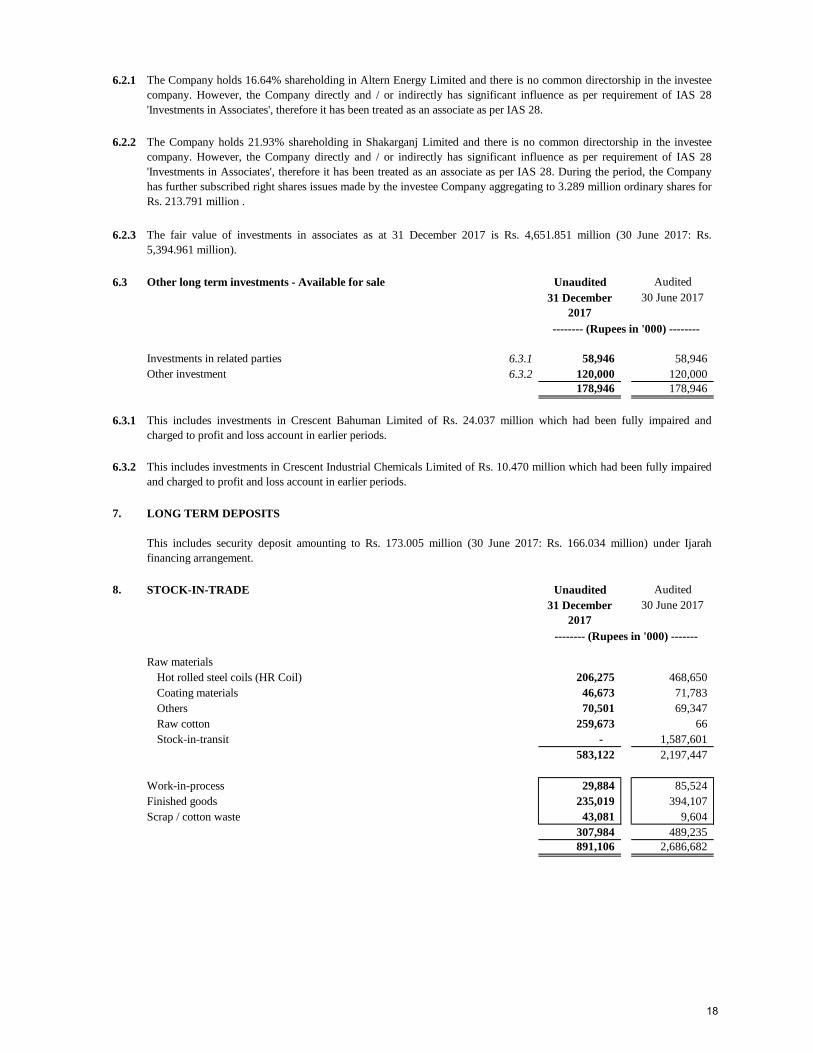
6.2.1
6.2.2
6.2.3
6.3 Other long term investments - Available for sale Unaudited Audited
Investments in related parties 6.3.1 58,946 58,946
Other investment 6.3.2 120,000 120,000
178,946 178,946
6.3.1
6.3.2
7. LONG TERM DEPOSITS
8. STOCK-IN-TRADE Unaudited Audited
Raw materials
Hot rolled steel coils (HR Coil) 206,275 468,650
Coating materials 46,673 71,783
Others 70,501 69,347
Raw cotton 259,673 66
Stock-in-transit - 1,587,601
583,122 2,197,447
Work-in-process 29,884 85,524
Finished goods 235,019 394,107
Scrap / cotton waste 43,081 9,604
307,984 489,235
891,106 2,686,682
30 June 2017
-------- (Rupees in '000) --------
31 December
2017
The fair value of investments in associates as at 31 December 2017 is Rs. 4,651.851 million (30 June 2017: Rs.
5,394.961 million).
The Company holds 16.64% shareholding in Altern Energy Limited and there is no common directorship in the investee
company. However, the Company directly and / or indirectly has significant influence as per requirement of IAS 28
'Investments in Associates', therefore it has been treated as an associate as per IAS 28.
The Company holds 21.93% shareholding in Shakarganj Limited and there is no common directorship in the investee
company. However, the Company directly and / or indirectly has significant influence as per requirement of IAS 28
'Investments in Associates', therefore it has been treated as an associate as per IAS 28. During the period, the Company
has further subscribed right shares issues made by the investee Company aggregating to 3.289 million ordinary shares for
Rs. 213.791 million .
30 June 2017
-------- (Rupees in '000) -------
31 December
2017
This includes security deposit amounting to Rs. 173.005 million (30 June 2017: Rs. 166.034 million) under Ijarah
financing arrangement.
This includes investments in Crescent Bahuman Limited of Rs. 24.037 million which had been fully impaired and
charged to profit and loss account in earlier periods.
This includes investments in Crescent Industrial Chemicals Limited of Rs. 10.470 million which had been fully impaired
and charged to profit and loss account in earlier periods.
18
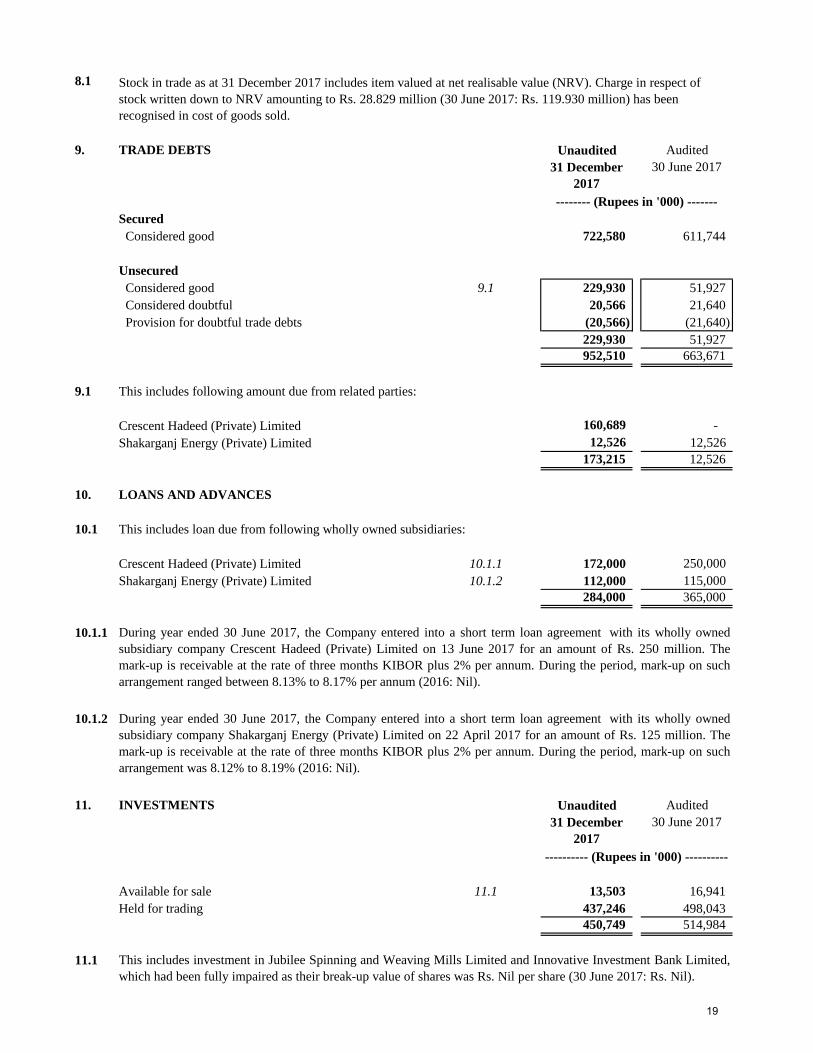
8.1
9. TRADE DEBTS Unaudited Audited
Secured
Considered good 722,580 611,744
Unsecured
Considered good 9.1 229,930 51,927
Considered doubtful 20,566 21,640
Provision for doubtful trade debts (20,566) (21,640)
229,930 51,927
952,510 663,671
9.1 This includes following amount due from related parties:
Crescent Hadeed (Private) Limited 160,689 -
Shakarganj Energy (Private) Limited 12,526 12,526
173,215 12,526
10. LOANS AND ADVANCES
10.1 This includes loan due from following wholly owned subsidiaries:
Crescent Hadeed (Private) Limited 10.1.1 172,000 250,000
Shakarganj Energy (Private) Limited 10.1.2 112,000 115,000
284,000 365,000
10.1.1
10.1.2
11. INVESTMENTS Unaudited Audited
Available for sale 11.1 13,503 16,941
Held for trading 437,246 498,043
450,749 514,984
11.1 This includes investment in Jubilee Spinning and Weaving Mills Limited and Innovative Investment Bank Limited,
which had been fully impaired as their break-up value of shares was Rs. Nil per share (30 June 2017: Rs. Nil).
31 December
2017
30 June 2017
---------- (Rupees in '000) ----------
During year ended 30 June 2017, the Company entered into a short term loan agreement with its wholly owned
subsidiary company Crescent Hadeed (Private) Limited on 13 June 2017 for an amount of Rs. 250 million. The
mark-up is receivable at the rate of three months KIBOR plus 2% per annum. During the period, mark-up on such
arrangement ranged between 8.13% to 8.17% per annum (2016: Nil).
During year ended 30 June 2017, the Company entered into a short term loan agreement with its wholly owned
subsidiary company Shakarganj Energy (Private) Limited on 22 April 2017 for an amount of Rs. 125 million. The
mark-up is receivable at the rate of three months KIBOR plus 2% per annum. During the period, mark-up on such
arrangement was 8.12% to 8.19% (2016: Nil).
-------- (Rupees in '000) -------
31 December
2017
30 June 2017
Stock in trade as at 31 December 2017 includes item valued at net realisable value (NRV). Charge in respect of
stock written down to NRV amounting to Rs. 28.829 million (30 June 2017: Rs. 119.930 million) has been
recognised in cost of goods sold.
19
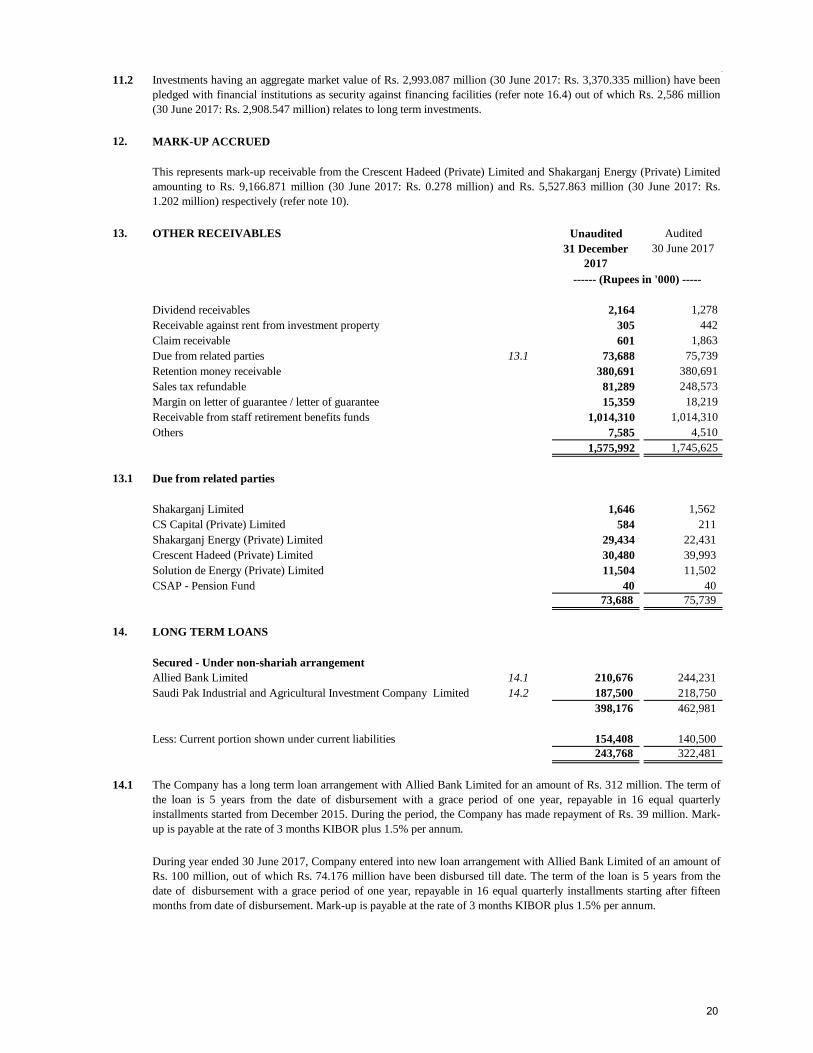
11.2
12. MARK-UP ACCRUED
13. OTHER RECEIVABLES Unaudited Audited
Dividend receivables 2,164 1,278
Receivable against rent from investment property 305 442
Claim receivable 601 1,863
Due from related parties 13.1 73,688 75,739
Retention money receivable 380,691 380,691
Sales tax refundable 81,289 248,573
Margin on letter of guarantee / letter of guarantee 15,359 18,219
Receivable from staff retirement benefits funds 1,014,310 1,014,310
Others 7,585 4,510
1,575,992 1,745,625
13.1 Due from related parties
Shakarganj Limited 1,646 1,562
CS Capital (Private) Limited 584 211
Shakarganj Energy (Private) Limited 29,434 22,431
Crescent Hadeed (Private) Limited 30,480 39,993
Solution de Energy (Private) Limited 11,504 11,502
CSAP - Pension Fund 40 40
73,688 75,739
14. LONG TERM LOANS
Secured - Under non-shariah arrangement
Allied Bank Limited 14.1 210,676 244,231
Saudi Pak Industrial and Agricultural Investment Company Limited 14.2 187,500 218,750
398,176 462,981
Less: Current portion shown under current liabilities 154,408 140,500
243,768 322,481
14.1
This represents mark-up receivable from the Crescent Hadeed (Private) Limited and Shakarganj Energy (Private) Limited
amounting to Rs. 9,166.871 million (30 June 2017: Rs. 0.278 million) and Rs. 5,527.863 million (30 June 2017: Rs.
1.202 million) respectively (refer note 10).
Investments having an aggregate market value of Rs. 2,993.087 million (30 June 2017: Rs. 3,370.335 million) have been
pledged with financial institutions as security against financing facilities (refer note 16.4) out of which Rs. 2,586 million
(30 June 2017: Rs. 2,908.547 million) relates to long term investments.
31 December
2017
30 June 2017
------ (Rupees in '000) -----
The Company has a long term loan arrangement with Allied Bank Limited for an amount of Rs. 312 million. The term of
the loan is 5 years from the date of disbursement with a grace period of one year, repayable in 16 equal quarterly
installments started from December 2015. During the period, the Company has made repayment of Rs. 39 million. Mark-
up is payable at the rate of 3 months KIBOR plus 1.5% per annum.
During year ended 30 June 2017, Company entered into new loan arrangement with Allied Bank Limited of an amount of
Rs. 100 million, out of which Rs. 74.176 million have been disbursed till date. The term of the loan is 5 years from the
date of disbursement with a grace period of one year, repayable in 16 equal quarterly installments starting after fifteen
months from date of disbursement. Mark-up is payable at the rate of 3 months KIBOR plus 1.5% per annum.
20
14.2
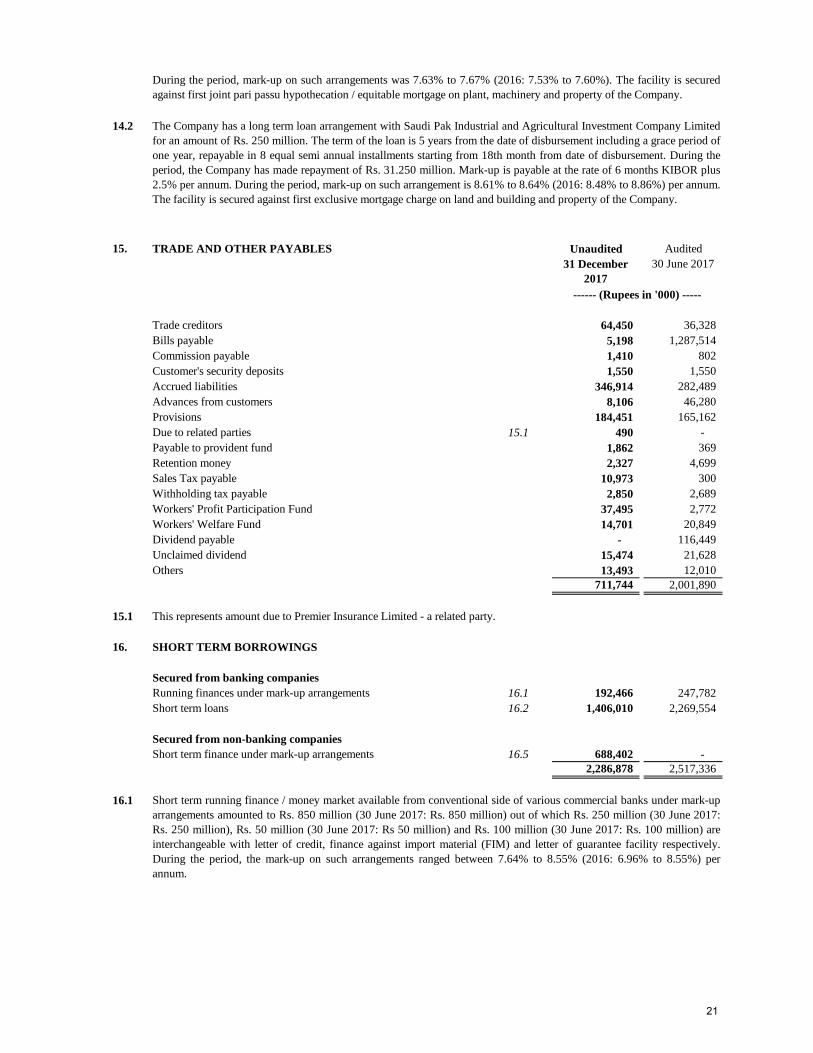
15. TRADE AND OTHER PAYABLES Unaudited Audited
Trade creditors 64,450 36,328
Bills payable 5,198 1,287,514
Commission payable 1,410 802
Customer's security deposits 1,550 1,550
Accrued liabilities 346,914 282,489
Advances from customers 8,106 46,280
Provisions 184,451 165,162
Due to related parties 15.1 490 -
Payable to provident fund 1,862 369
Retention money 2,327 4,699
Sales Tax payable 10,973 300
Withholding tax payable 2,850 2,689
Workers' Profit Participation Fund 37,495 2,772
Workers' Welfare Fund 14,701 20,849
Dividend payable - 116,449
Unclaimed dividend 15,474 21,628
Others 13,493 12,010
711,744 2,001,890
15.1 This represents amount due to Premier Insurance Limited - a related party.
16. SHORT TERM BORROWINGS
Secured from banking companies
Running finances under mark-up arrangements 16.1 192,466 247,782
Short term loans 16.2 1,406,010 2,269,554
Secured from non-banking companies
Short term finance under mark-up arrangements 16.5 688,402 -
2,286,878 2,517,336
16.1
The Company has a long term loan arrangement with Saudi Pak Industrial and Agricultural Investment Company Limited
for an amount of Rs. 250 million. The term of the loan is 5 years from the date of disbursement including a grace period of
one year, repayable in 8 equal semi annual installments starting from 18th month from date of disbursement. During the
period, the Company has made repayment of Rs. 31.250 million. Mark-up is payable at the rate of 6 months KIBOR plus
2.5% per annum. During the period, mark-up on such arrangement is 8.61% to 8.64% (2016: 8.48% to 8.86%) per annum.
The facility is secured against first exclusive mortgage charge on land and building and property of the Company.
31 December
2017
Short term running finance / money market available from conventional side of various commercial banks under mark-up
arrangements amounted to Rs. 850 million (30 June 2017: Rs. 850 million) out of which Rs. 250 million (30 June 2017:
Rs. 250 million), Rs. 50 million (30 June 2017: Rs 50 million) and Rs. 100 million (30 June 2017: Rs. 100 million) are
interchangeable with letter of credit, finance against import material (FIM) and letter of guarantee facility respectively.
During the period, the mark-up on such arrangements ranged between 7.64% to 8.55% (2016: 6.96% to 8.55%) per
annum.
30 June 2017
------ (Rupees in '000) -----
During the period, mark-up on such arrangements was 7.63% to 7.67% (2016: 7.53% to 7.60%). The facility is secured
against first joint pari passu hypothecation / equitable mortgage on plant, machinery and property of the Company.
21
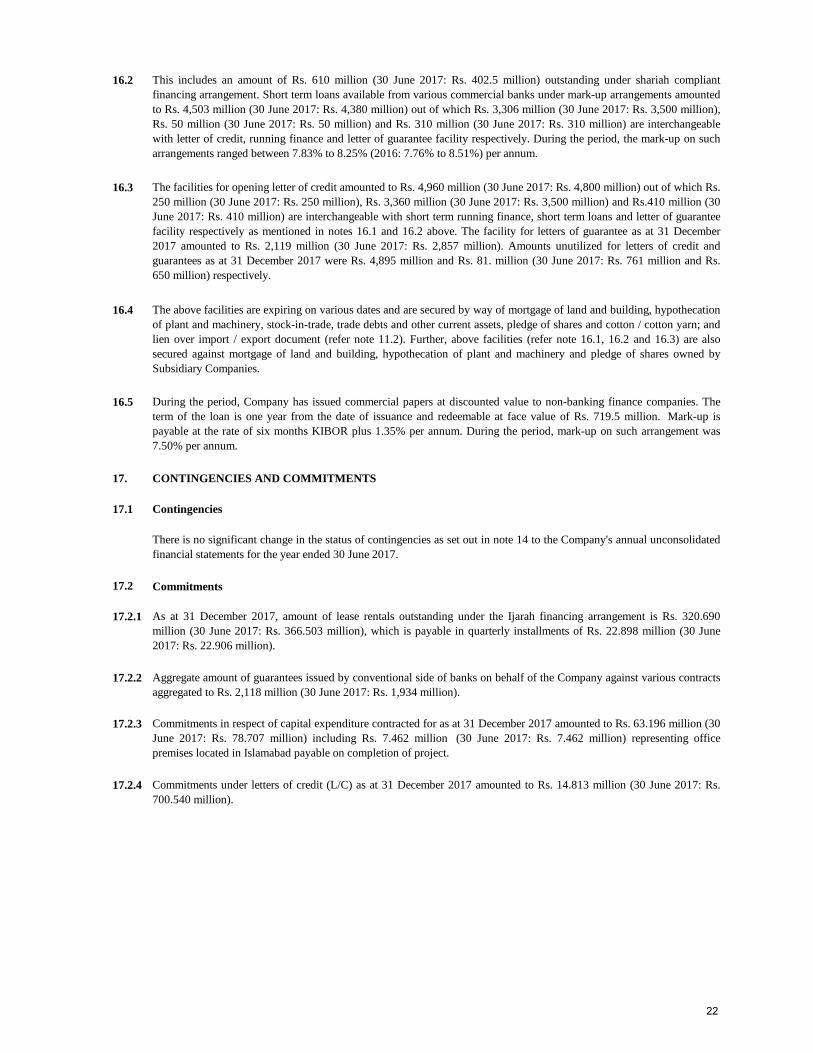
16.2
16.3
16.4
16.5
17. CONTINGENCIES AND COMMITMENTS
17.1 Contingencies
17.2 Commitments
17.2.1
17.2.2
17.2.3
17.2.4 Commitments under letters of credit (L/C) as at 31 December 2017 amounted to Rs. 14.813 million (30 June 2017: Rs.
700.540 million).
There is no significant change in the status of contingencies as set out in note 14 to the Company's annual unconsolidated
financial statements for the year ended 30 June 2017.
During the period, Company has issued commercial papers at discounted value to non-banking finance companies. The
term of the loan is one year from the date of issuance and redeemable at face value of Rs. 719.5 million. Mark-up is
payable at the rate of six months KIBOR plus 1.35% per annum. During the period, mark-up on such arrangement was
7.50% per annum.
This includes an amount of Rs. 610 million (30 June 2017: Rs. 402.5 million) outstanding under shariah compliant
financing arrangement. Short term loans available from various commercial banks under mark-up arrangements amounted
to Rs. 4,503 million (30 June 2017: Rs. 4,380 million) out of which Rs. 3,306 million (30 June 2017: Rs. 3,500 million),
Rs. 50 million (30 June 2017: Rs. 50 million) and Rs. 310 million (30 June 2017: Rs. 310 million) are interchangeable
with letter of credit, running finance and letter of guarantee facility respectively. During the period, the mark-up on such
arrangements ranged between 7.83% to 8.25% (2016: 7.76% to 8.51%) per annum.
The facilities for opening letter of credit amounted to Rs. 4,960 million (30 June 2017: Rs. 4,800 million) out of which Rs.
250 million (30 June 2017: Rs. 250 million), Rs. 3,360 million (30 June 2017: Rs. 3,500 million) and Rs.410 million (30
June 2017: Rs. 410 million) are interchangeable with short term running finance, short term loans and letter of guarantee
facility respectively as mentioned in notes 16.1 and 16.2 above. The facility for letters of guarantee as at 31 December
2017 amounted to Rs. 2,119 million (30 June 2017: Rs. 2,857 million). Amounts unutilized for letters of credit and
guarantees as at 31 December 2017 were Rs. 4,895 million and Rs. 81. million (30 June 2017: Rs. 761 million and Rs.
650 million) respectively.
Aggregate amount of guarantees issued by conventional side of banks on behalf of the Company against various contracts
aggregated to Rs. 2,118 million (30 June 2017: Rs. 1,934 million).
Commitments in respect of capital expenditure contracted for as at 31 December 2017 amounted to Rs. 63.196 million (30
June 2017: Rs. 78.707 million) including Rs. 7.462 million (30 June 2017: Rs. 7.462 million) representing office
premises located in Islamabad payable on completion of project.
As at 31 December 2017, amount of lease rentals outstanding under the Ijarah financing arrangement is Rs. 320.690
million (30 June 2017: Rs. 366.503 million), which is payable in quarterly installments of Rs. 22.898 million (30 June
2017: Rs. 22.906 million).
The above facilities are expiring on various dates and are secured by way of mortgage of land and building, hypothecation
of plant and machinery, stock-in-trade, trade debts and other current assets, pledge of shares and cotton / cotton yarn; and
lien over import / export document (refer note 11.2). Further, above facilities (refer note 16.1, 16.2 and 16.3) are also
secured against mortgage of land and building, hypothecation of plant and machinery and pledge of shares owned by
Subsidiary Companies.
22
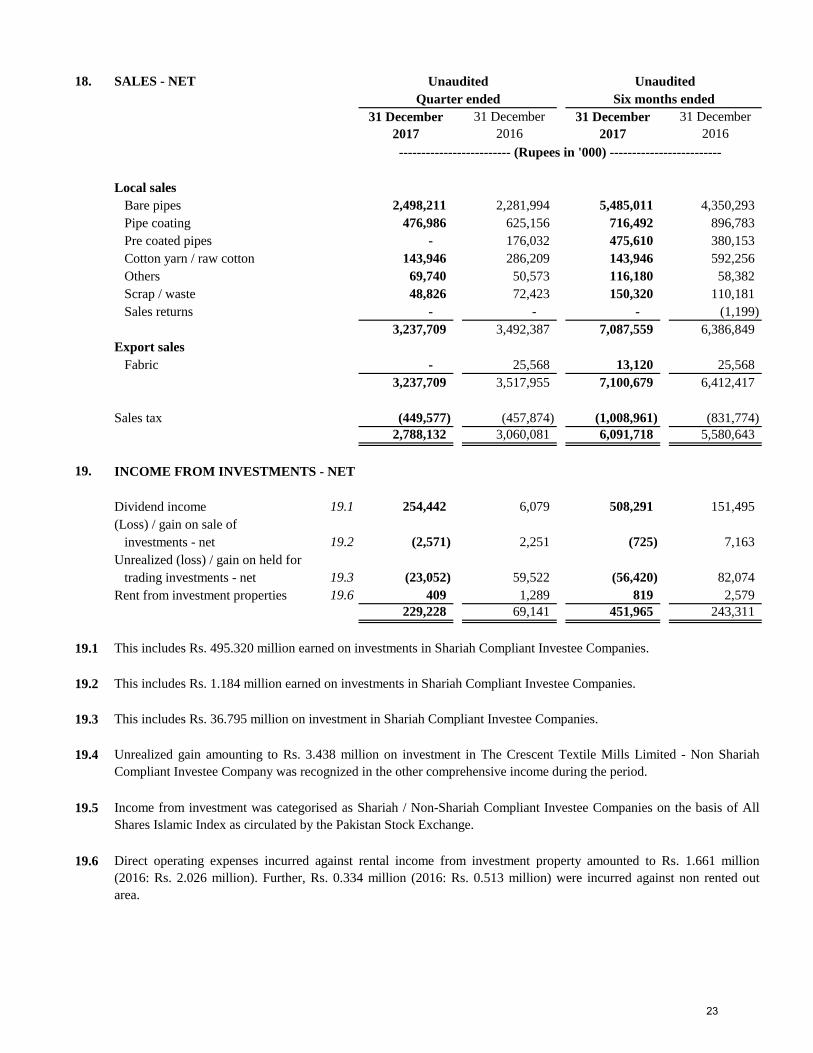
18. SALES - NET Unaudited Unaudited
Local sales
Bare pipes 2,498,211 2,281,994 5,485,011 4,350,293
Pipe coating 476,986 625,156 716,492 896,783
Pre coated pipes - 176,032 475,610 380,153
Cotton yarn / raw cotton 143,946 286,209 143,946 592,256
Others 69,740 50,573 116,180 58,382
Scrap / waste 48,826 72,423 150,320 110,181
Sales returns - - - (1,199)
3,237,709 3,492,387 7,087,559 6,386,849
Export sales
Fabric - 25,568 13,120 25,568
3,237,709 3,517,955 7,100,679 6,412,417
Sales tax (449,577) (457,874) (1,008,961) (831,774)
2,788,132 3,060,081 6,091,718 5,580,643
19. INCOME FROM INVESTMENTS - NET
Dividend income 19.1 254,442 6,079 508,291 151,495
(Loss) / gain on sale of
investments - net 19.2 (2,571) 2,251 (725) 7,163
Unrealized (loss) / gain on held for
trading investments - net 19.3 (23,052) 59,522 (56,420) 82,074
Rent from investment properties 19.6 409 1,289 819 2,579
229,228 69,141 451,965 243,311
19.1
19.2
19.3
19.4
19.5
19.6
Income from investment was categorised as Shariah / Non-Shariah Compliant Investee Companies on the basis of All
Shares Islamic Index as circulated by the Pakistan Stock Exchange.
This includes Rs. 1.184 million earned on investments in Shariah Compliant Investee Companies.
Direct operating expenses incurred against rental income from investment property amounted to Rs. 1.661 million
(2016: Rs. 2.026 million). Further, Rs. 0.334 million (2016: Rs. 0.513 million) were incurred against non rented out
area.
Quarter ended Six months ended
31 December
2017
31 December
2016
31 December
2017
31 December
2016
------------------------- (Rupees in '000) -------------------------
This includes Rs. 36.795 million on investment in Shariah Compliant Investee Companies.
This includes Rs. 495.320 million earned on investments in Shariah Compliant Investee Companies.
Unrealized gain amounting to Rs. 3.438 million on investment in The Crescent Textile Mills Limited - Non Shariah
Compliant Investee Company was recognized in the other comprehensive income during the period.
23

20. OTHER OPERATING EXPENSES Unaudited Unaudited
Exchange loss 1,201 263 12,606 2,557
Provision for:
Workers' Profit Participation Fund 17,276 28,956 34,834 46,793
Workers' Welfare Fund 7,179 16,204 13,556 21,458
Other receivables - 885 - 885
Liquidated damages - 207,918 - 207,918
Slow moving stores, spares and loose tools 8,915 - 8,915 -
Liquidated damages - 138,266 4,630 203,265
34,571 392,492 74,541 482,876
21. OTHER INCOME
Mark-up on short term loan to subsidiary companies 21.1 6,250 - 13,214 -
Reversal of provision for diminution in the value of
investments - 100,561 - 100,561
Others 8,940 7,169 15,492 14,173
15,190 107,730 28,706 114,734
21.1
22. FINANCE COSTS
Mark-up on short term loans - Shariah arrangement 12,321 4,381 19,252 5,478
Interest on - Non -
Shariah arrangement
- finance lease obligations 2,100 2,986 5,021 6,030
- long term loans 8,840 9,696 17,345 20,030
- running finances / short term loans including
commercial papers 47,014 19,138 103,294 58,958
Discounting of lease deposit (136) 399 2,708 399
Bank charges 917 1,598 2,700 5,859
71,056 38,198 150,320 96,754
23. TAXATION
24. BASIC AND DILUTED EARNINGS PER SHARE
Profit for the period 415,368 515,661 837,540 890,633
Weighted average number of ordinary
shares in issue during the period 77,632,491 77,632,491 77,632,491 77,632,491
Basic and diluted earnings per share 5.35 6.64 10.79 11.47
------------------------- (Rupees in '000) -------------------------
Quarter ended Six months ended
31 December
2017
31 December
2016
31 December
2017
31 December
2016
-------------------------------- (Rupees) --------------------------------
This represents mark-up income earned on short term loan provided to Crescent Hadeed (Private) Limited and Shakarganj Energy
(Private) Limited amounting to Rs. 8,888.87 million (2016: Rs. Nil) and Rs. 4,325.86 million (2016: Rs. Nil) respectively.
--------------------------- (Number of shares) ---------------------------
The Board of Directors of the Company intends to distribute sufficient cash dividend for the year ending 30 June 2018 to comply with
the requirements of Section 5A of the Income Tax Ordinance, 2001. Accordingly, no provision for tax on undistributed reserves has
been recognized in these condensed interim unconsolidated financial information.
24
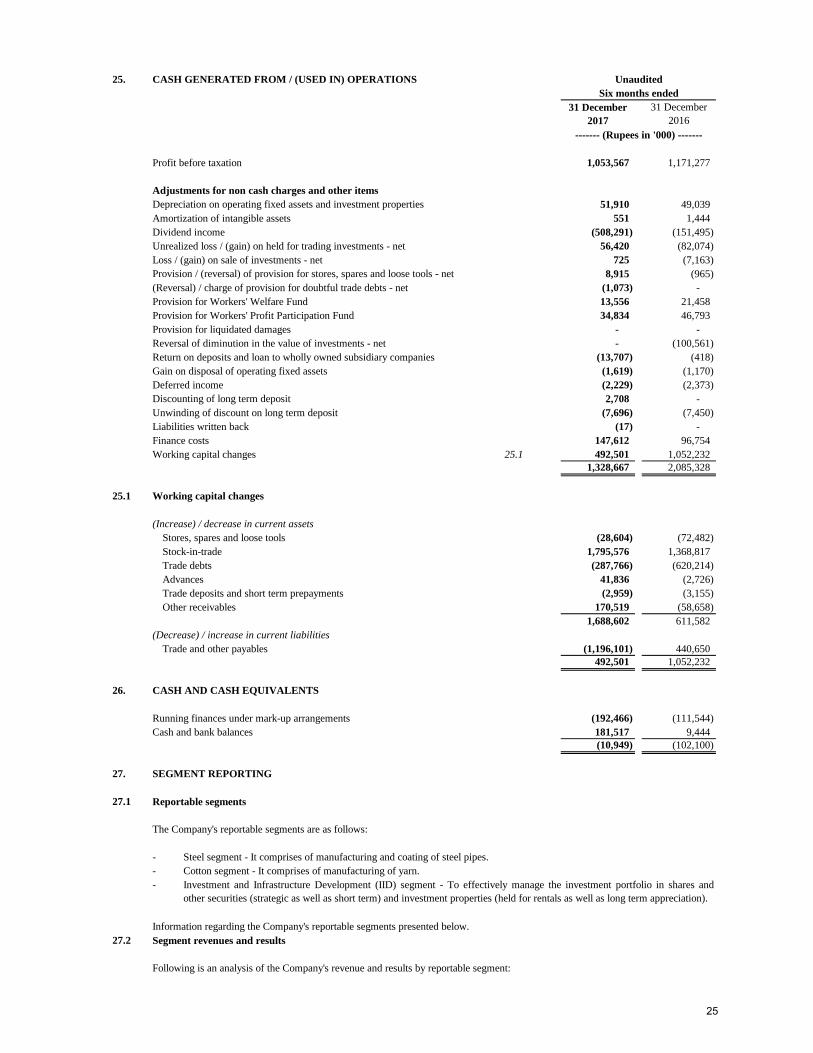
25. CASH GENERATED FROM / (USED IN) OPERATIONS Unaudited
Profit before taxation 1,053,567 1,171,277
Adjustments for non cash charges and other items
Depreciation on operating fixed assets and investment properties 51,910 49,039
Amortization of intangible assets 551 1,444
Dividend income (508,291) (151,495)
Unrealized loss / (gain) on held for trading investments - net 56,420 (82,074)
Loss / (gain) on sale of investments - net 725 (7,163)
Provision / (reversal) of provision for stores, spares and loose tools - net 8,915 (965)
(Reversal) / charge of provision for doubtful trade debts - net (1,073) -
Provision for Workers' Welfare Fund 13,556 21,458
Provision for Workers' Profit Participation Fund 34,834 46,793
Provision for liquidated damages - -
Reversal of diminution in the value of investments - net - (100,561)
Return on deposits and loan to wholly owned subsidiary companies (13,707) (418)
Gain on disposal of operating fixed assets (1,619) (1,170)
Deferred income (2,229) (2,373)
Discounting of long term deposit 2,708 -
Unwinding of discount on long term deposit (7,696) (7,450)
Liabilities written back (17) -
Finance costs 147,612 96,754
Working capital changes 25.1 492,501 1,052,232
1,328,667 2,085,328
25.1 Working capital changes
(Increase) / decrease in current assets
Stores, spares and loose tools (28,604) (72,482)
Stock-in-trade 1,795,576 1,368,817
Trade debts (287,766) (620,214)
Advances 41,836 (2,726)
Trade deposits and short term prepayments (2,959) (3,155)
Other receivables 170,519 (58,658)
1,688,602 611,582
(Decrease) / increase in current liabilities
Trade and other payables (1,196,101) 440,650
492,501 1,052,232
26. CASH AND CASH EQUIVALENTS
Running finances under mark-up arrangements (192,466) (111,544)
Cash and bank balances 181,517 9,444
(10,949) (102,100)
27. SEGMENT REPORTING
27.1 Reportable segments
The Company's reportable segments are as follows:
- Steel segment - It comprises of manufacturing and coating of steel pipes.
- Cotton segment - It comprises of manufacturing of yarn.
-
Information regarding the Company's reportable segments presented below.
27.2 Segment revenues and results
Following is an analysis of the Company's revenue and results by reportable segment:
Six months ended
Investment and Infrastructure Development (IID) segment - To effectively manage the investment portfolio in shares and
other securities (strategic as well as short term) and investment properties (held for rentals as well as long term appreciation).
31 December
2017
31 December
2016
------- (Rupees in '000) -------
25
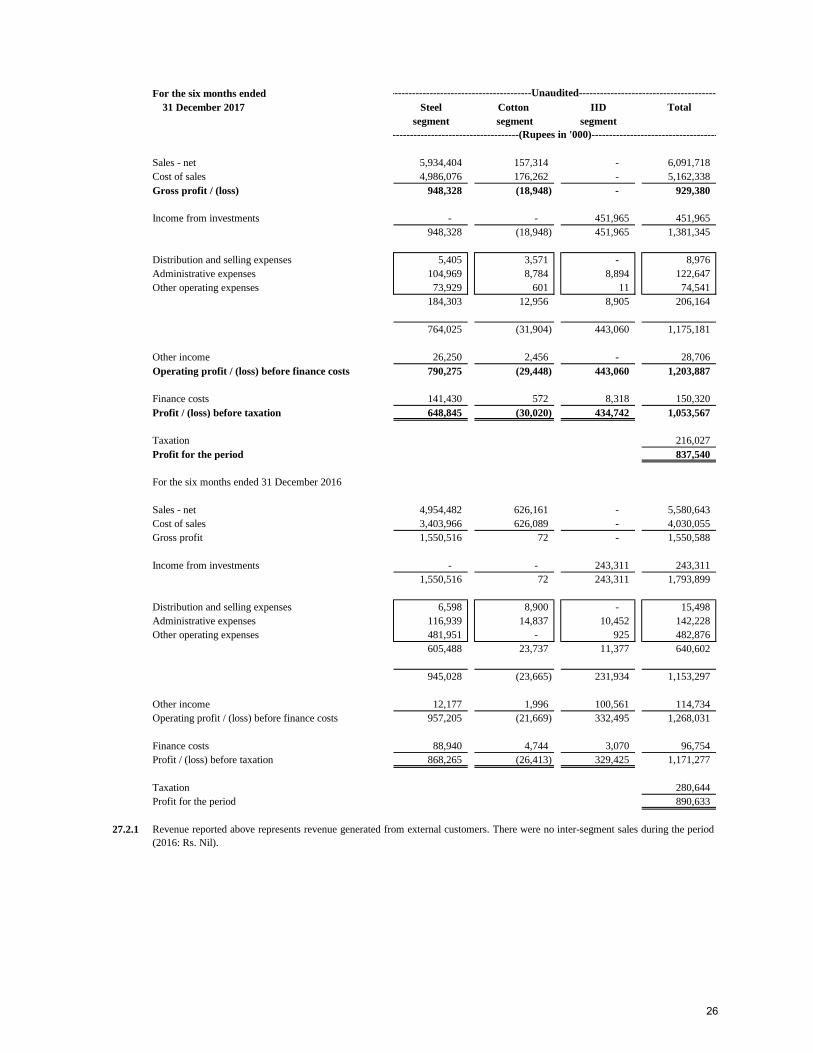
For the six months ended
31 December 2017 Steel Cotton IID
segment segment segment
Sales - net 5,934,404 157,314 - 6,091,718
Cost of sales 4,986,076 176,262 - 5,162,338
Gross profit / (loss) 948,328 (18,948) - 929,380
Income from investments - - 451,965 451,965
948,328 (18,948) 451,965 1,381,345
Distribution and selling expenses 5,405 3,571 - 8,976
Administrative expenses 104,969 8,784 8,894 122,647
Other operating expenses 73,929 601 11 74,541
184,303 12,956 8,905 206,164
764,025 (31,904) 443,060 1,175,181
Other income 26,250 2,456 - 28,706
Operating profit / (loss) before finance costs 790,275 (29,448) 443,060 1,203,887
Finance costs 141,430 572 8,318 150,320
Profit / (loss) before taxation 648,845 (30,020) 434,742 1,053,567
Taxation 216,027
Profit for the period 837,540
For the six months ended 31 December 2016
Sales - net 4,954,482 626,161 - 5,580,643
Cost of sales 3,403,966 626,089 - 4,030,055
Gross profit 1,550,516 72 - 1,550,588
Income from investments - - 243,311 243,311
1,550,516 72 243,311 1,793,899
Distribution and selling expenses 6,598 8,900 - 15,498
Administrative expenses 116,939 14,837 10,452 142,228
Other operating expenses 481,951 - 925 482,876
605,488 23,737 11,377 640,602
945,028 (23,665) 231,934 1,153,297
Other income 12,177 1,996 100,561 114,734
Operating profit / (loss) before finance costs 957,205 (21,669) 332,495 1,268,031
Finance costs 88,940 4,744 3,070 96,754
Profit / (loss) before taxation 868,265 (26,413) 329,425 1,171,277
Taxation 280,644
Profit for the period 890,633
27.2.1 Revenue reported above represents revenue generated from external customers. There were no inter-segment sales during the period
(2016: Rs. Nil).
Total
-------------------------------------------(Rupees in '000)-------------------------------------------
-------------------------------------------Unaudited-------------------------------------------
26
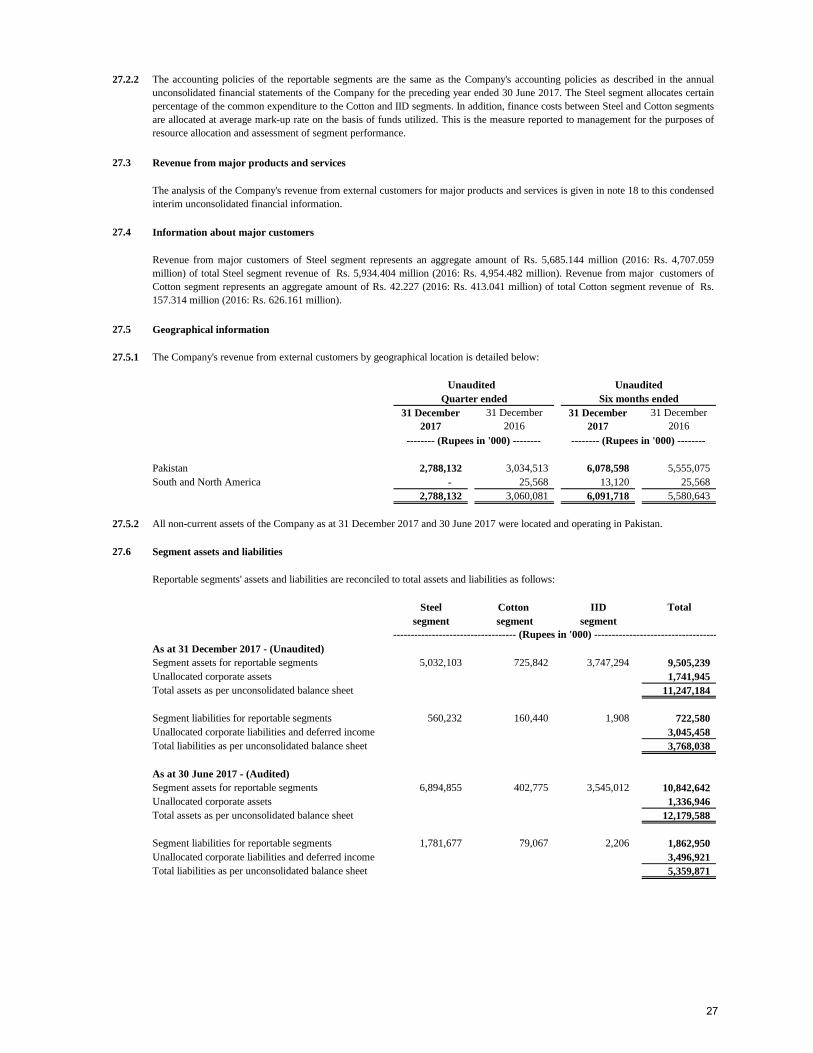
27.2.2
27.3 Revenue from major products and services
27.4 Information about major customers
27.5 Geographical information
27.5.1 The Company's revenue from external customers by geographical location is detailed below:
Unaudited Unaudited
Pakistan 2,788,132 3,034,513 6,078,598 5,555,075
South and North America - 25,568 13,120 25,568
2,788,132 3,060,081 6,091,718 5,580,643
27.5.2
27.6 Segment assets and liabilities
Reportable segments' assets and liabilities are reconciled to total assets and liabilities as follows:
Steel Cotton IID
segment segment segment
As at 31 December 2017 - (Unaudited)
Segment assets for reportable segments 5,032,103 725,842 3,747,294 9,505,239
Unallocated corporate assets 1,741,945
Total assets as per unconsolidated balance sheet 11,247,184
Segment liabilities for reportable segments 560,232 160,440 1,908 722,580
Unallocated corporate liabilities and deferred income 3,045,458
Total liabilities as per unconsolidated balance sheet 3,768,038
As at 30 June 2017 - (Audited)
Segment assets for reportable segments 6,894,855 402,775 3,545,012 10,842,642
Unallocated corporate assets 1,336,946
Total assets as per unconsolidated balance sheet 12,179,588
Segment liabilities for reportable segments 1,781,677 79,067 2,206 1,862,950
Unallocated corporate liabilities and deferred income 3,496,921
Total liabilities as per unconsolidated balance sheet 5,359,871
------------------------------------------- (Rupees in '000) -------------------------------------------
-------- (Rupees in '000) --------
The accounting policies of the reportable segments are the same as the Company's accounting policies as described in the annual
unconsolidated financial statements of the Company for the preceding year ended 30 June 2017. The Steel segment allocates certain
percentage of the common expenditure to the Cotton and IID segments. In addition, finance costs between Steel and Cotton segments
are allocated at average mark-up rate on the basis of funds utilized. This is the measure reported to management for the purposes of
resource allocation and assessment of segment performance.
Total
Six months ended
31 December
2017
31 December
2016
Revenue from major customers of Steel segment represents an aggregate amount of Rs. 5,685.144 million (2016: Rs. 4,707.059
million) of total Steel segment revenue of Rs. 5,934.404 million (2016: Rs. 4,954.482 million). Revenue from major customers of
Cotton segment represents an aggregate amount of Rs. 42.227 (2016: Rs. 413.041 million) of total Cotton segment revenue of Rs.
157.314 million (2016: Rs. 626.161 million).
-------- (Rupees in '000) --------
The analysis of the Company's revenue from external customers for major products and services is given in note 18 to this condensed
interim unconsolidated financial information.
Quarter ended
31 December
2017
31 December
2016
All non-current assets of the Company as at 31 December 2017 and 30 June 2017 were located and operating in Pakistan.
27
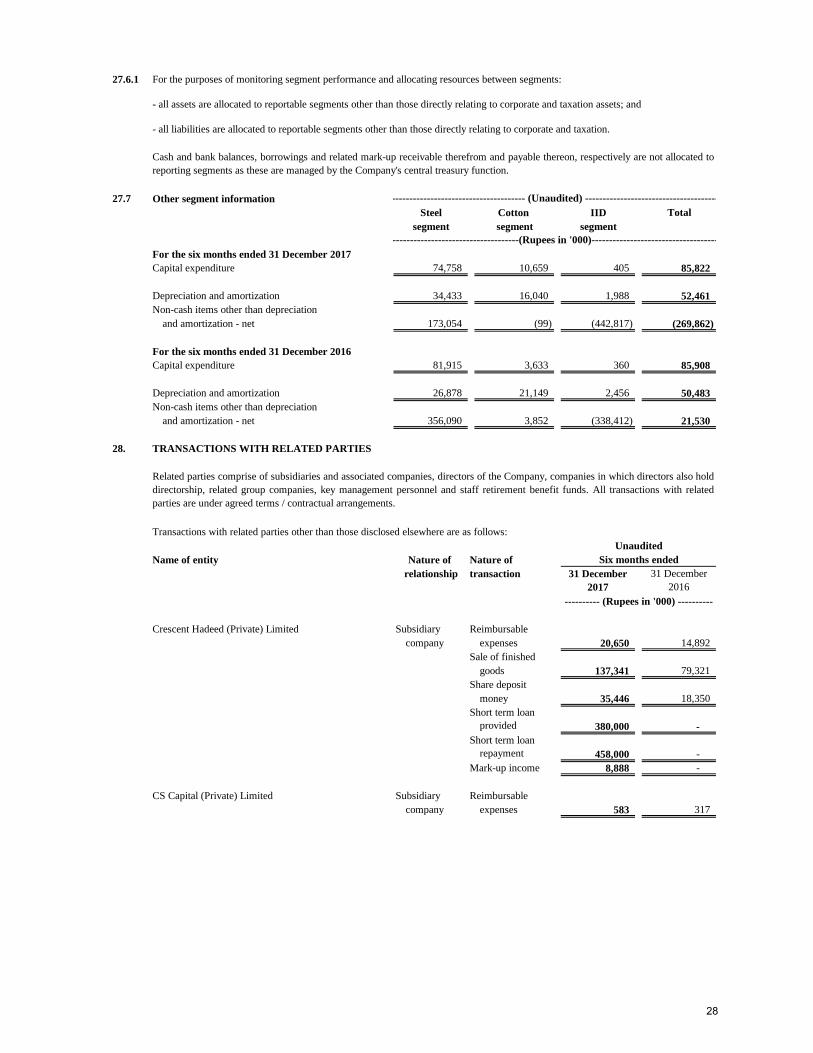
27.6.1 For the purposes of monitoring segment performance and allocating resources between segments:
27.7 Other segment information
Steel Cotton IID
segment segment segment
For the six months ended 31 December 2017
Capital expenditure 74,758 10,659 405 85,822
Depreciation and amortization 34,433 16,040 1,988 52,461
Non-cash items other than depreciation
and amortization - net 173,054 (99) (442,817) (269,862)
For the six months ended 31 December 2016
Capital expenditure 81,915 3,633 360 85,908
Depreciation and amortization 26,878 21,149 2,456 50,483
Non-cash items other than depreciation
and amortization - net 356,090 3,852 (338,412) 21,530
28. TRANSACTIONS WITH RELATED PARTIES
Transactions with related parties other than those disclosed elsewhere are as follows:
Unaudited
Name of entity Nature of Nature of
relationship transaction
Crescent Hadeed (Private) Limited Subsidiary Reimbursable
company expenses 20,650 14,892
Sale of finished
goods 137,341 79,321
Share deposit
money 35,446 18,350
Short term loan
provided 380,000 -
Short term loan
repayment 458,000 -
Mark-up income 8,888 -
CS Capital (Private) Limited Subsidiary Reimbursable
company expenses 583 317
- all assets are allocated to reportable segments other than those directly relating to corporate and taxation assets; and
Cash and bank balances, borrowings and related mark-up receivable therefrom and payable thereon, respectively are not allocated to
reporting segments as these are managed by the Company's central treasury function.
------------------------------------------- (Unaudited) -------------------------------------------
Total
---------- (Rupees in '000) ----------
Related parties comprise of subsidiaries and associated companies, directors of the Company, companies in which directors also hold
directorship, related group companies, key management personnel and staff retirement benefit funds. All transactions with related
parties are under agreed terms / contractual arrangements.
Six months ended
-------------------------------------------(Rupees in '000)-------------------------------------------
31 December
2017
31 December
2016
- all liabilities are allocated to reportable segments other than those directly relating to corporate and taxation.
28
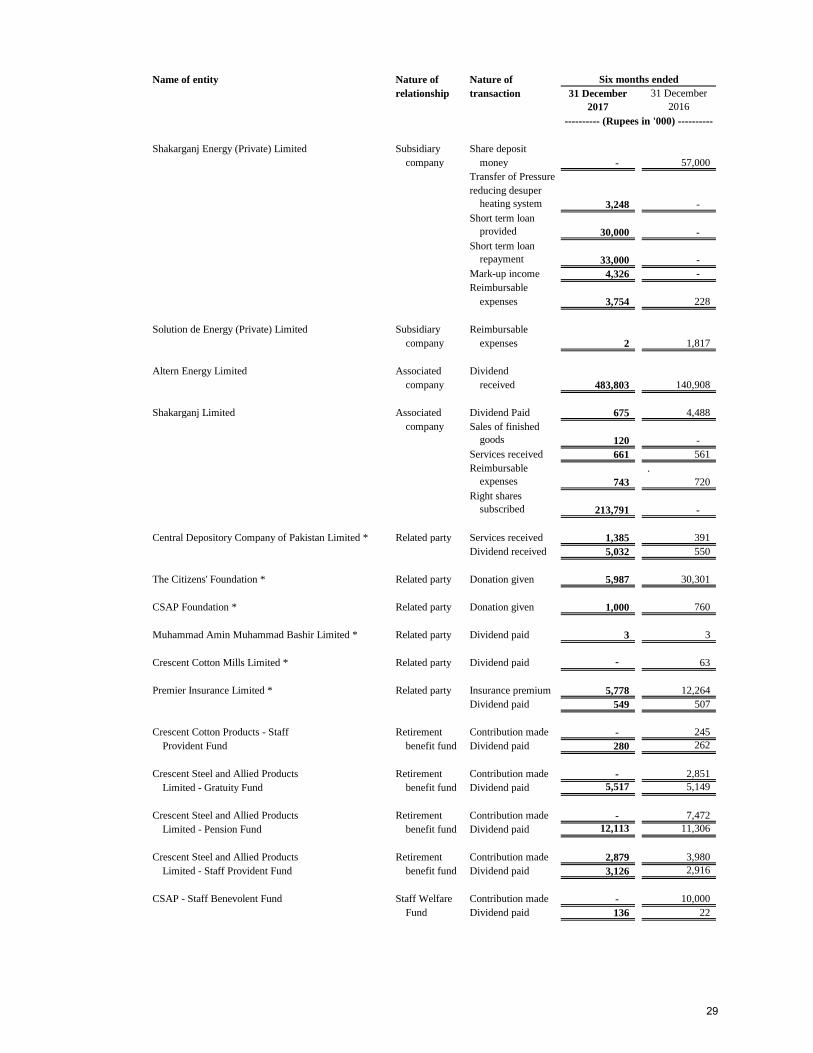
Name of entity Nature of Nature of
relationship transaction
Shakarganj Energy (Private) Limited Subsidiary Share deposit
company money - 57,000
Transfer of Pressure
reducing desuper
heating system 3,248 -
Short term loan
provided 30,000 -
Short term loan
repayment 33,000 -
Mark-up income 4,326 -
Reimbursable
expenses 3,754 228
Solution de Energy (Private) Limited Subsidiary Reimbursable
company expenses 2 1,817
Altern Energy Limited Associated Dividend
company received 483,803 140,908
Shakarganj Limited Associated Dividend Paid 675 4,488
company Sales of finished
goods 120 -
Services received 661 561
Reimbursable .
expenses 743 720
Right shares
subscribed 213,791 -
Central Depository Company of Pakistan Limited * Related party Services received 1,385 391
Dividend received 5,032 550
The Citizens' Foundation * Related party Donation given 5,987 30,301
CSAP Foundation * Related party Donation given 1,000 760
Muhammad Amin Muhammad Bashir Limited * Related party Dividend paid 3 3
Crescent Cotton Mills Limited * Related party Dividend paid - 63
Premier Insurance Limited * Related party Insurance premium 5,778 12,264
Dividend paid 549 507
Crescent Cotton Products - Staff Retirement Contribution made - 245
Provident Fund benefit fund Dividend paid 280 262
Crescent Steel and Allied Products Retirement Contribution made - 2,851
Limited - Gratuity Fund benefit fund Dividend paid 5,517 5,149
Crescent Steel and Allied Products Retirement Contribution made - 7,472
Limited - Pension Fund benefit fund Dividend paid 12,113 11,306
Crescent Steel and Allied Products Retirement Contribution made 2,879 3,980
Limited - Staff Provident Fund benefit fund Dividend paid 3,126 2,916
CSAP - Staff Benevolent Fund Staff Welfare Contribution made - 10,000
Fund Dividend paid 136 22
---------- (Rupees in '000) ----------
Six months ended
31 December
2017
31 December
2016
29

Name of entity Nature of Nature of
relationship transaction
Key management personnel Related parties Remuneration and
benefits 52,718 51,440
Dividend paid 908 332
Directors and their spouse Related parties Dividend paid 191 2,382
Meeting fee 2,240 1,760
* These entities are / have been related parties of the Company by virtue of common directorship only.
28.1
28.2
28.3
29. FINANCIAL RISK MANAGEMENT
Investments Loans and Other Total Level 1 Level 2 Level 3 Total
receivables financial
liabilities
On-balance sheet
financial instruments
Financial assets
measured at fair value
Investments
- listed equity securities 450,749 - - 450,749 450,749 - - 450,749
Financial assets not
measured at fair value
Investments
- unlisted equity securities 178,946 - - 178,946 - - - -
- associates 1,284,594 - - 1,284,594 4,651,851 - - 4,651,851
Deposits - 205,976 - 205,976 - - - -
Trade debts - 952,510 - 952,510 - - - -
Loan to subsidiaries - 284,000 - 284,000 - - - -
Mark-up accrued - 14,695 - 14,695 - - - -
Other receivables - 480,393 - 480,393 - - - -
Bank balances - 181,293 - 181,293 - - - -
1,463,540 2,118,867 - 3,582,407 4,651,851 - - 4,651,851
31 December
2017
31 December
2016
---------- (Rupees in '000) ----------
31 December 2017 (Un-audited)
Fair valueCarrying amount
---------------------------------------------------------------------------(Rupees in '000)------------------------------------------------------------------------------
Six months ended
The table below analyses financial instruments measured at the end of the reporting period by the level in the fair value hierarchy into which the fair value
measurement is categorised:
Level 3 : Fair value measurements using inputs for the asset or liability that are not based on observable market data (i.e. unobservable inputs).
Level 2 : Fair value measurements using inputs other than quoted prices included within Level 1 that are observable for the asset or liability, either directly (i.e. as
prices) or indirectly (i.e. derived from prices).
Level 1 : Fair value measurements using quoted (unadjusted) in active markets for identical asset or liability.
Fair value is defined as the price that would be received to sell an asset or paid to transfer a liability in an orderly transaction between market participants at the
measurement date.
The Company's financial risk management objectives and policies are consistent with those disclosed in annual unconsolidated financial statement of the Company
as at and the year ended 30 June 2017.
Key management personnel are those persons having authority and responsibility for planning, directing and controlling the activities of the Company, including
directors of the Company. There were no transactions with the key management personnel during the period other than their terms of employment / entitlements.
Contributions to the employee retirement benefit funds are made in accordance with the terms of employee retirement benefit schemes and actuarial advice.
Sale of finished goods and raw materials, rendering of services and insurance premium are based on commercial terms and at market prices which are approved by
the Board of Directors.
30
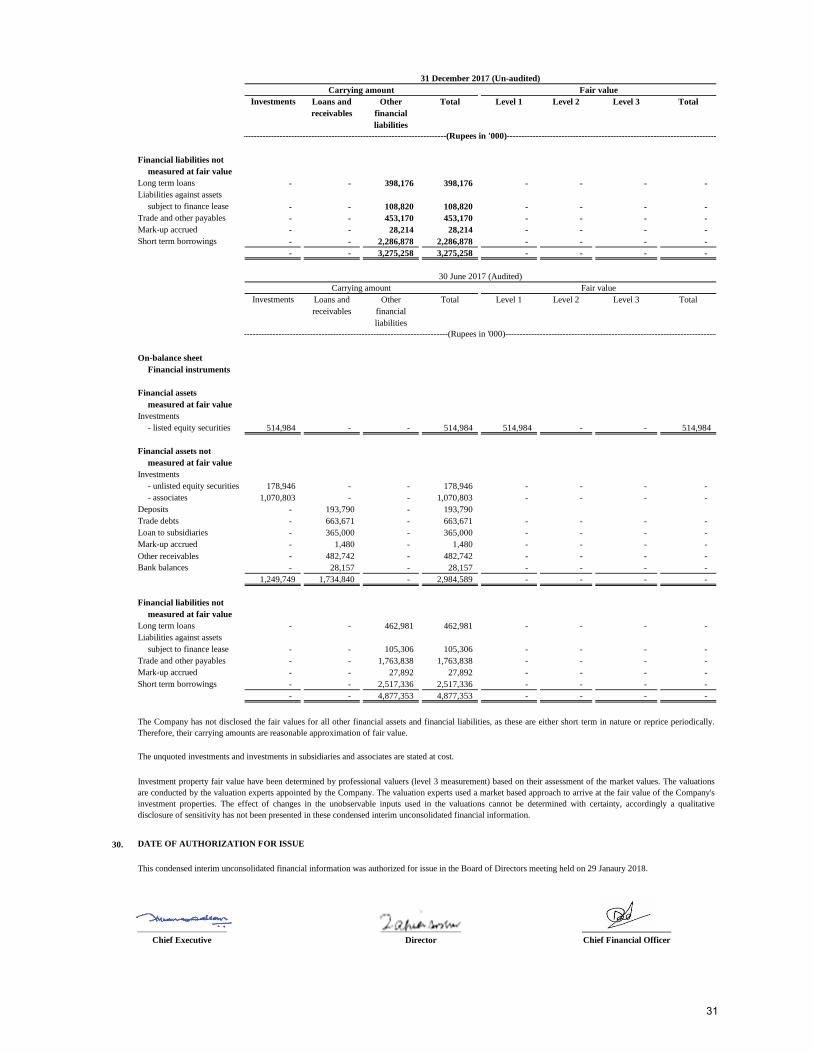
Investments Loans and Other Total Level 1 Level 2 Level 3 Total
receivables financial
liabilities
Financial liabilities not
measured at fair value
Long term loans - - 398,176 398,176 - - - -
Liabilities against assets
subject to finance lease - - 108,820 108,820 - - - -
Trade and other payables - - 453,170 453,170 - - - -
Mark-up accrued - - 28,214 28,214 - - - -
Short term borrowings - - 2,286,878 2,286,878 - - - -
- - 3,275,258 3,275,258 - - - -
Investments Loans and Other Total Level 1 Level 2 Level 3 Total
receivables financial
liabilities
On-balance sheet
Financial instruments
Financial assets
measured at fair value
Investments
- listed equity securities 514,984 - - 514,984 514,984 - - 514,984
Financial assets not
measured at fair value
Investments
- unlisted equity securities 178,946 - - 178,946 - - - -
- associates 1,070,803 - - 1,070,803 - - - -
Deposits - 193,790 - 193,790
Trade debts - 663,671 - 663,671 - - - -
Loan to subsidiaries - 365,000 - 365,000 - - - -
Mark-up accrued - 1,480 - 1,480 - - - -
Other receivables - 482,742 - 482,742 - - - -
Bank balances - 28,157 - 28,157 - - - -
1,249,749 1,734,840 - 2,984,589 - - - -
Financial liabilities not
measured at fair value
Long term loans - - 462,981 462,981 - - - -
Liabilities against assets
subject to finance lease - - 105,306 105,306 - - - -
Trade and other payables - - 1,763,838 1,763,838 - - - -
Mark-up accrued - - 27,892 27,892 - - - -
Short term borrowings - - 2,517,336 2,517,336 - - - -
- - 4,877,353 4,877,353 - - - -
30. DATE OF AUTHORIZATION FOR ISSUE
____________________ __________________ ____________________
Chief Executive Director Chief Financial Officer
The Company has not disclosed the fair values for all other financial assets and financial liabilities, as these are either short term in nature or reprice periodically.
Therefore, their carrying amounts are reasonable approximation of fair value.
This condensed interim unconsolidated financial information was authorized for issue in the Board of Directors meeting held on 29 Janaury 2018.
Carrying amount Fair value
The unquoted investments and investments in subsidiaries and associates are stated at cost.
30 June 2017 (Audited)
Investment property fair value have been determined by professional valuers (level 3 measurement) based on their assessment of the market values. The valuations
are conducted by the valuation experts appointed by the Company. The valuation experts used a market based approach to arrive at the fair value of the Company's
investment properties. The effect of changes in the unobservable inputs used in the valuations cannot be determined with certainty, accordingly a qualitative
disclosure of sensitivity has not been presented in these condensed interim unconsolidated financial information.
---------------------------------------------------------------------------(Rupees in '000)------------------------------------------------------------------------------
31 December 2017 (Un-audited)
Carrying amount Fair value
---------------------------------------------------------------------------(Rupees in '000)------------------------------------------------------------------------------
31
Crescent Steel and Allied Products Limited
CONDENSED INTERIM CONSOLIDATED FINANCIAL INFORMATION FOR THE SIX MONTHS ENDED 31 DECEMBER 2017
32
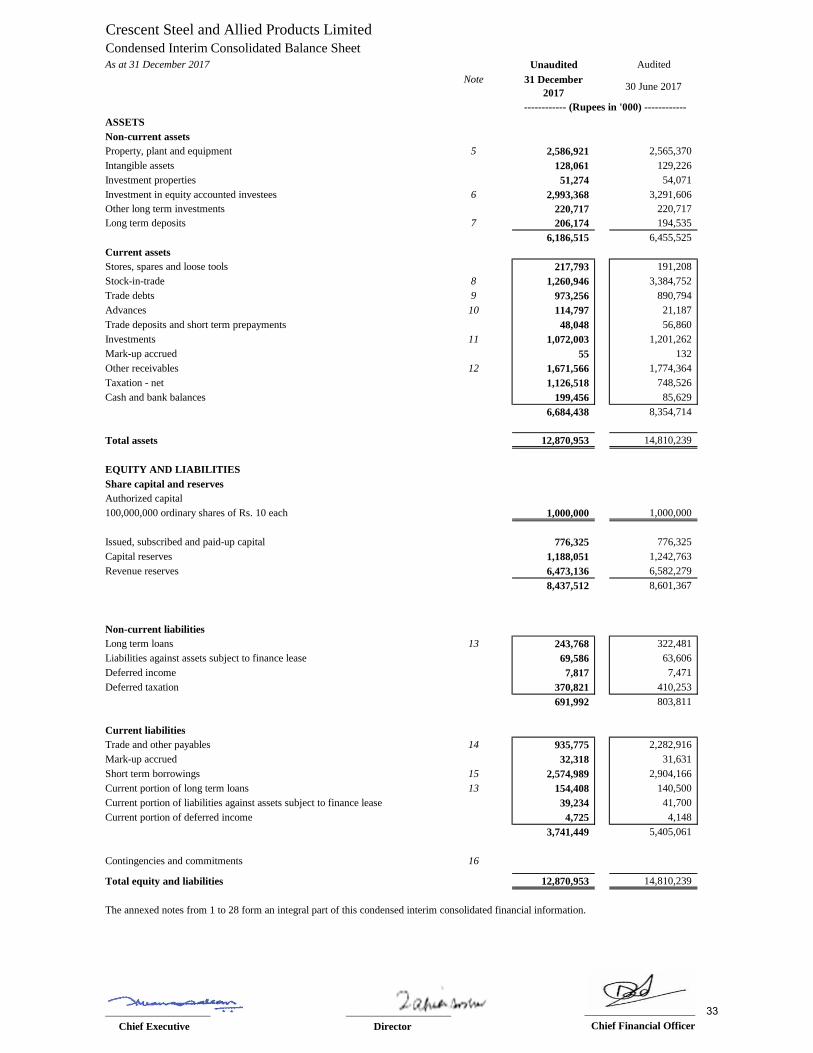
Crescent Steel and Allied Products Limited
Condensed Interim Consolidated Balance Sheet
As at 31 December 2017 Unaudited Audited
Note 31 December
201730 June 2017
ASSETS
Non-current assets
Property, plant and equipment 5 2,586,921 2,565,370
Intangible assets 128,061 129,226
Investment properties 51,274 54,071
Investment in equity accounted investees 6 2,993,368 3,291,606
Other long term investments 220,717 220,717
Long term deposits 7 206,174 194,535
6,186,515 6,455,525
Current assets
Stores, spares and loose tools 217,793 191,208
Stock-in-trade 8 1,260,946 3,384,752
Trade debts 9 973,256 890,794
Advances 10 114,797 21,187
Trade deposits and short term prepayments 48,048 56,860
Investments 11 1,072,003 1,201,262
Mark-up accrued 55 132
Other receivables 12 1,671,566 1,774,364
Taxation - net 1,126,518 748,526
Cash and bank balances 199,456 85,629
6,684,438 8,354,714
Total assets 12,870,953 14,810,239
EQUITY AND LIABILITIES
Share capital and reserves
Authorized capital
100,000,000 ordinary shares of Rs. 10 each 1,000,000 1,000,000
Issued, subscribed and paid-up capital 776,325 776,325
Capital reserves 1,188,051 1,242,763
Revenue reserves 6,473,136 6,582,279
8,437,512 8,601,367
Non-current liabilities
Long term loans 13 243,768 322,481
Liabilities against assets subject to finance lease 69,586 63,606
Deferred income 7,817 7,471
Deferred taxation 370,821 410,253
691,992 803,811
Current liabilities
Trade and other payables 14 935,775 2,282,916
Mark-up accrued 32,318 31,631
Short term borrowings 15 2,574,989 2,904,166
Current portion of long term loans 13 154,408 140,500
Current portion of liabilities against assets subject to finance lease 39,234 41,700
Current portion of deferred income 4,725 4,148
3,741,449 5,405,061
Contingencies and commitments 16
Total equity and liabilities 12,870,953 14,810,239
The annexed notes from 1 to 28 form an integral part of this condensed interim consolidated financial information.
____________________ ____________________
Chief Executive Director
------------ (Rupees in '000) ------------
Chief Financial Officer
_____________________ 33
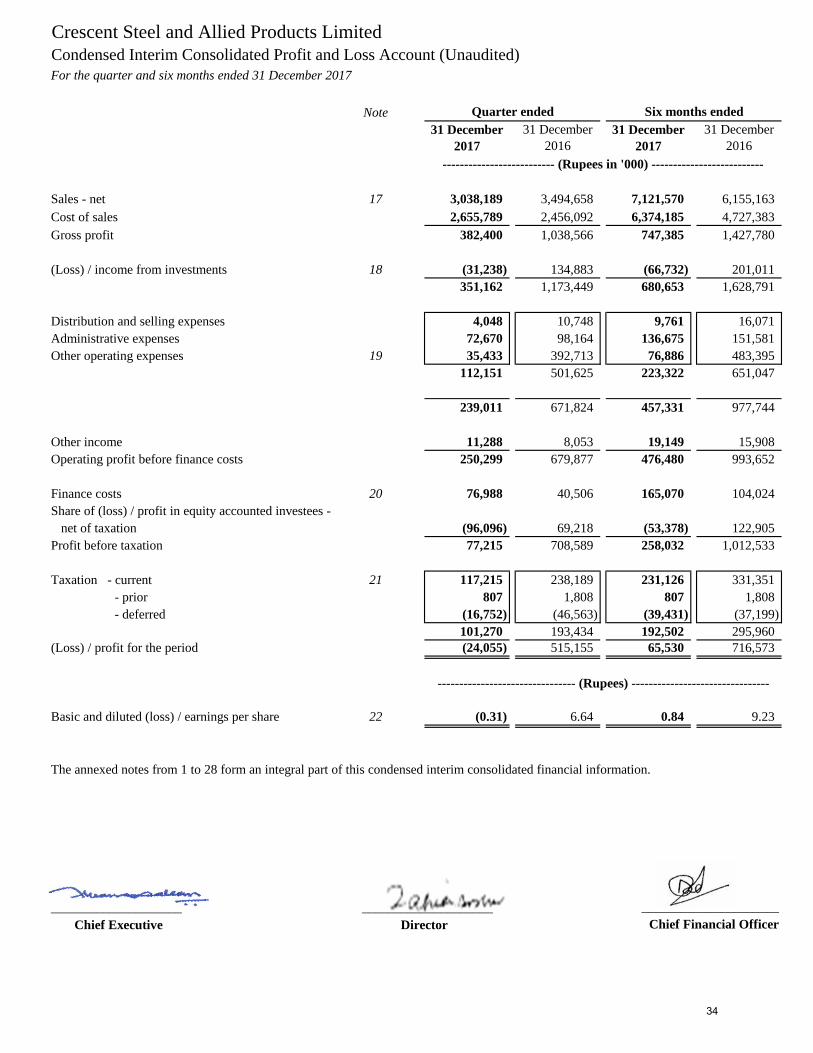
Crescent Steel and Allied Products Limited
Condensed Interim Consolidated Profit and Loss Account (Unaudited)
For the quarter and six months ended 31 December 2017
Note
Sales - net 17 3,038,189 3,494,658 7,121,570 6,155,163
Cost of sales 2,655,789 2,456,092 6,374,185 4,727,383
Gross profit 382,400 1,038,566 747,385 1,427,780
(Loss) / income from investments 18 (31,238) 134,883 (66,732) 201,011
351,162 1,173,449 680,653 1,628,791
Distribution and selling expenses 4,048 10,748 9,761 16,071
Administrative expenses 72,670 98,164 136,675 151,581
Other operating expenses 19 35,433 392,713 76,886 483,395
112,151 501,625 223,322 651,047
239,011 671,824 457,331 977,744
Other income 11,288 8,053 19,149 15,908
Operating profit before finance costs 250,299 679,877 476,480 993,652
Finance costs 20 76,988 40,506 165,070 104,024
Share of (loss) / profit in equity accounted investees -
net of taxation (96,096) 69,218 (53,378) 122,905
Profit before taxation 77,215 708,589 258,032 1,012,533
Taxation - current 21 117,215 238,189 231,126 331,351
- prior 807 1,808 807 1,808
- deferred (16,752) (46,563) (39,431) (37,199)
101,270 193,434 192,502 295,960
(Loss) / profit for the period (24,055) 515,155 65,530 716,573
Basic and diluted (loss) / earnings per share 22 (0.31) 6.64 0.84 9.23
The annexed notes from 1 to 28 form an integral part of this condensed interim consolidated financial information.
____________________ ____________________
Chief Executive Director Chief Financial Officer
_____________________
-------------------------------- (Rupees) --------------------------------
Quarter ended Six months ended
31 December
2017
31 December
2016
31 December
2017
31 December
2016
-------------------------- (Rupees in '000) --------------------------
34
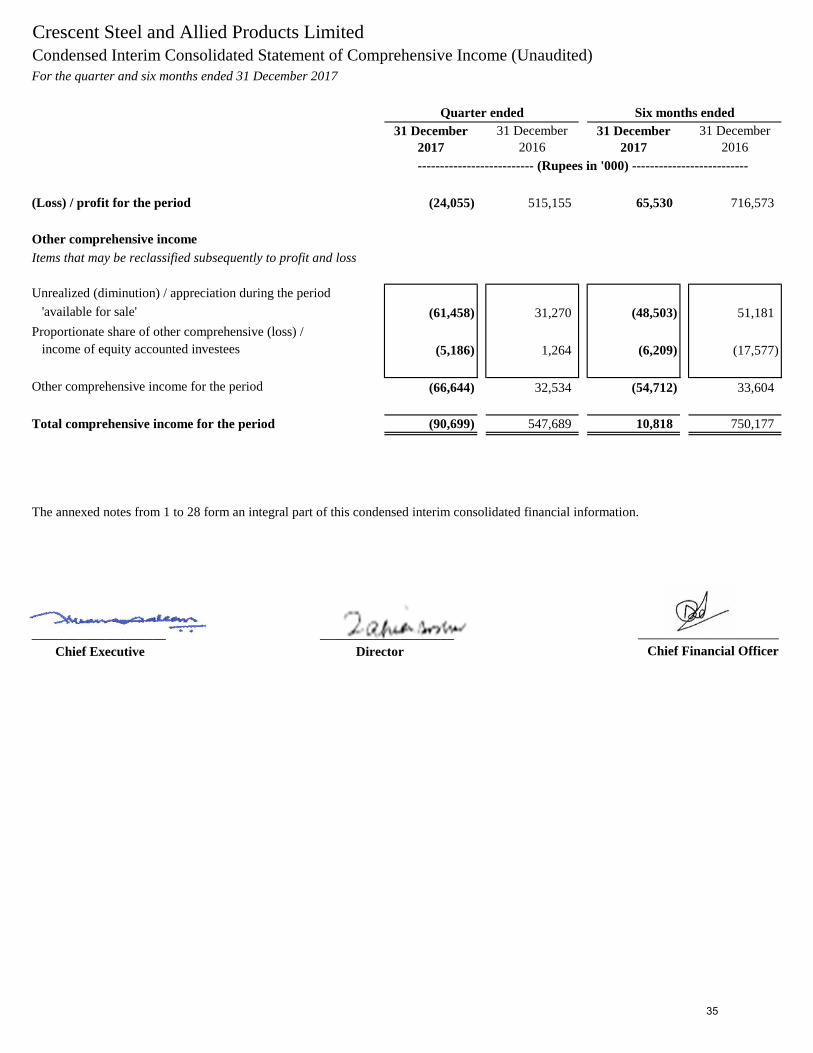
Crescent Steel and Allied Products Limited
Condensed Interim Consolidated Statement of Comprehensive Income (Unaudited)
For the quarter and six months ended 31 December 2017
(Loss) / profit for the period (24,055) 515,155 65,530 716,573
Other comprehensive income
Items that may be reclassified subsequently to profit and loss
Unrealized (diminution) / appreciation during the period
'available for sale' (61,458) 31,270 (48,503) 51,181
Proportionate share of other comprehensive (loss) /
income of equity accounted investees (5,186) 1,264 (6,209) (17,577)
Other comprehensive income for the period (66,644) 32,534 (54,712) 33,604
Total comprehensive income for the period (90,699) 547,689 10,818 750,177
The annexed notes from 1 to 28 form an integral part of this condensed interim consolidated financial information.
____________________ ____________________
Chief Executive Director Chief Financial Officer
31 December
2017
31 December
2016
31 December
2017
31 December
2016
_____________________
-------------------------- (Rupees in '000) --------------------------
Quarter ended Six months ended
35
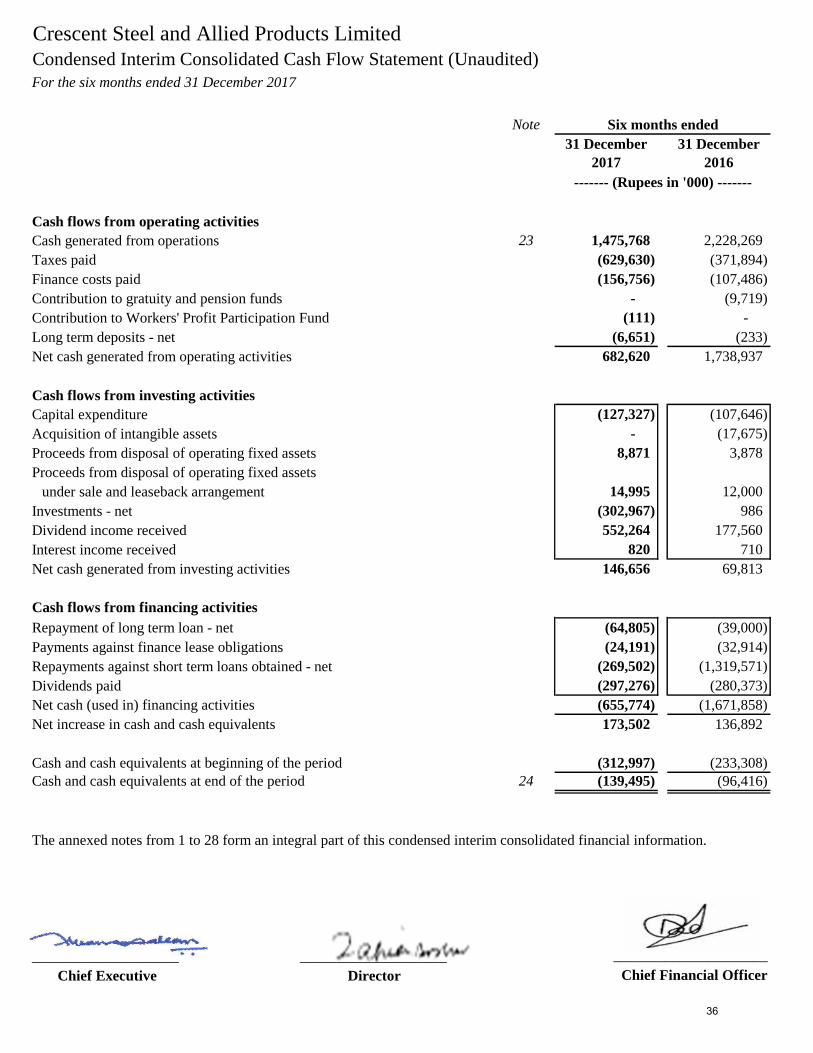
Crescent Steel and Allied Products Limited
Condensed Interim Consolidated Cash Flow Statement (Unaudited)
For the six months ended 31 December 2017
Note
Cash flows from operating activities
Cash generated from operations 23 1,475,768 2,228,269
Taxes paid (629,630) (371,894)
Finance costs paid (156,756) (107,486)
Contribution to gratuity and pension funds - (9,719)
Contribution to Workers' Profit Participation Fund (111) -
Long term deposits - net (6,651) (233)
Net cash generated from operating activities 682,620 1,738,937
Cash flows from investing activities
Capital expenditure (127,327) (107,646)
Acquisition of intangible assets - (17,675)
Proceeds from disposal of operating fixed assets 8,871 3,878
Proceeds from disposal of operating fixed assets
under sale and leaseback arrangement 14,995 12,000
Investments - net (302,967) 986
Dividend income received 552,264 177,560
Interest income received 820 710
Net cash generated from investing activities 146,656 69,813
Cash flows from financing activitiesProceeds from long term loan / (repayments against long term loan) - net
Repayment of long term loan - net (64,805) (39,000)
Payments against finance lease obligations (24,191) (32,914)
Repayments against short term loans obtained - net (269,502) (1,319,571)
Dividends paid (297,276) (280,373)
Net cash (used in) financing activities (655,774) (1,671,858)
Net increase in cash and cash equivalents 173,502 136,892
Cash and cash equivalents at beginning of the period (312,997) (233,308)
Cash and cash equivalents at end of the period 24 (139,495) (96,416)
The annexed notes from 1 to 28 form an integral part of this condensed interim consolidated financial information.
____________________ ____________________
Chief Executive Director
Six months ended
31 December
2017
31 December
2016
_____________________
Chief Financial Officer
------- (Rupees in '000) -------
36
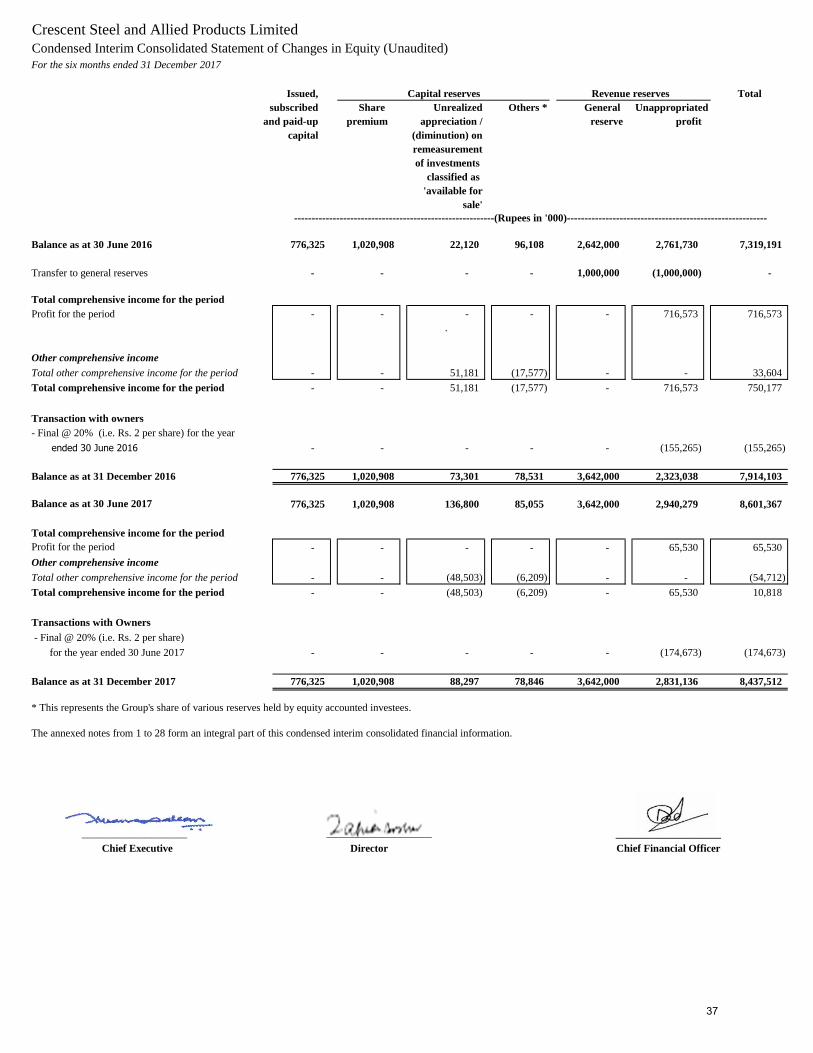
Crescent Steel and Allied Products Limited
Condensed Interim Consolidated Statement of Changes in Equity (Unaudited)
For the six months ended 31 December 2017
Issued, Total
subscribed Share Unrealized Others * General
and paid-up premium appreciation / reserve profit
capital (diminution) on
remeasurement
of investments
classified as
'available for
sale'
Balance as at 30 June 2016 776,325 1,020,908 22,120 96,108 2,642,000 2,761,730 7,319,191
Transfer to general reserves - - - - 1,000,000 (1,000,000) -
Total comprehensive income for the period
Profit for the period - - - - - 716,573 716,573
.
Other comprehensive income
Total other comprehensive income for the period - - 51,181 (17,577) - - 33,604
Total comprehensive income for the period - - 51,181 (17,577) - 716,573 750,177
Transaction with owners
- Final @ 20% (i.e. Rs. 2 per share) for the year
ended 30 June 2016 - - - - - (155,265) (155,265)
Balance as at 31 December 2016 776,325 1,020,908 73,301 78,531 3,642,000 2,323,038 7,914,103
Balance as at 30 June 2017 776,325 1,020,908 136,800 85,055 3,642,000 2,940,279 8,601,367
Total comprehensive income for the period
Profit for the period - - - - - 65,530 65,530
Other comprehensive income
Total other comprehensive income for the period - - (48,503) (6,209) - - (54,712)
Total comprehensive income for the period - - (48,503) (6,209) - 65,530 10,818
Transactions with Owners
- Final @ 20% (i.e. Rs. 2 per share)
for the year ended 30 June 2017 - - - - - (174,673) (174,673)
Balance as at 31 December 2017 776,325 1,020,908 88,297 78,846 3,642,000 2,831,136 8,437,512
* This represents the Group's share of various reserves held by equity accounted investees.
The annexed notes from 1 to 28 form an integral part of this condensed interim consolidated financial information.
____________________ ____________________
Chief Executive Director Chief Financial Officer
Capital reserves
____________________
---------------------------------------------------------(Rupees in '000)---------------------------------------------------------
Revenue reserves
Unappropriated
37
Crescent Steel and Allied Products LimitedNotes to the Condensed Interim Consolidated Financial Information (Unaudited)For the six months ended 31 December 2017
1. THE GROUP AND ITS OPERATIONS
1.1
1.2
1.3
1.4
1.5
1.6 Crescent Continental Gas Pipelines Limited is not carrying on any business operations.
1.7
2. BASIS OF PREPARATION
2.1
2.2
2.3
This condensed interim consolidated financial information of the Group for the six months ended 31 December 2017 has
been prepared in accordance with the requirements of the International Accounting Standards 34 "Interim Financial
Reporting" and provisions of and directives issued under the repealed Companies Ordinance, 1984. In case where
requirements differ, the provisions of and directives of the repealed Companies Ordinance, 1984 have been followed.
This condensed interim consolidated financial information of the Group does not include all of the information required
for annual consolidated financial statements and should be read in conjunction with the annual consolidated financial
statements of the Group as at and for the year ended 30 June 2017. However, selected explanatory notes are included to
explain events and transactions that are significant to an understanding of the changes in the Company’s financial position
and performance since the last consolidated financial statements.
This condensed interim consolidated financial information is presented in Pakistan Rupees which is also the Group's
functional currency and all financial information presented has been rounded off to the nearest thousand, except otherwise
stated.
Details regarding the Group's associates are given in note 6 to this condensed interim consolidated financial information.
The Group consists of Crescent Steel and Allied Products Limited ('the Holding Company') and its wholly owned
subsidiary companies namely; Shakarganj Energy (Private) Limited, CS Capital (Private) Limited, Crescent Hadeed
(Private) Limited and Crescent Continental Gas Pipelines Limited.
The Holding Company was incorporated on 1 August 1983 as a public limited company in Pakistan under the repealed
Companies Act, 1913 (now Companies Act, 2017) and is quoted on the Pakistan Stock Exchange. The registered office of
the Holding Company and its subsidiaries companies are located at E- Floor, IT Tower, 73-E/1, Hali Road, Gulberg III,
Lahore, where as its principal offices are situated at 9th floor, SIDCO Avenue Centre, 264 R.A. Lines, Karachi.
Shakarganj Energy (Private) Limited was incorporated on 2 April 2008 as a private limited company in Pakistan under the
repealed Companies Ordinance, 1984 (now Companies Act, 2017). The Holding Company acquired this subsidiary on 4
January 2010. The principal activity of the Subsidiary Company is to build, own, operate and maintain a power plant and
to generate, accumulate, distribute, sell and supply electricity / power to the Pakistan Electric Power Company (Private)
Limited (PEPCO) / power distribution companies under agreement(s) with the Government of Pakistan or to any other
consumer as permitted.
CS Capital (Private) Limited was incorporated on 5 November 2010 as a private limited company in Pakistan under the
repealed Companies Ordinance, 1984 (now Companies Act, 2017). The Holding Company acquired this subsidiary on 26
September 2011. The principal activity of the Subsidiary Company is to manage portfolio of shares, commodities and other
securities (strategic as well as short term).
Crescent Hadeed (Private) Limited was incorporated on 15 May 2013 as a private limited company in Pakistan under the
repealed Companies Ordinance, 1984 (Companies Act, 2017). The principal activity of the Subsidiary Company is to
manufacture steel billets.
38
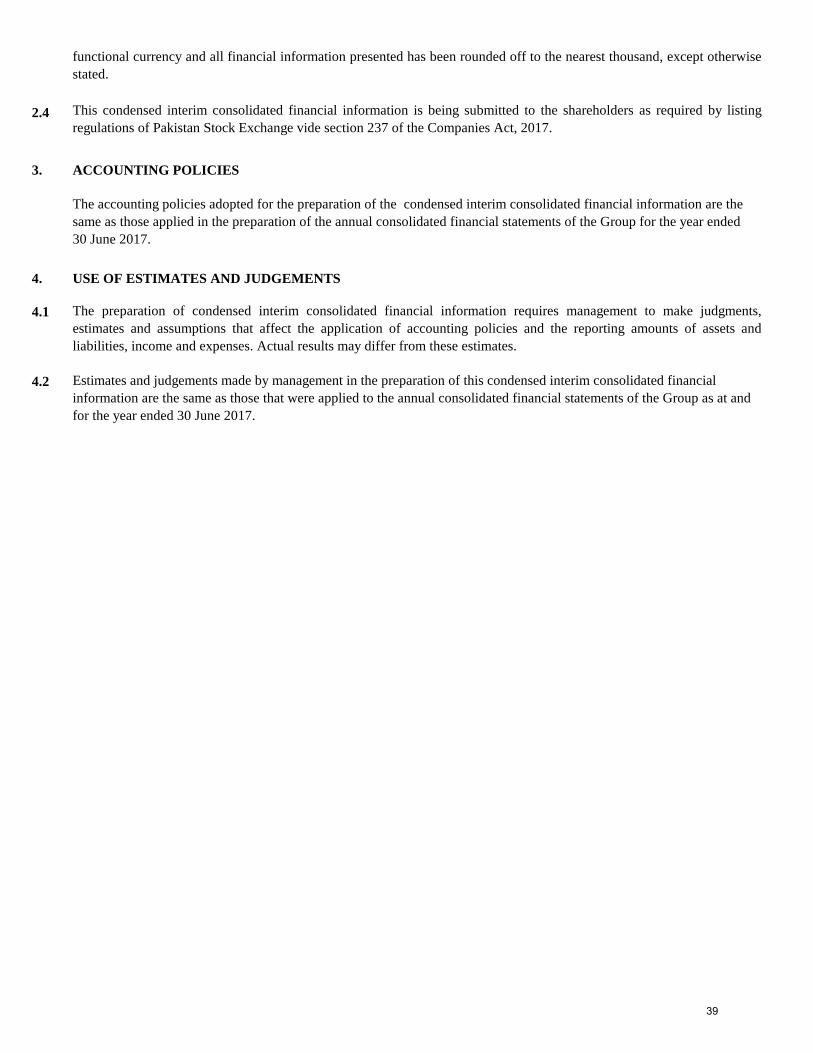
2.4
3. ACCOUNTING POLICIES
4. USE OF ESTIMATES AND JUDGEMENTS
4.1
4.2
This condensed interim consolidated financial information is being submitted to the shareholders as required by listing
regulations of Pakistan Stock Exchange vide section 237 of the Companies Act, 2017.
Estimates and judgements made by management in the preparation of this condensed interim consolidated financial
information are the same as those that were applied to the annual consolidated financial statements of the Group as at and
for the year ended 30 June 2017.
The accounting policies adopted for the preparation of the condensed interim consolidated financial information are the
same as those applied in the preparation of the annual consolidated financial statements of the Group for the year ended
30 June 2017.
The preparation of condensed interim consolidated financial information requires management to make judgments,
estimates and assumptions that affect the application of accounting policies and the reporting amounts of assets and
liabilities, income and expenses. Actual results may differ from these estimates.
This condensed interim consolidated financial information is presented in Pakistan Rupees which is also the Group's
functional currency and all financial information presented has been rounded off to the nearest thousand, except otherwise
stated.
39
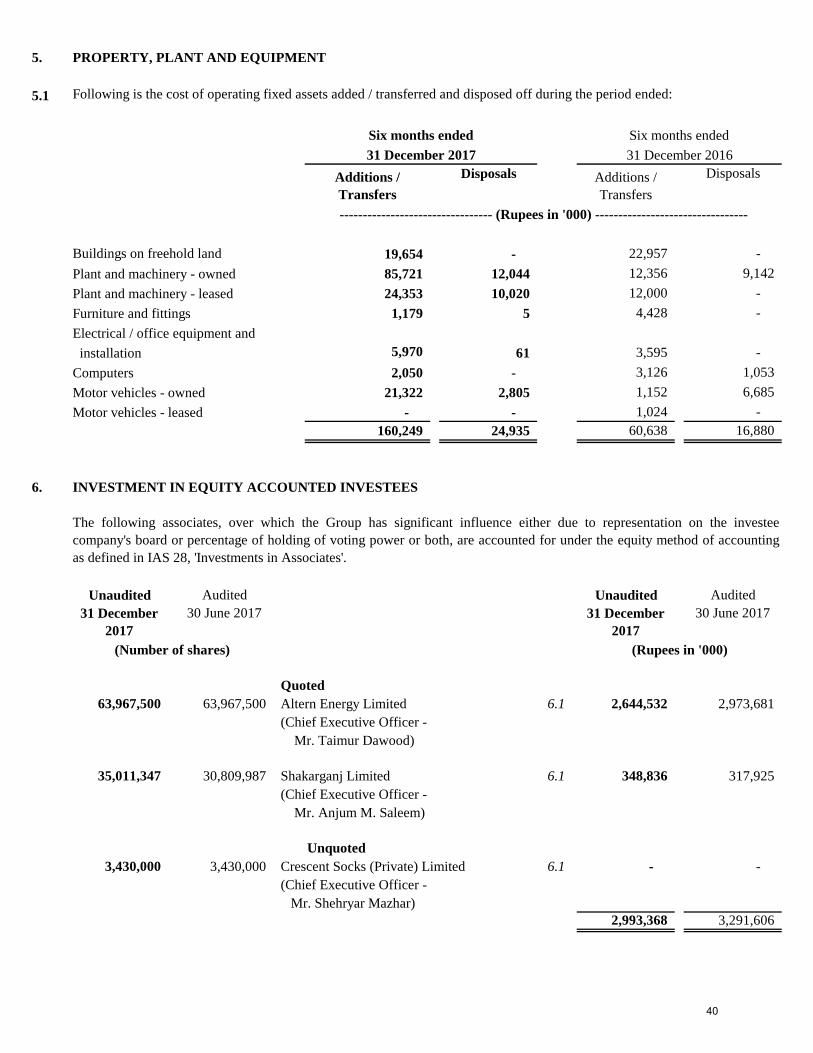
5. PROPERTY, PLANT AND EQUIPMENT
5.1
Buildings on freehold land 19,654 - 22,957 -
Plant and machinery - owned 85,721 12,044 12,356 9,142
Plant and machinery - leased 24,353 10,020 12,000 -
Furniture and fittings 1,179 5 4,428 -
Electrical / office equipment and
installation 5,970 61 3,595 -
Computers 2,050 - 3,126 1,053
Motor vehicles - owned 21,322 2,805 1,152 6,685
Motor vehicles - leased - - 1,024 -
160,249 24,935 60,638 16,880
6. INVESTMENT IN EQUITY ACCOUNTED INVESTEES
Unaudited Audited Unaudited Audited
(Number of shares) (Rupees in '000)
Quoted
63,967,500 63,967,500 Altern Energy Limited 6.1 2,644,532 2,973,681
(Chief Executive Officer -
Mr. Taimur Dawood)
35,011,347 30,809,987 Shakarganj Limited 6.1 348,836 317,925
(Chief Executive Officer -
Mr. Anjum M. Saleem)
Unquoted
3,430,000 3,430,000 Crescent Socks (Private) Limited 6.1 - -
(Chief Executive Officer -
Mr. Shehryar Mazhar)
2,993,368 3,291,606
Six months ended
Following is the cost of operating fixed assets added / transferred and disposed off during the period ended:
The following associates, over which the Group has significant influence either due to representation on the investee
company's board or percentage of holding of voting power or both, are accounted for under the equity method of accounting
as defined in IAS 28, 'Investments in Associates'.
31 December 2017 31 December 2016
--------------------------------- (Rupees in '000) ---------------------------------
Additions /
Transfers
Additions /
Transfers
Disposals Disposals
Six months ended
31 December
2017
31 December
2017
30 June 2017 30 June 2017
40
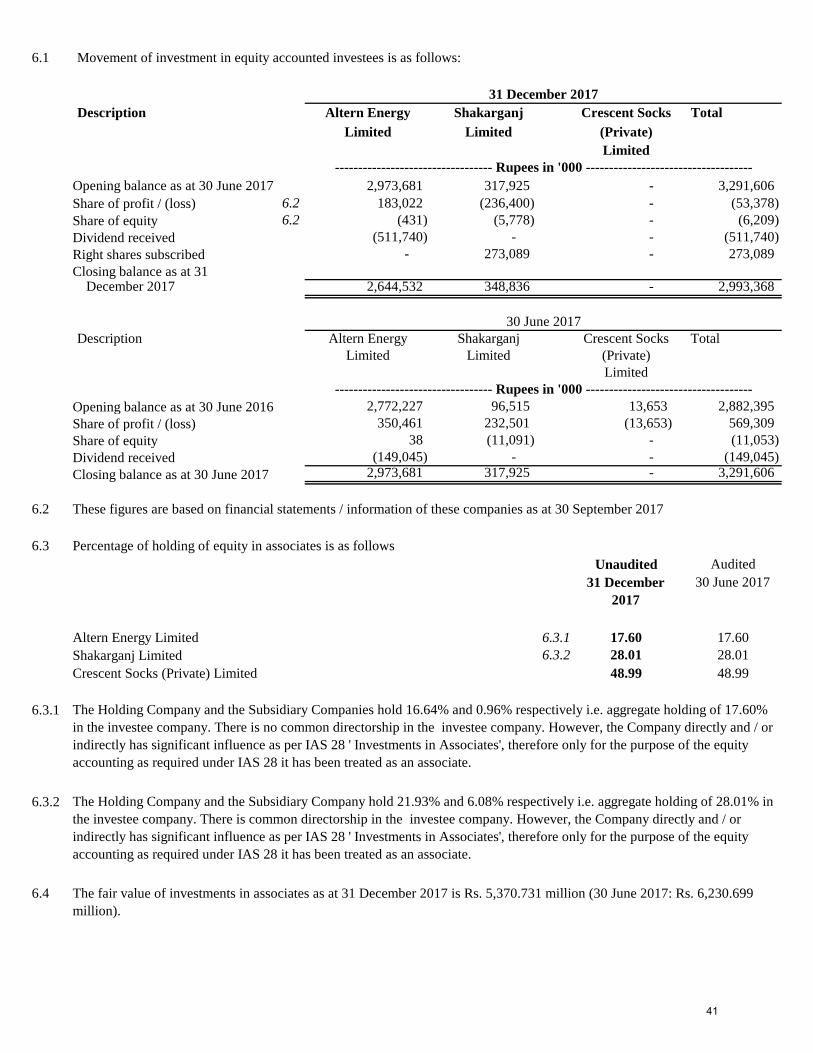
6.1 Movement of investment in equity accounted investees is as follows:
Description Altern Energy Shakarganj Crescent Socks Total
Limited Limited (Private)
Limited
Opening balance as at 30 June 2017 2,973,681 317,925 - 3,291,606
Share of profit / (loss) 6.2 183,022 (236,400) - (53,378)
Share of equity 6.2 (431) (5,778) - (6,209)
Dividend received (511,740) - - (511,740)
Right shares subscribed - 273,089 - 273,089
Closing balance as at 31 December 2017 2,644,532 348,836 - 2,993,368
Description Altern Energy Shakarganj Crescent Socks Total
Limited Limited (Private)
Limited
Opening balance as at 30 June 2016 2,772,227 96,515 13,653 2,882,395
Share of profit / (loss) 350,461 232,501 (13,653) 569,309
Share of equity 38 (11,091) - (11,053)
Dividend received (149,045) - - (149,045)
Closing balance as at 30 June 2017 2,973,681 317,925 - 3,291,606
6.2 These figures are based on financial statements / information of these companies as at 30 September 2017
6.3 Percentage of holding of equity in associates is as follows
Unaudited Audited
Altern Energy Limited 6.3.1 17.60 17.60
Shakarganj Limited 6.3.2 28.01 28.01
Crescent Socks (Private) Limited 48.99 48.99
6.3.1
6.3.2
6.4
31 December 2017
30 June 2017
The fair value of investments in associates as at 31 December 2017 is Rs. 5,370.731 million (30 June 2017: Rs. 6,230.699
million).
---------------------------------- Rupees in '000 ------------------------------------
---------------------------------- Rupees in '000 ------------------------------------
31 December
2017
30 June 2017
The Holding Company and the Subsidiary Companies hold 16.64% and 0.96% respectively i.e. aggregate holding of 17.60%
in the investee company. There is no common directorship in the investee company. However, the Company directly and / or
indirectly has significant influence as per IAS 28 ' Investments in Associates', therefore only for the purpose of the equity
accounting as required under IAS 28 it has been treated as an associate.
The Holding Company and the Subsidiary Company hold 21.93% and 6.08% respectively i.e. aggregate holding of 28.01% in
the investee company. There is common directorship in the investee company. However, the Company directly and / or
indirectly has significant influence as per IAS 28 ' Investments in Associates', therefore only for the purpose of the equity
accounting as required under IAS 28 it has been treated as an associate.
41
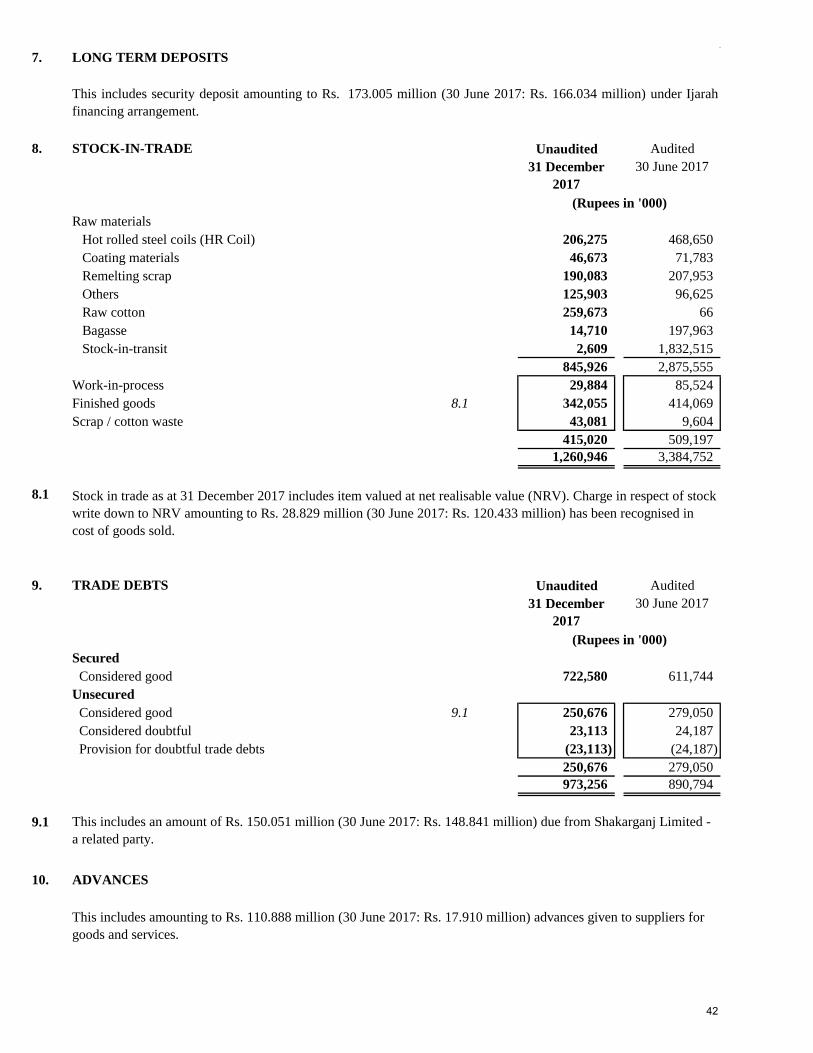
7. LONG TERM DEPOSITS
8. STOCK-IN-TRADE Unaudited Audited
(Rupees in '000)
Raw materials
Hot rolled steel coils (HR Coil) 206,275 468,650
Coating materials 46,673 71,783
Remelting scrap 190,083 207,953
Others 125,903 96,625
Raw cotton 259,673 66
Bagasse 14,710 197,963
Stock-in-transit 2,609 1,832,515
845,926 2,875,555
Work-in-process 29,884 85,524
Finished goods 8.1 342,055 414,069
Scrap / cotton waste 43,081 9,604
415,020 509,197
1,260,946 3,384,752
8.1
9. TRADE DEBTS Unaudited Audited
(Rupees in '000)
Secured
Considered good 722,580 611,744
Unsecured
Considered good 9.1 250,676 279,050
Considered doubtful 23,113 24,187
Provision for doubtful trade debts (23,113) (24,187)
250,676 279,050
973,256 890,794
9.1
10. ADVANCES
This includes amounting to Rs. 110.888 million (30 June 2017: Rs. 17.910 million) advances given to suppliers for
goods and services.
This includes an amount of Rs. 150.051 million (30 June 2017: Rs. 148.841 million) due from Shakarganj Limited -
a related party.
31 December
2017
30 June 2017
Stock in trade as at 31 December 2017 includes item valued at net realisable value (NRV). Charge in respect of stock
write down to NRV amounting to Rs. 28.829 million (30 June 2017: Rs. 120.433 million) has been recognised in
cost of goods sold.
31 December
2017
30 June 2017
This includes security deposit amounting to Rs. 173.005 million (30 June 2017: Rs. 166.034 million) under Ijarah
financing arrangement.
42
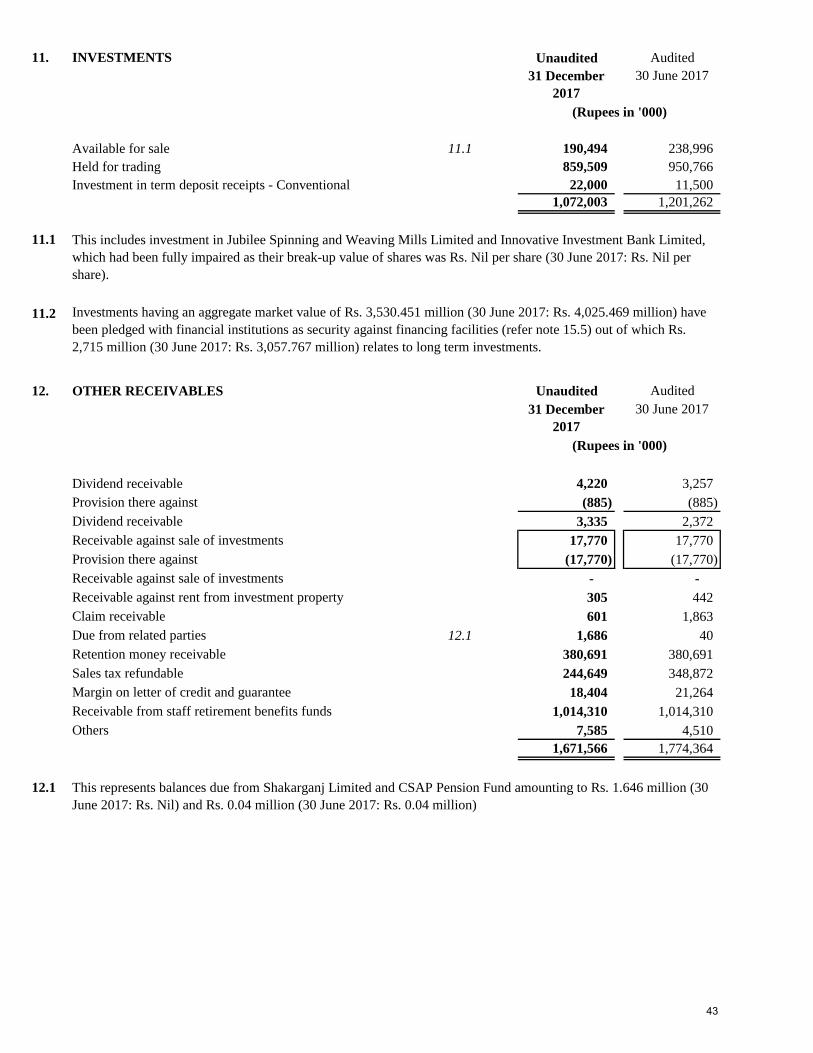
11. INVESTMENTS Unaudited Audited
(Rupees in '000)
Available for sale 11.1 190,494 238,996
Held for trading 859,509 950,766
Investment in term deposit receipts - Conventional 22,000 11,500
1,072,003 1,201,262
11.1
11.2
12. OTHER RECEIVABLES Unaudited Audited
(Rupees in '000)
Dividend receivable 4,220 3,257
Provision there against (885) (885)
Dividend receivable 3,335 2,372
Receivable against sale of investments 17,770 17,770
Provision there against (17,770) (17,770)
Receivable against sale of investments - -
Receivable against rent from investment property 305 442
Claim receivable 601 1,863
Due from related parties 12.1 1,686 40
Retention money receivable 380,691 380,691
Sales tax refundable 244,649 348,872
Margin on letter of credit and guarantee 18,404 21,264
Receivable from staff retirement benefits funds 1,014,310 1,014,310
Others 7,585 4,510
1,671,566 1,774,364
12.1
31 December
2017
30 June 2017
Investments having an aggregate market value of Rs. 3,530.451 million (30 June 2017: Rs. 4,025.469 million) have
been pledged with financial institutions as security against financing facilities (refer note 15.5) out of which Rs.
2,715 million (30 June 2017: Rs. 3,057.767 million) relates to long term investments.
This includes investment in Jubilee Spinning and Weaving Mills Limited and Innovative Investment Bank Limited,
which had been fully impaired as their break-up value of shares was Rs. Nil per share (30 June 2017: Rs. Nil per
share).
This represents balances due from Shakarganj Limited and CSAP Pension Fund amounting to Rs. 1.646 million (30
June 2017: Rs. Nil) and Rs. 0.04 million (30 June 2017: Rs. 0.04 million)
31 December
2017
30 June 2017
43
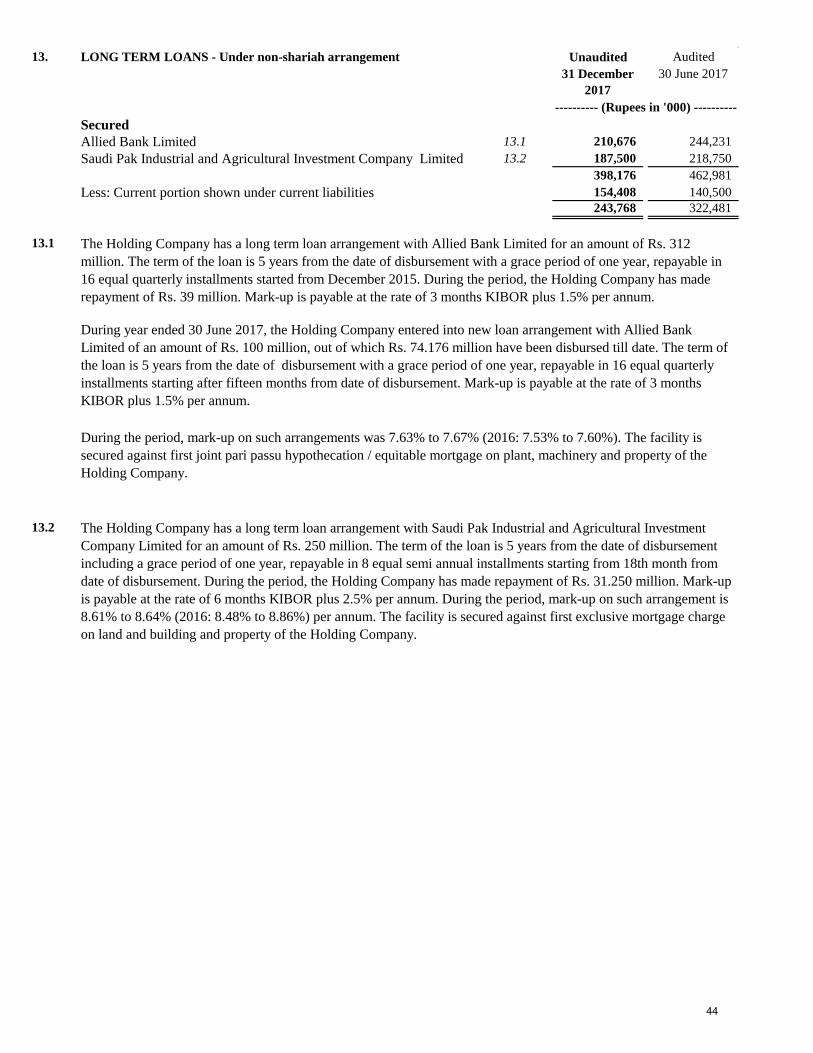
13. LONG TERM LOANS - Under non-shariah arrangement Unaudited Audited
Secured
Allied Bank Limited 13.1 210,676 244,231
Saudi Pak Industrial and Agricultural Investment Company Limited 13.2 187,500 218,750
398,176 462,981
Less: Current portion shown under current liabilities 154,408 140,500
243,768 322,481
13.1
13.2
30 June 2017
---------- (Rupees in '000) ----------
31 December
2017
The Holding Company has a long term loan arrangement with Allied Bank Limited for an amount of Rs. 312
million. The term of the loan is 5 years from the date of disbursement with a grace period of one year, repayable in
16 equal quarterly installments started from December 2015. During the period, the Holding Company has made
repayment of Rs. 39 million. Mark-up is payable at the rate of 3 months KIBOR plus 1.5% per annum.
During year ended 30 June 2017, the Holding Company entered into new loan arrangement with Allied Bank
Limited of an amount of Rs. 100 million, out of which Rs. 74.176 million have been disbursed till date. The term of
the loan is 5 years from the date of disbursement with a grace period of one year, repayable in 16 equal quarterly
installments starting after fifteen months from date of disbursement. Mark-up is payable at the rate of 3 months
KIBOR plus 1.5% per annum.
During the period, mark-up on such arrangements was 7.63% to 7.67% (2016: 7.53% to 7.60%). The facility is
secured against first joint pari passu hypothecation / equitable mortgage on plant, machinery and property of the
Holding Company.
The Holding Company has a long term loan arrangement with Saudi Pak Industrial and Agricultural Investment
Company Limited for an amount of Rs. 250 million. The term of the loan is 5 years from the date of disbursement
including a grace period of one year, repayable in 8 equal semi annual installments starting from 18th month from
date of disbursement. During the period, the Holding Company has made repayment of Rs. 31.250 million. Mark-up
is payable at the rate of 6 months KIBOR plus 2.5% per annum. During the period, mark-up on such arrangement is
8.61% to 8.64% (2016: 8.48% to 8.86%) per annum. The facility is secured against first exclusive mortgage charge
on land and building and property of the Holding Company.
44
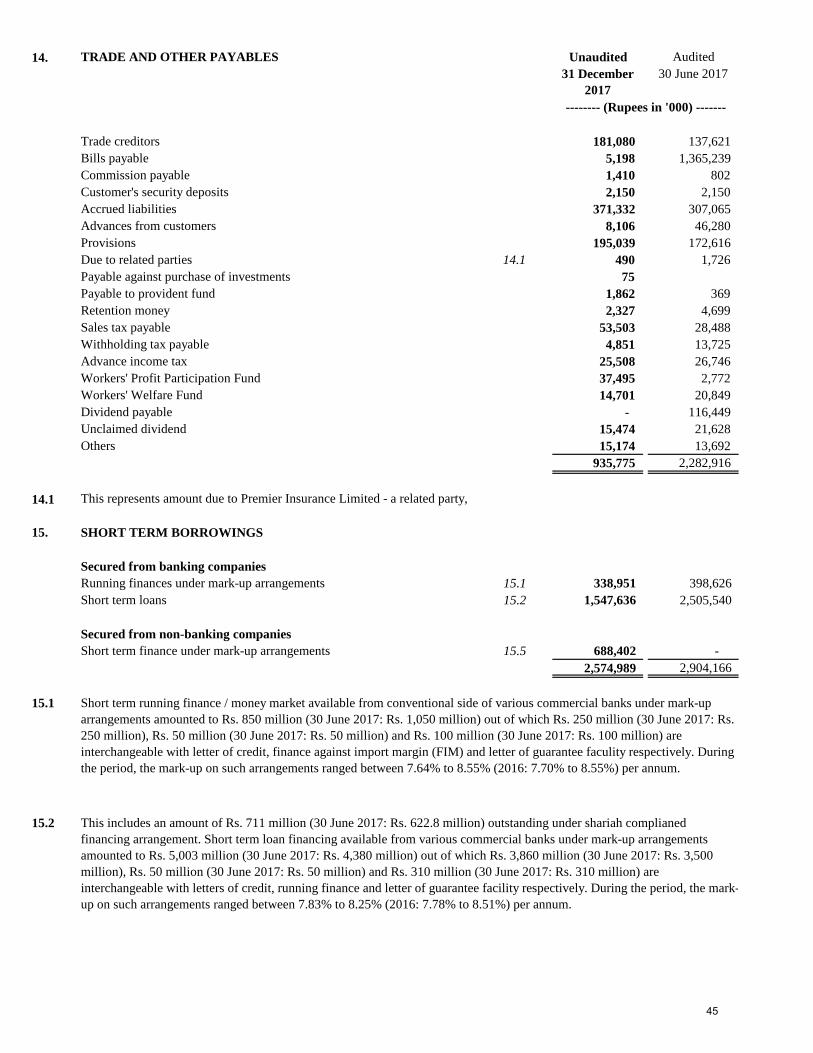
14. TRADE AND OTHER PAYABLES Unaudited Audited
Trade creditors 181,080 137,621
Bills payable 5,198 1,365,239
Commission payable 1,410 802
Customer's security deposits 2,150 2,150
Accrued liabilities 371,332 307,065
Advances from customers 8,106 46,280
Provisions 195,039 172,616
Due to related parties 14.1 490 1,726
Payable against purchase of investments 75
Payable to provident fund 1,862 369
Retention money 2,327 4,699
Sales tax payable 53,503 28,488
Withholding tax payable 4,851 13,725
Advance income tax 25,508 26,746
Workers' Profit Participation Fund 37,495 2,772
Workers' Welfare Fund 14,701 20,849
Dividend payable - 116,449
Unclaimed dividend 15,474 21,628
Others 15,174 13,692
935,775 2,282,916
14.1 This represents amount due to Premier Insurance Limited - a related party,
15. SHORT TERM BORROWINGS
Secured from banking companies
Running finances under mark-up arrangements 15.1 338,951 398,626
Short term loans 15.2 1,547,636 2,505,540
Secured from non-banking companies
Short term finance under mark-up arrangements 15.5 688,402 -
2,574,989 2,904,166
15.1
15.2
Short term running finance / money market available from conventional side of various commercial banks under mark-up
arrangements amounted to Rs. 850 million (30 June 2017: Rs. 1,050 million) out of which Rs. 250 million (30 June 2017: Rs.
250 million), Rs. 50 million (30 June 2017: Rs. 50 million) and Rs. 100 million (30 June 2017: Rs. 100 million) are
interchangeable with letter of credit, finance against import margin (FIM) and letter of guarantee faculity respectively. During
the period, the mark-up on such arrangements ranged between 7.64% to 8.55% (2016: 7.70% to 8.55%) per annum.
-------- (Rupees in '000) -------
This includes an amount of Rs. 711 million (30 June 2017: Rs. 622.8 million) outstanding under shariah complianed
financing arrangement. Short term loan financing available from various commercial banks under mark-up arrangements
amounted to Rs. 5,003 million (30 June 2017: Rs. 4,380 million) out of which Rs. 3,860 million (30 June 2017: Rs. 3,500
million), Rs. 50 million (30 June 2017: Rs. 50 million) and Rs. 310 million (30 June 2017: Rs. 310 million) are
interchangeable with letters of credit, running finance and letter of guarantee facility respectively. During the period, the mark-
up on such arrangements ranged between 7.83% to 8.25% (2016: 7.78% to 8.51%) per annum.
31 December
2017
30 June 2017
45
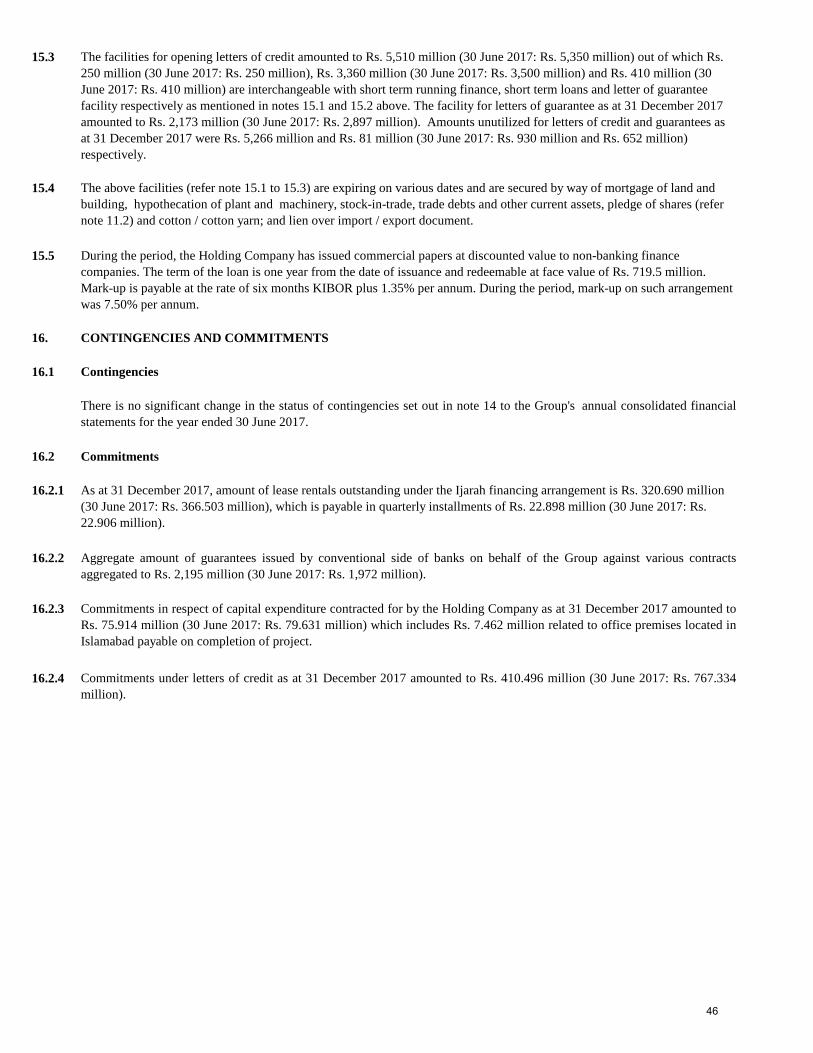
15.3
15.4
15.5
16. CONTINGENCIES AND COMMITMENTS
16.1 Contingencies
16.2 Commitments
16.2.1
16.2.2
16.2.3
16.2.4
The facilities for opening letters of credit amounted to Rs. 5,510 million (30 June 2017: Rs. 5,350 million) out of which Rs.
250 million (30 June 2017: Rs. 250 million), Rs. 3,360 million (30 June 2017: Rs. 3,500 million) and Rs. 410 million (30
June 2017: Rs. 410 million) are interchangeable with short term running finance, short term loans and letter of guarantee
facility respectively as mentioned in notes 15.1 and 15.2 above. The facility for letters of guarantee as at 31 December 2017
amounted to Rs. 2,173 million (30 June 2017: Rs. 2,897 million). Amounts unutilized for letters of credit and guarantees as
at 31 December 2017 were Rs. 5,266 million and Rs. 81 million (30 June 2017: Rs. 930 million and Rs. 652 million)
respectively.
The above facilities (refer note 15.1 to 15.3) are expiring on various dates and are secured by way of mortgage of land and
building, hypothecation of plant and machinery, stock-in-trade, trade debts and other current assets, pledge of shares (refer
note 11.2) and cotton / cotton yarn; and lien over import / export document.
During the period, the Holding Company has issued commercial papers at discounted value to non-banking finance
companies. The term of the loan is one year from the date of issuance and redeemable at face value of Rs. 719.5 million.
Mark-up is payable at the rate of six months KIBOR plus 1.35% per annum. During the period, mark-up on such arrangement
was 7.50% per annum.
Aggregate amount of guarantees issued by conventional side of banks on behalf of the Group against various contracts
aggregated to Rs. 2,195 million (30 June 2017: Rs. 1,972 million).
Commitments in respect of capital expenditure contracted for by the Holding Company as at 31 December 2017 amounted to
Rs. 75.914 million (30 June 2017: Rs. 79.631 million) which includes Rs. 7.462 million related to office premises located in
Islamabad payable on completion of project.
Commitments under letters of credit as at 31 December 2017 amounted to Rs. 410.496 million (30 June 2017: Rs. 767.334
million).
As at 31 December 2017, amount of lease rentals outstanding under the Ijarah financing arrangement is Rs. 320.690 million
(30 June 2017: Rs. 366.503 million), which is payable in quarterly installments of Rs. 22.898 million (30 June 2017: Rs.
22.906 million).
There is no significant change in the status of contingencies set out in note 14 to the Group's annual consolidated financial
statements for the year ended 30 June 2017.
46
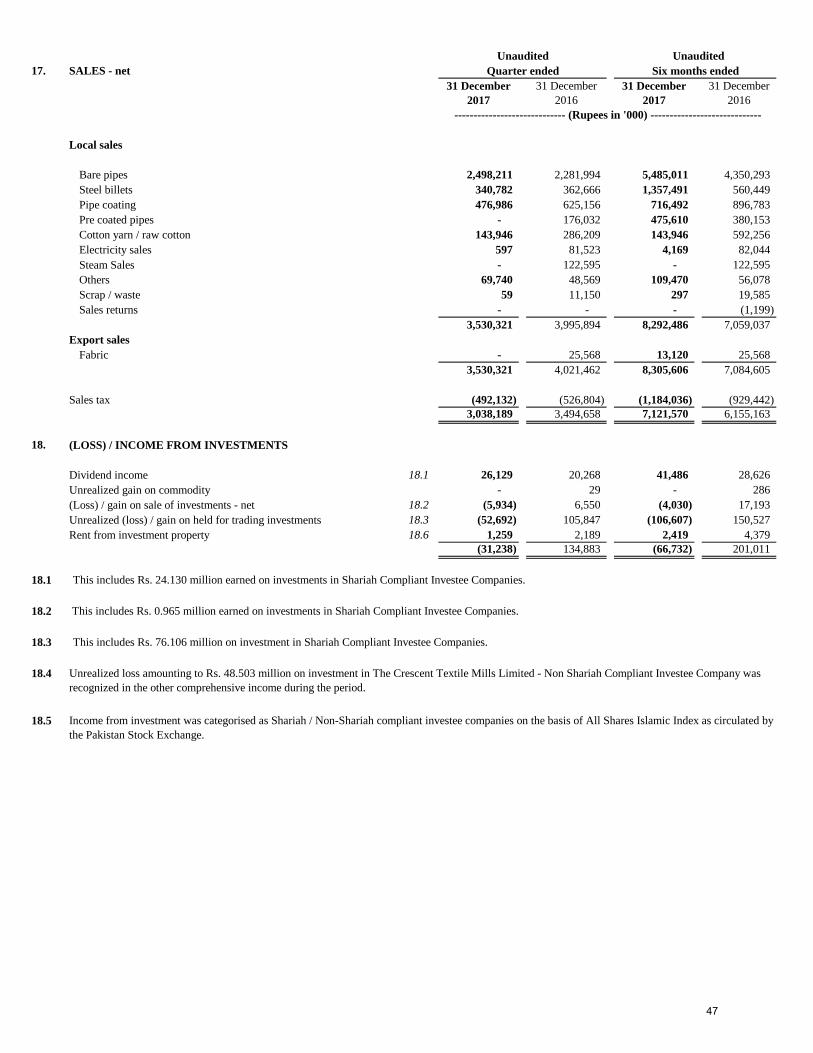
Unaudited Unaudited
17. SALES - net
Local sales
Bare pipes 2,498,211 2,281,994 5,485,011 4,350,293
Steel billets 340,782 362,666 1,357,491 560,449
Pipe coating 476,986 625,156 716,492 896,783
Pre coated pipes - 176,032 475,610 380,153
Cotton yarn / raw cotton 143,946 286,209 143,946 592,256
Electricity sales 597 81,523 4,169 82,044
Steam Sales - 122,595 - 122,595
Others 69,740 48,569 109,470 56,078
Scrap / waste 59 11,150 297 19,585
Sales returns - - - (1,199)
3,530,321 3,995,894 8,292,486 7,059,037
Export sales
Fabric - 25,568 13,120 25,568
3,530,321 4,021,462 8,305,606 7,084,605
Sales tax (492,132) (526,804) (1,184,036) (929,442)
3,038,189 3,494,658 7,121,570 6,155,163
18. (LOSS) / INCOME FROM INVESTMENTS
Dividend income 18.1 26,129 20,268 41,486 28,626
Unrealized gain on commodity - 29 - 286
(Loss) / gain on sale of investments - net 18.2 (5,934) 6,550 (4,030) 17,193
Unrealized (loss) / gain on held for trading investments 18.3 (52,692) 105,847 (106,607) 150,527
Rent from investment property 18.6 1,259 2,189 2,419 4,379
(31,238) 134,883 (66,732) 201,011
18.1
18.2
18.3
18.4
18.5
Quarter ended
31 December
2016
31 December
2017
31 December
2016
Six months ended
31 December
2017
This includes Rs. 76.106 million on investment in Shariah Compliant Investee Companies.
Unrealized loss amounting to Rs. 48.503 million on investment in The Crescent Textile Mills Limited - Non Shariah Compliant Investee Company was
recognized in the other comprehensive income during the period.
Income from investment was categorised as Shariah / Non-Shariah compliant investee companies on the basis of All Shares Islamic Index as circulated by
the Pakistan Stock Exchange.
----------------------------- (Rupees in '000) -----------------------------
This includes Rs. 0.965 million earned on investments in Shariah Compliant Investee Companies.
This includes Rs. 24.130 million earned on investments in Shariah Compliant Investee Companies.
47

18.6
19. OTHER OPERATING EXPENSES Unaudited Unaudited
------------------------------- (Rupees in '000) ----------------------------
Exchange loss 2,063 469 14,951 3,047
Provision for:
Workers' Profit Participation Fund 17,276 28,956 34,834 46,793
Workers' Welfare Fund 7,179 16,219 13,556 21,487
Other receivables - 885 - 885
Liquidated damages (4,630) 207,918 - 207,918
Slow moving stores, spares and loose tools 8,915 - 8,915 -
Liquidated damages 4,630 138,266 4,630 203,265
35,433 392,713 76,886 483,395
20. FINANCE COSTS
Mark-up on short term loans - Shariah arrangement 17,189 4,381 27,764 5,478
Interest on - Non - Shariah arrangement
- finance lease obligations 2,100 2,986 5,021 6,030
- long term loan 8,840 9,696 17,345 20,030
- running finances / short term loans 48,337 21,797 109,561 65,972
Discounting of lease deposit (136) 399 2,708 399
Bank charges 658 1,247 2,671 6,115
76,988 40,506 165,070 104,024
21. TAXATION
22. BASIC AND DILUTED EARNINGS PER SHARE
(Loss) / profit for the period (24,055) 515,155 65,530 716,573
Weighted average number of ordinary shares in issue
during the period 77,632,491 77,632,491 77,632,491 77,632,491
(Rupees) (Rupees)
Basic and diluted (loss) / earnings per share (0.31) 6.64 0.84 9.23
(Number of shares)(Number of shares)
Direct operating expenses incurred against rental income from investment property amounted to Rs. 3.031 million (2016: Rs. 3.385 million). Further, Rs.
0.334 million (2016: Rs. 0.513 million) were incurred against non rented out area.
The Board of Directors of the Company intends to distribute sufficient cash dividend for the year ending 30 June 2018 to comply with the requirements of
Section 5A of the Income Tax Ordinance, 2001. Accordingly, no provision for tax on undistributed reserves has been recognized in these condensed
interim consolidated financial information.
Six months ended
31 December
2016
31 December
2017
31 December
2016
Quarter ended
31 December
2017
48
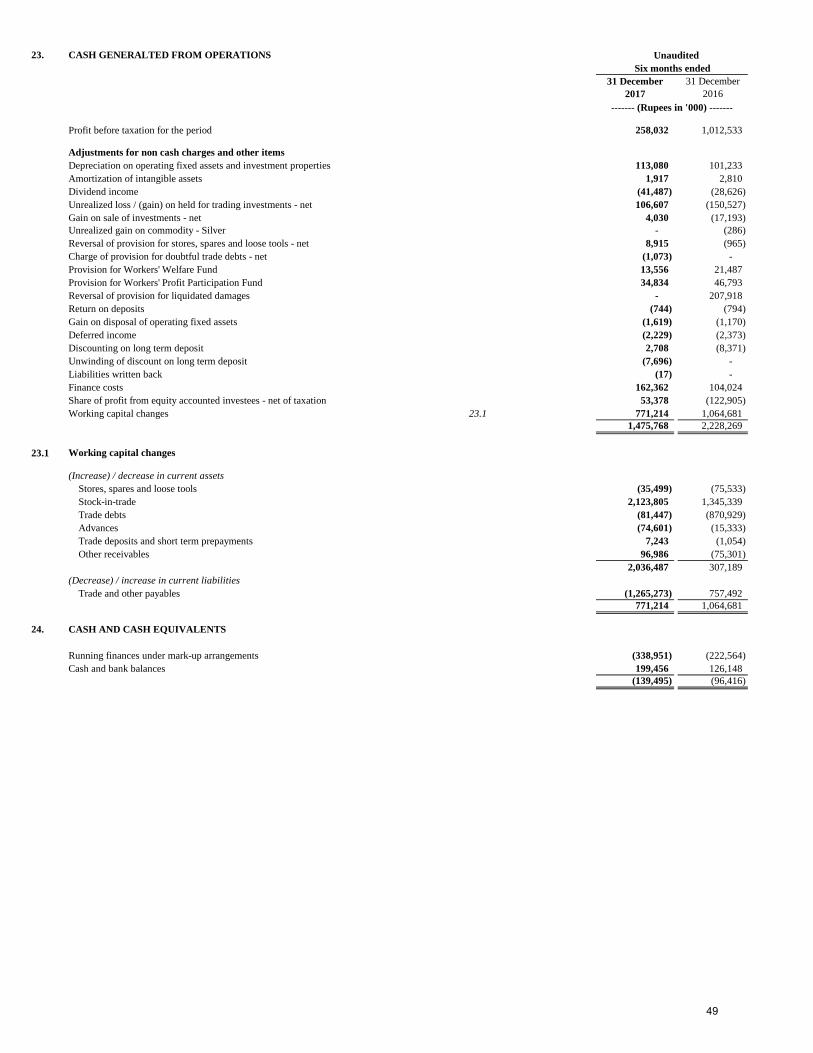
23. CASH GENERALTED FROM OPERATIONS Unaudited
Profit before taxation for the period 258,032 1,012,533
Adjustments for non cash charges and other items
Depreciation on operating fixed assets and investment properties 113,080 101,233
Amortization of intangible assets 1,917 2,810
Dividend income (41,487) (28,626)
Unrealized loss / (gain) on held for trading investments - net 106,607 (150,527)
Gain on sale of investments - net 4,030 (17,193)
Unrealized gain on commodity - Silver - (286)
Reversal of provision for stores, spares and loose tools - net 8,915 (965)
Charge of provision for doubtful trade debts - net (1,073) -
Provision for Workers' Welfare Fund 13,556 21,487
Provision for Workers' Profit Participation Fund 34,834 46,793
Reversal of provision for liquidated damages - 207,918
Return on deposits (744) (794)
Gain on disposal of operating fixed assets (1,619) (1,170)
Deferred income (2,229) (2,373)
Discounting on long term deposit 2,708 (8,371)
Unwinding of discount on long term deposit (7,696) -
Liabilities written back (17) -
Finance costs 162,362 104,024
Share of profit from equity accounted investees - net of taxation 53,378 (122,905)
Working capital changes 23.1 771,214 1,064,681
1,475,768 2,228,269
23.1 Working capital changes
(Increase) / decrease in current assets
Stores, spares and loose tools (35,499) (75,533)
Stock-in-trade 2,123,805 1,345,339
Trade debts (81,447) (870,929)
Advances (74,601) (15,333)
Trade deposits and short term prepayments 7,243 (1,054)
Other receivables 96,986 (75,301)
2,036,487 307,189
(Decrease) / increase in current liabilities
Trade and other payables (1,265,273) 757,492
771,214 1,064,681
24. CASH AND CASH EQUIVALENTS
Running finances under mark-up arrangements (338,951) (222,564)
Cash and bank balances 199,456 126,148
(139,495) (96,416)
Six months ended
31 December
2017
31 December
2016
------- (Rupees in '000) -------
49
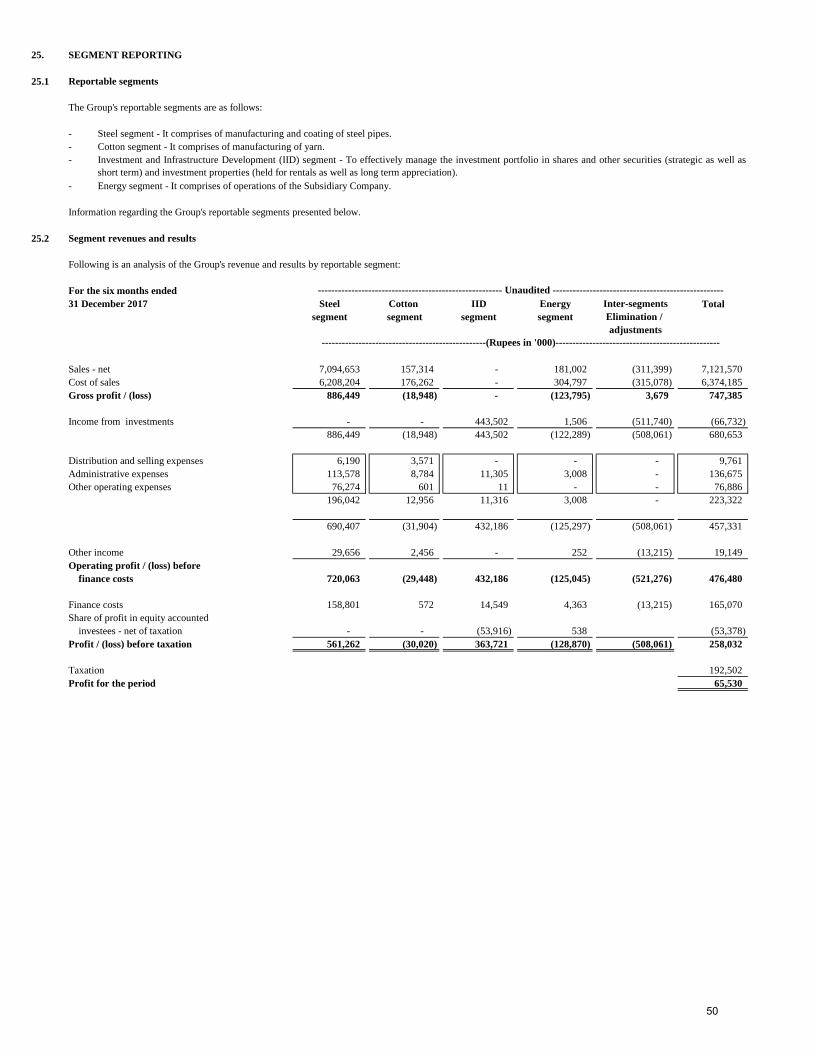
25. SEGMENT REPORTING
25.1 Reportable segments
The Group's reportable segments are as follows:
- Steel segment - It comprises of manufacturing and coating of steel pipes.
- Cotton segment - It comprises of manufacturing of yarn.
-
- Energy segment - It comprises of operations of the Subsidiary Company.
Information regarding the Group's reportable segments presented below.
25.2 Segment revenues and results
Following is an analysis of the Group's revenue and results by reportable segment:
For the six months ended
31 December 2017 Steel Cotton IID Energy Inter-segments
segment segment segment segment Elimination /
adjustments
Sales - net 7,094,653 157,314 - 181,002 (311,399) 7,121,570
Cost of sales 6,208,204 176,262 - 304,797 (315,078) 6,374,185
Gross profit / (loss) 886,449 (18,948) - (123,795) 3,679 747,385
Income from investments - - 443,502 1,506 (511,740) (66,732)
886,449 (18,948) 443,502 (122,289) (508,061) 680,653
Distribution and selling expenses 6,190 3,571 - - - 9,761
Administrative expenses 113,578 8,784 11,305 3,008 - 136,675
Other operating expenses 76,274 601 11 - - 76,886
196,042 12,956 11,316 3,008 - 223,322
690,407 (31,904) 432,186 (125,297) (508,061) 457,331
Other income 29,656 2,456 - 252 (13,215) 19,149
Operating profit / (loss) before
finance costs 720,063 (29,448) 432,186 (125,045) (521,276) 476,480
Finance costs 158,801 572 14,549 4,363 (13,215) 165,070
Share of profit in equity accounted
investees - net of taxation - - (53,916) 538 (53,378)
Profit / (loss) before taxation 561,262 (30,020) 363,721 (128,870) (508,061) 258,032
Taxation 192,502
Profit for the period 65,530
Investment and Infrastructure Development (IID) segment - To effectively manage the investment portfolio in shares and other securities (strategic as well as
short term) and investment properties (held for rentals as well as long term appreciation).
-------------------------------------------------(Rupees in '000)-------------------------------------------------
Total
------------------------------------------------------- Unaudited ---------------------------------------------------
50
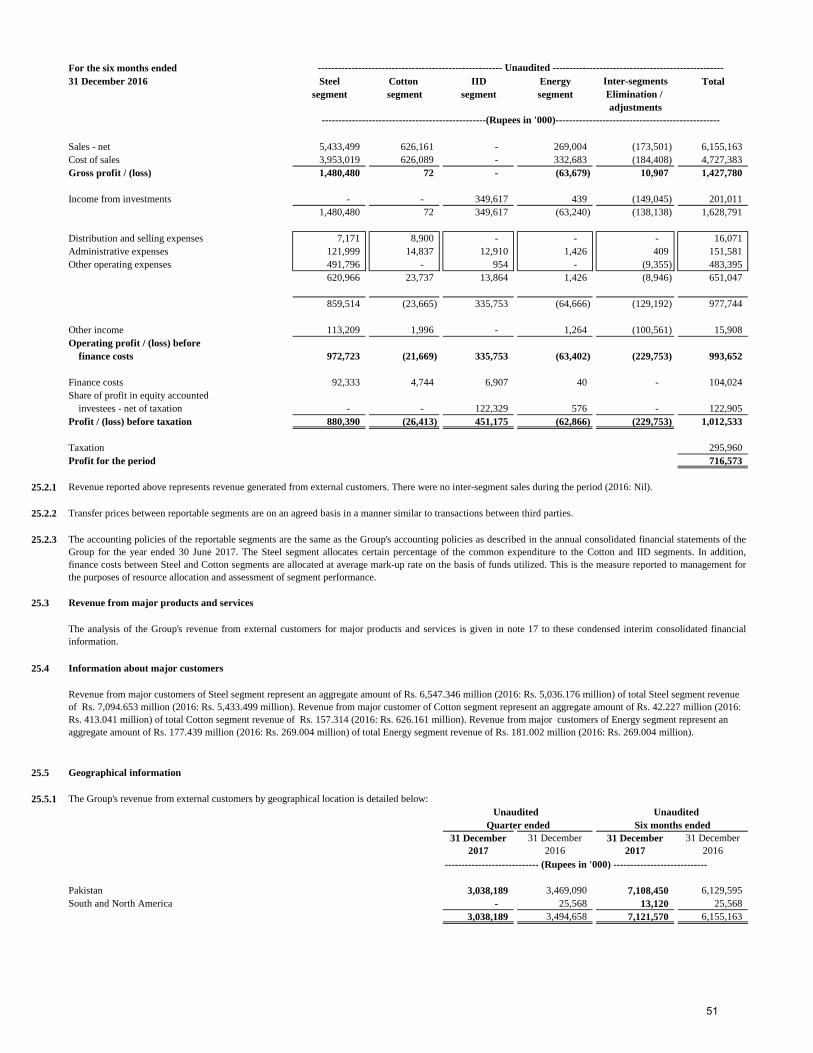
For the six months ended
31 December 2016 Steel Cotton IID Energy Inter-segments
segment segment segment segment Elimination /
adjustments
Sales - net 5,433,499 626,161 - 269,004 (173,501) 6,155,163
Cost of sales 3,953,019 626,089 - 332,683 (184,408) 4,727,383
Gross profit / (loss) 1,480,480 72 - (63,679) 10,907 1,427,780
Income from investments - - 349,617 439 (149,045) 201,011
1,480,480 72 349,617 (63,240) (138,138) 1,628,791
Distribution and selling expenses 7,171 8,900 - - - 16,071
Administrative expenses 121,999 14,837 12,910 1,426 409 151,581
Other operating expenses 491,796 - 954 - (9,355) 483,395
620,966 23,737 13,864 1,426 (8,946) 651,047
859,514 (23,665) 335,753 (64,666) (129,192) 977,744
Other income 113,209 1,996 - 1,264 (100,561) 15,908
Operating profit / (loss) before
finance costs 972,723 (21,669) 335,753 (63,402) (229,753) 993,652
Finance costs 92,333 4,744 6,907 40 - 104,024
Share of profit in equity accounted
investees - net of taxation - - 122,329 576 - 122,905
Profit / (loss) before taxation 880,390 (26,413) 451,175 (62,866) (229,753) 1,012,533
Taxation 295,960
Profit for the period 716,573
25.2.1
25.2.2
25.2.3
25.3 Revenue from major products and services
25.4 Information about major customers
25.5 Geographical information
25.5.1 The Group's revenue from external customers by geographical location is detailed below:
Unaudited Unaudited
---------------------------- (Rupees in '000) ----------------------------
Pakistan 3,038,189 3,469,090 7,108,450 6,129,595
South and North America - 25,568 13,120 25,568
3,038,189 3,494,658 7,121,570 6,155,163
-------------------------------------------------(Rupees in '000)-------------------------------------------------
Total
------------------------------------------------------- Unaudited ---------------------------------------------------
Revenue reported above represents revenue generated from external customers. There were no inter-segment sales during the period (2016: Nil).
Transfer prices between reportable segments are on an agreed basis in a manner similar to transactions between third parties.
Quarter ended
The accounting policies of the reportable segments are the same as the Group's accounting policies as described in the annual consolidated financial statements of the
Group for the year ended 30 June 2017. The Steel segment allocates certain percentage of the common expenditure to the Cotton and IID segments. In addition,
finance costs between Steel and Cotton segments are allocated at average mark-up rate on the basis of funds utilized. This is the measure reported to management for
the purposes of resource allocation and assessment of segment performance.
The analysis of the Group's revenue from external customers for major products and services is given in note 17 to these condensed interim consolidated financial
information.
Six months ended
31 December
2017
31 December
2016
31 December
2017
31 December
2016
Revenue from major customers of Steel segment represent an aggregate amount of Rs. 6,547.346 million (2016: Rs. 5,036.176 million) of total Steel segment revenue
of Rs. 7,094.653 million (2016: Rs. 5,433.499 million). Revenue from major customer of Cotton segment represent an aggregate amount of Rs. 42.227 million (2016:
Rs. 413.041 million) of total Cotton segment revenue of Rs. 157.314 (2016: Rs. 626.161 million). Revenue from major customers of Energy segment represent an
aggregate amount of Rs. 177.439 million (2016: Rs. 269.004 million) of total Energy segment revenue of Rs. 181.002 million (2016: Rs. 269.004 million).
51
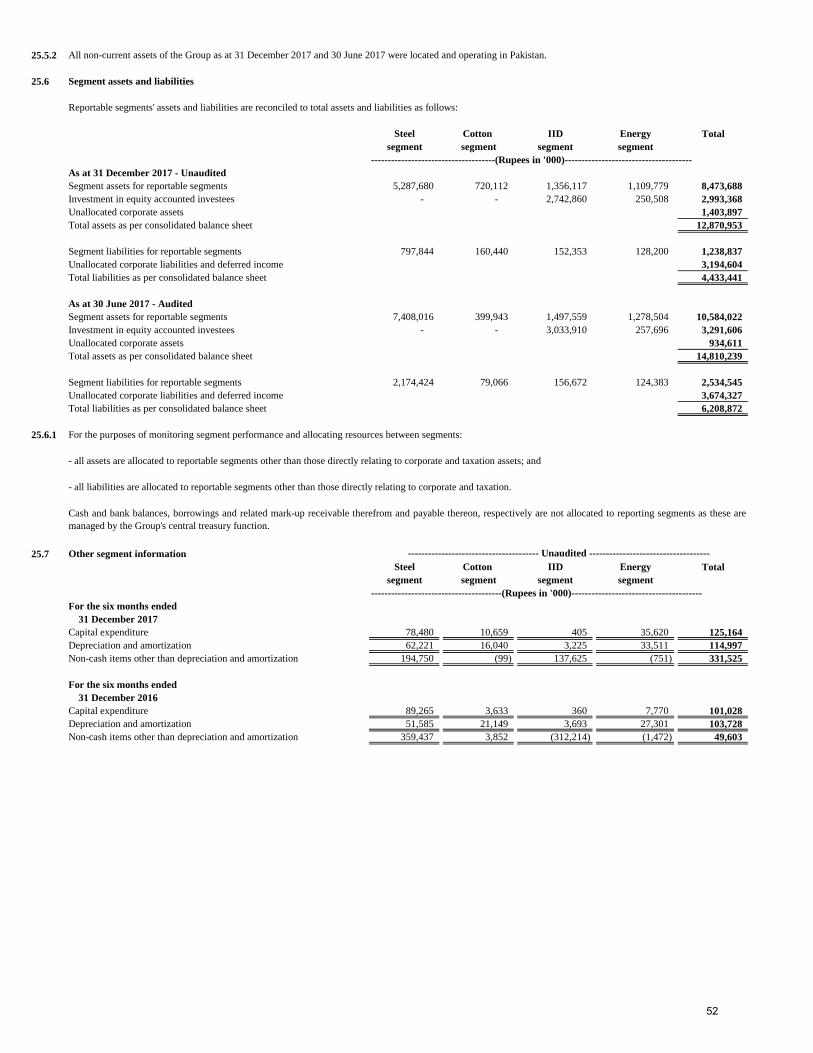
25.5.2 All non-current assets of the Group as at 31 December 2017 and 30 June 2017 were located and operating in Pakistan.
25.6 Segment assets and liabilities
Reportable segments' assets and liabilities are reconciled to total assets and liabilities as follows:
Steel Cotton IID Energy
segment segment segment segment
-------------------------------------(Rupees in '000)--------------------------------------
As at 31 December 2017 - Unaudited
Segment assets for reportable segments 5,287,680 720,112 1,356,117 1,109,779 8,473,688
Investment in equity accounted investees - - 2,742,860 250,508 2,993,368
Unallocated corporate assets 1,403,897
Total assets as per consolidated balance sheet 12,870,953
Segment liabilities for reportable segments 797,844 160,440 152,353 128,200 1,238,837
Unallocated corporate liabilities and deferred income 3,194,604
Total liabilities as per consolidated balance sheet 4,433,441
As at 30 June 2017 - Audited
Segment assets for reportable segments 7,408,016 399,943 1,497,559 1,278,504 10,584,022
Investment in equity accounted investees - - 3,033,910 257,696 3,291,606
Unallocated corporate assets 934,611
Total assets as per consolidated balance sheet 14,810,239
Segment liabilities for reportable segments 2,174,424 79,066 156,672 124,383 2,534,545
Unallocated corporate liabilities and deferred income 3,674,327
Total liabilities as per consolidated balance sheet 6,208,872
25.6.1 For the purposes of monitoring segment performance and allocating resources between segments:
25.7 Other segment information
Steel Cotton IID Energy
segment segment segment segment
---------------------------------------(Rupees in '000)---------------------------------------
For the six months ended
31 December 2017
Capital expenditure 78,480 10,659 405 35,620 125,164
Depreciation and amortization 62,221 16,040 3,225 33,511 114,997
Non-cash items other than depreciation and amortization 194,750 (99) 137,625 (751) 331,525
For the six months ended
31 December 2016
Capital expenditure 89,265 3,633 360 7,770 101,028
Depreciation and amortization 51,585 21,149 3,693 27,301 103,728
Non-cash items other than depreciation and amortization 359,437 3,852 (312,214) (1,472) 49,603
Total
- all assets are allocated to reportable segments other than those directly relating to corporate and taxation assets; and
Total
--------------------------------------- Unaudited ------------------------------------
- all liabilities are allocated to reportable segments other than those directly relating to corporate and taxation.
Cash and bank balances, borrowings and related mark-up receivable therefrom and payable thereon, respectively are not allocated to reporting segments as these are
managed by the Group's central treasury function.
52
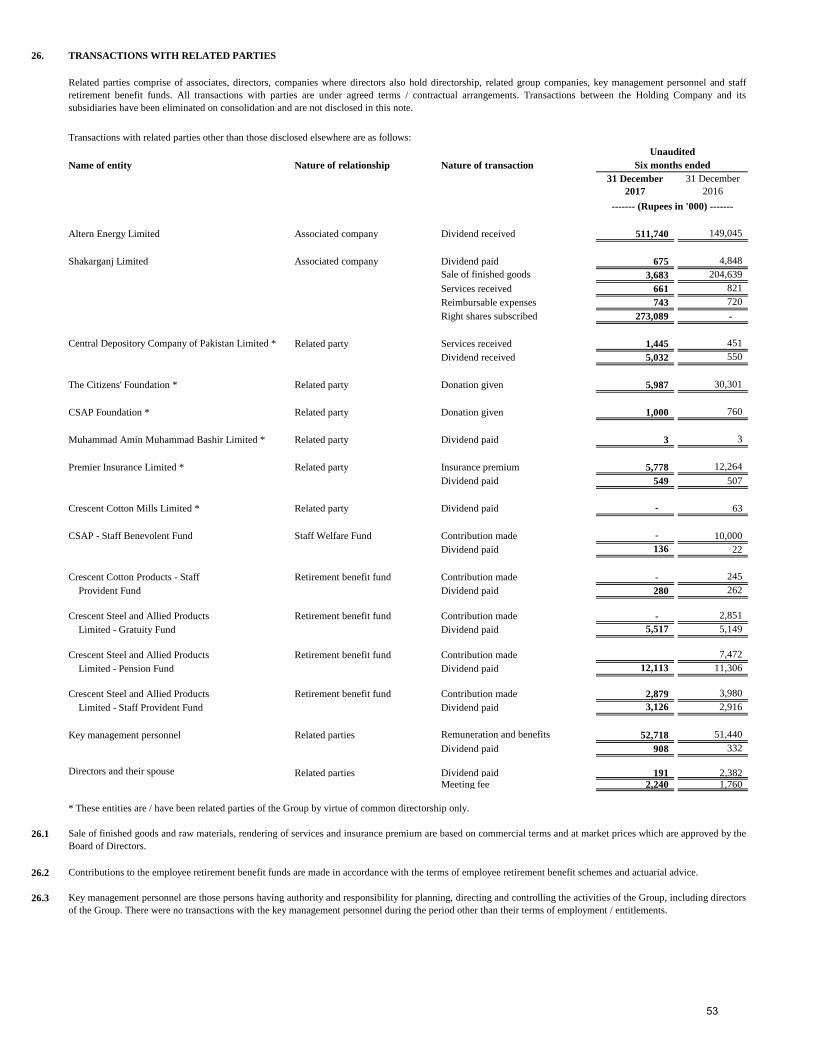
26. TRANSACTIONS WITH RELATED PARTIES
Transactions with related parties other than those disclosed elsewhere are as follows:
Name of entity Nature of relationship Nature of transaction
Altern Energy Limited Associated company Dividend received 511,740 149,045
Shakarganj Limited Associated company Dividend paid 675 4,848
Sale of finished goods 3,683 204,639
Services received 661 821
Reimbursable expenses 743 720
Right shares subscribed 273,089 -
Central Depository Company of Pakistan Limited * Related party Services received 1,445 451
Dividend received 5,032 550
The Citizens' Foundation * Related party Donation given 5,987 30,301
CSAP Foundation * Related party Donation given 1,000 760
Muhammad Amin Muhammad Bashir Limited * Related party Dividend paid 3 3
Premier Insurance Limited * Related party Insurance premium 5,778 12,264
Dividend paid 549 507
Crescent Cotton Mills Limited * Related party Dividend paid - 63
CSAP - Staff Benevolent Fund Staff Welfare Fund Contribution made - 10,000
Dividend paid 136 22
Crescent Cotton Products - Staff Retirement benefit fund Contribution made - 245
Provident Fund Dividend paid 280 262
Crescent Steel and Allied Products Retirement benefit fund Contribution made - 2,851
Limited - Gratuity Fund Dividend paid 5,517 5,149
Crescent Steel and Allied Products Retirement benefit fund Contribution made 7,472
Limited - Pension Fund Dividend paid 12,113 11,306
Crescent Steel and Allied Products Retirement benefit fund Contribution made 2,879 3,980
Limited - Staff Provident Fund Dividend paid 3,126 2,916
Key management personnel Related parties Remuneration and benefits 52,718 51,440
Dividend paid 908 332
Directors and their spouse Related parties Dividend paid 191 2,382
Meeting fee 2,240 1,760
26.1
26.2
26.3 Key management personnel are those persons having authority and responsibility for planning, directing and controlling the activities of the Group, including directors
of the Group. There were no transactions with the key management personnel during the period other than their terms of employment / entitlements.
Six months ended
------- (Rupees in '000) -------
Related parties comprise of associates, directors, companies where directors also hold directorship, related group companies, key management personnel and staff
retirement benefit funds. All transactions with parties are under agreed terms / contractual arrangements. Transactions between the Holding Company and its
subsidiaries have been eliminated on consolidation and are not disclosed in this note.
Sale of finished goods and raw materials, rendering of services and insurance premium are based on commercial terms and at market prices which are approved by the
Board of Directors.
Contributions to the employee retirement benefit funds are made in accordance with the terms of employee retirement benefit schemes and actuarial advice.
31 December
2016
* These entities are / have been related parties of the Group by virtue of common directorship only.
31 December
2017
Unaudited
53
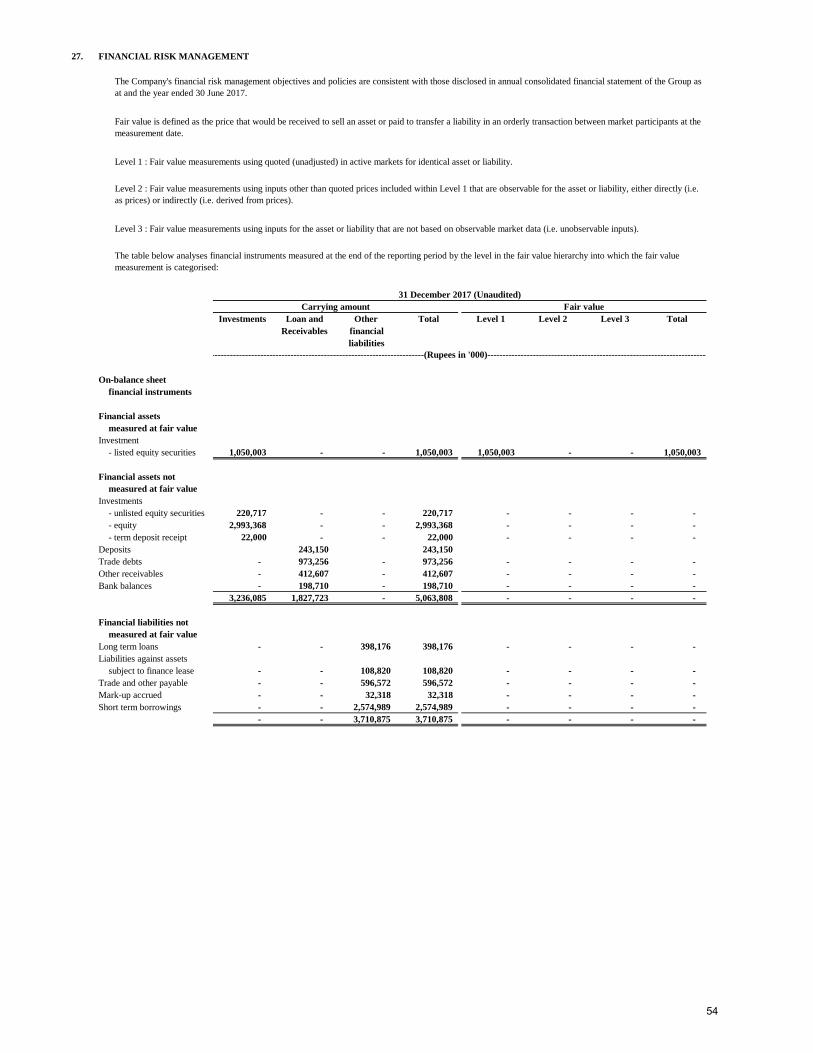
27. FINANCIAL RISK MANAGEMENT
Investments Loan and Other Total Level 1 Level 2 Level 3 Total
Receivables financial
liabilities
On-balance sheet
financial instruments
Financial assets
measured at fair value
Investment
- listed equity securities 1,050,003 - - 1,050,003 1,050,003 - - 1,050,003
Financial assets not
measured at fair value
Investments
- unlisted equity securities 220,717 - - 220,717 - - - -
- equity 2,993,368 - - 2,993,368 - - - -
- term deposit receipt 22,000 - - 22,000 - - - -
Deposits 243,150 243,150
Trade debts - 973,256 - 973,256 - - - -
Other receivables - 412,607 - 412,607 - - - -
Bank balances - 198,710 - 198,710 - - - -
3,236,085 1,827,723 - 5,063,808 - - - -
Financial liabilities not
measured at fair value
Long term loans - - 398,176 398,176 - - - -
Liabilities against assets
subject to finance lease - - 108,820 108,820 - - - -
Trade and other payable - - 596,572 596,572 - - - -
Mark-up accrued - - 32,318 32,318 - - - -
Short term borrowings - - 2,574,989 2,574,989 - - - -
- - 3,710,875 3,710,875 - - - -
Carrying amount
The Company's financial risk management objectives and policies are consistent with those disclosed in annual consolidated financial statement of the Group as
at and the year ended 30 June 2017.
Fair value is defined as the price that would be received to sell an asset or paid to transfer a liability in an orderly transaction between market participants at the
measurement date.
Level 1 : Fair value measurements using quoted (unadjusted) in active markets for identical asset or liability.
Level 2 : Fair value measurements using inputs other than quoted prices included within Level 1 that are observable for the asset or liability, either directly (i.e.
as prices) or indirectly (i.e. derived from prices).
Level 3 : Fair value measurements using inputs for the asset or liability that are not based on observable market data (i.e. unobservable inputs).
31 December 2017 (Unaudited)
The table below analyses financial instruments measured at the end of the reporting period by the level in the fair value hierarchy into which the fair value
measurement is categorised:
Fair value
---------------------------------------------------------------------------(Rupees in '000)------------------------------------------------------------------------------
54
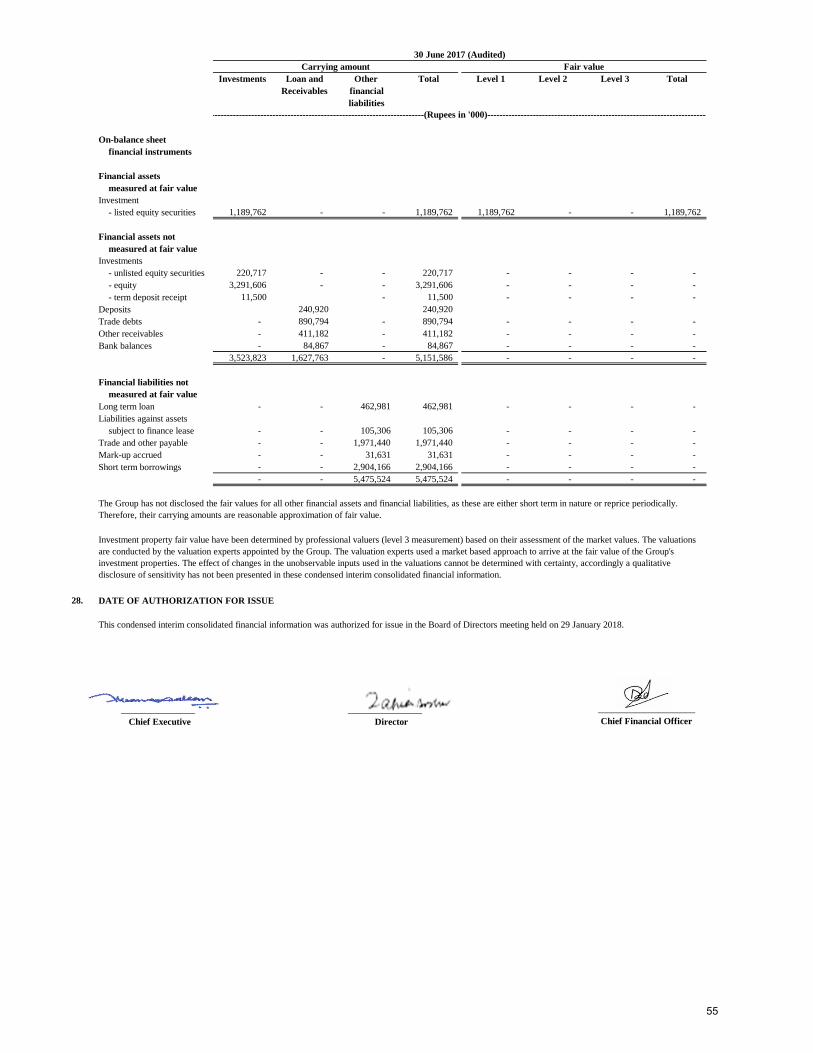
Investments Loan and Other Total Level 1 Level 2 Level 3 Total
Receivables financial
liabilities
On-balance sheet
financial instruments
Financial assets
measured at fair value
Investment
- listed equity securities 1,189,762 - - 1,189,762 1,189,762 - - 1,189,762
Financial assets not
measured at fair value
Investments
- unlisted equity securities 220,717 - - 220,717 - - - -
- equity 3,291,606 - - 3,291,606 - - - -
- term deposit receipt 11,500 - 11,500 - - - -
Deposits 240,920 240,920
Trade debts - 890,794 - 890,794 - - - -
Other receivables - 411,182 - 411,182 - - - -
Bank balances - 84,867 - 84,867 - - - -
3,523,823 1,627,763 - 5,151,586 - - - -
Financial liabilities not
measured at fair value
Long term loan - - 462,981 462,981 - - - -
Liabilities against assets
subject to finance lease - - 105,306 105,306 - - - -
Trade and other payable - - 1,971,440 1,971,440 - - - -
Mark-up accrued - - 31,631 31,631 - - - -
Short term borrowings - - 2,904,166 2,904,166 - - - -
- - 5,475,524 5,475,524 - - - -
28. DATE OF AUTHORIZATION FOR ISSUE
________________ ________________
Chief Executive Director Chief Financial Officer
The Group has not disclosed the fair values for all other financial assets and financial liabilities, as these are either short term in nature or reprice periodically.
Therefore, their carrying amounts are reasonable approximation of fair value.
Investment property fair value have been determined by professional valuers (level 3 measurement) based on their assessment of the market values. The valuations
are conducted by the valuation experts appointed by the Group. The valuation experts used a market based approach to arrive at the fair value of the Group's
investment properties. The effect of changes in the unobservable inputs used in the valuations cannot be determined with certainty, accordingly a qualitative
disclosure of sensitivity has not been presented in these condensed interim consolidated financial information.
This condensed interim consolidated financial information was authorized for issue in the Board of Directors meeting held on 29 January 2018.
---------------------------------------------------------------------------(Rupees in '000)------------------------------------------------------------------------------
30 June 2017 (Audited)
Carrying amount Fair value
_____________________
55
56
57

58
59
60

61
62
63

64