Embed Size (px)
Citation preview
1
MicroArray -- Data Analysis
Cecilia Hansen
&
Dirk Repsilber
Bioinformatics - 10p, October 2001
2
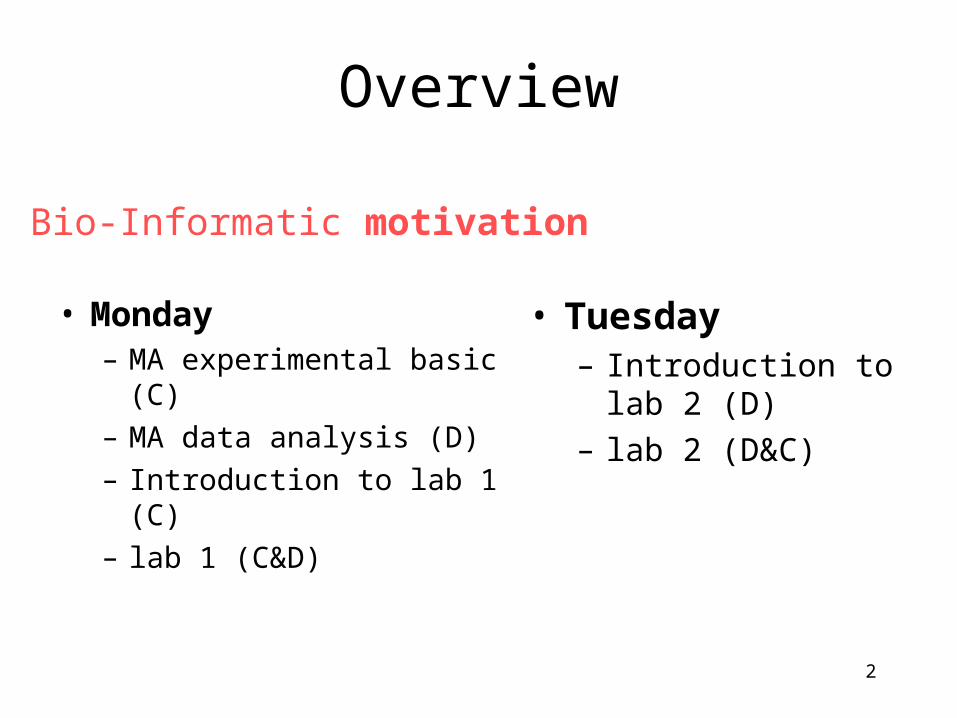
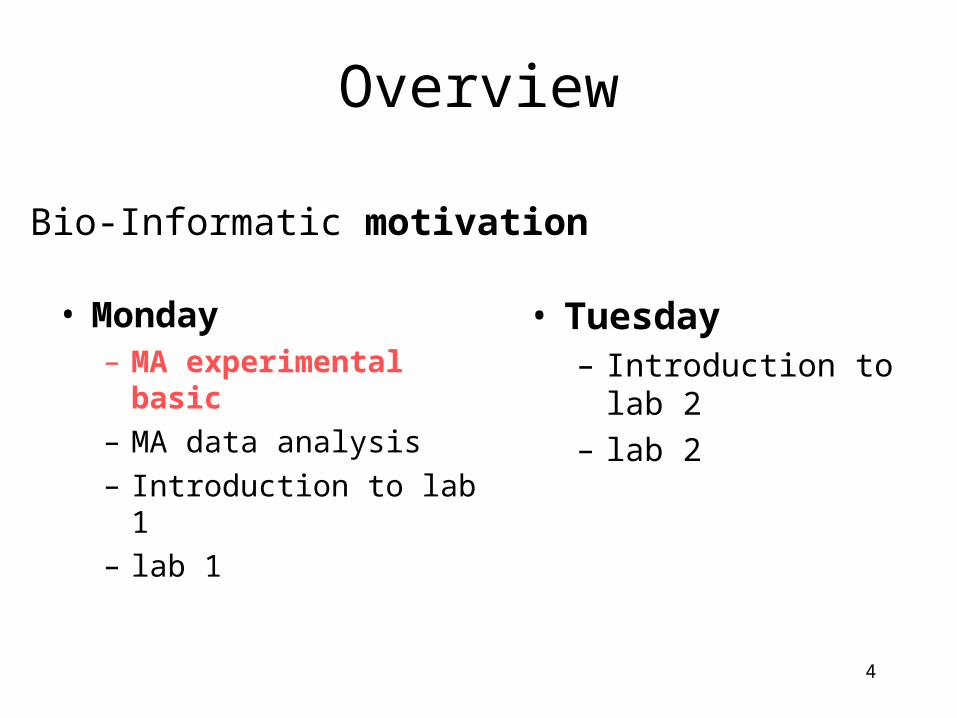
Overview
• Monday– MA experimental basic (C)
– MA data analysis (D)
– Introduction to lab 1 (C)
– lab 1 (C&D)
• Tuesday– Introduction to lab 2 (D)
– lab 2 (D&C)
• Bio-Informatic motivation
3
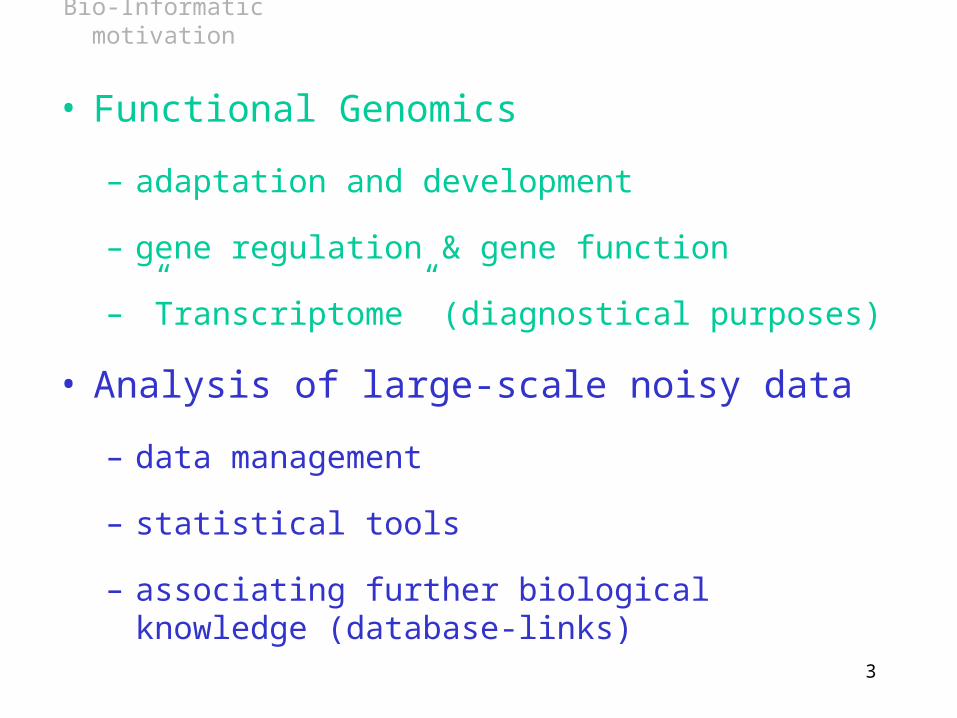
• Functional Genomics
– adaptation and development
– gene regulation & gene function
– ”Transcriptome” (diagnostical purposes)
• Analysis of large-scale noisy data
– data management
– statistical tools
– associating further biological knowledge (database-links)
Bio-Informatic motivation
4
Overview
• Monday– MA experimental basic
– MA data analysis
– Introduction to lab 1
– lab 1
• Tuesday– Introduction to lab 2
– lab 2
• Bio-Informatic motivation

5
Target (solid phase)
1) Genomic DNA or cDNA clones with known sequence.
2) PCR products are spotted on a glas slide in an organised way.
3) With a good printing device you can print at leased 10 000 spots (genes) on one microscope glas slide.
4) This gives you a matrix of spots, where every spot represents only ONE gene.
***************
***************
***************
***************
***************
experimental basics
6
t=0
t=0 t=2t=1 t=3 t=7
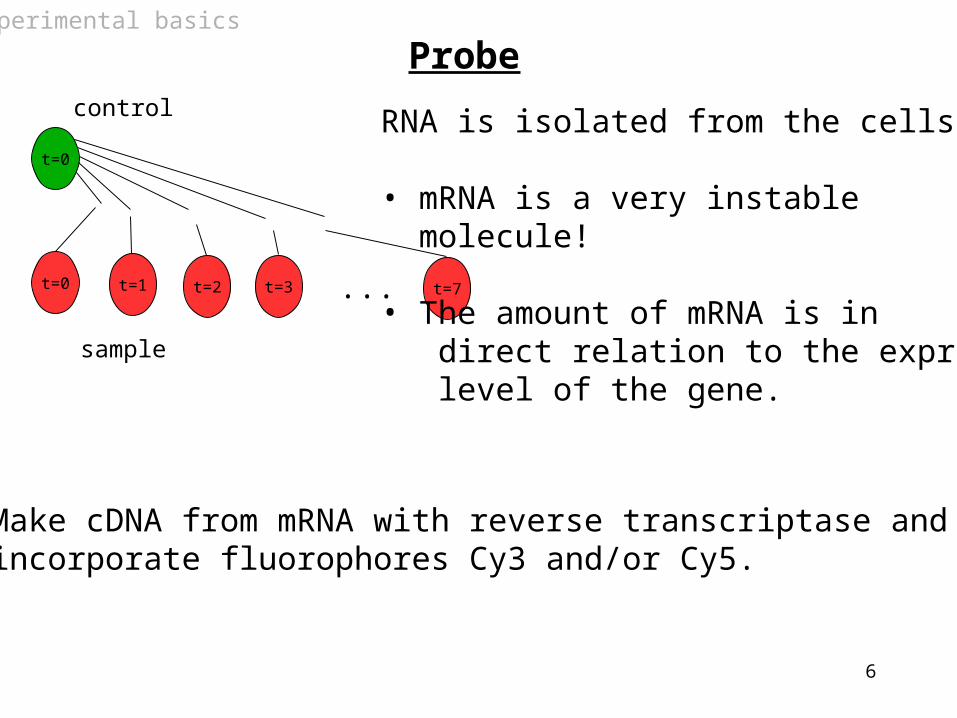
Probe
RNA is isolated from the cells
• mRNA is a very instable molecule!
• The amount of mRNA is in direct relation to the expression level of the gene.
Make cDNA from mRNA with reverse transcriptase and incorporate fluorophores Cy3 and/or Cy5.
experimental basics
control
sample
...
7
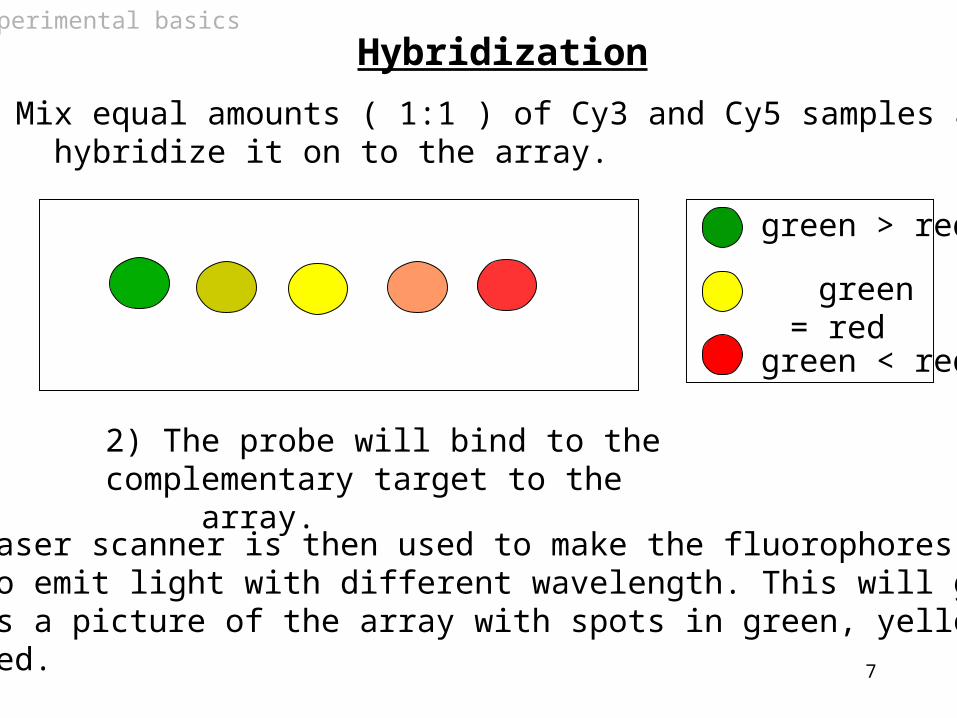
Hybridization
2) The probe will bind to the complementary target to the array.
1) Mix equal amounts ( 1:1 ) of Cy3 and Cy5 samples and hybridize it on to the array.
3) A laser scanner is then used to make the fluorophores to emit light with different wavelength. This will give us a picture of the array with spots in green, yellow and red.
green > red
green = red
green < red
experimental basics
8
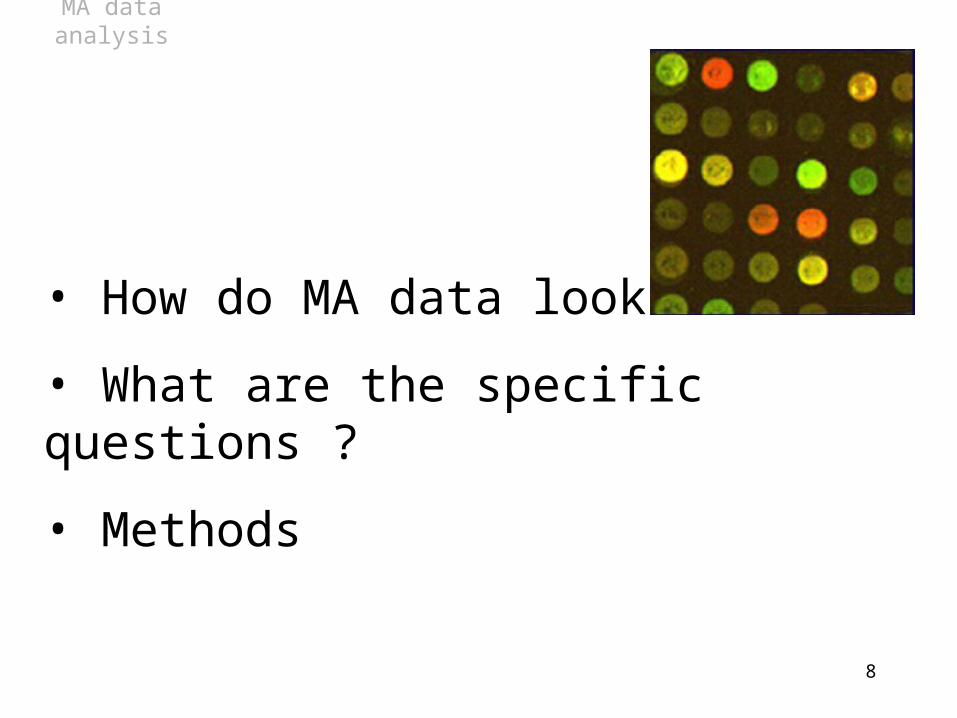
MA data analysis
• How do MA data look like ?
• What are the specific questions ?
• Methods
9
Overview
• Monday– MA experimental basic
– MA data analysis
– Introduction to lab 1
– lab 1
• Tuesday– Introduction to lab 2
– lab 2
• Bio-Informatic motivation
10
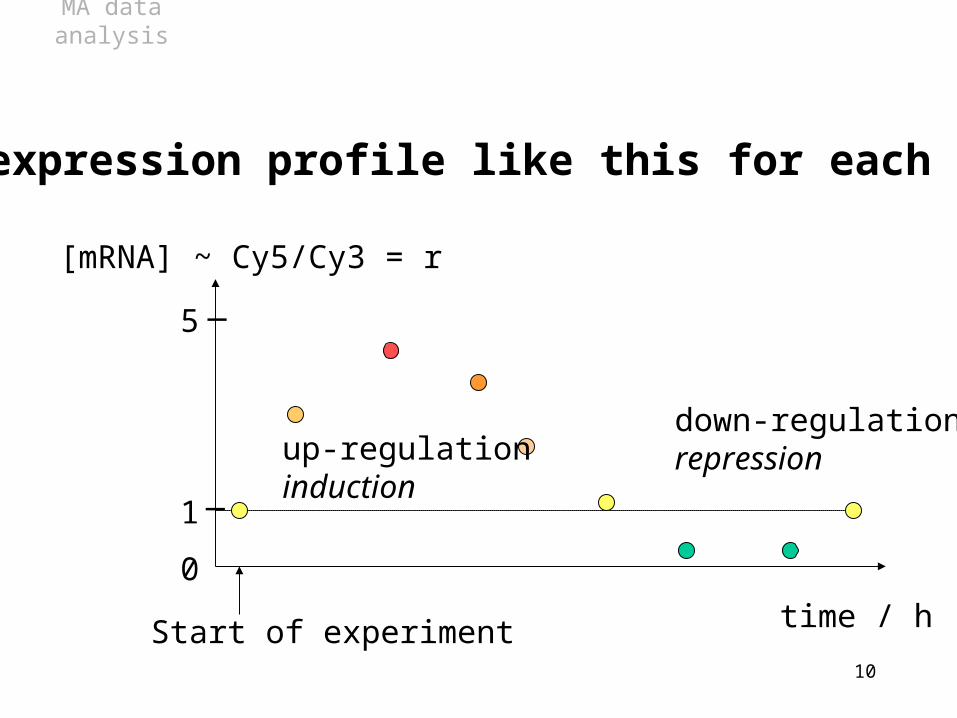
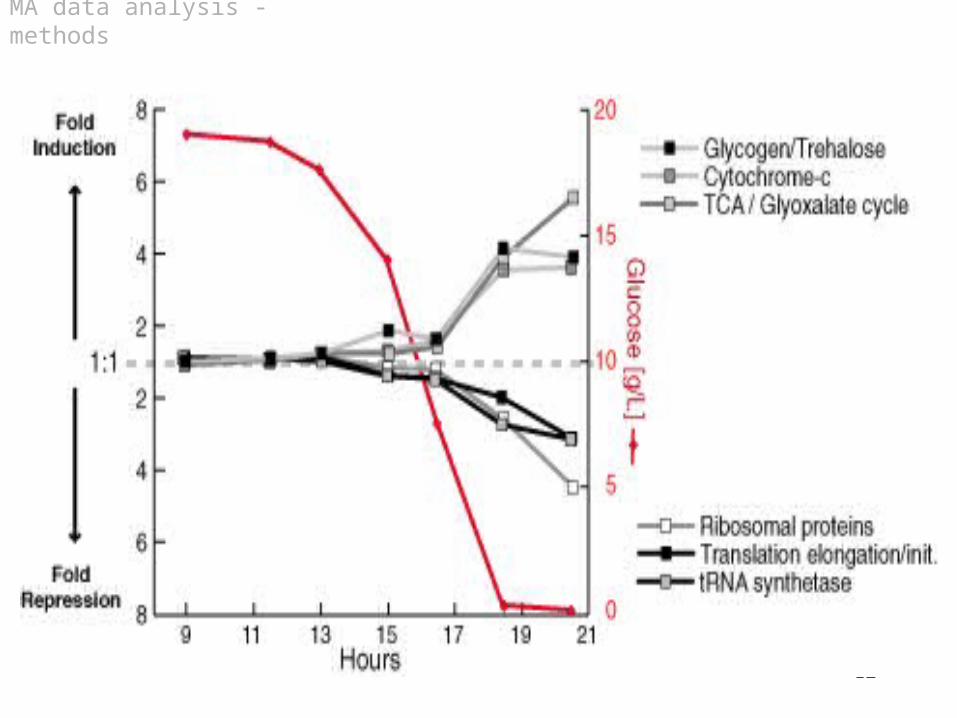
an expression profile like this for each gene :
[mRNA] ~ Cy5/Cy3 = r
time / h
1
5
0
_
_
Start of experiment
up-regulationinduction
down-regulationrepression
MA data analysis
11
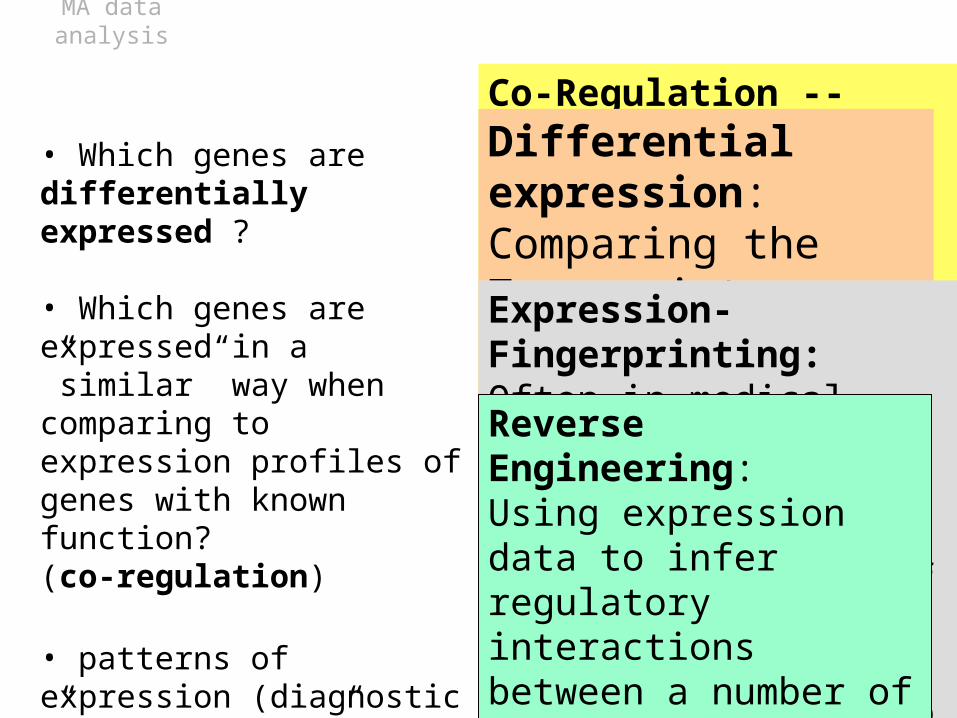
Co-Regulation -- Inference of function:Genes belonging to the same pathway are oftenshowing the same regulatory patterns (profiles) for a variety of biological situations (or in a time series).Hence, as a hypothesis, genes of unknown function showing similar regulatory behaviour as some genes of ”known” function may have a similar function.
• Which genes are differentially expressed ?
• Which genes are expressed in a ”similar” way when comparing to expression profiles of genes with known function? (co-regulation)
• patterns of expression (diagnostic ”Fingerprinting”)
• Reverse Engineering of genetic networks
Differential expression:Comparing the Transcriptomes for two different biological samples (e.g. control, heat-shock) you are interested in the subset of genes which are expressed on different levels (up-/ down-regulated).
Expression-Fingerprinting:Often in medical applications it is of interest to characterize the biological status of cells, e.g. the severeness of tumor cells, to be able to respond with the right therapy.
Reverse Engineering:Using expression data to infer regulatory interactions between a number of genes responsible for a certain adaptation process or developmental process.
MA data analysis
12
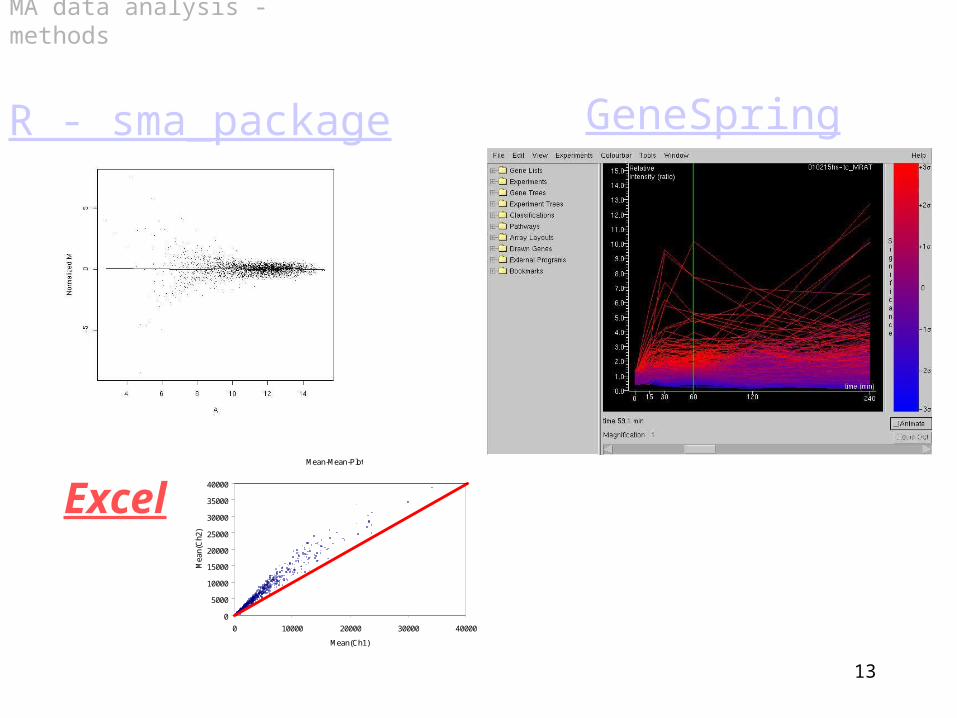
MA data analysis - methods
13
GeneSpringR - sma_package
ExcelMean-Mean-Plot
0
5000
10000
15000
20000
25000
30000
35000
40000
0 10000 20000 30000 40000
Mean(Ch1)
Mea
n(C
h2)
MA data analysis - methods
14
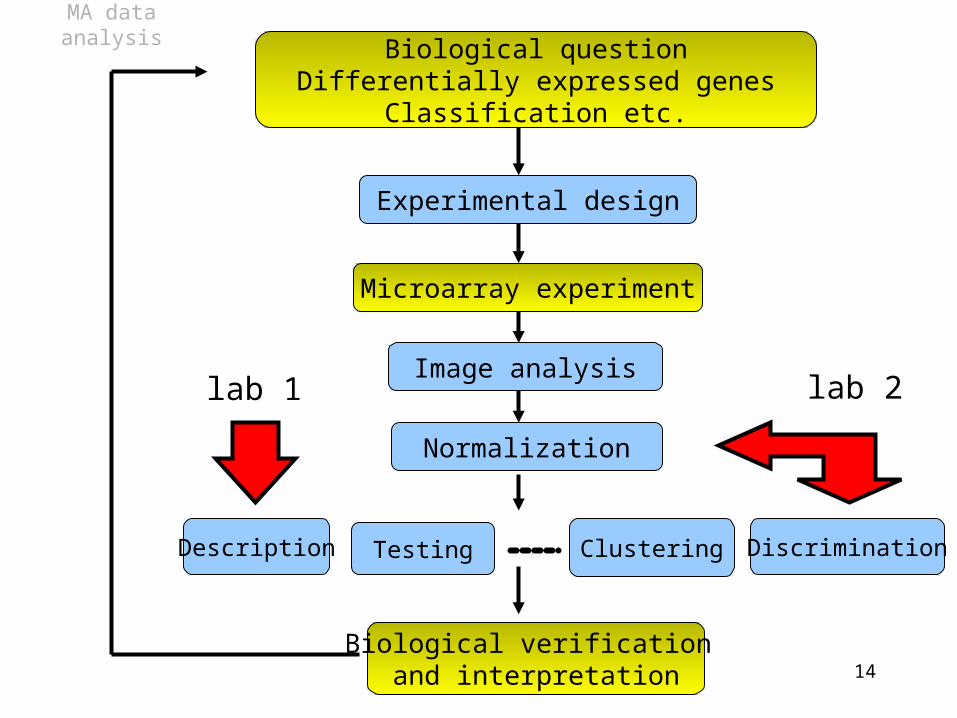
MA data analysisBiological question
Differentially expressed genesClassification etc.
Testing
Biological verification and interpretation
Microarray experiment
Description
Experimental design
Image analysis
Normalization
Clustering Discrimination
lab 1 lab 2