Embed Size (px)
Citation preview

1
©The McGraw-Hill Companies, Inc., 2004
Chapter 2
Operations Strategy and
Competitiveness

2
©The McGraw-Hill Companies, Inc., 2004
• Operations Strategy
• Competitive Dimensions
• Order Qualifiers and Winners
• Strategy Design Process
• A Framework for Manufacturing Strategy
• Service Strategy Capacity Capabilities
• Productivity Measures
OBJECTIVES
3
©The McGraw-Hill Companies, Inc., 2004
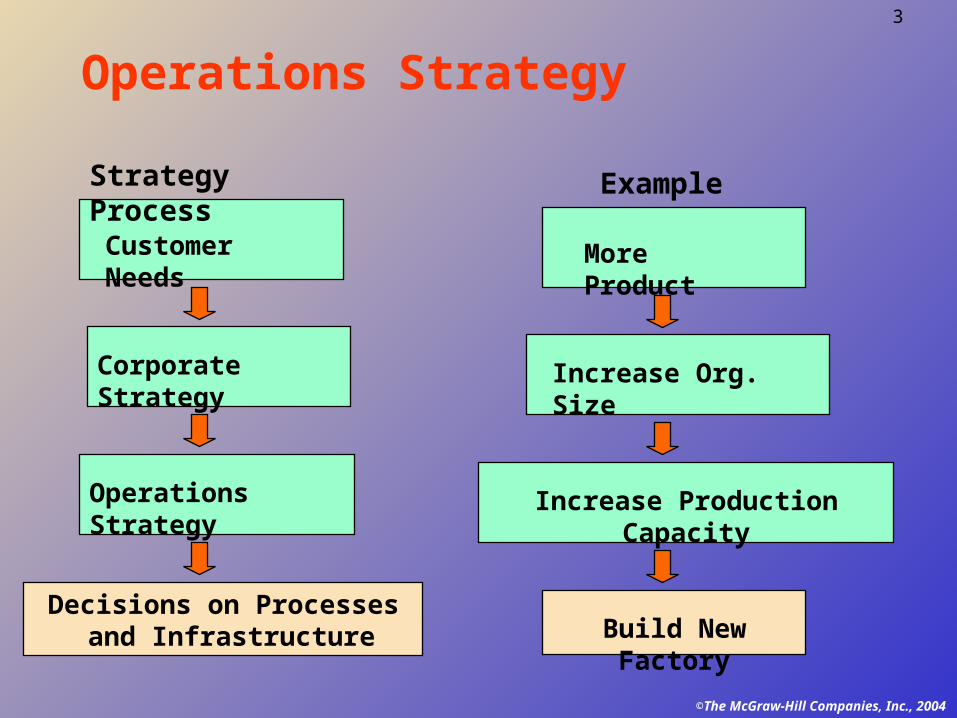
Operations Strategy
ExampleStrategy Process
Customer Needs
Corporate Strategy
Operations Strategy
Decisions on Processes and Infrastructure
More Product
Increase Org. Size
Increase Production Capacity
Build New Factory
4
©The McGraw-Hill Companies, Inc., 2004
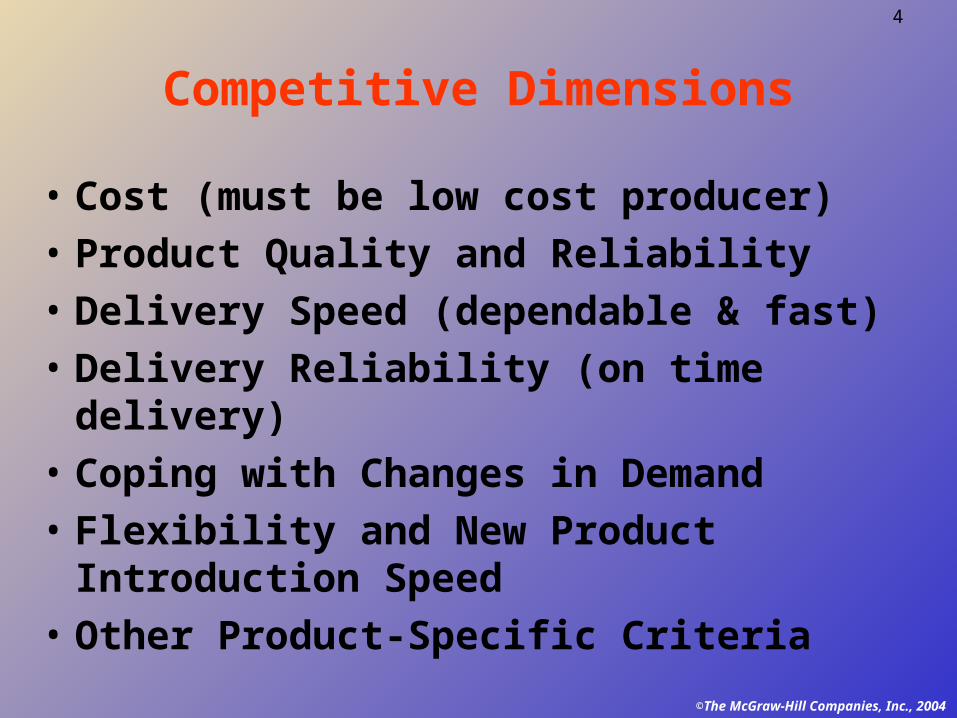
Competitive Dimensions
• Cost (must be low cost producer)
• Product Quality and Reliability
• Delivery Speed (dependable & fast)
• Delivery Reliability (on time delivery)
• Coping with Changes in Demand
• Flexibility and New Product Introduction Speed
• Other Product-Specific Criteria
5
©The McGraw-Hill Companies, Inc., 2004
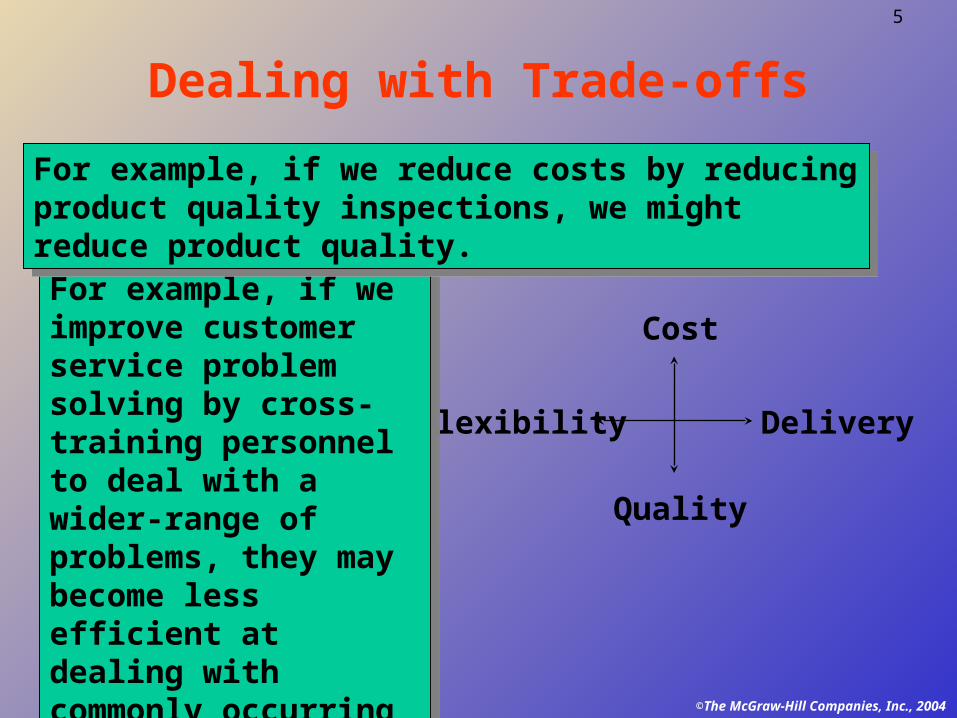
Dealing with Trade-offs
Cost
Quality
DeliveryFlexibility
For example, if we improve customer service problem solving by cross-training personnel to deal with a wider-range of problems, they may become less efficient at dealing with commonly occurring problems.
For example, if we improve customer service problem solving by cross-training personnel to deal with a wider-range of problems, they may become less efficient at dealing with commonly occurring problems.
For example, if we reduce costs by reducing product quality inspections, we might reduce product quality.
For example, if we reduce costs by reducing product quality inspections, we might reduce product quality.
6
©The McGraw-Hill Companies, Inc., 2004
Order Qualifiers and WinnersDefined
•Order qualifiers are the basic criteria that permit the firms products to be considered as candidates for purchase by customers
•Order winners are the criteria that differentiates the products and services of one firm from another
7
©The McGraw-Hill Companies, Inc., 2004
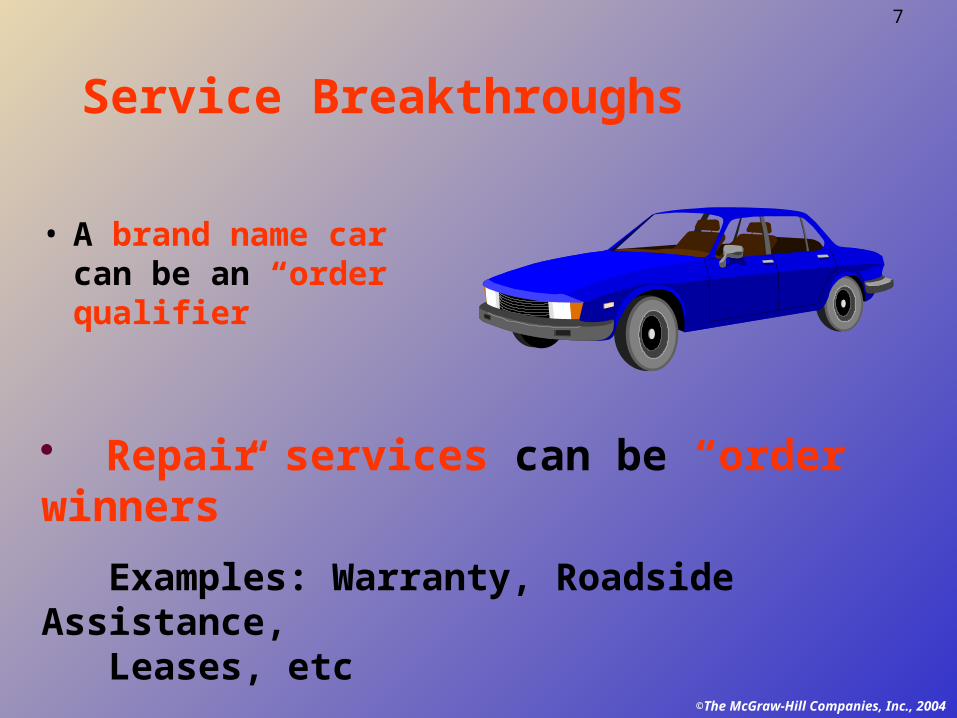
Service Breakthroughs
• A brand name car can be an “order qualifier”
Repair services can be “order winners”
Examples: Warranty, Roadside Assistance, Leases, etc

8
©The McGraw-Hill Companies, Inc., 2004
Strategy Design ProcessStrategy Map
Financial Perspective
Customer Perspective
Internal Perspective
Learning and Growth Perspective
Improve Shareholder Value
Customer Value Proposition
Build-Increase-Achieve
A Motivated and Prepared Workforce
What it is about!
9
©The McGraw-Hill Companies, Inc., 2004
Kaplan and Norton’s Generic Strategy Map
In the Kaplan and Norton’s Generic
Strategy Map, under the Financial
Perspective, the Productivity Strategy is
generally made up from two components:
1. Improve cost structure: Lower direct and indirect costs
2. Increase asset utilization: Reduce working and fixed capital
10
©The McGraw-Hill Companies, Inc., 2004
Kaplan and Norton’s Generic Strategy Map (Continued)In the Kaplan and Norton’s Generic Strategy Map, under the Financial Perspective, the Revenue Growth Strategy is generally made up from two components:
1. Build the franchise: Develop new sources of revenue
2. Increase customer value: Work with existing customers to expand relationships with company

11
©The McGraw-Hill Companies, Inc., 2004
Kaplan and Norton’s Generic Strategy Map (Continued)
In the Kaplan and Norton’s Generic Strategy
Map, under the Customer Perspective, there are
three ways suggested as means of differentiating
a company from others in a marketplace:
1. Product leadership
2. Customer intimacy
3. Operational excellence
12
©The McGraw-Hill Companies, Inc., 2004
Kaplan and Norton’s Generic Strategy Map (Continued)In the Kaplan and Norton’s Generic Strategy
Map, under the Learning and Growth
Perspective, there are three principle categories
of intangible assets needed for learning:
1. Strategic competencies
2. Strategic technologies
3. Climate for action
13
©The McGraw-Hill Companies, Inc., 2004
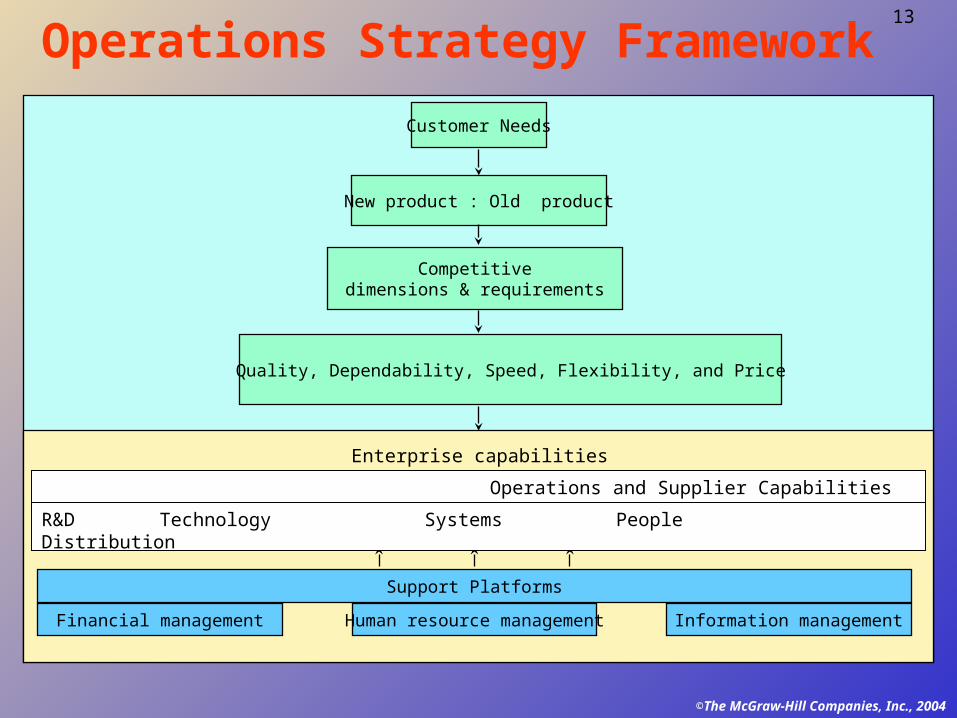
Operations Strategy Framework
Customer Needs
New product : Old product
Competitivedimensions & requirements
Quality, Dependability, Speed, Flexibility, and Price
Operations & Supplier capabilities
R&D Technology Systems People Distribution
Support Platforms
Financial management Human resource management Information management
Enterprise capabilities
Operations and Supplier Capabilities
R&D Technology Systems People Distribution
14
©The McGraw-Hill Companies, Inc., 2004
Steps in Developing a Manufacturing Strategy
• 1. Segment the market according to the product group
• 2. Identify product requirements, demand patterns, and profit margins of each group
• 3. Determine order qualifiers and winners for each group
• 4. Convert order winners into specific performance requirements
15
©The McGraw-Hill Companies, Inc., 2004
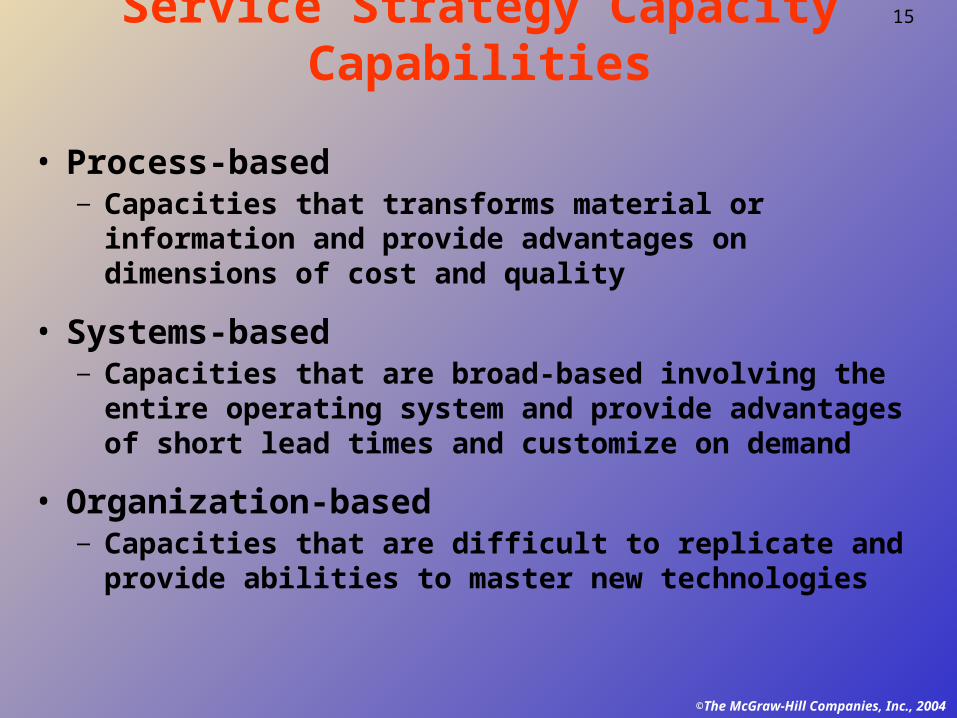
Service Strategy Capacity Capabilities
• Process-based — Capacities that transforms material or information
and provide advantages on dimensions of cost and quality
• Systems-based — Capacities that are broad-based involving the entire
operating system and provide advantages of short lead times and customize on demand
• Organization-based— Capacities that are difficult to replicate and provide
abilities to master new technologies

16
©The McGraw-Hill Companies, Inc., 2004
What is Productivity?Defined
Productivity is a common measure on how well resources are being used. In the broadest sense, it can be defined as the following ratio:
Outputs Inputs
17
©The McGraw-Hill Companies, Inc., 2004
Total Measure Productivity
Total Measure Productivity = Outputs Inputs
or
= Goods and services produced
All resources used
18
©The McGraw-Hill Companies, Inc., 2004
Partial Measure Productivity
• Partial measures of productivity =
• Output or Output or Output or Output Labor Capital Materials Energy
19
©The McGraw-Hill Companies, Inc., 2004
Multifactor Measure Productivity
• Multifactor measures of productivity =
• Output . Labor + Capital + Energy
or
• Output . Labor + Capital + Materials

20
©The McGraw-Hill Companies, Inc., 2004
Example of Productivity Measurement
• You have just determined that your service employees
have used a total of 2400 hours of labor this week to
process 560 insurance forms. Last week the same
crew used only 2000 hours of labor to process 480
forms.
• Which productivity measure should be used?
• Answer: Could be classified as a Total Measure or
Partial Measure.
• Is productivity increasing or decreasing?
• Answer: Last week’s productivity = 480/2000 = 0.24,
and this week’s productivity is = 560/2400 = 0.23. So,
productivity is decreasing slightly.