Embed Size (px)
Citation preview
remote sensing
Article
Morphology of Rain Clusters Influencing Rainfall Intensityover Hainan Island
Tingting Huang 1,2,3 , Chenghui Ding 2,4, Weibiao Li 1,3 and Yilun Chen 1,2,3,*
�����������������
Citation: Huang, T.; Ding, C.; Li, W.;
Chen, Y. Morphology of Rain Clusters
Influencing Rainfall Intensity over
Hainan Island. Remote Sens. 2021, 13,
2920. https://doi.org/10.3390/
rs13152920
Academic Editors: Min Min and
Chao Liu
Received: 24 June 2021
Accepted: 23 July 2021
Published: 25 July 2021
Publisher’s Note: MDPI stays neutral
with regard to jurisdictional claims in
published maps and institutional affil-
iations.
Copyright: © 2021 by the authors.
Licensee MDPI, Basel, Switzerland.
This article is an open access article
distributed under the terms and
conditions of the Creative Commons
Attribution (CC BY) license (https://
creativecommons.org/licenses/by/
4.0/).
1 Guangdong Province Key Laboratory for Climate Change and Natural Disaster Studies, School ofAtmospheric Sciences, Sun Yat-sen University, Zhuhai 519082, China; [email protected] (T.H.);[email protected] (W.L.)
2 Key Laboratory of South China Sea Meteorological Disaster Prevention and Mitigation of Hainan Province,Haikou 570203, China; [email protected]
3 Southern Marine Science and Engineering Guangdong Laboratory (Zhuhai), Zhuhai 519082, China4 Meteorological Bureau of Haikou City, Haikou 571100, China* Correspondence: [email protected]
Abstract: Continuous observations from geostationary satellites can show the morphology of pre-cipitation cloud systems in quasi-real-time, but there are still large deviations in the inversion ofprecipitation. We used binary-connected area recognition technology to identify meso-β-scale rainclusters over Hainan Island from 1 June 2000 to 31 December 2018, based on Global PrecipitationMeasurement (GPM) Integrated Multi-satellitE Retrievals for GPM data. We defined and statisticallyanalyzed the parameters of rain clusters to reveal the typical morphological and precipitation charac-teristics of rain clusters, and to explore the relationship between the parameters and rainfall intensityof rain clusters. We found that the area and long axis of rain clusters over land were larger than thoseover the ocean, and that continental rain clusters were usually square in shape. Rain clusters witha larger area and longer axis were concentrated on the northern side of the mountains on HainanIsland and the intensity of rain was larger on the northern and eastern sides of the mountains. Thevariation of continental rain clusters over time was more dramatic than the variation of oceanicclusters. The area and long axis of rain clusters was larger between 14:00 and 21:00 from April toSeptember and the long axis of the oceanic rain clusters increased in winter. There were clear positivecorrelations between the area, long axis and shape of the rain clusters and the maximum rain rate.The area and long axis of continental rain clusters had a higher correlation with the rain rate thanthose of oceanic clusters. The establishment of a relationship between the morphology of rain clustersand precipitation helps us to understand the laws of precipitation and improve the prediction ofprecipitation in this region.
Keywords: Hainan Island; morphological characteristics; precipitation characteristics; sea–landdifferences
1. Introduction
Hainan Island is located in the tropical South China Sea at the southern tip of mainlandChina and has abundant water vapor throughout the year. As a result, it has one of highestannual rainfalls in China [1]. Hainan Island and the surrounding areas are affected byweather systems—such as monsoons, tropical cyclones, low-pressure troughs, fronts andjets—and the characteristics of precipitation in this region are complex [1–3]. HainanIsland is located at the intersection of the southern edge of the East Asian monsoon regionand the Northwest Pacific and therefore the physical parameters—such as the potentialtemperature, wind field, vorticity and precipitation—of the island and surrounding areasare important in monitoring the onset of the Chinese summer monsoon and tropicalcyclones [4,5]. An in-depth study of the characteristics of precipitation over Hainan Islandand the surrounding areas helps us to understand precipitation patterns in this region andimprove the forecasting of meteorological disasters in East Asia [6,7].
Remote Sens. 2021, 13, 2920. https://doi.org/10.3390/rs13152920 https://www.mdpi.com/journal/remotesensing
Remote Sens. 2021, 13, 2920 2 of 19
China has completed many observational experiments in the South China Sea andSouth China since the 1970s. These experiments have laid the scientific foundations forforecasting rainstorms in the South China Sea and South China and established a seriesof ground- and ship-based observational datasets [8–12]. However, these datasets lacklong-term, large-scale observations and can only be used for individual case studies. Ourunderstanding of the characteristics of precipitation over Hainan Island and its surroundingareas is still insufficient. The rapid development of satellite-detection technology over thelast 20 years means that we can now carry out large-scale continuous monitoring of cloudand precipitation systems without being restricted by the natural geographical conditions,effectively overcoming the disadvantages of ground-based observations. The observedprecipitation data has a wide coverage, long duration and high spatial accuracy [13].
Existing studies use multi-year average grid-based satellite data or pixel-level productsto obtain direct statistics to study the temporal and spatial characteristics of precipitation,without consideration of the integrity and continuity of the precipitation system. If an areaof continuous precipitation is identified as a rain cluster, then the systematic characteristicsof the rain cluster (such as the spatial form and total precipitation) can be obtained [14,15].Hamada et al. [16] showed that the relationship between heavy rainfall and deep convectionwas not strong at the scale of rain clusters. Chen et al. [17] found that slender and chunkyrain clusters had the largest rain intensity and moderate 3D rain clusters had the lowestrain intensity over the Tibetan Plateau.
Stationary meteorological satellites can effectively observe the appearance of cloudsbut provide large errors in the estimation of precipitation intensity. Theoretically, theappearance of clouds is related to the internal movement of the atmosphere, radiantheating and the water vapor phase transition in the atmospheric circulation, which isalso related to precipitation. Early data mainly used an artificial classification of rainclusters. Gagin et al. [18] and Tsonis et al. [19] used ground-based radar data to study therelationship between the area of rain clusters and precipitation. Song et al. [20] estimatedefficient areas of precipitation using S-band dual-polarization radar measurements andyielded a rigorous comparison in statistical and machine learning. Capsoni et al. [21] andAwaka [22] found a relationship between the characteristic radius and peak rainfall rates ofrain clusters. For large amounts of satellite data, Nesbitt et al. [23] used the ellipse-fittingarea method to fit rain clusters and then discussed the morphological differences betweenrain clusters over land and rain clusters over the ocean. Liu et al. [24] found that convectivesystems over land had a larger area and a more circular shape than convective systemsover oceans. In addition, more shallow convective systems appeared over the ocean andcoastal areas.
As a result of the unique geographical location and topography of Hainan Island, thethermodynamic conditions are different over the land and the ocean and the precipitationhas regional characteristics [1,25–29]. At present, we have an insufficient understanding ofthe scale of rain cluster precipitation characteristics of Hainan Island and its surroundingareas and especially a lack of understanding of the morphological characteristics of rainclusters. Our study aims to reveal the relationship between the morphological characteris-tics of rain clusters and the intensity of precipitation.
2. Data and Methods2.1. Data
The Global Precipitation Measurement (GPM) project is carried out by the NationalAeronautics and Space Administration (NASA) [30]. Its core satellite was launched on27 February 2014 and satellite precipitation observations have changed from the originalTropical Rainfall Measuring Mission (TRMM) satellites to GPM satellites. The GPM prod-ucts are divided into four levels based on different retrieval algorithms. The IntegratedMulti-satellitE Retrievals for GPM (GPM IMERG) is a three-level product representative ofthe GPM. It makes full use of the remote-sensing detection data from GPM satellites andvarious mature retrieval algorithms for the TRMM satellites to provide satellite-retrieval
Remote Sens. 2021, 13, 2920 3 of 19
precipitation products with a temporal resolution of up to 30 min and a spatial resolutionof (0.1◦ × 0.1◦).
Based on the number of precipitation data calibrations, IMERG provides three types ofprecipitation products: “Early Run”, “Late Run” and “Final Run”. The IMERG generationsystem runs once in the real-time phase to obtain the Early Run product. After obtainingmultiple data points, it is then run again to obtain the Late Run product. The Early Runand Late Run are quasi-real-time products and are released after 4 and 12 h of observations,respectively. On the basis of the Late Run, more sensor data sources are introduced forcalibration to obtain a higher precision research product (Final Run), which is usuallyreleased after 3.5 months of observations [31].
Preliminary assessments of the GPM IMERG product have been made in many re-gions. The detection of precipitation by the GPM satellites has been significantly improvedrelative to the TRMM satellites and it has a better correlation with observational datain China [32]. Feng et al. [33] used GPM IMERG satellite precipitation data and geosta-tionary meteorological satellite infrared brightness temperature data to build a long-term(2000–2019) global high-resolution mesoscale convective system database, in order to studythe characteristics of global mesoscale convective systems. Mahmoud et al. [34] evaluatedthe accuracy of GPM IMERG V06 (Early, Late, and Final) satellite precipitation productsat high latitudes in Finland and found that IMERG-Final satellite precipitation productsperformed best in its high correlation with ground observation.
We used the GPM IMERG HDF5-formatted level 3 satellite data product, Final Run,from 1 June 2000 to 31 December 2018 and the version IMERG V06B algorithm [35,36].The GPM IMERG series products were downloaded from NASA’s official website (https://gpm.nasa.gov/data/directory, accessed on 24 June 2021). We used terrain, height anddigital elevation model (DEM) data provided by the National Geophysical Data Centerwith a spatial resolution of 1/30◦. The National Geophysical Data Center DEM data canbe obtained from the United States Geological Survey website (www.ngdc.noaa.gov/,accessed on 24 June 2021).
2.2. Methods
Hainan Island is elliptical in shape with its long axis running from the northeastto the southwest. The terrain is high in the middle and surrounded by low terrain onall sides. The highest area is Wuzhi Mountain in the center (the main peak is 1867 mabove sea level). This region consists of mountains, hills, platforms, plains and terraces,which form a layered landform surrounding the central mountains [37–40]. The researcharea was located at (18◦03′–20◦15′N, 108◦27′–111◦9′E) and covered Hainan Island andthe surrounding offshore areas. The selected range of rain clusters (located at 15–23◦N,105–114◦E) was larger than the research area to reduce the impact of truncated rain clusters.
Because the selected area covers Hainan Island and the surrounding area, it is moreappropriate to study mesoscale and small-scale rain clusters, although the satellite dataare not precise enough and light rain clusters are susceptible to interference from otherfactors. We therefore mainly analyzed the characteristics of meso-β-scale rain clusters(20–200 km). The connected domain recognition technology widely used in the field ofimage recognition was employed to identify the meso-β-scale rain clusters. We mainlyimplemented it through the Open Source Computer Vision Library (OpenCV) developed byIntel. OpenCV provides interfaces for C++, Python, Java and MATLAB, etc., and includesrich libraries of image-processing and computer vision functions [41–43]. The satelliteimages were first binarized—that is, the precipitation area (set to 1) and the no precipitationarea (set to 0) were distinguished. We then called the function “findContours” in OpenCVto find all enclosed areas and identified each connected domain as a rain cluster. The totalnumber of mesoscale rain clusters calculated was 231,664 and these clusters were combinedwith DEM topographic data to distinguish between oceanic and continental rain clustersby distinguishing their central coordinates. There were 113,006 oceanic rain clusters and118,658 continental rain clusters.
Remote Sens. 2021, 13, 2920 4 of 19
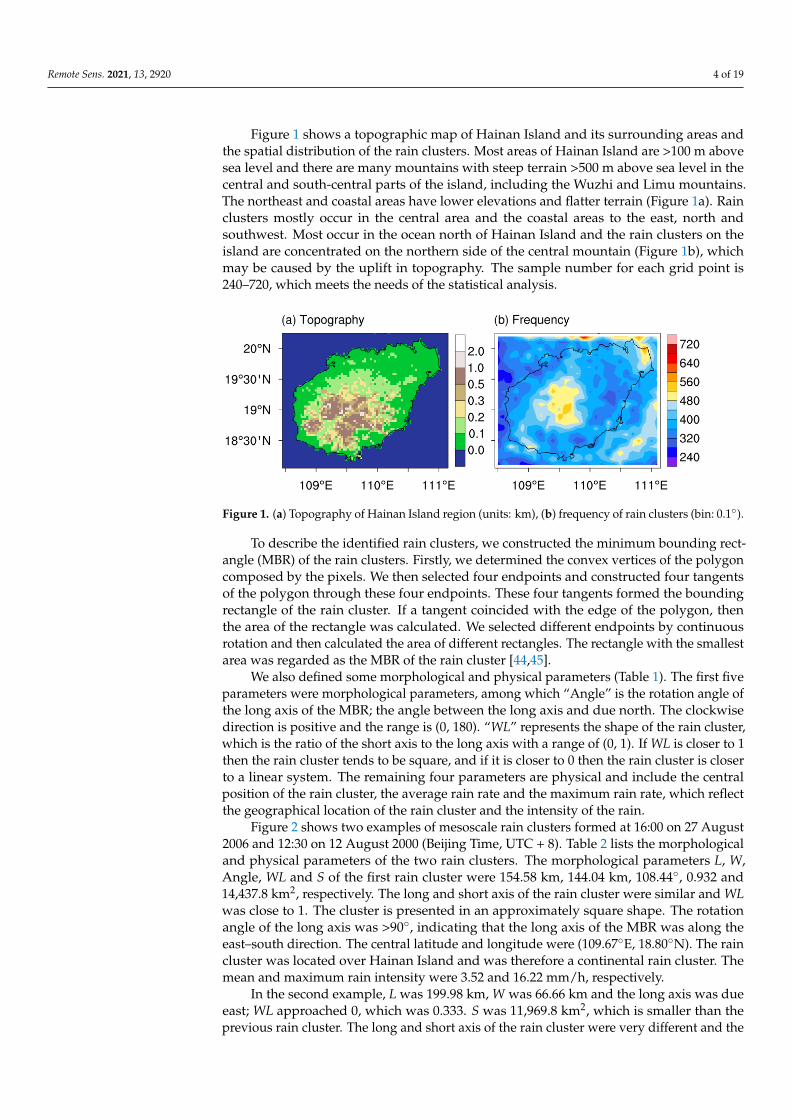
Figure 1 shows a topographic map of Hainan Island and its surrounding areas andthe spatial distribution of the rain clusters. Most areas of Hainan Island are >100 m abovesea level and there are many mountains with steep terrain >500 m above sea level in thecentral and south-central parts of the island, including the Wuzhi and Limu mountains.The northeast and coastal areas have lower elevations and flatter terrain (Figure 1a). Rainclusters mostly occur in the central area and the coastal areas to the east, north andsouthwest. Most occur in the ocean north of Hainan Island and the rain clusters on theisland are concentrated on the northern side of the central mountain (Figure 1b), whichmay be caused by the uplift in topography. The sample number for each grid point is240–720, which meets the needs of the statistical analysis.
Remote Sens. 2021, 13, x FOR PEER REVIEW 4 of 22
domain as a rain cluster. The total number of mesoscale rain clusters calculated was 231,664 and these clusters were combined with DEM topographic data to distinguish between oceanic and continental rain clusters by distinguishing their central coordinates. There were 113,006 oceanic rain clusters and 118,658 continental rain clusters.
Figure 1 shows a topographic map of Hainan Island and its surrounding areas and the spatial distribution of the rain clusters. Most areas of Hainan Island are >100 m above sea level and there are many mountains with steep terrain >500 m above sea level in the central and south-central parts of the island, including the Wuzhi and Limu mountains. The northeast and coastal areas have lower elevations and flatter terrain (Figure 1a). Rain clusters mostly occur in the central area and the coastal areas to the east, north and southwest. Most occur in the ocean north of Hainan Island and the rain clusters on the island are concentrated on the northern side of the central mountain (Figure 1b), which may be caused by the uplift in topography. The sample number for each grid point is 240-720, which meets the needs of the statistical analysis.
Figure 1. (a) Topography of Hainan Island region (units: km), (b) frequency of rain clusters (bin: 0.1°).
To describe the identified rain clusters, we constructed the minimum bounding rectangle (MBR) of the rain clusters. Firstly, we determined the convex vertices of the polygon composed by the pixels. We then selected four endpoints and constructed four tangents of the polygon through these four endpoints. These four tangents formed the bounding rectangle of the rain cluster. If a tangent coincided with the edge of the polygon, then the area of the rectangle was calculated. We selected different endpoints by continuous rotation and then calculated the area of different rectangles. The rectangle with the smallest area was regarded as the MBR of the rain cluster [44,45].
We also defined some morphological and physical parameters (Table 1). The first five parameters were morphological parameters, among which “Angle” is the rotation angle of the long axis of the MBR; the angle between the long axis and due north. The clockwise direction is positive and the range is (0, 180). “WL” represents the shape of the rain cluster, which is the ratio of the short axis to the long axis with a range of (0, 1). If WL is closer to 1 then the rain cluster tends to be square, and if it is closer to 0 then the rain cluster is closer to a linear system. The remaining four parameters are physical and include the central position of the rain cluster, the average rain rate and the maximum rain rate, which reflect the geographical location of the rain cluster and the intensity of the rain.
Figure 1. (a) Topography of Hainan Island region (units: km), (b) frequency of rain clusters (bin: 0.1◦).
To describe the identified rain clusters, we constructed the minimum bounding rect-angle (MBR) of the rain clusters. Firstly, we determined the convex vertices of the polygoncomposed by the pixels. We then selected four endpoints and constructed four tangentsof the polygon through these four endpoints. These four tangents formed the boundingrectangle of the rain cluster. If a tangent coincided with the edge of the polygon, thenthe area of the rectangle was calculated. We selected different endpoints by continuousrotation and then calculated the area of different rectangles. The rectangle with the smallestarea was regarded as the MBR of the rain cluster [44,45].
We also defined some morphological and physical parameters (Table 1). The first fiveparameters were morphological parameters, among which “Angle” is the rotation angle ofthe long axis of the MBR; the angle between the long axis and due north. The clockwisedirection is positive and the range is (0, 180). “WL” represents the shape of the rain cluster,which is the ratio of the short axis to the long axis with a range of (0, 1). If WL is closer to 1then the rain cluster tends to be square, and if it is closer to 0 then the rain cluster is closerto a linear system. The remaining four parameters are physical and include the centralposition of the rain cluster, the average rain rate and the maximum rain rate, which reflectthe geographical location of the rain cluster and the intensity of the rain.
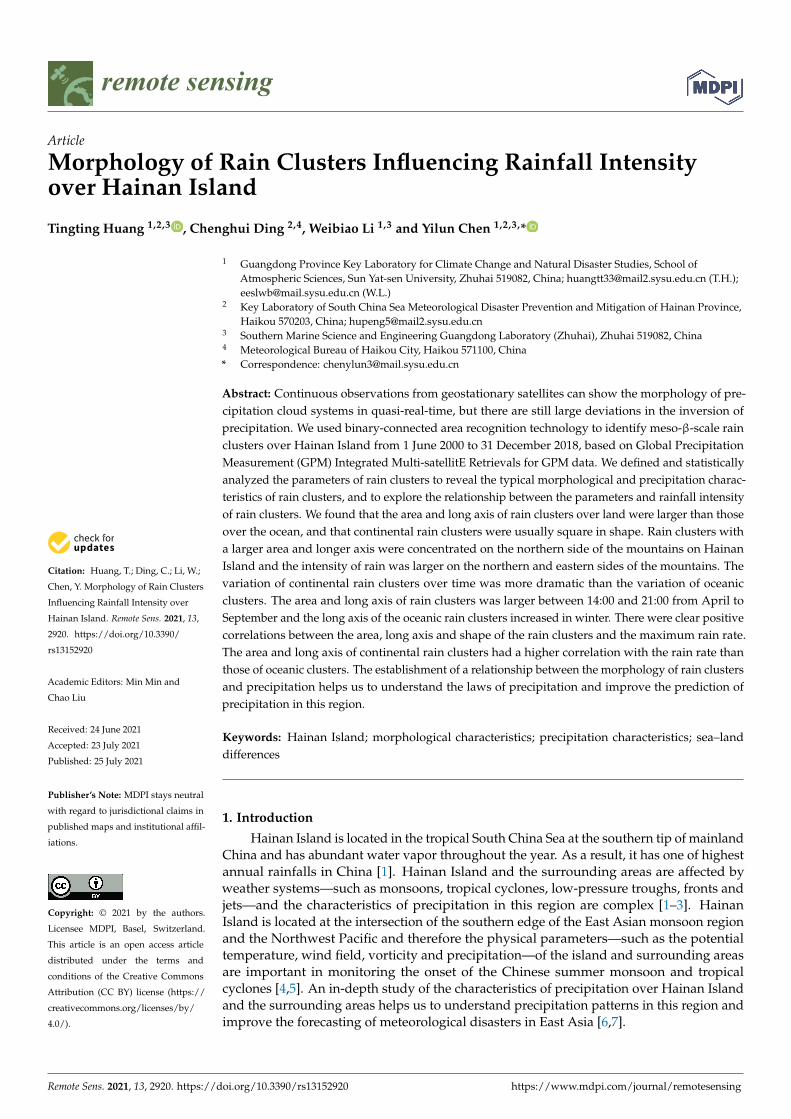
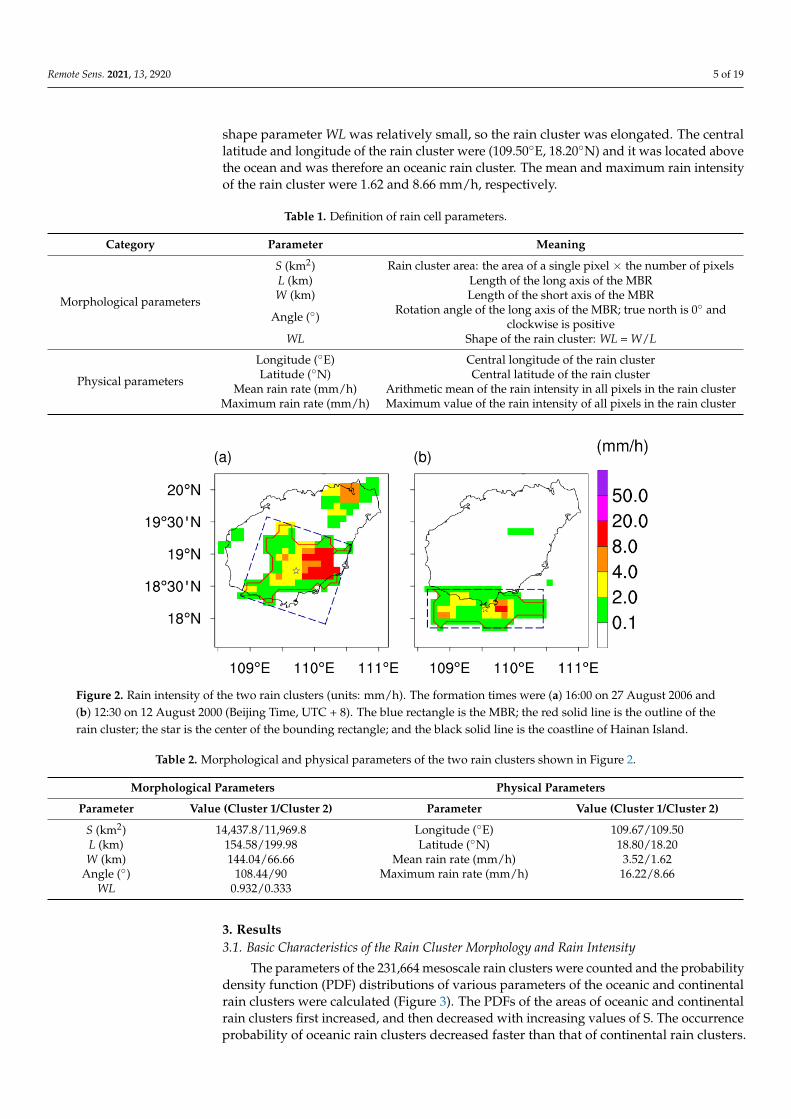
Figure 2 shows two examples of mesoscale rain clusters formed at 16:00 on 27 August2006 and 12:30 on 12 August 2000 (Beijing Time, UTC + 8). Table 2 lists the morphologicaland physical parameters of the two rain clusters. The morphological parameters L, W,Angle, WL and S of the first rain cluster were 154.58 km, 144.04 km, 108.44◦, 0.932 and14,437.8 km2, respectively. The long and short axis of the rain cluster were similar and WLwas close to 1. The cluster is presented in an approximately square shape. The rotationangle of the long axis was >90◦, indicating that the long axis of the MBR was along theeast–south direction. The central latitude and longitude were (109.67◦E, 18.80◦N). The raincluster was located over Hainan Island and was therefore a continental rain cluster. Themean and maximum rain intensity were 3.52 and 16.22 mm/h, respectively.
In the second example, L was 199.98 km, W was 66.66 km and the long axis was dueeast; WL approached 0, which was 0.333. S was 11,969.8 km2, which is smaller than theprevious rain cluster. The long and short axis of the rain cluster were very different and the
Remote Sens. 2021, 13, 2920 5 of 19
shape parameter WL was relatively small, so the rain cluster was elongated. The centrallatitude and longitude of the rain cluster were (109.50◦E, 18.20◦N) and it was located abovethe ocean and was therefore an oceanic rain cluster. The mean and maximum rain intensityof the rain cluster were 1.62 and 8.66 mm/h, respectively.
Table 1. Definition of rain cell parameters.
Category Parameter Meaning
Morphological parameters
S (km2) Rain cluster area: the area of a single pixel × the number of pixelsL (km) Length of the long axis of the MBRW (km) Length of the short axis of the MBR
Angle (◦) Rotation angle of the long axis of the MBR; true north is 0◦ andclockwise is positive
WL Shape of the rain cluster: WL = W/L
Physical parameters
Longitude (◦E) Central longitude of the rain clusterLatitude (◦N) Central latitude of the rain cluster
Mean rain rate (mm/h) Arithmetic mean of the rain intensity in all pixels in the rain clusterMaximum rain rate (mm/h) Maximum value of the rain intensity of all pixels in the rain cluster
Remote Sens. 2021, 13, x FOR PEER REVIEW 5 of 22
Table 1. Definition of rain cell parameters.
Category Parameter Meaning
Morphological parameters
S (km ) Rain cluster area: the area of a single pixel × the number of pixels L (km) Length of the long axis of the MBR W (km) Length of the short axis of the MBR
Angle (°) Rotation angle of the long axis of the MBR; true north is 0° and clockwise is positive
WL Shape of the rain cluster: WL = W/L
Physical parameters
Longitude (°E) Central longitude of the rain cluster Latitude (°N) Central latitude of the rain cluster
Mean rain rate (mm/h) Arithmetic mean of the rain intensity in all pixels in the rain cluster Maximum rain rate (mm/h) Maximum value of the rain intensity of all pixels in the rain cluster
Figure 2 shows two examples of mesoscale rain clusters formed at 16:00 on 27 August 2006 and 12:30 on 12 August 2000 (Beijing Time, UTC+8). Table 2 lists the morphological and physical parameters of the two rain clusters. The morphological parameters L, W, Angle, WL and S of the first rain cluster were 154.58 km, 144.04 km, 108.44°, 0.932 and 14437.8 km2, respectively. The long and short axis of the rain cluster were similar and WL was close to 1. The cluster is presented in an approximately square shape. The rotation angle of the long axis was >90°, indicating that the long axis of the MBR was along the east–south direction. The central latitude and longitude were (109.67°E, 18.80°N). The rain cluster was located over Hainan Island and was therefore a continental rain cluster. The mean and maximum rain intensity were 3.52 and 16.22 mm/h, respectively.
In the second example, L was 199.98 km, W was 66.66 km and the long axis was due east; WL approached 0, which was 0.333. S was 11969.8 km2, which is smaller than the previous rain cluster. The long and short axis of the rain cluster were very different and the shape parameter WL was relatively small, so the rain cluster was elongated. The central latitude and longitude of the rain cluster were (109.50°E, 18.20°N) and it was located above the ocean and was therefore an oceanic rain cluster. The mean and maximum rain intensity of the rain cluster were 1.62 and 8.66 mm/h, respectively.
Figure 2. Rain intensity of the two rain clusters (units: mm/h). The formation times were (a) 16:00 on 27 August 2006 and (b) 12:30 on 12 August 2000 (Beijing Time, UTC+8). The blue rectangle is the MBR; the red solid line is the outline of the rain cluster; the star is the center of the bounding rectangle; and the black solid line is the coastline of Hainan Island.
Figure 2. Rain intensity of the two rain clusters (units: mm/h). The formation times were (a) 16:00 on 27 August 2006 and(b) 12:30 on 12 August 2000 (Beijing Time, UTC + 8). The blue rectangle is the MBR; the red solid line is the outline of therain cluster; the star is the center of the bounding rectangle; and the black solid line is the coastline of Hainan Island.
Table 2. Morphological and physical parameters of the two rain clusters shown in Figure 2.
Morphological Parameters Physical Parameters
Parameter Value (Cluster 1/Cluster 2) Parameter Value (Cluster 1/Cluster 2)
S (km2) 14,437.8/11,969.8 Longitude (◦E) 109.67/109.50L (km) 154.58/199.98 Latitude (◦N) 18.80/18.20W (km) 144.04/66.66 Mean rain rate (mm/h) 3.52/1.62
Angle (◦) 108.44/90 Maximum rain rate (mm/h) 16.22/8.66WL 0.932/0.333
3. Results3.1. Basic Characteristics of the Rain Cluster Morphology and Rain Intensity
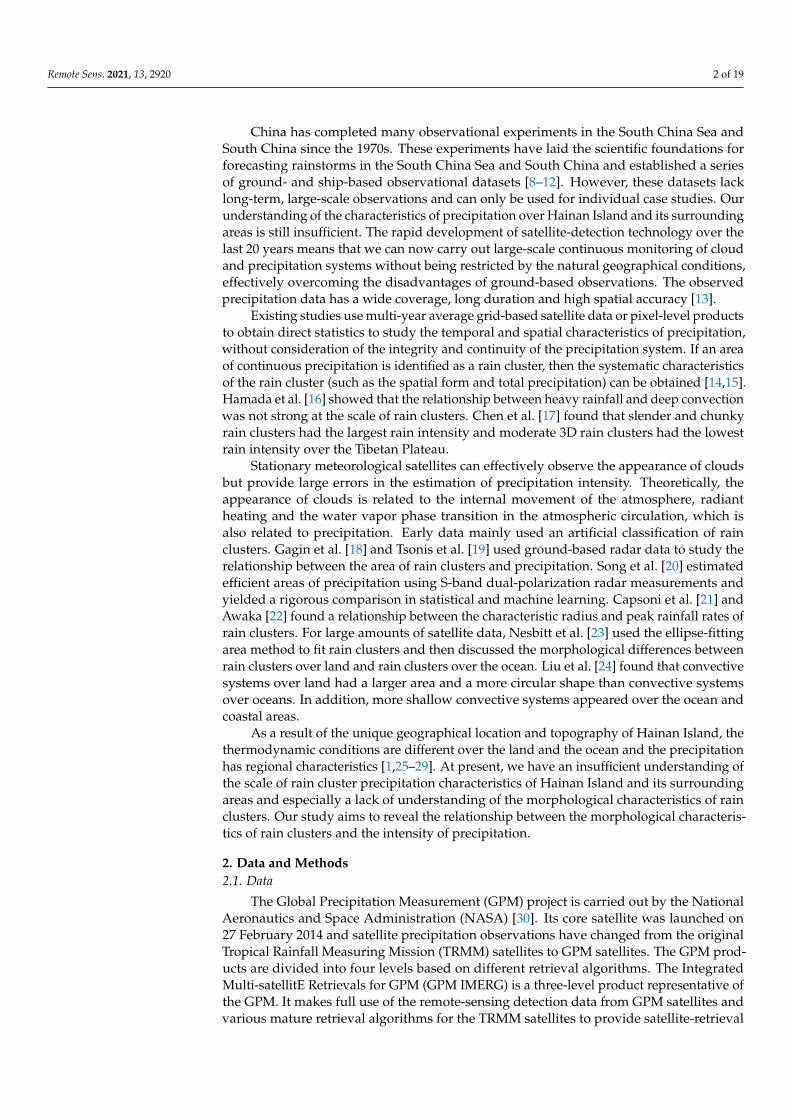
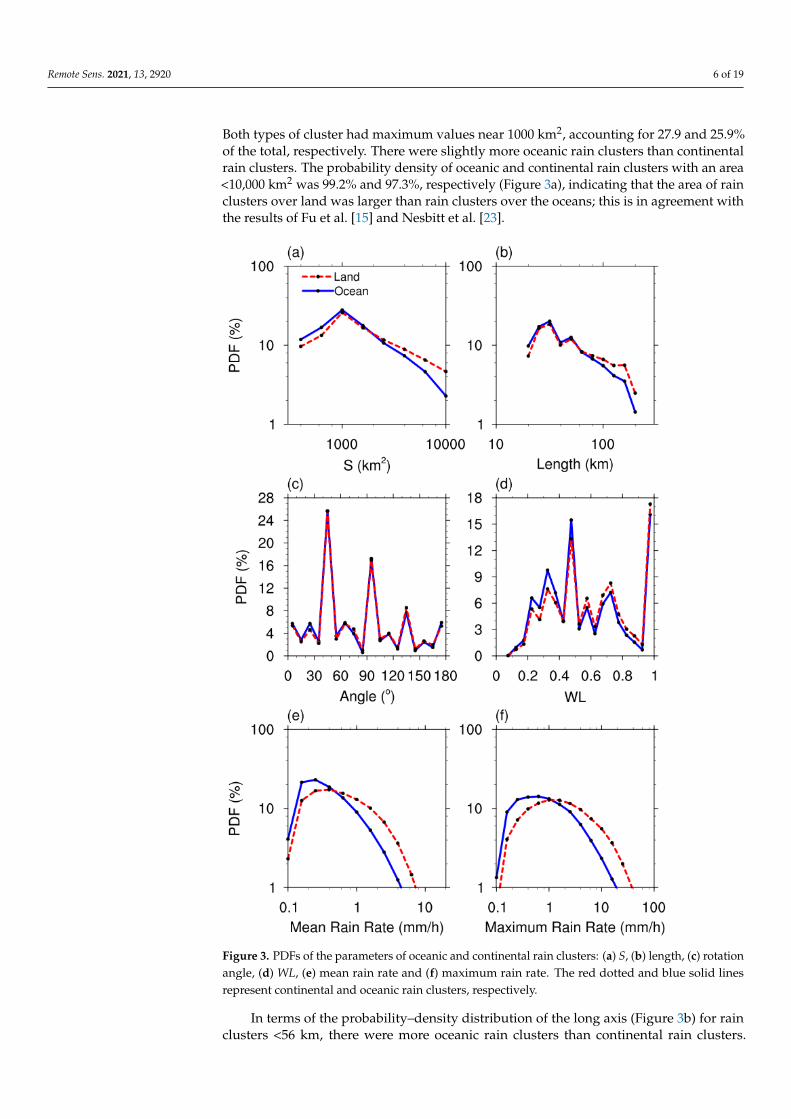
The parameters of the 231,664 mesoscale rain clusters were counted and the probabilitydensity function (PDF) distributions of various parameters of the oceanic and continentalrain clusters were calculated (Figure 3). The PDFs of the areas of oceanic and continentalrain clusters first increased, and then decreased with increasing values of S. The occurrenceprobability of oceanic rain clusters decreased faster than that of continental rain clusters.
Remote Sens. 2021, 13, 2920 6 of 19
Both types of cluster had maximum values near 1000 km2, accounting for 27.9 and 25.9%of the total, respectively. There were slightly more oceanic rain clusters than continentalrain clusters. The probability density of oceanic and continental rain clusters with an area<10,000 km2 was 99.2% and 97.3%, respectively (Figure 3a), indicating that the area of rainclusters over land was larger than rain clusters over the oceans; this is in agreement withthe results of Fu et al. [15] and Nesbitt et al. [23].
Remote Sens. 2021, 13, x FOR PEER REVIEW 8 of 22
over land. Convective clouds mostly appeared over land, whereas more stratocumulus clouds, with shallower precipitation, appeared over the ocean [47,48].
Figure 3. PDFs of the parameters of oceanic and continental rain clusters: (a) S, (b) length, (c) rotation angle, (d) WL, (e) mean rain rate and (f) maximum rain rate. The red dotted and blue solid lines represent continental and oceanic rain clusters, respectively.
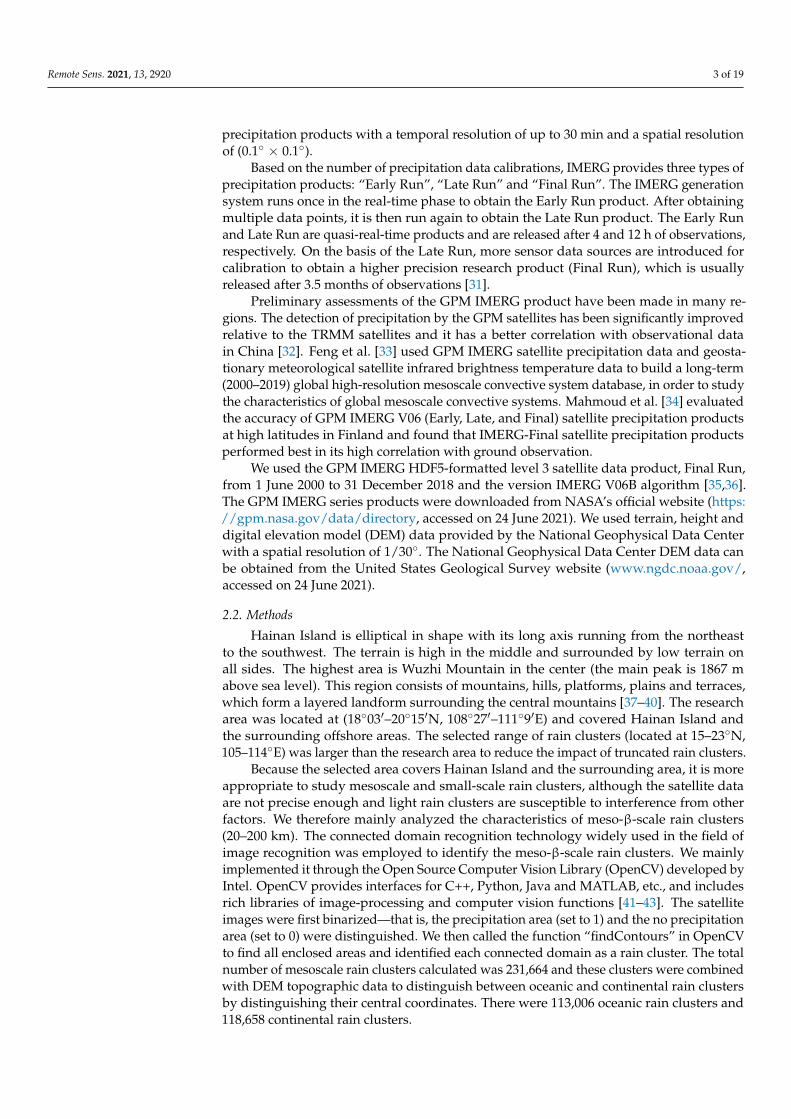
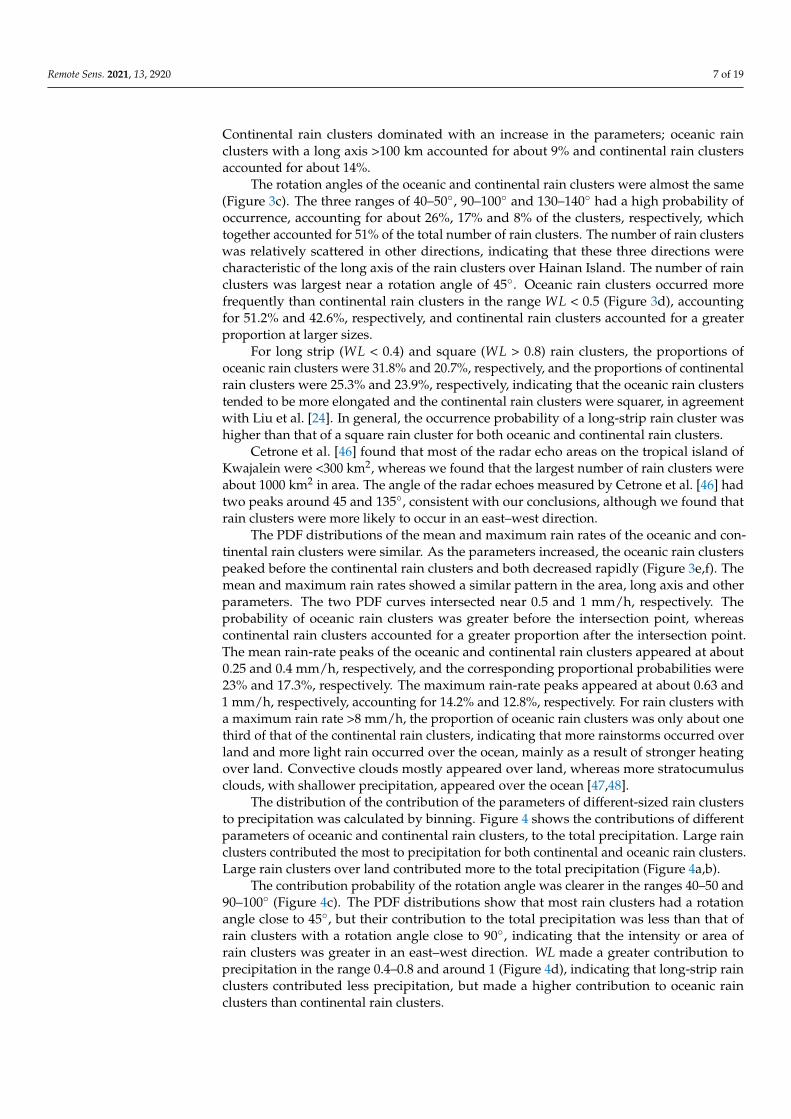
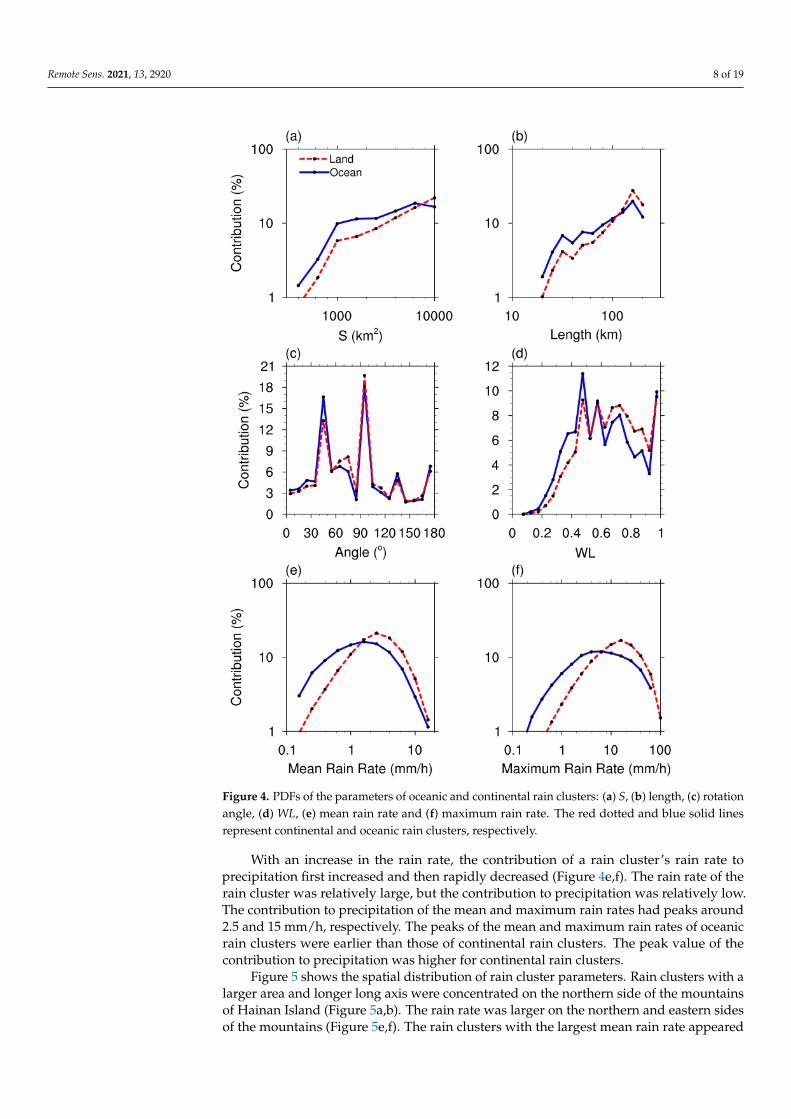
The distribution of the contribution of the parameters of different-sized rain clusters to precipitation was calculated by binning. Figure 4 shows the contributions of different parameters of oceanic and continental rain clusters, to the total precipitation. Large rain clusters contributed the most to precipitation for both continental and oceanic rain clusters. Large rain clusters over land contributed more to the total precipitation (Figure 4a,b).
Figure 3. PDFs of the parameters of oceanic and continental rain clusters: (a) S, (b) length, (c) rotationangle, (d) WL, (e) mean rain rate and (f) maximum rain rate. The red dotted and blue solid linesrepresent continental and oceanic rain clusters, respectively.
In terms of the probability–density distribution of the long axis (Figure 3b) for rainclusters <56 km, there were more oceanic rain clusters than continental rain clusters.
Remote Sens. 2021, 13, 2920 7 of 19
Continental rain clusters dominated with an increase in the parameters; oceanic rainclusters with a long axis >100 km accounted for about 9% and continental rain clustersaccounted for about 14%.
The rotation angles of the oceanic and continental rain clusters were almost the same(Figure 3c). The three ranges of 40–50◦, 90–100◦ and 130–140◦ had a high probability ofoccurrence, accounting for about 26%, 17% and 8% of the clusters, respectively, whichtogether accounted for 51% of the total number of rain clusters. The number of rain clusterswas relatively scattered in other directions, indicating that these three directions werecharacteristic of the long axis of the rain clusters over Hainan Island. The number of rainclusters was largest near a rotation angle of 45◦. Oceanic rain clusters occurred morefrequently than continental rain clusters in the range WL < 0.5 (Figure 3d), accountingfor 51.2% and 42.6%, respectively, and continental rain clusters accounted for a greaterproportion at larger sizes.
For long strip (WL < 0.4) and square (WL > 0.8) rain clusters, the proportions ofoceanic rain clusters were 31.8% and 20.7%, respectively, and the proportions of continentalrain clusters were 25.3% and 23.9%, respectively, indicating that the oceanic rain clusterstended to be more elongated and the continental rain clusters were squarer, in agreementwith Liu et al. [24]. In general, the occurrence probability of a long-strip rain cluster washigher than that of a square rain cluster for both oceanic and continental rain clusters.
Cetrone et al. [46] found that most of the radar echo areas on the tropical island ofKwajalein were <300 km2, whereas we found that the largest number of rain clusters wereabout 1000 km2 in area. The angle of the radar echoes measured by Cetrone et al. [46] hadtwo peaks around 45 and 135◦, consistent with our conclusions, although we found thatrain clusters were more likely to occur in an east–west direction.
The PDF distributions of the mean and maximum rain rates of the oceanic and con-tinental rain clusters were similar. As the parameters increased, the oceanic rain clusterspeaked before the continental rain clusters and both decreased rapidly (Figure 3e,f). Themean and maximum rain rates showed a similar pattern in the area, long axis and otherparameters. The two PDF curves intersected near 0.5 and 1 mm/h, respectively. Theprobability of oceanic rain clusters was greater before the intersection point, whereascontinental rain clusters accounted for a greater proportion after the intersection point.The mean rain-rate peaks of the oceanic and continental rain clusters appeared at about0.25 and 0.4 mm/h, respectively, and the corresponding proportional probabilities were23% and 17.3%, respectively. The maximum rain-rate peaks appeared at about 0.63 and1 mm/h, respectively, accounting for 14.2% and 12.8%, respectively. For rain clusters witha maximum rain rate >8 mm/h, the proportion of oceanic rain clusters was only about onethird of that of the continental rain clusters, indicating that more rainstorms occurred overland and more light rain occurred over the ocean, mainly as a result of stronger heatingover land. Convective clouds mostly appeared over land, whereas more stratocumulusclouds, with shallower precipitation, appeared over the ocean [47,48].
The distribution of the contribution of the parameters of different-sized rain clustersto precipitation was calculated by binning. Figure 4 shows the contributions of differentparameters of oceanic and continental rain clusters, to the total precipitation. Large rainclusters contributed the most to precipitation for both continental and oceanic rain clusters.Large rain clusters over land contributed more to the total precipitation (Figure 4a,b).
The contribution probability of the rotation angle was clearer in the ranges 40–50 and90–100◦ (Figure 4c). The PDF distributions show that most rain clusters had a rotationangle close to 45◦, but their contribution to the total precipitation was less than that ofrain clusters with a rotation angle close to 90◦, indicating that the intensity or area ofrain clusters was greater in an east–west direction. WL made a greater contribution toprecipitation in the range 0.4–0.8 and around 1 (Figure 4d), indicating that long-strip rainclusters contributed less precipitation, but made a higher contribution to oceanic rainclusters than continental rain clusters.
Remote Sens. 2021, 13, 2920 8 of 19
Remote Sens. 2021, 13, x FOR PEER REVIEW 9 of 22
The contribution probability of the rotation angle was clearer in the ranges 40-50 and 90-100° (Figure 4c). The PDF distributions show that most rain clusters had a rotation angle close to 45°, but their contribution to the total precipitation was less than that of rain clusters with a rotation angle close to 90°, indicating that the intensity or area of rain clusters was greater in an east–west direction. WL made a greater contribution to precipitation in the range 0.4-0.8 and around 1 (Figure 4d), indicating that long-strip rain clusters contributed less precipitation, but made a higher contribution to oceanic rain clusters than continental rain clusters.
With an increase in the rain rate, the contribution of a rain cluster’s rain rate to precipitation first increased and then rapidly decreased (Figure 4e,f). The rain rate of the rain cluster was relatively large, but the contribution to precipitation was relatively low. The contribution to precipitation of the mean and maximum rain rates had peaks around 2.5 and 15 mm/h, respectively. The peaks of the mean and maximum rain rates of oceanic rain clusters were earlier than those of continental rain clusters. The peak value of the contribution to precipitation was higher for continental rain clusters.
Figure 4. PDFs of the parameters of oceanic and continental rain clusters: (a) S, (b) length, (c) rotationangle, (d) WL, (e) mean rain rate and (f) maximum rain rate. The red dotted and blue solid linesrepresent continental and oceanic rain clusters, respectively.
With an increase in the rain rate, the contribution of a rain cluster’s rain rate toprecipitation first increased and then rapidly decreased (Figure 4e,f). The rain rate of therain cluster was relatively large, but the contribution to precipitation was relatively low.The contribution to precipitation of the mean and maximum rain rates had peaks around2.5 and 15 mm/h, respectively. The peaks of the mean and maximum rain rates of oceanicrain clusters were earlier than those of continental rain clusters. The peak value of thecontribution to precipitation was higher for continental rain clusters.
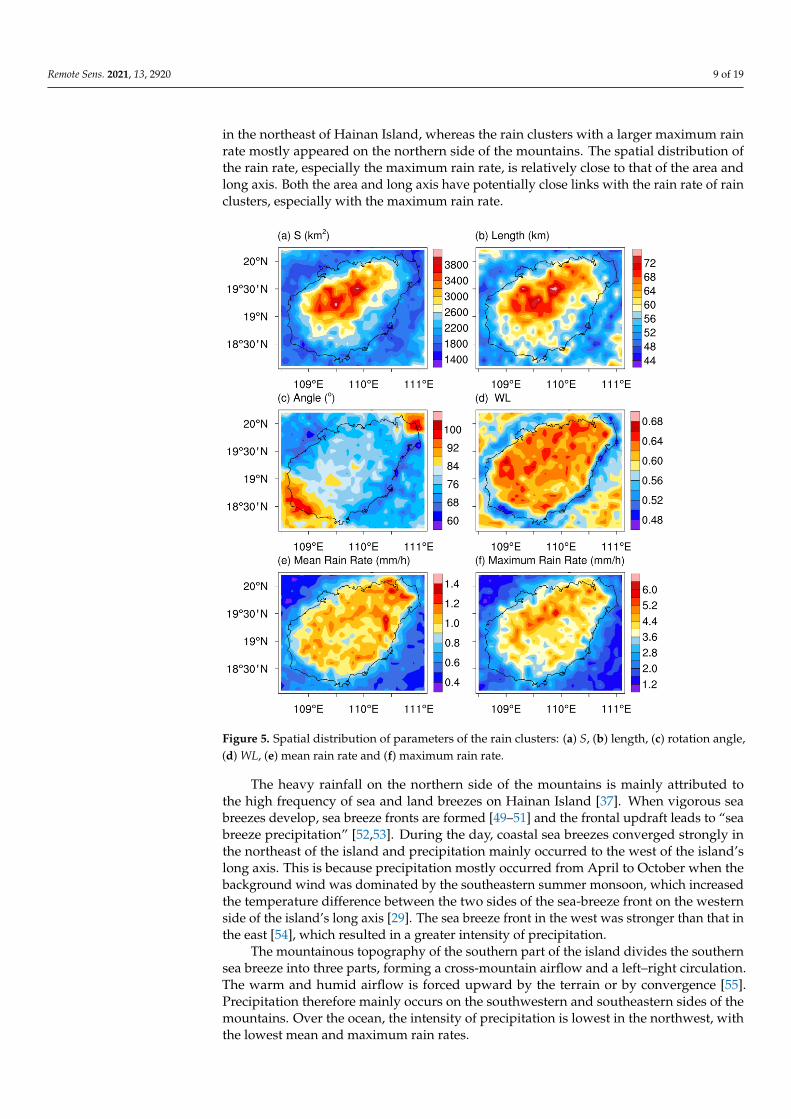
Figure 5 shows the spatial distribution of rain cluster parameters. Rain clusters with alarger area and longer long axis were concentrated on the northern side of the mountainsof Hainan Island (Figure 5a,b). The rain rate was larger on the northern and eastern sidesof the mountains (Figure 5e,f). The rain clusters with the largest mean rain rate appeared
Remote Sens. 2021, 13, 2920 9 of 19
in the northeast of Hainan Island, whereas the rain clusters with a larger maximum rainrate mostly appeared on the northern side of the mountains. The spatial distribution ofthe rain rate, especially the maximum rain rate, is relatively close to that of the area andlong axis. Both the area and long axis have potentially close links with the rain rate of rainclusters, especially with the maximum rain rate.
Remote Sens. 2021, 13, x FOR PEER REVIEW 11 of 22
Figure 5. Spatial distribution of parameters of the rain clusters: (a) S, (b) length, (c) rotation angle, (d) WL, (e) mean rain rate and (f) maximum rain rate.
3.2. Temporal Variation of Rain Cluster Shape and Rain Rate We also studied the diurnal variation of the parameters of the oceanic and continental
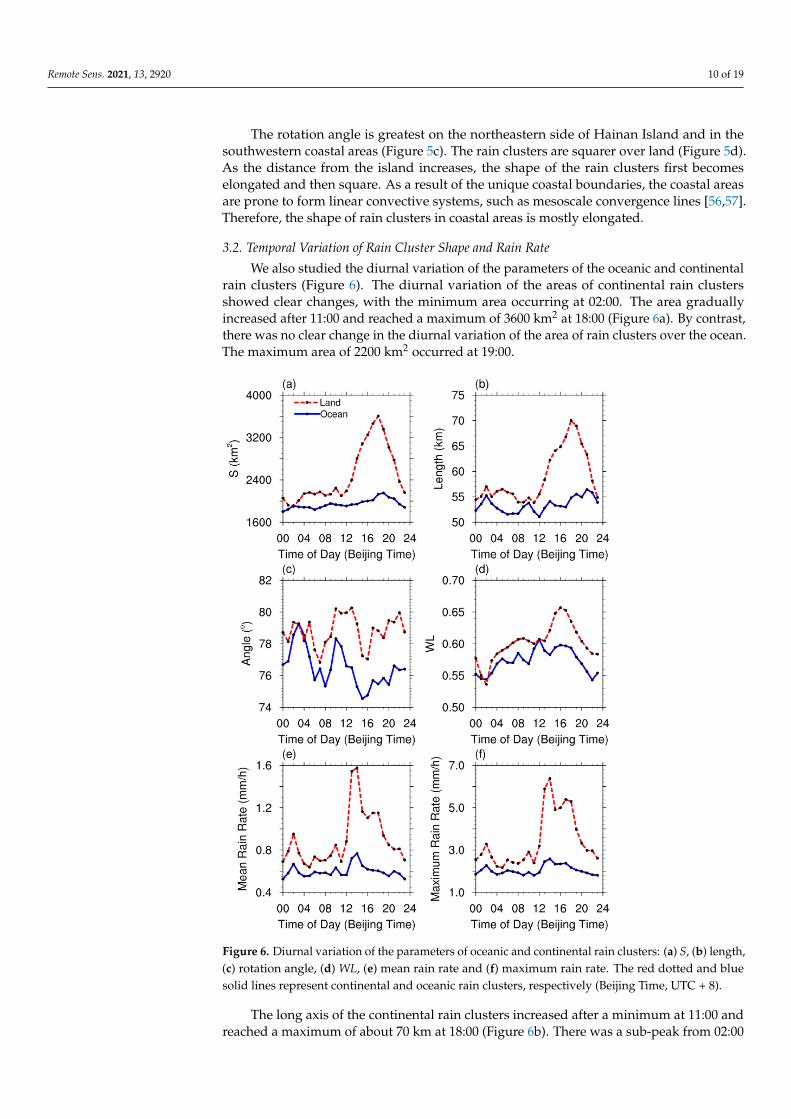
rain clusters (Figure 6). The diurnal variation of the areas of continental rain clusters showed clear changes, with the minimum area occurring at 02:00. The area gradually increased after 11:00 and reached a maximum of 3600 km2 at 18:00 (Figure 6a). By contrast, there was no clear change in the diurnal variation of the area of rain clusters over the ocean. The maximum area of 2200 km2 occurred at 19:00.
The long axis of the continental rain clusters increased after a minimum at 11:00 and reached a maximum of about 70 km at 18:00 (Figure 6b). There was a sub-peak from 02:00 to 05:00. The long axis of the oceanic rain clusters peaked at about 57 km at 02:00 and 21:00 and the minimum of the long axis (about 51 km) appeared at 12:00.
There were clear diurnal variations in the rotation angle of the oceanic rain clusters, with an amplitude close to 6°, whereas the amplitude for continental rain clusters was <4° (Figure 6c). The rotation angle of both continental and oceanic rain clusters increased at about 03:00, 10:00 and 18:00. Continental rain clusters maintained a small vibration for several hours at this angle and rainfall increased significantly in these three time periods. The increase in rainfall may therefore be related to the increase in the rotation angle or the more eastward location of the rain cluster.
The shape of the continental rain clusters changed more obviously than that of oceanic rain clusters (Figure 6d). The minimum value of WL for the continental clusters was about 0.53 at 02:00. At this time, the rain clusters were relatively slender and then
Figure 5. Spatial distribution of parameters of the rain clusters: (a) S, (b) length, (c) rotation angle,(d) WL, (e) mean rain rate and (f) maximum rain rate.
The heavy rainfall on the northern side of the mountains is mainly attributed tothe high frequency of sea and land breezes on Hainan Island [37]. When vigorous seabreezes develop, sea breeze fronts are formed [49–51] and the frontal updraft leads to “seabreeze precipitation” [52,53]. During the day, coastal sea breezes converged strongly inthe northeast of the island and precipitation mainly occurred to the west of the island’slong axis. This is because precipitation mostly occurred from April to October when thebackground wind was dominated by the southeastern summer monsoon, which increasedthe temperature difference between the two sides of the sea-breeze front on the westernside of the island’s long axis [29]. The sea breeze front in the west was stronger than that inthe east [54], which resulted in a greater intensity of precipitation.
The mountainous topography of the southern part of the island divides the southernsea breeze into three parts, forming a cross-mountain airflow and a left–right circulation.The warm and humid airflow is forced upward by the terrain or by convergence [55].Precipitation therefore mainly occurs on the southwestern and southeastern sides of themountains. Over the ocean, the intensity of precipitation is lowest in the northwest, withthe lowest mean and maximum rain rates.
Remote Sens. 2021, 13, 2920 10 of 19
The rotation angle is greatest on the northeastern side of Hainan Island and in thesouthwestern coastal areas (Figure 5c). The rain clusters are squarer over land (Figure 5d).As the distance from the island increases, the shape of the rain clusters first becomeselongated and then square. As a result of the unique coastal boundaries, the coastal areasare prone to form linear convective systems, such as mesoscale convergence lines [56,57].Therefore, the shape of rain clusters in coastal areas is mostly elongated.
3.2. Temporal Variation of Rain Cluster Shape and Rain Rate
We also studied the diurnal variation of the parameters of the oceanic and continentalrain clusters (Figure 6). The diurnal variation of the areas of continental rain clustersshowed clear changes, with the minimum area occurring at 02:00. The area graduallyincreased after 11:00 and reached a maximum of 3600 km2 at 18:00 (Figure 6a). By contrast,there was no clear change in the diurnal variation of the area of rain clusters over the ocean.The maximum area of 2200 km2 occurred at 19:00.
Remote Sens. 2021, 13, x FOR PEER REVIEW 13 of 22
Figure 6. Diurnal variation of the parameters of oceanic and continental rain clusters: (a) S, (b) length, (c) rotation angle, (d) WL, (e) mean rain rate and (f) maximum rain rate. The red dotted and blue solid lines represent continental and oceanic rain clusters, respectively (Beijing Time, UTC+8).
We classified the diurnal variations of the parameters for each month to show the diurnal and intra-annual variations (Figures 7 and 8). The parameters of the oceanic and continental rain clusters were calculated to show the diurnal variation in each month. The area of continental rain clusters showed clear intra-annual and diurnal variations (Figure 7b), mainly concentrated between 13:00 and 21:00 from April-October when the area was relatively large; the area reached a maximum in May. This is because the summer monsoon breaks out in this time period [8]. The area increased again in August as a result of the impact of the later flood season [57]. The area of the continental rain clusters was small in winter, whereas the area of the oceanic rain clusters did not change significantly throughout the year and the rain clusters were always relatively small (Figure 7a).
Figure 6. Diurnal variation of the parameters of oceanic and continental rain clusters: (a) S, (b) length,(c) rotation angle, (d) WL, (e) mean rain rate and (f) maximum rain rate. The red dotted and bluesolid lines represent continental and oceanic rain clusters, respectively (Beijing Time, UTC + 8).
The long axis of the continental rain clusters increased after a minimum at 11:00 andreached a maximum of about 70 km at 18:00 (Figure 6b). There was a sub-peak from 02:00
Remote Sens. 2021, 13, 2920 11 of 19
to 05:00. The long axis of the oceanic rain clusters peaked at about 57 km at 02:00 and 21:00and the minimum of the long axis (about 51 km) appeared at 12:00.
There were clear diurnal variations in the rotation angle of the oceanic rain clusters,with an amplitude close to 6◦, whereas the amplitude for continental rain clusters was <4◦
(Figure 6c). The rotation angle of both continental and oceanic rain clusters increased atabout 03:00, 10:00 and 18:00. Continental rain clusters maintained a small vibration forseveral hours at this angle and rainfall increased significantly in these three time periods.The increase in rainfall may therefore be related to the increase in the rotation angle or themore eastward location of the rain cluster.
The shape of the continental rain clusters changed more obviously than that of oceanicrain clusters (Figure 6d). The minimum value of WL for the continental clusters was about0.53 at 02:00. At this time, the rain clusters were relatively slender and then graduallychanged to a square. The maximum value of 0.66 appeared at 16:00. The minimum valueof the oceanic rain clusters was 0.54 at 02:00 and 22:00 and the maximum value of 0.61occurred at 12:00.
The variation trend of the mean rain rate of oceanic and continental rain clusters wassimilar (Figure 6e). The mean rain rate of continental rain clusters changed more than thatof oceanic rain clusters during the day and exceeded the mean rain rate of oceanic rainclusters. There were multiple peaks at 02:00, 14:00 and 18:00. The mean rainfall rate ofcontinental rain clusters showed an extra peak in precipitation around dusk. The maximumrainfall occurred at 14:00, when the mean rain rate of continental rain clusters reachedabout 1.6 mm/h, twice that of oceanic rain clusters. The trends in the diurnal variation ofthe maximum rain rate of both types of cluster were similar (Figure 6f), but the diurnalvariation and intensity of the precipitation of continental rain clusters were greater thanthose of oceanic rain clusters. The maximum rain rates of 6.4 and 2.6 mm/h for continentaland oceanic rain clusters, respectively, occurred at 14:00.
Many researchers have found that night-time rainfall is very common on tropicalislands and that this is closely related to inertial oscillations [28]. Chen and Du et al. [58–60]showed that the enhancement of the oceanic boundary layer jets at night triggers convectionand, combined with the influence of terrain and cold pools, produces strong rainfall. Thepeak precipitation in the afternoon is attributed to strong convection caused by solarheating and the peak at dusk is attributed to the strong low-level convergence producedby sea and land breezes around 18:00 [1].
By combining rain intensity, shape and area, we found that the rain intensity reacheda peak first, and then the shape reached a peak, followed by a peak in the area of therain cluster. This shows that the initial convection was triggered by strong heating. Theshape was relatively random at the start and the system gradually became more organized.The shape of the precipitation system became square. Under the influence of water-vaportransport, it spread to the surroundings and the area of stratus clouds expanded.
We classified the diurnal variations of the parameters for each month to show thediurnal and intra-annual variations (Figures 7 and 8). The parameters of the oceanic andcontinental rain clusters were calculated to show the diurnal variation in each month.The area of continental rain clusters showed clear intra-annual and diurnal variations(Figure 7b), mainly concentrated between 13:00 and 21:00 from April–October when thearea was relatively large; the area reached a maximum in May. This is because the summermonsoon breaks out in this time period [8]. The area increased again in August as a resultof the impact of the later flood season [57]. The area of the continental rain clusters wassmall in winter, whereas the area of the oceanic rain clusters did not change significantlythroughout the year and the rain clusters were always relatively small (Figure 7a).
The long axis of the continental rain clusters also showed significant intra-annual vari-ations (Figure 7d). The long axis was relatively large between 14:00 and 21:00 from April–September and reached a maximum around dusk from April–September. The long axisof continental rain clusters was relatively small in winter with a minimum at 03:00 in Jan-uary, whereas the oceanic rain clusters had a larger long axis in winter, especially in January
Remote Sens. 2021, 13, 2920 12 of 19
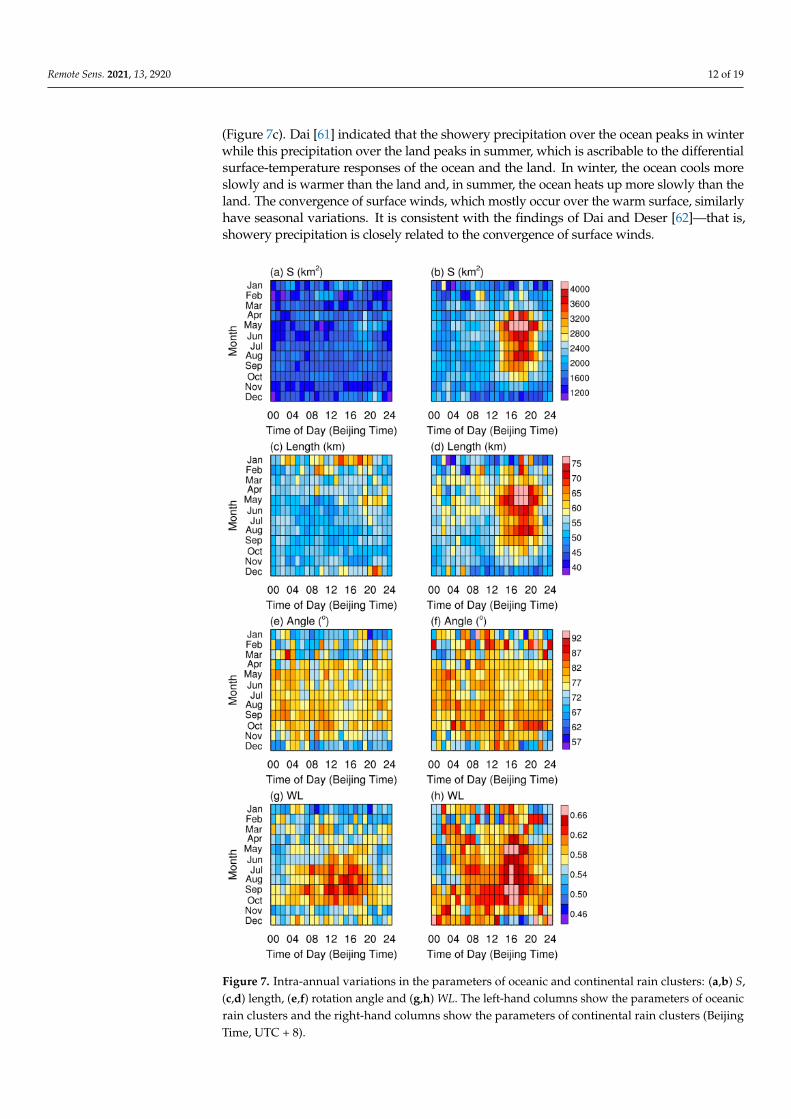
(Figure 7c). Dai [61] indicated that the showery precipitation over the ocean peaks in winterwhile this precipitation over the land peaks in summer, which is ascribable to the differentialsurface-temperature responses of the ocean and the land. In winter, the ocean cools moreslowly and is warmer than the land and, in summer, the ocean heats up more slowly than theland. The convergence of surface winds, which mostly occur over the warm surface, similarlyhave seasonal variations. It is consistent with the findings of Dai and Deser [62]—that is,showery precipitation is closely related to the convergence of surface winds.
Remote Sens. 2021, 13, x FOR PEER REVIEW 14 of 22
Figure 7. Intra-annual variations in the parameters of oceanic and continental rain clusters: (a,b) S, (c,d) length, (e,f) rotation angle and (g,h) WL. The left-hand columns show the parameters of oceanic rain clusters and the right-hand columns show the parameters of continental rain clusters (Beijing Time, UTC+8).
The long axis of the continental rain clusters also showed significant intra-annual variations (Figure 7d). The long axis was relatively large between 14:00 and 21:00 from April-September and reached a maximum around dusk from April-September. The long axis of continental rain clusters was relatively small in winter with a minimum at 03:00 in January, whereas the oceanic rain clusters had a larger long axis in winter, especially in January (Figure 7c). Dai [61] indicated that the showery precipitation over the ocean peaks in winter while this precipitation over the land peaks in summer, which is ascribable to
Figure 7. Intra-annual variations in the parameters of oceanic and continental rain clusters: (a,b) S,(c,d) length, (e,f) rotation angle and (g,h) WL. The left-hand columns show the parameters of oceanicrain clusters and the right-hand columns show the parameters of continental rain clusters (BeijingTime, UTC + 8).
Remote Sens. 2021, 13, 2920 13 of 19Remote Sens. 2021, 13, x FOR PEER REVIEW 16 of 22
Figure 8. Intra-annual variations in the parameters of oceanic and continental rain clusters: (a,b) mean rain rate and (c,d) maximum rain rate. The left-hand columns show the parameters of oceanic rain clusters and the right-hand columns show the parameters of continental rain clusters (Beijing Time, UTC+8).
3.3. Relationship between the Morphology of Rain Clusters and Rainfall Intensity We arranged the meso-β-scale rain clusters in ascending order of parameters, divided
the samples into 100 groups, calculated the average of each group and obtained 100 sample points. We then found the relationship between the morphological parameters of the rain clusters and the mean and maximum rain rates corresponding to the 100 sample points. Grouping of equal samples can reduce the influence of extreme values in the original data and has the power of a statistical test.
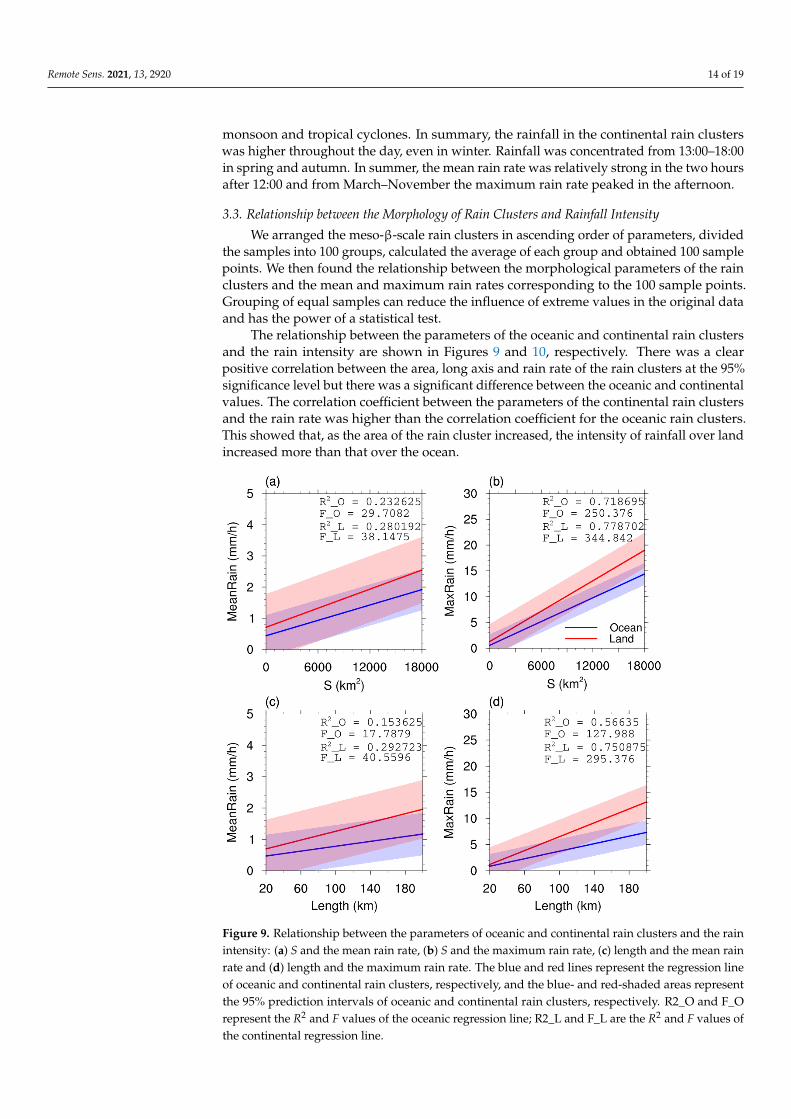
The relationship between the parameters of the oceanic and continental rain clusters and the rain intensity are shown in Figures 9 and 10, respectively. There was a clear positive correlation between the area, long axis and rain rate of the rain clusters at the 95% significance level but there was a significant difference between the oceanic and continental values. The correlation coefficient between the parameters of the continental rain clusters and the rain rate was higher than the correlation coefficient for the oceanic rain clusters. This showed that, as the area of the rain cluster increased, the intensity of rainfall over land increased more than that over the ocean.
The two most significant relationships were between the area and the long axis of the continental rain clusters and the maximum rain rate (Figure 9b,d). The maximum rain rate could be characterized by describing the area and long axis of the rain cluster. There was no significant linear relationship between the rotation angle of the oceanic and continental rain clusters and the rain rate (Figure 10a,b) so the rotation angle was not sufficient to describe the rain rate. The positive correlation between the WL value of the oceanic rain clusters and the rain rate was stronger than that of the continental rain clusters (Figure 10c,d), especially the positive correlation between the WL value of the oceanic rain clusters and the maximum rain rate, indicating that the squarer the ocean rain cluster, the stronger
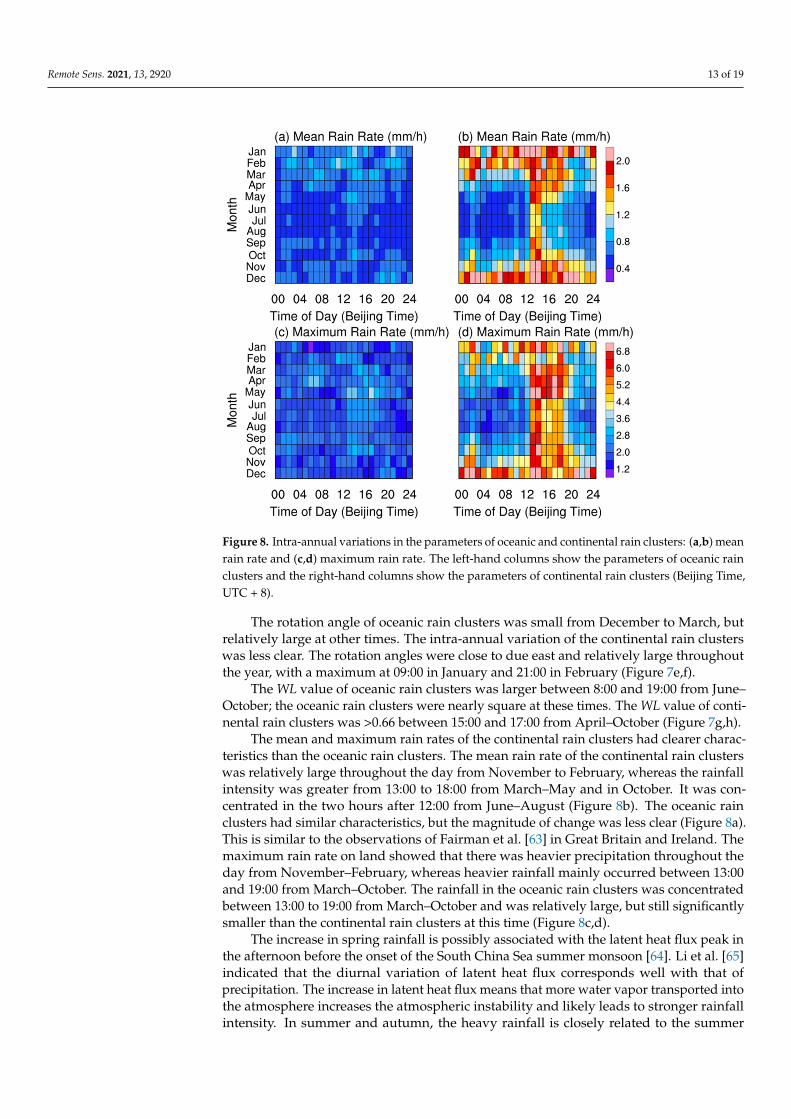
Figure 8. Intra-annual variations in the parameters of oceanic and continental rain clusters: (a,b) meanrain rate and (c,d) maximum rain rate. The left-hand columns show the parameters of oceanic rainclusters and the right-hand columns show the parameters of continental rain clusters (Beijing Time,UTC + 8).
The rotation angle of oceanic rain clusters was small from December to March, butrelatively large at other times. The intra-annual variation of the continental rain clusterswas less clear. The rotation angles were close to due east and relatively large throughoutthe year, with a maximum at 09:00 in January and 21:00 in February (Figure 7e,f).
The WL value of oceanic rain clusters was larger between 8:00 and 19:00 from June–October; the oceanic rain clusters were nearly square at these times. The WL value of conti-nental rain clusters was >0.66 between 15:00 and 17:00 from April–October (Figure 7g,h).
The mean and maximum rain rates of the continental rain clusters had clearer charac-teristics than the oceanic rain clusters. The mean rain rate of the continental rain clusterswas relatively large throughout the day from November to February, whereas the rainfallintensity was greater from 13:00 to 18:00 from March–May and in October. It was con-centrated in the two hours after 12:00 from June–August (Figure 8b). The oceanic rainclusters had similar characteristics, but the magnitude of change was less clear (Figure 8a).This is similar to the observations of Fairman et al. [63] in Great Britain and Ireland. Themaximum rain rate on land showed that there was heavier precipitation throughout theday from November–February, whereas heavier rainfall mainly occurred between 13:00and 19:00 from March–October. The rainfall in the oceanic rain clusters was concentratedbetween 13:00 to 19:00 from March–October and was relatively large, but still significantlysmaller than the continental rain clusters at this time (Figure 8c,d).
The increase in spring rainfall is possibly associated with the latent heat flux peak inthe afternoon before the onset of the South China Sea summer monsoon [64]. Li et al. [65]indicated that the diurnal variation of latent heat flux corresponds well with that ofprecipitation. The increase in latent heat flux means that more water vapor transported intothe atmosphere increases the atmospheric instability and likely leads to stronger rainfallintensity. In summer and autumn, the heavy rainfall is closely related to the summer
Remote Sens. 2021, 13, 2920 14 of 19
monsoon and tropical cyclones. In summary, the rainfall in the continental rain clusterswas higher throughout the day, even in winter. Rainfall was concentrated from 13:00–18:00in spring and autumn. In summer, the mean rain rate was relatively strong in the two hoursafter 12:00 and from March–November the maximum rain rate peaked in the afternoon.
3.3. Relationship between the Morphology of Rain Clusters and Rainfall Intensity
We arranged the meso-β-scale rain clusters in ascending order of parameters, dividedthe samples into 100 groups, calculated the average of each group and obtained 100 samplepoints. We then found the relationship between the morphological parameters of the rainclusters and the mean and maximum rain rates corresponding to the 100 sample points.Grouping of equal samples can reduce the influence of extreme values in the original dataand has the power of a statistical test.
The relationship between the parameters of the oceanic and continental rain clustersand the rain intensity are shown in Figures 9 and 10, respectively. There was a clearpositive correlation between the area, long axis and rain rate of the rain clusters at the 95%significance level but there was a significant difference between the oceanic and continentalvalues. The correlation coefficient between the parameters of the continental rain clustersand the rain rate was higher than the correlation coefficient for the oceanic rain clusters.This showed that, as the area of the rain cluster increased, the intensity of rainfall over landincreased more than that over the ocean.
Remote Sens. 2021, 13, x FOR PEER REVIEW 17 of 22
the rainfall intensity. The shape parameter can therefore describe the maximum rain rate of the rain cluster.
Figure 9. Relationship between the parameters of oceanic and continental rain clusters and the rain intensity: (a) S and the mean rain rate, (b) S and the maximum rain rate, (c) length and the mean rain rate and (d) length and the maximum rain rate. The blue and red lines represent the regression line of oceanic and continental rain clusters, respectively, and the blue- and red-shaded areas represent the 95% prediction intervals of oceanic and continental rain clusters, respectively. R2_O and F_O represent the R2 and F values of the oceanic regression line; R2_L and F_L are the R2 and F values of the continental regression line.
Figure 9. Relationship between the parameters of oceanic and continental rain clusters and the rainintensity: (a) S and the mean rain rate, (b) S and the maximum rain rate, (c) length and the mean rainrate and (d) length and the maximum rain rate. The blue and red lines represent the regression lineof oceanic and continental rain clusters, respectively, and the blue- and red-shaded areas representthe 95% prediction intervals of oceanic and continental rain clusters, respectively. R2_O and F_Orepresent the R2 and F values of the oceanic regression line; R2_L and F_L are the R2 and F values ofthe continental regression line.
Remote Sens. 2021, 13, 2920 15 of 19Remote Sens. 2021, 13, x FOR PEER REVIEW 18 of 22
Figure 10. Relationship between the parameters of oceanic and continental rain clusters and the rain intensity: (a) rotation angle and the mean rain rate, (b) rotation angle and the maximum rain rate, (c) WL and the mean rain rate and (d) WL and the maximum rain rate. The blue and red lines represent the regression line of oceanic and continental rain clusters, respectively, and the blue- and red-shaded areas represent the 95% prediction intervals of oceanic and continental rain clusters, respectively. R2_O and F_O represent the R2 and F values of the oceanic regression line; R2_L and F_L are the R2 and F values of the continental regression line.
4. Conclusions We first binarized the satellite image, and then used the connected area recognition
technology of OpenCV to identify all the meso-β-scale rain clusters that appeared over Hainan Island and the surrounding areas between 1 June 2000 and 31 December 2018 from GPM IMERG satellite precipitation data. We defined the parameters of the rain clusters based on the minimum-bounding rectangle-fitting method and topographic data and then carried out a statistical analysis on the parameters to explore the characteristics of the rain clusters and the relationship between the parameters and the rain rate. Our main conclusions are as follows: 1. From the probability density distribution of rain clusters, the area of most mesoscale
rain clusters was <10,000 km2 and the area and long axis of the continental rain clusters were larger than those of the oceanic rain clusters. The oceanic and continental rain clusters had three characteristic directions: 40-50°, 90-100° and 130-140°. More rainstorms occurred over land and there was more light rain over the ocean. In terms of the contribution to precipitation, large rain clusters or rain clusters in an east–west direction contributed the most to precipitation for both oceanic and continental rain clusters; long-strip rain clusters or rain clusters with a strong rainfall intensity contributed less to precipitation. In terms of the spatial distribution of their parameters, rain clusters with a large area or a long axis were concentrated on the
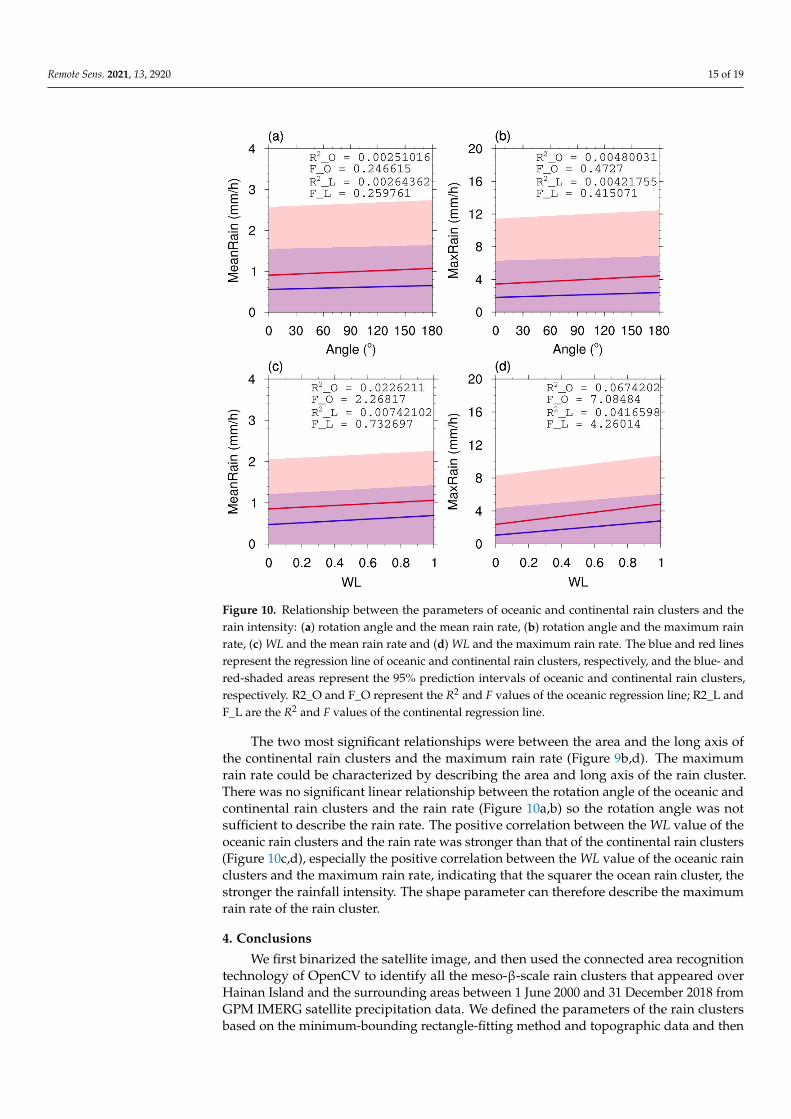
Figure 10. Relationship between the parameters of oceanic and continental rain clusters and therain intensity: (a) rotation angle and the mean rain rate, (b) rotation angle and the maximum rainrate, (c) WL and the mean rain rate and (d) WL and the maximum rain rate. The blue and red linesrepresent the regression line of oceanic and continental rain clusters, respectively, and the blue- andred-shaded areas represent the 95% prediction intervals of oceanic and continental rain clusters,respectively. R2_O and F_O represent the R2 and F values of the oceanic regression line; R2_L andF_L are the R2 and F values of the continental regression line.
The two most significant relationships were between the area and the long axis ofthe continental rain clusters and the maximum rain rate (Figure 9b,d). The maximumrain rate could be characterized by describing the area and long axis of the rain cluster.There was no significant linear relationship between the rotation angle of the oceanic andcontinental rain clusters and the rain rate (Figure 10a,b) so the rotation angle was notsufficient to describe the rain rate. The positive correlation between the WL value of theoceanic rain clusters and the rain rate was stronger than that of the continental rain clusters(Figure 10c,d), especially the positive correlation between the WL value of the oceanic rainclusters and the maximum rain rate, indicating that the squarer the ocean rain cluster, thestronger the rainfall intensity. The shape parameter can therefore describe the maximumrain rate of the rain cluster.
4. Conclusions
We first binarized the satellite image, and then used the connected area recognitiontechnology of OpenCV to identify all the meso-β-scale rain clusters that appeared overHainan Island and the surrounding areas between 1 June 2000 and 31 December 2018 fromGPM IMERG satellite precipitation data. We defined the parameters of the rain clustersbased on the minimum-bounding rectangle-fitting method and topographic data and then
Remote Sens. 2021, 13, 2920 16 of 19
carried out a statistical analysis on the parameters to explore the characteristics of therain clusters and the relationship between the parameters and the rain rate. Our mainconclusions are as follows:
1. From the probability density distribution of rain clusters, the area of most mesoscalerain clusters was <10,000 km2 and the area and long axis of the continental rainclusters were larger than those of the oceanic rain clusters. The oceanic and conti-nental rain clusters had three characteristic directions: 40–50◦, 90–100◦ and 130–140◦.More rainstorms occurred over land and there was more light rain over the ocean.In terms of the contribution to precipitation, large rain clusters or rain clusters inan east–west direction contributed the most to precipitation for both oceanic andcontinental rain clusters; long-strip rain clusters or rain clusters with a strong rainfallintensity contributed less to precipitation. In terms of the spatial distribution of theirparameters, rain clusters with a large area or a long axis were concentrated on thenorthern side of the mountains of Hainan Island and the rain rate was larger on thenorthern and eastern sides of the mountains. The rotation angle was greater on thenortheastern side of Hainan Island and in the southwestern coastal areas. The rainclusters over land were square and the rain clusters over coastal areas were elongated.In general, the occurrence probability of elongated rain clusters was higher than thatof square rain clusters;
2. The variation over time of the parameters of rain clusters was significant and thechanges were more dramatic in continental rain clusters. The area and long axis ofrain clusters were relatively large between 14:00 and 21:00 from April–Septemberand were smaller in winter. The area of oceanic rain clusters was relatively smallthroughout the year, but the long axis increased in winter. The maximum shapevalue of 0.66 appeared at 16:00 for continental rain clusters, whereas the maximumvalue of 0.61 for oceanic rain clusters appeared at 12:00. Continental rain clusterswere nearly square for a longer time than oceanic rain clusters. The diurnal andintra-annual variations of the rotation angle of oceanic rain clusters were greater thanthose of continental rain clusters. The rotation angle of oceanic rain clusters wassmaller from December–March. In addition, the rainfall in continental rain clusterswas relatively even in winter and precipitation occurred in the early morning. Inspring and autumn, precipitation mainly occurred in the afternoon and, in summer,precipitation was concentrated in the two hours after 12:00. The oceanic rain clustershad similar characteristics. Both the oceanic and continental rain clusters had largemaximum rain rates in the afternoon from March–October;
3. There was a clear positive correlation between the area, long axis and rain rate ofboth oceanic and continental rain clusters. The correlations between the area, longaxis and rain rate of continental rain clusters were higher than those for the oceanicrain clusters; as the area or the long axis increased, the rainfall intensity over landwas higher than that over the ocean. The correlation between the morphologicalparameters of the rain clusters and the maximum rain rate was higher than thecorrelation with the mean rain rate. The maximum rain rate of the rain clusters cantherefore be characterized by describing the area, long axis and shape of a rain cluster.
The key finding of this study was to quantitatively obtain the morphology, rainfallintensity and their relationship from the perspective of the rain cluster. The use of morpho-logical parameters such as the area, scale and shape of the rain cluster has the potentialto predict precipitation over Hainan Island and the surrounding areas. This will help toimprove the accuracy of the geostationary satellite infrared algorithm used to estimateprecipitation. We also found that there are diurnal and monthly changes in the morphologyand rainfall intensity of rain clusters and there may be some transfer process between them.Future research will consider time as a variable and the adaptive Kalman filter method willbe used to obtain more accurate estimates of precipitation.
Remote Sens. 2021, 13, 2920 17 of 19
Author Contributions: Conceptualization, T.H. and Y.C.; methodology, T.H. and Y.C.; software, T.H.;validation, T.H. and Y.C.; formal analysis, T.H.; investigation, T.H.; resources, T.H. and Y.C.; datacuration, T.H.; writing—original draft preparation, T.H.; writing—review and editing, T.H. andY.C.; visualization, T.H.; supervision, Y.C. and W.L.; project administration, Y.C. and C.D.; fundingacquisition, Y.C. All authors have read and agreed to the published version of the manuscript.
Funding: This work was supported by the Guangdong Major Project of Basic and Applied BasicResearch (Grant No. 2020B0301030004), Key Laboratory of South China Sea Meteorological DisasterPrevention and Mitigation of Hainan Province (Grant No. SCSF201902), National Natural ScienceFoundation of China (Grant Nos. 42005062 and 42075004), the Fundamental Research Funds forthe Central Universities Sun Yat-sen University (Grant No. 2021qntd29) and the Innovation GroupProject of Southern Marine Science and Engineering Guangdong Laboratory (Zhuhai) (Grant No.311021009).
Institutional Review Board Statement: Not applicable.
Informed Consent Statement: Not applicable.
Data Availability Statement: The GPM IMERG series products were downloaded from NASA’sofficial website (https://gpm.nasa.gov/data/directory (accessed on 24 June 2021)). The NationalGeophysical Data Center DEM data can be obtained from the United States Geological Survey website(www.ngdc.noaa.gov/ (accessed on 24 June 2021)).
Acknowledgments: We thankfully acknowledge the Goddard Earth Sciences Data and InformationServices Center for providing access to the GPM IMERG product. We also appreciate the constructivesuggestions and comments from the editor and reviewers.
Conflicts of Interest: The authors declare no conflict of interest.
References1. Zhu, L.; Meng, Z.Y.; Zhang, F.Q.; Markowski, P.M. The influence of sea- and land-breeze circulations on the diurnal variability in
precipitation over a tropical island. Atmos. Chem. Phys. 2017, 17, 13213–13232. [CrossRef]2. Ding, Y.H.; Chan, J.C.L. The East Asian summer monsoon: An overview. Meteorol. Atmos. Phys. 2005, 89, 117–142.3. Luo, Y.L.; Wang, H.; Zhang, R.H.; Qian, W.M.; Luo, Z.Z. Comparison of rainfall characteristics and convective properties of
monsoon precipitation systems over South China and the Yangtze and Huai river basin. J. Clim. 2013, 26, 110–132. [CrossRef]4. Wang, S.S.; Guan, Y.P.; Guan, T.Z.; Huang, J.P. Oscillation in frequency of tropical cyclones passing Taiwan and Hainan Islands
and the relationship with summer monsoon. Chin. J. Oceanol. Limn. 2012, 30, 966–973. [CrossRef]5. Chang, C.P.; Lei, Y.H.; Sui, C.H.; Lin, X.H.; Ren, F.M. Tropical cyclone and extreme rainfall trends in East Asian summer monsoon
since mid-20th century. Geophys. Res. Lett. 2012, 39. [CrossRef]6. Li, C.Y.; Long, Z.X.; Zhang, Q.Y. Strong/weak summer monsoon activity over the South China Sea and atmospheric intraseasonal
oscillation. Adv. Atmos. Sci. 2001, 18, 1146–1160.7. Liu, Y.J.; Ding, Y.H.; Zhang, Y.X.; Song, Y.F. Role of a warm and wet transport conveyor of Asian summer monsoon in a Beijing
heavy rainstorm on July 21, 2012. J. Trop. Meteorol. 2017, 23, 302–313.8. Ding, Y.H.; Li, C.Y.; He, J.H.; Chen, L.X.; Gan, Z.J. South China Sea Monsoon Experiment(SCSMEX) and the east-Asian monsoon.
Acta Meteorol. Sin. 2004, 62, 561–586. (In Chinese)9. Zhang, R.H.; Ni, Y.Q.; Liu, L.P.; Luo, Y.L.; Wang, Y.H. South China Heavy Rainfall Experiments (SCHeREX). J. Meteorol. Soc. Jpn.
2011, 89A, 153–166. [CrossRef]10. Luo, Y.L.; Zhang, R.H.; Wan, Q.L.; Wang, B.; Wong, W.K.; Hu, Z.Q.; Jou, B.J.D.; Lin, Y.L.; Johnson, R.H.; Chang, C.P.; et al. The
Southern China Monsoon Rainfall Experiment (SCMREX). Bull. Am. Meteorol. Soc. 2017, 98, 999–1013. [CrossRef]11. Zhang, X.F.; Li, L.X.; Yang, R.K.; Guo, R.; Sun, X.; Luo, J.P.; Chen, H.B.; Liu, D.X.; Tang, K.B.; Peng, W.W.; et al. Comprehensive
marine observing experiment based on high-altitude large unmanned aerial vehicle (South China Sea Experiment 2020 of the“Petrel Project”). Adv. Atmos. Sci. 2021, 38, 531–537. [CrossRef]
12. Zheng, H.P.; Zhang, Y.; Zhang, L.F.; Lei, H.C.; Wu, Z.H. Precipitation microphysical processes in the inner rainband of tropicalcyclone Kajiki (2019) over the South China Sea revealed by polarimetric radar. Adv. Atmos. Sci. 2021, 38, 65–80. [CrossRef]
13. Liu, S.J.; Cai, D.X.; Han, J.; Gan, Y.X. Progress of the satellite remote sensing retrieval of precipitation. Adv. Meteorol. Sci. Technol.2021, 11, 28–33. (In Chinese)
14. Liu, C.T.; Zipser, E.J.; Cecil, D.J.; Nesbitt, S.W.; Sherwood, S. A cloud and precipitation feature database from nine years of TRMMobservations. J. Appl. Meteorol. Clim. 2008, 47, 2712–2728. [CrossRef]
15. Fu, Y.F.; Chen, Y.L.; Zhang, X.D.; Wang, Y.; Li, R.; Liu, Q.; Zhong, L.; Zhang, Q.; Zhang, A.Q. Fundamental characteristics oftropical rain cell structures as measured by TRMM PR. J. Meteorol. Res. Prc. 2020, 34, 1129–1150. [CrossRef]
16. Hamada, A.; Takayabu, Y.N.; Liu, C.T.; Zipser, E.J. Weak linkage between the heaviest rainfall and tallest storms. Nat. Commun.2015, 6, 6213. [CrossRef]
Remote Sens. 2021, 13, 2920 18 of 19
17. Chen, Y.L.; Zhang, A.Q.; Fu, Y.F.; Chen, S.M.; Li, W.B. Morphological characteristics of precipitation areas over the Tibetan Plateaumeasured by TRMM PR. Adv. Atmos. Sci. 2021, 38, 677–689. [CrossRef]
18. Gagin, A.; Rosenfeld, D.; Woodley, W.L.; Lopez, R.E. Results of seeding for dynamic effects on rain-cell properties in FACE-2. J.Clim. Appl. Meteorol. 1986, 25, 3–13. [CrossRef]
19. Tsonis, A.A.; Triantafyllou, G.N.; Georgakakos, K.P. Hydrological applications of satellite data. 1. Rainfall estimation. J. Geophys.Res. 1996, 101, 26517–26525. [CrossRef]
20. Song, J.J.; Innerst, M.; Shin, K.; Ye, B.Y.; Kim, M.; Yeom, D.; Lee, G.W. Estimation of precipitation area using S-band dual-polarization radar measurements. Remote Sens. 2021, 13, 2039. [CrossRef]
21. Capsoni, C.; Fedi, F.; Magistroni, C.; Paraboni, A.; Pawlina, A. Data and theory for a new model of the horizontal structure of raincells for propagation applications. Radio Sci. 1987, 22, 395–404. [CrossRef]
22. Awaka, J. A three-dimensional rain cell model for the study of interference due to hydrometeor scattering. J. Commun. Res. Lab.1989, 36, 13–44.
23. Nesbitt, S.W.; Cifelli, R.; Rutledge, S.A. Storm morphology and rainfall characteristics of TRMM precipitation features. Mon.Weather Rev. 2006, 134, 2702–2721. [CrossRef]
24. Liu, C.T.; Zipser, E. Regional variation of morphology of organized convection in the tropics and subtropics. J. Geophys. Res.Atmos. 2013, 118, 453–466. [CrossRef]
25. Neale, R.; Slingo, J. The maritime continent and its role in the global climate: A GCM study. J. Clim. 2003, 16, 834–848. [CrossRef]26. Sobel, A.H.; Maloney, E.D.; Bellon, G.; Frierson, D.M. Surface fluxes and tropical intraseasonal variability: A reassessment. J. Adv.
Model. Earth Sy. 2010, 2. [CrossRef]27. Sobel, A.H.; Burleyson, C.D.; Yuter, S.E. Rain on small tropical islands. J. Geophys. Res. Atmos. 2011, 116. [CrossRef]28. Zhu, L.; Chen, X.C.; Bai, L.Q. Relative roles of low-level wind speed and moisture in the diurnal cycle of rainfall over a tropical
island under monsoonal flows. Geophys. Res. Lett. 2020, 47. [CrossRef]29. Wang, Y.; Miao, J.F.; Su, T. A numerical study of impact of topography on intensity and pattern of sea breeze precipitation over
the Hainan Island. Plateau Meteorol. 2018, 37, 207–222. (In Chinese)30. Hou, A.Y.; Kakar, R.K.; Neeck, S.; Azarbarzin, A.A.; Kummerow, C.D.; Kojima, M.; Oki, R.; Nakamura, K.; Iguchi, T. The global
precipitation measurement mission. Bull. Am. Meteorol. Soc. 2014, 95, 701–722. [CrossRef]31. Chen, X.H.; Zhong, R.D.; Wang, Z.L.; Lai, C.G.; Chen, J.C. Evaluation on the accuracy and hydrological performance of the
latest-generation GPM IMERG product over South China. J. Hydraul. Eng. 2017, 48, 1147–1156. (In Chinese)32. Tang, G.Q.; Ma, Y.Z.; Long, D.; Zhong, L.Z.; Hong, Y. Evaluation of GPM Day-1 IMERG and TMPA Version-7 legacy products
over Mainland China at multiple spatiotemporal scales. J. Hydrol. 2016, 533, 152–167. [CrossRef]33. Feng, Z.; Leung, L.R.; Liu, N.N.; Wang, J.Y.; Houze Jr, R.A.; Li, J.F.; Hardin, J.C.; Chen, D.D.; Guo, J.P. A global high-resolution
mesoscale convective system database using satellite-derived cloud tops, surface precipitation, and tracking. J. Geophys. Res.Atmos. 2021, 126. [CrossRef]
34. Mahmoud, M.T.; Mohammed, S.A.; Hamouda, M.A.; Maso, M.D.; Mohamed, M.M. Performance of the IMERG precipitationproducts over high-latitudes region of Finland. Remote Sens. 2021, 13, 2073. [CrossRef]
35. Huffman, G.J.; Stocker, E.F.; Bolvin, D.T.; Nelkin, E.J.; Tan, J. GPM IMERG Final Precipitation L3 Half Hourly 0.1 Degree ×0.1 Degree V06, Greenbelt, MD, Goddard Earth Sciences Data and Information Services Center (GES DISC). 2019. Availableonline: https://disc.gsfc.nasa.gov/datasets/GPM_3IMERGHH_06/summary (accessed on 25 July 2021). [CrossRef]
36. Huffman, G.J.; Bolvin, D.T.; Nelkin, E.J.; Tan, J. Integrated Multi-Satellite Retrievals for GPM (IMERG) Technical Documentation(Technical Documentation). NASA/GSFC Code 2015, 612, 2019.
37. Wang, J.; Miao, J.F.; Feng, W. An observational analysis of sea breeze characteristics over the Hainan Island. J. Meteorol. Sci. 2016,36, 244–255. (In Chinese)
38. Sun, R.; Wu, Z.X.; Chen, B.Q.; Qi, D.L.; Yang, C. Spatio-temporal patterns of climatic changes in Hainan Island in recent 55 years.J. Meteorol. Res. Appl. 2016, 37, 1–7. (In Chinese)
39. Yang, Q.Y.; Miao, J.F.; Wang, Y.H. A numerical study of impact of topography on sea breeze circulation over the Hainan Island.Haiyang Xuebao 2017, 39, 24–43. (In Chinese)
40. Zhang, C.H.; Dong, L.J.; Wu, Y.; Feng, W.; Guo, D.Y.; Wu, H.; Fu, X.H.; Chen, X.M. The influence of the mountainous terrain in themiddle of Hainan Island on the weather and climate. Adv. Meteorol. Sci. Technol. 2020, 10, 70–73. (In Chinese)
41. Jia, X.J.; Yu, Q.C. The image processing based on open source computer vision library. Comput. Appl. Softw. 2008, 25, 276–278.(In Chinese)
42. Liu, H.Y.; Wang, X.B. A vehicle contours detection method based on OpenCV. Sci. Technol. Eng. 2010, 10, 2987–2991. (In Chinese)43. Dominguez, C.; Heras, J.; Pascual, V. IJ-OpenCV: Combining ImageJ and OpenCV for processing images in biomedicine. Comput.
Biol. Med. 2017, 84, 189–194. [CrossRef]44. Toussaint, G.T. Solving geometric problems with the rotating calipers. In Proceedings of the MELECON’83. Mediterranean
Electrotechnical Conference, Athens, Greece, 24–26 May 1983. A10.2/1-4 vol.1.45. Liu, Y.Z.; Liu, R.T. An algorithm for minimal circumscribed rectangle of a simple polygon. J. Harbin Univ. Sci. Technol. 2008, 13,
5–7. (In Chinese)46. Cetrone, J.; Houze, R.A. Characteristics of tropical convection over the ocean near Kwajalein. Mon. Weather Rev. 2006, 134,
834–853. [CrossRef]
Remote Sens. 2021, 13, 2920 19 of 19
47. Liu, C.T.; Zipser, E.J. “Warm rain” in the tropics: Seasonal and regional distributions based on 9 yr of TRMM data. J. Clim. 2009,22, 767–779. [CrossRef]
48. Chen, Y.L.; Fu, Y.F. Tropical echo-top height for precipitating clouds observed by multiple active instruments aboard satellites.Atmos. Res. 2018, 199, 54–61. [CrossRef]
49. Fovell, R.G. Convective initiation ahead of the sea-breeze front. Mon. Weather Rev. 2005, 133, 264–278. [CrossRef]50. Zhao, Y. Diurnal variation of rainfall associated with tropical depression in South China and its relationship to land-sea contrast
and topography. Atmos 2014, 5, 16–44. [CrossRef]51. Liang, Z.; Wang, D. Numerical study of the evolution of a sea-breeze front under two environmental flows. J. Meteorol. Res. 2015,
29, 446–466. [CrossRef]52. Simpson, M.; Warrior, H.; Raman, S.; Aswathanarayana, P.A.; Mohanty, U.C.; Suresh, R. Sea-breeze-initiated rainfall over the east
coast of India during the Indian southwest monsoon. Nat. Hazards 2007, 42, 401–413. [CrossRef]53. Hill, C.M.; Fitzpatrick, P.J.; Corbin, J.H.; Lau, Y.H.; Bhate, S.K. Summertime precipitation regimes associated with the sea breeze
and land breeze in Southern Mississippi and Eastern Louisiana. Weather Forecast 2010, 25, 1755–1779. [CrossRef]54. Nitis, T.; Kitsiou, D.; Klaic, Z.B.; Prtenjak, M.T.; Moussiopoulos, N. The effects of basic flow and topography on the development
of the sea breeze over a complex coastal environment. Q. J. Roy. Meteor. Soc. 2005, 131, 305–327. [CrossRef]55. Wang, L.Z.; Miao, J.F.; Guan, Y.P. Numerical simulation of impact of topography of Hainan Island on structure of local sea breeze
circulation under cloudy weather. Trans. Atmos. Sci. 2020, 43, 322–335. (In Chinese)56. Wang, J.H.; Yang, Y.Y.; Miao, C.S.; Gao, Y.M.; Zhang, X. The numerical study of terrain dynamic influence on warm area heavy
rainfall of convergence lines in South China coast. Chin. J. Atmos. Sci. 2017, 41, 784–796. (In Chinese)57. Liu, Y.N.; Wang, D.H.; Li, G.P.; Ding, W.Y. A comparative study of the diurnal variations of annually first rainy season rainfall in
South China before and after the onset of the South China Sea summer monsoon. J. Trop. Meteorol. 2019, 35, 365–378. (In Chinese)58. Chen, G.X. Diurnal cycle of the Asian summer monsoon: Air pump of the second kind. J. Clim. 2020, 33, 1747–1775. [CrossRef]59. Du, Y.; Chen, G.X.; Han, B.; Mai, C.Y.; Bai, L.Q.; Li, M.H. Convection initiation and growth at the coast of South China. Part I:
Effect of the marine boundary layer jet. Mon. Weather Rev. 2020, 148, 3847–3869. [CrossRef]60. Du, Y.; Chen, G.X.; Han, B.; Bai, L.Q.; Li, M.H. Convection initiation and growth at the coast of South China. Part II: Effects of the
terrain, coastline, and cold pools. Mon. Weather Rev. 2020, 148, 3871–3892. [CrossRef]61. Dai, A. Global precipitation and thunderstorm frequencies. Part I: Seasonal and interannual variations. J. Clim. 2001, 14,
1092–1111. [CrossRef]62. Dai, A.; Deser, C. Diurnal and semidiurnal variations in global surface wind and divergence fields. J. Geophys. Res. 1999, 104,
31109–31125. [CrossRef]63. Fairman, J.G.; Schultz, D.M.; Kirshbaum, D.J.; Gray, S.L.; Barrett, A.I. Climatology of size, shape, and intensity of precipitation
features over Great Britain and Ireland. J. Hydrometeorol. 2017, 18, 1595–1615. [CrossRef]64. Yan, J.Y.; Liu, J.M.; Jiang, G.R.; Wang, H.; Liu, Y.J.; Yao, H.D. Advances in the study of air-sea flux exchange over the South China
Sea. Adv. Earth Sci. 2007, 22, 685–697. (In Chinese)65. Li, W.B.; Luo, C.; Wang, D.X.; Lei, T. Diurnal variations of precipitation over the South China Sea. Meteorol. Atmos. Phys. 2010,
109, 33–46. [CrossRef]