Embed Size (px)
Citation preview

20 Neoplastic Lesions of Vertebrae on Magnetic
Resonance Imaging

CLINICAL IMAGAGINGAN ATLAS OF DIFFERENTIAL DAIGNOSIS
EISENBERG
DR. Muhammad Bin Zulfiqar PGR-FCPS III SIMS/SHL

• Fig SP 20-1 Hemangioma. Sagittal proton-density image shows a high-signal lesion (H) within a lower thoracic vertebral body. The lesion is well defined, and a discrete cortical margin is evident posteriorly (arrow).15

• Fig SP 20-2 Osteoblastoma. (A) Axial CT scan shows an expanded spinous process of T2 with internal amorphous calcifications (arrow). The anterior extent of the tumor and its relationship with the cord cannot be established. (B) Axial T1-weighted and (C) midline sagittal T2-weighted images show the cord (straight arrows) and its relationship with the tumor (curved arrows in B). Note the partial obliteration of the posterior subarachnoid space (curved arrow in C) on the sagittal image.16

• Fig SP 20-3 Aneurysmal bone cyst. (A) Axial CT scan shows osseous extension of the tumor but cannot evaluate possible spinal canal invasion. (B) Axial T2-weighted image shows the relationship between the tumor and the thecal sac (straight arrows). Note the bubbly appearance of the tumor, with small cysts of different signal intensity. (C) Left parasagittal proton-density image shows the superior extension of the tumor into the spinal canal (straight arrows). Note the band of decreased signal intensity (curved arrow in B) between the tumor and vertebral body, representing the rim of sclerosis.16

• Fig SP 20-4 Giant cell tumor. (A) Axial T1-weighted image shows tumor (arrowheads) replacing normal marrow fat in the left sacral ala and body of S1. Tumor surrounds the neural canal containing the first left ventral sacral nerve root (arrow). (B) On the T2-weighted image, the tumor (arrows) is inhomogeneous and of intermediate signal intensity. Note the tumor extension (arrowhead) across the left sacroiliac joint.17

• Fig SP 20-5 Sacral teratoma. (A) CT scan shows a presacral mass without evidence of sacral erosion. Note the posterior calcification (arrowhead) and fat-fluid level (arrow) in the lesion. (B) Axial T1-weighted MR scan shows the presacral mass (arrowheads). The high-intensity fat (solid arrow) is layering on the lower intensity fluid in the lesion. The low-intensity area posteriorly (open arrow) represents calcification. (C) On the T2-weighted image, the signal intensities have reversed at the fat-fluid interface (solid arrow). The posterior calcification (open arrow) remains of low intensity. (C, ovarian cyst; U, uterus.)17

• Fig SP 20-6 Langerhans cell histiocytosis. (A) T1-weighted and (B) proton-density sagittal images demonstrate compression deformity (vertebra plana) of the T11 vertebral body (short arrows). Soft tissue (long arrow) also projects posteriorly into the ventral epidural space. The intervertebral disks are not involved.15
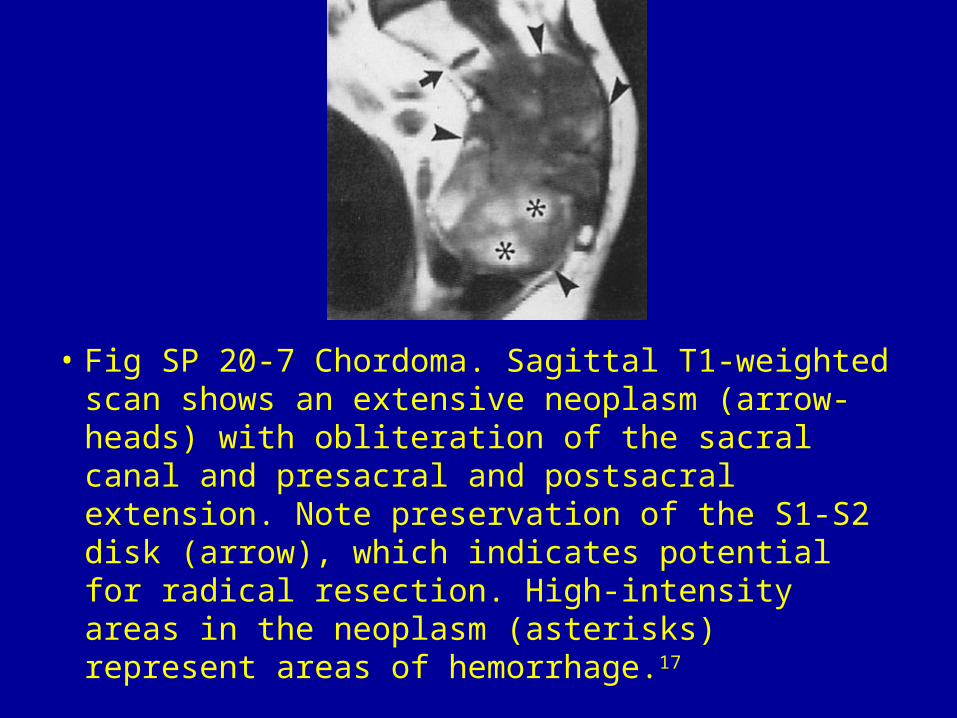
• Fig SP 20-7 Chordoma. Sagittal T1-weighted scan shows an extensive neoplasm (arrow-heads) with obliteration of the sacral canal and presacral and postsacral extension. Note preservation of the S1-S2 disk (arrow), which indicates potential for radical resection. High-intensity areas in the neoplasm (asterisks) represent areas of hemorrhage.17

• Fig SP 20-8 Lymphoma. (A) Parasagittal T1-weighted image shows tumor replacement of much of the normal marrow of the T11 vertebral body. The tumor has broken through the cortex posteriorly (arrowhead) and displaces the high-signal epidural fat. Note that the posterosuperior portion of T12 has decreased signal intensity consistent with tumor involvement (small arrow). (B) Axial T1-weighted scan through the T11-T12 foramen shows tumor infiltration (arrows) into the left epidural space, compressing the left side of the thecal sac and filling the left neural foramen.15

• Fig SP 20-9 Metastases. A noncontrast midsagittal T1-weighted image shows areas of low signal intensity (arrows) in multiple vertebrae representing metastases from breast cancer.11