Embed Size (px)
Citation preview
TCD7, 2891–2941, 2013
2001–2010 glacierchanges in the
Central KarakoramNational Park
U. Minora et al.
Title Page
Abstract Introduction
Conclusions References
Tables Figures
J I
J I
Back Close
Full Screen / Esc
Printer-friendly Version
Interactive Discussion
Discussion
Paper
|D
iscussionP
aper|
Discussion
Paper
|D
iscussionP
aper|
The Cryosphere Discuss., 7, 2891–2941, 2013www.the-cryosphere-discuss.net/7/2891/2013/doi:10.5194/tcd-7-2891-2013© Author(s) 2013. CC Attribution 3.0 License.
EGU Journal Logos (RGB)
Advances in Geosciences
Open A
ccess
Natural Hazards and Earth System
Sciences
Open A
ccess
Annales Geophysicae
Open A
ccess
Nonlinear Processes in Geophysics
Open A
ccess
Atmospheric Chemistry
and Physics
Open A
ccess
Atmospheric Chemistry
and Physics
Open A
ccess
Discussions
Atmospheric Measurement
Techniques
Open A
ccess
Atmospheric Measurement
Techniques
Open A
ccess
Discussions
Biogeosciences
Open A
ccess
Open A
ccess
BiogeosciencesDiscussions
Climate of the Past
Open A
ccess
Open A
ccess
Climate of the Past
Discussions
Earth System Dynamics
Open A
ccess
Open A
ccess
Earth System Dynamics
Discussions
GeoscientificInstrumentation
Methods andData Systems
Open A
ccess
GeoscientificInstrumentation
Methods andData Systems
Open A
ccess
Discussions
GeoscientificModel Development
Open A
ccess
Open A
ccess
GeoscientificModel Development
Discussions
Hydrology and Earth System
Sciences
Open A
ccess
Hydrology and Earth System
Sciences
Open A
ccess
Discussions
Ocean Science
Open A
ccess
Open A
ccess
Ocean ScienceDiscussions
Solid Earth
Open A
ccess
Open A
ccess
Solid EarthDiscussions
The Cryosphere
Open A
ccess
Open A
ccess
The CryosphereDiscussions
Natural Hazards and Earth System
Sciences
Open A
ccess
Discussions
This discussion paper is/has been under review for the journal The Cryosphere (TC).Please refer to the corresponding final paper in TC if available.
2001–2010 glacier changes in the CentralKarakoram National Park: a contributionto evaluate the magnitude and rate of the“Karakoram anomaly”U. Minora1,3, D. Bocchiola1,2, C. D’Agata1,3, D. Maragno1,3, C. Mayer1,4,A. Lambrecht1,4, B. Mosconi3, E. Vuillermoz1, A. Senese3, C. Compostella3,C. Smiraglia1,3, and G. Diolaiuti1,3
1Evk2cnr Committee, Bergamo, Italy2Politecnico di Milano, Milan, Italy3Universita degli Studi di Milano, Milan, Italy4Bavarian Academy of Sciences and Humanities, Munich, Germany
Received: 7 May 2013 – Accepted: 21 May 2013 – Published: 18 June 2013
Correspondence to: G. Diolaiuti ([email protected])
Published by Copernicus Publications on behalf of the European Geosciences Union.
2891
TCD7, 2891–2941, 2013
2001–2010 glacierchanges in the
Central KarakoramNational Park
U. Minora et al.
Title Page
Abstract Introduction
Conclusions References
Tables Figures
J I
J I
Back Close
Full Screen / Esc
Printer-friendly Version
Interactive Discussion
Discussion
Paper
|D
iscussionP
aper|
Discussion
Paper
|D
iscussionP
aper|
Abstract
Karakoram is one of the most glacierized region worldwide, and glaciers therein are themain water resource of Pakistan. The attention paid to this area is increasing, becausethe evolution of its glaciers recently depicted a situation of general stability, knownas “Karakoram Anomaly”, in contrast to glacier retreat worldwide. Here we focused5
our attention upon the glacier evolution within the Central Karakoram National Park(CKNP, a newborn park of this region, ca. 12 162 km2 in area) to assess the magnitudeand rate of such anomaly. By means of Remote Sensing data (i.e.: Landsat images),we analyzed a sample of more than 700 glaciers, and we found out their area changebetween 2001 and 2010 is not significant (+27 km2 ±42 km2), thus confirming their10
stationarity. We analyzed climate data, snow coverage from MODIS, and supraglacialdebris presence, as well as potential (con-) causes. We found a slight decrease ofsummer temperatures (down to −1.5 ◦C during 1980–2009) and an increase of wetdays during winter (up +3.3 daysyr−1 during 1980–2009), possibly increasing snowcover duration, consistently with MODIS data. We further detected considerable supra-15
glacial debris coverage (ca. 20 % of the glacier area which rose up to 31 % consideringonly the ablation area), which could have reduced buried ice melting during the lastdecade. These results provide further ground to uphold the existence of the KarakoramAnomaly, and present an useful template for assessment of water availability within theglaciers of the CKNP.20
1 Introduction
The HKKH (Hindu Kush–Karakoram–Himalaya) stretches for more than 2000 kilome-tres in length from East to West. Along this mountain range there is a considerablevariability in climate conditions, including varying source regions and type of precipi-tation (e.g. Bocchiola and Diolaiuti, 2013), influencing the behaviour and evolution of25
cryosphere. The HKKH nests about 60 000 km2 of ice bodies, glaciers, glacierets and
2892
TCD7, 2891–2941, 2013
2001–2010 glacierchanges in the
Central KarakoramNational Park
U. Minora et al.
Title Page
Abstract Introduction
Conclusions References
Tables Figures
J I
J I
Back Close
Full Screen / Esc
Printer-friendly Version
Interactive Discussion
Discussion
Paper
|D
iscussionP
aper|
Discussion
Paper
|D
iscussionP
aper|
perennial surface ice in varying climatic regimes (Kaab et al., 2012), and it is consid-ered the third pole of our planet (Winiger et al., 2005; Smiraglia et al., 2007; Kehrwaldet al., 2008). This large mountain system delivers water for agriculture, human con-sumption and power production, and more than 50 % of the water in the Indus riveroriginating from the Karakoram comes from snow and glacier melt (Immerzeel et al.,5
2010). The economy of the Himalayan regions relies upon agriculture, and it is highlydependent upon water availability and irrigation (Aggarwal et al., 2004; Kahlown et al.,2007; Akhtar et al., 2008). The most recent observations of glacier fluctuations indicatethat in the eastern and central HKKH glaciers are subject to general retreat, and havelost a significant amount of mass and area (Salerno et al., 2008; Bolch et al., 2011).10
Rapid declines in glacier area is reported throughout the Greater Himalaya and mostof mainland Asia (Ageta, and Higuchi, 1984; Ageta, and Fujita, 1996), widely attributedto global warming (IPCC, 2001, 2007). On the other hand changes in climate andglaciers geometry are not uniform. Observations of individual glaciers indicate that theglacier retreat rates may vary strongly from among different glacial basins. In fact pos-15
itive ice mass balances and advancing glaciers have been reported in the Karakorammountains, since the last decade, in spite of worldwide glacier decline (Hewitt, 2005).Glaciers in the Eastern part of the HKKH receive accumulation from precipitation duringthe Indian monsoon in summer, whereas in the West snow fall occurs mainly in win-ter, through Westerly atmospheric circulations (Bookhagen and Burbank, 2010; Kaab20
et al., 2012; Fowler and Archer, 2006). This variability in accumulation conditions maybe one reason for the large spread in glacier changes within the region (Bolch et al.,2011; Kaab et al., 2012). Among others, Kaab et al. (2012) indicated a complex patternof glacial responses in reaction to heterogeneous climate signals. They used satellitelaser altimetry and a global elevation model to show widespread glacier wastage in the25
Eastern, central and South–Western parts of the HKKH during 2003–08. The maxi-mum regional thinning rate they found was −0.66±0.09 myr−1 in the Jammu–Kashmirregion. Conversely, in the Karakoram, glaciers seem to have thinned by a few centime-tres per year, with this behaviour not linked only to the widespread supra-glacial debris
2893
TCD7, 2891–2941, 2013
2001–2010 glacierchanges in the
Central KarakoramNational Park
U. Minora et al.
Title Page
Abstract Introduction
Conclusions References
Tables Figures
J I
J I
Back Close
Full Screen / Esc
Printer-friendly Version
Interactive Discussion
Discussion
Paper
|D
iscussionP
aper|
Discussion
Paper
|D
iscussionP
aper|
cover. Unexpectedly, regionally averaged thinning rates under debris-mantled ice weresimilar to those of clean ice. The glacier mass balance budget in the Karakoram posi-tively affected the 2003–2008 specific mass balance for the entire HKKH region, whichwas estimated by Kaab et al. (2012) into −0.21±0.05 myr−1 of water equivalent. This issignificantly smaller in magnitude than the estimated global average for glaciers and ice5
caps (Cogley 2009; WGMS, 2012). Some studies display not only balanced to slightlynegative mass budgets in the Karakoram range, but even an expansion and thickeningof the largest glaciers, mainly in the central Karakoram, since the 1990s, accompaniedby a non-negligible number of rapid glacier advances (i.e.: surge-type phenomena, seeamong the others Diolaiuti et al., 2003; Hewitt, 2005; Barrand and Murray, 2006; Belo10
et al., 2008; Mayer et al., 2011; Copland et al., 2011).This situation of stagnant and advancing glaciers in the highest parts of central
Karakoram was called “Karakoram anomaly” by Hewitt (2005), and more recently the“Pamir–Karakoram Anomaly” name was proposed by Gardelle et al. (2013). Hewitt(2005) reported that 33 glaciers thickened (by 5 to 20 m on the lowest parts of their15
tongues) and/or advanced, or at least were stagnant in this region between 1997 and2001. For instance, 4 tributaries of Panmah Glacier have surged in less than a decade,3 in quick succession. Liligo Glacier, a tributary of Baltoro Glacier, advanced by 1.4 kmfrom 1986 to 1997 (Diolaiuti et al., 2003). Batura and Baltoro had stagnant termini, al-though accompanied by down wasting and debris cover increase in the lowest reaches20
(Shroder et al., 2010; Mayer et al., 2006).In general glaciers in the Karakoram range seem to be less affected by the global
trend of negative glacier mass balance, with frequent observations of advancingglaciers. This behaviour might be a consequence of the generally high elevations ofglaciers’ bodies in this area, combined with a possible increase in orographic precipi-25
tation leading to enhanced accumulation. These observations were explained with therecent climate peculiarities, i.e. (i) a decreasing trend in maximum and minimum tem-peratures in some periods within the Karakoram range, and (ii) an increase in winterprecipitation (Archer and Fowler, 2004; Bocchiola and Diolaiuti, 2013). The negative
2894
TCD7, 2891–2941, 2013
2001–2010 glacierchanges in the
Central KarakoramNational Park
U. Minora et al.
Title Page
Abstract Introduction
Conclusions References
Tables Figures
J I
J I
Back Close
Full Screen / Esc
Printer-friendly Version
Interactive Discussion
Discussion
Paper
|D
iscussionP
aper|
Discussion
Paper
|D
iscussionP
aper|
temperature trend during summer is consistent with observed advance and thickeningof some Karakoram glaciers, and the reducing runoff shown by some gauging sta-tion data from heavily glacierized catchments (e.g. Hunza basin, Hewitt, 2005; Archer,2003). An in depth scientific understanding of the glacier evolution of the Karakoramwas hampered hitherto by the lack of systematic long-term field observations, due to5
the rugged topography and the complex climatology of the area. The annual glaciermass balances of a few small and mainly debris-free glaciers (Fujita and Nuimura,2011; Gardelle et al., 2012) are unlikely to be representative of the entire region withsome of the world’s largest glaciers. Therefore the combination of remote sensing stud-ies and data from field surveys is required for improving the understanding of glacier10
dynamics related to the specific climate conditions. In this contribution we present themain results we obtained analysing Landsat images covering the Central KarakoramNational Park (CKNP) area to describe glacier coverage during 2001–2010. We furtherprocessed meteorological data provided by the Pakistan Meteorological Department(PMD), including precipitation and air temperature during 1980–2009 from three sta-15
tions in the upper Karakoram nearby the CKNP. These data were also tested againstthe Northern Atlantic Oscillation (NAO) index and global temperature anomalies (HAD-CRUT data set, see Brohan et al., 2006) to assess potential teleconnections, claimedrecently to affect the climate in this area. We then evaluated snow-coverage in theCKNP area during 2000–2011 from MODIS data, and supraglacial debris-coverage20
variations during 2001–2010 from Landsat images. From the intercomparison of thedifferent data sources exploited here we try to draw an updated picture of the CKNPglaciation, and discuss its peculiar behavior and features against the recent literatureupon HKKH glacier changes.
2 Study site25
The CKNP is an extensive, newborn protected natural area within the Karakoram,Northern Pakistan (Fig. 1). The park area is ca. 12 162 km2, and roughly 40 % of it
2895
TCD7, 2891–2941, 2013
2001–2010 glacierchanges in the
Central KarakoramNational Park
U. Minora et al.
Title Page
Abstract Introduction
Conclusions References
Tables Figures
J I
J I
Back Close
Full Screen / Esc
Printer-friendly Version
Interactive Discussion
Discussion
Paper
|D
iscussionP
aper|
Discussion
Paper
|D
iscussionP
aper|
is covered by ice. The park’s mission is to preserve unimpaired natural and culturalresources of this peculiar area, supporting the study and interpretation of this heav-ily glacierized environment and its population of birds and mammals. There are someglaciers that intersect the park boundary, and therefore we modified CKNP boundary soas to include all glacier outlines, covering an area of 13 199 km2, which we considered5
when calculating glacierized versus not-glacierized area statistics in this paper.The Park is a new protected area, funded in the last decade. Several scientists from
Pakistan and Italy are cooperating to develop a Park Management Plan, implement-ing best practices of environmental surveys within the framework of the SEED (SocialEconomic Environment Development in the Central Karakorum National Park, Gilgit10
Baltistan Region) project, funded by the Pakistan and Italian governments, and man-aged by EvK2CNR Committee. The highest altitude in the park, and in the entire west-ern HKKH is reached by the summit of K2 mountain (8611 ma.s.l.). According to theKoppen–Geiger climate classification this area is a cold desert region, or BWK region,with a dry climate, little precipitation, and a wide daily temperature range (Peel et al.,15
2007). The HKKH area displays a considerable altitude range, influencing climatic con-ditions. The Nanga Parbat massif forms a barrier to the Northward movement of mon-soon storms, which intrude little into Karakoram. Thus, the hydrological regime in thisregion is only partly influenced by the monsoon, while a major contribution results fromseasonal snow and glacier melt. Precipitation occurs in two main periods, winter (JFM)20
and summer (JAS), i.e. driven by the westerly currents and monsoon respectively, andthe winter precipitation provides the dominant nourishment for the glacier systems ofthe HKKH (Bocchiola and Diolaiuti, 2013). Some studies postulate that these moun-tains gain a total annual rainfall between 200 mm and 500 mm, amounts that are gener-ally derived from valley-based meteorological stations and which are less representa-25
tive for the highest elevation zones (Archer, 2003). High elevation snowfall is still ratherunknown, due to the difficulty of obtaining reliable measurements. Some estimatesfrom snow pits above 5000 ma.s.l. range from 1000 mm to more than 3000 mmyr−1,depending upon site (Winiger et al., 2005; the authors of this study, unpublished data).
2896
TCD7, 2891–2941, 2013
2001–2010 glacierchanges in the
Central KarakoramNational Park
U. Minora et al.
Title Page
Abstract Introduction
Conclusions References
Tables Figures
J I
J I
Back Close
Full Screen / Esc
Printer-friendly Version
Interactive Discussion
Discussion
Paper
|D
iscussionP
aper|
Discussion
Paper
|D
iscussionP
aper|
However, there is considerable uncertainty about the spatial distribution and the ver-tical gradient of precipitation at high altitudes. Among the natural elements within theCKNP glaciers probably show the largest temporal variations. Within the park thereare more than 700 glaciers, spanning a broad range of size, geometry, type, and sur-face conditions (i.e. debris free and debris covered ice). The Baltoro glacier, one of the5
most prominent glaciers in the park, is about 60 km long, and it is one of the largestdebris covered glaciers worldwide. Baltoro glacier has been studied for more than onecentury, within several scientific expeditions, among others those led by Ardito Desio,a most renowned Italian scientist and explorer (Desio, 1954; Mayer et al., 2006). It is notfully clear how results from the temperate zones can be applied to understand the dy-10
namics of glaciers within the monsoon-dominated region of HKKH (Kaser et al., 2003),and also in central Karakoram, with a reduced influence of monsoon precipitation, theclimate-glacier relation is not investigated in detail. The glacier-climate-hydrology inter-actions in the lower latitudes are of great interest for both global and regional purposes,and a network of well-chosen and carefully monitored glaciers is important to establish15
a base for investigating these relationships (Kaser et al., 2003). In addition, accurateobservation of glaciers’ coverage and dynamics is needed to understand the role ofcryosphere in hydrology and water resources. The SEED project is focusing upon pro-viding these data base, e.g. by developing the CKNP glacier inventory for differentperiods. This is a base for (i) describing the present characteristics of glaciation in the20
Park and its features and, (ii) evaluating glacier changes within a time window of abouta decade. The main results from this research activity are presented in this paper,including the interpretation of the observed glacier dynamics against climate trendsfrom meteorological data provided by the Pakistan Meteorological Department (PMD),covering the period 1980–2009, and against maps of snow cover area from MODIS25
satellite during 2001–2011.
2897
TCD7, 2891–2941, 2013
2001–2010 glacierchanges in the
Central KarakoramNational Park
U. Minora et al.
Title Page
Abstract Introduction
Conclusions References
Tables Figures
J I
J I
Back Close
Full Screen / Esc
Printer-friendly Version
Interactive Discussion
Discussion
Paper
|D
iscussionP
aper|
Discussion
Paper
|D
iscussionP
aper|
3 Methods
3.1 Glacier data
3.1.1 The CKNP glacier inventory
On a global scale, glacier outlines can be derived using automated classification algo-rithms from multispectral satellite data (e.g. Paul et al., 2004a,b; Paul and Kaab, 2005),5
as recommended in the the Global Terrestrial Network for Glaciers (GTN-G, Haeberli,2006).
For the compilation of the CKNP Glacier Inventory we followed the new and updatedrecommendations suggested by Paul et al. (2010), and we considered the main pa-rameters as follows:10
– Identification (ID), i.e.: each glacier entity has a unique identification code.
– Coordinates, i.e: we reported the coordinates describing the location of a glacieras accurately as possible.
– Date, i.e.: each glacier outline is associated with the date of its acquisition, ifpossible day, month and year.15
– Surface area.
– Length, i.e.: we evaluated and inserted for each glacier the longest flowline value.
– Minimum elevation.
– Maximum elevation.
– Mean elevation.20
– Median elevation.
2898
TCD7, 2891–2941, 2013
2001–2010 glacierchanges in the
Central KarakoramNational Park
U. Minora et al.
Title Page
Abstract Introduction
Conclusions References
Tables Figures
J I
J I
Back Close
Full Screen / Esc
Printer-friendly Version
Interactive Discussion
Discussion
Paper
|D
iscussionP
aper|
Discussion
Paper
|D
iscussionP
aper|
– Mean orientation/aspect. We derived the mean aspect from a DTM, that allowsone to consider the value of all individual cells that are covered by the glacier andto derive a mean value in the full 0–360◦ range.
– Slope, i.e.: the mean slope was derived from elevation range and glacier length.
The images used in this study are from Landsat TM and ETM+ scenes of 2001 and5
2010. Details of the scenes are provided in Table 1. For year 2001; Landast 7 ETM+PAN-sharpened images were used as the base for the glacier delineation. The sceneshave been selected to obtain the least snow and cloud coverage. For 2010 Landsat5 TM scenes were used primarily, due to problems with scan-line errors in the ETM+scenes. Landsat 7 ETM+ gap-filled and PAN-sharpened images were simply used as10
a support, whenever it was not possible to recognize some parts of the glacier bound-aries in the reference Landsat 5 scene (e.g. when hidden by shadows). Moreover,a Digital Elevation Model (DEM) from the Shuttle Radar Topography Mission (SRTM3)was used to extract elevation related glacial parameters (e.g. minimum, maximum andmean elevation, hypsography). We used the void filled CGIAR-CSI SRTM DEM version15
4 (CGIAR-CSI, 2012), also used in other glacier related studies (Bolch et al., 2010).The co-registration of the Landsat scenes to the DEM resulted in a correlation of lessthan one pixel and thus no orthoprojection of the satellite images was needed.
To obtain glacier outlines we applied a semi-automatic approach. A fully automaticclassification system was not suitable since there are three main factors making glacier20
boundary assessment uncertain, namely (i) debris cover, (ii) attached seasonal and/orperennial snow, and (iii) the position of drainage divides in the accumulation area. Suchitems make the accuracy of the final classification largely driven by operator’s sensitivity(ESA, 2013). Thus, additional manual classification was applied upon the automatic re-sults. As a basis for the classification scheme we have used some band combinations,25
namely (i) 321 (true color), (ii) 543 (snow and ice represented by blue), and (iii) bandratios 4 and 5 (TM4/TM5). A Supervised Maximum Likelihood (SML) classification wasinitially used to detect all classes (bare-ice, debris, snow, rocks, shadows) in the study
2899
TCD7, 2891–2941, 2013
2001–2010 glacierchanges in the
Central KarakoramNational Park
U. Minora et al.
Title Page
Abstract Introduction
Conclusions References
Tables Figures
J I
J I
Back Close
Full Screen / Esc
Printer-friendly Version
Interactive Discussion
Discussion
Paper
|D
iscussionP
aper|
Discussion
Paper
|D
iscussionP
aper|
area, but it displayed poor accuracy. A comparison of the results of SML with the truecolor image (band 321) showed large differences between automatic classification andmanual identification of specific classes. Eventually, we could use SML only to iden-tify shadow areas, that were mostly excluded from further analysis. The combinationof different image products gave the best resulting glacier maps. Band combination5
543 allowed a clear delineation of snow and ice, the ratio TM4/TM5 provided detec-tion of the limits of snow accumulation areas (in particular upon the image acquired on30 September 2001), while the true color image was used for detection of supraglacialdebris, and for quality check of classification. In addition, we evaluated our resultsagainst our DEM and slope maps, which also supported the detection of morphologi-10
cal evidence of debris covered ice, thus allowing to properly identify glacier snouts andtermini whenever covered by supra-glacial debris. We also referred to Google Earth© toanalyze high resolution SPOT images from the study area. After successful delineationof the glacier boundaries, the area of each polygon was computed using a GeographicInformation System (GIS) software. Other glaciological parameters, such as minimum,15
maximum and mean elevation, and the hypsographic curves, have been obtained bycombining the glacier outlines with the DEM.
3.1.2 Glacier outlines accuracy and error assessment
When performing a temporal analysis, inaccuracies may occur due to positional andmapping errors. The latter depend upon the image resolution and its conditions at the20
time of acquisition, namely cloud and snow-cover, presence of shadows and debrishampering ice detection.
1. Georeferencing error
This type of error depends upon the referencing quality with respect to the specificprojection system. For our study we chose level 1T as the best possible one for geo-25
referencing. The georeferencing accuracy of this type of data is obtained by NASA,delivering the product, by means of a correction process based both upon Ground
2900
TCD7, 2891–2941, 2013
2001–2010 glacierchanges in the
Central KarakoramNational Park
U. Minora et al.
Title Page
Abstract Introduction
Conclusions References
Tables Figures
J I
J I
Back Close
Full Screen / Esc
Printer-friendly Version
Interactive Discussion
Discussion
Paper
|D
iscussionP
aper|
Discussion
Paper
|D
iscussionP
aper|
Control Points (GCPs, taken from the 2005 Global Land Survey), and Shuttle RadarTopographic Mission (SRTM) DEMs (Landsat7 Handbook, 2013). The SRTM DEM isthought to have good accuracy (Falorni et al., 2005, quoted also by Bolch et al., 2010),and it is more accurate in areas with low contrast. Visual inspection of the two over-lapped images revealed a good match. Thus we considered this error negligible with5
respect to the other errors.
2. Linear resolution error (LRE)
Image resolution influences the accuracy of glacier mapping. The higher the res-olution, the better the outlines, the smaller the error. Following Vogtle and Schilling(1999) and Citterio et al. (2007), the final planimetric precision value was evaluated10
considering both the uncertainty due to the sources (satellite images) and the clarityof glacier limits. The area precision for each glacier was evaluated by buffering theglacier perimeter considering the area uncertainty. The final precision of the wholeCKNP glacier coverage was determined by taking the root of the squared sum of allthe buffer areas. The error in area change ∆AE was then calculated as:15
∆AE =
√√√√√(711∑i=1
Pi ,2001 ·LRE2001
)2
+
707∑j=1
Pi ,2010 ·LRE2010
2
(1)
Where Pi ,2001 and Pj ,2010 are the glacier perimeters, and i /j is the number of ana-lyzed glaciers, for 2001 and 2010 respectively, ranging from 1 to 711/707, respectively.LRE2001 is the Linear Resolution Error affecting 2001 Landsat images while LRE2010is that of 2010. As suggested by O’Gorman (1996), the precision error is half a pixel20
for the area delineation. Therefore, the LRE should be half the resolution of a singleimage, i.e. in our case 7.5 m for the 2001 scene (the resolution of which was previouslyimplemented by the PAN-sharpening technique), and 15 m for the most recent one.
3. Errors depending on specific scene conditions2901
TCD7, 2891–2941, 2013
2001–2010 glacierchanges in the
Central KarakoramNational Park
U. Minora et al.
Title Page
Abstract Introduction
Conclusions References
Tables Figures
J I
J I
Back Close
Full Screen / Esc
Printer-friendly Version
Interactive Discussion
Discussion
Paper
|D
iscussionP
aper|
Discussion
Paper
|D
iscussionP
aper|
Seasonal snow, cloud cover and presence of shadows and debris can introduceerrors in glacier area determination. Therefore, we selected scenes with the least pos-sible snow and cloud cover (the latter is less than 6 %). Concerning snow cover, weminimized its impact by choosing the LANDSAT images where glacier ablation areawas as snow-free as possible, and according to their temporal coherence, so as to5
avoid major differences between the scenes for the same year (similar seasonality, seeTable 1). We also referred to other sources (SPOT from Google Earth©) whenever cer-tain glacier features were not visible in the Landsat images. Furthermore, we used SMLclassification to identify shadow areas, that were mostly excluded from the analysis.
3.1.3 Supraglacial debris-coverage10
We applied a Supervised Maximum Likelihood (SML) classification to the Landsat falsecolour composite image (i.e.: 543 bands) to map the supraglacial debris upon the studyarea in 2001 and 2010. We first extracted the glacial areas upon the 2001 glacier mask,thus reducing possible misclassifications in the classifier-training, due to out-of-glacierpixel noise.15
We chose to consider only glaciers larger than 2 km2, because Landsat resolutionwas too poor to discriminate debris areas in very small glaciers. So doing, we consid-ered 4273 km2 of ice cover (ca. 95 % of the total area). We then trained the classifier todiscriminate between two classes (“clean-ice” and “supraglacial debris”), by choosingappropriate Region of Interests (ROIs). This led to an accurate automatic classification20
of the debris, validated then by visual comparison of the resulting debris masks againstthe visible colour Landsat images. We then investigated the debris cover change withinthe studied period (2001–2010). Eventually, to investigate the role of debris cover withinglacier ablation area, we set the highest line of ablation to 5200 ma.s.l. (see e.g. Boc-chiola et al., 2011).25
2902
TCD7, 2891–2941, 2013
2001–2010 glacierchanges in the
Central KarakoramNational Park
U. Minora et al.
Title Page
Abstract Introduction
Conclusions References
Tables Figures
J I
J I
Back Close
Full Screen / Esc
Printer-friendly Version
Interactive Discussion
Discussion
Paper
|D
iscussionP
aper|
Discussion
Paper
|D
iscussionP
aper|
3.1.4 Debris mapping accuracy
Equation (1) was also applied to evaluate the error affecting debris-mapping. LREswere the same used for glacier outlines accuracy assessment (namely 7.5 m for 2001and 15 m for 2010).
3.2 Snow cover data5
3.2.1 Snow detection
We used MODIS images to investigate snow-cover variability during 2001–2011 withinthe CKNP. We downloaded the MOD10A2-V5 product, i.e. pre-processed raw MODISimages, showing snow and other environmental features (e.g. lakes, clouds, etc.),freely available from the National Snow and Ice Data Center website (NSDIC, 2013).10
The data set contains fields of maximum snow cover extent over an eight-day period(bundle). All the images have undergone further processing to fit the study area, anda threshold for cloud cover was set to reduce clouds noise over the scenes. The overallprocess consists of different steps:
– Re-projection from Sinusoidal to WGS84 Zone 43N projection;15
– Image clipping to fit CKNP area;
– Attribute Tables extraction;
– Table and MODIS scene filenames export to spreadsheet.
All these steps have been cascaded into a script to process all data batch using Pythonlanguage (Python, 2013) combined with a GIS. Cloud coverage was inspected first con-20
sidering different thresholds, and a best output was taken as a tradeoff between dataquality and quantity. In fact, the lower the threshold, the cleaner the scenes, but witha higher loss of area. On the other hand, too high a threshold would lead to poor qual-ity. Thus we set the threshold to 50 %, as a best tradeoff. Most of the available dataset
2903
TCD7, 2891–2941, 2013
2001–2010 glacierchanges in the
Central KarakoramNational Park
U. Minora et al.
Title Page
Abstract Introduction
Conclusions References
Tables Figures
J I
J I
Back Close
Full Screen / Esc
Printer-friendly Version
Interactive Discussion
Discussion
Paper
|D
iscussionP
aper|
Discussion
Paper
|D
iscussionP
aper|
have not yet been investigated by the NSDIC group for quality check, and further anal-yses are ongoing. We compared our results against those in Tahir et al. (2011), thatstudied snow-cover in the Hunza basin, north of the CKNP. We investigated snow coverchanges per elevation belts (A, B, C), trying to match as much as possible those re-ported by Tahir et al. (2011). The classification is shown in Table 2.5
We carried out linear regression of snow cover data within the three selected alti-tude belts. To provide a meaningful comparison between different years, we chose tocompare snow cover at fixed dates. Within the available database of reasonably clearimages we chose a number of dates where images were available for several years.We selected five dates during ablation season (from 18 June to 30 September), and10
a total of 37 images. We chose to analyze dates during the ablation season becausea significant analysis of the accumulation season (fall–spring) would not have beenpossible due to lack of a sufficient amount of data. Also, glacier nourishment is relatedto snow accumulation at onset of thaw season and snow depletion thenceforth, so theconsidered period seems relevant. Given the short series (11 yr) of snow cover data,15
neither we carried out significance analysis of the observed trends, nor we pursuedother statistical tests (e.g. Mann–Kendall).
3.2.2 Snow data accuracy
As summarized in Parajka and Bloschl (2012), most of the MODIS accuracy assess-ments reported the overall accuracy between 85 % and 99 % during clear sky condi-20
tions. The accuracies at individual sites vary between 87.5 % and 100 %, but there is noclear dependence between mapping accuracy and topography (Parajka et al., 2012).Moreover, Tahir et al. (2011) have used ASTER images (which have high-spatial res-olution) to validate MODIS snow cover products in the Hunza basin. The results theyobtained suggest that MODIS snow products are accurate in estimating snow cover25
within our study area.
2904
TCD7, 2891–2941, 2013
2001–2010 glacierchanges in the
Central KarakoramNational Park
U. Minora et al.
Title Page
Abstract Introduction
Conclusions References
Tables Figures
J I
J I
Back Close
Full Screen / Esc
Printer-friendly Version
Interactive Discussion
Discussion
Paper
|D
iscussionP
aper|
Discussion
Paper
|D
iscussionP
aper|
3.3 Climate data analysis
We investigated monthly averaged meteorological variables, kindly provided by thePakistan Meteorological Department (PMD), derived from measurements at a numberof stations in North Eastern Pakistan during 1980–2009. Data from the three closeststations to the CKNP area, namely Gilgit, Bunji and Astore (from North to South, Fig. 1)5
are used for this study. Earlier investigations (Weiers, 1995; Winiger et al., 2005; Boc-chiola and Diolaiuti, 2013), suggested that in Northern Pakistan three main climaticregions can be identified, depending mainly upon characteristic rainfall regimes. Theseare
1. Western Himalaya (Kaghan Valley and Nanga Parbat), marginally influenced by10
the monsoon, with annual precipitation ranging from 900 to 1300 mm in the al-titudinal range between 1000 and 4000 ma.s.l., and increasing to 2300 mm at5500 ma.s.l.,
2. Chitral–Hindukush, influenced by Mediterranean low pressure systems in win-ter and spring, with average annual precipitation from 500 mm at 1000 ma.s.l. to15
1300 mm at 5500 ma.s.l., and
3. Northwest Karakoram (including the CKNP area), with winter and occasionalspring and summer rainfall, where precipitation increases from 150–500 mm at1500–3000 ma.s.l. to more than 1700 mm at 5500 ma.s.l.
All three meteorological stations used here are nested into Northwest Karakoram re-20
gion. The analysis covers seasonal values of total precipitation, number of wet daysand maximum and minimum air temperature. The data are investigated for trends withlinear regression (LR) analysis and the non-parametric Mann–Kendall (MK) test, bothtraditional and progressive (backward–forward). MK highlights not linear trends, andmay pinpoint the onset period of a trend, if any (Bocchiola and Diolaiuti, 2010). The sta-25
tion altitudes range from 1460 ma.s.l. (Gilgit) to 2168 ma.s.l. (Astore), which is ratherlow in comparison with the hypsography of the region and the likely large precipitation
2905
TCD7, 2891–2941, 2013
2001–2010 glacierchanges in the
Central KarakoramNational Park
U. Minora et al.
Title Page
Abstract Introduction
Conclusions References
Tables Figures
J I
J I
Back Close
Full Screen / Esc
Printer-friendly Version
Interactive Discussion
Discussion
Paper
|D
iscussionP
aper|
Discussion
Paper
|D
iscussionP
aper|
gradient in higher altitudes (Winiger et al., 2005; Wulf et al., 2010; Bocchiola et al.,2011). Data from automatic weather stations (AWSs) at higher altitudes (e.g. Askole,3015 ma.s.l., and Urdukas, 3926 ma.s.l., installed by EVK2CNR committee, see Boc-chiola et al., 2011) are available, but for very short periods (2005–now). Eventually,the three chosen stations are the only ones available in our knowledge to analyse re-5
cent climate patterns within the CKNP area. Given the relative proximity to the CKNP(Gilgit and Bunji are placed 10–20 km from CKNP boundaries, Astore ca. 50 km), theclimate data within the selected stations may be thought as representative of climatewithin the park area. Also, in spite of the considerable vertical gradients within the area(temperature and precipitation, the latter more uncertain), relative variations observed10
at the selected stations may be taken as representative of variation also at the highestaltitudes, at least in a first approximation.
Unfortunately, no snow gauges are available in the PMD data base, so no direct in-ference can be made about snow amount and snow water equivalent SWE (see. e.g.Bocchiola and Rosso, 2007; Bocchiola, 2010; Bocchiola and Groppelli, 2010; Diolaiuti15
et al., 2011, 2012), but only indirectly through remote sensing of snow covered areaSCA, like we do here, and hydrological modeling (see e.g. Bocchiola et al., 2011). Themain parameters for the climate analysis are the monthly amount of precipitation Pm(mm), the monthly number of wet days Dw, the monthly average of the maximum andminimum day-time air temperature Tmax (◦C), Tmin (◦C). Pm provides the hydrological in-20
put on the area, while Dw indirectly indicates the frequency (or average duration) of pre-cipitation events (days with rainfall). No information concerning splitting of precipitationinto either rainfall or snowfall is available here, and Pm is labeled as “monthly amount ofprecipitation”. Upon analysis of the average winter temperature, that are below zero inseveral sites, and of considerable Pm values during winter unlikely to represent entirely25
liquid values, we assume here that water under snowfall is included here and Pm isa measure of total precipitation. The maximum and minimum day-time temperatures,Tmax and Tmin, provide indication about the temperature characteristics in the investi-gated periods (e.g. arrival and duration of heat waves). Annual and seasonal (JFM,
2906
TCD7, 2891–2941, 2013
2001–2010 glacierchanges in the
Central KarakoramNational Park
U. Minora et al.
Title Page
Abstract Introduction
Conclusions References
Tables Figures
J I
J I
Back Close
Full Screen / Esc
Printer-friendly Version
Interactive Discussion
Discussion
Paper
|D
iscussionP
aper|
Discussion
Paper
|D
iscussionP
aper|
etc.) values of the variables are also derived and used in the analysis, and Pm,Y/SEA isthe sum of the monthly values during a year/season, Dw,Y/SEA represents the mean ofmonthly values during a year/season, and Tmax,Y/SEA and Tmin,Y/SEA are calculated asthe mean of monthly values during a year/season.
The significance of LR during the period of observations is given by the p-value5
(α = 5 %, e.g. Jiang et al., 2007). Multiple trends could be identified in the time se-ries analysis, e.g. by assessing slope changes (see e.g. Seidou and Ouarda, 2007).However, in view of the relative shortness of the series here, a single slope regressionanalysis is carried out. The Mann–Kendall test (Mann, 1945; Kendall, 1975) is widelyadopted to assess the significance of trends in time series (Hirsch and Slack, 1984;10
Gan, 1998; Chiew and McMahon, 1993; Lettenmaier et al., 1994; Zhang et al., 2000;Yue and Wang, 2002; Bocchiola et al., 2008). It is a non-parametric test, less sensi-tive to extreme values, and independent from the hypothesis about the nature of thetrend (e.g. Wang et al., 2005). Consider a sample of a random variable, e.g. Pm, { Pm,y ,y = 1,2, . . .,Y } with Y being the length of the series. Taken a value within the sample15
with index y , we define py as the number of elements of the sample with j < y for whichPm,j < Pm,y . Then τ is defined as
τ =Y∑
y=1
py . (2)
It turns out that τ is asymptotically normally distributed, and its mean and standarddeviation are20
µ(τ) = Y (Y −1)/4; σ(τ) =√Y (Y −1)(2Y +5)/72. (3)
The variable u(τ) = (τ−µ(τ))/σ(τ) is then a standard normal, and it is possible to derivethe associated confidence interval. The Mann–Kendall test verifies the assumption ofstationarity by investigating if u(τ) is within the confidence interval for a given signif-icance level (e.g. for α = 5 %, the range would be −1.96 to 1.96). In the progressive25
2907
TCD7, 2891–2941, 2013
2001–2010 glacierchanges in the
Central KarakoramNational Park
U. Minora et al.
Title Page
Abstract Introduction
Conclusions References
Tables Figures
J I
J I
Back Close
Full Screen / Esc
Printer-friendly Version
Interactive Discussion
Discussion
Paper
|D
iscussionP
aper|
Discussion
Paper
|D
iscussionP
aper|
form of the Mann–Kendall test, the variables τj and u(τj ) are calculated for each el-ement of the sample j , by trading Y for j in Eqs. (2) and (3). The value of τ definesthe direction (positive/negative) and magnitude (modulus) of the trend. The same pro-cedure is applied by starting from the most recent values and backward. In this case,p′i indicates the number of elements of the series of Pm,y with j > y , and Pm,j > Pm,y .5
Then u(τ′j ) is calculated accordingly from p′y and τ′j . If no trend is present, the diagram
of u(τj ) and u(τ′j ) against the sample unit (e.g. time) shows several crossing points.Contrarily, if the series is affected by a trend, the crossing period is unique and allowsto approximately locate the starting point. Here the MK test was applied to raw data,without pre-whitening, according to Yue and Wang (2002). Then, we investigated the10
correlation of the weather variables against the anomaly (vs. long term average) ofthe Northern Atlantic Oscillation (NAO) index (e.g. Hurrell, 1995; Jones et al., 1997;Osborn, 2004, 2006), during 1980–2009. Archer and Fowler (2004) obtained a statisti-cally significant (positive) correlation between winter precipitation and a monthly index(November to January) of the NAO during 1961–1999, and a significant negative cor-15
relation between NAO and summer rainfall at several stations. Further on, we triedand verify the hypothesis that the temperature evolution in the Karakoram is related towarming at global or hemispheric scale. To do so, we investigated the correlation be-tween global temperature anomalies DTG (calculated according to Brohan et al., 2006)and Tmin and Tmax of the station data.20
4 Results
4.1 The CKNP glacier changes during 2001–2010
The 2001 inventory displayed 711 glaciers within the CKNP region (Table 5). Their totalarea is 4587 (±18 km2), namely ∼ 38 % of the total surface of the Central KarakoramNational Park (12 162 km2) and 35 % of the surface of our study area (13 199 km2).25
This area represents ∼ 30 % of the glacier surface of the entire Karakoram range in
2908
TCD7, 2891–2941, 2013
2001–2010 glacierchanges in the
Central KarakoramNational Park
U. Minora et al.
Title Page
Abstract Introduction
Conclusions References
Tables Figures
J I
J I
Back Close
Full Screen / Esc
Printer-friendly Version
Interactive Discussion
Discussion
Paper
|D
iscussionP
aper|
Discussion
Paper
|D
iscussionP
aper|
Pakistan (total area from ICIMOD, 2012). Thus, the CKNP glaciation seems a repre-sentative sample for future considerations upon glaciers in upper Pakistan. The biggestglacier is 604 km2 large (i.e. Baltoro), while the overall average glacier size is 6.5 km2.The 9 largest glaciers (1.27 % of the total number) cover more than half of the glacier-ized surface. The smallest glaciers class (433 glaciers < 1 km2) covers ca. 61 % of all5
glaciers by number, while covering only 3.6 % of the glacier surface (see Table 6). Fifty-three glaciers had an area smaller than 0.1 km2 in 2001. Nevertheless they all togethercovered a surface area of 2 km2 and were integrated in the CKNP Glacier Inventoryas “glacierets”. The glacier minimum elevation (i.e.: glacier terminus altitude) was be-tween 4500 and 5000 ma.s.l. for almost 40 % in number of all the mapped glaciers. On10
the other hand, this share of glaciers only accounts for 5 % of ice cover overall. In fact,almost half of the glacier area is covered by a few bigger glaciers (only the 3.4 % of thetotal number), with a minimum elevation between 3000 and 3500 ma.s.l. (see Tab. 4).This mirrors the fact that larger glaciers tend to reach lower elevations, while smallerglaciers have higher termini, as observed in other glaciated regions, including Alaska15
Brooks Range (Manley, 2005), Swiss glaciers (Kaab et al., 2002), Cordillera Blanca(Racoviteanu et al., 2008a), and Italian Alps (Diolaiuti et al., 2011, 2012a,b).
Our mapped glaciers were sorted according to the size classes introduced byBolch et al. (2011), who studied Garhwal Himalaya’s glaciers in India. They appliedsize classes as follows: < 0.5 km2, 0.51–1.0 km2, 1.01–2.0 km2, 2.01–5.0 km2, 5.01–20
10.0 km2, 10.01–20.0 km2, 20.01–50.0 km2, > 50.01 km2(Table 5). The hypsography ofthe glacierized areas (2001) for the size classes and 100 m elevation belts is shown inFig. 2 (based on the SRTM DEM of 2000). The glaciers range in elevation from 2250to 7900 ma.s.l.
The glacier size displays some characteristic distribution against glaciers’ altitude25
(Fig. 3). Small glaciers with an area less than 1 km2 are restricted to elevations above3500 ma.s.l.. The elevation range is not very large, but some of the small glaciers arefound at up to 7000 ma.s.l.
2909
TCD7, 2891–2941, 2013
2001–2010 glacierchanges in the
Central KarakoramNational Park
U. Minora et al.
Title Page
Abstract Introduction
Conclusions References
Tables Figures
J I
J I
Back Close
Full Screen / Esc
Printer-friendly Version
Interactive Discussion
Discussion
Paper
|D
iscussionP
aper|
Discussion
Paper
|D
iscussionP
aper|
We found a significant relationship (ρ = 0.5) between the area and the vertical extentof the glacier (i.e. difference between maximum and median elevation). Glaciers withsmall vertical extent (i.e. maximum elevation close to median) feature small areas. Inaddition, we found a significant relationship (ρ = 0.5) of the area vs. the altitudinal range(i.e. maximum minus minimum elevation).5
Then correlation analysis showed that small glaciers possess both smaller altitudinalrange and vertical extent. Conversely larger glaciers possess wider altitudinal rangeand vertical extent and their snout reach the lower elevations. Most of the large andprominent glaciers originate above 7000 m a.s.l. and have wide elevation range. More-over, the minimum elevation reached by some of these large glaciers is much lower10
than in the Greater Himalaya of India and Nepal (Hewitt, 2005). It is also interestingto note that the mean elevation of all glaciers sizes is ca. 4990 ma.s.l., i.e. only a fewhundred meters below the estimated ELA.
In the inventory of 2010 the number of glaciers is slightly lower than in 2001, with 707glaciers (due to some individual glaciers advancing to merge with neighboring glacier15
bodies, see also Fig. 5), covering an area of 4613 km2 (±38 km2). Their size distributionis shown in Table 5. Some glaciers have shifted from one size class to another during2001–2010. To avoid inconsistencies, Table 6 shows the contribution of each glacieraccording to the class it belonged to in 2001.
Based on this analysis, the total glacier surface increased slightly, by ca. 27 km2 dur-20
ing 2001–2010. The relative area change is not remarkable (+0.6 % of the 2001 area),and it is smaller than the error we calculated from Eq. (1) (±42 km2), thus suggest-ing rather stable conditions. Moreover, we found 40 glaciers (over the whole sampleof more than 700) with changed area, i.e. only 0.06 % of the CKNP glaciers varied itssurface, confirming the stability of this glacierized region.25
In spite of the overall stable situation, when focusing upon those 40 glaciers wit-nessing surface change (i.e. due to advance or surge events), noticeable variationsare found (Fig. 6a, b). Especially glaciers in the size classes from 10 to 50 km2 haveshown appreciable advances, with a decrease of the minimum elevation of up to 60 m
2910
TCD7, 2891–2941, 2013
2001–2010 glacierchanges in the
Central KarakoramNational Park
U. Minora et al.
Title Page
Abstract Introduction
Conclusions References
Tables Figures
J I
J I
Back Close
Full Screen / Esc
Printer-friendly Version
Interactive Discussion
Discussion
Paper
|D
iscussionP
aper|
Discussion
Paper
|D
iscussionP
aper|
with respect to 2001. These advances consisted in a downshift of the glacier minimumelevation in 2010. In some cases they even advanced on top of their bigger neighboringglaciers. A most prominent example is given by Panmah’s tributaries, some of whichhave experienced surges from 2001 and 2005 (Hewitt, 2007), now protruding far ontothe main trunk of the Panmah glacier, which may (Fig. 6a) or may not (Fig. 6b) result5
into a surface area increase.Our results are in agreement with earlier observations, e.g. by Hewitt (2005), claiming
the existence of the “Karakoram anomaly”, a regional deviation from the general glaciershrinkage observed in most glacierized areas worldwide (e.g. Gardelle et al., 2012).Other neighboring Asian glacierized areas are undergoing a general glacier decline10
(IPCC, 2007; Bolch et al., 2010; Bhambri et al., 2011; Pan et al., 2012), thus indicatingdifferent conditions in the Karakoram.
Here, we distinguished glacier-snout movements between advancing and surgingtype by visual inspection of the Landsat scenes. We focused upon the magnitude ofglacier-termini advance, and we labeled it as a surging type when it exceeded about15
150 myr−1 (Cuffey and Paterson, 2010). Under this assumption, and according to thepresent literature (Hewitt, 2007; Copland et al., 2011), 6 glaciers (Panmah and Bralduglaciers and some of their tributaries) are potentially affected by actual surge phenom-ena. Furthermore, looped moraines are present on their surfaces, supporting this hy-pothesis (Copland et al., 2003). Then the rest (and most) of glacier expansion through20
recent years could be charged upon diffuse glacier advance activity. Barrand and Mur-ray (2006) analysed 150 glaciers in the Karakoram, using multivariate statistical analy-sis of data derived from ASTER and Landsat. They found that the incidence of surgingwas statistically connected to various size-related variables, including glacier lengthand perimeter, and debris cover. Moreover, the effect of glacier perimeter upon surging25
may be explained by the increased availability of avalanche-fed snow and debris ma-terial which may act as a mass balance proxy. In our case, the 6 glaciers witnessingsurge-type advances show complex perimeters, but not abundant supraglacial debris.
2911
TCD7, 2891–2941, 2013
2001–2010 glacierchanges in the
Central KarakoramNational Park
U. Minora et al.
Title Page
Abstract Introduction
Conclusions References
Tables Figures
J I
J I
Back Close
Full Screen / Esc
Printer-friendly Version
Interactive Discussion
Discussion
Paper
|D
iscussionP
aper|
Discussion
Paper
|D
iscussionP
aper|
4.2 Debris-cover changes during 2001–2010
Landsat images displayed that the total supraglacial-debris-coverage was 977 km2
(±138 km2) in 2001, and 1070 km2 (±194 km2) in 2010, about 20 % of the total ice cov-ered area. When considering only the ablation area, the percentage rose up to 31 %.The accuracy of the surface comparison is ±238 km2, then the change in the debris5
cover area of +92 km2 falls within the error range. In spite of this non-significant areachange, debris cover increment can be appreciated by comparison of two FCC imagesupon some selected glaciers (Fig. 7). Source of debris cover may have been rockyavalanches due to steep slopes, glacier dynamics, wind action and other factors. Themaximum cover was found at 4300 ma.s.l., in the ablation zone. Supraglacial debris10
increase is likely another cause of the stable conditions of the Karakoram glaciers. Infact supraglacial debris coverage, whenever thicker than the “critical thickness” (sensuMattson et al., 1993), is proven to reduce buried ice melting rates (Mihalcea et al.,2006).
4.3 Snow-cover variability during 2001–201015
We analyzed trends of snow cover data during 2001–2010 (see Fig. 8). An increasingtrend of snow cover is seen through time in all the elevation belts (Table 2). In Belt A,a gain of +0.09 km2 yr−1 was observed, or 2 % of snow cover area yearly. In Belt B,snow cover area increased by +2.35 km2 yr−1, or +0.6 %yr−1. Belt C has increasingsnow cover of +14.86 km2 yr−1, or +0.2 %yr−1. These results are qualitatively similar20
to those in Tahir et al. (2001), who studied snow variability of the Hunza basin during2001–2009, finding increasing snow cover area, especially in Belt C during summer.
4.4 Climate trends in the period 1980–2009
The results of the trend analysis of climate are shown in Table 7. The progressiveMK test was carried out whenever both MK and LR tests showed non-stationarity. The25
2912
TCD7, 2891–2941, 2013
2001–2010 glacierchanges in the
Central KarakoramNational Park
U. Minora et al.
Title Page
Abstract Introduction
Conclusions References
Tables Figures
J I
J I
Back Close
Full Screen / Esc
Printer-friendly Version
Interactive Discussion
Discussion
Paper
|D
iscussionP
aper|
Discussion
Paper
|D
iscussionP
aper|
results of this analysis, i.e. onset date, and average values before and after this date,as compared to long term average, are also reported in Table 7. Especially Pm demon-strates a substantial stationary behavior, and no significant change of total precipitationis seen in the area. Concerning the number of wet days (Dw), increasing values arefound in Gilgit (yearly, Y since 2001, JFM with no clear onset), i.e. there is a significant5
increase of the number of yearly (and winter) precipitation events. In Astore signifi-cant increase of Dw is found in summer months (JAS) via the LR test. In Bunji non-significant decreasing values are observed. The minimum temperature Tmin increasessignificantly in Astore for winter and spring (JFM, AMJ, since 1999–2002) and in Bunjialso for all periods except in summer (Y , JFM, AMJ, OND, since 1997–2003). In Gilgit10
Tmin decreases significantly during summer (JAS, since 1986), while a non-significantdecrease is found in fall and yearly. The maximum temperature Tmax increases signifi-cantly yearly, in fall and winter in Astore (Y since 1998, Fig. 3, JFM since 2000). Alsoin Gilgit significant Tmax increases are observed for most periods (Y , JFM, since 1995,OND, since 1991), while Bunji shows a significant Tmax increase only in winter (JFM,15
since 1997) and a non-significant decreasing trend in JAS. We then evaluated the (lin-ear) correlation between (i) local temperatures and global thermal anomalies, and (ii)the investigated weather variables and the NAO index. As a representative parame-ters of the region, the averaged values between the three stations have been used(Table 7). The minimum air temperature Tmin is slightly, but significantly positively cor-20
related with respect to DTG yearly, in winter and spring. The maximum air temperatureTmax is significantly positively correlated against DTG for annual as well as seasonalperiods, especially in fall and winter. Concerning the NAO index, Pm shows a signifi-cant correlation (negative vs. Y , and positive vs. JAS and OND), but small in absolutevalue. The duration of wet periods Dw is significantly shorter for higher NAO anomalies,25
unless during spring. The minimum temperature Tmin is negatively correlated to NAOduring winter and spring. Tmax is negatively correlated to NAO (Y , JFM, AMJ).
2913
TCD7, 2891–2941, 2013
2001–2010 glacierchanges in the
Central KarakoramNational Park
U. Minora et al.
Title Page
Abstract Introduction
Conclusions References
Tables Figures
J I
J I
Back Close
Full Screen / Esc
Printer-friendly Version
Interactive Discussion
Discussion
Paper
|D
iscussionP
aper|
Discussion
Paper
|D
iscussionP
aper|
5 Discussion and conclusion
We used remote sensing data of ice and snow cover, together with climate data fromPMD automatic weather stations, to provide an overview of the state of glaciers withinCKNP in northern Pakistan, and possible trends occurring lately.
From our glacier inventory, in 2001 CKNP glaciers covered an area of 45875
(±18 km2), namely ∼ 38 % of the park surface and ∼ 30 % of the glacier surface ofthe entire Karakoram range in Pakistan. In 2010 we found an ice coverage of 4613 km2
(±38 km2), thus giving a not remarkable area change (+0.6 % of the 2001 area), whichis also smaller than the error affecting our computation (±42 km2), thus suggestingrather stable glacier conditions.10
Moreover, we found 40 glaciers (over the whole sample of more than 700) withchanged area, i.e. only 0.06 % of our glaciers was found varying its surface, thus con-firming the stability of this glacierized region.
Nevertheless, when focusing on this small subset of changing glaciers noticeablevariations can be detected. Especially glaciers in the size classes from 10 to 50 km2
15
have shown appreciable advances, with a decrease of the minimum elevation of upto 60 m with respect to 2001. These advances consisted in a downshift of the glacierminimum elevation in 2010. In some cases they even advanced on top of their biggerneighboring glaciers (mostly because of actual snout advances and few because ofsurges).20
The most prominent examples of surging glaciers are given by Panmah’s tributaries,some of which have experienced surges from 2001 and 2005 (Hewitt, 2007), now pro-truding far onto the main trunk of the Panmah glacier (Fig. 6).
The supraglacial debris was found 977 km2 (±138 km2) in 2001, and 1070 km2
(±194 km2) in 2010, about 20 % of the total ice covered area and 31 % of the abla-25
tion area. This debris coverage may have played a role in maintaining the quite stableconditions of the Karakoram glaciers. In fact, supraglacial debris can decrease ice melt-ing rate (i.e. whenever thicker than the “critical value”, see Mattson et al., 1993).The
2914
TCD7, 2891–2941, 2013
2001–2010 glacierchanges in the
Central KarakoramNational Park
U. Minora et al.
Title Page
Abstract Introduction
Conclusions References
Tables Figures
J I
J I
Back Close
Full Screen / Esc
Printer-friendly Version
Interactive Discussion
Discussion
Paper
|D
iscussionP
aper|
Discussion
Paper
|D
iscussionP
aper|
surface change falls within the error range affecting our calculation (±238 km2) but it isclearly appreciable by analysing FCC images upon some selected glaciers, suggestingit really happened (Fig. 7).
We found snow cover increase at thaw (June–September) everywhere. Our climateanalysis revealed a significant decrease in minimum summer temperatures (−1.5 ◦C5
during 1980–2009) at Gilgit, and a general increase in winter wet days (+3.3 daysyr−1
during 1980–2009), which at high altitudes might have supported the increase of snowcover as detected. This favourable climate behaviour, together with the peculiar glaciersetting, with the largest part of ice bodies above 4500 ma.s.l. and a large fraction ofthe melting glacier surface covered by rock debris, may have caused small ice losses.10
These factors may have resulted into the stable ice cover area we found.These findings are in agreement with the evidence of the “Karakoram anomaly” (He-
witt, 2005), a regional deviation from the general glacier shrinkage observed in mostglacierized zones worldwide, and also agree with the results by Kaab et al. (2012). Thisglacier “anomaly” was only partially affected by glacier surges, unlikely to be a main15
cause of glaciers’ snout advance.Our findings are also in agreement with Gardelle et al. (2012, 2013) who used satel-
lite data to find out a slight mass gain for the glaciers of this area, and estimated theKarakoram mass balance to be +0.10±0.19 myr−1 water equivalent.
To further deepen knowledge of glaciers evolution in our target region more field20
data are required, especially to describe high resolution glacier changes (glacier massbalances), and to evaluate magnitude and rate of snow accumulation. The lack of snowdepth data at the highest altitudes, terribly important for ice nourishing, may limit ourunderstanding of glaciers’ dynamics, and claims for further investigation in this sense.Extensive field data collection could improve our knowledge of behavior and dynamics25
of glaciers in this part of the “Third Pole”.
Acknowledgements. Landsat data used in this paper are distributed by the Land ProcessesDistributed Active Archive Center (LP DAAC), located at USGS/EROS, Sioux Falls, SD, http://lpdaac.usgs.gov.
2915
TCD7, 2891–2941, 2013
2001–2010 glacierchanges in the
Central KarakoramNational Park
U. Minora et al.
Title Page
Abstract Introduction
Conclusions References
Tables Figures
J I
J I
Back Close
Full Screen / Esc
Printer-friendly Version
Interactive Discussion
Discussion
Paper
|D
iscussionP
aper|
Discussion
Paper
|D
iscussionP
aper|
Climate data are kindly provided by PMD (Pakistani Meteorological Department).
This research was performed under the umbrella of SEED and PAPRIKA projects.
SEED is a project funded by Pakistani and Italian governments, and managed by EvK2-CNRCommittee.
PAPRIKA is a project funded and managed by EvK2-CNR Committee (it is the twin project of5
the PAPRIKA France program).
References
Ageta, Y. and Higuchi, K.: Estimation of mass balance components of a summer accumulationtype glacier in Nepal, Himalaya, Geogr. Ann. A, 66A, 249–255, 1984.
Ageta, Y. and Fujita, K.: Characteristics of mass balance of summer – accumulation type10
glaciers in the Himalayas and Tibetan Plateau, Zeitschrift fur Gletscherkunde und Glazialge-ologie, 32, 61–65, 1996.
Aggarwal, P. K., Joshi, P. K., Ingram, J. S. I., and Gupta, R. K.: Adapting food systems ofthe Indo–Gangetic plains to global environmental change: key information needs to improvepolicy formulation, Environ. Sci. Policy, 7, 487–498, 2004.15
Akhtar, M., Ahmad, N., and Booij, M. J.: The impact of climate change on the water resourcesof Hindukush–Karakoram–Himalaya region under different glacier coverage scenario, J. Hy-drol., 355, 148–163, 2008.
Archer, D. R.: Contrasting hydrological regimes in the upper Indus Basin, J. Hydrol., 274, 198–210, 2003.20
Archer, D. R. and Fowler, H. J.: Spatial and temporal variations in precipitation in the UpperIndus Basin, global teleconnections and hydrological implications, Hydrol. Earth Syst. Sci.,8, 47–61, doi:10.5194/hess-8-47-2004, 2004.
Barrand, N. and Murray, T.: Multivariate controls on the incidence of glacier surging in theKarakoram Himalaya, Arct. Antarct. Alp. Res., 38, 489–498, 2006.25
Belo, M., Mayer, C., Lambrect, A., Smiraglia, C., and Tamburini, A.: The recent evolution of LiligoGlacier Karakoram, Pakistan and its present quiescent phase, Ann. Glaciol., 48, 171–176.,2008.
Bhambri, R., Bolch, T., Chaujar, R. K., and Kulshreshtha, S. C.: Glacier changes in the GarhwalHimalaya, India, from 1968 to 2006 based on remote sensing, J. Glaciol., 57, 534–556, 2011.30
2916
TCD7, 2891–2941, 2013
2001–2010 glacierchanges in the
Central KarakoramNational Park
U. Minora et al.
Title Page
Abstract Introduction
Conclusions References
Tables Figures
J I
J I
Back Close
Full Screen / Esc
Printer-friendly Version
Interactive Discussion
Discussion
Paper
|D
iscussionP
aper|
Discussion
Paper
|D
iscussionP
aper|
Bocchiola, D.: Regional estimation of Snow Water Equivalent using Kriging: a preliminary studywithin the Italian Alps, Geogr. Fis. Din. Quat., 33, 3–14, 2010.
Bocchiola, D. and Diolaiuti, G.: Evidence of climate change within the Adamello Glacier of Italy,Theor. App. Climat., 100, 3–4, 351–369, 2010.
Bocchiola, D. and Diolaiuti, G.: Recent (1980–2009) evidence of climate change in the upper5
Karakoram, Pakistan, Theor. Appl. Climatol., doi:10.1007/s00704-012-0803-y, 2013.Bocchiola, D. and Groppelli, B.: Spatial estimation of Snow Water Equivalent at different dates
within the Adamello Park of Italy, Cold Reg. Sci. Technol., 63, 97–109, 2010.Bocchiola, D. and Rosso, R.: The distribution of daily Snow Water Equivalent in the Central
Italian Alps, Adv. Water Resour., 30, 135–147, 200710
Bocchiola, D., Bianchi Janetti, E., Gorni, E., Marty, C., and Sovilla, B.: Regional evaluation ofthree day snow depth for avalanche hazard mapping in Switzerland, Nat. Hazards EarthSyst. Sci., 8, 685–705, doi:10.5194/nhess-8-685-2008, 2008.
Bocchiola, D., Diolaiuti, G., Soncini, A., Mihalcea, C., D’Agata, C., Mayer, C., Lambrecht, A.,Rosso, R., and Smiraglia, C.: Prediction of future hydrological regimes in poorly gauged high15
altitude basins: the case study of the upper Indus, Pakistan, Hydrol. Earth Syst. Sci., 15,2059–2075, doi:10.5194/hess-15-2059-2011, 2011.
Bolch, T., Yao, T., Kang, S., Buchroithner, M. F., Scherer, D., Maussion, F., Huintjes, E., andSchneider, C.: A glacier inventory for the western Nyainqentanglha Range and the Nam CoBasin, Tibet, and glacier changes 1976–2009, The Cryosphere, 4, 419–433, doi:10.5194/tc-20
4-419-2010, 2010.Bolch, T., Pieczonka, T., and Benn, D. I.: Multi-decadal mass loss of glaciers in the Everest area
(Nepal Himalaya) derived from stereo imagery, The Cryosphere, 5, 349–358, doi:10.5194/tc-5-349-2011, 2011.
Bookhagen, B. and Burbank, D. W.: Towards a complete Himalayan hydrologic budget: the25
spatiotemporal distribution of snow melt and rainfall and their impact on river discharge,J. Geophys. Res., 115, F03019, doi:10.1029/2009jf001426, 2010.
Brohan, P., Kennedy, J. J., Harris, I., Tett, S. F. B., and Jones, P. D.: Uncertainty estimates inregional and global observed temperature changes: a new dataset from 1850, J. Geophys.Res., 111, D12106, doi:10.1029/2005JD006548, 2006.30
CGIAR-CSI, Consortium for Spatial Information: http://www.cgiar-csi.org, last access: 20February 2012.
2917
TCD7, 2891–2941, 2013
2001–2010 glacierchanges in the
Central KarakoramNational Park
U. Minora et al.
Title Page
Abstract Introduction
Conclusions References
Tables Figures
J I
J I
Back Close
Full Screen / Esc
Printer-friendly Version
Interactive Discussion
Discussion
Paper
|D
iscussionP
aper|
Discussion
Paper
|D
iscussionP
aper|
Chiew, F. H. S. and McMahon, T. A.: Detection of trend or change in annual flow of Australianrivers, Int. J. Climatol., 13, 643–653, 1993.
Citterio, M., Diolaiuti, G., Smiraglia, C., D’agata, C., Carnielli, T., Stella, G., and Siletto, G. B.:The fluctuations of Italian glaciers during the last century: a contribution to knowledge aboutAlpine glacier changes, Geogr. Ann. A, 89, 164–182, 2007.5
Cogley, J. G.: Geodetic and direct mass-balance measurements: comparison and joint analysis,Ann. Glaciol., 50, 96–100, 2009.
Copland, L., Sharp, M. J., and Dowdeswell, J. A.: The distribution and flow characteristics ofsurge-type glaciers in the Canadian High Arctic, Ann. Glaciol., 36, 73–81, 2003.
Copland, L., Pope, S., Bishop, M., Schroder Jr., J. F., Clendon, P., Bush, A., Kamp, U.,10
Seong, Y. B., and Owen, L.: Glacier velocities across the Central Karakoram, Ann. Glaciol.,50, 41–49, 2009.
Copland, L., Sylvestre, T., Bishop, M. P., Shroder, J. F., Seoung, Y. B., Owen, L. A., Bush, A.,and Kamp, U.: Expanded and Recently Increased Glacier Surging in the Karakoram, Instituteof Arctic and Alpine Reasearch (INSTAAR), University of Colorado, available at: http://www.15
bioone.org/doi/full/10.1657/1938-4246-43.4.503, 2011.Cuffey, K. M. and Paterson, W. S. B.: The Physics of Glaciers, 4th Edn., ISBN: 9780123694614,
Pergamon Press, Oxford, UK, 2010.Desio, A.: Italian Expeditions to the Karakorum (K2) and Hindu Kush, in: Leader II, vol. 1, edited
by: Marussi, A., E. J. Brill, Leiden, 1964.20
Diolaiuti, G., Pecci, M., and Smiraglia, C.: Liligo Glacier (Karakoram): reconstruction of therecent history of a surge-type glacier, Ann. Glaciol., 36, 168–172, 2003.
Diolaiuti, G., Maragno, D., D’Agata, C., Smiraglia, C., and Bocchiola, D.: A contribution to theknowledge ofthe last fifty years of Alpine glacier history: the 1954–2003 area and geometrychanges of Dosde Piazzi glaciers (Lombardy–Alps, Italy), Prog. Phys. Geogr., 35, 161–182,25
2011.Diolaiuti, G., Bocchiola, D., D’agata, C., and Smiraglia, C.: Evidence of climate change impact
upon glaciers’ recession within the Italian Alps: the case of Lombardy glaciers, Theor. Appl.Climatol., 109, 429–445, doi:10.1007/s00704-012-0589-y, 2012a.
Diolaiuti, G., Bocchiola, D., Vagliasindi, M., D’agata, C., and Smiraglia, C.: The 1975–200530
glacier changes in Aosta Valley (Italy) and the relations with climate evolution, Prog. Phys.Geogr., 36, 764–785, doi:10.1177/0309133312456413, 2012b.
2918
TCD7, 2891–2941, 2013
2001–2010 glacierchanges in the
Central KarakoramNational Park
U. Minora et al.
Title Page
Abstract Introduction
Conclusions References
Tables Figures
J I
J I
Back Close
Full Screen / Esc
Printer-friendly Version
Interactive Discussion
Discussion
Paper
|D
iscussionP
aper|
Discussion
Paper
|D
iscussionP
aper|
ESA, European Space Agency: http://www.esa-glaciers-cci.org/index.php?q=overview, lastaccess: 15 April 2013.
Fowler, H. J. and Archer, D. R.: Conflicting signals of climatic change in the Upper Indus basin,J. Climate, 19, 4276–4293, 2006.
Fujita, K. and Nuimura, T.: Spatially heterogeneous wastage of Himalayan glaciers, P. Natl.5
Acad. Sci. USA, 108, 14011–14014, 2011.Gan, T. Y.: Hydroclimatic trends and possible climatic warming in the Canadian prairies, Water
Resour. Res., 34, 3009–3015, 1998.Gardelle, J., Berthier, E., and Arnaud, Y.: Slight mass gain of Karakoram glaciers in the early
twenty-first century, Nat. Geosci. Letters, 5, 322–325, doi:10.1038/NGEO1450, 2012.10
Gardelle, J., Berthier, E., Arnaud, Y., and Kaab, A.: Region-wide glacier mass balances overthe Pamir-Karakoram-Himalaya during 1999–2011, The Cryosphere Discuss., 7, 975–1028,doi:10.5194/tcd-7-975-2013, 2013.
Haeberli, W.: Integrated perception of glacier changes: a challenge of historical dimensions,in: Glacier Science and Environmental Change, edited by: Knight, P. G., Blackwell, Oxford,15
423–430, 2006.Hewitt, K.: The Karakoram Anomaly? Glacier expansion and the “elevation effect”, Karakoram
Himalaya, Mt. Res. Dev., 25, 332–340, 2005.Hewitt, K.: Tributary glacier surges: an exceptional concentration at Panmah Glacier, Karako-
ram, Himalaya, J. Glaciol., 53, 181–188. doi:10.3189/172756507782202829, 2007.20
Hirsch, R. M. and Slack, J. R.: Non-parametric trend test for seasonal data with serial depen-dence, Water Resour. Res., 20, 727–732, 1984.
Hurrell, J. W.: Decadal trends in the North Atlantic Oscillation regional temperatures and pre-cipitation, Science, 269, 676–679, 1995.
Immerzeel, W. W., van Beek, L. P. H., and Bierkens, M. F. P.: Climate change will affect the25
Asian water towers, Science, 328, 1382–1385, 2010.Intergovernmental Panel on Climate Change (IPCC): Climate Change, 2001, The Scientific
Basis. Contribution of Working Group II to the Third Assessment Report of the Intergovern-mental Panel on Climate Change, Cambridge University Press, Cambridge, 2001.
Intergovernmental Panel on Climate Change (IPCC): IPCC Fourth Assessment Report: Climate30
Change 2007, Synthesis Report (AR4), WMO-UNEP, Geneva, 2007.Jiang, T., Su, B., and Hartmann, H.: Temporal and spatial trends of precipitation and river flow
in the Yangtze River Basin, 1961–2000, Geomorphology, 85, 143–154, 2007.
2919
TCD7, 2891–2941, 2013
2001–2010 glacierchanges in the
Central KarakoramNational Park
U. Minora et al.
Title Page
Abstract Introduction
Conclusions References
Tables Figures
J I
J I
Back Close
Full Screen / Esc
Printer-friendly Version
Interactive Discussion
Discussion
Paper
|D
iscussionP
aper|
Discussion
Paper
|D
iscussionP
aper|
Jones, P. D., Jonsson, T., and Wheeler, D.: Extension to the North Atlantic Oscillation using earlyinstrumental pressure observations from Gibraltar and South–West Iceland, Int. J. Climatol.,17, 1433–1450, 1997.
Kaab, A., Paul, F., Maisch, M., Hoelzle, M., and Haeberli, W.: The new remote sensing derivedSwiss glacier inventory: II. First results, Ann. Glaciol., 34, 362–366, 2002.5
Kaab, A., Huggel, C., Fischer, L., Guex, S., Paul, F., Roer, I., Salzmann, N., Schlaefli, S.,Schmutz, K., Schneider, D., Strozzi, T., and Weidmann, Y.: Remote sensing of glacier- andpermafrost-related hazards in high mountains: an overview, Nat. Hazards Earth Syst. Sci.,5, 527–554, doi:10.5194/nhess-5-527-2005, 2005.
Kaab, A., Berthier, E., Nuth, C., Gardelle, J., and Arnaud, Y.: Contrasting patterns of early10
twenty-first-century glacier mass change in the Himalayas, Nature Letter, 488, 495–498,doi:10.1038/nature11324, 2012.
Kahlown, M. A., Raoof, A., Zubair, M., and Kemper, W. D.: Water use efficiency and economicfeasibility of growing rice and wheat with sprinkler irrigation in the Indus Basin of Pakistan,Agr. Water Manage., 8, 292–298, 2007.15
Kaser, G., Fountain, A., and Jansson, P.: A Manual for Monitoring the Mass Balance of MountainGlaciers, International Hydrological Programme Technical Documents in Hydrology No. 59,UNESCO, Paris, 2003.
Kehrwald, N. M., Thompson, L. G., Tandong, Y., Mosley-Thompson, E., Schotterer, U., Alfi-mov, V., Beer, J., Eikenberg, J., and Davis, M. E.: Mass loss on Himalayan glacier endangers20
water resources, Geophys. Res. Lett., 35, L22503, doi:10.1029/2008GL035556, 2008.Kendall, M. G.: Rank Correlation Methods, Oxford Univ. Press, New York, 1975.Landsat7 Handbook: http://landsathandbook.gsfc.nasa.gov/, http://lpdaac.usgs.gov, last ac-
cess: 17 April 2013.Lettenmaier, D. P., Wood, E. F., and Wallis, J. R.: Hydro-climatological trends in the continental25
United States, 1948–88, J. Climate, 7, 586–607, 1994.Manley, W. F.: Geospatial inventory and analysis of glaciers: a case study for the eastern Alaska
Range, in: Satellite Image Atlas of Glaciers of the World, edited by: Williams Jr, R. S. andFerrigno, J. G., Professional Paper 1386-K, K424–K439, US Geological Survey, 2005.
Mann, H. B.: Nonparametric tests against trend, Econometrica, 13, 245–259, 1945.30
Mattson, L. E., Gardner, J. S., and Young, G. J.: Ablation on debris covered glaciers: an ex-ample from the Rakhiot Glacier, Punjab, Himalaya, in: Snow and Glacier Hydrology, Proc.
2920
TCD7, 2891–2941, 2013
2001–2010 glacierchanges in the
Central KarakoramNational Park
U. Minora et al.
Title Page
Abstract Introduction
Conclusions References
Tables Figures
J I
J I
Back Close
Full Screen / Esc
Printer-friendly Version
Interactive Discussion
Discussion
Paper
|D
iscussionP
aper|
Discussion
Paper
|D
iscussionP
aper|
Kathmandu Symp., November 1992, edited by: Young, G. J., IAHS Publ. no. 218, IAHS Pub-lishing, Wallingford, 289–296, 1993.
Mayer, C., Lambrecht, A., Belo, M, Smiraglia, C., and Diolaiuti, G.: Glaciological characteristicsof the ablation zone of Baltoro Glacier, Karakoram, Ann. Glaciol., 43, 123–131, 2006.
Mayer, C., Fowler, A. C., Lambrecht, A., and Scharrer, K.: A surge of North Gasherbrum Glacier,5
Karakoram, China, J. Glaciol., 57, 904–916, 2011.Mihalcea, C., Mayer, C., Diolaiuti, G., Lambrecht, A., Smiraglia, C., and Tartari, G.: Ice ablation
and meteorological conditions on the debris covered area of Baltoro Glacier (Karakoram,Pakistan), Ann. Glaciol., 43, 292–300, 2006.
NSIDC, National Snow and Ice Data Center: http://nsidc.org, last access: 13 March 2013.10
O’Gorman, L.: Subpixel precision of straight-edged shapes for registration and measure-ment, IEEE Transactions on Pattern Analysis and Machine Intelligence, 18, 746–751,doi:10.1109/34.506796, 1996.
Osborn, T. J.: Simulating the Winter North Atlantic Oscillation: the roles of internal variabilityand greenhouse gas forcing, Clim. Dynam., 22, 605–623, 2004.15
Osborn, T. J.: Recent variations in the Winter North Atlantic Oscillation, Weather, 61, 353–355,2006.
Pan, B. T., Zhang, G. L., Wang, J., Cao, B., Geng, H. P., Wang, J., Zhang, C., and Ji, Y. P.:Glacier changes from 1966–2009 in the Gongga Mountains, on the south-eastern marginof the Qinghai-Tibetan Plateau and their climatic forcing, The Cryosphere, 6, 1087–1101,20
doi:10.5194/tc-6-1087-2012, 2012.Parajka, J. and Bloschl, G.: MODIS-based snow cover products, validation, and hydrologic ap-
plications, in: Multiscale Hydrologic Remote Sensing Perspectives and Applications, editedby: Chang, Y. and Ni-Bin, H., CRC Press, 185–212, Print ISBN 978-1-4398-7745-6, 2012.
Parajka, J., Holko, L., Kostka, Z., and Bloschl, G.: MODIS snow cover mapping accuracy in25
a small mountain catchment – comparison between open and forest sites, Hydrol. EarthSyst. Sci., 16, 2365–2377, doi:10.5194/hess-16-2365-2012, 2012.
Paul, F., Huggel, C., and Kaab, A.: Combining satellite multispectral image data and a digitalelevation model for mapping debris-covered glaciers, Rem. Sens. Environ., 89, 510–518,2004a.30
Paul, F., Kaab, A., Maisch, M., Kellenberger, T., and Haeberli, W.: Rapid disintegra-tion of Alpine glaciers observed with satellite data, Geophys. Res. Lett., 31, L21402,doi:10.1029/2004GL020816, 2004b.
2921
TCD7, 2891–2941, 2013
2001–2010 glacierchanges in the
Central KarakoramNational Park
U. Minora et al.
Title Page
Abstract Introduction
Conclusions References
Tables Figures
J I
J I
Back Close
Full Screen / Esc
Printer-friendly Version
Interactive Discussion
Discussion
Paper
|D
iscussionP
aper|
Discussion
Paper
|D
iscussionP
aper|
Paul, F., Barry, R. G., Cogley, J. G., Frey, H., Haeberli, W., Ohmura, A., Ommanney, C. S. L.,Raup, B., Rivera, A., and Zemp, M.: Guidelines for the compilation of glacier inventory datafrom digital sources, Ann. Glaciol., 50, 119–126, 2010.
Peel, M. C., Finlayson, B. L., and McMahon, T. A.: Updated world map of the Koppen-Geigerclimate classification, Hydrol. Earth Syst. Sci., 11, 1633–1644, doi:10.5194/hess-11-1633-5
2007, 2007.Python: http://www.python.org/, last access: 13 March 2013.Racoviteanu, A. E., Arnaud, Y., Williams, M. W., and Ordonez, J.: Decadal changes in glacier
parameters in the Cordillera Blanca, Peru, derived from remote sensing, J. Glaciol., 54, 499–510, 2008a.10
Salerno, F., Buraschi, E., Bruccoleri, D., Tartari, G., and Smiraglia, C.: Glacier surface-areachanges in Sagarmartha national park, Nepal, in the second half of the 20th century, bycomparison of historical maps, J. Glaciol., 54, 738–752, 2008.
Seidou, O. and Ouarda, T. B. M. J.: Recursion-based multiple changepoint detection in multiplelinear regression and application to river stream flows, Water Resour. Res., 43, W07404,15
doi:10.1029/2006WR005021, 2007.Shroder, J. F., Jr., Owen, L. A., Seong, Y. B., Bishop, M. P., Bush, A., Caffee, M. W., Copland,
L., Finkel, R. C., and Kamp, U.: The role of mass movements on landscape evolution inthe Central Karakoram: Discussion and speculation, Quaternary International, 236, 34–47,doi:10.1016/j.quaint.2010.05.024, 201020
Smiraglia, C., Mayer, C., Mihalcea, C., Diolaiuti, G., Belo, M., and Vassena, G.: Ongoing varia-tions of Himalayan and Karakoram glaciers as witnesses of global changes: recent studiesof selected glaciers, Developments in Earth Surface Processes, 10, 235–248, 2007.
Tahir, A. A., Chevallier, P., Arnaud, Y., and Ahmad, B.: Snow cover dynamics and hydrologicalregime of the Hunza River basin, Karakoram Range, Northern Pakistan, Hydrol. Earth Syst.25
Sci., 15, 2275–2290, doi:10.5194/hess-15-2275-2011, 2011.Vogtle, T. and Schilling, K. J.: Digitizing maps, in: GIS for Environmental Monitoring, edited by:
Bahr, H.-P. and Vogtle, T., Schweizerbart, Stuttgart, Germany, 201–216, 1999.Wang, W., Van Gelder, P. H. A. J. M., and Vrijling, J. K.: Trend and stationarity analysis for
streamflow processes of rivers in western Europe in the 20th century, Proceedings: IWA30
International Conference on Water Economics, Statistics and Finance, Rethymno, Greece,8–10 July, 2005.
2922
TCD7, 2891–2941, 2013
2001–2010 glacierchanges in the
Central KarakoramNational Park
U. Minora et al.
Title Page
Abstract Introduction
Conclusions References
Tables Figures
J I
J I
Back Close
Full Screen / Esc
Printer-friendly Version
Interactive Discussion
Discussion
Paper
|D
iscussionP
aper|
Discussion
Paper
|D
iscussionP
aper|
Weiers, S.: Zur Klimatologie des NW-Karakoram und angrenzender Gebiete. Statistische Anal-ysen unter Einbeziehung von Wettersatellitenbildern und eines Geographischen Informationsystems (GIS), Bonner Geographische Abhandlungen, 92, Geographisches Institut, Univer-sitat Bonn, Bonn, Germany, 1995.
Winiger, M., Gumpert, M., and Yamout, H.: Karakoram–Hindukush–western Himalaya: assess-5
ing high-altitude water resources, Hydrol. Process., 19, 2329–2338, 2005.World Glacier Monitoring Service (WGMS): available at: http://www.wgms.ch/dataexp.html,
2012.Wulf, H., Bookhagen, B., and Scherler, D.: Seasonal precipitation gradients and their impact on
fluvial sediment flux in the Northwest Himalaya, Geomorphology, 118, 13–21, 2010.10
Yue, S. and Wang, C. Y.: Applicability of pre-whitening to eliminate the influenceof serial correlation on the Mann–Kendall test, Water Resour. Res., 38, 4-1–4-7,doi:10.1029/2001WR000861, 2002.
Zhang, X., Vincent, L. A., Hogg, W. D., and Niitsoo, A.: Temperature and precipitation trends inCanada during the 20th century, Atmos. Ocean, 38, 395–429, 2000.15
2923
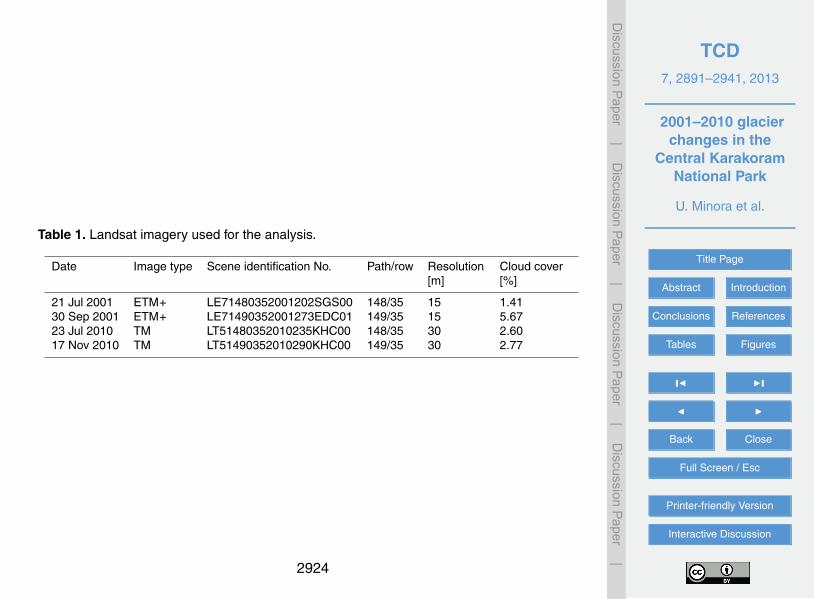
TCD7, 2891–2941, 2013
2001–2010 glacierchanges in the
Central KarakoramNational Park
U. Minora et al.
Title Page
Abstract Introduction
Conclusions References
Tables Figures
J I
J I
Back Close
Full Screen / Esc
Printer-friendly Version
Interactive Discussion
Discussion
Paper
|D
iscussionP
aper|
Discussion
Paper
|D
iscussionP
aper|
Table 1. Landsat imagery used for the analysis.
Date Image type Scene identification No. Path/row Resolution[m]
Cloud cover[%]
21 Jul 2001 ETM+ LE71480352001202SGS00 148/35 15 1.4130 Sep 2001 ETM+ LE71490352001273EDC01 149/35 15 5.6723 Jul 2010 TM LT51480352010235KHC00 148/35 30 2.6017 Nov 2010 TM LT51490352010290KHC00 149/35 30 2.77
2924
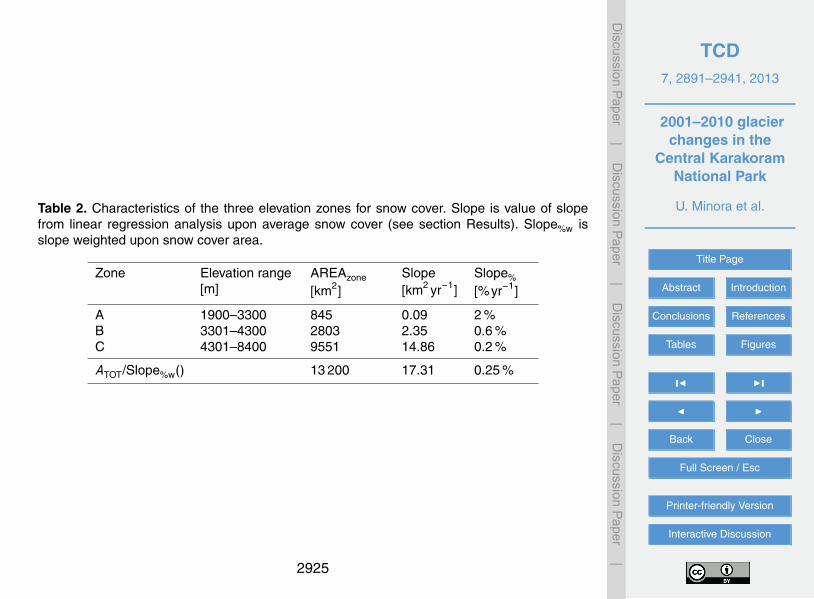
TCD7, 2891–2941, 2013
2001–2010 glacierchanges in the
Central KarakoramNational Park
U. Minora et al.
Title Page
Abstract Introduction
Conclusions References
Tables Figures
J I
J I
Back Close
Full Screen / Esc
Printer-friendly Version
Interactive Discussion
Discussion
Paper
|D
iscussionP
aper|
Discussion
Paper
|D
iscussionP
aper|
Table 2. Characteristics of the three elevation zones for snow cover. Slope is value of slopefrom linear regression analysis upon average snow cover (see section Results). Slope%w isslope weighted upon snow cover area.
Zone Elevation range[m]
AREAzone
[km2]Slope[km2 yr−1]
Slope%
[%yr−1]
A 1900–3300 845 0.09 2 %B 3301–4300 2803 2.35 0.6 %C 4301–8400 9551 14.86 0.2 %
ATOT/Slope%w() 13 200 17.31 0.25 %
2925
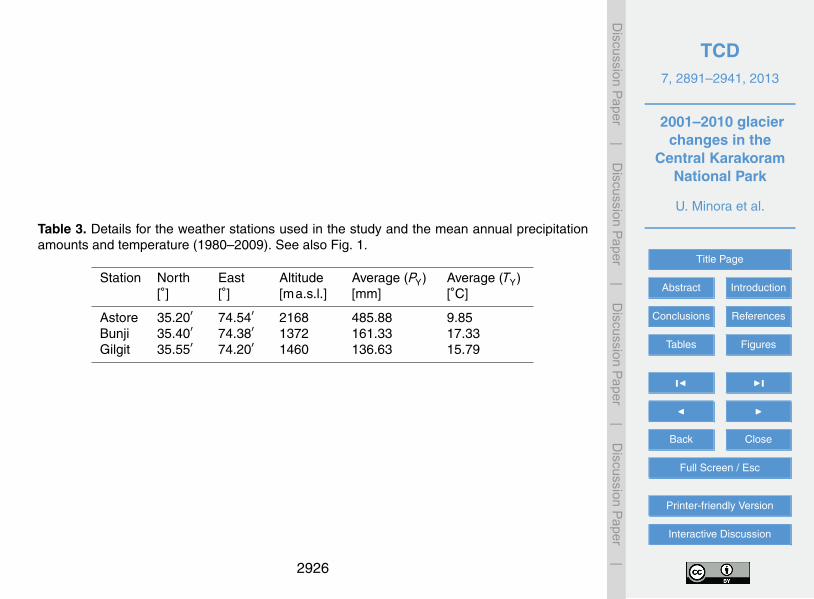
TCD7, 2891–2941, 2013
2001–2010 glacierchanges in the
Central KarakoramNational Park
U. Minora et al.
Title Page
Abstract Introduction
Conclusions References
Tables Figures
J I
J I
Back Close
Full Screen / Esc
Printer-friendly Version
Interactive Discussion
Discussion
Paper
|D
iscussionP
aper|
Discussion
Paper
|D
iscussionP
aper|
Table 3. Details for the weather stations used in the study and the mean annual precipitationamounts and temperature (1980–2009). See also Fig. 1.
Station North[◦]
East[◦]
Altitude[ma.s.l.]
Average (PY)[mm]
Average (TY)[◦C]
Astore 35.20′ 74.54′ 2168 485.88 9.85Bunji 35.40′ 74.38′ 1372 161.33 17.33Gilgit 35.55′ 74.20′ 1460 136.63 15.79
2926
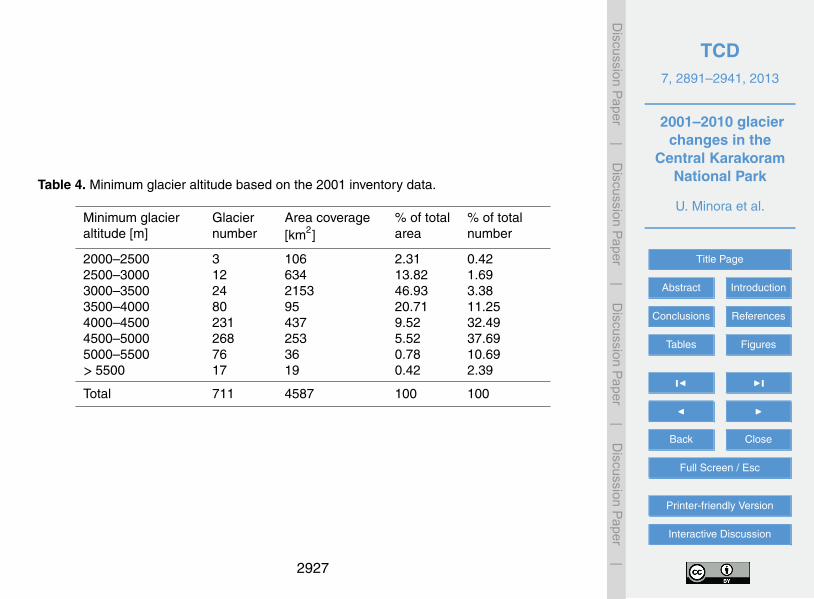
TCD7, 2891–2941, 2013
2001–2010 glacierchanges in the
Central KarakoramNational Park
U. Minora et al.
Title Page
Abstract Introduction
Conclusions References
Tables Figures
J I
J I
Back Close
Full Screen / Esc
Printer-friendly Version
Interactive Discussion
Discussion
Paper
|D
iscussionP
aper|
Discussion
Paper
|D
iscussionP
aper|
Table 4. Minimum glacier altitude based on the 2001 inventory data.
Minimum glacieraltitude [m]
Glaciernumber
Area coverage[km2]
% of totalarea
% of totalnumber
2000–2500 3 106 2.31 0.422500–3000 12 634 13.82 1.693000–3500 24 2153 46.93 3.383500–4000 80 95 20.71 11.254000–4500 231 437 9.52 32.494500–5000 268 253 5.52 37.695000–5500 76 36 0.78 10.69> 5500 17 19 0.42 2.39
Total 711 4587 100 100
2927
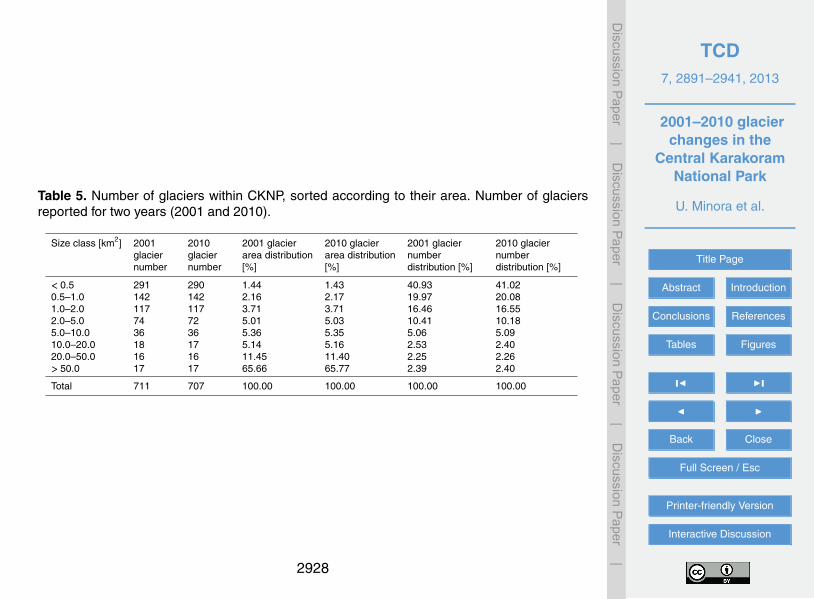
TCD7, 2891–2941, 2013
2001–2010 glacierchanges in the
Central KarakoramNational Park
U. Minora et al.
Title Page
Abstract Introduction
Conclusions References
Tables Figures
J I
J I
Back Close
Full Screen / Esc
Printer-friendly Version
Interactive Discussion
Discussion
Paper
|D
iscussionP
aper|
Discussion
Paper
|D
iscussionP
aper|
Table 5. Number of glaciers within CKNP, sorted according to their area. Number of glaciersreported for two years (2001 and 2010).
Size class [km2] 2001glaciernumber
2010glaciernumber
2001 glacierarea distribution[%]
2010 glacierarea distribution[%]
2001 glaciernumberdistribution [%]
2010 glaciernumberdistribution [%]
< 0.5 291 290 1.44 1.43 40.93 41.020.5–1.0 142 142 2.16 2.17 19.97 20.081.0–2.0 117 117 3.71 3.71 16.46 16.552.0–5.0 74 72 5.01 5.03 10.41 10.185.0–10.0 36 36 5.36 5.35 5.06 5.0910.0–20.0 18 17 5.14 5.16 2.53 2.4020.0–50.0 16 16 11.45 11.40 2.25 2.26> 50.0 17 17 65.66 65.77 2.39 2.40
Total 711 707 100.00 100.00 100.00 100.00
2928
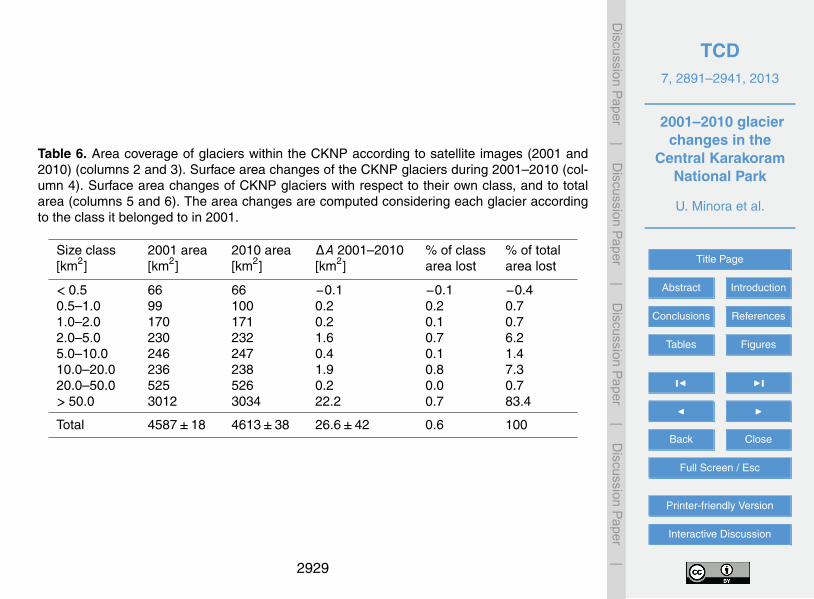
TCD7, 2891–2941, 2013
2001–2010 glacierchanges in the
Central KarakoramNational Park
U. Minora et al.
Title Page
Abstract Introduction
Conclusions References
Tables Figures
J I
J I
Back Close
Full Screen / Esc
Printer-friendly Version
Interactive Discussion
Discussion
Paper
|D
iscussionP
aper|
Discussion
Paper
|D
iscussionP
aper|
Table 6. Area coverage of glaciers within the CKNP according to satellite images (2001 and2010) (columns 2 and 3). Surface area changes of the CKNP glaciers during 2001–2010 (col-umn 4). Surface area changes of CKNP glaciers with respect to their own class, and to totalarea (columns 5 and 6). The area changes are computed considering each glacier accordingto the class it belonged to in 2001.
Size class[km2]
2001 area[km2]
2010 area[km2]
∆A 2001–2010[km2]
% of classarea lost
% of totalarea lost
< 0.5 66 66 −0.1 −0.1 −0.40.5–1.0 99 100 0.2 0.2 0.71.0–2.0 170 171 0.2 0.1 0.72.0–5.0 230 232 1.6 0.7 6.25.0–10.0 246 247 0.4 0.1 1.410.0–20.0 236 238 1.9 0.8 7.320.0–50.0 525 526 0.2 0.0 0.7> 50.0 3012 3034 22.2 0.7 83.4
Total 4587±18 4613±38 26.6±42 0.6 100
2929
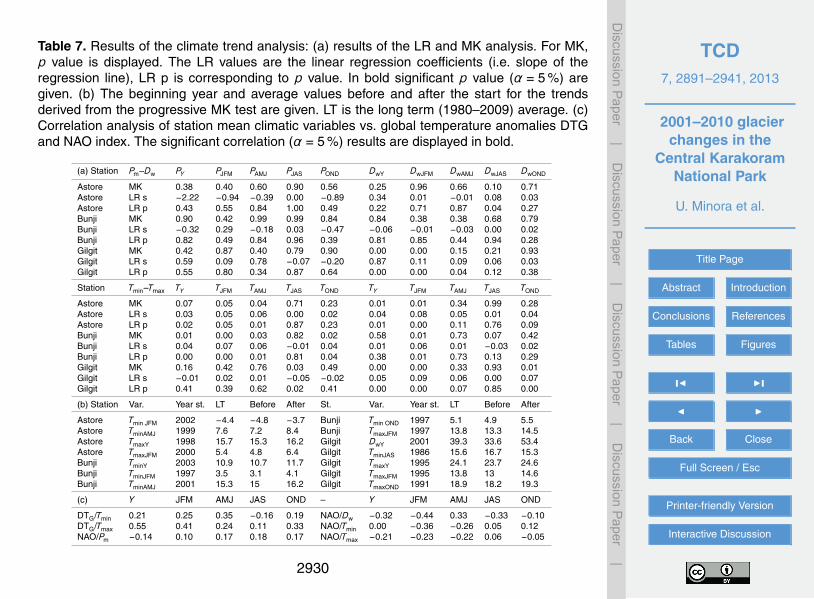
TCD7, 2891–2941, 2013
2001–2010 glacierchanges in the
Central KarakoramNational Park
U. Minora et al.
Title Page
Abstract Introduction
Conclusions References
Tables Figures
J I
J I
Back Close
Full Screen / Esc
Printer-friendly Version
Interactive Discussion
Discussion
Paper
|D
iscussionP
aper|
Discussion
Paper
|D
iscussionP
aper|
Table 7. Results of the climate trend analysis: (a) results of the LR and MK analysis. For MK,p value is displayed. The LR values are the linear regression coefficients (i.e. slope of theregression line), LR p is corresponding to p value. In bold significant p value (α = 5 %) aregiven. (b) The beginning year and average values before and after the start for the trendsderived from the progressive MK test are given. LT is the long term (1980–2009) average. (c)Correlation analysis of station mean climatic variables vs. global temperature anomalies DTGand NAO index. The significant correlation (α = 5 %) results are displayed in bold.
(a) Station Pm–Dw PY PJFM PAMJ PJAS POND DwY DwJFM DwAMJ DwJAS DwOND
Astore MK 0.38 0.40 0.60 0.90 0.56 0.25 0.96 0.66 0.10 0.71Astore LR s −2.22 −0.94 −0.39 0.00 −0.89 0.34 0.01 −0.01 0.08 0.03Astore LR p 0.43 0.55 0.84 1.00 0.49 0.22 0.71 0.87 0.04 0.27Bunji MK 0.90 0.42 0.99 0.99 0.84 0.84 0.38 0.38 0.68 0.79Bunji LR s −0.32 0.29 −0.18 0.03 −0.47 −0.06 −0.01 −0.03 0.00 0.02Bunji LR p 0.82 0.49 0.84 0.96 0.39 0.81 0.85 0.44 0.94 0.28Gilgit MK 0.42 0.87 0.40 0.79 0.90 0.00 0.00 0.15 0.21 0.93Gilgit LR s 0.59 0.09 0.78 −0.07 −0.20 0.87 0.11 0.09 0.06 0.03Gilgit LR p 0.55 0.80 0.34 0.87 0.64 0.00 0.00 0.04 0.12 0.38
Station Tmin–Tmax TY TJFM TAMJ TJAS TOND TY TJFM TAMJ TJAS TOND
Astore MK 0.07 0.05 0.04 0.71 0.23 0.01 0.01 0.34 0.99 0.28Astore LR s 0.03 0.05 0.06 0.00 0.02 0.04 0.08 0.05 0.01 0.04Astore LR p 0.02 0.05 0.01 0.87 0.23 0.01 0.00 0.11 0.76 0.09Bunji MK 0.01 0.00 0.03 0.82 0.02 0.58 0.01 0.73 0.07 0.42Bunji LR s 0.04 0.07 0.06 −0.01 0.04 0.01 0.06 0.01 −0.03 0.02Bunji LR p 0.00 0.00 0.01 0.81 0.04 0.38 0.01 0.73 0.13 0.29Gilgit MK 0.16 0.42 0.76 0.03 0.49 0.00 0.00 0.33 0.93 0.01Gilgit LR s −0.01 0.02 0.01 −0.05 −0.02 0.05 0.09 0.06 0.00 0.07Gilgit LR p 0.41 0.39 0.62 0.02 0.41 0.00 0.00 0.07 0.85 0.00
(b) Station Var. Year st. LT Before After St. Var. Year st. LT Before After
Astore Tmin JFM 2002 −4.4 −4.8 −3.7 Bunji Tmin OND 1997 5.1 4.9 5.5Astore TminAMJ 1999 7.6 7.2 8.4 Bunji TmaxJFM 1997 13.8 13.3 14.5Astore TmaxY 1998 15.7 15.3 16.2 Gilgit DwY 2001 39.3 33.6 53.4Astore TmaxJFM 2000 5.4 4.8 6.4 Gilgit TminJAS 1986 15.6 16.7 15.3Bunji TminY 2003 10.9 10.7 11.7 Gilgit TmaxY 1995 24.1 23.7 24.6Bunji TminJFM 1997 3.5 3.1 4.1 Gilgit TmaxJFM 1995 13.8 13 14.6Bunji TminAMJ 2001 15.3 15 16.2 Gilgit TmaxOND 1991 18.9 18.2 19.3
(c) Y JFM AMJ JAS OND – Y JFM AMJ JAS OND
DTG/Tmin 0.21 0.25 0.35 −0.16 0.19 NAO/Dw −0.32 −0.44 0.33 −0.33 −0.10DTG/Tmax 0.55 0.41 0.24 0.11 0.33 NAO/Tmin 0.00 −0.36 −0.26 0.05 0.12NAO/Pm −0.14 0.10 0.17 0.18 0.17 NAO/Tmax −0.21 −0.23 −0.22 0.06 −0.05
2930
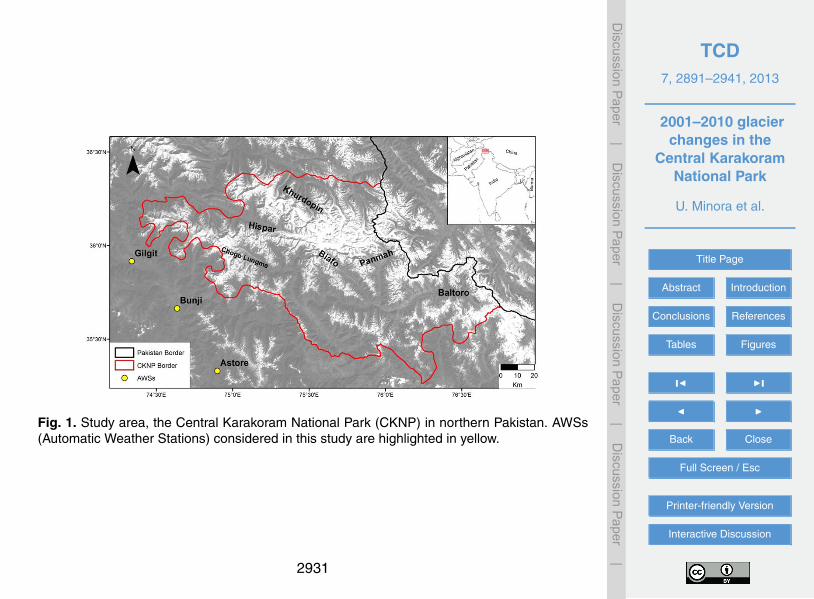
TCD7, 2891–2941, 2013
2001–2010 glacierchanges in the
Central KarakoramNational Park
U. Minora et al.
Title Page
Abstract Introduction
Conclusions References
Tables Figures
J I
J I
Back Close
Full Screen / Esc
Printer-friendly Version
Interactive Discussion
Discussion
Paper
|D
iscussionP
aper|
Discussion
Paper
|D
iscussionP
aper|
Fig. 1. Study area, the Central Karakoram National Park (CKNP) in northern Pakistan. AWSs(Automatic Weather Stations) considered in this study are highlighted in yellow.
2931
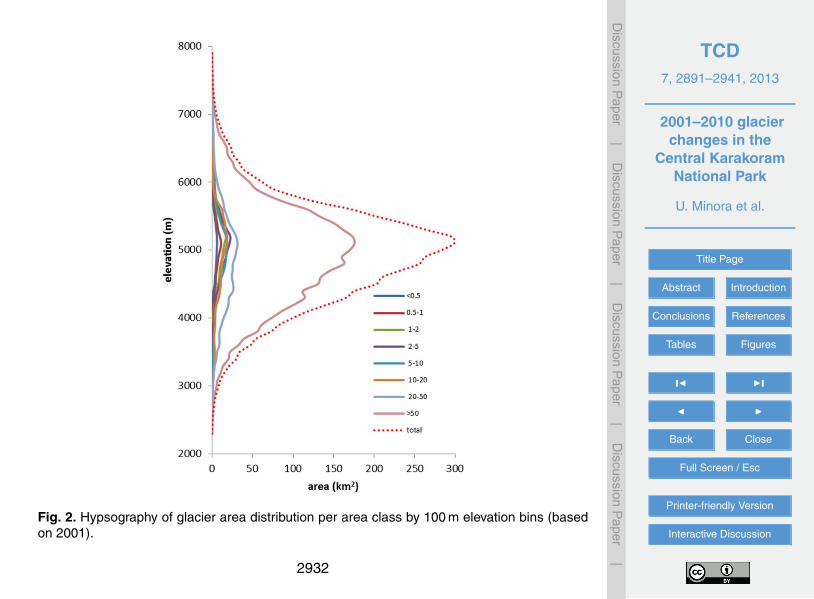
TCD7, 2891–2941, 2013
2001–2010 glacierchanges in the
Central KarakoramNational Park
U. Minora et al.
Title Page
Abstract Introduction
Conclusions References
Tables Figures
J I
J I
Back Close
Full Screen / Esc
Printer-friendly Version
Interactive Discussion
Discussion
Paper
|D
iscussionP
aper|
Discussion
Paper
|D
iscussionP
aper|
Fig. 2. Hypsography of glacier area distribution per area class by 100 m elevation bins (basedon 2001).
2932
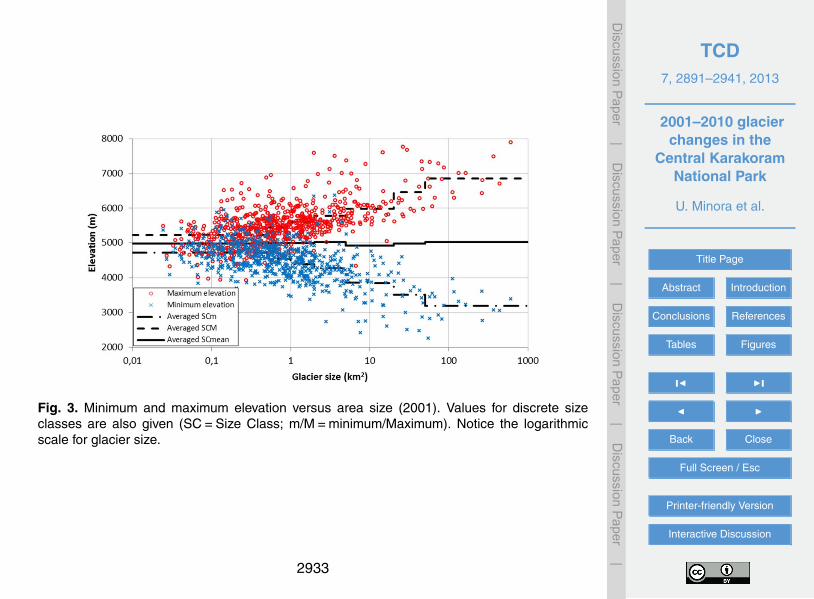
TCD7, 2891–2941, 2013
2001–2010 glacierchanges in the
Central KarakoramNational Park
U. Minora et al.
Title Page
Abstract Introduction
Conclusions References
Tables Figures
J I
J I
Back Close
Full Screen / Esc
Printer-friendly Version
Interactive Discussion
Discussion
Paper
|D
iscussionP
aper|
Discussion
Paper
|D
iscussionP
aper|
Fig. 3. Minimum and maximum elevation versus area size (2001). Values for discrete sizeclasses are also given (SC=Size Class; m/M=minimum/Maximum). Notice the logarithmicscale for glacier size.
2933
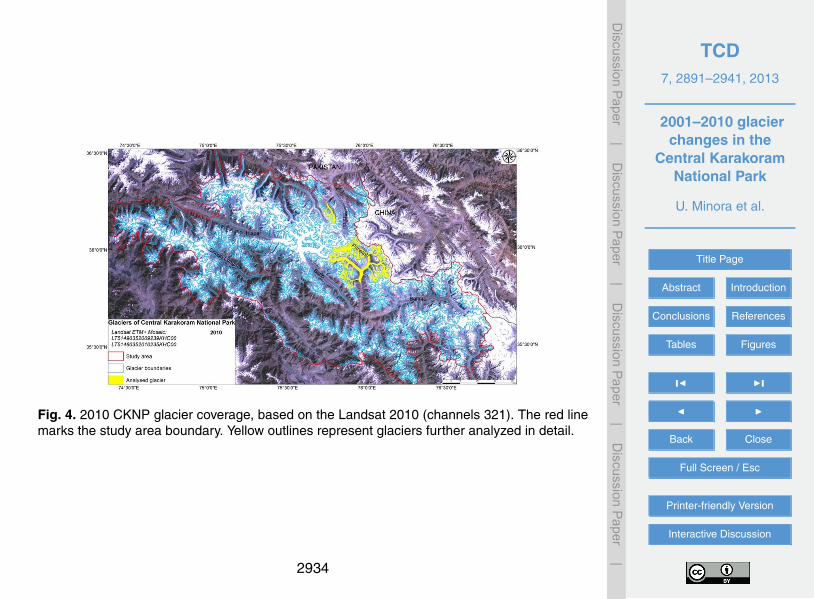
TCD7, 2891–2941, 2013
2001–2010 glacierchanges in the
Central KarakoramNational Park
U. Minora et al.
Title Page
Abstract Introduction
Conclusions References
Tables Figures
J I
J I
Back Close
Full Screen / Esc
Printer-friendly Version
Interactive Discussion
Discussion
Paper
|D
iscussionP
aper|
Discussion
Paper
|D
iscussionP
aper|
Fig. 4. 2010 CKNP glacier coverage, based on the Landsat 2010 (channels 321). The red linemarks the study area boundary. Yellow outlines represent glaciers further analyzed in detail.
2934
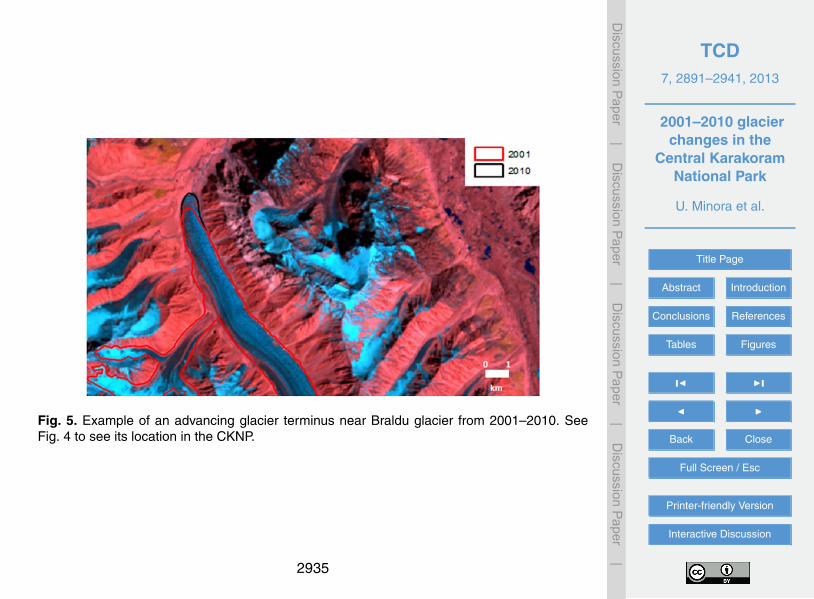
TCD7, 2891–2941, 2013
2001–2010 glacierchanges in the
Central KarakoramNational Park
U. Minora et al.
Title Page
Abstract Introduction
Conclusions References
Tables Figures
J I
J I
Back Close
Full Screen / Esc
Printer-friendly Version
Interactive Discussion
Discussion
Paper
|D
iscussionP
aper|
Discussion
Paper
|D
iscussionP
aper|
Fig. 5. Example of an advancing glacier terminus near Braldu glacier from 2001–2010. SeeFig. 4 to see its location in the CKNP.
2935
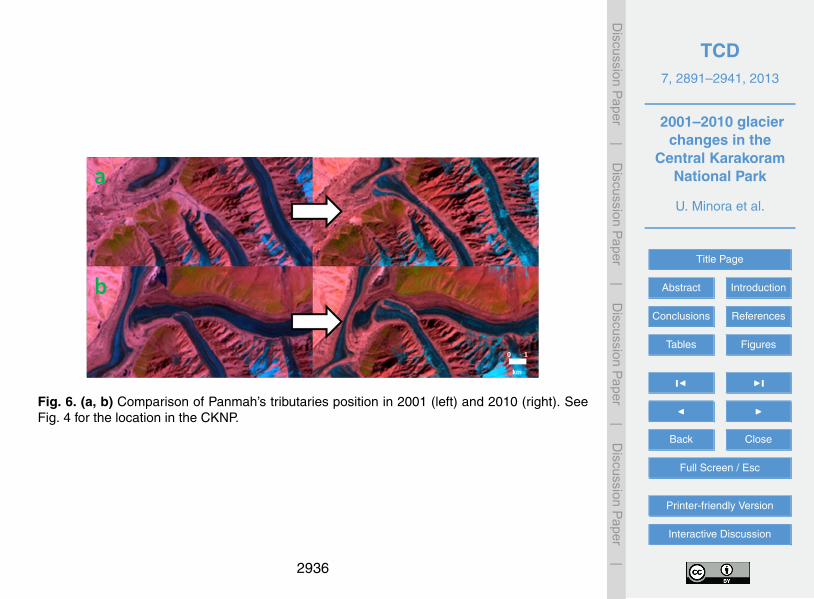
TCD7, 2891–2941, 2013
2001–2010 glacierchanges in the
Central KarakoramNational Park
U. Minora et al.
Title Page
Abstract Introduction
Conclusions References
Tables Figures
J I
J I
Back Close
Full Screen / Esc
Printer-friendly Version
Interactive Discussion
Discussion
Paper
|D
iscussionP
aper|
Discussion
Paper
|D
iscussionP
aper|
Fig. 6. (a, b) Comparison of Panmah’s tributaries position in 2001 (left) and 2010 (right). SeeFig. 4 for the location in the CKNP.
2936
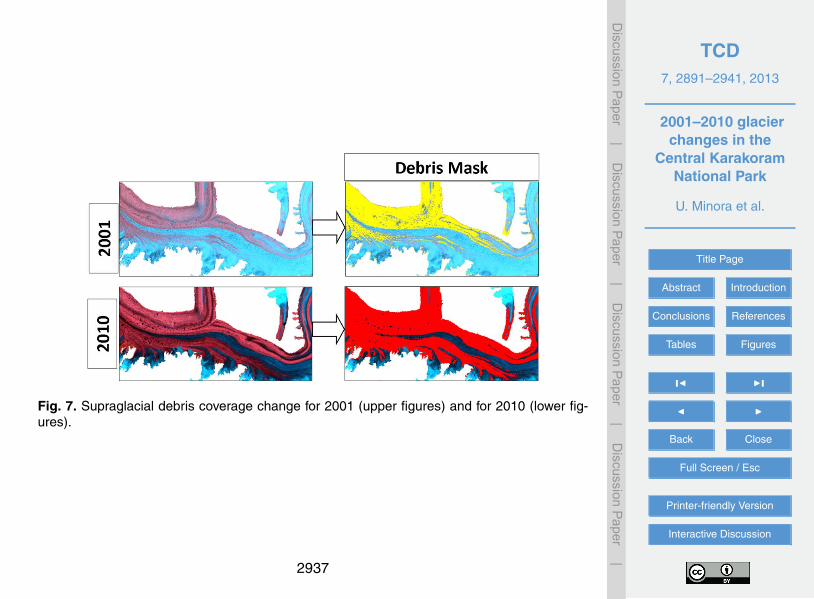
TCD7, 2891–2941, 2013
2001–2010 glacierchanges in the
Central KarakoramNational Park
U. Minora et al.
Title Page
Abstract Introduction
Conclusions References
Tables Figures
J I
J I
Back Close
Full Screen / Esc
Printer-friendly Version
Interactive Discussion
Discussion
Paper
|D
iscussionP
aper|
Discussion
Paper
|D
iscussionP
aper|
Fig. 7. Supraglacial debris coverage change for 2001 (upper figures) and for 2010 (lower fig-ures).
2937
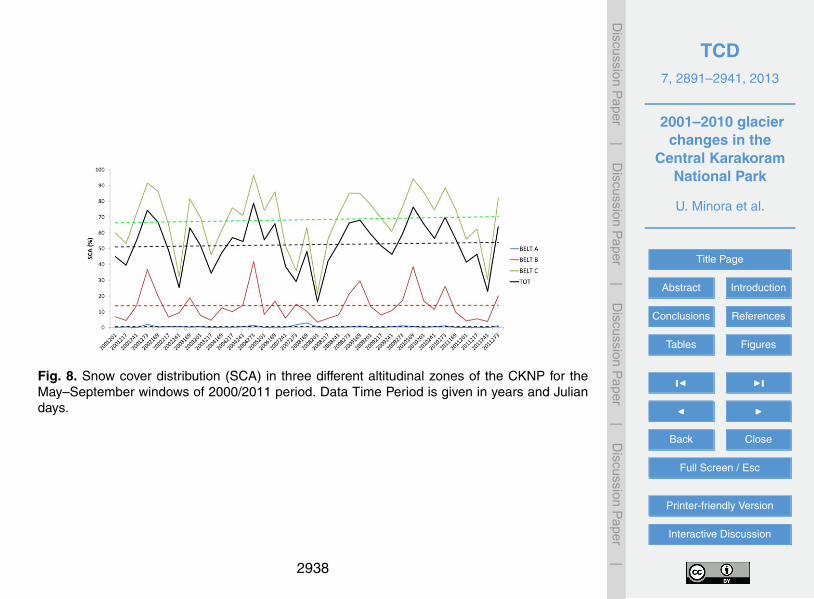
TCD7, 2891–2941, 2013
2001–2010 glacierchanges in the
Central KarakoramNational Park
U. Minora et al.
Title Page
Abstract Introduction
Conclusions References
Tables Figures
J I
J I
Back Close
Full Screen / Esc
Printer-friendly Version
Interactive Discussion
Discussion
Paper
|D
iscussionP
aper|
Discussion
Paper
|D
iscussionP
aper|
Fig. 8. Snow cover distribution (SCA) in three different altitudinal zones of the CKNP for theMay–September windows of 2000/2011 period. Data Time Period is given in years and Juliandays.
2938
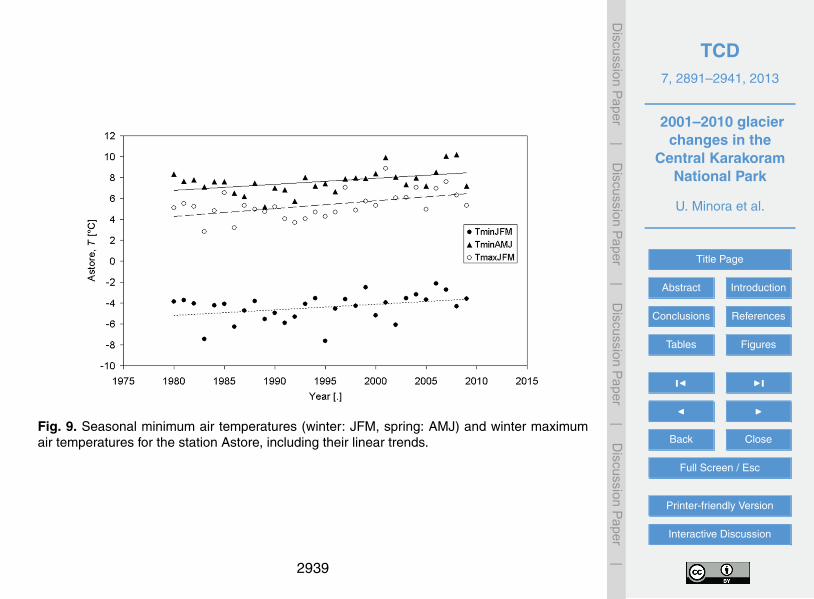
TCD7, 2891–2941, 2013
2001–2010 glacierchanges in the
Central KarakoramNational Park
U. Minora et al.
Title Page
Abstract Introduction
Conclusions References
Tables Figures
J I
J I
Back Close
Full Screen / Esc
Printer-friendly Version
Interactive Discussion
Discussion
Paper
|D
iscussionP
aper|
Discussion
Paper
|D
iscussionP
aper|
Fig. 9. Seasonal minimum air temperatures (winter: JFM, spring: AMJ) and winter maximumair temperatures for the station Astore, including their linear trends.
2939
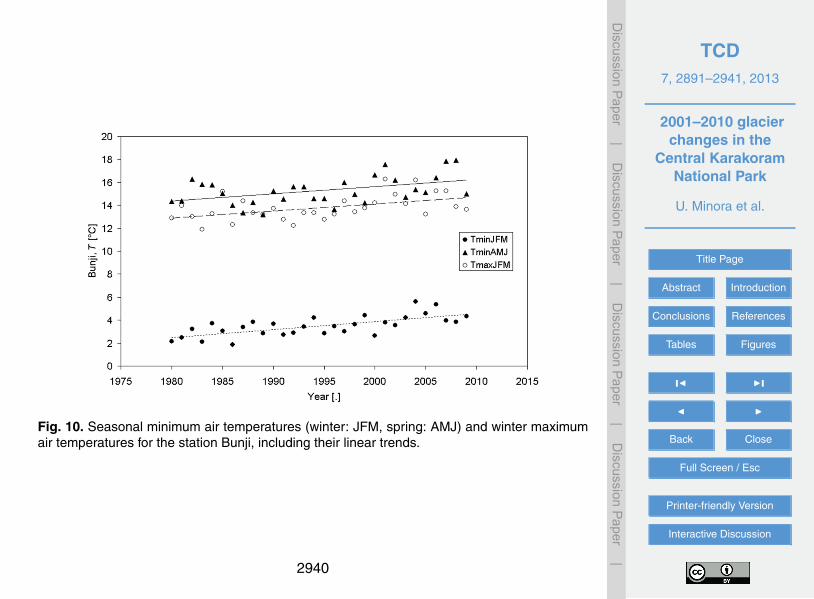
TCD7, 2891–2941, 2013
2001–2010 glacierchanges in the
Central KarakoramNational Park
U. Minora et al.
Title Page
Abstract Introduction
Conclusions References
Tables Figures
J I
J I
Back Close
Full Screen / Esc
Printer-friendly Version
Interactive Discussion
Discussion
Paper
|D
iscussionP
aper|
Discussion
Paper
|D
iscussionP
aper|
Fig. 10. Seasonal minimum air temperatures (winter: JFM, spring: AMJ) and winter maximumair temperatures for the station Bunji, including their linear trends.
2940
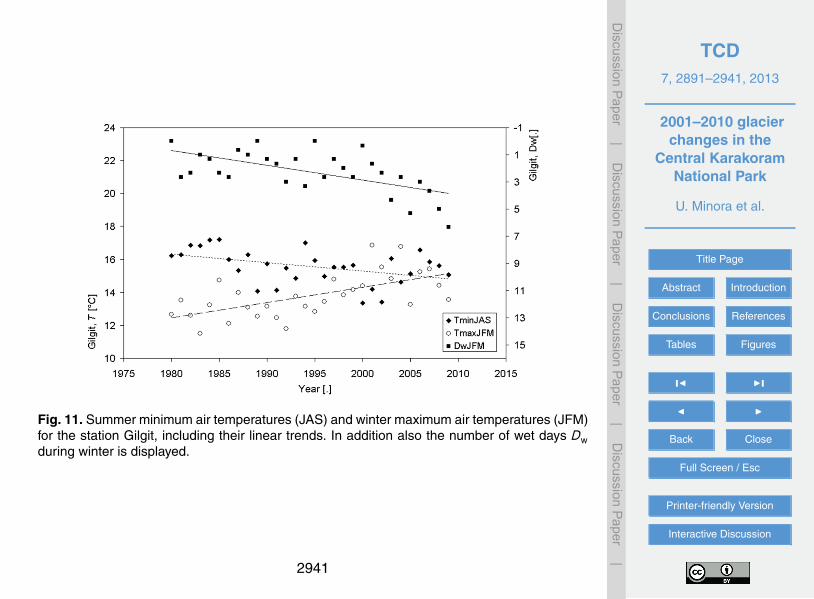
TCD7, 2891–2941, 2013
2001–2010 glacierchanges in the
Central KarakoramNational Park
U. Minora et al.
Title Page
Abstract Introduction
Conclusions References
Tables Figures
J I
J I
Back Close
Full Screen / Esc
Printer-friendly Version
Interactive Discussion
Discussion
Paper
|D
iscussionP
aper|
Discussion
Paper
|D
iscussionP
aper|
Fig. 11. Summer minimum air temperatures (JAS) and winter maximum air temperatures (JFM)for the station Gilgit, including their linear trends. In addition also the number of wet days Dwduring winter is displayed.
2941


![Glacier changes and related high mountain hazards in Tajikistan [Martin Mergili]](https://img.pdfslide.net/doc/110x75/55491223b4c9056b458bf20b/glacier-changes-and-related-high-mountain-hazards-in-tajikistan-martin-mergili.jpg)