Embed Size (px)
Citation preview
1
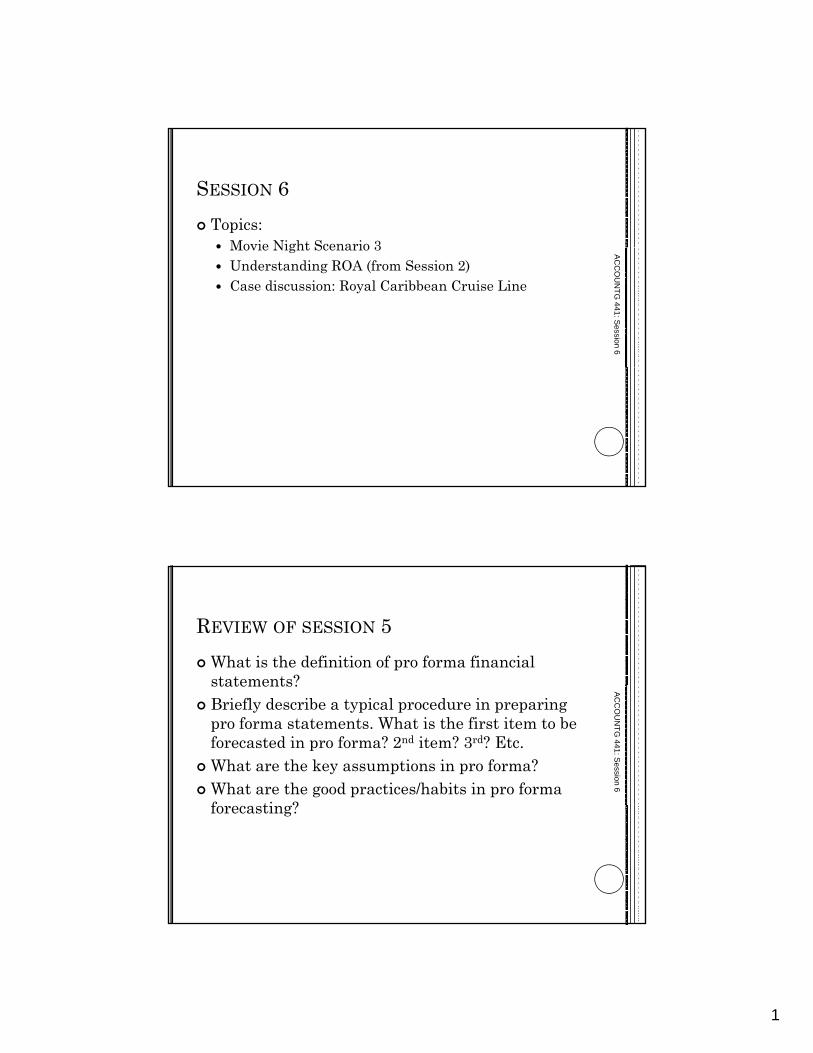
SESSION 6Topics:
Movie Night Scenario 3Movie Night Scenario 3Understanding ROA (from Session 2)Case discussion: Royal Caribbean Cruise Line
AC
CO
UN
TG 441: S
ession 6
REVIEW OF SESSION 5What is the definition of pro forma financial statements?statements?Briefly describe a typical procedure in preparing pro forma statements. What is the first item to be forecasted in pro forma? 2nd item? 3rd? Etc.What are the key assumptions in pro forma?What are the good practices/habits in pro forma f ti ?
AC
CO
UN
TG 441: S
ession 6
forecasting?
2
UNDERSTAND ROAHow do profit margin, asset turnover, and ROArelate to each other?relate to each other?What makes ROA differ across firms?What are the time-series properties of ROA?
AC
CO
UN
TG 441 S
ession 2
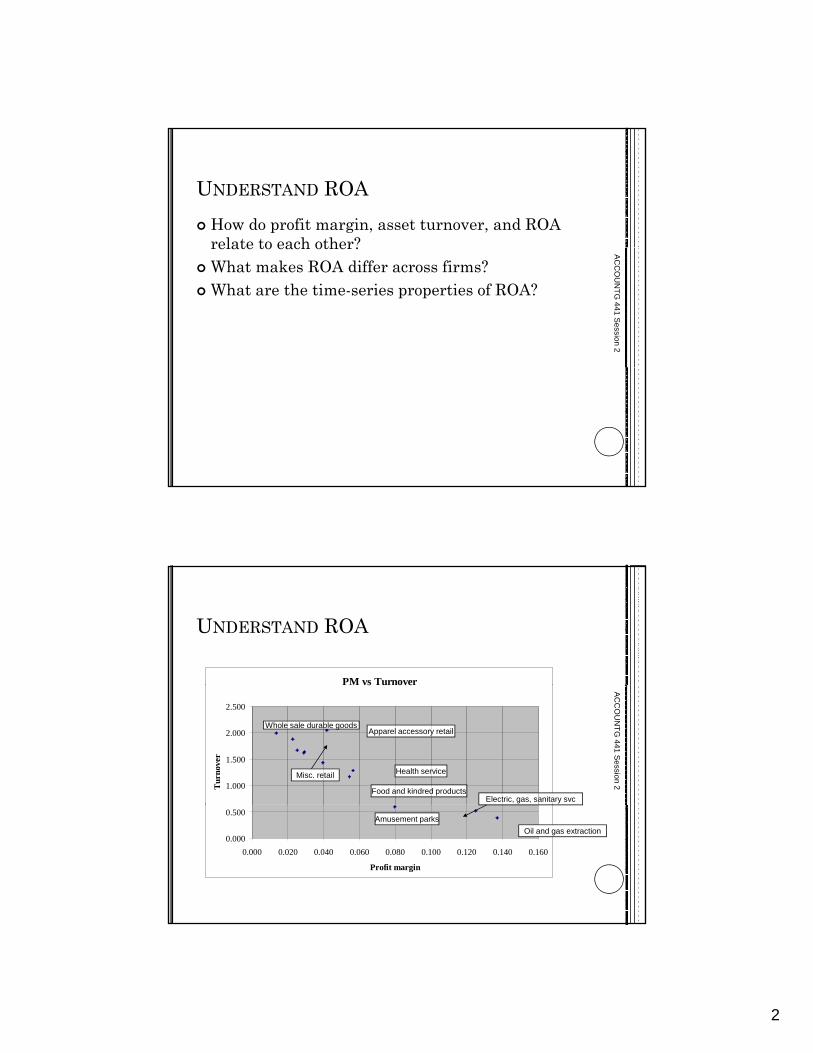
UNDERSTAND ROA
PM vs Turnovervs u ove
1.000
1.500
2.000
2.500
Tur
nove
r
AC
CO
UN
TG 441 S
ession 2
Whole sale durable goodsApparel accessory retail
Food and kindred products
Health serviceMisc. retail
Electric, gas, sanitary svc
0.000
0.500
0.000 0.020 0.040 0.060 0.080 0.100 0.120 0.140 0.160
Profit margin
Oil and gas extractionAmusement parks
3
UNDERSTAND ROAWhy do ROAs differ across firms?Why certain industries consistently earn high Why certain industries consistently earn high ROAs?
External: high risk, high expected return. Examples of risk factors:
Operating leverageCyclicality of saleProduct life cycle
AC
CO
UN
TG 441 S
ession 2
Internal: corporate strategy
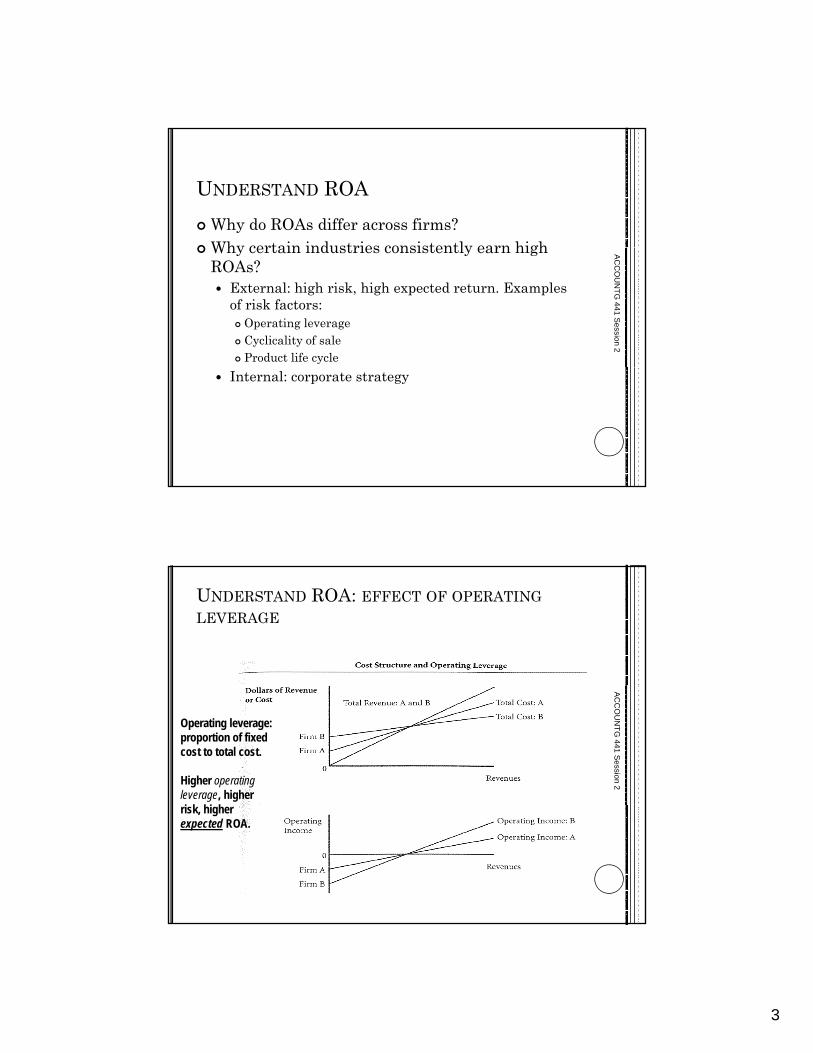
UNDERSTAND ROA: EFFECT OF OPERATINGLEVERAGE
AC
CO
UN
TG 441 S
ession 2
Operating leverage: proportion of fixed cost to total cost.
Higher operating leverage, higher i k hi h risk, higher
expected ROA.
4
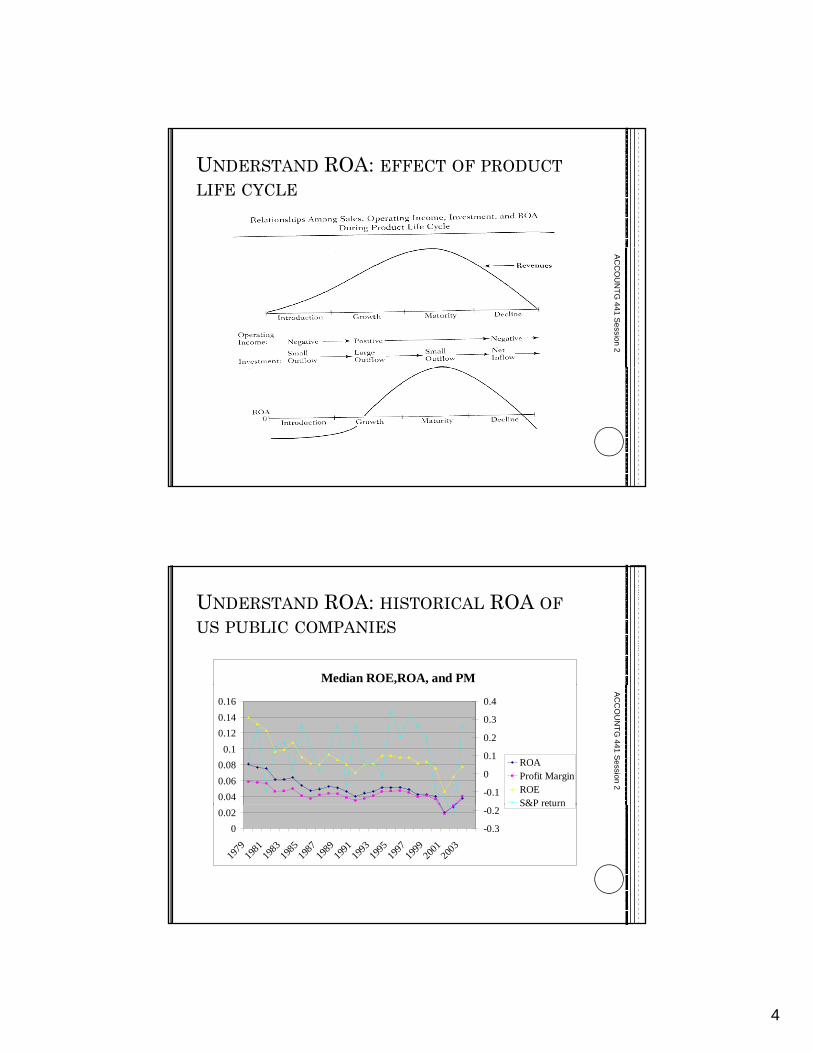
UNDERSTAND ROA: EFFECT OF PRODUCTLIFE CYCLE
AC
CO
UN
TG 441 S
ession 2
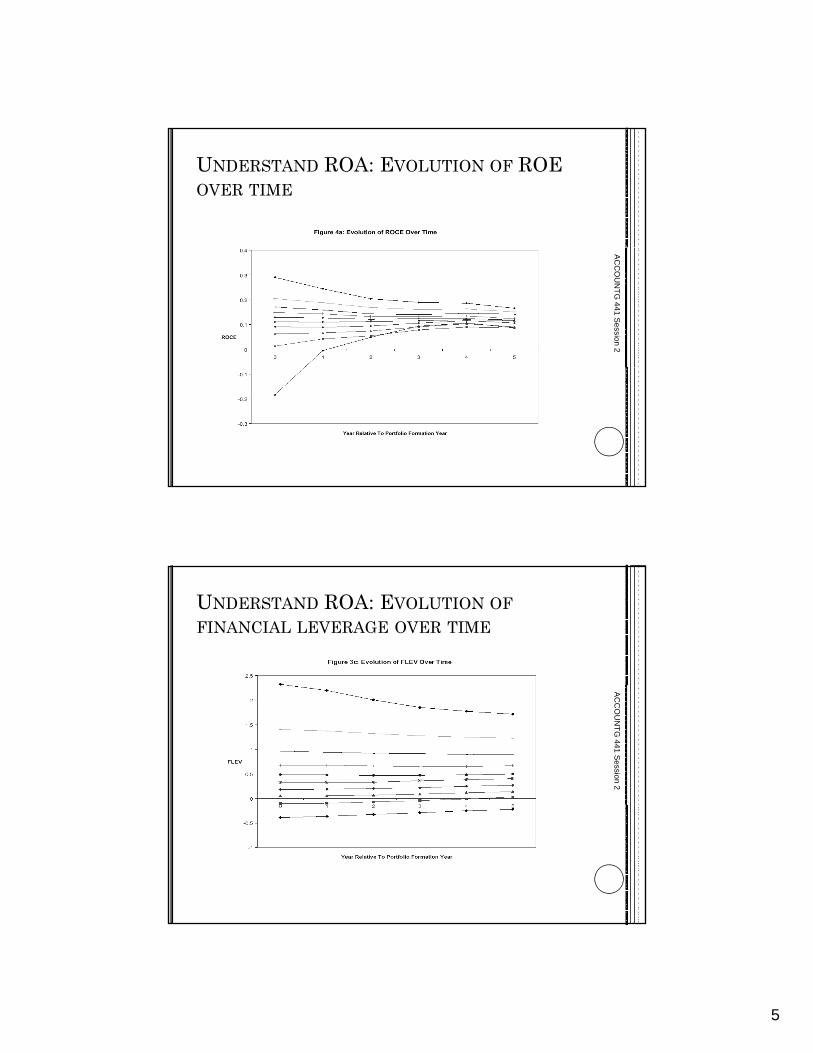
UNDERSTAND ROA: HISTORICAL ROA OFUS PUBLIC COMPANIES
Median ROE,ROA, and PM
0.040.060.08
0.10.120.140.16
-0.1
0
0.1
0.2
0.3
0.4
ROAProfit MarginROES&P return
AC
CO
UN
TG 441 S
ession 2
00.02
1979
1981
1983
1985
1987
1989
1991
1993
1995
1997
1999
2001
2003
-0.3
-0.2S&P return
5
UNDERSTAND ROA: EVOLUTION OF ROE OVER TIME
AC
CO
UN
TG 441 S
ession 2
UNDERSTAND ROA: EVOLUTION OFFINANCIAL LEVERAGE OVER TIME
AC
CO
UN
TG 441 S
ession 2
6
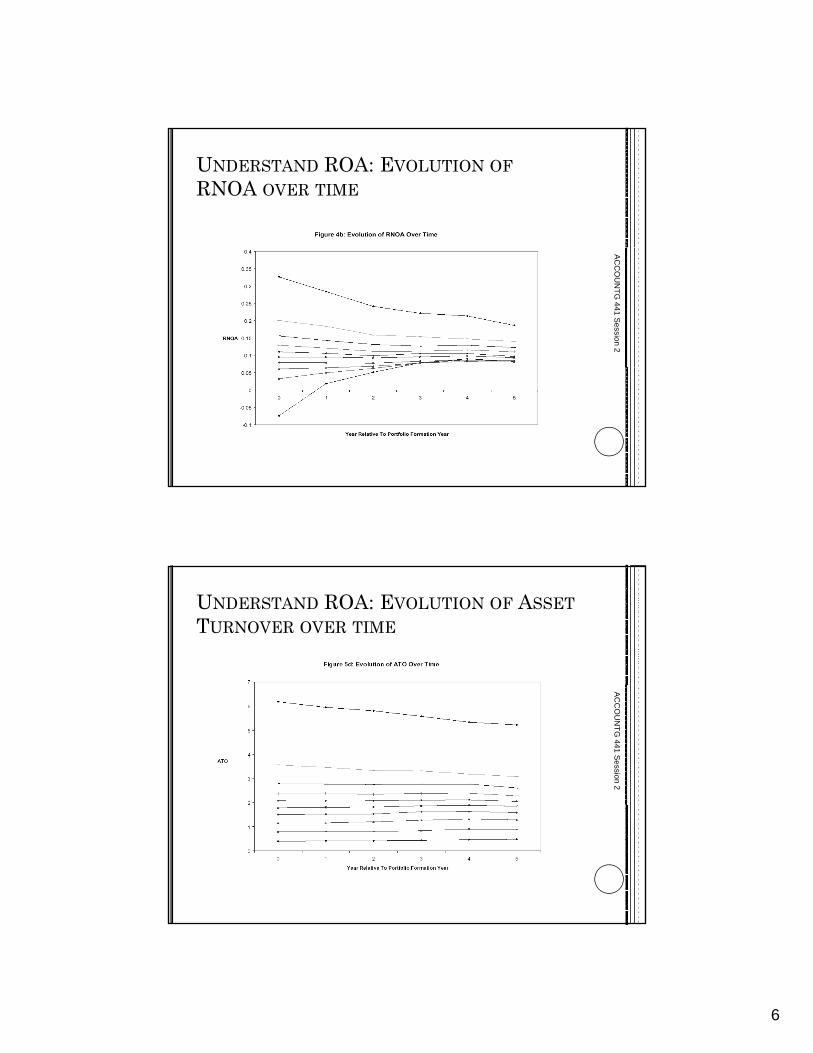
UNDERSTAND ROA: EVOLUTION OFRNOA OVER TIME
AC
CO
UN
TG 441 S
ession 2
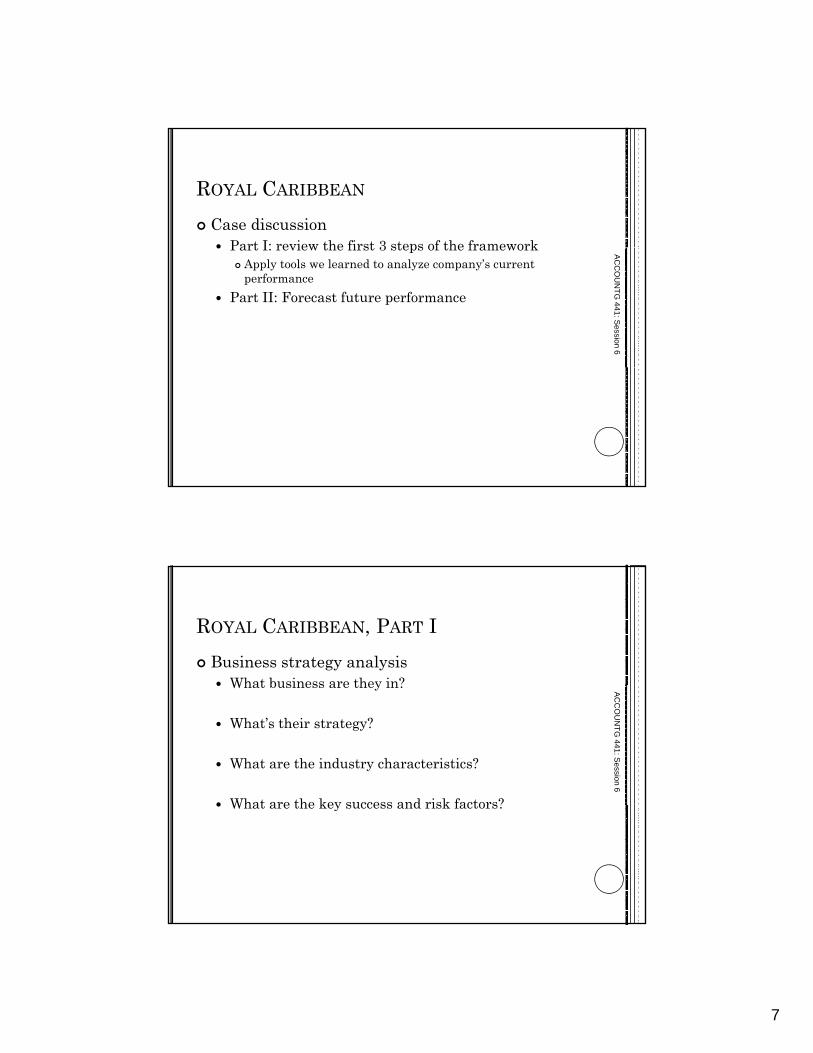
UNDERSTAND ROA: EVOLUTION OF ASSETTURNOVER OVER TIME
AC
CO
UN
TG 441 S
ession 2
7
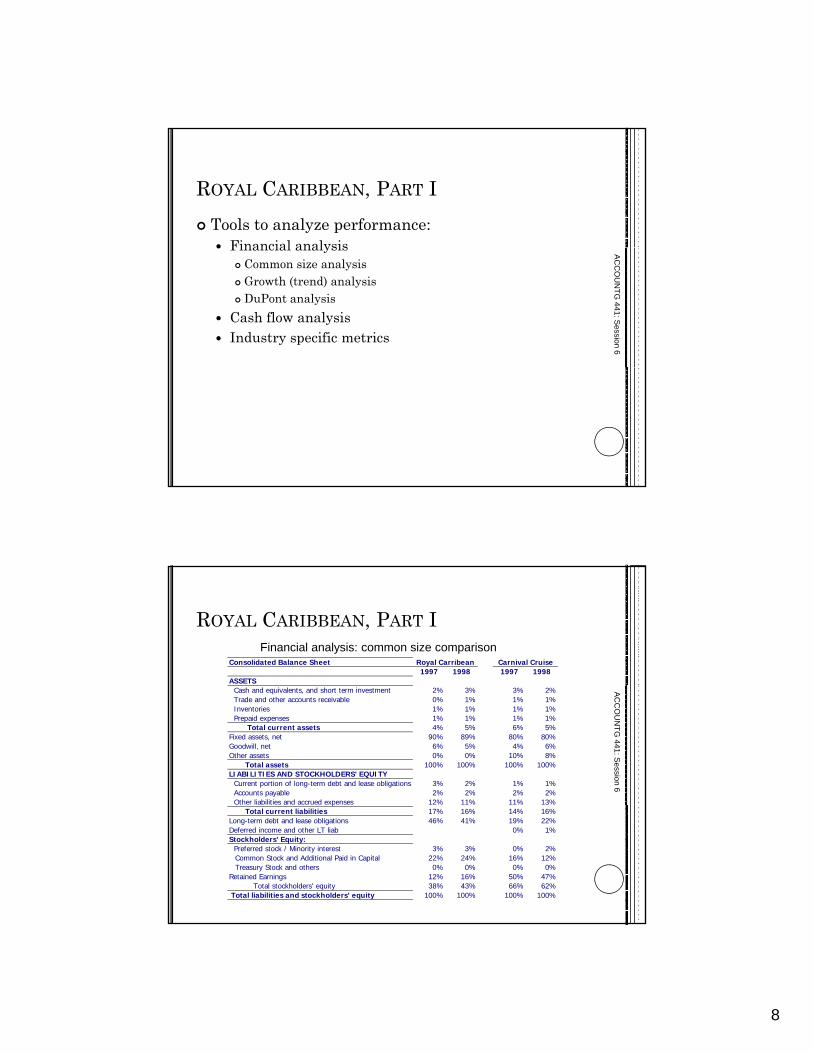
ROYAL CARIBBEAN
Case discussionPart I: review the first 3 steps of the framework Part I: review the first 3 steps of the framework
Apply tools we learned to analyze company’s current performance
Part II: Forecast future performance
AC
CO
UN
TG 441: S
ession 6
ROYAL CARIBBEAN, PART IBusiness strategy analysis
What business are they in?What business are they in?
What’s their strategy?
What are the industry characteristics?
What are the key success and risk factors?
AC
CO
UN
TG 441: S
ession 6
What are the key success and risk factors?
8
ROYAL CARIBBEAN, PART ITools to analyze performance:
Financial analysisFinancial analysisCommon size analysisGrowth (trend) analysisDuPont analysis
Cash flow analysisIndustry specific metrics
AC
CO
UN
TG 441: S
ession 6
ROYAL CARIBBEAN, PART I
Consolidated Balance Sheet1997 1998 1997 1998
ASSETS
Carnival CruiseRoyal Carribean
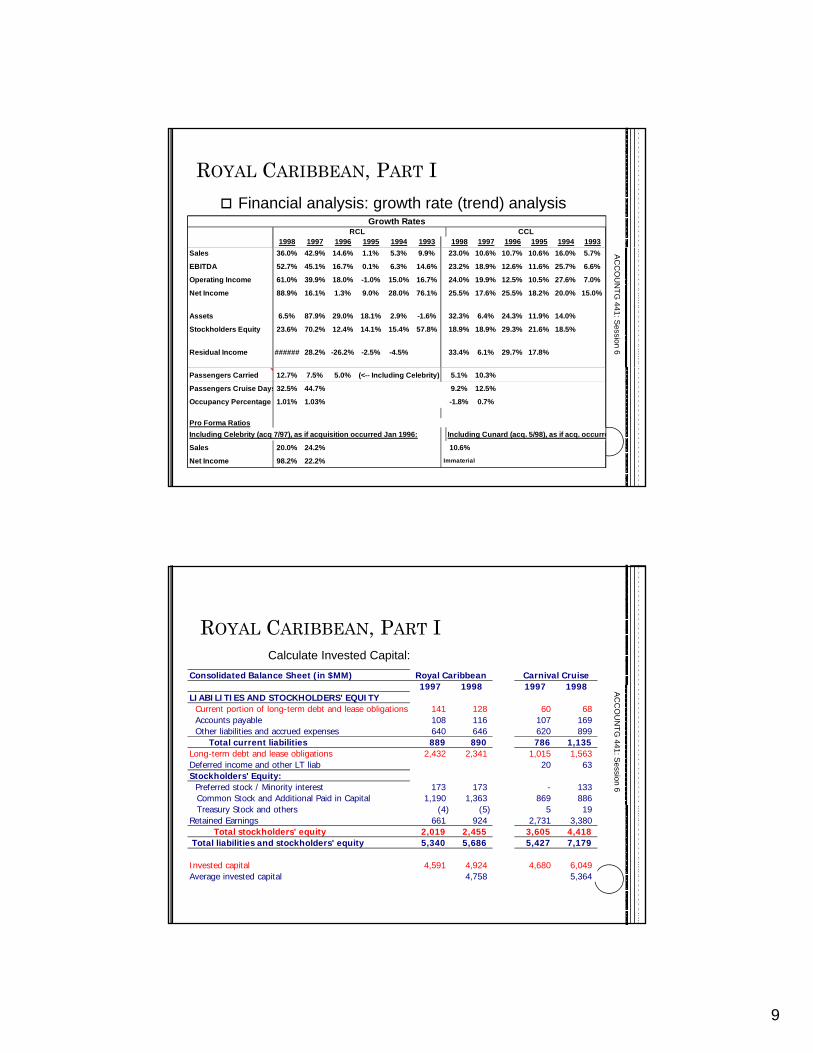
Financial analysis: common size comparison
Cash and equivalents, and short term investment 2% 3% 3% 2% Trade and other accounts receivable 0% 1% 1% 1% Inventories 1% 1% 1% 1% Prepaid expenses 1% 1% 1% 1% Total current assets 4% 5% 6% 5%Fixed assets, net 90% 89% 80% 80%Goodwill, net 6% 5% 4% 6%Other assets 0% 0% 10% 8% Total assets 100% 100% 100% 100%LIABILITIES AND STOCKHOLDERS' EQUITY Current portion of long-term debt and lease obligations 3% 2% 1% 1% Accounts payable 2% 2% 2% 2% Other liabilities and accrued expenses 12% 11% 11% 13%
AC
CO
UN
TG 441: S
ession 6
p Total current liabilities 17% 16% 14% 16%Long-term debt and lease obligations 46% 41% 19% 22%Deferred income and other LT liab 0% 1%Stockholders' Equity: Preferred stock / Minority interest 3% 3% 0% 2%
Common Stock and Additional Paid in Capital 22% 24% 16% 12%Treasury Stock and others 0% 0% 0% 0%
Retained Earnings 12% 16% 50% 47% Total stockholders' equity 38% 43% 66% 62% Total liabilities and stockholders' equity 100% 100% 100% 100%
9
ROYAL CARIBBEAN, PART I
1998 1997 1996 1995 1994 1993 1998 1997 1996 1995 1994 1993
Growth RatesCCLRCL
Financial analysis: growth rate (trend) analysis
Sales 36.0% 42.9% 14.6% 1.1% 5.3% 9.9% 23.0% 10.6% 10.7% 10.6% 16.0% 5.7%
EBITDA 52.7% 45.1% 16.7% 0.1% 6.3% 14.6% 23.2% 18.9% 12.6% 11.6% 25.7% 6.6%
Operating Income 61.0% 39.9% 18.0% -1.0% 15.0% 16.7% 24.0% 19.9% 12.5% 10.5% 27.6% 7.0%
Net Income 88.9% 16.1% 1.3% 9.0% 28.0% 76.1% 25.5% 17.6% 25.5% 18.2% 20.0% 15.0%
Assets 6.5% 87.9% 29.0% 18.1% 2.9% -1.6% 32.3% 6.4% 24.3% 11.9% 14.0%
Stockholders Equity 23.6% 70.2% 12.4% 14.1% 15.4% 57.8% 18.9% 18.9% 29.3% 21.6% 18.5%
Residual Income ###### 28.2% -26.2% -2.5% -4.5% 33.4% 6.1% 29.7% 17.8%
AC
CO
UN
TG 441: S
ession 6
Passengers Carried 12.7% 7.5% 5.0% (<-- Including Celebrity) 5.1% 10.3%
Passengers Cruise Days32.5% 44.7% 9.2% 12.5%
Occupancy Percentage 1.01% 1.03% -1.8% 0.7%
Pro Forma RatiosIncluding Celebrity (acq 7/97), as if acquisition occurred Jan 1996: Including Cunard (acq. 5/98), as if acq. occurre
Sales 20.0% 24.2% 10.6%
Net Income 98.2% 22.2% Immaterial
ROYAL CARIBBEAN, PART I
Consolidated Balance Sheet (in $MM)1997 1998 1997 1998
Carnival CruiseRoyal Caribbean
Calculate Invested Capital:
1997 1998 1997 1998LIABILITIES AND STOCKHOLDERS' EQUITY Current portion of long-term debt and lease obligations 141 128 60 68 Accounts payable 108 116 107 169 Other liabilities and accrued expenses 640 646 620 899 Total current liabilities 889 890 786 1,135 Long-term debt and lease obligations 2,432 2,341 1,015 1,563 Deferred income and other LT liab 20 63 Stockholders' Equity: Preferred stock / Minority interest 173 173 - 133
Common Stock and Additional Paid in Capital 1,190 1,363 869 886
AC
CO
UN
TG 441: S
ession 6
Treasury Stock and others (4) (5) 5 19 Retained Earnings 661 924 2,731 3,380 Total stockholders' equity 2,019 2,455 3,605 4,418 Total liabilities and stockholders' equity 5,340 5,686 5,427 7,179
Invested capital 4,591 4,924 4,680 6,049 Average invested capital 4,758 5,364
10
ROYAL CARIBBEAN, PART I
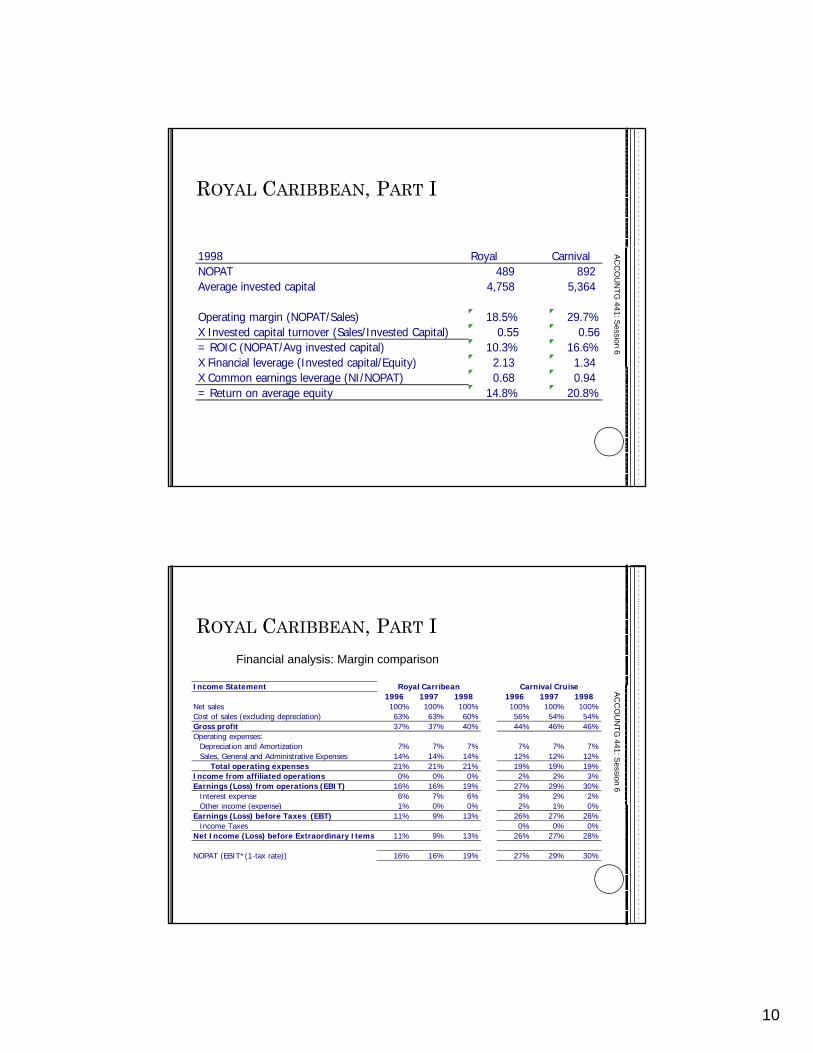
1998 Royal CarnivalNOPAT 489 892 Average invested capital 4,758 5,364
Operating margin (NOPAT/Sales) 18.5% 29.7%X Invested capital turnover (Sales/Invested Capital) 0.55 0.56= ROIC (NOPAT/Avg invested capital) 10.3% 16.6%X Financial leverage (Invested capital/Equity) 2.13 1.34
AC
CO
UN
TG 441: S
ession 6
g ( p / q y)X Common earnings leverage (NI/NOPAT) 0.68 0.94 = Return on average equity 14.8% 20.8%
ROYAL CARIBBEAN, PART I
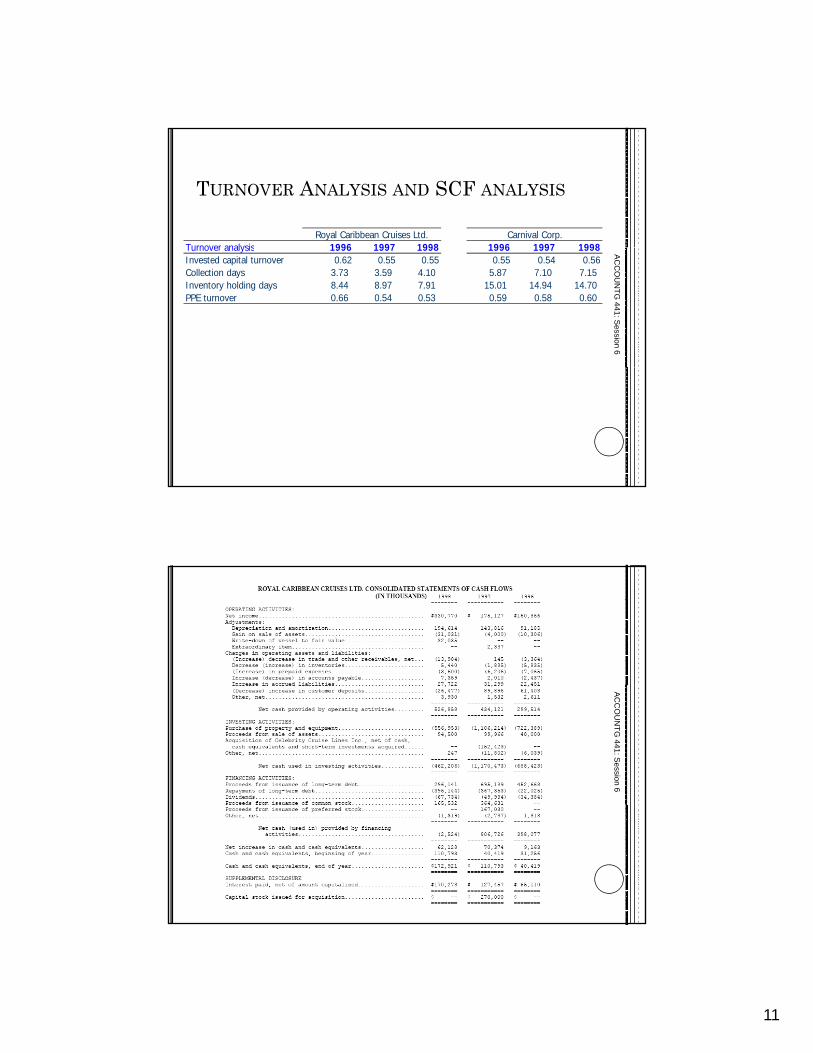
Income Statement Royal Carribean Carnival Cruise
Financial analysis: Margin comparison
Income Statement1996 1997 1998 1996 1997 1998
Net sales 100% 100% 100% 100% 100% 100%Cost of sales (excluding depreciation) 63% 63% 60% 56% 54% 54%Gross profit 37% 37% 40% 44% 46% 46%Operating expenses:
Depreciation and Amortization 7% 7% 7% 7% 7% 7%Sales, General and Administrative Expenses 14% 14% 14% 12% 12% 12%
Total operating expenses 21% 21% 21% 19% 19% 19%Income from affiliated operations 0% 0% 0% 2% 2% 3%Earnings (Loss) from operations (EBIT) 16% 16% 19% 27% 29% 30%
Interest expense 6% 7% 6% 3% 2% 2%Other income (expense) 1% 0% 0% 2% 1% 0%
Royal Carribean Carnival Cruise AC
CO
UN
TG 441: S
ession 6
Other income (expense) 1% 0% 0% 2% 1% 0%Earnings (Loss) before Taxes (EBT) 11% 9% 13% 26% 27% 28%
Income Taxes 0% 0% 0%Net Income (Loss) before Extraordinary Items 11% 9% 13% 26% 27% 28%
NOPAT (EBIT*(1-tax rate)) 16% 16% 19% 27% 29% 30%
11
TURNOVER ANALYSIS AND SCF ANALYSIS
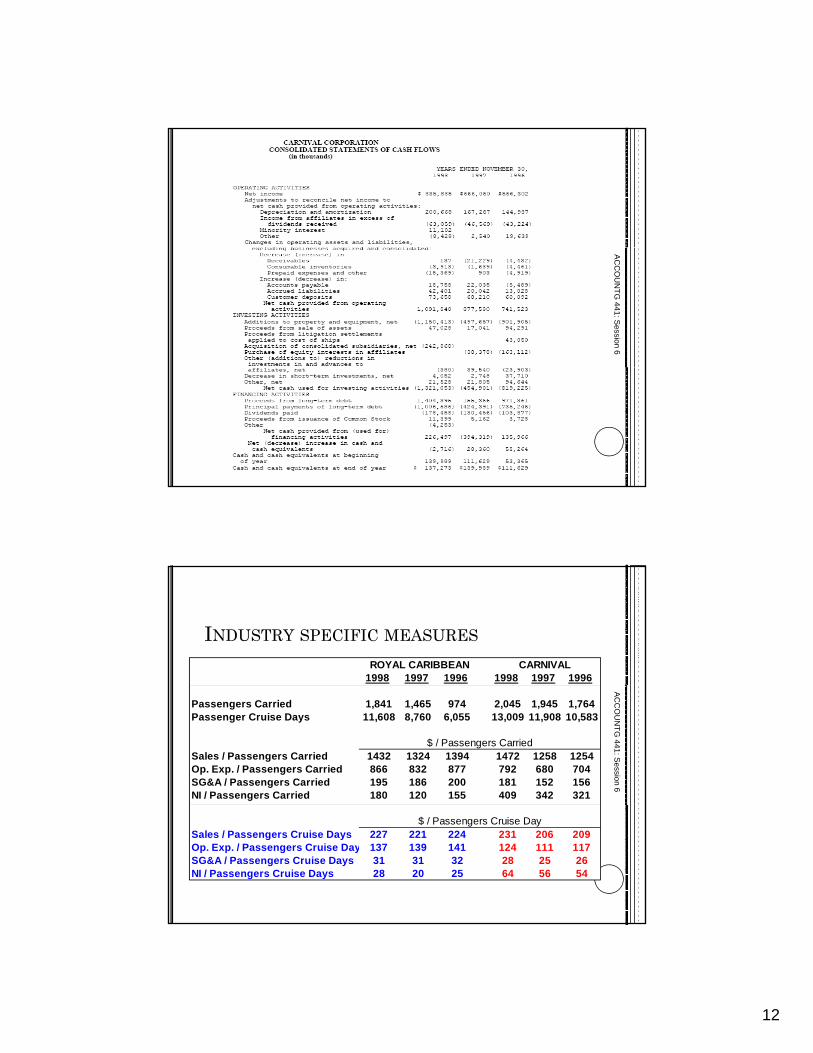
Turnover analysis 1996 1997 1998 1996 1997 1998Royal Caribbean Cruises Ltd. Carnival Corp.
Turnover analysis 1996 1997 1998 1996 1997 1998Invested capital turnover 0.62 0.55 0.55 0.55 0.54 0.56Collection days 3.73 3.59 4.10 5.87 7.10 7.15 Inventory holding days 8.44 8.97 7.91 15.01 14.94 14.70 PPE turnover 0.66 0.54 0.53 0.59 0.58 0.60
AC
CO
UN
TG 441: S
ession 6A
CC
OU
NTG
441: Session 6
12
AC
CO
UN
TG 441: S
ession 6
1998 1997 1996 1998 1997 1996CARNIVAL ROYAL CARIBBEAN
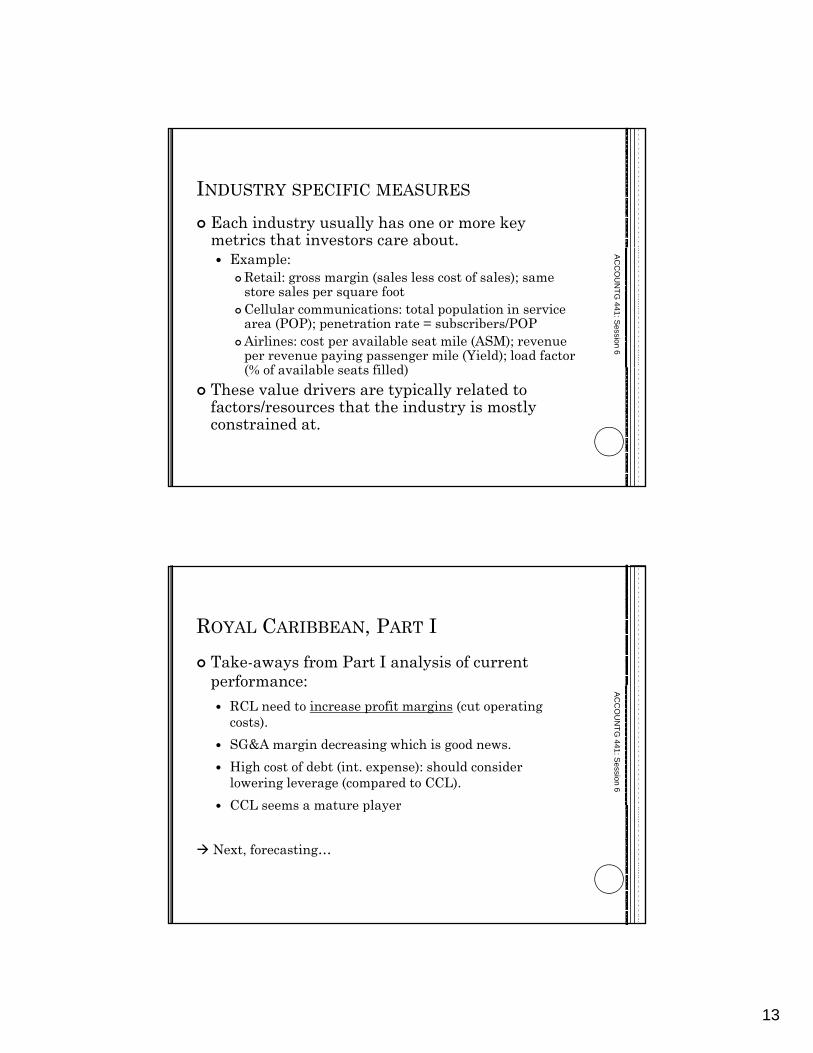
INDUSTRY SPECIFIC MEASURES
Passengers Carried 1,841 1,465 974 2,045 1,945 1,764Passenger Cruise Days 11,608 8,760 6,055 13,009 11,908 10,583
Sales / Passengers Carried 1432 1324 1394 1472 1258 1254Op. Exp. / Passengers Carried 866 832 877 792 680 704SG&A / Passengers Carried 195 186 200 181 152 156NI / Passengers Carried 180 120 155 409 342 321
$ / Passengers Carried
AC
CO
UN
TG 441: S
ession 6
Sales / Passengers Cruise Days 227 221 224 231 206 209Op. Exp. / Passengers Cruise Day 137 139 141 124 111 117SG&A / Passengers Cruise Days 31 31 32 28 25 26NI / Passengers Cruise Days 28 20 25 64 56 54
$ / Passengers Cruise Day
13
INDUSTRY SPECIFIC MEASURES
Each industry usually has one or more key metrics that investors care about.
Example: Retail: gross margin (sales less cost of sales); same store sales per square footCellular communications: total population in service area (POP); penetration rate = subscribers/POPAirlines: cost per available seat mile (ASM); revenue per revenue paying passenger mile (Yield); load factor (% f il bl t fill d)
AC
CO
UN
TG 441: S
ession 6
(% of available seats filled)These value drivers are typically related to factors/resources that the industry is mostly constrained at.
ROYAL CARIBBEAN, PART ITake-aways from Part I analysis of current performance:performance:
RCL need to increase profit margins (cut operating costs). SG&A margin decreasing which is good news.High cost of debt (int. expense): should consider lowering leverage (compared to CCL). CCL seems a mature player
AC
CO
UN
TG 441: S
ession 6
CCL seems a mature player
Next, forecasting…
14
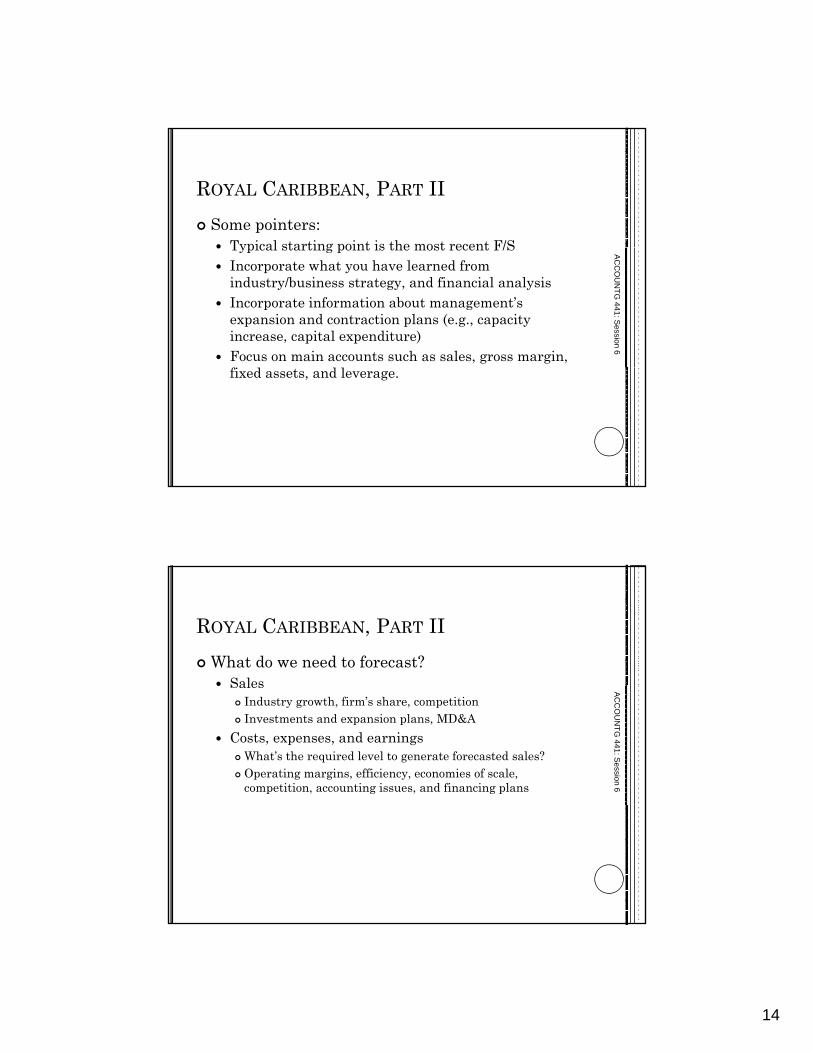
ROYAL CARIBBEAN, PART IISome pointers:
Typical starting point is the most recent F/STypical starting point is the most recent F/SIncorporate what you have learned from industry/business strategy, and financial analysisIncorporate information about management’s expansion and contraction plans (e.g., capacity increase, capital expenditure)Focus on main accounts such as sales, gross margin,
AC
CO
UN
TG 441: S
ession 6
fixed assets, and leverage.
ROYAL CARIBBEAN, PART IIWhat do we need to forecast?
SalesSalesIndustry growth, firm’s share, competitionInvestments and expansion plans, MD&A
Costs, expenses, and earningsWhat’s the required level to generate forecasted sales?Operating margins, efficiency, economies of scale, competition, accounting issues, and financing plans
AC
CO
UN
TG 441: S
ession 6
15
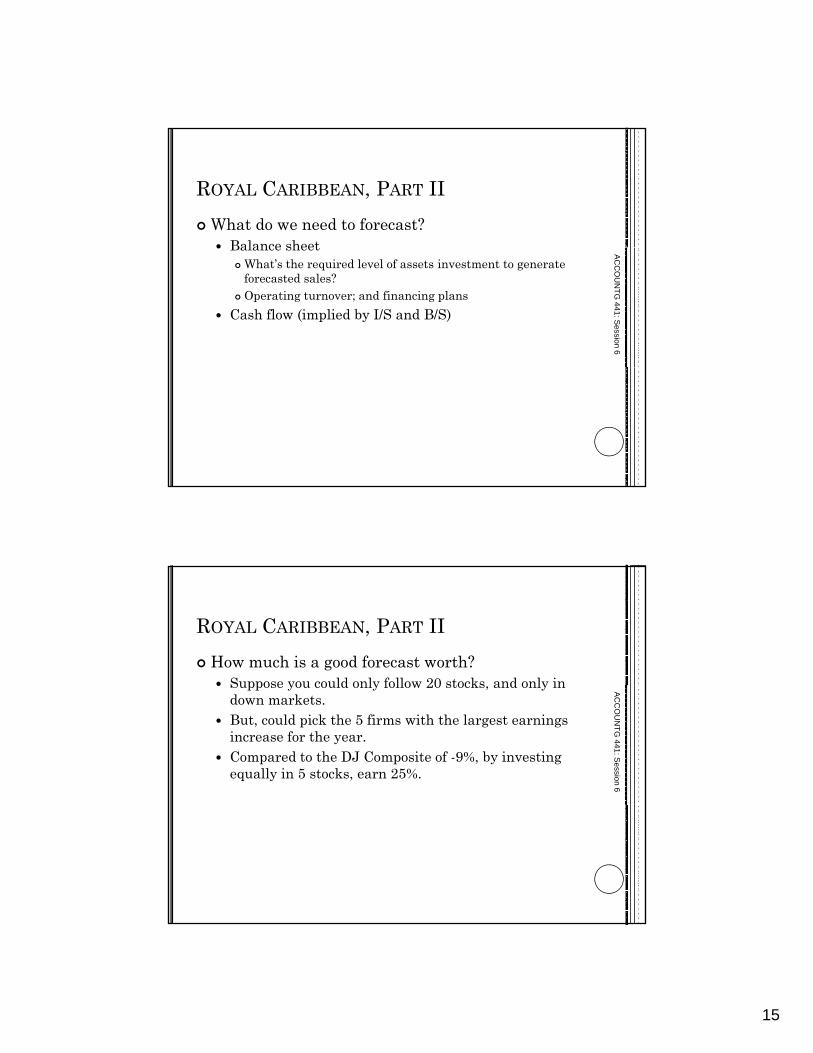
ROYAL CARIBBEAN, PART IIWhat do we need to forecast?
Balance sheetBalance sheetWhat’s the required level of assets investment to generate forecasted sales?Operating turnover; and financing plans
Cash flow (implied by I/S and B/S)
AC
CO
UN
TG 441: S
ession 6
ROYAL CARIBBEAN, PART IIHow much is a good forecast worth?
Suppose you could only follow 20 stocks and only in Suppose you could only follow 20 stocks, and only in down markets.But, could pick the 5 firms with the largest earnings increase for the year.Compared to the DJ Composite of -9%, by investing equally in 5 stocks, earn 25%.
AC
CO
UN
TG 441: S
ession 6
16
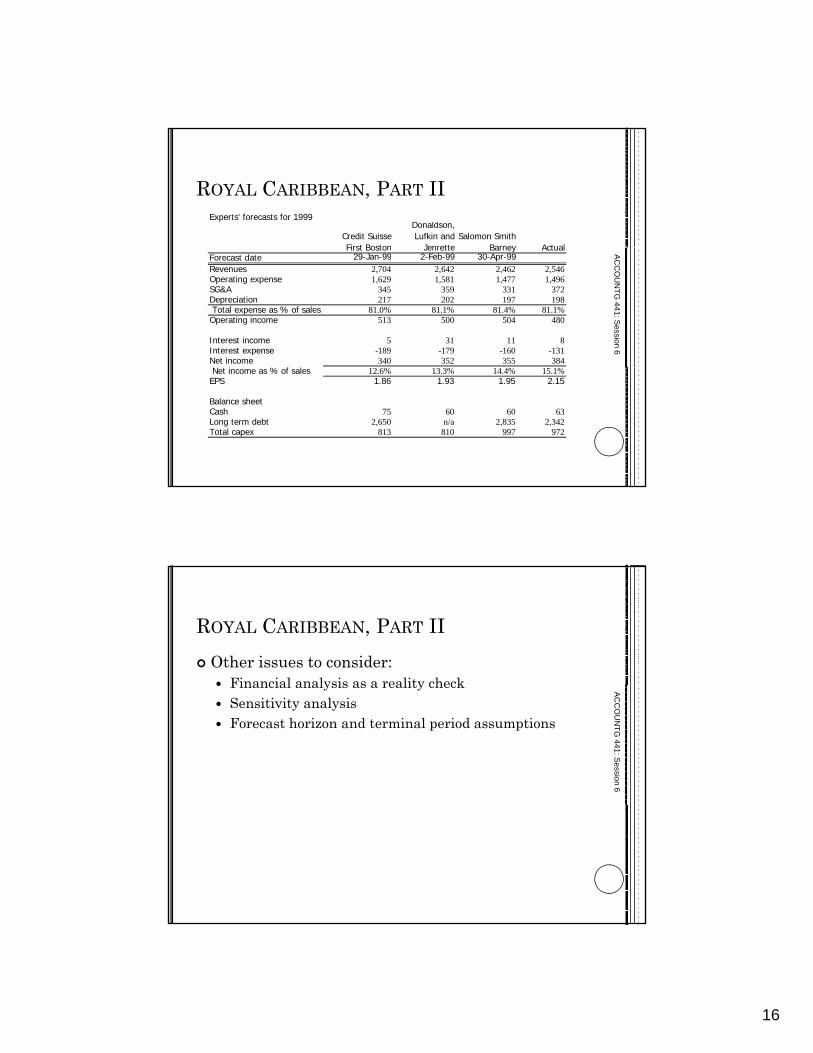
ROYAL CARIBBEAN, PART IIExperts' forecasts for 1999
Credit Suisse First Boston
Donaldson, Lufkin and
JenretteSalomon Smith
Barney ActualFirst Boston Jenrette Barney ActualForecast date 29-Jan-99 2-Feb-99 30-Apr-99Revenues 2,704 2,642 2,462 2,546Operating expense 1,629 1,581 1,477 1,496SG&A 345 359 331 372Depreciation 217 202 197 198 Total expense as % of sales 81.0% 81.1% 81.4% 81.1%Operating income 513 500 504 480
Interest income 5 31 11 8Interest expense -189 -179 -160 -131Net income 340 352 355 384
% f l
AC
CO
UN
TG 441: S
ession 6
Net income as % of sales 12.6% 13.3% 14.4% 15.1%EPS 1.86 1.93 1.95 2.15
Balance sheetCash 75 60 60 63Long term debt 2,650 n/a 2,835 2,342Total capex 813 810 997 972
ROYAL CARIBBEAN, PART IIOther issues to consider:
Financial analysis as a reality checkFinancial analysis as a reality checkSensitivity analysisForecast horizon and terminal period assumptions
AC
CO
UN
TG 441: S
ession 6
17
REVIEW OF ROYAL CARIBBEAN
What are the tools we used to analyze Royal Caribbean’s current performance?pHow did we forecast Royal Caribbean’s
Revenues? Expenses? Capital expenditures? Long term debts?
AC
CO
UN
TG 441: S
ession 6
IN PREPARATION FOR SESSION 7We are moving into the earnings quality/earnings management module from Session 7 to 9Read the Harnischfeger case and think about the case questions
AC
CO
UN
TG 441: S
ession 6
Jill S. [email protected]
Spencer [email protected]
E Q U I T Y MID-CAPR E S E A R C H : $6.8 bil.
U N I T E D S T A T E S GROWTH
Leisure Time
April 30, 1999
Royal Caribbean Cruises, Ltd.(RCL#–$35.50)
Staying the Course
➤ Royal Caribbean reported first quarter 1999 EPSof $0.49 vs. $0.44, just above our $0.45 estimate.
➤ As expected, capacity declined 4%, yielding a7.5% drop in sales although margins (adjusted forgroundings) demonstrated modest improvement.
➤ Adopting a more cautious stance on the war inKosovo, we cut our 1999 and 2000 EPS estimatesby $0.05 each, to $1.86 and $2.20, respectively.
➤ Valuation is still compelling in the face of anacceleration in capacity readying to ignite laterin 1999. However, until the war ends, we aresticking with our tempered Outperformrecommendation and mid-$40s price target.
S&P 500: 1363
FY December 1998A 1999E 2000E 52-Week Range $44-$17
Revenues (bil.) $2.6 $2.5 $3.0 Dividend/Yield $0.36/1.0%
Current EPS $1.88 $1.86 $2.20 Shares Out (mil.) 183
Previous EPS $1.91 $2.25 Float (mil.) 63.4
P/E 18.9x 19.0x 16.1x Est. 5-Year EPS Growth 19%
TEV/EBITDA 12.0x 14.8x 12.4x L-T Debt/Capital 50.1%
Price Performance 1997 1998 YTD ROE (1999E) 12.5%
Absolute 128.1% 38.8% -4.4% Current Book Value $15.46
Relative 97.1% 12.1% -15.3% Price/Book 2.3x
2M Outperform, Medium Risk(UNCHANGED)

Royal Caribbean Cruises, Ltd. – April 30, 1999
2
This page intentionally left blank
Royal Caribbean Cruises, Ltd. – April 30, 1999
3
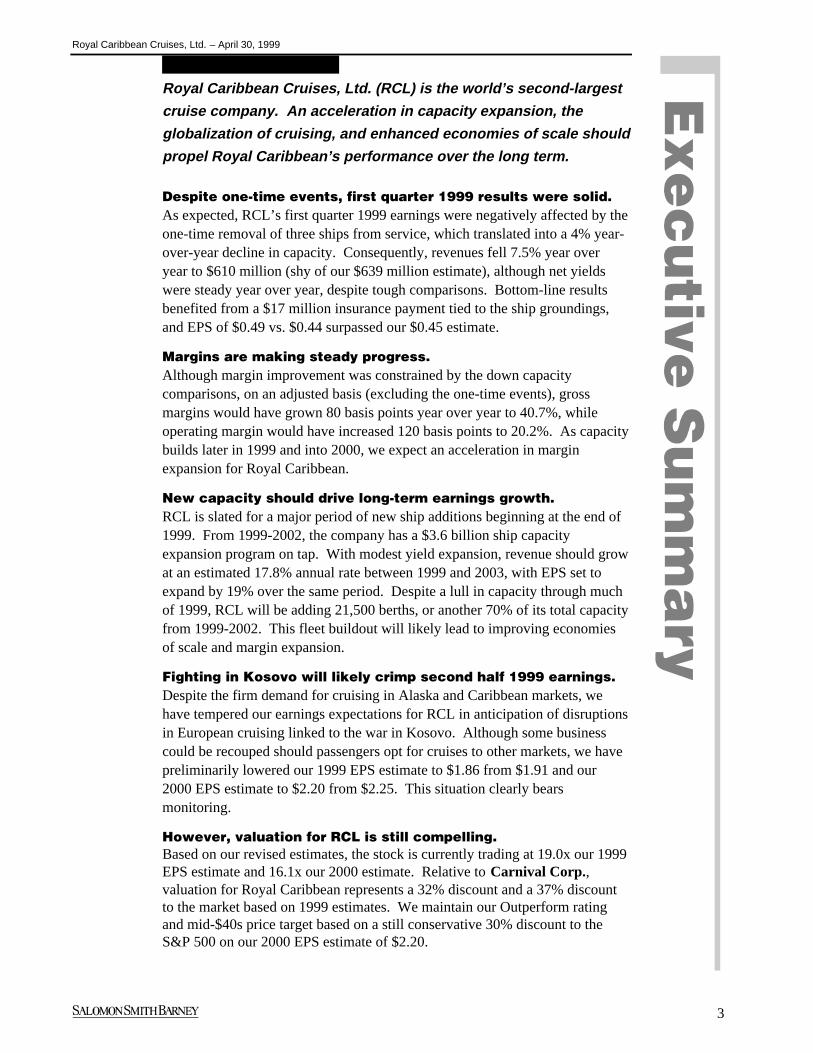
Royal Caribbean Cruises, Ltd. (RCL) is the world’s second-largest
cruise company. An acceleration in capacity expansion, the
globalization of cruising, and enhanced economies of scale should
propel Royal Caribbean’s performance over the long term.
Despite one-time events, first quarter 1999 results were solid.As expected, RCL’s first quarter 1999 earnings were negatively affected by theone-time removal of three ships from service, which translated into a 4% year-over-year decline in capacity. Consequently, revenues fell 7.5% year overyear to $610 million (shy of our $639 million estimate), although net yieldswere steady year over year, despite tough comparisons. Bottom-line resultsbenefited from a $17 million insurance payment tied to the ship groundings,and EPS of $0.49 vs. $0.44 surpassed our $0.45 estimate.
Margins are making steady progress.Although margin improvement was constrained by the down capacitycomparisons, on an adjusted basis (excluding the one-time events), grossmargins would have grown 80 basis points year over year to 40.7%, whileoperating margin would have increased 120 basis points to 20.2%. As capacitybuilds later in 1999 and into 2000, we expect an acceleration in marginexpansion for Royal Caribbean.
New capacity should drive long-term earnings growth.RCL is slated for a major period of new ship additions beginning at the end of1999. From 1999-2002, the company has a $3.6 billion ship capacityexpansion program on tap. With modest yield expansion, revenue should growat an estimated 17.8% annual rate between 1999 and 2003, with EPS set toexpand by 19% over the same period. Despite a lull in capacity through muchof 1999, RCL will be adding 21,500 berths, or another 70% of its total capacityfrom 1999-2002. This fleet buildout will likely lead to improving economiesof scale and margin expansion.
Fighting in Kosovo will likely crimp second half 1999 earnings.Despite the firm demand for cruising in Alaska and Caribbean markets, wehave tempered our earnings expectations for RCL in anticipation of disruptionsin European cruising linked to the war in Kosovo. Although some businesscould be recouped should passengers opt for cruises to other markets, we havepreliminarily lowered our 1999 EPS estimate to $1.86 from $1.91 and our2000 EPS estimate to $2.20 from $2.25. This situation clearly bearsmonitoring.
However, valuation for RCL is still compelling.Based on our revised estimates, the stock is currently trading at 19.0x our 1999EPS estimate and 16.1x our 2000 estimate. Relative to Carnival Corp.,valuation for Royal Caribbean represents a 32% discount and a 37% discountto the market based on 1999 estimates. We maintain our Outperform ratingand mid-$40s price target based on a still conservative 30% discount to theS&P 500 on our 2000 EPS estimate of $2.20.
Royal Caribbean Cruises, Ltd. – April 30, 1999
4
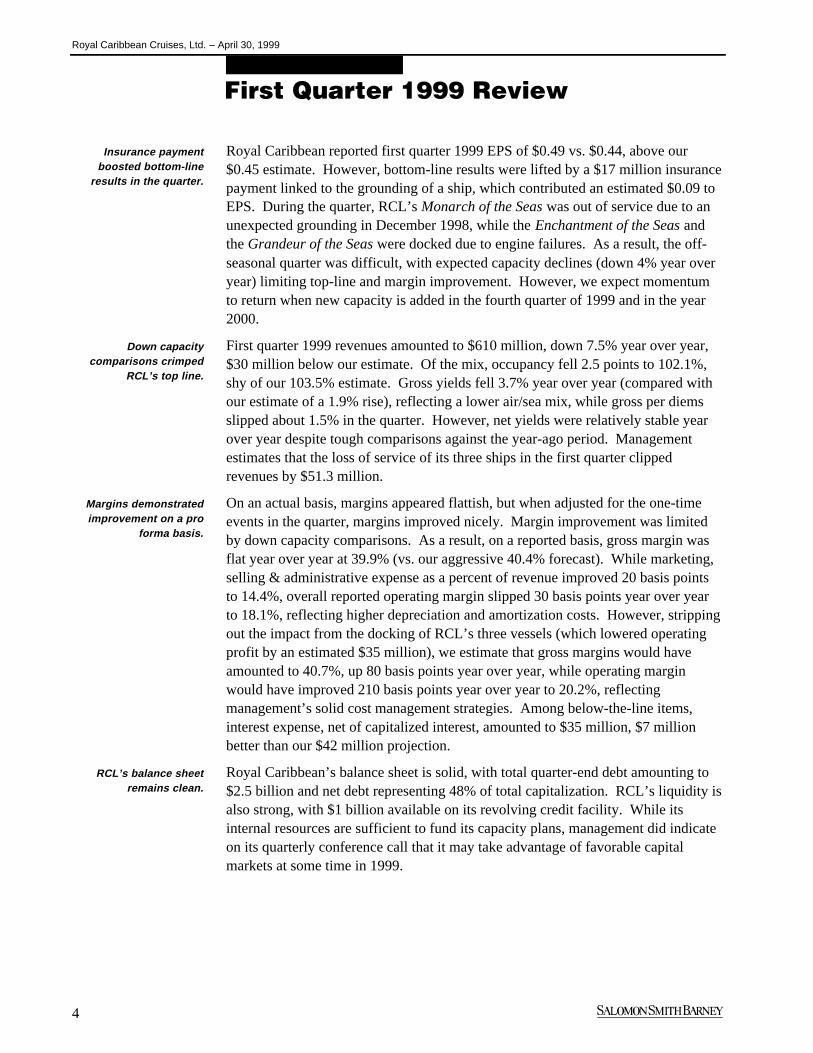
Royal Caribbean reported first quarter 1999 EPS of $0.49 vs. $0.44, above our$0.45 estimate. However, bottom-line results were lifted by a $17 million insurancepayment linked to the grounding of a ship, which contributed an estimated $0.09 toEPS. During the quarter, RCL’s Monarch of the Seas was out of service due to anunexpected grounding in December 1998, while the Enchantment of the Seas andthe Grandeur of the Seas were docked due to engine failures. As a result, the off-seasonal quarter was difficult, with expected capacity declines (down 4% year overyear) limiting top-line and margin improvement. However, we expect momentumto return when new capacity is added in the fourth quarter of 1999 and in the year2000.
First quarter 1999 revenues amounted to $610 million, down 7.5% year over year,$30 million below our estimate. Of the mix, occupancy fell 2.5 points to 102.1%,shy of our 103.5% estimate. Gross yields fell 3.7% year over year (compared withour estimate of a 1.9% rise), reflecting a lower air/sea mix, while gross per diemsslipped about 1.5% in the quarter. However, net yields were relatively stable yearover year despite tough comparisons against the year-ago period. Managementestimates that the loss of service of its three ships in the first quarter clippedrevenues by $51.3 million.
On an actual basis, margins appeared flattish, but when adjusted for the one-timeevents in the quarter, margins improved nicely. Margin improvement was limitedby down capacity comparisons. As a result, on a reported basis, gross margin wasflat year over year at 39.9% (vs. our aggressive 40.4% forecast). While marketing,selling & administrative expense as a percent of revenue improved 20 basis pointsto 14.4%, overall reported operating margin slipped 30 basis points year over yearto 18.1%, reflecting higher depreciation and amortization costs. However, strippingout the impact from the docking of RCL’s three vessels (which lowered operatingprofit by an estimated $35 million), we estimate that gross margins would haveamounted to 40.7%, up 80 basis points year over year, while operating marginwould have improved 210 basis points year over year to 20.2%, reflectingmanagement’s solid cost management strategies. Among below-the-line items,interest expense, net of capitalized interest, amounted to $35 million, $7 millionbetter than our $42 million projection.
Royal Caribbean’s balance sheet is solid, with total quarter-end debt amounting to$2.5 billion and net debt representing 48% of total capitalization. RCL’s liquidity isalso strong, with $1 billion available on its revolving credit facility. While itsinternal resources are sufficient to fund its capacity plans, management did indicateon its quarterly conference call that it may take advantage of favorable capitalmarkets at some time in 1999.
First Quarter 1999 Review
Insurance paymentboosted bottom-line
results in the quarter.
Down capacitycomparisons crimped
RCL’s top line.
Margins demonstratedimprovement on a pro
forma basis.
RCL’s balance sheetremains clean.
Royal Caribbean Cruises, Ltd. – April 30, 1999
5
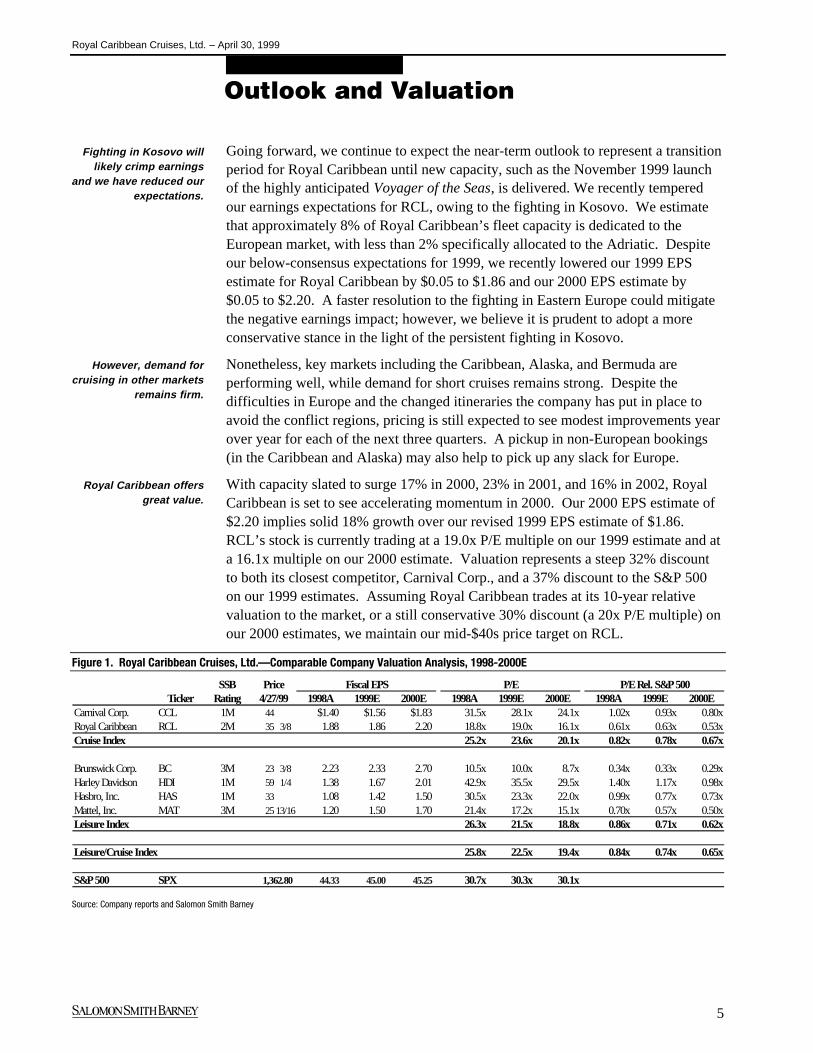
Going forward, we continue to expect the near-term outlook to represent a transitionperiod for Royal Caribbean until new capacity, such as the November 1999 launchof the highly anticipated Voyager of the Seas, is delivered. We recently temperedour earnings expectations for RCL, owing to the fighting in Kosovo. We estimatethat approximately 8% of Royal Caribbean’s fleet capacity is dedicated to theEuropean market, with less than 2% specifically allocated to the Adriatic. Despiteour below-consensus expectations for 1999, we recently lowered our 1999 EPSestimate for Royal Caribbean by $0.05 to $1.86 and our 2000 EPS estimate by$0.05 to $2.20. A faster resolution to the fighting in Eastern Europe could mitigatethe negative earnings impact; however, we believe it is prudent to adopt a moreconservative stance in the light of the persistent fighting in Kosovo.
Nonetheless, key markets including the Caribbean, Alaska, and Bermuda areperforming well, while demand for short cruises remains strong. Despite thedifficulties in Europe and the changed itineraries the company has put in place toavoid the conflict regions, pricing is still expected to see modest improvements yearover year for each of the next three quarters. A pickup in non-European bookings(in the Caribbean and Alaska) may also help to pick up any slack for Europe.
With capacity slated to surge 17% in 2000, 23% in 2001, and 16% in 2002, RoyalCaribbean is set to see accelerating momentum in 2000. Our 2000 EPS estimate of$2.20 implies solid 18% growth over our revised 1999 EPS estimate of $1.86.RCL’s stock is currently trading at a 19.0x P/E multiple on our 1999 estimate and ata 16.1x multiple on our 2000 estimate. Valuation represents a steep 32% discountto both its closest competitor, Carnival Corp., and a 37% discount to the S&P 500on our 1999 estimates. Assuming Royal Caribbean trades at its 10-year relativevaluation to the market, or a still conservative 30% discount (a 20x P/E multiple) onour 2000 estimates, we maintain our mid-$40s price target on RCL.
Figure 1. Royal Caribbean Cruises, Ltd.—Comparable Company Valuation Analysis, 1998-2000E
SSB Price Fiscal EPS P/E P/E Rel. S&P 500Ticker Rating 4/27/99 1998A 1999E 2000E 1998A 1999E 2000E 1998A 1999E 2000E
Carnival Corp. CCL 1M 44 $1.40 $1.56 $1.83 31.5x 28.1x 24.1x 1.02x 0.93x 0.80xRoyal Caribbean RCL 2M 35 3/8 1.88 1.86 2.20 18.8x 19.0x 16.1x 0.61x 0.63x 0.53xCruise Index 25.2x 23.6x 20.1x 0.82x 0.78x 0.67x
Brunswick Corp. BC 3M 23 3/8 2.23 2.33 2.70 10.5x 10.0x 8.7x 0.34x 0.33x 0.29xHarley Davidson HDI 1M 59 1/4 1.38 1.67 2.01 42.9x 35.5x 29.5x 1.40x 1.17x 0.98xHasbro, Inc. HAS 1M 33 1.08 1.42 1.50 30.5x 23.3x 22.0x 0.99x 0.77x 0.73xMattel, Inc. MAT 3M 25 13/16 1.20 1.50 1.70 21.4x 17.2x 15.1x 0.70x 0.57x 0.50xLeisure Index 26.3x 21.5x 18.8x 0.86x 0.71x 0.62x
Leisure/Cruise Index 25.8x 22.5x 19.4x 0.84x 0.74x 0.65x
S&P 500 SPX 1,362.80 44.33 45.00 45.25 30.7x 30.3x 30.1x
Source: Company reports and Salomon Smith Barney
Outlook and Valuation
Fighting in Kosovo willlikely crimp earnings
and we have reduced ourexpectations.
However, demand forcruising in other markets
remains firm.
Royal Caribbean offersgreat value.
Royal Caribbean Cruises, Ltd. – April 30, 1999
6
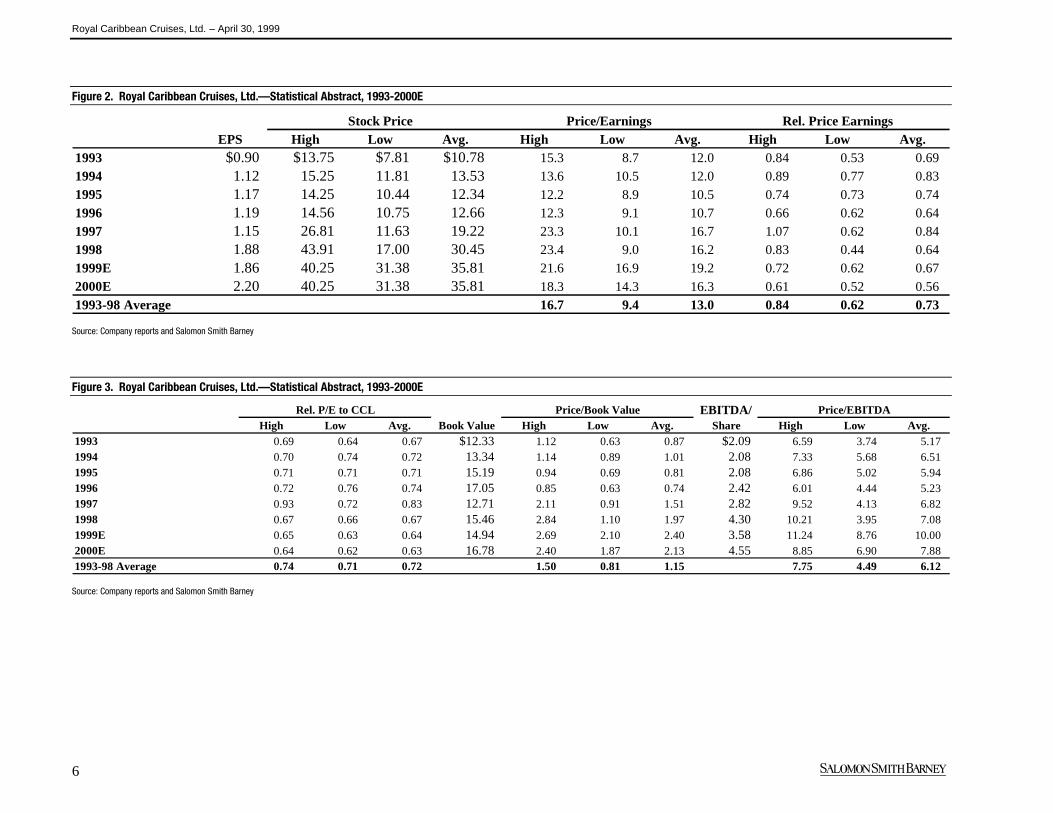
Figure 2. Royal Caribbean Cruises, Ltd.—Statistical Abstract, 1993-2000E
Stock Price Price/Earnings Rel. Price EarningsEPS High Low Avg. High Low Avg. High Low Avg.
1993 $0.90 $13.75 $7.81 $10.78 15.3 8.7 12.0 0.84 0.53 0.69 1994 1.12 15.25 11.81 13.53 13.6 10.5 12.0 0.89 0.77 0.83 1995 1.17 14.25 10.44 12.34 12.2 8.9 10.5 0.74 0.73 0.74 1996 1.19 14.56 10.75 12.66 12.3 9.1 10.7 0.66 0.62 0.64 1997 1.15 26.81 11.63 19.22 23.3 10.1 16.7 1.07 0.62 0.84 1998 1.88 43.91 17.00 30.45 23.4 9.0 16.2 0.83 0.44 0.64 1999E 1.86 40.25 31.38 35.81 21.6 16.9 19.2 0.72 0.62 0.67 2000E 2.20 40.25 31.38 35.81 18.3 14.3 16.3 0.61 0.52 0.56 1993-98 Average 16.7 9.4 13.0 0.84 0.62 0.73
Source: Company reports and Salomon Smith Barney
Figure 3. Royal Caribbean Cruises, Ltd.—Statistical Abstract, 1993-2000E
Rel. P/E to CCL Price/Book Value EBITDA/ Price/EBITDAHigh Low Avg. Book Value High Low Avg. Share High Low Avg.
1993 0.69 0.64 0.67 $12.33 1.12 0.63 0.87 $2.09 6.59 3.74 5.17 1994 0.70 0.74 0.72 13.34 1.14 0.89 1.01 2.08 7.33 5.68 6.51 1995 0.71 0.71 0.71 15.19 0.94 0.69 0.81 2.08 6.86 5.02 5.94 1996 0.72 0.76 0.74 17.05 0.85 0.63 0.74 2.42 6.01 4.44 5.23 1997 0.93 0.72 0.83 12.71 2.11 0.91 1.51 2.82 9.52 4.13 6.82 1998 0.67 0.66 0.67 15.46 2.84 1.10 1.97 4.30 10.21 3.95 7.08 1999E 0.65 0.63 0.64 14.94 2.69 2.10 2.40 3.58 11.24 8.76 10.00 2000E 0.64 0.62 0.63 16.78 2.40 1.87 2.13 4.55 8.85 6.90 7.88 1993-98 Average 0.74 0.71 0.72 1.50 0.81 1.15 7.75 4.49 6.12
Source: Company reports and Salomon Smith Barney
Royal Caribbean Cruises, Ltd. – April 30, 1999
7
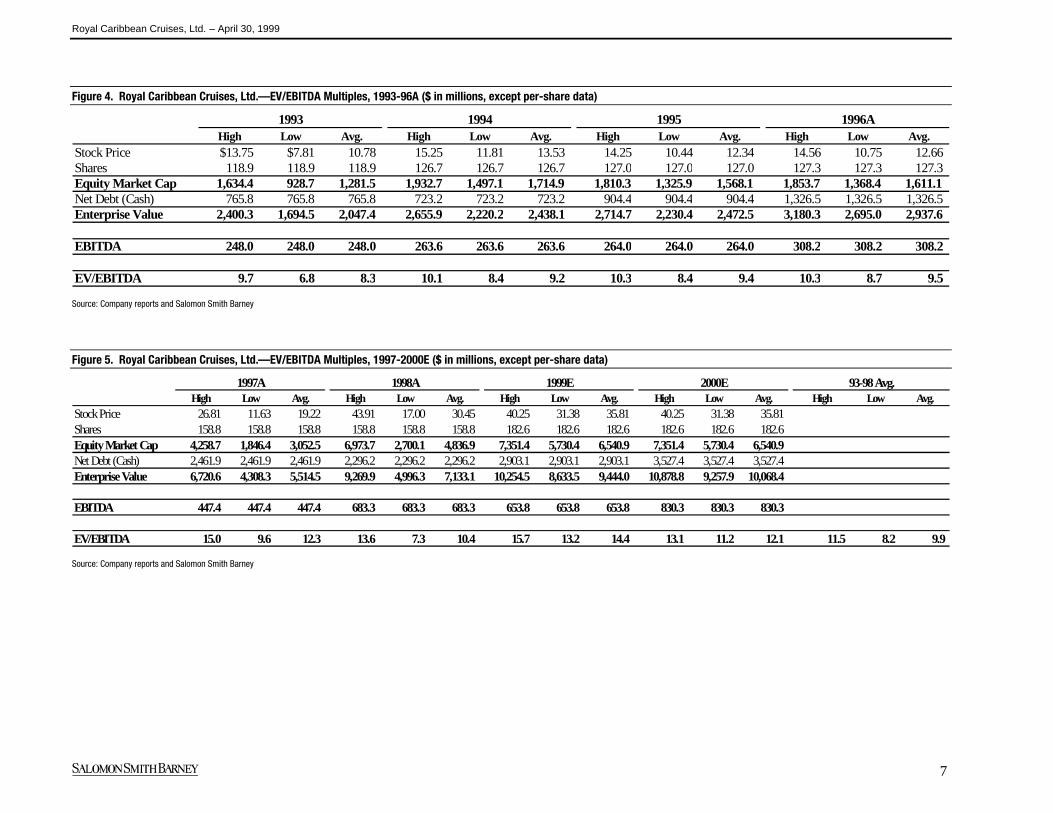
Figure 4. Royal Caribbean Cruises, Ltd.—EV/EBITDA Multiples, 1993-96A ($ in millions, except per-share data)
1993 1994 1995 1996AHigh Low Avg. High Low Avg. High Low Avg. High Low Avg.
Stock Price $13.75 $7.81 10.78 15.25 11.81 13.53 14.25 10.44 12.34 14.56 10.75 12.66 Shares 118.9 118.9 118.9 126.7 126.7 126.7 127.0 127.0 127.0 127.3 127.3 127.3Equity Market Cap 1,634.4 928.7 1,281.5 1,932.7 1,497.1 1,714.9 1,810.3 1,325.9 1,568.1 1,853.7 1,368.4 1,611.1Net Debt (Cash) 765.8 765.8 765.8 723.2 723.2 723.2 904.4 904.4 904.4 1,326.5 1,326.5 1,326.5Enterprise Value 2,400.3 1,694.5 2,047.4 2,655.9 2,220.2 2,438.1 2,714.7 2,230.4 2,472.5 3,180.3 2,695.0 2,937.6
EBITDA 248.0 248.0 248.0 263.6 263.6 263.6 264.0 264.0 264.0 308.2 308.2 308.2
EV/EBITDA 9.7 6.8 8.3 10.1 8.4 9.2 10.3 8.4 9.4 10.3 8.7 9.5
Source: Company reports and Salomon Smith Barney
Figure 5. Royal Caribbean Cruises, Ltd.—EV/EBITDA Multiples, 1997-2000E ($ in millions, except per-share data)
1997A 1998A 1999E 2000E 93-98 Avg.High Low Avg. High Low Avg. High Low Avg. High Low Avg. High Low Avg.
Stock Price 26.81 11.63 19.22 43.91 17.00 30.45 40.25 31.38 35.81 40.25 31.38 35.81 Shares 158.8 158.8 158.8 158.8 158.8 158.8 182.6 182.6 182.6 182.6 182.6 182.6Equity Market Cap 4,258.7 1,846.4 3,052.5 6,973.7 2,700.1 4,836.9 7,351.4 5,730.4 6,540.9 7,351.4 5,730.4 6,540.9Net Debt (Cash) 2,461.9 2,461.9 2,461.9 2,296.2 2,296.2 2,296.2 2,903.1 2,903.1 2,903.1 3,527.4 3,527.4 3,527.4Enterprise Value 6,720.6 4,308.3 5,514.5 9,269.9 4,996.3 7,133.1 10,254.5 8,633.5 9,444.0 10,878.8 9,257.9 10,068.4
EBITDA 447.4 447.4 447.4 683.3 683.3 683.3 653.8 653.8 653.8 830.3 830.3 830.3
EV/EBITDA 15.0 9.6 12.3 13.6 7.3 10.4 15.7 13.2 14.4 13.1 11.2 12.1 11.5 8.2 9.9
Source: Company reports and Salomon Smith Barney
Royal Caribbean Cruises, Ltd. – April 30, 1999
8
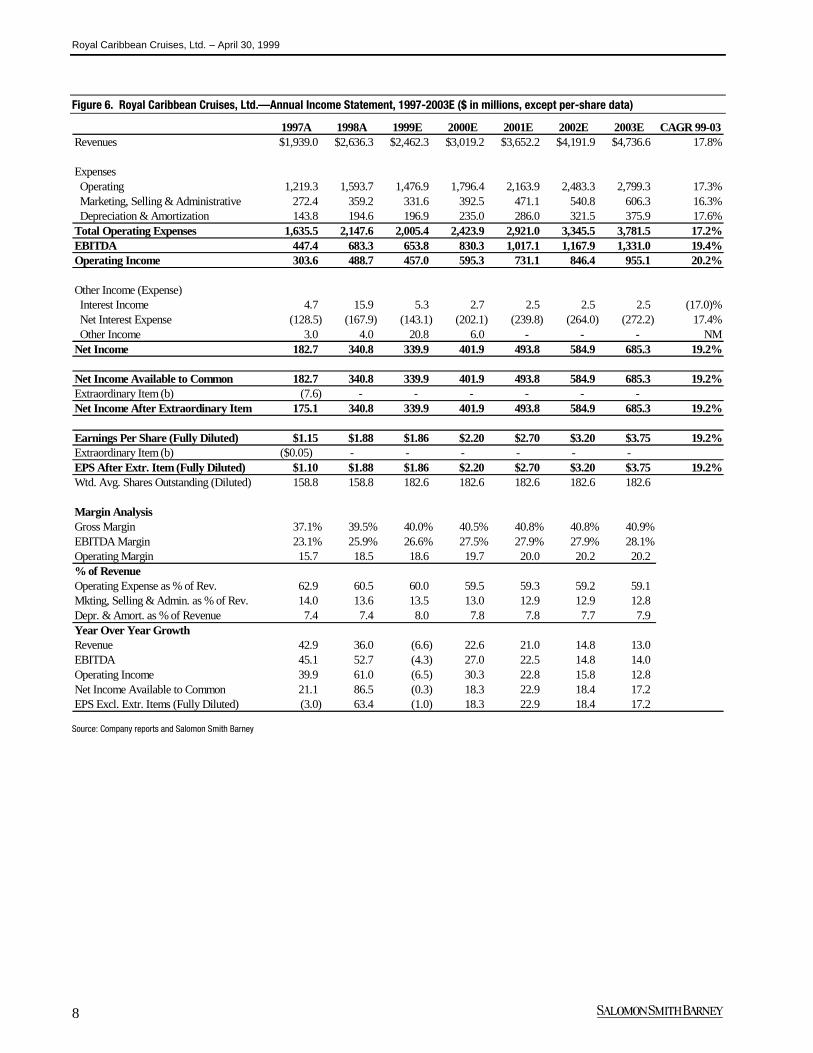
Figure 6. Royal Caribbean Cruises, Ltd.—Annual Income Statement, 1997-2003E ($ in millions, except per-share data)
1997A 1998A 1999E 2000E 2001E 2002E 2003E CAGR 99-03Revenues $1,939.0 $2,636.3 $2,462.3 $3,019.2 $3,652.2 $4,191.9 $4,736.6 17.8%
Expenses Operating 1,219.3 1,593.7 1,476.9 1,796.4 2,163.9 2,483.3 2,799.3 17.3% Marketing, Selling & Administrative 272.4 359.2 331.6 392.5 471.1 540.8 606.3 16.3% Depreciation & Amortization 143.8 194.6 196.9 235.0 286.0 321.5 375.9 17.6%Total Operating Expenses 1,635.5 2,147.6 2,005.4 2,423.9 2,921.0 3,345.5 3,781.5 17.2%EBITDA 447.4 683.3 653.8 830.3 1,017.1 1,167.9 1,331.0 19.4%Operating Income 303.6 488.7 457.0 595.3 731.1 846.4 955.1 20.2%
Other Income (Expense) Interest Income 4.7 15.9 5.3 2.7 2.5 2.5 2.5 (17.0)% Net Interest Expense (128.5) (167.9) (143.1) (202.1) (239.8) (264.0) (272.2) 17.4% Other Income 3.0 4.0 20.8 6.0 - - - NMNet Income 182.7 340.8 339.9 401.9 493.8 584.9 685.3 19.2%
Net Income Available to Common 182.7 340.8 339.9 401.9 493.8 584.9 685.3 19.2%Extraordinary Item (b) (7.6) - - - - - - Net Income After Extraordinary Item 175.1 340.8 339.9 401.9 493.8 584.9 685.3 19.2%
Earnings Per Share (Fully Diluted) $1.15 $1.88 $1.86 $2.20 $2.70 $3.20 $3.75 19.2%Extraordinary Item (b) ($0.05) - - - - - -EPS After Extr. Item (Fully Diluted) $1.10 $1.88 $1.86 $2.20 $2.70 $3.20 $3.75 19.2%Wtd. Avg. Shares Outstanding (Diluted) 158.8 158.8 182.6 182.6 182.6 182.6 182.6
Margin AnalysisGross Margin 37.1% 39.5% 40.0% 40.5% 40.8% 40.8% 40.9%EBITDA Margin 23.1% 25.9% 26.6% 27.5% 27.9% 27.9% 28.1%Operating Margin 15.7 18.5 18.6 19.7 20.0 20.2 20.2 % of RevenueOperating Expense as % of Rev. 62.9 60.5 60.0 59.5 59.3 59.2 59.1 Mkting, Selling & Admin. as % of Rev. 14.0 13.6 13.5 13.0 12.9 12.9 12.8 Depr. & Amort. as % of Revenue 7.4 7.4 8.0 7.8 7.8 7.7 7.9 Year Over Year GrowthRevenue 42.9 36.0 (6.6) 22.6 21.0 14.8 13.0 EBITDA 45.1 52.7 (4.3) 27.0 22.5 14.8 14.0 Operating Income 39.9 61.0 (6.5) 30.3 22.8 15.8 12.8 Net Income Available to Common 21.1 86.5 (0.3) 18.3 22.9 18.4 17.2 EPS Excl. Extr. Items (Fully Diluted) (3.0) 63.4 (1.0) 18.3 22.9 18.4 17.2
Source: Company reports and Salomon Smith Barney
Royal Caribbean Cruises, Ltd. – April 30, 1999
9
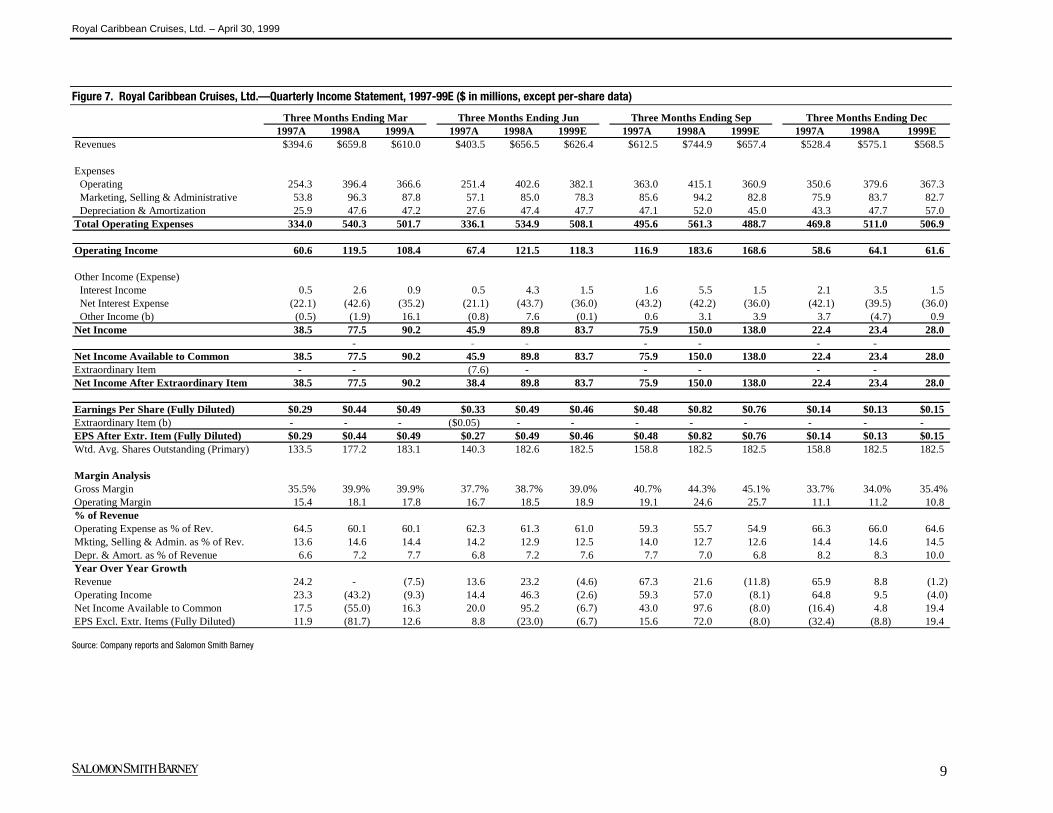
Figure 7. Royal Caribbean Cruises, Ltd.—Quarterly Income Statement, 1997-99E ($ in millions, except per-share data)
Three Months Ending Mar Three Months Ending Jun Three Months Ending Sep Three Months Ending Dec1997A 1998A 1999A 1997A 1998A 1999E 1997A 1998A 1999E 1997A 1998A 1999E
Revenues $394.6 $659.8 $610.0 $403.5 $656.5 $626.4 $612.5 $744.9 $657.4 $528.4 $575.1 $568.5
Expenses Operating 254.3 396.4 366.6 251.4 402.6 382.1 363.0 415.1 360.9 350.6 379.6 367.3 Marketing, Selling & Administrative 53.8 96.3 87.8 57.1 85.0 78.3 85.6 94.2 82.8 75.9 83.7 82.7 Depreciation & Amortization 25.9 47.6 47.2 27.6 47.4 47.7 47.1 52.0 45.0 43.3 47.7 57.0 Total Operating Expenses 334.0 540.3 501.7 336.1 534.9 508.1 495.6 561.3 488.7 469.8 511.0 506.9
Operating Income 60.6 119.5 108.4 67.4 121.5 118.3 116.9 183.6 168.6 58.6 64.1 61.6
Other Income (Expense) Interest Income 0.5 2.6 0.9 0.5 4.3 1.5 1.6 5.5 1.5 2.1 3.5 1.5 Net Interest Expense (22.1) (42.6) (35.2) (21.1) (43.7) (36.0) (43.2) (42.2) (36.0) (42.1) (39.5) (36.0) Other Income (b) (0.5) (1.9) 16.1 (0.8) 7.6 (0.1) 0.6 3.1 3.9 3.7 (4.7) 0.9 Net Income 38.5 77.5 90.2 45.9 89.8 83.7 75.9 150.0 138.0 22.4 23.4 28.0
- - - - - - - Net Income Available to Common 38.5 77.5 90.2 45.9 89.8 83.7 75.9 150.0 138.0 22.4 23.4 28.0 Extraordinary Item - - (7.6) - - - - - Net Income After Extraordinary Item 38.5 77.5 90.2 38.4 89.8 83.7 75.9 150.0 138.0 22.4 23.4 28.0
Earnings Per Share (Fully Diluted) $0.29 $0.44 $0.49 $0.33 $0.49 $0.46 $0.48 $0.82 $0.76 $0.14 $0.13 $0.15Extraordinary Item (b) - - - ($0.05) - - - - - - - -EPS After Extr. Item (Fully Diluted) $0.29 $0.44 $0.49 $0.27 $0.49 $0.46 $0.48 $0.82 $0.76 $0.14 $0.13 $0.15Wtd. Avg. Shares Outstanding (Primary) 133.5 177.2 183.1 140.3 182.6 182.5 158.8 182.5 182.5 158.8 182.5 182.5
Margin AnalysisGross Margin 35.5% 39.9% 39.9% 37.7% 38.7% 39.0% 40.7% 44.3% 45.1% 33.7% 34.0% 35.4%Operating Margin 15.4 18.1 17.8 16.7 18.5 18.9 19.1 24.6 25.7 11.1 11.2 10.8 % of RevenueOperating Expense as % of Rev. 64.5 60.1 60.1 62.3 61.3 61.0 59.3 55.7 54.9 66.3 66.0 64.6 Mkting, Selling & Admin. as % of Rev. 13.6 14.6 14.4 14.2 12.9 12.5 14.0 12.7 12.6 14.4 14.6 14.5 Depr. & Amort. as % of Revenue 6.6 7.2 7.7 6.8 7.2 7.6 7.7 7.0 6.8 8.2 8.3 10.0 Year Over Year GrowthRevenue 24.2 - (7.5) 13.6 23.2 (4.6) 67.3 21.6 (11.8) 65.9 8.8 (1.2) Operating Income 23.3 (43.2) (9.3) 14.4 46.3 (2.6) 59.3 57.0 (8.1) 64.8 9.5 (4.0) Net Income Available to Common 17.5 (55.0) 16.3 20.0 95.2 (6.7) 43.0 97.6 (8.0) (16.4) 4.8 19.4 EPS Excl. Extr. Items (Fully Diluted) 11.9 (81.7) 12.6 8.8 (23.0) (6.7) 15.6 72.0 (8.0) (32.4) (8.8) 19.4
Source: Company reports and Salomon Smith Barney
Royal Caribbean Cruises, Ltd. – April 30, 1999
10
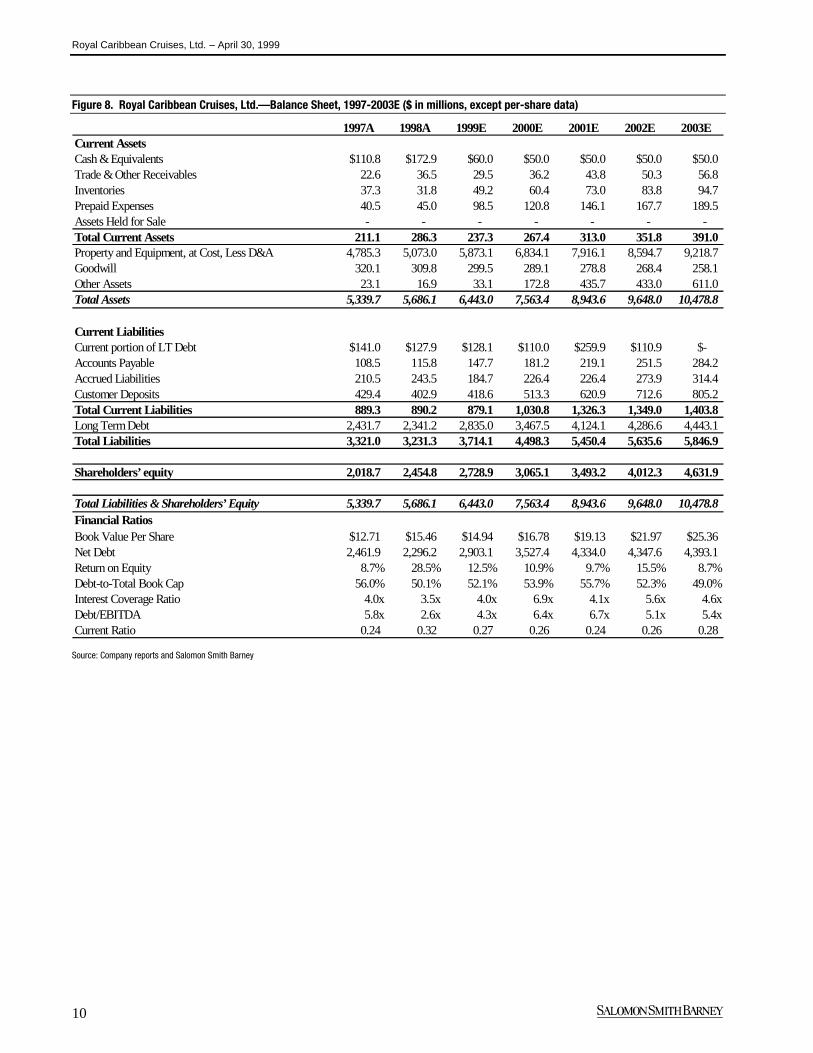
Figure 8. Royal Caribbean Cruises, Ltd.—Balance Sheet, 1997-2003E ($ in millions, except per-share data)
1997A 1998A 1999E 2000E 2001E 2002E 2003ECurrent AssetsCash & Equivalents $110.8 $172.9 $60.0 $50.0 $50.0 $50.0 $50.0Trade & Other Receivables 22.6 36.5 29.5 36.2 43.8 50.3 56.8 Inventories 37.3 31.8 49.2 60.4 73.0 83.8 94.7 Prepaid Expenses 40.5 45.0 98.5 120.8 146.1 167.7 189.5 Assets Held for Sale - - - - - - - Total Current Assets 211.1 286.3 237.3 267.4 313.0 351.8 391.0 Property and Equipment, at Cost, Less D&A 4,785.3 5,073.0 5,873.1 6,834.1 7,916.1 8,594.7 9,218.7 Goodwill 320.1 309.8 299.5 289.1 278.8 268.4 258.1 Other Assets 23.1 16.9 33.1 172.8 435.7 433.0 611.0 Total Assets 5,339.7 5,686.1 6,443.0 7,563.4 8,943.6 9,648.0 10,478.8
Current LiabilitiesCurrent portion of LT Debt $141.0 $127.9 $128.1 $110.0 $259.9 $110.9 $-Accounts Payable 108.5 115.8 147.7 181.2 219.1 251.5 284.2 Accrued Liabilities 210.5 243.5 184.7 226.4 226.4 273.9 314.4 Customer Deposits 429.4 402.9 418.6 513.3 620.9 712.6 805.2 Total Current Liabilities 889.3 890.2 879.1 1,030.8 1,326.3 1,349.0 1,403.8 Long Term Debt 2,431.7 2,341.2 2,835.0 3,467.5 4,124.1 4,286.6 4,443.1 Total Liabilities 3,321.0 3,231.3 3,714.1 4,498.3 5,450.4 5,635.6 5,846.9
Shareholders’ equity 2,018.7 2,454.8 2,728.9 3,065.1 3,493.2 4,012.3 4,631.9
Total Liabilities & Shareholders’ Equity 5,339.7 5,686.1 6,443.0 7,563.4 8,943.6 9,648.0 10,478.8 Financial RatiosBook Value Per Share $12.71 $15.46 $14.94 $16.78 $19.13 $21.97 $25.36Net Debt 2,461.9 2,296.2 2,903.1 3,527.4 4,334.0 4,347.6 4,393.1 Return on Equity 8.7% 28.5% 12.5% 10.9% 9.7% 15.5% 8.7%Debt-to-Total Book Cap 56.0% 50.1% 52.1% 53.9% 55.7% 52.3% 49.0%Interest Coverage Ratio 4.0x 3.5x 4.0x 6.9x 4.1x 5.6x 4.6xDebt/EBITDA 5.8x 2.6x 4.3x 6.4x 6.7x 5.1x 5.4xCurrent Ratio 0.24 0.32 0.27 0.26 0.24 0.26 0.28
Source: Company reports and Salomon Smith Barney
Royal Caribbean Cruises, Ltd. – April 30, 1999
11
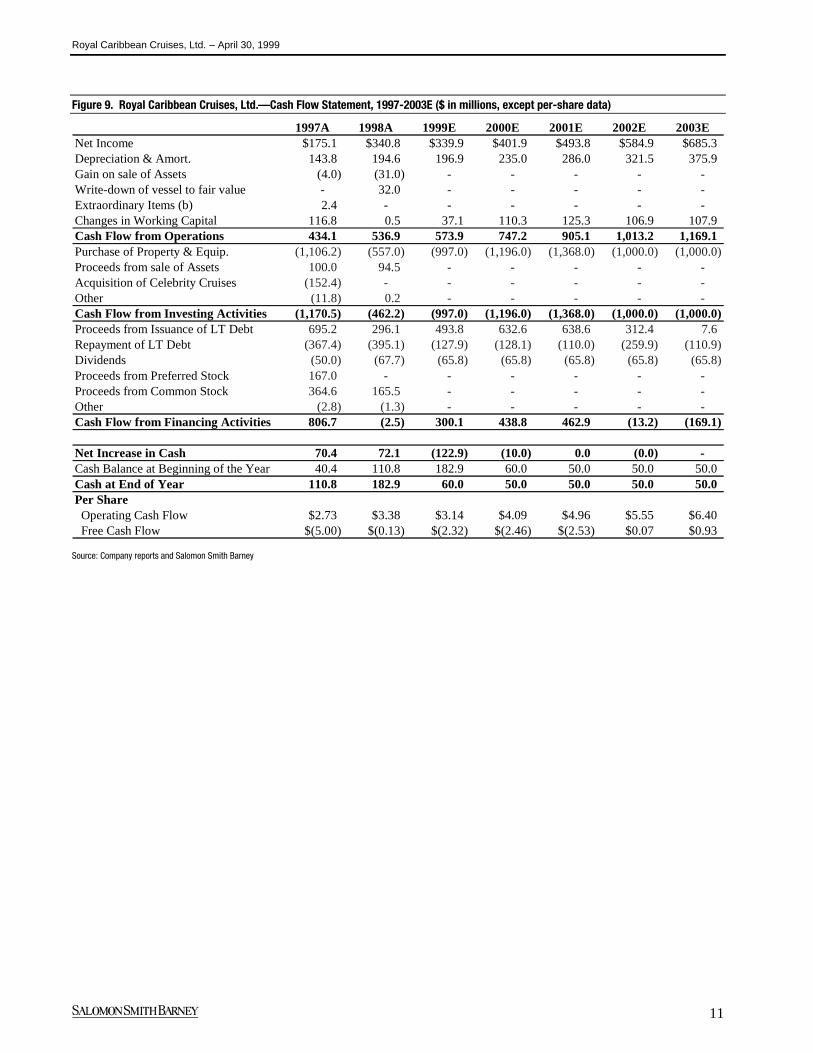
Figure 9. Royal Caribbean Cruises, Ltd.—Cash Flow Statement, 1997-2003E ($ in millions, except per-share data)
1997A 1998A 1999E 2000E 2001E 2002E 2003ENet Income $175.1 $340.8 $339.9 $401.9 $493.8 $584.9 $685.3Depreciation & Amort. 143.8 194.6 196.9 235.0 286.0 321.5 375.9 Gain on sale of Assets (4.0) (31.0) - - - - - Write-down of vessel to fair value - 32.0 - - - - - Extraordinary Items (b) 2.4 - - - - - - Changes in Working Capital 116.8 0.5 37.1 110.3 125.3 106.9 107.9 Cash Flow from Operations 434.1 536.9 573.9 747.2 905.1 1,013.2 1,169.1 Purchase of Property & Equip. (1,106.2) (557.0) (997.0) (1,196.0) (1,368.0) (1,000.0) (1,000.0) Proceeds from sale of Assets 100.0 94.5 - - - - - Acquisition of Celebrity Cruises (152.4) - - - - - - Other (11.8) 0.2 - - - - - Cash Flow from Investing Activities (1,170.5) (462.2) (997.0) (1,196.0) (1,368.0) (1,000.0) (1,000.0) Proceeds from Issuance of LT Debt 695.2 296.1 493.8 632.6 638.6 312.4 7.6 Repayment of LT Debt (367.4) (395.1) (127.9) (128.1) (110.0) (259.9) (110.9) Dividends (50.0) (67.7) (65.8) (65.8) (65.8) (65.8) (65.8) Proceeds from Preferred Stock 167.0 - - - - - - Proceeds from Common Stock 364.6 165.5 - - - - - Other (2.8) (1.3) - - - - - Cash Flow from Financing Activities 806.7 (2.5) 300.1 438.8 462.9 (13.2) (169.1)
Net Increase in Cash 70.4 72.1 (122.9) (10.0) 0.0 (0.0) - Cash Balance at Beginning of the Year 40.4 110.8 182.9 60.0 50.0 50.0 50.0 Cash at End of Year 110.8 182.9 60.0 50.0 50.0 50.0 50.0 Per Share Operating Cash Flow $2.73 $3.38 $3.14 $4.09 $4.96 $5.55 $6.40 Free Cash Flow $(5.00) $(0.13) $(2.32) $(2.46) $(2.53) $0.07 $0.93
Source: Company reports and Salomon Smith Barney
Royal Caribbean Cruises, Ltd. – April 30, 1999
12
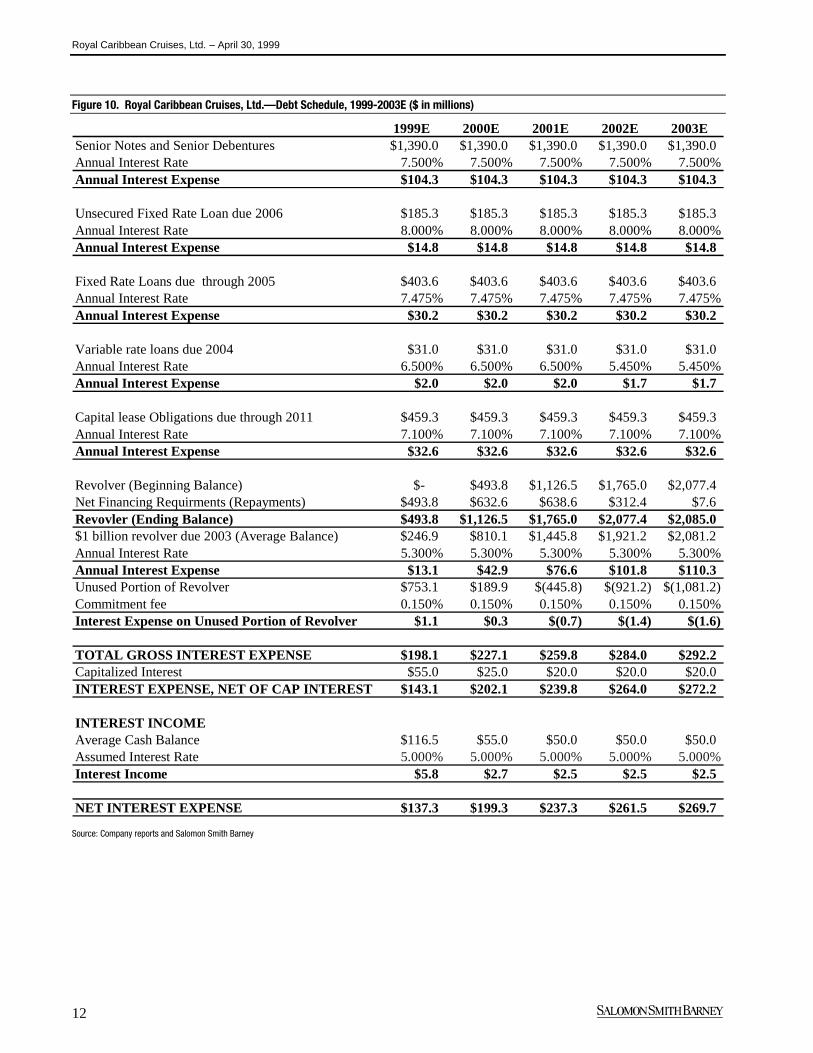
Figure 10. Royal Caribbean Cruises, Ltd.—Debt Schedule, 1999-2003E ($ in millions)
1999E 2000E 2001E 2002E 2003ESenior Notes and Senior Debentures $1,390.0 $1,390.0 $1,390.0 $1,390.0 $1,390.0Annual Interest Rate 7.500% 7.500% 7.500% 7.500% 7.500%Annual Interest Expense $104.3 $104.3 $104.3 $104.3 $104.3
Unsecured Fixed Rate Loan due 2006 $185.3 $185.3 $185.3 $185.3 $185.3Annual Interest Rate 8.000% 8.000% 8.000% 8.000% 8.000%Annual Interest Expense $14.8 $14.8 $14.8 $14.8 $14.8
Fixed Rate Loans due through 2005 $403.6 $403.6 $403.6 $403.6 $403.6Annual Interest Rate 7.475% 7.475% 7.475% 7.475% 7.475%Annual Interest Expense $30.2 $30.2 $30.2 $30.2 $30.2
Variable rate loans due 2004 $31.0 $31.0 $31.0 $31.0 $31.0Annual Interest Rate 6.500% 6.500% 6.500% 5.450% 5.450%Annual Interest Expense $2.0 $2.0 $2.0 $1.7 $1.7
Capital lease Obligations due through 2011 $459.3 $459.3 $459.3 $459.3 $459.3Annual Interest Rate 7.100% 7.100% 7.100% 7.100% 7.100%Annual Interest Expense $32.6 $32.6 $32.6 $32.6 $32.6
Revolver (Beginning Balance) $- $493.8 $1,126.5 $1,765.0 $2,077.4Net Financing Requirments (Repayments) $493.8 $632.6 $638.6 $312.4 $7.6Revovler (Ending Balance) $493.8 $1,126.5 $1,765.0 $2,077.4 $2,085.0$1 billion revolver due 2003 (Average Balance) $246.9 $810.1 $1,445.8 $1,921.2 $2,081.2Annual Interest Rate 5.300% 5.300% 5.300% 5.300% 5.300%Annual Interest Expense $13.1 $42.9 $76.6 $101.8 $110.3Unused Portion of Revolver $753.1 $189.9 $(445.8) $(921.2) $(1,081.2)Commitment fee 0.150% 0.150% 0.150% 0.150% 0.150%Interest Expense on Unused Portion of Revolver $1.1 $0.3 $(0.7) $(1.4) $(1.6)
TOTAL GROSS INTEREST EXPENSE $198.1 $227.1 $259.8 $284.0 $292.2Capitalized Interest $55.0 $25.0 $20.0 $20.0 $20.0INTEREST EXPENSE, NET OF CAP INTEREST $143.1 $202.1 $239.8 $264.0 $272.2
INTEREST INCOMEAverage Cash Balance $116.5 $55.0 $50.0 $50.0 $50.0Assumed Interest Rate 5.000% 5.000% 5.000% 5.000% 5.000%Interest Income $5.8 $2.7 $2.5 $2.5 $2.5
NET INTEREST EXPENSE $137.3 $199.3 $237.3 $261.5 $269.7
Source: Company reports and Salomon Smith Barney
Royal Caribbean Cruises, Ltd. – April 30, 1999
13
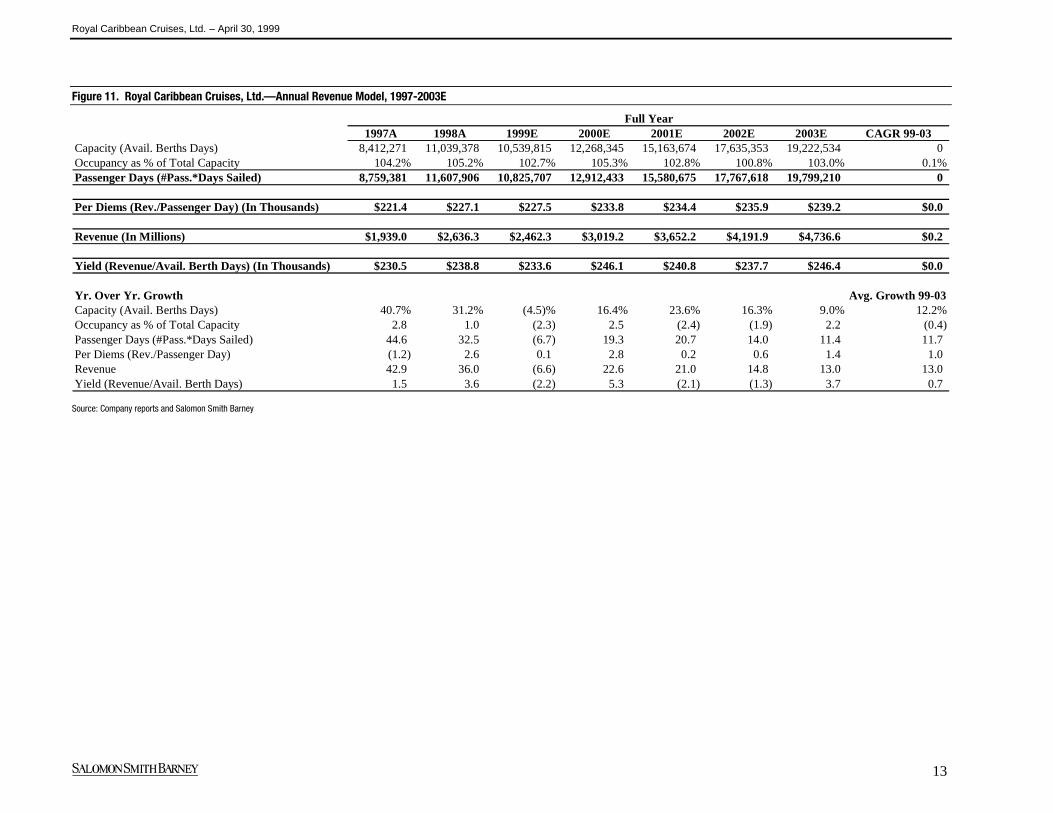
Figure 11. Royal Caribbean Cruises, Ltd.—Annual Revenue Model, 1997-2003E
Full Year1997A 1998A 1999E 2000E 2001E 2002E 2003E CAGR 99-03
Capacity (Avail. Berths Days) 8,412,271 11,039,378 10,539,815 12,268,345 15,163,674 17,635,353 19,222,534 0 Occupancy as % of Total Capacity 104.2% 105.2% 102.7% 105.3% 102.8% 100.8% 103.0% 0.1%Passenger Days (#Pass.*Days Sailed) 8,759,381 11,607,906 10,825,707 12,912,433 15,580,675 17,767,618 19,799,210 0
Per Diems (Rev./Passenger Day) (In Thousands) $221.4 $227.1 $227.5 $233.8 $234.4 $235.9 $239.2 $0.0
Revenue (In Millions) $1,939.0 $2,636.3 $2,462.3 $3,019.2 $3,652.2 $4,191.9 $4,736.6 $0.2
Yield (Revenue/Avail. Berth Days) (In Thousands) $230.5 $238.8 $233.6 $246.1 $240.8 $237.7 $246.4 $0.0
Yr. Over Yr. Growth Avg. Growth 99-03Capacity (Avail. Berths Days) 40.7% 31.2% (4.5)% 16.4% 23.6% 16.3% 9.0% 12.2%Occupancy as % of Total Capacity 2.8 1.0 (2.3) 2.5 (2.4) (1.9) 2.2 (0.4) Passenger Days (#Pass.*Days Sailed) 44.6 32.5 (6.7) 19.3 20.7 14.0 11.4 11.7 Per Diems (Rev./Passenger Day) (1.2) 2.6 0.1 2.8 0.2 0.6 1.4 1.0 Revenue 42.9 36.0 (6.6) 22.6 21.0 14.8 13.0 13.0 Yield (Revenue/Avail. Berth Days) 1.5 3.6 (2.2) 5.3 (2.1) (1.3) 3.7 0.7
Source: Company reports and Salomon Smith Barney
Royal Caribbean Cruises, Ltd. – April 30, 1999
14
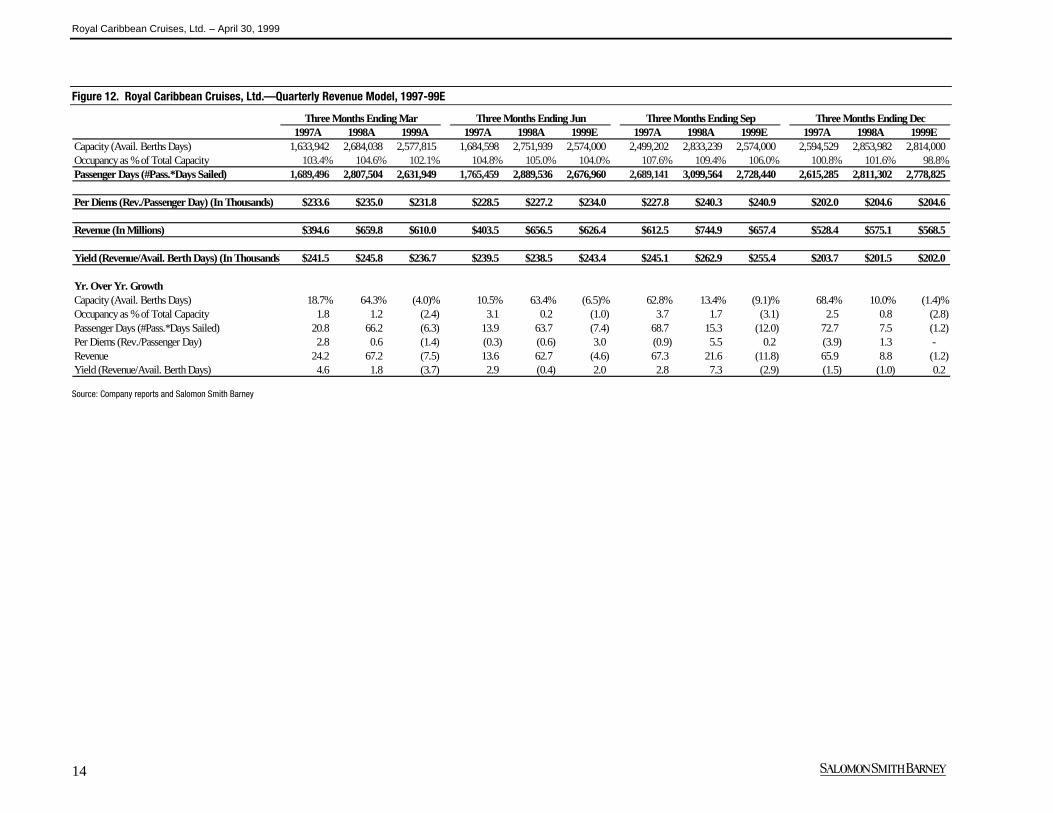
Figure 12. Royal Caribbean Cruises, Ltd.—Quarterly Revenue Model, 1997-99E
Three Months Ending Mar Three Months Ending Jun Three Months Ending Sep Three Months Ending Dec1997A 1998A 1999A 1997A 1998A 1999E 1997A 1998A 1999E 1997A 1998A 1999E
Capacity (Avail. Berths Days) 1,633,942 2,684,038 2,577,815 1,684,598 2,751,939 2,574,000 2,499,202 2,833,239 2,574,000 2,594,529 2,853,982 2,814,000 Occupancy as % of Total Capacity 103.4% 104.6% 102.1% 104.8% 105.0% 104.0% 107.6% 109.4% 106.0% 100.8% 101.6% 98.8%Passenger Days (#Pass.*Days Sailed) 1,689,496 2,807,504 2,631,949 1,765,459 2,889,536 2,676,960 2,689,141 3,099,564 2,728,440 2,615,285 2,811,302 2,778,825
Per Diems (Rev./Passenger Day) (In Thousands) $233.6 $235.0 $231.8 $228.5 $227.2 $234.0 $227.8 $240.3 $240.9 $202.0 $204.6 $204.6
Revenue (In Millions) $394.6 $659.8 $610.0 $403.5 $656.5 $626.4 $612.5 $744.9 $657.4 $528.4 $575.1 $568.5
Yield (Revenue/Avail. Berth Days) (In Thousands) $241.5 $245.8 $236.7 $239.5 $238.5 $243.4 $245.1 $262.9 $255.4 $203.7 $201.5 $202.0
Yr. Over Yr. GrowthCapacity (Avail. Berths Days) 18.7% 64.3% (4.0)% 10.5% 63.4% (6.5)% 62.8% 13.4% (9.1)% 68.4% 10.0% (1.4)%Occupancy as % of Total Capacity 1.8 1.2 (2.4) 3.1 0.2 (1.0) 3.7 1.7 (3.1) 2.5 0.8 (2.8) Passenger Days (#Pass.*Days Sailed) 20.8 66.2 (6.3) 13.9 63.7 (7.4) 68.7 15.3 (12.0) 72.7 7.5 (1.2) Per Diems (Rev./Passenger Day) 2.8 0.6 (1.4) (0.3) (0.6) 3.0 (0.9) 5.5 0.2 (3.9) 1.3 - Revenue 24.2 67.2 (7.5) 13.6 62.7 (4.6) 67.3 21.6 (11.8) 65.9 8.8 (1.2) Yield (Revenue/Avail. Berth Days) 4.6 1.8 (3.7) 2.9 (0.4) 2.0 2.8 7.3 (2.9) (1.5) (1.0) 0.2
Source: Company reports and Salomon Smith Barney

Royal Caribbean Cruises, Ltd. – April 30, 1999
15
Royal Caribbean Cruises, Ltd. – April 30, 1999
16
ADDITIONAL INFORMATION IS AVAILABLE UPON REQUEST US04G347# Within the past three years, Salomon Smith Barney, including its parent, subsidiaries and/or affiliates, has acted as manager or co-manager of a public offering of the securitiesof this company.
Salomon Smith Barney is a U.S.-registered broker-dealer. It is a member of Citigroup Inc and is affiliated with Citibank, N.A., and its subsidiaries and branches worldwide(collectively "Citibank"). Despite those affiliations, securities recommended, offered, sold by, or held at, Salomon Smith Barney: (i) are not insured by the Federal DepositInsurance Corporation; (ii) are not deposits or other obligations of any insured depository institution (including Citibank); and (iii) are subject to investment risks, including thepossible loss of the principal amount invested.
Guide to investment ratings: RANK is a guide to the expected total return over the next 12-18 months. The total return required for a given rank depends on the degree of risk(see below) in a stock. The higher the risk, the higher the required return. For example, a 1 (Buy) rating indicates a total return ranging from 15% or greater for a low-risk stockto 30% or greater for speculative stocks. Estimated returns for other risk categories are scaled accordingly. RISK takes into account predictability of earnings and dividends,financial leverage, and stock price volatility. L (Low Risk): predictable earnings and dividends, suitable for conservative investor. M (Medium Risk): moderately predictableearnings and dividends, suitable for average equity investor. H (High Risk): earnings and dividends are less predictable, suitable for aggressive investor. S (Speculative): verylow predictability of fundamentals and a high degree of volatility, suitable only for investors/traders with diversified portfolios that can withstand material losses. V (Venture):indicates a stock with venture capital characteristics that is suitable for sophisticated investors with a high tolerance for risk and broadly diversified investment portfolios. Athorough explanation of the ratings system is available upon request.
Salomon Smith Barney, including its parent, subsidiaries and/or affiliates ("the Firm"), may from time to time perform investment banking or other services for, or solicitinvestment banking or other business from, any company mentioned in this report. For the securities discussed in this report, the Firm may make a market and may sell to or buyfrom customers on a principal basis. The Firm, or any individuals preparing this report, may at any time have a position in any securities or options of any of the issuers in thisreport. An employee of the Firm may be a director of a company mentioned in this report.
Although the statements of fact in this report have been obtained from and are based upon sources that the Firm believes to be reliable, we do not guarantee their accuracy, andany such information may be incomplete or condensed. All opinions and estimates included in this report constitute the Firm’s judgment as of the date of this report and aresubject to change without notice. This report is for informational purposes only and is not intended as an offer or solicitation with respect to the purchase or sale of any security.
Investing in non-U.S. securities entails certain risks. The securities of non-U.S. issuers may not be registered with, nor be subject to the reporting requirements of, the U.S.Securities and Exchange Commission. There may be limited information available on foreign securities. Foreign companies are generally not subject to uniform audit andreporting standards, practices and requirements comparable to those in the U.S. Securities of some foreign companies may be less liquid and their prices more volatile thansecurities of comparable U.S. companies. In addition, exchange rate movements may have an adverse effect on the value of an investment in a foreign stock and itscorresponding dividend payment for U.S. investors.
Investors who have received this report from the Firm may be prohibited in certain U.S. states from purchasing securities mentioned in this report from Salomon Smith Barney.Please ask your Financial Consultant for additional details.
This publication was prepared by Salomon Smith Barney Inc. and is being distributed in Japan by Nikko Salomon Smith Barney Limited under license. This publication has beenapproved for distribution in the United Kingdom by Salomon Brothers International Limited, which is regulated by the Securities and Futures Authority. The investments andservices contained herein are not available to private customers in the United Kingdom. This report does not take into account the investment objectives, financial situation orparticular needs of any particular person. Investors should obtain individual financial advice based on their own particular circumstances before making an investment decisionon the basis of the recommendations in this report.
The Firm’s research opinions may differ from those of The Robinson-Humphrey Company, LLC, a wholly owned brokerage subsidiary of Salomon Smith Barney Inc.
Salomon Smith Barney is a service mark of Salomon Smith Barney Inc.
© Salomon Smith Barney Inc., 1999. All rights reserved. Any unauthorized use, duplication or disclosure is prohibited by law and will result in prosecution.