Embed Size (px)
Citation preview
2012 SUMMER ENRICHMENT PROGRAM
2012 Program Evaluation Report
Prepared by: Gregory R. Wood, Ph.D.
HausMark Research Services
Steven J. Harvey, Ph.D.
Center for Educational and Career
Advancement (CECA), Inc.
2012 Summer Enrichment Program
Page 1
2012 Summer Enrichment Program P R O G R A M E VA L U A T I O N R E P O R T
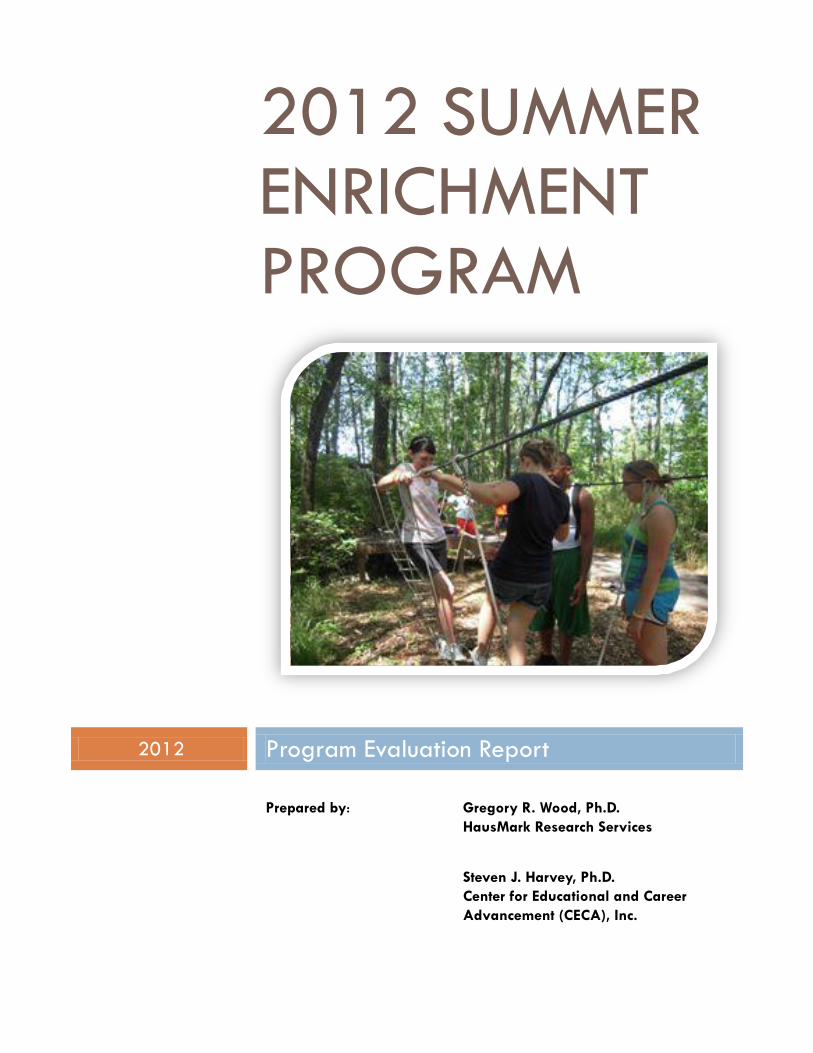
EXECUTIVE SUMMARY Founded in 1888, Cradle Beach has a well-deserved reputation for serving disadvantaged children from
Buffalo, NY by giving them an opportunity for a summer camp experience traditionally available only to
children from higher income families.
The goal of this particular study was to examine the Summer Enrichment Program (SEP) with regard to four
Immediate Outcome variables listed in the organization’s logic model:
Self-Awareness - the ability to detect and decipher
emotions in faces, pictures, voices, and cultural artifacts—
including the ability to identify one's own emotions. Self-
Awareness represents a basic aspect of emotional
intelligence, as it makes all other processing of emotional
information possible.
Social Awareness - the ability to comprehend the
emotional language of others and to appreciate
complicated relationships among emotions. For example,
understanding emotions encompasses the ability to be
sensitive to slight variations between emotions, other
people’s needs and the ability to recognize and describe
how other people’s emotions evolve over time.
Self-Management (Self-Control) - the ability to harness
emotions to facilitate various cognitive activities, such as
thinking and problem solving. The emotionally intelligent
person can capitalize fully upon his or her changing
moods in order to best fit the task at hand.
Relationship Management (Social Competency) the
ability to regulate emotions in both ourselves and in
others. Therefore, the emotionally intelligent person can
harness emotions, even negative ones, and manage them
to achieve intended goals and cultivate relationships.
The study sample consisted of 529 campers who attended Cradle Beach during the summer of 2012.
Campers ranged in age from 8 to 17 (grades 3 to 12). The group was almost evenly divided between boys
and girls (49% male, 51% female). Campers came from a variety of ethnic groups: 50.0% White, 39.3%
African-American, 10% Hispanic, 7.9% Native American, 0.8% Hispanic, and 9.1% “Other”. (The
percentages do not add to 100% because many children indicated that they identify with more than one
ethnic group, reflecting the growing number of mixed race people in our society).
Campers completed surveys at the beginning and end of their camp experience. The surveys measured their
standing on four scales that correspond to the Outcome variables described above.
Four key findings emerged from the study:
1. The Outcome variables appear to be highly interrelated. In other words, a child’s level on one of the
outcome variables appears to be related to their level on one or more of the other outcome variables.
Not surprisingly, the 2 variables dealing with Self-awareness and Self-control are highly correlated
and the 2 variables dealing with social skills and relationships are highly correlated. Finally, the
variables dealing with individual emotions and behavior are highly correlated with the 2 variables
dealing with social skills and relationships, suggesting that the ability to regulate one’s personal
emotions and behavior has some influence on one’s success in social situations. See Table 5.
2012 Summer Enrichment Program
Page 2
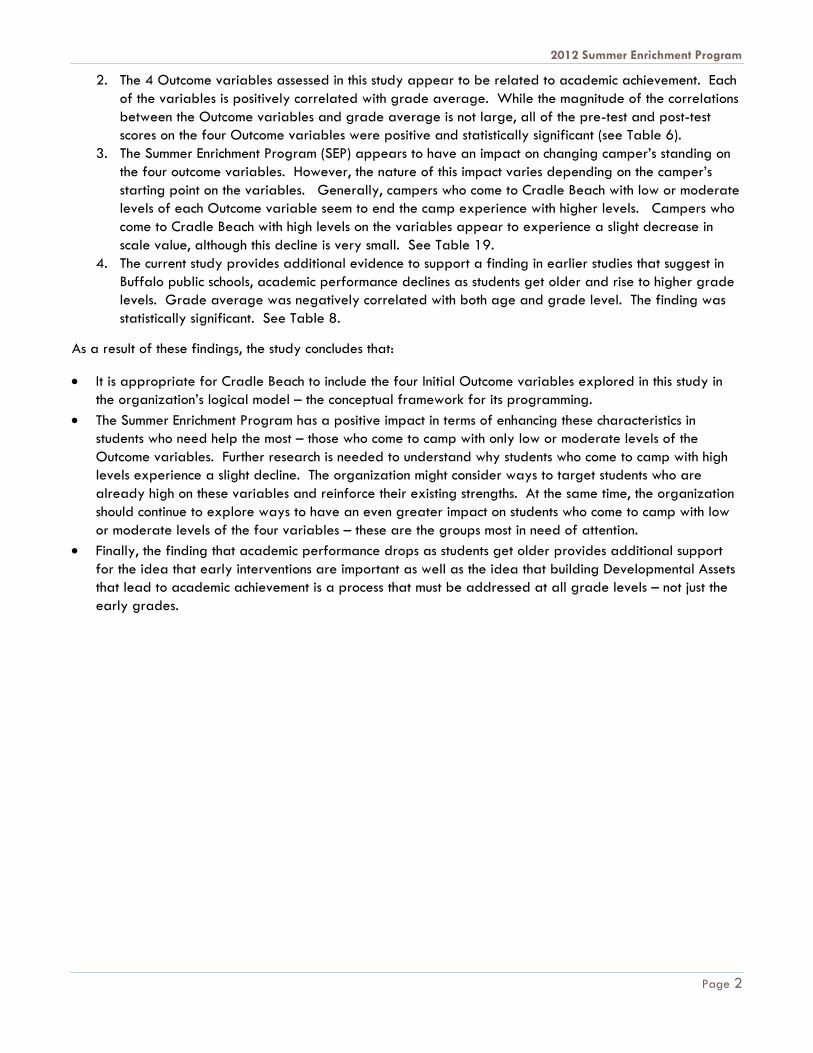
2. The 4 Outcome variables assessed in this study appear to be related to academic achievement. Each
of the variables is positively correlated with grade average. While the magnitude of the correlations
between the Outcome variables and grade average is not large, all of the pre-test and post-test
scores on the four Outcome variables were positive and statistically significant (see Table 6).
3. The Summer Enrichment Program (SEP) appears to have an impact on changing camper’s standing on
the four outcome variables. However, the nature of this impact varies depending on the camper’s
starting point on the variables. Generally, campers who come to Cradle Beach with low or moderate
levels of each Outcome variable seem to end the camp experience with higher levels. Campers who
come to Cradle Beach with high levels on the variables appear to experience a slight decrease in
scale value, although this decline is very small. See Table 19.
4. The current study provides additional evidence to support a finding in earlier studies that suggest in
Buffalo public schools, academic performance declines as students get older and rise to higher grade
levels. Grade average was negatively correlated with both age and grade level. The finding was
statistically significant. See Table 8.
As a result of these findings, the study concludes that:
It is appropriate for Cradle Beach to include the four Initial Outcome variables explored in this study in
the organization’s logical model – the conceptual framework for its programming.
The Summer Enrichment Program has a positive impact in terms of enhancing these characteristics in
students who need help the most – those who come to camp with only low or moderate levels of the
Outcome variables. Further research is needed to understand why students who come to camp with high
levels experience a slight decline. The organization might consider ways to target students who are
already high on these variables and reinforce their existing strengths. At the same time, the organization
should continue to explore ways to have an even greater impact on students who come to camp with low
or moderate levels of the four variables – these are the groups most in need of attention.
Finally, the finding that academic performance drops as students get older provides additional support
for the idea that early interventions are important as well as the idea that building Developmental Assets
that lead to academic achievement is a process that must be addressed at all grade levels – not just the
early grades.
2012 Summer Enrichment Program
Page 3
2012 Summer Enrichment Program P R O G R A M E VA L U A T I O N R E P O R T
INTRODUCTION
Cradle Beach History
Founded in 1888, Cradle Beach has a well-deserved reputation for serving disadvantaged children from the
metropolitan Buffalo, NY area by giving them an opportunity for a summer camp experience traditionally
available only to children from higher income families. The Cradle Beach camp, located on the shores of Lake
Erie, provided an opportunity for these children to experience a range of outdoor activities in a natural, rural
setting. In 1946, the organization expanded its mission by offering camp experiences to children with
physical and developmental challenges. They pioneered an approach to working with these children that
emphasized integrating the special needs group with their traditional camper population. This was based on
the belief that integration provided important experiential, attitudinal and behavioral benefits to both
groups. The success of Cradle Beach’s innovative approach to working with both disadvantaged and special
needs children is well known. It is one of the most beloved and highly regarded not-for-profit organizations in
the Western New York region.
In 2010, Cradle Beach expanded its operations further in an attempt to help the community address
significant performance deficits in the Buffalo public school system – the district where most of its camper
population came from. The Cradle Beach/Project SOAR program is a school based intervention that operates
during months where camp activity is traditionally slow. This pilot program places Cradle Beach staff in
School 43 to provide support and assistance to teachers and staff during the school day and operates a
range of after-school programming designed to enhance and reinforce students’ academic experiences. This
year (2012), for the first time, Cradle Beach will be delivering services to a target group of children on a
continuous basis that involves both school-based and summer camp contact.
Program Description
While project SOAR, the school based program, has been the focus of other program evaluation studies1, this
report focuses on the impact of the traditional Summer Enrichment Program (SEP). The Cradle Beach camp,
“… is over 60 acres of beach, woods, nature trails and open space. The camp facilities include 15 cabins,
large dining and recreation hall, infirmary, computer lab, library, and an arts and crafts center. All facilities
are designed to meet the special needs of our campers. Outdoor facilities include a tennis court, basketball
court, baseball field, walking-hiking trails, low ropes course, a universally accessible playground, adaptive
challenge course and a swimming pool that is one of very few in the state to be fully accessible to all
children.”2
Cradle Beach programming is designed to build Developmental Assets into the lives of children. Extensive
research by the Search Institute3 shows that the more Assets a child has in his or her life the more likely he or
she is to grow up to be a responsible and caring adult. Developmental Assets are related to important
characteristics such as:
2012 Summer Enrichment Program
Page 4
Social Competency
Positive Identity
Positive Values
Commitment to Learning
Constructive Time Use
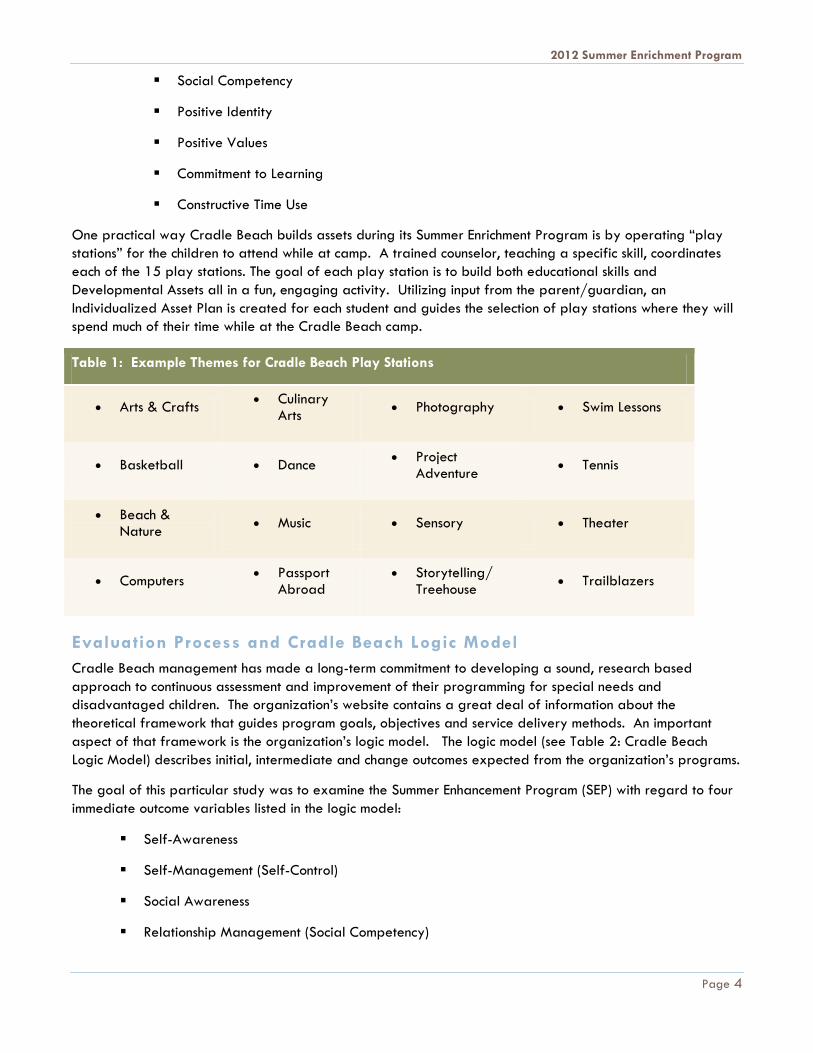
One practical way Cradle Beach builds assets during its Summer Enrichment Program is by operating “play
stations” for the children to attend while at camp. A trained counselor, teaching a specific skill, coordinates
each of the 15 play stations. The goal of each play station is to build both educational skills and
Developmental Assets all in a fun, engaging activity. Utilizing input from the parent/guardian, an
Individualized Asset Plan is created for each student and guides the selection of play stations where they will
spend much of their time while at the Cradle Beach camp.
Table 1: Example Themes for Cradle Beach Play Stations
Arts & Crafts Culinary
Arts Photography Swim Lessons
Basketball Dance Project
Adventure Tennis
Beach & Nature
Music Sensory Theater
Computers Passport
Abroad Storytelling/
Treehouse Trailblazers
Evaluation Process and Cradle Beach Logic Model
Cradle Beach management has made a long-term commitment to developing a sound, research based
approach to continuous assessment and improvement of their programming for special needs and
disadvantaged children. The organization’s website contains a great deal of information about the
theoretical framework that guides program goals, objectives and service delivery methods. An important
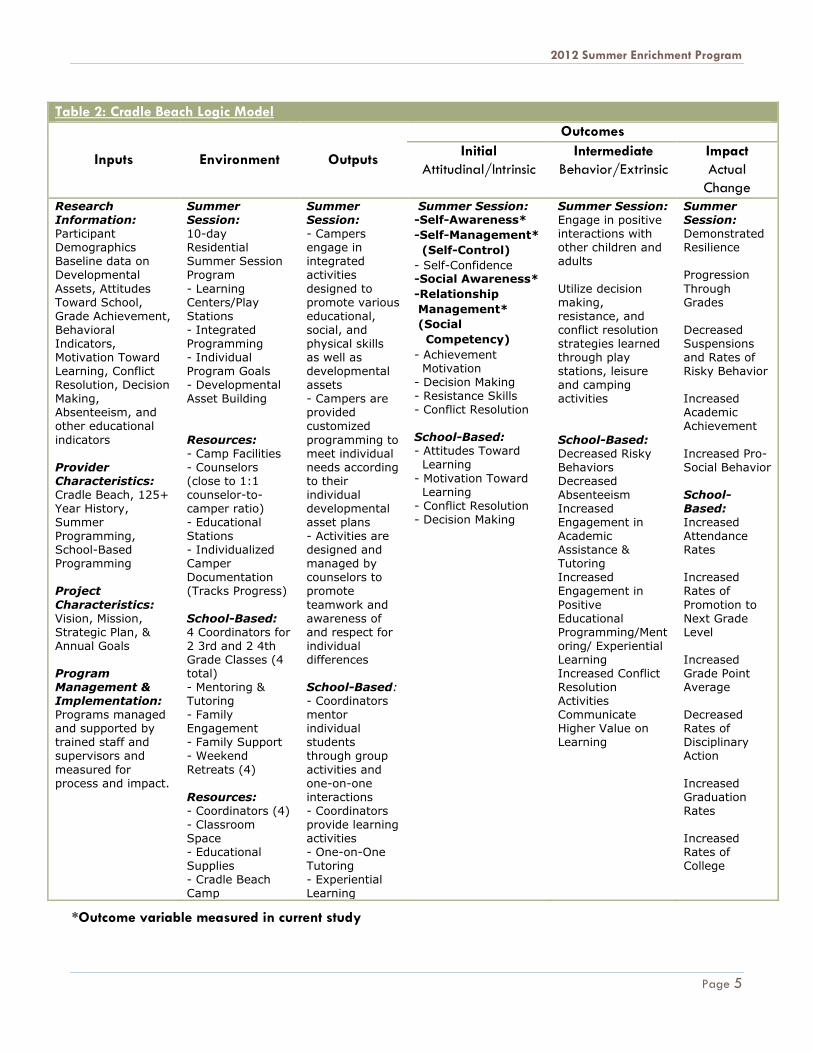
aspect of that framework is the organization’s logic model. The logic model (see Table 2: Cradle Beach
Logic Model) describes initial, intermediate and change outcomes expected from the organization’s programs.
The goal of this particular study was to examine the Summer Enhancement Program (SEP) with regard to four
immediate outcome variables listed in the logic model:
Self-Awareness
Self-Management (Self-Control)
Social Awareness
Relationship Management (Social Competency)
2012 Summer Enrichment Program
Page 5
Table 2: Cradle Beach Logic Model
Inputs Environment Outputs
Outcomes
Initial
Attitudinal/Intrinsic
Intermediate
Behavior/Extrinsic
Impact
Actual
Change
Research Information: Participant Demographics Baseline data on Developmental
Assets, Attitudes Toward School, Grade Achievement, Behavioral Indicators, Motivation Toward Learning, Conflict Resolution, Decision Making, Absenteeism, and other educational
indicators Provider Characteristics: Cradle Beach, 125+ Year History, Summer Programming, School-Based Programming Project
Characteristics: Vision, Mission, Strategic Plan, & Annual Goals Program Management & Implementation: Programs managed and supported by trained staff and supervisors and
measured for process and impact.
Summer Session: 10-day Residential Summer Session Program
- Learning Centers/Play Stations - Integrated Programming - Individual Program Goals - Developmental Asset Building
Resources: - Camp Facilities - Counselors (close to 1:1 counselor-to-camper ratio) - Educational Stations - Individualized Camper Documentation (Tracks Progress)
School-Based: 4 Coordinators for 2 3rd and 2 4th Grade Classes (4 total) - Mentoring & Tutoring - Family Engagement - Family Support - Weekend
Retreats (4) Resources: - Coordinators (4) - Classroom Space - Educational Supplies - Cradle Beach Camp
Summer Session: - Campers engage in integrated activities
designed to promote various educational, social, and physical skills as well as developmental assets - Campers are provided customized
programming to meet individual needs according to their individual developmental asset plans - Activities are designed and managed by counselors to promote
teamwork and awareness of and respect for individual differences School-Based: - Coordinators mentor individual students through group
activities and one-on-one interactions - Coordinators provide learning activities - One-on-One Tutoring - Experiential Learning
Summer Session: -Self-Awareness*
-Self-Management*
(Self-Control)
- Self-Confidence -Social Awareness*
-Relationship
Management*
(Social
Competency)
- Achievement Motivation - Decision Making - Resistance Skills - Conflict Resolution School-Based: - Attitudes Toward Learning
- Motivation Toward Learning - Conflict Resolution - Decision Making
Summer Session: Engage in positive interactions with other children and adults
Utilize decision making, resistance, and conflict resolution strategies learned through play stations, leisure and camping activities
School-Based: Decreased Risky Behaviors Decreased Absenteeism Increased Engagement in Academic Assistance & Tutoring Increased Engagement in
Positive Educational Programming/Mentoring/ Experiential Learning Increased Conflict Resolution Activities Communicate Higher Value on Learning
Summer Session: Demonstrated Resilience Progression
Through Grades Decreased Suspensions and Rates of Risky Behavior Increased Academic Achievement
Increased Pro-Social Behavior School-Based: Increased Attendance Rates Increased Rates of
Promotion to Next Grade Level Increased Grade Point Average Decreased Rates of Disciplinary Action
Increased Graduation Rates Increased Rates of College
*Outcome variable measured in current study
2012 Summer Enrichment Program
Page 6
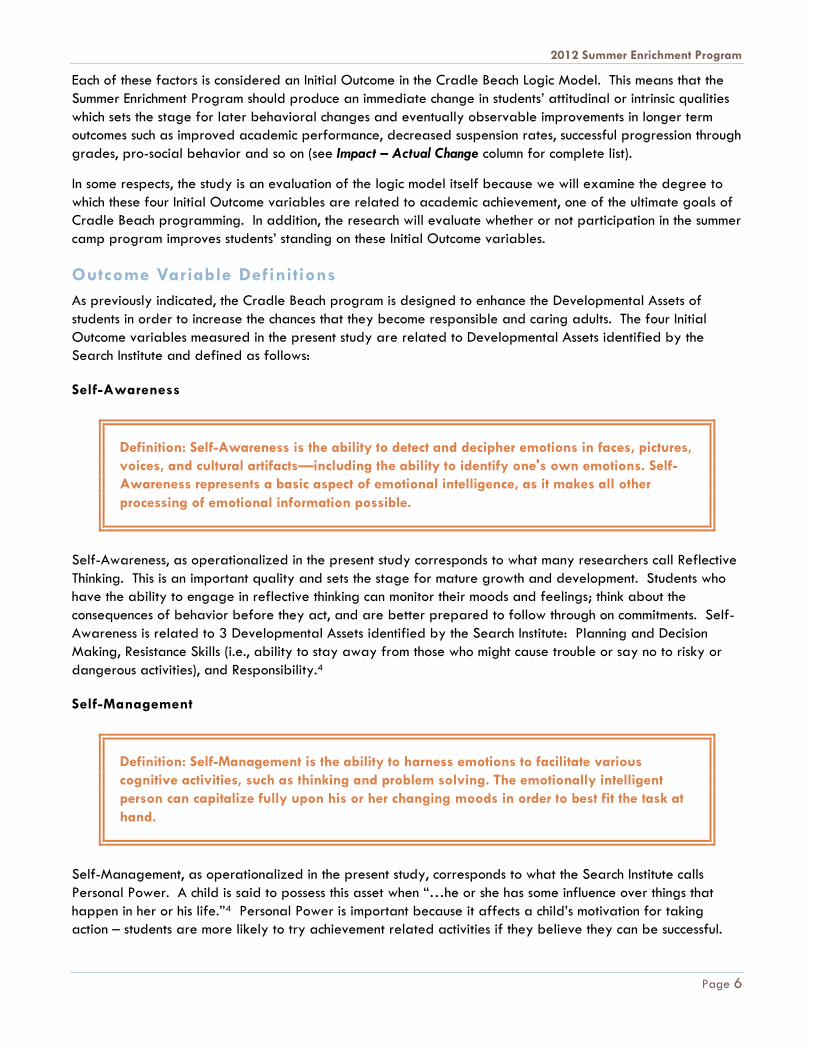
Each of these factors is considered an Initial Outcome in the Cradle Beach Logic Model. This means that the
Summer Enrichment Program should produce an immediate change in students’ attitudinal or intrinsic qualities
which sets the stage for later behavioral changes and eventually observable improvements in longer term
outcomes such as improved academic performance, decreased suspension rates, successful progression through
grades, pro-social behavior and so on (see Impact – Actual Change column for complete list).
In some respects, the study is an evaluation of the logic model itself because we will examine the degree to
which these four Initial Outcome variables are related to academic achievement, one of the ultimate goals of
Cradle Beach programming. In addition, the research will evaluate whether or not participation in the summer
camp program improves students’ standing on these Initial Outcome variables.
Outcome Variable Definitions
As previously indicated, the Cradle Beach program is designed to enhance the Developmental Assets of
students in order to increase the chances that they become responsible and caring adults. The four Initial
Outcome variables measured in the present study are related to Developmental Assets identified by the
Search Institute and defined as follows:
Self-Awareness
Definition: Self-Awareness is the ability to detect and decipher emotions in faces, pictures,
voices, and cultural artifacts—including the ability to identify one's own emotions. Self-
Awareness represents a basic aspect of emotional intelligence, as it makes all other
processing of emotional information possible.
Self-Awareness, as operationalized in the present study corresponds to what many researchers call Reflective
Thinking. This is an important quality and sets the stage for mature growth and development. Students who
have the ability to engage in reflective thinking can monitor their moods and feelings; think about the
consequences of behavior before they act, and are better prepared to follow through on commitments. Self-
Awareness is related to 3 Developmental Assets identified by the Search Institute: Planning and Decision
Making, Resistance Skills (i.e., ability to stay away from those who might cause trouble or say no to risky or
dangerous activities), and Responsibility.4
Self-Management
Definition: Self-Management is the ability to harness emotions to facilitate various
cognitive activities, such as thinking and problem solving. The emotionally intelligent
person can capitalize fully upon his or her changing moods in order to best fit the task at
hand.
Self-Management, as operationalized in the present study, corresponds to what the Search Institute calls
Personal Power. A child is said to possess this asset when “…he or she has some influence over things that
happen in her or his life.”4 Personal Power is important because it affects a child’s motivation for taking
action – students are more likely to try achievement related activities if they believe they can be successful.
2012 Summer Enrichment Program
Page 7
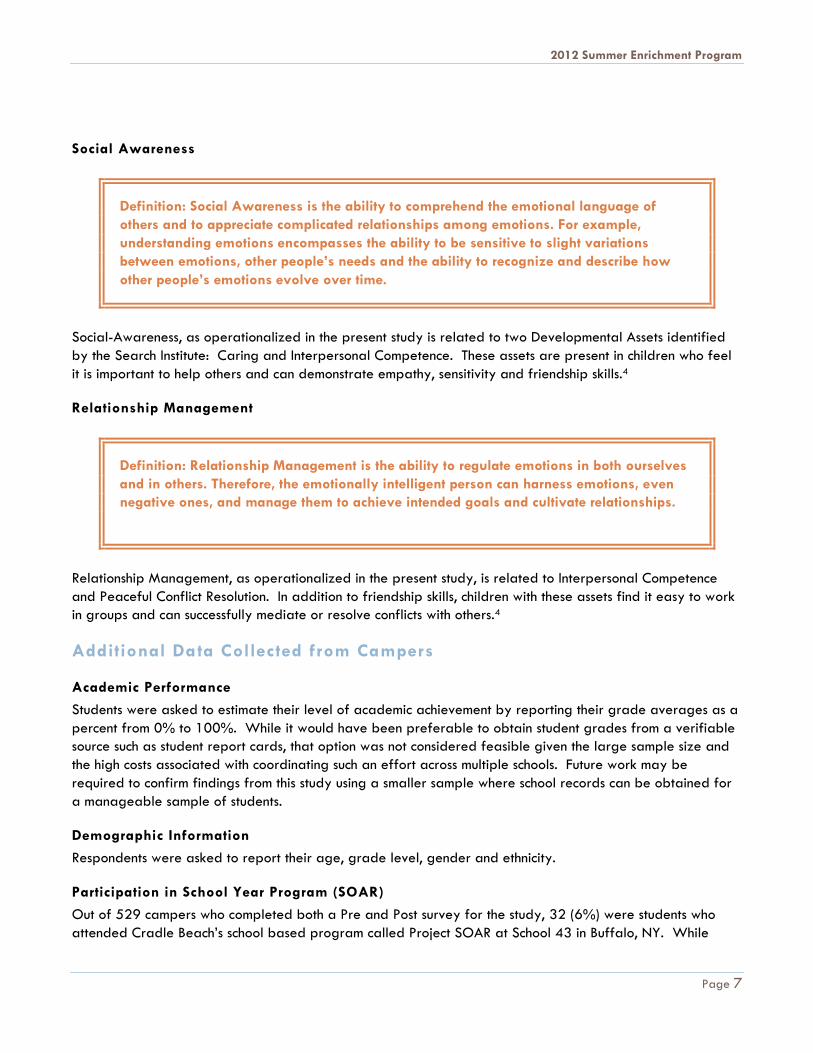
Social Awareness
Definition: Social Awareness is the ability to comprehend the emotional language of
others and to appreciate complicated relationships among emotions. For example,
understanding emotions encompasses the ability to be sensitive to slight variations
between emotions, other people’s needs and the ability to recognize and describe how
other people’s emotions evolve over time.
Social-Awareness, as operationalized in the present study is related to two Developmental Assets identified
by the Search Institute: Caring and Interpersonal Competence. These assets are present in children who feel
it is important to help others and can demonstrate empathy, sensitivity and friendship skills.4
Relationship Management
Definition: Relationship Management is the ability to regulate emotions in both ourselves
and in others. Therefore, the emotionally intelligent person can harness emotions, even
negative ones, and manage them to achieve intended goals and cultivate relationships.
Relationship Management, as operationalized in the present study, is related to Interpersonal Competence
and Peaceful Conflict Resolution. In addition to friendship skills, children with these assets find it easy to work
in groups and can successfully mediate or resolve conflicts with others.4
Additional Data Collected from Campers
Academic Performance
Students were asked to estimate their level of academic achievement by reporting their grade averages as a
percent from 0% to 100%. While it would have been preferable to obtain student grades from a verifiable
source such as student report cards, that option was not considered feasible given the large sample size and
the high costs associated with coordinating such an effort across multiple schools. Future work may be
required to confirm findings from this study using a smaller sample where school records can be obtained for
a manageable sample of students.
Demographic Information
Respondents were asked to report their age, grade level, gender and ethnicity.
Participation in School Year Program (SOAR)
Out of 529 campers who completed both a Pre and Post survey for the study, 32 (6%) were students who
attended Cradle Beach’s school based program called Project SOAR at School 43 in Buffalo, NY. While
2012 Summer Enrichment Program
Page 8
SOAR students make up a relatively small portion of the camper population, it should be noted that over half
of all the students who participated the Project SOAR school year program (approximately 60 students) also
attended the summer camp. We suspect that participation in project SOAR greatly increases the probability
that a student will attend the summer camp program for a variety of reasons including exposure to
information about the camp, parent comfort levels with the organization based on their school year
experience, desire to continue receiving the benefits of Cradle Beach programming and so on.
Specific Research Questions Answered in this Study
The current study was conducted to answer the following questions:
1. Is there a relationship between the 4 target psychological variables (Self-Awareness, Self-Management,
Social Awareness and Relationship Management) and academic performance?
The answer to this question will help determine if it is appropriate for these 4 variables to be considered
useful Immediate Outcome variables in the Cradle Beach Logic Model.
2. Are the 4 target psychological variables related to each other in some way? For instance, are people who
possess high qualities of Self-Awareness more likely to also have high levels of Social Awareness?
The answer to this question will shed light on the nature of the 4 target variables and determine if these
characteristics tend to appear together in people or if the presence of one characteristic is independent
of the others.
3. Does the camp experience change students’ standing on the 4 target psychological variables?
The answer to this question will help determine if the programming at Cradle Beach’s Summer
Enhancement Program has an immediate impact on the 4 target variables being studied.
4. How are Age and Grade Level related to academic achievement?
The large sample size in this study will allow further exploration of a finding in earlier Cradle Beach
research studies – that academic performance, measured by grade average, seems to decline as students
get older and rise to higher grade levels.
Research Methods
Sample Selection
As previously indicated, data was collected from 529 campers in the Cradle Beach Summer Enhancement
Program. Campers fit the traditional Cradle Beach profile as being either disadvantaged, special needs
children, or both. It is presumed that most of the campers are students in the Buffalo Public School System;
however, Cradle Beach accepts applications from throughout the Western New York region so it is not
possible to tell how many school districts are represented in the current sample
Survey Instrument and Data Collection
Campers completed a survey at both the beginning and completion of their camp experience. The “pre-test”
survey consisted of a brief list of demographic questions and 4 separate sets of questions that corresponded
to the target outcome variables identified previously. For each outcome variable, students answered either 7
or 8 questions relating to the construct. The “post-test” questions were identical to the “pre-test” questions.
2012 Summer Enrichment Program
Page 9
Survey items consisted of statements that corresponded to each of the target variable constructs. Students
responded to these statements using a 0 to 6 scale with the labels “Not at all True”, “Slightly True”, “Quite
True” and “Extremely True” appearing under the 0, 2, 4 and 6 ratings respectively.
A copy of the survey instruments appears in the appendix of this report.
Research Design and Analysis
Scale values for each of the four target variables were calculated by first reversing the values of negatively
worded statements, and then adding the responses together. Finally, each scale value total was divided by
the number of items in the scale to determine the average scale rating for each respondent. (Scale value
scores were not calculated for those respondents who failed to answer one or more of the items in the scale.)
This process was carried out separately for the pre-test data and the post-test data. This resulted in a pre-
test and post-test scale score for each target variable for most of the respondents.
Differences between the pre and post-test scale scores were determined using a paired samples T Test
procedure. In addition, the relationship between the target outcome variables and other variables in the
study was determined using a Pearson correlation statistic.
RESULTS
Demographic Characteristics
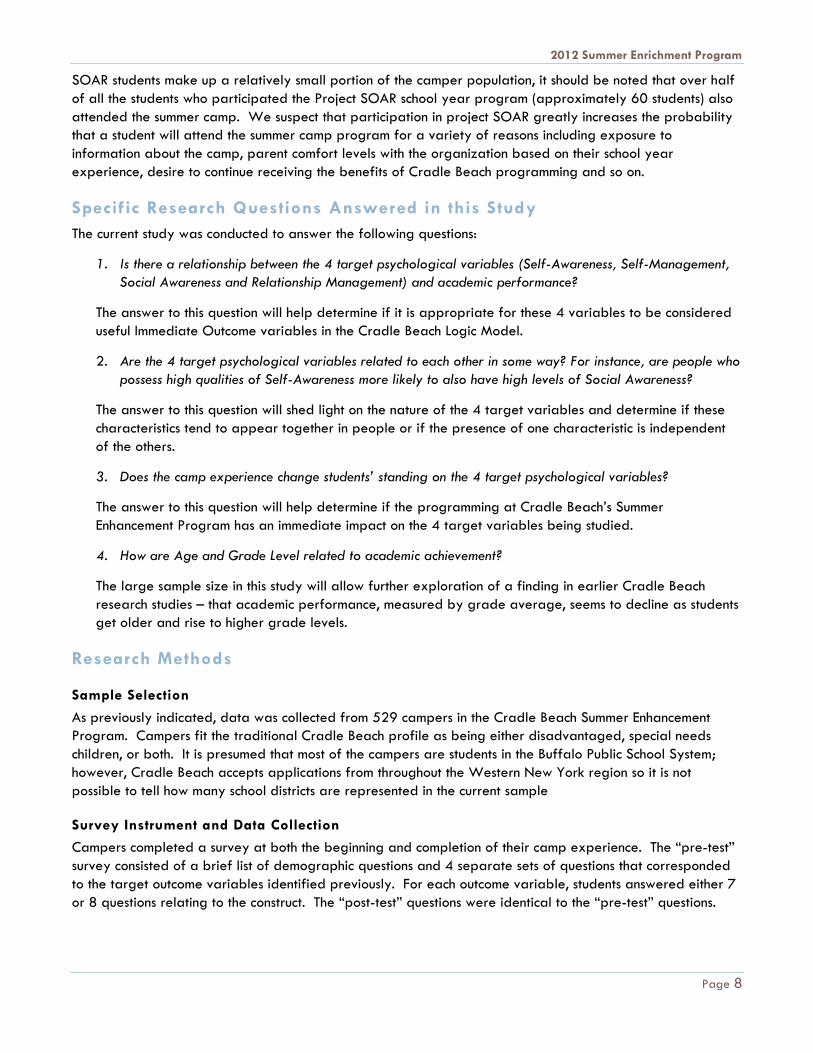
The study sample consisted of 529 campers who attended Cradle Beach during the summer of 2012. Tables
3 through 6 describe the sample in terms of grade level, gender, ethnicity and academic proficiency (grade
average).
Table 3: Distribution of Camper Grade Levels
Grade Frequency Percent Valid Percent Cumulative
Percent
3.00 22 4.2 4.3 4.3
4.00 62 11.7 12.1 16.3
5.00 80 15.1 15.6 31.9
6.00 79 14.9 15.4 47.3
7.00 62 11.7 12.1 59.3
8.00 57 10.8 11.1 70.4
9.00 68 12.9 13.2 83.7
10.00 38 7.2 7.4 91.1
11.00 38 7.2 7.4 98.4
12.00 8 1.5 1.6 100.0
Total 514 97.2 100.0
Missing Data 15 2.6
Total 529 100.0
2012 Summer Enrichment Program
Page 10
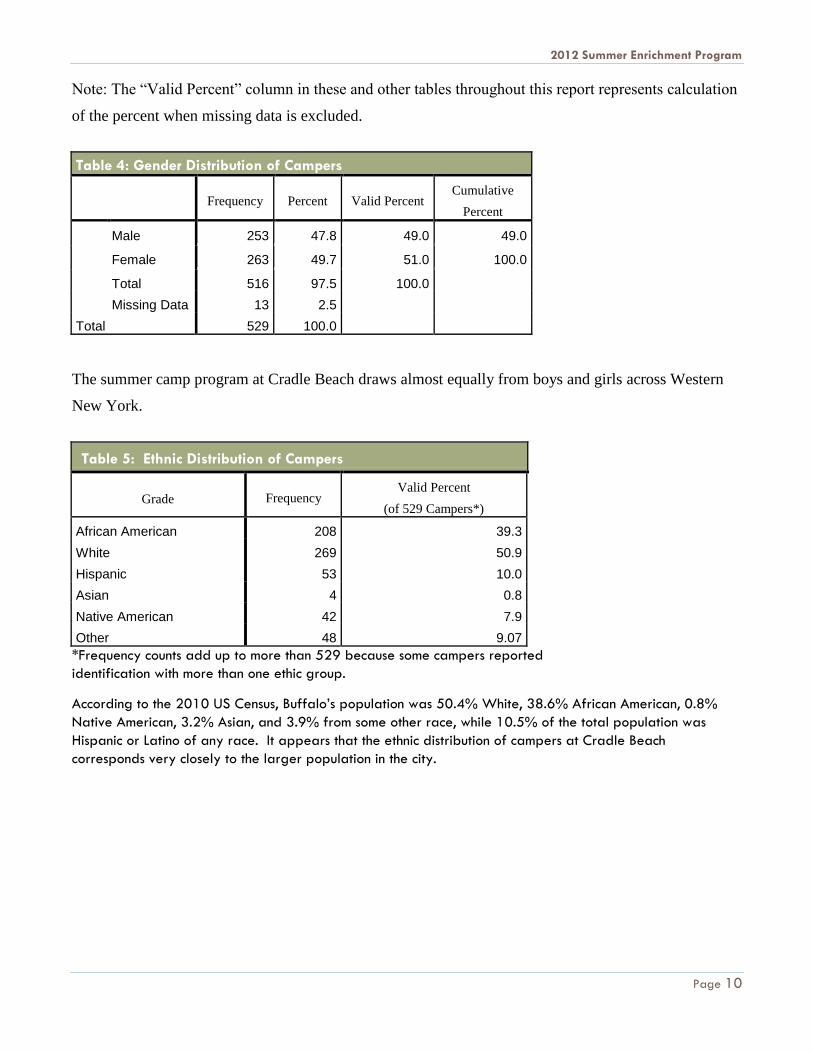
Note: The “Valid Percent” column in these and other tables throughout this report represents calculation
of the percent when missing data is excluded.
Table 4: Gender Distribution of Campers
Frequency Percent Valid Percent Cumulative
Percent
Male 253 47.8 49.0 49.0
Female 263 49.7 51.0 100.0
Total 516 97.5 100.0
Missing Data 13 2.5
Total 529 100.0
The summer camp program at Cradle Beach draws almost equally from boys and girls across Western
New York.
Table 5: Ethnic Distribution of Campers
Grade Frequency Valid Percent
(of 529 Campers*)
African American 208 39.3
White 269 50.9
Hispanic 53 10.0
Asian 4 0.8
Native American 42 7.9
Other 48 9.07
*Frequency counts add up to more than 529 because some campers reported
identification with more than one ethic group.
According to the 2010 US Census, Buffalo’s population was 50.4% White, 38.6% African American, 0.8%
Native American, 3.2% Asian, and 3.9% from some other race, while 10.5% of the total population was
Hispanic or Latino of any race. It appears that the ethnic distribution of campers at Cradle Beach
corresponds very closely to the larger population in the city.
2012 Summer Enrichment Program
Page 11
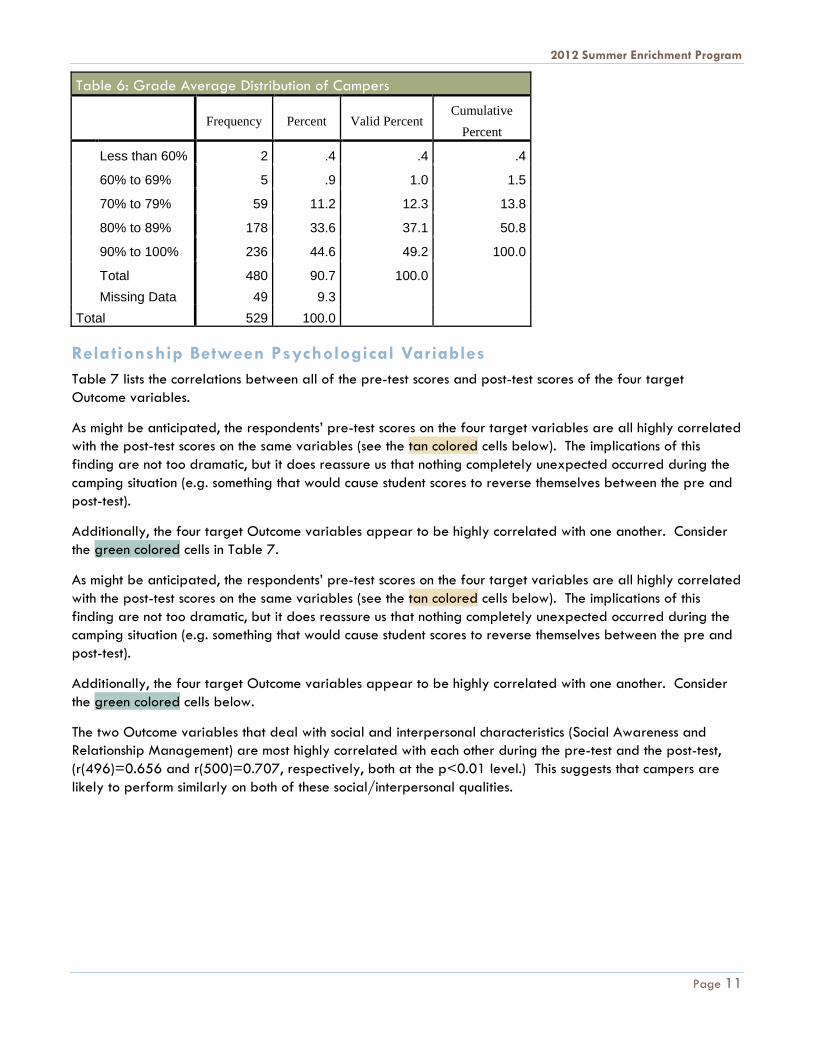
Table 6: Grade Average Distribution of Campers
Frequency Percent Valid Percent Cumulative
Percent
Less than 60% 2 .4 .4 .4
60% to 69% 5 .9 1.0 1.5
70% to 79% 59 11.2 12.3 13.8
80% to 89% 178 33.6 37.1 50.8
90% to 100% 236 44.6 49.2 100.0
Total 480 90.7 100.0
Missing Data 49 9.3
Total 529 100.0
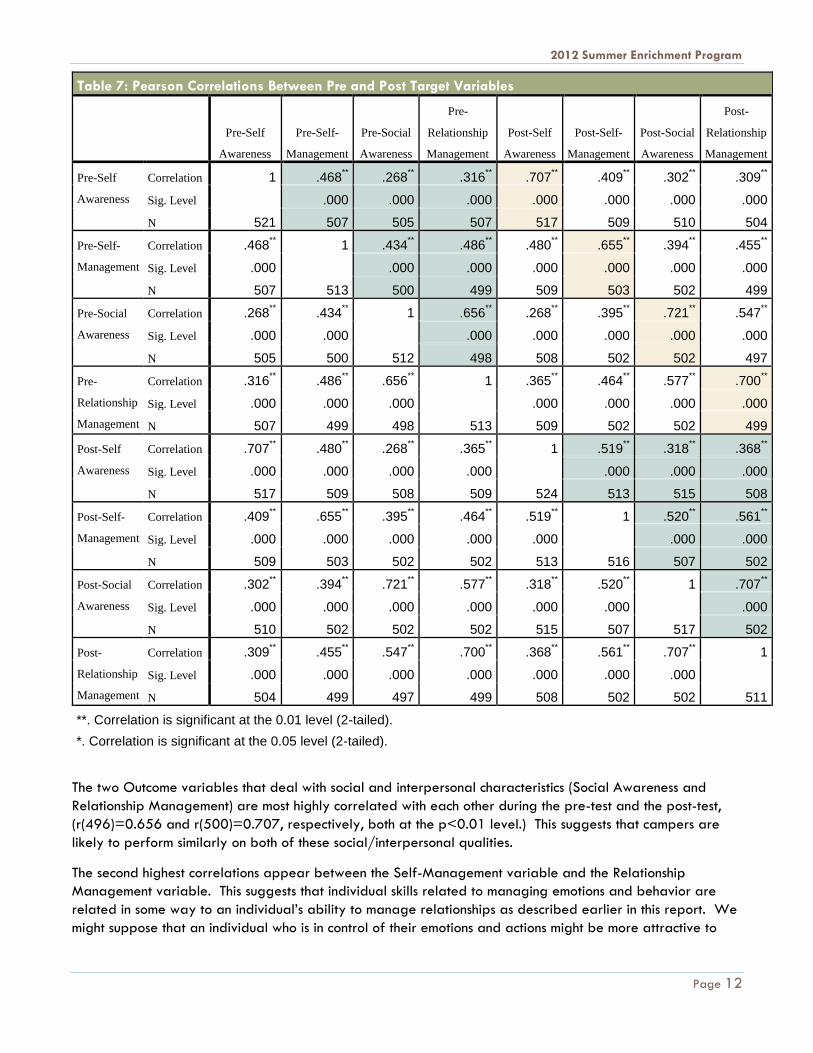
Relationship Between Psychological Variables
Table 7 lists the correlations between all of the pre-test scores and post-test scores of the four target
Outcome variables.
As might be anticipated, the respondents’ pre-test scores on the four target variables are all highly correlated
with the post-test scores on the same variables (see the tan colored cells below). The implications of this
finding are not too dramatic, but it does reassure us that nothing completely unexpected occurred during the
camping situation (e.g. something that would cause student scores to reverse themselves between the pre and
post-test).
Additionally, the four target Outcome variables appear to be highly correlated with one another. Consider
the green colored cells in Table 7.
As might be anticipated, the respondents’ pre-test scores on the four target variables are all highly correlated
with the post-test scores on the same variables (see the tan colored cells below). The implications of this
finding are not too dramatic, but it does reassure us that nothing completely unexpected occurred during the
camping situation (e.g. something that would cause student scores to reverse themselves between the pre and
post-test).
Additionally, the four target Outcome variables appear to be highly correlated with one another. Consider
the green colored cells below.
The two Outcome variables that deal with social and interpersonal characteristics (Social Awareness and
Relationship Management) are most highly correlated with each other during the pre-test and the post-test,
(r(496)=0.656 and r(500)=0.707, respectively, both at the p<0.01 level.) This suggests that campers are
likely to perform similarly on both of these social/interpersonal qualities.
2012 Summer Enrichment Program
Page 12
Table 7: Pearson Correlations Between Pre and Post Target Variables
Pre-Self
Awareness
Pre-Self-
Management
Pre-Social
Awareness
Pre-
Relationship
Management
Post-Self
Awareness
Post-Self-
Management
Post-Social
Awareness
Post-
Relationship
Management
Pre-Self
Awareness
Correlation 1 .468** .268
** .316
** .707
** .409
** .302
** .309
**
Sig. Level .000 .000 .000 .000 .000 .000 .000
N 521 507 505 507 517 509 510 504
Pre-Self-
Management
Correlation .468** 1 .434
** .486
** .480
** .655
** .394
** .455
**
Sig. Level .000 .000 .000 .000 .000 .000 .000
N 507 513 500 499 509 503 502 499
Pre-Social
Awareness
Correlation .268** .434
** 1 .656
** .268
** .395
** .721
** .547
**
Sig. Level .000 .000 .000 .000 .000 .000 .000
N 505 500 512 498 508 502 502 497
Pre-
Relationship
Management
Correlation .316** .486
** .656
** 1 .365
** .464
** .577
** .700
**
Sig. Level .000 .000 .000 .000 .000 .000 .000
N 507 499 498 513 509 502 502 499
Post-Self
Awareness
Correlation .707** .480
** .268
** .365
** 1 .519
** .318
** .368
**
Sig. Level .000 .000 .000 .000 .000 .000 .000
N 517 509 508 509 524 513 515 508
Post-Self-
Management
Correlation .409** .655
** .395
** .464
** .519
** 1 .520
** .561
**
Sig. Level .000 .000 .000 .000 .000 .000 .000
N 509 503 502 502 513 516 507 502
Post-Social
Awareness
Correlation .302** .394
** .721
** .577
** .318
** .520
** 1 .707
**
Sig. Level .000 .000 .000 .000 .000 .000 .000
N 510 502 502 502 515 507 517 502
Post-
Relationship
Management
Correlation .309** .455
** .547
** .700
** .368
** .561
** .707
** 1
Sig. Level .000 .000 .000 .000 .000 .000 .000
N 504 499 497 499 508 502 502 511
**. Correlation is significant at the 0.01 level (2-tailed).
*. Correlation is significant at the 0.05 level (2-tailed).
The two Outcome variables that deal with social and interpersonal characteristics (Social Awareness and
Relationship Management) are most highly correlated with each other during the pre-test and the post-test,
(r(496)=0.656 and r(500)=0.707, respectively, both at the p<0.01 level.) This suggests that campers are
likely to perform similarly on both of these social/interpersonal qualities.
The second highest correlations appear between the Self-Management variable and the Relationship
Management variable. This suggests that individual skills related to managing emotions and behavior are
related in some way to an individual’s ability to manage relationships as described earlier in this report. We
might suppose that an individual who is in control of their emotions and actions might be more attractive to
2012 Summer Enrichment Program
Page 13
others and therefore, somewhat more successful at interpersonal relationships. Individuals with strong self-
management tendencies might garner the respect of others in such a way that they would be more successful
at things like mediating conflicts between themselves and others and more capable of navigating the
challenges of interpersonal relationships better than those who are low in self-management. Self-management
and Relationship-management generated correlations of r(497)=0.486 and r(500)=0.707 during the pre-test
and post-test, respectively, both at the p<0.01 level.)
Finally, the two variables dealing with individual behavior (Self-awareness and Self-management) were
highly correlated (r(505)=0.486 and r(511)=0.518 during the pre-test and post-test, respectively, both at
the p<0.01 level.) It is not too surprising that these two factors are strongly related. The ability to monitor
one’s moods and feelings and consider the consequences of behavior (Self-awareness) most likely increases an
individual’s ability to control their behavior (Self-management). The improved decision making skills of the
highly Self-aware individual most likely leads to greater confidence and feelings of Personal Power found in
individuals with higher levels of Self-management.
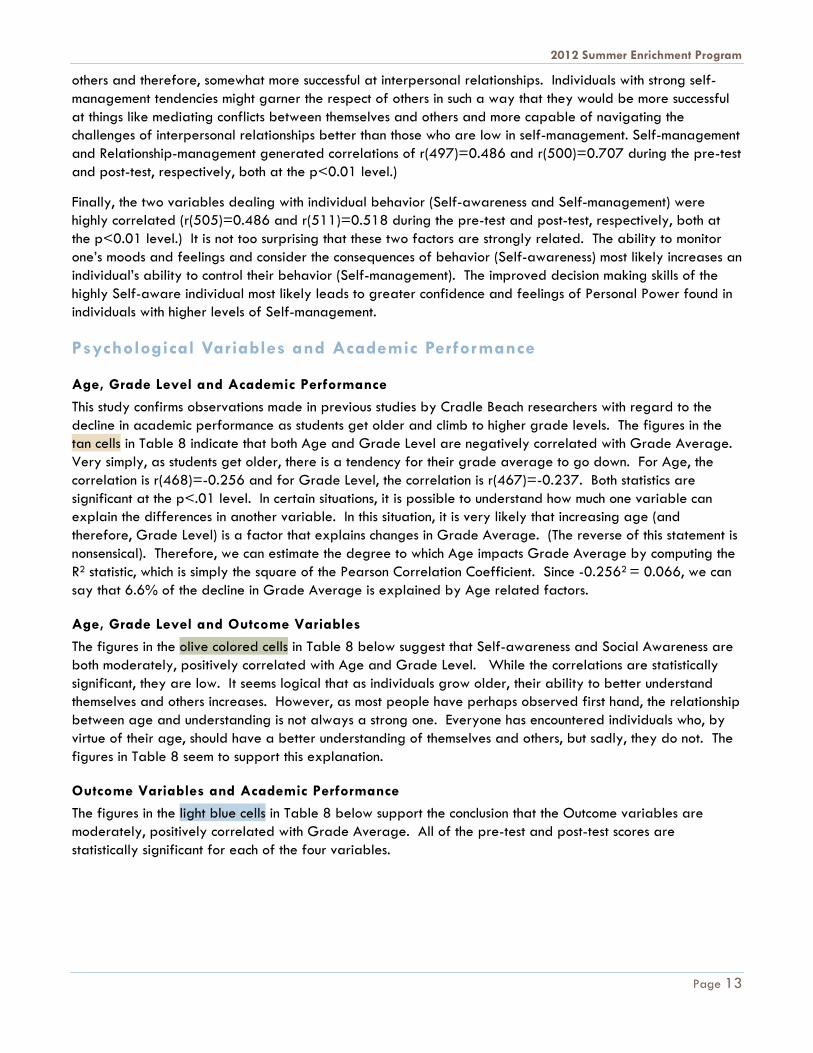
Psychological Variables and Academic Performance
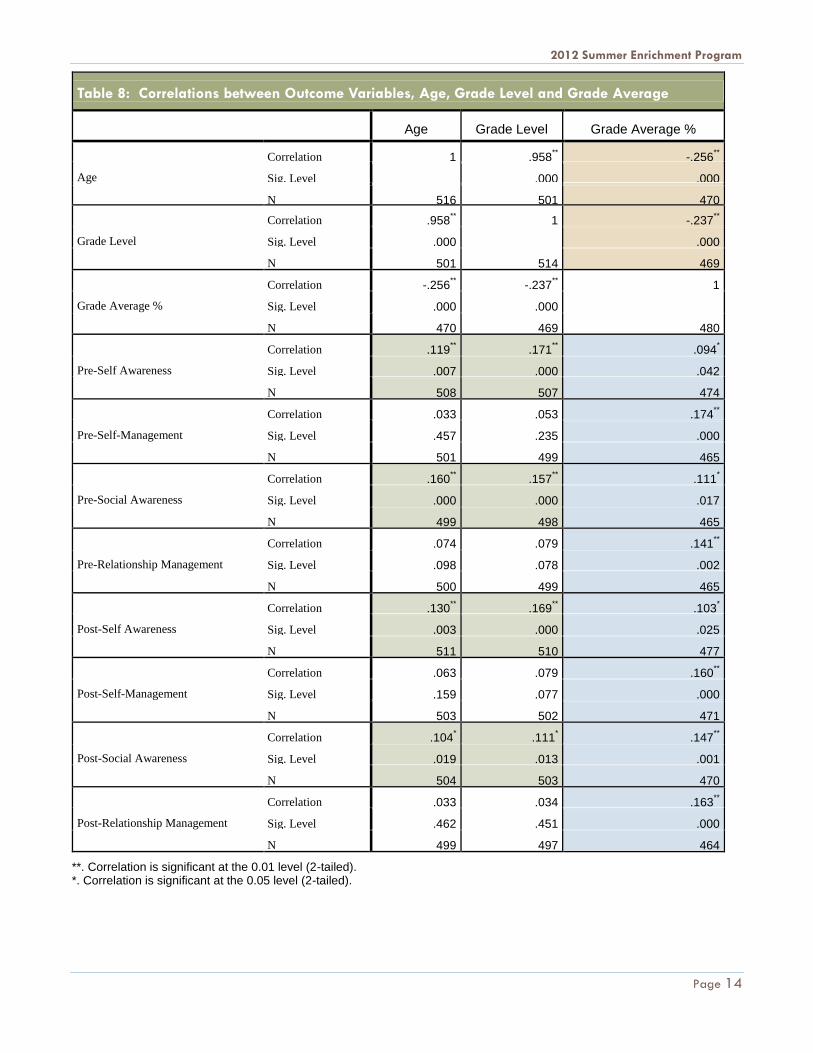
Age, Grade Level and Academic Performance
This study confirms observations made in previous studies by Cradle Beach researchers with regard to the
decline in academic performance as students get older and climb to higher grade levels. The figures in the
tan cells in Table 8 indicate that both Age and Grade Level are negatively correlated with Grade Average.
Very simply, as students get older, there is a tendency for their grade average to go down. For Age, the
correlation is r(468)=-0.256 and for Grade Level, the correlation is r(467)=-0.237. Both statistics are
significant at the p<.01 level. In certain situations, it is possible to understand how much one variable can
explain the differences in another variable. In this situation, it is very likely that increasing age (and
therefore, Grade Level) is a factor that explains changes in Grade Average. (The reverse of this statement is
nonsensical). Therefore, we can estimate the degree to which Age impacts Grade Average by computing the
R2 statistic, which is simply the square of the Pearson Correlation Coefficient. Since -0.2562 = 0.066, we can
say that 6.6% of the decline in Grade Average is explained by Age related factors.
Age, Grade Level and Outcome Variables
The figures in the olive colored cells in Table 8 below suggest that Self-awareness and Social Awareness are
both moderately, positively correlated with Age and Grade Level. While the correlations are statistically
significant, they are low. It seems logical that as individuals grow older, their ability to better understand
themselves and others increases. However, as most people have perhaps observed first hand, the relationship
between age and understanding is not always a strong one. Everyone has encountered individuals who, by
virtue of their age, should have a better understanding of themselves and others, but sadly, they do not. The
figures in Table 8 seem to support this explanation.
Outcome Variables and Academic Performance
The figures in the light blue cells in Table 8 below support the conclusion that the Outcome variables are
moderately, positively correlated with Grade Average. All of the pre-test and post-test scores are
statistically significant for each of the four variables.
2012 Summer Enrichment Program
Page 14
Table 8: Correlations between Outcome Variables, Age, Grade Level and Grade Average
Age Grade Level Grade Average %
Age
Correlation 1 .958** -.256
**
Sig. Level
.000 .000
N 516 501 470
Grade Level
Correlation .958** 1 -.237
**
Sig. Level .000
.000
N 501 514 469
Grade Average %
Correlation -.256** -.237
** 1
Sig. Level .000 .000
N 470 469 480
Pre-Self Awareness
Correlation .119** .171
** .094
*
Sig. Level .007 .000 .042
N 508 507 474
Pre-Self-Management
Correlation .033 .053 .174**
Sig. Level .457 .235 .000
N 501 499 465
Pre-Social Awareness
Correlation .160** .157
** .111
*
Sig. Level .000 .000 .017
N 499 498 465
Pre-Relationship Management
Correlation .074 .079 .141**
Sig. Level .098 .078 .002
N 500 499 465
Post-Self Awareness
Correlation .130** .169
** .103
*
Sig. Level .003 .000 .025
N 511 510 477
Post-Self-Management
Correlation .063 .079 .160**
Sig. Level .159 .077 .000
N 503 502 471
Post-Social Awareness
Correlation .104* .111
* .147
**
Sig. Level .019 .013 .001
N 504 503 470
Post-Relationship Management
Correlation .033 .034 .163**
Sig. Level .462 .451 .000
N 499 497 464
**. Correlation is significant at the 0.01 level (2-tailed). *. Correlation is significant at the 0.05 level (2-tailed).
2012 Summer Enrichment Program
Page 15
Impact of Camp Experience on Outcome Variables
To examine if the camp experience had any impact on the 4 target Outcome variables, pre-test and post-test
scores on each variable where subjected to a paired comparisons T Test.
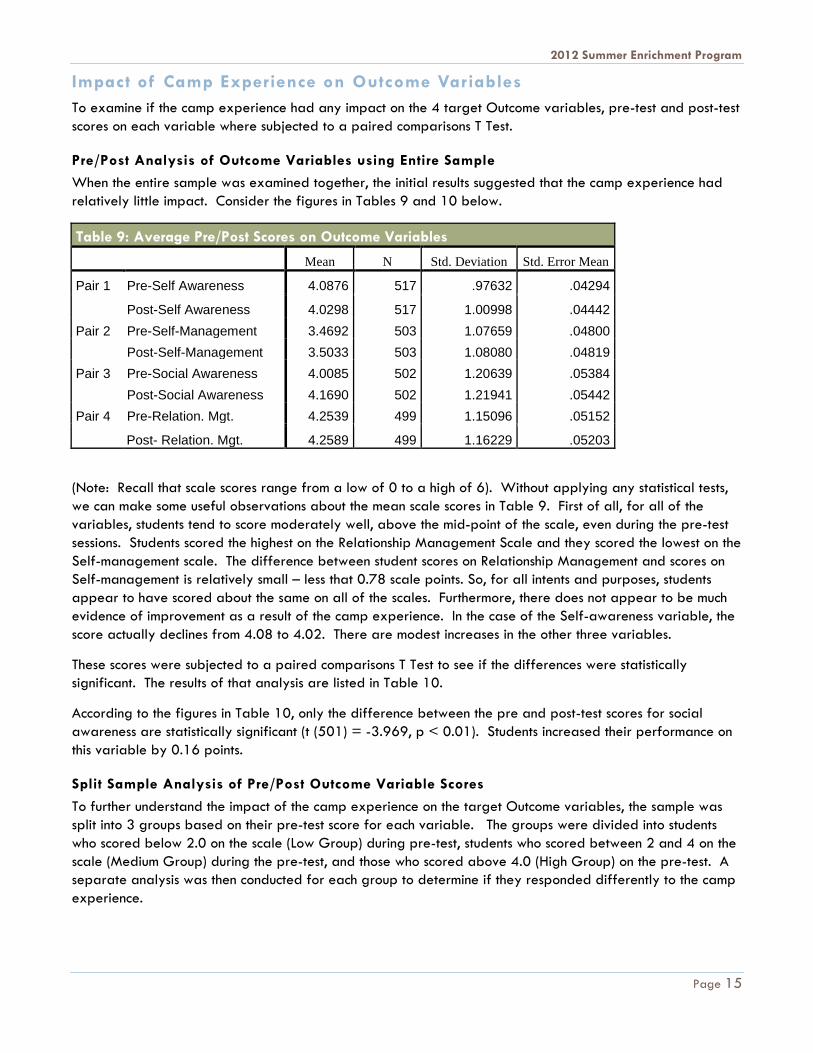
Pre/Post Analysis of Outcome Variables using Entire Sample
When the entire sample was examined together, the initial results suggested that the camp experience had
relatively little impact. Consider the figures in Tables 9 and 10 below.
Table 9: Average Pre/Post Scores on Outcome Variables
Mean N Std. Deviation Std. Error Mean
Pair 1 Pre-Self Awareness 4.0876 517 .97632 .04294
Post-Self Awareness 4.0298 517 1.00998 .04442
Pair 2 Pre-Self-Management 3.4692 503 1.07659 .04800
Post-Self-Management 3.5033 503 1.08080 .04819
Pair 3 Pre-Social Awareness 4.0085 502 1.20639 .05384
Post-Social Awareness 4.1690 502 1.21941 .05442
Pair 4 Pre-Relation. Mgt. 4.2539 499 1.15096 .05152
Post- Relation. Mgt. 4.2589 499 1.16229 .05203
(Note: Recall that scale scores range from a low of 0 to a high of 6). Without applying any statistical tests,
we can make some useful observations about the mean scale scores in Table 9. First of all, for all of the
variables, students tend to score moderately well, above the mid-point of the scale, even during the pre-test
sessions. Students scored the highest on the Relationship Management Scale and they scored the lowest on the
Self-management scale. The difference between student scores on Relationship Management and scores on
Self-management is relatively small – less that 0.78 scale points. So, for all intents and purposes, students
appear to have scored about the same on all of the scales. Furthermore, there does not appear to be much
evidence of improvement as a result of the camp experience. In the case of the Self-awareness variable, the
score actually declines from 4.08 to 4.02. There are modest increases in the other three variables.
These scores were subjected to a paired comparisons T Test to see if the differences were statistically
significant. The results of that analysis are listed in Table 10.
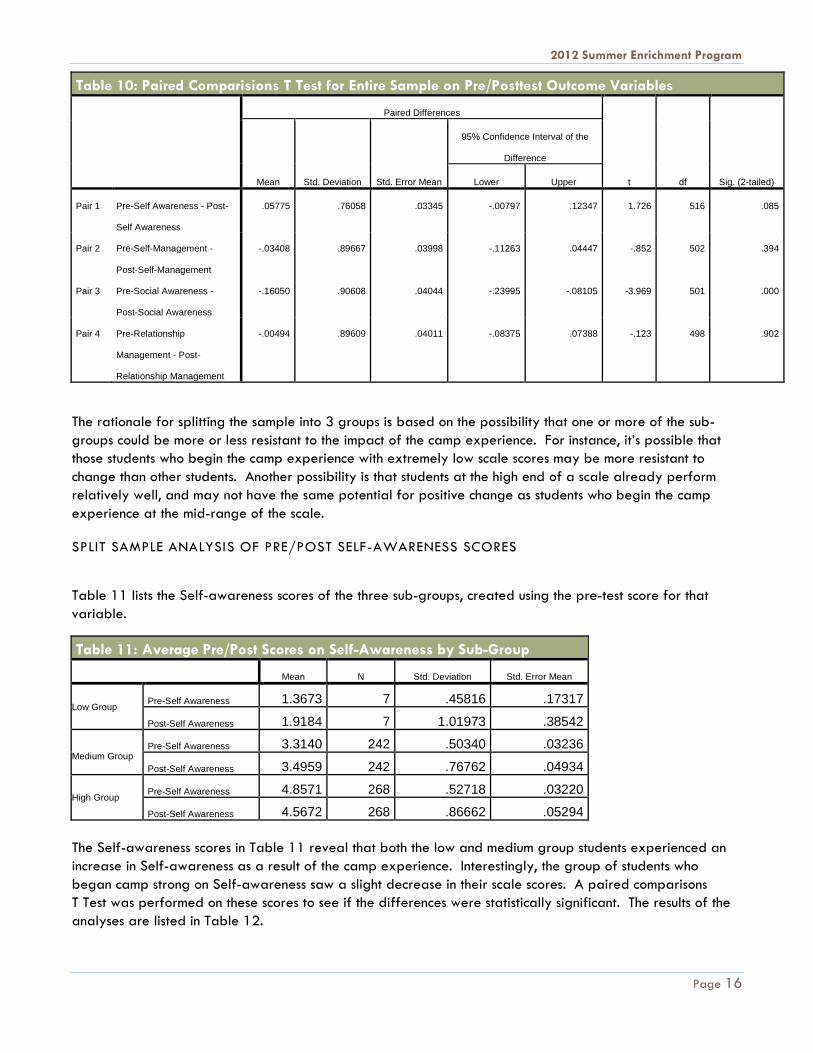
According to the figures in Table 10, only the difference between the pre and post-test scores for social
awareness are statistically significant (t (501) = -3.969, p < 0.01). Students increased their performance on
this variable by 0.16 points.
Split Sample Analysis of Pre/Post Outcome Variable Scores
To further understand the impact of the camp experience on the target Outcome variables, the sample was
split into 3 groups based on their pre-test score for each variable. The groups were divided into students
who scored below 2.0 on the scale (Low Group) during pre-test, students who scored between 2 and 4 on the
scale (Medium Group) during the pre-test, and those who scored above 4.0 (High Group) on the pre-test. A
separate analysis was then conducted for each group to determine if they responded differently to the camp
experience.
2012 Summer Enrichment Program
Page 16
Table 10: Paired Comparisions T Test for Entire Sample on Pre/Posttest Outcome Variables
Paired Differences
t df Sig. (2-tailed) Mean Std. Deviation Std. Error Mean
95% Confidence Interval of the
Difference
Lower Upper
Pair 1 Pre-Self Awareness - Post-
Self Awareness
.05775 .76058 .03345 -.00797 .12347 1.726 516 .085
Pair 2 Pre-Self-Management -
Post-Self-Management
-.03408 .89667 .03998 -.11263 .04447 -.852 502 .394
Pair 3 Pre-Social Awareness -
Post-Social Awareness
-.16050 .90608 .04044 -.23995 -.08105 -3.969 501 .000
Pair 4 Pre-Relationship
Management - Post-
Relationship Management
-.00494 .89609 .04011 -.08375 .07388 -.123 498 .902
The rationale for splitting the sample into 3 groups is based on the possibility that one or more of the sub-
groups could be more or less resistant to the impact of the camp experience. For instance, it’s possible that
those students who begin the camp experience with extremely low scale scores may be more resistant to
change than other students. Another possibility is that students at the high end of a scale already perform
relatively well, and may not have the same potential for positive change as students who begin the camp
experience at the mid-range of the scale.
SPLIT SAMPLE ANALYSIS OF PRE/POST SELF-AWARENESS SCORES
Table 11 lists the Self-awareness scores of the three sub-groups, created using the pre-test score for that
variable.
Table 11: Average Pre/Post Scores on Self-Awareness by Sub-Group
Mean N Std. Deviation Std. Error Mean
Low Group Pre-Self Awareness 1.3673 7 .45816 .17317
Post-Self Awareness 1.9184 7 1.01973 .38542
Medium Group Pre-Self Awareness 3.3140 242 .50340 .03236
Post-Self Awareness 3.4959 242 .76762 .04934
High Group Pre-Self Awareness 4.8571 268 .52718 .03220
Post-Self Awareness 4.5672 268 .86662 .05294
The Self-awareness scores in Table 11 reveal that both the low and medium group students experienced an
increase in Self-awareness as a result of the camp experience. Interestingly, the group of students who
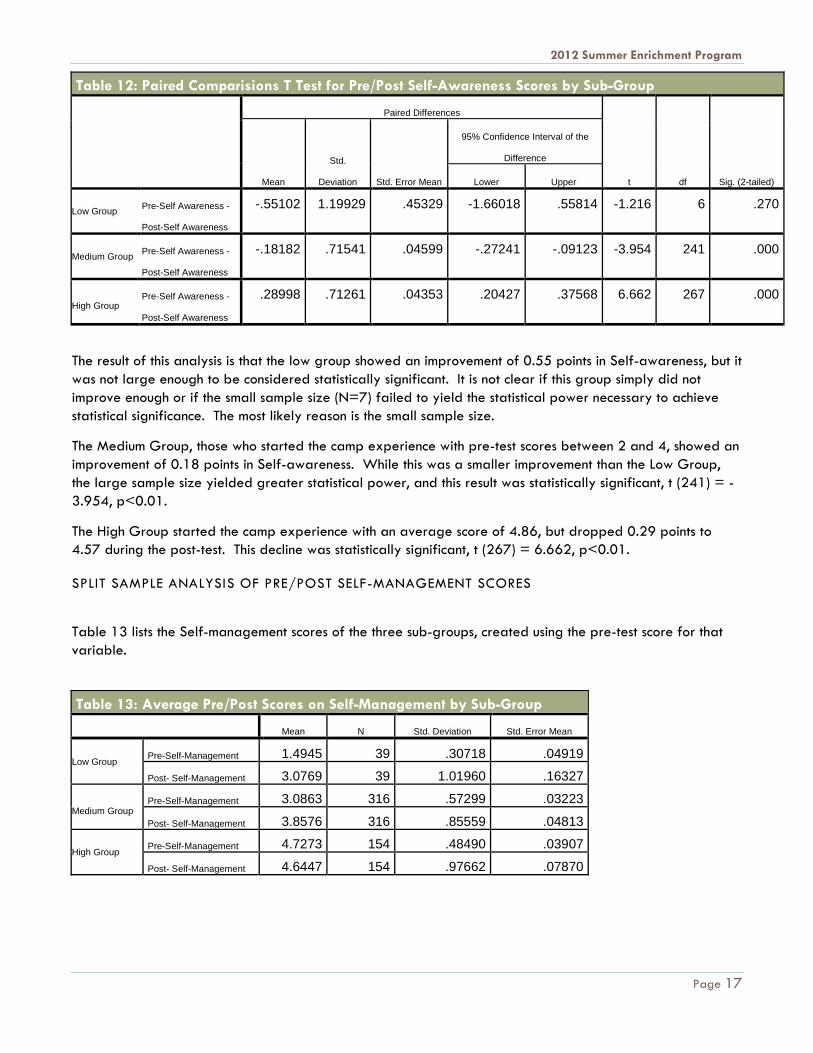
began camp strong on Self-awareness saw a slight decrease in their scale scores. A paired comparisons
T Test was performed on these scores to see if the differences were statistically significant. The results of the
analyses are listed in Table 12.
2012 Summer Enrichment Program
Page 17
Table 12: Paired Comparisions T Test for Pre/Post Self-Awareness Scores by Sub-Group
Paired Differences
t df Sig. (2-tailed) Mean
Std.
Deviation Std. Error Mean
95% Confidence Interval of the
Difference
Lower Upper
Low Group Pre-Self Awareness -
Post-Self Awareness
-.55102 1.19929 .45329 -1.66018 .55814 -1.216 6 .270
Medium Group Pre-Self Awareness -
Post-Self Awareness
-.18182 .71541 .04599 -.27241 -.09123 -3.954 241 .000
High Group Pre-Self Awareness -
Post-Self Awareness
.28998 .71261 .04353 .20427 .37568 6.662 267 .000
The result of this analysis is that the low group showed an improvement of 0.55 points in Self-awareness, but it
was not large enough to be considered statistically significant. It is not clear if this group simply did not
improve enough or if the small sample size (N=7) failed to yield the statistical power necessary to achieve
statistical significance. The most likely reason is the small sample size.
The Medium Group, those who started the camp experience with pre-test scores between 2 and 4, showed an
improvement of 0.18 points in Self-awareness. While this was a smaller improvement than the Low Group,
the large sample size yielded greater statistical power, and this result was statistically significant, t (241) = -
3.954, p<0.01.
The High Group started the camp experience with an average score of 4.86, but dropped 0.29 points to
4.57 during the post-test. This decline was statistically significant, t (267) = 6.662, p<0.01.
SPLIT SAMPLE ANALYSIS OF PRE/POST SELF-MANAGEMENT SCORES
Table 13 lists the Self-management scores of the three sub-groups, created using the pre-test score for that
variable.
Table 13: Average Pre/Post Scores on Self-Management by Sub-Group
Mean N Std. Deviation Std. Error Mean
Low Group Pre-Self-Management 1.4945 39 .30718 .04919
Post- Self-Management 3.0769 39 1.01960 .16327
Medium Group Pre-Self-Management 3.0863 316 .57299 .03223
Post- Self-Management 3.8576 316 .85559 .04813
High Group Pre-Self-Management 4.7273 154 .48490 .03907
Post- Self-Management 4.6447 154 .97662 .07870
2012 Summer Enrichment Program
Page 18
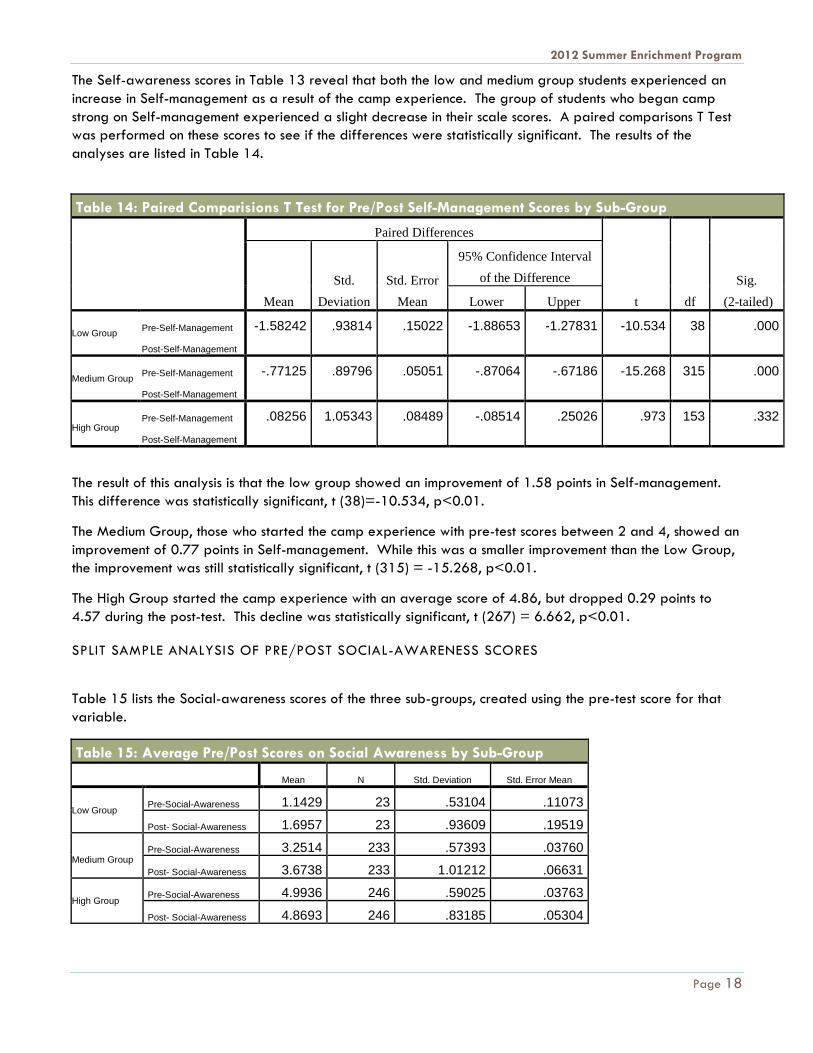
The Self-awareness scores in Table 13 reveal that both the low and medium group students experienced an
increase in Self-management as a result of the camp experience. The group of students who began camp
strong on Self-management experienced a slight decrease in their scale scores. A paired comparisons T Test
was performed on these scores to see if the differences were statistically significant. The results of the
analyses are listed in Table 14.
Table 14: Paired Comparisions T Test for Pre/Post Self-Management Scores by Sub-Group
Paired Differences
t df
Sig.
(2-tailed) Mean
Std.
Deviation
Std. Error
Mean
95% Confidence Interval
of the Difference
Lower Upper
Low Group Pre-Self-Management
Post-Self-Management
-1.58242 .93814 .15022 -1.88653 -1.27831 -10.534 38 .000
Medium Group Pre-Self-Management
Post-Self-Management
-.77125 .89796 .05051 -.87064 -.67186 -15.268 315 .000
High Group Pre-Self-Management
Post-Self-Management
.08256 1.05343 .08489 -.08514 .25026 .973 153 .332
The result of this analysis is that the low group showed an improvement of 1.58 points in Self-management.
This difference was statistically significant, t (38)=-10.534, p<0.01.
The Medium Group, those who started the camp experience with pre-test scores between 2 and 4, showed an
improvement of 0.77 points in Self-management. While this was a smaller improvement than the Low Group,
the improvement was still statistically significant, t (315) = -15.268, p<0.01.
The High Group started the camp experience with an average score of 4.86, but dropped 0.29 points to
4.57 during the post-test. This decline was statistically significant, t (267) = 6.662, p<0.01.
SPLIT SAMPLE ANALYSIS OF PRE/POST SOCIAL-AWARENESS SCORES
Table 15 lists the Social-awareness scores of the three sub-groups, created using the pre-test score for that
variable.
Table 15: Average Pre/Post Scores on Social Awareness by Sub-Group
Mean N Std. Deviation Std. Error Mean
Low Group Pre-Social-Awareness 1.1429 23 .53104 .11073
Post- Social-Awareness 1.6957 23 .93609 .19519
Medium Group Pre-Social-Awareness 3.2514 233 .57393 .03760
Post- Social-Awareness 3.6738 233 1.01212 .06631
High Group Pre-Social-Awareness 4.9936 246 .59025 .03763
Post- Social-Awareness 4.8693 246 .83185 .05304
2012 Summer Enrichment Program
Page 19
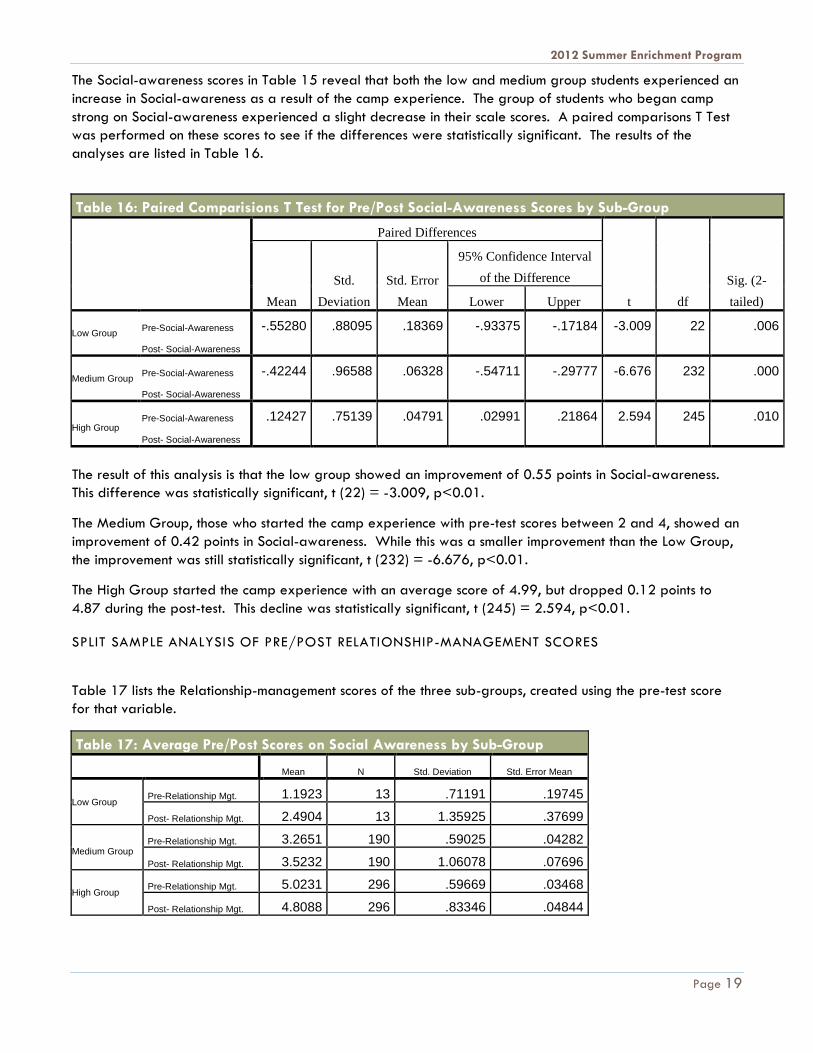
The Social-awareness scores in Table 15 reveal that both the low and medium group students experienced an
increase in Social-awareness as a result of the camp experience. The group of students who began camp
strong on Social-awareness experienced a slight decrease in their scale scores. A paired comparisons T Test
was performed on these scores to see if the differences were statistically significant. The results of the
analyses are listed in Table 16.
Table 16: Paired Comparisions T Test for Pre/Post Social-Awareness Scores by Sub-Group
Paired Differences
t df
Sig. (2-
tailed) Mean
Std.
Deviation
Std. Error
Mean
95% Confidence Interval
of the Difference
Lower Upper
Low Group Pre-Social-Awareness
Post- Social-Awareness
-.55280 .88095 .18369 -.93375 -.17184 -3.009 22 .006
Medium Group Pre-Social-Awareness
Post- Social-Awareness
-.42244 .96588 .06328 -.54711 -.29777 -6.676 232 .000
High Group Pre-Social-Awareness
Post- Social-Awareness
.12427 .75139 .04791 .02991 .21864 2.594 245 .010
The result of this analysis is that the low group showed an improvement of 0.55 points in Social-awareness.
This difference was statistically significant, t (22) = -3.009, p<0.01.
The Medium Group, those who started the camp experience with pre-test scores between 2 and 4, showed an
improvement of 0.42 points in Social-awareness. While this was a smaller improvement than the Low Group,
the improvement was still statistically significant, t (232) = -6.676, p<0.01.
The High Group started the camp experience with an average score of 4.99, but dropped 0.12 points to
4.87 during the post-test. This decline was statistically significant, t (245) = 2.594, p<0.01.
SPLIT SAMPLE ANALYSIS OF PRE/POST RELATIONSHIP-MANAGEMENT SCORES
Table 17 lists the Relationship-management scores of the three sub-groups, created using the pre-test score
for that variable.
Table 17: Average Pre/Post Scores on Social Awareness by Sub-Group
Mean N Std. Deviation Std. Error Mean
Low Group Pre-Relationship Mgt. 1.1923 13 .71191 .19745
Post- Relationship Mgt. 2.4904 13 1.35925 .37699
Medium Group Pre-Relationship Mgt. 3.2651 190 .59025 .04282
Post- Relationship Mgt. 3.5232 190 1.06078 .07696
High Group Pre-Relationship Mgt. 5.0231 296 .59669 .03468
Post- Relationship Mgt. 4.8088 296 .83346 .04844
2012 Summer Enrichment Program
Page 20
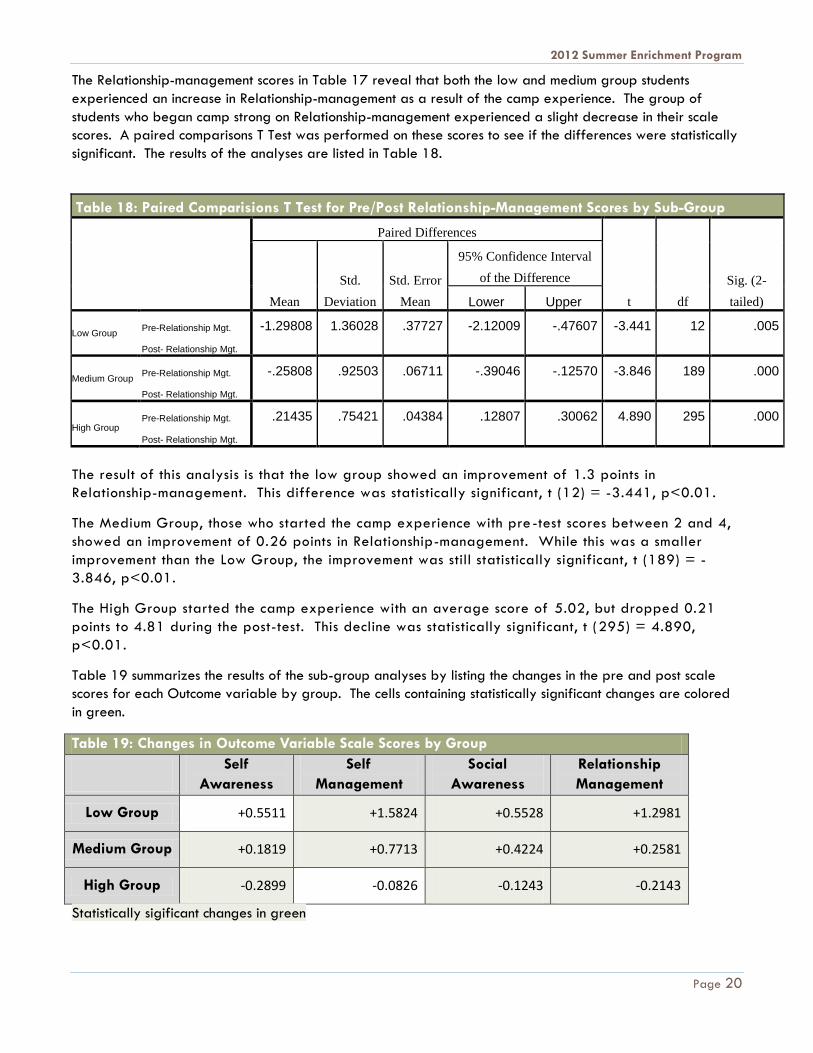
The Relationship-management scores in Table 17 reveal that both the low and medium group students
experienced an increase in Relationship-management as a result of the camp experience. The group of
students who began camp strong on Relationship-management experienced a slight decrease in their scale
scores. A paired comparisons T Test was performed on these scores to see if the differences were statistically
significant. The results of the analyses are listed in Table 18.
Table 18: Paired Comparisions T Test for Pre/Post Relationship-Management Scores by Sub-Group
Paired Differences
t df
Sig. (2-
tailed) Mean
Std.
Deviation
Std. Error
Mean
95% Confidence Interval
of the Difference
Lower Upper
Low Group Pre-Relationship Mgt.
Post- Relationship Mgt.
-1.29808 1.36028 .37727 -2.12009 -.47607 -3.441 12 .005
Medium Group Pre-Relationship Mgt.
Post- Relationship Mgt.
-.25808 .92503 .06711 -.39046 -.12570 -3.846 189 .000
High Group Pre-Relationship Mgt.
Post- Relationship Mgt.
.21435 .75421 .04384 .12807 .30062 4.890 295 .000
The result of this analysis is that the low group showed an improvement of 1.3 points in
Relationship-management. This difference was statistically significant, t (12) = -3.441, p<0.01.
The Medium Group, those who started the camp experience with pre -test scores between 2 and 4,
showed an improvement of 0.26 points in Relationship-management. While this was a smaller
improvement than the Low Group, the improvement was still statistically significant, t (189) = -
3.846, p<0.01.
The High Group started the camp experience with an average score of 5.02, but dropped 0.21
points to 4.81 during the post-test. This decline was statistically significant, t (295) = 4.890,
p<0.01.
Table 19 summarizes the results of the sub-group analyses by listing the changes in the pre and post scale
scores for each Outcome variable by group. The cells containing statistically significant changes are colored
in green.
Table 19: Changes in Outcome Variable Scale Scores by Group
Self
Awareness
Self
Management
Social
Awareness
Relationship
Management
Low Group +0.5511 +1.5824 +0.5528 +1.2981
Medium Group +0.1819 +0.7713 +0.4224 +0.2581
High Group -0.2899 -0.0826 -0.1243 -0.2143
Statistically sigificant changes in green
2012 Summer Enrichment Program
Page 21
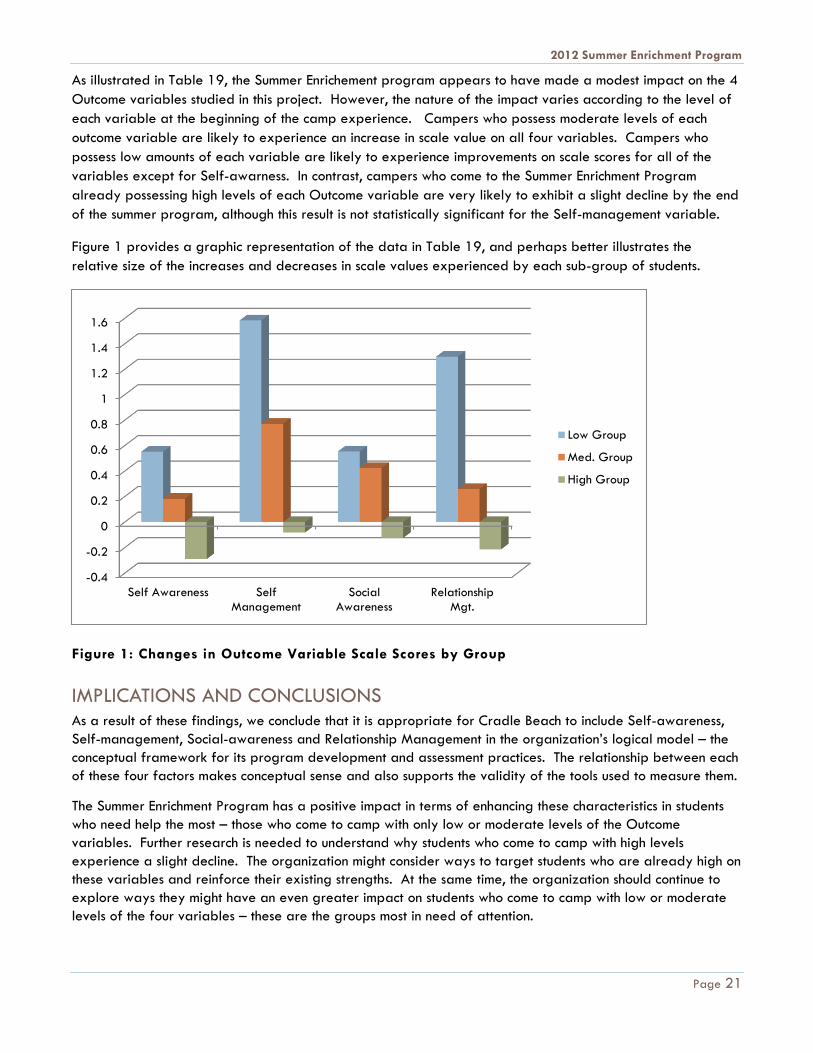
As illustrated in Table 19, the Summer Enrichement program appears to have made a modest impact on the 4
Outcome variables studied in this project. However, the nature of the impact varies according to the level of
each variable at the beginning of the camp experience. Campers who possess moderate levels of each
outcome variable are likely to experience an increase in scale value on all four variables. Campers who
possess low amounts of each variable are likely to experience improvements on scale scores for all of the
variables except for Self-awarness. In contrast, campers who come to the Summer Enrichment Program
already possessing high levels of each Outcome variable are very likely to exhibit a slight decline by the end
of the summer program, although this result is not statistically significant for the Self-management variable.
Figure 1 provides a graphic representation of the data in Table 19, and perhaps better illustrates the
relative size of the increases and decreases in scale values experienced by each sub-group of students.
Figure 1: Changes in Outcome Variable Scale Scores by Group
IMPLICATIONS AND CONCLUSIONS As a result of these findings, we conclude that it is appropriate for Cradle Beach to include Self-awareness,
Self-management, Social-awareness and Relationship Management in the organization’s logical model – the
conceptual framework for its program development and assessment practices. The relationship between each
of these four factors makes conceptual sense and also supports the validity of the tools used to measure them.
The Summer Enrichment Program has a positive impact in terms of enhancing these characteristics in students
who need help the most – those who come to camp with only low or moderate levels of the Outcome
variables. Further research is needed to understand why students who come to camp with high levels
experience a slight decline. The organization might consider ways to target students who are already high on
these variables and reinforce their existing strengths. At the same time, the organization should continue to
explore ways they might have an even greater impact on students who come to camp with low or moderate
levels of the four variables – these are the groups most in need of attention.
-0.4
-0.2
0
0.2
0.4
0.6
0.8
1
1.2
1.4
1.6
Self Awareness SelfManagement
SocialAwareness
RelationshipMgt.
Low Group
Med. Group
High Group

2012 Summer Enrichment Program
Page 22
Finally, the finding that academic performance drops as students get older provides additional support for
the idea that while early academic intervention, building Developmental Assets that lead to academic
achievement is a process that must be addressed at all grade levels – not just the early grades. Cradle
Beach’s development of school-based programming is a move in the right direction and should be expanded
beyond just the early grade levels that have been the focus of the first phase of Project SOAR.
2012 Summer Enrichment Program
Page 1
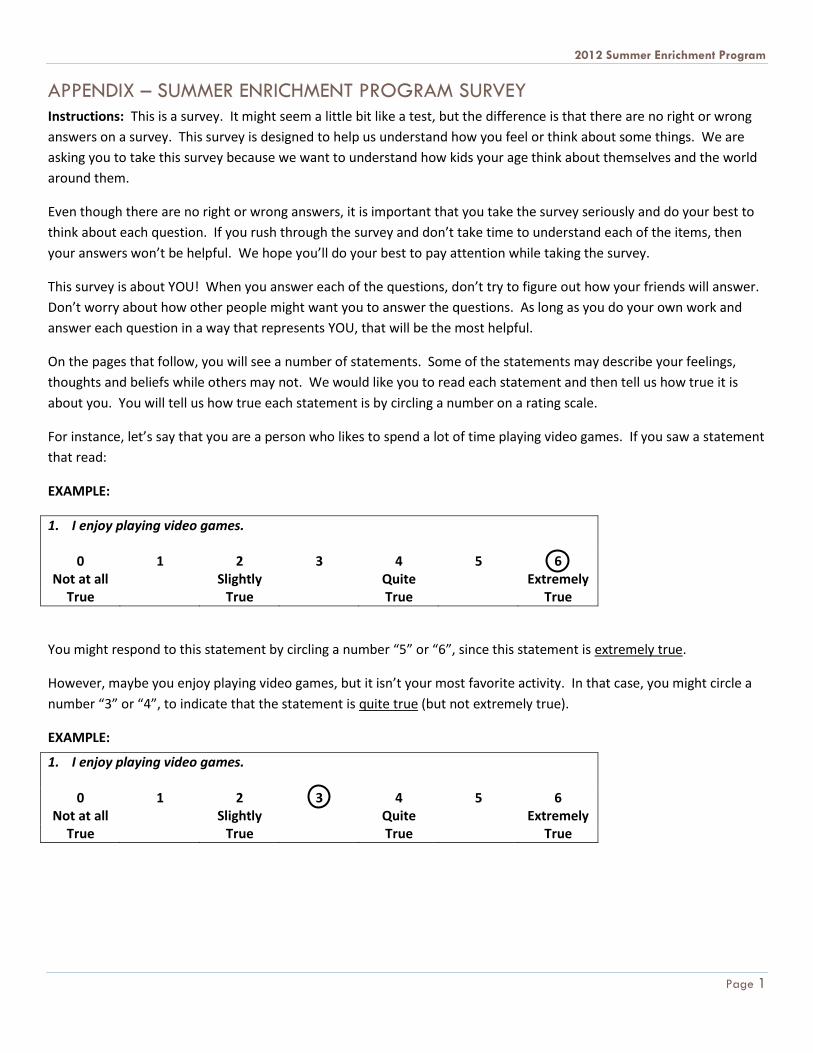
APPENDIX – SUMMER ENRICHMENT PROGRAM SURVEY
Instructions: This is a survey. It might seem a little bit like a test, but the difference is that there are no right or wrong
answers on a survey. This survey is designed to help us understand how you feel or think about some things. We are
asking you to take this survey because we want to understand how kids your age think about themselves and the world
around them.
Even though there are no right or wrong answers, it is important that you take the survey seriously and do your best to
think about each question. If you rush through the survey and don’t take time to understand each of the items, then
your answers won’t be helpful. We hope you’ll do your best to pay attention while taking the survey.
This survey is about YOU! When you answer each of the questions, don’t try to figure out how your friends will answer.
Don’t worry about how other people might want you to answer the questions. As long as you do your own work and
answer each question in a way that represents YOU, that will be the most helpful.
On the pages that follow, you will see a number of statements. Some of the statements may describe your feelings,
thoughts and beliefs while others may not. We would like you to read each statement and then tell us how true it is
about you. You will tell us how true each statement is by circling a number on a rating scale.
For instance, let’s say that you are a person who likes to spend a lot of time playing video games. If you saw a statement
that read:
EXAMPLE:
1. I enjoy playing video games.
0 Not at all
1
2 Slightly
3
4 Quite
5
6 Extremely
True True True True
You might respond to this statement by circling a number “5” or “6”, since this statement is extremely true.
However, maybe you enjoy playing video games, but it isn’t your most favorite activity. In that case, you might circle a
number “3” or “4”, to indicate that the statement is quite true (but not extremely true).
EXAMPLE:
1. I enjoy playing video games.
0 Not at all
1
2 Slightly
3
4 Quite
5
6 Extremely
True True True True
2012 Summer Enrichment Program
Page 2
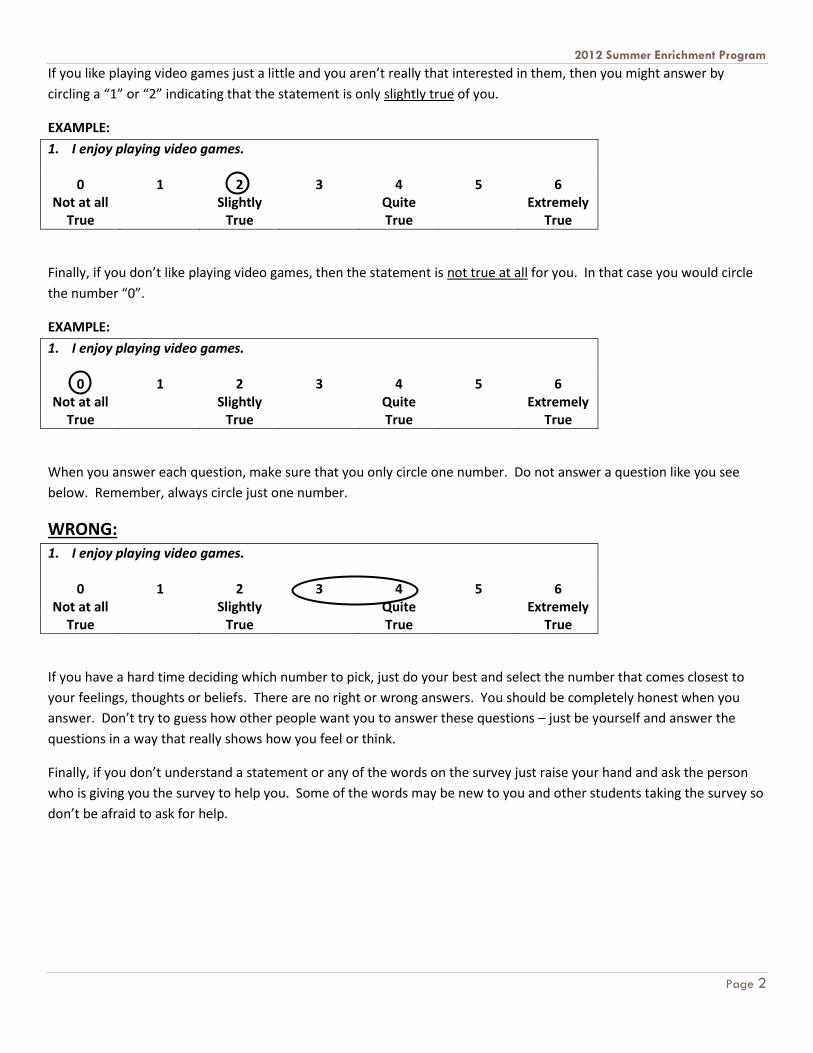
If you like playing video games just a little and you aren’t really that interested in them, then you might answer by
circling a “1” or “2” indicating that the statement is only slightly true of you.
EXAMPLE:
1. I enjoy playing video games.
0 Not at all
1
2 Slightly
3
4 Quite
5
6 Extremely
True True True True
Finally, if you don’t like playing video games, then the statement is not true at all for you. In that case you would circle
the number “0”.
EXAMPLE:
1. I enjoy playing video games.
0 Not at all
1
2 Slightly
3
4 Quite
5
6 Extremely
True True True True
When you answer each question, make sure that you only circle one number. Do not answer a question like you see
below. Remember, always circle just one number.
WRONG: 1. I enjoy playing video games.
0 Not at all
1
2 Slightly
3
4 Quite
5
6 Extremely
True True True True
If you have a hard time deciding which number to pick, just do your best and select the number that comes closest to
your feelings, thoughts or beliefs. There are no right or wrong answers. You should be completely honest when you
answer. Don’t try to guess how other people want you to answer these questions – just be yourself and answer the
questions in a way that really shows how you feel or think.
Finally, if you don’t understand a statement or any of the words on the survey just raise your hand and ask the person
who is giving you the survey to help you. Some of the words may be new to you and other students taking the survey so
don’t be afraid to ask for help.
2012 Summer Enrichment Program
Page 3
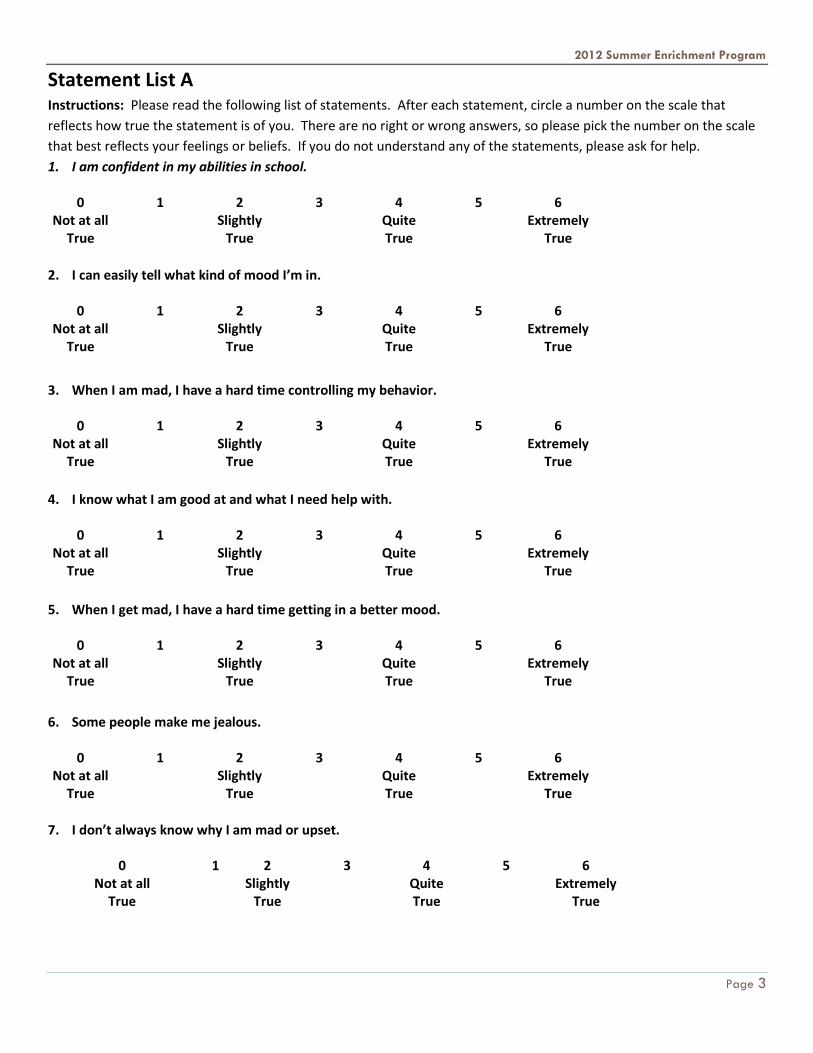
Statement List A Instructions: Please read the following list of statements. After each statement, circle a number on the scale that
reflects how true the statement is of you. There are no right or wrong answers, so please pick the number on the scale
that best reflects your feelings or beliefs. If you do not understand any of the statements, please ask for help.
1. I am confident in my abilities in school.
0 Not at all
1
2 Slightly
3
4 Quite
5
6 Extremely
True True True True
2. I can easily tell what kind of mood I’m in.
0 Not at all
1
2 Slightly
3
4 Quite
5
6 Extremely
True True True True
3. When I am mad, I have a hard time controlling my behavior.
0 Not at all
1
2 Slightly
3
4 Quite
5
6 Extremely
True True True True
4. I know what I am good at and what I need help with.
0 Not at all
1
2 Slightly
3
4 Quite
5
6 Extremely
True True True True
5. When I get mad, I have a hard time getting in a better mood.
0 Not at all
1
2 Slightly
3
4 Quite
5
6 Extremely
True True True True
6. Some people make me jealous.
0 Not at all
1
2 Slightly
3
4 Quite
5
6 Extremely
True True True True
7. I don’t always know why I am mad or upset.
0 Not at all
1
2 Slightly
3
4 Quite
5
6 Extremely
True True True True
2012 Summer Enrichment Program
Page 4
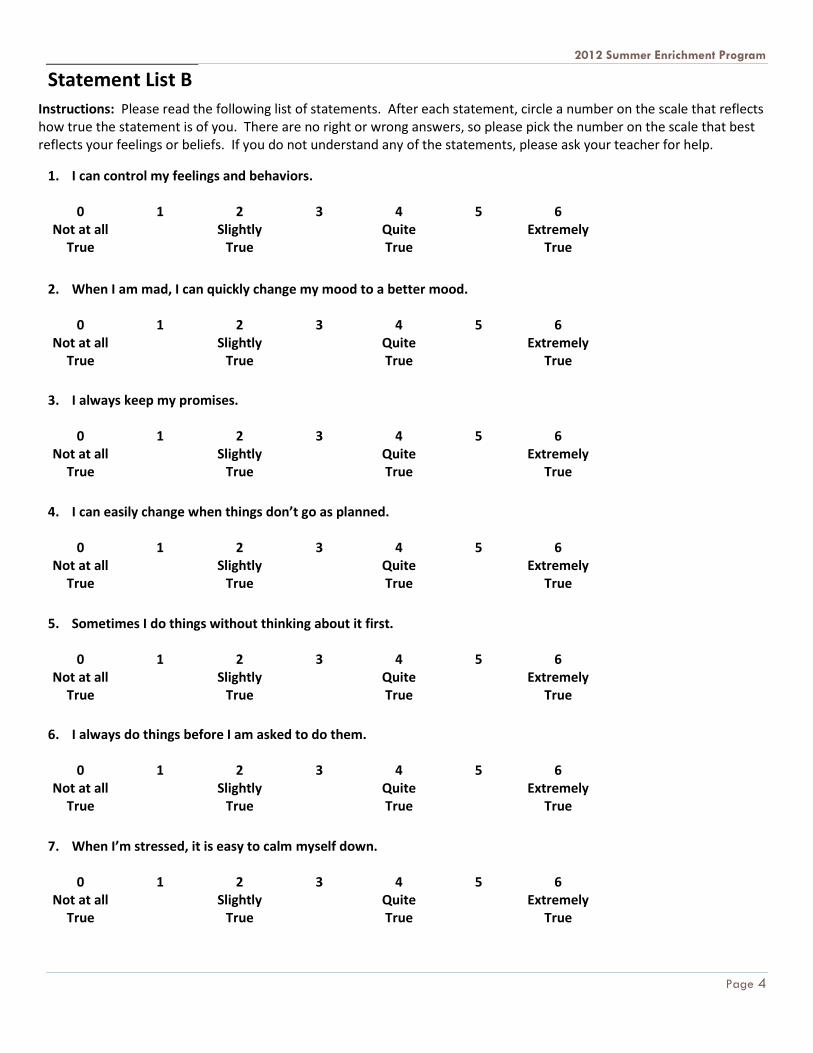
Instructions: Please read the following list of statements. After each statement, circle a number on the scale that reflects how true the statement is of you. There are no right or wrong answers, so please pick the number on the scale that best reflects your feelings or beliefs. If you do not understand any of the statements, please ask your teacher for help.
Statement List B
1. I can control my feelings and behaviors.
0 Not at all
1
2 Slightly
3
4 Quite
5
6 Extremely
True True True True
2. When I am mad, I can quickly change my mood to a better mood.
0 Not at all
1
2 Slightly
3
4 Quite
5
6 Extremely
True True True True
3. I always keep my promises.
0 Not at all
1
2 Slightly
3
4 Quite
5
6 Extremely
True True True True
4. I can easily change when things don’t go as planned.
0 Not at all
1
2 Slightly
3
4 Quite
5
6 Extremely
True True True True
5. Sometimes I do things without thinking about it first.
0 Not at all
1
2 Slightly
3
4 Quite
5
6 Extremely
True True True True
6. I always do things before I am asked to do them.
0 Not at all
1
2 Slightly
3
4 Quite
5
6 Extremely
True True True True
7. When I’m stressed, it is easy to calm myself down.
0 Not at all
1
2 Slightly
3
4 Quite
5
6 Extremely
True True True True
2012 Summer Enrichment Program
Page 5
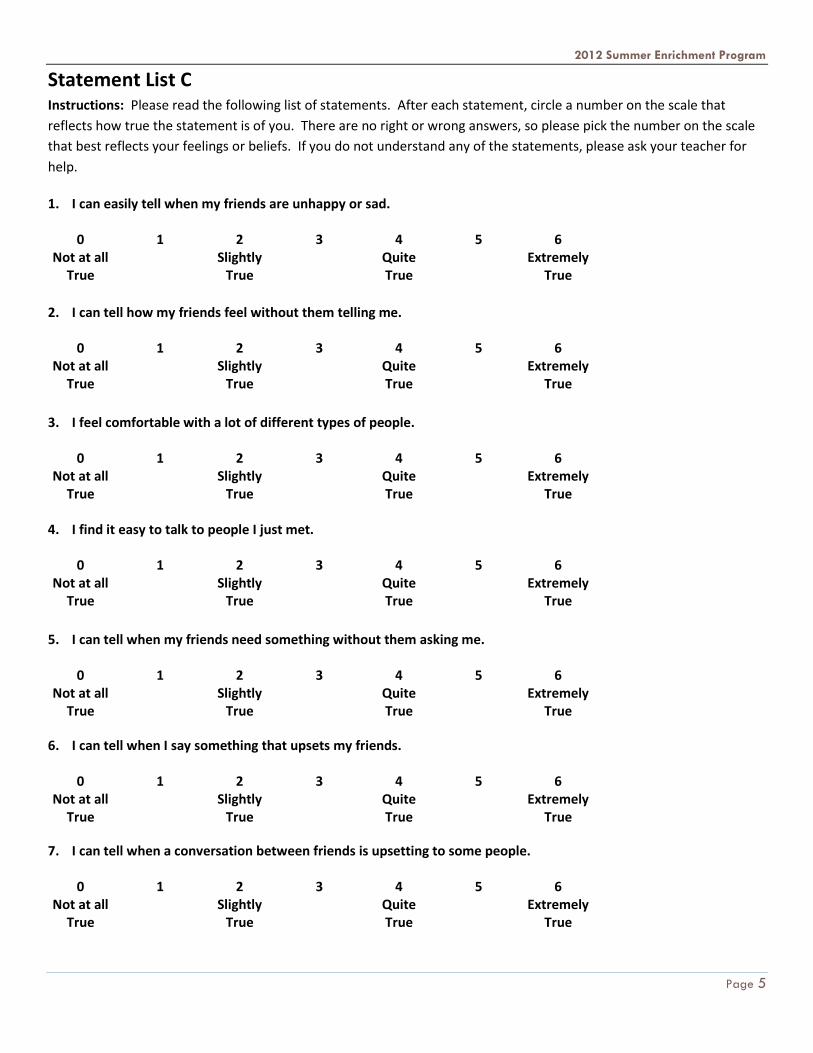
Statement List C Instructions: Please read the following list of statements. After each statement, circle a number on the scale that
reflects how true the statement is of you. There are no right or wrong answers, so please pick the number on the scale
that best reflects your feelings or beliefs. If you do not understand any of the statements, please ask your teacher for
help.
1. I can easily tell when my friends are unhappy or sad.
0 Not at all
1
2 Slightly
3
4 Quite
5
6 Extremely
True True True True
2. I can tell how my friends feel without them telling me.
0 Not at all
1
2 Slightly
3
4 Quite
5
6 Extremely
True True True True
3. I feel comfortable with a lot of different types of people.
0 Not at all
1
2 Slightly
3
4 Quite
5
6 Extremely
True True True True
4. I find it easy to talk to people I just met.
0 Not at all
1
2 Slightly
3
4 Quite
5
6 Extremely
True True True True
5. I can tell when my friends need something without them asking me.
0 Not at all
1
2 Slightly
3
4 Quite
5
6 Extremely
True True True True
6. I can tell when I say something that upsets my friends.
0 Not at all
1
2 Slightly
3
4 Quite
5
6 Extremely
True True True True
7. I can tell when a conversation between friends is upsetting to some people.
0 Not at all
1
2 Slightly
3
4 Quite
5
6 Extremely
True True True True
2012 Summer Enrichment Program
Page 6
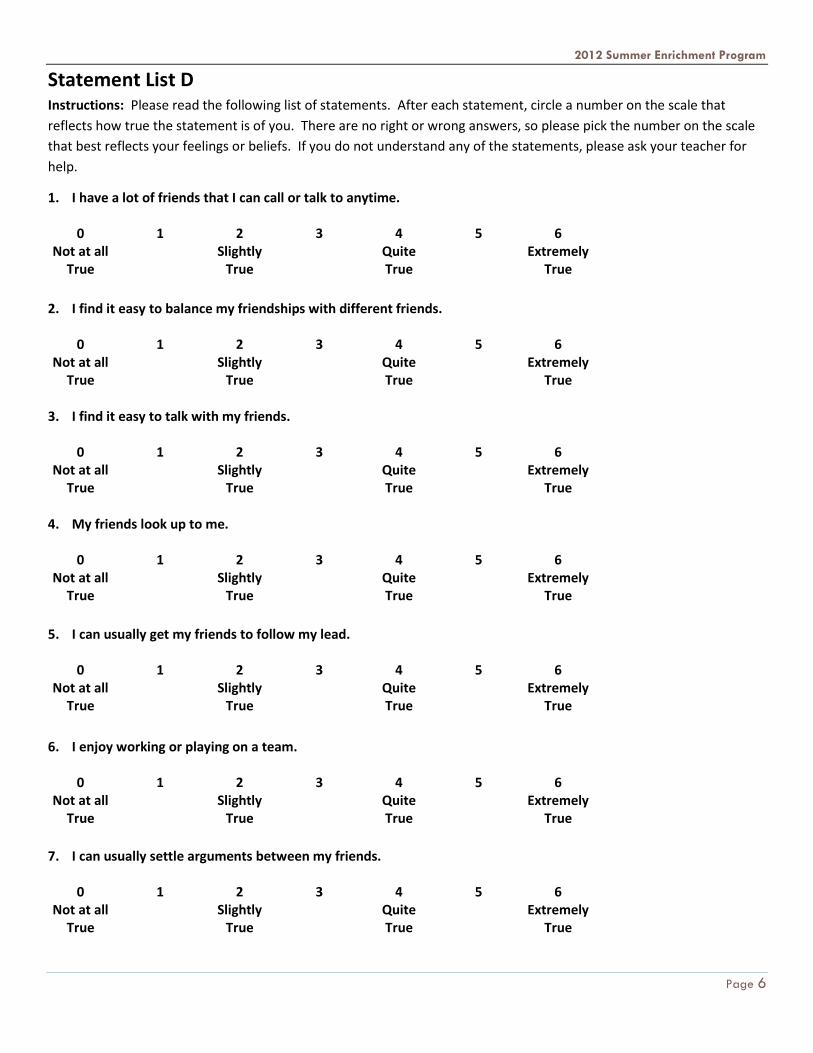
Statement List D Instructions: Please read the following list of statements. After each statement, circle a number on the scale that
reflects how true the statement is of you. There are no right or wrong answers, so please pick the number on the scale
that best reflects your feelings or beliefs. If you do not understand any of the statements, please ask your teacher for
help.
1. I have a lot of friends that I can call or talk to anytime.
0 Not at all
1
2 Slightly
3
4 Quite
5
6 Extremely
True True True True
2. I find it easy to balance my friendships with different friends.
0 Not at all
1
2 Slightly
3
4 Quite
5
6 Extremely
True True True True
3. I find it easy to talk with my friends.
0 Not at all
1
2 Slightly
3
4 Quite
5
6 Extremely
True True True True
4. My friends look up to me.
0 Not at all
1
2 Slightly
3
4 Quite
5
6 Extremely
True True True True
5. I can usually get my friends to follow my lead.
0 Not at all
1
2 Slightly
3
4 Quite
5
6 Extremely
True True True True
6. I enjoy working or playing on a team.
0 Not at all
1
2 Slightly
3
4 Quite
5
6 Extremely
True True True True
7. I can usually settle arguments between my friends.
0 Not at all
1
2 Slightly
3
4 Quite
5
6 Extremely
True True True True
2012 Summer Enrichment Program
Page 7
When you have completed all the above items, please turn to the next page.
Report Note: The section headings in the survey above appear as they did in the instrument used to collect data.
The sections correspond to the 4 Initial Outcome scales as follows:
List A – Self-awareness
List B – Self-management
List C – Social-awareness
List D – Relationship-management
8. My friends look to me for my opinion.
0 Not at all
1
2 Slightly
3
4 Quite
5
6 Extremely
True True True True
2012 Summer Enrichment Program
Page 8
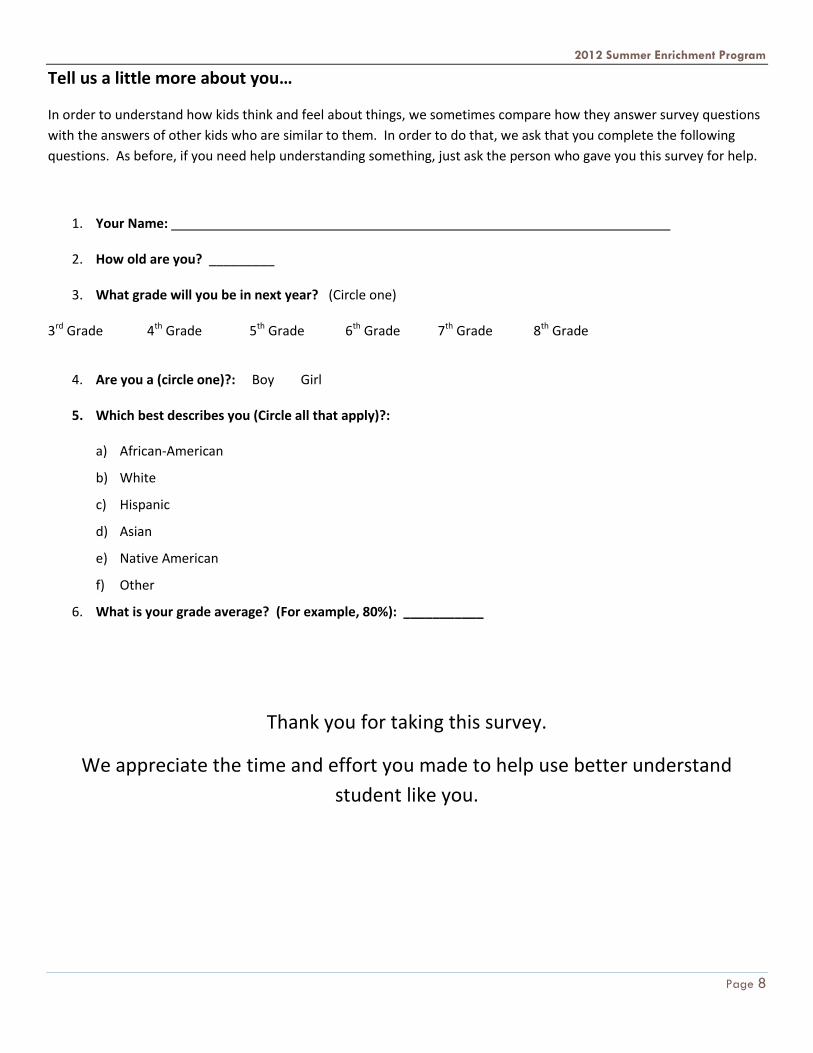
Tell us a little more about you…
In order to understand how kids think and feel about things, we sometimes compare how they answer survey questions
with the answers of other kids who are similar to them. In order to do that, we ask that you complete the following
questions. As before, if you need help understanding something, just ask the person who gave you this survey for help.
1. Your Name:
2. How old are you? _________
3. What grade will you be in next year? (Circle one)
3rd Grade 4th Grade 5th Grade 6th Grade 7th Grade 8th Grade
4. Are you a (circle one)?: Boy Girl
5. Which best describes you (Circle all that apply)?:
a) African-American
b) White
c) Hispanic
d) Asian
e) Native American
f) Other
6. What is your grade average? (For example, 80%): ___________
Thank you for taking this survey.
We appreciate the time and effort you made to help use better understand
student like you.
CITATIONS
1 Project SOAR Evidenced-Based Outcomes (Website)
http://www.cradlebeach.org/cradle-beach-research-project-soar.100034.content
2 Cradle Beach: Our History (Website)
http://www.cradlebeach.org/content/pages/history
3 The Search Institute (Website)
http://www.search-institute.org
4 40 Developmental Assets for Middle Childhood
http://www.search-institute.org/40-developmental-asset-middle-childhood-8-12