Embed Size (px)
Citation preview
2012 Virginia Polytechnic Institute and State University ANR-19NP
Virginia Cooperative Extension programs and employment are open to all, regardless of race, color, national origin, sex, religion, age, disability, political beliefs, sexual orientation, or marital or family status. An
equal opportunity/affirmative action employer. Issued in furtherance of Cooperative Extension work, Virginia Polytechnic Institute and State University, Virginia State University, and the U.S. Department of
Agriculture cooperating. Edwin J. Jones, Director, Virginia Cooperative Extension, Virginia Tech, Blacksburg; Jewel E. Hairston, Interim Administrator, 1890 Extension Program, Virginia State, Petersburg.
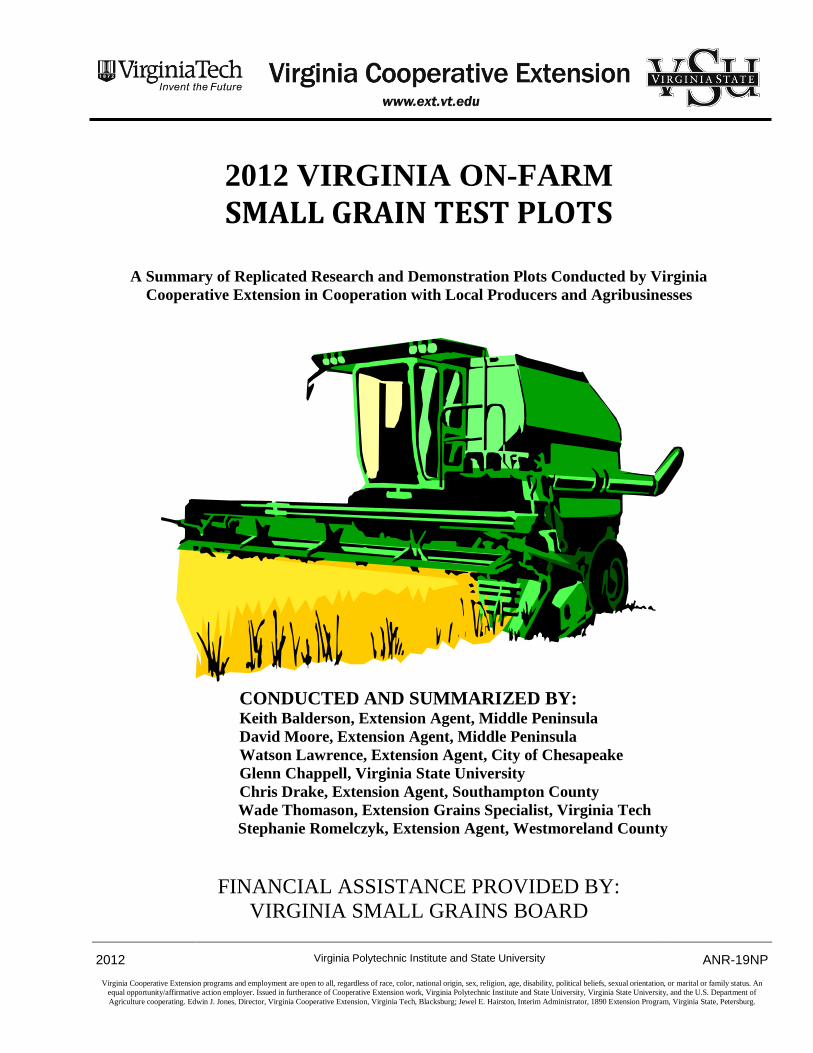
2012 VIRGINIA ON-FARM
SMALL GRAIN TEST PLOTS
A Summary of Replicated Research and Demonstration Plots Conducted by Virginia
Cooperative Extension in Cooperation with Local Producers and Agribusinesses
CONDUCTED AND SUMMARIZED BY: Keith Balderson, Extension Agent, Middle Peninsula
David Moore, Extension Agent, Middle Peninsula
Watson Lawrence, Extension Agent, City of Chesapeake
Glenn Chappell, Virginia State University
Chris Drake, Extension Agent, Southampton County
Wade Thomason, Extension Grains Specialist, Virginia Tech
Stephanie Romelczyk, Extension Agent, Westmoreland County
FINANCIAL ASSISTANCE PROVIDED BY:
VIRGINIA SMALL GRAINS BOARD
2
INTRODUCTION
The demonstration and research plot results discussed in this publication are a cooperative effort by
four Virginia Cooperative Extension agents, extension specialists from Virginia Tech, and an
assistant professor at the Virginia State University School of Agriculture. We are proud to present
this year’s on-farm small grain plot work to you. The 2011-12 small grain season was challenging.
Wet conditions in the fall hampered planting and caused stand losses in some fields. Precipitation
was well below normal and temperatures were well above normal for January through mid April.
Dry conditions decreased tillering and overall growth of the crop. Widespread rainfall on April 22nd
basically saved the crop. Some late season diseases developed in some fields. With July 2013
wheat futures prices currently trading over $8.00 per bushel, the outlook for the 2013 crop is very
good. We hope the information in this publication will help farmers produce a profitable crop.
The field work and printing of this publication are supported by the Virginia Small Grains Check-
Off Funds. The cooperators gratefully acknowledge this support. Any small grain producer or
agribusiness personnel who would like to receive of copy of this report should contact his/her local
extension agent, who can request a copy from Keith Balderson in Essex County at 804 443-3551 or
This is the nineteenth year of this multi-year project. Further work is planned for the upcoming
growing season.
The authors wish to thank the many producers who participated in this project. Appreciation is
extended to the seed, chemical, and fertilizer representative who donated products and/or assisted
with the field work.
DISCLAIMER:
Trade and brand names are used for educational purposes only, and Virginia Cooperative Extension
does not guarantee or warrant the standards of the product, nor does Virginia Cooperative Extension
imply approval of the product to the exclusion of others which may be also be suitable.

3
TABLE OF CONTENTS
Page
General Summary. . . . . . . . . . . . . . . . . . . . . . . . . . . . . . . . . . . . . . . . . . . . . . . . . . 4
Small Grain Variety Plots. . . . . . . . . . . . . . . . . . . . . . . . . . . . . . . . . . . . . . . . . . . . 5-11
Soil Fertility Plots. . . . . . . . . . . . . . . . . . . . . . . . . . . . . . . . . . . . . . . . . . . . . . . . . . 12-15
Pest Management Plots and Observations. . . . . . . . . . . . . . . . . . . . . . . . . . . . . . . . 16-20
Tissue Testing Results. . . . . . . . . . . . . . . . . . . . . . . . . . . . . . . . . . . . . . . . . . . . . . . 21-23

4
GENERAL SUMMARY
A. VARIETY SELECTION: Variety selection remains one of the most important components
of wheat production. We planted wheat variety demonstration plots in five locations in eastern and central
Virginia. The Middlesex, Westmoreland, and Va. State University locations included the same varieties.
Yields were low at the Virginia State location. Average of the varieties over the Westmoreland and
Middlesex locations ranged from 78 bushels per acre to 100 bushels per acre. The top four varieties averaged
over those two locations were Dyna-Gro 9042 at 100 bushels per acre, Shirley at 96 bushels per acre, Beck’s
113 at 92 bushels per acre and Merl at 90 bushels per acre. Wheat variety plots in Chesapeake and
Southampton included the same varieties. Average of the varieties over those two locations ranged from 79
bushels per acre to 103.5 bushels per acre with top varieties being Dyna-Gro 9053, Southern States 560,
Southern States 5205 Agripro Oakes, and Pioneer 26R20.
B. SOIL FERTILITY PLOTS: In a plot evaluating organic carbon applied at 1 qt. per acre in the fall
and twice in the spring, we did not get a yield response. In a plot evaluating the effect of soil pH on wheat,
low soil pH resulted in a yield loss of over 10 bushels per acre. In a plot evaluating an application of zinc at
.25 per acre, we got no yield response to zinc.
C. FUNGICIDE PLOTS: In a plot evaluating a .5 rate of Headline fungicide applied in the second
nitrogen application, there was no yield response with yields over 100 bushels per acre. In two plots
evaluating Prosaro fungicide applied at flowering, the fungicide treated plots yielded 3.5 bushels per acre
more than the untreated plots. In one plot the yield difference was statistically significant, while at the other
location the yield difference was statistically significant. Prosaro also increased test weight at the Middlesex
location where test weights were recorded. Head scab was not an issue at either location.
D. TISSUE TESTING: Twenty-nine tissue samples were analyzed for nutrient content during the
spring of 2012 in the Middle Peninsula. Many of these samples were taken as a part of trouble-shooting
barley and wheat production problems. Sulfur was deficient in 1 sample, while manganese was deficient in 2
samples. From 2007-2012, two hundred thirteen tissue samples were submitted for full analysis. Seventeen
samples were deficient in sulfur, nine samples were deficient in magnesium, nine samples were deficient in
zinc, and twenty-one samples were deficient in manganese.

5
2012 Southampton County Wheat Variety Evaluation Plot
Cooperators: Producer: Chance Crowder
Extension: Chris Drake, Southampton County Extension Agent, ANR
Previous Crop: Peanuts
Soil Type: Uchee Loamy Sand
Tillage: Disked, Planted w/ JD 1590 No-Till Drill on 7.5” spacing at 160#/acre
Planting Date: 11/25/11
Fertilizer: 300# 7-18-36 broadcast preplant, 25 gallons 24-0-0-3S on 2/25/12,
15 gallons 24-0-0-3S on 3/8, 10 gallons 24-0-0-3S on 3/28
Crop Protection: 3/8 – 0.75 oz. Harmony, 3/28 – 1.9 oz. Karate, 6.5 oz Quadris
Harvest Date: 6/11/12 with Case 1688 Axial Flow Combine with 15 ft. platform
Discussion: The wheat performed excellent for the most part despite the late planting date. The weather was
warm following planting that led to an excellent stand and good tillering. It benefited from a warm winter and
early spring. Timely April rains led to some outstanding yields with several varieties. The Shirley plot had
some deer feeding damage and yields would have been in the range of the best performing varieties
otherwise. We harvested 200 foot long by 15 foot wide plots out of the 300’ x 30’ plots that were planted.
This was a great test showing several potentially high yielding varieties to choose from when making planting
decisions in 2012.
Variety Test Weight
(Lbs./Bu.)
Moisture
(%)
Yield
Bu./A @13.5%
Agripro Branson 58.8 12.7 89.8
DG Shirley 60.1 12.2 81.2
DG 9053 57.4 12.2 113.1
DG 9042 58.0 12.5 80.7
USG 3555 59.5 12.6 102.8
Pioneer 26R22 59.8 12.5 76.0
Pioneer 26R20 60.6 12.3 103.2
SS 560 57.9 12.7 114.9
SS 5205 59.8 12.8 105.0
Agripro Oakes 59.9 12.9 95.1
GreatHeart 940 60.8 12.7 66.1
Agripro Cooper 60.6 12.5 76.0
AVG. ALL PLOTS 92.0

6

7
2012 Chesapeake Wheat Variety Plot
Cooperators: Producer: Marvel Nicholas
Extension: Watson Lawrence - Chesapeake
Previous Crop: Corn
Soil Type: Chesapeake Fine Sandy Loam
Tillage: Disk followed by disk with culti-packer
Planting Date: October 27, 2011
Fertilizer: October: 8-13-33 @ 424 lbs./acre + 3.8 lbs. sulfur/acre
Late February: 32%Nitrogen @ 90 lbs. acre
Crop Protection: Herbicide: Harmony SG @ ¾ oz./acre
Harvest Date: June 20, 2012
Discussion: We noticed in February the wheat crop was advancing physiologically ahead of normal. This
was due to the unusually warm winter we experienced. There was some indecision whether to apply nitrogen
in late February due to the fact we did not want to over advance the crop and cause freeze problems later if
heads emerged too soon. But the crop was showing signs of needing nitrogen (yellowing) and dry field
conditions presented an opportunity to get nitrogen on the crop. So nitrogen was applied about two weeks
ahead of the normal calendar date to coincide with the advanced phase of the crop. This was a good decision
because fields soon became wet in early March. The crop was already well tillered, but the early nitrogen
probably increased tillers more to make this one of the best tillered crops in recent years. Powdery Mildew
and other diseases did not present problems this spring. Cereal leaf beetles did not meet threshold in 2012
after large numbers were seen last year at this farm. Test weights were extremely variable even though there
was plenty of rainfall in May when heads were maturing. The variety Shirley continues to be the best
yielding variety for our area. Since Shirley was first planted in 2009, it has yielded first place twice and
second place twice in my variety tests. All of the other varieties performed well this year also.
Variety Test Weight
(Lbs./Bu.)
Moisture
(%)
Yield
Bu./[email protected]%
Shirley 54 14.4 94.78
Dyna Gro 9042 59 14.3 94.55
Dyna Gro 9053 55 13.6 93.61
Oakes 58 16.1 93.04
Great Heart 940 60 14.9 92.37
Southern States 5205 59 14.4 91.64
USG 3555 58 15.4 91.20
USG 3665 51 15.1 89.31
Southern States 560 52 14.4 88.19
Cooper 58 14.5 87.99
Pioneer 26R22 59 14.2 87.24
Great Heart 933 55 13.7 86.81
Pioneer 26R20 59 14.4 85.21
Coker 9553 52 15.1 80.52
8
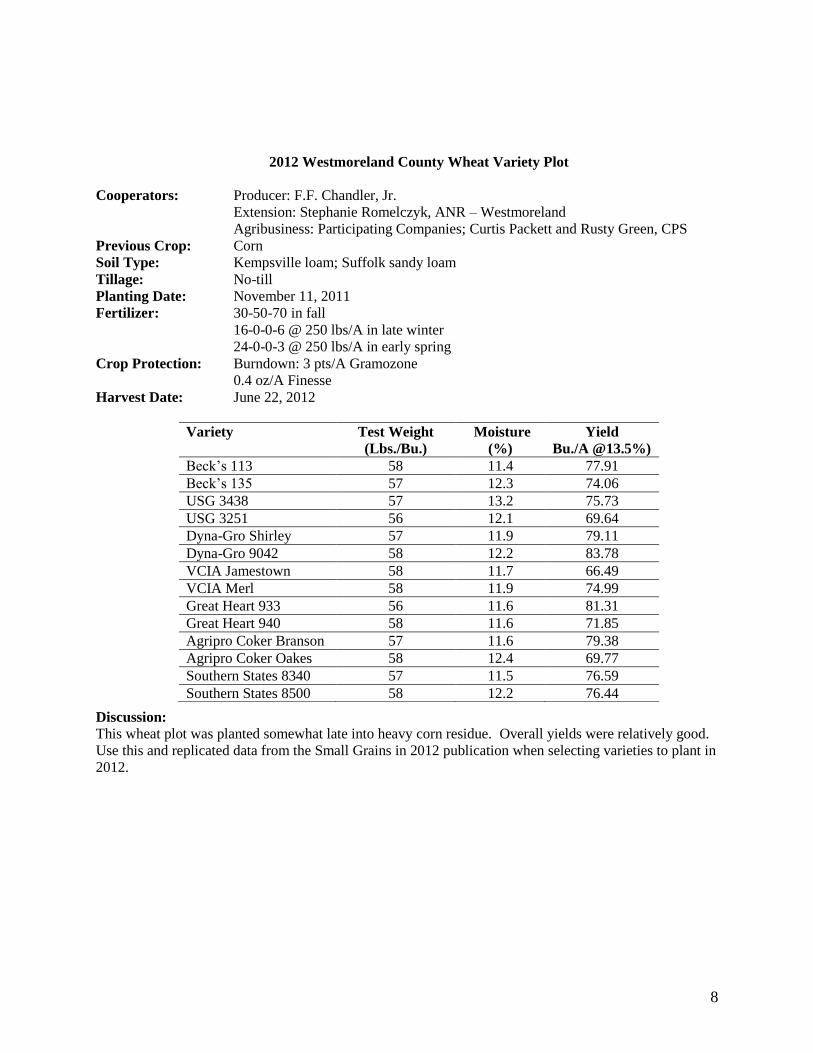
2012 Westmoreland County Wheat Variety Plot
Cooperators: Producer: F.F. Chandler, Jr.
Extension: Stephanie Romelczyk, ANR – Westmoreland
Agribusiness: Participating Companies; Curtis Packett and Rusty Green, CPS
Previous Crop: Corn
Soil Type: Kempsville loam; Suffolk sandy loam
Tillage: No-till
Planting Date: November 11, 2011
Fertilizer: 30-50-70 in fall
16-0-0-6 @ 250 lbs/A in late winter
24-0-0-3 @ 250 lbs/A in early spring
Crop Protection: Burndown: 3 pts/A Gramozone
0.4 oz/A Finesse
Harvest Date: June 22, 2012
Discussion: This wheat plot was planted somewhat late into heavy corn residue. Overall yields were relatively good.
Use this and replicated data from the Small Grains in 2012 publication when selecting varieties to plant in
2012.
Variety Test Weight
(Lbs./Bu.)
Moisture
(%)
Yield
Bu./A @13.5%)
Beck’s 113 58 11.4 77.91
Beck’s 135 57 12.3 74.06
USG 3438 57 13.2 75.73
USG 3251 56 12.1 69.64
Dyna-Gro Shirley 57 11.9 79.11
Dyna-Gro 9042 58 12.2 83.78
VCIA Jamestown 58 11.7 66.49
VCIA Merl 58 11.9 74.99
Great Heart 933 56 11.6 81.31
Great Heart 940 58 11.6 71.85
Agripro Coker Branson 57 11.6 79.38
Agripro Coker Oakes 58 12.4 69.77
Southern States 8340 57 11.5 76.59
Southern States 8500 58 12.2 76.44
9
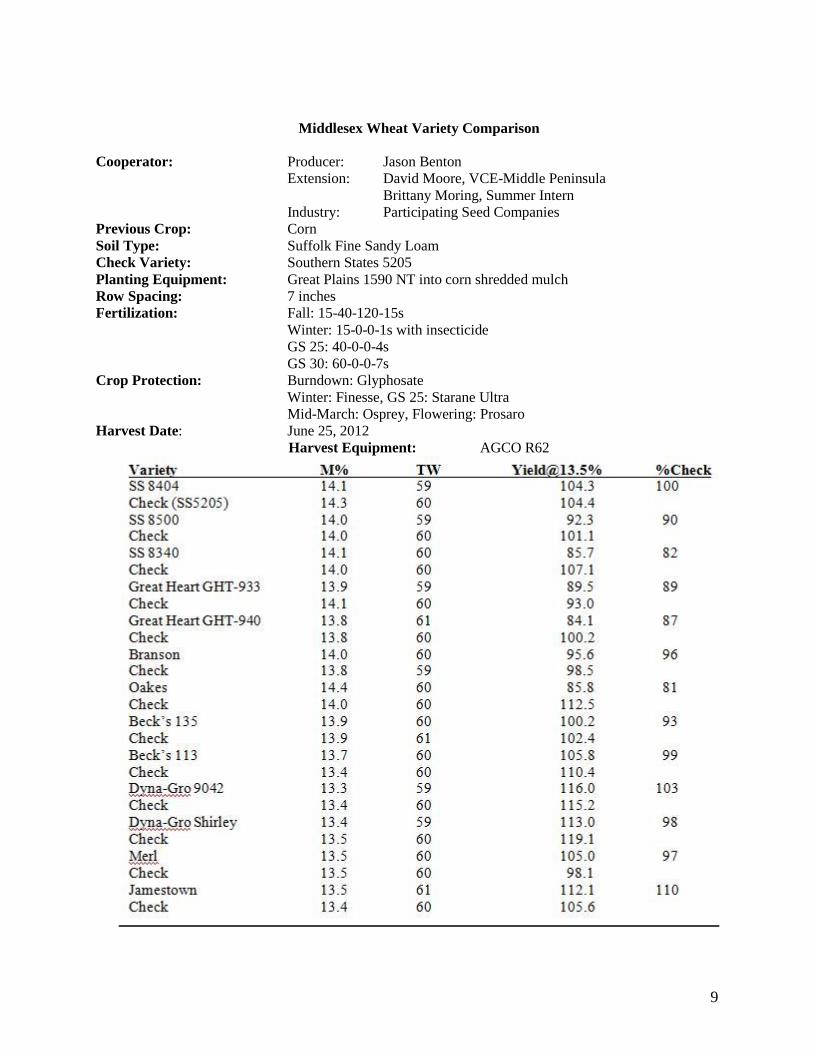
Middlesex Wheat Variety Comparison
Cooperator: Producer: Jason Benton
Extension: David Moore, VCE-Middle Peninsula
Brittany Moring, Summer Intern
Industry: Participating Seed Companies
Previous Crop: Corn
Soil Type: Suffolk Fine Sandy Loam
Check Variety: Southern States 5205
Planting Equipment: Great Plains 1590 NT into corn shredded mulch
Row Spacing: 7 inches
Fertilization: Fall: 15-40-120-15s
Winter: 15-0-0-1s with insecticide
GS 25: 40-0-0-4s
GS 30: 60-0-0-7s
Crop Protection: Burndown: Glyphosate
Winter: Finesse, GS 25: Starane Ultra
Mid-March: Osprey, Flowering: Prosaro
Harvest Date: June 25, 2012
Harvest Equipment: AGCO R62

10
Escalate: Difenconazole, Metalaxyl, Dividend Extreme, Storcide
Proceed: Metalaxyl, Prothioconazole, Tebuconazole
Dyna-Shield: Gaucho, Metalaxyl, Raxil
Awaken ST®: A complex of zinc ammonium acetate with potash and balanced micronutrient seed treatment
package including boron, copper, iron, manganese, molybdenum and zinc.
VISOR 5 Tebuconazole, Metalaxyl, Thiamethoxam, Imazalil (fungicide), Awaken ST®
Discussion: This was a very good plot. Early maturing varieties may have had an advantage when things
turned hot and dry around early April this year. The plot area for each variety was 14 feet
wide and approximately 700 feet in length. Use this and other Virginia Tech small grain
variety information when making planting decisions for 2013.

11
2011/12 Virginia State University Small Grain Variety Comparison
Cooperators: Producer: Glenn F. Chappell
Glenn F. Chappell, II – Virginia State University
Glenn F. Chappell, III – Virginia State University
Scott Reiter – Virginia Cooperative Extension – Prince George
Previous Crop: Corn
Soil Type: Emporia Sandy loam
Tillage: No-Till
Test/Plot Size: 300 ft x 30 ft per variety
Planting Equipment: John Deere 1590 NT Drill
Planting Date: November 12, 2011
Row Spacing: 7.5 inches
Variety: Various
Seeding Rate: 25 seed/row ft
Crop Protection: Herbicides: 1.0 oz of Harmony Extra – Mar. 13, 2012
Fertilizer: 60 lbs of N – Feb. 1, 2012 & 50 lbs. of N Mar. 13, 2012
Harvest Date: June 25, 2012
Harvest Equipment: John Deere 6620
Brand Variety Moisture (%) Yield Bu/A
USG 3251 14.2 40.1
VCIA Jamestown 13.2 45.2
Agripro Oaks 15.7 38.7
Southern S. 8500 14.1 45.9
USG 3438 13.1 41.2
Southern S. 8340 14.9 44.1
Great Heart 940 13.6 40.9
Great Heart 933 13.8 39.3
Dyna-Gro Shirley 14.4 26.2
Agripro Branson 12.9 29.1
VCIA Merl 14.1 35.3
Becks 113 14.7 39.6
Dyna-Gro 9042 12.6 59.3
Becks 135 12.1 51.8
Discussion: Due to weather conditions the plot did not receive any fall nitrogen resulting in a low tiller
production. Check varieties on either side of the plot were eliminated from the results due to wildlife
damage. Compare these results with regional data to better choose wheat varieties.

12
2012 Virginia Cooperative Extension On-Farm Wheat Variety Plot Yield Summary (bu/A @ 13.5%)
Variety Middlesex Westmoreland Mdsx/Wmlnd Chesapeake Southampton Chspke/S. Hampton Total
Avg. Avg. Avg
Beck's 113 106 78 92
Beck's 135 100 74 87
USG 3438 99 76 87.5
USG 3251 107 70 88.5
USG 3555 91 103 97
USG 3665 89
Dyna-Gro Shirley 113 79 96 95 81 88 92
Dyna-Gro 9042 116 84 100 95 81 88 94
Dyna-Gro 9053 94 113 103.5
VCIA Jamestown 112 66 89
VCIA Merl 105 75 90
Great Heart 933 90 81 85.5 87
Great Heart 940 84 72 78 92 66 79 78.5
Agripro Branson 96 79 87.5 90
Agripro Oakes 86 70 78 93 95 94 86
Agripro Cooper 88 76 82
Coker 9553 81
Southern States 5205 92 105 98.5
Southern States 560 88 115 101.5
Southern States 8340 86 77 81.5
Southern States 8404 104
Southern States 8500 92 76 84
Pioneer 26R15 105
Pioneer 26R20 93 85 103 94
Pioneer 26R22 87 76 81.5
Average 100 76 87 90 92 91
13
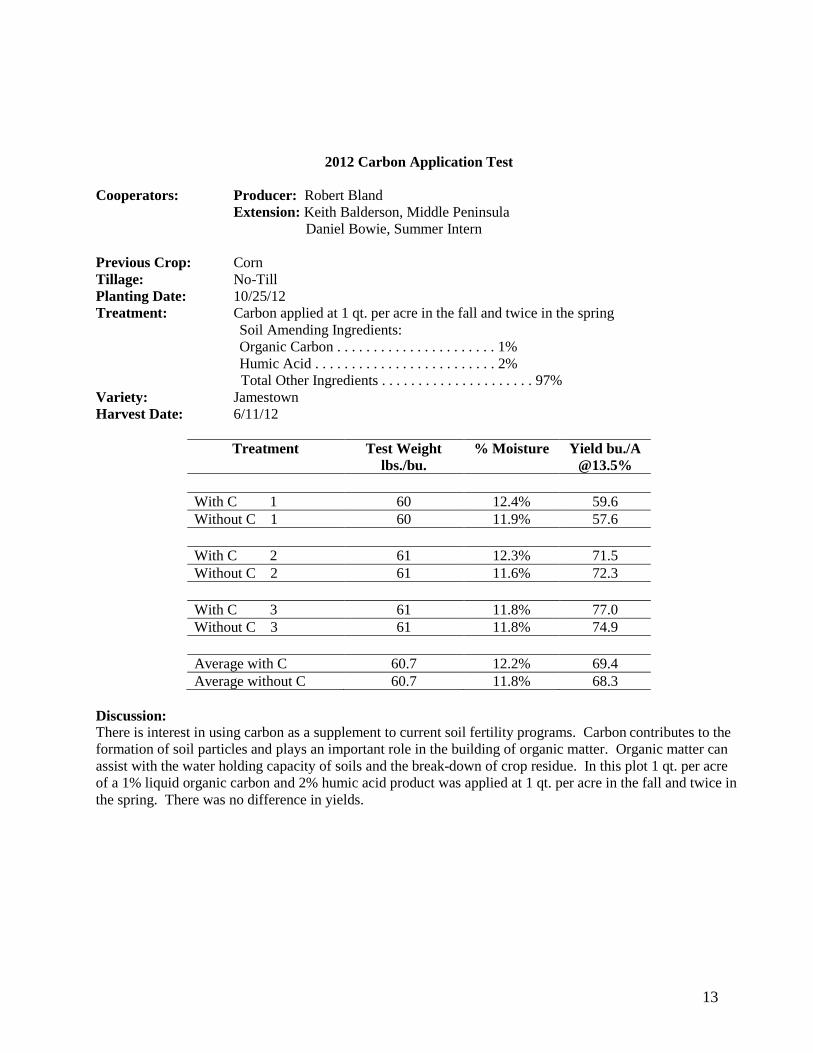
2012 Carbon Application Test
Cooperators: Producer: Robert Bland
Extension: Keith Balderson, Middle Peninsula
Daniel Bowie, Summer Intern
Previous Crop: Corn
Tillage: No-Till
Planting Date: 10/25/12
Treatment: Carbon applied at 1 qt. per acre in the fall and twice in the spring
Soil Amending Ingredients:
Organic Carbon . . . . . . . . . . . . . . . . . . . . . . 1%
Humic Acid . . . . . . . . . . . . . . . . . . . . . . . . . 2%
Total Other Ingredients . . . . . . . . . . . . . . . . . . . . . 97%
Variety: Jamestown
Harvest Date: 6/11/12
Treatment Test Weight
lbs./bu. % Moisture Yield bu./A
@13.5%
With C 1 60 12.4% 59.6 Without C 1 60 11.9% 57.6
With C 2 61 12.3% 71.5 Without C 2 61 11.6% 72.3
With C 3 61 11.8% 77.0 Without C 3 61 11.8% 74.9
Average with C 60.7 12.2% 69.4 Average without C 60.7 11.8% 68.3
Discussion: There is interest in using carbon as a supplement to current soil fertility programs. Carbon contributes to the
formation of soil particles and plays an important role in the building of organic matter. Organic matter can
assist with the water holding capacity of soils and the break-down of crop residue. In this plot 1 qt. per acre
of a 1% liquid organic carbon and 2% humic acid product was applied at 1 qt. per acre in the fall and twice in
the spring. There was no difference in yields.
14
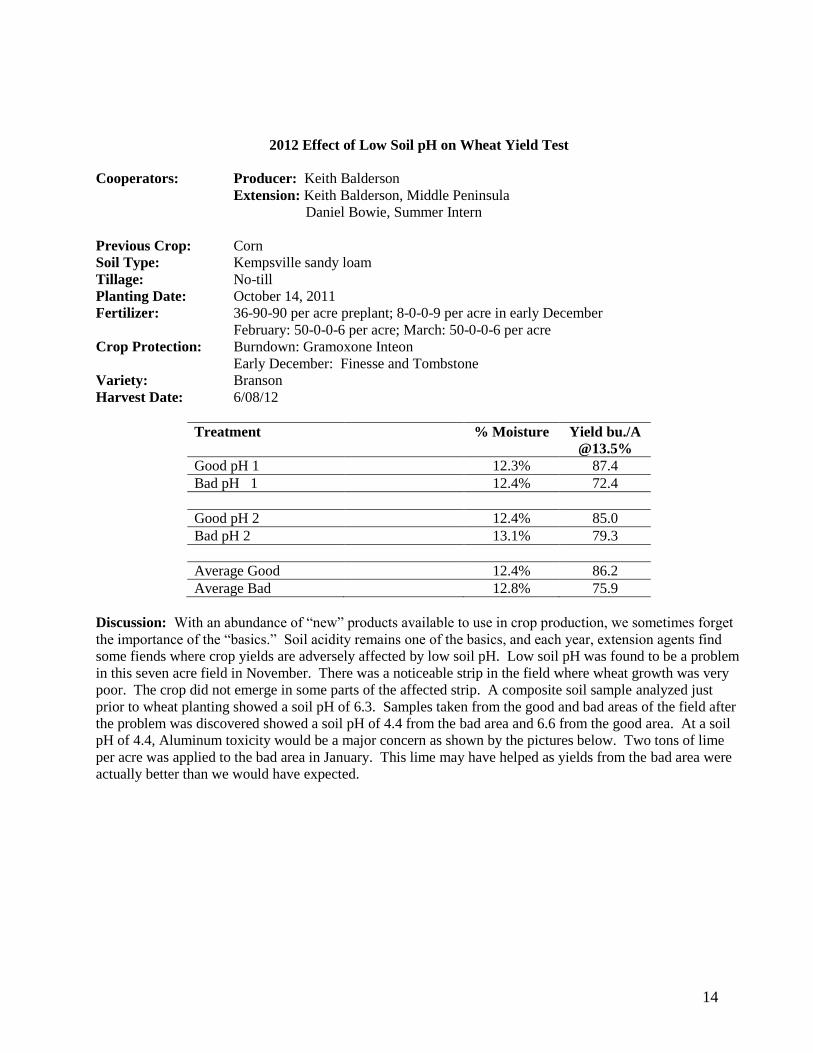
2012 Effect of Low Soil pH on Wheat Yield Test
Cooperators: Producer: Keith Balderson
Extension: Keith Balderson, Middle Peninsula
Daniel Bowie, Summer Intern
Previous Crop: Corn
Soil Type: Kempsville sandy loam
Tillage: No-till
Planting Date: October 14, 2011
Fertilizer: 36-90-90 per acre preplant; 8-0-0-9 per acre in early December
February: 50-0-0-6 per acre; March: 50-0-0-6 per acre
Crop Protection: Burndown: Gramoxone Inteon
Early December: Finesse and Tombstone
Variety: Branson
Harvest Date: 6/08/12
Treatment % Moisture Yield bu./A
@13.5%
Good pH 1 12.3% 87.4
Bad pH 1 12.4% 72.4
Good pH 2 12.4% 85.0
Bad pH 2 13.1% 79.3
Average Good 12.4% 86.2
Average Bad 12.8% 75.9
Discussion: With an abundance of “new” products available to use in crop production, we sometimes forget
the importance of the “basics.” Soil acidity remains one of the basics, and each year, extension agents find
some fiends where crop yields are adversely affected by low soil pH. Low soil pH was found to be a problem
in this seven acre field in November. There was a noticeable strip in the field where wheat growth was very
poor. The crop did not emerge in some parts of the affected strip. A composite soil sample analyzed just
prior to wheat planting showed a soil pH of 6.3. Samples taken from the good and bad areas of the field after
the problem was discovered showed a soil pH of 4.4 from the bad area and 6.6 from the good area. At a soil
pH of 4.4, Aluminum toxicity would be a major concern as shown by the pictures below. Two tons of lime
per acre was applied to the bad area in January. This lime may have helped as yields from the bad area were
actually better than we would have expected.

15
Figure 1. Effect of aluminum toxicity on wheat roots caused by low soil pH.
Figure 2. Effect of low soil pH on wheat following heading
16
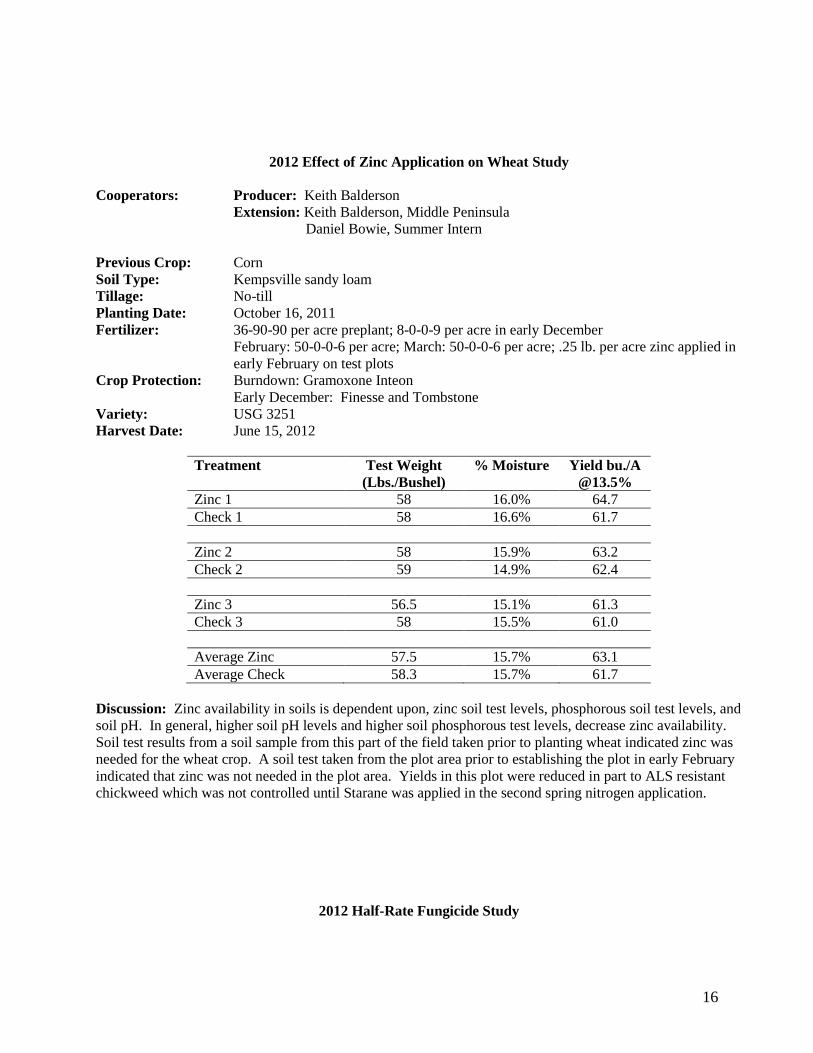
2012 Effect of Zinc Application on Wheat Study
Cooperators: Producer: Keith Balderson
Extension: Keith Balderson, Middle Peninsula
Daniel Bowie, Summer Intern
Previous Crop: Corn
Soil Type: Kempsville sandy loam
Tillage: No-till
Planting Date: October 16, 2011
Fertilizer: 36-90-90 per acre preplant; 8-0-0-9 per acre in early December
February: 50-0-0-6 per acre; March: 50-0-0-6 per acre; .25 lb. per acre zinc applied in
early February on test plots
Crop Protection: Burndown: Gramoxone Inteon
Early December: Finesse and Tombstone
Variety: USG 3251
Harvest Date: June 15, 2012
Treatment Test Weight
(Lbs./Bushel)
% Moisture Yield bu./A
@13.5%
Zinc 1 58 16.0% 64.7
Check 1 58 16.6% 61.7
Zinc 2 58 15.9% 63.2
Check 2 59 14.9% 62.4
Zinc 3 56.5 15.1% 61.3
Check 3 58 15.5% 61.0
Average Zinc 57.5 15.7% 63.1
Average Check 58.3 15.7% 61.7
Discussion: Zinc availability in soils is dependent upon, zinc soil test levels, phosphorous soil test levels, and
soil pH. In general, higher soil pH levels and higher soil phosphorous test levels, decrease zinc availability.
Soil test results from a soil sample from this part of the field taken prior to planting wheat indicated zinc was
needed for the wheat crop. A soil test taken from the plot area prior to establishing the plot in early February
indicated that zinc was not needed in the plot area. Yields in this plot were reduced in part to ALS resistant
chickweed which was not controlled until Starane was applied in the second spring nitrogen application.
2012 Half-Rate Fungicide Study
17
Cooperators: Producer: Jason Benton
Extension: David Moore, VCE-Middlesex
Brittany Moring, Summer Intern
Previous Crop: Corn
Soil Type: Suffolk Fine Sandy Loam
Tillage: No-Till 1590 GP Drill
Planting Date: October 15, 2011
Fertilizer: Fall 15-40-150-15s
Winter: 15-0-0-1s
February: 40-0-0-4s; March 60-0-0-7s
Crop Protection: Burndown: Glyphosate
Winter: Finesse, February: Starane Ultra
Mid-March: Osprey, Flowering: Prosaro
Treatment: ½ rate (4 ounces) of Headline Fungicide with 2nd
N Application
Variety: USG 3120
Harvest Date: June 26, 2012
Treatment Test Weight
lbs./bu.
% Moisture Yield bu./A
@13.5%
With Headline 1 59 12.7 101.6
Without Headline 1 60 12.9 100.4
With Headline 2 60 12.8 98.5
Without Headline 2 59 12.7 101.3
With Headline 3 59 12.6 109.4
Without Headline 3 59 12.6 114.7
Avg. with Headline 59 12.7 103.2
Avg. without Headline 59 12.7 105.5
Discussion:
Practices among wheat growers include applying one-half the rate of fungicides at GS 30 which is applied
with the second application of nitrogen in the spring. In this test, that application made no significant
difference in yield, moisture, or test weight. There were reports of early season powdery mildew, which
caused many growers to apply this practice. In most instances, this half rate application gives very little
residual protection. Money spent on fungicides would be better spent closer to the time of heading and grain
fill.
Use these and other Virginia Tech on farm plot results when making small grain production decisions for
2012-13.
2012 Middlesex Prosaro on Wheat Test

18
Cooperators: Producer: Jason Benton
Extension: David Moore, VCE-Middle Peninsula
Brittany Moring, Summer Intern
Previous Crop: Corn
Soil Type: Suffolk Fine Sandy Loam
Tillage: No-Till
Planting Date: October 13, 2011
Fertilizer: Fall: 18-46-90; December: 25-0-0-3
Spring (1): 45-0-0; Spring (2): 50-0-0
Crop Protection: Burndown: Glyphosate
December: 2 ounces Warrior
Spring (1): Finesse @ 3/10 ounces
Early March: Osprey @ 4.75 ounces
Early May: Prosaro @ 8 ounces
Treatment: Dividend Extreme
Variety: USG 3251
Harvest Date: June 15, 2012
Treatment Test Weight
lbs./bu.
% Moisture Yield bu./A
@13.5%
With Prosaro 1 62 14.4 118.4
Without Prosaro 1 60 13.9 113.3
With Prosaro 2 61 14.3 111.8
Without Prosaro 2 60 14.1 112.1
With Prosaro 3 61 14.2 109.6
Without Prosaro 3 61 13.7 104.4
Avg. with Prosaro 61.3 14.3 113.3
Avg. without Prosaro 60.3 13.9 109.9
LSD (0.10) ns 0.3 ns
Discussion: During most of the grain flowering period, Head Scab pressure was low. Late in the period,
temperatures stayed cool, moisture and humidity were higher than normal and we had some situations where
making the decision to spray a fungicide for head scab was difficult.
In this test, even though the difference is over 3 bushels, the increase is not significant due to replication
number 2 where there was no difference in yield. Please keep in mind that in a lot of fields, the spray tracks
will probably decrease yield by 2-3 bushels, making this application pretty much a wash.
In looking at the use of a fungicide for scab over the past 4-5 years, it appears that the worst that can happen
with this is breakeven. The best has been a 9 bushel increase. In all those cases, however, there has been an

19
increase in test weight. Use this and other replicated information when making future head scab spray
decisions.
20
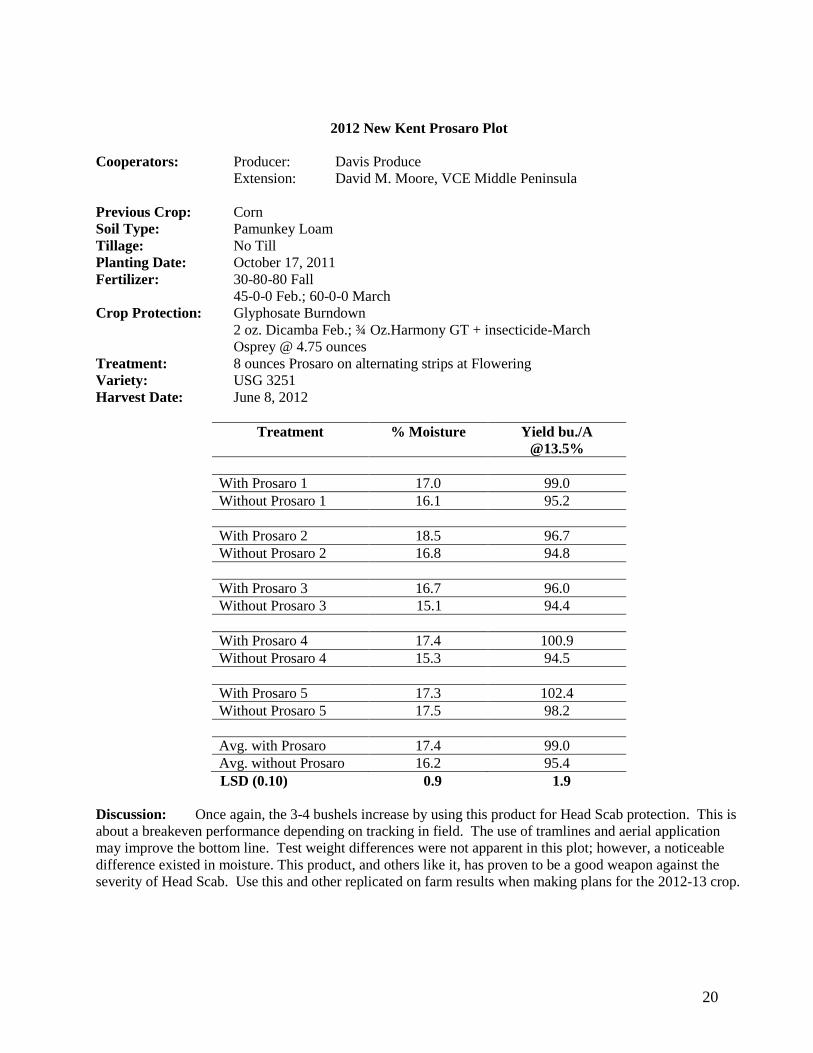
2012 New Kent Prosaro Plot
Cooperators: Producer: Davis Produce
Extension: David M. Moore, VCE Middle Peninsula
Previous Crop: Corn
Soil Type: Pamunkey Loam
Tillage: No Till
Planting Date: October 17, 2011
Fertilizer: 30-80-80 Fall
45-0-0 Feb.; 60-0-0 March
Crop Protection: Glyphosate Burndown
2 oz. Dicamba Feb.; ¾ Oz.Harmony GT + insecticide-March
Osprey @ 4.75 ounces
Treatment: 8 ounces Prosaro on alternating strips at Flowering
Variety: USG 3251
Harvest Date: June 8, 2012
Treatment % Moisture Yield bu./A
@13.5%
With Prosaro 1 17.0 99.0
Without Prosaro 1 16.1 95.2
With Prosaro 2 18.5 96.7
Without Prosaro 2 16.8 94.8
With Prosaro 3 16.7 96.0
Without Prosaro 3 15.1 94.4
With Prosaro 4 17.4 100.9
Without Prosaro 4 15.3 94.5
With Prosaro 5 17.3 102.4
Without Prosaro 5 17.5 98.2
Avg. with Prosaro 17.4 99.0
Avg. without Prosaro 16.2 95.4
LSD (0.10) 0.9 1.9
Discussion: Once again, the 3-4 bushels increase by using this product for Head Scab protection. This is
about a breakeven performance depending on tracking in field. The use of tramlines and aerial application
may improve the bottom line. Test weight differences were not apparent in this plot; however, a noticeable
difference existed in moisture. This product, and others like it, has proven to be a good weapon against the
severity of Head Scab. Use this and other replicated on farm results when making plans for the 2012-13 crop.

21
Field Mouse Feeding on Wheat Stems
A field of wheat in Westmoreland County exhibited areas in the field with scattered “white” heads in
mid-May. The damage was in clumps. In some cases, stems of wheat were cut up in small pieces
and left on the ground in the clumps. “Chewing” damage was evident on the stems of the plants
with the dead heads, and the damage almost always occurred just above the top node of the wheat
plant. This damage was most likely caused by field mice.
22
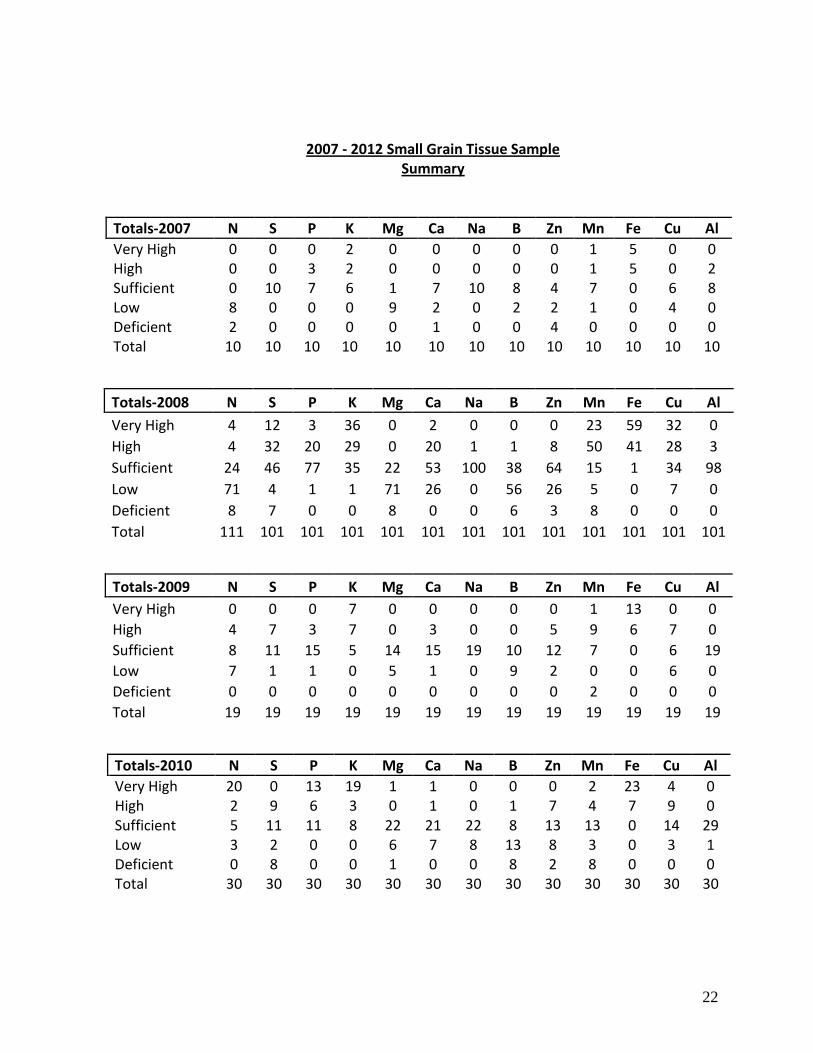
2007 - 2012 Small Grain Tissue Sample
Summary
Totals-2007 N S P K Mg Ca Na B Zn Mn Fe Cu Al
Very High 0 0 0 2 0 0 0 0 0 1 5 0 0 High 0 0 3 2 0 0 0 0 0 1 5 0 2 Sufficient 0 10 7 6 1 7 10 8 4 7 0 6 8 Low 8 0 0 0 9 2 0 2 2 1 0 4 0 Deficient 2 0 0 0 0 1 0 0 4 0 0 0 0 Total 10 10 10 10 10 10 10 10 10 10 10 10 10
Totals-2008 N S P K Mg Ca Na B Zn Mn Fe Cu Al
Very High 4 12 3 36 0 2 0 0 0 23 59 32 0
High 4 32 20 29 0 20 1 1 8 50 41 28 3
Sufficient 24 46 77 35 22 53 100 38 64 15 1 34 98
Low 71 4 1 1 71 26 0 56 26 5 0 7 0
Deficient 8 7 0 0 8 0 0 6 3 8 0 0 0
Total 111 101 101 101 101 101 101 101 101 101 101 101 101
Totals-2009 N S P K Mg Ca Na B Zn Mn Fe Cu Al
Very High 0 0 0 7 0 0 0 0 0 1 13 0 0
High 4 7 3 7 0 3 0 0 5 9 6 7 0
Sufficient 8 11 15 5 14 15 19 10 12 7 0 6 19
Low 7 1 1 0 5 1 0 9 2 0 0 6 0
Deficient 0 0 0 0 0 0 0 0 0 2 0 0 0
Total 19 19 19 19 19 19 19 19 19 19 19 19 19
Totals-2010 N S P K Mg Ca Na B Zn Mn Fe Cu Al
Very High 20 0 13 19 1 1 0 0 0 2 23 4 0 High 2 9 6 3 0 1 0 1 7 4 7 9 0 Sufficient 5 11 11 8 22 21 22 8 13 13 0 14 29 Low 3 2 0 0 6 7 8 13 8 3 0 3 1 Deficient 0 8 0 0 1 0 0 8 2 8 0 0 0 Total 30 30 30 30 30 30 30 30 30 30 30 30 30

23
Totals-2011 N S P K Mg Ca Na B Zn Mn Fe Cu Al
Barley
Very High 0 0 0 4 0 0 0 0 0 0 3 0 0
High 2 2 3 0 0 4 0 0 1 2 0 0 0
Sufficient 2 3 2 1 5 1 5 1 3 2 2 3 5
Low 2 0 0 0 0 0 0 2 1 0 0 1 0
Deficient 0 0 0 0 0 0 0 2 0 1 0 1 0
Total 6 5 5 5 5 5 5 5 5 5 5 5 5
Wheat
Very High 0 0 0 0 0 0 0 0 0 0 3 0 0
High 12 0 10 1 0 0 0 0 0 0 0 0 2
Sufficient 22 13 9 18 17 18 19 4 18 17 16 14 17
Low 0 6 0 0 2 1 0 13 1 1 0 5 0
Deficient 0 0 0 0 0 0 0 2 0 1 0 0 0
Total 34 19 19 19 19 19 19 19 19 19 19 19 19
Totals-2012 N S P K Mg Ca Na B Zn Mn Fe Cu Al
Barley Very High 0 0 0 0 0 0 0 0 0 0 0 0 0 High 2 0 0 0 0 3 0 0 0 1 0 0 0 Sufficient 1 3 5 5 4 1 4 5 5 4 5 5 4 Low 0 1 0 0 1 1 1 0 0 0 0 0 0 Deficient 2 1 0 0 0 0 0 0 0 0 0 0 1 Total 5 5 5 5 5 5 5 5 5 5 5 5 5 Wheat Very High 1 0 0 0 0 0 1 1 0 0 1 0 0 High 5 0 6 3 0 6 0 0 0 0 0 1 0 Sufficient 14 17 15 21 21 18 23 9 23 22 23 23 18 Low 2 6 3 0 3 0 0 14 1 1 0 0 6 Deficient 2 1 0 0 0 0 0 0 0 1 0 0 0 Total 24 24 24 24 24 24 24 24 24 24 24 24 24
24
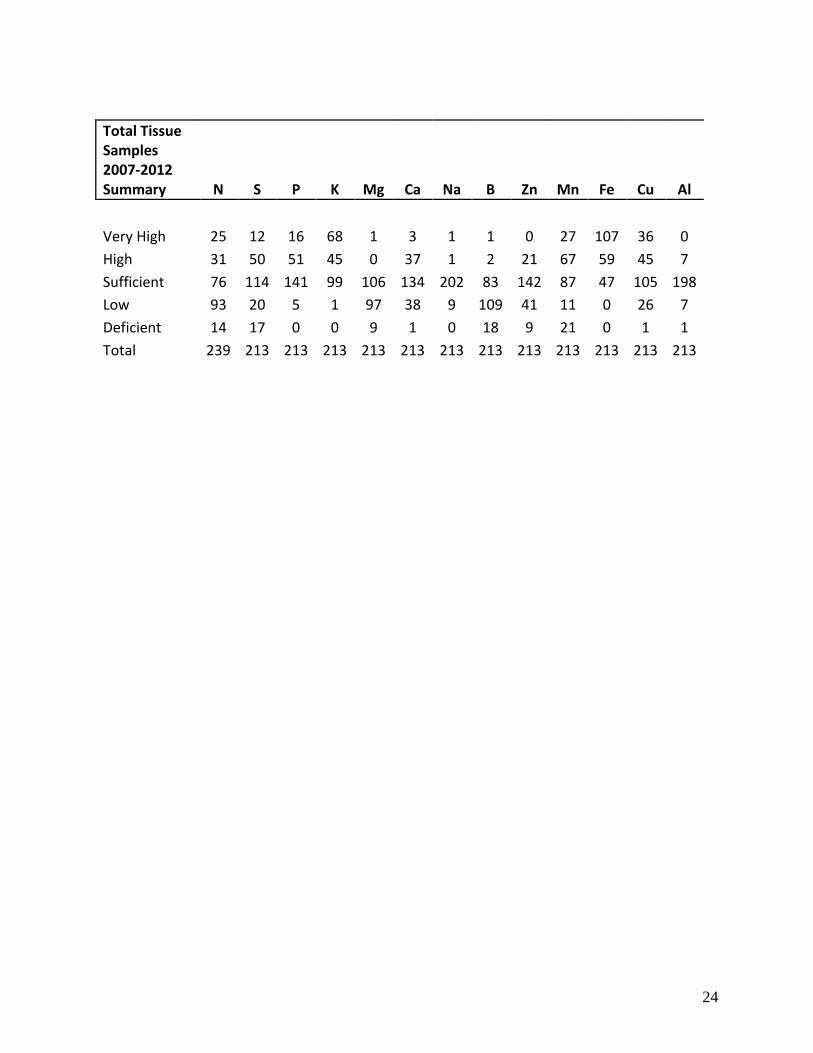
Total Tissue Samples 2007-2012 Summary N S P K Mg Ca Na B Zn Mn Fe Cu Al
Very High 25 12 16 68 1 3 1 1 0 27 107 36 0
High 31 50 51 45 0 37 1 2 21 67 59 45 7
Sufficient 76 114 141 99 106 134 202 83 142 87 47 105 198
Low 93 20 5 1 97 38 9 109 41 11 0 26 7
Deficient 14 17 0 0 9 1 0 18 9 21 0 1 1
Total 239 213 213 213 213 213 213 213 213 213 213 213 213


![Meteo [2] ANR](https://img.pdfslide.net/doc/110x75/55cf9729550346d0339005d6/meteo-2-anr.jpg)