Embed Size (px)
Citation preview

© Tolvik Consulting Ltd, 2015
2015 Briefing Report:
RDF Exports: Here for Good?
A report into the Combustible Waste Market in Europe
February 2015

RDF Exports: Here for Good?
Licenced to:
© Tolvik Consulting Ltd, 2015
Issue Number Release 1
Date 20.02.15
Author IEH/APJ
CONTENTS
EXECUTIVE SUMMARY ........................................................................................................................ 3
1. INTRODUCTION .......................................................................................................................... 4
2. BACKGROUND, BASELINE AND METHODOLOGY .................................................................. 7
3. CORE COUNTRIES ................................................................................................................... 11
4. UNITED KINGDOM .................................................................................................................... 16
5. INNER CIRCLE .......................................................................................................................... 20
6. OUTER CIRCLE ......................................................................................................................... 25
7. ADDITIONAL SCENARIOS ....................................................................................................... 27
8. GATE FEE ECONOMICS .......................................................................................................... 32
APPENDIX 1 – MODELLING ASSUMPTIONS AND DATA SOURCES .............................................. 37
APPENDIX 2 – 2013 EUROPEAN IMPORTS AND EXPORTS ........................................................... 38
APPENDIX 3 – SUPPLY/CAPACITY BALANCE – INNER CIRCLE .................................................... 38
APPENDIX 4 – GLOSSARY ................................................................................................................. 39
APPENDIX 5 – REFERENCES ............................................................................................................ 40
This report has been prepared by Tolvik Consulting Ltd on an independent basis using our knowledge of the current UK waste market and with reference inter alia to various published reports and studies and to our own in-house analysis. This knowledge has been built up over time and in the context of our prior work in the waste industry.
This report has been prepared by Tolvik Consulting Ltd with all reasonable skill, care and diligence as applicable. We do not warrant the accuracy of information provided. Whilst we have taken reasonable precautions to check the accuracy of information contained herein, the advice contained within the report is generic and we would strongly recommend that any assumptions be verified on a project specific basis. Tolvik Consulting Ltd shall not be responsible for the consequences (whether direct or indirect) of any such decisions.
Copyright in this document is reserved to ourselves. The report is personal to the Licensee and may not be reproduced by a Licensee without prior authority by ourselves and due acknowledgement of source.

RDF Exports: Here for Good?
Licenced to:
© Tolvik Consulting Ltd, 2015 3
EXECUTIVE SUMMARY
This report considers the future of the Combustible Waste market in Europe through to 2025, with a particular emphasis on its impact on RDF export markets, both from the perspective of exporters and importers. The report focusses on the “Core” markets of Germany, Netherlands, Sweden and the UK, together with an assessment of neighbouring countries (“Inner Circle”).
It has been assumed that future EU policy and targets will be in line with the Circular Economy proposals withdrawn in late 2014. Using 2012 as a baseline, two supply side scenarios have been considered – Incremental Improvement (ongoing steady progress towards targets) and Policy (achievement of targets). The analysis assumes that future incineration capacity is based on current capacity together with facilities already in construction – i.e. no net decommissioning.
For the Core markets, it is projected that the 2012 overcapacity of 4.8 Million tonnes (Mt) will increase to between 6.6Mt and 9.3Mt in 2020 and 7.7Mt and 11.5Mt by 2025. In 2012 (and 2013) the overcapacity in these countries was largely addressed through RDF imports.
As more capacity comes online In the UK it will become increasingly difficult to secure finance for new incinerators. As a result no more than around 5.0Mt of additional capacity is projected to be constructed, which would mean that in 2020 in the Incremental Improvement scenario at least 8.1Mt of Combustible Waste in the UK will continue to either be landfilled or exported as RDF.
Consequently it is expected that the UK will continue to remain a very important market for RDF exports. However it is difficult on a sustained basis to see RDF exports rising to much above the current 2.5Mt per annum and in time tonnages could well fall.
Of the Inner Circle, five countries (Austria, Belgium, Denmark, Finland and Switzerland) are also projected, without net decommissioning, to see a national overcapacity by 2020.
Of the remainder, France is not expected to actively participate in the European trade in RDF whilst Ireland and Norway are projected to move into balance once incinerator capacity in construction becomes operational. Italy has the potential to be a major RDF exporter, but it only exported 0.4Mt in 2013 and RDF exports are unlikely to exceed 1.0Mt.
Many of the newer EU member states continue to struggle to meet targets, but due to their relatively small scale and national policies RDF exports from these countries are unlikely to have a material impact on the European RDF market.
Tolvik's analysis for the "6 energy countries" identified in a 2011 market analysis by Afval Sverige1 (Core plus Belgium, Denmark and Norway) projects an overcapacity in 2020 of 7.4Mt (Incremental Improvement) and 10.4Mt (Policy). This compares with the 2011 report’s estimate of 7.2Mt.
The single most significant factor impacting on the Combustible Waste market may well prove to be the rate at which existing Incineration capacity is decommissioned. Using the first operational date as the basis for analysis, it is estimated that if by 2020 all incinerators over 48 years (Incremental Improvement scenario) and 44 years (Policy scenario) were decommissioned, the projected incineration overcapacity would disappear. Using alternative data based on the date of the latest upgrade, these figures reduce to 38 and 36 years respectively. Given a typical design life for an incinerator is 40 years further research would significantly help market understanding.
Increased use of alternative fuels means that across Europe there is the potential by 2020 for an additional 4.5-5.0Mt of Combustible Waste to be treated in co-incineration facilities.
The economic picture is mixed. On the one hand across the Core countries gate fees for MSW at contract renewal are now being benchmarked against (often significantly lower) C&I Waste gate fees. On the other C&I Waste gate fees have seen small improvements of late.

RDF Exports: Here for Good?
Licenced to:
© Tolvik Consulting Ltd, 2015 4
It is estimated on average that the energy efficiency of Swedish incinerators means that they have a €30/t gate fee advantage over Netherlands and Germany. With the break-even floor gate fee for a generic incinerator in Sweden calculated to be around €25/t, the equivalent in Netherlands and Germany is therefore €55/t.
Notwithstanding typically lower transport costs from the UK to Netherlands and Germany than Sweden, incinerators in these countries have been offering lower gate fees than this to compete for RDF. This has been possible thanks in part to the ‘subsidy effect’ from historically higher MSW gate fees.
Lower MSW gate fees and the recent decline in energy prices reduce the potential ‘subsidy effect’ for such incinerators when pricing for RDF imports and so, in time, could also lead to some incinerators being decommissioned sooner than planned (i.e. on economic grounds).
For a generic facility, consistent with recent data, €80/t (£65/t) is projected to be the lowest cost “ex works” RDF export price from the UK to Sweden with the range rising to €105/t (£84/t) for export to parts of Germany.
It is important to note however that as there could still be as much as 8Mt of ‘available’ Combustible Waste in the UK in 2020, it will not be just the competitiveness of export prices which determine the actual level of RDF exports from the UK.

RDF Exports: Here for Good?
Licenced to:
© Tolvik Consulting Ltd, 2015 5
1. INTRODUCTION
1.1. Background
In the summer of 2011, Tolvik produced a Briefing Report which considered the potential for the expansion of Refuse Derived Fuel (RDF) exports from the UK to Europe. It reached several key conclusions including analysis that “with modest investment there is the potential for the production of between 2.3Mt and 4.8Mt of RDF” in the UK.
The 2011 Briefing Report then went on to identify four potential scenarios. With total RDF exports from the UK in 2014 having exceeded 2.4Mt, it is now clear that the “Export Solution” has prevailed. This scenario identified a market in which incineration overcapacity in Northern Europe would remain at least at 2011 levels and that there would be downward pressure on UK gate fees. It also projected that the capacity of waste infrastructure developed in the UK would be lower than that needed to deliver UK ‘self-sufficiency’.
Three and half year on it is time to once again to consider the future of the RDF export market – not just from the perspective of those exporting from the UK, but also from the perspective of European incinerator operators looking to the UK (and other countries still dependent on landfill) for the feedstock they require to operate their facilities efficiently.
In a market that has rapidly become internationally competitive, the key questions this report looks to address are:
What are the future supply/capacity balances for Combustible Waste in the “Core” importing countries of Germany, the Netherlands and Sweden?
How reliable is the UK as a long-term source of RDF?
What is the potential impact on the RDF market of other countries, particularly those most geographically proximate to the Core (“Inner Circle”)?
What other factors may influence the development of the market?
What are the implications for future economics in the sector?
This report summarises our research and considers the main themes. In assessing a market of this scale in a report such as this, particularly outside the Core countries, it is acknowledged that a number of relatively general assumptions have had to be made. As a result it is not appropriate to use this report for the purpose of an in-depth analysis of the market in a single country.
1.2. Key Definitions
Despite the widespread use of European Waste Catalogue (EWC) codes, waste descriptions vary from country to country.
Figure 1: Defining Combustible Waste

RDF Exports: Here for Good?
Licenced to:
© Tolvik Consulting Ltd, 2015 6
The most common term used in this report is Combustible Waste. This is used to define solid, combustible, non-hazardous post recycling Household Waste, and waste from commercial and industrial sources (C&I Waste) capable of being thermally treated in the same facility. The definition is deliberately broader than that for post recycling Municipal Solid Waste (MSW).
The definition of Combustible Waste specifically includes mixed MSW (EWC 20 03 01) and RDF which is permitted to be exported under the Waste Shipment Regulations and which in this report includes EWC codes 19 12 10 and 19 12 12. Solid Recovered Fuel (SRF) is the phrase used in the report to refer to the subset of RDF suitable for treatment in co-incineration facilities (see Section 7.3.1).
For the avoidance of doubt the definition of Combustible Waste excludes segregated waste wood but includes sewage sludge in those countries where it is commonly thermally treated alongside MSW.
The use of the term ‘incinerator’ in this report is the generic term used for WID compliant treatment facilities used to thermally process Combustible Waste with the recovery of power and/or heat.
1.3. The Markets
The market definitions used in this report as shown in Figure 2 are:
Core Markets - Germany, the Netherlands, Sweden and the UK who, based on official statistics either imported and/or exported more than 750kt of RDF in 2012;
Inner Circle – countries which share a border with the four Core markets (plus Italy due to the potential extent of its impact on the RDF market);
Outer Circle – other proximate countries which may have the potential to influence the market.
Core Markets
Germany, Netherlands, Sweden, UK
Inner Circle
France, Italy, Poland, Switzerland, Belgium, Austria,
Denmark, Czech Republic, Finland, Ireland, Norway,
Luxembourg
Outer Circle
Spain, Portugal, Hungary, Slovakia, Croatia, Lithuania,
Slovenia, Latvia, Estonia
Figure 2: The Markets
1.4. About Tolvik Consulting
Tolvik Consulting is a specialist provider of independent, market analysis and commercial advisory services across the waste sector. Our clients include the UK’s leading waste companies, project finance lenders, independent developers and equity finance providers. Further details can be found at www.tolvik.com.
We would very much welcome any feedback on this report and any suggestions as to other topics to be covered by subsequent Briefing Reports.

RDF Exports: Here for Good?
Licenced to:
© Tolvik Consulting Ltd, 2015 7
2. BACKGROUND, BASELINE AND METHODOLOGY
2.1. European Waste Policy
In December 2014 the European Commission withdrew its proposed Circular Economy package in order to release a “more ambitious proposal” later in 2015 which would cover “a strategy on waste that takes better into account the variety of situations across member states and focuses on achievable objectives and their effective implementation on the ground.”2 However, for the purposes of this report, it has been assumed that the amended package will be broadly similar to that presented in 2014.
There are three objectives in the proposal with the potential to affect the availability of Combustible Waste in Europe:
Waste generation should decline and be decoupled from GDP – with national waste prevention programmes being revaluated every 6 years;
Reuse and recycling to be maximised – with a target of 70% recycling or reuse of MSW by 2030 (up from 50% of Household Waste in 2020);
Landfilling of recoverable waste should be phased out – such that by 2025 no more than 25% of MSW is to be sent to landfill.
2.1.1. Waste Generation
Figure 3: MSW Arisings per Capita in 2012 Source: Eurostat
Whilst a number of member states have suggested that they have succeeded in decoupling waste generation from GDP growth, it appears that this is likely to be only partially true and much of the recent decline in waste arisings has been as much a function of the 2008-2012 economic downturn as any other factor.
2.1.2. Recycling and Landfilling
Most north European countries are on target to meet the 50% household waste recycling target for 2020, although a number of countries have seen only modest improvements in recycling rates in recent years. There is, however, the expectation that the collection requirements in the revised Waste Framework Directive, which took effect at the beginning of 2015, will act as a ‘kick start’ for the further development of recycling markets. This optimism is tempered by the depressed commodity markets which support recycling economics. Not surprisingly it is the so called A8 EU (new member states) which have the furthest to go to meet the targets.
Many EU member states have reduced their dependence on landfilling of Combustible Waste to below 5% - including the Core countries of Germany, Netherlands, and Sweden. According to the other EU, countries making good progress include the UK (which is almost certain to reach its 2020 Landfill

RDF Exports: Here for Good?
Licenced to:
© Tolvik Consulting Ltd, 2015 8
Directive target3), France, Ireland and Finland. On the other hand, it is understood that Italy, for example, was unable to meet its 2010 target.
Figure 4: MSW Treatment in 2012 Source: Eurostat
However, to put the market into context, in 2012 it is calculated using Eurostat data that across the Core and Inner Circle 45Mt of MSW was landfilled and 59Mt was incinerated.
2.2. National Waste Policies
In general it has been assumed that member states will follow EU policy. However, in a number of member states, national waste policies and targets differ from those outlined in Section 2.1. Where such policies have the potential to materially impact the wider European RDF market they have been used in the analysis.
2.3. Movement of RDF - EU Waste Shipment Regulations
The principal EU legislation impacting on the movement of RDF between member states is the Waste Shipment Regulations (WSR). Under the terms of the WSR the export (and import) of wastes within the EU falls into one of three categories:
Green List – for wastes considered low risk (largely recyclables), with no requirement for prior approval or notification by the relevant authorities;
Recovery – for other forms of waste (i.e. not on the Green List) which are to be ‘recovered’, there is a requirement for prior notification to the relevant authorities supported by documentation to validate the recovery route;
Disposal – export is generally not permitted other than in specific, exceptional circumstances in accordance with the relevant Waste Management Plan for each member state.
The export of RDF is therefore only possible if it is ‘recovered’ – it is to be processed at an identified incinerator which meets minimum energy efficiency standards and so is classified “R1 - Use principally as a fuel or other means to generate energy”. It should also be noted that under the WSR mixed MSW (EWC Code 20 03 01) is generally subject to the same provisions as shipments of waste destined for disposal – i.e. in most member states (unless the Waste Management Plan states otherwise) the export of mixed MSW will not generally be permitted.
RDF Exports: Here for Good?
Licenced to:
© Tolvik Consulting Ltd, 2015 9
In order to seek to clarify the difference between RDF and mixed MSW, the revised Waste Framework Directive makes it clear that mixed MSW needs to have been treated in such a way that it has “substantially altered its properties” before it can be regarded as RDF.
2.4. EU Energy Policy
Despite the fact that around 50% of the energy produced by incinerators is “renewable”, policy links between energy and waste at an EU level are perhaps not as strong as one might expect. It is interesting to note that whilst on the one hand this was acknowledged at the 2014 launch of the EU’s previous proposals for a circular economy, whilst elsewhere the policy documentation was keen to point to the risks to recycling of too much incineration.
Two areas of particular relevance to Combustible Waste incineration are energy security and the provision of local heat.
In terms of energy security, according to CEWEP4 in 2012 the energy content of the Combustible Waste treated in Incinerators in the EU was the equivalent of 19% of Russian gas imports and by 2020 it has the potential to reach 33% of Russian gas imports.
They also note that incinerators are often suitably sized to efficiently support local district heating projects in an energy ‘closed loop’ – and in some cities incinerators already meet more than 50% of the local heat demand. CEWEP estimate a potential, in theory, to quadruple heat offtake from incinerators by 2050.
As European energy markets become increasingly interconnected, it is likely that the recent trend of converging national wholesale power prices will continue. This, when combined with lower power prices, may in time impact on economics of those incineration facilities designed in the past to specifically reduce local power price risk - for example RDF facilities hosted by energy intensive users.
2.5. Setting 2012 Baseline
In order to undertake an analysis of the European market, it was first necessary to develop a 2012 data baseline for each country covering not just MSW but also C&I Waste. In order to maintain consistency throughout, the report uses 2012 data for the baseline even in those countries for which more recent data is available, save in such cases projections have been adjusted to reflect actual 2013 data.
The critical baseline data comprises an analysis of the national supply/capacity balance for Combustible Waste for each of the Core and Inner Circle countries identified in Figure 2. This has been established using country specific data, including consideration of waste arisings for household, MSW and/or C&I waste streams within each country and recycling rates for each identified stream in order to establish the baseline tonnage of Combustible Waste.
Following this, capacity and where available input volumes for the treatment of Combustible Waste within each country was assessed. This included, as relevant incinerators, co-incineration plants, landfills and Mechanical Biological Treatment (MBT) facilities. It also considered the volume of RDF imports and exports.
2.6. 2012 RDF Exports
For each country the net import/export of Combustible Waste was assessed using a range of national sources. Figure 5 is a schematic for movements in 2012. A similar, more up to date analysis for 2013 and can be found in Appendix 2.

RDF Exports: Here for Good?
Licenced to:
© Tolvik Consulting Ltd, 2015 10
Figure 5: Major European RDF Exports and Imports – 2012 Source: Various, Tolvik Analysis
*NB Import and Export total do not fully reconcile as smaller markets excluded
2.7. Assumptions used for Projections
In developing projections for Combustible Waste supply/capacity balance, two scenarios have been developed – “Incremental Improvement” in which member states continue on a steady trajectory towards the EU targets outlined in Section 2.1 and “Policy” in which it is assumed that all countries reach the EU targets – unless there are materially different national targets in which case these are assumed.
The projections presented in Sections 3 to 6 include additional new incineration capacity where is it already in construction or certain to start construction but exclude decommissioning of older facilities. The implication of this on the market is considered in Section 7.
Further details on assumptions used and data sources can be found in Appendix 1.

RDF Exports: Here for Good?
Licenced to:
© Tolvik Consulting Ltd, 2015 11
3. CORE COUNTRIES
3.1. Segregation of the German Market
As a result of the market dynamics, in this report the North and West regions of Germany (“NW Germany”) have been separated from the South, East and Southwest regions (“SES Germany”):
NW Germany: encompassing the states of Schleswig Holstein, Hamburg, Lower Saxony, Bremen and North Rhine Westphalia (NRW);
SES Germany: covering all other states within Germany.
NW Germany includes the ‘heartland’ of the German economy and has been more active in RDF markets. As a consequence NW Germany has been considered in more detail than the rest of Germany.
Figure 6: German Markets
3.2. Policy Context
There is an apparent political will within the Netherlands to move even further towards a circular economy and so ensure the Netherlands remains amongst the leading countries in waste management in Europe. Current Dutch waste policy is defined by LAP2 (2009-2015) which, inter alia, sought to limit waste arisings, set targets for Household Waste recycling (65%) and recovery. The overall performance against the LAP2 objectives have been mixed; recycling has remained stubbornly around 50% but the expansion in incinerator capacity in the Netherlands has meant that the recovery targets have been met.
Following extensive consultation LAP3 is expected later this year. The recycling performance over recent years has led to suggestions that, amongst a range of measures to promote a circular economy, LAP3 will introduce a recycling target of as high as 75% by 2025. The Dutch recognise that meeting waste recycling and arisings targets would have an adverse impact on the availability of Combustible Waste and as a result government policy pragmatically acknowledges the future role of waste imports.
In Germany the 2012 Kreislaufwirtschaftsgesetz (KrWG), amongst other measures, mandates the collection of municipal bio-waste from the beginning of 2015 and sets a recycling target of 65% for MSW by 2020. This is a relatively modest aspiration given that recycling rates have recently been reported as above 60%. The federal structure of Germany means that significant responsibility is devolved to individual states to develop and enforce their own Waste Management Plans.
In NW Germany the two largest states are NRW and Lower Saxony. A guiding principle within the NRW plan is for regional self-sufficiency and security through the enforcement of the proximity principle; as a result the sustainability of existing incineration capacity in the state is being actively considered. Lower Saxony’s now relatively dated plan is consistent with the federal position.
Sweden’s current Waste Plan is based on EU legislation but with a specific target to increase the capture of food waste from households, institutional kitchens, shops and restaurants to 50% by 2018 with at least 40% of the waste used to generate energy. The Swedish EPA has, however, begun work on updating the Municipal Waste Plan with a revision planned for the end of 2015/16.
Table 7 summarises the landfill bans and taxes applicable to the three Core countries. It is observed that whilst on the one hand the combination of landfill bans and landfill tax mean that now less than 2% of Combustible Waste is landfilled in each of the Core countries, on the other all three Core countries now have an incineration over capacity (see Section 3.5).

RDF Exports: Here for Good?
Licenced to:
© Tolvik Consulting Ltd, 2015 12
Country Waste banned from Landfill Date of
Landfill Ban Landfill Tax
Incineration Tax
Germany Untreated MSW 2005 None None
Netherlands Combustible Waste 1995 €13/t €13/t
Sweden Sorted Combustible and
Organic Waste 2002,2005 SEK500 (€54/t) None
Table 7: Landfill bans and taxes in Core countries Source: CEWEP, Various
In Sweden, the incineration tax was lifted in October 2010 in order to increase the international competitiveness of domestic incinerators.
In January 2015 the Netherlands introduced an incineration (and landfill) tax of €13/t as part of a series of measures to generate €100m of government income. It is also hoped that this will help ensure that, domestically at least, recycling is once again competitive with incineration. Imported waste is not subject to the tax but to prevent ‘leakage’ to other importing countries (especially Germany), from July 2015 RDF exported for incineration will also be subject to the tax.
3.3. Combustible Waste Supply
The two factors which, in Tolvik’s opinion, most significantly influence Combustible Waste arisings are population growth (for Household Waste/MSW) and GDP growth (for C&I Waste). Figure 8 shows third party cumulative growth predictions (Population – World Bank, GDP – OECD) for the Core countries for the period 2012-2025.
Figure 8: Growth Projections Source: World Data Bank, OECD
Whilst the population in Germany is predicted to decline the high current levels of recycling means that the Combustible Waste supply is projected to decline only modestly in the period through to 2025. In contrast, whilst a reasonably significant population increase is projected in Sweden, this is expected, subject to the economics of recycling, to be largely offset by improvements in recycling and in the Incremental Improvement scenario the supply of Combustible Waste remain largely unchanged through to 2025.
In the Netherlands, on the other hand, the combination of only modest population growth and potentially significant increases in the recycling rate, particularly in the Policy Scenario, means that through to 2025 a sharper decrease in Combustible Waste supply is projected.

RDF Exports: Here for Good?
Licenced to:
© Tolvik Consulting Ltd, 2015 13
(Mt)
Baseline Incremental Improvement Policy
2012 2020 2025 %
Change* 2020 2025 %
Change*
NW Germany 9.5 9.3 9.1 (4.5)% 9.1 8.8 (7.3)%
SES Germany 15.1 14.8 14.4 (4.5)% 14.5 14.0 (7.3)%
Germany 24.6 24.1 23.5 (4.5)% 23.6 22.8 (7.3)%
Netherlands 7.3 6.7 6.5 (10.9)% 5.2 4.1 (43.8)%
Sweden 4.6 4.8 4.5 (2.2)% 4.1 3.9 (15.2)%
Table 9: Combustible Waste Supply in the Core Countries Source: Tolvik Analysis *% change between 2012 and 2025
3.4. Capacity
Germany has the greatest incineration capacity in Europe, estimated to be 27.8Mt, being a mix of conventional municipal incinerators (“MVA”), RDF facilities typically connected to an industrial host (“EBS”) and a number of co-incineration facilities. Approximately half the total capacity is located in NW Germany.
Whilst current market conditions means there are few plans for new capacity, there has been only very limited decommissioning activity of late – in part due to the relatively high level of municipal ownership. Within NW Germany, the NRW Waste Management Plan makes it clear that there is a need to increase collaboration amongst incinerator owners so as to reduce the total capacity but there are currently no clear plans as to how this will be achieved.
The supply/capacity projections in this section of the report therefore assume no net change in capacity in Germany.
A moratorium was introduced in 2010 in the Netherlands on the construction of any new incinerators until 2020. However, this was withdrawn in October 2014 as it was deemed contrary to EU competition rules. This said, it would seem unlikely that any new capacity will be built – rather the focus in the Netherlands is upon improving the efficiency and competitiveness of existing facilities (and reliance on gate fee income) through refurbishment/installation of additional heat networks.
The demand for non-fossil fuel alternatives to power district heating is such that Sweden is still developing incineration capacity with an additional 0.3Mt due to come online by 2020 according to Tolvik’s Swedish partner Profu. Since 2012, 4 plants have completed construction (Helsingborg, Sigtuna (Brista), Landskrona and Vasteras) and 3 have expanded their capacity (Linkoping, Vastervik and Uddevalla) so that in 2015 the national capacity will be approximately 6.4Mt.
(Mt) Germany
Netherlands Sweden NW SES Total
Incineration Capacity 12.1 12.9 25.0 7.6 5.7
Co-Incineration Capacity 1.2 1.6 2.8 <0.1 <0.1
Total 13.3 14.5 27.8 7.6 5.7
% Utilisation 2012 90% 90% 90% 99% 91%
Table 10: Capacity in Core countries in 2012 Source: Various, Tolvik Analysis
3.5. Projected Supply/Capacity Balance
Table 11 provides estimates of the current and future supply/capacity balance for the Core countries assuming that the only change in incineration capacity comes from projects which are already in construction and that no net decommissioning occurs. Note that the Netherlands 2012 overcapacity of

RDF Exports: Here for Good?
Licenced to:
© Tolvik Consulting Ltd, 2015 14
0.3Mt appears to be low – because the analysis in Table 11 has been produced on the basis that there are no exports – and in 2012 Netherlands exported 0.6Mt to Germany.
(Mt) Baseline Incremental Improvement Policy
2012 2020 2025 2020 2025
NW Germany (3.7) (4.0) (4.2) (4.2) (4.5)
SES Germany 0.6 0.2 (0.1) (0.1) (0.6)
Germany (3.1) (3.8) (4.3) (4.3) (5.1)
Netherlands (0.3) (0.9) (1.2) (2.4) (3.5)
Sweden (1.0) (1.9) (2.2) (2.6) (2.9)
Total (4.4) (6.6) (7.7) (9.3) (11.5)
Table 11: Supply/Capacity Balance in Core countries Source: Tolvik Analysis
It is estimated that, assuming no net decommissioning of capacity, the overcapacity in the Core countries could increase from an estimated 4.4Mt in 2012 to between 6.6Mt (Incremental Improvement) and 9.3Mt (Policy) by 2020.
In recent years the effects of overcapacity in the Core countries has been largely mitigated by the importation of Combustible Waste in the form of RDF.
3.6. Imports/Exports
The Netherlands is at the forefront of the international trade in RDF. On the one hand, in 2013 the Netherlands exported 0.6Mt5 to NW Germany. On the other, its location means that its primary source of RDF imports (which totalled 1.4Mt in 2013) has been the UK with a smaller portion also coming from Ireland.
RDF import contracts are typically a mix of short and medium term, but with operators in the Netherlands nervous about the effects of the incineration tax and the potential for future recycling rises, as outlined in Table 9, they are increasingly keen to enter into longer term arrangements. The Dutch have also in the past targeted RDF imports from Italy, however this has been with mixed success.

RDF Exports: Here for Good?
Licenced to:
© Tolvik Consulting Ltd, 2015 15
Similarly, NW Germany is well placed to import RDF from the UK, amongst other countries, with the region estimated to have an 88% share of the total German RDF import market. It is reported that UK suppliers have entered into multi-year contracts with German incinerators and so it has been predicted in Germany that the import tonnage will remain stable for at least the next five years. Whether this is so remains to be seen.
Historically Sweden’s main source of RDF imports has been from Norway (63%) with the balancing tonnage from the UK, Ireland and Finland. With Norway building its own capacity (Section 5.2) alternative markets are being sought. Although much of the effort to date has been focussed on the UK, the Swedish EPA have been quoted as saying that in the future the Swedish market may need to look further afield to Italy, Romania, Bulgaria or the Baltic states for the RDF necessary to support their district heating networks. However the seasonality of demand remains one of the challenges for the Swedish import market as most exporters are keen to trade all year round.
Figure 12: Import Tonnages to Core countries Source: Various, Profu *Dashed lines represent estimates

RDF Exports: Here for Good?
Licenced to:
© Tolvik Consulting Ltd, 2015 16
4. UNITED KINGDOM
4.1. Policy Context
Waste policy is devolved to the UK regions whilst English policy is managed centrally. Regional policy targets include:
Scotland: 70% recycling and composting of all waste by 2025, with a maximum of 5% sent to landfill by 2025 and restrictions on incinerator inputs;
Wales: Reduce waste arisings by 1.5%pa and recycle at least 70% by 2025;
Northern Ireland: 60% recycling rate for council collected waste by 2020.
England on the other hand has very limited ambitions, with the (unstated) objective seemingly to meet but not necessarily exceed EU requirements. Over the last few years the average Household Waste recycling rate in the UK has stagnated at around 43% with any real increases in recycling rates only being seen in the devolved regions (which account for around 10% of Household Waste in the UK).
Following a number of years at which the rate of landfill tax for Combustible Waste in the UK rose annually by €10/t (£8/t), it is now €100/t (£80/t) and it is expected that in the future this rate will increase in line with inflation. Whilst the setting of landfill tax rates is being devolved (Scotland: 2015, Wales: 2018), the expectation is that material regional variations in tax are unlikely. There are currently no plans for an incineration tax.
It is also worth noting that whilst Scotland will see a ban on the landfilling of biodegradable MSW in 2021 and Wales is also proposing a ban on separately collected materials from landfill, overall landfill bans in the UK are currently regarded as unlikely.
4.2. Combustible Waste Supply
In July 2014 the UK Green Investment Bank published a report (“GIB Report”) on the UK market using data prepared by Tolvik6.
Rather than replicate the analysis, this report updates the GIB Report to reflect more recent data. The most notable development over the last 12 months is that, largely as a result of population growth, Household Waste arisings in the UK rose in 2013/14 for the first time in 6 years.
(Mt) Baseline Incremental Improvement Policy
2013 2020 2025 2020 2025
Local Authority Collected Waste 17.2 16.7 16.4 15.1 14.6
Other Combustible Waste 10.1 9.9 9.4 8.3 7.9
Total Combustible Waste 27.3 26.6 25.8 23.4 22.5
Table 13: Combustible Waste Supply – UK Source: Tolvik Analysis
4.3. Existing Capacity
The GIB Report identified, based on specific projects as at December 2013, 11.9Mt of incineration capacity in the UK, of this operational capacity was estimated to be 5.2Mt with the remaining 6.7Mt of capacity in construction or due to commence construction imminently – making it currently the largest market in Europe for incinerator construction.
The GIB Report identified that with MBT facilities expected to reduce volumes of input Combustible Waste by 0.7Mt and co-incineration capacity of 0.5Mt that total treatment capacity was 13.1Mt.

RDF Exports: Here for Good?
Licenced to:
© Tolvik Consulting Ltd, 2015 17
By way of reference, in 2013 19.0Mt of Combustible Waste was landfilled in the UK and 1.8Mt was exported as RDF to Europe.
Updating this analysis to December 2014, total capacity has increased marginally to 13.4Mt. No material further MBT capacity is planned in the UK and the scope for additional co-incineration of Combustible Waste is expected to be limited.
(Mt) Permitted Capacity
Assumed Availability
Projected Capacity
Operational 7.6 86% 6.5
In Construction 5.2 95% 4.9
Construction Imminent 0.8 95% 0.7
Total Incineration 13.6 12.1
Net impact of MBT Treatment 0.7
Co Incineration 0.6
Total 13.4
Table 14: Treatment Capacity – UK Source: Tolvik Analysis
4.4. Additional Capacity
In addition to the capacity in Table 14, Tolvik has identified a further 2.3Mt of incineration capacity which is currently in development and actively seeking external finance. This is a mix of several large conventional incinerators together with a number of smaller schemes proposing to use gasification/pyrolysis technologies – reflecting the subsidy support available to such projects. For the purposes of this report it has been assumed that 50% of this capacity will be constructed.
The extent to which UK incinerator capacity will continue to grow is a key question for importers looking to the UK as a source of Combustible Waste. Three factors here are of critical importance:
Unlike much of the rest of Europe, nearly all UK incinerators are privately rather than publicly financed. With only a very limited number of exceptions, incinerator operators in the UK do not have balance sheet capacity to fund new incinerators themselves and the market is therefore dependent on external finance;
Nearly all public authorities have now let long term waste management contracts (c.72% of MSW is under contracts which expire after 2020), and so most new projects are likely to be ‘merchant’ projects – backed by waste company commitments to supply feedstock. For investors these are regarded as higher risk projects;
Other than Scotland, the absence of any absolute ban on Combustible Waste to landfill. This removes a potential ‘cliff edge’ which could otherwise make an investment in new incineration capacity an absolute necessity.
The reliance of the construction market on external funders means that significant time and effort is spent in assessing the availability of Combustible Waste for new projects – with a requirement that local supply needs to be projected to significantly exceed that required to fill the incinerator. This means that as more capacity is developed in the UK, the more difficult it will be for external investors to satisfy themselves that the risks are acceptable for them to invest.
This is best demonstrated by means of a simplified example. Assume that total capacity is 14.5Mt (13.4Mt from Section 4.3 plus 50% x 2.3Mt in Section 4.4) and there are plans to develop a further four facilities with a total 1.0Mt of capacity. With a projected supply (Incremental Improvement scenario) of Combustible Waste in 2025 of 25.8Mt, this 1.0Mt represents 1.0/(25.8-14.5) = 9% of the market. Once

RDF Exports: Here for Good?
Licenced to:
© Tolvik Consulting Ltd, 2015 18
a commitment is made to develop the 1.0Mt of capacity, the market share of the next 1.0Mt is 1.0/(25.8-15.5) = 10% - i.e. it increases. As the blue line on Figure 15 shows, this increase is not linear.
External investors will generally want to consider the effect on Combustible Waste supply should policy prevail – as shown in green in Figure 15 - and here the market share rises much more rapidly with additional capacity.
In general, investors will become increasingly less comfortable as the market share rises and typically will set themselves a level of market share which reflects their appetite for risk. For illustration Figure 15 shows this set at a 25% market share. In this case, it would suggest that no more than 4.0Mt of additional incineration capacity (to 18.5Mt) is likely to be built in the UK.
Figure 15: Market Share for New Investment in the UK Source: Tolvik Analysis
In reality investors will undertake project-specific market analysis which will take into account local market conditions – both in terms of Combustible Waste supply, competition, geography (some parts of the UK are reasonably remote making transport costs an important factor) and the competitive threat posed by RDF exports.
4.5. Supply/Capacity Balance
(Mt) Baseline Incremental Improvement Policy
2013 2020 2025 2020 2025
Supply 27.3 26.6 25.8 23.4 22.5
Capacity - Low 6.5 14.5
Balance 20.8 12.1 11.3 8.9 8.0
Capacity - High 6.5 18.5
Balance 20.8 8.1 7.3 4.9 4.0
Table 16: Supply/Capacity Balance in the UK Source: Tolvik Analysis
Table 16 has been developed on the basis of a low capacity scenario (i.e that 50% of the 2.3Mt of capacity currently under development will be constructed) and on the basis that a further 4.0Mt will be developed – noting that all new capacity will be subject to the constraints outlined in Section 4.4.
As the analysis demonstrates, in Tolvik’s opinion, the risk profile of new incinerator projects means that it is very unlikely that there will be an overcapacity in the UK as a result of a ‘dash for capacity’ and, at the very least in the Incremental Improvement scenario, there will continue to be a potential role for RDF exports.
0%
10%
20%
30%
40%
50%
60%
70%
14.5 15.5 16.5 17.5 18.5 19.5 20.5 21.5 22.5 23.5 24.5
Total Capacity inc Co incineration + MBT (Mt)
Market Share for 1Mt of Additional Capacity
Bankable Market ShareProjected Waste Supply - Incremental ImprovementProjected Waste Supply - Policy

RDF Exports: Here for Good?
Licenced to:
© Tolvik Consulting Ltd, 2015 19
4.6. Imports/Exports
With just under 2.4Mt exported from England and Wales and an estimated 0.2 – 0.3Mt exported from Scotland and Northern Ireland, the UK is currently the largest exporter of RDF within the EU.
Figure 17: RDF Exports from England and Wales Source: EA
Figure 18: RDF Export vs Landfill Tax Apr-Mar Source: Tolvik analysis
Exports have risen steeply over the last few years – largely as a result of the landfill tax increase which, in the absence of incineration capacity in the UK, has made RDF export a progressively more economically attractive option. For some RDF exporters it is seen as an interim step as domestic incineration capacity is being developed, whilst for others it is a long term strategic choice – as evidenced by the investment announced in summer 2015 by SITA for a major export facility at Tilbury.
However, recent data suggest that the rate of RDF exports from the UK may be flat lining at around 200kt per month. There are a number of contributory reasons for this:
New operational incineration capacity – for some customers contracted to such facilities the export of Combustible Waste was an interim arrangement;
Lower than expected availability in Europe at key plants – e.g. the AEB fire;
Tightening of commercial terms – importers are reported as looking to enter longer term contracts where prices are understood to have risen a little in the Netherlands and Germany (see Section 8);
Uncertainty regarding future costs associated with RDF exports from the UK - In December 2014 the UK Government announced that it would develop an RDF definition, introduce standards for its treatment and would consider the case for financial guarantees or bonds for permitted RDF sites. Whilst generally welcomed by the industry, in the interim, they provide some market uncertainty.
It is becoming increasingly clear that a number of UK waste companies are developing ‘balanced’ treatment strategies using a mix of contract durations and outlets – i.e. RDF exports, UK incinerator capacity and, for peak volumes and/or in low waste density markets, landfill (to the extent it is still available). This approach provides flexibility and allows them to balance supply chain risk and costs.
For potential importers of RDF from the UK, whilst in Section 4.5 it was estimated in the Incremental Improvement scenario that there would be at least 8Mt of Combustible Waste landfilled in 2020, in practice only a portion of this will be available for export to Europe. As a result, in Tolvik’s opinion, it is difficult to see total UK RDF exports rising on a sustained basis to much above 2.5Mt, and on balance it is likely that export tonnages will fall in time as more UK incineration capacity becomes operational and importers need to source RDF from ever more remote locations and/or smaller waste operators.
0
50
100
150
200
250
kt
RDF Exports from England and Wales
Netherlands Germany Sweden Other
£56
£61
£66
£71
£76
£81
0.0
0.5
1.0
1.5
2.0
2.5
2010 2012 2013 2014 2015
Land
fill T
ax /t
RD
F E
xpor
t M
t
RDF Export vs Landfill Tax
RDF Export Landfill Tax - Year End

RDF Exports: Here for Good?
Licenced to:
© Tolvik Consulting Ltd, 2015 20
5. INNER CIRCLE
As set out below, the countries identified within the “Inner Circle” have been divided into three groups based, assuming no net decommissioning of incinerator capacity, on the projected Combustible Waste supply/demand balance in 2020:
Projected Overcapacity – Austria, Belgium, Denmark, Finland and Switzerland;
“Neutral” Markets – France, Ireland and Norway;
Projected Undercapacity – Czech Republic, Italy and Poland.
Figures 19, 21 and 22 highlight the population and GDP growth projections used to project the supply/capacity balance within each country.
5.1. Projected Overcapacity
Figure 19: Population and GDP growth by 2025 in Overcapacity Markets Source: World Data Bank, OECD
Unlike many other markets, Austria saw an increase in MSW arisings of 5.8% between 2010 and 2012 - in line with the 5.9% GDP growth seen over the same period. Whilst recycling rates, at around 60%, are amongst the highest in Europe, they have at best levelled off over recent years with limited drivers, at least in the medium term, for further increases. Austria has 2.5Mt of incinerator capacity7 and, supported by Austria’s development of End of Waste Criteria for SRF, co-incineration facilities accept an estimated 0.2Mt of Combustible Waste. The Austrian incineration market is relatively self-contained, with only limited imports (mainly from Italy) and negligible tonnages sent to landfill or exported. Without net decommissioning the overcapacity is projected to increase from around 0.2Mt to 0.5Mt in 2020.
Similarly, Belgium is also one of Europe’s leaders in terms of recycling and recovery with a Household Waste recycling rate of 57% as well as the almost complete diversion of Combustible Waste from landfill. In 2012 it is estimated that there was a modest overcapacity in the 3.4Mt of incineration capacity. This is projected, without net decommissioning, to increase by 2020 to 0.4Mt. Notwithstanding incineration taxes there is seemingly a greater reluctance in Belgium to accept waste imports than other countries with an overcapacity.
Historically, Denmark has had a high dependence on incineration. This led to them being the first in Europe to implement a ban on Combustible Waste to landfill and having the oldest average incinerator age in Europe of around 30 years. On the other hand, it has also meant that there continues to be arguments as to the extent to which the recycling rate in Denmark(reported by Eurostat as 43% for Household Waste but lower elsewhere8) has been held back by the availability of incineration capacity. The Danish government have set various targets to improve recycling rates including 50% Household Waste recycling by 20228.

RDF Exports: Here for Good?
Licenced to:
© Tolvik Consulting Ltd, 2015 21
As of 2012, Danish company “Ea Energianalyse” estimated Danish overcapacity to be as much as 0.6Mt9. If recycling targets are met, and there is no net decommissioning (new capacity has recently been developed to replace existing lines) then overcapacity could increase to over 1.0Mt by 2020. As a result, Denmark has begun to look to fill its spare capacity, with RDF imports approximately doubling between 2012 and 2013, although still relatively low. In the longer term Denmark has a target to become a carbon neutral country by 2050 – which, it has been reported, would result in the closure of all power plants, including incinerators.
In Finland the Household Waste recycling rate in 2012 was relatively low at around 33%. However, driven by increased landfill tax and the introduction of a landfill ban on organic waste to take effect in 2016, incineration capacity has almost tripled to 1.5Mt in recent years. It is expected that incineration capacity will continue to increase to at least 2.0Mt by 2020 in order to ensure full diversion from landfill and, when combined with the potential for further improvements in recycling, could result in a very modest overcapacity.
Similar to Austria, Switzerland has recently seen waste growth, of 4.5% between 2011 and 2012, driven as much by significant population increases as by GDP growth together with a flat recycling rate of 50%. In 2012 the 3.8Mt of waste processed at Swiss incinerators included 0.2Mt of RDF imports10. Recent legislation aims to impose an energy efficiency standard for incinerators of at least 55% but the expectation is that instead of this leading to decommissioning of inefficient facilities “considerable investment” will be made to existing incinerators. Notwithstanding projections for increased waste arisings, the lifting of some restrictions on co-incineration and modest incineration capacity due to come online in 2015 is likely to result in a clear overcapacity in Switzerland.
Table 20 summarises the supply/capacity balance in the five countries with a projected overcapacity of 2.5Mt-3.0Mt in 2020. Further detail can be found in Appendix 3.
(Mt) Baseline Incremental Improvement Policy
2012 2020 2025 2020 2025
Austria (0.2) (0.5) (0.6) (0.5) (0.6)
Belgium (0.2) (0.4) (0.5) (0.5) (0.7)
Denmark (0.5) (0.8) (1.1) (0.9) (1.3)
Finland 1.2 0.1 (0.2) (0.1) (0.4)
Switzerland (0.3) (0.9) (1.2) (1.0) (1.3)
Total 0.0 (2.5) (3.6) (3.0) (4.3)
Table 20: Forecast Supply/Capacity Balance Source: Tolvik Analysis
5.2. Neutral Markets
For differing reasons, France, Ireland and Norway have been defined as ‘neutral’ markets – i.e. which are projected as being unlikely to have a significant role in the international trade of RDF by 2020.
On the one hand is France. France is one of the largest waste markets in Europe and has the largest number of incinerators (127) of any country in Europe. Despite this, as many are relatively small, a significant proportion of Combustible Waste continues to be landfilled. With a landfill and incineration tax and a negative public perception of incineration (even the Minister for the Environment has stated in an interview on the radio station France Inter that “incinerators are outdated technology”11), the future for waste treatment appears to be towards the increased development of MBT plants based on anaerobic digestion technology. Furthermore, there appears to be a greater willingness to apply the organic rich, mixed waste derived output from MBT plants to land than in other parts of northern Europe.

RDF Exports: Here for Good?
Licenced to:
© Tolvik Consulting Ltd, 2015 22
France is known to be a relatively closed market with only modest imports of RDF and exports of SRF. With the proximity principle central to their Energy Transition Law (with the intention of maintaining/achieving national self-sustainability) it is therefore unlikely that, irrespective of the national supply/capacity balance for Combustible Waste, France will actively participate in the RDF import/export market.
Figure 21: % Population and GDP Growth in Neutral Markets Source: World Data Bank, OECD
Ireland has historically been reliant on landfill, but the recent increase in landfill tax has proved a driver for the export of Combustible Waste (both as RDF and MSW) with volumes increasing from 0.1Mt in 2012 to 0.3Mt in 2013. However, with the development of a single new incinerator (0.6Mt capacity) due to complete construction in 2017, and recent increases in co-incineration capacity at cement kilns, it is expected that Ireland will become a self-reliant, broadly balanced market.
The development of the Combustible Waste market in Norway has historically closely followed the market in Sweden due to the competition between the two for Norwegian Combustible Waste – as demonstrated by Norway removing its incineration tax in 2010 within a month of Sweden. In 2012 favourable economics meant that 0.6Mt of RDF was exported to Sweden. This reportedly led to a Norwegian incinerator operator becoming bankrupt and forced Norway to look to imports including from the UK (which rose to 0.1Mt in 2013).
As of 2012, there were at least 6 additional incinerators in planning in Norway with the potential to increase incineration capacity by approximately 0.3Mt by 2020 compared to 201212. As a result, when combined with increased recycling, exports to Sweden are expected to continue to decline. In the Incremental Improvement scenario by 2025 it is projected that there will be a slight undercapacity in Norway and in the Policy scenario a modest overcapacity. As a result overall Norway has been characterised as ‘neutral’.
5.3. Forecast Undercapacity
The Czech Republic still has a heavy reliance on landfill, however this is set to change. The recently approved 2015-2024 Waste Act points to a landfill ban in 2024; whilst in the interim the landfill tax, currently at €18/t, is expected to double by 2020. Latest government figures estimate that incineration capacity will need to increase by around 1.5Mt if the landfill ban is to be met without the need for RDF exports.
Over the last decade or so there have been a number of proposals for new incinerators. However, policy uncertainty, marginal economics and delays in accepting EU directives into Czech legislation have proved a barrier to necessary finance. It is currently too early to assess whether recent legislation will sufficiently address these issues for Czech incineration capacity to expand as required – noting that government have stated that they do not intend to supply subsidy support to incineration. The alternative

RDF Exports: Here for Good?
Licenced to:
© Tolvik Consulting Ltd, 2015 23
is export of RDF (probably to Austria or Germany) – which thus far have been uncompetitive with domestic landfill. However the Waste Act states that cross border RDF movement will only be permitted when there is insufficient capacity to treat the waste within the Czech Republic.
Figure 22: % Population and GDP Growth by 2025 in Undercapacity Markets Source: World Data Bank, OECD
The Italian waste market is dynamic, complex and fragmented. The majority of the 45 incinerators (total capacity of 7.5Mt) are in the north of the country. About half are small (below 100ktpa) and a number struggle to source sufficient Combustible Waste to operate efficiently. Meanwhile the central and southern regions are reliant on an ever decreasing and often poorly managed landfill capacity – where it is estimated that there is around two years of capacity remaining13. At various points over the last few years, particularly in Naples, waste management issues have become a national crisis as a number of plans to develop additional incineration infrastructure failed.
Across the whole of Italy, in total 10Mt of MSW is landfilled together with an estimated 11Mt of C&I Waste.
To help the Italian economy back to growth, a new law known as “Unblock Italy” was passed in November 2014. As part of this wide ranging legislation in part to remove ‘red tape’, large incinerators were identified as being a “strategic infrastructure of national importance” – both to manage waste and to help contribute to energy self-sufficiency. Plans were announced for an increase in incineration capacity of 20-30%, as well as measures to free the movement of MSW within Italy – particularly from the south to the north. The new law has had a mixed reception – with claims that it is in breach of various EU rules – and a number of local authorities are challenging it in the courts.
Meanwhile, for a number of local authorities (particularly in Sicily, Lazio and Campania) the options are limited and so they are increasingly looking to (more costly) export markets where prices are, including shipping, reportedly €110/t. To date, whilst highly publicised, at around 0.4Mtpa the tonnages have been relatively small. Whilst there is clear scope for increased tonnages of RDF export, given the length of the supply chain (particularly to Scandinavia) and the state of the Italian economy, it is difficult to see annual RDF exports from Italy reaching 1.0Mt.
Poland has been historically reliant on landfill, but changes are underway following an overhaul of responsibility for MSW in 2013. Six new incinerators (total capacity of almost 1.0Mt) are currently under construction whilst SRF demand from the domestic cement industry (currently around 1.0Mt, including limited imports) is projected to increase to 1.5Mt with some additional MBT capacity being developed to produce the fuel.
However, MSW systems are not yet fully formed and whilst EU funds were used to support the construction of the initial round of incinerator capacity, securing finance for further incinerators is expected to be more challenging.

RDF Exports: Here for Good?
Licenced to:
© Tolvik Consulting Ltd, 2015 24
Whilst a landfill ban on Combustible Waste is due in 2016 it is likely that this will be pushed back, as with around 10Mt of Combustible Waste Poland will not have the necessary infrastructure in place to treat such volumes domestically. In theory this could act as a trigger for a rush of RDF exports, but in Tolvik’s opinion it is unlikely that this would be a practical or affordable option. However, for a country the size of Poland were there to be a sudden rush of RDF exports then it could have a material impact on the market as a whole.

RDF Exports: Here for Good?
Licenced to:
© Tolvik Consulting Ltd, 2015 25
6. OUTER CIRCLE
The outer circle has been divided into two groups, as outlined below, due to the differences between the markets:
Members of the EU15 - Portugal, Spain;
A8 States (& Croatia) - Croatia, Estonia, Hungary, Latvia, Lithuania, Slovakia, Slovenia.
6.1. Members of the EU15
(Mt) Generated Recycled Incinerated Landfilled
Portugal 4.8 26% 20% 54%
Spain 21.7 27% 10% 63%
Table 23: MSW Treatment for the Outer Circle Members of the EU15 in 2012 Source: Eurostat
More than half of Combustible Waste in Portugal and Spain is currently landfilled and both have relatively low MSW recycling rates. In 2011 the European Environment Agency reported14 that “an extraordinary effort” (Spain) and “an exceptional effort” (Portugal) and will be required if they are to meet the 2020 recycling target.
In Portugal, a landfill tax was introduced in order to divert waste from landfill; however currently at €5/t and with no landfill bans, to date it has had little impact on the Combustible Waste market. Although there is no national landfill tax in Spain as a whole, Catalonia imposes a landfill tax of €12-€21/t depending on whether there is a separate collection system and an incineration tax of €5.70-€16.50/t. Both the National Waste Plans of Spain and Portugal feature objectives to reduce the amount of Combustible Waste going to landfill and meeting the latest EU Landfill Directive targets is proving challenging.
MBT has an active role to play in waste management in both countries with the outputs either used to support co-incineration (Spain in particular has historically had a relatively large cement industry) or applied to land where it is generally categorised, at a national level, as recycling. This helps reduce pressure on landfill and as a result there is only limited incineration capacity in the two countries - 1.1Mt of incineration capacity in Portugal and 2.7Mt in Spain. Securing agreements to develop additional incineration capacity in both countries is proving very difficult.
Recent reports of imports into Spain and Portugal appear to be very specific opportunities rather than part of a general trend – the exports of RDF from the UK and Italy relate to the incinerator in Mallorca which, since the recession, is now over-sized whilst the 0.1Mtpa of SRF to be imported over the next 5 years from the UK is to support co-incineration in Portugal.
It seems unlikely, therefore, that either Spain or Portugal will have a material role in the European RDF market.
6.2. A8 + Croatia
The A8 states in general have relatively immature waste management infrastructure with an average MSW recycling rate of just 22% and a landfill rate of 70%. Excluding Hungary, the total MSW arisings across the 6 states is just 7 Mt - by way of comparison only a little greater than Switzerland. As a result, individually, it is not expected that they will have a material impact on the wider European market.
As Figure 24 shows, Hungary is by far the largest market within the Outer Circle with around 4.0Mt of MSW generated annually. Over the last few years there have been significant developments in their waste management with large increases in recycling and the apparent decoupling of waste generation from economic growth.

RDF Exports: Here for Good?
Licenced to:
© Tolvik Consulting Ltd, 2015 26
Figure 24: Treatment of MSW in the Outer Circle in 2012 Source: Eurostat
As well as a landfill tax and 2015 landfill ban on untreated waste, the latest Hungarian Waste Act, required that the State take a majority shareholding of previously privately owned waste management companies eliminating competition amongst waste companies and forcing private companies to either sell the majority of their shares or shut down. This is claimed by FEAD (European waste operators’ trade body) to infringe upon the European freedom of goods, the right of establishment and European competition legislation15. In addition, the act stipulated that companies should obtain non-profit status by 201416. The EU have commenced a critical assessment of the Hungarian Waste Act however it appears that no infringement procedures have yet been enacted and that the Act is currently in force in Hungary.
Consequently, the continuing uncertainty of the effects of the Waste Act within Hungary would make it seem unlikely that they will have any material impact on the European RDF export market in the near future.

RDF Exports: Here for Good?
Licenced to:
© Tolvik Consulting Ltd, 2015 27
7. ADDITIONAL SCENARIOS
In addition to the Incremental Improvement and Policy scenarios relating to the supply of Combustible Waste developed in Sections 3-6, there are a number of other factors which may influence the future of the Combustible Waste market in Europe.
7.1. Other Potential Supply Factors
The Incremental Improvement and Policy scenarios are progressions of “business as usual”. Two potential scenarios have been identified which could materially impact on the supply of Combustible Waste in Europe:
New restrictions on RDF movements – if competent authorities (generally national EPAs) were to become increasingly reluctant to consent movements of RDF under the WSR – be it on political (e.g. national policy of self-sufficiency), environmental or economic grounds – although to date there has been little evidence of this;
Major economic turmoil in Europe – providing a ‘shock’ to the market at least as great as that seen in 2008.
In Tolvik’s opinion neither of these scenarios merit further analysis in this report.
7.2. Incinerator Decommissioning
Over the last 5 years or so there has been a relatively low level of incinerator decommissioning (particularly of larger >200ktpa facilities) across Europe. Given the challenging market conditions this is perhaps a little surprising, and those that have shut have been on the basis of persistent emissions breaches (eg the Pietrasanta incinerator in Lucca, Italy) as much as on economic grounds (eg AVR Rotterdam).
In Sections 3-6, it has been assumed that there will be no decommissioning of existing incineration capacity (or more correctly no ‘net’ decommissioning of capacity). But how realistic is this going forward to 2020 and beyond?
There are main three factors with the potential to drive decommissioning:
Technical Obsolescence – i.e. an inability to meet current legislative standards and/or where a facility has reached the ‘natural’ end of its operational life;
Legislative Obsolescence – for example where new legislation requires higher operational standards, the effect of specific taxes, restriction on fuel sources etc;
Economic Obsolescence – where changing market conditions mean that an incinerator is uncompetitive/uneconomic to operate.
7.2.1. Technical Obsolescence
The markets which will be most influenced by any net decommissioning will be the Core and Inner Circle with a projected overcapacity (Section 5.1). They are the focus of the analysis in this section.
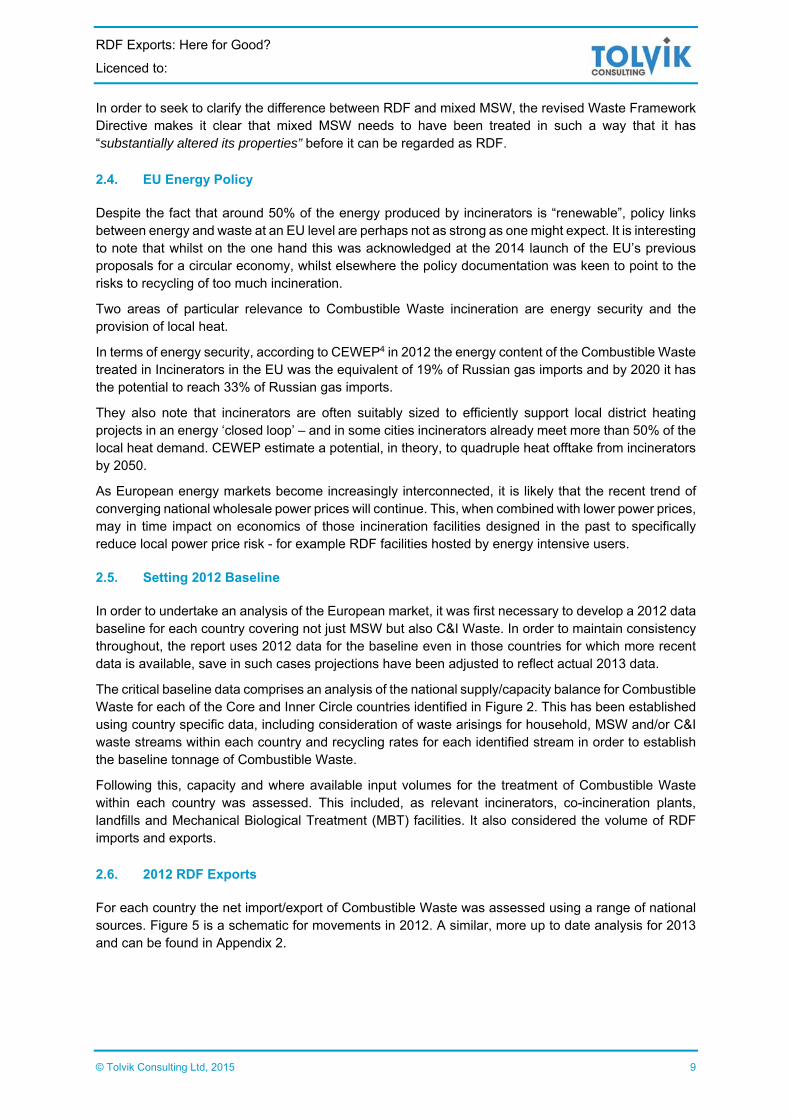
Using a wide variety of sources Figure 25 shows the age profile of incinerator capacity in these markets projected forward on the basis of no net decommissioning to 2020. This analysis is based on the entire facility rather than individual lines within an incinerator and considers the age of an incinerator from the date of first operation (“Operational Date”). This will therefore reflect an older age profile (average of 26) than an equivalent based on a line by line analysis.
Figure 25 demonstrates that by 2020 11% of the 55.1Mt of incinerator capacity in these markets will be over 45 old and 24% over 40 years old. With the nominal design life of an incinerator typically around
RDF Exports: Here for Good?
Licenced to:
© Tolvik Consulting Ltd, 2015 28
40 years, the net decommissioning of incinerators on the grounds of technical obsolescence has the potential to have a significant impact on the market between now and 2020.
Figure 25: Age Profile of Incinerator Capacity in 2020 Source: Tolvik Analysis
The extent of the potential impact of decommissioning on the market can be seen from the analysis in Table 26. This shows the total overcapacity for the target markets projected in 2020 to be 9.1Mt (Incremental Improvement) and 12.3Mt (Policy). Scenarios were then run to consider the effect of various assumptions with respect to incineration decommissioning age. The result, using the incinerator age profile data in Figure 25, was that if all incinerators aged 48 years or above were decommissioned in 2020 then the overcapacity would disappear in the Incremental Improvement scenario, whilst this would need to reduce to 44 years to achieve the equivalent result in the Policy scenario.
2020
Incremental Improvement
Policy
Core (Mt) – Table 11 (6.6) (9.3)
Inner Circle – Projected Overcapacity (Mt) – Table 20 (2.5) (3.0)
Total Overcapacity (9.1) (12.3)
Age of Decommissioning Operational Date 48 44
Latest Upgrade 38 36
Table 26: Decommissioning age required for a balanced market within the Core and Inner Circle Markets in 2020 Source: Tolvik Analysis

RDF Exports: Here for Good?
Licenced to:
© Tolvik Consulting Ltd, 2015 29
An alternative source of incinerator ages, which appears to be based on the latest date for the addition of new lines or major upgrades of existing ones (“Latest Upgrade”) was also used17. Using this data, the assumed decommissioning age to remove the projected overcapacity reduces to 38 years (Incremental Improvement) or 36 years (Policy).
With only relatively few incinerators decommissioned, and with developments in technology (e.g. anti-corrosion materials) extending the operational life for newer facilities, it is very difficult to establish a meaningful average age for incinerator decommissioning. On the one hand those that appear to have ceased to operate on the grounds of “old age” (rather than persistent environmental breaches) have ranged in age from 38 to 45 years whilst on the other there are a number of incinerators which, based on their Operational Date, are over 50 years and which are currently still in service. It is noted that in modelling others18 have used an assumed decommissioning age of 35 years based on latest upgrade information.
There will be country by country variations. Of the countries considered, using Operational Date data, Denmark has the oldest average age (30 years) and Finland the youngest (11 years).
In 2012 specific third party research was undertaken on the age profile of incinerators in Germany, the largest market19. Comparing this third party data to the Operational Date data used in this report there is a significant variation – with the Operational Date data showing 32% of incinerators aged above 32 years in 2012 whilst for the third party 19%.
Figure 27: Age profile of German incinerators in 2012 Source: Trend Research, Tolvik Analysis
If this German specific analysis were applied to the whole market then the age of decommissioning to bring the market into balance in 2020 would be 41 years (Incremental Improvement) and 35 years (Policy) – which is nearer the Latest Upgrade than Operational Date data.
Given that the rate of future incinerator decommissioning is likely to have at least as great an impact on the Combustible Waste market in Europe as any assumptions with regard to the supply of Combustible Waste further, more detailed, analysis is likely to greatly assist market understanding.
7.2.2. Legislative Obsolescence
Legislation with respect to incineration across Europe is in a state of permanent evolution – as evidenced by the ongoing review Best Available Techniques Reference Document (BREF) and new energy efficiency requests for incinerators in Switzerland. Whilst classification of an incinerator as R1 (recovery) is undoubtedly an advantage in terms of being able to access the international RDF markets, to date a failure to achieve R1 has not increased the risk of decommissioning – although clearly national governments may consider, in time, legislation which has the effect of favouring R1 facilities.

RDF Exports: Here for Good?
Licenced to:
© Tolvik Consulting Ltd, 2015 30
Overall, however, whilst legislative obsolescence is an ongoing potential risk, it is understood there are no current major legislative developments which could reasonably be expected to have a material impact on the rate of decommissioning.
7.2.3. Economic Obsolescence
This is considered further in Section 8.
7.3. Capacity – Growth in Co-Incineration
7.3.1. Co Incineration
Co-incineration, particularly in cement and lime kilns (where there is no requirement for treated waste to achieve an “End of Waste” criteria) represents an alternative market for Combustible Waste. These industries are energy intensive and under pressure to reduce their carbon footprint. The industry has set itself the objective to reduce the use of fossil fuels to 40% of energy by 2050.
In 2012, it is estimated that the European cement industry used 7.7Mt20 of alternative fuels (representing 26% of total thermal energy consumption) with a further 9% of fuel derived from virgin biomass.
Of the total alternative fuels, it is estimated that the total use of Combustible Waste (largely in the form of mixed plastics and
SRF) was around 5.0-5.5Mt – with the largest markets being Germany (around 2.0Mt) and Poland (around 1.0Mt). The remaining portion of alternative fuels came from tyres, meat and bone meal, recovered solvents etc.
As Figure 28 shows, until the recession hit cement markets, steady increases had been seen in the total tonnage of alternative fuels used by the cement industry in Europe. There are signs that, with the improvement in market conditions, these may be increasing once again. The European Recovered Fuel Organisation (ERFO) estimates that the total potential use of SRF in cement kilns in the EU could reach 10Mt by 2020; this expansion in the market would help ensure that the industry was in line with its long term carbon reduction target.
The use of alternative fuels varies from market to market – and typically the EU countries with significant domestic cement industries but with a proportionately lower use of alternative fuels (i.e. Italy, Poland and Spain) also happen to be those with a high dependence on landfill. It would therefore be reasonable to assume that any significant expansion in the use of alternative fuels in these cement producing countries will be more likely, over time, to be met by domestic sources of Combustible Waste rather than imports – although in the short term evidence suggests that they may look to imports to achieve the required quality and quantity of SRF.
7.3.2. End Of Waste (EoW)
In addition to cement and lime kilns, there is the potential for Combustible Waste to be co-incinerated in other forms of thermal treatment facilities. However, this report has assumed that, as at present, even after treatment into an SRF, Combustible Waste will not generally be able to meet EU EoW criteria.
Figure 28: Use of Alternative Fuels in the EU Source: GNR Project
0.0
1.0
2.0
3.0
4.0
5.0
6.0
7.0
8.0
9.0
2005 2006 2007 2008 2009 2010 2011 2012
Mill
ion
To
nn
es
Use of Alternative Fuels - EU28

RDF Exports: Here for Good?
Licenced to:
© Tolvik Consulting Ltd, 2015 31
Achieving such criteria would in theory permit SRF to be regarded as a product and allow for thermal treatment in a wider range of facilities.
At EU level, this is currently subject of ongoing work by the Austrian EPA on behalf of the Joint Research Centre. Whilst it is notable that Austria (with Italy) have both developed their own national EoW criteria for these fuels most of the incineration industry is against such an approach - pointing to the potential for an uneven playing field across Europe.
7.4. Capacity – Market Disruptive technologies
Almost all the incineration capacity identified in this report uses conventional moving grate or fluidised bed technology. For these technologies operational performance typically lies within a well understood band – with any differences (and hence economics – see Section 8) as much a function of scale, age, operator performance, feedstock and location as they are the underlying technology.
So what is the potential for market disruptive technologies to emerge in the next 10 years which fundamentally change the energy from waste market? The key to being commercially disruptive is for any such process to be able to offer significant energy efficiency benefits. There are two potential threats:
Gasification technology suitable for Combustible Waste – with a long term objective being the production of high value gaseous products – including hydrogen;
A Fischer Tropsch process which delivers liquid fuels – eg aviation fuel.
However, it is noted that despite a very significant investment in research over a number of years there has been only very limited success. Furthermore, should a commercially effective solution be found, the lead times are such that it is unlikely such technology would be disruptive to the Combustible Waste market until some time after 2020.

RDF Exports: Here for Good?
Licenced to:
© Tolvik Consulting Ltd, 2015 32
8. GATE FEE ECONOMICS
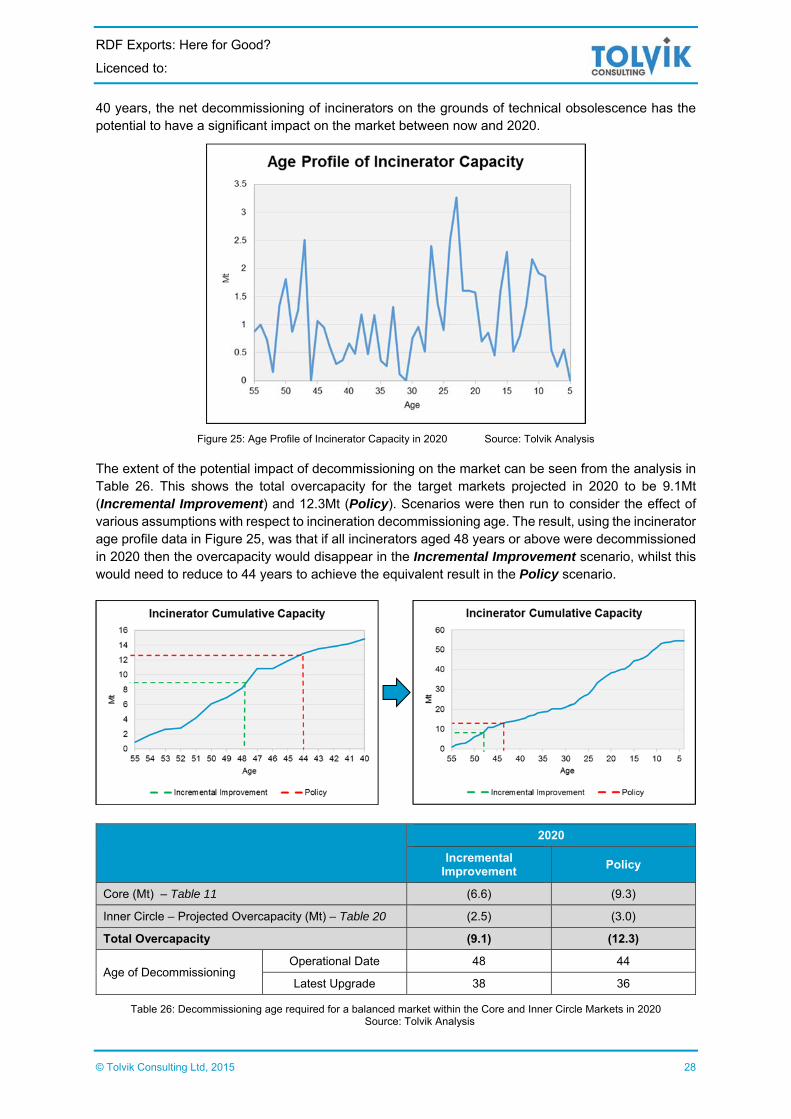
8.1. Historic – Core Countries
8.1.1. Germany
Incinerator gate fees for MSW in Germany have historically been significantly above those for C&I Waste as shown in Figure 29. These higher prices, together with the MSW gate fee adjustment mechanisms (particularly for publicly owned incinerators), has meant that those German incinerators with MSW contracts have thus far been relatively well protected against downturns in revenues from C&I Waste.
Over the last few years German incinerator operators dropped spot C&I Waste gate fees to as low as €40/t (more typically €60-70/t) but over the last 12 months, for the first time in many
years, these C&I Waste gate fees have started to rise – albeit by modest amounts – as the market has become proficient at importing RDF (particularly from the UK). Some operators are also expressing confidence that, in the short term, following the incineration tax in the Netherlands, they may be able to secure additional Dutch waste.
Figure 30: Spot Gate Fee Ranges NW Germany Source: EUWID
8.1.2. Sweden
Figure 31: Gate Fees in Sweden Source: Profu
200
250
300
350
400
450
500
550
600
2010 2011 2012 2013 2014
Gat
e F
ee
Per
SE
K T
onne
Import Gate Fees
Figure 29: Median Gate Fees in North Germany
Source: EUWID
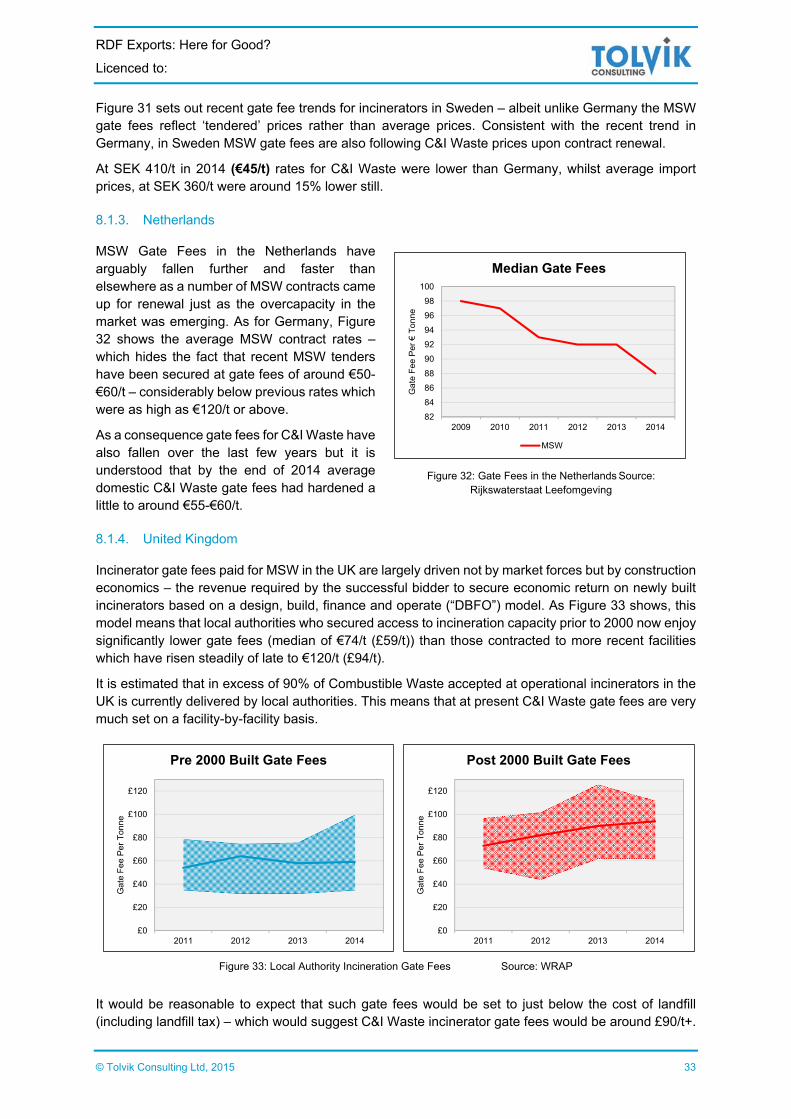
RDF Exports: Here for Good?
Licenced to:
© Tolvik Consulting Ltd, 2015 33
Figure 31 sets out recent gate fee trends for incinerators in Sweden – albeit unlike Germany the MSW gate fees reflect ‘tendered’ prices rather than average prices. Consistent with the recent trend in Germany, in Sweden MSW gate fees are also following C&I Waste prices upon contract renewal.
At SEK 410/t in 2014 (€45/t) rates for C&I Waste were lower than Germany, whilst average import prices, at SEK 360/t were around 15% lower still.
8.1.3. Netherlands
MSW Gate Fees in the Netherlands have arguably fallen further and faster than elsewhere as a number of MSW contracts came up for renewal just as the overcapacity in the market was emerging. As for Germany, Figure 32 shows the average MSW contract rates – which hides the fact that recent MSW tenders have been secured at gate fees of around €50-€60/t – considerably below previous rates which were as high as €120/t or above.
As a consequence gate fees for C&I Waste have also fallen over the last few years but it is understood that by the end of 2014 average domestic C&I Waste gate fees had hardened a little to around €55-€60/t.
8.1.4. United Kingdom
Incinerator gate fees paid for MSW in the UK are largely driven not by market forces but by construction economics – the revenue required by the successful bidder to secure economic return on newly built incinerators based on a design, build, finance and operate (“DBFO”) model. As Figure 33 shows, this model means that local authorities who secured access to incineration capacity prior to 2000 now enjoy significantly lower gate fees (median of €74/t (£59/t)) than those contracted to more recent facilities which have risen steadily of late to €120/t (£94/t).
It is estimated that in excess of 90% of Combustible Waste accepted at operational incinerators in the UK is currently delivered by local authorities. This means that at present C&I Waste gate fees are very much set on a facility-by-facility basis.
Figure 33: Local Authority Incineration Gate Fees Source: WRAP
It would be reasonable to expect that such gate fees would be set to just below the cost of landfill (including landfill tax) – which would suggest C&I Waste incinerator gate fees would be around £90/t+.
£0
£20
£40
£60
£80
£100
£120
2011 2012 2013 2014
Ga
te F
ee
Pe
r T
onne
Pre 2000 Built Gate Fees
£0
£20
£40
£60
£80
£100
£120
2011 2012 2013 2014
Ga
te F
ee P
er
Ton
ne
Post 2000 Built Gate Fees
Figure 32: Gate Fees in the Netherlands Source: Rijkswaterstaat Leefomgeving
82
84
86
88
90
92
94
96
98
100
2009 2010 2011 2012 2013 2014
Ga
te F
ee P
er €
To
nne
Median Gate Fees
MSW
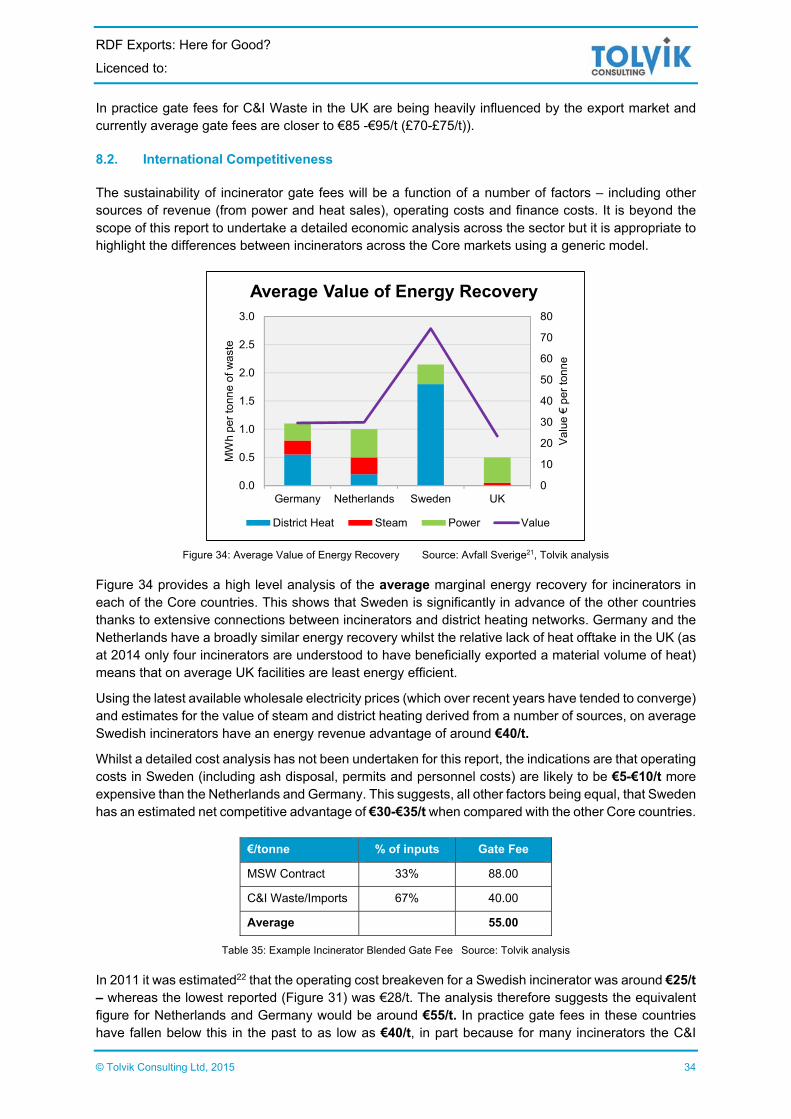
RDF Exports: Here for Good?
Licenced to:
© Tolvik Consulting Ltd, 2015 34
In practice gate fees for C&I Waste in the UK are being heavily influenced by the export market and currently average gate fees are closer to €85 -€95/t (£70-£75/t)).
8.2. International Competitiveness
The sustainability of incinerator gate fees will be a function of a number of factors – including other sources of revenue (from power and heat sales), operating costs and finance costs. It is beyond the scope of this report to undertake a detailed economic analysis across the sector but it is appropriate to highlight the differences between incinerators across the Core markets using a generic model.
Figure 34: Average Value of Energy Recovery Source: Avfall Sverige21, Tolvik analysis
Figure 34 provides a high level analysis of the average marginal energy recovery for incinerators in each of the Core countries. This shows that Sweden is significantly in advance of the other countries thanks to extensive connections between incinerators and district heating networks. Germany and the Netherlands have a broadly similar energy recovery whilst the relative lack of heat offtake in the UK (as at 2014 only four incinerators are understood to have beneficially exported a material volume of heat) means that on average UK facilities are least energy efficient.
Using the latest available wholesale electricity prices (which over recent years have tended to converge) and estimates for the value of steam and district heating derived from a number of sources, on average Swedish incinerators have an energy revenue advantage of around €40/t.
Whilst a detailed cost analysis has not been undertaken for this report, the indications are that operating costs in Sweden (including ash disposal, permits and personnel costs) are likely to be €5-€10/t more expensive than the Netherlands and Germany. This suggests, all other factors being equal, that Sweden has an estimated net competitive advantage of €30-€35/t when compared with the other Core countries.
€/tonne % of inputs Gate Fee
MSW Contract 33% 88.00
C&I Waste/Imports 67% 40.00
Average 55.00
Table 35: Example Incinerator Blended Gate Fee Source: Tolvik analysis
In 2011 it was estimated22 that the operating cost breakeven for a Swedish incinerator was around €25/t – whereas the lowest reported (Figure 31) was €28/t. The analysis therefore suggests the equivalent figure for Netherlands and Germany would be around €55/t. In practice gate fees in these countries have fallen below this in the past to as low as €40/t, in part because for many incinerators the C&I
0
10
20
30
40
50
60
70
80
0.0
0.5
1.0
1.5
2.0
2.5
3.0
Germany Netherlands Sweden UK
Va
lue
€p
er to
nn
e
MW
h pe
r to
nne
of w
ast
e
Average Value of Energy Recovery
District Heat Steam Power Value

RDF Exports: Here for Good?
Licenced to:
© Tolvik Consulting Ltd, 2015 35
Waste (and import) gate fees have been subsidised by (higher) MSW gate fees. This is shown in Table 35 where if 33% of inputs attract average MSW gate fee in the Netherlands in 2014 and C&I Waste/import gate fees are €40/t then the overall incinerator average gate fee is €55/t.
Clearly the economics for each incinerator will vary significantly, but it is hoped that figures provide a useful illustration.
8.3. Competitiveness in attracting RDF Imports
The competitiveness of the Core countries in securing RDF imports will be a function not just of gate fee but also transport costs and a number of ‘soft factors’ such as counter-party risk and the seasonality of delivery requirements (which is a particular issue for Sweden). For exports from the UK and using the gate fees from Section 8.2 as the basis, these are summarised in Table 36.
€/tonne To
Germany To
Netherlands To
Sweden
UK Transport Costs 12.50 12.50 12.50
Admin/Port Costs etc 10.00 10.00 10.00
Sea Transport Costs 10.00 8.00 17.50
European Handling Costs 5.00 5.00 5.00
European Transport Costs 12.50 5.00 7.50
Incinerator Gate Fee 55.00 55.00 28.00
Total € 105.00 95.50 80.50
Total £ 84.00 76.40 64.40
Table 36: RDF Ex Works Export Prices from the UK
Letsrecycle.com23 shows that the range of RDF export gate fees in the UK in 2014 was from £65-£90/t (€81-€113/t) which is consistent with the figures in Table 36. It is noted that, consistent with anecdotal evidence, there has been some hardening of these prices over recent months.
8.4. Competitiveness of RDF Exports against UK Incineration
For potential exporters of RDF from the UK (and importers), UK competition is likely to come from one of four types of incineration facility:
Incinerators built to support MSW contracts - The contractual arrangements for such incinerators in the UK are such that, similar to elsewhere in Europe, they will generally be able to adjust their gate fees as required in order to secure sufficient Combustible Waste to operate at full capacity. Looking forward this is unlikely to change.
Small scale (80-150ktpa) gasification – where an advanced thermal treatment technology is being used, the project will benefit from UK government subsidy for the power it produces at around €100/MWh (£80/MWh). Gate fees for the thermal processing stage of such projects are being proposed at around €50- €70/t (£40 - £55/t)) but critically generally require waste to have been prepared to a specification not dissimilar to that seen for SRF. This makes a direct gate fee comparison difficult.
Large scale (400 ktpa+) conventional RDF incineration – often with a heat offtake. These facilities benefit from economies of scale and additional subsidy support for any heat produced. Such facilities are looking to gate fees around €85/t (£70/t)) – although for long term contracted volumes are offering reductions of €12.50-€20/t (£10 - £15/t)).

RDF Exports: Here for Good?
Licenced to:
© Tolvik Consulting Ltd, 2015 36
New, ‘merchant’ medium scale (200 - 250 ktpa) power only conventional incinerators – the economics of these facilities without MSW contracts are such that an average gate fee of €100/t (£80/t)) + is required to provide third party investors with an adequate return. It is therefore likely that only a limited number of such incinerators will be constructed.
The need for exporters/importers to compete with UK incinerator gate fees to secure sufficient tonnages will, in part, also be dependent upon the overall UK Combustible Waste supply/capacity balance as described in Section 4.5. It is important to note that with such an undercapacity there is no need for importers to always have to compete with the cheapest options available in the market in order to secure the necessary tonnages.
8.5. Further Gate Fee Considerations
As discussed in Section 8.1, for a number of incinerator operators in Germany and the Netherlands the realignment of MSW gate fees at contract renewal towards gate fees for C&I Waste (rather than trends in C&I Waste gate fees) will potentially change their overall economic model. This in turn may restrict their ability to compete, on a ‘marginal basis’, for example with Sweden, in securing RDF imports. This must, when combined with further declines in energy prices, at the very least, increase the possibility that some incinerators could be decommissioned sooner than planned (i.e. on economic grounds).
In contrast with this longer term trend, at present, the market is currently feeling a little more positive than it has for some time. This in part because the recent rapid decline in Combustible Waste tonnages has slowed down as EU economics start to improve, and in part because operators have managed to increase C&I Waste gate fees a little. However, there are those who point to these recent rises, incineration tax in the Netherlands and Circular Economy proposals and suggest than any short term market gains still be more than offset by the effects of further increases in recycling.

RDF Exports: Here for Good?
Licenced to:
© Tolvik Consulting Ltd, 2015 37
APPENDIX 1 – MODELLING ASSUMPTIONS AND DATA SOURCES
Assumptions Incremental Improvement Policy
Supply
Population Forecast from The World Bank24
GDP Forecast from OECD25
Household Waste Arisings Growth = 50% of population
change
Waste generation decoupled from population– arisings
unchanged from 2012
C&I Waste Arisings Growth = 50% of GDP change Waste generation decoupled
from GDP– arisings unchanged from 2012
Household Waste Recycling Tolvik algorithm 50% by 2020 and 70% by
2030
C&I Waste Recycling Minimum of 2012 level or 70% by 2030
Demand
Incinerator Capacity Stated ‘headline’ capacity as identified at 2012 from various
sources
Availability 100% as ‘headline’ capacity increasingly based on ‘design’
capacity and not ‘maximum capacity’
Calorific Value No change in average calorific value of Combustible Waste (and
hence headline capacity)
Operational Status Only facilities which are operational or in construction as at
01.01.2015 considered in analysis
Co-Incineration Capacity Based on various information sources
MBT Capacity Treatment assumed to have the effect of reducing the tonnage of
Combustible Waste into 60% RDF
Decommissioning Considered in Section 7. Previous chapters assume no net
decommissioning
Future Incinerator Capacity Country specific analysis, considered further in Sections 3-6
Table A1: Modelling assumptions
Exchange Rates
This report uses the following exchange rate: £1.00 = €1.25 = SEK11.50
Data Sources
Waste data has been generally collected from the relevant government department/statistics organisation of each country – and it is to be noted that this is not always consistent with data used by Eurostat26. Definitions of Household, MSW and C&I Waste vary significantly from country to country and the analysis for each country to arrive at the tonnage of Combustible Waste has been structured to reflect the data available rather than adopt an identical methodology for each.
Capacities of incinerators and other treatment facilities were collected from a range of sources including individual incinerator company websites, CEWEP “Waste to Energy – State of the Art Report”27, Profu28, Umwelt Bundesamt29 and Rijkswaterstaat30
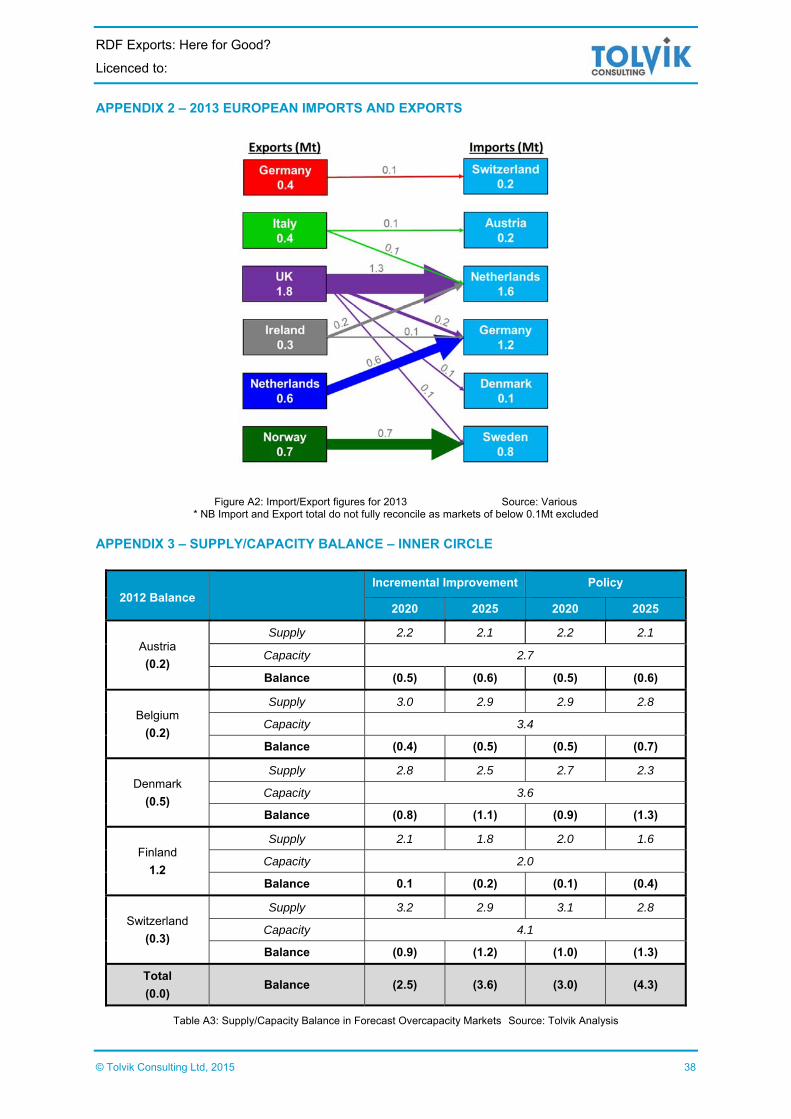
RDF Exports: Here for Good?
Licenced to:
© Tolvik Consulting Ltd, 2015 38
APPENDIX 2 – 2013 EUROPEAN IMPORTS AND EXPORTS
Figure A2: Import/Export figures for 2013 Source: Various * NB Import and Export total do not fully reconcile as markets of below 0.1Mt excluded
APPENDIX 3 – SUPPLY/CAPACITY BALANCE – INNER CIRCLE
2012 Balance Incremental Improvement Policy
2020 2025 2020 2025
Austria
(0.2)
Supply 2.2 2.1 2.2 2.1
Capacity 2.7
Balance (0.5) (0.6) (0.5) (0.6)
Belgium
(0.2)
Supply 3.0 2.9 2.9 2.8
Capacity 3.4
Balance (0.4) (0.5) (0.5) (0.7)
Denmark
(0.5)
Supply 2.8 2.5 2.7 2.3
Capacity 3.6
Balance (0.8) (1.1) (0.9) (1.3)
Finland
1.2
Supply 2.1 1.8 2.0 1.6
Capacity 2.0
Balance 0.1 (0.2) (0.1) (0.4)
Switzerland
(0.3)
Supply 3.2 2.9 3.1 2.8
Capacity 4.1
Balance (0.9) (1.2) (1.0) (1.3)
Total
(0.0) Balance (2.5) (3.6) (3.0) (4.3)
Table A3: Supply/Capacity Balance in Forecast Overcapacity Markets Source: Tolvik Analysis

RDF Exports: Here for Good?
Licenced to:
© Tolvik Consulting Ltd, 2015 39
APPENDIX 4 – GLOSSARY
Co Incineration The combustion of RDF alongside other fuels in a high temperature thermal treatment facility – eg cement kiln - not designed specifically for the treatment of Combustible Waste
Combustible Waste Please see definition in Section 1.2
C&I Waste Commercial & Industrial Waste
Dirty MRF Materials Recycling Facility processing Residual Waste
EoW End of Waste
EPA Environmental Protection Agency
EWC European Waste Catalogue
Incinerator Treatment facilities used to thermally process Combustible Waste with the recovery of power and/or heat.
kt ‘000s of tonnes
MBT Mechanical Biological Treatment
MSW Municipal Solid Waste - Household waste and commercial and industrial waste with similar characteristics to household waste
MT Mechanical Treatment
Mtpa Millions Tonnes per annum
pa per annum
Residual Waste which remains after recycling and composting
RDF Refuse Derived Fuel
SRF Solid Recovered Fuel produced to a specification
WID Waste Incineration Directive (now part of the Industrial Emissions Directive)
WSR Waste Shipment Regulations

RDF Exports: Here for Good?
Licenced to:
© Tolvik Consulting Ltd, 2015 40
APPENDIX 5 – REFERENCES
1 http://www.avfallsverige.se/fileadmin/uploads/Rapporter/F%C3%B6rbr%C3%A4nning/F2012-04.pdf
2 www.letsrecycle.com/news/latest-news/commission-outlines-scope-new-circular-economy-plans/
3 www.gov.uk/government/uploads/system/uploads/attachment_data/file/363004/UK_Statistical_release_FINALv4_10_10_2014.pd
4 http://www.recyclingwasteworld.co.uk/in-depth-article/energy-from-waste/73749/
5 This includes exports to Emlicheim/Coevorden on the German/Dutch border. Data from http://www.umweltbundesamt.de/en/topics/waste-resources/transfrontier-movement-of-wastes-destined-for/statistics-concerning-transfrontier-shipment-of
6 http://www.greeninvestmentbank.com/media/25376/gib-residual-waste-report-july-2014-final.pdf
7 June 14: Bundesministerium für Land- und Forstwirtschaft, Umwelt und Wasserwirtschaft: Die Bestandsaufnahme der abfallwirtschaft in Österreich Statusbericht 2013
8 http://mim.dk/media/mim/67848/Ressourcestrategi_UK_web.pdf
9 http://www.danskaffaldsforening.dk/documents/23264/0/V%C3%A6rdi+af+affaldsimport+nov+2014.pdf/104c2966-8efa-4d7e-bb29-54b4061499d3
10 BAFU: Brennbare Abfälle in Kehrichtverbrennungsanlagen
11 http://www.stoptheincinerator.co.uk/?p=645
12 http://www.avfallnorge.no/rapporter1.cfm?pArticleId=33063&pArticleCollectionId=3918
13 http://www.althesys.com/sviluppo-di-conoscenze/osservatori-e-centri-di-ricerca/was/annual-report/
14 February 2013: EEA: Municipal waste management in Spain and Portugal
15 http://www.fead.be/uploads/PressReleases/documents/FEAD%20Press%20Release%20-%20FEAD%20calls%20for%20an%20infringement%20procedure%20against%20the%20Hungarian%20Waste%20Act.pdf
16 http://www.fead.be/uploads/PressReleases/documents/FEAD%20Press%20Release%20-%20Hungarian%20Waste%20Act.pdf
17 http://www.coenrady.com/ 18 http://www.prognos.com/uploads/tx_atwpubdb/140508_HAL_IFAT-Vortrag.pdf 19 http://trendsresearch.com/
20 GNR Project: http://www.wbcsdcement.org/GNR-2012/index.html
21http://www.verenigingafvalbedrijven.nl/fileadmin/user_upload/Documenten/Overig/WAR_Afvalverwerking_in_Nederland_gegevens_2012_okt_2013.pdf 22 http://www.avfallnorge.no/rapporter1.cfm?pArticleId=33063&pArticleCollectionId=3918 23 http://www.letsrecycle.com/prices/efw-landfill-rdf-2/ 24 databank.worldbank.org/data/home.aspx
25 stats.oecd.org
26 http://ec.europa.eu/eurostat
27 http://www.cewep.eu/information/data/iswawtestateoftheartreport/index.html 28 Kapacitetsutredning 2014 – Avfallsförbränning och avfallsmängder till år 2020
29 http://www.umweltbundesamt.de/en/topics/waste-resources/waste-disposal/thermal-treatment 30 http://www.verenigingafvalbedrijven.nl/fileadmin/user_upload/Documenten/Overig/WAR_Afvalverwerking_in_Nederland_gegevens_2012_okt_2013.pdf