Embed Size (px)
Citation preview
INSTITUTE for RESEARCH on HIGHER EDUCATION
--OCOLLEGE
V VANDERBILT PEABODY COLLEGE
....,L HIGHER EDUCATION ~ POLICY INSTITUTE
C) AFFORDABILITY N DIAGNOSIS PENNSYLVANIA

Suggested Citation:
Institute for Research on Higher Education. (2016). College Affordability Diagnosis: Pennsylvania. Philadelphia, PA: Institute for Research on Higher Education, Graduate School of Education, University of Pennsylvania. http:// www2.gse.upenn.edu/irhe/affordability-diagnosis
Image by twenty20.com/@michellehaha
1
COLLEGE AFFORDABILITY DIAGNOSIS
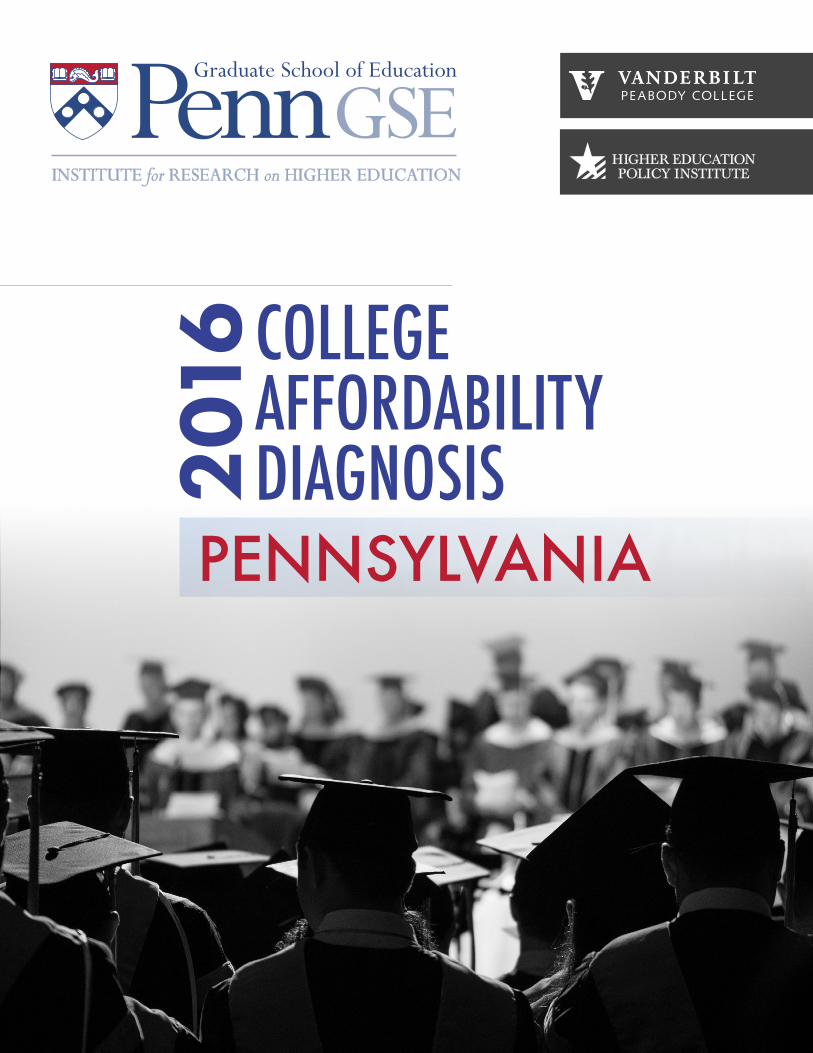
Pennsylvanio students attend private four-year nondoctoral institutions than ony other kind of institution, with 29 percent enrolled . Families would spend, on average, 47 percent of annual income to pay for full-time attendance.
Percentage of students attending private four-year nondoctoral institutions
47%
Percentage of fomily income required to pay for full-time attendance
On average, 40 percent of working-age Pennsylvania
state residents (age 25-64) have an associate's degree or
higher. By 2020, 63 percent of jobs will require an associate's degree or higher.
63% Jobs requiring associate's degree or higher by 2020
40% Workforce with associate's degree or higher, as of 2014
PENNSYLVANIA Pennsylvania provides financially needy students with a comparatively large amount of financial aid, but those efforts are outpaced by tuition increases across the state.
All public sectors of higher education in Pennsylvania rank in the bottom half of the state affordability rankings, but the state’s public research universities are the most unaffordable in the nation. Nearly one third of all Pennsylvania students attend private nondoctoral institutions, with most other students enrolling in the state’s public community colleges and nondoctoral institutions.
In order to pay for college, students in all types of institutions in Pennsylvania would have to work between 29 and 67 hours per week, on average, to be able to attend college full time.
By 2020, 63 percent of all Pennsylvania jobs will require some postsecondary education. Far more high school students and adults will have to earn an associate’s degree or above in order for the state to successfully address workforce needs and be competitive in the information economy. Additionally, the stark gaps in the college attainment—those with an associate’s
degree or higher—between White and Black residents must be closed for Pennsylvania to be 49 competitive.
� All sectors of higher education are less affordable than they were in 2007.
� Financial aid to students enrolled in public and private higher education has declined since 2007 but is well above the national average. Still, Pennsylvania public institutions are among the least affordable nationwide.
� Large gaps exist between White and Black Pennsylvanians in terms of those who have earned an associate’s degree or above (43 percent vs. 26 percent).
� Nearly 20 percent of Pennsylvania children live in poverty, an increase of 2 percent since 2005.
Visit www2.gse.upenn.edu/irhe/affordability-diagnosis for interactive map.
Pennsylvania 2016
INSTITUTE FOR RESEARCH ON HIGHER EDUCATION at PENN GSE2
COLLEGE AFFORDABILITY DIAGNOSIS
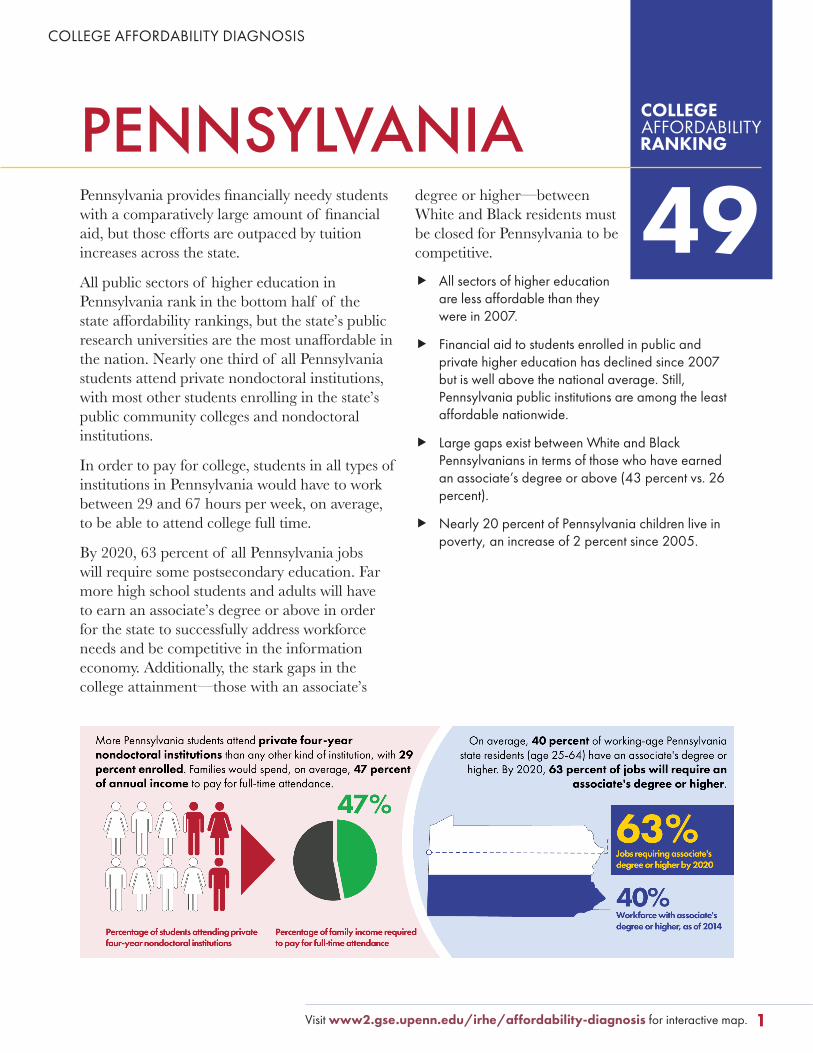
WHAT PERCENT OF FAMILY INCOME would be needed to attend college full time?
Percent of Income 2008
Percent of Income 2013
Ranking*
Public Two-Year 18 19 36 (23 percent of enrollment)** Public Four-Year Nondoctoral 29 37 47 (22 percent of enrollment) Public Research 36 47 50 (17 percent of enrollment) Private Four-Year Nondoctoral 43 47 30 (29 percent of enrollment) Private Research 50 51 16 (8 percent of enrollment)
* This measure ranked states 1-50. The lower the ranking on this measure, the better a state performed on overall college affordability.
**Enrollment may not add up to 100% due to rounding.
NOTE: The “net price” reported in the following tables for each sector of higher education includes tuition, mandatory fees, room/board and books minus all fnancial aid (federal, state and institutional).
For information on how these measures were calculated or which institutions were included, please see the technical report, available at www2.gse.upenn.edu/irhe/affordability-diagnosis.
Pennsylvania 2016
3 INSTITUTE FOR RESEARCH ON HIGHER EDUCATION at PENN GSE
COLLEGE AFFORDABILITY DIAGNOSIS
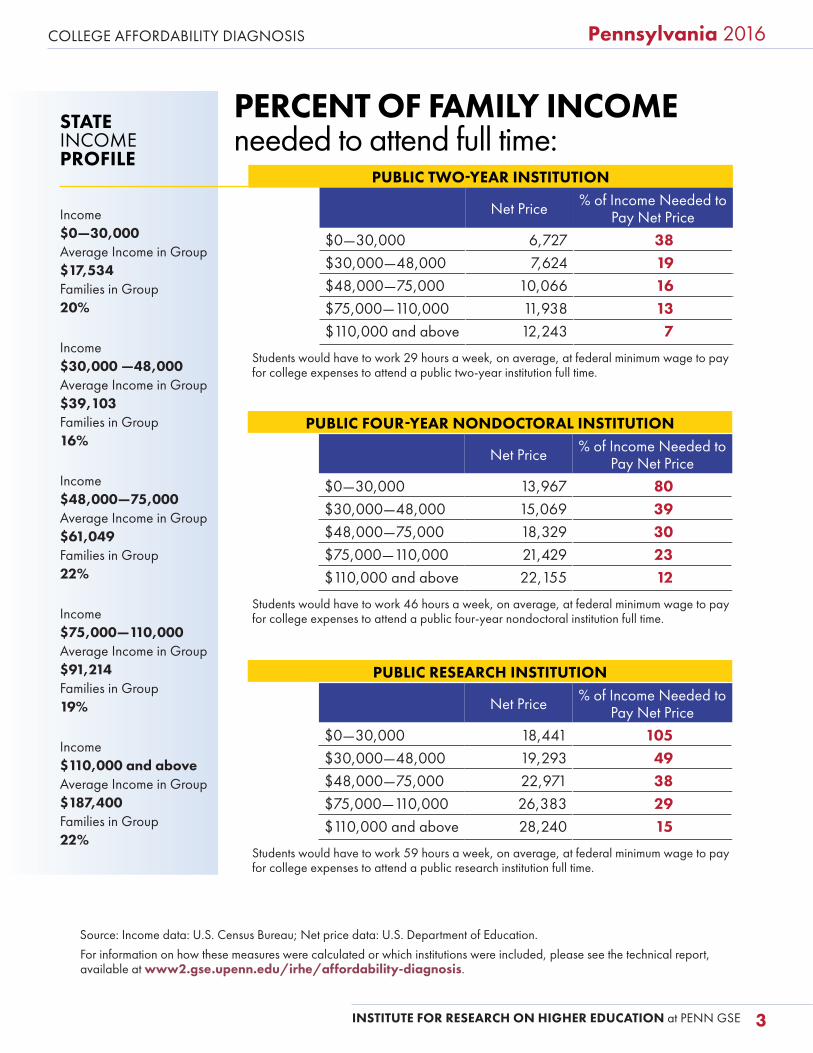
PERCENT OF FAMILY INCOME STATE INCOME needed to attend full time: PROFILE
PUBLIC TWO-YEAR INSTITUTION
Income $0—30,000
Net Price % of Income Needed to Pay Net Price
$0—30,000 6,727 38 Average Income in Group $17,534 $30,000—48,000 7,624 19
Families in Group $48,000—75,000 10,066 16 20% $75,000—110,000 11,938 13
$110,000 and above 12,243 7 Income $30,000 —48,000 Students would have to work 29 hours a week, on average, at federal minimum wage to pay
for college expenses to attend a public two-year institution full time. Average Income in Group $39,103 Families in Group 16%
PUBLIC FOUR-YEAR NONDOCTORAL INSTITUTION
Net Price % of Income Needed to Pay Net Price
Income $0—30,000 13,967 80 $48,000—75,000 Average Income in Group $30,000—48,000 15,069 39
$61,049 $48,000—75,000 18,329 30 Families in Group $75,000—110,000 21,429 23 22% $110,000 and above 22,155 12
Students would have to work 46 hours a week, on average, at federal minimum wage to pay Income for college expenses to attend a public four-year nondoctoral institution full time. $75,000—110,000 Average Income in Group $91,214 Families in Group 19%
PUBLIC RESEARCH INSTITUTION
Net Price % of Income Needed to Pay Net Price
Income $110,000 and above
$0—30,000 $30,000—48,000
18,441 19,293
105 49
Average Income in Group $48,000—75,000 22,971 38 $187,400 $75,000—110,000 26,383 29 Families in Group $110,000 and above 28,240 15 22%
Students would have to work 59 hours a week, on average, at federal minimum wage to pay for college expenses to attend a public research institution full time.
Source: Income data: U.S. Census Bureau; Net price data: U.S. Department of Education.
For information on how these measures were calculated or which institutions were included, please see the technical report, available at www2.gse.upenn.edu/irhe/affordability-diagnosis.
Pennsylvania 2016
INSTITUTE FOR RESEARCH ON HIGHER EDUCATION at PENN GSE4
COLLEGE AFFORDABILITY DIAGNOSIS
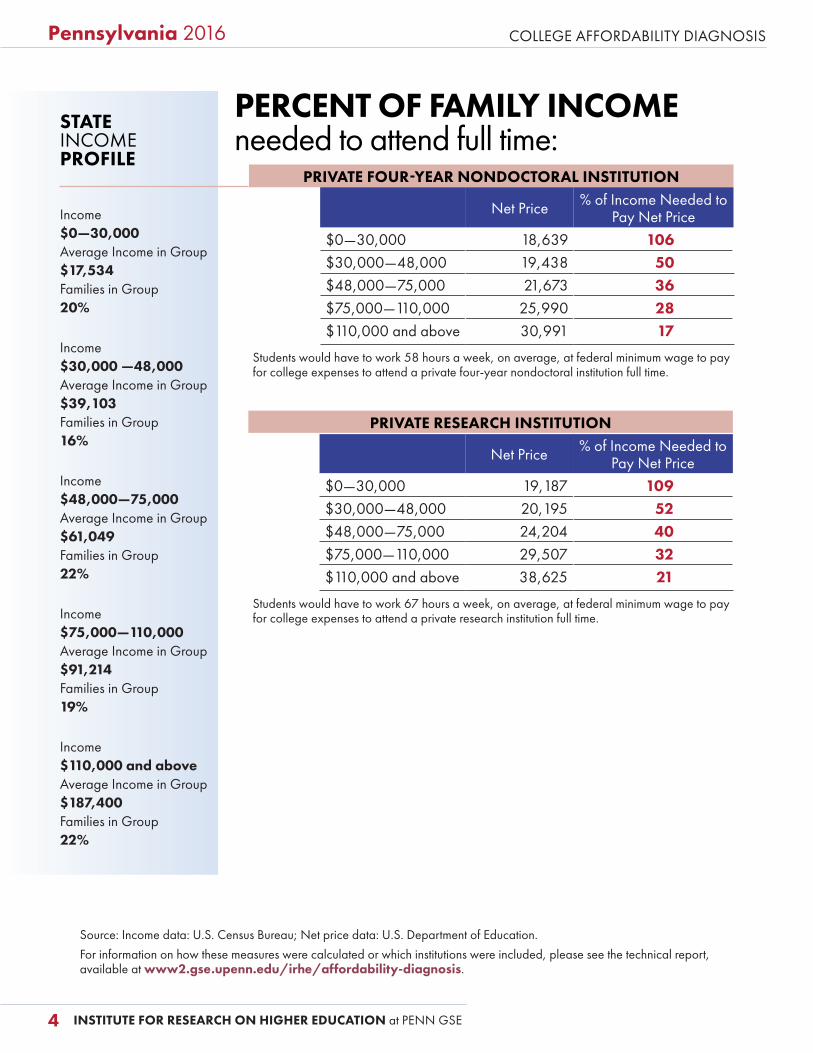
PERCENT OF FAMILY INCOME STATE INCOME needed to attend full time: PROFILE
PRIVATE FOUR-YEAR NONDOCTORAL INSTITUTION
Income $0—30,000
Net Price % of Income Needed to Pay Net Price
$0—30,000 18,639 106 Average Income in Group
$30,000—48,000 19,438 50 $17,534 $48,000—75,000 21,673 36 Families in Group
20% $75,000—110,000 25,990 28 $110,000 and above 30,991 17
Income $30,000 —48,000
Students would have to work 58 hours a week, on average, at federal minimum wage to pay for college expenses to attend a private four-year nondoctoral institution full time.
Average Income in Group $39,103 Families in Group 16%
PRIVATE RESEARCH INSTITUTION
Net Price % of Income Needed to Pay Net Price
Income $0—30,000 19,187 109 $48,000—75,000 Average Income in Group
$30,000—48,000 20,195 52
$61,049 $48,000—75,000 24,204 40 Families in Group $75,000—110,000 29,507 32 22% $110,000 and above 38,625 21
Students would have to work 67 hours a week, on average, at federal minimum wage to pay Income for college expenses to attend a private research institution full time. $75,000—110,000 Average Income in Group $91,214 Families in Group 19%
Income $110,000 and above Average Income in Group $187,400 Families in Group 22%
Source: Income data: U.S. Census Bureau; Net price data: U.S. Department of Education.
For information on how these measures were calculated or which institutions were included, please see the technical report, available at www2.gse.upenn.edu/irhe/affordability-diagnosis.
Pennsylvania 2016
5
COLLEGE AFFORDABILITY DIAGNOSIS
INSTITUTE FOR RESEARCH ON HIGHER EDUCATION at PENN GSE
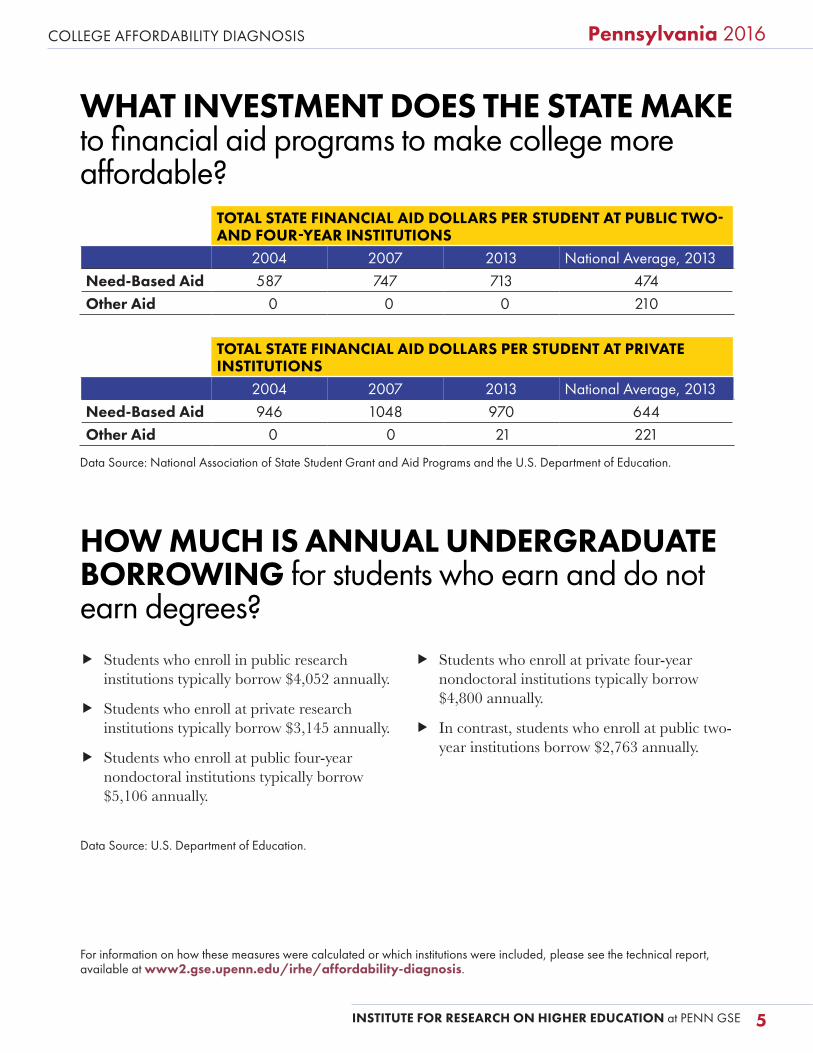
WHAT INVESTMENT DOES THE STATE MAKE to fnancial aid programs to make college more affordable?
TOTAL STATE FINANCIAL AID DOLLARS PER STUDENT AT PUBLIC TWO-AND FOUR-YEAR INSTITUTIONS
2004 2007 2013 National Average, 2013 Need-Based Aid 587 747 713 474 Other Aid 0 0 0 210
TOTAL STATE FINANCIAL AID DOLLARS PER STUDENT AT PRIVATE INSTITUTIONS
2004 2007 2013 National Average, 2013 Need-Based Aid 946 1048 970 644 Other Aid 0 0 21 221
Data Source: National Association of State Student Grant and Aid Programs and the U.S. Department of Education.
HOW MUCH IS ANNUAL UNDERGRADUATE BORROWING for students who earn and do not earn degrees? � Students who enroll in public research � Students who enroll at private four-year
institutions typically borrow $4,052 annually. nondoctoral institutions typically borrow $4,800 annually.
� Students who enroll at private research institutions typically borrow $3,145 annually. � In contrast, students who enroll at public two-
year institutions borrow $2,763 annually. � Students who enroll at public four-year
nondoctoral institutions typically borrow $5,106 annually.
Data Source: U.S. Department of Education.
For information on how these measures were calculated or which institutions were included, please see the technical report, available at www2.gse.upenn.edu/irhe/affordability-diagnosis.
Pennsylvania 2016
INSTITUTE FOR RESEARCH ON HIGHER EDUCATION at PENN GSE6
COLLEGE AFFORDABILITY DIAGNOSIS
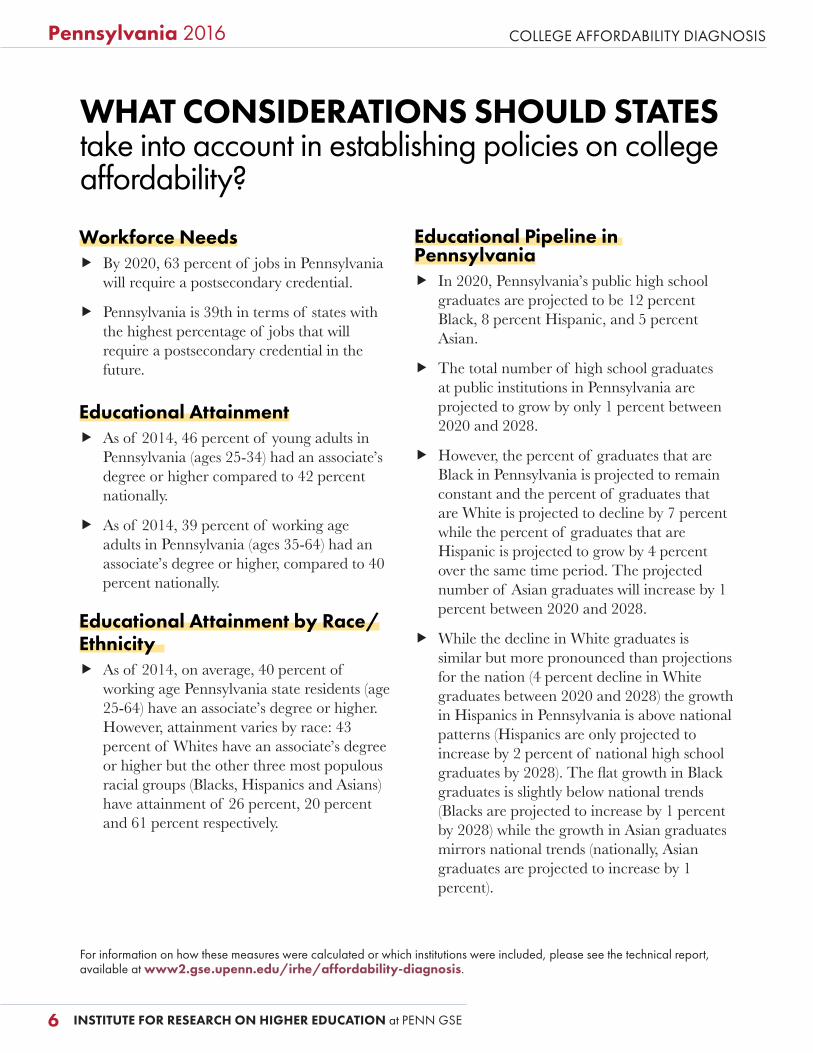
WHAT CONSIDERATIONS SHOULD STATES take into account in establishing policies on college affordability?
Workforce Needs � By 2020, 63 percent of jobs in Pennsylvania
will require a postsecondary credential.
� Pennsylvania is 39th in terms of states with the highest percentage of jobs that will require a postsecondary credential in the future.
Educational Attainment � As of 2014, 46 percent of young adults in
Pennsylvania (ages 25-34) had an associate’s degree or higher compared to 42 percent nationally.
� As of 2014, 39 percent of working age adults in Pennsylvania (ages 35-64) had an associate’s degree or higher, compared to 40 percent nationally.
Educational Attainment by Race/ Ethnicity � As of 2014, on average, 40 percent of
working age Pennsylvania state residents (age 25-64) have an associate’s degree or higher. However, attainment varies by race: 43 percent of Whites have an associate’s degree or higher but the other three most populous racial groups (Blacks, Hispanics and Asians) have attainment of 26 percent, 20 percent and 61 percent respectively.
Educational Pipeline in Pennsylvania � In 2020, Pennsylvania’s public high school
graduates are projected to be 12 percent Black, 8 percent Hispanic, and 5 percent Asian.
� The total number of high school graduates at public institutions in Pennsylvania are projected to grow by only 1 percent between 2020 and 2028.
� However, the percent of graduates that are Black in Pennsylvania is projected to remain constant and the percent of graduates that are White is projected to decline by 7 percent while the percent of graduates that are Hispanic is projected to grow by 4 percent over the same time period. The projected number of Asian graduates will increase by 1 percent between 2020 and 2028.
� While the decline in White graduates is similar but more pronounced than projections for the nation (4 percent decline in White graduates between 2020 and 2028) the growth in Hispanics in Pennsylvania is above national patterns (Hispanics are only projected to increase by 2 percent of national high school graduates by 2028). The flat growth in Black graduates is slightly below national trends (Blacks are projected to increase by 1 percent by 2028) while the growth in Asian graduates mirrors national trends (nationally, Asian graduates are projected to increase by 1 percent).
For information on how these measures were calculated or which institutions were included, please see the technical report, available at www2.gse.upenn.edu/irhe/affordability-diagnosis.
7
Pennsylvania 2016
INSTITUTE FOR RESEARCH ON HIGHER EDUCATION at PENN GSE
For information on how these measures were calculated or which institutions were included, please see the technical report, available at www2.gse.upenn.edu/irhe/affordability-diagnosis.
COLLEGE AFFORDABILITY DIAGNOSIS
Children in Poverty � The percent of children living in poverty in
Pennsylvania increased between 2005 and 2013, from 17 percent to 19 percent.
� In 2013 Pennsylvania was ranked 20th in terms of percent of children living in poverty. Rank order is from lowest to highest percentages of poverty.
Student Share of Total State and Tuition Revenues for Public Higher Education � In Pennsylvania, total student share of state
and net tuition revenues per full time student was 41 percent in 1989, 48 percent in 2000, and 72 percent in 2014, adjusted for inflation. This pattern shows that net tuition revenues were increasing as a share of higher education funding from 1989 to 2000 but after the 2007-08 recession net tuition revenues increased even more rapidly.
INSTITUTE FOR RESEARCH ON HIGHER EDUCATION at PENN GSE8
Pennsylvania 2016
For information on how these measures were calculated or which institutions were included, please see the technical report, available at www2.gse.upenn.edu/irhe/affordability-diagnosis.
COLLEGE AFFORDABILITY DIAGNOSIS
POLICY QUESTIONS FOR STATE LEADERS
� In what types of higher education institutions (sectors) has the state lost ground in college affordability?
� What are the economic circumstances of families in the state (by income quintiles, by different regions of the state, etc.)? What are the implications for college affordability?
� What is the projected demand for an educated workforce in the state? How far is your state from addressing this demand? To what extent is college affordability one of the barriers in educating more state residents?
� What are the gaps in college attainment between Whites and minority groups in your state? How can state policies on college affordability help to narrow these gaps?
� How is tuition policy related, if at all, to the income of the students and families that the state must educate?
� If tuition policy is delegated to public institutions, how does the state provide oversight to ensure that tuition and other educational costs are affordable for students and families?
� In what ways can state policies related to tuition be more tightly coupled with state policies on institutional appropriations and financial aid to address college affordability?
� To what extent do tuition policies encourage access to higher education and completion of certificates and degrees? How do financial aid policies address the needs of both young and working-age students?
� In what ways has the state provided incentives for institutions to improve efficiency and productivity in order to reduce the overall costs to students?
� Research shows that students who work more than 20 hours a week are less likely to make progress toward or complete their certificate or degree programs. How is the state alleviating the need for students to work more than 20 hours a week so that they can focus more on earning their certificates and degrees?
� How much are students borrowing relative to the percent of family income needed to pay for postsecondary education?
� Are all state policies that influence college affordability inadvertently stratifying higher education by income or race?