Embed Size (px)
Citation preview

Copyright © 2017 Boeing. All rights reserved.
Title Here2017 Current Market Outlook Randy Tinseth
Vice President, MarketingBoeing Commercial AirplanesJune 20, 2017
The statements contained herein are based on good faith assumptions are to be used for general information purposes only.
These statements do not constitute an offer, promise, warranty or guarantee of performance.
Copyright © 2017 Boeing. All rights reserved.
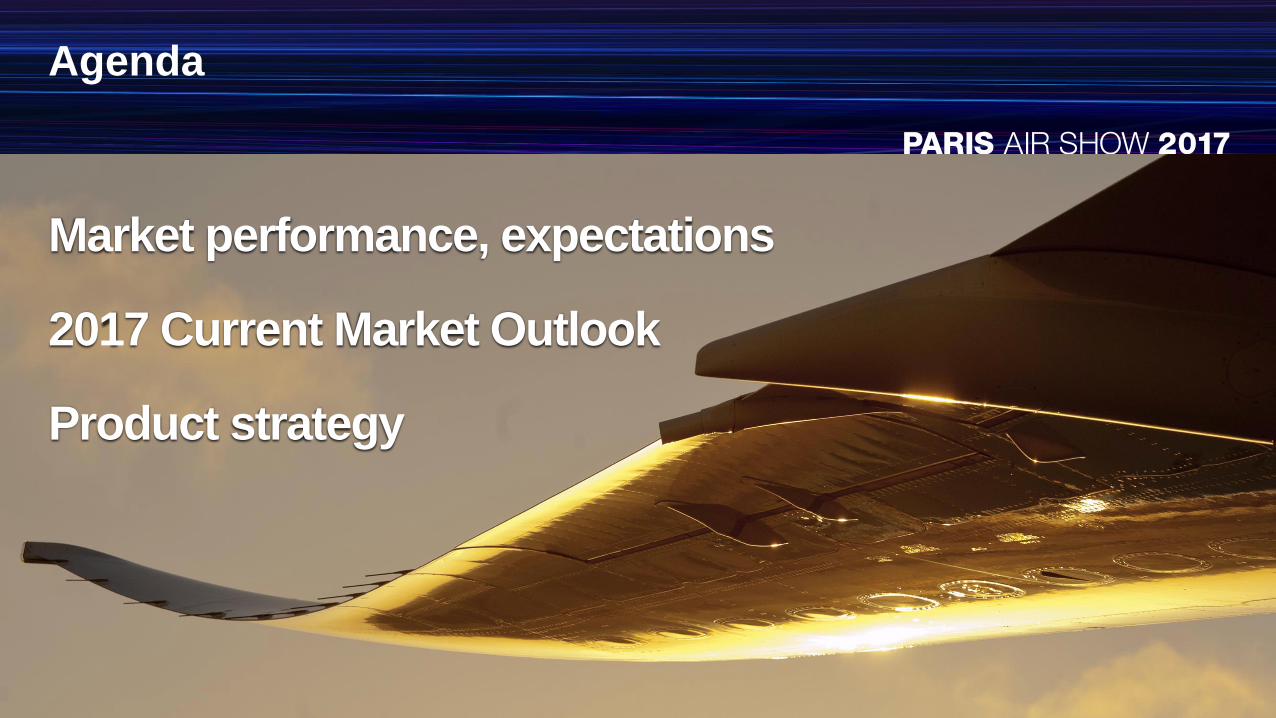
Agenda
Market performance, expectations
2017 Current Market Outlook
Product strategy
Copyright © 2017 Boeing. All rights reserved.
-2%
0%
2%
4%
6%
8%
10%
12%
14%
16%
18%
20%
2010 2011 2012 2013 2014 2015 2016
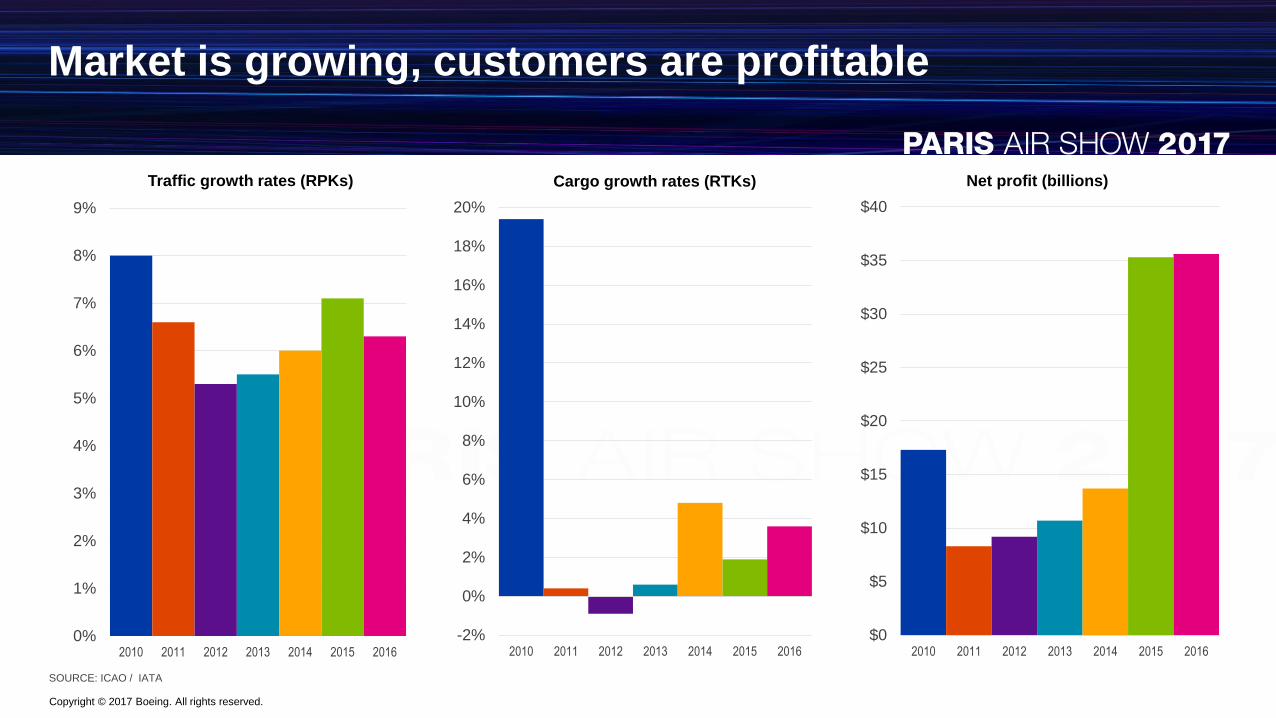
Cargo growth rates (RTKs)
$0
$5
$10
$15
$20
$25
$30
$35
$40
2010 2011 2012 2013 2014 2015 2016
Net profit (billions)
0%
1%
2%
3%
4%
5%
6%
7%
8%
9%
2010 2011 2012 2013 2014 2015 2016
Traffic growth rates (RPKs)
Market is growing, customers are profitable
SOURCE: ICAO / IATA
Copyright © 2017 Boeing. All rights reserved.
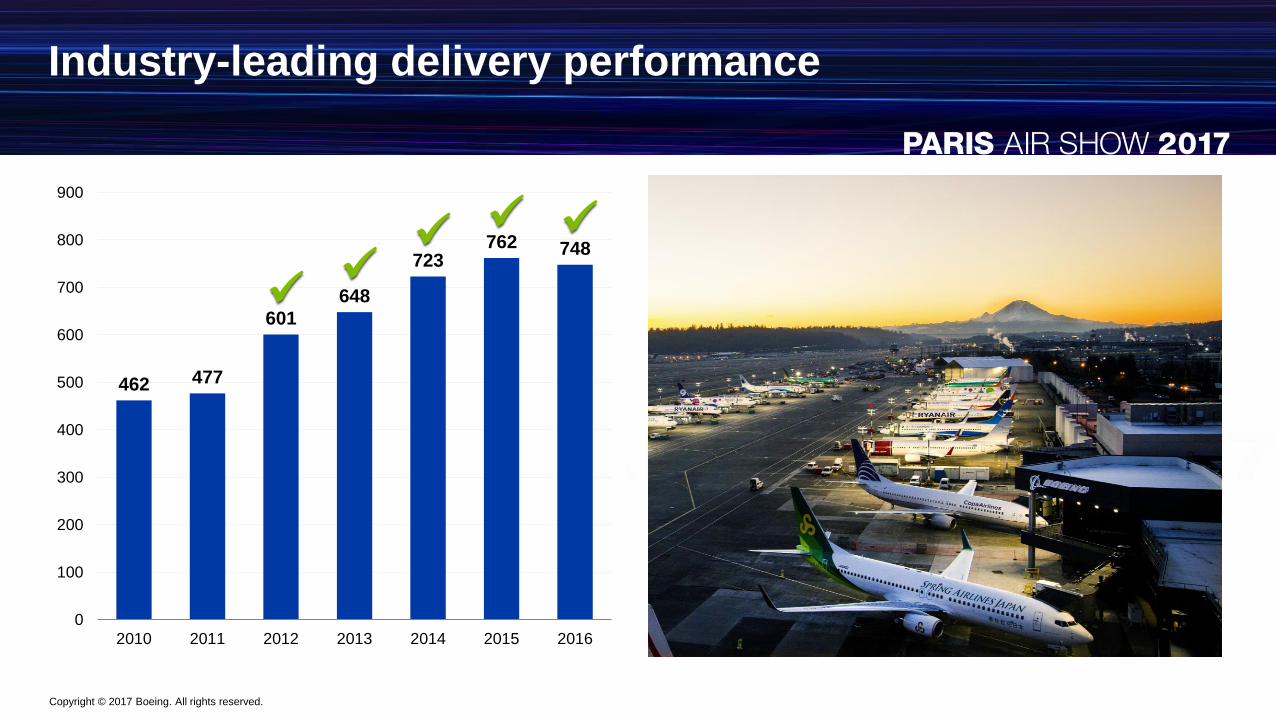
Industry-leading delivery performance
462 477
601
648
723762 748
0
100
200
300
400
500
600
700
800
900
2010 2011 2012 2013 2014 2015 2016
Copyright © 2017 Boeing. All rights reserved.
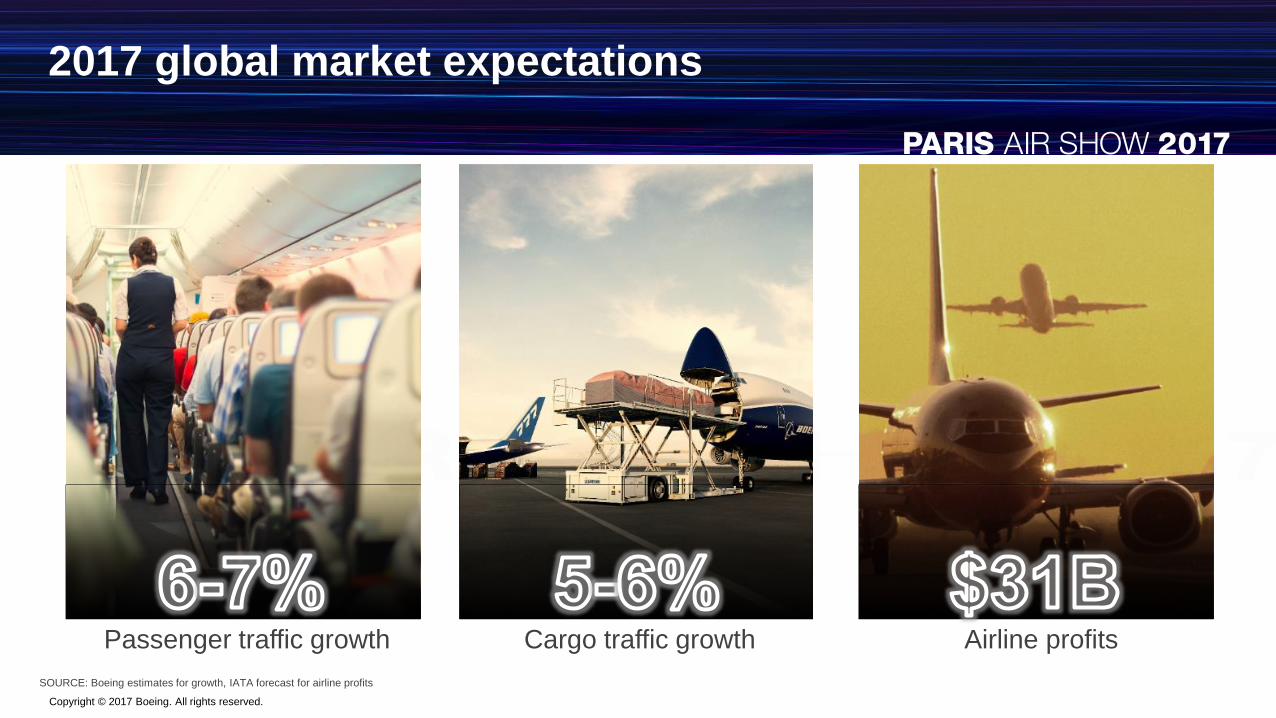
2017 global market expectations
Cargo traffic growth Airline profitsPassenger traffic growth
SOURCE: Boeing estimates for growth, IATA forecast for airline profits
Copyright © 2017 Boeing. All rights reserved.
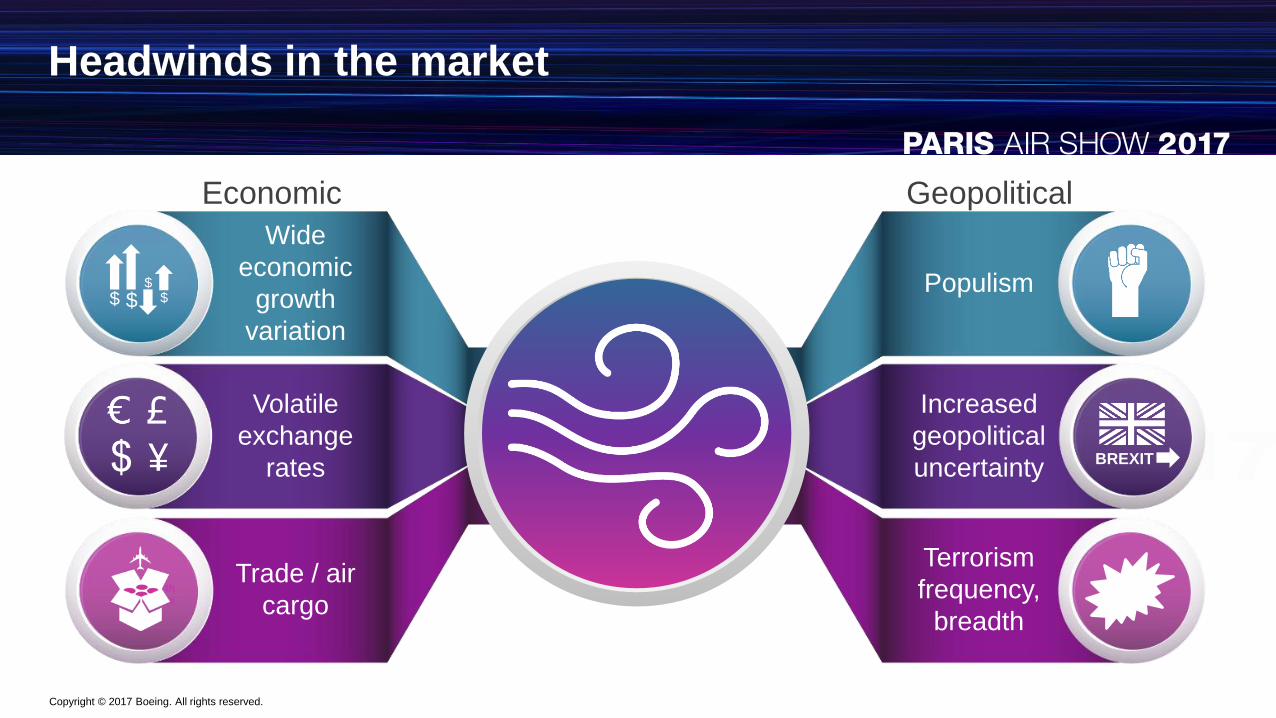
Headwinds in the market
Economic Geopolitical
Wide
economic
growth
variation
Volatile
exchange
rates
Trade / air
cargo
Populism
Increased
geopolitical
uncertainty
Terrorism
frequency,
breadth
BREXIT
£
$ $$
$
North
America
Copyright © 2017 Boeing. All rights reserved.
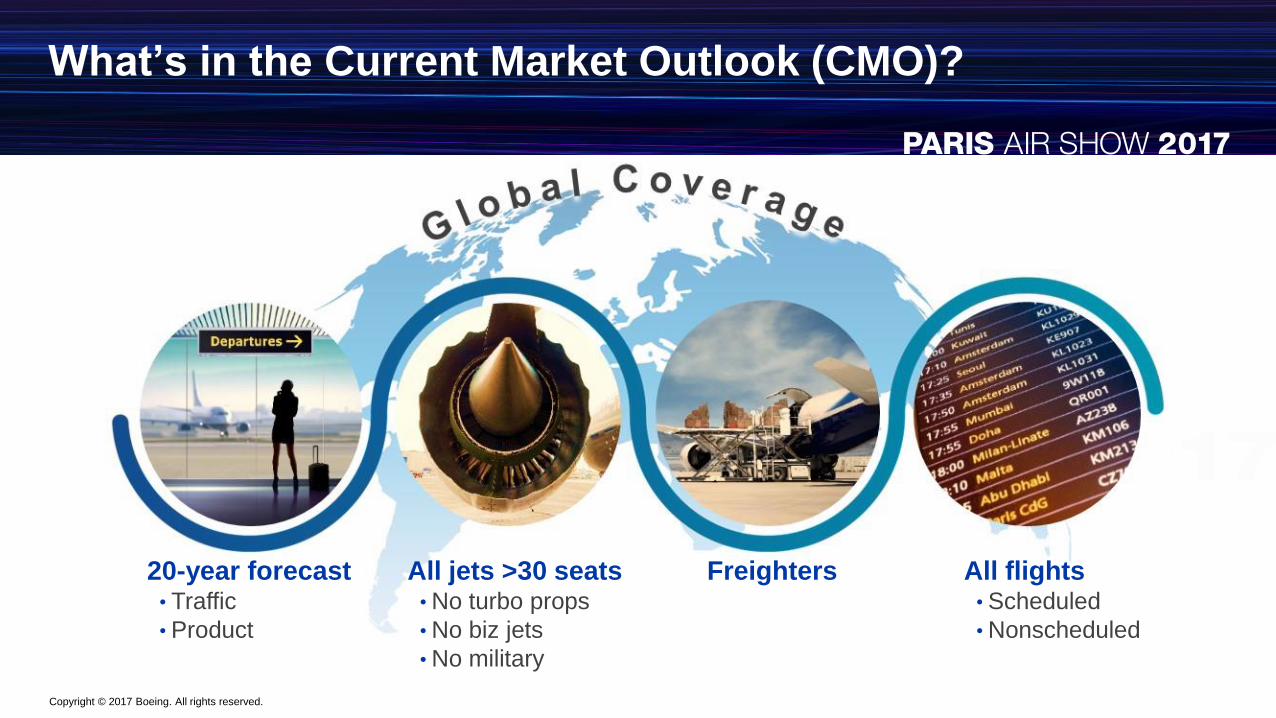
What’s in the Current Market Outlook (CMO)?
20-year forecast • Traffic
• Product
All jets >30 seats• No turbo props
• No biz jets
• No military
All flights • Scheduled
• Nonscheduled
Freighters
Copyright © 2017 Boeing. All rights reserved.
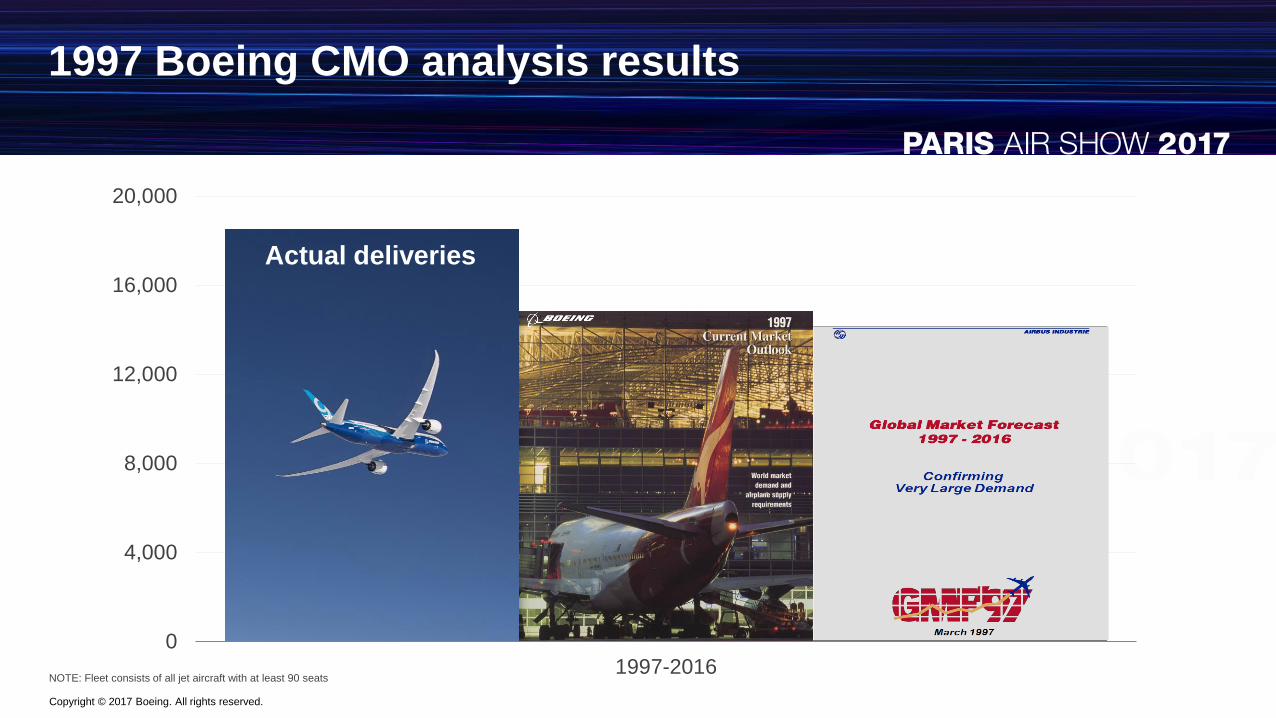
1997 Boeing CMO analysis results
NOTE: Fleet consists of all jet aircraft with at least 90 seats
0
4,000
8,000
12,000
16,000
20,000
1997-2016
Actual deliveries
Copyright © 2017 Boeing. All rights reserved.
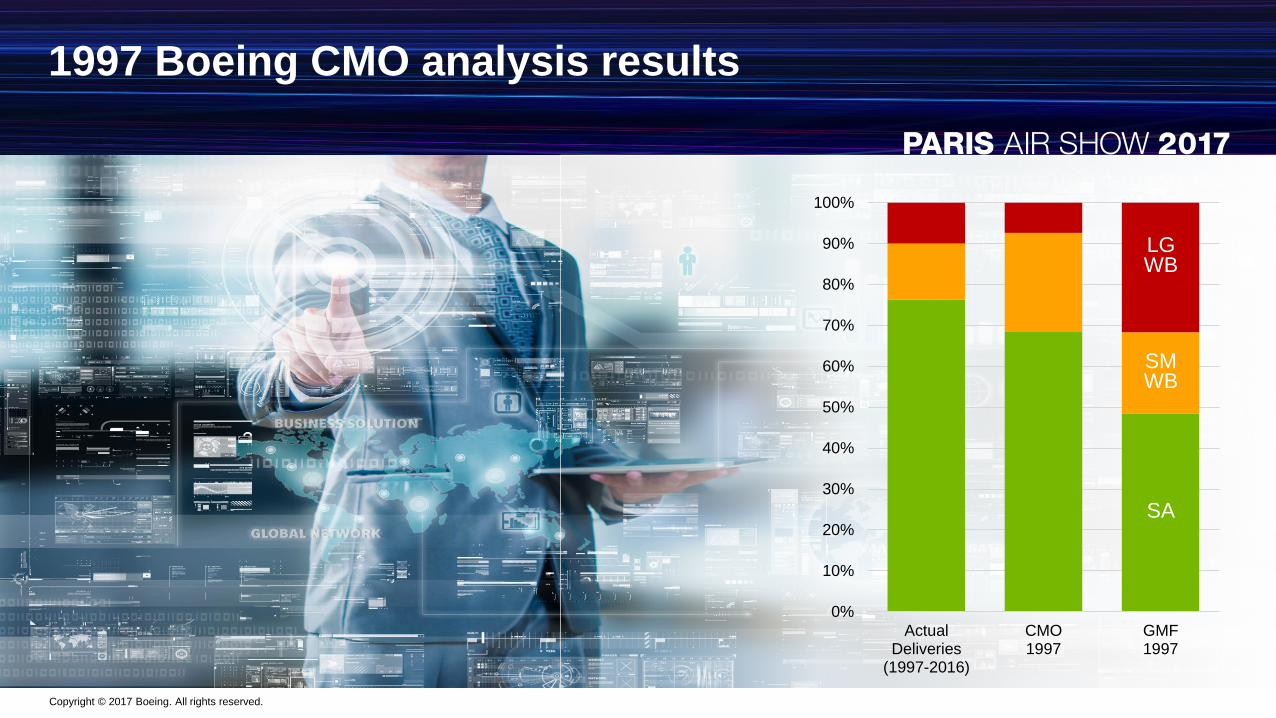
1997 Boeing CMO analysis results
0%
10%
20%
30%
40%
50%
60%
70%
80%
90%
100%
ActualDeliveries
(1997-2016)
CMO1997
GMF1997
SA
SMWB
LGWB
Copyright © 2017 Boeing. All rights reserved.
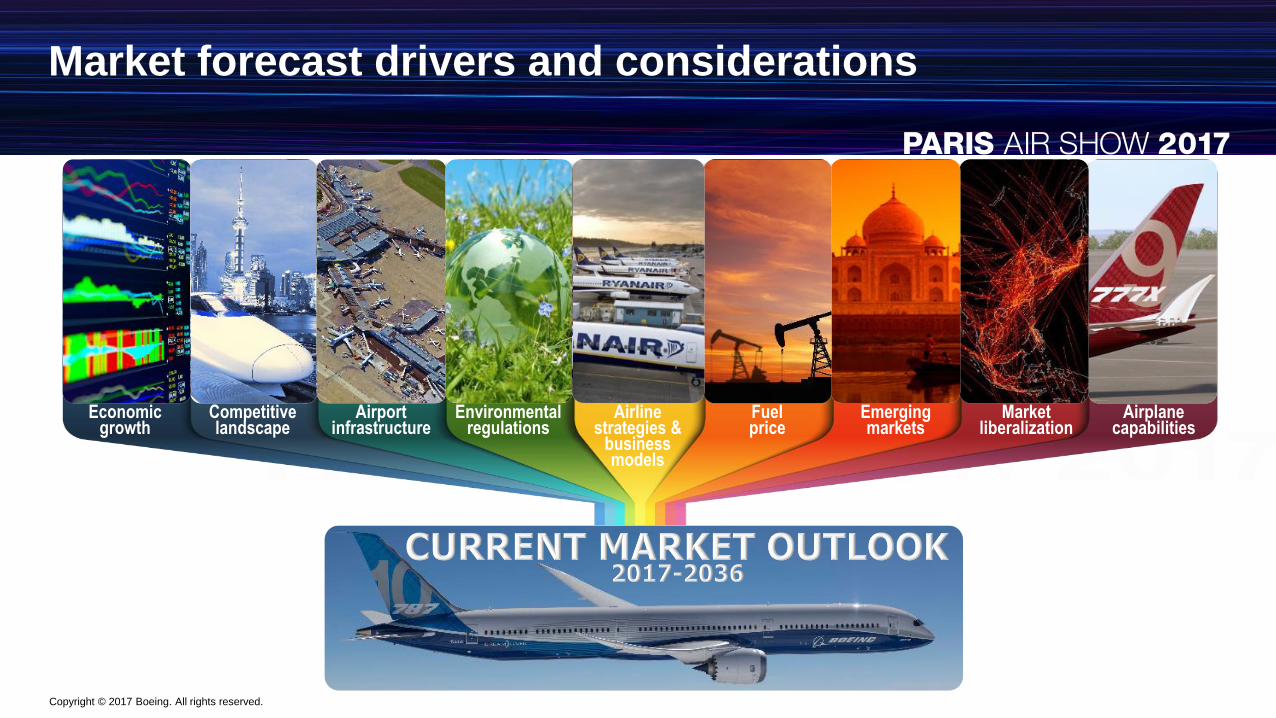
Market forecast drivers and considerations
Economic growth
Competitive landscape
Airportinfrastructure
Environmental regulations
Airline strategies &
business models
Fuelprice
Emerging markets
Market liberalization
Airplane capabilities
Copyright © 2017 Boeing. All rights reserved.
0.0
1.0
2.0
3.0
4.0
5.0
6.0
7.0
8.0
1980
1981
1982
1983
1984
1985
1986
1987
1988
1989
1990
1991
1992
1993
1994
1995
1996
1997
1998
1999
2000
2001
2002
2003
2004
2005
2006
2007
2008
2009
2010
2011
2012
2013
2014
2015
2016E
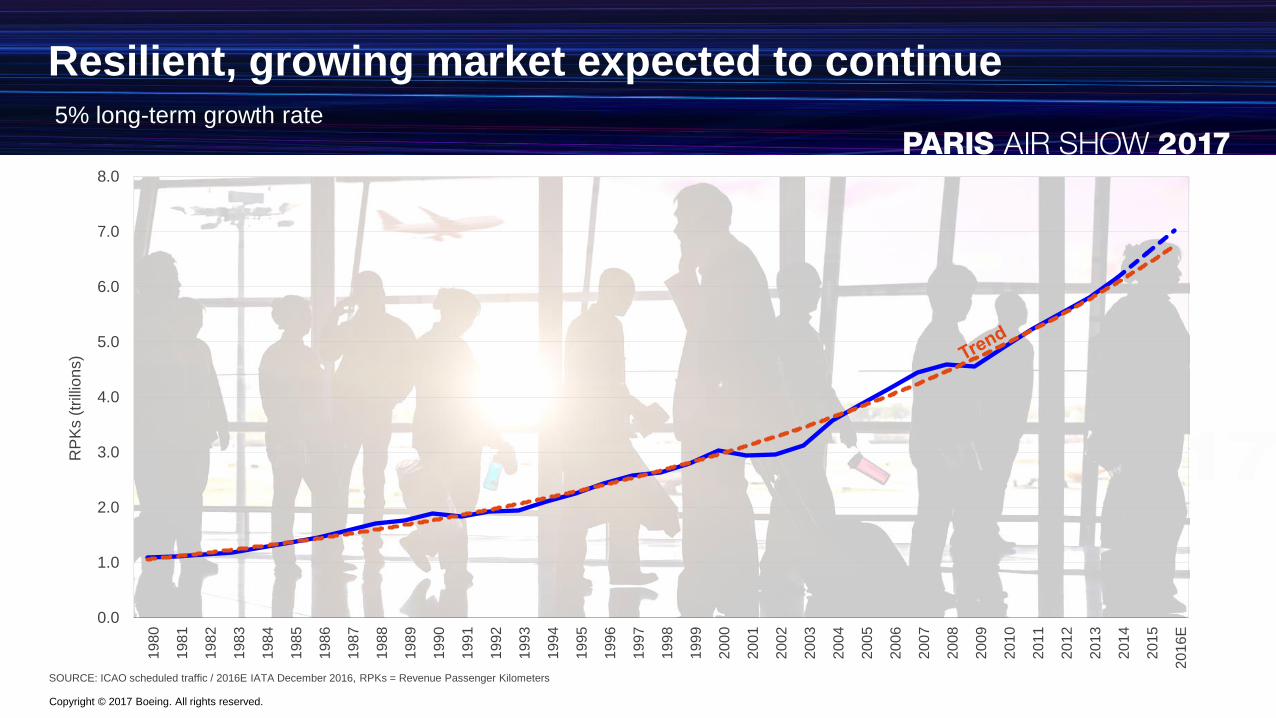
Resilient, growing market expected to continue
SOURCE: ICAO scheduled traffic / 2016E IATA December 2016, RPKs = Revenue Passenger Kilometers
RP
Ks (
trill
ion
s)
5% long-term growth rate
Copyright © 2017 Boeing. All rights reserved.
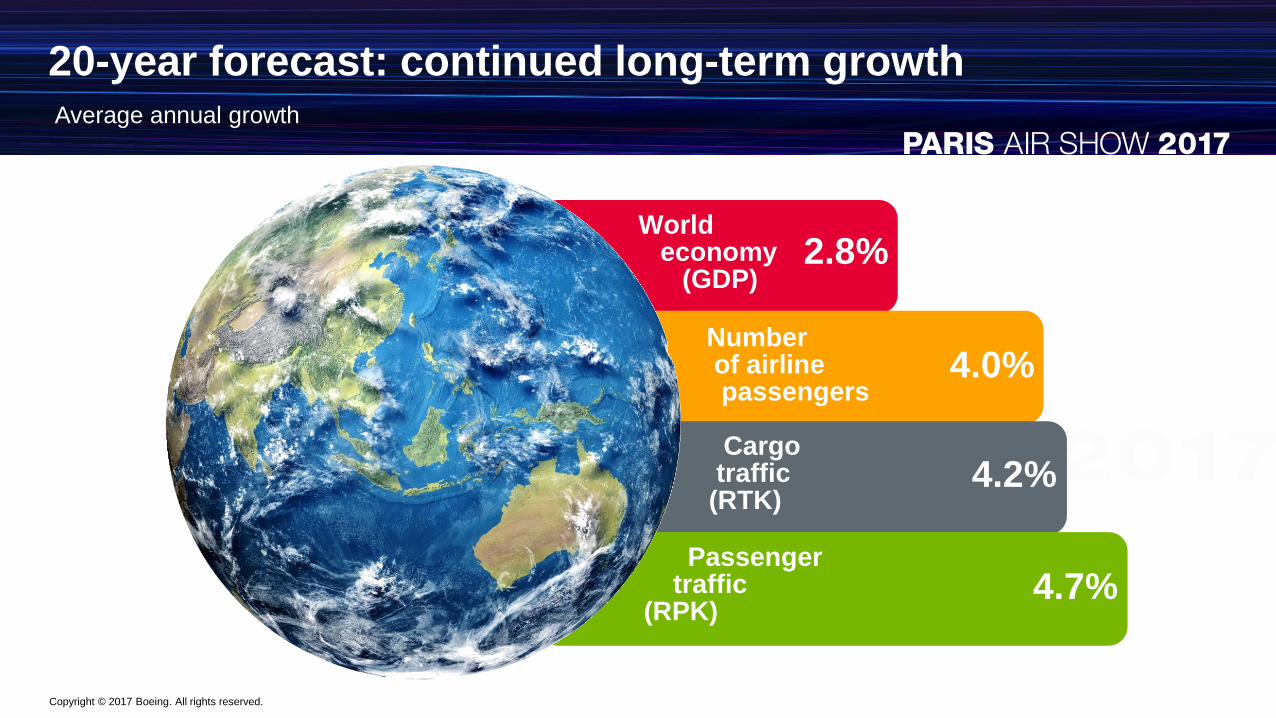
20-year forecast: continued long-term growthAverage annual growth
2.8%
4.0%
4.7%
4.2%
Worldeconomy
(GDP)
Passengertraffic
(RPK)
Cargotraffic(RTK)
Numberof airlinepassengers
Copyright © 2017 Boeing. All rights reserved.
0 500 1,000 1,500 2,000 2,500 3,000 3,500
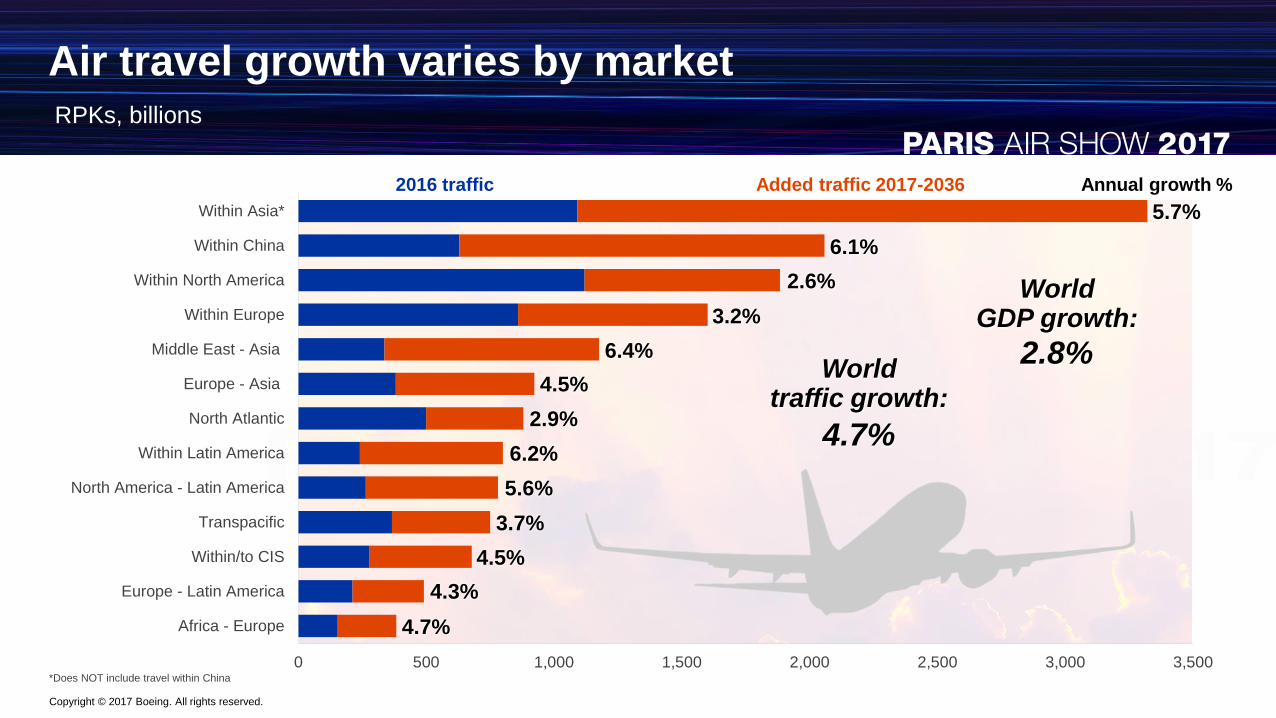
Within Asia*
Within China
Within North America
Within Europe
Middle East - Asia
Europe - Asia
North Atlantic
Within Latin America
North America - Latin America
Transpacific
Within/to CIS
Europe - Latin America
Africa - Europe
Air travel growth varies by marketRPKs, billions
*Does NOT include travel within China
2016 traffic Added traffic 2017-2036 Annual growth %
Worldtraffic growth:
WorldGDP growth:
4.7%
2.8%
4.7%
5.7%
4.3%
6.1%
3.2%
6.4%
6.2%
5.6%
3.7%
4.5%
4.5%
2.9%
2.6%
Copyright © 2017 Boeing. All rights reserved.
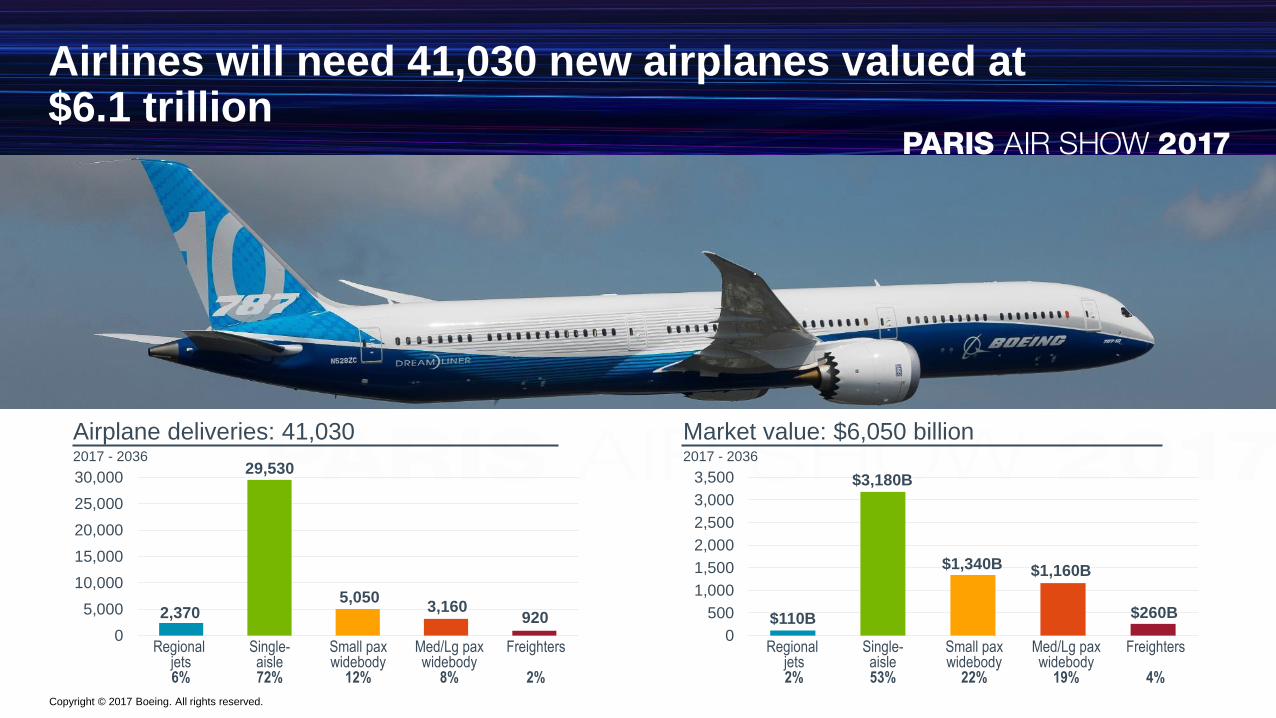
Airlines will need 41,030 new airplanes valued at $6.1 trillion
Airplane deliveries: 41,0302017 - 2036
Market value: $6,050 billion2017 - 2036
0
5,000
10,000
15,000
20,000
25,000
30,000
Regional jets6%
Single-aisle72%
Small paxwidebody
12%
Freighters
2%
Med/Lg paxwidebody
8%
2,370
29,530
5,050
9203,160
0
500
1,000
1,500
2,000
2,500
3,000
3,500
Regional jets2%
Single-aisle53%
Small paxwidebody
22%
Freighters
4%
Med/Lg paxwidebody
19%
$110B
$3,180B
$1,340B
$260B
$1,160B
Copyright © 2017 Boeing. All rights reserved.
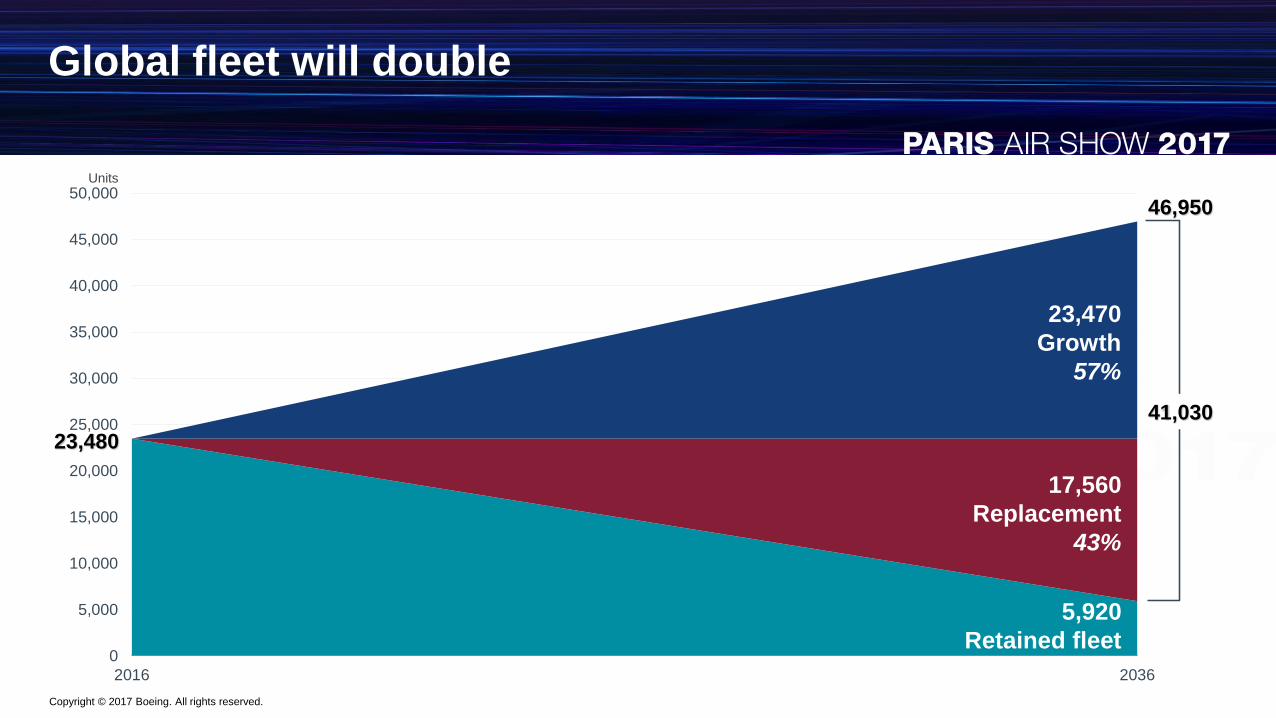
Global fleet will double
0
5,000
10,000
15,000
20,000
25,000
30,000
35,000
40,000
45,000
50,000
2016 2036
5,920
Retained fleet
17,560
Replacement
43%
23,470
Growth
57%
23,480
41,030
46,950
Units
Copyright © 2017 Boeing. All rights reserved.
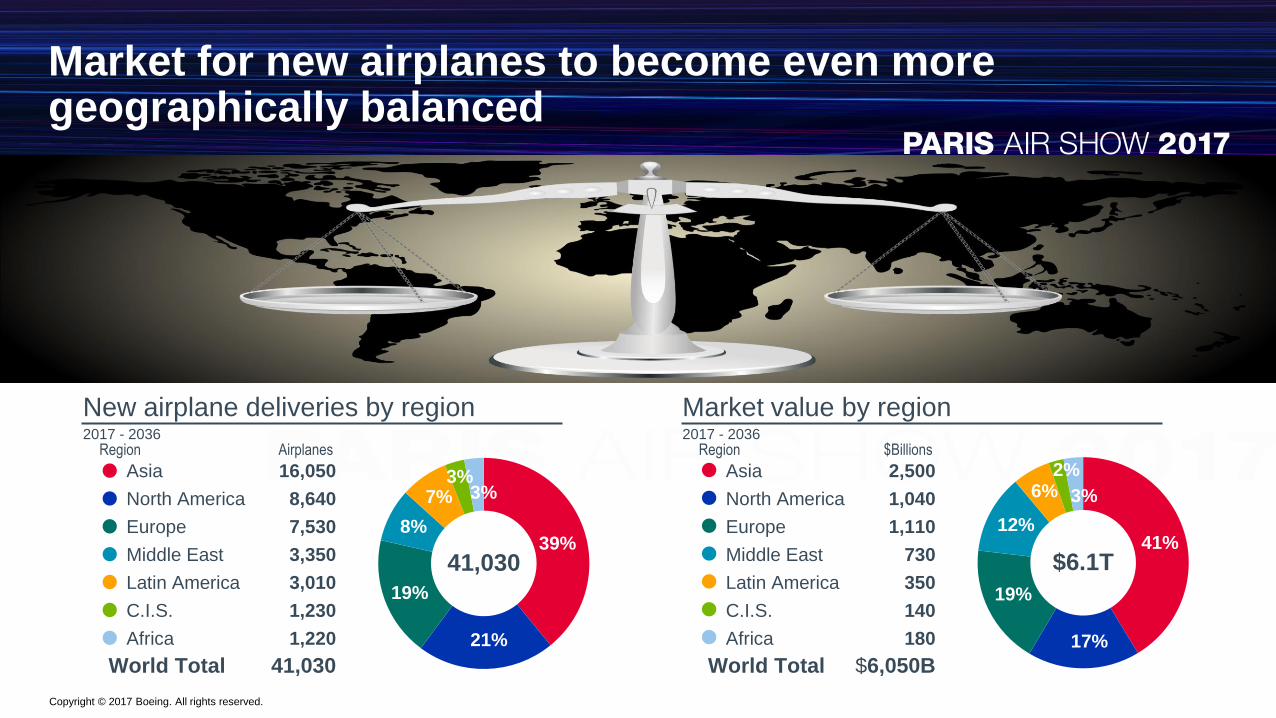
Market for new airplanes to become even more geographically balanced
Market value by region2017 - 2036
41%
19%
12%
6%2%
3%
17%
$6.1T
Asia 2,500
North America 1,040
Europe 1,110
Middle East 730
Latin America 350
C.I.S. 140
Africa 180
World Total $6,050B
Region $Billions
New airplane deliveries by region2017 - 2036
39%
19%
8%
7%3%
3%
21%
41,030
Asia 16,050
North America 8,640
Europe 7,530
Middle East 3,350
Latin America 3,010
C.I.S. 1,230
Africa 1,220
World Total 41,030
Region Airplanes
Copyright © 2017 Boeing. All rights reserved.
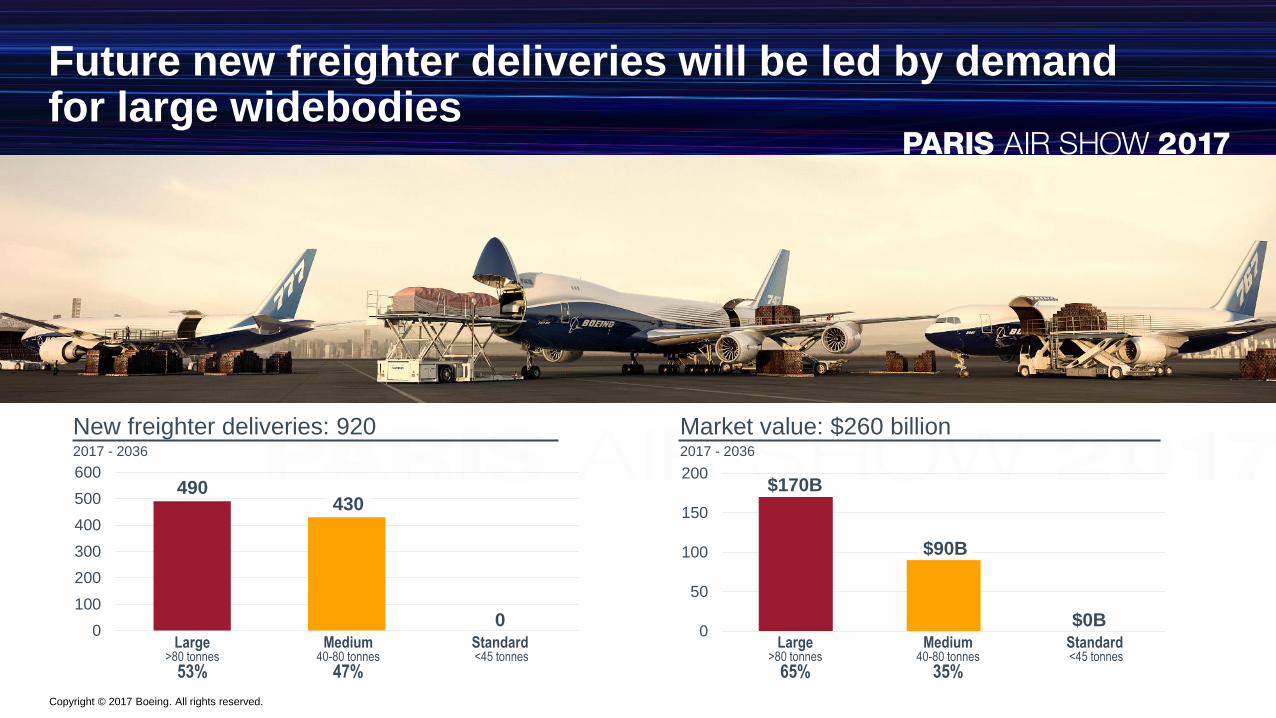
Future new freighter deliveries will be led by demand for large widebodies
0
50
100
150
200
New freighter deliveries: 9202017 - 2036
Market value: $260 billion2017 - 2036
0
100
200
300
400
500
600490
430
0
$170B
$90B
$0BMedium
40-80 tonnes
47%
Standard<45 tonnes
Large>80 tonnes
53%
Medium 40-80 tonnes
35%
Standard<45 tonnes
Large>80 tonnes
65%
Copyright © 2017 Boeing. All rights reserved.
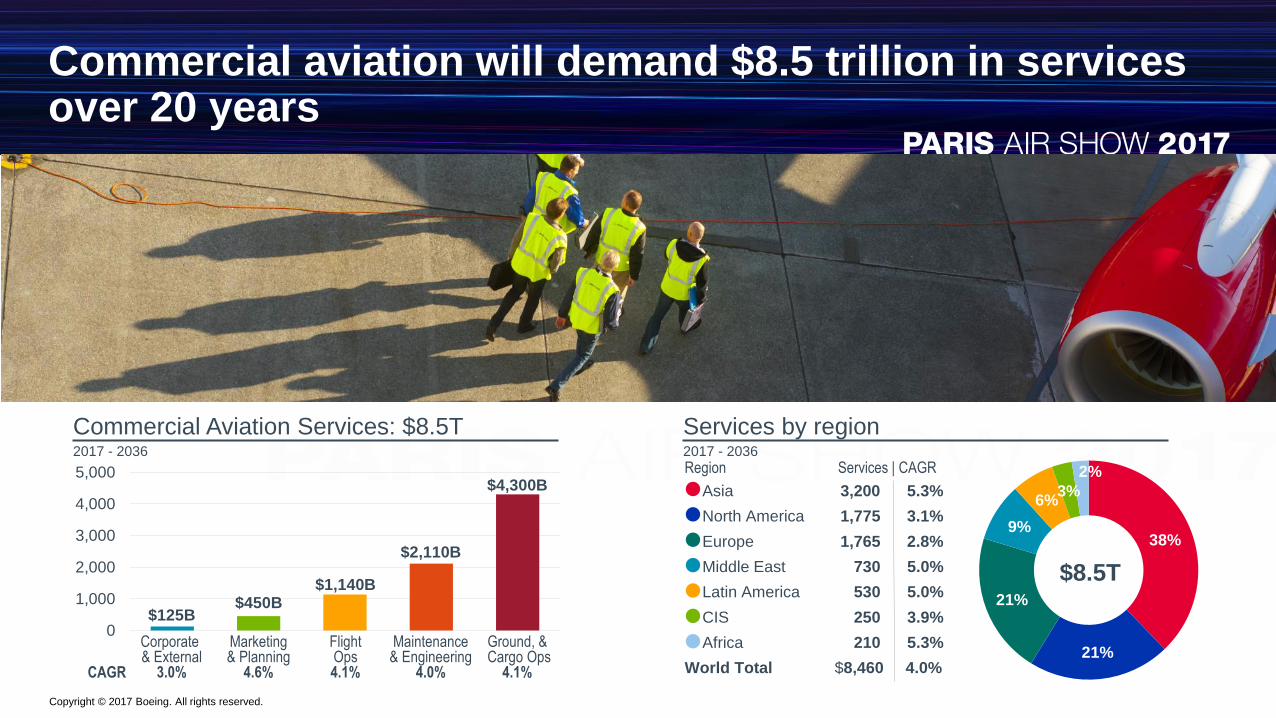
Commercial aviation will demand $8.5 trillion in services over 20 years
38%
21%
21%
9%
6%3%
2%
Commercial Aviation Services: $8.5T2017 - 2036
Services by region2017 - 2036
0
1,000
2,000
3,000
4,000
5,000
Corporate & External
3.0%
Marketing& Planning
4.6%
FlightOps4.1%
Ground, &Cargo Ops
4.1%
Maintenance& Engineering
4.0%
$125B$450B
$1,140B
$4,300B
$2,110B
$8.5T
CAGR
Asia 3,200 5.3%
North America 1,775 3.1%
Europe 1,765 2.8%
Middle East 730 5.0%
Latin America 530 5.0%
CIS 250 3.9%
Africa 210 5.3%
World Total $8,460 4.0%
Region Services | CAGR
Copyright © 2017 Boeing. All rights reserved.
Superior market coverage, exceptional value
Author, Filename.ppt | 21
Copyright © 2010 Boeing. All rights reserved.
![British Columbia Labour Market Outlook 2010 - 2020 · Labour Market OutlookLabour Market Outlook British Columbia Labour Market Outlook: 2010-2020 [2] B.C. Labour Market Outlook,](https://img.pdfslide.net/doc/110x75/5e167e8e481eae63a43f8127/british-columbia-labour-market-outlook-2010-2020-labour-market-outlooklabour-market.jpg)